Method For Measuring Components Of Biological Sample
HIRONAKA; Shouko ; et al.
U.S. patent application number 16/345981 was filed with the patent office on 2020-02-20 for method for measuring components of biological sample. The applicant listed for this patent is PHC Holdings Corporation. Invention is credited to Shouko HIRONAKA, Daiki MIZUOKA, Suguru SASAKI, Eriko YOSHIOKA.
| Application Number | 20200057016 16/345981 |
| Document ID | / |
| Family ID | 62195476 |
| Filed Date | 2020-02-20 |


View All Diagrams
| United States Patent Application | 20200057016 |
| Kind Code | A1 |
| HIRONAKA; Shouko ; et al. | February 20, 2020 |
METHOD FOR MEASURING COMPONENTS OF BIOLOGICAL SAMPLE
Abstract
Provided is a method for measuring a component of a biological sample with a biosensor provided with: a capillary for introducing the biological sample; an electrode part including a first electrode system that includes a first working electrode and a first counter electrode in the capillary; and a reagent part disposed so as to be in contact with the electrode part, the reagent part containing an enzyme and a mediator, and the method including a step of starting voltage application for a duration longer than 0 second and up to 0.7 second to the first electrode system within 0 second to 0.5 second after detection of the introduction of the biological sample to obtain a hematocrit value based on a current value obtained thereby.
| Inventors: | HIRONAKA; Shouko; (Ehime, JP) ; YOSHIOKA; Eriko; (Ehime, JP) ; MIZUOKA; Daiki; (Ehime, JP) ; SASAKI; Suguru; (Ehime, JP) | ||||||||||
| Applicant: |
|
||||||||||
|---|---|---|---|---|---|---|---|---|---|---|---|
| Family ID: | 62195476 | ||||||||||
| Appl. No.: | 16/345981 | ||||||||||
| Filed: | November 22, 2017 | ||||||||||
| PCT Filed: | November 22, 2017 | ||||||||||
| PCT NO: | PCT/JP2017/042113 | ||||||||||
| 371 Date: | April 29, 2019 |
| Current U.S. Class: | 1/1 |
| Current CPC Class: | G01N 27/4166 20130101; G01N 27/307 20130101; C12Q 1/006 20130101; G01N 27/3274 20130101 |
| International Class: | G01N 27/327 20060101 G01N027/327; C12Q 1/00 20060101 C12Q001/00; G01N 27/30 20060101 G01N027/30; G01N 27/416 20060101 G01N027/416 |
Foreign Application Data
| Date | Code | Application Number |
|---|---|---|
| Nov 25, 2016 | JP | 2016-229287 |
Claims
1. A method for measuring a component of a biological sample with a biosensor comprising: a capillary for introducing the biological sample, an electrode part comprising a first electrode system that comprises a first working electrode and a first counter electrode in the capillary, and a reagent part disposed so as to be in contact with the electrode part, the reagent part containing an enzyme and a mediator, and the method comprising a step of starting voltage application for a duration longer than 0 second and up to 0.7 second to the first electrode system within 0 second to 0.5 second after detection of introduction of the biological sample to obtain a hematocrit value based on a current value obtained thereby.
2. The method for measuring a component of a biological sample according to claim 1, wherein the duration of the voltage application to the first electrode system is any duration longer than 0 second and up to 0.5 second.
3. The method for measuring a component of a biological sample according to claim 1, wherein the voltage application to the first electrode system is started at 0 second after the detection of introduction of the biological sample.
4. The method for measuring a component of a biological sample according to claim 1, wherein the voltage application to the first electrode system is started at later than 0 second but within 0.1 second after the detection of introduction of the biological sample.
5. The method for measuring a component of a biological sample according to claim 1, wherein the voltage to be applied to the first electrode system is any voltage in a range of 1.5 to 4.0 V.
6. The method for measuring a component of a biological sample according to claim 1, wherein the component is glucose, and the method further comprises: a step of applying a voltage to the first electrode system after the step to obtain a hematocrit value, to obtain a current value that depends on glucose, and a step of using the current value that depends on glucose and the hematocrit value to obtain a glucose value.
7. The method for measuring a component of a biological sample according to claim 6, wherein in the step to obtain a current value that depends on glucose, the duration of the voltage application to the first electrode system is any duration between 0.01 and 10.0 seconds.
8. The method for measuring a component of a biological sample according to claim 6, wherein in the step to obtain a current value that depends on glucose, the voltage to be applied to the first electrode system is any voltage in a range of 0.1V to 1.4V.
9. The method for measuring a component of a biological sample according to claim 1, wherein the component is glucose, the electrode part further comprises a second electrode system that comprises a second working electrode and a second counter electrode, and the method further comprises: a step of applying a voltage to the second electrode system after the step to obtain a hematocrit value, to obtain a current value that depends on glucose; and a step of using the current value that depends on glucose and the hematocrit value to obtain a glucose value.
10. The method for measuring a component of a biological sample according to claim 9, wherein the duration of applying a voltage to the second electrode system is any duration between 0.01 and 10.0 seconds.
11. The method for measuring a component of a biological sample according to claim 9, wherein the voltage to be applied to the second electrode system is any voltage in a range of 0.1V to 1.4V.
12-71. (canceled)
Description
TECHNICAL FIELD
[0001] The present invention relates to a method for measuring a component of a biological sample.
BACKGROUND ART
[0002] Sensors for measuring a component of a biological sample have been conventionally used in, for example, clinical examinations and self-measurement of blood glucose levels of diabetic patients. Such sensors have a configuration in which, for example, a cover is disposed on an insulating substrate, which has a working electrode and a counter electrode formed on its surface, with a spacer being interposed therebetween. A reagent containing, for example, an oxidoreductase and a mediator (an electron mediator) is placed on the working electrode and the counter electrode, and this part serves as an analysis section. One end of a channel for introducing blood communicates with the analysis section, and the other end of the channel is open toward the outside, which serves as a biological sample supply port. Analysis of components (for example, blood glucose, ketone, HbA1c, etc.) of a biological sample (for example, blood) using such a sensor is performed as follows, for example. That is, firstly, the sensor is set in a dedicated measuring apparatus (a meter). Then, for example, a fingertip is pricked with a lancet to cause bleeding, and the biological sample supply port of the sensor is brought into contact therewith. The blood is drawn into the channel of the sensor by a capillary phenomenon to be introduced into the analysis section through the channel and then comes into contact with the reagent there. Then, the components of the blood react with the oxidoreductase to cause an oxidation-reduction reaction, and thereby a current flows through the mediator. This current is detected and based on the current value, the amounts of the blood components are calculated in the measuring apparatus to be displayed.
[0003] Although blood components can be measured using a sensor in such a manner as described above, the measured values may be affected by hematocrit (Hct). Therefore, in order to obtain correct measured values, it is necessary to measure the Hct value to correct the values of the amounts of the blood components based on the Hct value. For example, there is a known method in which a reagent layer containing an oxidoreductase and a mediator is disposed above a working electrode and a counter electrode, blood is supplied onto the reagent layer, thereby blood containing the reagent is obtained, and with the blood being supplied to the working electrode and the counter electrode, a voltage is applied to measure the Hct value (see Patent Document 1). Furthermore, there is a known method in which in a biosensor that includes two working electrodes W1 and W2 and a reference electrode R, with a mediator being disposed on the working electrode W1 and the reference electrode R and with the mediator and an oxidoreductase being disposed on the working electrode W2, a voltage is applied to these electrodes to measure the Hct value (see Patent Document 2). Furthermore, there is a known method in which using a sensor, which is an electrode system including a working electrode and a counter electrode, having a reagent layer containing an oxidoreductase and a mediator disposed only on the working electrode, a current value is measured while the polarities of the electrodes are switched (see Patent Document 3). In this method, the Hct value is obtained based on a plurality of current values.
[0004] There is also a known Hct measuring method characterized by a method of applying a voltage to electrodes. For example, there is a method in which in a sensor having a reagent layer containing an oxidoreductase and a mediator disposed on a working electrode and a counter electrode, immediately after blood is supplied to the working electrode and the counter electrode, a voltage is applied at 0.35 V for 2.5 seconds to measure the Hct value (see Patent Document 4). There is also a known method in which a whole blood sample is supplied to a sample analysis device having capillary pores, the initial current in the sample within at least part of the capillary pores is measured, and the Hct value of the sample is determined from the initial current (see Patent Document 5). Furthermore, there is also a known method in which in a sensor having a reagent layer containing an oxidoreductase and a mediator disposed only on the counter electrode for measuring the Hct value, a high voltage is applied to both electrodes multiple times to obtain the Hct value based on the current values obtained thereby (see Patent Document 6). However, for example, in the method described in Patent Document 3, it takes time to obtain the Hct value. Therefore, a method of obtaining the Hct value in a short time has been desired.
PRIOR ART DOCUMENTS
Patent Documents
[Patent Document 1] JP3369183B
[Patent Document 2] JP4060078B
[Patent Document 3] JP5066108B
[Patent Document 4] JP5801479B
[Patent Document 5] JP5788857B
[Patent Document 6] WO2014/174815
SUMMARY OF THE INVENTION
Problems to be Solved by the Invention
[0005] Therefore, the present invention is intended to provide a method of measuring the Hct value of a biological sample in a short time.
Means for Solving the Problem
[0006] The present invention is:
a method for measuring a component of a biological sample with a biosensor provided with: a capillary for introducing the biological sample; an electrode part including a first electrode system that includes a first working electrode and a first counter electrode in the capillary; and a reagent part disposed so as to be in contact with the electrode part, the reagent part containing an enzyme and a mediator, and the method including a step of starting voltage application for a duration longer than 0 second and up to 0.7 second to the first electrode system within 0 second to 0.5 second after detection of introduction of the biological sample to obtain a Hct value based on a current value obtained thereby (this method may be referred to as a "first method for measuring a component of a biological sample" in the description).
[0007] Furthermore, the present invention is the first method for measuring a component of a biological sample, wherein
the component is glucose (Glu), and the method further includes: a step of applying a voltage to the first electrode system after the step to obtain a Hct value, to obtain a current value that depends on Glu, and a step of using the current value that depends on Glu and the Hct value to obtain a Glu value (this method may be referred to as a "second method for measuring a component of a biological sample" in the description).
[0008] Moreover, the present invention is the first method for measuring a component of a biological sample, wherein
the component is Glu, the electrode part is further provided with a second electrode system that includes a second working electrode and a second counter electrode, and the method further includes: a step of applying a voltage to the second electrode system after the step to obtain a Hct value, to obtain a current value that depends on Glu; and a step of using the current value that depends on Glu and the Hct value to obtain a Glu value (this method may be referred to as a "third method for measuring a component of a biological sample" in the description).
[0009] Furthermore, the present invention is:
a method for measuring a component of a biological sample with a biosensor provided with: a capillary for introducing the biological sample; an electrode part including a first electrode system that includes a first working electrode and a first counter electrode in the capillary; and a reagent part disposed so as to be in contact with the electrode part, the component being Glu, the reagent part containing an enzyme and a mediator, and the method including: a step of starting voltage application for a duration longer than 0 second and up to 0.7 second to the first electrode system within 0 second to 0.5 second after detection of introduction of the biological sample to obtain a current value that depends on Hct; a step of applying a voltage to the first electrode system after the step to obtain a current value that depends on Hct, to obtain a current value that depends on Glu; and a step of using the current value that depends on Glu and the current value that depends on Hct to obtain a Glu value (this method may be referred to as a "fourth method for measuring a component of a biological sample" in the description).
[0010] Moreover, the present invention is a method for measuring a component of a biological sample with a biosensor provided with:
a capillary for introducing the biological sample; an electrode part including, in the capillary, a first electrode system that includes a first working electrode and a first counter electrode as well as a second electrode system that includes a second working electrode and a second counter electrode; and a reagent part disposed so as to be in contact with the electrode part, the component being Glu, the reagent part containing an enzyme and a mediator, and the method including: a step of starting voltage application for a duration longer than 0 second and up to 0.7 second to the first electrode system within 0 second to 0.5 second after detection of introduction of the biological sample to obtain a current value that depends on Hct; a step of applying a voltage to the second electrode system after the step to obtain a current value that depends on Hct, to obtain a current value that depends on Glu; and a step of using the current value that depends on Glu and the current value that depends on Hct to obtain a Glu value (this method may be referred to as a "fifth method for measuring a component of a biological sample" in the description).
[0011] Furthermore, the present invention is a biosensor including:
a capillary for introducing a biological sample; a reagent part containing an enzyme and a mediator in the capillary; a first Hct measurement system for measuring a Hct value that is disposed so as to be in contact with the reagent part in the capillary and includes a third working electrode and a third counter electrode; and a second Hct measurement system for measuring a Hct value that includes a fifth working electrode arranged at a place where the reagent part is not disposed and a fifth counter electrode disposed so as to be in contact with the reagent part (this biosensor may be referred to as a "first biosensor A" in the description).
[0012] Moreover, the present invention is the first biosensor, further being provided with; an electrode system for obtaining a current value that depends on Glu, the electrode system including a fourth working electrode and a fourth counter electrode disposed in the capillary so as to be in contact with the reagent part (this biosensor may be referred to as a "first biosensor B" in the description).
[0013] When simply referred to as a "first biosensor", it includes the first biosensor A and the first biosensor B.
[0014] Furthermore, the present invention is the first A biosensor, further being provided with:
an electrode system for obtaining a current value that depends on Glu, the electrode system including the sixth working electrode and the sixth counter electrode; and an electrode system for obtaining a current value that depends on Glu, the electrode system including the fourth working electrode and the fourth counter electrode (this biosensor may be referred to as a "second biosensor" in the description).
[0015] Moreover, the present invention is the second biosensor, further being provided with: an additional electrode system for obtaining a current value that depends on Glu, the additional electrode system including a fourth working electrode and a fourth counter electrode disposed in the capillary so as to be in contact with the reagent part (this biosensor may be referred to as a "third biosensor A" in the description).
[0016] Furthermore, the present invention is the third biosensor A, further being provided with an electrode system for obtaining a current value that depends on Int (an interfering substance), the electrode system including, in the capillary, a seventh working electrode disposed so as not to be in contact with the reagent part and a seventh counter electrode that is in contact with the reagent part (this biosensor may be referred to as a "third biosensor B").
[0017] When simply referred to as a "third biosensor", it includes the third biosensor A and the third biosensor B.
[0018] Moreover, the present invention is a method for measuring a component of a biological sample, including a step of using a first biosensor to obtain a Hct value of the biological sample,
the method including: a step of starting voltage application for a duration longer than 0 second and up to 0.7 second to the first Hct measurement system within 0 to 0.5 second after detection of introduction of the biological sample to obtain a first current value; a step of applying a voltage to the second Hct measurement system after the step to obtain a first current value, to obtain a second current value; and a step of obtaining the Hct value of the biological sample based on the first current value and the second current value (this method may be referred to as a "sixth method for measuring a component of a biological sample" in the description).
[0019] Furthermore, the present invention is the sixth method for measuring a component of a biological sample, further including:
a step of applying a voltage to the first Hct measurement system after the step to obtain a first current value, to obtain a current value that depends on Glu; and a step of obtaining a Glu value of the biological sample based on the current value that depends on Glu and the Hct value of the biological sample (this method may be referred to as a "seventh method for measuring a component of a biological sample" in the description).
[0020] Moreover, the present invention is a method for measuring a component of a biological sample, including a step of using a second biosensor to obtain a Hct value of the biological sample, the method including:
a step of starting voltage application for a duration longer than 0 second and up to 0.7 second to the first Hct measurement system within 0 second to 0.5 second after detection of introduction of the biological sample to obtain a first current value; a step of applying a voltage to the second Hct measurement system after the step to obtain a first current value, to obtain a second current value; and a step of obtaining the Hct value of the biological sample based on the first current value and the second current value (this method may be referred to as an "eighth method for measuring a component of a biological sample" in the description).
[0021] Furthermore, the present invention is the eighth method for measuring a component of a biological sample, further including:
a step of applying a voltage to the electrode system for obtaining a current value that depends on Glu after the step to obtain a first current value, to obtain a current value that depends on Glu; and a step of obtaining a Glu value of the biological sample based on the current value that depends on Glu and the Hct value of the biological sample (this method may be referred to as a "ninth method for measuring a component of a biological sample" in the description.
[0022] Moreover, the present invention is a method for measuring a component of a biological sample, including a step of using a first biosensor to obtain a Glu value of the biological sample, the method including:
a step of starting voltage application for a duration longer than 0 second and up to 0.7 second to the first Hct measurement system within 0 second to 0.5 second after detection of introduction of the biological sample to obtain a first current value; a step of applying a voltage to the second Hct measurement system after the step to obtain a first current value, to obtain a second current value; a step of applying a voltage to the first Hct measurement system after the step to obtain a first current value, to obtain a current value that depends on Glu; and a step of using the current value that depends on Glu, the first current value, and the second current value to obtain a Glu value of the biological sample (this method may be referred to as a "tenth method for measuring a component of a biological sample" in the description.
[0023] Furthermore, the present invention is a method for measuring a component of a biological sample, including a step of using a second biosensor to obtain a Glu value of the biological sample, the method including:
a step of starting voltage application for a duration longer than 0 second and up to 0.7 second to the first Hct measurement system within 0 second to 0.5 second after detection of introduction of the biological sample to obtain a first current value; a step of applying a voltage to the second Hct measurement system after the step to obtain a first current value, to obtain a second current value; a step of applying a voltage to the electrode system for obtaining a current value that depends on Glu after the step to obtain a first current value, to obtain a current value that depends on Glu; and a step of using the current value that depends on Glu, the first current value, and the second current value to obtain a Glu value of the biological sample (this method may be referred to as an "eleventh method for measuring a component of a biological sample" in the description).
[0024] Moreover, the present invention is:
a method for measuring a component of a biological sample, including a step of using the third biosensor to obtain a Glu value of the biological sample, the method including: a step of starting voltage application for a duration longer than 0 second and up to 0.7 second to the first Hct measurement system within 0 to 0.5 second after detection of introduction of the biological sample to obtain a first current value; a step of applying a voltage to the second Hct measurement system after the step to obtain a first current value, to obtain a second current value; a step of obtaining a Hct value of the biological sample based on the first current value and the second current value; a step of applying a voltage to the first Hct measurement system after the step to obtain a first current value, to obtain a current value that depends on Glu; and a step of obtaining the Glu value of the biological sample based on the current value that depends on Glu and the Hct value of the biological sample (this method may be referred to as a "twelfth method for measuring a component of a biological sample" in the description).
[0025] Furthermore, the present invention is:
a method for measuring a component of a biological sample, including a step of using the third biosensor to obtain a Glu value of the biological sample, the method including: a step of starting voltage application for a duration longer than 0 second and up to 0.7 second to the first Hct measurement system within 0 second to 0.5 second after detection of introduction of the biological sample to obtain a first current value; a step of applying a voltage to the second Hct measurement system after the step to obtain a first current value, to obtain a second current value; a step of obtaining a Hct value of the biological sample based on the first current value and the second current value; a step of applying a voltage to the electrode system for obtaining a current value that depends on Glu after the step to obtain a first current value, to obtain a current value that depends on Glu; and a step of obtaining the Glu value of the biological sample based on the current value that depends on Glu and the Hct value of the biological sample (this method may be referred to as a "thirteenth method for measuring a component of a biological sample" in the description).
[0026] Moreover, the present invention is:
a method for measuring a component of a biological sample, including a step of using the third biosensor to obtain a Glu value of the biological sample, the method including: a step of starting voltage application for a duration longer than 0 second and up to 0.7 second to the first Hct measurement system within 0 to 0.5 second after detection of introduction of the biological sample to obtain a first current value; a step of applying a voltage to the second Hct measurement system after the step to obtain a first current value, to obtain a second current value; a step of obtaining a Hct value of the biological sample based on the first current value and the second current value; a step of applying a voltage to the first Hct measurement system after the step to obtain a first current value, to obtain a current value that depends on Glu; a step of applying a voltage to an electrode system for obtaining a current value that depends on Int after the step to obtain a current value that depends on Glu, to obtain a current value that depends on an Int value of the biological sample; and a step of obtaining the Glu value of the biological sample based on the current value that depends on Glu, the Hct value of the biological sample, and the current value that depends on an Int value of the biological sample (this method may be referred to as a "fourteenth method for measuring a component of a biological sample" in the description).
[0027] Furthermore, the present invention is:
a method for measuring a component of a biological sample, including a step of using the third biosensor to obtain a Glu value of the biological sample, the method including: a step of starting voltage application for a duration longer than 0 second and up to 0.7 second to the first Hct measurement system within 0 second to 0.5 second after detection of introduction of the biological sample to obtain a first current value; a step of applying a voltage to the second Hct measurement system after the step to obtain a first current value, to obtain a second current value; a step of obtaining a Hct value of the biological sample based on the first current value and the second current value; a step of applying a voltage to the electrode system for obtaining a current value that depends on Glu after the step to obtain s first current value, to obtain a current value that depends on Glu; a step of applying a voltage to an electrode system for obtaining a current value that depends on Int after the step to obtain a current value that depends on Glu, to obtain a current value that depends on an Int value of the biological sample; and a step of obtaining the Glu value of the biological sample based on the current value that depends on Glu, the Hct value of the biological sample, and the current value that depends on an Int value of the biological sample (this method may be referred to as a "fifteenth method for measuring a component of a biological sample" in the description).
[0028] Moreover, the present invention is:
a method for measuring a component of a biological sample, including a step of using the third biosensor to obtain a Glu value of the biological sample, the method including: a step of starting voltage application for a duration longer than 0 second and up to 0.7 second to the first Hct measurement system within 0 to 0.5 second after detection of introduction of the biological sample to obtain a first current value; a step of applying a voltage to the second Hct measurement system after the step to obtain a first current value, to obtain a second current value; a step of obtaining a Hct value of the biological sample based on the first current value and the second current value; a step of applying a voltage to the first Hct measurement system after the step to obtain a first current value, to obtain a first current value that depends on Glu; a step of applying a voltage to the electrode system for obtaining a second current value that depends on Glu after the step to obtain a first current value that depends on Glu, to obtain a second current value that depends on Glu; a step of applying a voltage to an electrode system for obtaining a current value that depends on Int after the step to obtain a second current value that depends on Glu, to obtain a current value that depends on an Int value of the biological sample; and a step of obtaining the Glu value of the biological sample based on the first current value that depends on Glu, the second current value that depends on Glu, the Hct value of the biological sample, and the current value that depends on an Int value of the biological sample (this method may be referred to as a "sixteenth method for measuring a component of a biological sample" in the description).
[0029] Furthermore, the present invention is:
a method for measuring a component of a biological sample, including a step of using the third biosensor to obtain a Glu value of the biological sample, the method including: a step of starting voltage application for a duration longer than 0 second and up to 0.7 second to the first Hct measurement system within 0 second to 0.5 second after detection of introduction of the biological sample to obtain a first current value; a step of applying a voltage to the second Hct measurement system after the step to obtain a first current value, to obtain a second current value; a step of obtaining a Hct value of the biological sample based on the first current value and the second current value; a step of applying a voltage to the electrode system for obtaining a first current value that depends on Glu after the step to obtain a first current value, to obtain a first current value that depends on Glu; a step of applying a voltage to the electrode system for obtaining a second current value that depends on Glu after the step to obtain a first current value that depends on Glu, to obtain a second current value that depends on Glu; a step of applying a voltage to an electrode system for obtaining a current value that depends on Int after the step to obtain a second current value that depends on Glu, to obtain a current value that depends on an Int value of the biological sample; and a step of obtaining the Glu value of the biological sample based on the first current value that depends on Glu, the second current value that depends on Glu, the Hct value of the biological sample, and the current value that depends on an Int value of the biological sample (this method may be referred to as a "seventeenth method for measuring a component of a biological sample" in the description).
[0030] Moreover, the present invention is:
a method for measuring a component of a biological sample, including a step of using the third biosensor to obtain a Glu value of the biological sample, the method including: a step of starting voltage application for a duration longer than 0 second and up to 0.7 second to the first Hct measurement system within 0 to 0.5 second after detection of introduction of the biological sample to obtain a first current value; a step of applying a voltage to the second Hct measurement system after the step to obtain a first current value, to obtain a second current value; a step of obtaining a Hct value of the biological sample based on the first current value and the second current value; a step of applying a voltage to the first Hct measurement system after the step to obtain a first current value, to obtain a first current value that depends on Glu; a step of applying a voltage to the electrode system for obtaining a current value that depends on Glu after the step to obtain a first current value, to obtain a second current value that depends on Glu; and a step of obtaining the Glu value of the biological sample based on the first current value that depends on Glu, the second current value that depends on Glu, and the Hct value of the biological sample (this method may be referred to as an "eighteenth method for measuring a component of a biological sample" in the description).
Effects of Invention
[0031] As described above, the method for measuring a component of a biological sample of the present invention is characterized in that the biological sample is measured with a biosensor in which a reagent layer containing an enzyme and a mediator is in contact with an electrode system including a working electrode and a counter electrode, and voltage application to the electrode system for a duration longer than 0 second and up to 0.7 second is started within 0 second to 0.5 second after detection of introduction of the biological sample to obtain a Hct value based on the current value obtained thereby (the first method for measuring a component of a biological sample). That is, in the biosensor in which the reagent layer is in contact with both the working electrode and the counter electrode, a voltage is applied for a very short time after detection of the biological sample, and the Hct value is obtained based on the current value obtained thereby. According to such a method, the Hct value can be measured in a short time.
[0032] Furthermore, such a method for measuring a component of a biological sample is characterized in that a voltage is applied to the electrode system to obtain a current value that depends on Glu and then the current value and the resultant Hct value are used to obtain a Glu value (the second method for measuring a component of a biological sample). That is, since the current value that depends on Glu in the vicinity of the electrodes that are in contact with the reagent layer and the Hct value in the vicinity of the same electrodes are used to obtain a Glu value, the Glu value can be measured, with the properties of the biological sample in the vicinity of the electrodes being reflected with higher accuracy. Moreover, according to such a method, the Hct value can be measured in a short time in the first electrode system, and the Glu value corrected using the Hct value can be obtained with high accuracy.
[0033] Moreover, such a method for measuring a component of a biological sample is characterized in that a voltage is applied to an electrode system different from the above-mentioned electrode system to obtain a current value that depends on Glu and then the current value and the resultant Hct value are used to obtain a Glu value (the third method for measuring a component of a biological sample). According to such a method, the Hct value can be measured in a short time in the first electrode system, and the Glu value corrected using the Hct value can be obtained with high accuracy.
[0034] Furthermore, a method for measuring a component of a biological sample of the present invention is characterized in that the biological sample is measured with a biosensor in which a reagent layer containing an enzyme and a mediator is in contact with an electrode system including a working electrode and a counter electrode, and voltage application to the electrode system for a duration longer than 0 second and up to 0.7 second is started within 0 second to 0.5 second after detection of introduction of the biological sample to obtain a current value that depends on Hct, a voltage is applied to the electrode system to obtain a current value that depends on Glu, and the current value that depends on Hct and the current value that depends on Glu are used to obtain a Glu value (the fourth method for measuring a component of a biological sample). That is, since the current value that depends on Glu in the vicinity of the electrodes that are in contact with the reagent layer and the current value that depends on Hct in the vicinity of the same electrodes are used to obtain a Glu value, the Glu value can be measured, with the properties of the biological sample in the vicinity of the electrodes being reflected with higher accuracy. Furthermore, according to such a method, the current value that depends on Hct can be measured in a short time in the first electrode system, and the Glu value corrected using the current value that depends on Hct can be obtained with high accuracy.
[0035] Moreover, a method for measuring a component of a biological sample of the present invention is characterized in that the biological sample is measured with a biosensor in which a reagent layer containing an enzyme and a mediator is in contact with an electrode system including a working electrode and a counter electrode, and voltage application to the electrode system for a duration longer than 0 second and up to 0.7 second is started within 0 second to 0.5 second after detection of introduction of the biological sample to obtain a current value that depends on Hct, a voltage is applied to an electrode system different from the above-mentioned electrode system to obtain a current value that depends on Glu, and the current value that depends on Hct and the current value that depends on Glu are used to obtain a Glu value (the fifth method for measuring a component of a biological sample). Furthermore, according to such a method, the current value that depends on Hct can be measured in a short time in the first electrode system, and the Glu value corrected using the current value that depends on Hct can be obtained with high accuracy.
[0036] Furthermore, a biosensor of the present invention has a first Hct measurement system that is in contact with a reagent part and a second Hct measurement system in a place where the reagent part is not disposed (the first biosensor). According to such a biosensor, measurement can be carried out in systems having different environments (the measurement place and the presence or absence of a reagent) for measurement of a biological sample (for example, blood) applied as a spot in a capillary. With the biosensor of the present invention, particularly a hematocrit value and a current value that depends thereon can be measured in a plurality of systems in the capillary and thereby the measurement accuracy in determining the Glu value can be further improved.
[0037] Moreover, a method for measuring a component of a biological sample of the present invention is characterized in that the biological sample is measured with the first biosensor, and voltage application to the first Hct measurement system for a duration longer than 0 second and up to 0.7 second is started within 0 second to 0.5 second after detection of introduction of the biological sample to obtain a first current value, then a voltage is applied to the second Hct measurement system to obtain a second current value, and the first current value and the second current value are used to obtain a Hct value (the sixth method for measuring a component of a biological sample). According to such a method, in the first Hct measurement system with a reagent disposed thereon, particularly, the first current value (a Hct value or a current value that depends on a Hct value) can be measured in a short time, and the first current value and the second current value (a Hct value or a current value that depends on a Hct value) measured in the second Hct measurement system are used and thereby a measurement accuracy in determining a corrected Glu value can be improved. Furthermore, the method is characterized by further including a step of applying a voltage to the first Hct measurement system after the step to obtain a first current value, to obtain a current value that depends on Glu and a step of obtaining a Glu value of the biological sample based on the current value that depends on Glu and the Hct value of the biological sample (the seventh method for measuring a component of a biological sample). According to such a method, since the current value that depends on Glu in the vicinity of the electrodes that are in contact with the reagent part and the current value that depends on Hct in the vicinity of the same electrodes are used to obtain a Glu value, the Glu value can be measured, with the properties of the biological sample in the vicinity of the electrodes being reflected with higher accuracy. Moreover, according to such a method, the Hct value can be measured in a short time in the first Hct measurement system, and the Glu value corrected using the Hct value can be obtained with high accuracy.
[0038] Furthermore, a method for measuring a component of a biological sample of the present invention is characterized in that the biological sample is measured with the first biosensor, and voltage application to the first Hct measurement system for a duration longer than 0 second and up to 0.7 second is started within 0 second to 0.5 second after detection of introduction of the biological sample to obtain a first current value then a voltage is applied to the second Hct measurement system to obtain a second current value, and after the step to obtain a first current value, the method further includes a step of applying a voltage to the first Hct measurement system to obtain a current value that depends on Glu and a step of obtaining a Glu value of the biological sample based on the current value that depends on Glu, the first current value, and the second current value (the tenth method for measuring a component of a biological sample). According to such a method, since the current value that depends on Glu in the vicinity of the electrodes that are in contact with the reagent part and the current value that depends on Hct in the vicinity of the same electrodes are used to obtain a Glu value, the Glu value can be measured, with the properties of the biological sample in the vicinity of the electrodes being reflected with higher accuracy. Moreover, according to such a method, the current value that depends on Hct can be measured in a short time in the first Hct measurement system, and the Glu value corrected using the current value that depends on Hct can be obtained with high accuracy.
[0039] Moreover, the biosensor of the present invention further includes an electrode system for obtaining a current value that depends on Glu, the electrode system being in contact with the reagent part, for obtaining a current value that depends on Glu (the second biosensor). According to such a biosensor, since it includes the fifth working electrode and the fifth counter electrode disposed so as to be in contact with the reagent part, it is possible to measure more current values that depend on Glu and therefore a corrected Glu value can be obtained with higher accuracy.
[0040] Furthermore, a method for measuring a component of a biological sample of the present invention is characterized in that the biological sample is measured with the second biosensor, and voltage application to the first Hct measurement system for a duration longer than 0 second and up to 0.7 second is started within 0 second to 0.5 second after detection of introduction of the biological sample to obtain a first current value, then a voltage is applied to the second Hct measurement system to obtain a second current value, and the first current value and the second current value are used to obtain a Hct value (the eighth method for measuring a component of a biological sample). According to such a method, the first current value (a Hct value) can be measured in a short time in the first Hct measurement system and the Glu value corrected using the Hct value can be obtained with high accuracy.
[0041] Moreover, a method for measuring a component of a biological sample is characterized by further including, in the eighth method for measuring a component of a biological sample, a step of applying a voltage to the electrode system for obtaining a current value that depends on Glu after the step to obtain a first current value, to obtain a current value that depends on Glu, and a step of obtaining a Glu value of the biological sample based on the current value that depends on Glu and the Hct value of the biological sample (the ninth method for measuring a component of a biological sample). According to such a method, since the current value that depends on Glu in the vicinity of the electrodes that are in contact with the reagent part and the current value that depends on Hct in the vicinity of the same electrodes are used to obtain a Glu value, the Glu value can be measured, with the properties of the biological sample in the vicinity of the electrodes being reflected with higher accuracy.
[0042] Furthermore, a method for measuring a component of a biological sample of the present invention is characterized in that the biological sample is measured with the second biosensor, and voltage application to the first Hct measurement system for a duration longer than 0 second and up to 0.7 second is started within 0 second to 0.5 second after detection of introduction of the biological sample to obtain a first current value, then a voltage is applied to the second Hct measurement system to obtain a second current value, and after the step to obtain a first current value, the method further includes a step of applying a voltage to the electrode system for obtaining a current value that depends on Glu to obtain a current value that depends on Glu and a step of obtaining a Glu value of the biological sample based on the current value that depends on Glu, the first current value, and the second current value (the eleventh method for measuring a component of a biological sample). According to such a method, since the current value that depends on Glu in the vicinity of the electrodes that are in contact with the reagent part and the current value that depends on Hct in the vicinity of the same electrodes are used to obtain a Glu value, the Glu value can be measured, with the properties of the biological sample in the vicinity of the electrodes being reflected with higher accuracy. Furthermore, according to such a method, the first current value can be measured in a short time in the first Hct measurement system, and the Glu value corrected using the first current value can be obtained with high accuracy.
[0043] In the description, when simply referring to a "method for measuring a component of a biological sample," it refers to all of the "first method for measuring a component of a biological sample," "second method for measuring a component of a biological sample," "third method for measuring a component of a biological sample," "fourth method for measuring a component of a biological sample," "fifth method for measuring a component of a biological sample," "sixth method for measuring a component of a biological sample," "seventh method for measuring a component of a biological sample," "eighth method for measuring a component of a biological sample," "ninth method for measuring a component of a biological sample," "tenth method for measuring a component of a biological sample," "eleventh method for measuring a component of a biological sample," "twelfth method for measuring a component of a biological sample," "thirteenth method for measuring a component of a biological sample," "fourteenth method for measuring a component of a biological sample," "fifteenth method for measuring a component of a biological sample," "sixteenth method for measuring a component of a biological sample," "seventeenth method for measuring a component of a biological sample," and "eighteenth method for measuring a component of a biological sample." Furthermore, in the description, when simply referring to a "biosensor," it refers to all of the "first biosensor," "second biosensor," and "third biosensor."
BRIEF DESCRIPTION OF DRAWINGS
[0044] FIG. 1 is an exploded perspective view of a biosensor used in the present invention.
[0045] FIG. 2 is a sectional view of the biosensor used in the present invention.
[0046] FIG. 3 is a plan view of an example of the biosensor used in the present invention.
[0047] FIG. 4 show a plan view of another example (the first biosensor) of the biosensor used in the present invention.
[0048] FIG. 5 shows a plan view of still another example (the second biosensor) of the biosensor used in the present invention.
[0049] FIG. 6 shows a plan view of yet another example (the third biosensor) of the biosensor used in the present invention.
[0050] FIG. 7 shows a perspective view of an example of a measuring apparatus of the present invention, with a biosensor used in a measuring method of the present invention being inserted thereinto.
[0051] FIG. 8 shows an example of an electric block diagram of the measuring apparatus of the present invention, with the biosensor used in the measuring method of the present invention being inserted thereinto.
[0052] FIG. 9 is an operation flow chart according to Embodiment 1.
[0053] FIG. 10 is a flow chart of HCT measurement according to Embodiment 1.
[0054] FIG. 11 is an operation flow chart according to Embodiment 2.
[0055] FIG. 12 is a flow chart of current value measurement according to Embodiment 2.
[0056] FIGS. 13(a) and 13(b) each show an example of the relationship between voltage application time and applied voltage according to Embodiment 2.
[0057] FIG. 14a is an operation flow chart according to Embodiment 3.
[0058] FIG. 14b is a flow chart of HCT measurement 2 according to Embodiment 3.
[0059] FIG. 15a is an operation flow chart according to Embodiment 4.
[0060] FIG. 15b is a flow chart of INT measurement according to Embodiment 4.
[0061] FIG. 16a shows an example of the relationship between applied voltage and voltage application time according to Embodiment 2.
[0062] FIG. 16b shows another example of the relationship between applied voltage and voltage application time according to Embodiment 2.
[0063] FIG. 17a shows an example of the relationship between applied voltage and voltage application time according to Embodiment 3.
[0064] FIG. 17b shows another example of the relationship between applied voltage and voltage application time according to Embodiment 3.
[0065] FIG. 18a shows an example of the relationship between applied voltage and voltage application time according to Embodiment 4.
[0066] FIG. 18b shows another example of the relationship between applied voltage and voltage application time according to Embodiment 4.
[0067] FIG. 19(a) shows the relationship between voltage application time and applied voltage immediately (0 second) after detection of the introduction of a blood sample. FIG. 19(b) shows the relationship between voltage application time and applied voltage after a predetermined time from detection of the introduction of a blood sample.
[0068] FIG. 20a is a graph showing the change with time in the response current value relative to an applied voltage with respect to each blood sample with a Glu concentration of 45 mg/dl (Hct value: 0%, 42%, and 70%) in Example 1.
[0069] FIG. 20b is a graph showing the change with time in the response current value relative to an applied voltage with respect to each blood sample with a Glu concentration of 550 mg/dl (Hct value: 0%, 42%, and 70%) in Example 1.
[0070] FIG. 20c is a graph showing the sensitivity difference (%) in each case of Glu values of 45 mg/dl and 550 mg/dl with reference to Hct 42% in Example 1.
[0071] FIG. 20d is a graph showing the sensitivity difference (%) in each case of Hct values of 0%, 42%, and 70% with reference to Glu 45 mg/dl in Example 1.
[0072] FIG. 21a is a graph showing the change with time in the response current value relative to an applied voltage with respect to each blood sample with a Glu concentration of 45 mg/dl (Hct value: 0%, 42%, and 70%) in Example 2.
[0073] FIG. 21b is a graph showing the change with time in the response current value relative to an applied voltage with respect to each blood sample with a Glu concentration of 550 mg/dl (Hct value: 0%, 42%, and 70%) in Example 2.
[0074] FIG. 21c is a graph showing the sensitivity difference (%) in each case of Glu values of 45 mg/dl and 550 mg/dl with reference to Hct 42% in Example 2.
[0075] FIG. 21d is a graph showing the sensitivity difference (%) in each case of Hct values of 0%, 42%, and 70% with reference to Glu 45 mg/dl in Example 2.
[0076] FIG. 22a is a graph showing the change with time in the response current value relative to an applied voltage with respect to each blood sample with a Glu concentration of 45 mg/dl (Hct value: 0%, 42%, and 70%) in Example 3.
[0077] FIG. 22b is a graph showing the change with time in the response current value relative to an applied voltage with respect to each blood sample with a Glu concentration of 550 mg/dl (Hct value: 0%, 42%, and 70%) in Example 3.
[0078] FIG. 22c is a graph showing the sensitivity difference (%) in each case of Glu values of 45 mg/dl and 550 mg/dl with reference to Hct 42% in Example 3.
[0079] FIG. 22d is a graph showing the sensitivity difference (%) in each case of Hct values of 0%, 42%, and 70% with reference to Glu 45 mg/dl in Example 3.
[0080] FIG. 23a is a graph showing the change with time in the response current value relative to an applied voltage with respect to each blood sample with a Glu concentration of 45 mg/dl (Hct value: 0%, 42%, and 70%) in Example 4.
[0081] FIG. 23b is a graph showing the change with time in the response current value relative to an applied voltage with respect to each blood sample with a Glu concentration of 550 mg/dl (Hct value: 0%, 42%, and 70%) in Example 4.
[0082] FIG. 23c is a graph showing the sensitivity difference (%) in each case of Glu values of 45 mg/dl and 550 mg/dl with reference to Hct 42% in Example 4.
[0083] FIG. 23d is a graph showing the sensitivity difference (%) in each case of Hct values of 0%, 42%, and 70% with reference to Glu 45 mg/dl in Example 4.
[0084] FIG. 24a is a graph showing the change with time in the response current value relative to an applied voltage with respect to each blood sample with a Glu concentration of 45 mg/dl (Hct value: 0%, 42%, and 70%) in Comparative Example 1.
[0085] FIG. 24b is a graph showing the change with time in the response current value relative to an applied voltage with respect to each blood sample with a Glu concentration of 550 mg/dl (Hct value: 0%, 42%, and 70%) in Comparative Example 1.
[0086] FIG. 24c is a graph showing the sensitivity difference (%) in each case of Glu values of 45 mg/dl and 550 mg/dl with reference to Hct 42% in Comparative Example 1.
[0087] FIG. 24d is a graph showing the sensitivity difference (%) in each case of Hct values of 0%, 42%, and 70% with reference to Glu 45 mg/dl in Comparative Example 1.
[0088] FIG. 25a is a graph showing the change with time in the response current value relative to an applied voltage with respect to each blood sample with a Glu concentration of 45 mg/dl (Hct value: 0%, 42%, and 70%) in Comparative Example 2.
[0089] FIG. 25b is a graph showing the change with time in the response current value relative to an applied voltage with respect to each blood sample with a Glu concentration of 550 mg/dl (Hct value: 0%, 42%, and 70%) in Comparative Example 2.
[0090] FIG. 25c is a graph showing the sensitivity difference (%) in each case of Glu values of 45 mg/dl and 550 mg/dl with reference to Hct 42% in Comparative Example 2.
[0091] FIG. 25d is a graph showing the sensitivity difference (%) in each case of Hct values of 0%, 42%, and 70% with reference to Glu 45 mg/dl in Comparative Example 2.
[0092] FIG. 26a is a graph showing the change with time in the response current value relative to an applied voltage with respect to each blood sample with a Glu concentration of 45 mg/dl (Hct value: 0%, 42%, and 70%) in Example 5.
[0093] FIG. 26b is a graph showing the change with time in the response current value relative to an applied voltage with respect to each blood sample with a Glu concentration of 550 mg/dl (Hct value: 0%, 42%, and 70%) in Example 5.
[0094] FIG. 26c is a graph showing the sensitivity difference (%) in each case of Glu values of 45 mg/dl and 550 mg/dl with reference to Hct 42% in Example 5.
[0095] FIG. 26d is a graph showing the sensitivity difference (%) in each case of Hct values of 0%, 42%, and 70% with reference to Glu 45 mg/dl in Example 5.
[0096] FIG. 27a is a graph showing the change with time in the response current value relative to an applied voltage with respect to each blood sample with a Glu concentration of 45 mg/dl (Hct value: 0%, 42%, and 70%) in Example 6.
[0097] FIG. 27b is a graph showing the change with time in the response current value relative to an applied voltage with respect to each blood sample with a Glu concentration of 550 mg/dl (Hct value: 0%, 42%, and 70%) in Example 6.
[0098] FIG. 27c is a graph showing the sensitivity difference (%) in each case of Glu values of 45 mg/dl and 550 mg/dl with reference to Hct 42% in Example 6.
[0099] FIG. 27d is a graph showing the sensitivity difference (%) in each case of Hct values of 0%, 42%, and 70% with reference to Glu 45 mg/dl in Example 6.
[0100] FIG. 28a is a graph showing the change with time in the response current value relative to an applied voltage with respect to each blood sample with a Glu concentration of 45 mg/dl (Hct value: 0%, 42%, and 70%) in Example 7.
[0101] FIG. 28b is a graph showing the change with time in the response current value relative to an applied voltage with respect to each blood sample with a Glu concentration of 550 mg/dl (Hct value: 0%, 42%, and 70%) in Example 7.
[0102] FIG. 28c is a graph showing the sensitivity difference (%) in each case of Glu values of 45 mg/dl and 550 mg/dl with reference to Hct 42% in Example 7.
[0103] FIG. 28d is a graph showing the sensitivity difference (%) in each case of Hct values of 0%, 42%, and 70% with reference to Glu 45 mg/dl in Example 7.
[0104] FIG. 29a is a graph showing the change with time in the response current value relative to an applied voltage with respect to each blood sample with a Glu concentration of 45 mg/dl (Hct value: 0%, 42%, and 70%) in Example 8.
[0105] FIG. 29b is a graph showing the change with time in the response current value relative to an applied voltage with respect to each blood sample with a Glu concentration of 550 mg/dl (Hct value: 0%, 42%, and 70%) in Example 8.
[0106] FIG. 29c is a graph showing the sensitivity difference (%) in each case of Glu values of 45 mg/dl and 550 mg/dl with reference to Hct 42% in Example 8.
[0107] FIG. 29d is a graph showing the sensitivity difference (%) in each case of Hct values of 0%, 42%, and 70% with reference to Glu 45 mg/dl in Example 8.
[0108] FIG. 30a is a graph showing the change with time in the response current value relative to an applied voltage with respect to each blood sample with a Glu concentration of 45 mg/dl (Hct value: 0%, 42%, and 70%) in Comparative Example 3.
[0109] FIG. 30b is a graph showing the change with time in the response current value relative to an applied voltage with respect to each blood sample with a Glu concentration of 550 mg/dl (Hct value: 0%, 42%, and 70%) in Comparative Example 3.
[0110] FIG. 30c is a graph showing the sensitivity difference (%) in each case of Glu values of 45 mg/dl and 550 mg/dl with reference to Hct 42% in Comparative Example 3.
[0111] FIG. 30d is a graph showing the sensitivity difference (%) in each case of Hct values of 0%, 42%, and 70% with reference to Glu 45 mg/dl in Comparative Example 3.
[0112] FIG. 31a is a graph showing the change with time in the response current value relative to an applied voltage with respect to each blood sample with a Glu concentration of 45 mg/dl (Hct value: 0%, 42%, and 70%) in Example 9.
[0113] FIG. 31b is a graph showing the change with time in the response current value relative to an applied voltage with respect to each blood sample with a Glu concentration of 550 mg/dl (Hct value: 0%, 42%, and 70%) in Example 9.
[0114] FIG. 31c is a graph showing the sensitivity difference (%) in each case of Glu values of 45 mg/dl and 550 mg/dl with reference to Hct 42% in Example 9.
[0115] FIG. 31d is a graph showing the sensitivity difference (%) in each case of Hct values of 0%, 42%, and 70% with reference to Glu 45 mg/dl in Example 9.
[0116] FIG. 32a is a graph showing the change with time in the response current value relative to an applied voltage with respect to each blood sample with a Glu concentration of 45 mg/dl (Hct value: 0%, 42%, and 70%) in Example 10.
[0117] FIG. 32b is a graph showing the change with time in the response current value relative to an applied voltage with respect to each blood sample with a Glu concentration of 550 mg/dl (Hct value: 0%, 42%, and 70%) in Example 10.
[0118] FIG. 32c is a graph showing the sensitivity difference (%) in each case of Glu values of 45 mg/dl and 550 mg/dl with reference to Hct 42% in Example 10.
[0119] FIG. 32d is a graph showing the sensitivity difference (%) in each case of Hct values of 0%, 42%, and 70% with reference to Glu 45 mg/dl in Example 10.
[0120] FIG. 33a is a graph showing the change with time in the response current value relative to an applied voltage with respect to each blood sample with a Glu concentration of 45 mg/dl (Hct value: 0%, 42%, and 70%) in Example 11.
[0121] FIG. 33b is a graph showing the change with time in the response current value relative to an applied voltage with respect to each blood sample with a Glu concentration of 550 mg/dl (Hct value: 0%, 42%, and 70%) in Example 11.
[0122] FIG. 33c is a graph showing the sensitivity difference (%) in each case of Glu values of 45 mg/dl and 550 mg/dl with reference to Hct 42% in Example 11.
[0123] FIG. 33d is a graph showing the sensitivity difference (%) in each case of Hct values of 0%, 42%, and 70% with reference to Glu 45 mg/dl in Example 11.
[0124] FIG. 34a is a graph showing the change with time in the response current value relative to an applied voltage with respect to each blood sample with a Glu concentration of 45 mg/dl (Hct value: 0%, 42%, and 70%) in Example 12.
[0125] FIG. 34b is a graph showing the change with time in the response current value relative to an applied voltage with respect to each blood sample with a Glu concentration of 550 mg/dl (Hct value: 0%, 42%, and 70%) in Example 12.
[0126] FIG. 34c is a graph showing the sensitivity difference (%) in each case of Glu values of 45 mg/dl and 550 mg/dl with reference to Hct 42% in Example 12.
[0127] FIG. 34d is a graph showing the sensitivity difference (%) in each case of Hct values of 0%, 42%, and 70% with reference to Glu 45 mg/dl in Example 12.
[0128] FIG. 35a is a graph showing the sensitivity difference (%) in each case of Glu values of 45 mg/dl and 550 mg/dl with reference to Hct 42% in Example 13.
[0129] FIG. 35b is a graph showing the sensitivity difference (%) in each case of Hct values of 0%, 42%, and 70% with reference to Glu 45 mg/dl in Example 13.
[0130] FIG. 36a is a graph showing the sensitivity difference (%) in each case of Glu values of 45 mg/dl and 550 mg/dl with reference to Hct 42% in Example 14.
[0131] FIG. 36b is a graph showing the sensitivity difference (%) in each case of Hct values of 0%, 42%, and 70% with reference to Glu 45 mg/dl in Example 14.
[0132] FIG. 37a is a graph showing the sensitivity difference (%) in each case of Glu values of 45 mg/dl and 550 mg/dl with reference to Hct 42% in Example 15.
[0133] FIG. 37b is a graph showing the sensitivity difference (%) in each case of Hct values of 0%, 42%, and 70% with reference to Glu 45 mg/dl in Example 15.
[0134] FIG. 38a is a graph showing the sensitivity difference (%) in each case of Glu values of 45 mg/dl and 550 mg/dl with reference to Hct 42% in Example 16.
[0135] FIG. 38b is a graph showing the sensitivity difference (%) in each case of Hct values of 0%, 42%, and 70% with reference to Glu 45 mg/dl in Example 16.
[0136] FIG. 39a is a graph showing the sensitivity difference (%) in each case of Glu values of 45 mg/dl and 550 mg/dl with reference to Hct 42% in Example 17.
[0137] FIG. 39b is a graph showing the sensitivity difference (%) in each case of Hct values of 0%, 42%, and 70% with reference to Glu 45 mg/dl in Example 17.
[0138] FIG. 40a is a graph showing the sensitivity difference (%) in each case of Glu values of 45 mg/dl and 550 mg/dl with reference to Hct 42% in Example 18.
[0139] FIG. 40b is a graph showing the sensitivity difference (%) in each case of Hct values of 0%, 42%, and 70% with reference to Glu 45 mg/dl in Example 18.
[0140] FIG. 41a is a graph showing the sensitivity difference (%) in each case of Glu values of 45 mg/dl and 550 mg/dl with reference to Hct 42% in Example 19.
[0141] FIG. 41b is a graph showing the sensitivity difference (%) in each case of Hct values of 0%, 42%, and 70% with reference to Glu 45 mg/dl in Example 19.
[0142] FIG. 42a is a graph showing the sensitivity difference (%) in each case of Glu values of 45 mg/dl and 550 mg/dl with reference to Hct 42% in Example 20.
[0143] FIG. 42b is a graph showing the sensitivity difference (%) in each case of Hct values of 0%, 42%, and 70% with reference to Glu 45 mg/dl in Example 20.
[0144] FIG. 43a is a graph showing the sensitivity difference (%) in each case of Glu values of 45 mg/dl and 550 mg/dl with reference to Hct 42% in Example 21.
[0145] FIG. 43b is a graph showing the sensitivity difference (%) in each case of Hct values of 0%, 42%, and 70% with reference to Glu 45 mg/dl in Example 21.
[0146] FIG. 44a is a graph showing the sensitivity difference (%) in each case of Glu values of 45 mg/dl and 550 mg/dl with reference to Hct 42% in Example 22.
[0147] FIG. 44b is a graph showing the sensitivity difference (%) in each case of Hct values of 0%, 42%, and 70% with reference to Glu 45 mg/dl in Example 22.
[0148] FIG. 45a is a graph showing the sensitivity difference (%) in each case of Glu values of 45 mg/dl and 550 mg/dl with reference to Hct 42% in Example 23.
[0149] FIG. 45b is a graph showing the sensitivity difference (%) in each case of Hct values of 0%, 42%, and 70% with reference to Glu 45 mg/dl in Example 23.
[0150] FIG. 46a is a graph showing the sensitivity difference (%) in each case of Glu values of 45 mg/dl and 550 mg/dl with reference to Hct 42% in Example 24.
[0151] FIG. 46b is a graph showing the sensitivity difference (%) in each case of Hct values of 0%, 42%, and 70% with reference to Glu 45 mg/dl in Example 24.
[0152] FIG. 47a is a graph showing the sensitivity difference (%) in each case of Glu values of 45 mg/dl and 550 mg/dl with reference to Hct 42% in Example 25.
[0153] FIG. 47b is a graph showing the sensitivity difference (%) in each case of Hct values of 0%, 42%, and 70% with reference to Glu 45 mg/dl in Example 25.
[0154] FIG. 48a is a graph showing the sensitivity difference (%) in each case of Glu values of 45 mg/dl and 550 mg/dl with reference to Hct 42% in Example 26.
[0155] FIG. 48b is a graph showing the sensitivity difference (%) in each case of Hct values of 0%, 42%, and 70% with reference to Glu 45 mg/dl in Example 26.
[0156] FIG. 49a is a graph showing the sensitivity difference (%) in each case of Glu values of 45 mg/dl and 550 mg/dl with reference to Hct 42% in Example 27.
[0157] FIG. 49b is a graph showing the sensitivity difference (%) in each case of Hct values of 0%, 42%, and 70% with reference to Glu 45 mg/dl in Example 27.
[0158] FIG. 50a is a graph showing the sensitivity difference (%) in each case of Glu values of 45 mg/dl and 550 mg/dl with reference to Hct 42% in Example 28.
[0159] FIG. 50b is a graph showing the sensitivity difference (%) in each case of Hct values of 0%, 42%, and 70% with reference to Glu 45 mg/dl in Example 28.
[0160] FIG. 51a is a graph showing the sensitivity difference (%) in each case of Glu values of 45 mg/dl and 550 mg/dl with reference to Hct 42% in Example 29.
[0161] FIG. 51b is a graph showing the sensitivity difference (%) in each case of Hct values of 0%, 42%, and 70% with reference to Glu 45 mg/dl in Example 29.
[0162] FIG. 52a is a graph showing the sensitivity difference (%) in each case of Glu values of 45 mg/dl and 550 mg/dl with reference to Hct 42% in Example 30.
[0163] FIG. 52b is a graph showing the sensitivity difference (%) in each case of Hct values of 0%, 42%, and 70% with reference to Glu 45 mg/dl in Example 30.
[0164] FIG. 53a is a graph showing the sensitivity difference (%) in each case of Glu values of 45 mg/dl and 550 mg/dl with reference to Hct 42% in Example 31.
[0165] FIG. 53b is a graph showing the sensitivity difference (%) in each case of Hct values of 0%, 42%, and 70% with reference to Glu 45 mg/dl in Example 31.
[0166] FIG. 54a is a graph showing the sensitivity difference (%) in each case of Glu values of 45 mg/dl and 550 mg/dl with reference to Hct 42% in Example 32.
[0167] FIG. 54b is a graph showing the sensitivity difference (%) in each case of Hct values of 0%, 42%, and 70% with reference to Glu 45 mg/dl in Example 32.
[0168] FIG. 55a is a graph showing the sensitivity difference (%) in each case of Glu values of 45 mg/dl and 550 mg/dl with reference to Hct 42% in Comparative Example 4.
[0169] FIG. 55b is a graph showing the sensitivity difference (%) in each case of Hct values of 0%, 42%, and 70% with reference to Glu 45 mg/dl in Comparative Example 4.
[0170] FIG. 56a is a graph showing the sensitivity difference (%) in each case of Glu values of 45 mg/dl and 550 mg/dl with reference to Hct 42% in Comparative Example 5.
[0171] FIG. 56b is a graph showing the sensitivity difference (%) in each case of Hct values of 0%, 42%, and 70% with reference to Glu 45 mg/dl in Comparative Example 5.
[0172] FIG. 57a is a graph showing the sensitivity difference (%) in each case of Glu values of 45 mg/dl and 5.50 mg/dl with reference to Hct 42% in Comparative Example 6.
[0173] FIG. 57b is a graph showing the sensitivity difference (%) in each case of Hct values of 0%, 42%, and 70% with reference to Glu 45 mg/dl in Comparative Example 6.
[0174] FIG. 58a is a graph showing the change with time in the response current value relative to an applied voltage with respect to each blood sample with a Glu concentration of 45 mg/dl (Hct value: 0%, 42%, and 70%) in Example 33.
[0175] FIG. 58b is a graph showing the change with time in the response current value relative to an applied voltage with respect to each blood sample with a Glu concentration of 550 mg/dl (Hct value: 0%, 42%, and 70%) in Example 33.
[0176] FIG. 58c is a graph showing the sensitivity difference (%) in each case of Glu values of 45 mg/dl and 550 mg/dl with reference to Hct 42% in Example 33.
[0177] FIG. 58d is a graph showing the sensitivity difference (%) in each case of Hct values of 0%, 42%, and 70% with reference to Glu 45 mg/dl in Example 33.
[0178] FIG. 59a is a graph showing the change with time in the response current value relative to an applied voltage with respect to each blood sample with a Glu concentration of 45 mg/dl (Hct value: 0%, 42%, and 70%) in Example 34.
[0179] FIG. 59b is a graph showing the change with time in the response current value relative to an applied voltage with respect to each blood sample with a Glu concentration of 550 mg/dl (Hct value: 0%, 42%, and 70%) in Example 34.
[0180] FIG. 59c is a graph showing the sensitivity difference (%) in each case of Glu values of 45 mg/dl and 550 mg/dl with reference to Hct 42% in Example 34.
[0181] FIG. 59d is a graph showing the sensitivity difference (%) in each case of Hct values of 0%, 42%, and 70% with reference to Glu 45 mg/dl in Example 34.
[0182] FIG. 60a is a graph showing the change with time in the response current value relative to an applied voltage with respect to each blood sample with a Glu concentration of 45 mg/dl (Hct value: 0%, 42%, and 70%) in Example 35.
[0183] FIG. 60b is a graph showing the change with time in the response current value relative to an applied voltage with respect to each blood sample with a Glu concentration of 550 mg/dl (Hct value: 0%, 42%, and 70%) in Example 35.
[0184] FIG. 60c is a graph showing the sensitivity difference (%) in each case of Glu values of 45 mg/dl and 550 mg/dl with reference to Hct 42% in Example 35.
[0185] FIG. 60d is a graph showing the sensitivity difference (%) in each case of Hct values of 0%, 42%, and 70% with reference to Glu 45 mg/dl in Example 35.
[0186] FIG. 61a is a graph showing the change with time in the response current value relative to an applied voltage with respect to each blood sample with a Glu concentration of 45 mg/dl (Hct value: 0%, 42%, and 70%) in Example 36.
[0187] FIG. 61b is a graph showing the change with time in the response current value relative to an applied voltage with respect to each blood sample with a Glu concentration of 550 mg/dl (Hct value: 0%, 42%, and 70%) in Example 36.
[0188] FIG. 61c is a graph showing the sensitivity difference (%) in each case of Glu values of 45 mg/dl and 550 mg/dl with reference to Hct 42% in Example 36.
[0189] FIG. 61d is a graph showing the sensitivity difference (%) in each case of Hct values of 0%, 42%, and 70% with reference to Glu 45 mg/dl in Example 36.
[0190] FIG. 62a is a graph showing the change with time in the response current value relative to an applied voltage with respect to each blood sample with a Glu concentration of 45 mg/dl (Hct value: 0%, 42%, and 70%) in Example 37.
[0191] FIG. 62b is a graph showing the change with time in the response current value relative to an applied voltage with respect to each blood sample with a Glu concentration of 550 mg/dl (Hct value: 0%, 42%, and 70%) in Example 37.
[0192] FIG. 62c is a graph showing the sensitivity difference (%) in each case of Glu values of 45 mg/dl and 550 mg/dl with reference to Hct 42% in Example 37.
[0193] FIG. 62d is a graph showing the sensitivity difference (%) in each case of Hct values of 0%, 42%, and 70% with reference to Glu 45 mg/dl in Example 37.
[0194] FIG. 63a is a graph showing the change with time in the response current value relative to an applied voltage with respect to each blood sample with a Glu concentration of 45 mg/dl (Hct value: 0%, 42%, and 70%) in Example 38.
[0195] FIG. 63b is a graph showing the change with time in the response current value relative to an applied voltage with respect to each blood sample with a Glu concentration of 550 mg/dl (Hct value: 0%, 42%, and 70%) in Example 38.
[0196] FIG. 63c is a graph showing the sensitivity difference (%) in each case of Glu values of 45 mg/dl and 550 mg/dl with reference to Hct 42% in Example 38.
[0197] FIG. 63d is a graph showing the sensitivity difference (%) in each case of Hct values of 0%, 42%, and 70% with reference to Glu 45 mg/dl in Example 38.
[0198] FIG. 64a is a graph showing the change with time in the response current value relative to an applied voltage with respect to each blood sample with a Glu concentration of 45 mg/dl (Hct value: 0%, 42%, and 70%) in Example 39.
[0199] FIG. 64b is a graph showing the change with time in the response current value relative to an applied voltage with respect to each blood sample with a Glu concentration of 550 mg/dl (Hct value: 0%, 42%, and 70%) in Example 39.
[0200] FIG. 64c is a graph showing the sensitivity difference (%) in each case of Glu values of 45 mg/dl and 550 mg/dl with reference to Hct 42% in Example 39.
[0201] FIG. 64d is a graph showing the sensitivity difference (%) in each case of Hct values of 0%, 42%, and 70% with reference to Glu 45 mg/dl in Example 39.
[0202] FIG. 65a is a graph showing the change with time in the response current value relative to an applied voltage with respect to each blood sample with a Glu concentration of 45 mg/dl (Hct value: 0%, 42%, and 70%) in Example 40.
[0203] FIG. 65b is a graph showing the change with time in the response current value relative to an applied voltage with respect to each blood sample with a Glu concentration of 550 mg/dl (Hct value: 0%, 42%, and 70%) in Example 40.
[0204] FIG. 65c is a graph showing the sensitivity difference (%) in each case of Glu values of 45 mg/dl and 550 mg/dl with reference to Hct 42% in Example 40.
[0205] FIG. 65d is a graph showing the sensitivity difference (%) in each case of Hct values of 0%, 42%, and 70% with reference to Glu 45 mg/dl in Example 40.
[0206] FIG. 66a is a graph showing the change with time in the response current value relative to an applied voltage with respect to each blood sample with a Glu concentration of 45 mg/dl (Hct value: 0%, 42%, and 70%) in Example 41.
[0207] FIG. 66b is a graph showing the change with time in the response current value relative to an applied voltage with respect to each blood sample with a Glu concentration of 550 mg/dl (Hct value: 0%, 42%, and 70%) in Example 41.
[0208] FIG. 66c is a graph showing the sensitivity difference (%) in each case of Glu values of 45 mg/dl and 550 mg/dl with reference to Hct 42% in Example 41.
[0209] FIG. 66d is a graph showing the sensitivity difference (%) in each case of Hct values of 0%, 42%, and 70% with reference to Glu 45 mg/dl in Example 41.
[0210] FIG. 67a is a graph showing the change with time in the response current value relative to an applied voltage with respect to each blood sample with a Glu concentration of 45 mg/dl (Hct value: 0%, 42%, and 70%) in Example 42.
[0211] FIG. 67b is a graph showing the change with time in the response current value relative to an applied voltage with respect to each blood sample with a Glu concentration of 550 mg/dl (Hct value: 0%, 42%, and 70%) in Example 42.
[0212] FIG. 67c is a graph showing the sensitivity difference (%) in each case of Glu values of 45 mg/dl and 550 mg/dl with reference to Hct 42% in Example 42.
[0213] FIG. 67d is a graph showing the sensitivity difference (%) in each case of Hct values of 0%, 42%, and 70% with reference to Glu 45 mg/dl in Example 42.
[0214] FIG. 68a is a graph showing the sensitivity difference (%) in each case of Glu values of 45 mg/dl and 550 mg/dl with reference to Hct 42% in Example 43.
[0215] FIG. 68b is a graph showing the sensitivity difference (%) in each case of Hct values of 0%, 42%, and 70% with reference to Glu 45 mg/dl in Example 43.
[0216] FIG. 69a is a graph showing the sensitivity difference (%) in each case of Glu values of 45 mg/dl and 550 mg/dl with reference to Hct 42% in Example 44.
[0217] FIG. 69b is a graph showing the sensitivity difference (%) in each case of Hct values of 0%, 42%, and 70% with reference to Glu 45 mg/dl in Example 44.
[0218] FIG. 70a is a graph showing the sensitivity difference (%) in each case of Glu values of 45 mg/dl and 550 mg/dl with reference to Hct 42% in Example 45.
[0219] FIG. 70b is a graph showing the sensitivity difference (%) in each case of Hct values of 0%, 42%, and 70% with reference to Glu 45 mg/dl in Example 45.
[0220] FIG. 71a is a graph showing the sensitivity difference (%) in each case of Glu values of 45 mg/dl and 550 mg/dl with reference to Hct 42% in Example 46.
[0221] FIG. 71b is a graph showing the sensitivity difference (%) in each case of Hct values of 0%, 42%, and 70% with reference to Glu 45 mg/dl in Example 46.
[0222] FIG. 72a is a graph showing the sensitivity difference (%) in each case of Glu values of 45 mg/dl and 550 mg/dl with reference to Hct 42% in Example 47.
[0223] FIG. 72b is a graph showing the sensitivity difference (%) in each case of Hct values of 0%, 42%, and 70% with reference to Glu 45 mg/dl in Example 47.
[0224] FIG. 73a is a graph showing the sensitivity difference (%) in each case of Glu values of 45 mg/dl and 550 mg/dl with reference to Hct 42% in Example 48.
[0225] FIG. 73b is a graph showing the sensitivity difference (%) in each case of Hct values of 0%, 42%, and 70% with reference to Glu 45 mg/dl in Example 48.
[0226] FIG. 74a is a graph showing the sensitivity difference (%) in each case of Glu values of 45 mg/dl and 550 mg/dl with reference to Hct 42% in Example 49.
[0227] FIG. 74b is a graph showing the sensitivity difference (%) in each case of Hct values of 0%, 42%, and 70% with reference to Glu 45 mg/dl in Example 49.
[0228] FIG. 75a is a graph showing the sensitivity difference (%) in each case of Glu values of 45 mg/dl and 550 mg/dl with reference to Hct 42% in Example 50.
[0229] FIG. 75b is a graph showing the sensitivity difference (%) in each case of Hct values of 0%, 42%, and 70% with reference to Glu 45 mg/dl in Example 50.
[0230] FIG. 76a is a graph showing the sensitivity difference (%) in each case of Glu values of 45 mg/dl and 550 mg/dl with reference to Hct 42% in Example 51.
[0231] FIG. 76b is a graph showing the sensitivity difference (%) in each case of Hct values of 0%, 42%, and 70% with reference to Glu 45 mg/dl in Example 51.
[0232] FIG. 77a is a graph showing the sensitivity difference (%) in each case of Glu values of 45 mg/dl and 550 mg/dl with reference to Hct 42% in Example 52.
[0233] FIG. 77b is a graph showing the sensitivity difference (%) in each case of Hct values of 0%, 42%, and 70% with reference to Glu 45 mg/dl in Example 52.
[0234] FIG. 78a is a graph showing the sensitivity difference (%) in each case of Glu values of 45 mg/dl and 550 mg/dl with reference to Hct 42% in Comparative Example 7.
[0235] FIG. 78b is a graph showing the sensitivity difference (%) in each case of Hct values of 0%, 42%, and 70% with reference to Glu 45 mg/dl in Comparative Example 7.
[0236] FIG. 79a is a graph showing the sensitivity difference (%) in each case of Glu values of 45 mg/dl and 550 mg/dl with reference to Hct 42% in Comparative Example 8.
[0237] FIG. 79b is a graph showing the sensitivity difference (%) in each case of Hct values of 0%, 42%, and 70% with reference to Glu 45 mg/dl in Comparative Example 8.
[0238] FIG. 80(a) shows the relationship between voltage application time and applied voltage in Examples 53 to 73 of Embodiment 3 and Comparative Examples 9 to 13. Furthermore, FIG. 80(b) shows the relationship between voltage application time and applied voltage in Examples 74 to 93 of Embodiment 3 and Comparative Example 14.
[0239] FIG. 81a is a graph showing the sensitivity difference (%) in each case of Glu values of 45 mg/dl and 550 mg/dl with reference to Hct 42% in Example 53.
[0240] FIG. 81b is a graph showing the sensitivity difference (%) in each case of Hct values of 0%, 42%, and 70% with reference to Glu 45 mg/dl in Example 53.
[0241] FIG. 82a is a graph showing the sensitivity difference (%) in each case of Glu values of 45 mg/dl and 550 mg/dl with reference to Hct 42% in Example 54.
[0242] FIG. 82b is a graph showing the sensitivity difference (%) in each case of Hct values of 0%, 42%, and 70% with reference to Glu 45 mg/dl in Example 54.
[0243] FIG. 83a is a graph showing the sensitivity difference (%) in each case of Glu values of 45 mg/dl and 550 mg/dl with reference to Hct 42% in Example 55.
[0244] FIG. 83b is a graph showing the sensitivity difference (%) in each case of Hct values of 0%, 42%, and 70% with reference to Glu 45 mg/dl in Example 55.
[0245] FIG. 84a is a graph showing the sensitivity difference (%) in each case of Glu values of 45 mg/dl and 550 mg/dl with reference to Hct 42% in Example 56.
[0246] FIG. 84b is a graph showing the sensitivity difference (%) in each case of Hct values of 0%, 42%, and 70% with reference to Glu 45 mg/dl in Example 56.
[0247] FIG. 85a is a graph showing the sensitivity difference (%) in each case of Glu values of 45 mg/dl and 550 mg/dl with reference to Hct 42% in Example 57.
[0248] FIG. 85b is a graph showing the sensitivity difference (%) in each case of Hct values of 0%, 42%, and 70% with reference to Glu 45 mg/dl in Example 57.
[0249] FIG. 86a is a graph showing the sensitivity difference (%) in each case of Glu values of 45 mg/dl and 550 mg/dl with reference to Hct 42% in Example 58.
[0250] FIG. 86b is a graph showing the sensitivity difference (%) in each case of Hct values of 0%, 42%, and 70% with reference to Glu 45 mg/dl in Example 58.
[0251] FIG. 87a is a graph showing the sensitivity difference (%) in each case of Glu values of 45 mg/dl and 550 mg/dl with reference to Hct 42% in Example 59.
[0252] FIG. 87b is a graph showing the sensitivity difference (%) in each case of Hct values of 0%, 42%, and 70% with reference to Glu 45 mg/dl in Example 59.
[0253] FIG. 88a is a graph showing the sensitivity difference (%) in each case of Glu values of 45 mg/dl and 550 mg/dl with reference to Hct 42% in Example 60.
[0254] FIG. 88b is a graph showing the sensitivity difference (%) in each case of Hct values of 0%, 42%, and 70% with reference to Glu 45 mg/dl in Example 60.
[0255] FIG. 89a is a graph showing the sensitivity difference (%) in each case of Glu values of 45 mg/dl and 550 mg/dl with reference to Hct 42% in Example 61.
[0256] FIG. 89b is a graph showing the sensitivity difference (%) in each case of Hct values of 0%, 42%, and 70% with reference to Glu 45 mg/dl in Example 61.
[0257] FIG. 90a is a graph showing the sensitivity difference (%) in each case of Glu values of 45 mg/dl and 550 mg/dl with reference to Hct 42% in Example 62.
[0258] FIG. 90b is a graph showing the sensitivity difference (%) in each case of Hct values of 0%, 42%, and 70% with reference to Glu 45 mg/dl in Example 62.
[0259] FIG. 91a is a graph showing the sensitivity difference (%) in each case of Glu values of 45 mg/dl and 550 mg/dl with reference to Hct 42% in Example 63.
[0260] FIG. 91b is a graph showing the sensitivity difference (%) in each case of Hct values of 0%, 42%, and 70% with reference to Glu 45 mg/dl in Example 63.
[0261] FIG. 92a is a graph showing the sensitivity difference (%) in each case of Glu values of 45 mg/dl and 550 mg/dl with reference to Hct 42% in Example 64.
[0262] FIG. 92b is a graph showing the sensitivity difference (%) in each case of Hct values of 0%, 42%, and 70% with reference to Glu 45 mg/dl in Example 64.
[0263] FIG. 93a is a graph showing the sensitivity difference (%) in each case of Glu values of 45 mg/dl and 550 mg/dl with reference to Hct 42% in Example 65.
[0264] FIG. 93b is a graph showing the sensitivity difference (%) in each case of Hct values of 0%, 42%, and 70% with reference to Glu 45 mg/dl in Example 65.
[0265] FIG. 94a is a graph showing the sensitivity difference (%) in each case of Glu values of 45 mg/dl and 550 mg/dl with reference to Hct 42% in Example 66.
[0266] FIG. 94b is a graph showing the sensitivity difference (%) in each case of Hct values of 0%, 42%, and 70% with reference to Glu 45 mg/dl in Example 66.
[0267] FIG. 95a is a graph showing the sensitivity difference (%) in each case of Glu values of 45 mg/dl and 550 mg/dl with reference to Hct 42% in Comparative Example 9.
[0268] FIG. 95b is a graph showing the sensitivity difference (%) in each case of Hct values of 0%, 42%, and 70% with reference to Glu 45 mg/dl in Comparative Example 9.
[0269] FIG. 96a is a graph showing the sensitivity difference (%) in each case of Glu values of 45 mg/dl and 550 mg/dl with reference to Hct 42% in Comparative Example 10.
[0270] FIG. 96b is a graph showing the sensitivity difference (%) in each case of Hct values of 0%, 42%, and 70% with reference to Glu 45 mg/dl in Comparative Example 10.
[0271] FIG. 97a is a graph showing the sensitivity difference (%) in each case of Glu values of 45 mg/dl and 550 mg/dl with reference to Hct 42% in Comparative Example 11.
[0272] FIG. 97b is a graph showing the sensitivity difference (%) in each case of Hct values of 0%, 42%, and 70% with reference to Glu 45 mg/dl in Comparative Example 11.
[0273] FIG. 98a is a graph showing the sensitivity difference (%) in each case of Glu values of 45 mg/dl and 550 mg/dl with reference to Hct 42% in Example 67.
[0274] FIG. 98b is a graph showing the sensitivity difference (%) in each case of Hct values of 0%, 42%, and 70% with reference to Glu 45 mg/dl in Example 67.
[0275] FIG. 99a is a graph showing the sensitivity difference (%) in each case of Glu values of 45 mg/dl and 550 mg/dl with reference to Hct 42% in Example 68.
[0276] FIG. 99b is a graph showing the sensitivity difference (%) in each case of Hct values of 0%, 42%, and 70% with reference to Glu 45 mg/dl in Example 68.
[0277] FIG. 100a is a graph showing the sensitivity difference (%) in each case of Glu values of 45 mg/dl and 550 mg/dl with reference to Hct 42% in Example 69.
[0278] FIG. 100b is a graph showing the sensitivity difference (%) in each case of Hct values of 0%, 42%, and 70% with reference to Glu 45 mg/dl in Example 69.
[0279] FIG. 101a is a graph showing the sensitivity difference (%) in each case of Glu values of 45 mg/dl and 550 mg/dl with reference to Hct 42% in Example 70.
[0280] FIG. 101b is a graph showing the sensitivity difference (%) in each case of Hct values of 0%, 42%, and 70% with reference to Glu 45 mg/dl in Example 70.
[0281] FIG. 102a is a graph showing the sensitivity difference (%) in each case of Glu values of 45 mg/dl and 550 mg/dl with reference to Hct 42% in Example 71.
[0282] FIG. 102b is a graph showing the sensitivity difference (%) in each case of Hct values of 0%, 42%, and 70% with reference to Glu 45 mg/dl in Example 71.
[0283] FIG. 103a is a graph showing the sensitivity difference (%) in each case of Glu values of 45 mg/dl and 550 mg/dl with reference to Hct 42% in Example 72.
[0284] FIG. 103b is a graph showing the sensitivity difference (%) in each case of Hct values of 0%, 42%, and 70% with reference to Glu 45 mg/dl in Example 72.
[0285] FIG. 104a is a graph showing the sensitivity difference (%) in each case of Glu values of 45 mg/dl and 550 mg/dl with reference to Hct 42% in Example 73.
[0286] FIG. 104b is a graph showing the sensitivity difference (%) in each case of Hct values of 0%, 42%, and 70% with reference to Glu 45 mg/dl in Example 73.
[0287] FIG. 105a is a graph showing the sensitivity difference (%) in each case of Glu values of 45 mg/dl and 550 mg/dl with reference to Hct 42% in Comparative Example 12.
[0288] FIG. 105b is a graph showing the sensitivity difference (%) in each case of Hct values of 0%, 42%, and 70% with reference to Glu 45 mg/dl in Comparative Example 12.
[0289] FIG. 106a is a graph showing the sensitivity difference (%) in each case of Glu values of 45 mg/dl and 550 mg/dl with reference to Hct 42% in Comparative Example 13.
[0290] FIG. 106b is a graph showing the sensitivity difference (%) in each case of Hct values of 0%, 42%, and 70% with reference to Glu 45 mg/dl in Comparative Example 13.
[0291] FIG. 107a is a graph showing the sensitivity difference (%) in each case of Glu values of 45 mg/dl and 550 mg/dl with reference to Hct 42% in Example 74.
[0292] FIG. 107b is a graph showing the sensitivity difference (%) in each case of Hct values of 0%, 42%, and 70% with reference to Glu 45 mg/dl in Example 74.
[0293] FIG. 108a is a graph showing the sensitivity difference (%) in each case of Glu values of 45 mg/dl and 550 mg/dl with reference to Hct 42% in Example 75.
[0294] FIG. 108b is a graph showing the sensitivity difference (%) in each case of Hct values of 0%, 42%, and 70% with reference to Glu 45 mg/dl in Example 75.
[0295] FIG. 109a is a graph showing the sensitivity difference (%) in each case of Glu values of 45 mg/dl and 550 mg/dl with reference to Hct 42% in Example 76.
[0296] FIG. 109b is a graph showing the sensitivity difference (%) in each case of Hct values of 0%, 42%, and 70% with reference to Glu 45 mg/dl in Example 76.
[0297] FIG. 110a is a graph showing the sensitivity difference (%) in each case of Glu values of 45 mg/dl and 550 mg/dl with reference to Hct 42% in Example 77.
[0298] FIG. 110b is a graph showing the sensitivity difference (%) in each case of Hct values of 0%, 42%, and 70% with reference to Glu 45 mg/dl in Example 77.
[0299] FIG. 111a is a graph showing the sensitivity difference (%) in each case of Glu values of 45 mg/dl and 550 mg/dl with reference to Hct 42% in Example 78.
[0300] FIG. 111b is a graph showing the sensitivity difference (%) in each case of Hct values of 0%, 42%, and 70% with reference to Glu 45 mg/dl in Example 78.
[0301] FIG. 112a is a graph showing the sensitivity difference (%) in each case of Glu values of 45 mg/dl and 550 mg/dl with reference to Hct 42% in Example 79.
[0302] FIG. 112b is a graph showing the sensitivity difference (%) in each case of Hct values of 0%, 42%, and 70% with reference to Glu 45 mg/dl in Example 79.
[0303] FIG. 113a is a graph showing the sensitivity difference (%) in each case of Glu values of 45 mg/dl and 550 mg/dl with reference to Hct 42% in Example 80.
[0304] FIG. 113b is a graph showing the sensitivity difference (%) in each case of Hct values of 0%, 42%, and 70% with reference to Glu 45 mg/dl in Example 80.
[0305] FIG. 114a is a graph showing the sensitivity difference (%) in each case of Glu values of 45 mg/dl and 550 mg/dl with reference to Hct 42% in Example 81.
[0306] FIG. 114b is a graph showing the sensitivity difference (%) in each case of Hct values of 0%, 42%, and 70% with reference to Glu 45 mg/dl in Example 81.
[0307] FIG. 115a is a graph showing the sensitivity difference (%) in each case of Glu values of 45 mg/dl and 550 mg/dl with reference to Hct 42% in Example 82.
[0308] FIG. 115b is a graph showing the sensitivity difference (%) in each case of Hct values of 0%, 42%, and 70% with reference to Glu 45 mg/dl in Example 82.
[0309] FIG. 116a is a graph showing the sensitivity difference (%) in each case of Glu values of 45 mg/dl and 550 mg/dl with reference to Hct 42% in Example 83.
[0310] FIG. 116b is a graph showing the sensitivity difference (%) in each case of Hct values of 0%, 42%, and 70% with reference to Glu 45 mg/dl in Example 83.
[0311] FIG. 117a is a graph showing the sensitivity difference (%) in each case of Glu values of 45 mg/dl and 550 mg/dl with reference to Hct 42% in Example 84.
[0312] FIG. 117b is a graph showing the sensitivity difference (%) in each case of Hct values of 0%, 42%, and 70% with reference to Glu 45 mg/dl in Example 84.
[0313] FIG. 118a is a graph showing the sensitivity difference (%) in each case of Glu values of 45 mg/dl and 550 mg/dl with reference to Hct 42% in Example 85.
[0314] FIG. 118b is a graph showing the sensitivity difference (%) in each case of Hct values of 0%, 42%, and 70% with reference to Glu 45 mg/dl in Example 85.
[0315] FIG. 119a is a graph showing the sensitivity difference (%) in each case of Glu values of 45 mg/dl and 550 mg/dl with reference to Hct 42% in Example 86.
[0316] FIG. 119b is a graph showing the sensitivity difference (%) in each case of Hct values of 0%, 42%, and 70% with reference to Glu 45 mg/dl in Example 86.
[0317] FIG. 120a is a graph showing the sensitivity difference (%) in each case of Glu values of 45 mg/dl and 550 mg/dl with reference to Hct 42% in Example 87.
[0318] FIG. 120b is a graph showing the sensitivity difference (%) in each case of Hct values of 0%, 42%, and 70% with reference to Glu 45 mg/dl in Example 87.
[0319] FIG. 121a is a graph showing the sensitivity difference (%) in each case of Glu values of 45 mg/dl and 550 mg/dl with reference to Hct 42% in Example 88.
[0320] FIG. 121b is a graph showing the sensitivity difference (%) in each case of Hct values of 0%, 42%, and 70% with reference to Glu 45 mg/dl in Example 88.
[0321] FIG. 122a is a graph showing the sensitivity difference (%) in each case of Glu values of 45 mg/dl and 550 mg/dl with reference to Hct 42% in Example 89.
[0322] FIG. 122b is a graph showing the sensitivity difference (%) in each case of Hct values of 0%, 42%, and 70% with reference to Glu 45 mg/dl in Example 89.
[0323] FIG. 123a is a graph showing the sensitivity difference (%) in each case of Glu values of 45 mg/dl and 550 mg/dl with reference to Hct 42% in Example 90.
[0324] FIG. 123b is a graph showing the sensitivity difference (%) in each case of Hct values of 0%, 42%, and 70% with reference to Glu 45 mg/dl in Example 90.
[0325] FIG. 124a is a graph showing the sensitivity difference (%) in each case of Glu values of 45 mg/dl and 550 mg/dl with reference to Hct 42% in Example 91.
[0326] FIG. 124b is a graph showing the sensitivity difference (%) in each case of Hct values of 0%, 42%, and 70% with reference to Glu 45 mg/dl in Example 91.
[0327] FIG. 125a is a graph showing the sensitivity difference (%) in each case of Glu values of 45 mg/dl and 550 mg/dl with reference to Hct 42% in Example 92.
[0328] FIG. 125b is a graph showing the sensitivity difference (%) in each case of Hct values of 0%, 42%, and 70% with reference to Glu 45 mg/dl in Example 92.
[0329] FIG. 126a is a graph showing the sensitivity difference (%) in each case of Glu values of 45 mg/dl and 550 mg/dl with reference to Hct 42% in Example 93.
[0330] FIG. 126b is a graph showing the sensitivity difference (%) in each case of Hct values of 0%, 42%, and 70% with reference to Glu 45 mg/dl in Example 93.
[0331] FIG. 127a is a graph showing the sensitivity difference (%) in each case of Glu values of 45 mg/dl and 550 mg/dl with reference to Hct 42% in Comparative Example 14.
[0332] FIG. 127b is a graph showing the sensitivity difference (%) in each case of Hct values of 0%, 42%, and 70% with reference to Glu 45 mg/dl in Comparative Example 14.
DESCRIPTION OF PREFERRED EMBODIMENTS
[0333] Next, the present invention will be described in detail.
[0334] In the method for measuring a component of a biological sample and the biosensor of the present invention, examples of the component to be measured include glucose, ketone, HbA1c, lactic acid, uric acid, bilirubin, and cholesterol. In the biosensor that is used in the method for measuring a component of a biological sample of the present invention, the enzyme contained in the reagent part is suitably selected according to the component of the biological sample to be measured.
<First Method for Measuring Component of Biological Sample>
[0335] The present invention is:
a method for measuring a component of a biological sample with a biosensor provided with: a capillary for introducing the biological sample; an electrode part including a first electrode system that includes a first working electrode and a first counter electrode in the capillary; and a reagent part disposed so as to be in contact with the electrode part, the reagent part containing an enzyme and a mediator, and the method including a step of starting voltage application for a duration longer than 0 second and up to 0.7 second to the first electrode system within 0 second to 0.5 second after detection of introduction of the biological sample to obtain a Hct value based on a current value obtained thereby (the first method for measuring a component of a biological sample).
[0336] In the first method for measuring a component of a biological sample, the duration of the voltage application to the first electrode system is any duration longer than 0 second and up to 0.7 second, preferably any duration longer than 0 second and up to 0.5 second, and further preferably any duration longer than 0 second and up to 0.1 second.
[0337] In the first method for measuring a component of a biological sample, it is preferable that the voltage application to the first electrode system be started at 0 second after detection of introduction of the biological sample. Furthermore, in the first method for measuring a component of a biological sample, the voltage application to the first electrode system is started at later than 0 second but within 0.5 second after detection of introduction of the biological sample, preferably later than 0 second but within 0.3 second, more preferably later than 0 second but within 0.1 second, and further preferably later than 0 second but within 0.05 second.
[0338] In the first method for measuring a component of a biological sample, the voltage to be applied to the first electrode system is preferably any voltage in the range of 1.5 to 4.0 V, more preferably any voltage in the range of 1.5 to 3.0 V, and further preferably any voltage in the range of 1.5 to 2.5 V.
[0339] In the first method for measuring a component of a biological sample, in a biosensor in which the reagent layer is in contact with both the working electrode and the counter electrode, a voltage is applied for a very short time after detection of the biological sample and a Hct value is obtained based on a current value obtained thereby. According to such a method, the Hct value can be measured in a short time.
<Second Method for Measuring Component of Biological Sample>
[0340] Furthermore, the present invention is a method for measuring a component of a biological sample, wherein in the first method for measuring a component of a biological sample,
the component is Glu, and the method further includes; a step of applying a voltage to the first electrode system after the step to obtain a Hct value, to obtain a current value that depends on Glu, and a step of using the current value that depends on Glu and the Hct value to obtain a Glu value (the second method for measuring a component of a biological sample).
[0341] In the second method for measuring a component of a biological sample, the duration of the voltage application to the first electrode system in the step to obtain a current value that depends on Glu is preferably any duration between 0.01 and 10.0 seconds, more preferably any duration between 0.1 and 7.0 seconds, and further preferably any duration between 0.1 and 5.0 seconds.
[0342] In the second method for measuring a component of a biological sample, the voltage to be applied to the first electrode system in the step to obtain a current value that depends on Glu is preferably any voltage in the range of 0.1 V to 1.4 V, more preferably any voltage in the range of 0.1 V to 1.0 V.
[0343] In the second method for measuring a component of a biological sample, since the current value that depends on Glu in the vicinity of the electrodes that are in contact with the reagent layer and the Hct value in the vicinity of the same electrodes are used to obtain a Glu value, the Glu value can be measured, with the properties of the biological sample in the vicinity of the electrodes being reflected with higher accuracy. Furthermore, according to such a method, the Hct value can be measured in a short time.
[0344] In the second method for measuring a component of a biological sample, the step of applying a voltage to the first electrode system to obtain a current value that depends on Glu may be performed multiple times. In this case, a plurality of the current values that depend on Glu and the Hct value are used to obtain a Glu value. When the step to obtain a current value that depends on Glu is performed multiple times, the measurement accuracy can be further improved, which is preferable.
<Third Method for Measuring Component of Biological Sample>
[0345] Moreover, the present invention is a method for measuring a component of a biological sample, wherein in the first method for measuring a component of a biological sample, the component is Glu,
the electrode part is further provided with a second electrode system that includes a second working electrode and a second counter electrode, and the method further includes: a step of applying a voltage to the second electrode system after the step to obtain a Hct value, to obtain a current value that depends on Glu; and a step of using the current value that depends on Glu and the Hct value to obtain a Glu value (the third method for measuring a component of a biological sample).
[0346] In the third method for measuring a component of a biological sample, the duration of the applying a voltage to the second electrode system is preferably any duration between 0.01 and 10.0 seconds, more preferably any duration between 0.1 and 7.0 seconds, and further preferably any duration between 0.1 and 5.0 seconds.
[0347] In the third method for measuring a component of a biological sample, the voltage to be applied to the second electrode system is preferably any voltage in the range of 0.1 V to 1.4 V, more preferably any voltage in the range of 0.1 V to 1.0 V.
[0348] According to the third method for measuring a component of a biological sample, the Hct value can be measured in a short time, and the Glu value corrected using the Hct value can be obtained in a short time.
[0349] In the third method for measuring a component of a biological sample, the step of applying a voltage to the second electrode system to obtain a current value that depends on Glu may be performed multiple times. In this case, a plurality of the current values that depend on Glu and the Hct value are used to obtain a Glu value.
<Fourth Method for Measuring Component of Biological Sample>
[0350] Furthermore, the present invention is:
a method for measuring a component of a biological sample with a biosensor provided with: a capillary for introducing the biological sample; an electrode part including a first electrode system that includes a first working electrode and a first counter electrode in the capillary; and a reagent part disposed so as to be in contact with the electrode part, the component being Glu, the reagent part containing an enzyme and a mediator, and the method including: a step of starting voltage application for a duration longer than 0 second and up to 0.7 second to the first electrode system within 0 second to 0.5 second after detection of introduction of the biological sample to obtain a current value that depends on Hct; a step of applying a voltage to the first electrode system after the step to obtain a current value that depends on Hct, to obtain a current value that depends on Glu; and a step of using the current value that depends on Glu and the current value that depends on Hct to obtain a Glu value (the fourth method for measuring a component of a biological sample).
[0351] In the fourth method for measuring a component of a biological sample, the duration of the voltage application to the first electrode system in the step to obtain a current value that depends on Hct is preferably any duration longer than 0 second and up to 0.5 second, further preferably any duration longer than 0 second and up to 0.1 second.
[0352] In the fourth method for measuring a component of a biological sample, it is preferable that the voltage application to the first electrode system in the step to obtain a current value that depends on Hct be started at 0 second after detection of introduction of the biological sample.
[0353] In the fourth method for measuring a component of a biological sample, the voltage application to the first electrode system in the step to obtain a current value that depends on Hct is started at later than 0 second but within 0.5 second, preferably started at later than 0 second but within 0.3 second, more preferably started at later than 0 second but within 0.1 second, and further preferably started at later than 0 second but within 0.05 second after detection of introduction of the biological sample.
[0354] In the fourth method for measuring a component of a biological sample, the voltage to be applied to the first electrode system in the step to obtain a current value that depends on Hct is preferably any voltage in the range of 1.5 to 4.0 V, more preferably any voltage in the range of 1.5 V to 3.0 V, and further preferably any voltage in the range of 1.5 V to 2.5 V.
[0355] In the fourth method for measuring a component of a biological sample, the duration of the voltage application to the first electrode system in the step to obtain a current value that depends on Glu is preferably any duration between 0.01 and 10.0 seconds, more preferably any duration between 0.1 and 7.0 seconds, and further preferably any duration between 0.1 and 5.0 seconds.
[0356] In the fourth method for measuring a component of a biological sample, the voltage to be applied to the first electrode system in the step to obtain a current value that depends on Glu is preferably any voltage in the range of 0.1 V to 1.4 V, more preferably any voltage in the range of 0.1 V to 1.0 V.
[0357] In the fourth method for measuring a component of a biological sample, since the current value that depends on Glu in the vicinity of the electrodes that are in contact with the reagent layer and the current value that depends on Hct in the vicinity of the same electrodes are used to obtain a Glu value, the Glu value can be measured, with the properties of the biological sample in the vicinity of the electrodes being reflected with higher accuracy. Furthermore, according to such a method, the Hct value can be measured in a short time, and the Glu value corrected using the Hct value can be obtained in a short time.
[0358] In the fourth method for measuring a component of a biological sample, the step of applying a voltage to the first electrode system to obtain a current value that depends on Glu may be performed multiple times. In this case, a plurality of the current values that depend on Glu and the current value that depends on Hct are used to obtain a Glu value. When the step to obtain a current value that depends on Glu is performed multiple times, the measurement accuracy can be further improved, which is preferable.
<Fifth Method for Measuring Component of Biological Sample>
[0359] Moreover, the present invention is:
a method for measuring a component of a biological sample with a biosensor provided with: a capillary for introducing the biological sample; an electrode part including, in the capillary, a first electrode system that includes a first working electrode and a first counter electrode as well as a second electrode system that includes a second working electrode and a second counter electrode; and a reagent part disposed so as to be in contact with the electrode part, the component being Glu, the reagent part containing an enzyme and a mediator, and the method including: a step of starting voltage application for a duration longer than 0 second and up to 0.7 second to the first electrode system within 0 second to 0.5 second after detection of introduction of the biological sample to obtain a current value that depends on Hct; a step of applying a voltage to the second electrode system after the step to obtain a current value that depends on Hct, to obtain a current value that depends on Glu; and a step of using the current value that depends on Glu and the current value that depends on Hct to obtain a Glu value (the fifth method for measuring a component of a biological sample).
[0360] In the fifth method for measuring a component of a biological sample, the duration of the voltage application to the first electrode system is preferably any duration longer than 0 second and up to 0.5 second, further preferably any duration longer than 0 second and up to 0.1 second.
[0361] In the fifth method for measuring a component of a biological sample, it is preferable that the voltage application to the first electrode system be started at 0 second after detection of introduction of the biological sample.
[0362] In the fifth method for measuring a component of a biological sample, the voltage application to the first electrode system is started at later than 0 second but within 0.5 second, preferably started at later than 0 second but within 0.3 second, more preferably started at later than 0 second but within 0.1 second, and further preferably started at later than 0 second but within 0.05 second after detection of introduction of the biological sample.
[0363] In the fifth method for measuring a component of a biological sample, the voltage to be applied to the first electrode system is preferably any voltage in the range of 1.5 to 4.0 V, more preferably any voltage in the range of 1.5 V to 3.0 V, and further preferably any voltage in the range of 1.5 V to 2.5 V.
[0364] In the fifth method for measuring a component of a biological sample, the duration of applying a voltage to the second electrode system is preferably any duration between 0.01 and 10.0 seconds, more preferably any duration between 0.1 and 7.0 seconds, and further preferably any duration between 0.1 and 5.0 seconds.
[0365] In the fifth method for measuring a component of a biological sample, the voltage to be applied to the second electrode system is preferably any voltage in the range of 0.1 to 1.4 V, more preferably any voltage in the range of 0.1 V to 1.0 V.
[0366] According to the fifth method for measuring a component of a biological sample, the Hct value can be measured in a short time and the Glu value corrected using the Hct value can be obtained in a short time.
[0367] In the fifth method for measuring a component of a biological sample, the step of applying a voltage to the second electrode system to obtain a current value that depends on Glu may be performed multiple times. In this case, a plurality of the current values that depend on Glu and the current value that depends on Hct are used to obtain a Glu value. When the step to obtain a current value that depends on Glu is performed multiple times, the measurement accuracy can be further improved, which is preferable.
[0368] In the first method for measuring a component of a biological sample, the second method for measuring a component of a biological sample, the third method for measuring a component of a biological sample, the fourth method for measuring a component of a biological sample, or the fifth method for measuring a component of a biological sample, the biological sample is, for example, blood, sweat, or urine and is preferably blood.
<First Biosensor>
[0369] Furthermore, the present invention is:
a biosensor including: a capillary for introducing a biological sample; a reagent part containing an enzyme and a mediator in the capillary; a first Hct measurement system for measuring a Hct value that is disposed so as to be in contact with the reagent part in the capillary and includes a third working electrode and a third counter electrode; and a second Hct measurement system for measuring a Hct value that includes a fifth working electrode arranged at a place where the reagent part is not disposed and a fifth counter electrode disposed so as to be in contact with the reagent part (the first biosensor A).
[0370] Moreover, in the present invention, it is preferable that in the first biosensor, an electrode system for obtaining a current value that depends on Glu be further provided, the electrode system including a fourth working electrode and a fourth counter electrode disposed in the capillary so as to be in contact with the reagent part. Such a biosensor is referred to as a first biosensor B.
<Second Biosensor>
[0371] Furthermore, in the present invention, it is preferable that the first biosensor Abe further provided with:
an electrode system for obtaining a current value that depends on Glu, the electrode system including the sixth working electrode and the sixth counter electrode; and an electrode system for obtaining a current value that depends on Glu, the electrode system including the fourth working electrode and the fourth counter electrode. Such a biosensor is referred to as a second biosensor.
<Third Biosensor>
[0372] Moreover, in the present invention, it is preferable that the second biosensor be further provided with:
an additional electrode system for obtaining a current value that depends on Glu, the additional electrode system including a fourth working electrode and a fourth counter electrode disposed in the capillary so as to be in contact with the reagent part. Such a biosensor is referred to as a third biosensor A.
[0373] Furthermore, in the present invention, it is preferable that the third biosensor A be further provided with;
an electrode system for obtaining a current value that depends on Int (an interfering substance), the electrode system including, in the capillary, a seventh working electrode disposed so as not to be in contact with the reagent part and a seventh counter electrode that is in contact with the reagent part. Such a biosensor is referred to as a third biosensor B.
[0374] In the biosensor used in the first method for measuring a component of a biological sample, the second method for measuring a component of a biological sample, the third method for measuring a component of a biological sample, the fourth method for measuring a component of a biological sample, or the fifth method for measuring a component of a biological sample, as well as the first biosensor, the second biosensor, and the third biosensor, for the purpose of for example, preventing adhesion of impurities and preventing oxidation, it is preferable that the electrode on which the reagent part is not disposed be coated with a polymer material. Examples of the polymer material include carboxymethyl cellulose (CMC), hydroxyethyl cellulose, hydroxypropyl cellulose, methyl cellulose, ethyl cellulose, ethyl hydroxyethyl cellulose, carboxyethyl cellulose, polyvinyl alcohol, polyvinylpyrrolidone, polyamino acid such as polysine, polystyrene sulfonate, gelatin and derivatives thereof polyacrylic acid and salts thereof polymethacrylic acid and salts thereof; starch and derivatives thereof maleic anhydride polymer and salts thereof, as well as agarose gel and derivatives thereof. They may be used individually or two or more of them may be used together. Among these, CMC is preferred. Coating of the electrode with a polymer material is not particularly limited. For example, a polymer material solution may be prepared to be applied to the electrode surface and then dried and thereby the solvent contained in the coating film may be removed. The proportion of the polymer material is, for example, 0.001 to 10% by weight, preferably 0.005 to 5% by weight, and more preferably 0.01 to 2% by weight relative to the entire reagent solution for producing the reagent part.
[0375] In the biosensor used in the first method for measuring a component of a biological sample, the second method for measuring a component of a biological sample, the third method for measuring a component of a biological sample, the fourth method for measuring a component of a biological sample, or the fifth method for measuring a component of a biological sample, as well as the first biosensor, the second biosensor, and the third biosensor, the closest distance between the working electrode and the counter electrode is preferably 0.1 mm or more. As described above, when the distance between the electrodes is 0.1 mm or more, the reliability of measured values is improved. The distance between the electrodes is more preferably 0.3 mm or more, further preferably 0.5 mm or more.
[0376] In the biosensor used in the first method for measuring a component of a biological sample, the second method for measuring a component of a biological sample, the third method for measuring a component of a biological sample, the fourth method for measuring a component of a biological sample, or the fifth method for measuring a component of a biological sample, as well as the first biosensor, the second biosensor, and the third biosensor, the enzyme contained in the reagent part is preferably an oxidoreductase. The oxidoreductase is suitably selected according to the blood component to be measured. Examples of the oxidoreductase include glucose oxidase, lactate oxidase, cholesterol oxidase, bilirubin oxidase, glucose dehydrogenase, and lactate dehydrogenase. The amount of the oxidoreductase is, for example, 0.01 to 100 U, preferably 0.05 to 10 U, and more preferably 0.1 To 5 U, for example, per sensor or per measurement. Particularly, glucose is preferably to be measured, and in this case the oxidoreductase is preferably glucose oxidase and glucose dehydrogenase.
[0377] In the biosensor used in the first method for measuring a component of a biological sample, the second method for measuring a component of a biological sample, the third method for measuring a component of a biological sample, the fourth method for measuring a component of a biological sample, or the fifth method for measuring a component of a biological sample, as well as the first biosensor, the second biosensor, and the third biosensor, the mediator (an electron acceptor) contained in the reagent part is not particularly limited. Examples thereof include ferricyanides, p-benzoquinone, p-benzoquinone derivatives, phenazine methosulfate, methylene blue, ferrocene, ferrocene derivatives, phenothiazine derivatives, phenoxazine derivatives, and phenanthrenequinone derivatives. Among these, phenanthrenequinone (9,10-phenanthrenequinone), 3-phenylimino-3H-phenothiazine, or ferricyanide (potassium ferricyanide) is preferred. The amount of the mediator to be mixed is not particularly limited and is, for example, 0.1 to 1000 mM, preferably 1 to 500 mM, and more preferably 10 to 300 mM per measurement or per sensor. For example, when a glucose value (a component) in blood (a biological sample) is to be measured, in the case of a biosensor in which glucose dehydrogenase (oxidoreductase) is used as an enzyme and potassium ferricyanide is used as a mediator, a current value that depends on Glu is obtained, for example, as follows. In the biosensor, the oxidoreductase and the mediator come into contact with the blood, and these are dissolved in the blood. Then, an enzymatic reaction progresses between Glu, which is a substrate in the blood, and the oxidoreductase, and the mediator is reduced to produce ferrocyanide. After completion of this reaction, the mediator thus reduced is electrochemically oxidized, and from the current obtained thereby, a current value that depends on Glu in the blood is obtained.
[0378] In the biosensor used in the first method for measuring a component of a biological sample, the second method for measuring a component of a biological sample, the third method for measuring a component of a biological sample, the fourth method for measuring a component of a biological sample, or the fifth method for measuring a component of a biological sample, as well as the first biosensor, the second biosensor, and the third biosensor, the reagent part may further contain at least one of an enzyme stabilizer and a crystal homogenizing agent.
[0379] Examples of the enzyme stabilizer include sugar alcohol. Examples of the sugar alcohol include chain polyhydric alcohols and cyclic sugar alcohols, such as sorbitol, maltitol, xylitol, mannitol, lactitol, reduced palatinose, arabinitol, glycerol, ribitol, galactitol, sedoheptitol, perseitol, volemitol, styracitol, polygalitol, iditol, talitol, allitol, isylitol, and saccharified reduced starch. Furthermore, stereoisomers, substitution products, or derivatives of these sugar alcohols may be used. These sugar alcohols may be used individually or two or more of them may be used together. Among these, maltitol is preferred. The amount of the enzyme stabilizer to be mixed is, for example, in the range of 0.1 to 500 mM, preferably in the range of 0.5 to 100 mM, and more preferably in the range of 1 to 50 mM per measurement or per sensor.
[0380] The crystal homogenizing agent is used for homogenizing the crystal state of the reagent part, and examples thereof include amino acids. Examples of the amino acids include glycine, alanine, valine, leucine, isoleucine, serine, threonine, methionine, asparagine, glutamine, arginine, lysine, histidine, phenylalanine, tryptophan, proline, sarcosine, betaine, and taurine, as well as salts, substitution products, and derivatives thereof. These may be used individually or two or more of them may be used together. Among these, glycine, serine, proline, threonine, lysine, and taurine are preferable, and taurine is more preferable. The amount of the crystal homogenizing agent to be mixed is, for example, 0.1 to 1000 mM, preferably 10 to 500 mM, and more preferably to 200 mM per measurement or per sensor.
[0381] FIGS. 1, 2, and 3 show an example of a biosensor that is used in the present invention. FIG. 1 is an exploded perspective view of the sensor, FIG. 2 is a sectional view, and FIG. 3 is a plan view. In the above-mentioned three drawings, the same parts are indicated with the same reference signs. This sensor is the biosensor used, as an example, in the first method for measuring a component of a biological sample, the second method for measuring a component of a biological sample, or the fourth method for measuring a component of a biological sample.
[0382] As shown in the drawings, in this sensor, two electrodes A and B are formed on an insulating substrate 101. These electrodes can be switched between a working electrode and a counter electrode. A reagent layer 11 is disposed so as to cover part of the electrodes A and B. The reagent layer 11 contains an oxidoreductase such as glucose dehydrogenase and a mediator such as phenanthrenequinone (9,10-phenanthrenequinone), 3-phenylimino-3H-phenothiazine, or potassium ferricyanide, as well as, as an optional component, an enzyme stabilizer, a crystal homogenizing agent, a polymer, etc. A cover 103 is disposed above the insulating substrate 101 with a spacer 102 interposed therebetween, with one end (the right end in the drawings) being left uncovered. In this sensor, in order to introduce blood to each electrode (A and B), a channel 14 is formed of the insulating substrate 101, the spacer 102, and the cover 103. The end of the channel 14 extends to the other end (the left end in the drawings) of the sensor and is open to the outside to serve as a biological sample supply port 12. The two electrodes (A and B) are connected to leads, respectively, and these leads extend to the one end side (the right end in the drawings), and the end of each lead is exposed without being covered with the cover. The cover 103 has an air hole 13 formed in a portion corresponding to the right end of the channel 14.
[0383] When this biosensor is used as the biosensor that is used in the first method for measuring a component of a biological sample, the second method for measuring a component of a biological sample, or the fourth method for measuring a component of a biological sample, the electrode A may function as the first working electrode and the electrode B may function as the first counter electrode.
[0384] In the present invention, the material for the insulating substrate 101 is not particularly limited. Examples of the material that can be used include polyethylene terephthalate (PET), polycarbonate (PC), polyimide (PI), polyethylene (PE), polypropylene (PP), polystyrene (PS), polyvinyl chloride (PVC), polyoxymethylene (POM), monomercast nylon (MC), polybutylene terephthalate (PBT), methacrylic resin (PMMA), ABS resin (ABS), and glass. Among these, polyethylene terephthalate (PET), polycarbonate (PC), and polyimide (PI) are preferable, and polyethylene terephthalate (PET) is more preferable. The size of the insulating substrate is not particularly limited and is, for example, an overall length of 5 to 100 mm, a width of 2 to 50 mm, and a thickness of 0.05 to 2 mm, preferably an overall length of 7 to 50 mm, a width of 3 to 20 mm, and a thickness of 0.1 to 1 mm, and more preferably an overall length of 10 to 30 mm, a width of 3 to 10 mm, and a thickness of 0.1 to 0.6 mm.
[0385] The electrodes and leads on the insulating substrate can be formed by forming a conductive layer by sputtering or vapor deposition using, for example, gold, platinum, palladium, or ruthenium as a material and processing it into a specific electrode pattern with a laser. Examples of the laser that can be used include YAG lasers, green lasers, CO.sub.2 lasers, and excimer lasers.
[0386] The reagent layer 11 is formed as follows. For example, an aqueous solution containing 0.1 to 5 U/sensor of glucose dehydrogenase, 10 to 300 mM of phenanthrenequinone (9,10-phenanthrenequinone), 3-phenylimino-3H-phenothiazine, or potassium ferricyanide, which is used as a mediator, 1 to 50 mM of maltitol, 20 to 200 mM of taurine, and 0.1 to 2% by weight of polymer (also containing a surfactant as necessary) is applied dropwise to a circular slit portion (not shown in the drawings) and then is dried. With this alit portion being provided, spreading of the aqueous solution applied dropwise can be suppressed, and the reagent layer 11 can be disposed at a more accurate position. Thus, the reagent layer 11 is formed so as to cover part of the electrode part formed of the electrodes A and B. The drying may be, for example, natural drying or forced drying using warm air, but if the temperature is too high, the enzyme may be deactivated. Therefore, it is preferable to use warm air at around 50.degree. C.
[0387] In the present invention, the material for the spacer 102 is not particularly limited and, for example, the same materials as those used for the insulating substrate can be used. Furthermore, the size of the spacer 102 is not particularly limited and, for example, is an overall length of 5 to 100 mm, a width of 2 to 50 mm, and a thickness of 0.01 to 1 mm, preferably an overall length of 7 to 50 mm, a width of 3 to 20 mm, and a thickness of 0.05 to 0.5 mm, and more preferably an overall length of 10 to 30 mm, a width of 3 to 10 mm, and a thickness of 0.05 to 0.25 mm. The spacer 102 of this example is formed with an I-shaped cutout portion that serves as a channel for blood introduction, and the size thereof is, for example, an overall length of 0.5 to 8 mm and a width of 0.1 to 5 mm, preferably an overall length of 1 to 10 mm and a width of 0.2 to 3 mm, and more preferably an overall length of 1 to 5 mm and a width of 0.5 to 2 mm. The cutout portion may be formed by cutting with, for example, a laser or a drill or may be formed using a mold that can form a cutout portion at the time of forming the spacer 102.
[0388] In the present invention, the material for the cover 103 is not particularly limited. For example, the same materials as those used for the insulating substrate can be used. It is further preferable that the portion corresponding to the ceiling portion of the channel for introducing a biological sample of the cover 103 be subjected to a hydrophilic treatment. Examples of the hydrophilic treatment include a method of applying a surfactant and a method of introducing a hydrophilic functional group such as a hydroxyl group, a carbonyl group, or a carboxyl group to the surface of the cover 103 by, for example, a plasma treatment. Furthermore, a layer composed of a surfactant such as lecithin may be formed on the reagent layer. The size of the cover 103 is not particularly limited. For example, the cover may have an overall length of to 100 mm, a width of 3 to 50 mm, and a thickness of 0.01 to 0.5 mm, preferably an overall length of 10 to 50 mm, a width of 3 to 20 mm, and a thickness of 0.05 to 0.25 mm, and more preferably an overall length of 15 to 30 mm, a width of 5 to 10 mm, and a thickness of 0.05 to 0.1 mm. The cover 103 preferably has an air hole 13 formed therein, and the shape thereof is, for example, circular, oval, or polygonal. The size of the air hole 13 is, for example, a maximum diameter of 0.01 to 10 mm, preferably a maximum diameter of 0.05 to 5 mm, and more preferably a maximum diameter of 0.1 to 2 mm. The air hole may be formed by cutting with, for example, a laser or a drill or may be formed using a mold that can form an air vent portion at the time of forming the cover 103.
[0389] Moreover, this sensor can be produced by stacking the insulating substrate 101, the spacer 102, and the cover 103 in this order to form one body. The aforementioned three members are stuck together with an adhesive or by thermal fusion bonding to form one body. Examples of the adhesive that can be used herein include an epoxy adhesive, an acrylic adhesive, and a polyurethane adhesive, as well as a thermosetting adhesive (for example, a hot melt adhesive) and a UV curable adhesive.
[0390] When this biosensor is used in the first method for measuring a component of a biological sample, the second method for measuring a component of a biological sample, or the fourth method for measuring a component of a biological sample, the electrode A may function as the first working electrode and the electrode B may function as the first counter electrode. Furthermore, the electrode B may function as the first working electrode and the electrode A may function as the first counter electrode.
[0391] FIG. 4 shows another example (the first biosensor) of the biosensor used in the present invention. The configuration thereof is the same as that shown in FIGS. 1 and 2 except that the plan view of an insulating substrate 101 shown in FIG. 4 is used instead of the plan view of the insulating substrate 101 shown in FIG. 2. This sensor is a biosensor used, as an example, in the first method for measuring a component of a biological sample, the second method for measuring a component of a biological sample, the third method for measuring a component of a biological sample, the fourth method for measuring a component of a biological sample, or the fifth method for measuring a component of a biological sample.
[0392] As shown in the drawing, the first biosensor has four electrodes A, B, C, and D formed on an insulating substrate 101. These electrodes can be switched between a working electrode and a counter electrode. A reagent layer 11 is disposed so as to cover part of the electrodes A, B and D. The four electrodes (A, B, C, and D) are connected to leads, respectively, and these leads extend to the one end side (the right end in the drawing), and the ends of the leads are exposed without being covered with a cover. In the cover 103, an air hole 13 is formed in a portion corresponding to the right end of the channel 14.
[0393] When the first biosensor is used as the biosensor that is used in the third method for measuring a component of a biological sample or the fifth method for measuring a component of a biological sample, the electrode A may function as the first working electrode and the second working electrode, the electrode B may function as the first counter electrode and the second counter electrode, and the electrode D may function as a detection electrode. The first working electrode and the first counter electrode correspond to the third working electrode and the third counter electrode of the first biosensor, and the second working electrode and the second counter electrode correspond to the fourth working electrode and the fourth counter electrode of the first biosensor.
TABLE-US-00001 TABLE 1 Working Electrode Counter Electrode First A B Second A B
[0394] Furthermore, when the first biosensor is used as the biosensor that is used in the fifth method for measuring a component of a biological sample, the electrode B may function as the first working electrode, the electrode A may function as the first counter electrode and the second counter electrode, and the electrode D may function as a detection electrode. The first working electrode and the first counter electrode correspond to the third working electrode and the third counter electrode of the first biosensor, and the second working electrode and the second counter electrode correspond to the fourth working electrode and the fourth counter electrode of the first biosensor.
TABLE-US-00002 TABLE 2 Working Electrode Counter Electrode First B A Second B A
[0395] Moreover, when the first biosensor is used as the biosensor that is used in the first method for measuring a component of a biological sample, the second method for measuring a component of a biological sample, or the fourth method for measuring a component of a biological sample, the electrode A may function as the first working electrode, and the electrode B may function as the first counter electrode.
[0396] When the first biosensor is used as the biosensor that is used in the sixth method for measuring a component of a biological sample described later, the electrode A may function as the third working electrode or the fifth working electrode, and the electrode B may function as the third counter electrode or the fifth counter electrode.
TABLE-US-00003 TABLE 3 Working Electrode Counter Electrode Third A B Fifth A B
[0397] Furthermore, when the first biosensor is used as the biosensor that is used in the seventh method for measuring a component of a biological sample or the tenth method for measuring a component of a biological sample described later, the electrode A may function as the third working electrode, the fourth working electrode, or the fifth counter, the electrode B may function as the third counter electrode, the fourth counter electrode, or the fifth counter electrode, and the electrode C may function as the fifth working electrode.
TABLE-US-00004 TABLE 4 Working Electrode Counter Electrode Third A B Fourth A B Fifth C A, B
[0398] When the first biosensor is used as the biosensor that is used in the seventh method for measuring a component of a biological sample or the tenth method for measuring a component of a biological sample described later, the electrode A may function as the third counter electrode, the fourth counter electrode, or the fifth counter, the electrode B may function as the third working electrode, the fourth working electrode, or the fifth counter electrode, and the electrode C may function as the fifth working electrode.
TABLE-US-00005 TABLE 5 Working Electrode Counter Electrode Third B A Fourth B A Fifth C A, B
[0399] FIG. 5 shows still another example (the second biosensor) of the biosensor used in the present invention. The configuration thereof is the same as that shown in FIGS. 1 and 2 except that the plan view of an insulating substrate 101 shown in FIG. 5 is used instead of the plan view of the insulating substrate 101 shown in FIG. 2. This sensor is a biosensor used, as an example, in the sixth method for measuring a component of a biological sample, the seventh method for measuring a component of a biological sample, the eighth method for measuring a component of a biological sample, the ninth method for measuring a component of a biological sample, the tenth method for measuring a component of a biological sample, or the eleventh method for measuring a component of a biological sample.
[0400] As shown in the drawing, the second biosensor has five electrodes A, B, E, F, and G formed on an insulating substrate 101. These electrodes can be switched between a working electrode and a counter electrode. A reagent layer 11 is disposed so as to cover part of the electrodes A, B, E, and G. The electrode A and the electrode B are placed at an interval. That is, another electrode may be provided between the electrode A and the electrode B. Furthermore, the electrode A and the electrode E also are placed at an interval. Moreover, the electrode F is spaced from the reagent layer 11 and placed on the side of a biological sample supply port 12 in a channel 14. The electrode A and the electrode F are placed at an interval. The five electrodes (A, B, E, F, and G) are connected to leads, respectively, and as shown in FIGS. 1 and 2, these leads extend to the one end side (the right end in the drawings), and the ends of the leads are exposed without being covered with a cover. In the cover 103, an air hole 13 is formed in a portion corresponding to the right end of the channel 14. In the third sensor, the electrode A and the electrode B are not adjacent to each other.
[0401] When the second biosensor is used as the biosensor that is used in the third method for measuring a component of a biological sample or the fifth method for measuring a component of a biological sample, the electrode A may function as the first working electrode or the second counter electrode, the electrode B may function as the first counter electrode or the second counter electrode, the electrode E may function as a detection electrode or the second counter electrode, and the electrode G may function as the second working electrode. The first working electrode and the first counter electrode correspond to the third working electrode and the third counter electrode of the second biosensor, and the second working electrode and the second counter electrode correspond to the sixth working electrode and the sixth counter electrode of the second biosensor.
TABLE-US-00006 TABLE 6 Working Electrode Counter Electrode First A B Second G A, B, E
[0402] Furthermore, when the second biosensor is used as the biosensor that is used in the third method for measuring a component of a biological sample or the fifth method for measuring a component of a biological sample, the electrode B may function as the first working electrode or the second counter electrode, the electrode A may function as the first counter electrode or the second counter electrode, the electrode E may function as a detection electrode or the second counter electrode, and the electrode G may function as the second working electrode. In the second biosensor, when the electrode A is used as a counter electrode and the electrode B is used as a working electrode in order to obtain a hematocrit value, the electrode A and the electrode B are placed at an interval. Also, when the electrode F is used as a working electrode and any one of the electrodes E, A, or B is used as a counter electrode, the electrode F and any one of the electrode E, A, or B are placed at an interval. The first working electrode and the first counter electrode correspond to the third working electrode and the third counter electrode of the second bioeensor, and the second working electrode and the second counter electrode correspond to the sixth working electrode and the sixth counter electrode of the second biosensor.
TABLE-US-00007 TABLE 7 Working Electrode Counter Electrode First B A Second G A, B, E
[0403] When the second biosensor is used as the biosensor that is used in the first method for measuring a component of a biological sample, the second method for measuring a component of a biological sample, or the fourth method for measuring a component of a biological sample, the electrode B and the electrode E may function as the first counter electrode, and the electrode A may function as the first working electrode.
[0404] Furthermore, when the second biosensor is used as the biosensor that is used in the eighth method for measuring a component of a biological sample, the ninth method for measuring a component of a biological sample, or the eleventh method for measuring a component of a biological sample described later, the electrode A may function as the third working electrode, the fifth counter electrode, or the sixth counter electrode, the electrode B may function as the third counter electrode, the fifth counter electrode, or the sixth counter electrode, the electrode E may function as a detection electrode or the sixth counter electrode, the electrode F may function as the fifth working electrode, and the electrode G may function as the fifth counter electrode or the sixth working electrode.
TABLE-US-00008 TABLE 8 Working Electrode Counter Electrode Third A B Fifth F A, B, G Sixth G A, B, E
[0405] Moreover, when the second biosensor is used as the biosensor that is used in the eighth method for measuring a component of a biological sample, the ninth method for measuring a component of a biological sample, or the eleventh method for measuring a component of a biological sample described later, the electrode A may function as the third counter electrode, the fifth counter electrode, or the sixth counter electrode, the electrode B may function as the third working electrode, the fifth counter electrode, or the sixth counter electrode, the electrode E may function as a detection electrode or the sixth counter electrode, the electrode F may function as the fifth working electrode, and the electrode G may function as the fifth counter electrode or the sixth working electrode.
TABLE-US-00009 TABLE 9 Working Electrode Counter Electrode Third B A Fifth F A, B, G Sixth G A, B, E
[0406] It is preferable that the detection electrode be positioned behind at least one of the respective electrode systems from the biological sample supply 12 and that this blood detection electrode can detect that the biological sample has been reliably introduced into at least one of the respective electrode systems. More preferably, the blood detection electrode is positioned behind all the respective electrode systems.
[0407] FIG. 6 shows yet another example (the third biosensor) of the biosensor used in the present invention. The configuration thereof is the same as that shown in FIGS. 1 and 2 except that the plan view of an insulating substrate 101 shown in FIG. 6 is used instead of the plan view of the insulating substrate 101 shown in FIG. 2. This sensor is a biosensor used, as an example, in the twelfth method for measuring a component of a biological sample, the thirteenth method for measuring a component of a biological sample, the fourteenth method for measuring a component of a biological sample, the fifteenth method for measuring a component of a biological sample, the sixteenth method for measuring a component of a biological sample, and the seventeenth method for measuring a component of a biological sample.
[0408] As shown in the drawing, the third biosensor has six electrodes A, B, C, E, F, and G formed on the insulating substrate 101. These electrodes can be switched between a working electrode and a counter electrode. A reagent layer 11 is disposed so as to cover part of the electrodes A, B, C, E, and G. The electrode A and the electrode B are placed at an interval. That is, another electrode may be provided between the electrode A and the electrode B. Furthermore, the electrode A and the electrode E also are placed at an interval. Moreover, the electrode F is spaced from the reagent layer 11 and placed on the side of a biological sample supply port 12 in a channel 14. The electrode A and the electrode F are placed at an interval. The six electrodes (A, B, C, E, F, and G) are connected to leads, respectively, and as shown in FIGS. 1 and 2, these leads extend to the one end side (the right end in the drawings), and the ends of the leads are exposed without being covered with a cover. In the cover 103, an air hole 13 is formed in a portion corresponding to the right end of the channel 14. In the fourth sensor, the electrode A and the electrode B are not adjacent to each other.
[0409] The electrode configurations shown in Tables 10 to 21 below can also be obtained by using the second biosensor instead of the third biosensor. However, as examples, the electrode configurations obtained in the case of using the third biosensor are described.
[0410] When the third biosensor is used as the biosensor that is used in the sixth method for measuring a component of a biological sample, the seventh method for measuring a component of a biological sample, or the tenth method for measuring a component of a biological sample described later, the electrode A may function as the third working electrode or the fourth working electrode, the electrode B may function as the third counter electrode or the fourth counter electrode, the electrode C may function as the fourth counter electrode, and the electrode E may function as a detection electrode.
TABLE-US-00010 TABLE 10 Working Electrode Counter Electrode Third A B Fourth A B, C
[0411] Furthermore, when the third biosensor is used as the biosensor that is used in the sixth method for measuring a component of a biological sample, the seventh method for measuring a component of a biological sample, or the tenth method for measuring a component of a biological sample described later, the electrode A may function as the third counter electrode or the fourth counter electrode, the electrode B may function as the third working electrode or the fourth working electrode, the electrode C may function as the fourth counter electrode, and the electrode E may function as a detection electrode.
TABLE-US-00011 TABLE 11 Working Electrode Counter Electrode Third B A Fourth B A, C
[0412] When the third biosensor is used as the biosensor that is used in the twelfth method for measuring a component of a biological sample described later, the electrode A may function as the third working electrode, the fourth working electrode, or the fifth counter electrode, the electrode B may function as the third counter electrode, the fourth counter electrode, or the fifth counter electrode, the electrode C may function as the fourth counter electrode or the fifth counter electrode, the electrode E may function as a detection electrode, the electrode F may function as the fifth working electrode, and the electrode G may function as the fifth counter electrode.
TABLE-US-00012 TABLE 12 Working Electrode Counter Electrode Third A B Fourth A B, C Fifth F A, B, C, G
[0413] When the third biosensor is used as the biosensor that is used in the twelfth method for measuring a component of a biological sample described later, or the electrode B may function as the third working electrode, the fourth working electrode, or the fifth counter electrode, the electrode A may function as the third counter electrode, the fourth counter electrode, or the fifth counter electrode, the electrode C may function as the fourth counter electrode or the fifth counter electrode, the electrode E may function as a detection electrode, the electrode F may function as the fifth working electrode, and the electrode G may function as the fifth counter electrode. In the third biosensor, when the electrode A is used as a counter electrode and the electrode B is used as a working electrode in order to obtain a hematocrit value, the electrode A and the electrode B are placed at an interval. Also, when the electrode F is used as a working electrode and the electrode A, B, C, or G is used as a counter electrode, the electrode F and the electrode A, B, C, or G are placed at an interval.
TABLE-US-00013 TABLE 13 Working Electrode Counter Electrode Third B A Fourth B A, C Fifth F A, B, C, G
[0414] Furthermore, when the third biosensor is used as the biosensor that is used in the thirteenth method for measuring a component of a biological sample described later, the electrode A may function as the third working electrode, the fourth counter electrode, or the fifth working electrode, the electrode B may function as the third counter electrode, the fourth counter electrode, or the fifth counter electrode, the electrode C may function as the third counter electrode, the fourth counter electrode, or the fifth counter electrode, the electrode E may function as a detection electrode, the electrode F may function as the fourth working electrode, and the electrode G may function as the fifth working electrode.
TABLE-US-00014 TABLE 14 Working Electrode Counter Electrode Third A B Fifth F A, B, C, G Sixth G B, C, E
[0415] Furthermore, when the third biosensor is used as the biosensor that is used in the thirteenth method for measuring a component of a biological sample described later, the electrode B may function as the third working electrode or the fifth counter electrode, the electrode A may function as the third counter electrode, the fifth counter electrode, or the sixth counter electrode, the electrode C may function as the fifth counter electrode or the sixth counter electrode, the electrode E may function as a detection electrode, the electrode F may function as the fifth working electrode, and the electrode G may function as the fifth counter electrode or the fifth working electrode.
TABLE-US-00015 TABLE 15 Working Electrode Counter Electrode Third B A Fifth F A, B, C, G Sixth G A, C, E
[0416] When the third biosensor is used as the biosensor that is used in the eighteenth method for measuring a component of a biological sample described later, the electrode A may function as the third working electrode, the fourth working electrode, or the fifth counter electrode, the electrode B may function as the third counter electrode, the fourth counter electrode, the fifth counter electrode, or the sixth counter electrode, the electrode C may function as the fourth counter electrode, the fifth counter electrode, or the sixth counter electrode, the electrode E may function as a detection electrode or the sixth counter electrode, the electrode F may function as the fifth working electrode, and the electrode G may function as the fifth counter electrode or the sixth working electrode.
TABLE-US-00016 TABLE 16 Working Electrode Counter Electrode Third A B Fourth A B, C, E Fifth F A, B, C, G Sixth G B, C, E
[0417] When the third biosensor is used as the biosensor that is used in the eighteenth method for measuring a component of a biological sample described later, the electrode A may function as the third counter electrode, the fourth counter electrode, the fifth counter electrode, or the sixth counter electrode, the electrode B may function as the third working electrode, the fourth working electrode, or the fifth working electrode, the electrode C may function as the fourth counter electrode, the fifth counter electrode, or the sixth counter electrode, the electrode E may function as a detection electrode or the sixth counter electrode, the electrode F may function as the fifth working electrode, and the electrode G may function as the fifth counter electrode or the sixth working electrode. In the third biosensor, when the electrode A is used as a counter electrode and the electrode B is used as a working electrode in order to obtain a hematocrit value, the electrode A and the electrode B are placed at an interval. Also, when the electrode F is used as a working electrode and the electrode A, B, C, or G is used as a counter electrode, the electrode F and the electrode A, B, C, or G are placed at an interval.
TABLE-US-00017 TABLE 17 Working Electrode Counter Electrode Third B A Fourth B A, C, E Fifth F A B, C, G Sixth G A, C, E
[0418] Furthermore, when the third biosensor is used as the biosensor that is used in the fourteenth method for measuring a component of a biological sample described later, the electrode A may function as the third working electrode, the fourth working electrode, or the fifth counter electrode, the electrode B may function as the third counter electrode, the fourth counter electrode, the fifth counter electrode, or the seventh counter electrode, the electrode C may function as the fourth counter electrode, the fifth counter electrode, or the seventh counter electrode, the electrode E may function as a detection electrode, the electrode F may function as the fifth working electrode or the seventh working electrode, and the electrode G may function as the sixth counter electrode.
TABLE-US-00018 TABLE 18 Working Electrode Counter Electrode Third A B Fourth A B, C, E Fifth F A, B, C, G Seventh F B, C, E
[0419] Furthermore, when the third biosensor is used as the biosensor that is used in the fourteenth method for measuring a component of a biological sample described later, the electrode B may function as the third working electrode, the fourth working electrode, or the fifth counter electrode, the electrode A may function as the third counter electrode, the fourth counter electrode, the fifth counter electrode, or the seventh working electrode, the electrode C may function as the fourth counter electrode, the fifth counter electrode, or the seventh counter electrode, the electrode F may function as the fifth working electrode or the seventh working electrode, and the electrode G may function as the fifth counter electrode. In the third biosensor, when the electrode A is used as a counter electrode and the electrode B is used as a working electrode in order to obtain a hematocrit value, the electrode A and the electrode B are placed at an interval. Also, when the electrode F is used as a working electrode and the electrode A, B, C, or G is used as a counter electrode, the electrode F and the electrode A, B, C, or G are placed at an interval.
TABLE-US-00019 TABLE 19 Working Electrode Counter Electrode Third B A Fourth B A, C, E Fifth F A, B, C, G Seventh F A, C, E
[0420] Furthermore, the third biosensor is used as the biosensor that is used in the sixteenth method for measuring a component of a biological sample described later, the electrode A may function as the third working electrode, the fourth working electrode, or the fifth counter electrode, the electrode B may function as the third counter electrode, the fourth counter electrode, the fifth counter electrode, or the seventh counter electrode, the electrode C may function as the fourth counter electrode, the fifth counter electrode, or the seventh counter electrode, the electrode E may function as a detection electrode, the electrode F may function as the fifth working electrode or the seventh working electrode, and the electrode G may function as the fifth counter electrode or the seventh working electrode.
TABLE-US-00020 TABLE 20 Working Electrode Counter Electrode Third A B Fourth A B, C, E Fifth F A, B, C, G Seventh F B, C, E
[0421] Furthermore, when the third biosensor is used as the biosensor that is used in the sixteenth method for measuring a component of a biological sample described later, the electrode B may function as the third working electrode, the fourth working electrode, or the fifth counter electrode, the electrode A may function as the third counter electrode, the fourth counter electrode, the fifth counter electrode, or the seventh counter electrode, the electrode C may function as the fourth counter electrode, the fifth counter electrode, or the seventh counter electrode, the electrode E may function as a detection electrode, the electrode F may function as the fifth working electrode or the seventh working electrode, and the electrode G may function as the fifth counter electrode. In the third biosensor, when the electrode A is used as a counter electrode and the electrode B is used as a working electrode in order to obtain a hematocrit value, the electrode A and the electrode B are placed at an interval. Also, when the electrode F is used as a working electrode and the electrode A, B, C, or G is used as a counter electrode, the electrode F and the electrode A, B, C, or G are placed at an interval.
TABLE-US-00021 TABLE 21 Working Electrode Counter Electrode Third B A Fourth B A, C, E Fifth F A, B, C, G Seventh F A, C, E
[0422] It is preferable that the detection electrode be positioned behind at least one of the respective electrode systems from the biological sample supply 12 and that this blood detection electrode can detect that the biological sample has been reliably introduced into at least one of the respective electrode systems. More preferably, the blood detection electrode is positioned behind all the respective electrode systems.
[0423] FIG. 7 shows a perspective view of an example of a measuring apparatus of the present invention, with a biosensor 1 used in the measuring method of the present invention being inserted thereinto. As shown in the drawing, the measuring apparatus 2 has an insertion port 5 for the sensor 1 at one end thereof and the sensor 1 is inserted thereinto and held therein. Reference sign 12 denotes a biological sample supply port of the sensor 1. Furthermore, the measuring apparatus 2 has a display unit 4 substantially in the center thereof and the measurement result is displayed here.
[0424] FIG. 8 shows an example of an electric block diagram of the measuring apparatus of the present invention, with the biosensor 1 used in the measuring method of the present invention being inserted thereinto. In the measuring apparatus of the present invention, a voltage applying unit 37 for applying a voltage and a current-voltage conversion unit 38 are connected to an input terminal section 6 of the measuring apparatus according to an embodiment of the present invention. A voltage is applied to the voltage applying unit 37 from a control unit 39 and this voltage is applied to a desired electrode selected from the electrodes of the biosensor 1 for a predetermined duration through the input terminal section 6. The current that flows between the electrodes in the biosensor 1 by the voltage application is converted into a voltage by a current-voltage conversion unit 38. Thereafter, the voltage is digitally converted by an A/D conversion unit 30, and the voltage thus digitally converted is compared with a threshold value by a determination means 31.
[0425] On the display unit 32 connected to the control unit 39, the value of the component detected by the biosensor 1 and the result of determination made by the determination means 31 are displayed. In FIG. 8, reference sign 33 denotes a power supply unit for supplying power to the respective parts. Reference sign 34 denotes a memory that is provided with a table including, for example, applied voltage and voltage application time used at the time of measurement of a Hct value and Glu, as well as a calibration curve and calibration table prepared in advance based on the environmental temperature.
[0426] A clock 35 is connected to the control unit 39, and the control unit 39 is configured to utilize the time shown and the time measured by the clock 35 to execute various control operations. Furthermore, a correction means 36 is provided in the control unit 39 to correct a measured Glu value with the Hct value and thereby the measurement accuracy of the Glu value is improved.
<Sixth Method for Measuring Component of Biological Sample>
[0427] Moreover, the present invention is:
a method for measuring a component of a biological sample, including a step of using the first biosensor to obtain a Hct value of the biological sample, the method including: a step of starting voltage application for a duration longer than 0 second and up to 0.7 second to the first Hct measurement system within 0 to 0.5 second after detection of introduction of the biological sample to obtain a first current value; a step of applying a voltage to the second Hct measurement system after the step to obtain a first current value, to obtain a second current value; and a step of obtaining a Hct value of the biological sample based on the first current value and the second current value (the sixth method for measuring a component of a biological sample).
[0428] In the sixth method for measuring a component of a biological sample, the duration of the voltage application to the first Hct measurement system is any duration longer than 0 second and up to 0.7 second, preferably any duration longer than 0 second and up to 0.5 second, and further preferably any duration longer than 0 second and up to 0.1 second. Moreover, it is preferable that the voltage application to the first Hct measurement system be started at 0 second after detection of introduction of the biological sample.
[0429] In the sixth method for measuring a component of a biological sample, the voltage application to the first Hct measurement system is started at later than 0 second but within 0.5 second, preferably started at later than 0 second but within 0.3 second, more preferably started at later than 0 second but within 0.1 second, and further preferably started at later than 0 second but within 0.05 second after detection of introduction of the biological sample.
[0430] In the sixth method for measuring a component of a biological sample, the voltage to be applied to the first Hct measurement system is preferably any voltage in the range of 1.5 to 4.0 V, more preferably any voltage in the range of 1.5 V to 3.0 V, and further preferably any voltage in the range of 1.5 V to 2.5 V.
[0431] In the sixth method for measuring a component of a biological sample, the duration of the voltage application to the second Hct measurement system is preferably any duration between 0.01 and 5.0 seconds, more preferably any duration between 0.05 and 1.0 second, and further preferably any duration between 0.1 and 0.5 second.
[0432] In the sixth method for measuring a component of a biological sample, the voltage to be applied to the second Hct measurement system is preferably any voltage in the range of 1.0 V to 3.5 V, more preferably any voltage in the range of 1.5 V to 3.5 V, and further preferably any voltage in the range of 2.0 V to 3.0 V.
[0433] According to the sixth method for measuring a component of a biological sample, the Hct value can be measured in a short time in the first Hct measurement system, and the Glu value corrected using the Hct value in the first Hct measurement system can be obtained with high accuracy.
<Seventh Method for Measuring Component of Biological Sample>
[0434] Furthermore, the present invention is:
the sixth method for measuring a component of a biological sample, further including: a step of applying a voltage to the first Hct measurement system after the step to obtain a first current value, to obtain a current value that depends on Glu, and a step of obtaining a Glu value of the biological sample based on the current value that depends on Glu and the Hct value of the biological sample (the seventh method for measuring a component of a biological sample).
[0435] In the seventh method for measuring a component of a biological sample, the duration of the voltage application to the first Hct measurement system in the step to obtain a current value that depends on Glu is preferably any duration between 0.01 and 10.0 seconds, more preferably any duration between 0.1 and 7.0 seconds, and further preferably any duration between 0.1 and 5.0 seconds.
[0436] In the seventh method for measuring a component of a biological sample, the voltage to be applied to the first Hct measurement system in the step to obtain a current value that depends on Glu is preferably any voltage in the range of 0.1 V to 1.4 V, more preferably any voltage in the range of 0.1 V to 1.0 V.
[0437] In the seventh method for measuring a component of a biological sample, it is preferable that the step to obtain a second current value be performed after the step to obtain a current value that depends on Glu.
[0438] According to the seventh method for measuring a component of a biological sample, since the current value that depends on Glu in the vicinity of the electrodes that are in contact with the reagent layer and the Hct value in the vicinity of the same electrodes are used to obtain a Glu value, the Glu value can be measured, with the properties of the biological sample in the vicinity of the electrodes being reflected with higher accuracy. Moreover, according to such a method, the Hct value can be measured in a short time in the first Hct measurement system, and the Glu value corrected using the Hct value can be obtained with high accuracy.
[0439] In the seventh method for measuring a component of a biological sample, the step of applying a voltage to the first Hct measurement system to obtain a current value that depends on Glu may be performed multiple times. In this case, a plurality of the current values that depend on Glu and the Hct value are used to obtain a Glu value. When the step to obtain a current value that depends on Glu is performed multiple times, the measurement accuracy can be further improved, which is preferable.
[0440] The seventh method for measuring a component of a biological sample may further include a step of applying a voltage to the first Hct measurement system to obtain another Hct value based on the current value obtained thereby after the step to obtain a current value that depends on Glu. In this case, in the step of using the current value that depends on Glu and the Hct value to obtain a Glu value, the current value that depends on Glu and two Hct values are used to obtain a Glu value. When a voltage is applied to the second Hct measurement system to obtain another Hct value based on the current value obtained thereby after the step to obtain a current value that depends on Glu, the measurement accuracy can be further improved, which is preferable.
<Eighth Method for Measuring Component of Biological Sample>
[0441] Moreover, the present invention is:
a method for measuring a component of a biological sample, including a step of using the second biosensor to obtain a Hct value of the biological sample, the method including: a step of starting voltage application for a duration longer than 0 second and up to 0.7 second to the first Hct measurement system within 0 second to 0.5 second after detection of introduction of the biological sample to obtain a first current value; a step of applying a voltage to the second Hct measurement system after the step to obtain a first current value, to obtain a second current value; and a step of obtaining the Hct value of the biological sample based on the first current value and the second current value (the eighth method for measuring a component of a biological sample).
[0442] In the eighth method for measuring a component of a biological sample, the duration of the voltage application to the first Hct measurement system is preferably any duration longer than 0 second and up to 0.5 second, further preferably any duration longer than 0 second and up to 0.1 second.
[0443] In the eighth method for measuring a component of a biological sample, it is preferable that the voltage application to the first Hct measurement system be started at 0 second after detection of introduction of the biological sample. Furthermore, the voltage application to the first Hct measurement system is started at later than 0 second but within 0.5 second, preferably started at later than 0 second but within 0.3 second, more preferably started at later than 0 second but within 0.1 second, and further preferably started at later than 0 second but within 0.05 second after detection of introduction of the biological sample.
[0444] In the eighth method for measuring a component of a biological sample, the voltage to be applied to the first Hct measurement system is preferably any voltage in the range of 1.5 to 4.0 V, more preferably any voltage in the range of 1.5 V to 3.0 V, and further preferably any voltage in the range of 1.5 V to 2.5 V.
[0445] In the eighth method for measuring a component of a biological sample, the duration of the voltage application to the second Hct measurement system is preferably any duration between 0.01 and 5.0 seconds, more preferably any duration between 0.05 and 1.0 second, and further preferably any duration between 0.1 and 0.5 second.
[0446] In the eighth method for measuring a component of a biological sample, the voltage to be applied to the second Hct measurement system is preferably any voltage in the range of 1.0 V to 3.5 V, more preferably any voltage in the range of 1.5 V to 3.5 V, and further preferably any voltage in the range of 2.0 V to 3.0 V.
[0447] According to the eighth method for measuring a component of a biological sample, the Hct value can be measured in a short time in the first Hct measurement system, and the Glu value corrected using the Hct value can be obtained with high accuracy
<Ninth Method for Measuring Component of Biological Sample>
[0448] Furthermore, the present invention is a method for measuring a component of a biological sample, further including, in the eighth method for measuring a component of a biological sample:
a step of applying a voltage to the electrode system for obtaining a current value that depends on Glu after the step to obtain a first current value, to obtain a current value that depends on Glu; and a step of obtaining a Glu value of the biological sample based on the current value that depends on Glu and the Hct value of the biological sample (the ninth method for measuring a component of a biological sample).
[0449] In the ninth method for measuring a component of a biological sample, the duration of the voltage application to the electrode system for obtaining a current value that depends on Glu is preferably any duration between 0.01 and 10.0 seconds, more preferably any duration between 0.1 and 7.0 seconds, and further preferably any duration between 0.1 and 5.0 seconds.
[0450] In the ninth method for measuring a component of a biological sample, the voltage to be applied to the electrode system for obtaining a current value that depends on Glu is preferably any voltage in the range of 0.1 V to 1.4 V, more preferably any voltage in the range of 0.1 V to 1.0 V.
[0451] In the ninth method for measuring a component of a biological sample, it is preferable that the step to obtain a second current value be performed after the step to obtain a current value that depends on Glu.
[0452] According to the ninth method for measuring a component of a biological sample, since the current value that depends on Glu in the vicinity of the electrodes that are in contact with the reagent part and the current value that depends on Hct in the vicinity of the same electrodes are used to obtain a Glu value, the Glu value can be measured, with the properties of the biological sample in the vicinity of the electrodes being reflected with higher accuracy. Furthermore, according to such a method, the Hct value can be measured in a short time in the first Hct measurement system, and the Glu value corrected using the Hct value can be obtained with high accuracy.
[0453] In the ninth method for measuring a component of a biological sample, the step of applying a voltage to the electrode system for obtaining a current value that depends on Glu to obtain a current value that depends on Glu may be performed multiple times. In this case, a plurality of the current values that depend on Glu and the Hct value are used to obtain a Glu value. When the step to obtain a current value that depends on Glu is performed multiple times, the measurement accuracy can be further improved, which is preferable.
[0454] The ninth method for measuring a component of a biological sample may further include a step of applying a voltage to the second Hct measurement system to obtain another Hct value based on the current value obtained thereby after the step to obtain a current value that depends on Glu. In this case, in the step of using the current value that depends on Glu and the Hct value to obtain a Glu value, the current value that depends on Glu and two Hct values are used to obtain a Glu value. When a voltage is applied to the second Hct measurement system to obtain another Hct value based on the current value obtained thereby after the step to obtain a current value that depends on Glu, the measurement accuracy can be further improved, which is preferable.
<Tenth Method for Measuring Component of Biological Sample>
[0455] Moreover, the present invention is:
a method for measuring a component of a biological sample, including a step of using the first biosensor to obtain a Glu value of the biological sample, the method including: a step of starting voltage application for a duration longer than 0 second and up to 0.7 second to the first Hct measurement system within 0 second to 0.5 second after detection of introduction of the biological sample to obtain a first current value; a step of applying a voltage to the second Hct measurement system after the step to obtain a first current value, to obtain a second current value; a step of applying a voltage to the first Hct measurement system after the step to obtain a first current value, to obtain a current value that depends on Glu; and a step of using the current value that depends on Glu, the first current value, and the second current value to obtain a Glu value of the biological sample (the tenth method for measuring a component of a biological sample).
[0456] In the tenth method for measuring a component of a biological sample, the duration of the voltage application to the first Hct measurement system in the step to obtain a first current value is preferably any duration longer than 0 second and up to 0.5 second, further preferably any duration longer than 0 second and up to 0.1 second.
[0457] In the tenth method for measuring a component of a biological sample, it is preferable that the voltage application to the first Hct measurement system in the step to obtain a first current value be started at 0 second after detection of introduction of the biological sample.
[0458] In the tenth method for measuring a component of a biological sample, the voltage application to the first Hct measurement system in the step to obtain a first current value is started at later than 0 second but within 0.5 second, preferably started at later than 0 second but within 0.3 second, more preferably started at later than 0 second but within 0.1 second, and further preferably started at later than 0 second but within 0.05 second after detection of introduction of the biological sample.
[0459] In the tenth method for measuring a component of a biological sample, the voltage to be applied to the first Hct measurement system in the step to obtain a first current value is preferably any voltage in the range of 1.5 to 4.0 V, more preferably any voltage in the range of 1.5 V to 3.0 V, and further preferably any voltage in the range of 1.5 V to 2.5 V.
[0460] In the tenth method for measuring a component of a biological sample, the duration of the voltage application to the second Hct measurement system is preferably any duration between 0.01 and 5.0 seconds, more preferably any duration between 0.05 and 1.0 second, and further preferably any duration between 0.1 and 0.5 second.
[0461] In the tenth method for measuring a component of a biological sample, the voltage to be applied to the second Hct measurement system is preferably any voltage in the range of 1.0 V to 3.5 V, more preferably any voltage in the range of 1.5 V to 3.5 V, and further preferably any voltage in the range of 2.0 V to 3.0 V.
[0462] In the tenth method for measuring a component of a biological sample, the duration of the voltage application to the first Hct measurement system in the step to obtain a current value that depends on Glu is preferably any duration between 0.01 and 10.0 seconds, more preferably any duration between 0.1 and 7.0 seconds, and further preferably any duration between 0.1 and 5.0 seconds.
[0463] In the tenth method for measuring a component of a biological sample, the voltage to be applied to the first Hct measurement system in the step to obtain a current value that depends on Glu is preferably any voltage in the range of 0.1 V to 1.4 V, more preferably any voltage in the range of 0.1 V to 1.0 V.
[0464] In the tenth method for measuring a component of a biological sample, it is preferable that the step to obtain a second current value be performed after the step to obtain a current value that depends on Glu.
[0465] In the tenth method for measuring a component of a biological sample, since the current value that depends on Glu in the vicinity of the electrodes that are in contact with the reagent part and the current value that depends on Hct in the vicinity of the same electrodes are used to obtain a Glu value, the Glu value can be measured, with the properties of the biological sample in the vicinity of the electrodes being reflected with higher accuracy. Furthermore, according to such a method, the Hct value can be measured in a short time in the first Hct measurement system, and the Glu value corrected using the Hct value can be obtained with high accuracy.
[0466] In the tenth method for measuring a component of a biological sample, the step of applying a voltage to the first Hct measurement system to obtain a current value that depends on Glu may be performed multiple times. In this case, a plurality of the current values that depend on Glu, the first current value, and the second current value (the current value that depends on Hct) are used to obtain a Glu value. When the step to obtain a current value that depends on Glu is performed multiple times, the measurement accuracy can be further improved, which is preferable.
<Eleventh Method for Measuring Component of Biological Sample>
[0467] Furthermore, the present invention is:
a method for measuring a component of a biological sample, including a step of using the second biosensor to obtain a Glu value of the biological sample, the method including: a step of starting voltage application for a duration longer than 0 second and up to 0.7 second to the first Hct measurement system within 0 second to 0.5 second after detection of introduction of the biological sample to obtain a first current value; a step of applying a voltage to the second Hct measurement system after the step to obtain a first current value, to obtain a second current value; a step of applying a voltage to the electrode system for obtaining a current value that depends on Glu after the step to obtain a first current value, to obtain a current value that depends on Glu; and a step of using the current value that depends on Glu, the first current value, and the second current value to obtain a Glu value of the biological sample (the eleventh method for measuring a component of a biological sample).
[0468] In the eleventh method for measuring a component of a biological sample, the duration of the voltage application to the first Hct measurement system is preferably any duration longer than 0 second and up to 0.5 second, further preferably any duration longer than 0 second and up to 0.1 second. Moreover, it is preferable that the voltage application to the first Hct measurement system be started at 0 second after detection of introduction of the biological sample.
[0469] In the eleventh method for measuring a component of a biological sample, the voltage application to the first Hct measurement system is started at later than 0 second but within 0.5 second, preferably started at later than 0 second but within 0.3 second, more preferably started at later than 0 second but within 0.1 second, and further preferably started at later than 0 second but within 0.05 second after detection of introduction of the biological sample.
[0470] In the eleventh method for measuring a component of a biological sample, the voltage to be applied to the first Hct measurement system is preferably any voltage in the range of 1.5 to 4.0 V, more preferably any voltage in the range of 1.5 V to 3.0 V, and further preferably any voltage in the range of 1.5 V to 2.5 V.
[0471] In the eleventh method for measuring a component of a biological sample, the duration of the voltage application to the second Hct measurement system is preferably any duration between 0.01 and 5.0 seconds, more preferably any duration between 0.05 and 1.0 second, and further preferably any duration between 0.1 and 0.5 second.
[0472] In the eleventh method for measuring a component of a biological sample, the voltage to be applied to the second Hct measurement system is preferably any voltage in the range of 1.0 V to 3.5 V, more preferably any voltage in the range of 1.5 V to 3.5 V, and further preferably any voltage in the range of 2.0 V to 3.0 V.
[0473] In the eleventh method for measuring a component of a biological sample, the duration of the voltage application to the electrode system for obtaining a current value that depends on Glu is preferably any duration between 0.01 and 10.0 seconds, more preferably any duration between 0.1 and 7.0 seconds, and further preferably any duration between 0.1 and 5.0 seconds.
[0474] In the eleventh method for measuring a component of a biological sample, the voltage to be applied to the electrode system for obtaining a current value that depends on Glu is preferably any voltage in the range of 0.1 V to 1.4 V, more preferably any voltage in the range of 0.1 V to 1.0 V.
[0475] In the eleventh method for measuring a component of a biological sample, it is preferable that the step to obtain a second current value be performed after the step to obtain a current value that depends on Glu.
[0476] According to the eleventh method for measuring a component of a biological sample, since the current value that depends on Glu in the vicinity of the electrodes that are in contact with the reagent part and the current value that depends on Hct in the vicinity of the same electrodes are used to obtain a Glu value, the Glu value can be measured, with the properties of the biological sample in the vicinity of the electrodes being reflected with higher accuracy. Furthermore, according to such a method, the Hct value can be measured in a short time in the first Hct measurement system, and the Glu value corrected using the Hct value can be obtained with high accuracy.
[0477] In the eleventh method for measuring a component of a biological sample, the step of applying a voltage to the electrode system for obtaining a current value that depends on Glu to obtain a current value that depends on Glu may be performed multiple times. In this case, a plurality of the current values that depend on Glu and the Hct value are used to obtain a Glu value. When the step to obtain a current value that depends on Glu is performed multiple times, the measurement accuracy can be further improved, which is preferable.
<Twelfth Method for Measuring Component of Biological Sample>
[0478] Moreover, the present invention is:
a method for measuring a component of a biological sample, including a step of using the third biosensor to obtain a Glu value of the biological sample, the method including: a step of starting voltage application for a duration longer than 0 second and up to 0.7 second to the first Hct measurement system within 0 to 0.5 second after detection of introduction of the biological sample to obtain a first current value; a step of applying a voltage to the second Hct measurement system after the step to obtain a first current value, to obtain a second current value; a step of obtaining a Hct value of the biological sample based on the first current value and the second current value; a step of applying a voltage to the first Hct measurement system after the step to obtain a first current value, to obtain a current value that depends on Glu; and a step of obtaining the Glu value of the biological sample based on the current value that depends on Glu and the Hct value of the biological sample (the twelfth method for measuring a component of a biological sample).
[0479] In the twelfth method for measuring a component of a biological sample, the duration of the voltage application to the first Hct measurement system for obtaining a first current value is preferably any duration longer than 0 second and up to 0.5 second, further preferably any duration longer than 0 second and up to 0.1 second. Moreover, it is preferable that the voltage application to the first Hct measurement system be started at 0 second after detection of introduction of the biological sample.
[0480] In the twelfth method for measuring a component of a biological sample, the voltage application to the first Hct measurement system for obtaining a first current value is started at later than 0 second but within 0.5 second, preferably started at later than 0 second but within 0.3 second, more preferably started at later than 0 second but within 0.1 second, and further preferably started at later than 0 second but within 0.05 second after detection of introduction of the biological sample.
[0481] In the twelfth method for measuring a component of a biological sample, the voltage to be applied to the first Hct measurement system for obtaining a first current value is preferably any voltage in the range of 1.5 to 4.0 V, more preferably any voltage in the range of 1.5 V to 3.0 V, and further preferably any voltage in the range of 1.5 V to 2.5 V.
[0482] In the twelfth method for measuring a component of a biological sample, the duration of the voltage application to the second Hct measurement system is preferably any duration between 0.01 and 5.0 seconds, more preferably any duration between 0.05 and 1.0 second, and further preferably any duration between 0.1 and 0.5 second.
[0483] In the twelfth method for measuring a component of a biological sample, the voltage to be applied to the second Hct measurement system is preferably any voltage in the range of 1.0 V to 3.5 V, more preferably any voltage in the range of 1.5 V to 3.5 V, and further preferably any voltage in the range of 2.0 V to 3.0 V.
[0484] In the twelfth method for measuring a component of a biological sample, the duration of the voltage application to the first Hct measurement system for obtaining the current value that depends on Glu is preferably any duration between 0.01 and 10.0 seconds, more preferably any duration between 0.1 and 7.0 seconds, and further preferably any duration between 0.1 and 5.0 seconds.
[0485] In the twelfth method for measuring a component of a biological sample, the voltage to be applied to the first Hct measurement system for obtaining the current value that depends on Glu is preferably any voltage in the range of 0.1 V to 1.4 V, more preferably any voltage in the range of 0.1 V to 1.0 V.
[0486] According to the twelfth method for measuring a component of a biological sample, since the current value that depends on Glu in the vicinity of the electrodes that are in contact with the reagent part and the current value that depends on Hct in the vicinity of the same electrodes are used to obtain a Glu value, the Glu value can be measured, with the properties of the biological sample in the vicinity of the electrodes being reflected with higher accuracy. Furthermore, according to such a method, the Hct value can be measured in a short time in the first Hct measurement system, and the Glu value corrected using the Hct value can be obtained with high accuracy.
[0487] In the twelfth method for measuring a component of a biological sample, the step of applying a voltage to the electrode system for obtaining a current value that depends on Glu to obtain a current value that depends on Glu may be performed multiple times. In this case, a plurality of the current values that depend on Glu and the Hct value are used to obtain a Glu value. When the step to obtain a current value that depends on Glu is performed multiple times, the measurement accuracy can be further improved, which is preferable.
[0488] The twelfth method for measuring a component of a biological sample may further include a step of applying a voltage to the first Hct measurement system to obtain a third current value. It is preferable that the step to obtain a third current value be performed after the step to obtain a second current value.
<Thirteenth Method for Measuring Component of Biological Sample>
[0489] Furthermore, the present invention is:
a method for measuring a component of a biological sample, including a step of using the third biosensor to obtain a Glu value of the biological sample, the method including: a step of starting voltage application for a duration longer than 0 second and up to 0.7 second to the first Hct measurement system within 0 second to 0.5 second after detection of introduction of the biological sample to obtain a first current value; a step of applying a voltage to the second Hct measurement system after the step to obtain a first current value, to obtain a second current value; a step of obtaining a Hct value of the biological sample based on the first current value and the second current value; a step of applying a voltage to the electrode system for obtaining a current value that depends on Glu after the step to obtain a first current value, to obtain a current value that depends on Glu; and a step of obtaining the Glu value of the biological sample based on the current value that depends on Glu and the Hct value of the biological sample (the thirteenth method for measuring a component of a biological sample).
[0490] In the thirteenth method for measuring a component of a biological sample, the duration of the voltage application to the first Hct measurement system is preferably any duration longer than 0 second and up to 0.5 second, further preferably any duration longer than 0 second and up to 0.1 second.
[0491] In the thirteenth method for measuring a component of a biological sample, it is preferable that the voltage application to the first Hct measurement system be started at 0 second after detection of introduction of the biological sample.
[0492] Furthermore, the voltage application to the first Hct measurement system is started at later than 0 second but within 0.5 second, preferably started at later than 0 second but within 0.3 second, more preferably started at later than 0 second but within 0.1 second, and further preferably started at later than 0 second but within 0.05 second after detection of introduction of the biological sample.
[0493] In the thirteenth method for measuring a component of a biological sample, the voltage to be applied to the first Hct measurement system is preferably any voltage in the range of 1.5 to 4.0 V, more preferably any voltage in the range of 1.5 V to 3.0 V, and further preferably any voltage in the range of 1.5 V to 2.5 V.
[0494] In the thirteenth method for measuring a component of a biological sample, the duration of the voltage application to the second Hct measurement system is preferably any duration between 0.01 and 5.0 seconds, more preferably any duration between 0.05 and 1.0 second, and further preferably any duration between 0.1 and 0.5 second.
[0495] In the thirteenth method for measuring a component of a biological sample, the voltage to be applied to the second Hct measurement system is preferably any voltage in the range of 1.0 V to 3.5 V, more preferably any voltage in the range of 1.5 V to 3.5 V, and further preferably any voltage in the range of 2.0 V to 3.0 V.
[0496] According to the thirteenth method for measuring a component of a biological sample, the Hct value can be measured in a short time in the first Hct measurement system, and the Glu value corrected using the Hct value can be obtained with high accuracy.
[0497] In the thirteenth method for measuring a component of a biological sample, the duration of the voltage application to the electrode system for obtaining a current value that depends on Glu is preferably any duration between 0.01 and 10.0 seconds, more preferably any duration between 0.1 and 7.0 seconds, and further preferably any duration between 0.1 and 5.0 seconds.
[0498] In the thirteenth method for measuring a component of a biological sample, the voltage to be applied to the electrode system for obtaining a current value that depends on Glu is preferably any voltage in the range of 0.1 V to 1.4 V more preferably any voltage in the range of 0.1 V to 1.0 V.
[0499] In the thirteenth method for measuring a component of a biological sample, it is preferable that the step to obtain a second current value be performed after the step to obtain a current value that depends on Glu.
[0500] According to the thirteenth method for measuring a component of a biological sample, since the current value that depends on Glu in the vicinity of the electrodes that are in contact with the reagent part and the current value that depends on Hct in the vicinity of the same electrodes are used to obtain a Glu value, the Glu value can be measured, with the properties of the biological sample in the vicinity of the electrodes being reflected with higher accuracy. Furthermore, according to such a method, the Hct value can be measured in a short time in the first Hct measurement system, and the Glu value corrected using the Hct value can be obtained with high accuracy.
[0501] In the thirteenth method for measuring a component of a biological sample, the step of applying a voltage to the electrode system for obtaining a current value that depends on Glu to obtain a current value that depends on Glu may be performed multiple times. In this case, a plurality of the current values that depend on Glu and the Hct value are used to obtain a Glu value. When the step to obtain a current value that depends on Glu is performed multiple times, the measurement accuracy can be further improved, which is preferable.
[0502] The thirteenth method for measuring a component of a biological sample may further include a step of applying a voltage to the second Hct measurement system to obtain another Hct value based on the current value obtained thereby after the step to obtain a current value that depends on Glu. In this case, in the step of using the current value that depends on Glu and the Hct value to obtain a Glu value, the current value that depends on Glu and two Hct values are used to obtain a Glu value. When a voltage is applied to the second Hct measurement system to obtain another Hct value based on the current value obtained thereby after the step to obtain a current value that depends on Glu, the measurement accuracy can be further improved, which is preferable.
<Fourteenth Method for Measuring Component of Biological Sample>
[0503] Moreover, the present invention is:
a method for measuring a component of a biological sample, including a step of using the third biosensor to obtain a Glu value of the biological sample, the method including: a step of starting voltage application for a duration longer than 0 second and up to 0.7 second to the first Hct measurement system within 0 to 0.5 second after detection of introduction of the biological sample to obtain a first current value; a step of applying a voltage to the second Hct measurement system after the step to obtain a first current value, to obtain a second current value; a step of obtaining a Hct value of the biological sample based on the first current value and the second current value; a step of applying a voltage to the first Hct measurement system after the step to obtain a first current value, to obtain a current value that depends on Glu; a step of applying a voltage to an electrode system for obtaining a current value that depends on Int after the step to obtain a current value that depends on Glu, to obtain a current value that depends on an Int value of the biological sample; and a step of obtaining the Glu value of the biological sample based on the current value that depends on Glu, the Hct value of the biological sample, and the current value that depends on an Int value of the biological sample (the fourteenth method for measuring a component of a biological sample).
[0504] In the fourteenth method for measuring a component of a biological sample, the duration of the voltage application to the first Hct measurement system for obtaining a first current value is preferably any duration longer than 0 second and up to 0.5 second, further preferably any duration longer than 0 second and up to 0.1 second. Furthermore, it is preferable that the voltage application to the first Hct measurement system be started at 0 second after detection of introduction of the biological sample.
[0505] In the fourteenth method for measuring a component of a biological sample, the voltage application to the first Hct measurement system for obtaining a first current value is started at later than 0 second but within 0.5 second, preferably started at later than 0 second but within 0.3 second, more preferably started at later than 0 second but within 0.1 second, and further preferably started at later than 0 second but within 0.05 second after detection of introduction of the biological sample.
[0506] In the fourteenth method for measuring a component of a biological sample, the voltage to be applied to the first Hct measurement system for obtaining a first current value is preferably any voltage in the range of 1.5 to 4.0 V, more preferably any voltage in the range of 1.5 V to 3.0 V, and further preferably any voltage in the range of 1.5 V to 2.5 V.
[0507] In the fourteenth method for measuring a component of a biological sample, the duration of the voltage application to the second Hct measurement system is preferably any duration between 0.01 and 5.0 seconds, more preferably any duration between 0.05 and 1.0 second, and further preferably any duration between 0.1 and 0.5 second.
[0508] In the fourteenth method for measuring a component of a biological sample, the voltage to be applied to the second Hct measurement system is preferably any voltage in the range of 1.0 V to 3.5 V, more preferably any voltage in the range of 1.5 V to 3.5 V, and further preferably any voltage in the range of 2.0 V to 3.0 V.
[0509] In the fourteenth method for measuring a component of a biological sample, the duration of the voltage application to the first Hct measurement system for obtaining the current value that depends on Glu is preferably any duration between 0.01 and 10.0 seconds, more preferably any duration between 0.1 and 7.0 seconds, and further preferably any duration between 0.1 and 5.0 seconds.
[0510] In the fourteenth method for measuring a component of a biological sample, the voltage to be applied to the first Hct measurement system for obtaining the current value that depends on Glu is preferably any voltage in the range of 0.1 V to 1.4 V, more preferably any voltage in the range of 0.1 V to 1.0 V.
[0511] According to the fourteenth method for measuring a component of a biological sample, since the current value that depends on Glu in the vicinity of the electrodes that are in contact with the reagent part and the current value that depends on Hct in the vicinity of the same electrodes are used to obtain a Glu value, the Glu value can be measured, with the properties of the biological sample in the vicinity of the electrodes being reflected with higher accuracy. Furthermore, according to such a method, the Hct value can be measured in a short time in the first Hct measurement system, and the Glu value corrected using the Hct value can be obtained with high accuracy.
[0512] In the fourteenth method for measuring a component of a biological sample, the step of applying a voltage to the first Hct measurement system to obtain a current value that depends on Glu may be performed multiple times. In this case, a plurality of the current values that depend on Glu and the Hct value are used to obtain a Glu value. When the step to obtain a current value that depends on Glu is performed multiple times, the measurement accuracy can be further improved, which is preferable.
[0513] The fourteenth method for measuring a component of a biological sample may further include a step of applying a voltage to the first Hct measurement system to obtain a third current value. It is preferable that the step to obtain a third current value be performed after the step to obtain a second current value.
[0514] In the fourteenth method for measuring a component of a biological sample, the duration of the voltage application to the electrode system for obtaining a current value that depends on Int is preferably any duration between 0.1 and 10.0 seconds, more preferably any duration between 0.1 and 7.0 seconds, and further preferably any duration between 0.1 and 5.0 seconds.
[0515] In the fourteenth method for measuring a component of a biological sample, the voltage to be applied to the electrode system for obtaining a current value that depends on Int is preferably any voltage in the range of 0.1 V to 1.4 V, more preferably any voltage in the range of 0.1 V to 1.0 V.
[0516] In the fourteenth method for measuring a component of a biological sample, it is preferable that the step to obtain a current value that depends on Int be performed after the step to obtain a current value that depends on Glu.
[0517] In the fourteenth method for measuring a component of a biological sample, it is preferable that the step to obtain a second current value be performed after the step to obtain a current value that depends on Int.
<Fifteenth Method for Measuring Component of Biological Sample>
[0518] Furthermore, the present invention is:
a method for measuring a component of a biological sample, including a step of using the third biosensor to obtain a Glu value of the biological sample, the method including: a step of starting voltage application for a duration longer than 0 second and up to 0.7 second to the first Hct measurement system within 0 second to 0.5 second after detection of introduction of the biological sample to obtain a first current value; a step of applying a voltage to the second Hct measurement system after the step to obtain a first current value, to obtain a second current value; a step of obtaining a Hct value of the biological sample based on the first current value and the second current value; a step of applying a voltage to the electrode system for obtaining a current value that depends on Glu after the step to obtain a first current value, to obtain a current value that depends on Glu; a step of applying a voltage to an electrode system for obtaining a current value that depends on Int after the step to obtain a current value that depends on Glu, to obtain a current value that depends on an Int value of the biological sample; and a step of obtaining the Glu value of the biological sample based on the current value that depends on Glu, the Hct value of the biological sample, and the current value that depends on an Int value of the biological sample (the fifteenth method for measuring a component of a biological sample).
[0519] In the fifteenth method for measuring a component of a biological sample, the duration of the voltage application to the first Hct measurement system is preferably any duration longer than 0 second and up to 0.5 second, further preferably any duration longer than 0 second and up to 0.1 second.
[0520] In the fifteenth method for measuring a component of a biological sample, it is preferable that the voltage application to the first Hct measurement system be started at 0 second after detection of introduction of the biological sample. Furthermore, the voltage application to the first Hct measurement system is started at later than 0 second but within 0.5 second, preferably started at later than 0 second but within 0.3 second, more preferably started at later than 0 second but within 0.1 second, and further preferably started at later than 0 second but within 0.05 second after detection of introduction of the biological sample.
[0521] In the fifteenth method for measuring a component of a biological sample, the voltage to be applied to the first Hct measurement system is preferably any voltage in the range of 1.5 to 4.0 V, more preferably any voltage in the range of 1.5 V to 3.0 V, and further preferably any voltage in the range of 1.5 V to 2.5 V.
[0522] In the fifteenth method for measuring a component of a biological sample, the duration of the voltage application to the second Hct measurement system is preferably any duration between 0.01 and 5.0 seconds, more preferably any duration between 0.05 and 1.0 second, and further preferably any duration between 0.1 and 0.5 second.
[0523] In the fifteenth method for measuring a component of a biological sample, the voltage to be applied to the second Hct measurement system is preferably any voltage in the range of 1.0 V to 3.5 V, more preferably any voltage in the range of 1.5 V to 3.5 V, and further preferably any voltage in the range of 2.0 V to 3.0 V.
[0524] According to the fifteenth method for measuring a component of a biological sample, the Hct value can be measured in a short time in the first Hct measurement system, and the Glu value corrected using the Hct value can be obtained with high accuracy.
[0525] In the fifteenth method for measuring a component of a biological sample, the duration of the voltage application to the electrode system for obtaining a current value that depends on Glu is preferably any duration between 0.01 and 10.0 seconds, more preferably any duration between 0.1 and 7.0 seconds, and further preferably any duration between 0.1 and 5.0 seconds.
[0526] In the fifteenth method for measuring a component of a biological sample, the voltage to be applied to the electrode system for obtaining a current value that depends on Glu is preferably any voltage in the range of 0.1 V to 1.4 V, more preferably any voltage in the range of 0.1 V to 1.0 V.
[0527] In the fifteenth method for measuring a component of a biological sample, it is preferable that the step to obtain a second current value be performed after the step to obtain a current value that depends on Glu.
[0528] According to the fifteenth method for measuring a component of a biological sample, since the current value that depends on Glu in the vicinity of the electrodes that are in contact with the reagent part and the current value that depends on Hct in the vicinity of the same electrodes are used to obtain a Glu value, the Glu value can be measured, with the properties of the biological sample in the vicinity of the electrodes being reflected with higher accuracy. Furthermore, according to such a method, the Hct value can be measured in a short time in the first Hct measurement system, and the Glu value corrected using the Hct value can be obtained with high accuracy.
[0529] In the fifteenth method for measuring a component of a biological sample, the step of applying a voltage to the electrode system for obtaining a current value that depends on Glu to obtain a current value that depends on Glu may be performed multiple times. In this case, a plurality of the current values that depend on Glu and the Hct value are used to obtain a Glu value. When the step to obtain a current value that depends on Glu is performed multiple times, the measurement accuracy can be further improved, which is preferable.
[0530] In the fifteenth method for measuring a component of a biological sample may further include a step of applying a voltage to the second Hct measurement system to obtain another Hct value based on the current value obtained thereby after the step to obtain a current value that depends on Glu. In this case, in the step of using the current value that depends on Glu and the Hct value to obtain a Glu value, the current value that depends on Glu and two Hct values are used to obtain a Glu value. When a voltage is applied to the second Hct measurement system to obtain another Hct value based on the current value obtained thereby after the step to obtain a current value that depends on Glu, the measurement accuracy can be further improved, which is preferable.
[0531] In the fifteenth method for measuring a component of a biological sample, the duration of the voltage application to the electrode system for obtaining a current value that depends on Int is preferably any duration between 0.1 and 10.0 seconds, more preferably any duration between 0.1 and 7.0 seconds, and further preferably any duration between 0.1 and 5.0 seconds.
[0532] In the fifteenth method for measuring a component of a biological sample, the voltage to be applied to the electrode system for obtaining a current value that depends on Int is preferably any voltage in the range of 0.1 V to 1.4 V, more preferably any voltage in the range of 0.1 V to 1.0 V.
[0533] In the fifteenth method for measuring a component of a biological sample, it is preferable that the step to obtain a current value that depends on Int be performed after the step to obtain a current value that depends on Glu.
[0534] In the fifteenth method for measuring a component of a biological sample, it is preferable that the step to obtain a second current value be performed after the step to obtain a current value that depends on Int.
<Sixteenth Method for Measuring Component of Biological Sample>
[0535] Moreover, the present invention is:
a method for measuring a component of a biological sample, including a step of using the third biosensor to obtain a Glu value of the biological sample, the method including: a step of starting voltage application for a duration longer than 0 second and up to 0.7 second to the first Hct measurement system within 0 to 0.5 second after detection of introduction of the biological sample to obtain a first current value; a step of applying a voltage to the second Hct measurement system after the step to obtain a first current value, to obtain a second current value; a step of obtaining a Hct value of the biological sample based on the first current value and the second current value; a step of applying a voltage to the first Hct measurement system after the step to obtain a first current value, to obtain a first current value that depends on Glu; a step of applying a voltage to the electrode system for obtaining a second current value that depends on Glu after the step to obtain a first current value that depends on Glu, to obtain a second current value that depends on Glu; a step of applying a voltage to an electrode system for obtaining a current value that depends on Int after the step to obtain a second current value that depends on Glu, to obtain a current value that depends on an Int value of the biological sample; and a step of obtaining the Glu value of the biological sample based on the first current value that depends on Glu, the second current value that depends on Glu, the Hct value of the biological sample, and the current value that depends on an Int value of the biological sample (the sixteenth method for measuring a component of a biological sample).
[0536] In the sixteenth method for measuring a component of a biological sample, the duration of the voltage application to the first Hct measurement system for obtaining a first current value is preferably any duration longer than 0 second and up to 0.5 second, further preferably any duration longer than 0 second and up to 0.1 second. Furthermore, it is preferable that the voltage application to the first Hct measurement system be started at 0 second after detection of introduction of the biological sample.
[0537] In the sixteenth method for measuring a component of a biological sample, the voltage application to the first Hct measurement system for obtaining a first current value is started at later than 0 second but within 0.5 second, preferably started at later than 0 second but within 0.3 second, more preferably started at later than 0 second but within 0.1 second, and further preferably started at later than 0 second but within 0.05 second after detection of introduction of the biological sample.
[0538] In the sixteenth method for measuring a component of a biological sample, the voltage to be applied to the first Hct measurement system for obtaining a first current value is preferably any voltage in the range of 1.5 to 4.0 V, more preferably any voltage in the range of 1.5 V to 3.0 V, and further preferably any voltage in the range of 1.5V to 2.5 V.
[0539] In the sixteenth method for measuring a component of a biological sample, the duration of the voltage application to the second Hct measurement system is preferably any duration between 0.01 and 5.0 seconds, more preferably any duration between 0.05 and 1.0 second, and further preferably any duration between 0.1 and 0.5 second.
[0540] In the sixteenth method for measuring a component of a biological sample, the voltage to be applied to the second Hct measurement system is preferably any voltage in the range of 1.0 V to 3.5 V, more preferably any voltage in the range of 1.5 V to 3.5 V, and further preferably any voltage in the range of 2.0 V to 3.0 V.
[0541] In the sixteenth method for measuring a component of a biological sample, the duration of the voltage application to the first Hct measurement system for obtaining the first current value that depends on Glu is preferably any duration between 0.01 and 10.0 seconds, more preferably any duration between 0.1 and 7.0 seconds, and further preferably any duration between 0.1 and 5.0 seconds.
[0542] In the sixteenth method for measuring a component of a biological sample, the voltage to be applied to the first Hct measurement system for obtaining the first current value that depends on Glu is preferably any voltage in the range of 0.1 V to 1.4 V, more preferably any voltage in the range of 0.1 V to 1.0 V.
[0543] In the sixteenth method for measuring a component of a biological sample, the duration of the voltage application to the electrode system for obtaining a second current value that depends on Glu is preferably any duration between 0.01 and 10.0 seconds, more preferably any duration between 0.1 and 7.0 seconds, and further preferably any duration between 0.1 and 5.0 seconds.
[0544] In the sixteenth method for measuring a component of a biological sample, the voltage to be applied to the electrode system for obtaining a second current value that depends on Glu is preferably any voltage in the range of 0.1 V to 1.4 V, more preferably any voltage in the range of 0.1 V to 1.0 V.
[0545] According to the sixteenth method for measuring a component of a biological sample, since the current value that depends on Glu in the vicinity of the electrodes that are in contact with the reagent part and the current value that depends on Hct in the vicinity of the same electrodes are used to obtain a Glu value, the Glu value can be measured, with the properties of the biological sample in the vicinity of the electrodes being reflected with higher accuracy. Furthermore, according to such a method, the Hct value can be measured in a short time in the first Hct measurement system, and the Glu value corrected using the Hct value can be obtained with high accuracy.
[0546] In the sixteenth method for measuring a component of a biological sample, the step to obtain a first current value that depends on Glu and the step to obtain a second current value that depends on Glu may be performed multiple times. In this case, a plurality of the first current values that depend on Glu and the second current values that depend on Glu as well as the Hct value are used to obtain a Glu value. When the steps to obtain a current value that depends on Glu are performed multiple times, the measurement accuracy can be further improved, which is preferable.
[0547] The sixteenth method for measuring a component of a biological sample may further includes a step of applying a voltage to the first Hct measurement system to obtain a third current value. It is preferable that the step to obtain a third current value be performed after the step to obtain a second current value.
[0548] In the sixteenth method for measuring a component of a biological sample, the duration of the voltage application to the electrode system for obtaining a current value that depends on Int is preferably any duration between 0.1 and 10.0 seconds, more preferably any duration between 0.1 and 7.0 seconds, and further preferably any duration between 0.1 and 5.0 seconds.
[0549] In the sixteenth method for measuring a component of a biological sample, the voltage to be applied to the electrode system for obtaining a current value that depends on Int is preferably any voltage in the range of 0.1 V to 1.4 V, more preferably any voltage in the range of 0.1 V to 1.0V.
[0550] In the sixteenth method for measuring a component of a biological sample, it is preferable that the step to obtain a current value that depends on Int be performed after the step to obtain a first current value that depends on Glu. Furthermore, it is preferable that the step to obtain a current value that depends on Int be performed after the step to obtain a second current value that depends on Glu.
[0551] In the sixteenth method for measuring a component of a biological sample, it is preferable that the step to obtain a second current value be performed after the step to obtain a current value that depends on Int.
[0552] In the sixteenth method for measuring a component of a biological sample, the duration of the voltage application to the electrode system for obtaining a second current value that depends on Glu is preferably any duration between 0.01 and 10.0 seconds, more preferably any duration between 0.1 and 7.0 seconds, and further preferably any duration between 0.1 and 5.0 seconds.
[0553] In the sixteenth method for measuring a component of a biological sample, the voltage to be applied to the electrode system for obtaining a second current value that depends on Glu is preferably any voltage in the range of 0.1 V to 1.4 V, more preferably any voltage in the range of 0.1 V to 1.0 V.
<Seventeenth Method for Measuring Component of Biological Sample>
[0554] Furthermore, the present invention is:
a method for measuring a component of a biological sample, including a step of using the third biosensor to obtain a Glu value of the biological sample, the method including: a step of starting voltage application for a duration longer than 0 second and up to 0.7 second to the first Hct measurement system within 0 second to 0.5 second after detection of introduction of the biological sample to obtain a first current value; a step of applying a voltage to the second Hct measurement system after the step to obtain a first current value, to obtain a second current value; a step of obtaining a Hct value of the biological sample based on the first current value and the second current value; a step of applying a voltage to the electrode system for obtaining a first current value that depends on Glu after the step to obtain a first current value, to obtain a first current value that depends on Glu; a step of applying a voltage to the electrode system for obtaining a second current value that depends on Glu after the step to obtain a first current value that depends on Glu, to obtain a second current value that depends on Glu; a step of applying a voltage to an electrode system for obtaining a current value that depends on Int after the step to obtain a second current value that depends on Glu, to obtain a current value that depends on an Int value of the biological sample; and a step of obtaining the Glu value of the biological sample based on the first current value that depends on Glu, the second current value that depends on Glu, the Hct value of the biological sample, and the current value that depends on an Int value of the biological sample (the seventeenth method for measuring a component of a biological sample).
[0555] In the seventeenth method for measuring a component of a biological sample, the duration of the voltage application to the first Hct measurement system is preferably any duration longer than 0 second and up to 0.5 second, further preferably any duration longer than 0 second and up to 0.1 second.
[0556] In the seventeenth method for measuring a component of a biological sample, it is preferable that the voltage application to the first Hct measurement system be started at 0 second after detection of introduction of the biological sample. Furthermore, the voltage application to the first Hct measurement system is started at later than 0 second but within 0.5 second, preferably started at later than 0 second but within 0.3 second, more preferably started at later than 0 second but within 0.1 second, and further preferably started at later than 0 second but within 0.05 second after detection of introduction of the biological sample.
[0557] In the seventeenth method for measuring a component of a biological sample, the voltage to be applied to the first Hct measurement system is preferably any voltage in the range of 1.5 to 4.0 V, more preferably any voltage in the range of 1.5 V to 3.0 V, and further preferably any voltage in the range of 1.5 V to 2.5 V.
[0558] In the seventeenth method for measuring a component of a biological sample, the duration of the voltage application to the second Hct measurement system is preferably any duration between 0.01 and 5.0 seconds, more preferably any duration between 0.05 and 1.0 second, and further preferably any duration between 0.1 and 0.5 second.
[0559] In the seventeenth method for measuring a component of a biological sample, the voltage to be applied to the second Hct measurement system is preferably any voltage in the range of 1.0 V to 3.5 V, more preferably any voltage in the range of 1.5 V to 3.5 V, and further preferably any voltage in the range of 2.0 V to 3.0 V.
[0560] According to the seventeenth method for measuring a component of a biological sample, the Hct value can be measured in a short time in the first Hct measurement system, and the Glu value corrected using the Hct value can be obtained with high accuracy.
[0561] In the seventeenth method for measuring a component of a biological sample, the duration of the voltage application to the electrode system for obtaining the first current value that depends on Glu is preferably any duration between 0.01 and 10.0 seconds, more preferably any duration between 0.1 and 7.0 seconds, and further preferably any duration between 0.1 and 5.0 seconds.
[0562] In the seventeenth method for measuring a component of a biological sample, the voltage to be applied to the electrode system for obtaining a first current value that depends on Glu is preferably any voltage in the range of 0.1 V to 1.4 V, more preferably any voltage in the range of 0.1 V to 1.0 V.
[0563] In the seventeenth method for measuring a component of a biological sample, the duration of the voltage application to the electrode system for obtaining a second current value that depends on Glu is preferably any duration between 0.01 and 10.0 seconds, more preferably any duration between 0.1 and 7.0 seconds, and further preferably any duration between 0.1 and 5.0 seconds.
[0564] In the seventeenth method for measuring a component of a biological sample, the voltage to be applied to the electrode system for obtaining a second current value that depends on Glu is preferably any voltage in the range of 0.1 V to 1.4 V, more preferably any voltage in the range of 0.1 V to 1.0 V.
[0565] In the seventeenth method for measuring a component of a biological sample, it is preferable that the step to obtain a second current value be performed after the step to obtain a first current value that depends on Glu.
[0566] According to the seventeenth method for measuring a component of a biological sample, since the current value that depends on Glu in the vicinity of the electrodes that are in contact with the reagent part and the current value that depends on Hct in the vicinity of the same electrodes are used to obtain a Glu value, the Glu value can be measured, with the properties of the biological sample in the vicinity of the electrodes being reflected with higher accuracy. Furthermore, according to such a method, the Hct value can be measured in a short time in the first Hct measurement system, and the Glu value corrected using the Hct value can be obtained with high accuracy.
[0567] In the seventeenth method for measuring a component of a biological sample, the step to obtain a first current value that depends on Glu and the step to obtain a second current value that depends on Glu may be performed multiple times. In this case, a plurality of the first current values that depend on Glu and the second current values that depend on Glu as well as the Hct value are used to obtain a Glu value. When the steps to obtain a current value that depends on Glu are performed multiple times, the measurement accuracy can be further improved, which is preferable.
[0568] The seventeenth method for measuring a component of a biological sample may further include a step of applying a voltage to the second Hct measurement system after the step to obtain a first current value that depends on Glu, to obtain another Hct value based on the current value obtained thereby. In this case, in the step of using the current values that depend on Glu and the Hct value to obtain a Glu value, the current values that depend on Glu and two Hct values are used to obtain a Glu value. When after the steps to obtain a current value that depends on Glu, a voltage is applied to the second Hct measurement system to obtain another Hct value based on the current value obtained thereby, the measurement accuracy can be further improved, which is preferable.
[0569] In the seventeenth method for measuring a component of a biological sample, the duration of the voltage application to the electrode system for obtaining a current value that depends on Int is preferably any duration between 0.1 and 10.0 seconds, more preferably any duration between 0.1 and 7.0 seconds, and further preferably any duration between 0.1 and 5.0 seconds.
[0570] In the seventeenth method for measuring a component of a biological sample, the voltage to be applied to the electrode system for obtaining a current value that depends on Int is preferably any voltage in the range of 0.1 V to 1.4 V, more preferably any voltage in the range of 0.1 V to 1.0 V.
[0571] In the seventeenth method for measuring a component of a biological sample, it is preferable that the step to obtain a current value that depends on Int be performed after the step to obtain a current value that depends on Glu.
[0572] In the seventeenth method for measuring a component of a biological sample, it is preferable that the step to obtain a second current value be performed after the step to obtain a current value that depends on Int.
[0573] Moreover, the present invention is:
a method for measuring a component of a biological sample, including a step of using the third biosensor to obtain a Glu value of the biological sample, the method including: a step of starting voltage application for a duration longer than 0 second and up to 0.7 second to the first Hct measurement system within 0 to 0.5 second after detection of introduction of the biological sample to obtain a first current value; a step of applying a voltage to the second Hct measurement system after the step to obtain a first current value, to obtain a second current value; a step of obtaining a Hct value of the biological sample based on the first current value and the second current value; a step of applying a voltage to the first Hct measurement system after the step to obtain a first current value, to obtain a first current value that depends on Glu; a step of applying a voltage to the electrode system for obtaining a current value that depends on Glu after the step to obtain a first current value, to obtain a second current value that depends on Glu; and a step of obtaining the Glu value of the biological sample based on the first current value that depends on Glu, the second current value that depends on Glu, and the Hct value of the biological sample (the eighteenth method for measuring a component of a biological sample).
[0574] In the eighteenth method for measuring a component of a biological sample, the duration of the voltage application to the first Hct measurement system is preferably any duration longer than 0 second and up to 0.5 second, further preferably any duration longer than 0 second and up to 0.1 second.
[0575] In the eighteenth method for measuring a component of a biological sample, it is preferable that the voltage application to the first Hct measurement system be started at 0 second after detection of introduction of the biological sample. Furthermore, the voltage application to the first Hct measurement system is started at later than 0 second but within 0.5 second, preferably started at later than 0 second but within 0.3 second, more preferably started at later than 0 second but within 0.1 second, and further preferably started at later than 0 second but within 0.05 second after detection of introduction of the biological sample.
[0576] In the eighteenth method for measuring a component of a biological sample, the voltage to be applied to the first Hct measurement system is preferably any voltage in the range of 1.5 to 4.0 V, more preferably any voltage in the range of 1.5 V to 3.0 V, and further preferably any voltage in the range of 1.5 V to 2.5 V.
[0577] In the eighteenth method for measuring a component of a biological sample, the duration of the voltage application to the second Hct measurement system is preferably any duration between 0.01 and 5.0 seconds, more preferably any duration between 0.05 and 1.0 second, and further preferably any duration between 0.1 and 0.5 second.
[0578] In the eighteenth method for measuring a component of a biological sample, the voltage to be applied to the second Hct measurement system is preferably any voltage in the range of 1.0 V to 3.5 V, more preferably any voltage in the range of 1.5 V to 3.5 V and further preferably any voltage in the range of 2.0 V to 3.0 V.
[0579] According to the eighteenth method for measuring a component of a biological sample, the Hct value can be measured in a short time in the first Hct measurement system, and the Glu value corrected using the Hct value can be obtained with high accuracy.
[0580] In the eighteenth method for measuring a component of a biological sample, the duration of the voltage application to the electrode system for obtaining a first current value that depends on Glu is preferably any duration between 0.01 and 10.0 seconds, more preferably any duration between 0.1 and 7.0 seconds, and further preferably any duration between 0.1 and 5.0 seconds.
[0581] In the eighteenth method for measuring a component of a biological sample, the voltage to be applied to the electrode system for obtaining a first current value that depends on Glu is preferably any voltage in the range of 0.1 V to 1.4 V, more preferably any voltage in the range of 0.1 V to 1.0 V.
[0582] In the eighteenth method for measuring a component of a biological sample, the duration of the voltage application to the electrode system for obtaining a second current value that depends on Glu is preferably any duration between 0.01 and 10.0 seconds, more preferably any duration between 0.1 and 7.0 seconds, and further preferably any duration between 0.1 and 5.0 seconds.
[0583] In the eighteenth method for measuring a component of a biological sample, the voltage to be applied to the electrode system for obtaining a second current value that depends on Glu is preferably any voltage in the range of 0.1 V to 1.4 V, more preferably any voltage in the range of 0.1 V to 1.0 V.
[0584] In the eighteenth method for measuring a component of a biological sample, it is preferable that the step to obtain a second current value be performed after the step to obtain a first current value that depends on Glu.
[0585] In the eighteenth method for measuring a component of a biological sample, the step to obtain a first current value that depends on Glu and the step to obtain a second current value that depends on Glu may be performed multiple times. In this case, a plurality of the first current values that depend on Glu and the second current values that depend on Glu as well as the Hct value are used to obtain a Glu value. When the steps to obtain a current value that depends on Glu are performed multiple times, the measurement accuracy can be further improved, which is preferable.
[0586] In the sixth method for measuring a component of a biological sample, the seventh method for measuring a component of a biological sample, the eighth method for measuring a component of a biological sample, the ninth method for measuring a component of a biological sample, the tenth method for measuring a component of a biological sample, the eleventh method for measuring a component of a biological sample, the twelfth method for measuring a component of a biological sample, the thirteenth method for measuring a component of a biological sample, the fourteenth method for measuring a component of a biological sample, the fifteenth method for measuring a component of a biological sample, the sixteenth method for measuring a component of a biological sample, the seventeenth method for measuring a component of a biological sample, or the eighteenth method for measuring a component of a biological sample, the biological sample may be, for example, blood, sweat, or urine and is preferably blood.
[0587] Next, embodiments of the method for measuring a component of a biological sample according to the present invention will be described with reference to the drawings.
Embodiment 1
[0588] A method for measuring a component of a biological sample, in which a Hct value is obtained, will be described with reference to FIG. 9. FIG. 9 is an operation flow chart of the method according to this embodiment.
[0589] An example using blood as a biological sample will be described. First, for example, a fingertip is pricked with a dedicated lancet to cause bleeding. On the other hand, the biosensor 1 is set in a dedicated measuring apparatus (a meter) (S1), and the measuring device is activated and put into a standby state (S2). In the measuring device, a display prompting "spot application onto the sensor" is presented (S3), the biological sample supply port 12 of the sensor set in the measuring apparatus is brought into contact with the bleeding blood, and the blood is introduced into the sensor by a capillary phenomenon.
[0590] In this measuring method, for example, the biosensor 1 shown in FIG. 1 is used. In this case, the electrode A is used as a first working electrode and the electrode B is used as a first counter electrode.
<Step 1: Detection of Sample (Blood)>
[0591] A voltage is applied between the working electrode and the counter electrode, and the introduction of blood is detected by the change in the current value accompanying the introduction of blood. When the current value exceeds a threshold value, it is determined that the spot application amount is full (S4). After the spot application amount becomes full, "Measurement start" is displayed on the measuring device (S5).
<Step 2: Hct Measurement Process>
[0592] After the introduction of blood is confirmed, the subsequent steps are started. The "Hct measurement process" shown in FIG. 9 will be described with reference to FIG. 10. A voltage is applied between the working electrode (the first working electrode) and the counter electrode (the first counter electrode) (S21). This voltage application is started within 0 second (i.e., immediately) to 0.5 second (i.e., after a very short time) after confirmation of the introduction of blood and is performed for a duration longer than 0 second and up to 0.7 second (i.e., a relatively short period of time) (S22). The voltage applied at this time is a high voltage, for example, 1.5 to 4.0 V. In the present invention, both the working electrode and the counter electrode are in contact with the reagent part containing an enzyme and a mediator. During this relatively short period of time, the reaction between Glu in the blood and the enzyme (for example, Glu oxidoreductase) hardly proceeds by voltage application alone. Therefore, such voltage application makes it possible to detect a current value that does not depend on the electrolytic oxidation reaction of Glu but depends on the Hct value (S23). Then, based on the current value thus obtained, the Hct value is obtained. In this case, conversion from the detected current value to the Hct value can be performed using a calibration curve or a calibration curve table that has been obtained beforehand. In this correction, the Hct value obtained from the calibration curve of the current value and the Hct value that has been prepared beforehand may be used, or the detected current value may be used as it is. In this step, since the mediator is disposed on both the working electrode and the counter electrode, the Hct value can be obtained under the same environment as that for measuring a Glu value. The voltage application is terminated (S24), and the Hct measurement process is terminated.
Embodiment 2
[0593] A method for measuring a component of a biological sample, in which a Glu value is obtained, will be described with reference to FIG. 11. FIG. 11 is an operation flow chart of the method according to this embodiment.
[0594] In this measuring method, for example, the biosensor (the first biosensor) shown in FIG. 4 may be used. In that case, for example, the electrode A is used as the working electrode in Step 2: Hct Measurement Process, the electrode B is used as the counter electrode in Step 2: Hct Measurement Process, the electrode A is used as the working electrode in Step 3: Measurement of Apparent Glu Amount, and the electrode B is used as the counter electrode in Step 3: Measurement of Apparent Glu Amount.
TABLE-US-00022 TABLE 22 Working Electrode Counter Electrode Step 2: Hct Measurement A B Process Step 3: Measurement of A B Apparent Glu Amount
[0595] In the operation flow chart shown in FIG. 11, steps S1 to S6 are the same as steps S1 to S6 of Embodiment 1 shown in FIG. 9. The "current value measurement process" (S7) in FIG. 11 will be described with reference to FIG. 12.
<Step 3: Measurement of Apparent Glu Amount>
[0596] After Glu in the blood is reacted with the Glu oxidoreductase for a certain period of time, a voltage is applied between the working electrode A (the first working electrode) and the counter electrode B (the first counter electrode) (S 31). The voltage to be applied in this step is, for example, 0.1 to 1.4 V. Both the working electrode A and the counter electrode B are in contact with the reagent part 11 containing the enzyme and a mediator. Therefore, while a voltage is being applied, Glu in the blood and the enzyme (for example, Glu oxidoreductase) are reacted with each other for a certain period of time. By applying a voltage, a current value that depends on Glu based on the electrolytic oxidation reaction of Glu can be detected (S 33). The current value may be measured once or multiple times. For example, in the case of the relationship between voltage application time and applied voltage as shown in FIG. 13(a), the current value measured at the time point (1) may be used or the current value measured at the time point (2) may be used. Furthermore, in the case of the relationship between voltage application time and applied voltage as shown in FIG. 13(b), the current value measured at the time point (1), the current value measured at the time point (2), the current value measured at the time point (3), or the current value measured at the time point (4) may be used. Moreover, a plurality of parameters (x1, x2, x3, . . . , x10) are calculated based on, for example, the extracted current values measured at the plurality of predetermined time points and the extracted temperature information of the biological information measuring apparatus ("Calculate predetermined parameters"), a correction amount is calculated by a multiple regression equation (for example, Formula 1 below), and then a Glu value is calculated (S8).
[Mathematical Formula 1]
y=ax1+bx2+cx3 . . . +kx10+1 (Formula 1)
(y denotes the correction amount, x1, x2, x3 . . . , x10 denote parameters, and a, b, c, . . . 1 denote coefficients.)
[0597] After the current value is measured, if desired, current values are further measured. For example, in the case of the relationship between voltage application time and applied voltage as shown in FIG. 13(a), the current value may be measured at the time point (1) and then the current value may be measured again at the time point (2). After the current value is measured for a desired number of times, the voltage application is stopped (S34), the current value measurement is terminated (S35), and the current value measurement process is terminated.
<Step 4: Correction of Blood Component>
[0598] The Hct value obtained in Step 2 and the current value that depends on Glu obtained in Step 3 are used to obtain a Glu value (S8, FIG. 11). It is preferable that this be performed based on a calibration curve (including a calibration table) prepared beforehand. The Glu amount thus obtained is displayed or stored in the measuring apparatus (S9). Instead of correcting the Glu amount after the Hct value is obtained first as described above, the current value that depends on the Hct value detected in Step 2 and the current value that depends on Glu obtained in Step 3 may be used to obtain a Glu value. Thereafter, the sensor is discarded (S11). After the display unit, etc. are turned off, the measuring device is also turned off (S 12), and the measurement of the component of the biological sample is terminated (S13).
[0599] That is, in Embodiment 2, Step 1: Detection of Sample (Blood), Step 2: Hct Measurement Process, Step 3: Measurement of Apparent GluAmount, and Step 4: Correction of Blood Component are performed in this order.
[0600] FIGS. 16a and 16b show the relationship between applied voltage and voltage application time in Embodiment 2.
[0601] In FIG. 16a, the Hct measurement process in Step 2 is started at zero second after confirmation of the introduction of blood and is performed by applying a voltage, until 0.3 second thereafter, for 0.3 second. In this case, a voltage of 1.5 V is applied. Then, the voltage application for measuring the apparent Glu amount in Step 3 is performed twice. Specifically, a voltage of 0.35 V is applied for 1.5 seconds from 1 second to 2.5 seconds, and a voltage of 0.35 V is applied for 1.5 seconds from 3.5 seconds to 5 seconds.
[0602] In FIG. 16b, the Hct measurement process in Step 2 is started at 0.1 second after confirmation of the introduction of blood and is performed by applying a voltage, until 0.3 second thereafter, for 0.2 second. In this case, a voltage of 1.5 V is applied. Then, the voltage application for measuring the apparent Glu amount in Step 3 is performed twice. Specifically, a voltage of 0.35 V is applied for 1.5 seconds from 1 second to 2.5 seconds, and a voltage of 0.35 V is applied for 1.5 seconds from 3.5 seconds to 5 seconds.
Embodiment 3
[0603] Another method for measuring a component of a biological sample, in which a Glu value is obtained, will be described with reference to FIG. 14a. FIG. 14a is an operation flow chart of the method according to this embodiment.
[0604] In this measuring method, for example, the biosensor (the first biosensor) shown in FIG. 4 may be used. In this case, for example, the electrode A is used as the working electrode in Step 2: Hct Measurement Process and the counter electrode in Step 5: Second Hct Measurement Process, the electrode B is used as the counter electrode in Step 2: Hct Measurement Process, the electrode A is used as the working electrode in Step 3: Measurement of Apparent Glu Amount, the electrode B is used as the counter electrode in Step 3: Measurement of Apparent Glu Amount, and the electrode C is used as the working electrode in Step 5: Second Hct Measurement Process.
TABLE-US-00023 TABLE 23 Working Electrode Counter Electrode Step 2: Hct Measurement A B Process Step 3: Measurement of A B Apparent Glu Amount Step 5: Second Hct C A Measurement Process
[0605] In the operation flow chart shown in FIG. 14a, steps S1 to S13 are the same as steps S1 to S13 of Embodiment 2 shown in FIG. 11. The "Hct measurement process 2" (S14 in FIG. 14a) in FIG. 14a will be described with reference to FIG. 14b.
<Step 5: Second Hct Measurement Process>
[0606] This step is a step arranged between Step 3: Measurement of Apparent Glu Amount and Step 4: Correction of Blood Component in Embodiment 2.
[0607] First, a voltage is applied between the working electrode C (the second working electrode) and the counter electrode A (the second counter electrode) (S41). In this case, the voltage is, for example, 1.5 to 3.5V. In the present invention, the counter electrode A is in contact with the reagent part containing an enzyme and a mediator. On the other hand, the working electrode C is not in contact with the reagent part. With this voltage application, the reaction between Glu in the blood and the enzyme (for example, Glu oxidoreductase) hardly proceeds (S42). Therefore, such voltage application makes it possible to detect a current value that does not depend on the electrolytic oxidation reaction of Glu but depends on the Hct value ($43). Then, based on the current value thus obtained, the Hct value is obtained. In this case, conversion from the detected current value to the Hct value can be performed using a calibration curve or a calibration curve table that has been obtained beforehand. In this correction, the Hct value obtained from the calibration curve of the current value and the Hct value that has been prepared beforehand may be used, or the detected current value may be used as it is. The voltage application is terminated (S44), and the Hct measurement process is terminated.
[0608] In this case, in Step 4: Correction of Blood Component, the Hct value obtained in Step 2, the Hct value obtained in Step 5, and the current value that depends on Glu obtained in Step 3 are used to obtain a Glu value (S8, FIG. 14a). When such Step 5 is added, it is possible to capture the Hct value of the blood of the entire capillary. Thus, it is possible to measure the Glu value with higher accuracy compared to the case where Step 5 is not added.
[0609] That is, in Embodiment 3, Step 1: Detection of Sample (Blood), Step 2: Hct Measurement Process, Step 3: Measurement of Apparent Glu Amount, Step 5: Second Hct Measurement Process, and Step 4: Correction of Blood Component are performed in this order.
[0610] FIGS. 17a and 17b show examples of the relationship between applied voltage and voltage application time in Embodiment 3.
[0611] In FIG. 17a, the Hct measurement process in Step 2 is started at zero second after confirmation of the introduction of blood and is performed by applying a voltage, until 0.3 second thereafter, for 0.3 second. In this case, a voltage of 1.5 V is applied. Then, the voltage application for measuring the apparent Glu amount in Step 3 is performed twice. Specifically, a voltage of 0.35 V is applied for 1.5 seconds from 1 second to 2.5 seconds, and a voltage of 0.35 V is applied for 1.5 seconds from 3.5 seconds to 5 seconds. Then, in the second Hct measurement process in Step 5, a voltage of 2.5 V is applied for 0.5 second from 6.5 seconds to 7 seconds.
[0612] In FIG. 17b, the Hct measurement process in Step 2 is started at 0.1 second after confirmation of the introduction of blood and is performed by applying a voltage, until 0.3 second thereafter, for 0.2 second. In this case, a voltage of 1.5 V is applied. Then, the voltage application for measuring the apparent Glu amount in Step 3 is performed twice. Specifically, a voltage of 0.35 V is applied for 1.5 seconds from 1 second to 2.5 seconds, and a voltage of 0.35 V is applied for 1.5 seconds from 3.5 seconds to 5 seconds. Then, in the second Hct measurement process in Step 5, a voltage of 2.5 V is applied for 0.5 second from 6.5 seconds to 7 seconds.
Embodiment 4
[0613] Another method for measuring a component of a biological sample, in which a Glu value is obtained, will be described with reference to FIG. 15a. FIG. 15a is an operation flow chart of the method according to this embodiment.
[0614] In this measuring method, for example, the biosensor (the third biosensor) shown in FIG. 6 may be used. In this case, for example, the electrode A is used as the working electrode in Step 2: Hct Measurement Process, the working electrode in Step 3: Measurement of Apparent Glu Amount, and the counter electrode in Step 5: Second Hct Measurement Process, the electrode B is used as the counter electrode in Step 2: Hct Measurement Process and the counter electrode in Step 3: Measurement of Apparent Glu Amount, the electrode C is used as the counter electrode in Step 3: Measurement of Apparent Glu Amount, the counter electrode in Step 6; Int Measurement Process, and the counter electrode in Step 5: Second Hct Measurement Process, the electrode E is used as the counter electrode in Step 3: Measurement of Apparent Glu Amount and the counter electrode in Step 6; Int Measurement Process, the electrode G is used as the counter electrode in Step 5: Second Hct Measurement Process, and the electrode F is used as the working electrode in Step 6; Int Measurement Process and the working electrode in Step 5: Second Hct Measurement Process.
[0615] In Step 6: Int Measurement Process described above, an electrode (for example, the electrode F) that is not in contact with the reagent layer can be used as the working electrode, and an electrode (for example, the electrode B, C, E) that is in contact with the reagent layer can be used as the counter electrode. Furthermore, it is preferable to use the same electrode for the counter electrode used in Step 6: Int Measurement Process and the counter electrode used in Step 3: Measurement of Apparent Glu Amount.
TABLE-US-00024 TABLE 24 Working Electrode Counter Electrode Step 2: Hct Measurement A B Process Step 3: Measurement of A or G B, C, E Apparent Glu Amount Step 6: Int Measurement F B, C, E Process Step 5: Second Hct F A, B, C, G Measurement Process
[0616] In the operation flow chart shown in FIG. 15a, steps S1 to S13 are the same as steps S1 to S13 of Embodiment 2 shown in FIG. 11. The "Hct measurement process 2" (S14 in FIG. 15a) in FIG. 15a is the same as step S14 of Embodiment 3 shown in FIG. 14b. The "INT measurement process" (S15 in FIG. 15a) in FIG. 15a will be described with reference to FIG. 15b.
<Step 6: Int Measurement Process>
[0617] This step is a step arranged between Step 3: Measurement of Apparent Glu Amount and Step 5: Hct Measurement Process 2 in Embodiment 3.
[0618] First, a voltage is applied between the working electrode F (the sixth working electrode) and the counter electrodes BA (the sixth counter electrode), C (the sixth counter electrode), E (the sixth counter electrode) (S51). In this case, the voltage is lower than the voltage used in the Hct measurement process such as S21 in Step 2 or S41 in Step 5, for example, 0.1 to 1.4 V. In the present invention, the counter electrode A is in contact with the reagent part containing an enzyme and a mediator. On the other hand, the working electrode C is not in contact with the reagent part. With this voltage application, a current value that depends on an interfering substance (uric acid, acetaminophen, etc.; abbreviated as Int) can be detected (S53). Then, based on the current value thus obtained, an Int value is obtained. In this case, conversion from the detected current value to the Int value can be performed using a calibration curve or a calibration curve table that has been obtained beforehand. In this correction, the Int value obtained from the calibration curve of the current value and the Int value that has been prepared beforehand may be used, or the detected current value may be used as it is. The voltage application is terminated (S54), and the Int measurement process is terminated.
[0619] In this case, in Step 4: Correction of Blood Component, the Hct value obtained in Step 2, the Hct value obtained in Step 5, the current value that depends on Glu obtained in Step 3, and the Int value obtained in Step 6 are used to obtain a Glu value (S8, FIG. 15a). When such Step 6 is added, it is possible to capture the Int value of the blood of the entire capillary. Thus, it is possible to measure the Glu value with higher accuracy compared to the case where Step 6 is not added.
[0620] That is, in Embodiment 4, Step 1: Detection of Sample (Blood), Step 2: Hct Measurement Process, Step 3: Measurement of Apparent Glu Amount, Step 6: Int Measurement Process, Step 5: Second Hct Measurement Process, and Step 4: Correction of Blood Component are performed in this order.
[0621] FIG. 18a shows an example of the relationship between applied voltage and voltage application time in Embodiment 4.
[0622] In FIG. 18a, the Hct measurement process in Step 2 is started at zero second after confirmation of the introduction of blood and is performed by applying a voltage, until 0.3 second thereafter, for 0.3 second. In this case, a voltage of 1.5 V is applied. Then, the voltage application for measuring the apparent Glu amount in Step 3 is performed twice. Specifically, a voltage of 0.35 V is applied for 1 second from 1 second to 2 seconds, and a voltage of 0.35 V is applied for 1 second from 3 seconds to 4 seconds. Then, in the Int measurement process in Step 6, a voltage of 1.0 V is applied for 1 second from 5 seconds to 6 seconds. Finally, in the second Hct measurement process in Step 5, a voltage of 2.5 V is applied for 0.5 second from 6.5 seconds to 7 seconds.
Embodiment 5
[0623] Still another method for measuring a component of a biological sample, in which a Glu value is obtained, will be described with reference to FIG. 15a. FIG. 15a is an operation flow chart of the method according to Embodiment 4, but a Hct measurement process 1 (S 6) is further added between the Hct measurement process 2 (S14) and the final glucose value correction & calculation (S8) to perform the method of Embodiment 5.
[0624] In this measuring method, for example, the biosensor (the third biosensor) shown in FIG. 6 may be used. In this case, for example, the electrode A is used as the counter electrode in Step 2: Hct Measurement Process, the counter electrode in Step 3: Measurement of Apparent Glu Amount, the counter electrode in Step 5: Second Hct Measurement Process, and the counter electrode in Step 6; Int Measurement Process, the electrode B is used as the working electrode in Step 2: Hct Measurement Process, the working electrode in Step 3: Measurement of Apparent GluAmount, and the counter electrode in Step 5: Second Hct Measurement Process, the electrode C is used as the counter electrode in Step 3: Measurement of Apparent Glu Amount, the counter electrode in Step 5: Second Hct Measurement Process, and the counter electrode in Step 6; Int Measurement Process, the electrode E is used as the counter electrode in Step 3: Measurement of Apparent Glu Amount and the counter electrode in Step 6; Int Measurement Process, the electrode G is used as the working electrode in Step 3: Measurement of Apparent Glu Amount and the counter electrode in Step 5: Second Hct Measurement Process, and the electrode F is used as the working electrode in Step 5: Second Hct Measurement Process and the working electrode in Step 6; Int Measurement Process.
[0625] In Step 6: Int Measurement Process described above, an electrode (for example, the electrode F) that is not in contact with the reagent layer can be used as the working electrode, and an electrode (for example, electrode A, C, E) that is in contact with the reagent layer can be used as the counter electrode. Furthermore, it is preferable to use the same electrode for the counter electrode used in Step 6: Int Measurement Process and the counter electrode used in Step 3: Measurement of Apparent Glu Amount.
[0626] In Step 3: Measurement of Apparent Glu Amount, voltage application can be performed multiple times. In this case, the same electrode (for example, the electrode A, the electrode C, the electrode E) is used as the counter electrode, and different electrodes (for example, the electrode B and the electrode G) among the electrodes that are in contact with the reagent layer each can be used as the working electrode. This makes it possible to obtain a current value for Glu of the whole biosensor, which is preferable.
TABLE-US-00025 TABLE 25 Working Electrode Counter Electrode Step 2: Hct Measurement B A Process Step 3: Measurement of B or G A, C, E Apparent Glu Amount Step 6: Int Measurement F A, C, E Process Step 5: Second Hct F A, B, C, G Measurement Process
[0627] In the operation flow chart shown in FIG. 15a, steps S1 to S13 are the same as steps S1 to S13 of Embodiment 2 shown in FIG. 11. The "Hct measurement process 2" (S14 in FIG. 15a) in FIG. 15a is the same as step S14 of Embodiment 3 shown in FIG. 14b. The Hct measurement process 1 (S6) further performed between the Hct measurement process 2 (S14) and the final glucose value correction & calculation (S8) is the same as the Hct measurement process (S6) in Embodiment 2 shown in FIG. 11.
[0628] In this case, in Step 4: Correction of Blood Component, the Hct values obtained in Step 2 performed twice, the Hct value obtained in Step 5, the current value that depends on Glu obtained in Step 3, and the Int value obtained in Step 6 am used to obtain a Glu value (S8, FIG. 15a). When such Step 6 is added, it is possible to capture the Int value of the blood of the entire capillary. Thus, it is possible to measure the Glu value with higher accuracy compared to the case where Step 6 is not added. Furthermore, Step 2 performed twice makes it possible to grasp the state of blood in the capillary more accurately, which can result in the effect that the Glu value can be measured with higher accuracy.
[0629] That is, in Embodiment 5, Step 1: Detection of Sample (Blood), Step 2: Hct Measurement Process, Step 3: Measurement of Apparent Glu Amount, Step 6: Int Measurement Process, and Step 5: Second Hct Measurement Process as well as additional Step 2: Hct Measurement Process and Step 4: Correction of Blood Component are performed in this order.
[0630] FIG. 18b shows an example of the relationship between applied voltage and voltage application time in Embodiment 5.
[0631] In FIG. 18b, the Hct measurement process in Step 2 is started at zero second after confirmation of the introduction of blood and is performed by applying a voltage, until 0.3 second thereafter, for 0.3 second. In this case, a voltage of 1.5 V is applied. Then, the voltage application for measuring the apparent Glu amount in Step 3 is performed twice. Specifically, a voltage of 0.35 V is applied for 1 second from 1 second to 2 seconds, and a voltage of 0.35 V is applied for 1 second from 3 seconds to 4 seconds. Then, in the Int measurement process in Step 6, a voltage of 1.0 V is applied for 1 second from 4.5 seconds to 5.5 seconds. Furthermore, in the second Hct measurement process in Step 5, a voltage of 2.5 V is applied for 0.5 second from 6 seconds to 6.5 seconds. Finally, in the second Hct measurement process in Step 2, a voltage of 1.5 V is applied for 0.5 second from 7 seconds to 7.5 seconds.
[0632] Next, examples of the method for measuring a component of a biological sample according to the present invention will be described with reference to the drawings. In FIGS. 20a to 127b, the curve of "0" denotes a curve in the case of a Hct value of 0%, the curve of "42" denotes a curve in the case of a Hct value of 42%, the curve of "70" denotes a curve in the case of a Hct value of 70%, the curve of "45" denotes a curve in the case of a Glu value of 45 mg/dl, and the curve of "550" denotes a curve in the case of a Glu value of 550 mg/dl.
Example 1
[0633] FIGS. 1, 2, and 3 show an example of a sensor for measuring a blood component that is used in the measuring method of the present invention. FIG. 1 is an exploded perspective view of the sensor, FIG. 2 is a sectional view, and FIG. 3 is a plan view. In the above-mentioned three drawings, the same parts are indicated with the same reference signs. As an example, this sensor is a sensor for measuring Glu as a blood component.
[0634] As shown in the drawings, in this sensor 1, two electrodes A and B are formed on an insulating substrate 101. The space between these electrodes is 100 to 1600 .mu.m and they can be switched between a working electrode and a counter electrode. The areas of the electrode A and the electrode B each are 0.055 to 1.1 mm.sup.2. The surfaces of the electrodes A and B are coated with a polymer material such as CMC. A reagent layer 11 is disposed so as to cover part of the electrodes A and B. The reagent layer 11 contains an oxidoreductase such as glucose dehydrogenase and a mediator such as phenanthrenequinone (9,10-phenanthrenequinone), 3-phenylimino-3H-phenothiazine, or potassium ferricyanide, as well as, as an optional component, an enzyme stabilizer, a crystal homogenizing agent, a polymer, etc. A cover 103 is disposed above the insulating substrate 101 with a spacer 102 interposed therebetween, with one end (the right end in the drawings) being left uncovered. In this sensor 1, in order to introduce blood to each electrode (A and B), a channel 14 is formed of the insulating substrate 101, the spacer 102, and the cover 103. The end of the channel 14 extends to the other end (the left end in the drawings) of the sensor 1 and is open to the outside to serve as a biological sample supply port 12. The two electrodes (A and B) are connected to leads, respectively, and these leads extend to the one end side (the right end in the drawings), and the end of each lead is exposed without being covered with the cover 103. The cover 103 has an air hole 13 formed in a portion corresponding to the right end of the channel 14.
[0635] In the present invention, the material for the insulating substrate 101 is polyethylene terephthalate. The size of the insulating substrate 101 is an overall length of 10 to 30 mm, a width of 3 to 10 mm, and a thickness of 0.1 to 0.6 mm. With respect to the material and the size of the insulating substrate, the same applies to Examples 2 to 93 described later.
[0636] The electrodes and leads on the insulating substrate were formed by using palladium as a material to form a conductive layer by a sputtering method and processing it into a specific electrode pattern with a laser. The laser used herein was a green laser. The distance between the working electrode and the counter electrode was set at 1000 .mu.m. This also applies to Examples 2 to 93 described later.
[0637] The reagent layer 11 is formed as follows. An aqueous solution containing 0.1 to 5 U/sensor of glucose dehydrogenase, 10 to 300 mM of phenanthrenequinone (9,10-phenanthrenequinone), 3-phenylimino-3H-phenothiazine, or potassium ferricyanide, 1 to 50 mM of maltitol, 20 to 200 mM of taurine, and 0.01 to 2% by weight of CMC is applied dropwise to a circular slit portion 20 (not shown in the drawings) and then is dried. With the slit portion 20 being provided, spreading of the aqueous solution applied dropwise can be suppressed, and the reagent layer 11 can be disposed at a more accurate position. Thus, the reagent layer 11 is formed so as to cover part of the electrode part formed of the electrode A and the electrode B. The above-mentioned drying was carried out using a dryer.
[0638] In the present invention, the material for the spacer 102 is the same as that used for the insulating substrate. The size of the spacer 102 is an overall length of 10 to 30 mm, a width of 3 to 10 mm, and a thickness of 0.05 to 0.25 mm. The spacer 102 of this example is formed with an I-shaped cutout portion that serves as a channel for blood introduction, and the size thereof is an overall length of 1.0 to 5.0 mm and a width of 0.5 to 2.0 mm. The cutout portion was formed using a mold. With respect to the material and size of the spacer 102 as well as the cutout portion, the same applies to Examples 2 to 93 described later.
[0639] In the present invention, the material for the cover 103 is the same as that used for the insulating substrate. The portion corresponding to the ceiling portion of the channel for introducing blood of the cover 103 was subjected to a hydrophilic treatment. The hydrophilic treatment was carried out by a method of applying a surfactant. The size of the cover 103 is an overall length of 15 to 30 mm, a width of 5 to 10 mm, and a thickness of 0.05 to 0.1 mm. The cover 103 has an air hole formed therein, and the shape thereof is circular. The size thereof is a maximum diameter of 0.1 to 2.0 mm. With respect to the material and size of the cover 103 as well as the air hole 13, the same applies to Examples 2 to 93 described later.
[0640] Furthermore, the sensor 1 was produced by stacking the insulating substrate, the spacer 102, and the cover 103 in this order to form one body. The three members are stuck together with a thermosetting adhesive to form one body. This also applies to Examples 2 to 108 described later.
[0641] Measurement of the blood component amount, for example, a blood glucose value using the sensor 1 is carried out as follows. Three types of blood samples having Hct values adjusted to 0%, 42%, and 70%, respectively, were prepared for two Glu concentrations, i.e., 45 mg/dL or 550 mg/dL. With respect to these six blood samples, a voltage of 1.5 V was applied with the sensor 1 between the electrode A and the electrode B for 0.1 second from 0 second to 0.1 second after detection of the introduction of a blood sample (see FIG. 19(a)). The current flowing between the working electrode and the counter electrode of each sensor was measured, and the response current value and the sensitivity difference were measured in the measurement of the Hct value (see FIGS. 20a to 20d). FIG. 20a is a graph showing the change with time in the response current value relative to the applied voltage with respect to each blood sample with a Glu concentration of 45 mg/dl (Hct value: 0%, 42%, and 70%) in Example 1. FIG. 20b is a graph showing the change with time in the response current value relative to the applied voltage with respect to each blood sample with a Glu concentration of 550 mg/dl (Hct value: 0%, 42%, and 70%) in Example 1. FIGS. 20a and 20b each are a graph showing the change with time in the response current value relative to the applied voltage in the case of applying a voltage of 1.5 V for 5 seconds between the electrode A and the electrode B that have the reagent disposed thereon. FIG. 20c is a graph showing the sensitivity difference (%) in each case of Glu values of 45 mg/dl and 550 mg/dl with reference to Hct 42% in Example 1. FIG. 20d is a graph showing the sensitivity difference (%) in each case of Hct values of 0%, 42%, and 70% with reference to Glu 45 mg/dl in Example 1. FIGS. 20c and 20d each are a graph showing the sensitivity difference in each case at 0 second to 0.1 second after the detection.
Example 2
[0642] The procedure was carried out in the same manner as in Example 1 except that voltage application was started at 0.05 second after detection of the introduction of a blood sample and a voltage of 1.5 V was applied between the electrode A and the electrode B, until 0.15 second, for 0.1 second (see FIG. 19 (b)). The current flowing between the working electrode and the counter electrode of each sensor 1 was measured, and the response current value and the sensitivity difference were measured in the measurement of the Hct value (see FIGS. 21a to 21d). FIG. 21a is a graph showing the change with time in the response current value relative to the applied voltage with respect to each blood sample with a Glu concentration of 45 mg/dl (Hct value: 0%, 42%, and 70%) in Example 2. FIG. 21b is a graph showing the change with time in the response current value relative to the applied voltage with respect to each blood sample with a Glu concentration of 550 mg/dl (Hct value: 0%, 42%, and 70%) in Example 2. FIGS. 21a and 21b each are a graph showing the change with time in the response current value relative to the applied voltage in the case of applying a voltage of 1.5 V for 5 seconds between the electrode A and the electrode B that have the reagent disposed thereon. FIG. 21c is a graph showing the sensitivity difference (%) in each case of Glu values of 45 mg/dl and 550 mg/dl with reference to Hct 42% in Example 2. FIG. 21d is a graph showing the sensitivity difference (%) in each case of Hct values of 0%, 42%, and 70% with reference to Glu 45 mg/dl in Example 2. FIGS. 21c and 21d each are a graph showing the sensitivity difference in each case at 0.05 second to 0.15 second after the detection.
Example 3
[0643] The procedure was carried out in the same manner as in Example 1 except that voltage application was started at 0.1 second after detection of the introduction of a blood sample and a voltage of 1.5 V was applied between the electrode A and the electrode B, until 0.2 second, for 0.1 second. The current flowing between the working electrode and the counter electrode of each sensor 1 was measured, and the response current value and the sensitivity difference were measured in the measurement of the Hct value (see FIGS. 22a to 22d). FIG. 22a is a graph showing the change with time in the response current value relative to the applied voltage with respect to each blood sample with a Glu concentration of 45 mg/dl (Hct value: 0%, 42%, and 70%) in Example 3. FIG. 22b is a graph showing the change with time in the response current value relative to the applied voltage with respect to each blood sample with a Glu concentration of 550 mg/dl (Hct value: 0%, 42%, and 70%) in Example 3. FIGS. 22a and 22b each are a graph showing the change with time in the response current value relative to the applied voltage in the case of applying a voltage of 1.5 V for 5 seconds between the electrode A and the electrode B that have the reagent disposed thereon. FIG. 22c is a graph showing the sensitivity difference (%) in each case of Glu values of 45 mg/dl and 550 mg/dl with reference to Hct 42% in Example 3. FIG. 22d is a graph showing the sensitivity difference (%) in each case of Hct values of 0%, 42%, and 70% with reference to Glu 45 mg/dl in Example 3. FIGS. 22c and 22d each are a graph showing the sensitivity difference in each case at 0.1 second to 0.2 second after the detection.
Example 4
[0644] The procedure was carried out in the same manner as in Example 1 except that voltage application was started at 0.5 second after detection of the introduction of a blood sample and a voltage of 1.5 V was applied between the electrode A and the electrode B, until 0.6 second, for 0.1 second. The current flowing between the working electrode and the counter electrode of each sensor 1 was measured, and the response current value and the sensitivity difference were measured in the measurement of the Hct value (see FIGS. 23a to 23d). FIG. 23a is a graph showing the change with time in the response current value relative to the applied voltage with respect to each blood sample with a Glu concentration of 45 mg/dl (Hct value: 0%, 42%, and 70%) in Example 4. FIG. 23b is a graph showing the change with time in the response current value relative to the applied voltage with respect to each blood sample with a Glu concentration of 550 mg/dl (Hct value: 0%, 42%, and 70%) in Example 4. FIGS. 23a and 23b each are a graph showing the change with time in the response current value relative to the applied voltage in the case of applying a voltage of 1.5 V for 5 seconds between the electrode A and the electrode B that have the reagent disposed thereon. FIG. 23c is a graph showing the sensitivity difference (%) in each case of Glu values of 45 mg/dl and 550 mg/dl with reference to Hct 42% in Example 4. FIG. 23d is a graph showing the sensitivity difference (%) in each case of Hct values of 0%, 42%, and 70% with reference to Glu 45 mg/dl in Example 4. FIGS. 23c and 23d each are a graph showing the sensitivity difference in each case at 0.5 second to 0.6 second after the detection.
Comparative Example 1
[0645] The procedure was carried out in the same manner as in Example 1 except that voltage application was started at 1 second after detection of the introduction of a blood sample and a voltage of 1.5 V was applied between the electrode A and the electrode B, until 1.1 seconds, for 0.1 second. The current flowing between the working electrode and the counter electrode of each sensor 1 was measured, and the response current value and the sensitivity difference were measured in the measurement of the Hct value (see FIGS. 24a to 24d). FIG. 24a is a graph showing the change with time in the response current value relative to the applied voltage with respect to each blood sample with a Glu concentration of 45 mg/dl (Hct value: 0%, 42%, and 70%) in Comparative Example 1. FIG. 24b is a graph showing the change with time in the response current value relative to the applied voltage with respect to each blood sample with a Glu concentration of 550 mg/dl (Hct value: 0%, 42%, and 70%) in Comparative Example 1. FIGS. 24a and 24b each are a graph showing the change with time in the response current value relative to the applied voltage in the case of applying a voltage of 1.5 V for 5 seconds between the electrode A and the electrode B that have the reagent disposed thereon. FIG. 24c is a graph showing the sensitivity difference (%) in each case of Glu values of 45 mg/dl and 550 mg/dl with reference to Hct 42%/o in Comparative Example 1. FIG. 24d is a graph showing the sensitivity difference (%) in each case of Hct values of 0%, 42%, and 70% with reference to Glu 45 mg/dl in Comparative Example 1. FIGS. 24c and 24d each are a graph showing the sensitivity difference in each case at 1 second to 1.1 seconds after the detection.
Comparative Example 2
[0646] The procedure was carried out in the same manner as in Example 1 except that voltage application was started at 2 seconds after detection of the introduction of a blood sample and a voltage of 1.5 V was applied between the electrode A and the electrode B, until 2.1 seconds, for 0.1 second. The current flowing between the working electrode and the counter electrode of each sensor 1 was measured, and the response current value and the sensitivity difference were measured in the measurement of the Hct value (see FIGS. 25a to 25d). FIG. 25a is a graph showing the change with time in the response current value relative to the applied voltage with respect to each blood sample with a Glu concentration of 45 mg/dl (Hct value: 0%, 42%, and 70%) in Comparative Example 2. FIG. 25b is a graph showing the change with time in the response current value relative to the applied voltage with respect to each blood sample with a Glu concentration of 550 mg/dl (Hct value: 0%, 42%, and 70%) in Comparative Example 2. FIGS. 25a and 25b each are a graph showing the change with time in the response current value relative to the applied voltage in the case of applying a voltage of 1.5 V for 5 seconds between the electrode A and the electrode B that have the reagent disposed thereon. FIG. 25c is a graph showing the sensitivity difference (%) in each case of Glu values of 45 mg/dl and 550 mg/dl with reference to Hct 42% in Comparative Example 2. FIG. 25d is a graph showing the sensitivity difference (%) in each case of Hct values of 0%, 42%, and 70% with reference to Glu 45 mg/dl in Comparative Example 2. FIGS. 25c and 25d each are a graph showing the sensitivity difference in each case at 2 seconds to 2.1 seconds after the detection.
[0647] From Examples 1 to 4 and Comparative Examples 1 and 2, it was confirmed that when a voltage of 1.5 V was applied for 0.1 second to the working electrode and the counter electrode within 0 second to 0.5 second after detection of the introduction of a biological sample, the current value obtained thereby had a high sensitivity and the Hct value obtained based on the current value had a high accuracy. The time from the start of blood introduction to the start of voltage application was changed between 0 and 2 seconds and the graphs showing the sensitivity difference were checked. As a result, it was found that the effect of the glucose concentration gradually increased as the time increased. Particularly, when the time until the start of voltage application was 2 seconds as in Comparative Example 2, a divergence was seen in the graph showing the sensitivity difference in each case of Hct values of 0%, 42%, and 70% particularly with reference to Glu 550 mg/dl as shown in FIG. 25d.
Example 5
[0648] The procedure was carried out in the same manner as in Example 1 except that a voltage of 2.0 V was applied between the electrode A and the electrode B for 0.1 second from 0 second to 0.1 second after detection of the introduction of a blood sample. The current flowing between the working electrode and the counter electrode of each sensor 1 was measured, and the response current value and the sensitivity difference were measured in the measurement of the Hct value (see FIGS. 26a to 26d). FIG. 26a is a graph showing the change with time in the response current value relative to the applied voltage with respect to each blood sample with a Glu concentration of 45 mg/dl (Hct value: 0%, 42%, and 70%) in Example 5. FIG. 26b is a graph showing the change with time in the response current value relative to the applied voltage with respect to each blood sample with a Glu concentration of 550 mg/dl (Hct value: 0%, 42%, and 70%) in Example 5. FIGS. 26a and 26b each are a graph showing the change with time in the response current value relative to the applied voltage in the case of applying a voltage of 2.0 V for 5 seconds between the electrode A and the electrode B that have the reagent disposed thereon. FIG. 26c is a graph showing the sensitivity difference (%) in each case of Glu values of 45 mg/dl and 550 mg/dl with reference to Hct 42% in Example 5. FIG. 26d is a graph showing the sensitivity difference (%) in each case of Hct values of 0%, 42%, and 70% with reference to Glu 45 mg/dl in Example 5. FIGS. 26c and 26d each are a graph showing the sensitivity difference in each case at 0 second to 0.1 second after the detection.
Example 6
[0649] The procedure was carried out in the same manner as in Example 5 except that voltage application was started at 0.05 second after detection of the introduction of a blood sample and a voltage of 2.0 V was applied between the electrode A and the electrode B, until 0.15 second, for 0.1 second. The current flowing between the working electrode and the counter electrode of each sensor 1 was measured, and the response current value and the sensitivity difference were measured in the measurement of the Hct value (see FIGS. 27a to 27d). FIG. 27a is a graph showing the change with time in the response current value relative to the applied voltage with respect to each blood sample with a Glu concentration of 45 mg/dl (Hct value: 0%, 42%, and 70%) in Example 6. FIG. 27b is a graph showing the change with time in the response current value relative to the applied voltage with respect to each blood sample with a Glu concentration of 550 mg/dl (Hct value: 0%, 42%, and 70%) in Example 6. FIGS. 27a and 27b each are a graph showing the change with time in the response current value relative to the applied voltage in the case of applying a voltage of 2.0 V for 5 seconds between the electrode A and the electrode B that have the reagent disposed thereon. FIG. 27c is a graph showing the sensitivity difference (%) in each case of Glu values of 45 mg/dl and 550 mg/dl with reference to Hct 42% in Example 6. FIG. 27d is a graph showing the sensitivity difference (%) in each case of Hct values of 0%, 42%, and 70% with reference to Glu 45 mg/dl in Example 6. FIGS. 27c and 27d each are a graph showing the sensitivity difference in each case at 0.05 second to 0.15 second after the detection.
Example 7
[0650] The procedure was carried out in the same manner as in Example 5 except that voltage application was started at 0.1 second after detection of the introduction of a blood sample and a voltage of 2.0 V was applied between the electrode A and the electrode B, until 0.2 second, for 0.1 second. The current flowing between the working electrode and the counter electrode of each sensor 1 was measured, and the response current value and the sensitivity difference were measured in the measurement of the Hct value (see FIGS. 28a to 28d). FIG. 28a is a graph showing the change with time in the response current value relative to the applied voltage with respect to each blood sample with a Glu concentration of 45 mg/dl (Hct value: 0%, 42%, and 70%) in Example 7. FIG. 28b is a graph showing the change with time in the response current value relative to the applied voltage with respect to each blood sample with a Glu concentration of 550 mg/dl (Hct value: 0%, 42%, and 70%) in Example 7. FIGS. 28a and 28b each are a graph showing the change with time in the response current value relative to the applied voltage in the case of applying a voltage of 2.0 V for 5 seconds between the electrode A and the electrode B that have the reagent disposed thereon. FIG. 28c is a graph showing the sensitivity difference (%) in each case of Glu values of 45 mg/dl and 550 mg/dl with reference to Hct 42% in Example 7. FIG. 28d is a graph showing the sensitivity difference (%) in each case of Hct values of 0%, 42%, and 70% with reference to Glu 45 mg/dl in Example 7. FIGS. 28c and 28d each are a graph showing the sensitivity difference in each case at 0.1 second to 0.2 second after the detection.
Example 8
[0651] The procedure was carried out in the same manner as in Example 5 except that voltage application was started at 0.5 second after detection of the introduction of a blood sample and a voltage of 2.0 V was applied between the electrode A and the electrode B, until 0.6 second, for 0.1 second. The current flowing between the working electrode and the counter electrode of each sensor 1 was measured, and the response current value and the sensitivity difference were measured in the measurement of the Hct value (see FIGS. 29a to 29d). FIG. 29a is a graph showing the change with time in the response current value relative to the applied voltage with respect to each blood sample with a Glu concentration of 45 mg/dl (Hct value: 0%, 42%, and 70%) in Example 8. FIG. 29b is a graph showing the change with time in the response current value relative to the applied voltage with respect to each blood sample with a Glu concentration of 550 mg/dl (Hct value: 0%, 42%, and 70%) in Example 8. FIGS. 29a and 29b each are a graph showing the change with time in the response current value relative to the applied voltage in the case of applying a voltage of 2.0 V for 5 seconds between the electrode A and the electrode B that have the reagent disposed thereon. FIG. 29c is a graph showing the sensitivity difference (%) in each case of Glu values of 45 mg/dl and 550 mg/dl with reference to Hct 42% in Example 8. FIG. 29d is a graph showing the sensitivity difference (%) in each case of Hct values of 0%, 42%, and 70% with reference to Glu 45 mg/dl in Example 8. FIGS. 29c and 29d each are a graph showing the sensitivity difference in each case at 0.5 second to 0.6 second after the detection.
Comparative Example 3
[0652] The procedure was carried out in the same manner as in Example 5 except that voltage application was started at 4 seconds after detection of the introduction of a blood sample and a voltage of 2.0 V was applied between the electrode A and the electrode B, until 4.1 seconds, for 0.1 second. The current flowing between the working electrode and the counter electrode of each sensor 1 was measured, and the response current value and the sensitivity difference were measured in the measurement of the Hct value (see FIGS. 33a to 33d). FIG. 33a is a graph showing the change with time in the response current value relative to the applied voltage with respect to each blood sample with a Glu concentration of 45 mg/dl (Hct value: 0%, 42%, and 70%) in Comparative Example 3. FIG. 33b is a graph showing the change with time in the response current value relative to the applied voltage with respect to each blood sample with a Glu concentration of 550 mg/dl (Hct value: 0%, 42%, and 70%) in Comparative Example 3. FIGS. 33a and 33b each are a graph showing the change with time in the response current value relative to the applied voltage in the case of applying a voltage of 2.0 V for 5 seconds between the electrode A and the electrode B that have the reagent disposed thereon. FIG. 33c is a graph showing the sensitivity difference (%) in each case of Glu values of 45 mg/dl and 550 mg/dl with reference to Hct 42% in Comparative Example 3. FIG. 33d is a graph showing the sensitivity difference (%) in each case of Hct values of 0%, 42%, and 70% with reference to Glu 45 mg/dl in Comparative Example 3. FIGS. 33c and 33d each are a graph showing the sensitivity difference in each case at 4 seconds to 4.1 seconds after the detection.
[0653] From Examples 5 to 8 and Comparative Example 3, it was confirmed that when a voltage of 2.0 V was applied for 0.1 second to the working electrode and the counter electrode within 0 second to 0.5 second after detection of the introduction of a biological sample, the current value obtained thereby had a high sensitivity and the Hct value obtained based on the current value had a high accuracy. The time from the start of blood introduction to the start of voltage application was changed between 0 and 4 seconds and the graphs showing the sensitivity difference were checked. As a result, it was found that the effect of the glucose concentration gradually increased as the time increased. Particularly, when the time until the start of voltage application was 4 seconds as in Comparative Example 3, a divergence was seen in the graph showing the sensitivity difference in each case of Hct values of 0%, 42%, and 70% particularly with reference to Glu 550 mg/dl as shown in FIG. 33d.
Example 9
[0654] The procedure was carried out in the same manner as in Example 1 except that a voltage of 2.5 V was applied between the electrode A and the electrode B for 0.1 second from 0 second to 0.1 second after detection of the introduction of a blood sample. The current flowing between the working electrode and the counter electrode of each sensor 1 was measured, and the response current value and the sensitivity difference were measured in the measurement of the Hct value (see FIGS. 31a to 31d). FIG. 31a is a graph showing the change with time in the response current value relative to the applied voltage with respect to each blood sample with a Glu concentration of 45 mg/dl (Hct value: 0%, 42%, and 70%) in Example 9. FIG. 31b is a graph showing the change with time in the response current value relative to the applied voltage with respect to each blood sample with a Glu concentration of 550 mg/dl (Hct value: 0%, 42%, and 70%) in Example 9. FIGS. 31a and 31b each are a graph showing the change with time in the response current value relative to the applied voltage in the case of applying a voltage of 2.5 V for 5 seconds between the electrode A and the electrode B that have the reagent disposed thereon. FIG. 31c is a graph showing the sensitivity difference (%) in each case of Glu values of 45 mg/dl and 550 mg/dl with reference to Hct 42% in Example 9. FIG. 31d is a graph showing the sensitivity difference (%) in each case of Hct values of 0%, 42%, and 70% with reference to Glu 45 mg/dl in Example 9. FIGS. 31c and 31d each are a graph showing the sensitivity difference in each case at 0 second to 0.1 second after the detection.
Example 10
[0655] The procedure was carried out in the same manner as in Example 9 except that voltage application was started at 0.05 second after detection of the introduction of a blood sample and a voltage of 2.5 V was applied between the electrode A and the electrode B, until 0.15 second, for 0.1 second. The current flowing between the working electrode and the counter electrode of each sensor 1 was measured, and the response current value and the sensitivity difference were measured in the measurement of the Hct value (see FIGS. 32a to 32d). FIG. 32a is a graph showing the change with time in the response current value relative to the applied voltage with respect to each blood sample with a Glu concentration of 45 mg/dl (Hct value: 0%, 42%, and 70%) in Example 10. FIG. 32b is a graph showing the change with time in the response current value relative to the applied voltage with respect to each blood sample with a Glu concentration of 550 mg/dl (Hct value: 0%, 42%, and 70%) in Example 10. FIGS. 32a and 32b each are a graph showing the change with time in the response current value relative to the applied voltage in the case of applying a voltage of 2.5 V for 5 seconds between the electrode A and the electrode B that have the reagent disposed thereon. FIG. 32c is a graph showing the sensitivity difference (%) in each case of Glu values of 45 mg/dl and 550 mg/dl with reference to Hct 42% in Example 10. FIG. 32d is a graph showing the sensitivity difference (%) in each case of Hct values of 0%, 42%, and 70% with reference to Glu 45 mg/dl in Example 10. FIGS. 32c and 32d each are a graph showing the sensitivity difference in each case at 0.05 second to 0.15 second after the detection.
Example 11
[0656] The procedure was carried out in the same manner as in Example 9 except that voltage application was started at 0.1 second after detection of the introduction of a blood sample and a voltage of 2.5 V was applied between the electrode A and the electrode B, until 0.2 second, for 0.1 second. The current flowing between the working electrode and the counter electrode of each sensor 1 was measured, and the response current value and the sensitivity difference were measured in the measurement of the Hct value (see FIGS. 33a to 33d). FIG. 33a is a graph showing the change with time in the response current value relative to the applied voltage with respect to each blood sample with a Glu concentration of 45 mg/dl (Hct value: 0%, 42%, and 70%) in Example 11. FIG. 33b is a graph showing the change with time in the response current value relative to the applied voltage with respect to each blood sample with a Glu concentration of 550 mg/dl (Hct value: 0%, 42%, and 70%) in Example 11. FIGS. 33a and 33b each are a graph showing the change with time in the response current value relative to the applied voltage in the case of applying a voltage of 2.5 V for 5 seconds between the electrode A and the electrode B that have the reagent disposed thereon. FIG. 33c is a graph showing the sensitivity difference (%) in each case of Glu values of 45 mg/dl and 550 mg/dl with reference to Hct 42% in Example 11. FIG. 33d is a graph showing the sensitivity difference (%) in each case of Hct values of 0%, 42%, and 70% with reference to Glu 45 mg/dl in Example 11. FIGS. 33c and 33d each are a graph showing the sensitivity difference in each case at 0.1 second to 0.2 second after the detection.
Example 12
[0657] The procedure was carried out in the same manner as in Example 9 except that voltage application was started at 0.5 second after detection of the introduction of a blood sample and a voltage of 2.5 V was applied between the electrode A and the electrode B, until 0.6 second, for 0.1 second. The current flowing between the working electrode and the counter electrode of each sensor 1 was measured, and the response current value and the sensitivity difference were measured in the measurement of the Hct value (see FIGS. 34a to 34d). FIG. 34a is a graph showing the change with time in the response current value relative to the applied voltage with respect to each blood sample with a Glu concentration of 45 mg/dl (Hct value: 0%, 42%, and 70%) in Example 12. FIG. 34b is a graph showing the change with time in the response current value relative to the applied voltage with respect to each blood sample with a Glu concentration of 550 mg/dl (Hct value: 0%, 42%, and 70%) in Example 12. FIGS. 34a and 34b each are a graph showing the change with time in the response current value relative to the applied voltage in the case of applying a voltage of 2.5 V for 5 seconds between the electrode A and the electrode B that have the reagent disposed thereon. FIG. 34c is a graph showing the sensitivity difference (%) in each case of Glu values of 45 mg/dl and 550 mg/dl with reference to Hct 42% in Example 12. FIG. 34d is a graph showing the sensitivity difference (%) in each case of Hct values of 0%, 42%, and 70% with reference to Glu 45 mg/dl in Example 12. FIGS. 34c and 34d each are a graph showing the sensitivity difference in each case at 0.5 second to 0.6 second after the detection.
[0658] From Examples 9 to 12, it was confirmed that when a voltage of 2.5 V was applied for 0.1 second to the working electrode and the counter electrode within 0 second to 0.5 second after detection of the introduction of a biological sample, the current value obtained thereby had a high sensitivity and the Hct value obtained based on the current value had a high accuracy.
[0659] Thus, according to the methods of the present invention, in Examples 1 to 12 in which a voltage was applied for 0.1 second from 0 second to 0.5 second after detection of the introduction of a blood sample, the divergence was small in the graphs of the sensitivity difference of Hct values of 0%, 42% and 70% regardless of the applied voltage, particularly with reference to Glu 550 mg/dl. Therefore, it was confirmed that the Hct measurement accuracy was improved. Furthermore, according to these methods of the present invention, it was also confirmed that Hct can be measured in a short time.
Example 13
[0660] Three types of blood samples having Hct values adjusted to 0%, 42%, and 70%, respectively, were prepared for two Glu concentrations, i.e., 45 mg/dl or 550 mg/dL. With respect to these six blood samples, a voltage of 1.5 V was applied for 0.1 second from 0 second to 0.1 second after detection of the introduction of a blood sample with the sensor 1 used in Example 1 (see FIG. 19 (a)). The current flowing between the working electrode and the counter electrode of each sensor 1 was measured, and the response current value and the sensitivity difference were measured in the measurement of the Hct value (see FIGS. 35a and 35b). FIG. 35a is a graph showing the sensitivity difference (%) in each case of Glu values of 45 mg/dl and 550 mg/dl with reference to Hct 42% in Example 13. FIG. 35b is a graph showing the sensitivity difference (%) in each case of Hct values of 0%, 42%, and 70% with reference to Glu 45 mg/dl in Example 13. FIGS. 35a and 35b each are a graph showing the sensitivity difference in each case at 0 second to 0.1 second after the detection.
Example 14
[0661] The procedure was carried out in the same manner as in Example 13 except that a voltage of 1.6 V was applied between the electrode A and the electrode B for 0.1 second from 0 second to 0.1 second after detection of the introduction of a blood sample. The current flowing between the working electrode and the counter electrode of each sensor 1 was measured, and the response current value and the sensitivity difference were measured in the measurement of the Hct value (see FIGS. 36a and 36b). FIG. 36a is a graph showing the sensitivity difference (%) in each case of Glu values of 45 mg/dl and 550 mg/dl with reference to Hct 42% in Example 14. FIG. 36b is a graph showing the sensitivity difference (%) in each case of Hct values of 0%, 42%, and 70% with reference to Glu 45 mg/dl in Example 14. FIGS. 36a and 36b each are a graph showing the sensitivity difference in each case at 0 second to 0.1 second after the detection.
Example 15
[0662] The procedure was carried out in the same manner as in Example 13 except that a voltage of 1.7 V was applied between the electrode A and the electrode B for 0.1 second from 0 second to 0.1 second after detection of the introduction of a blood sample. The current flowing between the working electrode and the counter electrode of each sensor 1 was measured, and the response current value and the sensitivity difference were measured in the measurement of the Hct value (see FIGS. 37a and 37b). FIG. 37a is a graph showing the sensitivity difference (%) in each case of Glu values of 45 mg/dl and 550 mg/dl with reference to Hct 42% in Example 15. FIG. 37b is a graph showing the sensitivity difference (%) in each case of Hct values of 0%, 42%, and 70% with reference to Glu 45 mg/dl in Example 15. FIGS. 37a and 37b each are a graph showing the sensitivity difference in each case at 0 second to 0.1 second after the detection.
Example 16
[0663] The procedure was carried out in the same manner as in Example 13 except that a voltage of 1.8 V was applied between the electrode A and the electrode B for 0.1 second from 0 second to 0.1 second after detection of the introduction of a blood sample. The current flowing between the working electrode and the counter electrode of each sensor 1 was measured, and the response current value and the sensitivity difference were measured in the measurement of the Hct value (see FIGS. 38a and 38b). FIG. 38a is a graph showing the sensitivity difference (%) in each case of Glu values of 45 mg/dl and 550 mg/dl with reference to Hct 42% in Example 16. FIG. 38b is a graph showing the sensitivity difference (%) in each case of Hct values of 0%, 42%, and 70% with reference to Glu 45 mg/dl in Example 16. FIGS. 38a and 38b each are a graph showing the sensitivity difference in each case at 0 second to 0.1 second after the detection.
Example 17
[0664] The procedure was carried out in the same manner as in Example 13 except that a voltage of 1.9 V was applied between the electrode A and the electrode B for 0.1 second from 0 second to 0.1 second after detection of the introduction of a blood sample. The current flowing between the working electrode and the counter electrode of each sensor 1 was measured, and the response current value and the sensitivity difference were measured in the measurement of the Hct value (see FIGS. 39a and 39b). FIG. 39a is a graph showing the sensitivity difference (%) in each case of Glu values of 45 mg/dl and 550 mg/dl with reference to Hct 42% in Example 17. FIG. 39b is a graph showing the sensitivity difference (%) in each case of Hct values of 0%, 42%, and 70% with reference to Glu 45 mg/dl in Example 17. FIGS. 39a and 39b each are a graph showing the sensitivity difference in each case at 0 second to 0.1 second after the detection.
Example 18
[0665] The procedure was carried out in the same manner as in Example 13 except that a voltage of 2.0 V was applied between the electrode A and the electrode B for 0.1 second from 0 second to 0.1 second after detection of the introduction of a blood sample. The current flowing between the working electrode and the counter electrode of each sensor 1 was measured, and the response current value and the sensitivity difference were measured in the measurement of the Hct value (see FIGS. 40a and 40b). FIG. 40a is a graph showing the sensitivity difference (%) in each case of Glu values of 45 mg/dl and 550 mg/dl with reference to Hct 42% in Example 18. FIG. 40b is a graph showing the sensitivity difference (%) in each case of Hct values of 0%, 42%, and 70% with reference to Glu 45 mg/dl in Example 18. FIGS. 40a and 40b each are a graph showing the sensitivity difference in each case at 0 second to 0.1 second after the detection.
Example 19
[0666] The procedure was carried out in the same manner as in Example 13 except that a voltage of 2.5 V was applied between the electrode A and the electrode B for 0.1 second from 0 second to 0.1 second after detection of the introduction of a blood sample. The current flowing between the working electrode and the counter electrode of each sensor 1 was measured, and the response current value and the sensitivity difference were measured in the measurement of the Hct value (see FIGS. 41a and 41b). FIG. 41a is a graph showing the sensitivity difference (%) in each case of Glu values of 45 mg/dl and 550 mg/dl with reference to Hct 42% in Example 19. FIG. 41b is a graph showing the sensitivity difference (%) in each case of Hct values of 0%, 42%, and 70% with reference to Glu 45 mg/dl in Example 19. FIGS. 41a and 41b each are a graph showing the sensitivity difference in each case at 0 second to 0.1 second after the detection.
Example 20
[0667] The procedure was carried out in the same manner as in Example 13 except that a voltage of 3.0 V was applied between the electrode A and the electrode B for 0.1 second from 0 second to 0.1 second after detection of the introduction of a blood sample. The current flowing between the working electrode and the counter electrode of each sensor 1 was measured, and the response current value and the sensitivity difference were measured in the measurement of the Hct value (see FIGS. 42a and 42b). FIG. 42a is a graph showing the sensitivity difference (%) in each case of Glu values of 45 mg/dl and 550 mg/dl with reference to Hct 42% in Example 20. FIG. 42b is a graph showing the sensitivity difference (%) in each case of Hct values of 0%, 42%, and 70% with reference to Glu 45 mg/dl in Example 20. FIGS. 42a and 42b each are a graph showing the sensitivity difference in each case at 0 second to 0.1 second after the detection.
Example 21
[0668] The procedure was carried out in the same manner as in Example 13 except that a voltage of 3.5 V was applied between the electrode A and the electrode B for 0.1 second from 0 second to 0.1 second after detection of the introduction of a blood sample. The current flowing between the working electrode and the counter electrode of each sensor 1 was measured, and the response current value and the sensitivity difference were measured in the measurement of the Hct value (see FIGS. 43a and 43b). FIG. 43a is a graph showing the sensitivity difference (%) in each case of Glu values of 45 mg/dl and 550 mg/dl with reference to Hct 42% in Example 21. FIG. 43b is a graph showing the sensitivity difference (%) in each case of Hct values of 0%, 42%, and 70% with reference to Glu 45 mg/dl in Example 21. FIGS. 43a and 43b each are a graph showing the sensitivity difference in each case at 0 second to 0.1 second after the detection.
Example 22
[0669] The procedure was carried out in the same manner as in Example 13 except that a voltage of 4.0 V was applied between the electrode A and the electrode B for 0.1 second from 0 second to 0.1 second after detection of the introduction of a blood sample. The current flowing between the working electrode and the counter electrode of each sensor 1 was measured, and the response current value and the sensitivity difference were measured in the measurement of the Hct value (see FIGS. 44a and 44b). FIG. 44a is a graph showing the sensitivity difference (%) in each case of Glu values of 45 mg/dl and 550 mg/dl with reference to Hct 42% in Example 22. FIG. 44b is a graph showing the sensitivity difference (%) in each case of Hct values of 0%, 42%, and 70% with reference to Glu 45 mg/dl in Example 22. FIGS. 44a and 44b each are a graph showing the sensitivity difference in each case at 0 second to 0.1 second after the detection.
[0670] From Examples 13 to 22, it was confirmed that when a voltage of 1.5 to 4.0 V was applied to the working electrode and the counter electrode for 0.1 second immediately (0 second) after detection of the introduction of a biological sample, the current value obtained thereby had a high sensitivity, and the Hct value obtained based on the current value had a high accuracy.
Example 23
[0671] A voltage of 1.5 V was applied between the electrode A and the electrode B for 0.5 second from 0 second to 0.5 second after detection of the introduction of a blood sample (see FIG. 19(a)). The current flowing between the working electrode and the counter electrode of each sensor 1 was measured, and the response current value and the sensitivity difference were measured in the measurement of the Hct value (see FIGS. 45a and 45b). FIG. 45a is a graph showing the sensitivity difference (%) in each case of Glu values of 45 mg/dl and 550 mg/dl with reference to Hct 42% in Example 23. FIG. 45b is a graph showing the sensitivity difference (%) in each case of Hct values of 0%, 42%, and 70% with reference to Glu 45 mg/dl in Example 23. FIGS. 45a and 45b each are a graph showing the sensitivity difference in each case at 0 second to 0.5 second after the detection.
Example 24
[0672] The procedure was carried out in the same manner as in Example 23 except that a voltage of 1.6 V was applied between the electrode A and the electrode B for 0.5 second from 0 second to 0.5 second after detection of the introduction of a blood sample. The current flowing between the working electrode and the counter electrode of each sensor 1 was measured, and the response current value and the sensitivity difference were measured in the measurement of the Hct value (see FIGS. 46a and 46b). FIG. 46a is a graph showing the sensitivity difference (%) in each case of Glu values of 45 mg/dl and 550 mg/dl with reference to Hct 42% in Example 24. FIG. 46b is a graph showing the sensitivity difference (%) in each case of Hct values of 0%, 42%, and 70% with reference to Glu 45 mg/dl in Example 24. FIGS. 46a and 46b each are a graph showing the sensitivity difference in each case at 0 second to 0.5 second after the detection.
Example 25
[0673] The procedure was carried out in the same manner as in Example 23 except that a voltage of 1.7 V was applied between the electrode A and the electrode B for 0.5 second from 0 second to 0.5 second after detection of the introduction of a blood sample. The current flowing between the working electrode and the counter electrode of each sensor 1 was measured, and the response current value and the sensitivity difference were measured in the measurement of the Hct value (see FIGS. 47a and 47b). FIG. 47a is a graph showing the sensitivity difference (%) in each case of Glu values of 45 mg/dl and 550 mg/dl with reference to Hct 42% in Example 25. FIG. 47b is a graph showing the sensitivity difference (%) in each case of Hct values of 0%, 42%, and 70% with reference to Glu 45 mg/dl in Example 25. FIGS. 47a and 47b each are a graph showing the sensitivity difference in each case at 0 second to 0.5 second after the detection.
Example 26
[0674] The procedure was carried out in the same manner as in Example 23 except that a voltage of 1.8 V was applied between the electrode A and the electrode B for 0.5 second from 0 second to 0.5 second after detection of the introduction of a blood sample. The current flowing between the working electrode and the counter electrode of each sensor 1 was measured, and the response current value and the sensitivity difference were measured in the measurement of the Hct value (see FIGS. 48a and 48b). FIG. 48a is a graph showing the sensitivity difference (%) in each case of Glu values of 45 mg/dl and 550 mg/dl with reference to Hct 42% in Example 26. FIG. 48b is a graph showing the sensitivity difference (%) in each case of Hct values of 0%, 42%, and 70% with reference to Glu 45 mg/dl in Example 26. FIGS. 48a and 48b each are a graph showing the sensitivity difference in each case at 0 second to 0.5 second after the detection.
Example 27
[0675] The procedure was carried out in the same manner as in Example 23 except that a voltage of 1.9 V was applied between the electrode A and the electrode B for 0.5 second from 0 second to 0.5 second after detection of the introduction of a blood sample. The current flowing between the working electrode and the counter electrode of each sensor 1 was measured, and the response current value and the sensitivity difference were measured in the measurement of the Hct value (see FIGS. 49a and 49b). FIG. 49a is a graph showing the sensitivity difference (%) in each case of Glu values of 45 mg/dl and 550 mg/dl with reference to Hct 42% in Example 27. FIG. 49b is a graph showing the sensitivity difference (%) in each case of Hct values of 0%, 42%, and 70% with reference to Glu 45 mg/dl in Example 27. FIGS. 49a and 49b each are a graph showing the sensitivity difference in each case at 0 second to 0.5 second after the detection.
Example 28
[0676] The procedure was carried out in the same manner as in Example 23 except that a voltage of 2.0 V was applied between the electrode A and the electrode B for 0.5 second from 0 second to 0.5 second after detection of the introduction of a blood sample. The current flowing between the working electrode and the counter electrode of each sensor 1 was measured, and the response current value and the sensitivity difference were measured in the measurement of the Hct value (see FIGS. 50a and 50b). FIG. 50a is a graph showing the sensitivity difference (%) in each case of Glu values of 45 mg/dl and 550 mg/dl with reference to Hct 42% in Example 28. FIG. 50b is a graph showing the sensitivity difference (%) in each case of Hct values of 0%, 42%, and 70% with reference to Glu 45 mg/dl in Example 28. FIGS. 50a and 50b each are a graph showing the sensitivity difference in each case at 0 second to 0.5 second after the detection.
Example 29
[0677] The procedure was carried out in the same manner as in Example 23 except that a voltage of 2.5 V was applied between the electrode A and the electrode B for 0.5 second from 0 second to 0.5 second after detection of the introduction of a blood sample. The current flowing between the working electrode and the counter electrode of each sensor 1 was measured, and the response current value and the sensitivity difference were measured in the measurement of the Hct value (see FIGS. 51a and 51b). FIG. 51a is a graph showing the sensitivity difference (%) in each case of Glu values of 45 mg/dl and 550 mg/dl with reference to Hct 42% in Example 29. FIG. 51b is a graph showing the sensitivity difference (%) in each case of Hct values of 0%, 42%, and 70% with reference to Glu 45 mg/dl in Example 29. FIGS. 51a and 51b each are a graph showing the sensitivity difference in each case at 0 second to 0.5 second after the detection.
Example 30
[0678] The procedure was carried out in the same manner as in Example 23 except that a voltage of 3.0 V was applied between the electrode A and the electrode B for 0.5 second from 0 second to 0.5 second after detection of the introduction of a blood sample. The current flowing between the working electrode and the counter electrode of each sensor 1 was measured, and the response current value and the sensitivity difference were measured in the measurement of the Hct value (see FIGS. 52a and 52b). FIG. 52a is a graph showing the sensitivity difference (%) in each case of Glu values of 45 mg/dl and 550 mg/dl with reference to Hct 42% in Example 30. FIG. 52b is a graph showing the sensitivity difference (%) in each case of Hct values of 0%, 42%, and 70% with reference to Glu 45 mg/dl in Example 30. FIGS. 52a and 52b each are a graph showing the sensitivity difference in each case at 0 second to 0.5 second after the detection.
Example 31
[0679] The procedure was carried out in the same manner as in Example 23 except that a voltage of 3.5 V was applied between the electrode A and the electrode B for 0.5 second from 0 second to 0.5 second after detection of the introduction of a blood sample. The current flowing between the working electrode and the counter electrode of each sensor 1 was measured, and the response current value and the sensitivity difference were measured in the measurement of the Hct value (see FIGS. 53a and 53b). FIG. 53a is a graph showing the sensitivity difference (%) in each case of Glu values of 45 mg/dl and 550 mg/dl with reference to Hct 42% in Example 31. FIG. 53b is a graph showing the sensitivity difference (%) in each case of Hct values of 0%, 42%, and 70% with reference to Glu 45 mg/dl in Example 31. FIGS. 53a and 53b each are a graph showing the sensitivity difference in each case at 0 second to 0.5 second after the detection.
Example 32
[0680] The procedure was carried out in the same manner as in Example 23 except that a voltage of 4.0 V was applied between the electrode A and the electrode B for 0.5 second from 0 second to 0.5 second after detection of the introduction of a blood sample. The current flowing between the working electrode and the counter electrode of each sensor 1 was measured, and the response current value and the sensitivity difference were measured in the measurement of the Hct value (see FIGS. 54a and 54b). FIG. 54a is a graph showing the sensitivity difference (%) in each case of Glu values of 45 mg/dl and 550 mg/dl with reference to Hct 42% in Example 32. FIG. 54b is a graph showing the sensitivity difference (%) in each case of Hct values of 0%, 42%, and 70% with reference to Glu 45 mg/dl in Example 32. FIGS. 54a and 54b each are a graph showing the sensitivity difference in each case at 0 second to 0.5 second after the detection.
[0681] From Examples 23 to 32, it was confirmed that when a voltage of 1.5 to 4.0 V was applied to the working electrode and the counter electrode for 0.5 second immediately (0 second) after detection of the introduction of a biological sample, the current value obtained thereby had a high sensitivity, and the Hct value obtained based on the current value had a high accuracy.
Comparative Example 4
[0682] A voltage of 2.0 V was applied between the electrode A and the electrode B for 1.0 second from 0 second to 1.0 second after detection of the introduction of a blood sample (see FIG. 19(a)). The current flowing between the working electrode and the counter electrode of each sensor 1 was measured, and the response current value and the sensitivity difference were measured in the measurement of the Hct value (see FIGS. 55a and 55b). FIG. 55a is a graph showing the sensitivity difference (%) in each case of Glu values of 45 mg/dl and 550 mg/dl with reference to Hct 42% in Comparative Example 4. FIG. 55b is a graph showing the sensitivity difference (%) in each case of Hct values of 0%, 42%, and 70% with reference to Glu 45 mg/dl in Comparative Example 4. FIGS. 55a and 55b each are a graph showing the sensitivity difference in each case at 0 second to 1.0 second after the detection.
Comparative Example 5
[0683] The procedure was carried out in the same manner as in Comparative Example 4 except that a voltage of 2.5 V was applied between the electrode A and the electrode B for 1.0 second from 0 second to 1.0 second after detection of the introduction of a blood sample. The current flowing between the working electrode and the counter electrode of each sensor was measured, and the response current value and the sensitivity difference were measured in the measurement of the Hct value (see FIGS. 56a and 56b). FIG. 56a is a graph showing the sensitivity difference (%) in each case of Glu values of 45 mg/dl and 550 mg/dl with reference to Hct 42% in Comparative Example 5. FIG. 56b is a graph showing the sensitivity difference (%) in each case of Hct values of 0%, 42%, and 70% with reference to Glu 45 mg/dl in Comparative Example 5. FIGS. 56a and 56b each are a graph showing the sensitivity difference in each case at 0 second to 1.0 second after the detection.
Comparative Example 6
[0684] The procedure was carried out in the same manner as in Comparative Example 4 except that a voltage of 3.0 V was applied between the electrode A and the electrode B for 1.0 second from 0 second to 1.0 second after detection of the introduction of a blood sample. The current flowing between the working electrode and the counter electrode of each sensor was measured, and the response current value and the sensitivity difference were measured in the measurement of the Hct value (see FIGS. 57a and 57b). FIG. 57a is a graph showing the sensitivity difference (%) in each case of Glu values of 45 mg/dl and 550 mg/dl with reference to Hct 42% in Comparative Example 6. FIG. 57b is a graph showing the sensitivity difference (%) in each case of Hct values of 0%, 42%, and 70% with reference to Glu 45 mg/dl in Comparative Example 6. FIGS. 57a and 57b each are a graph showing the sensitivity difference in each case at 0 second to 1.0 second after the detection.
[0685] From Comparative Examples 4 to 6, when the voltage application time was changed to 1.0 second after the start of blood introduction and then the graphs showing the sensitivity difference were checked, it was found that the effect of the glucose concentration increased. Particularly, as in Comparative Example 4, when the voltage application time was 1 second, a divergence was seen in the graph of the sensitivity difference of Hct values of 0%, 42% and 70% particularly with reference to Glu 550 mg/dl as shown in FIG. 55b.
Example 33
[0686] A voltage of 1.5 V was applied between the electrode A and the electrode B for 0.1 second from 0.05 second to 0.15 second after detection of the introduction of a blood sample (see FIG. 19(b)). The current flowing between the working electrode and the counter electrode of each sensor 1 was measured, and the response current value and the sensitivity difference were measured in the measurement of the Hct value (see FIGS. 58a to 58d). FIG. 58a is a graph showing the change with time in the response current value relative to the applied voltage with respect to each blood sample with a Glu concentration of 45 mg/dl (Hct value: 0%, 42%, and 70%) in Example 33. FIG. 58b is a graph showing the change with time in the response current value relative to the applied voltage with respect to each blood sample with a Glu concentration of 550 mg/dl (Hct value: 0%, 42%, and 70%) in Example 33. FIGS. 58a and 58b each are a graph showing the change with time in the response current value relative to the applied voltage in the case of applying a voltage of 1.5 V for 5 seconds between the electrode A and the electrode B that have the reagent disposed thereon. FIG. 58c is a graph showing the sensitivity difference (%) in each case of Glu values of 45 mg/dl and 550 mg/dl with reference to Hct 42% in Example 33. FIG. 58d is a graph showing the sensitivity difference (%) in each case of Hct values of 0%, 42%, and 70% with reference to Glu 45 mg/dl in Example 33. FIGS. 58c and 58d each are a graph showing the sensitivity difference in each case at 0.05 second to 0.15 second after the detection.
Example 34
[0687] The procedure was carried out in the same manner as in Example 33 except that a voltage of 1.6 V was applied between the electrode A and the electrode B for 0.1 second from 0.05 second to 0.15 second after detection of the introduction of a blood sample. The current flowing between the working electrode and the counter electrode of each sensor 1 was measured, and the response current value and the sensitivity difference were measured in the measurement of the Hct value (see FIGS. 59a to 59d). FIG. 59a is a graph showing the change with time in the response current value relative to the applied voltage with respect to each blood sample with a Glu concentration of 45 mg/dl (Hct value: 0%, 42%, and 70%) in Example 34. FIG. 59b is a graph showing the change with time in the response current value relative to the applied voltage with respect to each blood sample with a Glu concentration of 550 mg/dl (Hct value: 0%, 42%, and 70%) in Example 34. FIGS. 59a and 59b each are a graph showing the change with time in the response current value relative to the applied voltage in the case of applying a voltage of 1.6 V for 5 seconds between the electrode A and the electrode B that have the reagent disposed thereon. FIG. 59c is a graph showing the sensitivity difference (%) in each case of Glu values of 45 mg/dl and 550 mg/dl with reference to Hct 42% in Example 34. FIG. 59d is a graph showing the sensitivity difference (%) in each case of Hct values of 0%, 42%, and 70% with reference to Glu 45 mg/dl in Example 34. FIGS. 59c and 59d each are a graph showing the sensitivity difference in each case at 0.05 second to 0.15 second after the detection.
Example 35
[0688] The procedure was carried out in the same manner as in Example 33 except that a voltage of 1.7 V was applied between the electrode A and the electrode B for 0.1 second from 0.05 second to 0.15 second after detection of the introduction of a blood sample. The current flowing between the working electrode and the counter electrode of each sensor 1 was measured, and the response current value and the sensitivity difference were measured in the measurement of the Hct value (see FIGS. 60a to 60d). FIG. 60a is a graph showing the change with time in the response current value relative to the applied voltage with respect to each blood sample with a Glu concentration of 45 mg/dl (Hct value: 0%, 42%, and 70%) in Example 35. FIG. 60b is a graph showing the change with time in the response current value relative to the applied voltage with respect to each blood sample with a Glu concentration of 550 mg/dl (Hct value: 0%, 42%, and 70%) in Example 35. FIGS. 60a and 60b each are a graph showing the change with time in the response current value relative to the applied voltage in the case of applying a voltage of 1.7 V for 5 seconds between the electrode A and the electrode B that have the reagent disposed thereon. FIG. 60c is a graph showing the sensitivity difference (%) in each case of Glu values of 45 mg/dl and 550 mg/dl with reference to Hct 42% in Example 35. FIG. 60d is a graph showing the sensitivity difference (%) in each case of Hct values of 0%, 42%, and 70% with reference to Glu 45 mg/dl in Example 35. FIGS. 60c and 60d each are a graph showing the sensitivity difference in each case at 0.05 second to 0.15 second after the detection.
Example 36
[0689] The procedure was carried out in the same manner as in Example 33 except that a voltage of 1.8 V was applied between the electrode A and the electrode B for 0.1 second from 0.05 second to 0.15 second after detection of the introduction of a blood sample. The current flowing between the working electrode and the counter electrode of each sensor 1 was measured, and the response current value and the sensitivity difference were measured in the measurement of the Hct value (see FIGS. 61a to 61d). FIG. 61a is a graph showing the change with time in the response current value relative to the applied voltage with respect to each blood sample with a Glu concentration of 45 mg/dl (Hct value: 0%, 42%, and 70%) in Example 36. FIG. 61b is a graph showing the change with time in the response current value relative to the applied voltage with respect to each blood sample with a Glu concentration of 550 mg/dl (Hct value: 0%, 42%, and 70%) in Example 36. FIGS. 61a and 61b each are a graph showing the change with time in the response current value relative to the applied voltage in the case of applying a voltage of 1.8 V for 5 seconds between the electrode A and the electrode B that have the reagent disposed thereon. FIG. 61c is a graph showing the sensitivity difference (%) in each case of Glu values of 45 mg/dl and 550 mg/dl with reference to Hct 42% in Example 36. FIG. 61d is a graph showing the sensitivity difference (%) in each case of Hct values of 0%, 42%, and 70% with reference to Glu 45 mg/dl in Example 36. FIGS. 61c and 61d each are a graph showing the sensitivity difference in each case at 0.05 second to 0.15 second after the detection.
Example 37
[0690] The procedure was carried out in the same manner as in Example 33 except that a voltage of 1.9 V was applied between the electrode A and the electrode B for 0.1 second from 0.05 second to 0.15 second after detection of the introduction of a blood sample. The current flowing between the working electrode and the counter electrode of each sensor 1 was measured, and the response current value and the sensitivity difference were measured in the measurement of the Hct value (see FIGS. 62a to 62d). FIG. 62a is a graph showing the change with time in the response current value relative to the applied voltage with respect to each blood sample with a Glu concentration of 45 mg/dl (Hct value: 0%, 42%, and 70%) in Example 37. FIG. 62b is a graph showing the change with time in the response current value relative to the applied voltage with respect to each blood sample with a Glu concentration of 550 mg/dl (Hct value: 0%, 42%, and 70%) in Example 37. FIGS. 62a and 62b each are a graph showing the change with time in the response current value relative to the applied voltage in the case of applying a voltage of 1.9 V for 5 seconds between the electrode A and the electrode B that have the reagent disposed thereon. FIG. 62c is a graph showing the sensitivity difference (%) in each case of Glu values of 45 mg/dl and 550 mg/dl with reference to Hct 42% in Example 37. FIG. 62d is a graph showing the sensitivity difference (%) in each case of Hct values of 0%, 42%, and 70% with reference to Glu 45 mg/dl in Example 37. FIGS. 62c and 62d each are a graph showing the sensitivity difference in each case at 0.05 second to 0.15 second after the detection.
Example 38
[0691] The procedure was carried out in the same manner as in Example 33 except that a voltage of 2.0 V was applied between the electrode A and the electrode B for 0.1 second from 0.05 second to 0.15 second after detection of the introduction of a blood sample. The current flowing between the working electrode and the counter electrode of each sensor 1 was measured, and the response current value and the sensitivity difference were measured in the measurement of the Hct value (see FIGS. 63a to 63d). FIG. 63a is a graph showing the change with time in the response current value relative to the applied voltage with respect to each blood sample with a Glu concentration of 45 mg/dl (Hct value: 0%, 42%, and 70%) in Example 38. FIG. 63b is a graph showing the change with time in the response current value relative to the applied voltage with respect to each blood sample with a Glu concentration of 550 mg/dl (Hct value: 0%, 42%, and 70%) in Example 38. FIGS. 63a and 63b each are a graph showing the change with time in the response current value relative to the applied voltage in the case of applying a voltage of 2.0 V for 5 seconds between the electrode A and the electrode B that have the reagent disposed thereon. FIG. 63c is a graph showing the sensitivity difference (%) in each case of Glu values of 45 mg/dl and 550 mg/dl with reference to Hct 42% in Example 38. FIG. 63d is a graph showing the sensitivity difference (%) in each case of Hct values of 0%, 42%, and 70% with reference to Glu 45 mg/dl in Example 38. FIGS. 63c and 63d each are a graph showing the sensitivity difference in each case at 0.05 second to 0.15 second after the detection.
Example 39
[0692] The procedure was carried out in the same manner as in Example 33 except that a voltage of 2.5 V was applied between the electrode A and the electrode B for 0.1 second from 0.05 second to 0.15 second after detection of the introduction of a blood sample. The current flowing between the working electrode and the counter electrode of each sensor 1 was measured, and the response current value and the sensitivity difference were measured in the measurement of the Hct value (see FIGS. 64a to 64d). FIG. 64a is a graph showing the change with time in the response current value relative to the applied voltage with respect to each blood sample with a Glu concentration of 45 mg/dl (Hct value: 0%, 42%, and 70%) in Example 39. FIG. 64b is a graph showing the change with time in the response current value relative to the applied voltage with respect to each blood sample with a Glu concentration of 550 mg/dl (Hct value: 0%, 42%, and 70%) in Example 39. FIGS. 64a and 64b each are a graph showing the change with time in the response current value relative to the applied voltage in the case of applying a voltage of 2.5 V for 5 seconds between the electrode A and the electrode B that have the reagent disposed thereon. FIG. 64c is a graph showing the sensitivity difference (%) in each case of Glu values of 45 mg/dl and 550 mg/dl with reference to Hct 42% in Example 39. FIG. 64d is a graph showing the sensitivity difference (%) in each case of Hct values of 0%, 42%, and 70% with reference to Glu 45 mg/dl in Example 39. FIGS. 64c and 64d each are a graph showing the sensitivity difference in each case at 0.05 second to 0.15 second after the detection.
Example 40
[0693] The procedure was carried out in the same manner as in Example 33 except that a voltage of 3.0 V was applied between the electrode A and the electrode B for 0.1 second from 0.05 second to 0.15 second after detection of the introduction of a blood sample. The current flowing between the working electrode and the counter electrode of each sensor 1 was measured, and the response current value and the sensitivity difference were measured in the measurement of the Hct value (see FIGS. 65a to 65d). FIG. 65a is a graph showing the change with time in the response current value relative to the applied voltage with respect to each blood sample with a Glu concentration of 45 mg/dl (Hct value: 0%, 42%, and 70%) in Example 40. FIG. 65b is a graph showing the change with time in the response current value relative to the applied voltage with respect to each blood sample with a Glu concentration of 550 mg/dl (Hct value: 0%, 42%, and 70%) in Example 40. FIGS. 65a and 65b each are a graph showing the change with time in the response current value relative to the applied voltage in the case of applying a voltage of 3.0 V for 5 seconds between the electrode A and the electrode B that have the reagent disposed thereon. FIG. 65c is a graph showing the sensitivity difference (%) in each case of Glu values of 45 mg/dl and 550 mg/dl with reference to Hct 42% in Example 40. FIG. 65d is a graph showing the sensitivity difference (%) in each case of Hct values of 0%, 42%, and 70% with reference to Glu 45 mg/dl in Example 40. FIGS. 65c and 65d each are a graph showing the sensitivity difference in each case at 0.05 second to 0.15 second after the detection.
Example 41
[0694] The procedure was carried out in the same manner as in Example 33 except that a voltage of 3.5 V was applied between the electrode A and the electrode B for 0.1 second from 0.05 second to 0.15 second after detection of the introduction of a blood sample. The current flowing between the working electrode and the counter electrode of each sensor 1 was measured, and the response current value and the sensitivity difference were measured in the measurement of the Hct value (see FIGS. 66a to 66d). FIG. 66a is a graph showing the change with time in the response current value relative to the applied voltage with respect to each blood sample with a Glu concentration of 45 mg/dl (Hct value: 0%, 42%, and 70%) in Example 41. FIG. 66b is a graph showing the change with time in the response current value relative to the applied voltage with respect to each blood sample with a Glu concentration of 550 mg/dl (Hct value: 0%, 42%, and 70%) in Example 41. FIGS. 66a and 66b each are a graph showing the change with time in the response current value relative to the applied voltage in the case of applying a voltage of 3.5 V for 5 seconds between the electrode A and the electrode B that have the reagent disposed thereon. FIG. 66c is a graph showing the sensitivity difference (%) in each case of Glu values of 45 mg/dl and 550 mg/dl with reference to Hct 42% in Example 41. FIG. 66d is a graph showing the sensitivity difference (%) in each case of Hct values of 0%, 42%, and 70% with reference to Glu 45 mg/dl in Example 41. FIGS. 66c and 66d each are a graph showing the sensitivity difference in each case at 0.05 second to 0.15 second after the detection.
Example 42
[0695] The procedure was carried out in the same manner as in Example 33 except that a voltage of 4.0 V was applied between the electrode A and the electrode B for 0.1 second from 0.05 second to 0.15 second after detection of the introduction of a blood sample. The current flowing between the working electrode and the counter electrode of each sensor 1 was measured, and the response current value and the sensitivity difference were measured in the measurement of the Hct value (see FIGS. 67a to 67d). FIG. 67a is a graph showing the change with time in the response current value relative to the applied voltage with respect to each blood sample with a Glu concentration of 45 mg/dl (Hct value: 0%, 42%, and 70%) in Example 42. FIG. 67b is a graph showing the change with time in the response current value relative to the applied voltage with respect to each blood sample with a Glu concentration of 550 mg/dl (Hct value: 0%, 42%, and 70%) in Example 42. FIGS. 67a and 67b each are a graph showing the change with time in the response current value relative to the applied voltage in the case of applying a voltage of 4.0 V for 5 seconds between the electrode A and the electrode B that have the reagent disposed thereon. FIG. 67c is a graph showing the sensitivity difference (%) in each case of Glu values of 45 mg/dl and 550 mg/dl with reference to Hct 42% in Example 42. FIG. 67d is a graph showing the sensitivity difference (%) in each case of Hct values of 0%, 42%, and 70% with reference to Glu 45 mg/dl in Example 42. FIGS. 67c and 67d each are a graph showing the sensitivity difference in each case at 0.05 second to 0.15 second after the detection.
[0696] From Examples 33 to 42, it was confirmed that when a voltage of 1.5 to 4.0 V was applied to the working electrode and the counter electrode for 0.05 second to 0.15 second after detection of the introduction of a biological sample, the current value obtained thereby had a high sensitivity and the Hct value obtained based on the current value had a high accuracy.
Example 43
[0697] A voltage of 1.5 V was applied between the electrode A and the electrode B for 0.5 second from 0.05 second to 0.55 second after detection of the introduction of a blood sample (see FIG. 19(b)). The current flowing between the working electrode and the counter electrode of each sensor 1 was measured, and the response current value and the sensitivity difference were measured in the measurement of the Hct value (see FIGS. 68a and 68b). FIG. 68a is a graph showing the sensitivity difference (%) in each case of Glu values of 45 mg/dl and 550 mg/dl with reference to Hct 42% in Example 43. FIG. 68b is a graph showing the sensitivity difference (%) in each case of Hct values of 0%, 42%, and 70% with reference to Glu 45 mg/dl in Example 43. FIGS. 68a and 68b each are a graph showing the sensitivity difference in each case at 0.05 second to 0.55 second after the detection.
Example 44
[0698] The procedure was carried out in the same manner as in Example 43 except that a voltage of 1.6 V was applied between the electrode A and the electrode B for 0.5 second from 0.05 second to 0.55 second after detection of the introduction of a blood sample. The current flowing between the working electrode and the counter electrode of each sensor 1 was measured, and the response current value and the sensitivity difference were measured in the measurement of the Hct value (see FIGS. 69a and 69b). FIG. 69a is a graph showing the sensitivity difference (%) in each case of Glu values of 45 mg/dl and 550 mg/dl with reference to Hct 42% in Example 44. FIG. 69b is a graph showing the sensitivity difference (%) in each case of Hct values of 0%, 42%, and 70% with reference to Glu 45 mg/dl in Example 44. FIGS. 69a and 69b each are a graph showing the sensitivity difference in each case at 0.05 second to 0.55 second after the detection.
Example 45
[0699] The procedure was carried out in the same manner as in Example 43 except that a voltage of 1.7 V was applied between the electrode A and the electrode B for 0.5 second from 0.05 second to 0.55 second after detection of the introduction of a blood sample. The current flowing between the working electrode and the counter electrode of each sensor 1 was measured, and the response current value and the sensitivity difference were measured in the measurement of the Hct value (see FIGS. 70a and 70b). FIG. 70a is a graph showing the sensitivity difference (%) in each case of Glu values of 45 mg/dl and 550 mg/dl with reference to Hct 42% in Example 45. FIG. 70b is a graph showing the sensitivity difference (%) in each case of Hct values of 0%, 42%, and 70% with reference to Glu 45 mg/dl in Example 45. FIGS. 70a and 70b each are a graph showing the sensitivity difference in each case at 0.05 second to 0.55 second after the detection.
Example 46
[0700] The procedure was carried out in the same manner as in Example 43 except that a voltage of 1.8 V was applied between the electrode A and the electrode B for 0.5 second from 0.05 second to 0.55 second after detection of the introduction of a blood sample. The current flowing between the working electrode and the counter electrode of each sensor 1 was measured, and the response current value and the sensitivity difference were measured in the measurement of the Hct value (see FIGS. 71a and 71b). FIG. 71a is a graph showing the sensitivity difference (%) in each case of Glu values of 45 mg/dl and 550 mg/dl with reference to Hct 42% in Example 46. FIG. 71b is a graph showing the sensitivity difference (%) in each case of Hct values of 0%, 42%, and 70% with reference to Glu 45 mg/dl in Example 46. FIGS. 71a and 71b each are a graph showing the sensitivity difference in each case at 0.05 second to 0.55 second after the detection.
Example 47
[0701] The procedure was carried out in the same manner as in Example 43 except that a voltage of 1.9 V was applied between the electrode A and the electrode B for 0.5 second from 0.05 second to 0.55 second after detection of the introduction of a blood sample. The current flowing between the working electrode and the counter electrode of each sensor 1 was measured, and the response current value and the sensitivity difference were measured in the measurement of the Hct value (see FIGS. 72a and 72b). FIG. 72a is a graph showing the sensitivity difference (%) in each case of Glu values of 45 mg/dl and 550 mg/dl with reference to Hct 42% in Example 47. FIG. 72b is a graph showing the sensitivity difference (%) in each case of Hct values of 0%, 42%, and 70% with reference to Glu 45 mg/dl in Example 47. FIGS. 72a and 72b each are a graph showing the sensitivity difference in each case at 0.05 second to 0.55 second after the detection.
Example 48
[0702] The procedure was carried out in the same manner as in Example 43 except that a voltage of 2.0 V was applied between the electrode A and the electrode B for 0.5 second from 0.05 second to 0.55 second after detection of the introduction of a blood sample. The current flowing between the working electrode and the counter electrode of each sensor 1 was measured, and the response current value and the sensitivity difference were measured in the measurement of the Hct value (see FIGS. 73a and 73b). FIG. 73a is a graph showing the sensitivity difference (%) in each case of Glu values of 45 mg/dl and 550 mg/dl with reference to Hct 42% in Example 48. FIG. 73b is a graph showing the sensitivity difference (%) in each case of Hct values of 0%, 42%, and 70% with reference to Glu 45 mg/dl in Example 48. FIGS. 73a and 73b each are a graph showing the sensitivity difference in each case at 0.05 second to 0.55 second after the detection.
Example 49
[0703] The procedure was carried out in the same manner as in Example 43 except that a voltage of 2.5 V was applied between the electrode A and the electrode B for 0.5 second from 0.05 second to 0.55 second after detection of the introduction of a blood sample. The current flowing between the working electrode and the counter electrode of each sensor 1 was measured, and the response current value and the sensitivity difference were measured in the measurement of the Hct value (see FIGS. 74a and 74b). FIG. 74a is a graph showing the sensitivity difference (%) in each case of Glu values of 45 mg/dl and 550 mg/dl with reference to Hct 42% in Example 49. FIG. 74b is a graph showing the sensitivity difference (%) in each case of Hct values of 0%, 42%, and 70% with reference to Glu 45 mg/dl in Example 49. FIGS. 74a and 74b each are a graph showing the sensitivity difference in each case at 0.05 second to 0.55 second after the detection.
Example 50
[0704] The procedure was carried out in the same manner as in Example 43 except that a voltage of 3.0 V was applied between the electrode A and the electrode B for 0.5 second from 0.05 second to 0.55 second after detection of the introduction of a blood sample. The current flowing between the working electrode and the counter electrode of each sensor 1 was measured, and the response current value and the sensitivity difference were measured in the measurement of the Hct value (see FIGS. 75a and 75b). FIG. 75a is a graph showing the sensitivity difference (%) in each case of Glu values of 45 mg/dl and 550 mg/dl with reference to Hct 42% in Example 50. FIG. 75b is a graph showing the sensitivity difference (%) in each case of Hct values of 0%, 42%, and 70% with reference to Glu 45 mg/dl in Example 50. FIGS. 75a and 75b each are a graph showing the sensitivity difference in each case at 0.05 second to 0.55 second after the detection.
Example 51
[0705] The procedure was carried out in the same manner as in Example 43 except that a voltage of 3.5 V was applied between the electrode A and the electrode B for 0.5 second from 0.05 second to 0.55 second after detection of the introduction of a blood sample. The current flowing between the working electrode and the counter electrode of each sensor 1 was measured, and the response current value and the sensitivity difference were measured in the measurement of the Hct value (see FIGS. 76a and 76b). FIG. 76a is a graph showing the sensitivity difference (%) in each case of Glu values of 45 mg/dl and 550 mg/dl with reference to Hct 42% in Example 51. FIG. 76b is a graph showing the sensitivity difference (%) in each case of Hct values of 0%, 42%, and 70% with reference to Glu 45 mg/dl in Example 51. FIGS. 76a and 76b each are a graph showing the sensitivity difference in each case at 0.05 second to 0.55 second after the detection.
Example 52
[0706] The procedure was carried out in the same manner as in Example 43 except that a voltage of 4.0 V was applied between the electrode A and the electrode B for 0.5 second from 0.05 second to 0.55 second after detection of the introduction of a blood sample. The current flowing between the working electrode and the counter electrode of each sensor 1 was measured, and the response current value and the sensitivity difference were measured in the measurement of the Hct value (see FIGS. 77a and 77b). FIG. 77a is a graph showing the sensitivity difference (%) in each case of Glu values of 45 mg/dl and 550 mg/dl with reference to Hct 42% in Example 52. FIG. 77b is a graph showing the sensitivity difference (%) in each case of Hct values of 0%, 42%, and 70% with reference to Glu 45 mg/dl in Example 52. FIGS. 77a and 77b each are a graph showing the sensitivity difference in each case at 0.05 second to 0.55 second after the detection.
[0707] From Examples 43 to 52, it was confirmed that when a voltage of 1.5 to 4.0 V was applied to the working electrode and the counter electrode for 0.5 second at 0.05 second after detection of the introduction of a biological sample, the current value obtained thereby had a high sensitivity, and the Hct value obtained based on the current value had a high accuracy.
Comparative Example 7
[0708] A voltage of 2.5 V was applied between the electrode A and the electrode B for 1.0 second from 0.05 second to 1.05 seconds after detection of the introduction of a blood sample (see FIG. 19(b)). The current flowing between the working electrode and the counter electrode of each sensor 1 was measured, and the response current value and the sensitivity difference were measured in the measurement of the Hct value (see FIGS. 78a and 78b). FIG. 78a is a graph showing the sensitivity difference (%) in each case of Glu values of 45 mg/dl and 550 mg/dl with reference to Hct 42% in Comparative Example 7. FIG. 78b is a graph showing the sensitivity difference (%) in each case of Hct values of 0%, 42%, and 70% with reference to Glu 45 mg/dl in Comparative Example 7. FIGS. 78a and 78b each are a graph showing the sensitivity difference in each case at 0.05 second to 1.05 seconds after the detection.
Comparative Example 8
[0709] The procedure was carried out in the same manner as in Comparative Example 7 except that a voltage of 3.0 V was applied between the electrode A and the electrode B for 1.0 second from 0.05 second to 1.05 seconds after detection of the introduction of a blood sample. The current flowing between the working electrode and the counter electrode of each sensor 1 was measured, and the response current value and the sensitivity difference were measured in the measurement of the Hct value (see FIGS. 79a and 79b). FIG. 79a is a graph showing the sensitivity difference (%) in each case of Glu values of 45 mg/dl and 550 mg/dl with reference to Hct 42% in Comparative Example 8. FIG. 79b is a graph showing the sensitivity difference (%) in each case of Hct values of 0%, 42%, and 70% with reference to Glu 45 mg/dl in Comparative Example 8. FIGS. 79a and 79b each are a graph showing the sensitivity difference in each case at 0.05 second to 1.05 seconds after the detection.
[0710] From Comparative Examples 7 and 8, the voltage application time after the start of blood introduction was changed to 1 second and the graph showing the sensitivity difference was checked. As a result, it was found that the effect of the glucose concentration gradually increased as the time increased. Particularly, when the voltage application time was 1 second as in Comparative Example 7, a divergence was seen in the graph showing the sensitivity difference in each case of Hct values of 0%, 42%, and 70% particularly with reference to Glu 550 mg/dl as shown in FIG. 78b.
[0711] According to the method of the present invention, the sensitivity difference (%) in Examples 33 to 52 in which the applied voltage was 1.5 V to 2.0 V was small as compared with Comparative Examples 7 and 8. Therefore, it was confirmed that the Hct measurement accuracy was improved. Furthermore, it was also confirmed that Hct can be measured in a short time according to these methods of the present invention.
[0712] Furthermore, it was confirmed that an effect similar to that described above was obtained in Examples 39 to 42 and Examples 49 to 52 if the voltage application time was less than 1.0 second also at an applied voltage of 2.5 V to 4.0 V.
Example 53
[0713] A biosensor (first biosensor) was produced in the same manner as in Example 1 except that the plan view of FIG. 4 was followed instead of the plan view of FIG. 3. A voltage of 1.5 V was applied between the electrode A and the electrode B for 0.1 second from 0 second to 0.1 second after detection of the introduction of a blood sample (see FIG. 80(a)). Next, a voltage of 0.1 to 1.0 V was applied multiple times between the electrode A and the electrode B from 0.1 second to 7.0 seconds after the detection of the introduction of a blood sample (see FIG. 80(a), voltage application for Glu). Finally, then, a voltage of 2.5 V was applied between the electrode C and the electrode A from 7.1 seconds to 7.5 seconds after the detection of the introduction of a blood sample (see FIG. 80(a), voltage application for the second Hct). The current flowing between the working electrode and the counter electrode of each sensor 1 was measured, and the response current value and the sensitivity difference were measured in the measurement of the Hct value. FIG. 81a is a graph showing the sensitivity difference (%) in each case of Glu values of 45 mg/dl and 550 mg/dl with reference to Hct 42% in Example 53. FIG. 81b is a graph showing the sensitivity difference (%) in each case of Hct values of 0%, 42%, and 70% with reference to Glu 45 mg/dl in Example 53. FIGS. 81a and 81b each are a graph showing the sensitivity difference in each case at 0 second to 0.1 second after the detection.
Example 54
[0714] The procedure was carried out in the same manner as in Example 53 except that a voltage of 1.5 V was applied between the electrode A and the electrode B for 0.2 second from 0 second to 0.2 second after detection of the introduction of a blood sample, then a voltage of 0.1 to 1.0 V was applied multiple times between the electrode A and the electrode B from 0.2 second to 7.0 seconds after the detection of the introduction of a blood sample, and finally a voltage of 2.5 V was applied between the electrode C and the electrode A from 7.1 seconds to 7.5 seconds after the detection of the introduction of a blood sample. The current flowing between the working electrode and the counter electrode of each sensor 1 was measured, and the response current value and the sensitivity difference were measured in the measurement of the Hct value (see FIGS. 82a and 82b). FIG. 82a is a graph showing the sensitivity difference (%) in each case of Glu values of 45 mg/dl and 550 mg/dl with reference to Hct 42% in Example 54. FIG. 82b is a graph showing the sensitivity difference (%) in each case of Hct values of 0%, 42%, and 70% with reference to Glu 45 mg/dl in Example 54. FIGS. 82a and 82b each are a graph showing the sensitivity difference in each case at 0 second to 0.2 second after the detection.
Example 55
[0715] The procedure was carried out in the same manner as in Example 53 except that a voltage of 1.5 V was applied between the electrode A and the electrode B for 0.3 second from 0 second to 0.3 second after detection of the introduction of a blood sample, then a voltage of 0.1 to 1.0 V was applied multiple times between the electrode A and the electrode B from 0.3 second to 7.0 seconds after the detection of the introduction of a blood sample, and finally a voltage of 2.5 V was applied between the electrode C and the electrode A from 7.1 seconds to 7.5 seconds after the detection of the introduction of a blood sample. The current flowing between the working electrode and the counter electrode of each sensor 1 was measured, and the response current value and the sensitivity difference were measured in the measurement of the Hct value (see FIGS. 83a and 83b). FIG. 83a is a graph showing the sensitivity difference (%) in each case of Glu values of 45 mg/dl and 550 mg/dl with reference to Hct 42% in Example 55. FIG. 83b is a graph showing the sensitivity difference (%) in each case of Hct values of 0%, 42%, and 70% with reference to Glu 45 mg/dl in Example 55. FIGS. 83a and 83b each are a graph showing the sensitivity difference in each case at 0 second to 0.3 second after the detection.
Example 56
[0716] The procedure was carried out in the same manner as in Example 53 except that a voltage of 1.5 V was applied between the electrode A and the electrode B for 0.4 second from 0 second to 0.4 second after detection of the introduction of a blood sample, then a voltage of 0.1 to 1.0 V was applied multiple times between the electrode A and the electrode B from 0.4 second to 7.0 seconds after the detection of the introduction of a blood sample, and finally a voltage of 2.5 V was applied between the electrode C and the electrode A from 7.1 seconds to 7.5 seconds after the detection of the introduction of a blood sample. The current flowing between the working electrode and the counter electrode of each sensor 1 was measured, and the response current value and the sensitivity difference were measured in the measurement of the Hct value (see FIGS. 84a and 84b). FIG. 84a is a graph showing the sensitivity difference (%) in each case of Glu values of 45 mg/dl and 550 mg/dl with reference to Hct 42% in Example 56. FIG. 84b is a graph showing the sensitivity difference (%) in each case of Hct values of 0%, 42%, and 70% with reference to Glu 45 mg/dl in Example 56. FIGS. 84a and 84b each are a graph showing the sensitivity difference in each case at 0 second to 0.4 second after the detection.
Example 57
[0717] The procedure was carried out in the same manner as in Example 53 except that a voltage of 1.5 V was applied between the electrode A and the electrode B for 0.5 second from 0 second to 0.5 second after detection of the introduction of a blood sample, then a voltage of 0.1 to 1.0 V was applied multiple times between the electrode A and the electrode B from 0.5 second to 7.0 seconds after the detection of the introduction of a blood sample, and finally a voltage of 2.5 V was applied between the electrode C and the electrode A from 7.1 seconds to 7.5 seconds after the detection of the introduction of a blood sample. The current flowing between the working electrode and the counter electrode of each sensor 1 was measured, and the response current value and the sensitivity difference were measured in the measurement of the Hct value (see FIGS. 85a and 85b). FIG. 85a is a graph showing the sensitivity difference (%) in each case of Glu values of 45 mg/dl and 550 mg/dl with reference to Hct 42% in Example 57. FIG. 85(b) is a graph showing the sensitivity difference (%) in each case of Hct values of 0%, 42%, and 70% with reference to Glu 45 mg/dl in Example 57. FIGS. 85a and 85b each are a graph showing the sensitivity difference in each case at 0 second to 0.5 second after the detection.
Example 58
[0718] The procedure was carried out in the same manner as in Example 53 except that a voltage of 1.5 V was applied between the electrode A and the electrode B for 0.6 second from 0 second to 0.6 second after detection of the introduction of a blood sample, then a voltage of 0.1 to 1.0 V was applied multiple times between the electrode A and the electrode B from 0.6 second to 7.0 seconds after the detection of the introduction of a blood sample, and finally a voltage of 2.5 V was applied between the electrode C and the electrode A from 7.1 seconds to 7.5 seconds after the detection of the introduction of a blood sample. The current flowing between the working electrode and the counter electrode of each sensor 1 was measured, and the response current value and the sensitivity difference were measured in the measurement of the Hct value (see FIGS. 86a and 86b). FIG. 86a is a graph showing the sensitivity difference (%) in each case of Glu values of 45 mg/dl and 550 mg/dl with reference to Hct 42% in Example 58. FIG. 86b is a graph showing the sensitivity difference (%) in each case of Hct values of 0%, 42%, and 70% with reference to Glu 45 mg/dl in Example 58. FIGS. 86a and 86b each are a graph showing the sensitivity difference in each case at 0 second to 0.6 second after the detection.
Example 59
[0719] The procedure was carried out in the same manner as in Example 53 except that a voltage of 1.5 V was applied between the electrode A and the electrode B for 0.7 second from 0 second to 0.7 second after detection of the introduction of a blood sample, then a voltage of 0.1 to 1.0 V was applied multiple times between the electrode A and the electrode B from 0.7 second to 7.0 seconds after the detection of the introduction of a blood sample, and finally a voltage of 2.5 V was applied between the electrode C and the electrode A from 7.1 seconds to 7.5 seconds after the detection of the introduction of a blood sample. The current flowing between the working electrode and the counter electrode of each sensor 1 was measured, and the response current value and the sensitivity difference were measured in the measurement of the Hct value (see FIGS. 87a and 87b). FIG. 87a is a graph showing the sensitivity difference (%) in each case of Glu values of 45 mg/dl and 550 mg/dl with reference to Hct 42% in Example 59. FIG. 87b is a graph showing the sensitivity difference (%) in each case of Hct values of 0%, 42%, and 70% with reference to Glu 45 mg/dl in Example 59. FIGS. 87a and 87b each are a graph showing the sensitivity difference in each case at 0 second to 0.7 second after the detection.
[0720] From Examples 53 to 59, it was confirmed that when a voltage of 1.5 V was applied to the working electrode and the counter electrode for 0.1 to 0.7 second immediately (0 second) after detection of the introduction of a biological sample, the current value obtained thereby had a high sensitivity, and the Hct value and the Glu value obtained based on the current value had a high accuracy.
Example 60
[0721] The procedure was carried out in the same manner as in Example 53 except that a voltage of 2.0 V was applied between the electrode A and the electrode B for 0.1 second from 0 second to 0.1 second after detection of the introduction of a blood sample, then a voltage of 0.1 to 1.0 V was applied multiple times between the electrode A and the electrode B from 0.1 second to 7.0 seconds after the detection of the introduction of a blood sample, and finally a voltage of 2.5 V was applied between the electrode C and the electrode A from 7.1 seconds to 7.5 seconds after the detection of the introduction of a blood sample. The current flowing between the working electrode and the counter electrode of each sensor 1 was measured, and the response current value and the sensitivity difference were measured in the measurement of the Hct value (see FIGS. 88a and 88b). FIG. 88a is a graph showing the sensitivity difference (%) in each case of Glu values of 45 mg/dl and 550 mg/dl with reference to Hct 42% in Example 60. FIG. 88b is a graph showing the sensitivity difference (%) in each case of Hct values of 0%, 42%, and 70% with reference to Glu 45 mg/dl in Example 60. FIGS. 88a and 88b each are a graph showing the sensitivity difference in each case at 0 second to 0.1 second after the detection.
Example 61
[0722] The procedure was carried out in the same manner as in Example 60 except that a voltage of 2.0 V was applied between the electrode A and the electrode B for 0.2 second from 0 second to 0.2 second after detection of the introduction of a blood sample, then a voltage of 0.1 to 1.0 V was applied multiple times between the electrode A and the electrode B from 0.2 second to 7.0 seconds after the detection of the introduction of a blood sample, and finally a voltage of 2.5 V was applied between the electrode C and the electrode A from 7.1 seconds to 7.5 seconds after the detection of the introduction of a blood sample. The current flowing between the working electrode and the counter electrode of each sensor 1 was measured, and the response current value and the sensitivity difference were measured in the measurement of the Hct value (see FIGS. 89a and 89b). FIG. 89a is a graph showing the sensitivity difference (%) in each case of Glu values of 45 mg/dl and 550 mg/dl with reference to Hct 42% in Example 61. FIG. 89b is a graph showing the sensitivity difference (%) in each case of Hct values of 0%, 42%, and 70% with reference to Glu 45 mg/dl in Example 61. FIGS. 89a and 89b each are a graph showing the sensitivity difference in each case at 0 second to 0.2 second after the detection.
Example 62
[0723] The procedure was carried out in the same manner as in Example 60 except that a voltage of 2.0 V was applied between the electrode A and the electrode B for 0.3 second from 0 second to 0.3 second after detection of the introduction of a blood sample, then a voltage of 0.1 to 1.0 V was applied multiple times between the electrode A and the electrode B from 0.3 second to 7.0 seconds after the detection of the introduction of a blood sample, and finally a voltage of 2.5 V was applied between the electrode C and the electrode A from 7.1 seconds to 7.5 seconds after the detection of the introduction of a blood sample. The current flowing between the working electrode and the counter electrode of each sensor 1 was measured, and the response current value and the sensitivity difference were measured in the measurement of the Hct value (see FIGS. 90a and 90b). FIG. 90a is a graph showing the sensitivity difference (%) in each case of Glu values of 45 mg/dl and 550 mg/dl with reference to Hct 42% in Example 62. FIG. 90b is a graph showing the sensitivity difference (%) in each case of Hct values of 0%, 42%, and 70% with reference to Glu 45 mg/dl in Example 62. FIGS. 90a and 90b each are a graph showing the sensitivity difference in each case at 0 second to 0.3 second after the detection.
Example 63
[0724] The procedure was carried out in the same manner as in Example 60 except that a voltage of 2.0 V was applied between the electrode A and the electrode B for 0.4 second from 0 second to 0.4 second after detection of the introduction of a blood sample, then a voltage of 0.1 to 1.0 V was applied multiple times between the electrode A and the electrode B from 0.4 second to 7.0 seconds after the detection of the introduction of a blood sample, and finally a voltage of 2.5 V was applied between the electrode C and the electrode A from 7.1 seconds to 7.5 seconds after the detection of the introduction of a blood sample. The current flowing between the working electrode and the counter electrode of each sensor 1 was measured, and the response current value and the sensitivity difference were measured in the measurement of the Hct value (see FIGS. 91a and 91b). FIG. 91a is a graph showing the sensitivity difference (%) in each case of Glu values of 45 mg/dl and 550 mg/dl with reference to Hct 42% in Example 63. FIG. 91b is a graph showing the sensitivity difference (%) in each case of Hct values of 0%, 42%, and 70% with reference to Glu 45 mg/dl in Example 63. FIGS. 91a and 91b each are a graph showing the sensitivity difference in each case at 0 second to 0.4 second after the detection.
Example 64
[0725] The procedure was carried out in the same manner as in Example 60 except that a voltage of 2.0 V was applied between the electrode A and the electrode B for 0.5 second from 0 second to 0.5 second after detection of the introduction of a blood sample, then a voltage of 0.1 to 1.0 V was applied multiple times between the electrode A and the electrode B from 0.5 second to 7.0 seconds after the detection of the introduction of a blood sample, and finally a voltage of 2.5 V was applied between the electrode C and the electrode A from 7.1 seconds to 7.5 seconds after the detection of the introduction of a blood sample. The current flowing between the working electrode and the counter electrode of each sensor 1 was measured, and the response current value and the sensitivity difference were measured in the measurement of the Hct value (see FIGS. 92a and 92b). FIG. 92a is a graph showing the sensitivity difference (%) in each case of Glu values of 45 mg/dl and 550 mg/dl with reference to Hct 42% in Example 64. FIG. 92b is a graph showing the sensitivity difference (%) in each case of Hct values of 0%, 42%, and 70% with reference to Glu 45 mg/dl in Example 64. FIGS. 92a and 92b each are a graph showing the sensitivity difference in each case at 0 second to 0.5 second after the detection.
Example 65
[0726] The procedure was carried out in the same manner as in Example 60 except that a voltage of 2.0 V was applied between the electrode A and the electrode B for 0.6 second from 0 second to 0.6 second after detection of the introduction of a blood sample, then a voltage of 0.1 to 1.0 V was applied multiple times between the electrode A and the electrode B from 0.6 second to 7.0 seconds after the detection of the introduction of a blood sample, and finally a voltage of 2.5 V was applied between the electrode C and the electrode A from 7.1 seconds to 7.5 seconds after the detection of the introduction of a blood sample. The current flowing between the working electrode and the counter electrode of each sensor 1 was measured, and the response current value and the sensitivity difference were measured in the measurement of the Hct value (see FIGS. 93a and 93b). FIG. 93a is a graph showing the sensitivity difference (%) in each case of Glu values of 45 mg/dl and 550 mg/dl with reference to Hct 42% in Example 65. B FIG. 93b is a graph showing the sensitivity difference (%) in each case of Hct values of 0%, 42%, and 70% with reference to Glu 45 mg/dl in Example 65. FIGS. 93a and 93b each are a graph showing the sensitivity difference in each case at 0 second to 0.6 second after the detection.
Example 66
[0727] The procedure was carried out in the same manner as in Example 60 except that a voltage of 2.0 V was applied between the electrode A and the electrode B for 0.7 second from 0 second to 0.7 second after detection of the introduction of a blood sample, then a voltage of 0.1 to 1.0 V was applied multiple times between the electrode A and the electrode B from 0.7 second to 7.0 seconds after the detection of the introduction of a blood sample, and finally a voltage of 2.5 V was applied between the electrode C and the electrode A from 7.1 seconds to 7.5 seconds after the detection of the introduction of a blood sample. The current flowing between the working electrode and the counter electrode of each sensor 1 was measured, and the response current value and the sensitivity difference were measured in the measurement of the Hct value (see FIGS. 94a and 94b). FIG. 94a is a graph showing the sensitivity difference (%) in each case of Glu values of 45 mg/dl and 550 mg/dl with reference to Hct 42% in Example 66. FIG. 94b is a graph showing the sensitivity difference (%) in each case of Hct values of 0%, 42%, and 70% with reference to Glu 45 mg/dl in Example 66. FIGS. 94a and 94b each are a graph showing the sensitivity difference in each case at 0 second to 0.7 second after the detection.
Comparative Example 9
[0728] The procedure was carried out in the same manner as in Example 60 except that a voltage of 2.0 V was applied between the electrode A and the electrode B for 0.8 second from 0 second to 0.8 second after detection of the introduction of a blood sample, then a voltage of 0.1 to 1.0 V was applied multiple times between the electrode A and the electrode B from 0.8 second to 7.0 seconds after the detection of the introduction of a blood sample, and finally a voltage of 2.5 V was applied between the electrode C and the electrode A from 7.1 seconds to 7.5 seconds after the detection of the introduction of a blood sample. The current flowing between the working electrode and the counter electrode of each sensor 1 was measured, and the response current value and the sensitivity difference were measured in the measurement of the Hct value (see FIGS. 95a and 95b). FIG. 95a is a graph showing the sensitivity difference (%) in each case of Glu values of 45 mg/dl and 550 mg/dl with reference to Hct 42% in Comparative Example 9. FIG. 95b is a graph showing the sensitivity difference (%) in each case of Hct values of 0%, 42%, and 70% with reference to Glu 45 mg/dl in Comparative Example 9. FIGS. 95a and 95b each are a graph showing the sensitivity difference in each case at 0 second to 0.8 second after the detection.
Comparative Example 10
[0729] The procedure was carried out in the same manner as in Example 60 except that a voltage of 2.0 V was applied between the electrode A and the electrode B for 0.9 second from 0 second to 0.9 second after detection of the introduction of a blood sample, then a voltage of 0.1 to 1.0 V was applied multiple times between the electrode A and the electrode B from 0.9 second to 7.0 seconds after the detection of the introduction of a blood sample, and finally a voltage of 2.5 V was applied between the electrode C and the electrode A from 7.1 seconds to 7.5 seconds after the detection of the introduction of a blood sample. The current flowing between the working electrode and the counter electrode of each sensor 1 was measured, and the response current value and the sensitivity difference were measured in the measurement of the Hct value (see FIGS. 96a and 96b). FIG. 96a is a graph showing the sensitivity difference (%) in each case of Glu values of 45 mg/dl and 550 mg/dl with reference to Hct 42% in Comparative Example 10. FIG. 96b is a graph showing the sensitivity difference (%) in each case of Hct values of 0%, 42%, and 70% with reference to Glu 45 mg/dl in Comparative Example 10. FIGS. 96a and 96b each are a graph showing the sensitivity difference in each case at 0 second to 0.9 second after the detection.
Comparative Example 11
[0730] The procedure was carried out in the same manner as in Example 78 except that a voltage of 2.0 V was applied between the electrode A and the electrode B for 1.0 second from 0 second to 1.0 second after detection of the introduction of a blood sample, then a voltage of 0.1 to 1.0 V was applied multiple times between the electrode A and the electrode B from 1.0 second to 7.0 seconds after the detection of the introduction of a blood sample, and finally a voltage of 2.5 V was applied between the electrode C and the electrode A from 7.1 seconds to 7.5 seconds after the detection of the introduction of a blood sample. The current flowing between the working electrode and the counter electrode of each sensor 1 was measured, and the response current value and the sensitivity difference were measured in the measurement of the Hct value (see FIGS. 97a and 97b). FIG. 97a is a graph showing the sensitivity difference (%) in each case of Glu values of 45 mg/dl and 550 mg/dl with reference to Hct 42% in Comparative Example 11. FIG. 97b is a graph showing the sensitivity difference (%) in each case of Hct values of 0%, 42%, and 70% with reference to Glu 45 mg/dl in Comparative Example 11. FIGS. 97a and 97b each are a graph showing the sensitivity difference in each case at 0 second to 1.0 second after the detection.
[0731] From Examples 60 to 66 and Comparative Examples 9 to 11, it was confirmed that when a voltage of 2.0 V was applied to the working electrode and the counter electrode for 0.1 to 0.7 second immediately (0 second) after detection of the introduction of a biological sample, the current value obtained thereby had a high sensitivity, and the Hct value and the Glu value obtained based on the current value had a high accuracy.
Example 67
[0732] The procedure was carried out in the same manner as in Example 53 except that a voltage of 2.5 V was applied between the electrode A and the electrode B for 0.1 second from 0 second to 0.1 second after detection of the introduction of a blood sample, then a voltage of 0.1 to 1.0 V was applied multiple times between the electrode A and the electrode B from 0.1 second to 7.0 seconds after the detection of the introduction of a blood sample, and finally a voltage of 2.5 V was applied between the electrode C and the electrode A from 7.1 seconds to 7.5 seconds after the detection of the introduction of a blood sample. The current flowing between the working electrode and the counter electrode of each sensor 1 was measured, and the response current value and the sensitivity difference were measured in the measurement of the Hct value (see FIGS. 98a and 98b). FIG. 98a is a graph showing the sensitivity difference (%) in each case of Glu values of 45 mg/dl and 550 mg/dl with reference to Hct 42% in Example 67. FIG. 98b is a graph showing the sensitivity difference (%) in each case of Hct values of 0%, 42%, and 70% with reference to Glu 45 mg/dl in Example 67. FIGS. 98a and 98b each are a graph showing the sensitivity difference in each case at 0 second to 0.1 second after the detection.
Example 68
[0733] The procedure was carried out in the same manner as in Example 67 except that a voltage of 2.5 V was applied between the electrode A and the electrode B for 0.2 second from 0 second to 0.2 second after detection of the introduction of a blood sample, then a voltage of 0.1 to 1.0 V was applied multiple times between the electrode A and the electrode B from 0.2 second to 7.0 seconds after the detection of the introduction of a blood sample, and finally a voltage of 2.5 V was applied between the electrode C and the electrode A from 7.1 seconds to 7.5 seconds after the detection of the introduction of a blood sample. The current flowing between the working electrode and the counter electrode of each sensor 1 was measured, and the response current value and the sensitivity difference were measured in the measurement of the Hct value (see FIGS. 99a and 99b). FIG. 99a is a graph showing the sensitivity difference (%) in each case of Glu values of 45 mg/dl and 550 mg/dl with reference to Hct 42% in Example 68. FIG. 99b is a graph showing the sensitivity difference (%) in each case of Hct values of 0%, 42%, and 70% with reference to Glu 45 mg/dl in Example 68. FIGS. 99a and 99b each are a graph showing the sensitivity difference in each case at 0 second to 0.2 second after the detection.
Example 69
[0734] The procedure was carried out in the same manner as in Example 67 except that a voltage of 2.5 V was applied between the electrode A and the electrode B for 0.3 second from 0 second to 0.3 second after detection of the introduction of a blood sample, then a voltage of 0.1 to 1.0 V was applied multiple times between the electrode A and the electrode B from 0.3 second to 7.0 seconds after the detection of the introduction of a blood sample, and finally a voltage of 2.5 V was applied between the electrode C and the electrode A from 7.1 seconds to 7.5 seconds after the detection of the introduction of a blood sample. The current flowing between the working electrode and the counter electrode of each sensor 1 was measured, and the response current value and the sensitivity difference were measured in the measurement of the Hct value (see FIGS. 100a and 100b). FIG. 100a is a graph showing the sensitivity difference (%) in each case of Glu values of 45 mg/dl and 550 mg/dl with reference to Hct 42% in Example 69. FIG. 100b is a graph showing the sensitivity difference (%) in each case of Hct values of 0%, 42%, and 70% with reference to Glu 45 mg/dl in Example 69. FIGS. 100a and 100b each are a graph showing the sensitivity difference in each case at 0 second to 0.3 second after the detection.
Example 70
[0735] The procedure was carried out in the same manner as in Example 67 except that a voltage of 2.5 V was applied between the electrode A and the electrode B for 0.4 second from 0 second to 0.4 second after detection of the introduction of a blood sample, then a voltage of 0.1 to 1.0 V was applied multiple times between the electrode A and the electrode B from 0.4 second to 7.0 seconds after the detection of the introduction of a blood sample, and finally a voltage of 2.5 V was applied between the electrode C and the electrode A from 7.1 seconds to 7.5 seconds after the detection of the introduction of a blood sample. The current flowing between the working electrode and the counter electrode of each sensor 1 was measured, and the response current value and the sensitivity difference were measured in the measurement of the Hct value (see FIGS. 101a and 101b). FIG. 101a is a graph showing the sensitivity difference (%) in each case of Glu values of 45 mg/dl and 550 mg/dl with reference to Hct 42% in Example 70. FIG. 101b is a graph showing the sensitivity difference (%) in each case of Hct values of 0%, 42%, and 70% with reference to Glu 45 mg/dl in Example 70. FIGS. 101a and 101b each are a graph showing the sensitivity difference in each case at 0 second to 0.4 second after the detection.
Example 71
[0736] The procedure was carried out in the same manner as in Example 67 except that a voltage of 2.5 V was applied between the electrode A and the electrode B for 0.5 second from 0 second to 0.5 second after detection of the introduction of a blood sample, then a voltage of 0.1 to 1.0 V was applied multiple times between the electrode A and the electrode B from 0.5 second to 7.0 seconds after the detection of the introduction of a blood sample, and finally a voltage of 2.5 V was applied between the electrode C and the electrode A from 7.1 seconds to 7.5 seconds after the detection of the introduction of a blood sample. The current flowing between the working electrode and the counter electrode of each sensor 1 was measured, and the response current value and the sensitivity difference were measured in the measurement of the Hct value (see FIGS. 102a and 102b). FIG. 102a is a graph showing the sensitivity difference (%) in each case of Glu values of 45 mg/dl and 550 mg/dl with reference to Hct 42% in Example 71. FIG. 102b is a graph showing the sensitivity difference (%) in each case of Hct values of 0%, 42%, and 70% with reference to Glu 45 mg/dl in Example 71. FIGS. 102a and 102b each are a graph showing the sensitivity difference in each case at 0 second to 0.5 second after the detection.
Example 72
[0737] The procedure was carried out in the same manner as in Example 67 except that a voltage of 2.5 V was applied between the electrode A and the electrode B for 0.6 second from 0 second to 0.6 second after detection of the introduction of a blood sample, then a voltage of 0.1 to 1.0 V was applied multiple times between the electrode A and the electrode B from 0.6 second to 7.0 seconds after the detection of the introduction of a blood sample, and finally a voltage of 2.5 V was applied between the electrode C and the electrode A from 7.1 seconds to 7.5 seconds after the detection of the introduction of a blood sample. The current flowing between the working electrode and the counter electrode of each sensor 1 was measured, and the response current value and the sensitivity difference were measured in the measurement of the Hct value (see FIGS. 103a and 103b). FIG. 103a is a graph showing the sensitivity difference (%) in each case of Glu values of 45 mg/dl and 550 mg/dl with reference to Hct 42% in Example 72. FIG. 103b is a graph showing the sensitivity difference (%) in each case of Hct values of 0%, 42%, and 70% with reference to Glu 45 mg/dl in Example 72. FIGS. 103a and 103b each are a graph showing the sensitivity difference in each case at 0 second to 0.6 second after the detection.
Example 73
[0738] The procedure was carried out in the same manner as in Example 67 except that a voltage of 2.5 V was applied between the electrode A and the electrode B for 0.7 second from 0 second to 0.7 second after detection of the introduction of a blood sample, then a voltage of 0.1 to 1.0 V was applied multiple times between the electrode A and the electrode B from 0.7 second to 7.0 seconds after the detection of the introduction of a blood sample, and finally a voltage of 2.5 V was applied between the electrode C and the electrode A from 7.1 seconds to 7.5 seconds after the detection of the introduction of a blood sample. The current flowing between the working electrode and the counter electrode of each sensor 1 was measured, and the response current value and the sensitivity difference were measured in the measurement of the Hct value (see FIGS. 104a and 104b). FIG. 104a is a graph showing the sensitivity difference (%) in each case of Glu values of 45 mg/dl and 550 mg/dl with reference to Hct 42% in Example 73. FIG. 104b is a graph showing the sensitivity difference (%) in each case of Hct values of 0%, 42%, and 70% with reference to Glu 45 mg/dl in Example 73. FIGS. 104a and 104b each are a graph showing the sensitivity difference in each case at 0 second to 0.7 second after the detection.
Comparative Example 12
[0739] The procedure was carried out in the same manner as in Example 67 except that a voltage of 2.5 V was applied between the electrode A and the electrode B for 0.9 second from 0 second to 0.9 second after detection of the introduction of a blood sample, then a voltage of 0.1 to 1.0 V was applied multiple times between the electrode A and the electrode B from 0.9 second to 7.0 seconds after the detection of the introduction of a blood sample, and finally a voltage of 2.5 V was applied between the electrode C and the electrode A from 7.1 seconds to 7.5 seconds after the detection of the introduction of a blood sample. The current flowing between the working electrode and the counter electrode of each sensor 1 was measured, and the response current value and the sensitivity difference were measured in the measurement of the Hct value (see FIGS. 105a and 105b). FIG. 105a is a graph showing the change with time in the sensitivity difference (%) relative to the applied voltage with reference to Hct 42% in Comparative Example 12. FIG. 105b is a graph showing the change with time in the sensitivity difference (%) relative to the applied voltage with reference to Glu 45% in Comparative Example 12. FIGS. 105a and 105b each are a graph showing the sensitivity difference in each case at 0 second to 0.9 second after the detection.
Comparative Example 13
[0740] The procedure was carried out in the same manner as in Example 67 except that a voltage of 2.5 V was applied between the electrode A and the electrode B for 1.0 second from 0 second to 1.0 second after detection of the introduction of a blood sample, then a voltage of 0.1 to 1.0 V was applied multiple times between the electrode A and the electrode B from 1.0 second to 7.0 seconds after the detection of the introduction of a blood sample, and finally a voltage of 2.5 V was applied between the electrode C and the electrode A from 7.1 seconds to 7.5 seconds after the detection of the introduction of a blood sample. The current flowing between the working electrode and the counter electrode of each sensor 1 was measured, and the response current value and the sensitivity difference were measured in the measurement of the Hct value (FIGS. 106a and 106b). FIG. 106a is a graph showing the sensitivity difference (%) in each case of Glu values of 45 mg/dl and 550 mg/dl with reference to Hct 42% in Comparative Example 13. FIG. 106b is a graph showing the sensitivity difference (%) in each case of Hct values of 0%, 42%, and 70% with reference to Glu 45 mg/dl in Comparative Example 13. FIGS. 106a and 106b each are a graph showing the sensitivity difference in each case at 0 second to 1.0 second after the detection.
[0741] From Examples 67 to 73 and Comparative Examples 12 and 13, it was confirmed that when a voltage of 2.5 V was applied to the working electrode and the counter electrode for 0.1 to 0.7 second immediately (0 second) after detection of the introduction of a biological sample, the current value obtained thereby had a high sensitivity, and the Hct value and the Glu value obtained based on the current value had a high accuracy. After the start of blood introduction, the voltage application time was changed between 0.1 and 1.0 second and the graphs showing the sensitivity difference were checked. As a result, it was found that the effect of the glucose concentration gradually increased as the time increased. Particularly, when the voltage application time was 0.9 second as in Comparative Example 12, a divergence was seen in the graph showing the sensitivity difference in each case of Hct values of 0%, 42%, and 70% particularly with reference to Glu 550 mg/dl as shown in FIG. 105b.
Example 74
[0742] A biosensor (first biosensor) was produced in the same manner as in Example 1 except that the plan view of FIG. 4 was followed instead of the plan view of FIG. 3. A voltage of 1.5 V was applied between the electrode A and the electrode B for 0.1 second from 0.05 second to 0.15 second after detection of the introduction of a blood sample (see FIG. 80(b)). Next, a voltage of 0.1 to 1.0 V was applied multiple times from 0.15 second to 7.05 seconds after the detection of the introduction of a blood sample (see FIG. 80(b), voltage application for Glu). Finally, then, a voltage of 2.5 V was applied from 7.15 seconds to 7.55 seconds after the detection of the introduction of a blood sample (see FIG. 80(b), voltage application for the second Hct). The current flowing between the working electrode and the counter electrode of each sensor 1 was measured, and the response current value and the sensitivity difference were measured in the measurement of the Hct value. FIG. 107a is a graph showing the sensitivity difference (%) in each case of Glu values of 45 mg/dl and 550 mg/dl with reference to Hct 42% in Example 74. FIG. 107b is a graph showing the sensitivity difference (%) in each case of Hct values of 0%, 42%, and 70% with reference to Glu 45 mg/dl in Example 74. FIGS. 107a and 107b each are a graph showing the sensitivity difference in each case at 0.05 second to 0.15 second after the detection.
Example 75
[0743] The procedure was carried out in the same manner as in Example 74 except that a voltage of 1.5 V was applied between the electrode A and the electrode B for 0.2 second from 0.05 second to 0.25 second after detection of the introduction of a blood sample, then a voltage of 0.1 to 1.0 V was applied multiple times between the electrode A and the electrode B from 0.25 second to 7.0 seconds after the detection of the introduction of a blood sample, and finally a voltage of 2.5 V was applied between the electrode C and the electrode A from 7.1 seconds to 7.5 seconds after the detection of the introduction of a blood sample. The current flowing between the working electrode and the counter electrode of each sensor 1 was measured, and the response current value and the sensitivity difference were measured in the measurement of the Hct value (see FIGS. 108a and 108b). FIG. 108a is a graph showing the sensitivity difference (%) in each case of Glu values of 45 mg/dl and 550 mg/dl with reference to Hct 42% in Example 75. FIG. 108b is a graph showing the sensitivity difference (%) in each case of Hct values of 0%, 42%, and 70% with reference to Glu 45 mg/dl in Example 75. FIGS. 108a and 108b each are a graph showing the sensitivity difference in each case at 0.05 second to 0.25 second after the detection.
Example 76
[0744] The procedure was carried out in the same manner as in Example 74 except that a voltage of 1.5 V was applied between the electrode A and the electrode B for 0.3 second from 0.05 second to 0.35 second after detection of the introduction of a blood sample, then a voltage of 0.1 to 1.0 V was applied multiple times between the electrode A and the electrode B from 0.3 second to 7.0 seconds after the detection of the introduction of a blood sample, and finally a voltage of 2.5 V was applied between the electrode C and the electrode A from 7.1 seconds to 7.5 seconds after the detection of the introduction of a blood sample. The current flowing between the working electrode and the counter electrode of each sensor 1 was measured, and the response current value and the sensitivity difference were measured in the measurement of the Hct value (see FIGS. 109a and 109b). FIG. 109a is a graph showing the sensitivity difference (%) in each case of Glu values of 45 mg/dl and 550 mg/dl with reference to Hct 42% in Example 76. FIG. 109b is a graph showing the sensitivity difference (%) in each case of Hct values of 0%, 42%, and 70% with reference to Glu 45 mg/dl in Example 76. FIGS. 109a and 109b each are a graph showing the sensitivity difference in each case at 0.05 second to 0.35 second after the detection.
Example 77
[0745] The procedure was carried out in the same manner as in Example 74 except that a voltage of 1.5 V was applied between the electrode A and the electrode B for 0.4 second from 0.05 second to 0.45 second after detection of the introduction of a blood sample, then a voltage of 0.1 to 1.0 V was applied multiple times between the electrode A and the electrode B from 0.45 second to 7.0 seconds after the detection of the introduction of a blood sample, and finally a voltage of 2.5 V was applied between the electrode C and the electrode A from 7.1 seconds to 7.5 seconds after the detection of the introduction of a blood sample. The current flowing between the working electrode and the counter electrode of each sensor 1 was measured, and the response current value and the sensitivity difference were measured in the measurement of the Hct value (see FIGS. 110a and 110b). FIG. 110a is a graph showing the sensitivity difference (%) in each case of Glu values of 45 mg/dl and 550 mg/dl with reference to Hct 42% in Example 77. FIG. 110b is a graph showing the sensitivity difference (%) in each case of Hct values of 0%, 42%, and 70% with reference to Glu 45 mg/dl in Example 77. FIGS. 110a and 110b each are a graph showing the sensitivity difference in each case at 0.05 second to 0.45 second after the detection.
Example 78
[0746] The procedure was carried out in the same manner as in Example 74 except that a voltage of 1.5 V was applied between the electrode A and the electrode B for 0.5 second from 0.05 second to 0.55 second after detection of the introduction of a blood sample, then a voltage of 0.1 to 1.0 V was applied multiple times between the electrode A and the electrode B from 0.55 second to 7.0 seconds after the detection of the introduction of a blood sample, and finally a voltage of 2.5 V was applied between the electrode C and the electrode A from 7.1 seconds to 7.5 seconds after the detection of the introduction of a blood sample. The current flowing between the working electrode and the counter electrode of each sensor 1 was measured, and the response current value and the sensitivity difference were measured in the measurement of the Hct value (see FIGS. 111a and 111b). FIG. 111a is a graph showing the sensitivity difference (%) in each case of Glu values of 45 mg/dl and 550 mg/dl with reference to Hct 42% in Example 78. FIG. 111b is a graph showing the sensitivity difference (%) in each case of Hct values of 0%, 42%, and 70% with reference to Glu 45 mg/dl in Example 78. FIGS. 111a and 111b each are a graph showing the sensitivity difference in each case at 0.05 second to 0.55 second after the detection.
Example 79
[0747] The procedure was carried out in the same manner as in Example 74 except that a voltage of 1.5 V was applied between the electrode A and the electrode B for 0.6 second from 0.05 second to 0.65 second after detection of the introduction of a blood sample, then a voltage of 0.1 to 1.0 V was applied multiple times between the electrode A and the electrode B from 0.65 second to 7.0 seconds after the detection of the introduction of a blood sample, and finally a voltage of 2.5 V was applied between the electrode C and the electrode A from 7.1 seconds to 7.5 seconds after the detection of the introduction of a blood sample. The current flowing between the working electrode and the counter electrode of each sensor 1 was measured, and the response current value and the sensitivity difference were measured in the measurement of the Hct value (see FIGS. 112a and 112b). FIG. 112a is a graph showing the sensitivity difference (%) in each case of Glu values of 45 mg/dl and 550 mg/dl with reference to Hct 42% in Example 79. FIG. 112b is a graph showing the sensitivity difference (%) in each case of Hct values of 0%, 42%, and 70% with reference to Glu 45 mg/dl in Example 79. FIGS. 112a and 112b each are a graph showing the sensitivity difference in each case at 0.05 second to 0.65 second after the detection.
Example 80
[0748] The procedure was carried out in the same manner as in Example 74 except that a voltage of 1.5 V was applied between the electrode A and the electrode B for 0.7 second from 0.05 second to 0.75 second after detection of the introduction of a blood sample, then a voltage of 0.1 to 1.0 V was applied multiple times between the electrode A and the electrode B from 0.75 second to 7.0 seconds after the detection of the introduction of a blood sample, and finally a voltage of 2.5 V was applied between the electrode C and the electrode A from 7.1 seconds to 7.5 seconds after the detection of the introduction of a blood sample. The current flowing between the working electrode and the counter electrode of each sensor 1 was measured, and the response current value and the sensitivity difference were measured in the measurement of the Hct value (see FIGS. 113a and 113b). FIG. 113a is a graph showing the sensitivity difference (%) in each case of Glu values of 45 mg/dl and 550 mg/dl with reference to Hct 42% in Example 80. FIG. 113b is a graph showing the sensitivity difference (%) in each case of Hct values of 0%, 42%, and 70% with reference to Glu 45 mg/dl in Example 80. FIGS. 113a and 113b each are a graph showing the sensitivity difference in each case at 0.05 second to 0.75 second after the detection.
[0749] From Examples 74 to 80, it was confirmed that when a voltage of 1.5 V was applied to the working electrode and the counter electrode for 0.1 to 0.7 second at 0.05 second after detection of the introduction of a biological sample, the current value obtained thereby had a high sensitivity, and the Hct value and the Glu value obtained based on the current value had a high accuracy.
Example 81
[0750] The procedure was carried out in the same manner as in Example 74 except that a voltage of 2.0 V was applied between the electrode A and the electrode B for 0.1 second from 0.05 second to 0.15 second after detection of the introduction of a blood sample, then a voltage of 0.1 to 1.0 V was applied multiple times between the electrode A and the electrode B from 0.15 second to 7.0 seconds after the detection of the introduction of a blood sample, and finally a voltage of 2.5 V was applied between the electrode C and the electrode A from 7.1 seconds to 7.5 seconds after the detection of the introduction of a blood sample. The current flowing between the working electrode and the counter electrode of each sensor 1 was measured, and the response current value and the sensitivity difference were measured in the measurement of the Hct value (see FIGS. 114a and 114b). FIG. 114a is a graph showing the sensitivity difference (%) in each case of Glu values of 45 mg/dl and 550 mg/dl with reference to Hct 42% in Example 81. FIG. 114b is a graph showing the sensitivity difference (%) in each case of Hct values of 0%, 42%, and 70% with reference to Glu 45 mg/dl in Example 81. FIGS. 114a and 114b each are a graph showing the sensitivity difference in each case at 0.05 second to 0.15 second after the detection.
Example 82
[0751] The procedure was carried out in the same manner as in Example 81 except that a voltage of 2.0 V was applied between the electrode A and the electrode B for 0.2 second from 0.05 second to 0.25 second after detection of the introduction of a blood sample, then a voltage of 0.1 to 1.0 V was applied multiple times between the electrode A and the electrode B from 0.25 second to 7.0 seconds after the detection of the introduction of a blood sample, and finally a voltage of 2.5 V was applied between the electrode C and the electrode A from 7.1 seconds to 7.5 seconds after the detection of the introduction of a blood sample. The current flowing between the working electrode and the counter electrode of each sensor 1 was measured, and the response current value and the sensitivity difference were measured in the measurement of the Hct value (see FIGS. 115a and 115b). FIG. 115a is a graph showing the sensitivity difference (%) in each case of Glu values of 45 mg/dl and 550 mg/dl with reference to Hct 42% in Example 82. FIG. 115b is a graph showing the sensitivity difference (%) in each case of Hct values of 0%, 42%, and 70% with reference to Glu 45 mg/dl in Example 82. FIGS. 115a and 115b each are a graph showing the sensitivity difference in each case at 0.05 second to 0.25 second after the detection.
Example 83
[0752] The procedure was carried out in the same manner as in Example 81 except that a voltage of 2.0 V was applied between the electrode A and the electrode B for 0.3 second from 0.05 second to 0.35 second after detection of the introduction of a blood sample, then a voltage of 0.1 to 1.0 V was applied multiple times between the electrode A and the electrode B from 0.35 second to 7.0 seconds after the detection of the introduction of a blood sample, and finally a voltage of 2.5 V was applied between the electrode C and the electrode A from 7.1 seconds to 7.5 seconds after the detection of the introduction of a blood sample. The current flowing between the working electrode and the counter electrode of each sensor 1 was measured, and the response current value and the sensitivity difference were measured in the measurement of the Hct value (see 116a and 116b). FIG. 116a is a graph showing the sensitivity difference (%) in each case of Glu values of 45 mg/dl and 550 mg/dl with reference to Hct 42% in Example 83. FIG. 116b is a graph showing the sensitivity difference (%) in each case of Hct values of 0%, 42%, and 70% with reference to Glu 45 mg/dl in Example 83. FIGS. 116a and 116b each are a graph showing the sensitivity difference in each case at 0.05 second to 0.35 second after the detection.
Example 84
[0753] The procedure was carried out in the same manner as in Example 81 except that a voltage of 2.0 V was applied between the electrode A and the electrode B for 0.4 second from 0.05 second to 0.45 second after detection of the introduction of a blood sample, then a voltage of 0.1 to 1.0 V was applied multiple times between the electrode A and the electrode B from 0.45 second to 7.0 seconds after the detection of the introduction of a blood sample, and finally a voltage of 2.5 V was applied between the electrode C and the electrode A from 7.1 seconds to 7.5 seconds after the detection of the introduction of a blood sample. The current flowing between the working electrode and the counter electrode of each sensor 1 was measured, and the response current value and the sensitivity difference were measured in the measurement of the Hct value (see FIGS. 117a and 117b). FIG. 117a is a graph showing the sensitivity difference (%) in each case of Glu values of 45 mg/dl and 550 mg/dl with reference to Hct 42% in Example 84. FIG. 117b is a graph showing the sensitivity difference (%) in each case of Hct values of 0%, 42%, and 70% with reference to Glu 45 mg/dl in Example 84. FIGS. 117a and 117b each are a graph showing the sensitivity difference in each case at 0.05 second to 0.45 second after the detection.
Example 85
[0754] The procedure was carried out in the same manner as in Example 81 except that a voltage of 2.0 V was applied between the electrode A and the electrode B for 0.5 second from 0.05 second to 0.55 second after detection of the introduction of a blood sample, then a voltage of 0.1 to 1.0 V was applied multiple times between the electrode A and the electrode B from 0.55 second to 7.0 seconds after the detection of the introduction of a blood sample, and finally a voltage of 2.5 V was applied between the electrode C and the electrode A from 7.1 seconds to 7.5 seconds after the detection of the introduction of a blood sample. The current flowing between the working electrode and the counter electrode of each sensor 1 was measured, and the response current value and the sensitivity difference were measured in the measurement of the Hct value (see FIGS. 118a and 118b). FIG. 118a is a graph showing the sensitivity difference (%) in each case of Glu values of 45 mg/dl and 550 mg/dl with reference to Hct 42% in Example 85. FIG. 118b is a graph showing the sensitivity difference (%) in each case of Hct values of 0%, 42%, and 70% with reference to Glu 45 mg/dl in Example 85. FIGS. 118a and 118b each are a graph showing the sensitivity difference in each case at 0.05 second to 0.55 second after the detection.
Example 86
[0755] The procedure was carried out in the same manner as in Example 81 except that a voltage of 2.0 V was applied between the electrode A and the electrode B for 0.6 second from 0.05 second to 0.65 second after detection of the introduction of a blood sample, then a voltage of 0.1 to 1.0 V was applied multiple times between the electrode A and the electrode B from 0.65 second to 7.0 seconds after the detection of the introduction of a blood sample, and finally a voltage of 2.5 V was applied between the electrode C and the electrode A from 7.1 seconds to 7.5 seconds after the detection of the introduction of a blood sample. The current flowing between the working electrode and the counter electrode of each sensor 1 was measured, and the response current value and the sensitivity difference were measured in the measurement of the Hct value (see FIGS. 119a and 119b). FIG. 119a is a graph showing the sensitivity difference (%) in each case of Glu values of 45 mg/dl and 550 mg/dl with reference to Hct 42% in Example 86. FIG. 119b is a graph showing the sensitivity difference (%) in each case of Hct values of 0%, 42%, and 70% with reference to Glu 45 mg/dl in Example 86. FIGS. 119a and 119b each are a graph showing the sensitivity difference in each case at 0.05 second to 0.65 second after the detection.
Example 87
[0756] The procedure was carried out in the same manner as in Example 81 except that a voltage of 2.0 V was applied between the electrode A and the electrode B for 0.7 second from 0.05 second to 0.75 second after detection of the introduction of a blood sample, then a voltage of 0.1 to 1.0 V was applied multiple times between the electrode A and the electrode B from 0.75 second to 7.0 seconds after the detection of the introduction of a blood sample, and finally a voltage of 2.5 V was applied between the electrode C and the electrode A from 7.1 seconds to 7.5 seconds after the detection of the introduction of a blood sample. The current flowing between the working electrode and the counter electrode of each sensor 1 was measured, and the response current value and the sensitivity difference were measured in the measurement of the Hct value (see FIGS. 120a and 120b). FIG. 120a is a graph showing the sensitivity difference (%) in each case of Glu values of 45 mg/dl and 550 mg/dl with reference to Hct 42% in Example 87. FIG. 120b is a graph showing the sensitivity difference (%) in each case of Hct values of 0%, 42%, and 70% with reference to Glu 45 mg/dl in Example 87. FIGS. 120a and 120b each are a graph showing the sensitivity difference in each case at 0.05 second to 0.75 second after the detection.
[0757] From Example 81 to 87, it was confirmed that when a voltage of 2.0 V was applied to the working electrode and the counter electrode for 0.1 to 0.7 second at 0.05 second after detection of the introduction of a biological sample, the current value obtained thereby had a high sensitivity, and the Hct value and the Glu value obtained based on the current value had a high accuracy.
Example 88
[0758] The procedure was carried out in the same manner as in Example 74 except that a voltage of 2.5 V was applied between the electrode A and the electrode B for 0.1 second from 0.05 second to 0.15 second after detection of the introduction of a blood sample, then a voltage of 0.1 to 1.0 V was applied multiple times between the electrode A and the electrode B from 0.15 second to 7.0 seconds after the detection of the introduction of a blood sample, and finally a voltage of 2.5 V was applied between the electrode C and the electrode A from 7.1 seconds to 7.5 seconds after the detection of the introduction of a blood sample. The current flowing between the working electrode and the counter electrode of each sensor 1 was measured, and the response current value and the sensitivity difference were measured in the measurement of the Hct value (see FIGS. 121a and 121b). FIG. 121a is a graph showing the sensitivity difference (%) in each case of Glu values of 45 mg/dl and 550 mg/dl with reference to Hct 42% in Example 88. FIG. 121b is a graph showing the sensitivity difference (%) in each case of Hct values of 0%, 42%, and 70% with reference to Glu 45 mg/dl in Example 88. FIGS. 121a and 121b each are a graph showing the sensitivity difference in each case at 0.05 second to 0.15 second after the detection.
Example 89
[0759] The procedure was carried out in the same manner as in Example 88 except that a voltage of 2.5 V was applied between the electrode A and the electrode B for 0.2 second from 0.05 second to 0.25 second after detection of the introduction of a blood sample, then a voltage of 0.1 to 1.0 V was applied multiple times between the electrode A and the electrode B from 0.25 second to 7.0 seconds after the detection of the introduction of a blood sample, and finally a voltage of 2.5 V was applied between the electrode C and the electrode A from 7.1 seconds to 7.5 seconds after the detection of the introduction of a blood sample. The current flowing between the working electrode and the counter electrode of each sensor 1 was measured, and the response current value and the sensitivity difference were measured in the measurement of the Hct value (see FIGS. 122a and 122b). FIG. 122a is a graph showing the sensitivity difference (%) in each case of Glu values of 45 mg/dl and 550 mg/dl with reference to Hct 42% in Example 89. FIG. 122b is a graph showing the sensitivity difference (%) in each case of Hct values of 0%, 42%, and 70% with reference to Glu 45 mg/dl in Example 89. FIGS. 122a and 122b each are a graph showing the sensitivity difference in each case at 0.05 second to 0.25 second after the detection.
Example 90
[0760] The procedure was carried out in the same manner as in Example 88 except that a voltage of 2.5 V was applied between the electrode A and the electrode B for 0.3 second from 0.05 second to 0.35 second after detection of the introduction of a blood sample, then a voltage of 0.1 to 1.0 V was applied multiple times between the electrode A and the electrode B from 0.35 second to 7.0 seconds after the detection of the introduction of a blood sample, and finally a voltage of 2.5 V was applied between the electrode C and the electrode A from 7.1 seconds to 7.5 seconds after the detection of the introduction of a blood sample. The current flowing between the working electrode and the counter electrode of each sensor 1 was measured, and the response current value and the sensitivity difference were measured in the measurement of the Hct value (see FIGS. 123a and 123b). FIG. 123a is a graph showing the sensitivity difference (%) in each case of Glu values of 45 mg/dl and 550 mg/dl with reference to Hct 42% in Example 90. FIG. 123b is a graph showing the sensitivity difference (%) in each case of Hct values of 0%, 42%, and 70% with reference to Glu 45 mg/dl in Example 90. FIGS. 123a and 123b each are a graph showing the sensitivity difference in each case at 0.05 second to 0.35 second after the detection.
Example 91
[0761] The procedure was carried out in the same manner as in Example 88 except that a voltage of 2.5 V was applied between the electrode A and the electrode B for 0.4 second from 0.05 second to 0.45 second after detection of the introduction of a blood sample, then a voltage of 0.1 to 1.0 V was applied multiple times between the electrode A and the electrode B from 0.45 second to 7.0 seconds after the detection of the introduction of a blood sample, and finally a voltage of 2.5 V was applied between the electrode C and the electrode A from 7.1 seconds to 7.5 seconds after the detection of the introduction of a blood sample. The current flowing between the working electrode and the counter electrode of each sensor 1 was measured, and the response current value and the sensitivity difference were measured in the measurement of the Hct value (see FIGS. 124a and 124b). FIG. 124a is a graph showing the sensitivity difference (%) in each case of Glu values of 45 mg/dl and 550 mg/dl with reference to Hct 42% in Example 91. FIG. 124b is a graph showing the sensitivity difference (%) in each case of Hct values of 0%, 42%, and 70% with reference to Glu 45 mg/dl in Example 91. FIGS. 124a and 124b each are a graph showing the sensitivity difference in each case at 0.05 second to 0.45 second after the detection.
Example 92
[0762] The procedure was carried out in the same manner as in Example 88 except that a voltage of 2.5 V was applied between the electrode A and the electrode B for 0.5 second from 0.05 second to 0.55 second after detection of the introduction of a blood sample, then a voltage of 0.1 to 1.0 V was applied multiple times between the electrode A and the electrode B from 0.55 second to 7.0 seconds after the detection of the introduction of a blood sample, and finally a voltage of 2.5 V was applied between the electrode C and the electrode A from 7.1 seconds to 7.5 seconds after the detection of the introduction of a blood sample. The current flowing between the working electrode and the counter electrode of each sensor 1 was measured, and the response current value and the sensitivity difference were measured in the measurement of the Hct value (see FIGS. 125a and 125b). FIG. 125a is a graph showing the sensitivity difference (%) in each case of Glu values of 45 mg/dl and 550 mg/dl with reference to Hct 42% in Example 92. FIG. 125b is a graph showing the sensitivity difference (%) in each case of Hct values of 0%, 42%, and 70% with reference to Glu 45 mg/dl in Example 92. FIGS. 125a and 125b each are a graph showing the sensitivity difference in each case at 0.05 second to 0.55 second after the detection.
Example 93
[0763] The procedure was carried out in the same manner as in Example 88 except that a voltage of 2.5 V was applied between the electrode A and the electrode B for 0.6 second from 0.05 second to 0.65 second after detection of the introduction of a blood sample, then a voltage of 0.1 to 1.0 V was applied multiple times between the electrode A and the electrode B from 0.65 second to 7.0 seconds after the detection of the introduction of a blood sample, and finally a voltage of 2.5 V was applied between the electrode C and the electrode A from 7.1 seconds to 7.5 seconds after the detection of the introduction of a blood sample. The current flowing between the working electrode and the counter electrode of each sensor 1 was measured, and the response current value and the sensitivity difference were measured in the measurement of the Hct value (see FIGS. 126a and 126b). FIG. 126a is a graph showing the sensitivity difference (%) in each case of Glu values of 45 mg/dl and 550 mg/dl with reference to Hct 42% in Example 93. FIG. 126b is a graph showing the sensitivity difference (%) in each case of Hct values of 0%, 42%, and 70% with reference to Glu 45 mg/dl in Example 93. FIGS. 126a and 126b each are a graph showing the sensitivity difference in each case at 0.05 second to 0.65 second after the detection.
Comparative Example 14
[0764] The procedure was carried out in the same manner as in Example 88 except that a voltage of 2.5 V was applied between the electrode A and the electrode B for 0.8 second from 0.05 second to 0.85 second after detection of the introduction of a blood sample, then a voltage of 0.1 to 1.0 V was applied multiple times between the electrode A and the electrode B from 0.85 second to 7.0 seconds after the detection of the introduction of a blood sample, and finally a voltage of 2.5 V was applied between the electrode C and the electrode A from 7.1 seconds to 7.5 seconds after the detection of the introduction of a blood sample. The current flowing between the working electrode and the counter electrode of each sensor 1 was measured, and the response current value and the sensitivity difference were measured in the measurement of the Hct value (see FIGS. 127a and 127b). FIG. 127a is a graph showing the sensitivity difference (%) in each case of Glu values of 45 mg/dl and 550 mg/dl with reference to Hct 42% in Comparative Example 14. FIG. 127b is a graph showing the sensitivity difference (%) in each case of Hct values of 0%, 42%, and 70% with reference to Glu 45 mg/dl in Comparative Example 14. FIGS. 127a and 127b each are a graph showing the sensitivity difference in each case at 0.05 second to 0.85 second after the detection.
[0765] From Examples 88 to 93 and Comparative Example 14, it was confirmed that when a voltage of 2.5 V was applied to the working electrode and the counter electrode for 0.1 to 0.6 second at 0.05 second after detection of the introduction of a biological sample, the current value obtained thereby had a high sensitivity, and the Hct value and the Glu value obtained based on the current value had a high accuracy. The voltage application time after the start of blood introduction was changed between 0 and 0.8 second and the graphs showing the sensitivity difference were checked. As a result, it was found that the effect of the glucose concentration gradually increased as the time increased. Particularly, when the voltage application time was 0.8 second as in Comparative Example 14, a divergence was seen in the graph showing the sensitivity difference in each case of Hct values of 0%, 42%, and 70% particularly with reference to Glu 550 mg/dl as shown in FIG. 127b.
[0766] According to the present invention, in the examples in which the voltage application time was longer than 0 second and up to 0.6 second, the sensitivity difference (%) was small. Therefore, it was confirmed that the Hct measurement accuracy was improved. Furthermore, it was confirmed that according to the present invention, Hct can be measured in a short time. Thus, by obtaining such Hct values, it was possible to obtain a corrected Glu value in a short time. Furthermore, according to the present invention, since the current value that depends on Glu in the vicinity of the electrodes that are in contact with the reagent part and the current value that depends on Hct in the vicinity of the same electrodes are used to obtain a Glu value, the Glu value can be measured, with the properties of the biological sample in the vicinity of the electrodes being reflected with higher accuracy.
INDUSTRIAL APPLICABILITY
[0767] As described above, in the method for measuring a component of a biological sample according to the present invention, a Hct value can be measured in a short time with an electrode system having a reagent layer disposed thereon and the accuracy of the Glu value calculated under the same reagent layer is improved. Accordingly, the method of the present invention can be preferably used in all fields of measuring blood components such as biology, biochemistry, and medicine, and is particularly suitable for the field of clinical examinations.
REFERENCE SIGNS LIST
[0768] A Electrode A [0769] B Electrode B [0770] C Electrode C [0771] D Electrode D [0772] E Electrode E [0773] F Electrode F [0774] 11 Reagent Layer [0775] 12 Biological Sample Supply Port [0776] 13 Air Hole [0777] 14 Channel [0778] 101 Insulating Substrate [0779] 102 Spacer [0780] 103 Cover [0781] 1 Sensor [0782] 2 Measuring Apparatus [0783] 4 Display Unit [0784] 5 Insertion Port [0785] 6 Input Terminal Area [0786] 30 A/D Conversion Unit [0787] 31 Determination Means [0788] 32 Display Unit [0789] 33 Power Supply Unit [0790] 34 Memory [0791] 35 Clock [0792] 36 Correction Means [0793] 37 Voltage Applying Unit [0794] 38 Current-Voltage Conversion Unit [0795] 39 Control Unit
* * * * *
D00000
D00001
D00002
D00003
D00004
D00005
D00006
D00007
D00008
D00009
D00010
D00011
D00012

D00013

D00014

D00015

D00016
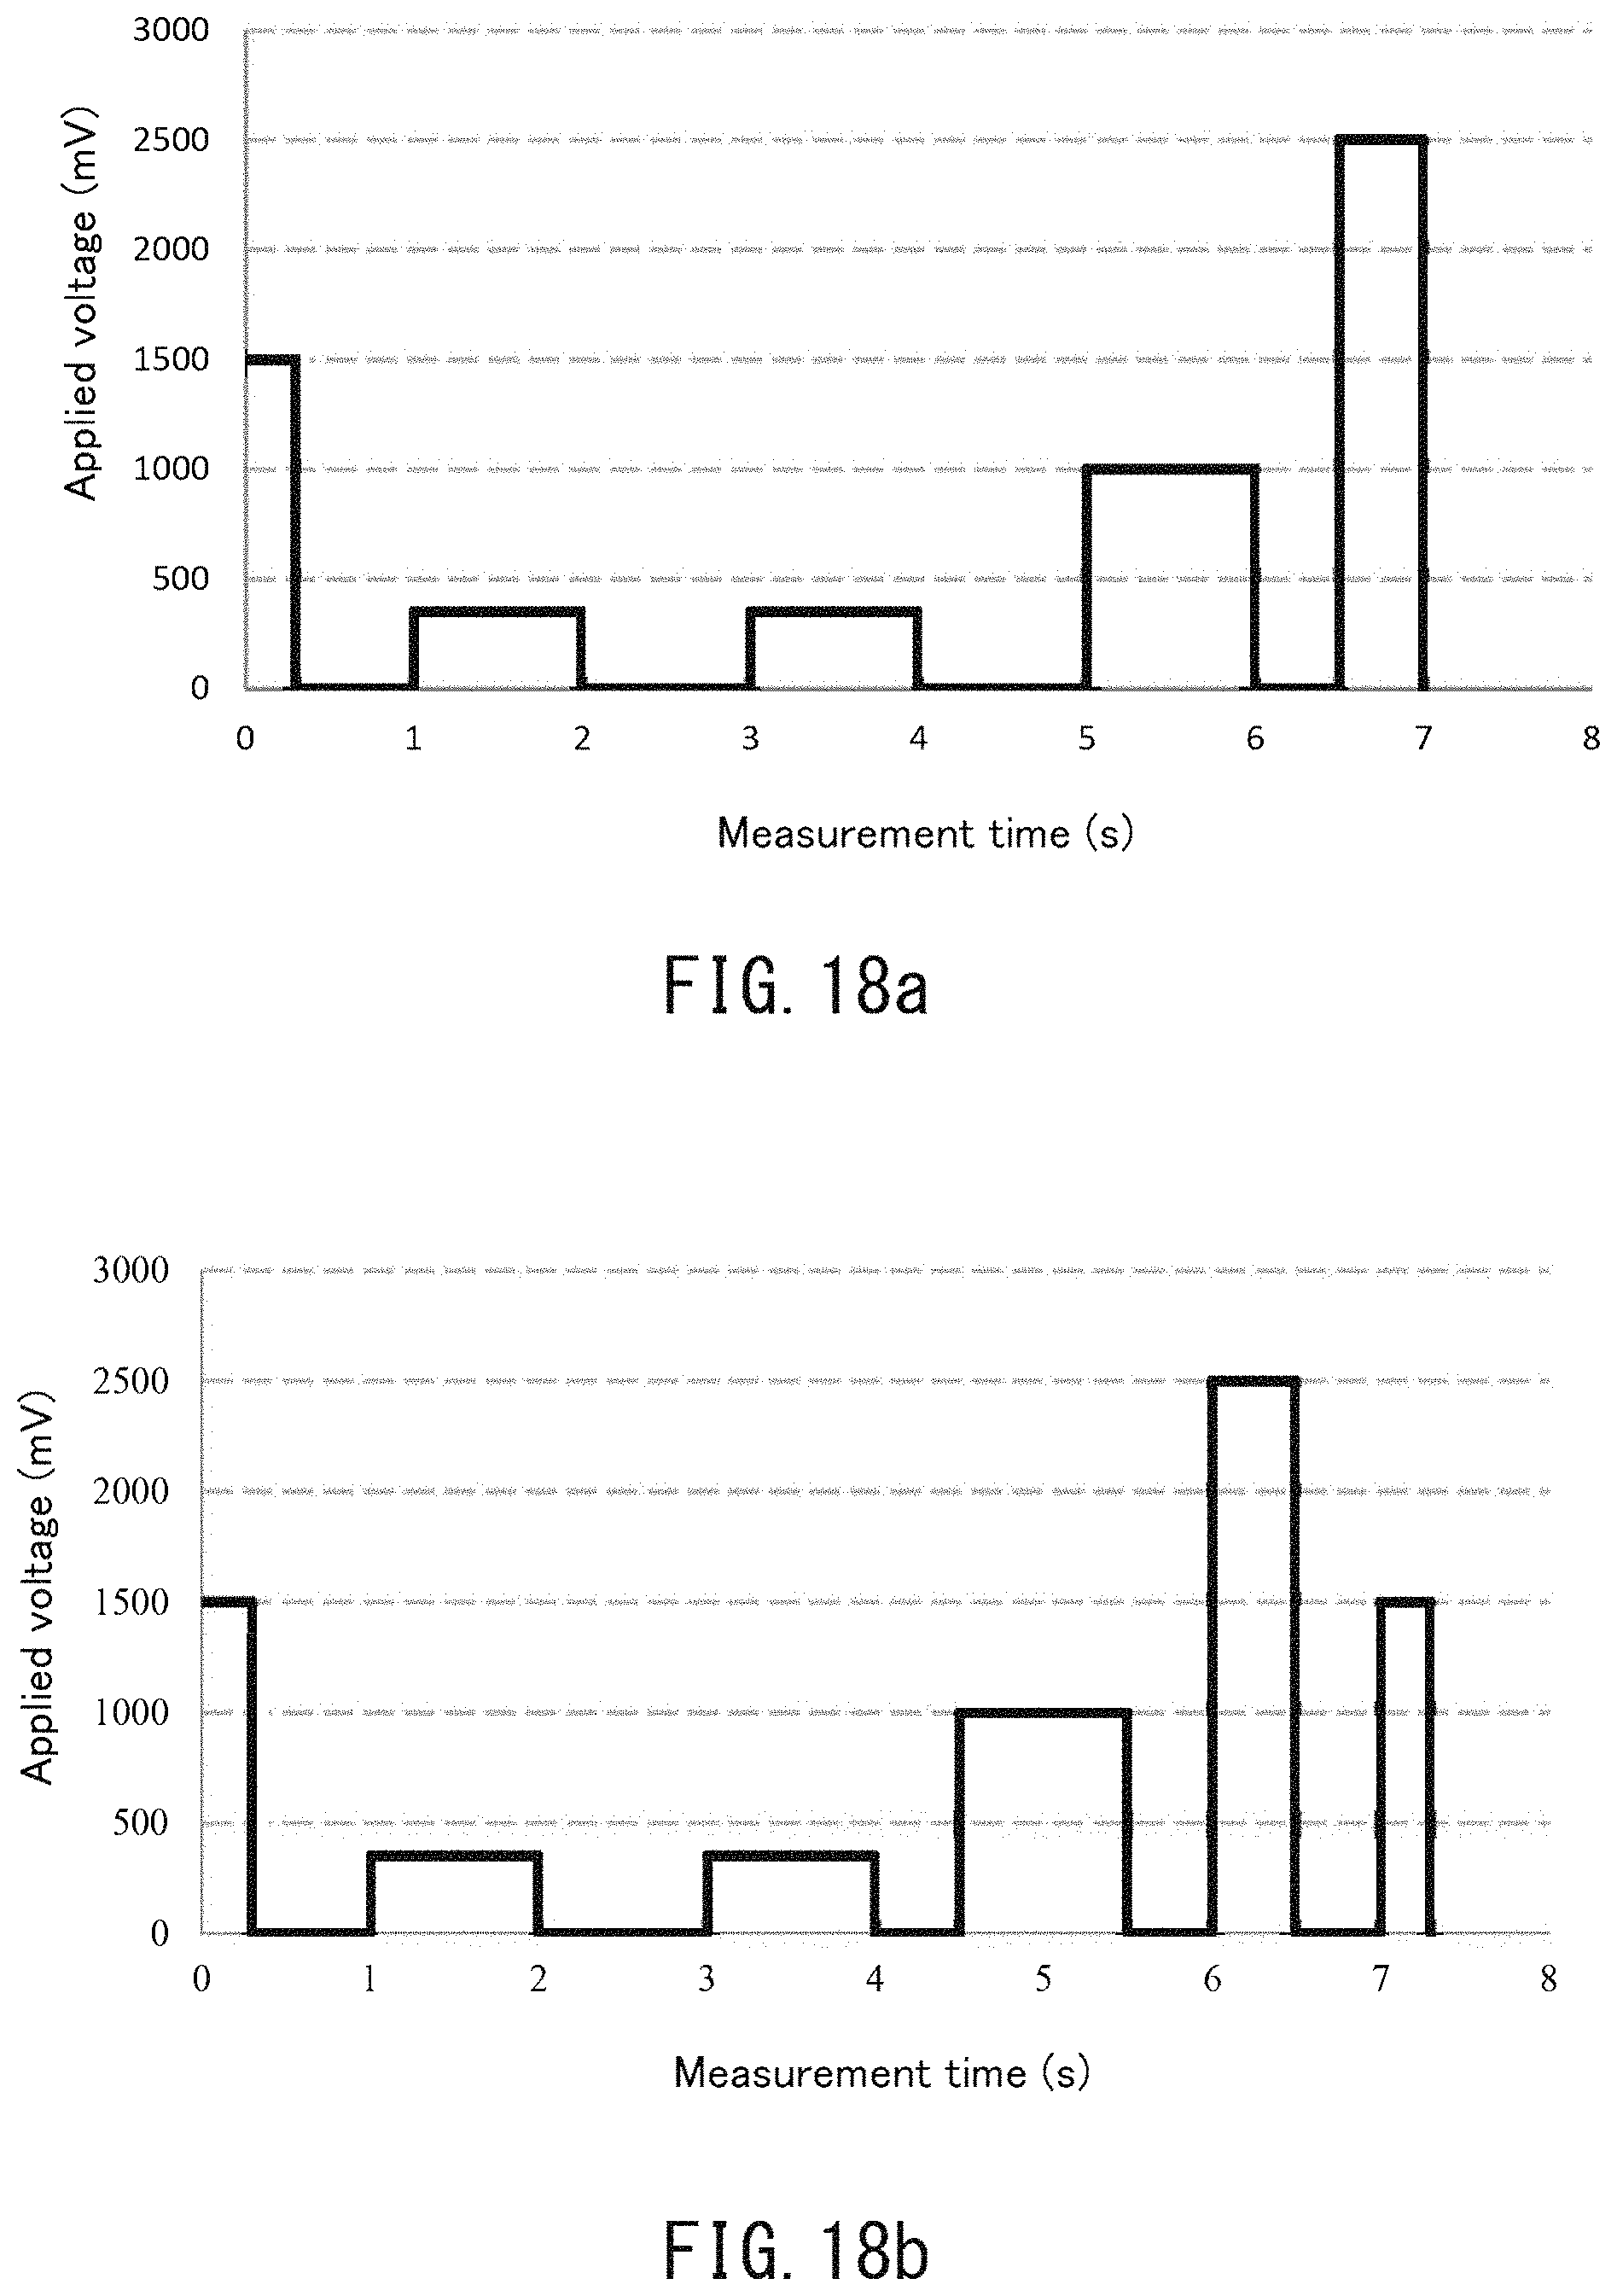
D00017

D00018

D00019

D00020

D00021

D00022

D00023

D00024

D00025
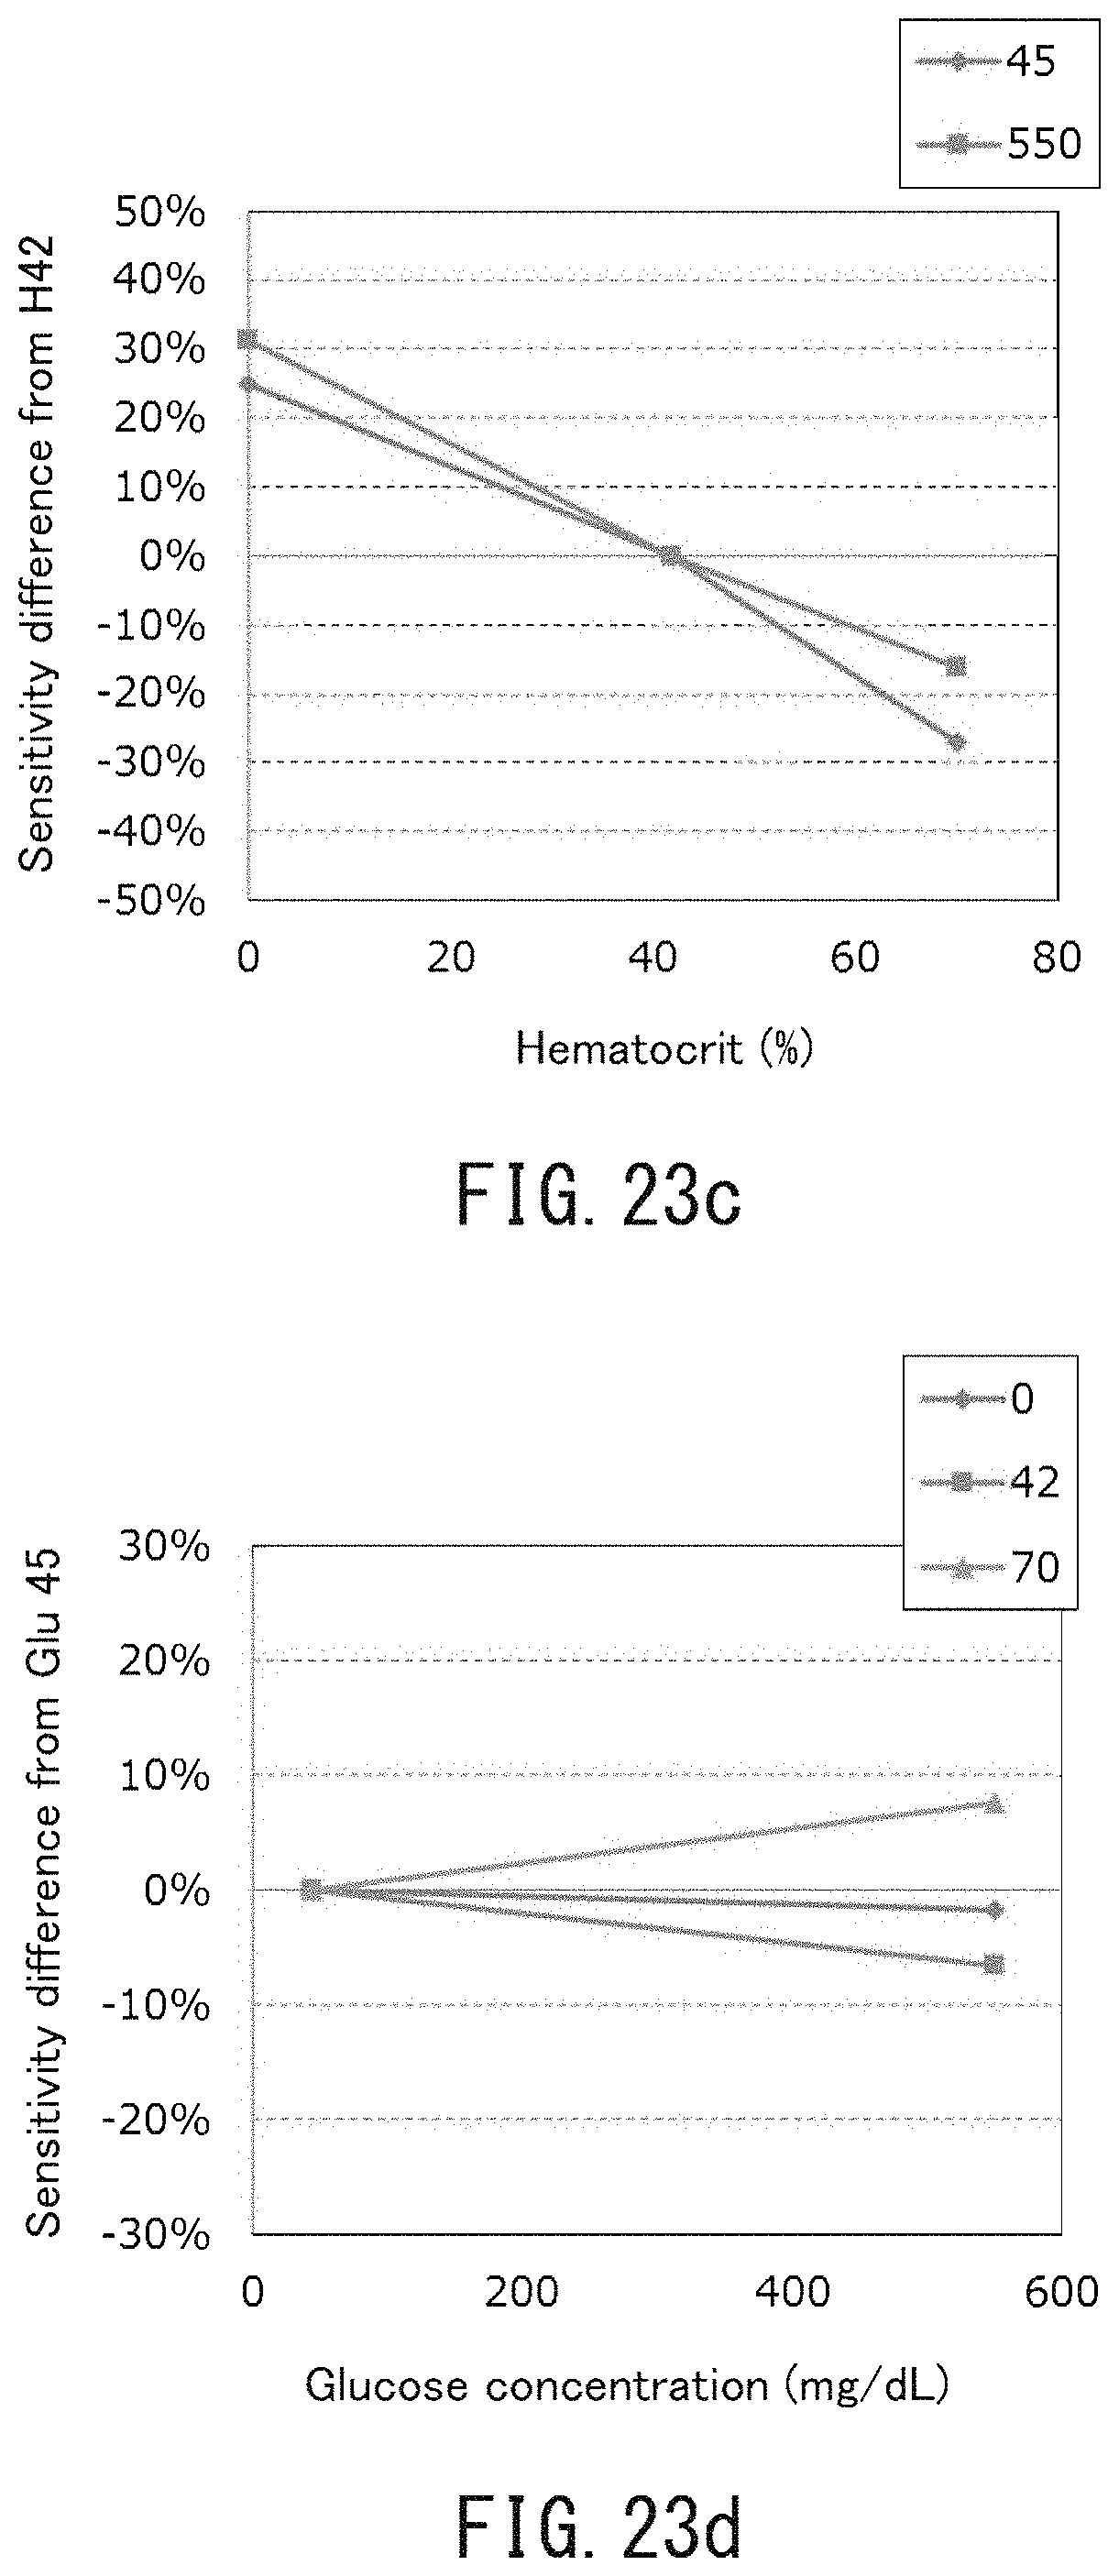
D00026

D00027

D00028

D00029

D00030

D00031
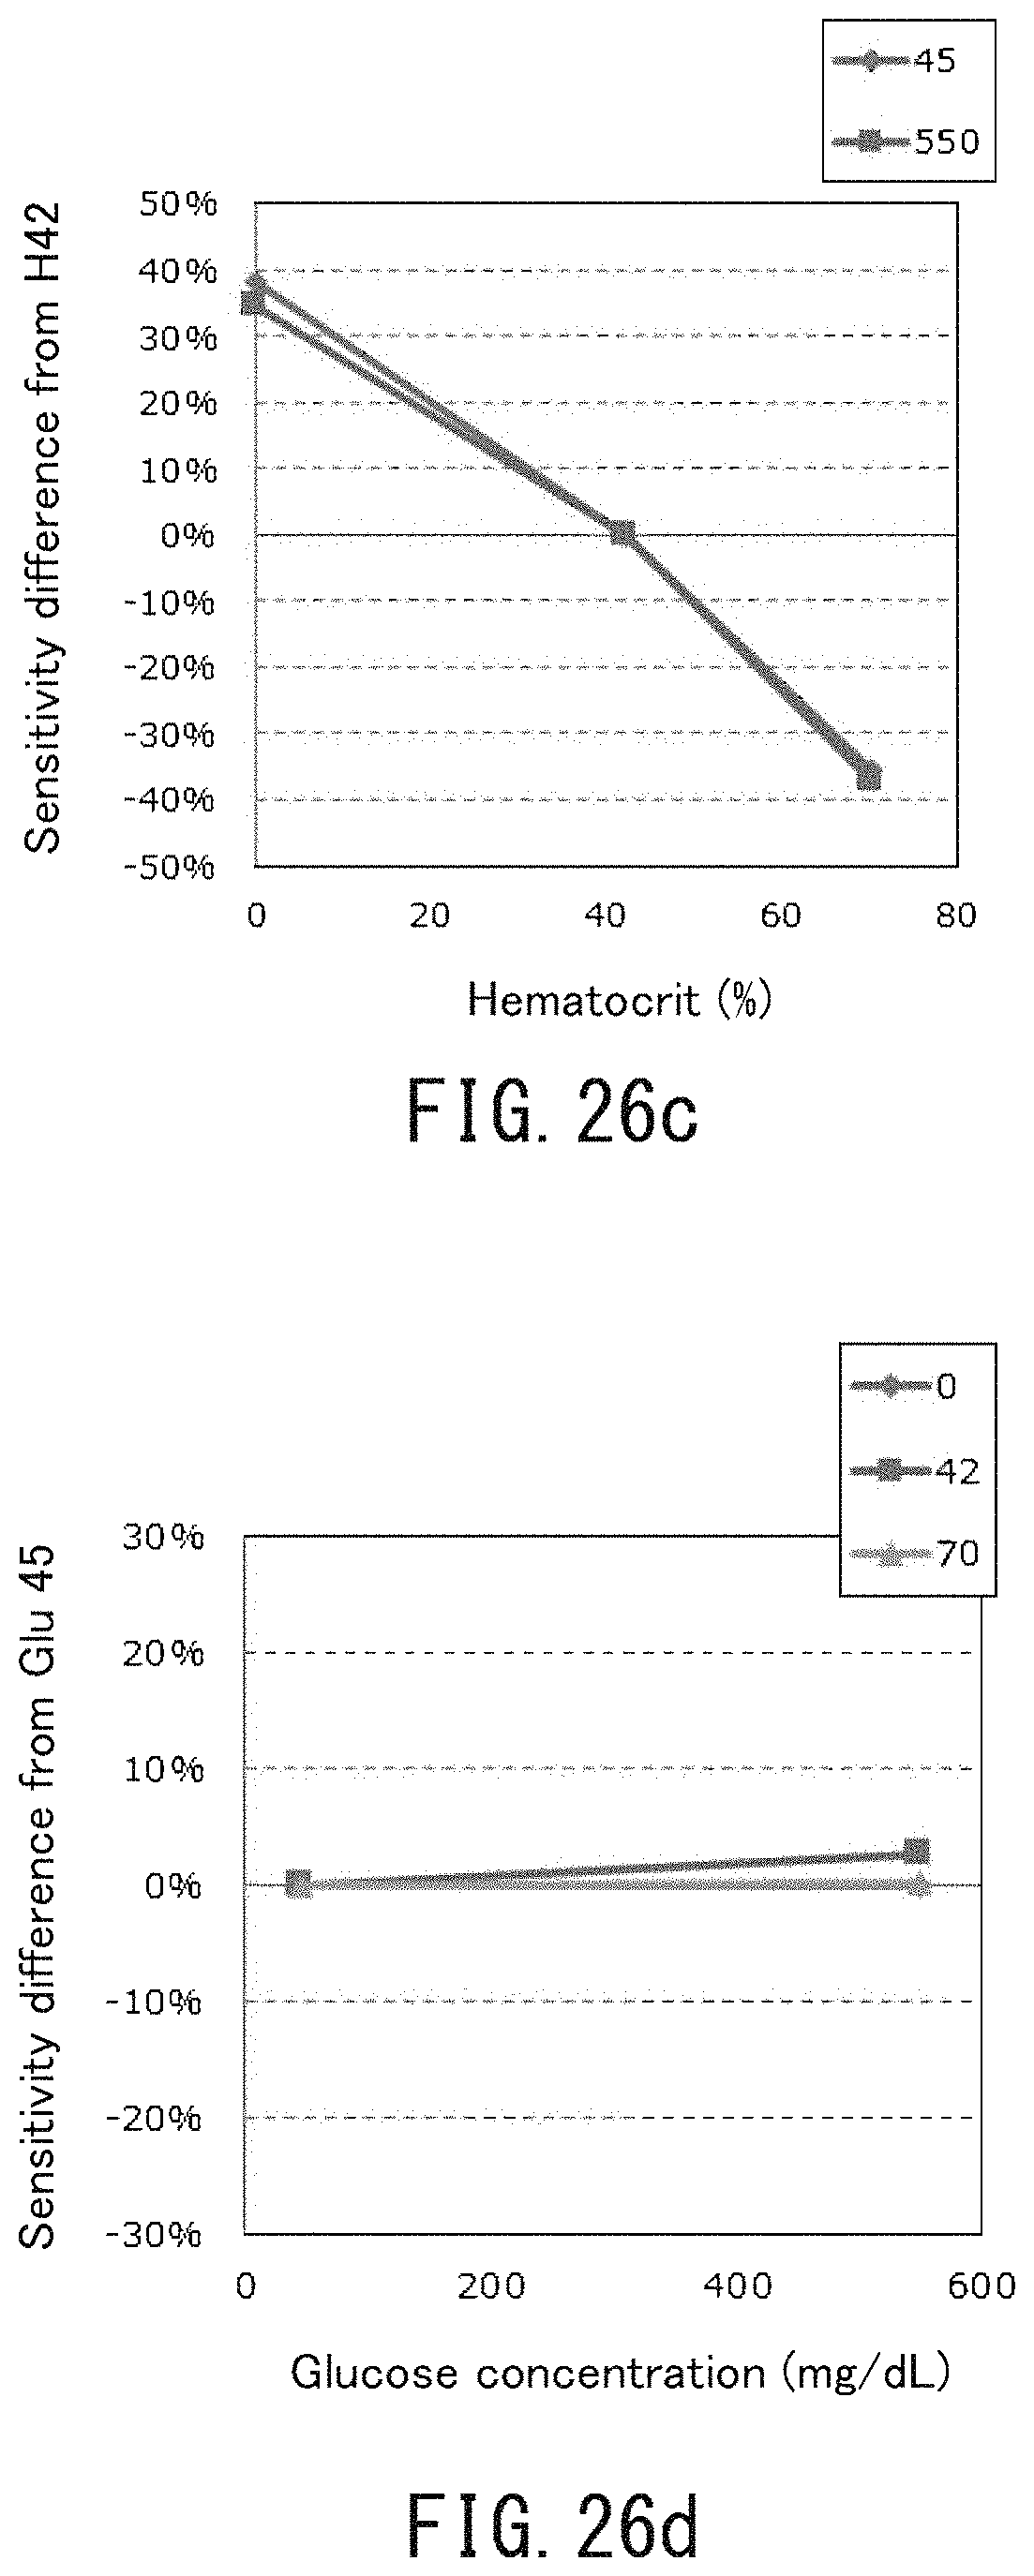
D00032

D00033

D00034

D00035

D00036

D00037

D00038

D00039

D00040

D00041

D00042

D00043

D00044

D00045

D00046

D00047
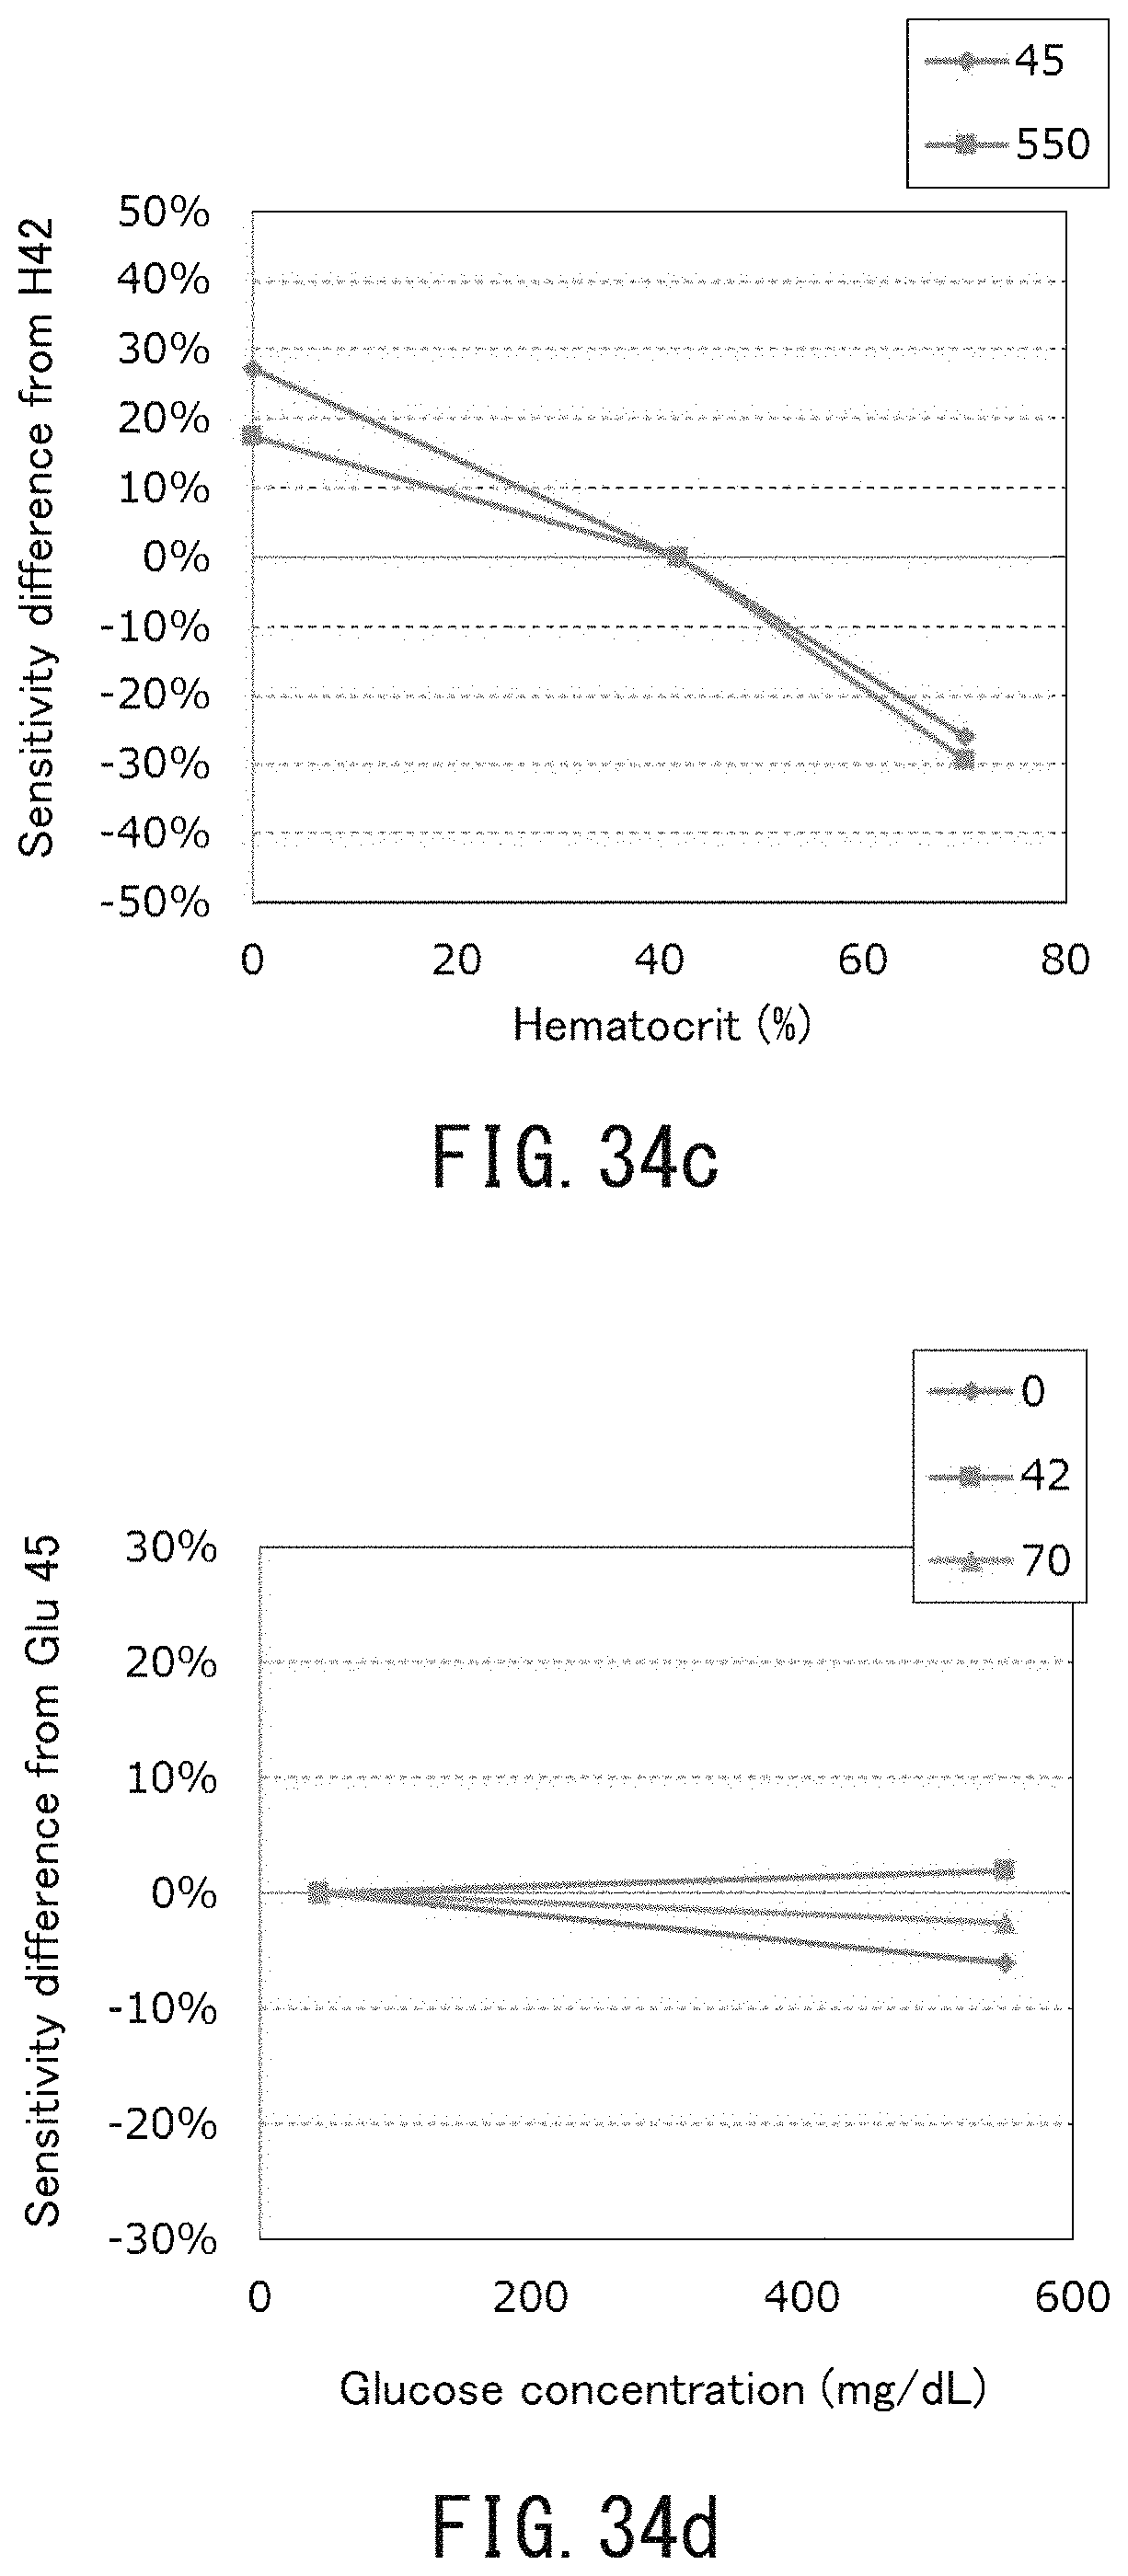
D00048

D00049

D00050

D00051

D00052

D00053

D00054

D00055

D00056

D00057

D00058

D00059
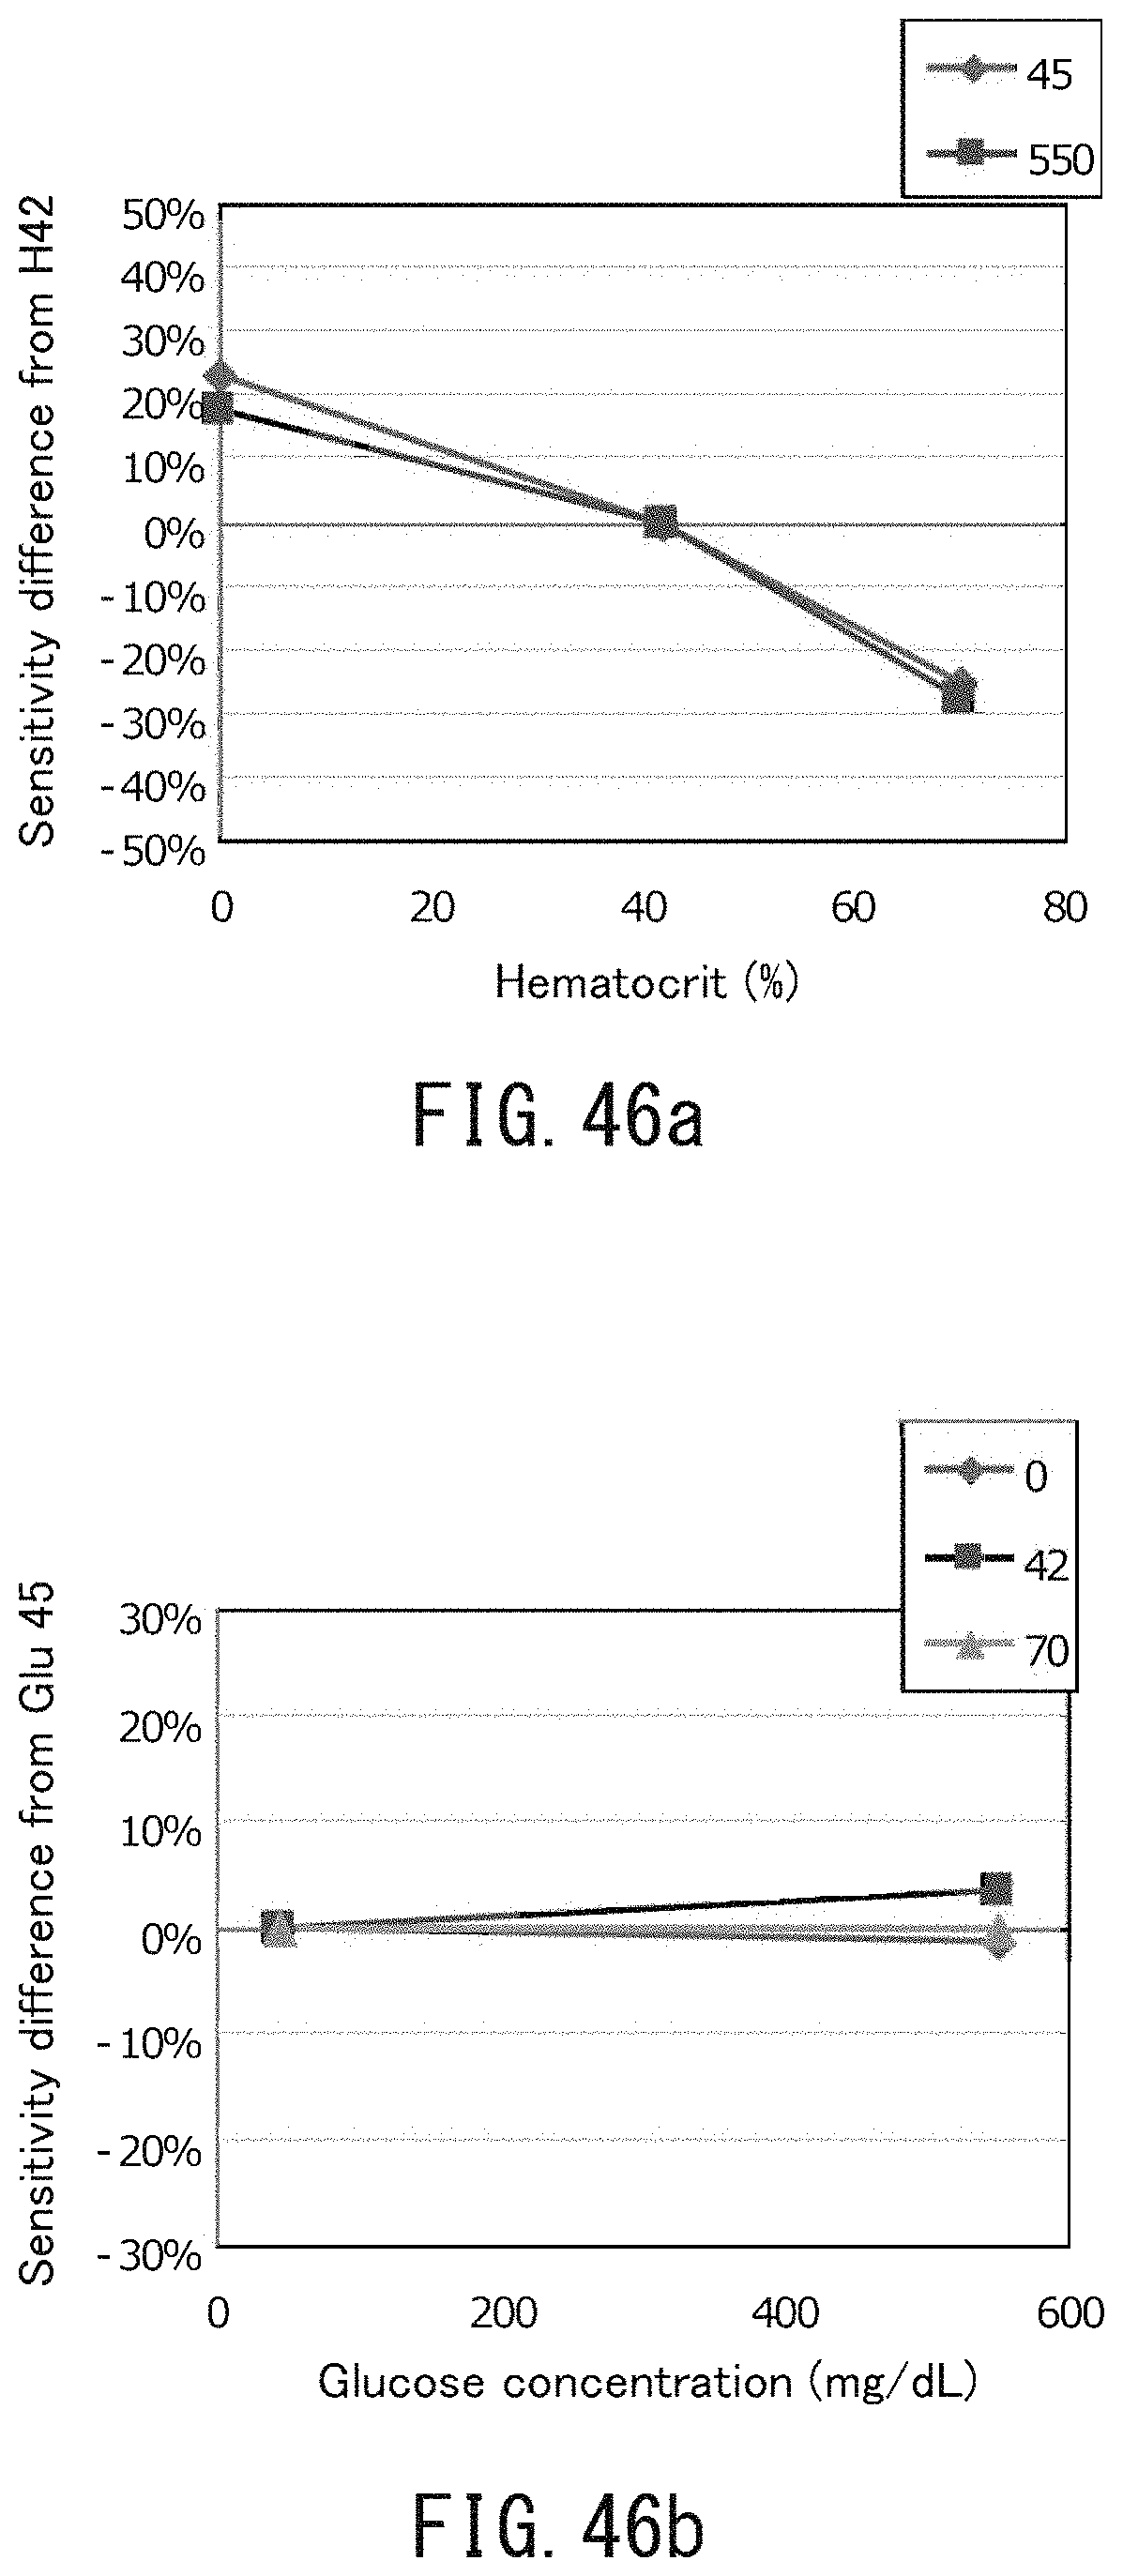
D00060
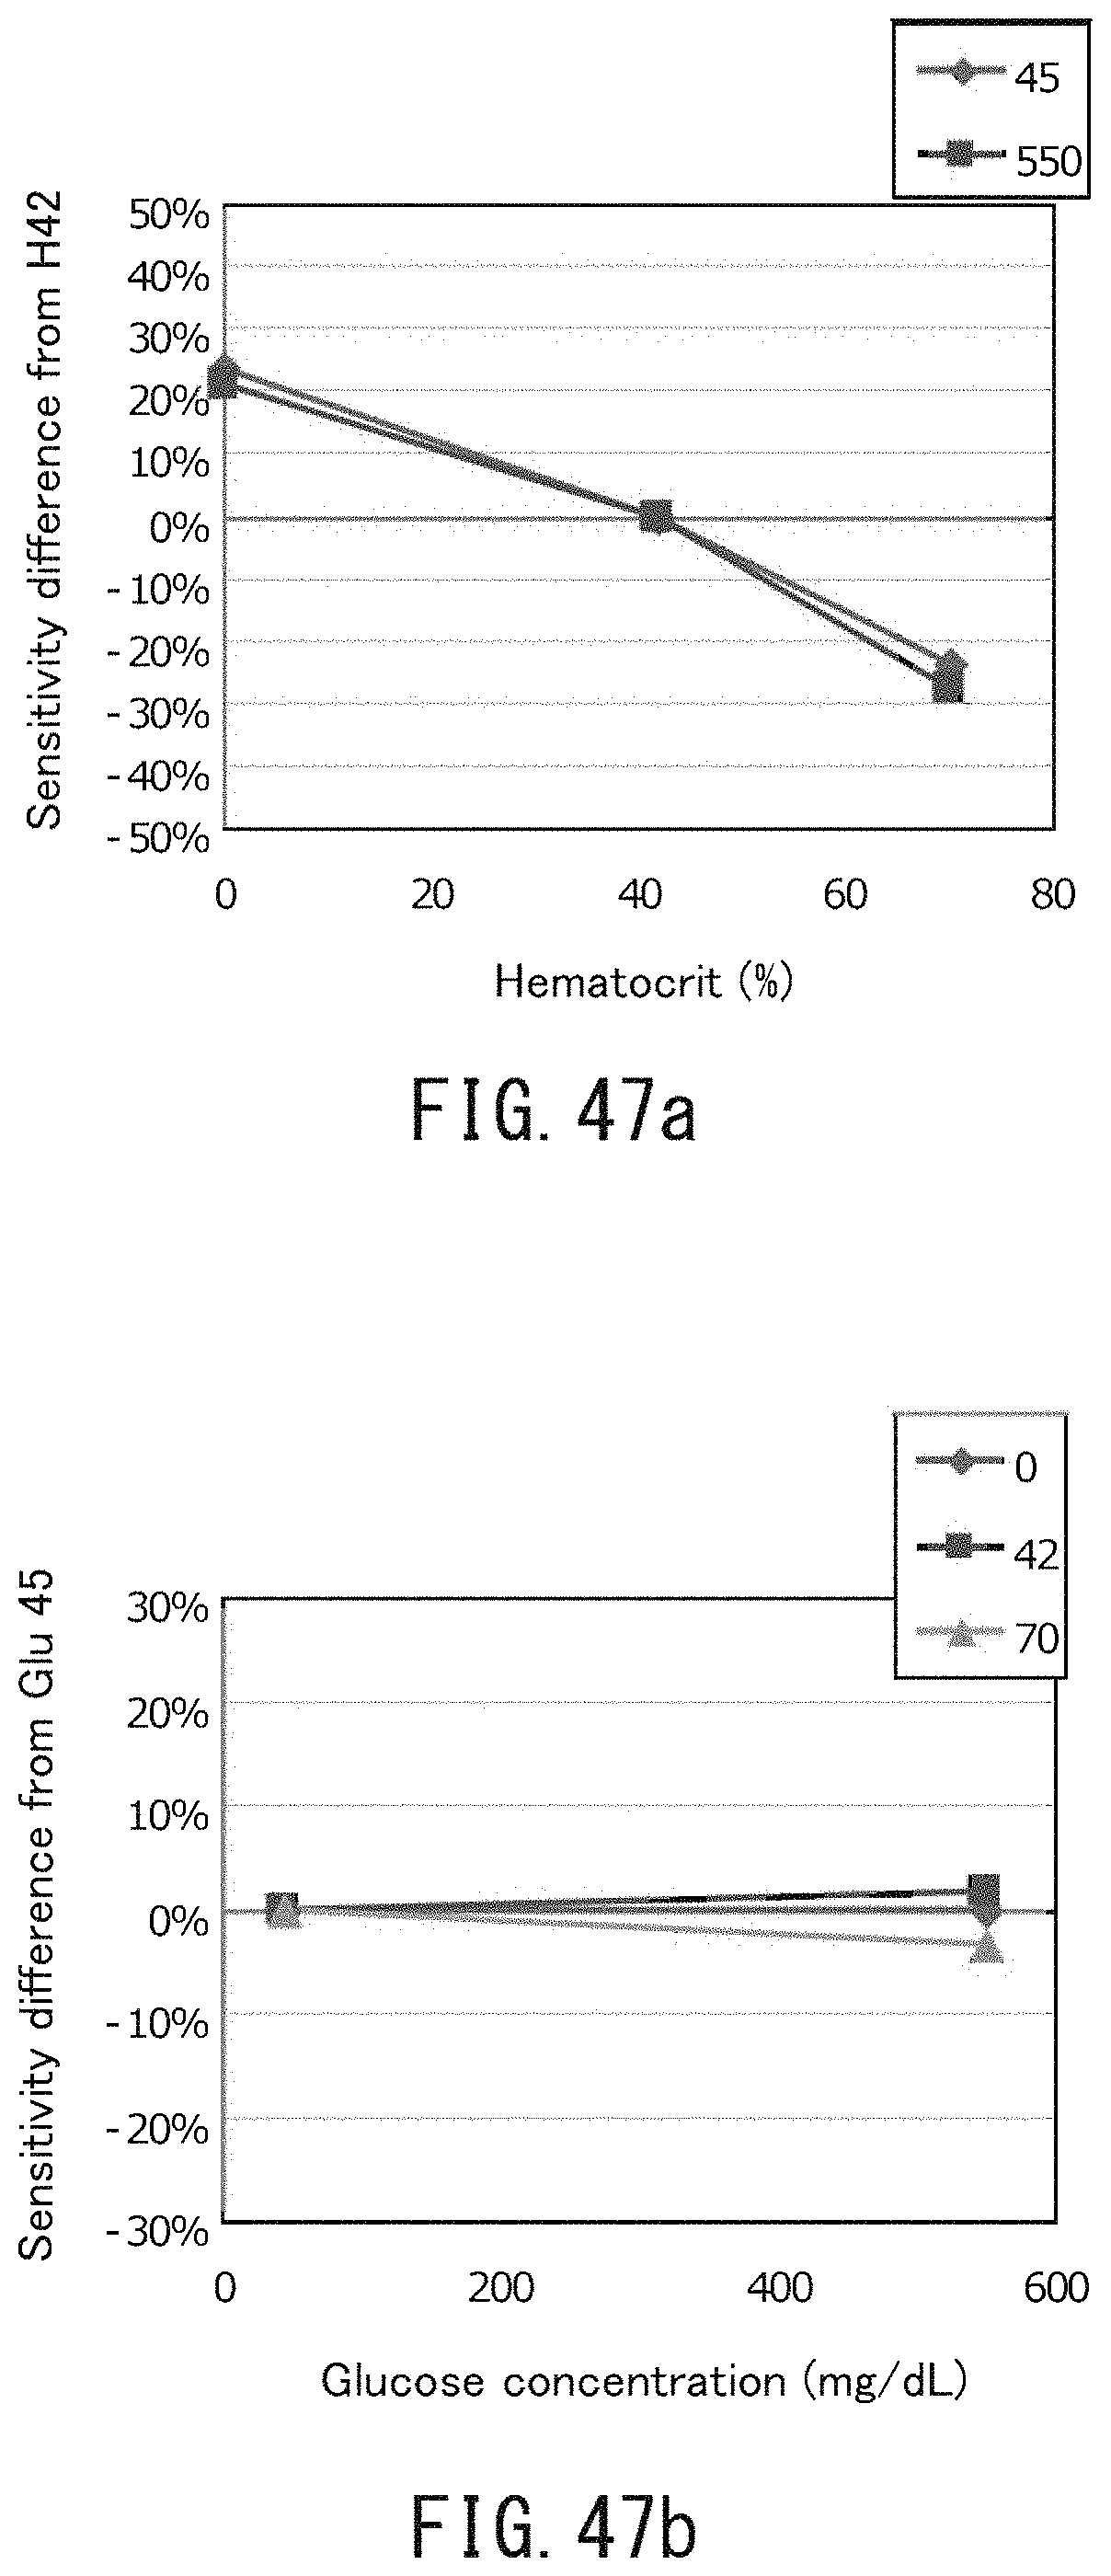
D00061

D00062

D00063

D00064

D00065

D00066

D00067

D00068

D00069

D00070

D00071

D00072

D00073

D00074

D00075
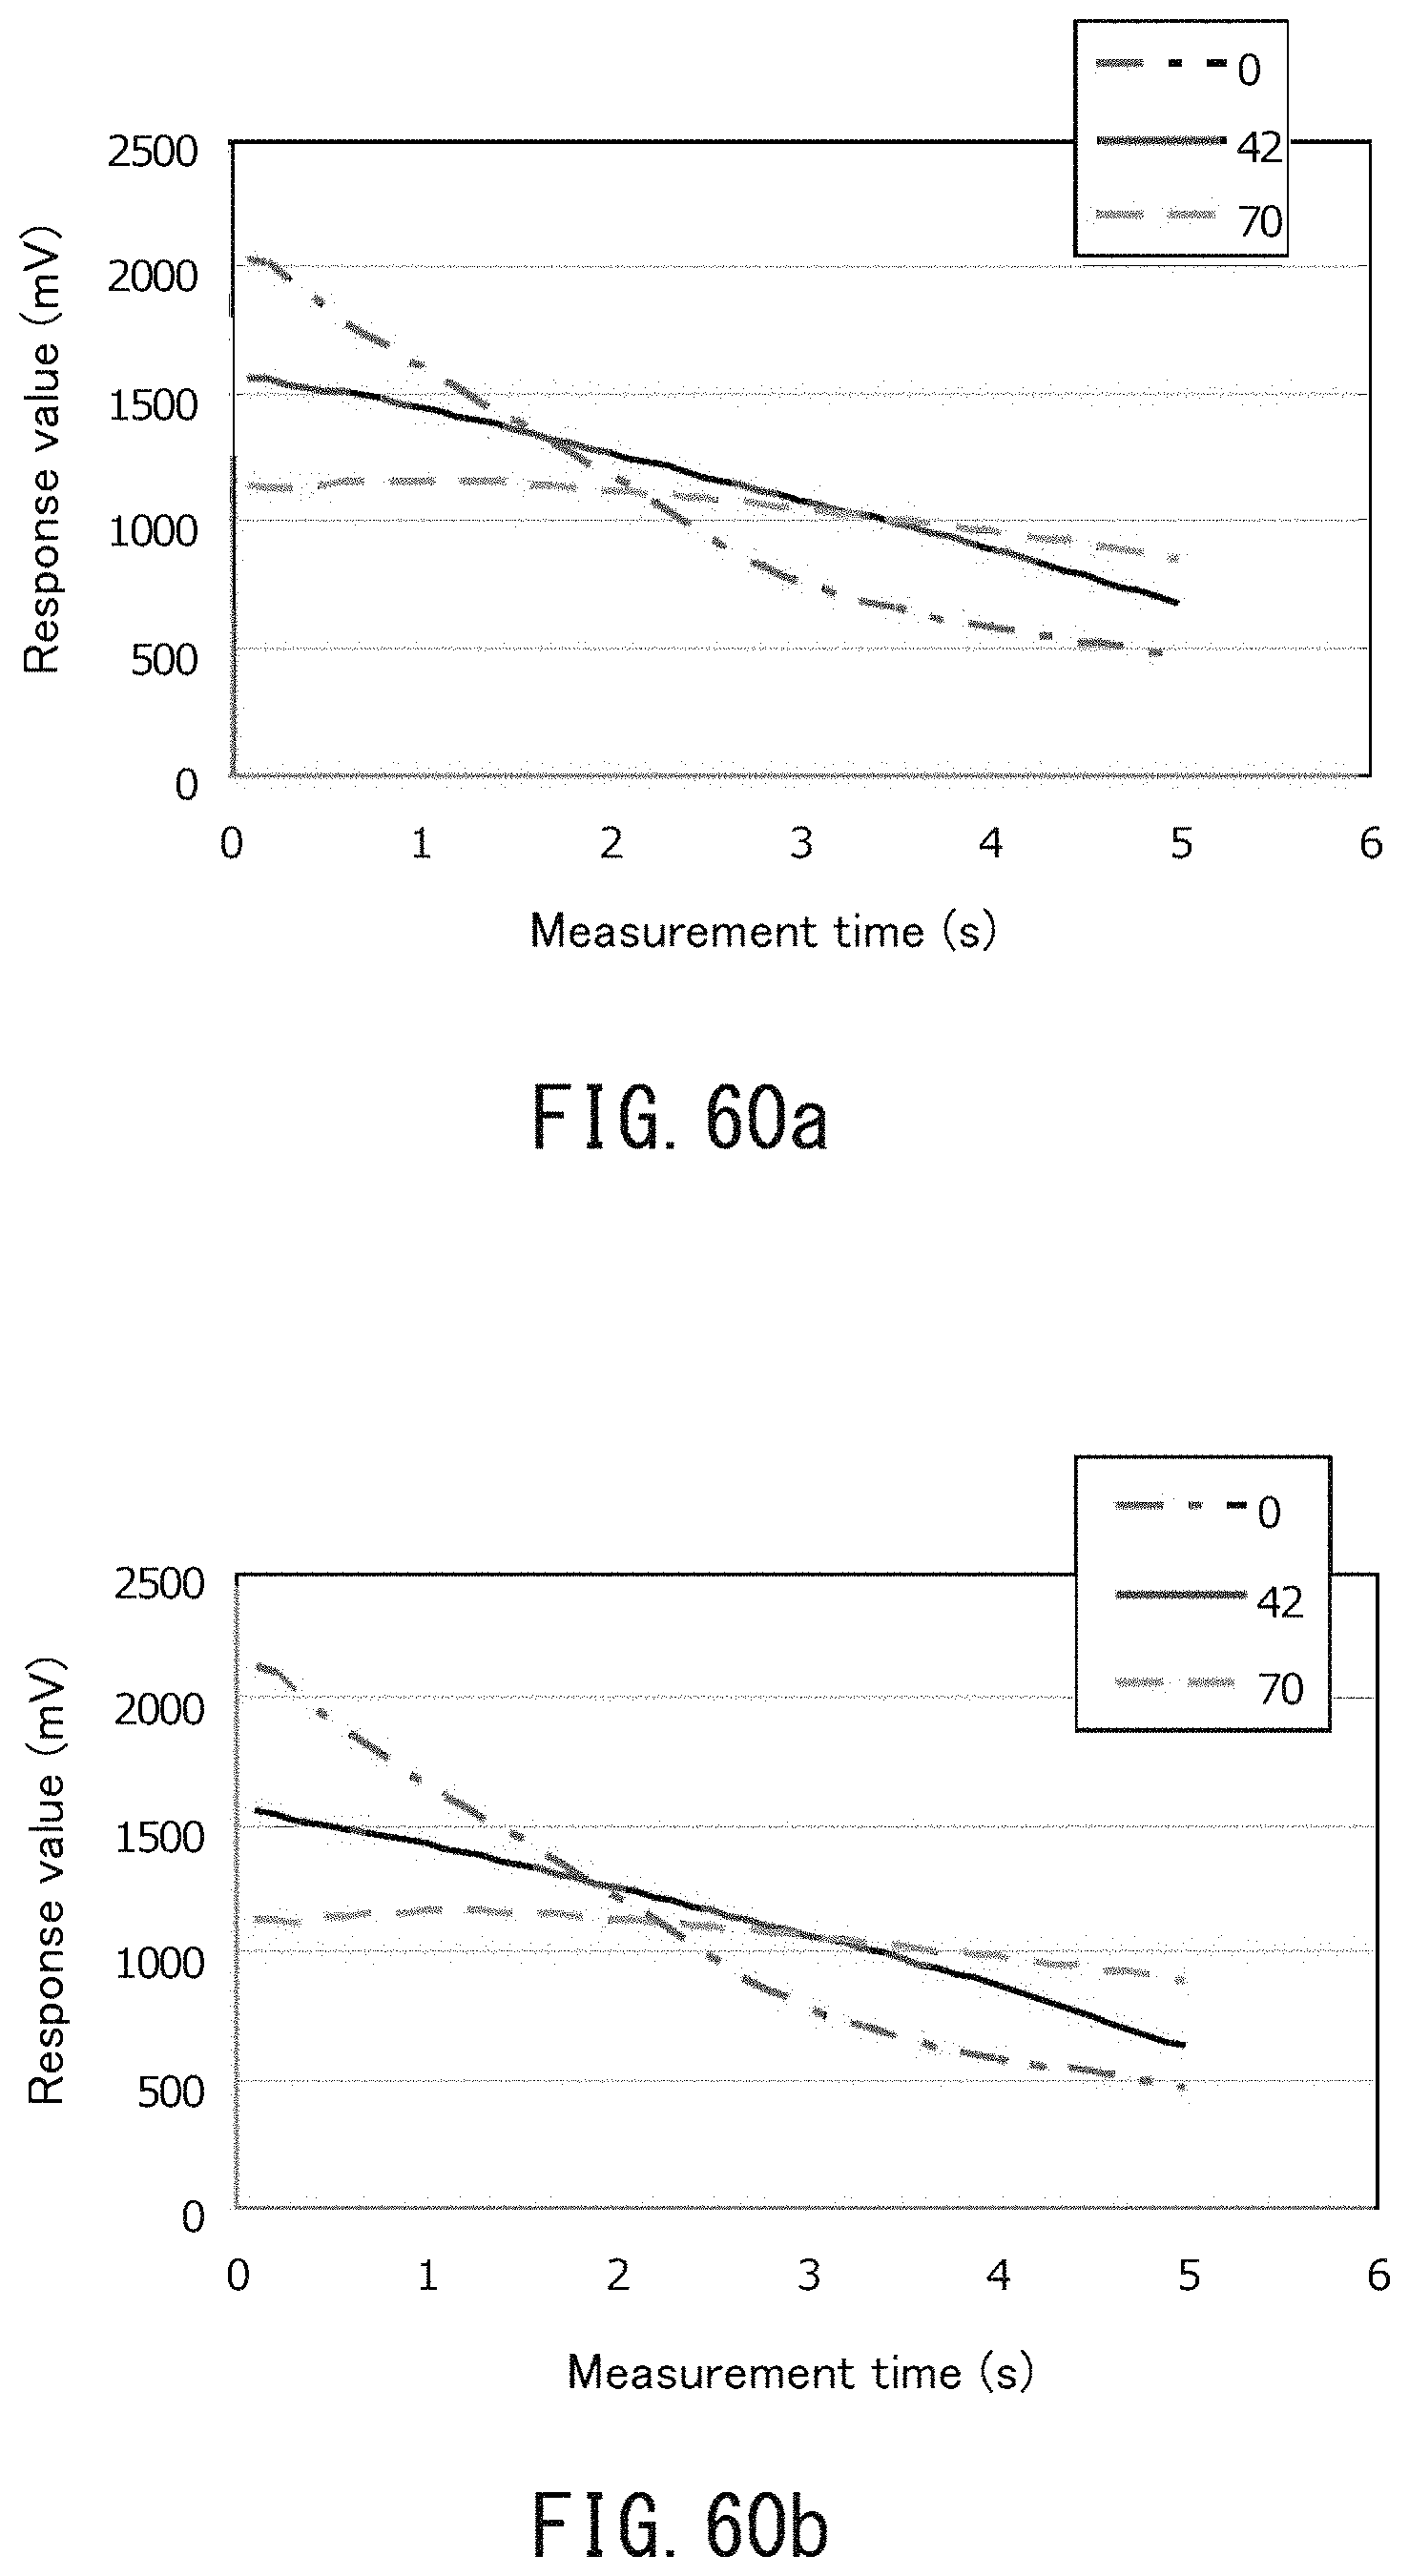
D00076

D00077

D00078

D00079

D00080

D00081

D00082

D00083

D00084

D00085

D00086

D00087

D00088
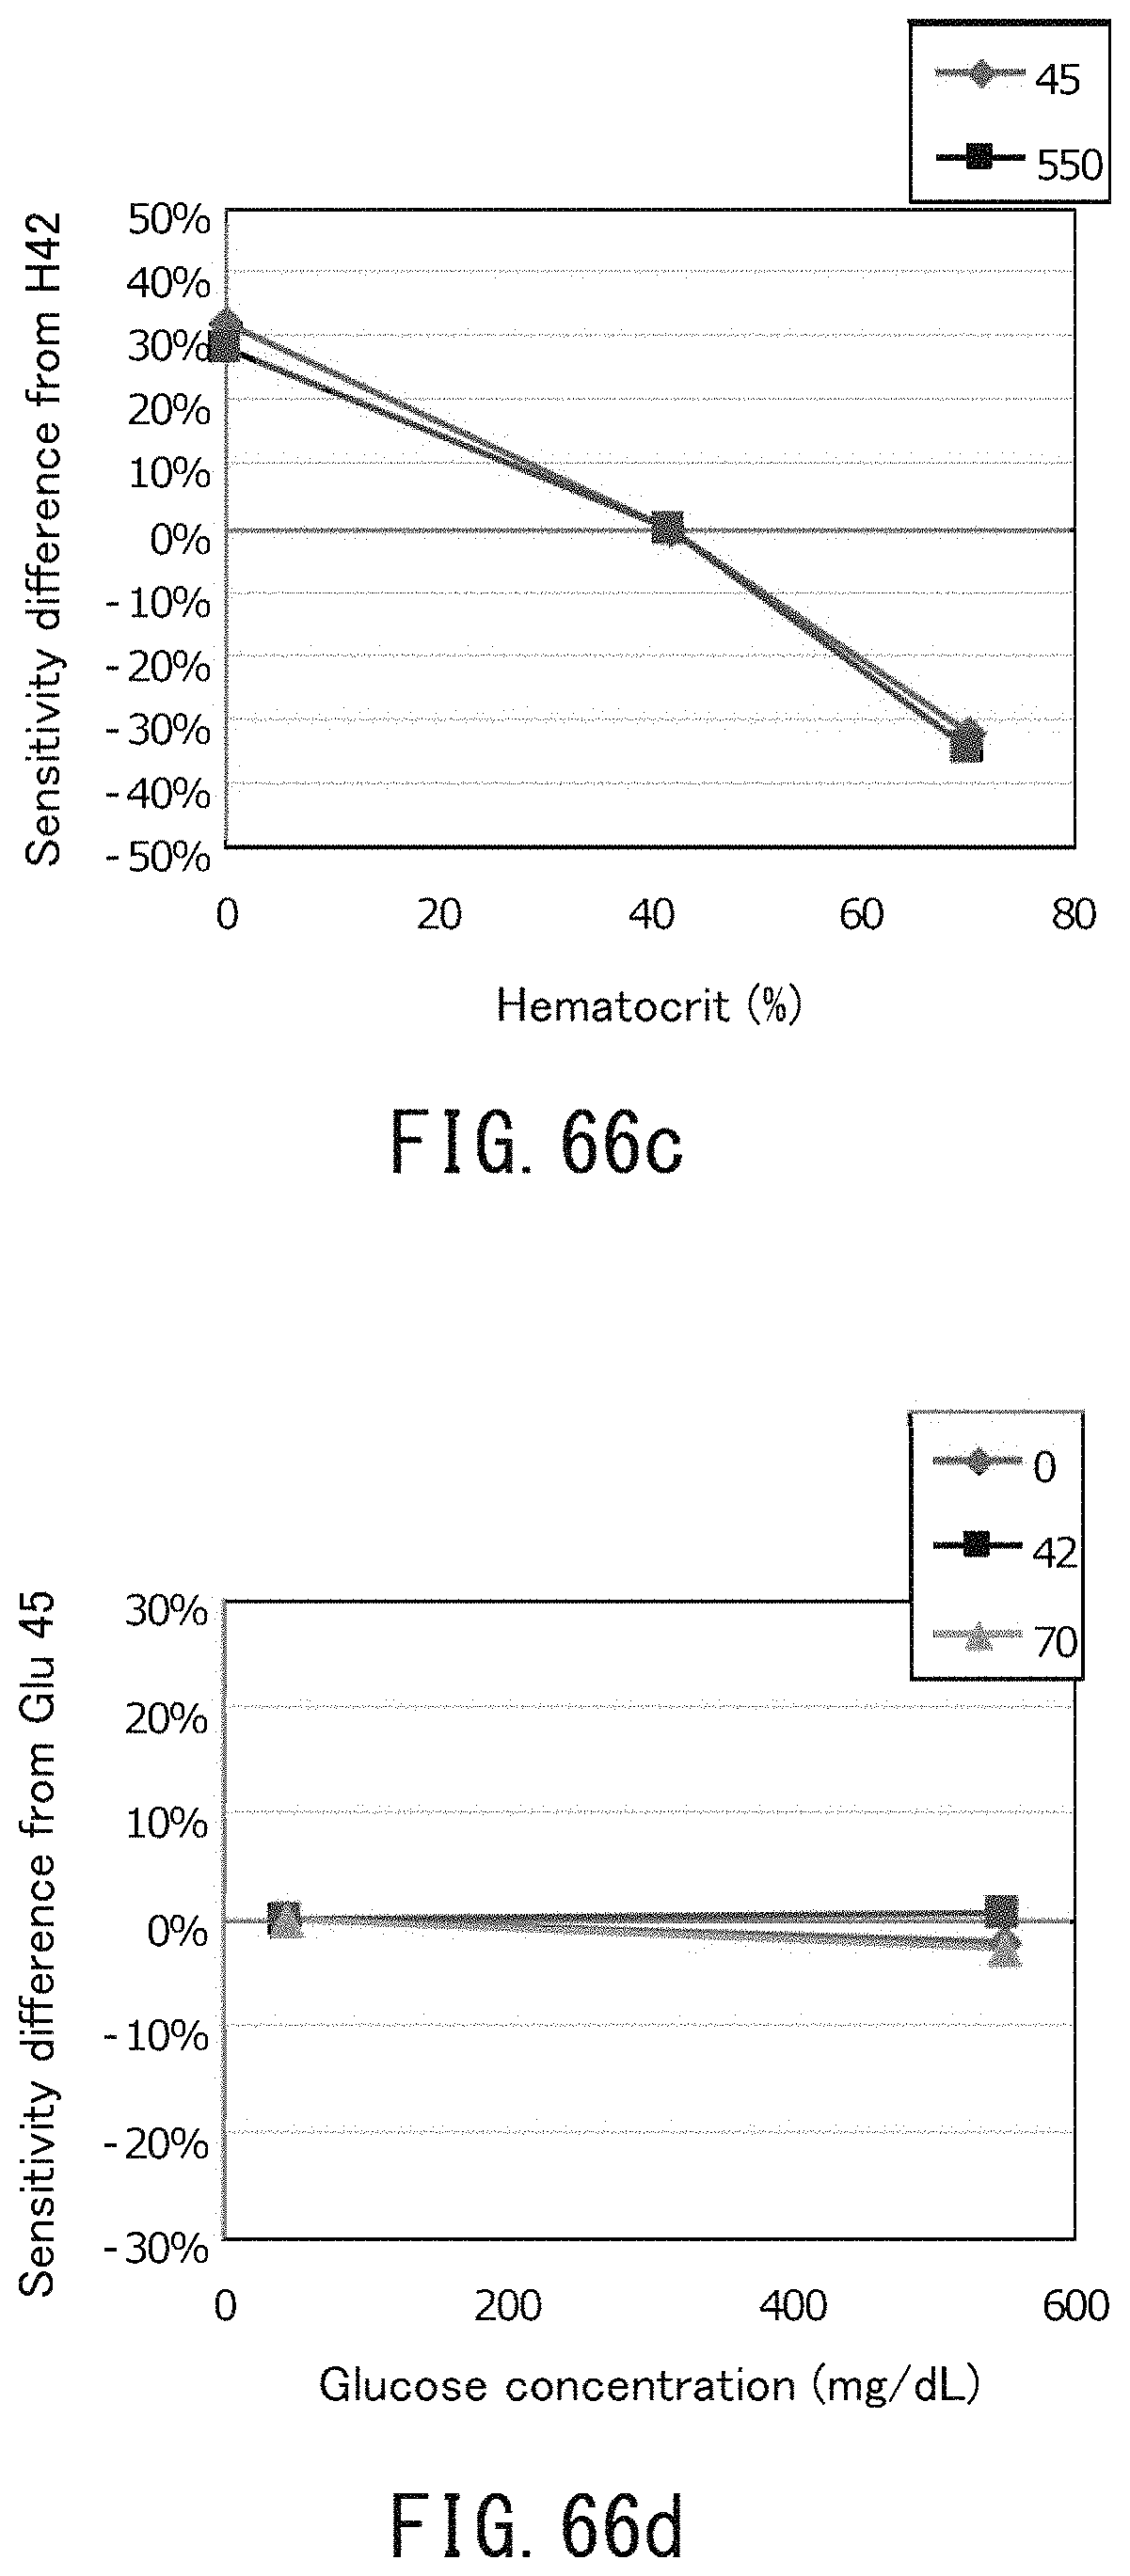
D00089

D00090

D00091

D00092

D00093

D00094

D00095

D00096

D00097

D00098
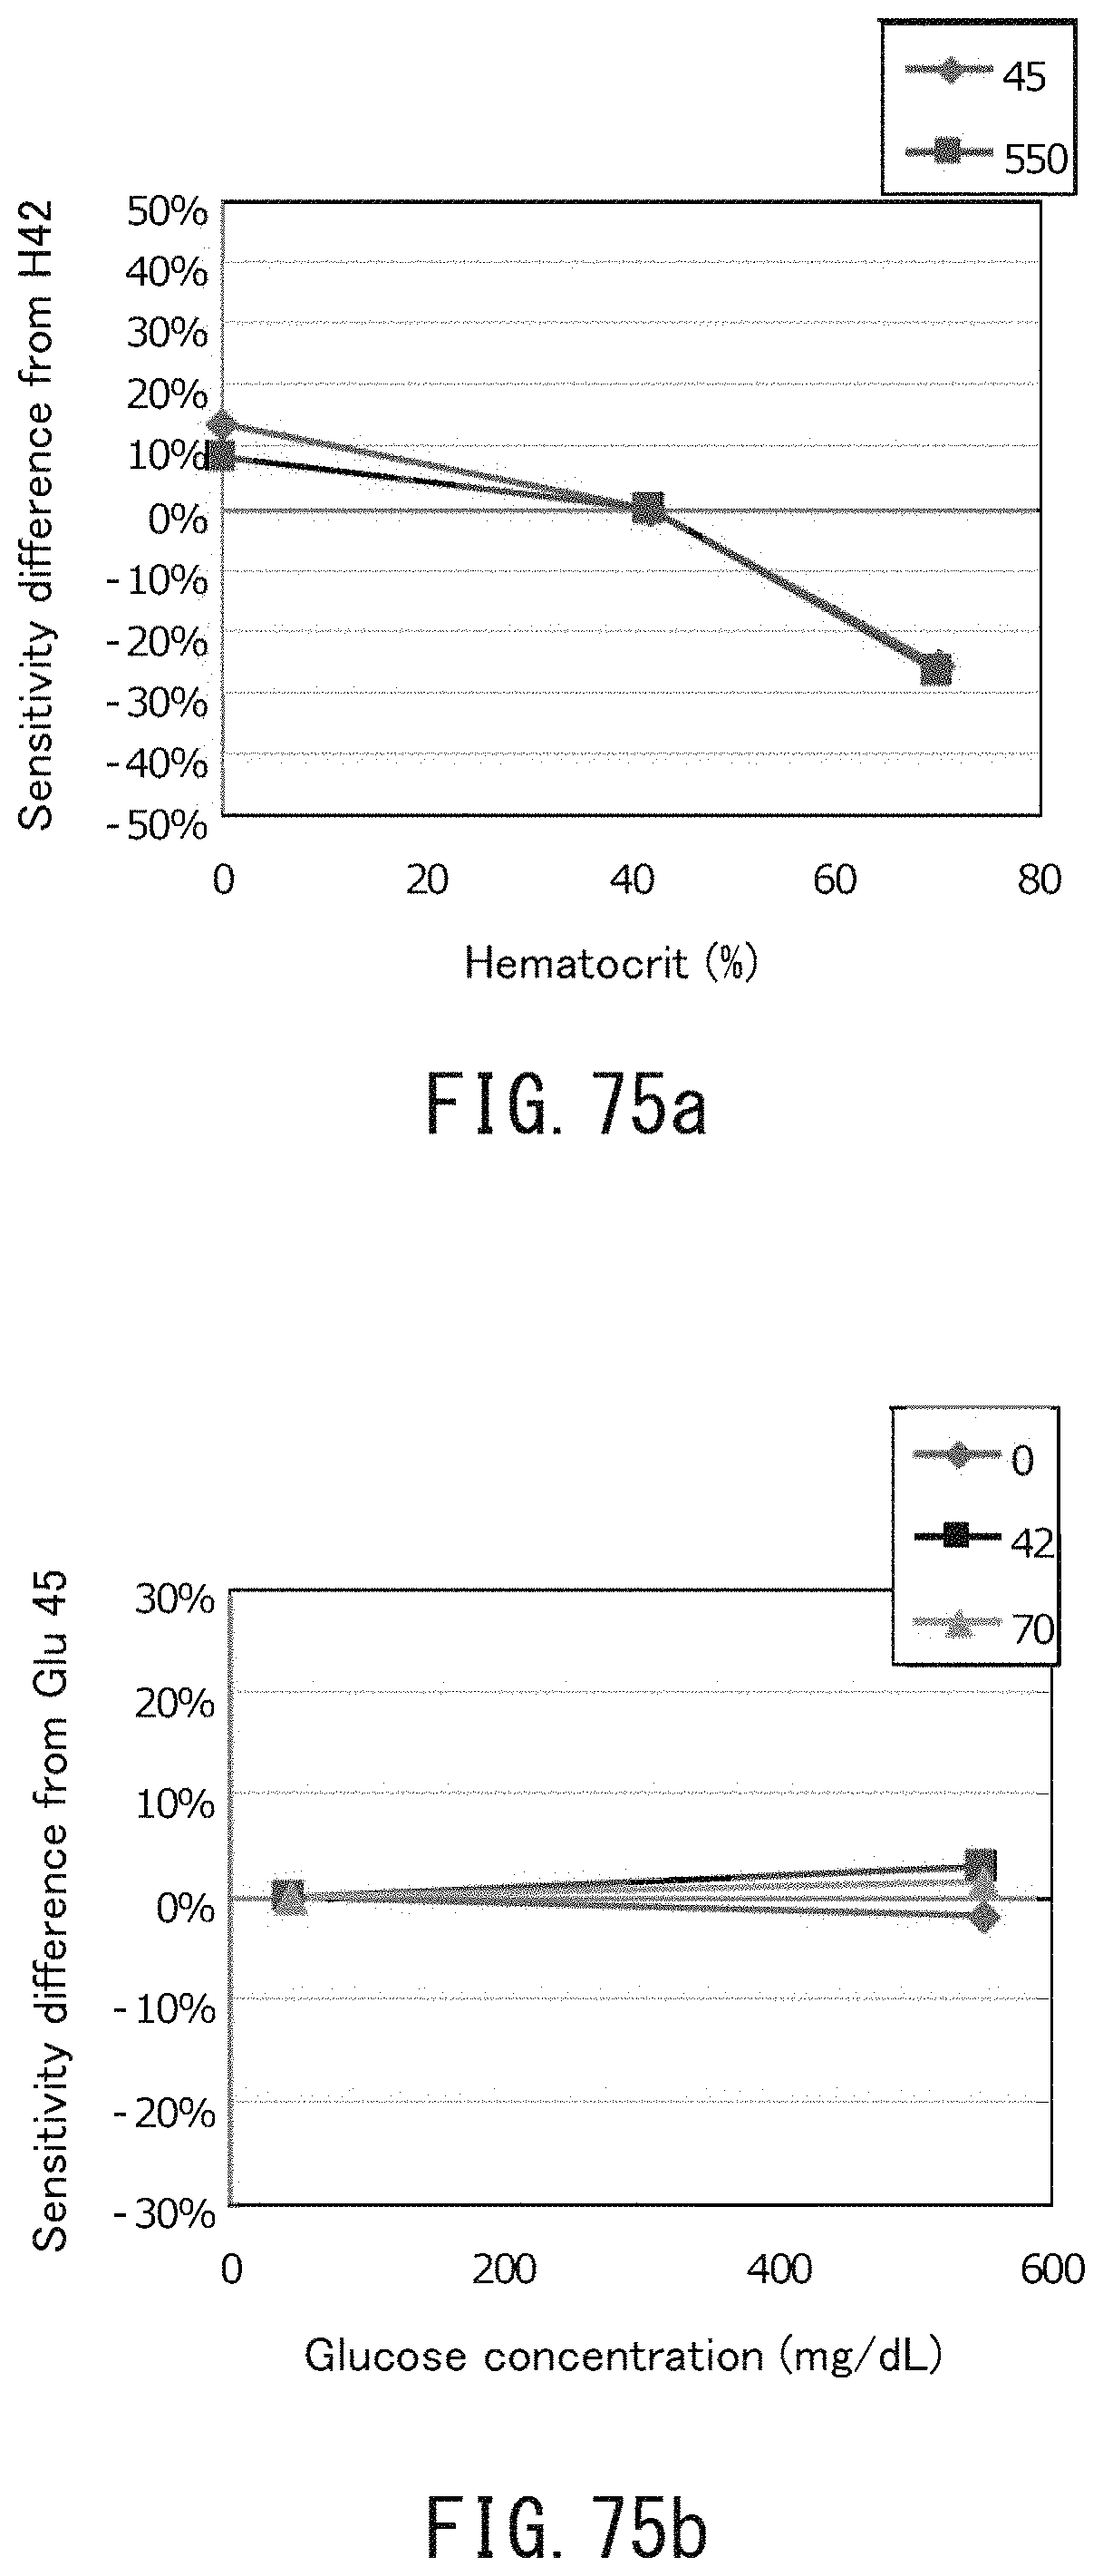
D00099

D00100

D00101

D00102

D00103

D00104

D00105

D00106

D00107

D00108

D00109

D00110

D00111

D00112
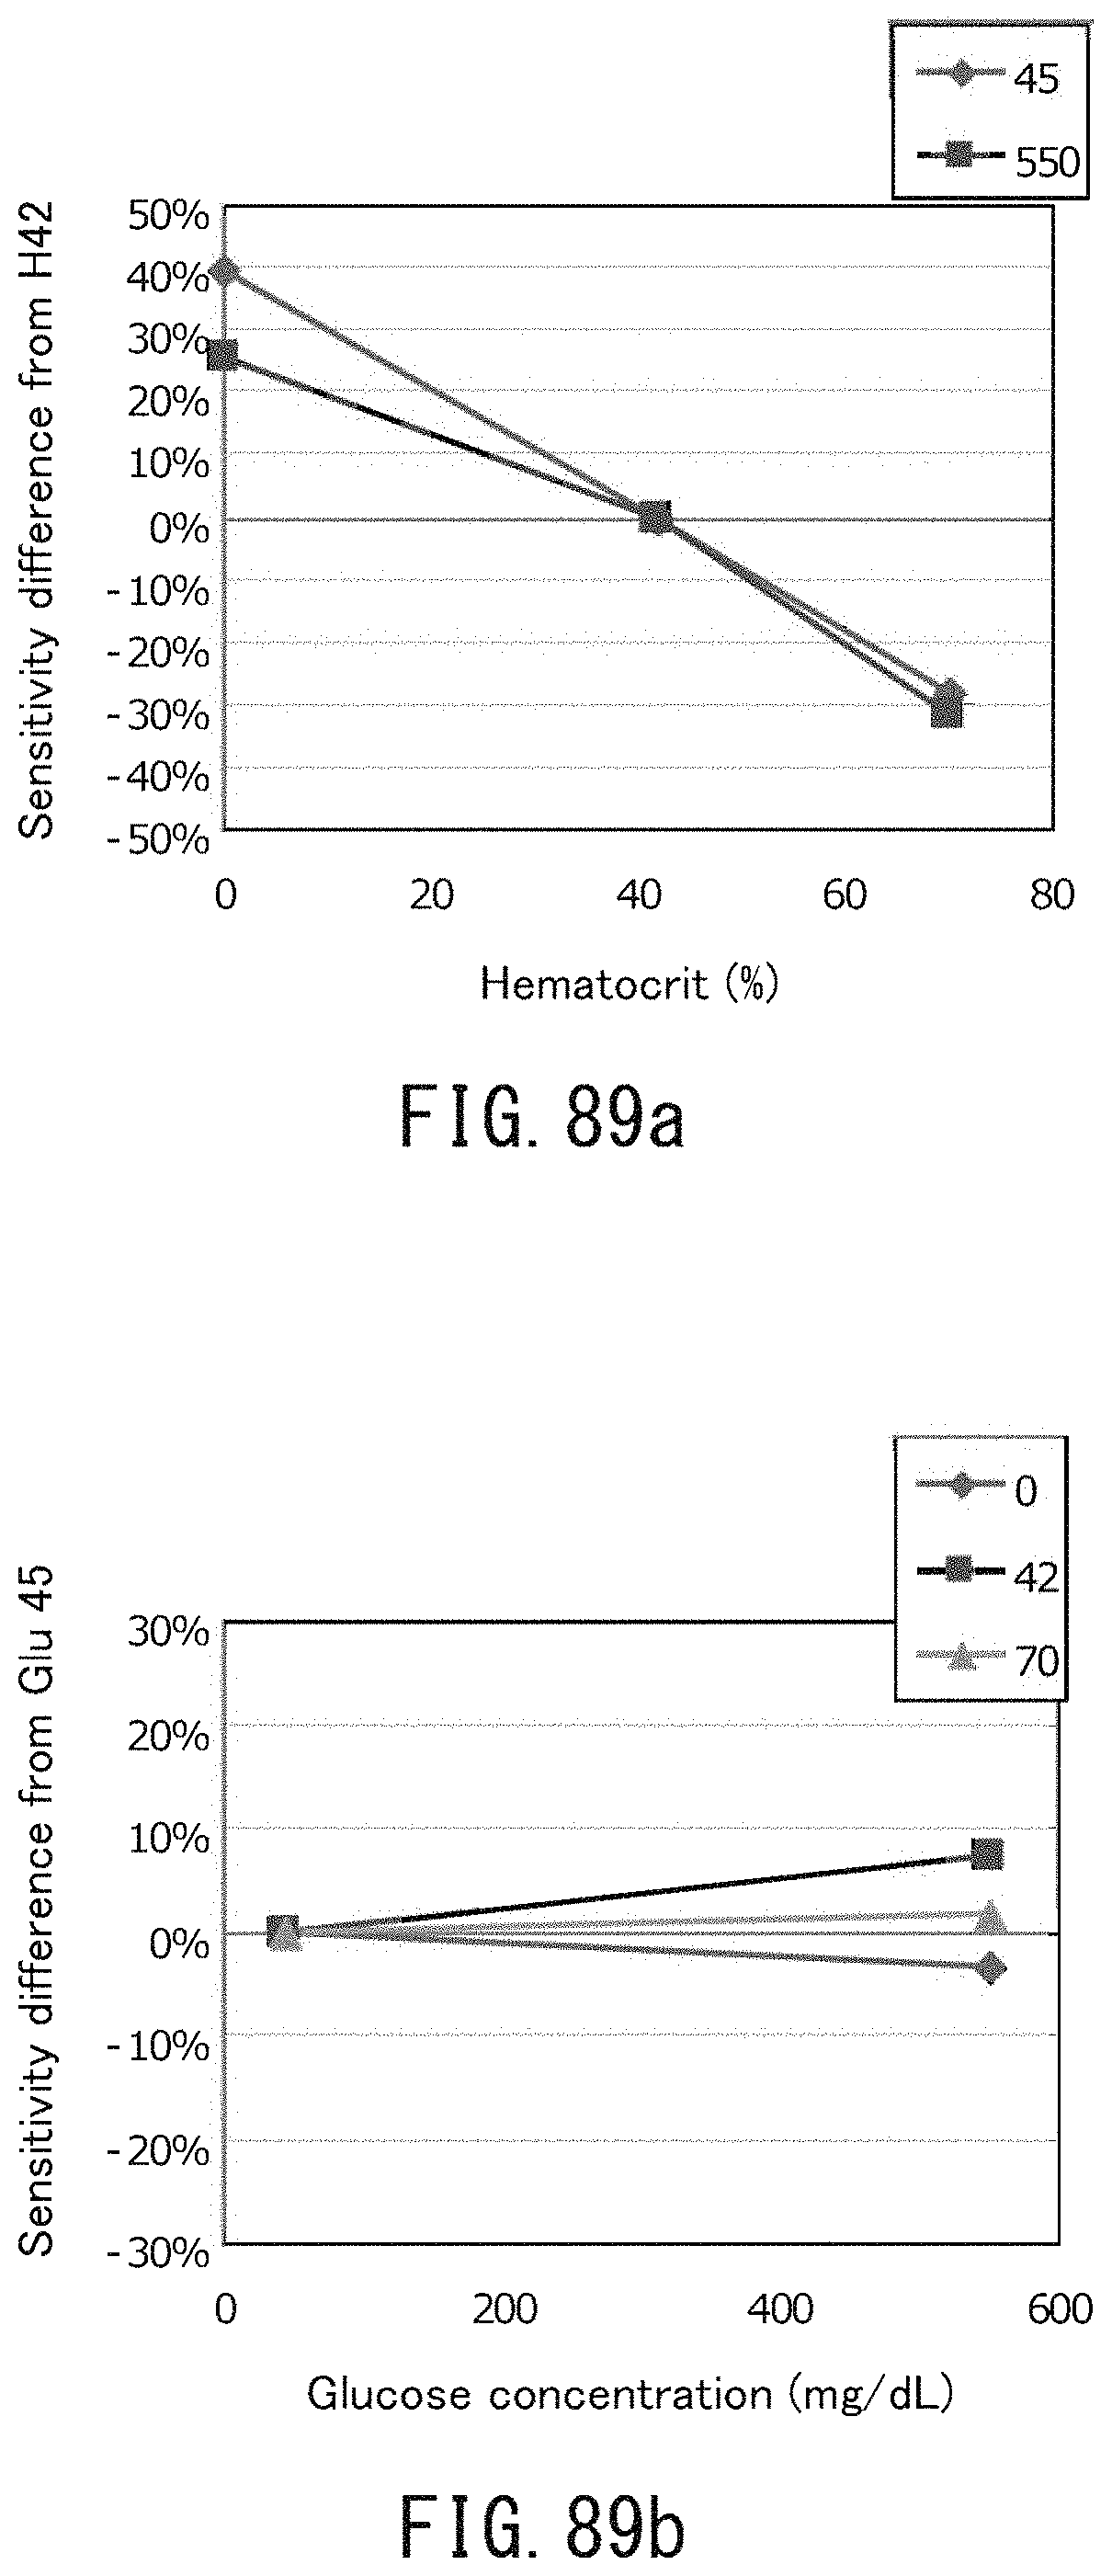
D00113

D00114

D00115

D00116

D00117
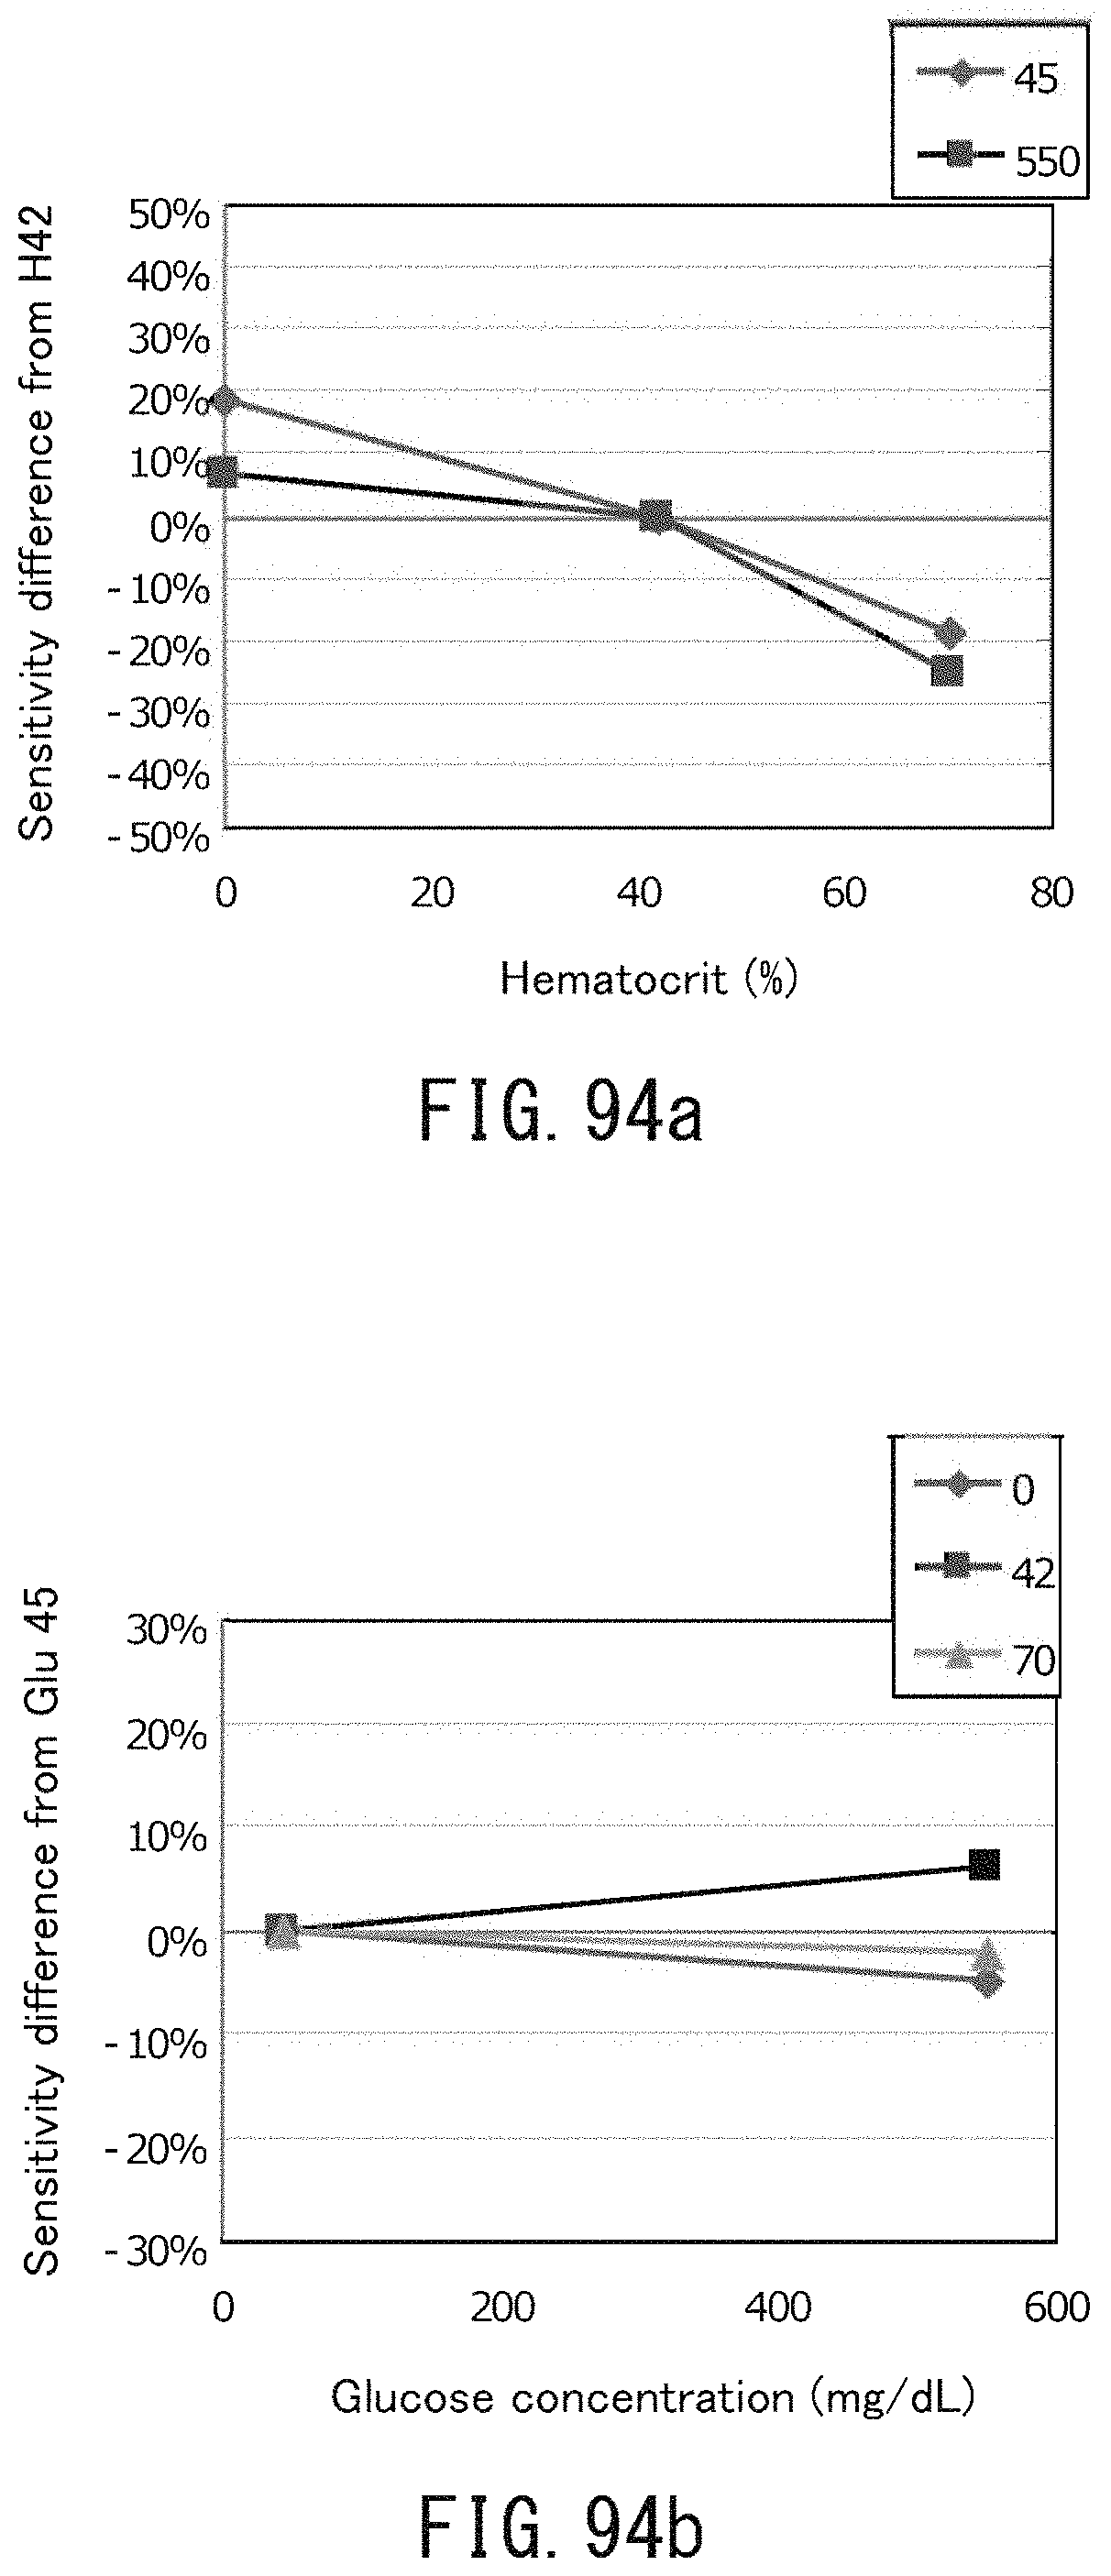
D00118

D00119

D00120

D00121

D00122

D00123

D00124

D00125
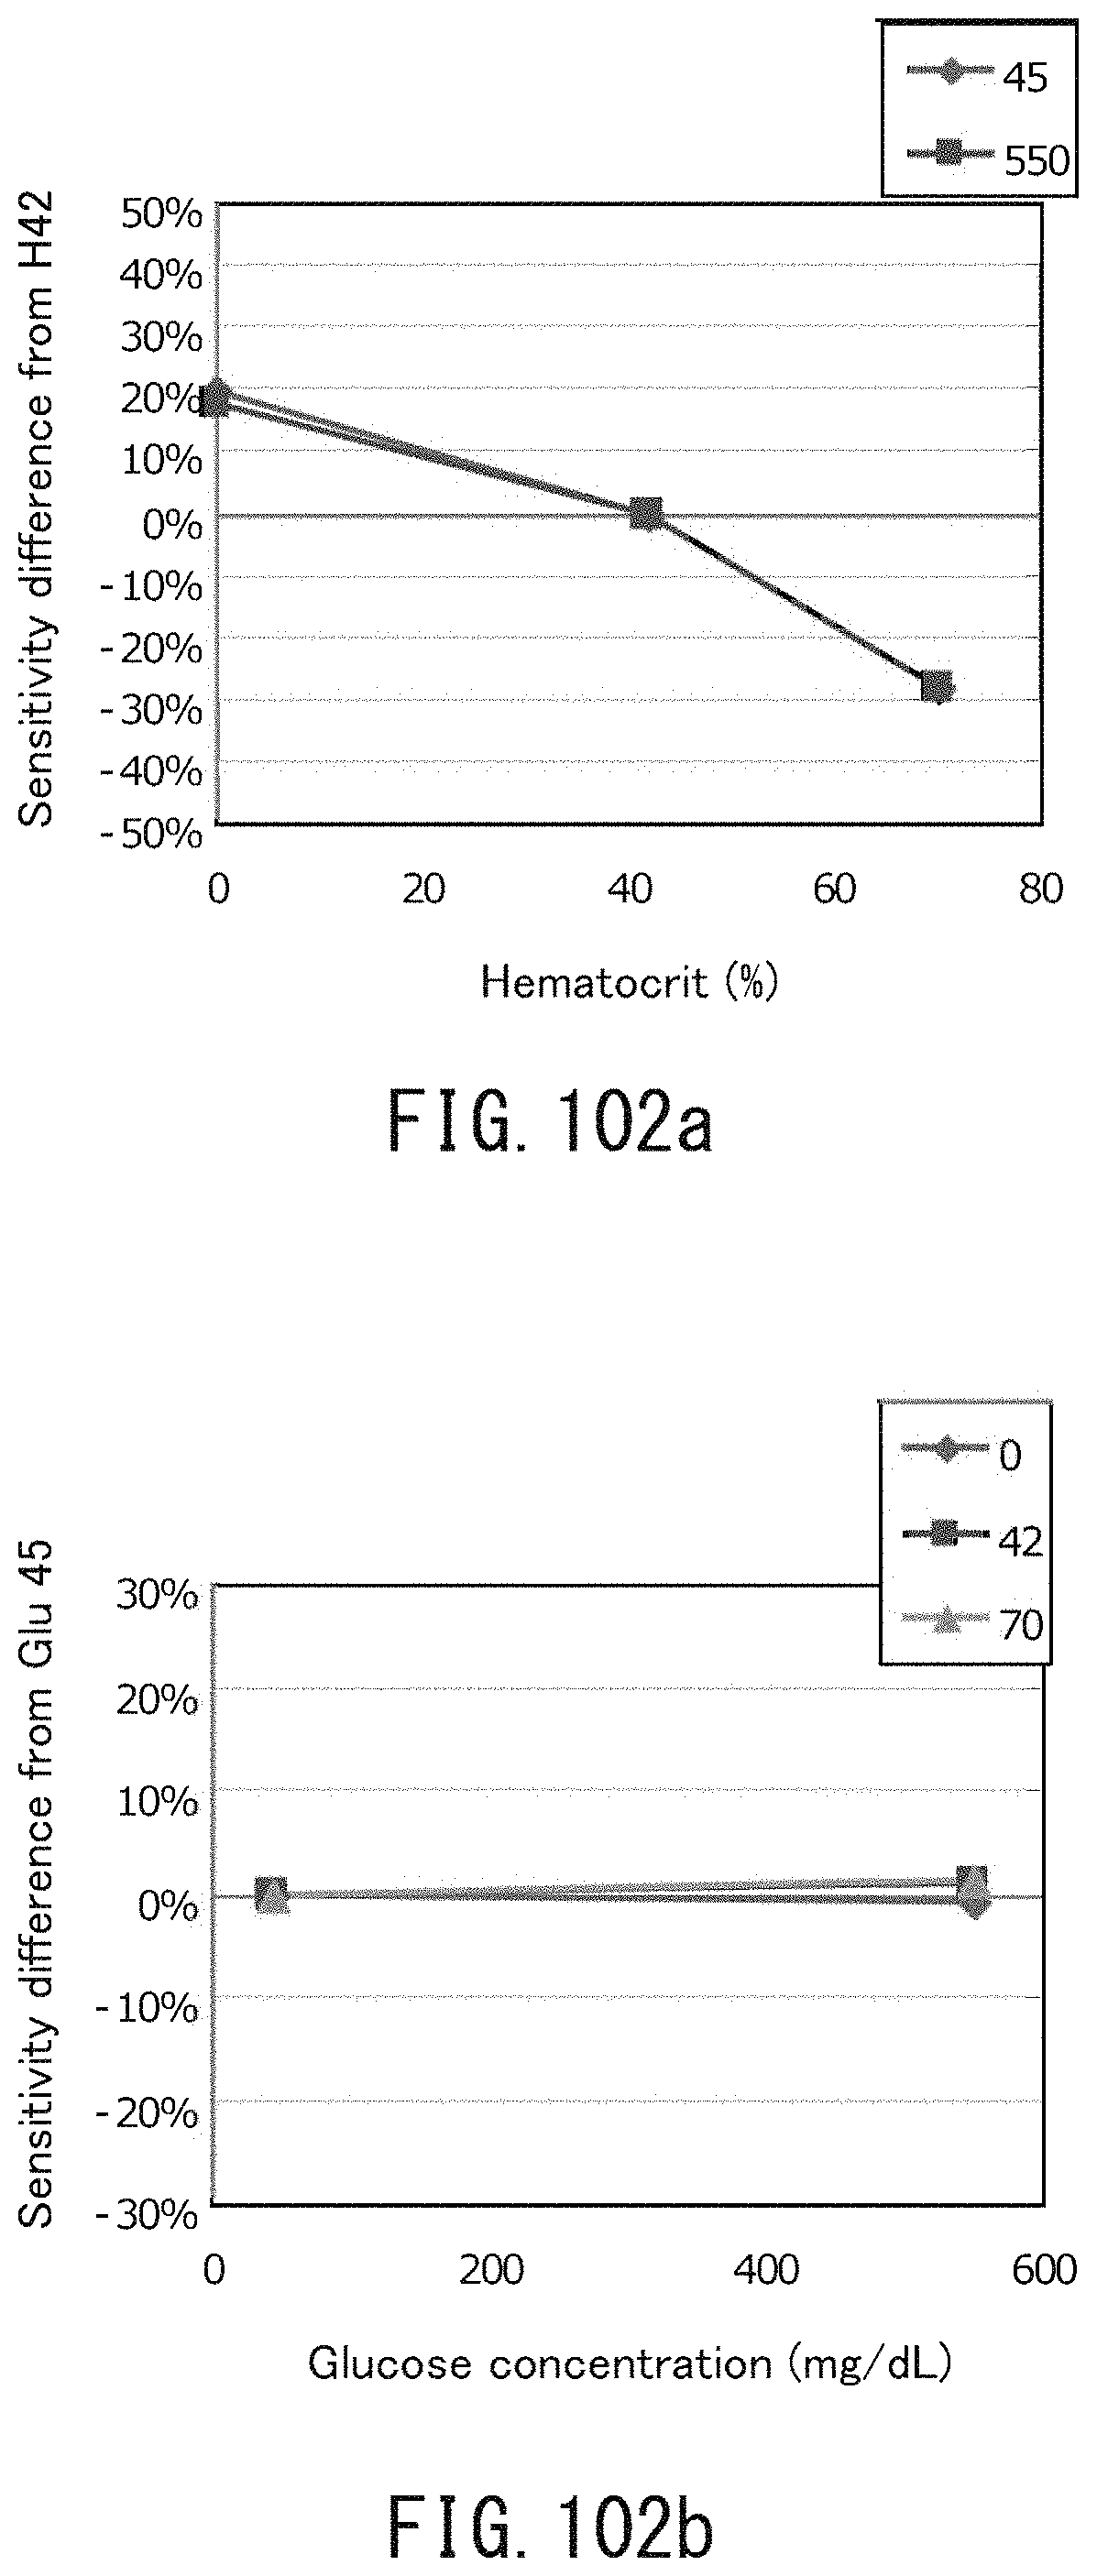
D00126

D00127

D00128

D00129

D00130

D00131
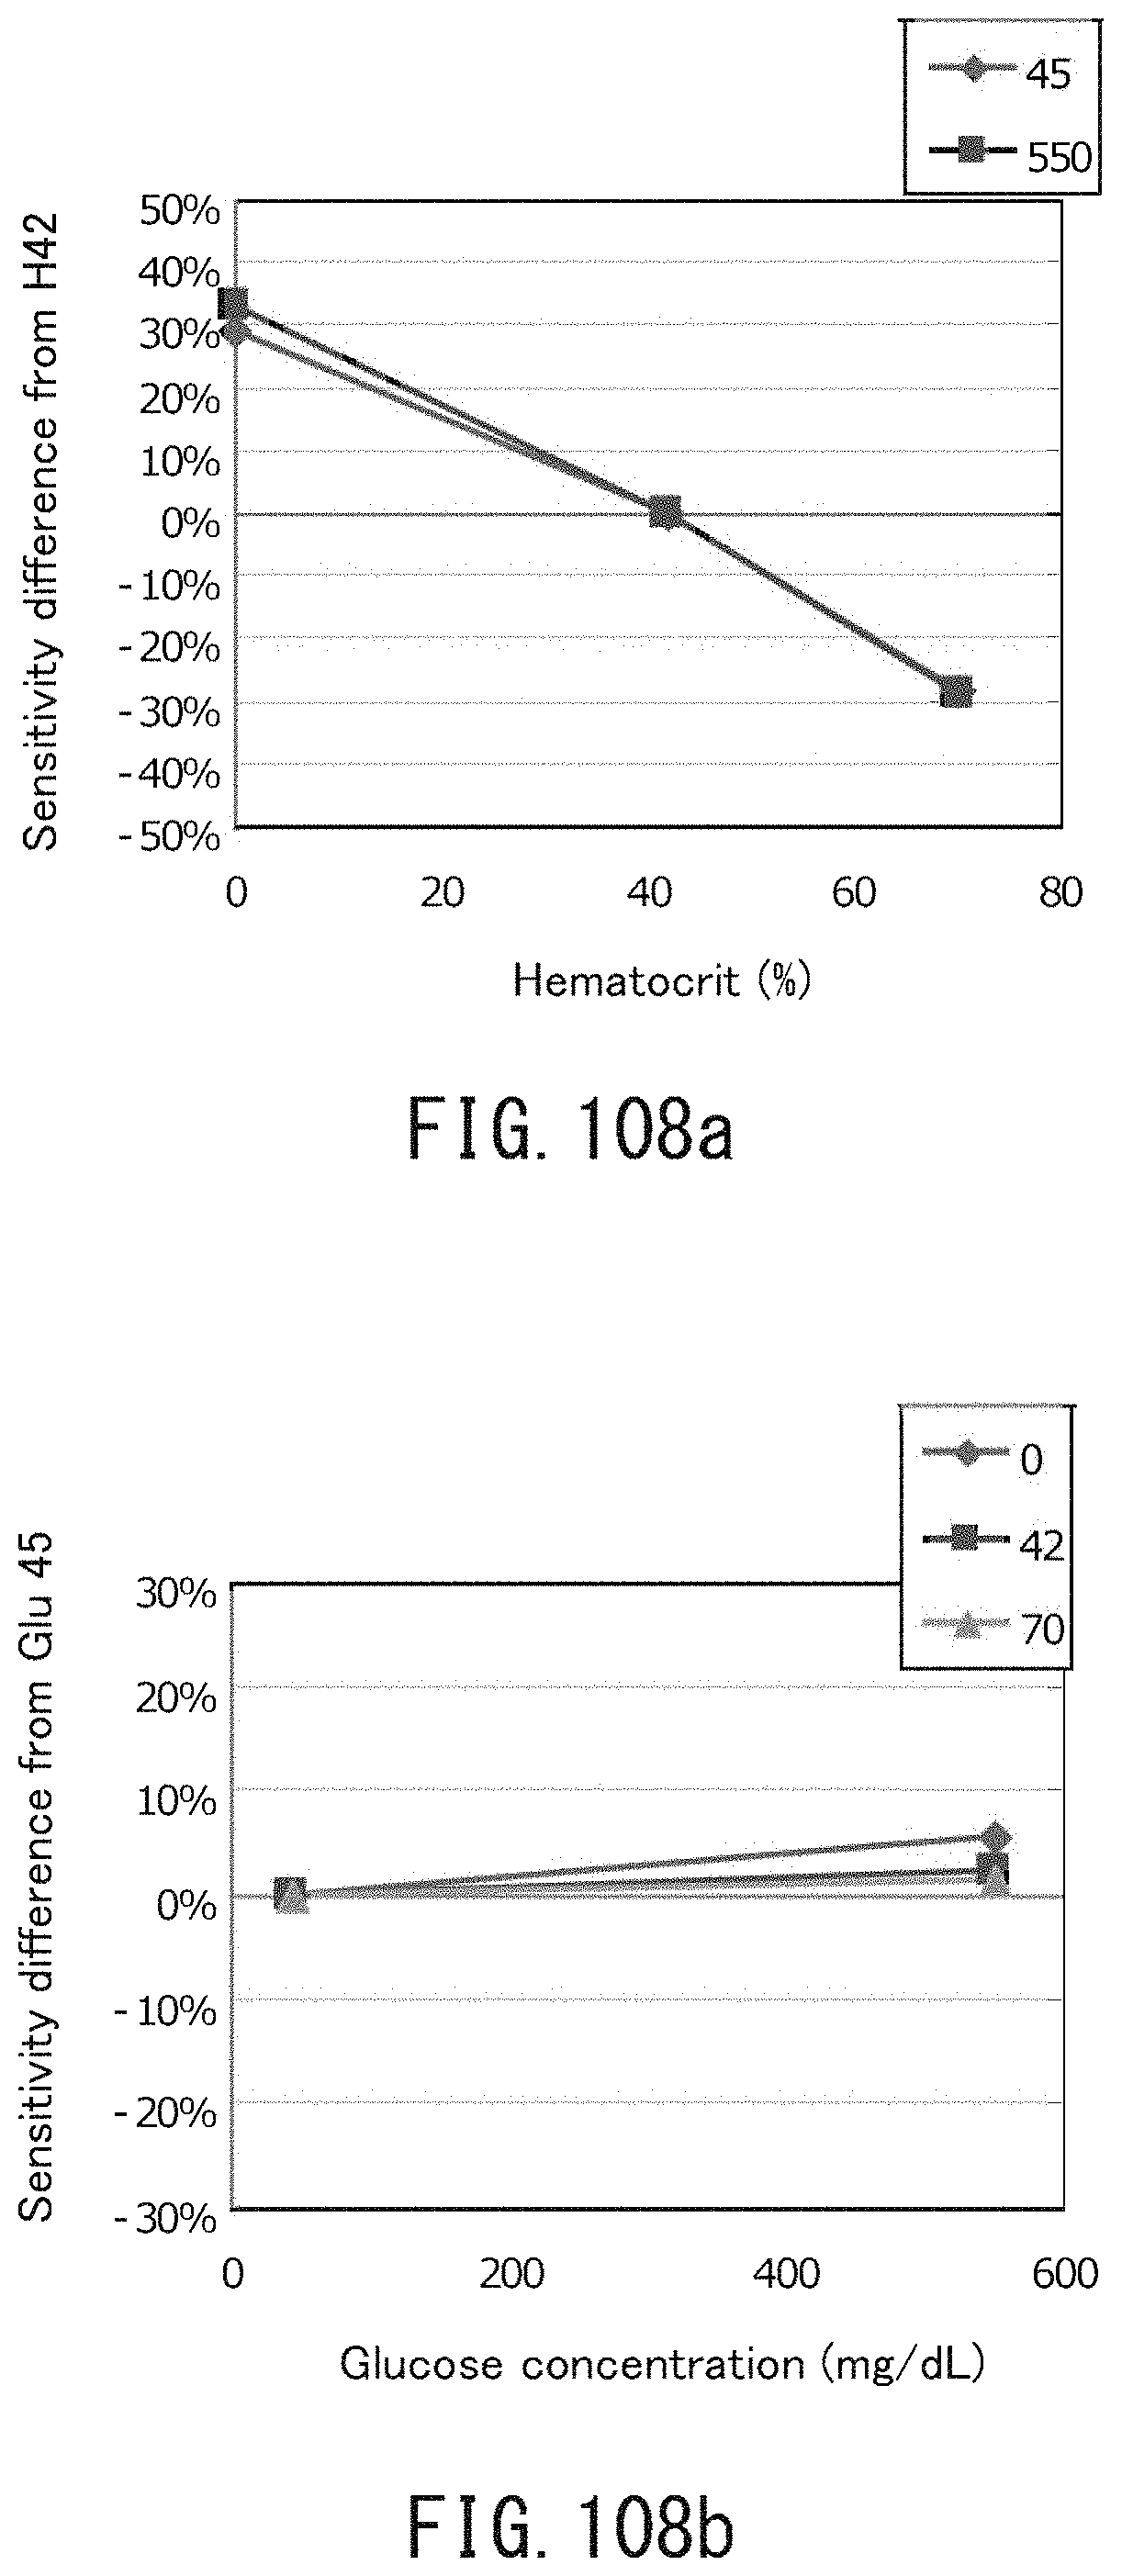
D00132

D00133

D00134

D00135

D00136
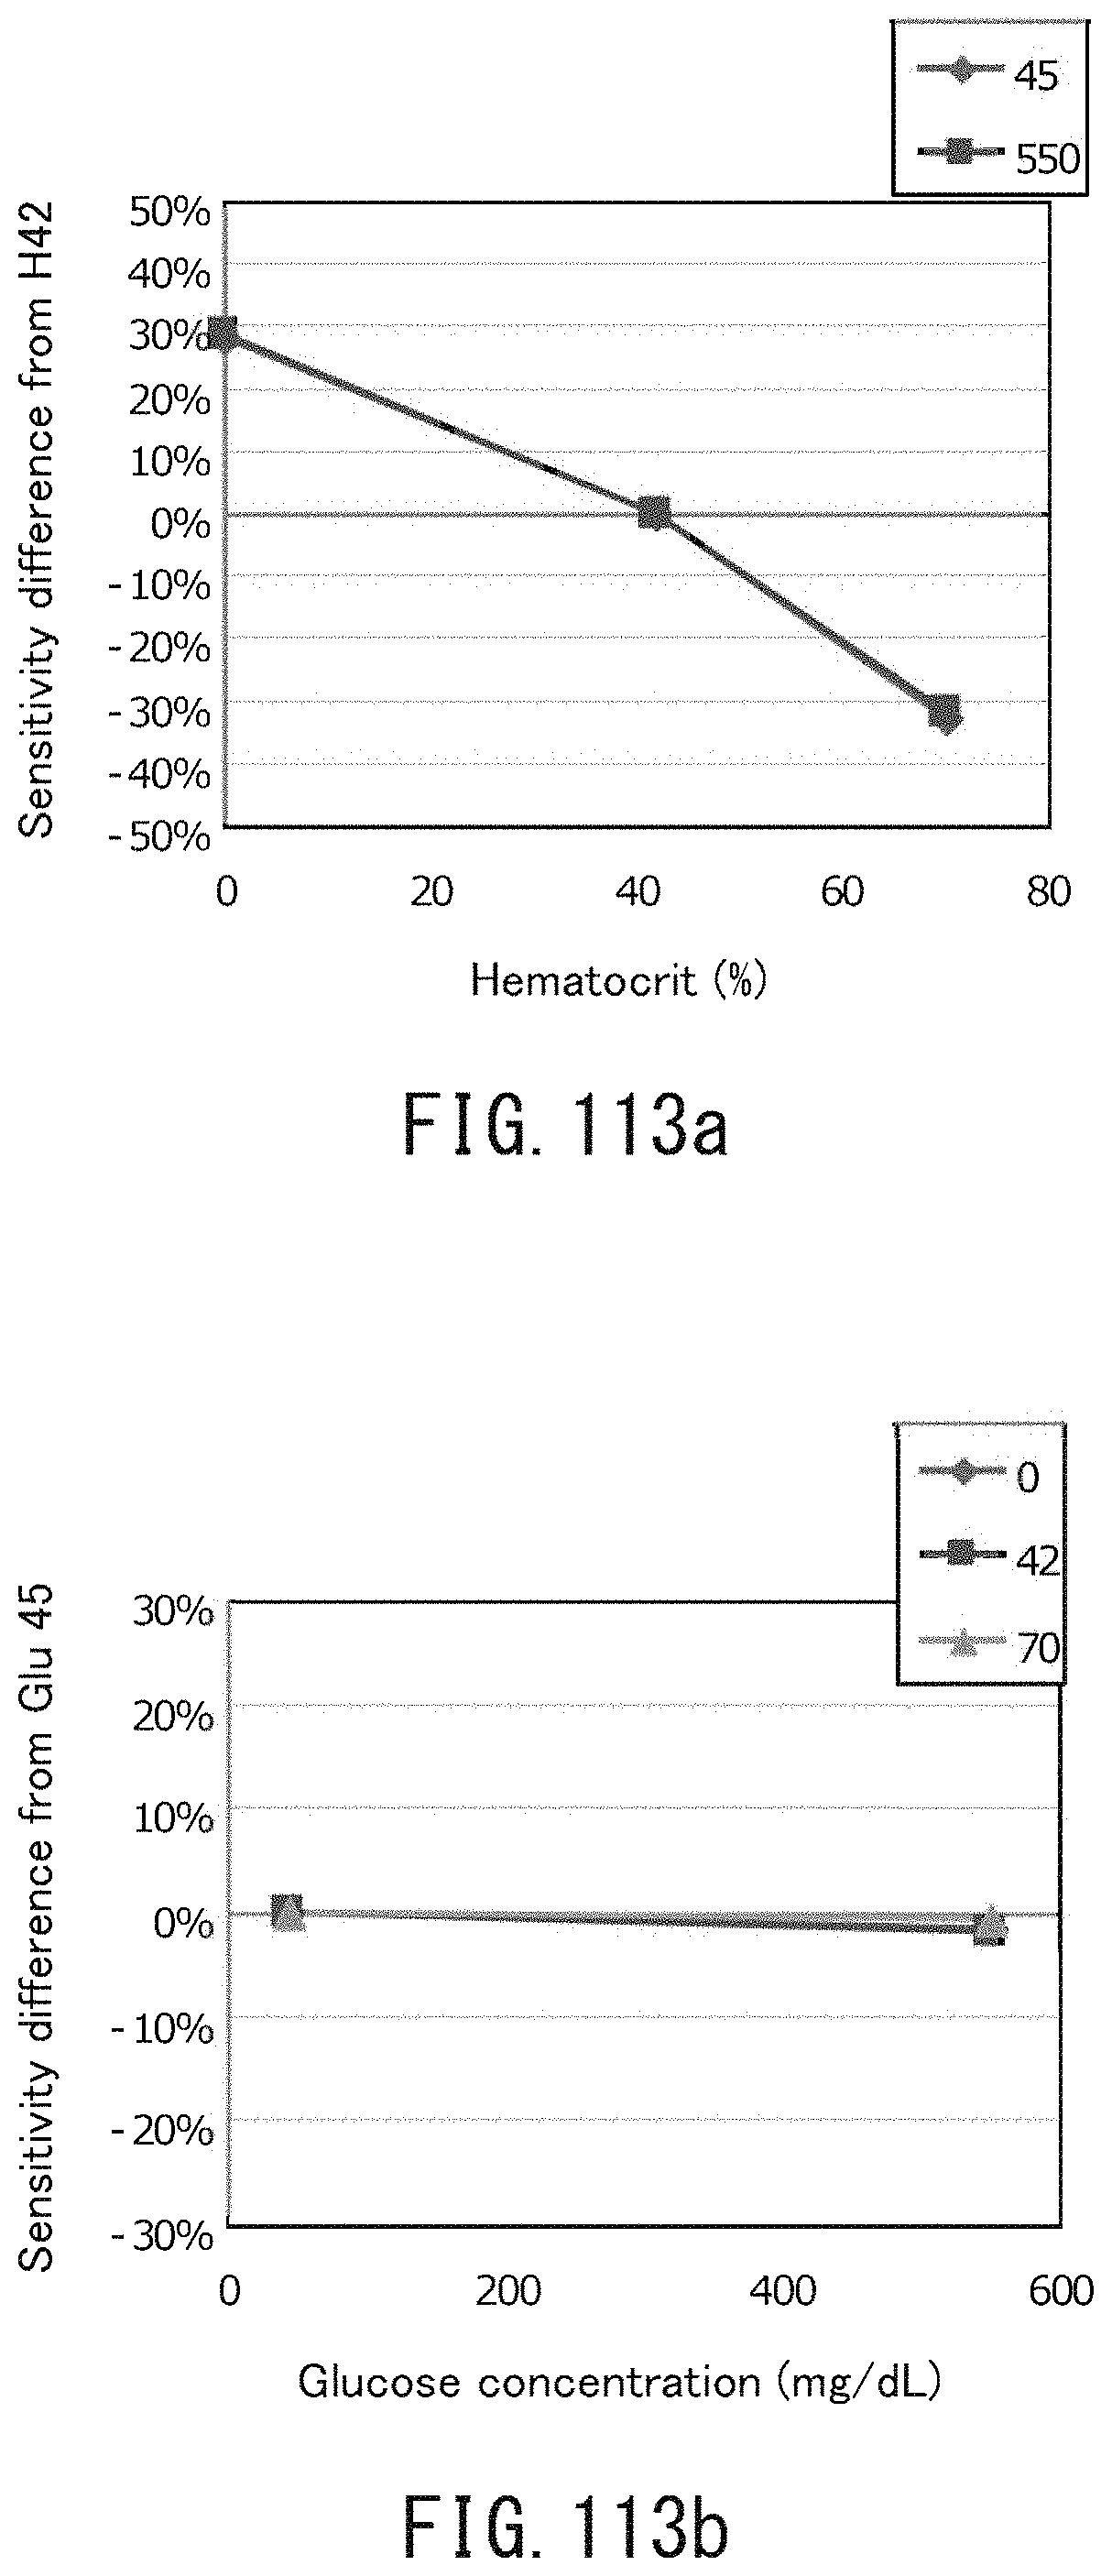
D00137
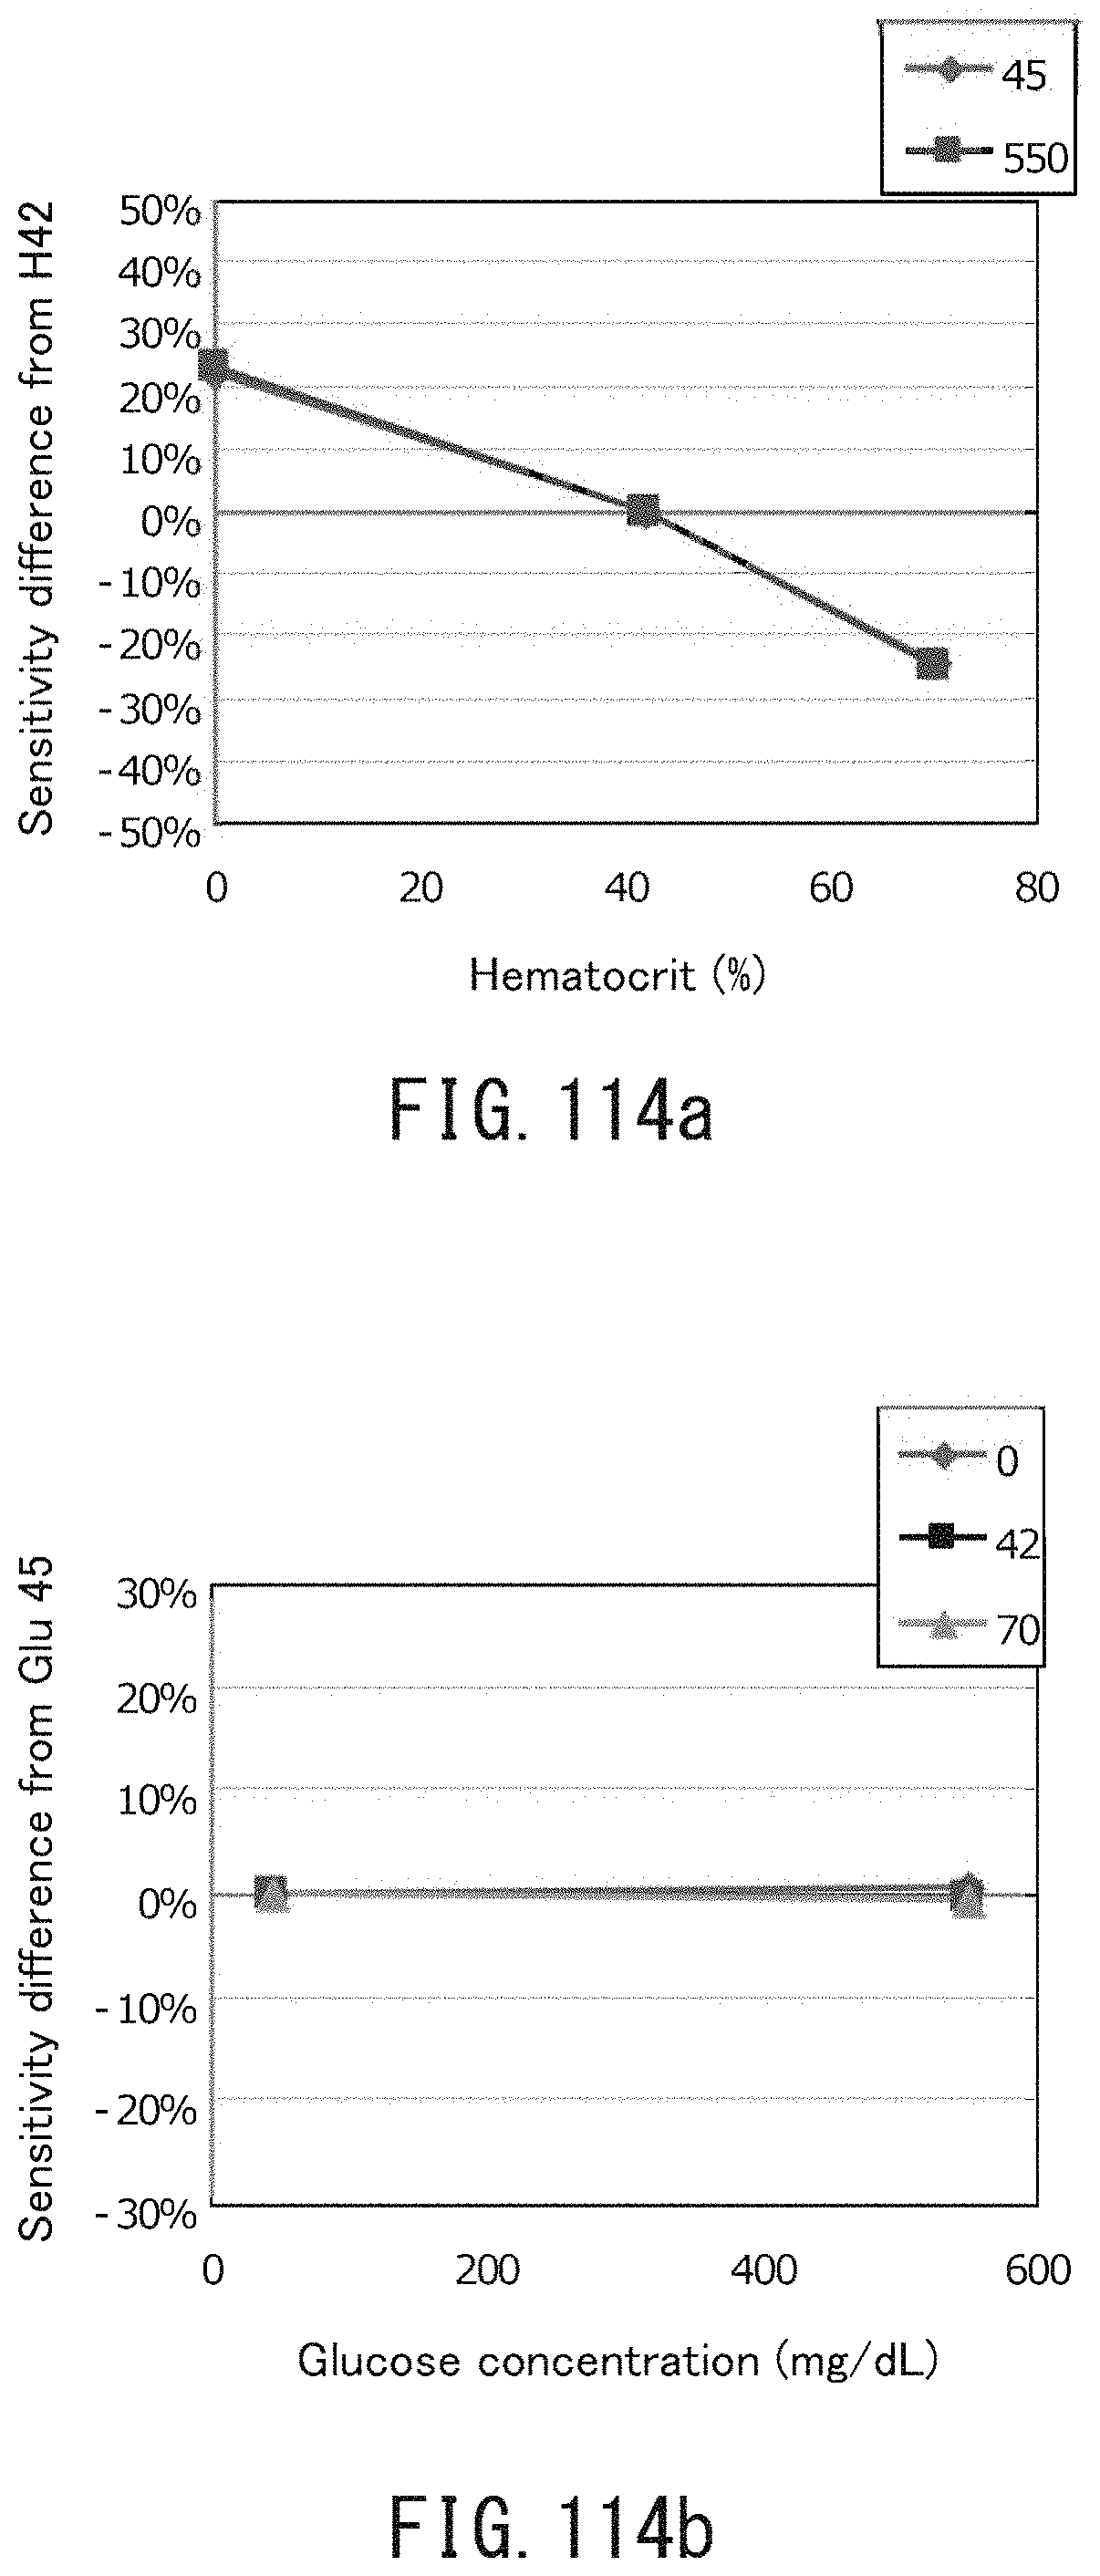
D00138
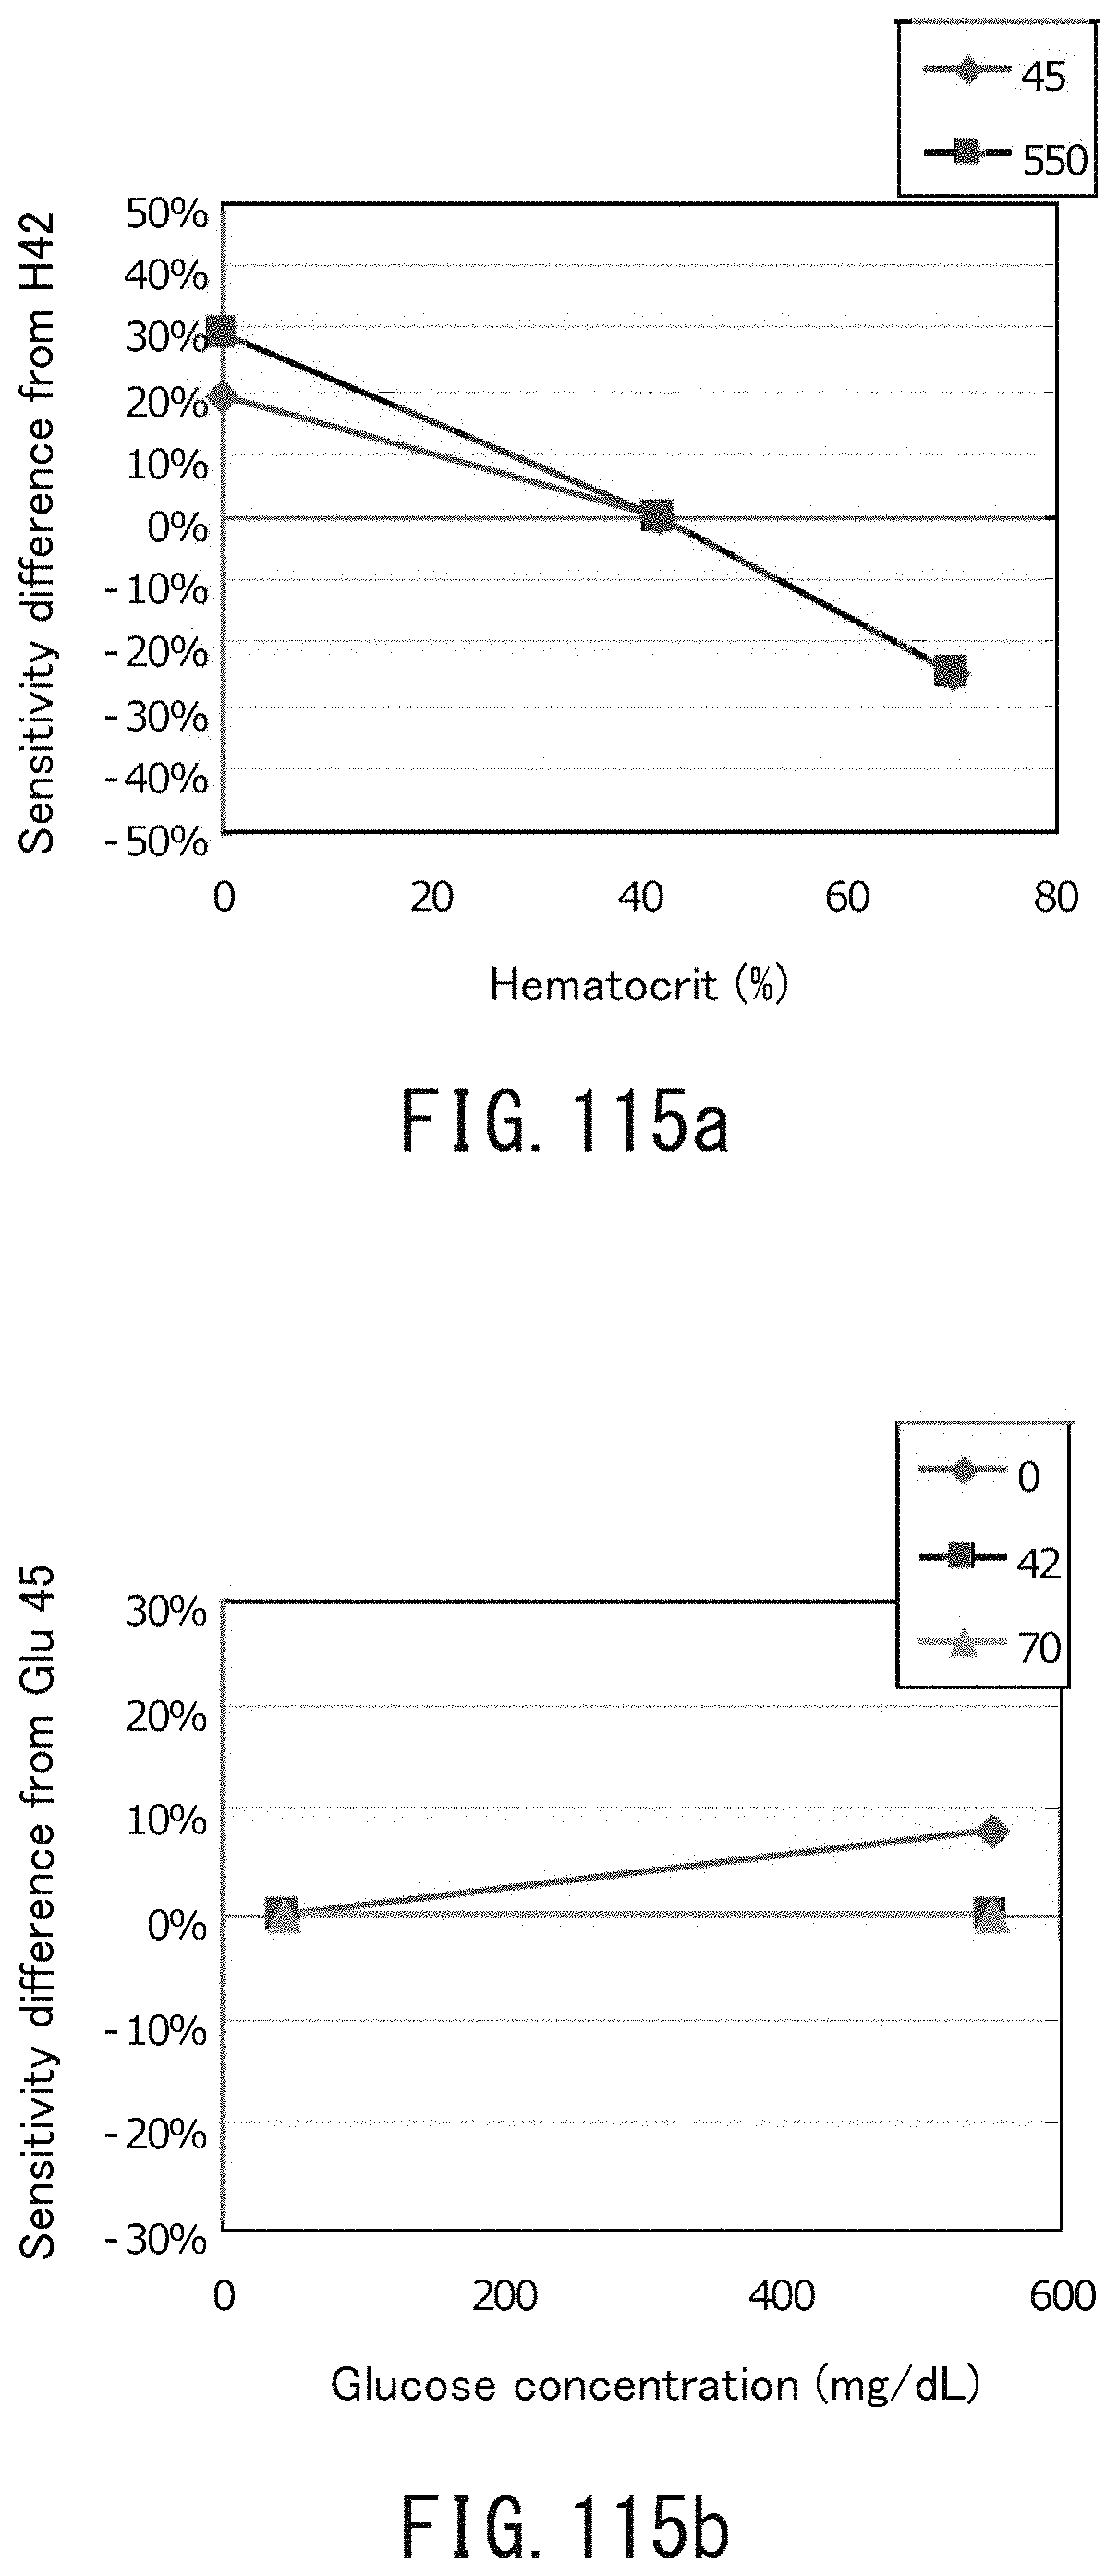
D00139

D00140

D00141

D00142

D00143
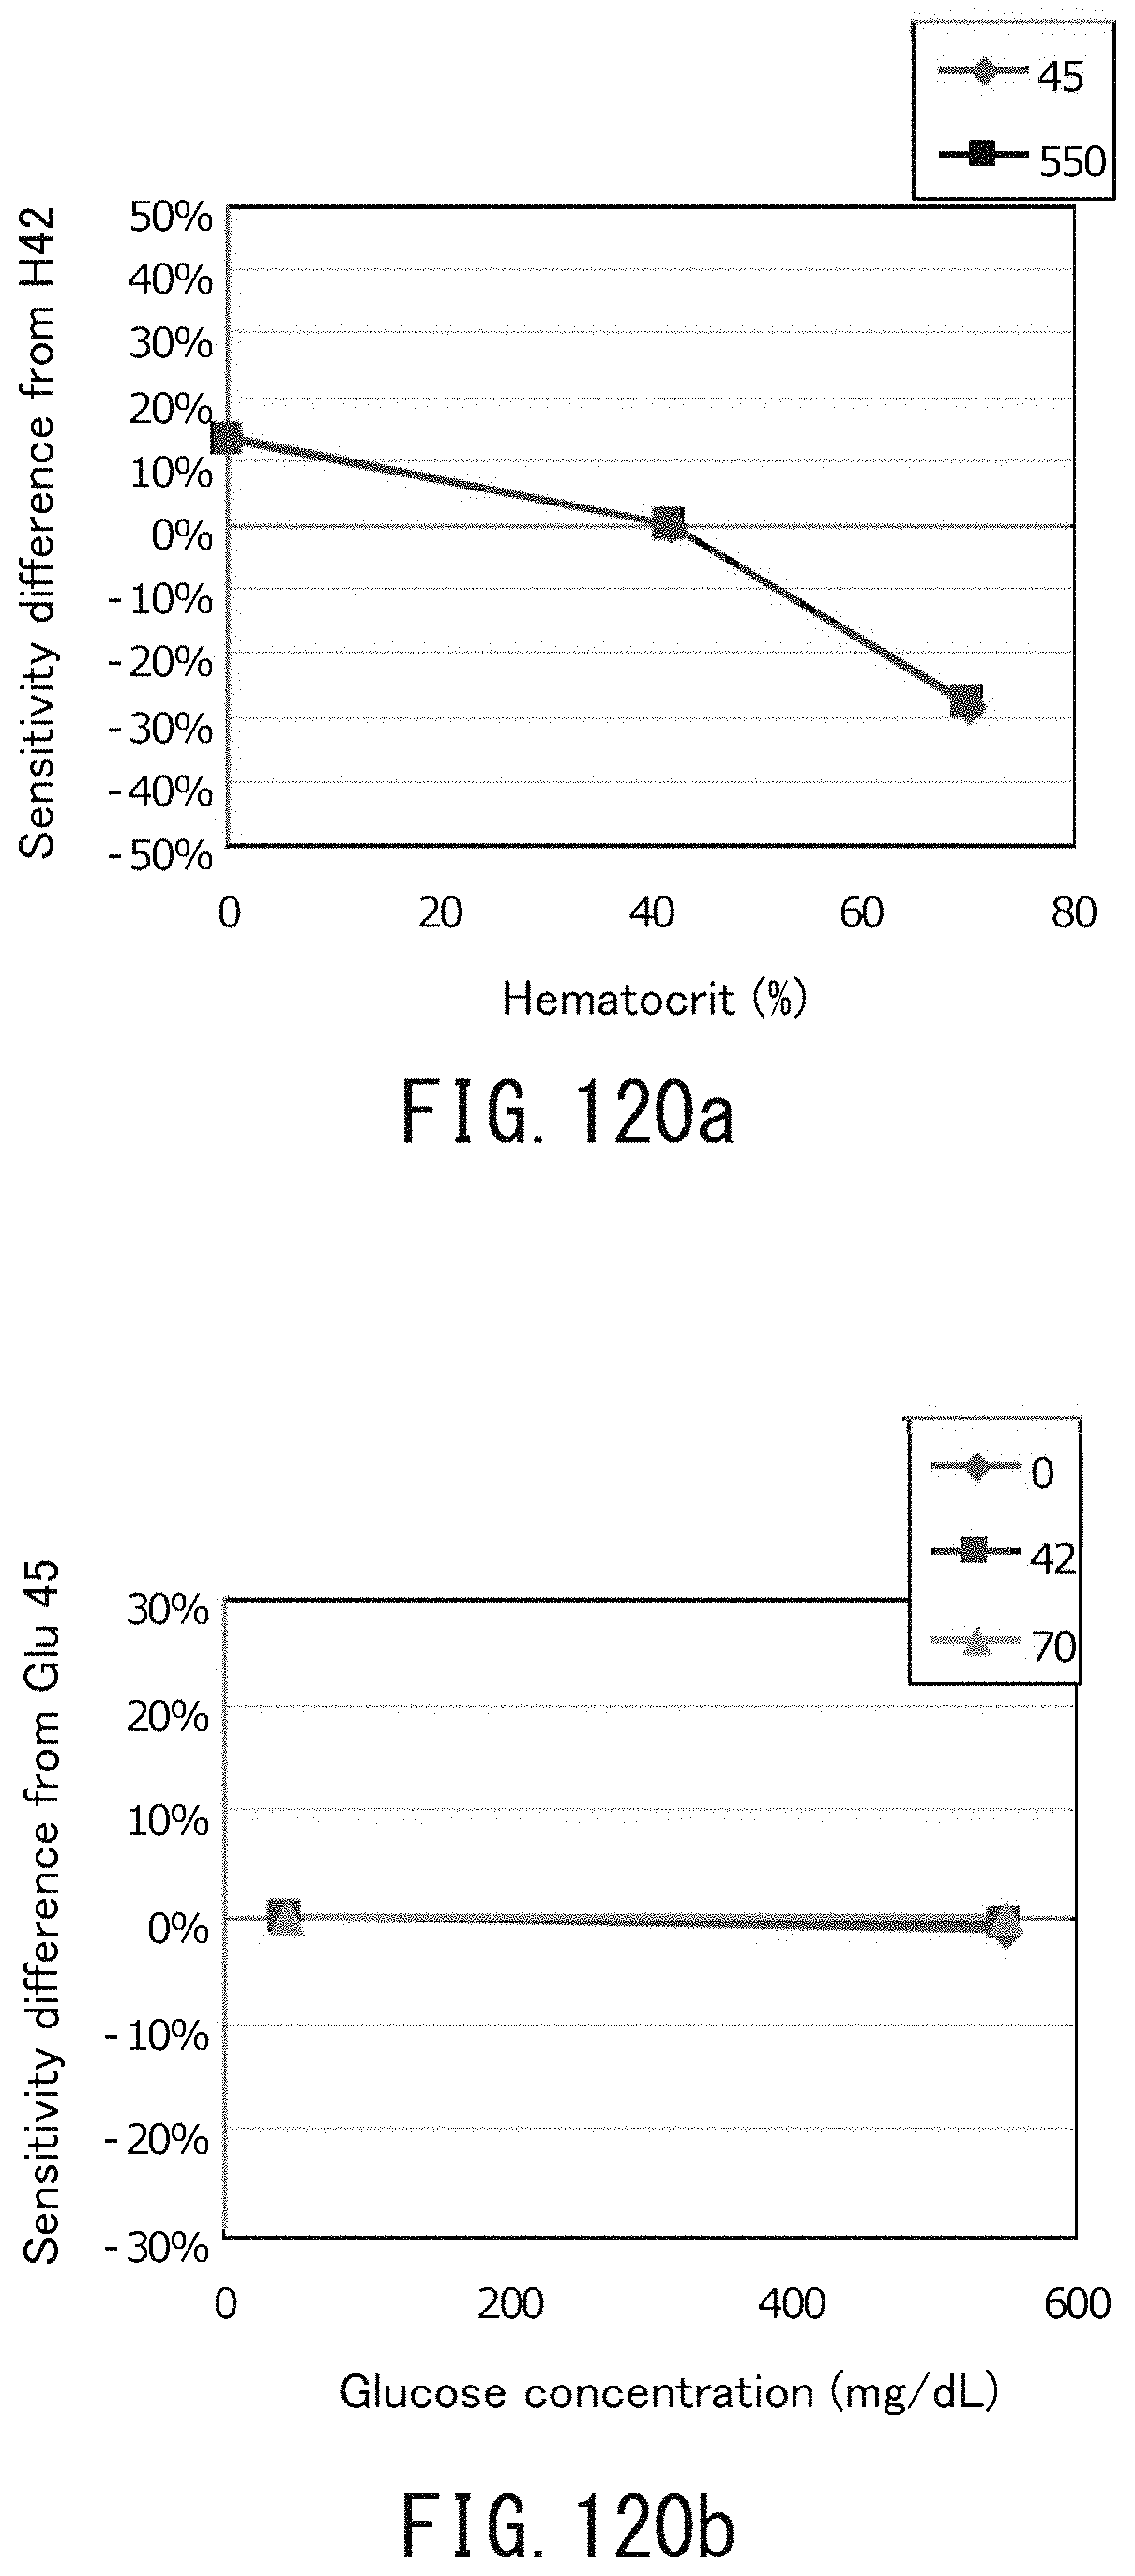
D00144
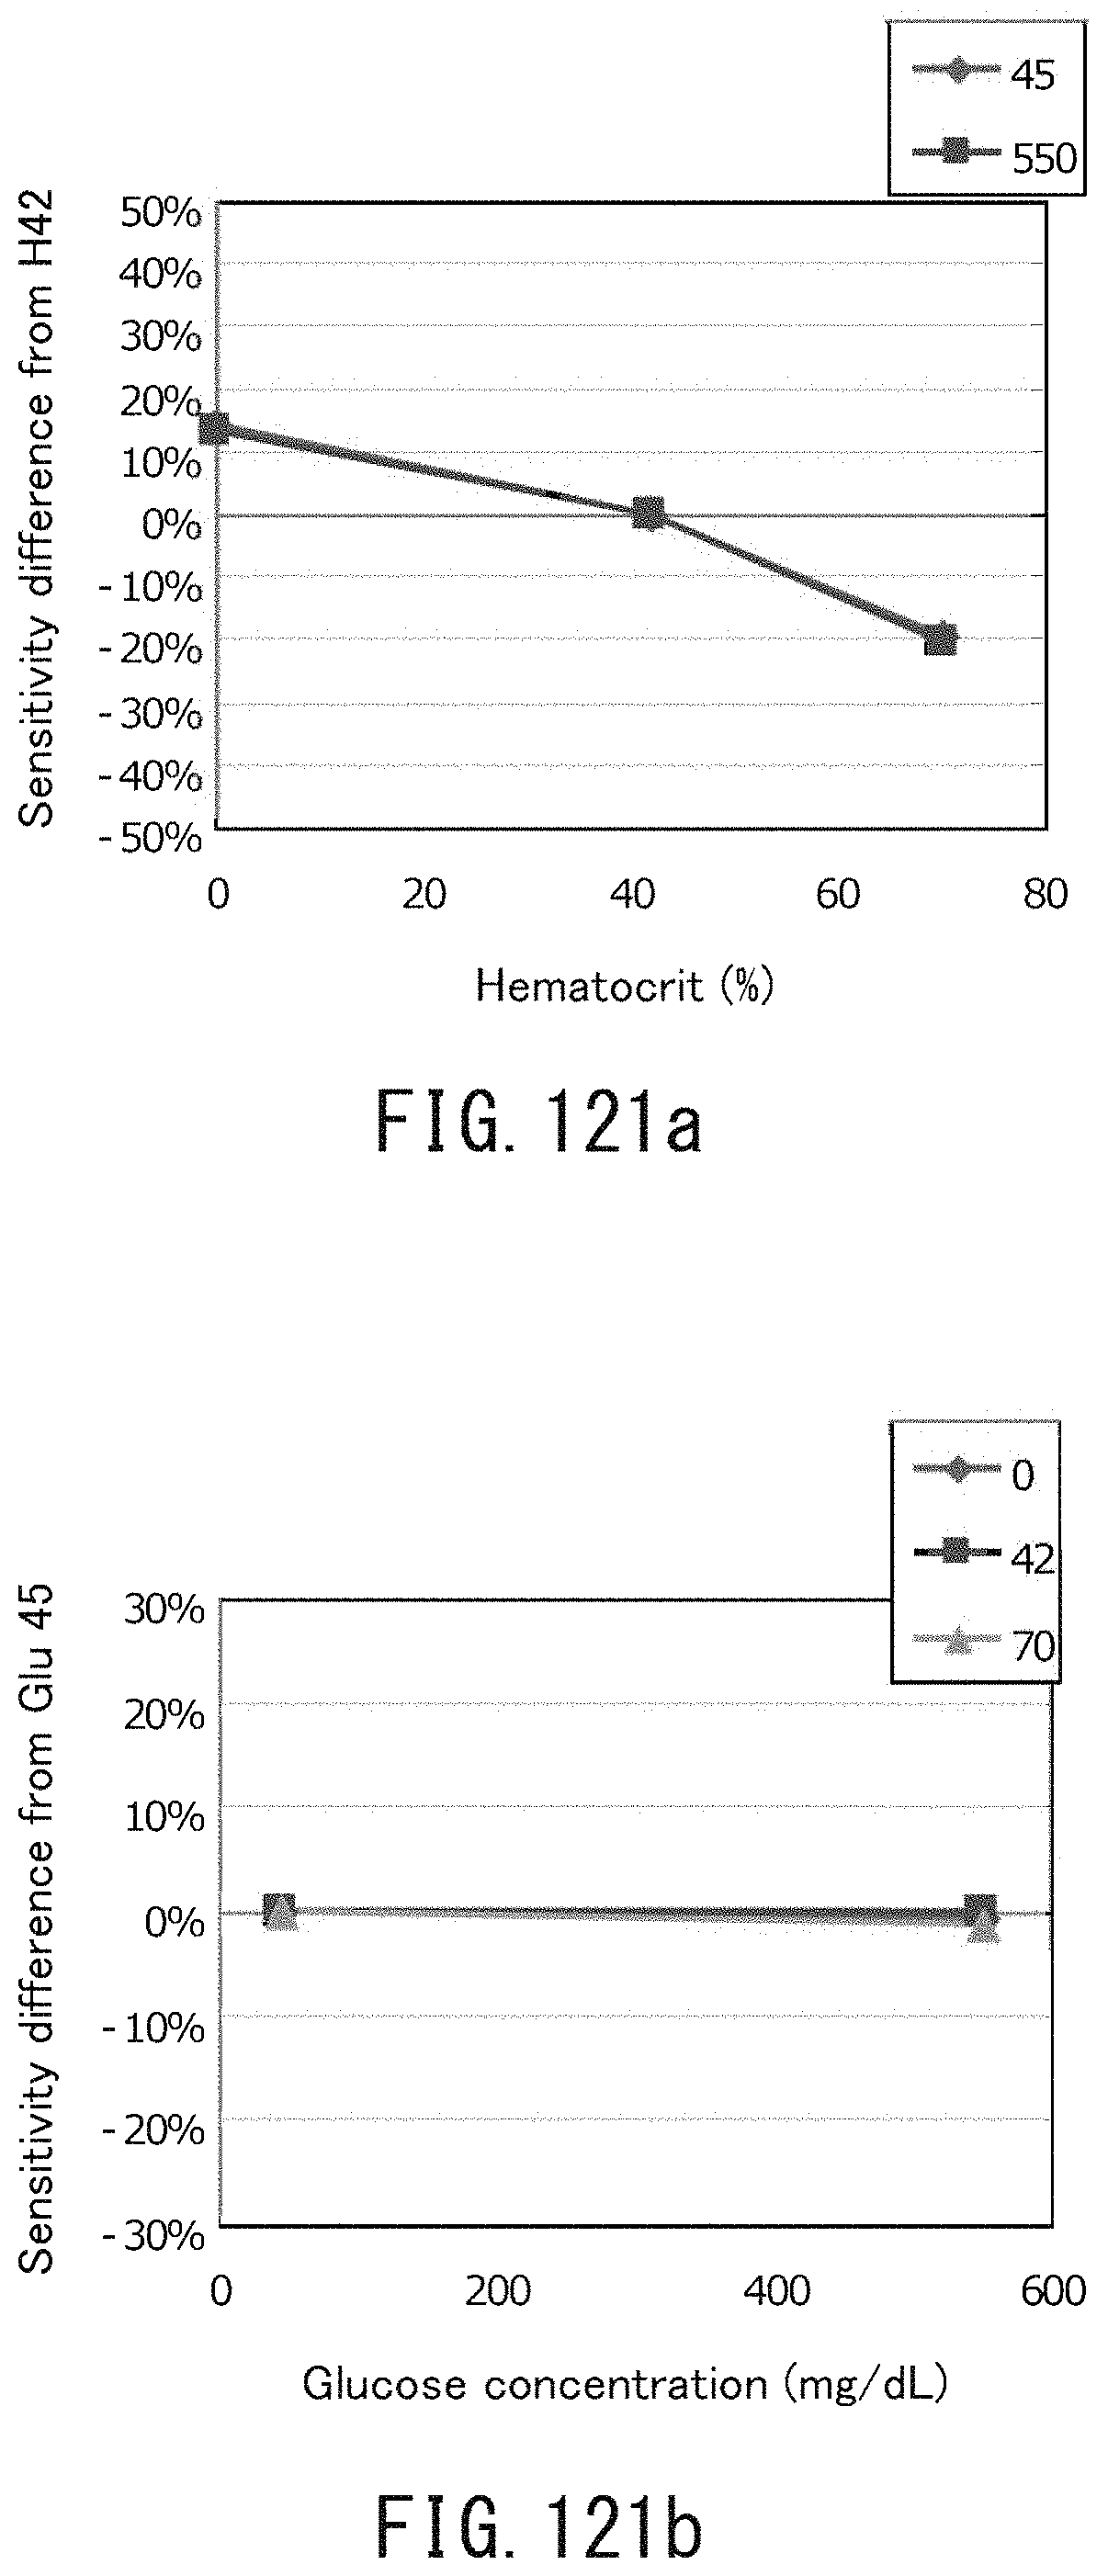
D00145

D00146

D00147

D00148

D00149

D00150

XML
uspto.report is an independent third-party trademark research tool that is not affiliated, endorsed, or sponsored by the United States Patent and Trademark Office (USPTO) or any other governmental organization. The information provided by uspto.report is based on publicly available data at the time of writing and is intended for informational purposes only.
While we strive to provide accurate and up-to-date information, we do not guarantee the accuracy, completeness, reliability, or suitability of the information displayed on this site. The use of this site is at your own risk. Any reliance you place on such information is therefore strictly at your own risk.
All official trademark data, including owner information, should be verified by visiting the official USPTO website at www.uspto.gov. This site is not intended to replace professional legal advice and should not be used as a substitute for consulting with a legal professional who is knowledgeable about trademark law.