Titanium alloy part
Tsukamoto , et al. May 25, 2
U.S. patent number 11,015,233 [Application Number 16/637,941] was granted by the patent office on 2021-05-25 for titanium alloy part. This patent grant is currently assigned to NIPPON STEEL CORPORATION. The grantee listed for this patent is NIPPON STEEL CORPORATION. Invention is credited to Hideto Seto, Kazuhiro Takahashi, Genki Tsukamoto.


| United States Patent | 11,015,233 |
| Tsukamoto , et al. | May 25, 2021 |
Titanium alloy part
Abstract
A titanium alloy part is characterized in that it includes, by mass %: Al: 1.0 to 8.0%; Fe: 0.10 to 0.40%; O: 0.00 to 0.30%; C: 0.00 to 0.10%; Sn: 0.00 to 0.20%; Si: 0.00 to 0.15%; and the balance: Ti and impurities, in which: an average grain diameter of .alpha.-phase crystal grains is 15.0 .mu.m or less; an average aspect ratio of the .alpha.-phase crystal grains is 1.0 or more and 3.0 or less; and a coefficient of variation of a number density of .beta.-phase crystal grains distributed in the .alpha. phase is 0.30 or less.
| Inventors: | Tsukamoto; Genki (Tokyo, JP), Takahashi; Kazuhiro (Tokyo, JP), Seto; Hideto (Tokyo, JP) | ||||||||||
|---|---|---|---|---|---|---|---|---|---|---|---|
| Applicant: |
|
||||||||||
| Assignee: | NIPPON STEEL CORPORATION
(Tokyo, JP) |
||||||||||
| Family ID: | 65527317 | ||||||||||
| Appl. No.: | 16/637,941 | ||||||||||
| Filed: | August 28, 2018 | ||||||||||
| PCT Filed: | August 28, 2018 | ||||||||||
| PCT No.: | PCT/JP2018/031836 | ||||||||||
| 371(c)(1),(2),(4) Date: | February 10, 2020 | ||||||||||
| PCT Pub. No.: | WO2019/044858 | ||||||||||
| PCT Pub. Date: | March 07, 2019 |
Prior Publication Data
| Document Identifier | Publication Date | |
|---|---|---|
| US 20200172996 A1 | Jun 4, 2020 | |
Foreign Application Priority Data
| Aug 28, 2017 [JP] | JP2017-163700 | |||
| Current U.S. Class: | 1/1 |
| Current CPC Class: | C22C 14/00 (20130101); C22F 1/183 (20130101); C22F 1/002 (20130101) |
| Current International Class: | C22C 14/00 (20060101); C22F 1/18 (20060101) |
References Cited [Referenced By]
U.S. Patent Documents
| 5277718 | January 1994 | Paxson |
| 5417779 | May 1995 | Griebel, III |
| 5509979 | April 1996 | Kimura |
| 5759484 | June 1998 | Kashii |
| 6332935 | December 2001 | Gorman |
| 2003/0168138 | September 2003 | Marquardt |
| 2004/0089380 | May 2004 | Woodfield |
| 2009/0074606 | March 2009 | Ogawa et al. |
| 2009/0181794 | July 2009 | Tsai et al. |
| 2012/0234066 | September 2012 | Takahashi |
| 2017/0067137 | March 2017 | Kawasaki |
| 7-43478 | Feb 1995 | JP | |||
| 7-62466 | Mar 1995 | JP | |||
| 7-150274 | Jun 1995 | JP | |||
| 2009-84690 | Apr 2009 | JP | |||
| 2009-167518 | Jul 2009 | JP | |||
| 2017-53021 | Mar 2017 | JP | |||
Other References
|
International Preliminary Report on Patentability and Written Opinion of the International Searching Authority (Forms PCT/IB/373, PCT/IB/326, and PCT/ISA/237) for International Application No. PCT/JP2018/031836, dated Mar. 12, 2020, with English translation. cited by applicant . International Search Report for PCT/JP2018/031836 dated Nov. 20, 2018. cited by applicant . Written Opinion of the International Searching Authority for PCT/JP2018/031836 (PCT/ISA/237) dated Nov. 20, 2018. cited by applicant. |
Primary Examiner: Zimmer; Anthony J
Assistant Examiner: Gusewelle; Jacob James
Attorney, Agent or Firm: Birch, Stewart, Kolasch & Birch, LLP
Claims
What is claimed is:
1. A titanium alloy part, comprising, by mass %: Al: 1.0 to 8.0%; Fe: 0.10 to 0.40%; O: 0.00 to 0.30%; C: 0.00 to 0.10%; Sn: 0.00 to 0.20%; Si: 0.00 to 0.15%; and the balance: Ti and impurities, wherein: an average grain diameter of .alpha.-phase crystal grains is 15.0 .mu.m or less; an average aspect ratio of the .alpha.-phase crystal grains is 1.0 or more and 3.0 or less; and a coefficient of variation of a number density of .beta.-phase crystal grains distributed in the .alpha. phase is 0.30 or less.
2. The titanium alloy part according to claim 1, wherein an average number of deformation twins per one .alpha.-phase crystal grain is 2.0 to 10.0.
3. The titanium alloy part according to claim 1, wherein the titanium alloy part consists of: Al: 1.0 to 8.0%; Fe: 0.10 to 0.40%; O: 0.0 to 0.30%; C: 0.00 to 0.10%; Sn: 0.00 to 0.20%; Si: 0.00 to 0.15%; and the balance: Ti and impurities.
Description
TECHNICAL FIELD
The present invention relates to a titanium alloy part suitable for mirror polishing.
BACKGROUND ART
As a material used for an ornament such as a brooch, there can be cited stainless steel and a titanium alloy. The titanium alloy is more suitable for an ornament than the stainless steel in terms of a specific gravity, a corrosion resistance, biocompatibility, and so on. However, the titanium alloy is inferior to the stainless steel in terms of a specularity after polishing.
Although it is also possible to improve the specularity by increasing hardness of the titanium alloy through control of a chemical composition, in a conventional titanium alloy, workability is greatly reduced in accordance with an increase in hardness. The reduction in workability makes it difficult, for example, to perform microfabrication for ornamentation.
For example, Patent Document 1 describes that high hardness and improvement of specularity are realized by a titanium alloy in which iron of 0.5% or more by weight is contained. Patent Document 2 describes that high hardness is realized by a titanium alloy in which iron of 0.5 to 5% by weight is contained and a two-phase microstructure of .alpha. and .beta. is provided. Patent Document 3 describes a titanium alloy containing 4.5% of Al, 3% of V, 2% of Fe, 2% of Mo, and 0.1% of 0, and whose crystal microstructure is of .alpha.+.beta. type.
PRIOR ART DOCUMENT
[Patent Document] Patent Document 1: Japanese Laid-open Patent Publication No. H7-043478 Patent Document 2: Japanese Laid-open Patent Publication No. H7-062466 Patent Document 3: Japanese Laid-open Patent Publication No. H7-150274
DISCLOSURE OF THE INVENTION
Problems to be Solved by the Invention
However, in the titanium alloys described in Patent Documents 1 and 2, there is a possibility that a temperature is increased by a frictional heat generated during polishing, resulting in that the hardness is reduced to deteriorate the specularity. In the titanium alloy described in Patent Document 3, Vickers hardness is excessively high to be 400 or more, and although an excellent specularity can be obtained, it becomes difficult to perform machining.
The present invention has an object to provide a titanium alloy part having good workability and capable of obtaining an excellent specularity.
Means for Solving the Problems
The gist of the present invention is as follows.
(1) A titanium alloy part is characterized in that it includes, by mass %:
Al: 1.0 to 8.0%;
Fe: 0.10 to 0.40%;
O: 0.00 to 0.30%;
C: 0.00 to 0.10%;
Sn: 0.00 to 0.20%;
Si: 0.00 to 0.15%; and
the balance: Ti and impurities, in which:
an average grain diameter of .alpha.-phase crystal grains is 15.0 .mu.m or less;
an average aspect ratio of the .alpha.-phase crystal grains is 1.0 or more and 3.0 or less; and
a coefficient of variation of a number density of .beta.-phase crystal grains distributed in the .alpha. phase is 0.30 or less.
(2) The titanium alloy part according to (1), where in an average number of deformation twins per one .alpha.-phase crystal grain is 2.0 to 10.0.
Note that in the present Description, the .alpha.-phase crystal grain is sometimes referred to as an ".alpha. grain". Further, the .beta.-phase crystal grain is sometimes referred to as a ".beta. grain".
Effect of the Invention
According to the present invention, it is possible to provide a titanium alloy part having good workability and capable of obtaining an excellent specularity.
BRIEF DESCRIPTION OF THE DRAWINGS
FIG. 1 is an optical micrograph of an .alpha.-phase microstructure in an .alpha.+.beta.-type two-phase alloy with an acicular microstructure.
FIG. 2 is an optical micrograph indicating an .alpha.-phase microstructure of a titanium alloy part according to the present embodiment.
FIG. 3 is an optical micrograph for explaining uniformity of a .beta.-phase distribution (uniform dispersion of .beta. grains) in the .alpha.-phase microstructure of the titanium alloy part according to the embodiment of the present invention.
FIG. 4 is a schematic view illustrating a case where a Ti hot-rolled sheet is supposed and .beta. grains are distributed in layers.
FIG. 5 is a schematic view illustrating a case where .beta. grains are locally concentrated.
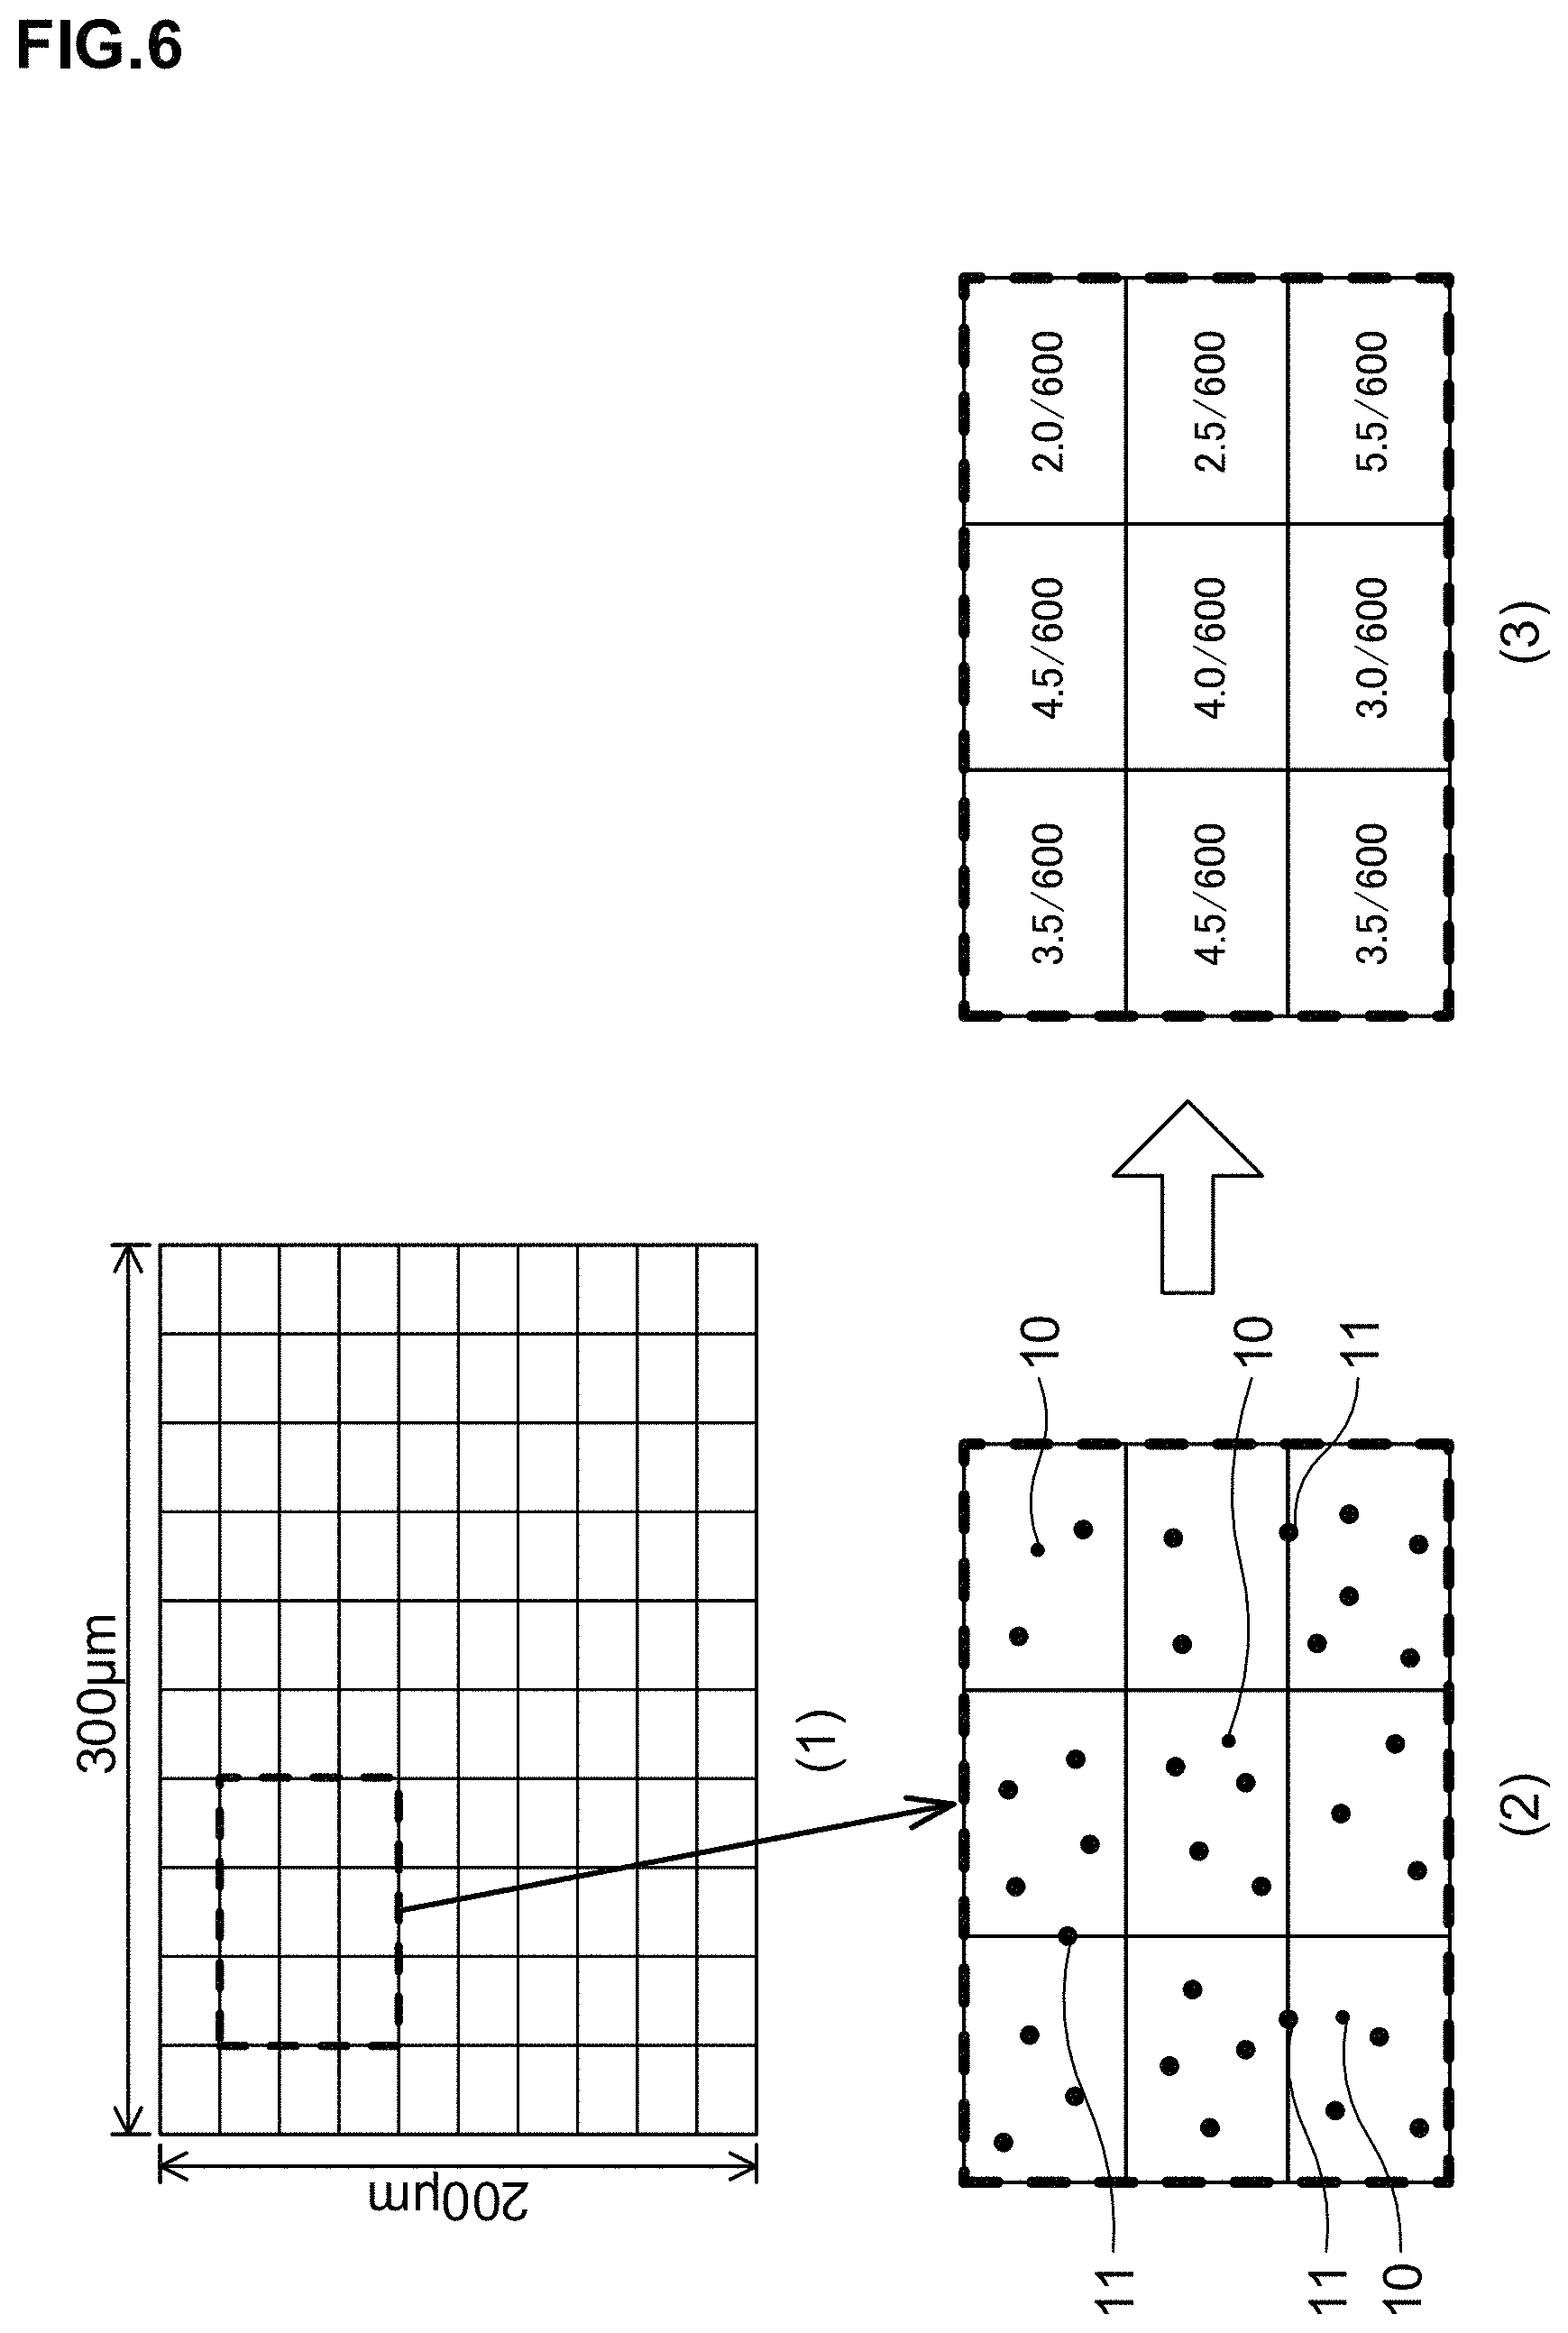
FIG. 6 are explanatory views illustrating a procedure of calculating a coefficient of variation of a number density of .beta.-phase crystal grains.
EMBODIMENTS FOR CARRYING OUT THE INVENTION
Hereinafter, an embodiment of the present invention will be explained.
[Chemical Composition]
A chemical composition of a titanium alloy part according to the present embodiment will be described in detail. As will be described later, the titanium alloy part according to the present embodiment is manufactured through hot rolling, annealing, cutting, scale removal, hot forging, machining, mirror polishing, and the like. Therefore, the chemical composition of the titanium alloy part is suitable for not only properties of the titanium alloy part but also the above treatment. In the following explanation, "%" which is a unit of a content of each element contained in the titanium alloy part means "mass %", unless otherwise noted. The titanium alloy part according to the present embodiment includes Al: 1.0 to 8.0%, Fe: 0.10 to 0.40%, O: 0.00 to 0.30%, C: 0.00 to 0.10%, Sn: 0.00 to 0.20%, Si: 0.00 to 0.15%, and a balance: Ti and impurities.
(Al: 1.0 to 8.0%)
Al suppresses a reduction in hardness due to a temperature rise during mirror polishing, particularly dry polishing. If an Al content is less than 1.0%, it is not possible to obtain sufficient hardness at a time of the mirror polishing, and an excellent specularity cannot be obtained. Therefore, the Al content is 1.0% or more, and preferably 1.5% or more. On the other hand, if the Al content exceeds 8.0%, the hardness becomes excessively large (for example, Vickers hardness Hv5.0 exceeds 400), and sufficient workability cannot be obtained. Therefore, the Al content is 8.0% or less, preferably 6.0% or less, and more preferably 5.0% or less. The Al content is still more preferably 4.0% or less.
(Fe: 0.10 to 0.40%)
Fe is a .beta.-stabilizing element, and suppresses growth of .alpha.-phase crystal grains by a pinning effect provided by a generation of .beta. phase. Although details will be described later, as the .alpha.-phase crystal grains are smaller, an unevenness is smaller and a specularity is higher. If an Fe content is less than 0.10%, the growth of .alpha.-phase crystal grains cannot be sufficiently suppressed, and the excellent specularity cannot be obtained. Therefore, the Fe content is 0.10% or more, and preferably 0.15% or more. On the other hand, Fe has a high contribution to 0-stabilization, and a slight difference in an addition amount greatly affects a .beta.-phase fraction, and a temperature T.sub..beta.20 at which the .beta.-phase fraction becomes 20% greatly fluctuates. If the temperature T.sub..beta.20 becomes lower than a forging temperature, there can be considered a case where an acicular microstructure is formed and an average value of an aspect ratio of the .alpha.-phase crystal grains exceeds 3.0 or a case where a coefficient of variation of a number density of .beta.-phase crystal grains distributed in the .alpha. phase exceeds 0.30. Therefore, the Fe content is 0.40% or less, and preferably 0.35% or less.
(O: 0.00 to 0.30%)
O is not an essential element, and is contained as an impurity, for example. O excessively increases the hardness to reduce the workability. Although O raises the hardness at a temperature around a room temperature, the reduction in hardness due to a temperature rise when performing the mirror polishing is larger when compared with Al, so O does not contribute very much to the hardness when performing the mirror polishing. For this reason, an O content is preferably as low as possible. In particular, when the O content exceeds 0.30%, the reduction in workability is significant. Therefore, the O content is 0.30% or less, and preferably 0.12% or less. The reduction in the O content requires a cost, and when the O content is tried to be reduced to less than 0.05%, the cost is significantly increased. For this reason, the O content may also be set to 0.05% or more.
(C: 0.00 to 0.10%)
C is not an essential element, and is contained as an impurity. C generates TiC and it reduces the specularity. For this reason, a C content is preferably as low as possible. In particular, when the C content exceeds 0.10%, the reduction in specularity is significant. Therefore, the C content is 0.10% or less, and preferably 0.08% or less. The reduction in the C content requires a cost, and when the C content is tried to be reduced to less than 0.0005%, the cost is significantly increased. For this reason, the C content may also be set to 0.0005% or more.
(Sn: 0.00 to 0.20%)
Although Sn is not an essential element, it suppresses the reduction in hardness due to the temperature rise during mirror polishing, particularly dry polishing, similarly to Al. Therefore, Sn may also be contained. In order to sufficiently obtain this effect, a Sn content is preferably 0.01% or more, and more preferably 0.03% or more. On the other hand, if the Sn content exceeds 0.20%, there is a possibility that an adverse effect is exerted on the workability. Therefore, the Sn content is 0.20% or less, and preferably 0.15% or less.
(Si: 0.00 to 0.15%)
Although Si is not an essential element, it suppresses the growth of crystal grains to improve the specularity, similarly to Fe. Further, Si is less likely to segregate than Fe. Therefore, Si may also be contained. In order to sufficiently obtain this effect, a Si content is preferably 0.01% or more, and more preferably 0.03% or more. On the other hand, if the Si content exceeds 0.15%, there is a possibility that an adverse effect is exerted on the specularity due to the segregation of Si. Therefore, the Si content is 0.15% or less, and preferably 0.12% or less.
(Balance: Ti and Impurities)
The balance is composed of Ti and impurities. As the impurities, there can be exemplified those contained in raw materials such as ore and scrap, and those contained in a manufacturing process such as, for example, C, N, H, Cr, Ni, Cu, V, and Mo. The total amount of these C, N, H, Cr, Ni, Cu, V, and Mo is desirably 0.4% or less.
[Microstructure]
Next, a microstructure of the titanium alloy part according to the present embodiment will be described in detail. The titanium alloy part according to the present embodiment has a metal microstructure in which a .beta. phase is distributed in a parent phase of .alpha. phase, and is desirably an .alpha.-.beta.-type titanium alloy (two-phase microstructure) with an .alpha.-phase area ratio of 90% or more. In the present embodiment, an average grain diameter of .alpha.-phase crystal grains is 15.0 .mu.m or less, an average aspect ratio of the .alpha.-phase crystal grains is 1.0 or more and 3.0 or less, and a coefficient of variation of a number density of .beta.-phase crystal grains distributed in the .alpha. phase is 0.30 or less.
(Average Grain Diameter of .alpha.-Phase Crystal Grains: 15.0 .mu.m or Less)
If the average grain diameter of the .alpha.-phase crystal grains exceeds 15.0 .mu.m, an unevenness become larger, and it is not possible to obtain the excellent specularity. Therefore, the average grain diameter of the .alpha.-phase crystal grains is 15.0 .mu.m or less, and preferably 12.0 .mu.m or less. The average grain diameter of the .alpha.-phase crystal grains can be obtained, for example, through a line segment method from an optical micrograph photographed by using a sample for metal microstructure observation. For example, an optical micrograph of 300 .mu.m.times.200 .mu.m photographed at 200 magnifications is prepared, and five line segments are drawn vertically and horizontally, respectively, on this optical micrograph. For each line segment, an average grain diameter is calculated by using the number of crystal grain boundaries of .alpha.-phase crystal grains crossing the line segment, and an arithmetic mean value of the average grain diameter corresponding to ten line segments in total is used to be set as the average grain diameter of the .alpha.-phase crystal grains. Note that when counting the number of crystal grain boundaries, it is set that the number of twin boundaries is not included. Further, when performing the photographing, by etching the mirror-polished sample cross section with a mixed solution of hydrofluoric acid and nitric acid, the .alpha. phase exhibits a white color and the .beta. phase exhibits a black color, so that it is possible to easily distinguish the .alpha. phase and the .beta. phase. Note that it is also possible to distinguish the .alpha. phase and the .beta. phase through EPMA by utilizing a property that Fe is concentrated in the .beta. phase. For example, a region where the intensity of Fe is 1.5 times or more when compared with the .alpha. phase being the parent phase, can be judged as the .beta. phase.
(Average Number of Deformation Twins Per .alpha.-Phase Crystal Grain: 2.0 or More and 10.0 or Less)
At an interface between the parent phase and the twin crystal (twin boundary), there is a surface of discontinuity of crystals similar to the crystal grain boundary, so that as the number of existing twin crystals is larger, it is more likely to practically obtain an effect same as that of a case where the crystal grain diameter becomes small Specifically, the unevenness during polishing becomes smaller, and thus the excellent specularity can be obtained. When the average number of deformation twins per .alpha.-phase crystal grain is 2.0 or less, a remarkable effect cannot be obtained. For this reason, the average number of deformation twins per .alpha.-phase crystal grain is preferably 2.0 or more, and more preferably 3.0 or more. On the other hand, when the average number of deformation twins per .alpha.-phase crystal grain exceeds 10.0, the hardness becomes excessively high, which reduces the workability. For this reason, the average number of deformation twins per .alpha.-phase crystal grain is preferably 10.0 or less, and more preferably 8.0 or less. Note that when measuring the number of deformation twins, an optical micrograph of a field of view of 120 .mu.m.times.80 .mu.m arbitrarily selected from a sample for metal microstructure observation is prepared, and by setting all .alpha.-phase crystal grains observed within the field of view as targets, the number of deformation twins is counted. An arithmetic mean value thereof is used to determine the average number of deformation twins per .alpha.-phase crystal grain.
(Average Aspect Ratio of .alpha.-Phase Crystal Grains: 1.0 or More and 3.0 or Less)
An aspect ratio of an .alpha.-phase crystal grain is a quotient obtained by dividing a length of a major axis of the .alpha.-phase crystal grain by a length of a minor axis. Here, the "major axis" indicates a line segment having the maximum length out of line segments each connecting arbitrary two points on a grain boundary (contour) of the .alpha.-phase crystal grain, and the "minor axis" indicates a line segment having the maximum length out of line segments each being normal to the major axis and connecting arbitrary two points on the grain boundary (contour). If the average aspect ratio of the .alpha.-phase crystal grains exceeds 4.0, an unevenness associated with the .alpha.-phase crystal grains having a high shape anisotropy is likely to be noticeable, resulting in that the excellent specularity cannot be obtained. Therefore, the average aspect ratio of the .alpha.-phase crystal grains is 3.0 or less, and preferably 2.5 or less. Further, when the major axis and the minor axis are equal, the aspect ratio becomes 1.0. The aspect ratio never becomes less than 1.0 by definition thereof. Note that since the titanium alloy part is manufactured through hot forging, the average aspect ratio of the .alpha.-phase crystal grains may have a non-negligible difference depending on a cross section where the microstructure is observed. For this reason, as the average aspect ratio of the .alpha.-phase crystal grains, an average value among three cross sections which are orthogonal to one another is used. The average aspect ratio for each cross section is obtained in a manner that 50 .alpha.-phase crystal grains are extracted from a cross section with the maximum area within an optical micrograph of 300 .mu.m.times.200 .mu.m photographed at 200 magnifications, for example, and an average value of aspect ratios thereof is calculated.
FIG. 1 illustrates an optical micrograph of an .alpha.-phase microstructure in an .alpha.+.beta.-type two-phase alloy formed of an acicular microstructure, and FIG. 2 illustrates an optical micrograph indicating an .alpha.-phase microstructure of a titanium alloy part according to the present embodiment. In the acicular microstructure, an unevenness is likely to be noticeable, and thus the excellent specularity cannot be obtained. The .alpha.-phase crystal grains in the titanium alloy part according to the present embodiment has an average aspect ratio of 3.0 or less in order to be distinguished from the acicular microstructure.
(Coefficient of Variation of Number Density of .beta.-Phase Crystal Grains Distributed in .alpha. Phase: 0.30 or Less)
Here, the way of determining the coefficient of variation of the number density of the .beta.-phase crystal grains distributed in the .alpha. phase will be described while referring to FIG. 3 to FIG. 5. FIG. 3 is an optical micrograph for explaining uniformity of a .beta.-phase distribution (uniform dispersion of .beta. grains) in the .alpha.-phase microstructure of the titanium alloy part according to the embodiment of the invention, in which the coefficient of variation of the number density of the .beta.-phase crystal grains is 0.30 or less. FIG. 4 is a schematic view illustrating a case where a Ti hot-rolled sheet is supposed and .beta. grains are distributed in layers, in which the .beta.-phase crystal grains are distributed in layers, and the coefficient of variation of the number density of the .beta.-phase crystal grains is 1.0. FIG. 5 is a schematic view illustrating a case where .beta. grains are locally concentrated, in which the coefficient of variation of the number density of the .beta.-phase crystal grains is about 1.7.
The coefficient of variation of the number density of the .beta.-phase crystal grains distributed in the .alpha. phase is an index indicating the uniformity of the .beta.-phase distribution, and is calculated as follows. First, as illustrated in FIG. 6(1), an optical micrograph of 300 .mu.m (horizontal direction).times.200 .mu.m (vertical direction) photographed at 200 magnifications is vertically divided into 10 equal parts and horizontally divided into 10 equal parts, to be divided into 100 squares. Next, the number density of .beta. grains for each square (a value obtained by dividing the number of .beta. grains existing in each square by an area of the square) is determined. At this time, the .beta. grain having a circle-equivalent diameter of 0.5 .mu.m or more is targeted, and the .beta. grain which exists across two or more squares is counted such that 0.5 pieces of the .beta. grain exists in each of the squares. For example, as illustrated in FIG. 6(2), in enlarged vertical and horizontal 3.times.3 squares, a .beta. grain 10 having a circle-equivalent diameter of less than 0.5 .mu.m is inferior regarding an effect of improving the specularity, and thus it is not counted as the number of .beta. grains. Further, a .beta. grain 11 which exists across two squares is counted such that 0.5 pieces thereof exists in each of the squares. For example, the number density (number/.mu.m.sup.2) of .beta. grains in each square of the vertical and horizontal 3.times.3 squares illustrated in an enlarged manner in FIG. 6(2) is as illustrated in FIG. 6(3). After that, an arithmetic average and a standard deviation of the number density of .beta. grains among 100 squares illustrated in FIG. 6(1) are calculated. Subsequently, a quotient obtained by dividing the standard deviation by the arithmetic average is employed as the coefficient of variation of the number density of the .beta.-phase crystal grains distributed in the .alpha. phase. If the coefficient of variation of the number density of the .beta.-phase crystal grains distributed in the .alpha. phase exceeds 0.30, an unevenness is likely to occur during the mirror polishing due to the nonuniformity of the .beta.-phase distribution, resulting in that the excellent specularity cannot be obtained. Therefore, the coefficient of variation of the number density of the .beta.-phase crystal grains distributed in the .alpha. phase is 0.30 or less, and preferably 0.25 or less.
[Manufacturing Method]
Next, one example of a manufacturing method of the titanium alloy part according to the embodiment of the present invention will be described. Note that the manufacturing method to be described below is one example for obtaining the titanium alloy part according to the embodiment of the present invention, and the titanium alloy part according to the embodiment of the present invention is not limited to be manufactured by the following manufacturing method. In this manufacturing method, first, a titanium alloy raw material having the aforementioned chemical composition is subjected to hot rolling, and cooling to the room temperature, to thereby obtain a hot-rolled material. Next, the hot-rolled material is subjected to annealing, and cooling to the room temperature, to thereby obtain a hot-rolled annealed material. After that, the hot-rolled annealed material is subjected to size adjustment, scale removal, and hot forging. The hot forging is repeated 2 to 10 times, and cooling is performed to the room temperature every time the hot forging is performed. Subsequently, machining and mirror polishing are carried out. According to such a method, it is possible to manufacture the titanium alloy part according to the embodiment of the present invention.
(Hot Rolling)
The titanium alloy raw material can be obtained through, for example, melting of the raw material, casting, and forging. The hot rolling is started in a two-phase region of .alpha. and .beta. (a temperature region lower than a .beta. transformation temperature T.sub..beta.100). By performing the hot rolling in the two-phase region, a c-axis of hexagonal close-packed (hcp) is oriented in a direction normal to a surface of the hot-rolled annealed material, resulting in that an in-plane anisotropy becomes small. The reduction in anisotropy is quite effective for improving the specularity. If the hot rolling is started at the .beta. transformation temperature T.sub..beta.100 or a temperature higher than the .beta. transformation temperature T.sub..beta.100, a proportion of the acicular microstructure become high, and it is not possible to obtain the .alpha.-phase crystal grain having the aspect ratio whose average value is 1.0 or more and 3.0 or less.
(Annealing)
The annealing of the hot-rolled material is performed under a condition in a temperature region of 600.degree. C. or more and equal to or less than a temperature T.sub..beta.20 at which a .beta.-phase fraction becomes 20%, for 30 minutes or more and 240 minutes or less. If the annealing temperature is less than 600.degree. C., recrystallization cannot be completed by the annealing, resulting in that a worked structure remains, and the average aspect ratio of the .alpha.-phase crystal grains exceeds 3.0 or a worked microstructure with nonuniform .beta.-phase distribution remains, which makes it impossible to obtain the excellent specularity. On the other hand, if the annealing temperature exceeds the temperature T.sub..beta.20, the proportion of the acicular microstructure becomes high, resulting in that the average aspect ratio of the .alpha.-phase crystal grains exceeds 3.0 or the coefficient of variation of the number density of the .beta.-phase crystal grains exceeds 0.3. Further, there is a possibility that the average grain diameter of the .alpha.-phase crystal grains exceeds 15.0 .mu.m. If the annealing time is less than 30 minutes, the recrystallization cannot be completed by the annealing, resulting in that a worked microstructure remains, and the average aspect ratio of the .alpha.-phase crystal grains exceeds 3.0 or a worked microstructure with nonuniform .beta.-phase distribution remains, which makes it impossible to obtain the excellent specularity. If the annealing time exceeds 240 minutes, the average grain diameter of the .alpha.-phase crystal grains exceeds 15.0 .mu.m, and it is not possible to obtain the excellent specularity. Further, as the period of time of the annealing becomes longer, the scale becomes thicker and the yield becomes lower.
(Size Adjustment, Scale Removal)
The hot-rolled annealed material is worked into a size suitable for a die used for the hot forging. For example, a blank material is cut out from the hot-rolled annealed material in a thick plate shape, or wire drawing or rolling of the hot-rolled annealed material in a round bar shape is performed. After that, pickling or machining is performed to remove scale that exists on a rolled surface of the hot-rolled annealed material. It is also possible to remove the scale by performing both pickling and machining
(Hot Forging)
Basically, the average grain diameter and the average aspect ratio of the .alpha.-phase crystal grains can satisfy the present invention by performing the predetermined annealing, but, the coefficient of variation of the number density of the .beta.-phase crystal grains does not satisfy the present invention without performing the hot forging. If a temperature of the hot forging is less than 750.degree. C., a deformation resistance of the material is large, which facilitates breakage and wear of a tool. On the other hand, if the temperature of the hot forging exceeds the temperature T.sub..beta.20, the proportion of the acicular microstructure becomes high, and the average value of the aspect ratio of the .alpha.-phase crystal grains exceeds 3.0 or the coefficient of variation of the number density of the .beta.-phase crystal grains exceeds 0.3. As the number of times of forging is larger, the .beta.-phase distribution is more likely to be uniform, and the aspect ratio of the .alpha.-phase crystal grains is more likely to be reduced.
The .beta. transformation temperature T.sub..beta.100 and the temperature T.sub..beta.20 at which the .beta.-phase fraction becomes 20% can be obtained from .alpha. phase diagram. The phase diagram can be obtained through, for example, a CALPHAD (Computer Coupling of Phase Diagrams and Thermochemistry) method, and for the purpose thereof, for example, it is possible to use Thermo-Calc which is an integrated thermodynamic calculation system provided by Thermo-Calc Software AB and a predetermined database (TI3).
After the hot forging, cooling to the room temperature is performed. At that time, if an average cooling rate from the forging temperature to 500.degree. C. is less than 20.degree. C./s, the .beta. phase is generated during the cooling, and in heating to be performed thereafter, the .beta.-phase distribution is difficult to be uniform, and it is not possible to make the coefficient of variation of the number density of the .beta.-phase crystal grains to be 0.3 or less. Further, Al and Fe diffuse during the cooling, which causes a heterogeneity of their concentrations, and which also causes an unevenness of a surface state after mirror polishing. An average cooling rate when performing water quench is approximately 300.degree. C./s, although depending also on a size of an object. An average cooling rate when performing air cooling is approximately 3.degree. C./s, so that it is preferable to perform the water quench.
Further, the hot forging and the cooling to the room temperature are repeatedly performed. If the forging is performed only one time, it is sometimes impossible to make the coefficient of variation of the number density of the .beta.-phase crystal grains to be 0.3 or less, or to make the average aspect ratio of the .alpha.-phase crystal grains to be 3.0 or less. On the other hand, even if the forging and the cooling are repeated 11 times or more, the change in the microstructure is small, which may unnecessarily cause the reduction in yield and the increase in manufacturing cost. The .beta. phase is uniformly distributed during reheating after the cooling.
In order to make the average number of deformation twins per .alpha.-phase crystal grain to be 2.0 or more, there is a need to set the maximum reduction of area at the time of final forging to 0.10 or more. On the other hand, in order to make the average number of deformation twins per .alpha.-phase crystal grain to be 10.0 or less, there is a need to set the maximum reduction of area at the time of final forging to 0.50 or less. Here, the reduction of area can be calculated by {(A.sub.1-A.sub.2)/A.sub.1} from a cross-sectional area A.sub.1 before forging and a cross-sectional area A.sub.2 after forging in a certain cross section of the material. In the present invention, out of cross sections parallel to a compressing direction of the final forging, a reduction of area in a cross section with the largest reduction of area is set to the maximum reduction of area.
The titanium alloy part according to the embodiment of the present invention can be manufactured by the above-described manufacturing method as one example. The titanium alloy part according to the embodiment of the present invention manufactured as above is subsequently subjected to machining and mirror polishing as follows, and can be manufactured into various products and components excellent in appearance such as ornaments.
(Machining)
The titanium alloy part according to the embodiment of the present invention manufactured as above is subjected to machining such as cutting, for example. In the machining, for example, drilling for connecting mutual components of an ornament is performed.
(Mirror Polishing)
Further, for example, the mirror polishing is performed after the machining Although either wet polishing or dry polishing may be performed, from a viewpoint of suppression of sagging, the dry polishing is more preferable than the wet polishing. In the dry polishing, a temperature is likely to be higher than that in the wet polishing, but, in the present embodiment, since an appropriate amount of Al is contained, a reduction in hardness due to the temperature rise is suppressed. Although a concrete method of the mirror polishing is not particularly defined, it is performed while properly using, for example, a polishing wheel of hemp base, grass base, cloth base, and the like, and a sand paper depending on purposes.
By performing the machining and the minor polishing on the titanium alloy part according to the embodiment of the present invention as described above, it is possible to obtain various products and components excellent in appearance such as ornaments.
[Evaluation]
The titanium alloy part according to the embodiment of the present invention is evaluated as follows regarding its good workability and excellent specularity.
(Vickers Hardness Hv5.0)
The titanium alloy part according to the embodiment of the present invention having the Vickers hardness Hv5.0 of 200 or more and 400 or less as an index of evaluating the good workability, is set as acceptable. If the Vickers hardness Hv5.0 is less than 200, the sufficient hardness cannot be obtained during the mirror polishing, and it is not possible to obtain the excellent specularity. On the other hand, if the Vickers hardness Hv5.0 exceeds 400, a total elongation often becomes less than 10%, which deteriorates the workability. The measurement of Vickers hardness is performed according to JIS Z 2244, in which a test is performed on seven points with a measuring load of 5 kgf and a retention time of 15 s, and calculation is performed based on an average of five points excluding the maximum value and the minimum value. Further, the Vickers hardness is measured in a manner that, for example, a forged product is cut and polished to produce a flat surface, and it is set that a distance between centers of two adjacent indentations on the flat surface becomes larger by five times or more than an indentation size.
(DOI)
Further, as an index of evaluating the excellent specularity, DOI (Distinctness of Image) being a parameter representing image clarity is used. The measurement of DOI is performed according to ASTM D 5767 with an angle of incident light of 20.degree.. The DOI is measured by using, for example, an appearance analyzer Rhopoint IQ Flex 20 manufactured by Rhopoint Instruments, or the like. The higher the DOI, the better the specularity, and the DOI of 60 or more is set as acceptable.
Note that each of the above-described embodiments only shows concrete examples when implementing the present invention, and the technical scope of the present invention should not be limitedly construed by these. That is, the present invention can be implemented in various forms without departing from the technical idea or the main features thereof.
EXAMPLES
Next, examples of the present invention will be described. The conditions in the examples are one condition example adopted to confirm the practicability and effects of the present invention, and the present invention is not limited to the one condition example. The present invention can adopt various conditions as long as the object of the present invention is achieved without departing from the gist of the present invention.
In the examples, a plurality of raw materials having chemical compositions shown in Table 1 were prepared. A blank column in Table 1 indicates that a content of an element in that column was less than a detection limit, and a balance is composed of Ti and impurities. An underline in Table 1 indicates that the underlined numeric value is out of the range of the present invention.
TABLE-US-00001 TABLE 1 RAW CHEMICAL COMPOSITION (MASS %) MATERIAL Al Fe O C Sn Si A 3.0 0.2 0.05 0.02 B 2.0 0.4 0.10 0.02 C 2.0 0.2 0.10 0.01 D 2.5 0.2 0.10 0.03 E 3.0 0.2 0.10 0.04 F 2.0 0.3 0.13 0.03 G 1.5 0.1 0.15 0.02 H 3.5 0.2 0.07 0.01 I 2.5 0.1 0.10 0.03 J 1.0 0.3 0.15 0.01 K 3.0 0.3 0.14 0.01 L 1.5 0.2 0.08 0.01 M 2.0 0.2 0.10 0.01 0.01 N 2.0 0.2 0.10 0.03 0.10 O 2.0 0.2 0.10 0.04 0.01 P 2.0 0.2 0.10 0.03 0.10 Q 2.0 0.2 0.10 0.02 0.10 0.10 R 4.0 0.2 0.10 0.01 S 4.4 0.4 0.10 0.02 T 3.5 0.1 0.13 0.02 U 1.0 0.4 0.10 0.02 V 2.0 0.2 0.10 0.03 0.12 W 2.0 0.2 0.10 0.02 0.12 X 5.0 0.3 0.10 0.03 Y 6.5 0.3 0.09 0.02 Z 7.8 0.2 0.10 0.02 AA 4.5 0.4 0.25 0.02 BB 5.5 0.2 0.20 0.03 CC 4.5 0.2 0.28 0.02 DD 6.5 0.3 0.35 0.03 EE 0.5 0.4 0.15 0.02 FF 1.0 0.01 0.14 0.03 GG 4.0 0.01 0.10 0.02 HH 1.0 1.0 0.10 0.01 II 1.0 0.01 0.20 0.03 JJ 5.0 1.0 0.07 0.04 KK 5.0 0.01 0.11 0.03 LL 0.0 0.4 0.30 0.03 MM 4.0 0.01 0.25 0.03 NN 2.0 0.2 0.10 0.17 OO 2.5 0.3 0.10 0.04 PP 1.5 0.2 0.10 0.01 QQ 8.5 0.3 0.20 0.04 RR 1.5 0.6 0.09 0.03 SS 7.8 0.2 0.20 0.02 0.25 TT 2.0 0.2 0.10 0.03 0.18
Next, each of the raw materials was subjected to hot rolling, annealing, and hot forging under conditions shown in Tables 2-1 and 2-2 to produce an evaluation sample simulating a shape of an ornament (brooch), and after that, dry polishing was performed. The dry polishing was performed in the order from polishing with a rough-grid abrasive paper to polishing with a fine-grid abrasive paper, and after that, finishing was performed through buffing to obtain a mirror surface. An underline in Tables 2-1 and 2-2 indicates that the underlined condition is out of the range suitable for manufacturing the titanium alloy part according to the present invention.
TABLE-US-00002 TABLE 2-1 MANUFACTURING METHOD TEMPERATURE HOT THE COOLING MAXIMUM T.sub..beta.20 AT WHICH ROLLING FORGING NUMBER RATE AFTER REDUCTION .beta. FRACTION .beta. TRANSFORMATION TEMPER- ANNEALING ANNEALING TEMPER- OF FORGING OF AREA RAW BECOMES TEMPERATURE ATURE TEMPERATURE TIME ATURE TIMES OF (.degree. C./s)/COOLING IN FINAL OTHER MATERIAL 20% (.degree. C.) T.sub..beta.100 (.degree. C.) (.degree. C.) (.degree. C.) (min) (.degree. C.) FORGING METHOD FORGING PROCESSES EXAMPLE 1 A 920 960 850 890 120 880 6 300/WATER QUENCH 0.14 -- EXAMPLE 2 B 883 940 700 840 60 850 6 300/WATER QUENCH 0.43 -- EXAMPLE 3 C 904 948 750 750 60 850 8 300/WATER QUENCH 0.33 -- EXAMPLE 4 D 914 961 780 800 120 850 8 300/WATER QUENCH 0.38 -- EXAMPLE 5 E 923 972 800 850 60 900 8 300/WATER QUENCH 0.34 -- EXAMPLE 6 F 895 951 750 850 30 850 6 300/WATER QUENCH 0.27 -- EXAMPLE 7 G 909 945 850 800 60 890 6 300/WATER QUENCH 0.21 -- EXAMPLE 8 H 931 978 900 875 240 900 7 300/WATER QUENCH 0.25 -- EXAMPLE 9 I 926 962 950 920 60 850 6 300/WATER QUENCH 0.24 -- EXAMPLE 10 J 878 927 700 600 120 750 6 300/WATER QUENCH 0.19 -- EXAMPLE 11 K 913 969 880 850 180 880 10 300/WATER QUENCH 0.15 -- EXAMPLE 12 L 894 932 900 700 120 860 2 300/WATER QUENCH 0.44 -- EXAMPLE 13 M 905 948 800 750 120 850 5 300/WATER QUENCH 0.19 -- EXAMPLE 14 N 905 949 800 750 120 850 5 300/WATER QUENCH 0.11 -- EXAMPLE 15 O 905 948 800 750 120 850 5 300/WATER QUENCH 0.13 -- EXAMPLE 16 P 903 948 800 750 120 850 5 300/WATER QUENCH 0.21 -- EXAMPLE 17 Q 903 948 800 750 120 850 5 300/WATER QUENCH 0.29 -- EXAMPLE 18 R 943 990 900 850 240 900 10 300/WATER QUENCH 0.30 -- EXAMPLE 19 S 918 994 900 800 240 880 10 300/WATER QUENCH 0.12 -- EXAMPLE 20 T 947 991 800 800 120 920 10 300/WATER QUENCH 0.49 -- EXAMPLE 21 U 869 918 700 700 180 750 4 300/WATER QUENCH 0.27 -- EXAMPLE 22 V 905 949 850 750 180 800 4 300/WATER QUENCH 0.42 -- EXAMPLE 23 W 903 948 850 750 120 780 5 300/WATER QUENCH 0.15 -- EXAMPLE 24 X 950 1008 950 920 120 900 8 300/WATER QUENCH 0.18 -- EXAMPLE 25 Y 979 1044 1000 950 240 950 10 300/WATER QUENCH 0.11 -- EXAMPLE 26 Z 1017 1074 1030 1000 240 1000 10 300/WATER QUENCH 0.12 -- EXAMPLE 27 D 914 961 780 800 120 850 8 300/WATER QUENCH 0.07 -- EXAMPLE 28 Z 1017 1074 1030 1000 240 1010 8 300/WATER QUENCH 0.55 -- EXAMPLE 29 AA 930 1024 900 850 180 900 10 300/WATER QUENCH 0.12 -- EXAMPLE 30 BB 982 1050 950 900 240 950 8 200/WATER QUENCH 0.13 -- EXAMPLE 31 BB 982 1050 950 900 240 950 8 50/WATER QUENCH 0.12 -- EXAMPLE 32 CC 969 1044 950 900 180 950 8 100/WATER QUENCH 0.15 --
TABLE-US-00003 TABLE 2-2 MANUFACTURING METHOD TEMPERATURE .beta. TRANS- HOT THE COOLING MAXIMUM T.sub..beta.20 AT WHICH FORMATION ROLLING ANNEALING FORGING NUMBER RATE AFTER REDUCTION .beta. FRACTION TEMPER- TEMPER- TEMPER- ANNEALING TEMPER- OF FORGING OF AREA RAW BECOMES ATURE ATURE ATURE TIME ATURE TIMES OF (.degree. C./s)/COOLING IN FINAL OTHER MATERIAL 20% (.degree. C.) T.sub..beta.100 (.degree. C.) (.degree. C.) (.degree. C.) (min) (.degree. C.) FORGING METHOD FORGING PROCESSES COMPARATIVE DD 1005 1105 1050 950 240 950 10 300/WATER QUENCH 0.11 -- EXAMPLE 1 COMPARATIVE EE 857 910 700 600 120 800 2 300/WATER QUENCH 0.33 -- EXAMPLE 2 COMPARATIVE FF 908 927 850 800 240 880 6 300/WATER QUENCH 0.17 -- EXAMPLE 3 COMPARATIVE GG 956 995 900 900 120 920 8 300/WATER QUENCH 0.22 -- EXAMPLE 4 COMPARATIVE HH 803 905 800 750 60 840 8 300/WATER QUENCH 0.43 -- EXAMPLE 5 COMPARATIVE II 911 936 700 700 120 840 4 300/WATER QUENCH 0.14 -- EXAMPLE 6 COMPARATIVE JJ 869 987 850 800 240 850 8 300/WATER QUENCH 0.12 -- EXAMPLE 7 COMPARATIVE KK 986 1021 900 900 120 960 10 300/WATER QUENCH 0.28 -- EXAMPLE 8 COMPARATIVE LL 856 915 700 650 180 850 8 300/WATER QUENCH 0.36 -- EXAMPLE 9 COMPARATIVE MM 978 995 900 850 180 940 10 300/WATER QUENCH 0.21 -- EXAMPLE 10 COMPARATIVE NN 920 1021 900 800 120 800 6 300/WATER QUENCH 0.15 -- EXAMPLE 11 COMPARATIVE OO 903 958 1000 750 120 800 4 300/WATER QUENCH 0.20 -- EXAMPLE 12 COMPARATIVE OO 903 958 850 550 60 800 4 300/WATER QUENCH 0.20 -- EXAMPLE 13 COMPARATIVE OO 903 958 850 930 60 800 4 300/WATER QUENCH 0.19 -- EXAMPLE 14 COMPARATIVE OO 903 958 850 700 20 800 4 300/WATER QUENCH 0.22 -- EXAMPLE 15 COMPARATIVE OO 903 958 850 700 300 800 4 300/WATER QUENCH 0.18 -- EXAMPLE 16 COMPARATIVE OO 903 958 850 700 60 700 4 300/WATER QUENCH 0.21 -- EXAMPLE 17 COMPARATIVE OO 903 958 850 700 60 930 4 300/WATER QUENCH 0.20 -- EXAMPLE 18 COMPARATIVE OO 903 958 850 700 60 800 1 300/WATER QUENCH 0.45 -- EXAMPLE 19 COMPARATIVE OO 903 958 850 700 60 800 4 3/AIR COOLING 0.20 -- EXAMPLE 20 COMPARATIVE OO 903 958 850 700 60 -- -- -- -- -- EXAMPLE 21 COMPARATIVE PP 895 931 850 700 60 -- -- -- -- 75% COLD ROLLING + EXAMPLE 22 VACUUM ANNEALING COMPARATIVE QQ 1024 1101 1000 950 240 1000 10 300/WATER QUENCH 0.11 -- EXAMPLE 23 COMPARATIVE RR 854 936 800 800 120 850 4 300/WATER QUENCH 0.23 -- EXAMPLE 24 COMPARATIVE SS 1024 1090 1000 950 120 1000 10 300/WATER QUENCH 0.19 -- EXAMPLE 25 COMPARATIVE TT 904 957 850 800 120 850 4 300/WATER QUENCH 0.15
Further, after the dry polishing, evaluation of the specularity was conducted. In the evaluation of the specularity, DOI (Distinctness of Image) being a parameter representing image clarity was used. The DOI measurement was performed according to ASTM D 5767 with an angle of incident light of 20.degree.. The DOI can be measured by using, for example, an appearance analyzer Rhopoint IQ Flex 20 manufactured by Rhopoint Instruments, or the like. The higher the DOI, the better the specularity, and a sample with the DOI of 60 or more is set as an acceptable line of the specularity. Further, the part after being subjected to the evaluation of the specularity was cut at an arbitrary cross section, subjected to mirror polishing and etching, an optical micrograph was photographed. And by using this photograph, an average grain diameter of .alpha.-phase crystal grains, an average aspect ratio of the .alpha.-phase crystal grains, a coefficient of variation of a number density of .beta.-phase crystal grains distributed in the .alpha. phase, and an average number of deformation twins per one crystal grain of the .alpha. phase were measured. Further, the hardness (Hv5.0) was measured through a Vickers hardness test.
Results of these are shown in Tables 3-1 and 3-2. An underline in Tables 3-1 and 3-2 indicates that the underlined numeric value is out of the range of the present invention or the underlined evaluation is out of the range to be obtained by the present invention. Note that in Tables 3-1 and 3-2, a grain diameter indicates an average grain diameter of .alpha.-phase crystal grains, an aspect ratio indicates an average aspect ratio of the .alpha.-phase crystal grains, and a coefficient of variation of .beta.-grain density indicates a coefficient of variation of a number density of .beta.-phase crystal grains.
TABLE-US-00004 TABLE 3-1 METAL MICROSTRUCTURE THE AVERAGE COEFFICIENT NUMBER OF OF DEFORMATION WORKABILITY GRAIN VARIATION TWINS PER SPECULARITY SURFACE RAW DIAMETER ASPECT OF .beta. GRAIN ONE .alpha.-PHASE DOI HARDNESS MATERIAL (.mu.m) RATIO DENSITY CRYSTAL GRAIN (%) (Hv5.0) EXAMPLE 1 A 7.2 1.7 0.22 3.0 75 251 EXAMPLE 2 B 8.6 1.6 0.18 6.9 69 218 EXAMPLE 3 C 7.4 1.9 0.19 5.2 70 227 EXAMPLE 4 D 8.5 1.8 0.24 5.7 71 235 EXAMPLE 5 E 8.8 2.1 0.21 5.1 75 247 EXAMPLE 6 F 7.9 2.1 0.19 3.7 72 229 EXAMPLE 7 G 10.3 2.2 0.20 5.0 68 220 EXAMPLE 8 H 6.8 1.7 0.23 3.5 81 247 EXAMPLE 9 I 7.8 2.0 0.20 5.0 75 230 EXAMPLE 10 J 11.2 2.3 0.19 5.1 62 210 EXAMPLE 11 K 5.6 1.5 0.16 3.1 75 241 EXAMPLE 12 L 9.4 2.8 0.28 7.6 67 232 EXAMPLE 13 M 8.5 1.5 0.21 3.7 70 218 EXAMPLE 14 N 8.6 2.2 0.23 2.9 69 220 EXAMPLE 15 O 8.4 2.1 0.19 2.8 69 223 EXAMPLE 16 P 8.2 1.9 0.18 4.2 72 221 EXAMPLE 17 Q 7.8 2.2 0.22 4.9 70 223 EXAMPLE 18 R 6.5 1.5 0.23 4.3 84 270 EXAMPLE 19 S 6.4 1.8 0.26 2.4 90 267 EXAMPLE 20 T 7.3 1.6 0.12 8.7 82 264 EXAMPLE 21 U 8.9 1.5 0.18 6.4 63 200 EXAMPLE 22 V 8.6 2.1 0.20 8.2 72 218 EXAMPLE 23 W 8.9 2.2 0.26 3.2 68 218 EXAMPLE 24 X 5.2 1.8 0.23 3.5 90 296 EXAMPLE 25 Y 8.7 1.5 0.18 2.3 93 330 EXAMPLE 26 Z 7.5 1.7 0.16 2.5 96 365 EXAMPLE 27 D 8.5 1.8 0.24 1.8 63 206 EXAMPLE 28 Z 7.2 2.2 0.22 10.5 97 397 EXAMPLE 29 AA 13.6 2.5 0.26 2.3 75 319 EXAMPLE 30 BB 8.0 1.7 0.16 2.4 90 338 EXAMPLE 31 BB 8.2 1.7 0.19 2.5 88 338 EXAMPLE 32 CC 9.4 2.0 0.18 2.4 85 337
TABLE-US-00005 TABLE 3-2 METAL MICROSTRUCTURE THE AVERAGE COEFFICIENT NUMBER OF OF DEFORMATION WORKABILITY GRAIN VARIATION TWINS PER SPECULARITY SURFACE RAW DIAMETER ASPECT OF .beta. GRAIN ONE .alpha.-PHASE DOI HARDNESS MATERIAL (.mu.m) RATIO DENSITY CRYSTAL GRAIN (%) (Hv5.0) COMPARATIVE DD 6.5 1.5 0.14 2.3 90 411 EXAMPLE 1 COMPARATIVE EE 5.6 1.7 0.15 8.2 53 199 EXAMPLE 2 COMPARATIVE FF 17.3 1.7 0.20 3.9 52 203 EXAMPLE 3 COMPARATIVE GG 18.5 2.2 0.24 3.5 58 278 EXAMPLE 4 COMPARATIVE HH 8.5 2.1 0.42 8.8 58 205 EXAMPLE 5 COMPARATIVE II 21.5 1.8 0.17 3.1 54 222 EXAMPLE 6 COMPARATIVE JJ 6.8 1.9 0.34 2.4 58 284 EXAMPLE 7 COMPARATIVE KK 17.5 2.0 0.19 3.4 57 290 EXAMPLE 8 COMPARATIVE LL 12.5 1.7 0.20 8.6 56 233 EXAMPLE 9 COMPARATIVE MM 16.3 2.1 0.13 2.9 51 302 EXAMPLE 10 COMPARATIVE NN 8.1 1.6 0.15 3.4 52 218 EXAMPLE 11 COMPARATIVE OO 11.7 3.7 0.42 3.8 50 228 EXAMPLE 12 COMPARATIVE OO 10.2 3.4 0.25 4.1 43 238 EXAMPLE 13 COMPARATIVE OO 21.6 4.3 0.38 3.7 56 230 EXAMPLE 14 COMPARATIVE OO 12.3 3.5 0.27 4.5 48 236 EXAMPLE 15 COMPARATIVE OO 18.3 2.3 0.25 4.5 48 228 EXAMPLE 16 COMPARATIVE OO SAMPLE COULD NOT BE PRODUCED BECAUSE OF DAMAGE OF DIE EXAMPLE 17 DUE TO POOR FORGING WORKABILITY COMPARATIVE OO 13.5 3.6 0.43 3.7 56 235 EXAMPLE 18 COMPARATIVE OO 7.3 3.3 0.31 8.3 54 250 EXAMPLE 19 COMPARATIVE OO 9.3 2.5 0.31 4.0 57 233 EXAMPLE 20 COMPARATIVE OO 10.0 1.3 0.32 0 48 233 EXAMPLE 21 COMPARATIVE PP 8.5 1.2 0.32 0 56 206 EXAMPLE 22 COMPARATIVE QQ 7.5 1.7 0.18 2.3 95 415 EXAMPLE 23 COMPARATIVE RR 10.5 2.4 0.38 4.6 53 209 EXAMPLE 24 COMPARATIVE SS 7.8 1.8 0.23 3.4 94 402 EXAMPLE 25 COMPARATIVE TT 8.5 2.1 0.26 3.1 55 220 EXAMPLE 26
As shown in Tables 3-1 and 3-2, in examples 1 to 32, since they were within the range of the present invention, it was possible to realize both excellent specularity and workability. Particularly good results were obtained in examples 1 to 26, and 29 to 32 in which the average number of deformation twins per one crystal grain of the .alpha. phase was 2.0 to 10.0.
In a comparative example 1, the O content is excessively high, and thus the hardness is excessively high and the workability is low. In a comparative example 2, the Al content is excessively low, and thus the hardness is excessively low and the specularity is low. In comparative examples 3, 4, the Fe content is excessively low, and thus the average grain diameter of the .alpha.-phase crystal grains is excessively large, and the specularity is low. In a comparative example 5, the Fe content is excessively high, and thus an acicular microstructure locally exists due to segregation, the coefficient of variation of the number density of the .beta.-phase crystal grains is excessively high, and the specularity is low. In a comparative example 6, the Fe content is excessively low, and thus the average grain diameter of the .alpha.-phase crystal grains is excessively large, and the specularity is low. In a comparative example 7, the Fe content is excessively high, and thus the coefficient of variation of the number density of the .beta.-phase crystal grains is excessively high, and the specularity is low. In a comparative example 8, the Fe content is excessively low, and thus the average grain diameter of the .alpha.-phase crystal grains is excessively large, and the specularity is low. In a comparative example 9, the Al content is excessively low, and the specularity is low. In a comparative example 10, the Fe content is excessively low, and thus the average grain diameter of the .alpha.-phase crystal grains is excessively large, and the specularity is low. In a comparative example 11, the C content is excessively high, and thus TiC is generated, and the specularity is low.
In a comparative example 12, the hot-rolling temperature is excessively high, the average aspect ratio of the .alpha.-phase crystal grains is excessively large, and the coefficient of variation of the number density of the .beta.-phase crystal grains is excessively high, and thus the specularity is low. In a comparative example 13, the annealing temperature is excessively low, and the average aspect ratio of the .alpha.-phase crystal grains is excessively large, and thus the specularity is low. In a comparative example 14, the annealing temperature is excessively high, the average grain diameter of the .alpha.-phase crystal grains is excessively large, the average aspect ratio of the .alpha.-phase crystal grains is excessively large, and the coefficient of variation of the number density of the .beta.-phase crystal grains is excessively high, and thus the specularity is low. In a comparative example 15, the annealing time is excessively short, and the average aspect ratio of the .alpha.-phase crystal grains is excessively large, and thus the specularity is low. In a comparative example 16, the annealing time is excessively long, and the average grain diameter of the .alpha.-phase crystal grains is excessively large, and thus the specularity is low. In a comparative example 17, the forging temperature was excessively low, and thus the metal mold was damaged and it was not possible to produce the sample. In a comparative example 18, the forging temperature is excessively high, the average aspect ratio of the .alpha.-phase crystal grains is excessively large, and the coefficient of variation of the number density of the .beta.-phase crystal grains is excessively high, and thus the specularity is low. In a comparative example 19, the number of times of the forging is excessively small, the average aspect ratio of the .alpha.-phase crystal grains is excessively large, and the coefficient of variation of the number density of the .beta.-phase crystal grains is excessively high, and thus the specularity is low. In a comparative example 20, the average cooling rate after the forging is excessively low, and the coefficient of variation of the number density of the .beta.-phase crystal grains is excessively high, and thus the specularity is low. In comparative examples 21, 22, the forging is not performed, and the coefficient of variation of the number density of the .beta.-phase crystal grains is excessively high, and thus the specularity is low.
In a comparative example 23, the Al content is excessively high, and thus the hardness is excessively high and the workability is low. In a comparative example 24, the Fe content is excessively high, and thus an acicular microstructure locally exists due to segregation, the coefficient of variation of the number density of the .beta.-phase crystal grains is excessively high, and the specularity is low. In a comparative example 25, the Sn content is excessively high, and thus the hardness is excessively high and the workability is low. In a comparative example 26, the Si content is excessively high, and thus the specularity is low.
EXPLANATION OF CODES
10 . . . .beta. grain having circle-equivalent diameter of less than 0.5 .mu.m 11 . . . .beta. grain having circle-equivalent diameter of 0.5 .mu.m or more and existing across two squares.
* * * * *
D00000
D00001
D00002
D00003
XML
uspto.report is an independent third-party trademark research tool that is not affiliated, endorsed, or sponsored by the United States Patent and Trademark Office (USPTO) or any other governmental organization. The information provided by uspto.report is based on publicly available data at the time of writing and is intended for informational purposes only.
While we strive to provide accurate and up-to-date information, we do not guarantee the accuracy, completeness, reliability, or suitability of the information displayed on this site. The use of this site is at your own risk. Any reliance you place on such information is therefore strictly at your own risk.
All official trademark data, including owner information, should be verified by visiting the official USPTO website at www.uspto.gov. This site is not intended to replace professional legal advice and should not be used as a substitute for consulting with a legal professional who is knowledgeable about trademark law.