Time-series analysis system
Cervelli , et al. May 11, 2
U.S. patent number 11,004,244 [Application Number 16/443,626] was granted by the patent office on 2021-05-11 for time-series analysis system. This patent grant is currently assigned to Palantir Technologies Inc.. The grantee listed for this patent is Palantir Technologies Inc.. Invention is credited to Allen Cai, Daniel Cervelli, David Skiff, David Tobin.


View All Diagrams
| United States Patent | 11,004,244 |
| Cervelli , et al. | May 11, 2021 |
Time-series analysis system
Abstract
Various systems and methods are provided that display various graphs in an interactive user interface in substantially real-time in response to input from a user in order to determine information related to measured data points and provide the determined information to the user in the interactive user interface. For example, a computing device may be configured to retrieve data from one or more databases and generate one or more interactive user interfaces. The one or more interactive user interfaces may display the retrieved data in one or more graphs, such as time-series or scatterplots. The user interface may be interactive in that a user may manipulate one graph, which causes an identical or nearly identical manipulation of another displayed graph in real-time. The manipulations may occur even if the displayed graphs include data across different time ranges.
| Inventors: | Cervelli; Daniel (Mountain View, CA), Skiff; David (Redwood City, CA), Tobin; David (Atherton, CA), Cai; Allen (Menlo Park, CA) | ||||||||||
|---|---|---|---|---|---|---|---|---|---|---|---|
| Applicant: |
|
||||||||||
| Assignee: | Palantir Technologies Inc.
(Denver, CO) |
||||||||||
| Family ID: | 1000005543684 | ||||||||||
| Appl. No.: | 16/443,626 | ||||||||||
| Filed: | June 17, 2019 |
Prior Publication Data
| Document Identifier | Publication Date | |
|---|---|---|
| US 20190304149 A1 | Oct 3, 2019 | |
Related U.S. Patent Documents
| Application Number | Filing Date | Patent Number | Issue Date | ||
|---|---|---|---|---|---|
| 15354868 | Nov 17, 2016 | 10360702 | |||
| 14871465 | Nov 22, 2016 | 9501851 | |||
| 62059601 | Oct 3, 2014 | ||||
| 62206159 | Aug 17, 2015 | ||||
| Current U.S. Class: | 1/1 |
| Current CPC Class: | G06F 3/04842 (20130101); G06F 16/2477 (20190101); G06F 3/04847 (20130101); G06T 11/206 (20130101); G06F 3/0482 (20130101); G06F 3/04845 (20130101); G06F 2203/04806 (20130101) |
| Current International Class: | G06T 11/20 (20060101); G06F 3/0484 (20130101); G06F 16/2458 (20190101); G06F 3/0482 (20130101) |
References Cited [Referenced By]
U.S. Patent Documents
| 4881179 | November 1989 | Vincent |
| 5109399 | April 1992 | Thompson |
| 5241625 | August 1993 | Epard et al. |
| 5329108 | July 1994 | Lamoure |
| 5632009 | May 1997 | Rao et al. |
| 5670987 | September 1997 | Doi et al. |
| 5729745 | March 1998 | Reina et al. |
| 5781704 | July 1998 | Rossmo |
| 5798769 | August 1998 | Chiu et al. |
| 5845300 | December 1998 | Comer |
| 5898307 | April 1999 | Taraki |
| 5933597 | August 1999 | Hogan |
| 5999911 | December 1999 | Berg et al. |
| 6057757 | May 2000 | Arrowsmith et al. |
| 6065026 | May 2000 | Cornelia et al. |
| 6091956 | July 2000 | Hollenberg |
| 6101479 | August 2000 | Shaw |
| 6161098 | December 2000 | Wallman |
| 6219053 | April 2001 | Tachibana et al. |
| 6232971 | May 2001 | Haynes |
| 6237138 | May 2001 | Hameluck et al. |
| 6243706 | June 2001 | Moreau et al. |
| 6247019 | June 2001 | Davies |
| 6279018 | August 2001 | Kudrolli et al. |
| 6341310 | January 2002 | Leshem et al. |
| 6356285 | March 2002 | Burkwald et al. |
| 6366933 | April 2002 | Ball et al. |
| 6369835 | April 2002 | Lin |
| 6370538 | April 2002 | Lamping et al. |
| 6374251 | April 2002 | Fayyad et al. |
| 6430305 | August 2002 | Decker |
| 6456997 | September 2002 | Shukla |
| 6523019 | February 2003 | Borthwick |
| 6549944 | April 2003 | Weinberg et al. |
| 6560620 | May 2003 | Ching |
| 6581068 | June 2003 | Bensoussan et al. |
| 6594672 | July 2003 | Lampson et al. |
| 6631496 | October 2003 | Li et al. |
| 6642945 | November 2003 | Sharpe |
| 6665683 | December 2003 | Meltzer |
| 6674434 | January 2004 | Chojnacki et al. |
| 6707454 | March 2004 | Barg et al. |
| 6714936 | March 2004 | Nevin, III |
| 6775675 | August 2004 | Nwabueze et al. |
| 6820135 | November 2004 | Dingman |
| 6828920 | December 2004 | Owen et al. |
| 6839745 | January 2005 | Dingari et al. |
| 6850317 | February 2005 | Mullins et al. |
| 6877137 | April 2005 | Rivette et al. |
| 6944777 | September 2005 | Belani et al. |
| 6944821 | September 2005 | Bates et al. |
| 6967589 | November 2005 | Peters |
| 6976210 | December 2005 | Silva et al. |
| 6978419 | December 2005 | Kantrowitz |
| 6980984 | December 2005 | Huffman et al. |
| 6985950 | January 2006 | Hanson et al. |
| 7036085 | April 2006 | Barros |
| 7043702 | May 2006 | Chi et al. |
| 7055110 | May 2006 | Kupka et al. |
| 7086028 | August 2006 | Davis et al. |
| 7139800 | November 2006 | Bellotti et al. |
| 7158878 | January 2007 | Rasmussen et al. |
| 7162475 | January 2007 | Ackerman |
| 7168039 | January 2007 | Bertram |
| 7171427 | January 2007 | Witowski et al. |
| 7174377 | February 2007 | Bernard et al. |
| 7194680 | March 2007 | Roy et al. |
| 7213030 | May 2007 | Jenkins |
| 7249328 | July 2007 | Davis |
| 7269786 | September 2007 | Malloy et al. |
| 7278105 | October 2007 | Kitts |
| 7290698 | November 2007 | Poslinski et al. |
| 7333998 | February 2008 | Heckerman et al. |
| 7370047 | May 2008 | Gorman |
| 7379811 | May 2008 | Rasmussen et al. |
| 7379903 | May 2008 | Caballero et al. |
| 7392254 | June 2008 | Jenkins |
| 7421648 | September 2008 | Davis |
| 7426654 | September 2008 | Adams et al. |
| 7441182 | October 2008 | Beilinson et al. |
| 7441219 | October 2008 | Perry et al. |
| 7454466 | November 2008 | Bellotti et al. |
| 7467375 | December 2008 | Tondreau et al. |
| 7487139 | February 2009 | Fraleigh et al. |
| 7502786 | March 2009 | Liu et al. |
| 7525422 | April 2009 | Bishop et al. |
| 7529727 | May 2009 | Arning et al. |
| 7529734 | May 2009 | Dirisala |
| 7558677 | July 2009 | Jones |
| 7574409 | August 2009 | Patinkin |
| 7574428 | August 2009 | Leiserowitz et al. |
| 7579965 | August 2009 | Bucholz |
| 7596285 | September 2009 | Brown et al. |
| 7614006 | November 2009 | Molander |
| 7617232 | November 2009 | Gabbert et al. |
| 7620628 | November 2009 | Kapur et al. |
| 7627812 | December 2009 | Chamberlain et al. |
| 7634717 | December 2009 | Chamberlain et al. |
| 7703021 | April 2010 | Flam |
| 7706817 | April 2010 | Bamrah et al. |
| 7712049 | May 2010 | Williams et al. |
| 7716077 | May 2010 | Mikurak |
| 7716140 | May 2010 | Nielsen et al. |
| 7725530 | May 2010 | Sah et al. |
| 7725547 | May 2010 | Albertson et al. |
| 7730082 | June 2010 | Sah et al. |
| 7730109 | June 2010 | Rohrs et al. |
| 7765489 | July 2010 | Shah |
| 7770100 | August 2010 | Chamberlain et al. |
| 7805457 | September 2010 | Viola et al. |
| 7809703 | October 2010 | Balabhadrapatruni et al. |
| 7818291 | October 2010 | Ferguson et al. |
| 7818658 | October 2010 | Chen |
| 7870493 | January 2011 | Pall et al. |
| 7877421 | January 2011 | Berger et al. |
| 7880921 | February 2011 | Dattilo et al. |
| 7894984 | February 2011 | Rasmussen et al. |
| 7899611 | March 2011 | Downs et al. |
| 7899796 | March 2011 | Borthwick et al. |
| 7917376 | March 2011 | Bellin et al. |
| 7920963 | April 2011 | Jouline et al. |
| 7933862 | April 2011 | Chamberlain et al. |
| 7941321 | May 2011 | Greenstein et al. |
| 7941336 | May 2011 | Robin-Jan |
| 7958147 | June 2011 | Turner et al. |
| 7962281 | June 2011 | Rasmussen et al. |
| 7962495 | June 2011 | Jain et al. |
| 7962848 | June 2011 | Bertram |
| 7966199 | June 2011 | Frasher |
| 7970240 | June 2011 | Chao et al. |
| 7971150 | June 2011 | Raskutti et al. |
| 7984374 | July 2011 | Caro et al. |
| 8001465 | August 2011 | Kudrolli et al. |
| 8001482 | August 2011 | Bhattiprolu et al. |
| 8010507 | August 2011 | Poston et al. |
| 8010545 | August 2011 | Stefik et al. |
| 8015487 | September 2011 | Roy et al. |
| 8024778 | September 2011 | Cash et al. |
| 8036632 | October 2011 | Cona et al. |
| 8036971 | October 2011 | Aymeloglu et al. |
| 8042110 | October 2011 | Kawahara et al. |
| 8046283 | October 2011 | Burns |
| 8054756 | November 2011 | Chand et al. |
| 8073857 | December 2011 | Sreekanth |
| 8103543 | January 2012 | Zwicky |
| 8134457 | March 2012 | Velipasalar et al. |
| 8145703 | March 2012 | Frishert et al. |
| 8185819 | May 2012 | Sah et al. |
| 8191005 | May 2012 | Baier et al. |
| 8214361 | July 2012 | Sandler et al. |
| 8214764 | July 2012 | Gemmell et al. |
| 8225201 | July 2012 | Michael |
| 8229902 | July 2012 | Vishniac et al. |
| 8229947 | July 2012 | Fujinaga |
| 8230333 | July 2012 | Decherd et al. |
| 8271461 | September 2012 | Pike et al. |
| 8271892 | September 2012 | Duncker et al. |
| 8280880 | October 2012 | Aymeloglu et al. |
| 8290838 | October 2012 | Thakur et al. |
| 8290926 | October 2012 | Ozzie et al. |
| 8290942 | October 2012 | Jones et al. |
| 8291490 | October 2012 | Ahmed et al. |
| 8301464 | October 2012 | Cave et al. |
| 8301904 | October 2012 | Gryaznov |
| 8302855 | November 2012 | Ma et al. |
| 8312367 | November 2012 | Foster |
| 8312546 | November 2012 | Alme |
| 8352881 | January 2013 | Champion et al. |
| 8365079 | January 2013 | Kenna et al. |
| 8368695 | February 2013 | Howell et al. |
| 8368699 | February 2013 | Alsbury et al. |
| 8386377 | February 2013 | Xiong et al. |
| 8392556 | March 2013 | Goulet et al. |
| 8397171 | March 2013 | Klassen et al. |
| 8412707 | April 2013 | Mianji |
| 8447722 | May 2013 | Ahuja et al. |
| 8452790 | May 2013 | Mianji |
| 8463036 | June 2013 | Ramesh et al. |
| 8473454 | June 2013 | Evanitsky et al. |
| 8484115 | July 2013 | Aymeloglu et al. |
| 8489331 | July 2013 | Kopf et al. |
| 8489641 | July 2013 | Seefeld et al. |
| 8498984 | July 2013 | Hwang et al. |
| 8510743 | August 2013 | Hackborn et al. |
| 8514082 | August 2013 | Cova et al. |
| 8515207 | August 2013 | Chau |
| 8527949 | September 2013 | Pleis et al. |
| 8528061 | September 2013 | Davis |
| 8554579 | October 2013 | Tribble et al. |
| 8554653 | October 2013 | Falkenborg et al. |
| 8554709 | October 2013 | Goodson et al. |
| 8560413 | October 2013 | Quarterman |
| 8577911 | November 2013 | Stepinski et al. |
| 8589273 | November 2013 | Creeden et al. |
| 8595234 | November 2013 | Siripuapu et al. |
| 8620641 | December 2013 | Farnsworth et al. |
| 8639757 | January 2014 | Zang et al. |
| 8646080 | February 2014 | Williamson et al. |
| 8676857 | March 2014 | Adams et al. |
| 8682696 | March 2014 | Shanmugam |
| 8688573 | April 2014 | Ruknoic et al. |
| 8689108 | April 2014 | Duffield et al. |
| 8713467 | April 2014 | Goldenberg et al. |
| 8726379 | May 2014 | Stiansen et al. |
| 8732574 | May 2014 | Burr et al. |
| 8739278 | May 2014 | Varghese |
| 8742934 | June 2014 | Sarpy et al. |
| 8744890 | June 2014 | Bernier |
| 8745516 | June 2014 | Mason et al. |
| 8781169 | July 2014 | Jackson et al. |
| 8787939 | July 2014 | Papakipos et al. |
| 8788407 | July 2014 | Singh et al. |
| 8798354 | August 2014 | Bunzel et al. |
| 8799313 | August 2014 | Satlow |
| 8799799 | August 2014 | Cervelli et al. |
| 8807948 | August 2014 | Luo et al. |
| 8812960 | August 2014 | Sun et al. |
| 8830322 | September 2014 | Nerayoff et al. |
| 8832594 | September 2014 | Thompson et al. |
| 8868537 | October 2014 | Colgrove et al. |
| 8917274 | December 2014 | Ma et al. |
| 8924388 | December 2014 | Elliot et al. |
| 8924389 | December 2014 | Elliot et al. |
| 8924872 | December 2014 | Bogomolov et al. |
| 8930874 | January 2015 | Duff et al. |
| 8937619 | January 2015 | Sharma et al. |
| 8938686 | January 2015 | Erenrich et al. |
| 8949164 | February 2015 | Mohler |
| 8984390 | March 2015 | Aymeloglu et al. |
| 9009171 | April 2015 | Grossman et al. |
| 9009827 | April 2015 | Albertson et al. |
| 9021260 | April 2015 | Falk et al. |
| 9021384 | April 2015 | Beard et al. |
| 9043696 | May 2015 | Meiklejohn et al. |
| 9043894 | May 2015 | Dennison et al. |
| 9058315 | June 2015 | Burr et al. |
| 9069842 | June 2015 | Melby |
| 9100428 | August 2015 | Visbal |
| 9116975 | August 2015 | Shankar et al. |
| 9165100 | October 2015 | Begur et al. |
| 9268615 | February 2016 | Calsyn et al. |
| 9286373 | March 2016 | Elliot et al. |
| 9348880 | May 2016 | Kramer et al. |
| 9501851 | November 2016 | Cervelli et al. |
| 9501852 | November 2016 | Jiang |
| 9594477 | March 2017 | Ardakani et al. |
| 9767172 | September 2017 | Fackler et al. |
| 10360702 | July 2019 | Cervelli |
| 10664490 | May 2020 | Fackler et al. |
| 2001/0021936 | September 2001 | Bertram |
| 2001/0054176 | December 2001 | Vin et al. |
| 2002/0032677 | March 2002 | Morgenthaler et al. |
| 2002/0033848 | March 2002 | Sciammarella et al. |
| 2002/0065708 | May 2002 | Senay et al. |
| 2002/0070965 | June 2002 | Austin |
| 2002/0091707 | July 2002 | Keller |
| 2002/0095360 | July 2002 | Joao |
| 2002/0095658 | July 2002 | Shulman |
| 2002/0103705 | August 2002 | Brady |
| 2002/0116120 | August 2002 | Ruiz et al. |
| 2002/0130907 | September 2002 | Chi et al. |
| 2002/0147805 | October 2002 | Leshem et al. |
| 2002/0154175 | October 2002 | Abello et al. |
| 2002/0174201 | November 2002 | Ramer et al. |
| 2002/0194119 | December 2002 | Wright et al. |
| 2002/0196229 | December 2002 | Chen et al. |
| 2003/0028560 | February 2003 | Kudrolli et al. |
| 2003/0036848 | February 2003 | Sheha et al. |
| 2003/0036927 | February 2003 | Bowen |
| 2003/0039948 | February 2003 | Donahue |
| 2003/0061132 | March 2003 | Mason et al. |
| 2003/0093755 | May 2003 | O'Carroll |
| 2003/0126102 | July 2003 | Borthwick |
| 2003/0140106 | July 2003 | Raguseo |
| 2003/0144868 | July 2003 | MacIntyre et al. |
| 2003/0163352 | August 2003 | Surpin et al. |
| 2003/0200217 | October 2003 | Ackerman |
| 2003/0225755 | December 2003 | Iwayama et al. |
| 2003/0227461 | December 2003 | Hux et al. |
| 2003/0229848 | December 2003 | Arend et al. |
| 2004/0032432 | February 2004 | Baynger |
| 2004/0034570 | February 2004 | Davis |
| 2004/0044648 | March 2004 | Anfindsen et al. |
| 2004/0064256 | April 2004 | Barinek et al. |
| 2004/0078451 | April 2004 | Dietz et al. |
| 2004/0085318 | May 2004 | Hassler et al. |
| 2004/0095349 | May 2004 | Bito et al. |
| 2004/0111410 | June 2004 | Burgoon et al. |
| 2004/0126840 | July 2004 | Cheng et al. |
| 2004/0143602 | July 2004 | Ruiz et al. |
| 2004/0143796 | July 2004 | Lerner et al. |
| 2004/0153418 | August 2004 | Hanweck |
| 2004/0163039 | August 2004 | Gorman |
| 2004/0181554 | September 2004 | Heckerman et al. |
| 2004/0193600 | September 2004 | Kaasten et al. |
| 2004/0205492 | October 2004 | Newsome |
| 2004/0221223 | November 2004 | Yu et al. |
| 2004/0236688 | November 2004 | Bozeman |
| 2004/0236711 | November 2004 | Nixon et al. |
| 2004/0260702 | December 2004 | Cragun et al. |
| 2004/0267746 | December 2004 | Marcjan et al. |
| 2005/0010472 | January 2005 | Quatse et al. |
| 2005/0027705 | February 2005 | Sadri et al. |
| 2005/0028094 | February 2005 | Allyn |
| 2005/0039116 | February 2005 | Slack-Smith |
| 2005/0039119 | February 2005 | Parks et al. |
| 2005/0065811 | March 2005 | Chu et al. |
| 2005/0078858 | April 2005 | Yao et al. |
| 2005/0080769 | April 2005 | Gemmell |
| 2005/0086207 | April 2005 | Heuer et al. |
| 2005/0091186 | April 2005 | Elish |
| 2005/0125715 | June 2005 | Di Franco et al. |
| 2005/0154628 | July 2005 | Eckart et al. |
| 2005/0154769 | July 2005 | Eckart et al. |
| 2005/0162523 | July 2005 | Darrell et al. |
| 2005/0166144 | July 2005 | Gross |
| 2005/0180330 | August 2005 | Shapiro |
| 2005/0182793 | August 2005 | Keenan et al. |
| 2005/0183005 | August 2005 | Denoue et al. |
| 2005/0193324 | September 2005 | Purple |
| 2005/0198332 | September 2005 | Laertz et al. |
| 2005/0210409 | September 2005 | Jou |
| 2005/0246327 | November 2005 | Yeung et al. |
| 2005/0251786 | November 2005 | Citron et al. |
| 2006/0026120 | February 2006 | Carolan et al. |
| 2006/0026170 | February 2006 | Kreitler et al. |
| 2006/0026561 | February 2006 | Bauman et al. |
| 2006/0031779 | February 2006 | Theurer et al. |
| 2006/0045470 | March 2006 | Poslinski et al. |
| 2006/0053097 | March 2006 | King et al. |
| 2006/0053170 | March 2006 | Hill et al. |
| 2006/0053194 | March 2006 | Schneider et al. |
| 2006/0059139 | March 2006 | Robinson |
| 2006/0059423 | March 2006 | Lehmann et al. |
| 2006/0074866 | April 2006 | Chamberlain et al. |
| 2006/0074881 | April 2006 | Vembu et al. |
| 2006/0080139 | April 2006 | Mainzer |
| 2006/0080283 | April 2006 | Shipman |
| 2006/0080619 | April 2006 | Carlson et al. |
| 2006/0093222 | May 2006 | Saffer et al. |
| 2006/0129746 | June 2006 | Porter |
| 2006/0136513 | June 2006 | Ngo et al. |
| 2006/0139375 | June 2006 | Rasmussen et al. |
| 2006/0142949 | June 2006 | Helt |
| 2006/0143034 | June 2006 | Rothermel |
| 2006/0143075 | June 2006 | Carr et al. |
| 2006/0143079 | June 2006 | Basak et al. |
| 2006/0149596 | July 2006 | Surpin et al. |
| 2006/0155654 | July 2006 | Plessis et al. |
| 2006/0178915 | August 2006 | Chao |
| 2006/0203337 | September 2006 | White |
| 2006/0218637 | September 2006 | Thomas et al. |
| 2006/0241974 | October 2006 | Chao et al. |
| 2006/0242040 | October 2006 | Rader |
| 2006/0242630 | October 2006 | Koike et al. |
| 2006/0265417 | November 2006 | Amato et al. |
| 2006/0271277 | November 2006 | Hu et al. |
| 2006/0277460 | December 2006 | Forstall et al. |
| 2006/0279630 | December 2006 | Aggarwal et al. |
| 2006/0294066 | December 2006 | Dettinger et al. |
| 2007/0000999 | January 2007 | Kubo et al. |
| 2007/0011150 | January 2007 | Frank |
| 2007/0011304 | January 2007 | Error |
| 2007/0016363 | January 2007 | Huang et al. |
| 2007/0018986 | January 2007 | Hauser |
| 2007/0038646 | February 2007 | Thota |
| 2007/0038962 | February 2007 | Fuchs et al. |
| 2007/0043686 | February 2007 | Teng et al. |
| 2007/0057966 | March 2007 | Ohno et al. |
| 2007/0061752 | March 2007 | Cory |
| 2007/0078832 | April 2007 | Ott et al. |
| 2007/0083541 | April 2007 | Fraleigh et al. |
| 2007/0088596 | April 2007 | Berkelhamer et al. |
| 2007/0094389 | April 2007 | Nussey et al. |
| 2007/0113164 | May 2007 | Hansen et al. |
| 2007/0124693 | May 2007 | Dominowska et al. |
| 2007/0136095 | June 2007 | Weinstein |
| 2007/0150369 | June 2007 | Zivin |
| 2007/0156673 | July 2007 | Maga |
| 2007/0162454 | July 2007 | D'Albora et al. |
| 2007/0168871 | July 2007 | Jenkins |
| 2007/0174760 | July 2007 | Chamberlain et al. |
| 2007/0185850 | August 2007 | Walters et al. |
| 2007/0185867 | August 2007 | Maga |
| 2007/0192122 | August 2007 | Routson et al. |
| 2007/0192265 | August 2007 | Chopin et al. |
| 2007/0198571 | August 2007 | Ferguson et al. |
| 2007/0208497 | September 2007 | Downs et al. |
| 2007/0208498 | September 2007 | Barker et al. |
| 2007/0208736 | September 2007 | Tanigawa et al. |
| 2007/0233709 | October 2007 | Abnous |
| 2007/0240062 | October 2007 | Christena et al. |
| 2007/0245339 | October 2007 | Bauman et al. |
| 2007/0266336 | November 2007 | Nojima et al. |
| 2007/0284433 | December 2007 | Domenica et al. |
| 2007/0294643 | December 2007 | Kyle |
| 2007/0299697 | December 2007 | Friedlander et al. |
| 2008/0016155 | January 2008 | Khalatian |
| 2008/0016216 | January 2008 | Worley et al. |
| 2008/0040275 | February 2008 | Paulsen et al. |
| 2008/0040684 | February 2008 | Crump |
| 2008/0051989 | February 2008 | Welsh |
| 2008/0052142 | February 2008 | Bailey et al. |
| 2008/0077597 | March 2008 | Butler |
| 2008/0077642 | March 2008 | Carbone et al. |
| 2008/0082486 | April 2008 | Lermant et al. |
| 2008/0091693 | April 2008 | Murthy |
| 2008/0104019 | May 2008 | Nath |
| 2008/0109714 | May 2008 | Kumar et al. |
| 2008/0126951 | May 2008 | Sood et al. |
| 2008/0148398 | June 2008 | Mezack et al. |
| 2008/0155440 | June 2008 | Trevor et al. |
| 2008/0162616 | July 2008 | Gross et al. |
| 2008/0172607 | July 2008 | Baer |
| 2008/0177782 | July 2008 | Poston et al. |
| 2008/0186904 | August 2008 | Koyama et al. |
| 2008/0195417 | August 2008 | Surpin et al. |
| 2008/0195608 | August 2008 | Clover |
| 2008/0208735 | August 2008 | Balet et al. |
| 2008/0222295 | September 2008 | Robinson et al. |
| 2008/0249820 | October 2008 | Pathria |
| 2008/0249983 | October 2008 | Meisels et al. |
| 2008/0255973 | October 2008 | El Wade et al. |
| 2008/0263468 | October 2008 | Cappione et al. |
| 2008/0267107 | October 2008 | Rosenberg |
| 2008/0270328 | October 2008 | Lafferty et al. |
| 2008/0276167 | November 2008 | Michael |
| 2008/0278311 | November 2008 | Grange et al. |
| 2008/0281819 | November 2008 | Tenenbaum et al. |
| 2008/0288306 | November 2008 | MacIntyre et al. |
| 2008/0288475 | November 2008 | Kim et al. |
| 2008/0301042 | December 2008 | Patzer |
| 2008/0301559 | December 2008 | Martinsen et al. |
| 2008/0301643 | December 2008 | Appleton et al. |
| 2008/0313132 | December 2008 | Hao et al. |
| 2008/0313243 | December 2008 | Poston et al. |
| 2008/0313281 | December 2008 | Scheidl et al. |
| 2009/0002492 | January 2009 | Velipasalar et al. |
| 2009/0024962 | January 2009 | Gotz |
| 2009/0027418 | January 2009 | Maru et al. |
| 2009/0030915 | January 2009 | Winter et al. |
| 2009/0031401 | January 2009 | Cudich et al. |
| 2009/0037912 | February 2009 | Stoitsev et al. |
| 2009/0043801 | February 2009 | LeClair |
| 2009/0055251 | February 2009 | Shah et al. |
| 2009/0070162 | March 2009 | Leonelli et al. |
| 2009/0076845 | March 2009 | Bellin et al. |
| 2009/0088964 | April 2009 | Schaaf et al. |
| 2009/0089651 | April 2009 | Herberger et al. |
| 2009/0094270 | April 2009 | Alirez et al. |
| 2009/0106178 | April 2009 | Chu |
| 2009/0112678 | April 2009 | Luzardo |
| 2009/0112745 | April 2009 | Stefanescu |
| 2009/0119309 | May 2009 | Gibson et al. |
| 2009/0125359 | May 2009 | Knapic |
| 2009/0125369 | May 2009 | Kloosstra et al. |
| 2009/0125459 | May 2009 | Norton et al. |
| 2009/0132921 | May 2009 | Hwangbo et al. |
| 2009/0132953 | May 2009 | Reed et al. |
| 2009/0143052 | June 2009 | Bates et al. |
| 2009/0144262 | June 2009 | White et al. |
| 2009/0144274 | June 2009 | Fraleigh et al. |
| 2009/0150868 | June 2009 | Chakra et al. |
| 2009/0157732 | June 2009 | Hao et al. |
| 2009/0164934 | June 2009 | Bhattiprolu et al. |
| 2009/0171939 | July 2009 | Athsani et al. |
| 2009/0172511 | July 2009 | Decherd et al. |
| 2009/0172821 | July 2009 | Daira et al. |
| 2009/0177962 | July 2009 | Gusmorino et al. |
| 2009/0179892 | July 2009 | Tsuda et al. |
| 2009/0187464 | July 2009 | Bai et al. |
| 2009/0187546 | July 2009 | Whyte et al. |
| 2009/0187548 | July 2009 | Ji et al. |
| 2009/0199106 | August 2009 | Jonsson et al. |
| 2009/0216562 | August 2009 | Faulkner et al. |
| 2009/0222400 | September 2009 | Kupershmidt et al. |
| 2009/0222759 | September 2009 | Drieschner |
| 2009/0222760 | September 2009 | Halverson et al. |
| 2009/0228365 | September 2009 | Tomchek et al. |
| 2009/0234720 | September 2009 | George et al. |
| 2009/0248757 | October 2009 | Havewala et al. |
| 2009/0249178 | October 2009 | Ambrosino et al. |
| 2009/0249244 | October 2009 | Robinson et al. |
| 2009/0254970 | October 2009 | Agarwal et al. |
| 2009/0271343 | October 2009 | Vaiciulis et al. |
| 2009/0281839 | November 2009 | Lynn et al. |
| 2009/0282068 | November 2009 | Shockro et al. |
| 2009/0287470 | November 2009 | Farnsworth et al. |
| 2009/0292626 | November 2009 | Oxford |
| 2009/0300589 | December 2009 | Watters et al. |
| 2009/0307049 | December 2009 | Elliott et al. |
| 2009/0313463 | December 2009 | Pang et al. |
| 2009/0318775 | December 2009 | Michelson et al. |
| 2009/0319418 | December 2009 | Herz |
| 2009/0319891 | December 2009 | MacKinlay |
| 2010/0004857 | January 2010 | Pereira et al. |
| 2010/0011282 | January 2010 | Dollard et al. |
| 2010/0042922 | February 2010 | Bradateanu et al. |
| 2010/0057622 | March 2010 | Faith et al. |
| 2010/0057716 | March 2010 | Stefik et al. |
| 2010/0070523 | March 2010 | Delgo et al. |
| 2010/0070842 | March 2010 | Aymeloglu et al. |
| 2010/0070844 | March 2010 | Aymeloglu et al. |
| 2010/0070845 | March 2010 | Facemire et al. |
| 2010/0070897 | March 2010 | Aymeloglu et al. |
| 2010/0076813 | March 2010 | Ghosh et al. |
| 2010/0098318 | April 2010 | Anderson |
| 2010/0100963 | April 2010 | Mahaffey |
| 2010/0103124 | April 2010 | Kruzeniski et al. |
| 2010/0106752 | April 2010 | Eckardt et al. |
| 2010/0114887 | May 2010 | Conway et al. |
| 2010/0122152 | May 2010 | Chamberlain et al. |
| 2010/0131457 | May 2010 | Heimendinger |
| 2010/0131502 | May 2010 | Fordham |
| 2010/0161735 | June 2010 | Sharma |
| 2010/0162176 | June 2010 | Dunton |
| 2010/0191563 | July 2010 | Schlaifer et al. |
| 2010/0198684 | August 2010 | Eraker et al. |
| 2010/0199225 | August 2010 | Coleman et al. |
| 2010/0223260 | September 2010 | Wu |
| 2010/0228812 | September 2010 | Uomini |
| 2010/0238174 | September 2010 | Haub |
| 2010/0250412 | September 2010 | Wagner |
| 2010/0262688 | October 2010 | Hussain et al. |
| 2010/0262901 | October 2010 | DiSalvo |
| 2010/0274674 | October 2010 | Roberts et al. |
| 2010/0280851 | November 2010 | Merkin |
| 2010/0280857 | November 2010 | Liu et al. |
| 2010/0293174 | November 2010 | Bennett et al. |
| 2010/0306713 | December 2010 | Geisner et al. |
| 2010/0306722 | December 2010 | LeHoty et al. |
| 2010/0313119 | December 2010 | Baldwin et al. |
| 2010/0313157 | December 2010 | Carlsson et al. |
| 2010/0313239 | December 2010 | Chakra et al. |
| 2010/0318924 | December 2010 | Frankel et al. |
| 2010/0321399 | December 2010 | Ellren et al. |
| 2010/0325526 | December 2010 | Ellis et al. |
| 2010/0325581 | December 2010 | Finkelstein et al. |
| 2010/0330801 | December 2010 | Rouh |
| 2011/0004498 | January 2011 | Readshaw |
| 2011/0004626 | January 2011 | Naeymi-Rad et al. |
| 2011/0029526 | February 2011 | Knight et al. |
| 2011/0047159 | February 2011 | Baid et al. |
| 2011/0047540 | February 2011 | Williams et al. |
| 2011/0060753 | March 2011 | Shaked |
| 2011/0061013 | March 2011 | Bilicki et al. |
| 2011/0066741 | March 2011 | Hoefner et al. |
| 2011/0066933 | March 2011 | Ludwig |
| 2011/0074788 | March 2011 | Regan et al. |
| 2011/0074811 | March 2011 | Hanson et al. |
| 2011/0078055 | March 2011 | Faribault et al. |
| 2011/0078173 | March 2011 | Seligmann et al. |
| 2011/0093327 | April 2011 | Fordyce, III et al. |
| 2011/0099133 | April 2011 | Chang et al. |
| 2011/0107196 | May 2011 | Foster |
| 2011/0107241 | May 2011 | Moore |
| 2011/0117878 | May 2011 | Barash et al. |
| 2011/0119100 | May 2011 | Ruhl et al. |
| 2011/0137766 | June 2011 | Rasmussen et al. |
| 2011/0153384 | June 2011 | Horne et al. |
| 2011/0161096 | June 2011 | Buehler et al. |
| 2011/0161409 | June 2011 | Nair |
| 2011/0167105 | July 2011 | Ramakrishnan et al. |
| 2011/0170799 | July 2011 | Carrino et al. |
| 2011/0173032 | July 2011 | Payne et al. |
| 2011/0173093 | July 2011 | Psota et al. |
| 2011/0179048 | July 2011 | Satlow |
| 2011/0185316 | July 2011 | Reid et al. |
| 2011/0208565 | August 2011 | Ross et al. |
| 2011/0208724 | August 2011 | Jones et al. |
| 2011/0213655 | September 2011 | Henkin |
| 2011/0218934 | September 2011 | Elser |
| 2011/0218955 | September 2011 | Tang |
| 2011/0219450 | September 2011 | McDougal et al. |
| 2011/0225198 | September 2011 | Edwards et al. |
| 2011/0225482 | September 2011 | Chan et al. |
| 2011/0225525 | September 2011 | Chasman et al. |
| 2011/0225586 | September 2011 | Bentley et al. |
| 2011/0225650 | September 2011 | Margolies et al. |
| 2011/0238495 | September 2011 | Kang |
| 2011/0238553 | September 2011 | Raj et al. |
| 2011/0251951 | October 2011 | Kolkowtiz |
| 2011/0258158 | October 2011 | Resende et al. |
| 2011/0270604 | November 2011 | Qi et al. |
| 2011/0270705 | November 2011 | Parker |
| 2011/0289397 | November 2011 | Eastmond et al. |
| 2011/0289407 | November 2011 | Naik et al. |
| 2011/0289420 | November 2011 | Morioka et al. |
| 2011/0291851 | December 2011 | Whisenant |
| 2011/0295649 | December 2011 | Fine |
| 2011/0296289 | December 2011 | Tokashiki |
| 2011/0310005 | December 2011 | Chen et al. |
| 2011/0314007 | December 2011 | Dassa et al. |
| 2012/0004894 | January 2012 | Butler |
| 2012/0004904 | January 2012 | Shin et al. |
| 2012/0011238 | January 2012 | Rathod |
| 2012/0019559 | January 2012 | Siler et al. |
| 2012/0022945 | January 2012 | Falkenborg et al. |
| 2012/0036013 | February 2012 | Neuhaus et al. |
| 2012/0036434 | February 2012 | Oberstein |
| 2012/0050293 | March 2012 | Carlhian et al. |
| 2012/0054284 | March 2012 | Rakshit |
| 2012/0059853 | March 2012 | Jagota |
| 2012/0065987 | March 2012 | Farooq et al. |
| 2012/0066166 | March 2012 | Curbera et al. |
| 2012/0066296 | March 2012 | Appleton et al. |
| 2012/0072825 | March 2012 | Sherkin et al. |
| 2012/0079363 | March 2012 | Folting et al. |
| 2012/0084117 | April 2012 | Tavares et al. |
| 2012/0084118 | April 2012 | Bai et al. |
| 2012/0084184 | April 2012 | Raleigh |
| 2012/0106801 | May 2012 | Jackson |
| 2012/0117082 | May 2012 | Koperda et al. |
| 2012/0123989 | May 2012 | Yu et al. |
| 2012/0131512 | May 2012 | Takeuchi et al. |
| 2012/0137235 | May 2012 | Ts et al. |
| 2012/0144335 | June 2012 | Abeln et al. |
| 2012/0159307 | June 2012 | Chung et al. |
| 2012/0159362 | June 2012 | Brown et al. |
| 2012/0159399 | June 2012 | Bastide et al. |
| 2012/0170847 | July 2012 | Tsukidate |
| 2012/0173381 | July 2012 | Smith |
| 2012/0173985 | July 2012 | Peppel |
| 2012/0180002 | July 2012 | Campbell et al. |
| 2012/0188252 | July 2012 | Law |
| 2012/0196557 | August 2012 | Reich et al. |
| 2012/0196558 | August 2012 | Reich et al. |
| 2012/0197651 | August 2012 | Robinson et al. |
| 2012/0197657 | August 2012 | Prodanovic |
| 2012/0197660 | August 2012 | Prodanovic |
| 2012/0203708 | August 2012 | Psota et al. |
| 2012/0208636 | August 2012 | Feige |
| 2012/0215784 | August 2012 | King et al. |
| 2012/0221511 | August 2012 | Gibson et al. |
| 2012/0221553 | August 2012 | Wittmer et al. |
| 2012/0221580 | August 2012 | Barney |
| 2012/0226590 | September 2012 | Love et al. |
| 2012/0245976 | September 2012 | Kumar et al. |
| 2012/0246148 | September 2012 | Dror |
| 2012/0254129 | October 2012 | Wheeler et al. |
| 2012/0266245 | October 2012 | McDougal et al. |
| 2012/0284345 | November 2012 | Costenaro et al. |
| 2012/0284670 | November 2012 | Kashik et al. |
| 2012/0290879 | November 2012 | Shibuya et al. |
| 2012/0296907 | November 2012 | Long et al. |
| 2012/0304244 | November 2012 | Xie et al. |
| 2012/0311684 | December 2012 | Paulsen et al. |
| 2012/0323829 | December 2012 | Stokes et al. |
| 2012/0323888 | December 2012 | Osann, Jr. |
| 2012/0330801 | December 2012 | McDougal et al. |
| 2012/0330973 | December 2012 | Ghuneim et al. |
| 2013/0006426 | January 2013 | Healey et al. |
| 2013/0006725 | January 2013 | Simanek et al. |
| 2013/0006916 | January 2013 | McBride et al. |
| 2013/0016106 | January 2013 | Yip et al. |
| 2013/0018796 | January 2013 | Kolhatkar et al. |
| 2013/0024268 | January 2013 | Manickavelu |
| 2013/0046635 | February 2013 | Grigg et al. |
| 2013/0046842 | February 2013 | Muntz et al. |
| 2013/0054306 | February 2013 | Bhalla |
| 2013/0055264 | February 2013 | Burr et al. |
| 2013/0057551 | March 2013 | Ebert et al. |
| 2013/0060786 | March 2013 | Serrano et al. |
| 2013/0061169 | March 2013 | Pearcy et al. |
| 2013/0073377 | March 2013 | Heath |
| 2013/0073454 | March 2013 | Busch |
| 2013/0078943 | March 2013 | Biage et al. |
| 2013/0086482 | April 2013 | Parsons |
| 2013/0086521 | April 2013 | Grossele et al. |
| 2013/0096988 | April 2013 | Grossman et al. |
| 2013/0097482 | April 2013 | Marantz et al. |
| 2013/0101159 | April 2013 | Chao et al. |
| 2013/0110746 | May 2013 | Ahn |
| 2013/0110822 | May 2013 | Ikeda et al. |
| 2013/0110877 | May 2013 | Bonham et al. |
| 2013/0111320 | May 2013 | Campbell et al. |
| 2013/0117651 | May 2013 | Waldman et al. |
| 2013/0124567 | May 2013 | Balinsky et al. |
| 2013/0150004 | June 2013 | Rosen |
| 2013/0151148 | June 2013 | Parundekar et al. |
| 2013/0151305 | June 2013 | Akinola et al. |
| 2013/0151388 | June 2013 | Falkenborg et al. |
| 2013/0151453 | June 2013 | Bhanot et al. |
| 2013/0157234 | June 2013 | Gulli et al. |
| 2013/0166348 | June 2013 | Scotto |
| 2013/0166480 | June 2013 | Popescu et al. |
| 2013/0166550 | June 2013 | Buchmann et al. |
| 2013/0176321 | July 2013 | Mitchell et al. |
| 2013/0179420 | July 2013 | Park et al. |
| 2013/0185245 | July 2013 | Anderson |
| 2013/0185307 | July 2013 | El-Yaniv et al. |
| 2013/0197925 | August 2013 | Blue |
| 2013/0224696 | August 2013 | Wolfe et al. |
| 2013/0225212 | August 2013 | Khan |
| 2013/0226318 | August 2013 | Procyk |
| 2013/0226953 | August 2013 | Markovich et al. |
| 2013/0232045 | September 2013 | Tai et al. |
| 2013/0232128 | September 2013 | Krishnan et al. |
| 2013/0238616 | September 2013 | Rose et al. |
| 2013/0246170 | September 2013 | Gross et al. |
| 2013/0246537 | September 2013 | Gaddala |
| 2013/0251233 | September 2013 | Yang et al. |
| 2013/0262527 | October 2013 | Hunter et al. |
| 2013/0262528 | October 2013 | Foit |
| 2013/0263019 | October 2013 | Castellanos et al. |
| 2013/0267207 | October 2013 | Hao et al. |
| 2013/0268520 | October 2013 | Fisher et al. |
| 2013/0279757 | October 2013 | Kephart |
| 2013/0282696 | October 2013 | John et al. |
| 2013/0288719 | October 2013 | Alonzo |
| 2013/0290011 | October 2013 | Lynn et al. |
| 2013/0290825 | October 2013 | Arndt et al. |
| 2013/0297619 | November 2013 | Chandrasekaran et al. |
| 2013/0304770 | November 2013 | Boero et al. |
| 2013/0311375 | November 2013 | Priebatsch |
| 2013/0325826 | December 2013 | Agarwal et al. |
| 2013/0347078 | December 2013 | Agarwal et al. |
| 2014/0012796 | January 2014 | Petersen et al. |
| 2014/0019936 | January 2014 | Cohanoff |
| 2014/0032506 | January 2014 | Hoey et al. |
| 2014/0033010 | January 2014 | Richardt et al. |
| 2014/0040371 | February 2014 | Gurevich et al. |
| 2014/0047319 | February 2014 | Eberlein |
| 2014/0047357 | February 2014 | Alfaro et al. |
| 2014/0058763 | February 2014 | Zizzamia et al. |
| 2014/0059038 | February 2014 | McPherson et al. |
| 2014/0067611 | March 2014 | Adachi et al. |
| 2014/0068487 | March 2014 | Steiger et al. |
| 2014/0074855 | March 2014 | Zhao et al. |
| 2014/0075004 | March 2014 | Van Dusen et al. |
| 2014/0075301 | March 2014 | Mihara |
| 2014/0081685 | March 2014 | Thacker et al. |
| 2014/0089339 | March 2014 | Siddiqui et al. |
| 2014/0089395 | March 2014 | Atsatt et al. |
| 2014/0095273 | April 2014 | Tang et al. |
| 2014/0095363 | April 2014 | Caldwell |
| 2014/0095509 | April 2014 | Patton |
| 2014/0108068 | April 2014 | Williams |
| 2014/0108380 | April 2014 | Gotz et al. |
| 2014/0108985 | April 2014 | Scott et al. |
| 2014/0123279 | May 2014 | Bishop et al. |
| 2014/0129261 | May 2014 | Bothwell et al. |
| 2014/0129936 | May 2014 | Richards et al. |
| 2014/0136285 | May 2014 | Carvalho |
| 2014/0143009 | May 2014 | Brice et al. |
| 2014/0149436 | May 2014 | Bahrami et al. |
| 2014/0156484 | June 2014 | Chan et al. |
| 2014/0156527 | June 2014 | Grigg et al. |
| 2014/0157172 | June 2014 | Peery et al. |
| 2014/0164502 | June 2014 | Khodorenko et al. |
| 2014/0189536 | July 2014 | Lange et al. |
| 2014/0195515 | July 2014 | Baker et al. |
| 2014/0195887 | July 2014 | Ellis et al. |
| 2014/0208281 | July 2014 | Ming |
| 2014/0214579 | July 2014 | Shen et al. |
| 2014/0222521 | August 2014 | Chait |
| 2014/0222793 | August 2014 | Sadkin et al. |
| 2014/0244284 | August 2014 | Smith |
| 2014/0244388 | August 2014 | Manouchehri et al. |
| 2014/0258246 | September 2014 | Lo Faro et al. |
| 2014/0267294 | September 2014 | Ma |
| 2014/0267295 | September 2014 | Sharma |
| 2014/0279824 | September 2014 | Tamayo |
| 2014/0310266 | October 2014 | Greenfield |
| 2014/0316911 | October 2014 | Gross |
| 2014/0333651 | November 2014 | Cervelli et al. |
| 2014/0337772 | November 2014 | Cervelli et al. |
| 2014/0344230 | November 2014 | Krause et al. |
| 2014/0344656 | November 2014 | Groom |
| 2014/0351070 | November 2014 | Christner et al. |
| 2014/0358829 | December 2014 | Hurwitz |
| 2014/0366132 | December 2014 | Stiansen et al. |
| 2014/0372861 | December 2014 | Lawless et al. |
| 2015/0019394 | January 2015 | Unser et al. |
| 2015/0026622 | January 2015 | Roaldson et al. |
| 2015/0046870 | February 2015 | Goldenberg et al. |
| 2015/0073929 | March 2015 | Psota et al. |
| 2015/0073954 | March 2015 | Braff |
| 2015/0089353 | March 2015 | Folkening |
| 2015/0089424 | March 2015 | Duffield et al. |
| 2015/0100897 | April 2015 | Sun et al. |
| 2015/0100907 | April 2015 | Erenrich et al. |
| 2015/0106379 | April 2015 | Elliot et al. |
| 2015/0134666 | May 2015 | Gattiker et al. |
| 2015/0169709 | June 2015 | Kara et al. |
| 2015/0169726 | June 2015 | Kara et al. |
| 2015/0170077 | June 2015 | Kara et al. |
| 2015/0178825 | June 2015 | Huerta |
| 2015/0178877 | June 2015 | Bogomolov et al. |
| 2015/0186483 | July 2015 | Tappan et al. |
| 2015/0186821 | July 2015 | Wang et al. |
| 2015/0187036 | July 2015 | Wang et al. |
| 2015/0188872 | July 2015 | White |
| 2015/0212663 | July 2015 | Papale et al. |
| 2015/0227295 | August 2015 | Meiklejohn et al. |
| 2015/0237085 | August 2015 | Duncker et al. |
| 2015/0242401 | August 2015 | Liu |
| 2015/0254220 | September 2015 | Burr et al. |
| 2015/0261727 | September 2015 | Davis |
| 2015/0309719 | October 2015 | Ma et al. |
| 2015/0317342 | November 2015 | Grossman et al. |
| 2015/0324868 | November 2015 | Kaftan et al. |
| 2016/0062555 | March 2016 | Ward et al. |
| 2016/0098176 | April 2016 | Cervelli et al. |
| 2016/0105459 | April 2016 | Esary et al. |
| 2016/0110369 | April 2016 | Cervelli et al. |
| 2016/0162519 | June 2016 | Stowe et al. |
| 2016/0306806 | October 2016 | Fackler et al. |
| 2017/0060651 | March 2017 | Falter et al. |
| 2017/0139558 | May 2017 | Cervelli et al. |
| 2017/0351686 | December 2017 | Fackler et al. |
| 2020/0272634 | August 2020 | Fackler et al. |
| 2013251186 | Nov 2015 | AU | |||
| 102546446 | Jul 2012 | CN | |||
| 103167093 | Jun 2013 | CN | |||
| 102054015 | May 2014 | CN | |||
| 102014103482 | Sep 2014 | DE | |||
| 102014204827 | Sep 2014 | DE | |||
| 102014204830 | Sep 2014 | DE | |||
| 102014204834 | Sep 2014 | DE | |||
| 102014215621 | Feb 2015 | DE | |||
| 1672527 | Jun 2006 | EP | |||
| 2551799 | Jan 2013 | EP | |||
| 2560134 | Feb 2013 | EP | |||
| 2778977 | Sep 2014 | EP | |||
| 2835745 | Feb 2015 | EP | |||
| 2835770 | Feb 2015 | EP | |||
| 2838039 | Feb 2015 | EP | |||
| 2846241 | Mar 2015 | EP | |||
| 2851852 | Mar 2015 | EP | |||
| 2858014 | Apr 2015 | EP | |||
| 2858018 | Apr 2015 | EP | |||
| 2863326 | Apr 2015 | EP | |||
| 2863346 | Apr 2015 | EP | |||
| 2869211 | May 2015 | EP | |||
| 2881868 | Jun 2015 | EP | |||
| 2884439 | Jun 2015 | EP | |||
| 2884440 | Jun 2015 | EP | |||
| 2889814 | Jul 2015 | EP | |||
| 2891992 | Jul 2015 | EP | |||
| 2892197 | Jul 2015 | EP | |||
| 2911078 | Aug 2015 | EP | |||
| 2911100 | Aug 2015 | EP | |||
| 2940603 | Nov 2015 | EP | |||
| 2940609 | Nov 2015 | EP | |||
| 2993595 | Mar 2016 | EP | |||
| 3002691 | Apr 2016 | EP | |||
| 3009943 | Apr 2016 | EP | |||
| 3107014 | Dec 2016 | EP | |||
| 3144810 | Mar 2017 | EP | |||
| 2516155 | Jan 2015 | GB | |||
| 2518745 | Apr 2015 | GB | |||
| 2012778 | Nov 2014 | NL | |||
| 2013306 | Feb 2015 | NL | |||
| 624557 | Dec 2014 | NZ | |||
| WO 2000/009529 | Feb 2000 | WO | |||
| WO 01/025906 | Apr 2001 | WO | |||
| WO 2001/088750 | Nov 2001 | WO | |||
| WO 2002/065353 | Aug 2002 | WO | |||
| WO 2005/104736 | Nov 2005 | WO | |||
| WO 2007/133206 | Nov 2007 | WO | |||
| WO 2008/064207 | May 2008 | WO | |||
| WO 2009/061501 | May 2009 | WO | |||
| WO 2010/000014 | Jan 2010 | WO | |||
| WO 2010/030913 | Mar 2010 | WO | |||
| WO 2010/030914 | Mar 2010 | WO | |||
| WO 2012/119008 | Sep 2012 | WO | |||
| WO 2013/010157 | Jan 2013 | WO | |||
| WO 2013/102892 | Jul 2013 | WO | |||
Other References
|
Habraken, Joe, "Microsoft Office 2010 in Depth", Que Publishing, Oct. 2010, p. 390-396, 409-412. (Year: 210). cited by examiner . Official Communication for U.S. Appl. No. 14/225,006 dated Dec. 21, 2015. cited by applicant . Official Communication for U.S. Appl. No. 15/354,868 dated Aug. 15, 2018. cited by applicant . Official Communication for U.S. Appl. No. 15/354,868 dated Apr. 2, 2018. cited by applicant . "A First Look: Predicting Market Demand for Food Retail using a Huff Analysis," TRF Policy Solutions, Jul. 2012, pp. 30. cited by applicant . "A Quick Guide to UniProtKB Swiss-Prot & TrEMBL," Sep. 2011, pp. 2. cited by applicant . "A Word About Banks and the Laundering of Drug Money," Aug. 18, 2012, http://www.golemxiv.co.uk/2012/08/a-word-about-banks-and-the-laundering-o- f-drug-money/. cited by applicant . Abbey, Kristen, "Review of Google Docs," May 1, 2007, pp. 2. cited by applicant . About 80 Minutes, "Palantir in a Number of Parts--Part 6--Graph," Mar. 21, 2013, pp. 1-6. cited by applicant . Acklen, Laura, "Absolute Beginner's Guide to Microsoft Word 2003," Dec. 24, 2003, pp. 15-18, 34-41, 308-316. cited by applicant . Adams et al., "Worklets: A Service-Oriented Implementation of Dynamic Flexibility in Workflows," R. Meersman, Z. Tari et al. (Eds.): OTM 2006, LNCS, 4275, pp. 291-308, 2006. cited by applicant . Alur et al., "Chapter 2: IBM InfoSphere DataStage Stages," IBM InfoSphere DataStage Data Flow and Job Design, Jul. 1, 2008, pp. 35-137. cited by applicant . Amnet, "5 Great Tools for Visualizing Your Twitter Followers," posted Aug. 4, 2010, http://www.amnetblog.com/component/content/article/115-5-grate-t- ools-for-visualizing-your-twitter-followers.html. cited by applicant . Ananiev et al., "The New Modality API," http://web.archive.org/web/20061211011958/http://java.sun.com/developer/t- echnicalArticles/J2SE/Desktop/javase6/modality/ Jan. 21, 2006, pp. 8. cited by applicant . Bluttman et al., "Excel Formulas and Functions for Dummies," 2005, Wiley Publishing, Inc., pp. 280, 284-286. cited by applicant . Boyce, Jim, "Microsoft Outlook 2010 Inside Out," Aug. 1, 2010, retrieved from the internet https://capdtron.files.wordpress.com/2013/01/outlook-2010-inside_out.pdf. cited by applicant . Bugzilla@Mozilla, "Bug 18726--[feature] Long-click means of invoking contextual menus not supported," http://bugzilla.mozilla.org/show_bug.cgi?id=18726 printed Jun. 13, 2013 in 11 pages. cited by applicant . Butkovic et al., "Using Whois Based Geolocation and Google Maps API for Support Cybercrime Investigations," Recent Advances in Telecommunications and Circuits: Proceedings of the 11th International Conference on Applied Electromagnetics, Wireless and Optical Communications (Electroscience '13), Proceedings of the 2nd International Conference on Circuits, Systems, Communications, Computers and Applications (CSCCA '13), Proceedings of the 1st International Conference on Solid State Circuits (SSC '13), Proceedings of the 1st International Conference on Antennas & Propagation (ANPRO '13) :Dubrovnik, Croatia, Jun. 25-27, 2013, pp. 194-200, 2013. cited by applicant . Canese et al., "Chapter 2: PubMed: The Bibliographic Database," The NCBI Handbook, Oct. 2002, pp. 1-10. cited by applicant . Celik, Tantek, "CSS Basic User Interface Module Level 3 (CSS3 UI)," Section 8 Resizing and Overflow, Jan. 17, 2012, retrieved from internet http://www.w3.org/TR/2012/WD-css3-ui-20120117/#resizing-amp-overflow retrieved on May 18, 2015. cited by applicant . Chaudhuri et al., "An Overview of Business Intelligence Technology," Communications of the ACM, Aug. 2011, vol. 54, No. 8. cited by applicant . Chen et al., "Bringing Order to the Web: Automatically Categorizing Search Results," CHI 2000, Proceedings of the SIGCHI conference on Human Factors in Computing Systems, Apr. 1-6, 2000, The Hague, The Netherlands, pp. 145-152. cited by applicant . Chung, Chin-Wan, "Dataplex: An Access to Heterogeneous Distributed Databases," Communications of the ACM, Association for Computing Machinery, Inc., vol. 33, No. 1, Jan. 1, 1990, pp. 70-80. cited by applicant . Conner, Nancy, "Google Apps: The Missing Manual," May 1, 2008, pp. 15. cited by applicant . Definition "Identify", downloaded Jan. 22, 2015, 1 page. cited by applicant . Definition "Overlay", downloaded Jan. 22, 2015, 1 page. cited by applicant . Delcher et al., "Identifying Bacterial Genes and Endosymbiont DNA with Glimmer," BioInformatics, vol. 23, No. 6, 2007, pp. 673-679. cited by applicant . Dramowicz, Ela, "Retail Trade Area Analysis Using the Huff Model," Directions Magazine, Jul. 2, 2005 in 10 pages, http://www.directionsmag.com/articles/retail-trade-area-analysis-using-th- e-huff-model/123411. cited by applicant . "The FASTA Program Package," fasta-36.3.4, Mar. 25, 2011, pp. 29. cited by applicant . Ferreira et al., "A Scheme for Analyzing Electronic Payment Systems," Basil 1997. cited by applicant . Galliford, Miles, "SnagIt Versus Free Screen Capture Software: Critical Tools for Website Owners," <http://www.subhub.com/articles/free-screen-capture-software>, Mar. 27, 2008, pp. 11. cited by applicant . Gesher, Ari, "Palantir Screenshots in the Wild: Swing Sightings," The Palantir Blog, Sep. 11, 2007, pp. 1-12. cited by applicant . GIS-NET 3 Public Department of Regional Planning. Planning & Zoning Information for Unincorporated LA County. Retrieved Oct. 2, 2013 from http://gis.planning.lacounty.gov/GIS-NET3_Public/Viewer.html. cited by applicant . Glaab et al., "EnrichNet: Network-Based Gene Set Enrichment Analysis," Bioinformatics 28.18 (2012): pp. i451-i457. cited by applicant . Goswami, Gautam, "Quite Writly Said!," One Brick at a Time, Aug. 21, 2005, pp. 7. cited by applicant . "GrabUp--What a Timesaver!" <http://atlchris.com/191/grabup/>, Aug. 11, 2008, pp. 3. cited by applicant . Griffith, Daniel A., "A Generalized Huff Model," Geographical Analysis, Apr. 1982, vol. 14, No. 2, pp. 135-144. cited by applicant . Gu et al., "Record Linkage: Current Practice and Future Directions," Jan. 15, 2004, pp. 32. cited by applicant . Hansen et al., "Analyzing Social Media Networks with NodeXL: Insights from a Connected World", Chapter 4, pp. 53-67 and Chapter 10, pp. 143-164, published Sep. 2010. cited by applicant . Hardesty, "Privacy Challenges: Analysis: It's Surprisingly Easy to Identify Individuals from Credit-Card Metadata," MIT News on Campus and Around the World, MIT News Office, Jan. 29, 2015, 3 pages. cited by applicant . Hibbert et al., "Prediction of Shopping Behavior Using a Huff Model Within a GIS Framework," Healthy Eating in Context, Mar. 18, 2011, pp. 16. cited by applicant . Hogue et al., "Thresher: Automating the Unwrapping of Semantic Content from the World Wide Web," 14th International Conference on World Wide Web, WWW 2005: Chiba, Japan, May 10-14, 2005, pp. 86-95. cited by applicant . Hua et al., "A Multi-attribute Data Structure with Parallel Bloom Filters for Network Services", HiPC 2006, LNCS 4297, pp. 277-288, 2006. cited by applicant . Huang et al., "Systematic and Integrative Analysis of Large Gene Lists Using DAVID Bioinformatics Resources," Nature Protocols, 4.1, 2008, 44-57. cited by applicant . Huff et al., "Calibrating the Huff Model Using ArcGIS Business Analyst," ESRI, Sep. 2008, pp. 33. cited by applicant . Huff, David L., "Parameter Estimation in the Huff Model," ESRI, ArcUser, Oct.-Dec. 2003, pp. 34-36. cited by applicant . Hur et al., "SciMiner: web-based literature mining tool for target identification and functional enrichment analysis," Bioinformatics 25.6 (2009): pp. 838-840. cited by applicant . IBM, "Determining Business Object Structure," IBM, 2004, 9 pages. cited by applicant . JetScreenshot.com, "Share Screenshots via Internet in Seconds," <http://web.archive.org/web/20130807164204/http://www.jetscreenshot.co- m/>, Aug. 7, 2013, pp. 1. cited by applicant . Kahan et al., "Annotea: an Open RDF Infrastructure for Shared Web Annotations", Computer Networks, Elsevier Science Publishers B.V., vol. 39, No. 5, dated Aug. 5, 2002, pp. 589-608. cited by applicant . Keylines.com, "An Introduction to KeyLines and Network Visualization," Mar. 2014, <http://keylines.com/wp-content/uploads/2014/03/KeyLines-White-Paper.p- df> downloaded May 12, 2014 in 8 pages. cited by applicant . Keylines.com, "KeyLines Datasheet," Mar. 2014, <http://keylines.com/wp-content/uploads/2014/03/KeyLines-datasheet.pdf- > downloaded May 12, 2014 in 2 pages. cited by applicant . Keylines.com, "Visualizing Threats: Improved Cyber Security Through Network Visualization," Apr. 2014, <http://keylines.com/wp-content/uploads/2014/04/Visualizing-Threats1.p- df> downloaded May 12, 2014 in 10 pages. cited by applicant . Kitts, Paul, "Chapter 14: Genome Assembly and Annotation Process," The NCBI Handbook, Oct. 2002, pp. 1-21. cited by applicant . Kwout, <http://web.archive.org/web/20080905132448/http://www.kwout.com/- > Sep. 5, 2008, pp. 2. cited by applicant . Li et al., "Interactive Multimodal Visual Search on Mobile Device," IEEE Transactions on Multimedia, vol. 15, No. 3, Apr. 1, 2013, pp. 594-607. cited by applicant . Liu, Tianshun, "Combining GIS and the Huff Model to Analyze Suitable Locations for a New Asian Supermarket in the Minneapolis and St. Paul, Minnesota USA," Papers in Resource Analysis, 2012, vol. 14, pp. 8. cited by applicant . Madden, Tom, "Chapter 16: The BLAST Sequence Analysis Tool," The NCBI Handbook, Oct. 2002, pp. 1-15. cited by applicant . Manno et al., "Introducing Collaboration in Single-user Applications through the Centralized Control Architecture," 2010, pp. 10. cited by applicant . Manske, "File Saving Dialogs," <http://www.mozilla.org/editor/ui_specs/FileSaveDialogs.html>, Jan. 20, 1999, pp. 7. cited by applicant . Map Builder, "Rapid Mashup Development Tool for Google and Yahoo Maps!" <http://web.archive.org/web/20090626224734/http://www.mapbuilder.net/&- gt; printed Jul. 20, 2012 in 2 pages. cited by applicant . Map of San Jose, CA. Retrieved Oct. 2, 2013 from http://maps.yahoo.com. cited by applicant . Map of San Jose, CA. Retrieved Oct. 2, 2013 from http://maps.bing.com. cited by applicant . Map of San Jose, CA. Retrieved Oct. 2, 2013 from http://maps.google.com. cited by applicant . Microsoft--Developer Network, "Getting Started with VBA in Word 2010," Apr. 2010, <http://msdn.microsoft.com/en-us/library/ff604039%28v=office.14%29.asp- x> as printed Apr. 4, 2014 in 17 pages. cited by applicant . Microsoft Office--Visio, "About connecting shapes," <http://office.microsoft.com/en-us/visio-help/about-connecting-shapes-- HP085050369.aspx> printed Aug. 4, 2011 in 6 pages. cited by applicant . Microsoft Office--Visio, "Add and glue connectors with the Connector tool," <http://office.microsoft.com/en-us/visio-help/add-and-glue-conn- ectors-with-the-connector-tool-HA010048532.aspx?CTT=1> printed Aug. 4, 2011 in 1 page. cited by applicant . Microsoft Windows, "Microsoft Windows Version 2002 Print Out 2," 2002, pp. 1-6. cited by applicant . Microsoft, "Registering an Application to a URI Scheme," <http://msdn.microsoft.com/en-us/library/aa767914.aspx>, printed Apr. 4, 2009 in 4 pages. cited by applicant . Microsoft, "Using the Clipboard," <http://msdn.microsoft.com/en-us/library/ms649016.aspx>, printed Jun. 8, 2009 in 20 pages. cited by applicant . Mizrachi, Ilene, "Chapter 1: GenBank: The Nuckeotide Sequence Database," The NCBI Handbook, Oct. 2002, pp. 1-14. cited by applicant . "Money Laundering Risks and E-Gaming: A European Overview and Assessment," 2009, http://www.cf.ac.uk/socsi/resources/Levi_Final_Money_Laundering_Ris- ks_egaming.pdf. cited by applicant . Nierman, "Evaluating Structural Similarity in XML Documents", 6 pages, 2002. cited by applicant . Nitro, "Trick: How to Capture a Screenshot as PDF, Annotate, Then Share It," <http://blog.nitropdf.com/2008/03/04/trick-how-to-capture-a-scree- nshot-as-pdf-annotate-it-then-share/>, Mar. 4, 2008, pp. 2. cited by applicant . Nolan et al., "MCARTA: A Malicious Code Automated Run-Time Analysis Framework," Homeland Security, 2012 IEEE Conference on Technologies for, Nov. 13, 2012, pp. 13-17. cited by applicant . Olanoff, Drew, "Deep Dive with the New Google Maps for Desktop with Google Earth Integration, It's More than Just a Utility," May 15, 2013, pp. 1-6, retrieved from the internet: http://web.archive.org/web/20130515230641/http://techcrunch.com/2013/05/1- 5/deep-dive-with-the-new-google-maps-for-desktop-with-google-earth-integra- tion-its-more-than-just-a-utility/. cited by applicant . Online Tech Tips, "Clip2Net--Share files, folders and screenshots easily," <http://www.online-tech-tips.com/free-software-downloads/share-files-f- olders-screenshots/>, Apr. 2, 2008, pp. 5. cited by applicant . O'Reilly.com, http://oreilly.com/digitalmedia/2006/01/01/mac-os-x-screenshot-secrets.ht- ml published Jan. 1, 2006 in 10 pages. cited by applicant . Palantir Technologies, "Palantir Labs--Timeline," Oct. 1, 2010, retrieved from the internet https://www.youtube.com/watch?v=JCgDW5bru9M. cited by applicant . Palmas et al., "An Edge-Bunding Layout for Interactive Parallel Coordinates" 2014 IEEE Pacific Visualization Symposium, pp. 57-64. cited by applicant . Perdisci et al., "Behavioral Clustering of HTTP-Based Malware and Signature Generation Using Malicious Network Traces," USENIX, Mar. 18, 2010, pp. 1-14. cited by applicant . "Potential Money Laundering Warning Signs," snapshot taken 2003, https://web.archive.org/web/20030816090055/http:/finsolinc.com/ANTI-MONEY- %20LAUNDERING%20TRAINING%20GUIDES.pdf. cited by applicant . Quest, "Toad for Oracle 11.6--Guide to Using Toad," Sep. 24, 2012, pp. 1-162. cited by applicant . "Refresh CSS Ellipsis When Resizing Container--Stack Overflow," Jul. 31, 2013, retrieved from internet http://stackoverflow.com/questions/17964681/refresh-css-ellipsis-when-res- izing-container, retrieved on May 18, 2015. cited by applicant . Rouse, Margaret, "OLAP Cube," <http://searchdatamanagement.techtarget.com/definition/OLAP-cube>, Apr. 28, 2012, pp. 16. cited by applicant . Schroder, Stan, "15 Ways to Create Website Screenshots," <http://mashable.com/2007/08/24/web-screenshots/>, Aug. 24, 2007, pp. 2. cited by applicant . Shi et al., "A Scalable Implementation of Malware Detection Based on Network Connection Behaviors," 2013 International Conference on Cyber-Enabled Distributed Computing and Knowledge Discovery, IEEE, Oct. 10, 2013, pp. 59-66. cited by applicant . Sigrist, et al., "PROSITE, a Protein Domain Database for Functional Characterization and Annotation," Nucleic Acids Research, 2010, vol. 38, pp. D161-D166. cited by applicant . Sirotkin et al., "Chapter 13: The Processing of Biological Sequence Data at NCBI," The NCBI Handbook, Oct. 2002, pp. 1-11. cited by applicant . SnagIt, "SnagIt 8.1.0 Print Out 2," Software release date Jun. 15, 2006, pp. 1-3. cited by applicant . SnagIt, "SnagIt 8.1.0 Print Out," Software release date Jun. 15, 2006, pp. 6. cited by applicant . SnagIt, "SnagIt Online Help Guide," <http://download.techsmith.com/snagit/docs/onlinehelp/enu/snagit_help.- pdf>, TechSmith Corp., Version 8.1, printed Feb. 7, 2007, pp. 284. cited by applicant . Symantec Corporation, "E-Security Begins with Sound Security Policies," Announcement Symantec, Jun. 14, 2001. cited by applicant . Thompson, Mick, "Getting Started with GEO," Getting Started with GEO, Jul. 26, 2011. cited by applicant . Umagandhi et al., "Search Query Recommendations Using Hybrid User Profile with Query Logs," International Journal of Computer Applications, vol. 80, No. 10, Oct. 1, 2013, pp. 7-18. cited by applicant . Wang et al., "Research on a Clustering Data De-Duplication Mechanism Based on Bloom Filter," IEEE 2010, 5 pages. cited by applicant . Warren, Christina, "TUAW Faceoff: Screenshot apps on the firing line," <http://www.tuaw.com/2008/05/05/tuaw-faceoff-screenshot-apps-on-the-fi- ring-line/>, May 5, 2008, pp. 11. cited by applicant . Wikipedia, "Federated Database System," Sep. 7, 2013, retrieved from the internet on Jan. 27, 2015 http://en.wikipedia.org/w/index.php?title=Federated_database_system&oldid- =571954221. cited by applicant . Wright et al., "Palantir Technologies VAST 2010 Challenge Text Records _ Investigations into Arms Dealing," Oct. 29, 2010, pp. 1-10. cited by applicant . Yang et al., "HTML Page Analysis Based on Visual Cues", A129, pp. 859-864, 2001. cited by applicant . Zheng et al., "GOEAST: a web-based software toolkit for Gene Ontology enrichment analysis," Nucleic acids research 36.suppl 2 (2008): pp. W385-W363. cited by applicant . Notice of Acceptance for Australian Patent Application No. 2013251186 dated Nov. 6, 2015. cited by applicant . Notice of Acceptance for Australian Patent Application No. 2014250678 dated Oct. 7, 2015. cited by applicant . Notice of Allowance for U.S. Appl. No. 12/556,318 dated Apr. 11, 2016. cited by applicant . Notice of Allowance for U.S. Appl. No. 12/556,318 dated Nov. 2, 2015. cited by applicant . Notice of Allowance for U.S. Appl. No. 13/247,987 dated Mar. 17, 2016. cited by applicant . Notice of Allowance for U.S. Appl. No. 14/102,394 dated Aug. 25, 2014. cited by applicant . Notice of Allowance for U.S. Appl. No. 14/108,187 dated Aug. 29, 2014. cited by applicant . Notice of Allowance for U.S. Appl. No. 14/135,289 dated Oct. 14, 2014. cited by applicant . Notice of Allowance for U.S. Appl. No. 14/148,568 dated Aug. 26, 2015. cited by applicant . Notice of Allowance for U.S. Appl. No. 14/192,767 dated Dec. 16, 2014. cited by applicant . Notice of Allowance for U.S. Appl. No. 14/192,767 dated Apr. 20, 2015. cited by applicant . Notice of Allowance for U.S. Appl. No. 14/225,084 dated May 4, 2015. cited by applicant . Notice of Allowance for U.S. Appl. No. 14/265,637 dated Feb. 13, 2015. cited by applicant . Notice of Allowance for U.S. Appl. No. 14/268,964 dated Dec. 3, 2014. cited by applicant . Notice of Allowance for U.S. Appl. No. 14/294,098 dated Dec. 29, 2014. cited by applicant . Notice of Allowance for U.S. Appl. No. 14/323,935 dated Oct. 1, 2015. cited by applicant . Notice of Allowance for U.S. Appl. No. 14/326,738 dated Nov. 18, 2015. cited by applicant . Notice of Allowance for U.S. Appl. No. 14/473,552 dated Jul. 24, 2015. cited by applicant . Notice of Allowance for U.S. Appl. No. 14/473,860 dated Feb. 27, 2015. cited by applicant . Notice of Allowance for U.S. Appl. No. 14/473,860 dated Jan. 5, 2015. cited by applicant . Notice of Allowance for U.S. Appl. No. 14/486,991 dated May 1, 2015. cited by applicant . Notice of Allowance for U.S. Appl. No. 14/504,103 dated May 18, 2015. cited by applicant . Notice of Allowance for U.S. Appl. No. 14/552,336 dated Nov. 3, 2015. cited by applicant . Notice of Allowance for U.S. Appl. No. 14/579,752 dated Apr. 4, 2016. cited by applicant . Notice of Allowance for U.S. Appl. No. 14/616,080 dated Apr. 2, 2015. cited by applicant . Notice of Allowance for U.S. Appl. No. 14/676,621 dated Feb. 10, 2016. cited by applicant . Notice of Allowance for U.S. Appl. No. 14/871,465 dated Jul. 19, 2016. cited by applicant . Notice of Allowance for U.S. Appl. No. 14/961,481 dated May 2, 2016. cited by applicant . Official Communication for Australian Patent Application No. 2013251186 dated Mar. 12, 2015. cited by applicant . Official Communication for Australian Patent Application No. 2014201511 dated Feb. 27, 2015. cited by applicant . Official Communication for Australian Patent Application No. 2014202442 dated Mar. 19, 2015. cited by applicant . Official Communication for Australian Patent Application No. 2014210604 dated Jun. 5, 2015. cited by applicant . Official Communication for Australian Patent Application No. 2014210614 dated Jun. 5, 2015. cited by applicant . Official Communication for Australian Patent Application No. 2014213553 dated May 7, 2015. cited by applicant . Official Communication for Australian Patent Application No. 2014250678 dated Jun. 17, 2015. cited by applicant . Official Communication for Canadian Patent Application No. 2831660 dated Jun. 9, 2015. cited by applicant . Official Communication for European Patent Application No. 12181585.6 dated Sep. 4, 2015. cited by applicant . Official Communication for European Patent Application No. 14158861.6 dated Jun. 16, 2014. cited by applicant . Official Communication for European Patent Application No. 14159464.8 dated Jul. 31, 2014. cited by applicant . Official Communication for European Patent Application No. 14180142.3 dated Feb. 6, 2015. cited by applicant . Official Communication for European Patent Application No. 14180281.9 dated Jan. 26, 2015. cited by applicant . Official Communication for European Patent Application No. 14180321.3 dated Apr. 17, 2015. cited by applicant . Official Communication for European Patent Application No. 14180432.8 dated Jun. 23, 2015. cited by applicant . Official Communication for European Patent Application No. 14186225.0 dated Feb. 13, 2015. cited by applicant . Official Communication for European Patent Application No. 14187739.9 dated Jul. 6, 2015. cited by applicant . Official Communication for European Patent Application No. 14187996.5 dated Feb. 12, 2015. cited by applicant . Official Communication for European Patent Application No. 14187996.5 dated Feb. 19, 2016. cited by applicant . Official Communication for European Patent Application No. 14189344.6 dated Feb. 20, 2015. cited by applicant . Official Communication for European Patent Application No. 14189344.6 dated Feb. 29, 2016. cited by applicant . Official Communication for European Patent Application No. 14189347.9 dated Mar. 4, 2015. cited by applicant . Official Communication for European Patent Application No. 14189802.3 dated May 11, 2015. cited by applicant . Official Communication for European Patent Application No. 14191540.5 dated May 27, 2015. cited by applicant . Official Communication for European Patent Application No. 14197879.1 dated Apr. 28, 2015. cited by applicant . Official Communication for European Patent Application No. 14197895.7 dated Apr. 28, 2015. cited by applicant . Official Communication for European Patent Application No. 14197938.5 dated Apr. 28, 2015. cited by applicant . Official Communication for European Patent Application No. 14199182.8 dated Mar. 13, 2015. cited by applicant . Official Communication for European Patent Application No. 15155845.9 dated Oct. 6, 2015. cited by applicant . Official Communication for European Patent Application No. 15155846.7 dated Jul. 8, 2015. cited by applicant . Official Communication for European Patent Application No. 15165244.3 dated Aug. 27, 2015. cited by applicant . Official Communication for European Patent Application No. 15175106.2 dated Nov. 5, 2015. cited by applicant . Official Communication for European Patent Application No. 15175151.8 dated Nov. 25, 2015. cited by applicant . Official Communication for European Patent Application No. 15183721.8 dated Nov. 23, 2015. cited by applicant . Official Communication for European Patent Application No. 15188106.7 dated Feb. 21, 2017. cited by applicant . Official Communication for European Patent Application No. 15188106.7 dated Feb. 3, 2016. cited by applicant . Official Communication for European Patent Application No. 15190307.7 dated Feb. 19, 2016. cited by applicant . Official Communication for Great Britain Patent Application No. 1404457.2 dated Aug. 14, 2014. cited by applicant . Official Communication for Great Britain Patent Application No. 1404486.1 dated May 21, 2015. cited by applicant . Official Communication for Great Britain Patent Application No. 1404486.1 dated Aug. 27, 2014. cited by applicant . Official Communication for Great Britain Patent Application No. 1404489.5 dated May 21, 2015. cited by applicant . Official Communication for Great Britain Patent Application No. 1404489.5 dated Aug. 27, 2014. cited by applicant . Official Communication for Great Britain Patent Application No. 1404499.4 dated Aug. 20, 2014. cited by applicant . Official Communication for Great Britain Patent Application No. 1404574.4 dated Dec. 18, 2014. cited by applicant . Official Communication for Great Britain Patent Application No. 1408025.3 dated Nov. 6, 2014. cited by applicant . Official Communication for Great Britain Patent Application No. 1411984.6 dated Dec. 22, 2014. cited by applicant . Official Communication for Great Britain Patent Application No. 1413935.6 dated Jan. 27, 2015. cited by applicant . Official Communication for Netherlands Patent Application No. 2011729 dated Aug. 13, 2015. cited by applicant . Official Communication for Netherlands Patent Application No. 2012437 dated Sep. 18, 2015. cited by applicant . Official Communication for Netherlands Patent Application No. 2012438 dated Sep. 21, 2015. cited by applicant . Official Communication for Netherlands Patent Application No. 2013306 dated Apr. 24, 2015. cited by applicant . Official Communication for New Zealand Patent Application No. 622473 dated Jun. 19, 2014. cited by applicant . Official Communication for New Zealand Patent Application No. 622473 dated Mar. 27, 2014. cited by applicant . Official Communication for New Zealand Patent Application No. 622513 dated Apr. 3, 2014. cited by applicant . Official Communication for New Zealand Patent Application No. 622517 dated Apr. 3, 2014. cited by applicant . Official Communication for New Zealand Patent Application No. 624557 dated May 14, 2014. cited by applicant . Official Communication for New Zealand Patent Application No. 627962 dated Aug. 5, 2014. cited by applicant . Official Communication for New Zealand Patent Application No. 628161 dated Aug. 25, 2014. cited by applicant . Official Communication for New Zealand Patent Application No. 628263 dated Aug. 12, 2014. cited by applicant . Official Communication for New Zealand Patent Application No. 628495 dated Aug. 19, 2014. cited by applicant . Official Communication for New Zealand Patent Application No. 628585 dated Aug. 26, 2014. cited by applicant . Official Communication for New Zealand Patent Application No. 628840 dated Aug. 28, 2014. cited by applicant . Official Communication for U.S. Appl. No. 12/556,318 dated Jul. 2, 2015. cited by applicant . Official Communication for U.S. Appl. No. 12/556,321 dated Feb. 25, 2016. cited by applicant . Official Communication for U.S. Appl. No. 12/556,321 dated Jun. 6, 2012. cited by applicant . Official Communication for U.S. Appl. No. 12/556,321 dated Dec. 7, 2011. cited by applicant . Official Communication for U.S. Appl. No. 12/556,321 dated Jul. 7, 2015. cited by applicant . Official Communication for U.S. Appl. No. 13/247,987 dated Apr. 2, 2015. cited by applicant . Official Communication for U.S. Appl. No. 13/247,987 dated Sep. 22, 2015. cited by applicant . Official Communication for U.S. Appl. No. 13/669,274 dated Aug. 26, 2015. cited by applicant . Official Communication for U.S. Appl. No. 13/669,274 dated May 2, 2016. cited by applicant . Official Communication for U.S. Appl. No. 13/669,274 dated May 6, 2015. cited by applicant . Official Communication for U.S. Appl. No. 13/827,491 dated Dec. 1, 2014. cited by applicant . Official Communication for U.S. Appl. No. 13/827,491 dated Jun. 22, 2015. cited by applicant . Official Communication for U.S. Appl. No. 13/827,491 dated Mar. 30, 2016. cited by applicant . Official Communication for U.S. Appl. No. 13/827,491 dated Oct. 9, 2015. cited by applicant . Official Communication for U.S. Appl. No. 13/831,791 dated Feb. 11, 2016. cited by applicant . Official Communication for U.S. Appl. No. 13/831,791 dated Mar. 4, 2015. cited by applicant . Official Communication for U.S. Appl. No. 13/831,791 dated Aug. 6, 2015. cited by applicant . Official Communication for U.S. Appl. No. 13/835,688 dated Jun. 17, 2015. cited by applicant . Official Communication for U.S. Appl. No. 13/835,688 dated Sep. 30, 2015. cited by applicant . Official Communication for U.S. Appl. No. 13/839,026 dated Aug. 4, 2015. cited by applicant . Official Communication for U.S. Appl. No. 14/102,394 dated Mar. 27, 2014. cited by applicant . Official Communication for U.S. Appl. No. 14/108,187 dated Apr. 17, 2014. cited by applicant . Official Communication for U.S. Appl. No. 14/108,187 dated Mar. 20, 2014. cited by applicant . Official Communication for U.S. Appl. No. 14/134,558 dated Oct. 7, 2015. cited by applicant . Official Communication for U.S. Appl. No. 14/135,289 dated Apr. 16, 2014. cited by applicant . Official Communication for U.S. Appl. No. 14/135,289 dated Jul. 7, 2014. cited by applicant . Official Communication for U.S. Appl. No. 14/148,568 dated Oct. 22, 2014. cited by applicant . Official Communication for U.S. Appl. No. 14/148,568 dated Mar. 26, 2015. cited by applicant . Official Communication for U.S. Appl. No. 14/148,568 dated Mar. 27, 2014. cited by applicant . Official Communication for U.S. Appl. No. 14/192,767 dated Sep. 24, 2014. cited by applicant . Official Communication for U.S. Appl. No. 14/192,767 dated May 6, 2014. cited by applicant . Official Communication for U.S. Appl. No. 14/196,814 dated Aug. 13, 2014. cited by applicant . Official Communication for U.S. Appl. No. 14/196,814 dated May 5, 2015. cited by applicant . Official Communication for U.S. Appl. No. 14/196,814 dated Oct. 7, 2015. cited by applicant . Official Communication for U.S. Appl. No. 14/222,364 dated Dec. 9, 2015. cited by applicant . Official Communication for U.S. Appl. No. 14/225,006 dated Sep. 10, 2014. cited by applicant . Official Communication for U.S. Appl. No. 14/225,006 dated Sep. 2, 2015. cited by applicant . Official Communication for U.S. Appl. No. 14/225,006 dated Feb. 27, 2015. cited by applicant . Official Communication for U.S. Appl. No. 14/225,084 dated Sep. 11, 2015. cited by applicant . Official Communication for U.S. Appl. No. 14/225,084 dated Sep. 2, 2014. cited by applicant . Official Communication for U.S. Appl. No. 14/225,084 dated Feb. 20, 2015. cited by applicant . Official Communication for U.S. Appl. No. 14/225,084 dated Feb. 26, 2016. cited by applicant . Official Communication for U.S. Appl. No. 14/225,084 dated Jan. 4, 2016. cited by applicant . Official Communication for U.S. Appl. No. 14/225,160 dated Feb. 11, 2015. cited by applicant . Official Communication for U.S. Appl. No. 14/225,160 dated Aug. 12, 2015. cited by applicant . Official Communication for U.S. Appl. No. 14/225,160 dated May 20, 2015. cited by applicant . Official Communication for U.S. Appl. No. 14/225,160 dated Oct. 22, 2014. cited by applicant . Official Communication for U.S. Appl. No. 14/225,160 dated Jan. 25, 2016. cited by applicant . Official Communication for U.S. Appl. No. 14/225,160 dated Jul. 29, 2014. cited by applicant . Official Communication for U.S. Appl. No. 14/265,637 dated Sep. 26, 2014. cited by applicant . Official Communication for U.S. Appl. No. 14/268,964 dated Jul. 11, 2014. cited by applicant . Official Communication for U.S. Appl. No. 14/268,964 dated Sep. 3, 2014. cited by applicant . Official Communication for U.S. Appl. No. 14/289,596 dated Jul. 18, 2014. cited by applicant . Official Communication for U.S. Appl. No. 14/289,596 dated Jan. 26, 2015. cited by applicant . Official Communication for U.S. Appl. No. 14/289,596 dated Apr. 30, 2015. cited by applicant . Official Communication for U.S. Appl. No. 14/289,596 dated Aug. 5, 2015. cited by applicant . Official Communication for U.S. Appl. No. 14/289,599 dated Jul. 22, 2014. cited by applicant . Official Communication for U.S. Appl. No. 14/289,599 dated May 29, 2015. cited by applicant . Official Communication for U.S. Appl. No. 14/289,599 dated Sep. 4, 2015. cited by applicant . Official Communication for U.S. Appl. No. 14/294,098 dated Aug. 15, 2014. cited by applicant . Official Communication for U.S. Appl. No. 14/294,098 dated Nov. 6, 2014. cited by applicant . Official Communication for U.S. Appl. No. 14/306,138 dated Sep. 14, 2015. cited by applicant . Official Communication for U.S. Appl. No. 14/306,138 dated Mar. 17, 2016. cited by applicant . Official Communication for U.S. Appl. No. 14/306,138 dated Feb. 18, 2015. cited by applicant . Official Communication for U.S. Appl. No. 14/306,138 dated Sep. 23, 2014. cited by applicant . Official Communication for U.S. Appl. No. 14/306,138 dated Dec. 24, 2015. cited by applicant . Official Communication for U.S. Appl. No. 14/306,138 dated May 26, 2015. cited by applicant . Official Communication for U.S. Appl. No. 14/306,138 dated Dec. 3, 2015. cited by applicant . Official Communication for U.S. Appl. No. 14/306,147 dated Feb. 19, 2015. cited by applicant . Official Communication for U.S. Appl. No. 14/306,147 dated Dec. 24, 2015. cited by applicant . Official Communication for U.S. Appl. No. 14/306,147 dated Aug. 7, 2015. cited by applicant . Official Communication for U.S. Appl. No. 14/306,147 dated Sep. 9, 2014. cited by applicant . Official Communication for U.S. Appl. No. 14/306,154 dated Feb. 1, 2016. cited by applicant . Official Communication for U.S. Appl. No. 14/306,154 dated Mar. 11, 2015. cited by applicant . Official Communication for U.S. Appl. No. 14/306,154 dated May 15, 2015. cited by applicant . Official Communication for U.S. Appl. No. 14/306,154 dated Nov. 16, 2015. cited by applicant . Official Communication for U.S. Appl. No. 14/306,154 dated Mar. 17, 2016. cited by applicant . Official Communication for U.S. Appl. No. 14/306,154 dated Jul. 6, 2015. cited by applicant . Official Communication for U.S. Appl. No. 14/306,154 dated Sep. 9, 2014. cited by applicant . Official Communication for U.S. Appl. No. 14/319,765 dated Feb. 1, 2016. cited by applicant . Official Communication for U.S. Appl. No. 14/319,765 dated Sep. 10, 2015. cited by applicant . Official Communication for U.S. Appl. No. 14/319,765 dated Jun. 16, 2015. cited by applicant . Official Communication for U.S. Appl. No. 14/319,765 dated Nov. 25, 2014. cited by applicant . Official Communication for U.S. Appl. No. 14/319,765 dated Feb. 4, 2015. cited by applicant . Official Communication for U.S. Appl. No. 14/323,935 dated Jun. 22, 2015. cited by applicant . Official Communication for U.S. Appl. No. 14/323,935 dated Nov. 28, 2014. cited by applicant . Official Communication for U.S. Appl. No. 14/323,935 dated Mar. 31, 2015. cited by applicant . Official Communication for U.S. Appl. No. 14/326,738 dated Dec. 2, 2014. cited by applicant . Official Communication for U.S. Appl. No. 14/326,738 dated Jul. 31, 2015. cited by applicant . Official Communication for U.S. Appl. No. 14/326,738 dated Mar. 31, 2015. cited by applicant . Official Communication for U.S. Appl. No. 14/332,306 dated May 20, 2016. cited by applicant . Official Communication for U.S. Appl. No. 14/473,552 dated Feb. 24, 2015. cited by applicant . Official Communication for U.S. Appl. No. 14/473,860 dated Nov. 4, 2014. cited by applicant . Official Communication for U.S. Appl. No. 14/479,160 dated Apr. 20, 2016. cited by applicant . Official Communication for U.S. Appl. No. 14/486,991 dated Mar. 10, 2015. cited by applicant . Official Communication for U.S. Appl. No. 14/490,612 dated Aug. 18, 2015. cited by applicant . Official Communication for U.S. Appl. No. 14/490,612 dated Jan. 27, 2015. cited by applicant . Official Communication for U.S. Appl. No. 14/490,612 dated Mar. 31, 2015. cited by applicant . Official Communication for U.S. Appl. No. 14/504,103 dated Mar. 31, 2015. cited by applicant . Official Communication for U.S. Appl. No. 14/504,103 dated Feb. 5, 2015. cited by applicant . Official Communication for U.S. Appl. No. 14/552,336 dated Jul. 20, 2015. cited by applicant . Official Communication for U.S. Appl. No. 14/571,098 dated Nov. 10, 2015. cited by applicant . Official Communication for U.S. Appl. No. 14/571,098 dated Mar. 11, 2015. cited by applicant . Official Communication for U.S. Appl. No. 14/571,098 dated Feb. 23, 2016. cited by applicant . Official Communication for U.S. Appl. No. 14/571,098 dated Aug. 24, 2015. cited by applicant . Official Communication for U.S. Appl. No. 14/571,098 dated Aug. 5, 2015. cited by applicant . Official Communication for U.S. Appl. No. 14/579,752 dated Aug. 19, 2015. cited by applicant . Official Communication for U.S. Appl. No. 14/579,752 dated May 26, 2015. cited by applicant . Official Communication for U.S. Appl. No. 14/579,752 dated Dec. 9, 2015. cited by applicant . Official Communication for U.S. Appl. No. 14/631,633 dated Sep. 10, 2015. cited by applicant . Official Communication for U.S. Appl. No. 14/631,633 dated Feb. 3, 2016. cited by applicant . Official Communication for U.S. Appl. No. 14/639,606 dated Oct. 16, 2015. cited by applicant . Official Communication for U.S. Appl. No. 14/639,606 dated May 18, 2015. cited by applicant . Official Communication for U.S. Appl. No. 14/639,606 dated Jul. 24, 2015. cited by applicant . Official Communication for U.S. Appl. No. 14/639,606 dated Apr. 5, 2016. cited by applicant . Official Communication for U.S. Appl. No. 14/676,621 dated Oct. 29, 2015. cited by applicant . Official Communication for U.S. Appl. No. 14/676,621 dated Jul. 30, 2015. cited by applicant . Official Communication for U.S. Appl. No. 14/715,834 dated Apr. 13, 2016. cited by applicant . Official Communication for U.S. Appl. No. 14/715,834 dated Feb. 19, 2016. cited by applicant . Official Communication for U.S. Appl. No. 14/726,353 dated Mar. 1, 2016. cited by applicant . Official Communication for U.S. Appl. No. 14/726,353 dated Sep. 10, 2015. cited by applicant . Official Communication for U.S. Appl. No. 14/741,256 dated Feb. 9, 2016. cited by applicant . Official Communication for U.S. Appl. No. 14/800,447 dated Dec. 10, 2015. cited by applicant . Official Communication for U.S. Appl. No. 14/800,447 dated Mar. 3, 2016. cited by applicant . Official Communication for U.S. Appl. No. 14/800,447 dated Jun. 6, 2016. cited by applicant . Official Communication for U.S. Appl. No. 14/813,749 dated Sep. 28, 2015. cited by applicant . Official Communication for U.S. Appl. No. 14/813,749 dated Apr. 8, 2016. cited by applicant . Official Communication for U.S. Appl. No. 14/841,338 dated Feb. 18, 2016. cited by applicant . Official Communication for U.S. Appl. No. 14/842,734 dated Nov. 19, 2015. cited by applicant . Official Communication for U.S. Appl. No. 14/871,465 dated Apr. 11, 2016. cited by applicant . Official Communication for U.S. Appl. No. 14/871,465 dated Feb. 9, 2016. cited by applicant . Official Communication for U.S. Appl. No. 14/883,498 dated Mar. 17, 2016. cited by applicant . Official Communication for U.S. Appl. No. 14/883,498 dated Dec. 24, 2015. cited by applicant . Official Communication for U.S. Appl. No. 14/961,481 dated Mar. 2, 2016. cited by applicant . Official Communication for U.S. Appl. No. 14/975,215 dated May 19, 2016. cited by applicant . Restriction Requirement for U.S. Appl. No. 13/839,026 dated Apr. 2, 2015. cited by applicant . Appacts, "Smart Thinking for Super Apps," <http://www.appacts.com> Printed Jul. 18, 2013 in 4 pages. cited by applicant . Apsalar, "Data Powered Mobile Advertising," "Free Mobile App Analytics" and various analytics related screen shots <http://apsalar.com> Printed Jul. 18, 2013 in 8 pages. cited by applicant . Berners-Lee et al., "Uniform Resource Locactors (URL)", RFS 1738, Dec. 1994, Internet Engineering Task Force, pp. 1-25. cited by applicant . Capptain--Pilot Your Apps, <http://www.capptain.com> Printed Jul. 18, 2013 in 6 pages. cited by applicant . Cohn et al., "Semi-supervised Clustering with User Feedback," Constrained Clustering: Advances in Algorithms, Theory, and Applications 4.1, 2003, pp. 17-22. cited by applicant . Countly Mobile Analytics, <http://count.ly/> Printed Jul. 18, 2013 in 9 pages. cited by applicant . Distimo--App Analytics, <http://www.distimo.com/app-analytics> Printed Jul. 18, 2013 in 5 pages. cited by applicant . Faulkner, Steve "Notes on Accessibility of Text Replacement Using HTML5 Canvas;" Jun. 9, 2009; The Paciello Group; pp. 1-4. cited by applicant . Flurry Analytics, <http://www.flurry.com/> Printed Jul. 18, 2013 in 14 pages. cited by applicant . Google Analytics Official Website--Web Analytics & Reporting, <http://www.google.com/analytics.index.html> Printed Jul. 18, 2013 in 22 pages. cited by applicant . Gorr et al., "Crime Hot Spot Forecasting: Modeling and Comparative Evaluation", Grant 98-IJ-CX-K005, May 6, 2002, 37 pages. cited by applicant . Johnson, Tom, "HunchLab: Heat Map and Kernel Density Calculation for Crime Analysis," Azavea Journal, printed from www.azavea.com/blogs/newsletter/v4i4/kernel-density-capabilities-added-to- -hunchlab/ on Sep. 9, 2014, 2 pages. cited by applicant . Kontagent Mobile Analytics, <http://www.kontagent.com/> Printed Jul. 18, 2013 in 9 pages. cited by applicant . Localytics--Mobile App Marketing & Analytics, <http://www.localytics.com/> Printed Jul. 18, 2013 in 12 pages. cited by applicant . Mixpanel--Mobile Analytics, <https://mixpanel.com/> Printed Jul. 18, 2013 in 13 pages. cited by applicant . Mozilla Support: "Applications panel--Set how Firefox handles different types of files" Jun. 4, 2015, Retrieved from the Internet: URL: https://web.archive.org/web/20150604001024/support.mozilla.org/en-US/kb/a- pplications-panel-set-how-firefox-handles-files [retrieved on Jul. 13, 2018], 2 pages. cited by applicant . Open Web Analytics (OWA), <http://www.openwebanalytics.com/> Printed Jul. 19, 2013 in 5 pages. cited by applicant . Piwik--Free Web Analytics Software. <http://piwik.org/> Printed Jul. 19, 2013 in 18 pages. cited by applicant . StatCounter--Free Invisible Web Tracker, Hit Counter and Web Stats, <http://statcounter.com/> Printed Jul. 19, 2013 in 17 pages. cited by applicant . TestFlight--Beta Testing on the Fly, <http://testflightapp.com/> Printed Jul. 18, 2013 in 3 pages. cited by applicant . trak.io, "Analytics for Data Driven Startups," http://trak.io/ printed Jul. 18, 2013 in 3 pages. cited by applicant . UserMetrix, <http://usermetrix.com/android-analytics> printed Jul. 18, 2013 in 3 pages. cited by applicant . Valentini et al., "Ensembles of Learning Machines", M. Marinaro and R. Tagliaferri (Eds.): WIRN VIETRI 2002, LNCS 2486, pp. 3-20. cited by applicant . Vose et al., "Help File for ModelRisk Version 5," 2007, Vose Software, pp. 349-353. [Uploaded in 2 Parts]. cited by applicant . Official Communication for European Patent Application No. 15188106.7 dated Aug. 29, 2018, 11 pages. cited by applicant . Official Communication for European Patent Application No. 16174638.3 dated Oct. 5, 2016, in 12 pages. cited by applicant . Official Communication for European Patent Application No. 16174638.3 dated Jul. 20, 2018, 10 pages. cited by applicant . Official Communication for European Patent Application No. 16174638.3 dated Jun. 3, 2019, 10 pages. cited by applicant . U.S. Appl. No. 15/684,591, Data Aggregation and Analysis System, filed Aug. 23, 2017. cited by applicant . U.S. Appl. No. 15/930,996, Data Aggregation and Analysis System, filed May 13, 2020. cited by applicant. |
Primary Examiner: Sams; Michelle L
Attorney, Agent or Firm: Knobbe Martens Olson & Bear LLP
Parent Case Text
CROSS-REFERENCE TO RELATED APPLICATIONS
This application is a continuation of U.S. patent application Ser. No. 15/354,868, filed on Nov. 17, 2016, entitled "TIME-SERIES ANALYSIS SYSTEM," which is a continuation of U.S. patent application Ser. No. 14/871,465, filed on Sep. 30, 2015, entitled "TIME-SERIES ANALYSIS SYSTEM," which claims priority under 35 U.S.C. .sctn. 119(e) to U.S. Provisional Application No. 62/059,601, entitled "CHRONICLE TIME-SERIES ANALYSIS SYSTEM" and filed on Oct. 3, 2014, and U.S. Provisional Application No. 62/206,159, entitled "TIME-SERIES ANALYSIS SYSTEM" and filed on Aug. 17, 2015, which are hereby incorporated by reference in their entireties.
Claims
What is claimed is:
1. A computing system comprising: a computer processor; and a computer readable storage medium storing program instructions configured for execution by the computer processor in order to cause a user interface module of the computing system to: generate user interface data for rendering an interactive user interface on a computing device, the interactive user interface including a first graph, wherein the first graph includes first data values corresponding to a first type of parameter over a first time period; receive an identification of a selection of a first data point in the first graph and a second data point in the first graph, wherein the first data point represents a beginning of a first time period and the second data point represents an end of the first time period; and in response to the selection of the first data point and the second data point: update, by the user interface module, the user interface data such that the interactive user interface includes a second graph that plots second data values corresponding to a second type of parameter against third data values corresponding to a third type of parameter, wherein the second data values and the third data values correspond to times within the first time period, wherein the second type of parameter is different than the first type of parameter and the third type of parameter, and wherein the third type of parameter is different than the first type of parameter and the second type of parameter.
2. The computing system of claim 1, wherein the program instructions further cause the user interface module of the computing system to receive an identification of a second selection in the second graph of a combination of one of the second data values and one of the third data values.
3. The computing system of claim 2, wherein the program instructions further cause the user interface module of the computing system to: determine that the combination of the one of the second data values and the one of the third data values occurred at a second time inside the first time period and at a third time outside the first time period; and update the updated user interface data such that the interactive user interface includes a first marker depicted in the first graph outside markers designating the first time period, wherein the first marker corresponds to the third time.
4. The computing system of claim 3, wherein the program instructions further cause the user interface module of the computing system to update the second updated user interface data such that the interactive user interface includes a second marker depicted in the second graph inside the markers designating the first time period, wherein the second marker corresponds to the second time.
5. The computing system of claim 2, wherein the second selection is represented by a box depicted in the second graph.
6. The computing system of claim 1, wherein the first graph comprises a time-series graph.
7. The computing system of claim 1, wherein the second graph comprises a scatterplot.
8. The computing system of claim 1, wherein the program instructions further cause the user interface module of the computing system to, for each time increment in the first time period, retrieve one of the second data values corresponding to the respective time increment and one of the third data values corresponding to the respective time increment.
9. The computing system of claim 1, wherein the first data values, the second data values, and the third data values are measured by different sensors associated with a system.
10. A computer-implemented method comprising: generating user interface data for rendering an interactive user interface on a computing device, the interactive user interface including a first graph, wherein the first graph includes first data values corresponding to a first type of parameter over a first time period; receiving an identification of a selection of a first data point in the first graph and a second data point in the first graph, wherein the first data point represents a beginning of a first time period and the second data point represents an end of the first time period; and in response to the selection of the first data point and the second data point: updating the user interface data such that the interactive user interface includes a second graph that plots second data values corresponding to a second type of parameter against third data values corresponding to a third type of parameter, wherein the second data values and the third data values correspond to times within the first time period, wherein the second type of parameter is different than the first type of parameter and the third type of parameter, and wherein the third type of parameter is different than the first type of parameter and the second type of parameter.
11. The computer-implemented method of claim 10, further comprising receiving an identification of a second selection in the second graph of a combination of one of the second data values and one of the third data values.
12. The computer-implemented method of claim 11, further comprising: determining that the combination of the one of the second data values and the one of the third data values occurred at a second time inside the first time period and at a third time outside the first time period; and updating the updated user interface data such that the interactive user interface includes a first marker depicted in the first graph outside markers designating the first time period, wherein the first marker corresponds to the third time.
13. The computer-implemented method of claim 12, further comprising updating the second updated user interface data such that the interactive user interface includes a second marker depicted in the second graph inside the markers designating the first time period, wherein the second marker corresponds to the second time.
14. The computer-implemented method of claim 10, wherein the first graph comprises a time-series graph, and wherein the second graph comprises a scatterplot.
15. The computer-implemented method of claim 10, further comprising, for each time increment in the first time period, retrieving one of the second data values corresponding to the respective time increment and one of the third data values corresponding to the respective time increment.
16. A non-transitory computer-readable medium comprising one or more program instructions recorded thereon, the instructions configured for execution by a computing system comprising one or more processors in order to cause the computing system to: generate user interface data for rendering an interactive user interface on a computing device, the interactive user interface including a first graph, wherein the first graph includes first data values corresponding to a first type of parameter over a first time period; receive an identification of a selection of a first data point in the first graph and a second data point in the first graph, wherein the first data point represents a beginning of a first time period and the second data point represents an end of the first time period; and in response to the selection of the first data point and the second data point: update the user interface data such that the interactive user interface includes a second graph that plots second data values corresponding to a second type of parameter against third data values corresponding to a third type of parameter, wherein the second data values and the third data values correspond to times within the first time period, wherein the second type of parameter is different than the first type of parameter and the third type of parameter, and wherein the third type of parameter is different than the first type of parameter and the second type of parameter.
17. The non-transitory computer-readable medium of claim 16, wherein the instructions are further configured to cause the computing system to receive an identification of a second selection in the second graph of a combination of one of the second data values and one of the third data values.
18. The non-transitory computer-readable medium of claim 17, wherein the instructions are further configured to cause the computing system to: determine that the combination of the one of the second data values and the one of the third data values occurred at a second time inside the first time period and at a third time outside the first time period; and update the updated user interface data such that the interactive user interface includes a first marker depicted in the first graph outside markers designating the first time period, wherein the first marker corresponds to the third time.
19. The non-transitory computer-readable medium of claim 18, wherein the instructions are further configured to cause the computing system to update the second updated user interface data such that the interactive user interface includes a second marker depicted in the second graph inside the markers designating the first time period, wherein the second marker corresponds to the second time.
Description
TECHNICAL FIELD
The present disclosure relates to systems and techniques for querying databases and displaying queried data in an interactive user interface.
BACKGROUND
A database may store a large quantity of data. For example, a system may comprise a large number of sensors that each collect measurements at regular intervals, and the measurements may be stored in the database and/or a system of databases. The measurement data can be supplemented with other data, such as information regarding events that occurred while the system was operational, and the supplemental data can also be stored in the database and/or the system of databases.
In some cases, a user may attempt to analyze a portion of the stored data. For example, the user may attempt to analyze a portion of the stored data that is associated with a specific time period. However, as the number of measurements increases over time, it can become very difficult for the user to identify the relevant data and perform the analysis.
SUMMARY
The systems, methods, and devices described herein each have several aspects, no single one of which is solely responsible for its desirable attributes. Without limiting the scope of this disclosure, several non-limiting features will now be discussed briefly.
Disclosed herein are various systems and methods for displaying various graphs in an interactive user interface in substantially real-time in response to input from a user in order to determine information related to measured data points and provide the determined information to the user in the interactive user interface. For example, a computing device may be configured to retrieve data from one or more databases and generate one or more interactive user interfaces. The one or more interactive user interfaces may display the retrieved data in one or more graphs, such as time-series or scatterplots. The user interface may be interactive in that a user may manipulate one graph, which causes an identical or nearly identical manipulation of another displayed graph in real-time. The manipulations may occur even if the displayed graphs include data across different time ranges. The user interface may also be interactive in that a user may select a portion of a graph (e.g., data across a certain time period) to view tangential data related to the selection (e.g., events that occurred during a time period represented by the selection).
The various systems described herein may maximize or enhance the speed and accuracy of data displayed in user interfaces using zoom level specific caching. For example, depending on a zoom level of data displayed, individual pixels represent different time ranges (e.g., 1 day in February, 1 week in February, 1 month in 2014, etc.). Over the time range of an individual pixel, the computing system may determine a maximum value and a minimum value of the data to be displayed in the graph. The determined minimum and maximum values may then be cached, such that they are available in the future when that same zoom level is requested by the user or other users, saving the system from recalculation of the same minimum and maximum value to include on the chart (possibly from multiple data points at each pixel time range). For each individual pixel, a line may be rendered from the maximum value to the minimum value. If the granularity of the measured data matches the time range of an individual pixel, then the maximum value and the minimum value may be the same. In one embodiment, the computing system may display the graph at the closest zoom level at which maximum and minimum values have been cached to ensure that the cached data can be used effectively.
One aspect of the disclosure provides a computing system configured to access one or more databases in substantially real-time in response to input from a user provided in an interactive user interface in order to determine information related to measured data points and provide the determined information to the user in the interactive user interface. The computing system comprises a computer processor. The computing system further comprises a database storing at least first sensor values for a first sensor at each of a plurality of times and second sensor values for a second sensor at each of a plurality of times. The computing system further comprises a computer readable storage medium storing program instructions configured for execution by the computer processor in order to cause the computing system to generate user interface data for rendering the interactive user interface on a computing device, the interactive user interface including a first container and a second container, where the first container includes a first graph and the second container includes a second graph, where the first container and the second container have a same width, where the first graph includes first sensor values for the first sensor over a first time period and the second graph includes second sensor values for the second sensor over a second time period that is shorter than the first time period, and wherein portions of the first graph and the second graph are each selectable by the user; receive an identification of a selection by the user of a first data point in the first graph, where the first data point corresponds to a first time range; update the user interface data such that the interactive user interface includes a first marker at a location of the first data point in the first graph; access the database to determine a second sensor value that corresponds to a beginning of the first time range and a second sensor value that corresponds to an end of the first time range; and update the user interface data to include a second marker at a location of a second data point in the second graph that corresponds to the beginning of the first time range and a third marker at a location of a third data point in the second graph that corresponds to the end of the first time range.
The computing system of the preceding paragraph can have any sub-combination of the following features: where the instructions are further configured to cause the computing system to: receive an indication from the user of a change to the first time period in the first graph, in response to receiving the indication from the user of the change to the first time period, adjust positions of the first and second markers indicating the first time period in the second graph; where the computer readable storage medium further stores program instructions that cause the computing system to update the user interface data to include a third container, where the third container includes a list of events that occurred within the first time range; where the first graph, for each event that occurred within the first time range, includes a mark that indicates a data point on the first graph that corresponds with a time that the respective event occurred; where the computer readable storage medium further stores program instructions that cause the computing system to update the user interface data to include a marker at a location in the first graph corresponding to a first event in the list of events in response to selection by the user of a location in the third container that corresponds to the first event; where the computer readable storage medium further stores program instructions that cause the computing system to: receive an indication by the user of a selection in the first graph at a fourth data point such that a new event is added at a time that corresponds with the fourth data point, and update the user interface data such that the third container includes an identification of the new event; where the computer readable storage medium further stores program instructions that cause the computing system to: receive an indication by the user that the new event corresponds with the first graph, and update the user interface data such that a first mark is displayed in the first graph at the time that corresponds with the fourth data point; where the computer readable storage medium further stores program instructions that cause the computing system to: receive an indication by the user that the new event corresponds with the second graph, and update the user interface data such that a first mark is displayed in the second graph at the time that corresponds with the fourth data point; where the computer readable storage medium further stores program instructions that cause the computing system to: receive an indication by the user that the new event corresponds with the first graph and the second graph, and update the user interface data such that a first mark is displayed in the first graph at the time that corresponds with the fourth data point and in the second graph at the time that corresponds with the fourth data point; where the computer readable storage medium further stores program instructions that cause the computing system to: receive an indication of selection by the user of a first event in the list of events, and update the user interface data such that the first graph includes an icon at a position of a data point in the first graph that corresponds with the first event; where the computer readable storage medium further stores program instructions that cause the computing system to: receive an indication of selection, by the user, of a first location corresponding to the first time in the first graph, and update the user interface data such that the first graph includes a marker at the location in the first graph corresponding to the first time; where the computer readable storage medium further stores program instructions that cause the computing system to update the user interface data such that the second graph includes a second marker at a location in the second graph corresponding to the first time; where the computer readable storage medium further stores program instructions that cause the computing system to: receive an indication of selection, by the user of a second location corresponding to a second time in the first graph, and update the user interface data such that the first graph includes the marker at the second location in the first graph corresponding to the second time; where the computer readable storage medium further stores program instructions that cause the computing system to update the user interface data such that the second graph includes the second marker at a location in the second graph corresponding to the second time; where the first data point comprises a line from a location in the first graph that corresponds with a highest value measured by the first sensor during the first time range to a location in the first graph that corresponds with a lowest value measured by the first sensor during the first time range; where the computer readable storage medium further stores program instructions that cause the computing system to receive an indication that a zoom level of the first graph is adjusted from a first zoom level to a second zoom level; where the computer readable storage medium further stores program instructions that cause the computing system to retrieve, from a cache, for a second time range that corresponds to a first pixel in an x-axis of the first graph, a highest value measured by the first sensor during the second time range and a lowest value measured by the first sensor during the second time range; where the computer readable storage medium further stores program instructions that cause the computing system to update the user interface data such that the first graph includes a line from a location in the first graph that corresponds with the highest value to a location in the first graph that corresponds with the lowest value; where the first sensor and the second sensor are oil well sensors; and where the first sensor values correspond to oil extracted from an oil well, and where the second sensor values correspond to water extracted from the oil well.
The present disclosure also comprises a computer program product, for example a non-transitory or transitory computer-readable medium, that comprises the program instructions recited in any of the appended claims, and/or comprises the program instructions disclosed in the present description. The present disclosure further comprises a method in which the steps recited in any of the appended claims, and/or the steps disclosed in the present description, are executed by one or more computing devices.
BRIEF DESCRIPTION OF THE DRAWINGS
FIG. 1 illustrates a user interface that displays a first time-series graph and a second time-series graph.
FIGS. 2A-B illustrate another user interface that displays the first time-series graph and the second time-series graph of FIG. 1.
FIGS. 3A-3D illustrate another user interface that displays the first time-series graph and the second time-series graph of FIG. 1.
FIGS. 4A-C illustrate another user interface that displays the first time-series graph and the second time-series graph of FIG. 1.
FIGS. 5A-B illustrate another user interface that displays the first time-series graph and the second time-series graph of FIG. 1.
FIGS. 6A-C illustrate another user interface that displays the first time-series graph and the second time-series graph of FIG. 1.
FIGS. 7A-C illustrate another user interface that displays the first time-series graph and the second time-series graph of FIG. 1.
FIGS. 8A-B illustrate another user interface that displays the first time-series graph and the second time-series graph of FIG. 1.
FIGS. 9A-E illustrate another user interface that displays the first time-series graph and the second time-series graph of FIG. 1.
FIGS. 10A-D illustrate a user interface that displays the first time-series graph and the second time-series graph of FIG. 1.
FIGS. 11A-D illustrate another user interface that displays interactive information about an oil well.
FIG. 12 illustrates another user interface that displays drill bit, hole depth, and rock layer information.
FIG. 13 is a flowchart depicting an illustrative operation of accessing one or more databases in substantially real-time in response to input from a user provided in an interactive user interface in order to determine information related to measured data points and provide the determined information to the user in the interactive user interface.
FIG. 14 illustrates a computer system with which certain methods discussed herein may be implemented, according to one embodiment.
DETAILED DESCRIPTION OF SPECIFIC EMBODIMENTS
Overview
As described above, it can become very difficult for the user to identify relevant data and perform an analysis when a database and/or a system of databases includes a large amount of data. This may be especially true if the user would like to compare two or more data sets over a specific period of time, where the data sets correspond to measurements taken by sensors in a system. In conventional systems, user interfaces may be generated that allow the user to view graphs of the data sets. However, it may be difficult or burdensome for the user to try to identify trends in the data and/or determine the reasons why a sensor acted in a given manner.
Accordingly, disclosed herein are various systems and methods for displaying various graphs in an interactive user interface. For example, a computing device (e.g., the computing system 1400 of FIG. 14 described below) may be configured to retrieve data from one or more databases and generate one or more interactive user interfaces. The one or more interactive user interfaces may display the retrieved data in one or more graphs, such as time-series or scatterplots. The user interface may be interactive in that a user may manipulate one graph, which causes an identical or nearly identical manipulation of another displayed graph in real-time. The manipulations may occur even if the displayed graphs include data across different time ranges. The user interface may also be interactive in that a user may select a portion of a graph (e.g., data across a certain time period) to view tangential data related to the selection (e.g., events that occurred during a time period represented by the selection).
The data in the graphs may be rendered in the interactive user interfaces according to a technique that efficiently uses the pixels that are available for displaying the graphs. For example, every individual pixel (in the x-axis of an x-y graph) may represent a time range (e.g., 1 day in February, 1 week in February, 1 month in 2014, etc.). Over the time range of an individual pixel, the computing system may determine a maximum value and a minimum value of the data to be displayed in the graph. If the granularity of the measured data matches the time range of an individual pixel (e.g., an individual pixel represents a time range of 1 hour and data was measured every hour), then the maximum value and the minimum value may be the same. For each individual pixel (in the x-axis), a line may be rendered from the maximum value to the minimum value (in the y-axis).
As described above, the graphs may be manipulated by the user. For example, the user may zoom into a portion of a graph. In an embodiment, the computing system predetermines each possible zoom level (or at least most commonly used zoom levels) and pre-calculates the maximum and minimum values for time periods associated with the minimum display resolution (e.g., each individual pixel in the x-axis may be associated with a time period) at separate possible zoom level. These pre-calculated maximum and minimum values may be cached, such that they may be retrieved as a user adjusts zoom levels in order to more rapidly update the graph to include the most granular data available at the particular zoom level. In one embodiment, if the user selects a zoom level having minimum time periods per pixel (or some other display unit) that has not been pre-cached, the computing system may display the graph at the closest zoom level at which maximum and minimum values have been cached to ensure that the cached data can be used effectively.
In some embodiments, the interactive user interfaces may include information about a system and sensors associated with the system. For example, the interactive user interfaces may include time-series graphs that display data measured by sensors associated with an oil well. The time-series (and/or any other graphs displayed in the user interface) may be manipulated by the user in any manner as described herein. While the disclosure is described herein with respect to time-series data measured by sensors associated with an oil well, this is not meant to be limiting. The various graphs described herein can depict any time-series data measured by sensors, not just sensors associated with an oil well. For example, the various graphs described herein can depict time-series data measured by outdoor or indoor temperature sensors, humidity sensors, sensors that measure water levels, sensors that measure traffic congestion, sensors that detect seismic activity, and/or the like. Furthermore, the various graphs described herein can depict any type of time-series data, not just time-series data derived from a sensor. For example, the various graphs described herein can depict healthcare data (e.g., pharmaceutical batch failure data over time, the number of claims filed over time, etc.), financial data (e.g., the price of a stock over time), polling data (e.g., the number of respondents that view an issue favorably in polls conducted over a period of time), census information (e.g., the population of a city over time), and/or the like. The time-series data depicted in the graphs and derived from any source can be manipulated by the user in any manner as described herein.
The systems and methods described herein may provide several benefits. For example, the systems and methods described herein may improve the usability of the user interface by providing graphs that can be manipulated by a user in a concurrent manner, thereby allowing the user to identify trends or other information associated with the graphs without having to separately manipulate each individual graph. As another example, the systems and methods described herein may reduce the processor load while the user is interacting with the user interfaces by predetermining each possible zoom level and pre-calculating the maximum and minimum values. The systems and methods described herein may also increase the processing speed as the computing system may not have to determine in real-time how a graph should be updated when the zoom level is changed. Rather, the computing system can retrieve the appropriate data from the cache to update the graph. As another example, the systems and methods described herein may reduce the latency in generating updated user interfaces as the zoom levels and maximum and minimum values may be predetermined and can be retrieved from cache rather than the databases that store the actual data (e.g., which could be located externally from the computing system). Thus, the systems and methods described herein may improve the usability of the user interface.
Examples of Manipulating Time-Series Graphs in an Interactive User Interface
FIG. 1 illustrates a user interface 100 that displays a time-series graph 110 and a time-series graph 120. As illustrated in FIG. 1, the time-series graph 110 plots water allocation data across several months. The time-series graph 120 plots temperature data across several years. While the time-series graph 110 and the time-series graph 120 are each illustrated as plotting a single type of data, this is merely for simplicity and not meant to be limiting. The time-series graph 110 and/or the time-series graph 120 can plot multiple types of data simultaneously. For example, the time-series graph 110 can plot both water allocation data across several months and bottom hole pressure data for the same time period. The depicting of the plotted data can be varied to distinguish between the different types of data plotted in a single time-series graph. The time-series graph 110 and/or 120 plots may be resized vertically, horizontally, diagonally, and/or the like. In an embodiment, not shown, the user interface 100 may include a button that, when selected, causes the computing system that generates the user interface 100 to request current or updated data from an external source for display in the graph 110 and/or the graph 120. In some embodiments, the water allocation data and the temperature data are measured by sensors associated with the same system (e.g., an oil well).
In an embodiment, the water allocation data was measured at a granularity that matches each individual pixel in the x-axis of the time-series graph 110. Thus, the maximum and minimum values of the water allocation data at each individual pixel may be the same and a single point (the size of a pixel in the x and y direction) may represent each water allocation measurement.
The temperature data, however, may be measured at a granularity that does not match each individual pixel in the x-axis of the time-series graph 120. For example, the temperature may have been measured every day, yet each individual pixel may represent a 2 week time period. Thus, the computing system that generates the user interface 100 may calculate the maximum and minimum temperature values for each 2 week time period between the beginning and the end of the time range associated with the time-series graph 120 (e.g., 2010 to 2014). For each individual pixel in the x-axis of the time-series graph 120, a line may be rendered from the maximum temperature value to the minimum temperature value.
FIGS. 2A-2B illustrate another user interface 200 that displays the time-series graph 110 and the time-series graph 120. As illustrated in FIG. 2A, a user may place a cursor 210 (e.g., a mouse pointer, a finger, etc.) over a portion of the time-series graph 120. For example, the user may select the portion of the time-series graph 120 at the location of the cursor 210. Because the temperature data may be measured at a granularity that does not match each individual pixel, the selected portion of the time-series graph 120 may correspond to a first time period (e.g., 1 month in the year 2013). Thus, selection of the portion of the time-series graph 120 at the location of the cursor 210 may include selecting all temperature values within the first time period.
In an embodiment, selection of the portion of the time-series graph 120 at the location of the cursor 210 causes a marker 220 to appear at the selection in the time-series graph 120, as illustrated in FIG. 2B. Furthermore, the selection of the portion of the time-series graph 120 at the location of the cursor 210 may cause a corresponding selection to be made and displayed in the time-series graph 110, e.g., water allocation data recorded over a same time period as is represented by the marker 220 with reference to temperate data. For example, markers 230A and 230B may be displayed in the time-series graph 110. The selection in the time-series graph 110 may correspond to the selection in the time-series graph 120 in that the water allocation values between markers 230A and 230B may have been measured over the first time period (e.g., during the same month in 2013 selected by marker 220).
The user interface 200 may further include a window 240 where users can provide or view notes associated with a particular sensor data or with sensor data at a particular time or time period. In the example of FIG. 2B, the window 240 includes notes associated with both graphs 110 and 120 during the selected time period, but as discussed further below, the user can choose to have note information on only a single chart displayed. In some embodiments, the notes can include actual measurement data associated with the corresponding graph. For example, in the embodiment of FIG. 2B, the window 240 includes water allocation maximum and minimum data during the selected time period, while window 250 includes temperature data for the selected time period.
FIGS. 3A-3D illustrate another user interface 300 that displays the time-series graph 110 and the time-series graph 120. As illustrated in FIG. 3A, a user may place the cursor 210 over a portion of the time-series graph 110. For example, the user may begin to select a portion of the time-series graph 110 at the location of the cursor 210. As illustrated in FIG. 3B, the user may drag the cursor 210, while the time-series graph 110 is selected, from left to right to complete the selection at the new location of the cursor 210. As the user is dragging the cursor 210, a marker 310A may appear in the time-series graph 110 to indicate where the selection began.
In an embodiment, as the selection of the end of the desired time period is made in graph 110, a second marker 310B appears in the time-series graph 110 to indicate an end of the time period, and marker 320 (or possibly two markers showing start and end of the time period, if the scale of graph 120 is such that the time period includes multiple pixels) is updated in response to changes in the time period selected in graph 110 such that the markers in each graph 110 and 120 indicate the same time period, even though the time series graphs are on a different time scale. Thus, the selected time period in the time-series graph 110 with reference to water allocation is automatically used to select a corresponding time period in the time-series graph 120 with reference to temperature values.
The user may indicate that all graphs or just a subset of graphs displayed in the user interface 300 should be synchronized or identically manipulated in a manner described herein (e.g., an identical manipulation such as a selection of a time period in one graph causing a selection of a corresponding time period in another graph). For example, if the user interface 300 displayed a third graph, the user may be provided with an option to synchronize the graph 110, the graph 120, and the third graph, the graph 110 and the third graph, or the graph 120 and the third graph. If, for example, the user selected to synchronize the graph 120 and the third graph, then any changes to the third graph by the user may also occur to the graph 120, but not to the graph 110. Likewise, any changes to the graph 110 by the user would not affect the graph 120 or the third graph.
In further embodiments, the user may elect to synchronize certain manipulations of a graph, but not other manipulations of a graph. For example, the user may select an option to synchronize the zoom level in two or more graphs, but not the time period displayed within the graphs. As illustrated in FIG. 3D, the user has selected an option to synchronize the zoom levels in the graph 110 and the graph 120 (e.g., the x-axis for both graphs 110 and 120 is at the same zoom level), however each graph is displaying data at a different period of time (e.g., the x-axis for graph 110 ranges from March to July and the x-axis for graph 120 ranges from January to May). If the user, for example, places a marker in the graph 110, the marker may appear in the graph 120 if the marker is placed at a time that appears on the x-axis for the graph 120 (e.g., if the marker is placed on April 1st, which also appears on the x-axis in the graph 120). If the user, as another example, manipulates the graph 110 by scrolling to the right, the graph 120 may be manipulated in the same way.
FIGS. 4A-4C illustrate another user interface 400 that displays the time-series graph 110 and the time-series graph 120. As illustrated in FIG. 4A, a user may place the cursor 210 over a portion of the time-series graph 120. For example, the user may hover over the portion of the time-series graph 120 at the location of the cursor 210. Hovering over the time-series graph 120 may cause the computing system to generate a marker 410 that is displayed in the time-series graph 120 at the location of the cursor 210, and which can be moved in response to movement, by the user, of the hovering cursor 210 over other portions of the graph 120. In addition, a corresponding marker 420 may be displayed in the time-series graph 110. The marker 420 may be located at a location in the time-series graph 110 that represents a water allocation value that was measured at a same time as a temperature value that falls within the time period represented by the marker 410.
In an embodiment, as the user moves the cursor 210 to different locations within the time-series graph 120, the marker 410 may follow the cursor 210. Furthermore, as illustrated in FIGS. 4B-4C, the marker 420 may also move such that the marker 420 continues to correspond to the marker 410 in a manner as described above. Because time scales of the two time-series graphs 110 and 120 are different, movement of the marker 420 may move at a faster rate than movement of the marker 410.
FIGS. 5A-5B illustrate another user interface 500 that displays the time-series graph 110 and the time-series graph 120. As illustrated in FIG. 5A, the time-series graph 110 and the time-series graph 120 include data plotted over the same time period (e.g., March to June). Furthermore, in this example the user may have selected water allocation values in the time-series graph 110 over a particular time period, represented by markers 510A-B, or the user may have selected temperature values in the time-series graph 120 over a time period, represented by markers 520A-B, causing the other time-series graph to display an automatically determined selection of the same time period.
In an embodiment, events (e.g., a manufacturing failure, a contamination event, etc.) may have occurred during the time period associated with the selections in the time-series graph 110 and the time-series graph 120 and/or annotations may be marked. The events that occurred and/or the annotations may be associated with the sensor that measured the water allocation values, the sensor that measured the temperature values, and/or other sensors that measured other data (not shown). Marks 530, 540, and 550 may identify a time at which an event occurred and/or an annotation is marked and/or a time range during which an event occurred and/or an annotation is marked. For example, the mark 530 may indicate that an event occurred or an annotation was marked at a time corresponding to the location of the mark 530 in the time-series graph 110, where the event or annotation is associated with the sensor that measured the water allocation values. Likewise, the mark 540 may indicate that an event occurred or an annotation was marked at a time corresponding to the location of the mark 540 in the time-series graph 110 (e.g., where the event or annotation is associated with the sensor that measured the water allocation values) and the mark 550 may indicate that an event occurred or an annotation was marked at a time corresponding to the location of the mark 550 in the time-series graph 120 (e.g., where the event or annotation is associated with the sensor that measured the temperature values). The marks 530, 540, and/or 550 can be represented in various ways. For example, if the event occurs or the annotation is marked at a specific time instant, the marks 530, 540, and/or 550 can be represented as vertical lines. If the event occurs or an annotation is marked during a range of time, the marks 530, 540, and/or 550 can be represented as blocks (e.g., rectangular blocks) that encompass the time range.
Furthermore, the user interface 500 may include an event information pane or notebook 560. The event information pane 560 may include information on the events that occurred (and/or annotations made by the user) corresponding to the sensors that measured the water allocation data, the temperature data, and/or other data (not shown). The information may include a time-series graph or sensor that the event or annotation is associated with, a time-series within the time-series graph that the event or annotation is associated with, a time that the event occurred (or that the annotation is associated with), and a description of the event or annotation itself, such as a description of the event or annotation provided by a human operator. In an embodiment, the event information pane 560 includes event or annotation information for any event that occurred during a time range for which data was collected and/or for any annotation marked within a time range for which data was collected. In another embodiment, the information displayed in the event information pane 560 is for events that occurred during the entire time range displayed (e.g., March to June) and/or for annotations marked during the entire time range displayed. In another embodiment, the information displayed in the event information pane 560 is for events that occurred during the selected portions (e.g., late April to late May, as represented by the markers 510A-B and 520A-B) and/or for annotations marked within the selected portions. The user interface may include controls that allow the user to select the desired time period for which event information should be included in the event information pane 560.
The event information pane 560 may display event and/or annotation information for every available time-series graph or just selected time-series graphs. For example, the user may use cursor 210 to select the time-series graph 120 (e.g., also referred to as "Graph 2") and not the time-series graph 110 (e.g., also referred to as "Graph 1"), as illustrated by the dark outline of time-series graph 120 in FIG. 5B. Selecting the time-series graph 120 may cause the event information pane 560 to only display the events and/or annotations that are associated with the time-series graph 120 (e.g., the sensor that measured the temperature values) during the currently selected time period associated with markers 520A and 520B. The event information pane 560 may also include a search field 570 that allows the user to search for and identify specific events and/or annotations that may have occurred or been marked within the currently displayed events (or among other events that are not displayed in some embodiments).
FIGS. 6A-6C illustrate another user interface 600 that displays the time-series graph 110 and the time-series graph 120. As illustrated in FIG. 6A, the time-series graph 120 has been selected by the user (as indicated by the dark outline around time-series graph 120). In this example, the user is hovering the cursor 210 over the time-series graph 120, causing the user interface 600 to display marker 610 at the location of the cursor 210. As described above, a marker 620 corresponding to the marker 610 may be displayed in the time-series graph 110 as a result.
As illustrated in FIG. 6B, the user may provide an instruction to add an event and/or an annotation at a time (or time range) that corresponds to the location of the cursor 210. For example, the user may right-click on a mouse, tap a touch screen, or press a keyboard hotkey to indicate that an event is to be added. Once the user interface 600 receives the instruction, the user interface 600 may display an add event window 630 that appears near a location where the event and/or annotation is to be added. The add event window 630 may be a pop-up window or may be a window that overlays the window displaying the time-series graphs 110 and 120.
In an embodiment, the user can specify a description of the event and/or annotation and a time-series within the time-series graph 120 that the event and/or annotation corresponds to within the add event window 630. As described above, the time-series graph 120 can depict multiple time-series data. However, the time-series graph 120 as illustrated in FIG. 6B only includes a single time-series (e.g., the temperature time-series data, also referred to as "Series 1"). Thus, the add event window 630 only provides an option to associate the event and/or annotation with the time-series depicted in the time-series graph 120. However, if the time-series graph 120 as illustrated in FIG. 6B included two or more time-series, then the add event window 630 would provide the option to specify that the event and/or annotation corresponds to the first time-series (e.g., the temperature time-series), a second time-series, a third time-series, and so on, and/or all time-series graphs or combinations of graphs that are displayed within the time-series graph 120. In many embodiments, each time-series graph is associated with a different sensor or other data source, while in other embodiments a time-series graph may be associated with multiple sensors or other data sources, such as to indicate derived values that are based on two or more sensor values (e.g., a ratio of temperature to pressure). In other embodiments, not shown, the user can specify that an event and/or annotation can be associated with time-series depicted in different time-series graphs (e.g., the time-series graph 110 and the time series-graph 120).
As illustrated in FIG. 6C, the user has specified that the new event and/or annotation is to correspond with the temperature sensor time-series data (illustrated in time-series graph 120). Accordingly, a mark 650 is placed in the time-series graph 120 at the corresponding time. Because the time-series graph 120 is still selected for display of event information, the event information pane 560 is updated to include information about the newly added event and/or annotation (e.g., "Event 2"). Note that former "Event 3" has now become "Event 4" because the events and/or annotations can be listed (and/or numbered) in chronological order and the newly added event or annotation occurs prior to "Event 4" represented by marker 550.
FIGS. 7A-7C illustrate another user interface 700 that displays the time-series graph 110 and the time-series graph 120. As illustrated in FIG. 7A, the time-series graph 120 has been selected by the user. Furthermore, the event information pane 560 includes two events: Event 2 that corresponds with the mark 650 and Event 4 that corresponds with the mark 550.
As illustrated in FIG. 7B, the user may hover over information about an event and/or annotation using the cursor 210. In the example of FIG. 7B, the user has hovered over the Event 2. In an embodiment, when the cursor 210 hovers over and/or is used to select an event and/or annotation, a marker is displayed at a location of the event and/or annotation in the corresponding time-series graph(s). For example, when the cursor 210 hovers over Event 2, a marker 710 is displayed at a location in the time-series graph 110 that corresponds with a time that the event and/or annotation occurred and/or a marker 720 is displayed at a location of the mark 650 in the time-series graph 120. In other embodiments, an event and/or annotation may be selected in any other manner and indications of the corresponding data on the time-series graphs may be indicated in other visual representations, such as an animated circular marker that changes size, blinks off and on, etc.
As illustrated in FIG. 7C, the user has moved the cursor over Event 4. When the cursor 210 hovers over Event 4, a marker 730 is displayed at a location in the time-series graph 110 that corresponds with a time that the event and/or annotation occurred and a marker 740 is displayed at a location of the mark 550 in the time-series graph 120.
FIGS. 8A-8B illustrate another user interface 800 that displays the time-series graph 110 and the time-series graph 120. In some embodiments, a physical component that is monitored by a sensor may begin to operate outside normal operating conditions. For example, the physical component may have encountered a mechanical issue that causes the physical component to operate at sub-optimal levels. In some cases, the abnormal performance of the physical component could cause a system slowdown or failure. Accordingly, the computing system that generates the user interface 800 may generate an alert to notify a human operator of the abnormal operation.
In an embodiment, the abnormal performance of the physical component is represented by sensor values that are outside of an expected range and an alert may be triggered when the sensor values are outside of the expected range. For example, an alert may be generated for a sensor that measures temperature values for a physical component of an oil well if the measured temperature values exceed certain levels (e.g., 200.degree. F.). Alerts may also be triggered based on a combination of sensor values. For example, an alert may be triggered if values associated with a first sensor (e.g., a temperature sensor) exceed certain values and values associated with a second sensor (e.g., a pressure sensor) do not exceed certain values. Triggering of alerts may initiate real-time (or substantially real-time) notifications to one or more users, such as via text messages, email, phone calls, etc. Thus, the alert may allow the user to make adjustments to the sensor and/or other system components in order to reduce impact of the physical component operating outside of its normal range. Alerts may be recorded and associated with a particular sensor and stored for display along side time-series graphs for the particular sensor in the future, such as in the notes or event information areas of the user interface.
The user interface 800 may display markers that indicate when an alert would be or should be triggered. For example, marker 810 may indicate an upper boundary at which point an alert may be triggered and marker 820 may indicate a lower boundary at which point an alert may be triggered. As illustrated in FIG. 8A, an alert was triggered in May as the water allocation values exceeded the value associated with the marker 810.
FIG. 8B illustrates an example recorded alert 830 that was triggered when the water allocation values exceeded the value associated with the marker 810. The user interface 800 may display the alert 830 if a user hovers over the portion of the time-series graph 110 that includes values that exceed the value associated with the marker 810 or that do not exceed the value associated with the marker 820.
FIGS. 9A-9E illustrate a user interface 900 that correlates time-series and scatterplot graphs. As illustrated in FIG. 9A, the user interface 900 includes a time-series graph 910. The user may use the cursor 210 to begin selecting a portion of the time-series graph 910.
As illustrated in FIG. 9B, the user, via the cursor 210, has selected a portion of the time-series graph 910 represented by markers 920 and 930. The selected portion of the time-series graph 910 represents water allocation values for a time period between late April and early June.
As illustrated in FIG. 9C, based on the selection in the time-series graph 910, a scatterplot 950 is displayed in the user interface 900. The scatterplot 950 may include temperature values plotted against pressure values. Each combination of temperature and pressure values may have been measured at a time within the time period corresponding to the selected portion of the time-series graph 910 (e.g., late April and early June). Thus, for every time increment in the time period, the computing system may retrieve a temperature value and a pressure value and generate the user interface 900 such that it plots the temperature value as a function of the pressure value.
In an embodiment, the water allocation values may be measured by a sensor associated with a system. The temperature values and the pressure values may also be measured by sensors associated with the same system.
As illustrated in FIG. 9D, the user can make a selection in the scatterplot 950 using the cursor 210. For example, the user can make a selection represented by box 960, where the box 960 includes various combinations of temperature and pressure values.
Once the user makes the selection in the scatterplot 950, the computing device may determine all times that the individual combinations of temperature and pressure values within the box 960 occurred. For example, while the combination of temperature and pressure values in the box 960 occurred during the time period between markers 920 and 930, the same combination of temperature and pressure values may have occurred at other times. Thus, the user interface 900 may indicate such times. As illustrated in FIG. 9E, markers 970A and 970B designate a first time period during which some or all combinations of temperature and pressure values in the box 960 occurred, markers 980A and 980B designate a second time period during which some or all combinations of temperature and pressure values in the box 960 occurred, and markers 990A and 990B designate a third time period during which some or all combinations of temperature and pressure values in the box 960 occurred. Alternatively or in addition, the portions of the time-series graph 910 that correspond with the times that the individual combinations of temperature and pressure values within the box 960 occurred can be bolded, highlighted, and/or otherwise annotated to indicate such times.
Example Use Case of an Interactive User Interface with Time-Series Graphs
FIGS. 10A-10D illustrate a user interface 1000 that provides interactive information about an oil well. As illustrated in FIG. 10A, the user interface 1000 includes a first window 1010 and a second window 1020. The window 1010 may be a navigation window that includes a list of selectable buttons that can be used to provide further information about the oil well. The window 1020 may be an informational window that provides details about the oil well, such as the well's age, the well's location, and/or the well's objectives.
As illustrated in FIG. 10B, the user may select a sensors button in the window 1010 using the cursor 210. The sensors button may retrieve data measured by the various sensors of the oil well. For example, the data may be retrieved from databases associated with the system that the sensors are associated with, and the data may be displayed in time-series graphs, scatterplot graphs, and/or the like as described herein.
As illustrated in FIG. 10C, after the sensors button is selected, the window 1020 may display various time-series graphs 1030 and 1040. The time-series graphs 1030 and/or 1040 may be manipulated in any manner as described herein with respect to FIGS. 1 through 9E. In addition, the user interface 1000 may display any number of time-series graphs, each of which may be manipulated in the manners described herein. For example, several time-series graphs (e.g., three, four, five, or more graphs) may be concurrently displayed on one or more display devices, each with differing (or identical) timescales for the corresponding sensor data displayed. According to the systems and methods discussed above, a user may select a particular time or time period on one of the displayed time-series graphs and, in response to such selection, the system automatically selects corresponding time periods in each of the other time-series graphs.
As illustrated in FIG. 10D, the user interface 1000 may also include an event information pane 1050 that provides event information for events that occurred and/or annotations that are related to the sensors that measured the data depicted in the time-series graphs 1030 and/or 1040.
FIGS. 11A-11D illustrate another user interface 1100 that provides interactive information about an oil well. As illustrated in FIG. 11A, the user interface 1100 includes the windows 1010 and 1020. In an embodiment, the user selects a maps button in the window 1010.
As illustrated in FIG. 11B, once the maps button is selected, the window 1020 displays a map showing a location of an oil well 1140, injectors 1110 and 1120, producer 1130, and/or other related components (not shown).
As illustrated in FIG. 11C, the user may hover and/or select one or more of the components depicted in the map to view more information. For example, the cursor 210 may hover over the injector 1110, which causes the user interface 1100 to display text associated with the injector 1110 in the window 1020 (e.g., "well communication between A01 and A1").
As illustrated in FIG. 11D, selecting a component may allow the user to view additional information about the component in the window 1020. For example, selection of the injector 1110 causes the user interface 1100 to provide more information about the injector 1110 (e.g., the injector's age, the injector's location, the injector's objectives, etc.). Furthermore, from the information displayed in FIG. 11D the user may select the sensors indicator in order to view one or more time-series graphs associated with sensor data of the selected component (a particular well in the example of FIG. 11D).
FIG. 12 illustrates another user interface 1200 that displays drill bit, hole depth, and rock layer information. As illustrated in FIG. 12, the user interface 1200 includes graph 1205 and window 1240. The graph 1205 may display a vertical position of an item (e.g., a drill bit) in an underground crevice or structure (e.g., an oil well) over a period of time in which a rock layer at the position of the item, a rock layer at the bottom of the underground crevice or structure (e.g., a hole depth), and/or events associated with the underground crevice or structure that have occurred during the period of time are indicated. For example, the graph 1205 may have an x-axis that represents time (e.g., in months), may have a y-axis that represents depth below the surface (e.g., in meters), and may display a vertical position of a drill bit in an oil well over a period of time. The graph 1205 may also display a rock layer at the position of the drill bit during the period of time, a rock layer at the bottom of the oil well during the period of time, and events associated with the oil well that occurred during the period of time.
As illustrated in FIG. 12, the graph 1205 includes a curve 1202 that represents a depth of the drill bit at each point in time. The graph 1205 further includes a curve 1204 that represents a depth of the bottom of the oil well at each point in time. For example, the drill bit may be used alone or as a part of a larger apparatus to drill into the ground to increase the depth of the oil well. Occasionally, the drill bit may be raised from the bottom of the oil well to the surface (e.g., to perform maintenance on the drill). Thus, the curve 1202 may rise and fall as drilling begins, ends, and restarts. However, the depth of the bottom of the oil well may not decrease (e.g., the depth may not decrease from 1000 m below the surface to 500 m below the surface) unless, for example, the hole in the oil well is filled in. Thus, the curve 1204 may remain static over time or continue to fall down along the y-axis.
Row 1210 identifies the different rock layers at a vertical position of the drill bit over time. For example, between February and mid-March, the drill bit may be at a depth that falls within rock layer 1212 (except for times in which the drill bit is at the surface, which is indicated by a blank space in the row 1210). After mid-March, the drill bit may briefly be at a depth that falls within rock layer 1214. However, prior to the beginning of April, the drill bit may be slowly raised to the surface. During this time, the drill bit may pass from the rock layer 1214 to the rock layer 1212 before reaching the surface, as indicated in the row 1210. Likewise, in May, the drill bit may reach a depth below the surface that falls within rock layer 1216, as indicated in the row 1210.
Row 1220 identifies the different rock layers at the bottom of the oil well over time. For example, the row 1220 may identify the deepest rock layer reached by the drill bit (assuming that the oil well is not filled in and that the deepest region reached by the drill bit corresponds with the depth of the bottom of the oil well). Thus, while the drill bit may be raised to the surface in mid-May, the row 1220 indicates that the rock layer 1216 is the rock layer at the depth of the bottom of the oil well.
Row 1230 identifies a time or time range at which various events 1231-1238 may have occurred in the period of time viewed within the graph 1205. Information on one or more of the events 1231-1238 may be provided in the window 1240. For example, the window 1240 may identify an event, a time that the event occurred, and/or a description of the event. Accordingly, a user may be able to identify times in which an oil well is not being drilled, reasons why such delays have occurred, and/or possible solutions for reducing such delays.
In further embodiments, not shown, additional data or curves can be included in the graph 1205. For example, a curve indicating levels of gamma radiation at the vertical position of the drill bit (e.g., a curve in which the y-axis value represents gamma radiation levels at the vertical position of the drill bit at a time instant and the x-axis value represents time), a curve indicating levels of gamma radiation at the bottom of the oil well (e.g., a curve in which the y-axis value represents gamma radiation levels at the bottom of the oil well at a time instant and the x-axis value represents time), a curve indicating levels of gamma radiation at a static or dynamic depth within the oil well (e.g., a curve in which the y-axis value represents gamma radiation levels at the static or dynamic depth and the x-axis value represents time), and/or the like may be included in the graph 1205.
Example Process Flow
FIG. 13 is a flowchart 1300 depicting an illustrative operation of accessing one or more databases in substantially real-time in response to input from a user provided in an interactive user interface in order to determine information related to measured data points and provide the determined information to the user in the interactive user interface. Depending on the embodiment, the method of FIG. 13 may be performed by various computing devices, such as by the computing system 1400 described below. Depending on the embodiment, the method of FIG. 13 may include fewer and/or additional blocks and the blocks may be performed in an order different than illustrated. While the flowchart 1300 is described with respect to having sensor data depicting in graphs, this is not meant to be limiting. The illustrative operation depicting in the flowchart 1300 can be implemented on any type of time-series data from any source.
In block 1302, user interface data for rendering an interactive user interface is generated. The interactive user interface may include a first graph in a first container and a second graph in a second container that has a same width as the first container. The first graph may include first sensor values over a first time period and the second graph may include second sensor values over a second time period.
In block 1304, an identification of a selection of a first data point in the first graph that corresponds to a first time range is received. The first time range could be determined based on a time range that corresponds with each individual pixel in an x-axis.
In block 1306, the user interface data is updated such that the interactive user interface includes a first marker at a location of the first data point in the first graph. The marker may be a vertical line that is temporarily displayed in the interactive user interface.
In block 1308, the database is accessed to determine a second sensor value that corresponds to a beginning of the first time range and a second sensor value that corresponds to an end of the first time range. For example, the second sensor value that corresponds to a beginning of the first time range may be a sensor value that was measured at a time that corresponds with the beginning of the first time range.
In block 1310, the user interface data is updated to include a second marker at a location of a second data point in the second graph that corresponds to the beginning of the first time range and a third marker at a location of a third data point in the second graph that corresponds to the end of the first time range. Thus, the user may be able to view, within the interactive user interface, first sensor values and second sensor values that were measured at the same time.
Implementation Mechanisms
According to one embodiment, the techniques described herein are implemented by one or more special-purpose computing devices. The special-purpose computing devices may be hard-wired to perform the techniques, or may include digital electronic devices such as one or more application-specific integrated circuits (ASICs) or field programmable gate arrays (FPGAs) that are persistently programmed to perform the techniques, or may include one or more general purpose hardware processors programmed to perform the techniques pursuant to program instructions in firmware, memory, other storage, or a combination. Such special-purpose computing devices may also combine custom hard-wired logic, ASICs, or FPGAs with custom programming to accomplish the techniques. The special-purpose computing devices may be desktop computer systems, server computer systems, portable computer systems, handheld devices, networking devices or any other device or combination of devices that incorporate hard-wired and/or program logic to implement the techniques.
Computing device(s) are generally controlled and coordinated by operating system software, such as iOS, Android, Chrome OS, Windows XP, Windows Vista, Windows 7, Windows 8, Windows Server, Windows CE, Unix, Linux, SunOS, Solaris, iOS, Blackberry OS, VxWorks, or other compatible operating systems. In other embodiments, the computing device may be controlled by a proprietary operating system. Conventional operating systems control and schedule computer processes for execution, perform memory management, provide file system, networking, I/O services, and provide a user interface functionality, such as a graphical user interface ("GUI"), among other things.
For example, FIG. 14 is a block diagram that illustrates a computer system 1400 upon which an embodiment may be implemented. For example, any of the computing devices discussed herein may include some or all of the components and/or functionality of the computer system 1400.
Computer system 1400 includes a bus 1402 or other communication mechanism for communicating information, and a hardware processor, or multiple processors, 1404 coupled with bus 1402 for processing information. Hardware processor(s) 1404 may be, for example, one or more general purpose microprocessors.
Computer system 1400 also includes a main memory 1406, such as a random access memory (RAM), cache and/or other dynamic storage devices, coupled to bus 1402 for storing information and instructions to be executed by processor 1404. Main memory 1406 also may be used for storing temporary variables or other intermediate information during execution of instructions to be executed by processor 1404. Such instructions, when stored in storage media accessible to processor 1404, render computer system 1400 into a special-purpose machine that is customized to perform the operations specified in the instructions. Main memory 1406 may also store cached data, such as zoom levels and maximum and minimum sensor values at each zoom level.
Computer system 1400 further includes a read only memory (ROM) 1408 or other static storage device coupled to bus 1402 for storing static information and instructions for processor 1404. A storage device 1410, such as a magnetic disk, optical disk, or USB thumb drive (Flash drive), etc., is provided and coupled to bus 1402 for storing information and instructions. For example, the storage device 1410 may store measurement data obtained from a plurality of sensors.
Computer system 1400 may be coupled via bus 1402 to a display 1412, such as a cathode ray tube (CRT) or LCD display (or touch screen), for displaying information to a computer user. For example, the display 1412 can be used to display any of the user interfaces described herein with respect to FIGS. 1 through 12. An input device 1414, including alphanumeric and other keys, is coupled to bus 1402 for communicating information and command selections to processor 1404. Another type of user input device is cursor control 416, such as a mouse, a trackball, or cursor direction keys for communicating direction information and command selections to processor 1404 and for controlling cursor movement on display 1412. This input device typically has two degrees of freedom in two axes, a first axis (e.g., x) and a second axis (e.g., y), that allows the device to specify positions in a plane. In some embodiments, the same direction information and command selections as cursor control may be implemented via receiving touches on a touch screen without a cursor.
Computing system 1400 may include a user interface module to implement and/or update (e.g., in response to the graph manipulations described herein) a GUI that may be stored in a mass storage device as executable software codes that are executed by the computing device(s). This and other modules may include, by way of example, components, such as software components, object-oriented software components, class components and task components, processes, functions, attributes, procedures, subroutines, segments of program code, drivers, firmware, microcode, circuitry, data, databases, data structures, tables, arrays, and variables.
In general, the word "module," as used herein, refers to logic embodied in hardware or firmware, or to a collection of software instructions, possibly having entry and exit points, written in a programming language, such as, for example, Java, Lua, C or C++. A software module may be compiled and linked into an executable program, installed in a dynamic link library, or may be written in an interpreted programming language such as, for example, BASIC, Perl, or Python. It will be appreciated that software modules may be callable from other modules or from themselves, and/or may be invoked in response to detected events or interrupts. Software modules configured for execution on computing devices may be provided on a computer readable medium, such as a compact disc, digital video disc, flash drive, magnetic disc, or any other tangible medium, or as a digital download (and may be originally stored in a compressed or installable format that requires installation, decompression or decryption prior to execution). Such software code may be stored, partially or fully, on a memory device of the executing computing device, for execution by the computing device. Software instructions may be embedded in firmware, such as an EPROM. It will be further appreciated that hardware modules may be comprised of connected logic units, such as gates and flip-flops, and/or may be comprised of programmable units, such as programmable gate arrays or processors. The modules or computing device functionality described herein are preferably implemented as software modules, but may be represented in hardware or firmware. Generally, the modules described herein refer to logical modules that may be combined with other modules or divided into sub-modules despite their physical organization or storage
Computer system 1400 may implement the techniques described herein using customized hard-wired logic, one or more ASICs or FPGAs, firmware and/or program logic which in combination with the computer system causes or programs computer system 1400 to be a special-purpose machine. According to one embodiment, the techniques herein are performed by computer system 1400 in response to processor(s) 1404 executing one or more sequences of one or more instructions contained in main memory 1406. Such instructions may be read into main memory 1406 from another storage medium, such as storage device 1410. Execution of the sequences of instructions contained in main memory 1406 causes processor(s) 1404 to perform the process steps described herein. In alternative embodiments, hard-wired circuitry may be used in place of or in combination with software instructions.
The term "non-transitory media," and similar terms, as used herein refers to any media that store data and/or instructions that cause a machine to operate in a specific fashion. Such non-transitory media may comprise non-volatile media and/or volatile media. Non-volatile media includes, for example, optical or magnetic disks, such as storage device 1410. Volatile media includes dynamic memory, such as main memory 1406. Common forms of non-transitory media include, for example, a floppy disk, a flexible disk, hard disk, solid state drive, magnetic tape, or any other magnetic data storage medium, a CD-ROM, any other optical data storage medium, any physical medium with patterns of holes, a RAM, a PROM, and EPROM, a FLASH-EPROM, NVRAM, any other memory chip or cartridge, and networked versions of the same.
Non-transitory media is distinct from but may be used in conjunction with transmission media. Transmission media participates in transferring information between non-transitory media. For example, transmission media includes coaxial cables, copper wire and fiber optics, including the wires that comprise bus 1402. Transmission media can also take the form of acoustic or light waves, such as those generated during radio-wave and infra-red data communications.
Various forms of media may be involved in carrying one or more sequences of one or more instructions to processor 1404 for execution. For example, the instructions may initially be carried on a magnetic disk or solid state drive of a remote computer. The remote computer can load the instructions into its dynamic memory and send the instructions over a telephone line using a modem. A modem local to computer system 1400 can receive the data on the telephone line and use an infra-red transmitter to convert the data to an infra-red signal. An infra-red detector can receive the data carried in the infra-red signal and appropriate circuitry can place the data on bus 1402. Bus 1402 carries the data to main memory 406, from which processor 1404 retrieves and executes the instructions. The instructions received by main memory 1406 may retrieve and execute the instructions. The instructions received by main memory 1406 may optionally be stored on storage device 1410 either before or after execution by processor 1404.
Computer system 1400 also includes a communication interface 1418 coupled to bus 1402. Communication interface 1418 provides a two-way data communication coupling to a network link 1420 that is connected to a local network 1422. For example, communication interface 1418 may be an integrated services digital network (ISDN) card, cable modem, satellite modem, or a modem to provide a data communication connection to a corresponding type of telephone line. As another example, communication interface 1418 may be a local area network (LAN) card to provide a data communication connection to a compatible LAN (or WAN component to communicated with a WAN). Wireless links may also be implemented. In any such implementation, communication interface 1418 sends and receives electrical, electromagnetic or optical signals that carry digital data streams representing various types of information.
Network link 1420 typically provides data communication through one or more networks to other data devices. For example, network link 1420 may provide a connection through local network 1422 to a host computer 1424 or to data equipment operated by an Internet Service Provider (ISP) 1426. ISP 1426 in turn provides data communication services through the world wide packet data communication network now commonly referred to as the "Internet" 1428. Local network 1422 and Internet 1428 both use electrical, electromagnetic or optical signals that carry digital data streams. The signals through the various networks and the signals on network link 1420 and through communication interface 1418, which carry the digital data to and from computer system 1400, are example forms of transmission media.
Computer system 1400 can send messages and receive data, including program code, through the network(s), network link 1420 and communication interface 1418. In the Internet example, a server 1430 might transmit a requested code for an application program through Internet 1428, ISP 1426, local network 1422 and communication interface 1418.
The received code may be executed by processor 1404 as it is received, and/or stored in storage device 1410, or other non-volatile storage for later execution.
Terminology
Each of the processes, methods, and algorithms described in the preceding sections may be embodied in, and fully or partially automated by, code modules executed by one or more computer systems or computer processors comprising computer hardware. The processes and algorithms may be implemented partially or wholly in application-specific circuitry.
The various features and processes described above may be used independently of one another, or may be combined in various ways. All possible combinations and subcombinations are intended to fall within the scope of this disclosure. In addition, certain method or process blocks may be omitted in some implementations. The methods and processes described herein are also not limited to any particular sequence, and the blocks or states relating thereto can be performed in other sequences that are appropriate. For example, described blocks or states may be performed in an order other than that specifically disclosed, or multiple blocks or states may be combined in a single block or state. The example blocks or states may be performed in serial, in parallel, or in some other manner. Blocks or states may be added to or removed from the disclosed example embodiments. The example systems and components described herein may be configured differently than described. For example, elements may be added to, removed from, or rearranged compared to the disclosed example embodiments.
Conditional language, such as, among others, "can," "could," "might," or "may," unless specifically stated otherwise, or otherwise understood within the context as used, is generally intended to convey that certain embodiments include, while other embodiments do not include, certain features, elements and/or steps. Thus, such conditional language is not generally intended to imply that features, elements and/or steps are in any way required for one or more embodiments or that one or more embodiments necessarily include logic for deciding, with or without user input or prompting, whether these features, elements and/or steps are included or are to be performed in any particular embodiment.
Any process descriptions, elements, or blocks in the flow diagrams described herein and/or depicted in the attached figures should be understood as potentially representing modules, segments, or portions of code which include one or more executable instructions for implementing specific logical functions or steps in the process. Alternate implementations are included within the scope of the embodiments described herein in which elements or functions may be deleted, executed out of order from that shown or discussed, including substantially concurrently or in reverse order, depending on the functionality involved, as would be understood by those skilled in the art.
It should be emphasized that many variations and modifications may be made to the above-described embodiments, the elements of which are to be understood as being among other acceptable examples. All such modifications and variations are intended to be included herein within the scope of this disclosure. The foregoing description details certain embodiments of the invention. It will be appreciated, however, that no matter how detailed the foregoing appears in text, the invention can be practiced in many ways. As is also stated above, it should be noted that the use of particular terminology when describing certain features or aspects of the invention should not be taken to imply that the terminology is being re-defined herein to be restricted to including any specific characteristics of the features or aspects of the invention with which that terminology is associated. The scope of the invention should therefore be construed in accordance with the appended claims and any equivalents thereof.
* * * * *
References
-
golemxiv.co.uk/2012/08/a-word-about-banks-and-the-laundering-of-drug-money
-
amnetblog.com/component/content/article/115-5-grate-tools-for-visualizing-your-twitter-followers.html
-
java.sun.com/developer/technicalArticles/J2SE/Desktop/javase6/modality/Jan
-
capdtron.files.wordpress.com/2013/01/outlook-2010-inside_out.pdf
-
bugzilla.mozilla.org/show_bug.cgi?id=18726
-
w3.org/TR/2012/WD-css3-ui-20120117/#resizing-amp-overflow
-
directionsmag.com/articles/retail-trade-area-analysis-using-the-huff-model/123411
-
subhub.com/articles/free-screen-capture-software
-
gis.planning.lacounty.gov/GIS-NET3_Public/Viewer.html
-
atlchris.com/191/grabup
-
jetscreenshot.com
-
keylines.com/wp-content/uploads/2014/03/KeyLines-White-Paper.pdf
-
-
-
kwout.com
-
mozilla.org/editor/ui_specs/FileSaveDialogs.html
-
mapbuilder.net
-
maps.yahoo.com
-
maps.bing.com
-
maps.google.com
-
msdn.microsoft.com/en-us/library/ff604039%28v=office.14%29.aspx
-
office.microsoft.com/en-us/visio-help/about-connecting-shapes-HP085050369.aspx
-
-
-
-
cf.ac.uk/socsi/resources/Levi_Final_Money_Laundering_Risks_egaming.pdf
-
blog.nitropdf.com/2008/03/04/trick-how-to-capture-a-screenshot-as-pdf-annotate-it-then-share
-
techcrunch.com/2013/05/15/deep-dive-with-the-new-google-maps-for-desktop-with-google-earth-integration-its-more-than-just-a-utility
-
online-tech-tips.com/free-software-downloads/share-files-folders-screenshots
-
oreilly.com/digitalmedia/2006/01/01/mac-os-x-screenshot-secrets.htmlpublishedJan
-
youtube.com/watch?v=JCgDW5bru9M
-
finsolinc.com/ANTI-MONEY%20LAUNDERING%20TRAINING%20GUIDES.pdf
-
stackoverflow.com/questions/17964681/refresh-css-ellipsis-when-resizing-container
-
searchdatamanagement.techtarget.com/definition/OLAP-cube
-
mashable.com/2007/08/24/web-screenshots
-
download.techsmith.com/snagit/docs/onlinehelp/enu/snagit_help.pdf
-
tuaw.com/2008/05/05/tuaw-faceoff-screenshot-apps-on-the-firing-line
-
en.wikipedia.org/w/index.php?title=Federated_database_system&oldid=571954221
-
appacts.com
-
apsalar.com
-
capptain.com
-
count.ly
-
distimo.com/app-analytics
-
flurry.com
-
google.com/analytics.index.html
-
azavea.com/blogs/newsletter/v4i4/kernel-density-capabilities-added-to-hunchlab
-
kontagent.com
-
localytics.com
-
mixpanel.com
-
support.mozilla.org/en-US/kb/applications-panel-set-how-firefox-handles-files
-
openwebanalytics.com
-
piwik.org
-
statcounter.com
-
testflightapp.com
-
trak.io
-
usermetrix.com/android-analytics
D00000
D00001
D00002
D00003
D00004
D00005
D00006
D00007
D00008
D00009
D00010
D00011
D00012

D00013

D00014

D00015

D00016

D00017

D00018

D00019

D00020

D00021

D00022

D00023

D00024

D00025

D00026

D00027

D00028

D00029
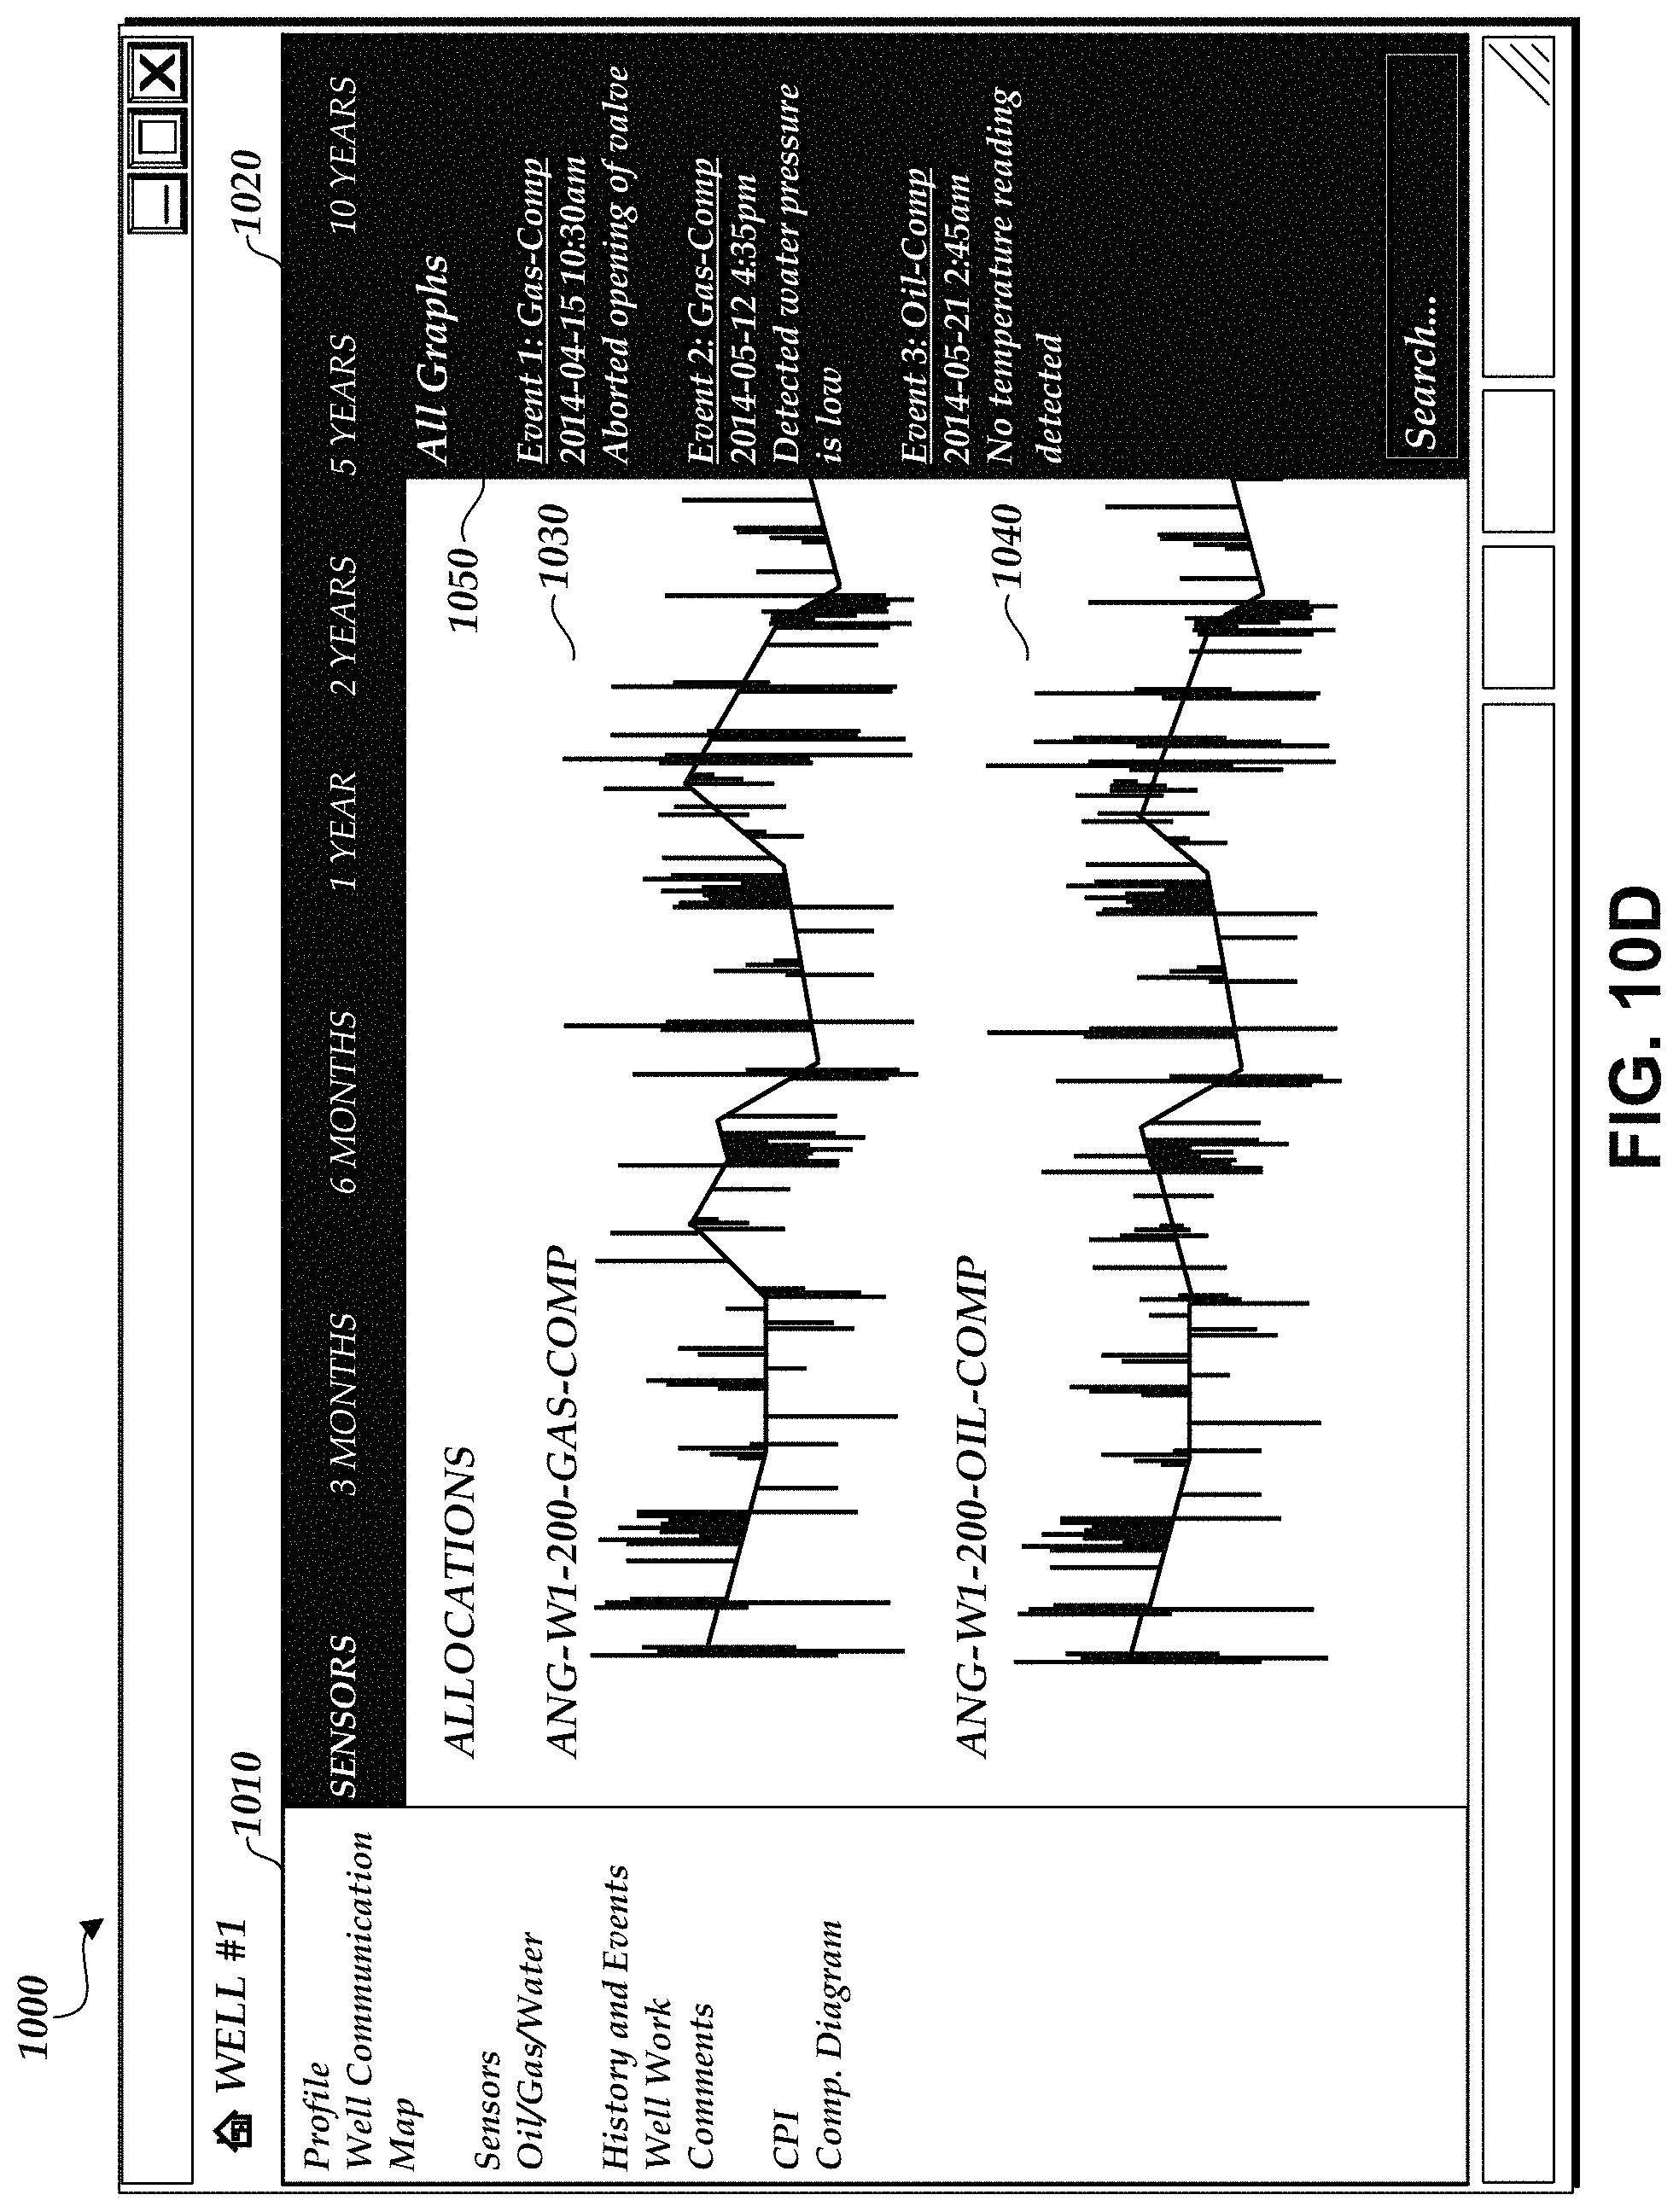
D00030

D00031

D00032

D00033

D00034

D00035

D00036

XML
uspto.report is an independent third-party trademark research tool that is not affiliated, endorsed, or sponsored by the United States Patent and Trademark Office (USPTO) or any other governmental organization. The information provided by uspto.report is based on publicly available data at the time of writing and is intended for informational purposes only.
While we strive to provide accurate and up-to-date information, we do not guarantee the accuracy, completeness, reliability, or suitability of the information displayed on this site. The use of this site is at your own risk. Any reliance you place on such information is therefore strictly at your own risk.
All official trademark data, including owner information, should be verified by visiting the official USPTO website at www.uspto.gov. This site is not intended to replace professional legal advice and should not be used as a substitute for consulting with a legal professional who is knowledgeable about trademark law.