Policy utilization analysis
Gupta , et al. January 26, 2
U.S. patent number 10,904,116 [Application Number 15/045,202] was granted by the patent office on 2021-01-26 for policy utilization analysis. This patent grant is currently assigned to CISCO TECHNOLOGY, INC.. The grantee listed for this patent is Cisco Technology, Inc.. Invention is credited to Khawar Deen, Shashidhar Gandham, Sunil Kumar Gupta, Ashutosh Kulshreshtha, Ali Parandehgheibi, Michael Standish Watts, Navindra Yadav.


| United States Patent | 10,904,116 |
| Gupta , et al. | January 26, 2021 |
Policy utilization analysis
Abstract
An example method according to some embodiments includes receiving flow data for a packet traversing a network. The method continues by determining a source endpoint group and a destination endpoint group for the packet. The method continues by determining that a policy was utilized, the policy being applicable to the endpoint group. Finally, the method includes updating utilization data for the policy based on the flow data.
| Inventors: | Gupta; Sunil Kumar (Milpitas, CA), Yadav; Navindra (Cupertino, CA), Watts; Michael Standish (Mill Valley, CA), Parandehgheibi; Ali (Sunnyvale, CA), Gandham; Shashidhar (Fremont, CA), Kulshreshtha; Ashutosh (Fremont, CA), Deen; Khawar (Sunnyvale, CA) | ||||||||||
|---|---|---|---|---|---|---|---|---|---|---|---|
| Applicant: |
|
||||||||||
| Assignee: | CISCO TECHNOLOGY, INC. (San
Jose, CA) |
||||||||||
| Appl. No.: | 15/045,202 | ||||||||||
| Filed: | February 16, 2016 |
Prior Publication Data
| Document Identifier | Publication Date | |
|---|---|---|
| US 20160359673 A1 | Dec 8, 2016 | |
Related U.S. Patent Documents
| Application Number | Filing Date | Patent Number | Issue Date | ||
|---|---|---|---|---|---|
| 62171899 | Jun 5, 2015 | ||||
| Current U.S. Class: | 1/1 |
| Current CPC Class: | G06F 16/2322 (20190101); H04L 63/0876 (20130101); H04L 45/66 (20130101); H04L 47/32 (20130101); H04L 63/0227 (20130101); G06F 3/04842 (20130101); G06F 16/285 (20190101); G06F 21/552 (20130101); H04L 41/16 (20130101); H04L 43/0882 (20130101); H04L 41/22 (20130101); H04L 67/36 (20130101); H04L 69/16 (20130101); G06F 16/235 (20190101); H04L 43/16 (20130101); H04L 43/0876 (20130101); H04L 67/42 (20130101); H04L 43/106 (20130101); H04L 43/12 (20130101); H04L 63/06 (20130101); G06F 16/288 (20190101); H04J 3/0661 (20130101); H04L 9/3242 (20130101); H04L 47/28 (20130101); H04L 41/0893 (20130101); H04L 67/10 (20130101); H04L 41/0668 (20130101); G06N 20/00 (20190101); G06F 16/1744 (20190101); H04L 63/1441 (20130101); G06F 21/53 (20130101); H04L 67/16 (20130101); G06F 16/174 (20190101); H04L 9/3239 (20130101); G06F 16/173 (20190101); H04L 41/12 (20130101); G06F 3/04847 (20130101); H04W 84/18 (20130101); H04L 43/08 (20130101); H04L 43/0829 (20130101); H04L 63/0263 (20130101); H04L 45/74 (20130101); H04L 67/12 (20130101); G06F 16/248 (20190101); H04L 45/507 (20130101); H04L 43/0888 (20130101); H04L 43/04 (20130101); H04L 43/062 (20130101); G06F 16/2365 (20190101); G06F 16/24578 (20190101); G06F 16/17 (20190101); G06F 16/137 (20190101); H04W 72/08 (20130101); H04L 43/10 (20130101); H04L 63/1408 (20130101); H04L 47/31 (20130101); H04L 63/1458 (20130101); H04L 43/045 (20130101); H04L 47/2483 (20130101); H04J 3/14 (20130101); H04L 43/02 (20130101); H04L 43/0805 (20130101); H04L 45/46 (20130101); H04L 63/145 (20130101); H04L 9/0866 (20130101); G06F 16/162 (20190101); G06F 16/122 (20190101); G06F 3/0482 (20130101); H04L 47/20 (20130101); G06F 9/45558 (20130101); H04L 1/242 (20130101); H04L 43/0811 (20130101); H04L 43/0864 (20130101); H04L 63/1433 (20130101); H04L 63/16 (20130101); H04L 61/2007 (20130101); H04L 47/11 (20130101); H04L 63/20 (20130101); H04L 43/0841 (20130101); H04L 45/306 (20130101); H04L 41/0816 (20130101); H04L 67/1002 (20130101); H04L 63/1425 (20130101); H04L 43/0858 (20130101); G06F 16/9535 (20190101); G06F 21/566 (20130101); G06F 16/1748 (20190101); H04L 41/0803 (20130101); H04L 47/2441 (20130101); H04L 45/38 (20130101); G06F 16/29 (20190101); H04L 63/1466 (20130101); G06N 99/00 (20130101); H04L 63/1416 (20130101); G06T 11/206 (20130101); H04L 69/22 (20130101); H04L 41/046 (20130101); H04L 41/0806 (20130101); G06F 2221/2145 (20130101); G06F 2009/4557 (20130101); G06F 2221/033 (20130101); G06F 2009/45587 (20130101); G06F 2009/45591 (20130101); G06F 2221/2101 (20130101); G06F 2221/2115 (20130101); H04L 67/22 (20130101); G06F 2009/45595 (20130101); G06F 2221/2105 (20130101); G06F 2221/2111 (20130101) |
| Current International Class: | H04L 12/26 (20060101); G06F 3/0482 (20130101); H04L 29/06 (20060101); G06F 9/455 (20180101); G06N 20/00 (20190101); G06F 21/55 (20130101); G06F 21/56 (20130101); G06F 16/28 (20190101); G06F 16/2457 (20190101); G06F 16/248 (20190101); G06F 16/29 (20190101); G06F 16/16 (20190101); G06F 16/17 (20190101); G06F 16/11 (20190101); G06F 16/13 (20190101); G06F 16/174 (20190101); G06F 16/23 (20190101); G06F 16/9535 (20190101); G06N 99/00 (20190101); H04L 9/32 (20060101); H04L 12/24 (20060101); G06T 11/20 (20060101); H04L 12/841 (20130101); H04L 12/725 (20130101); H04L 12/715 (20130101); H04L 12/723 (20130101); H04L 29/08 (20060101); H04L 12/851 (20130101); H04W 84/18 (20090101); G06F 21/53 (20130101); G06F 3/0484 (20130101); H04L 1/24 (20060101); H04W 72/08 (20090101); H04L 9/08 (20060101); H04J 3/06 (20060101); H04J 3/14 (20060101); H04L 29/12 (20060101); H04L 12/801 (20130101); H04L 12/813 (20130101); H04L 12/823 (20130101); H04L 12/741 (20130101); H04L 12/833 (20130101); H04L 12/721 (20130101) |
References Cited [Referenced By]
U.S. Patent Documents
| 5086385 | February 1992 | Launey et al. |
| 5319754 | June 1994 | Meinecke et al. |
| 5400246 | March 1995 | Wilson et al. |
| 5436909 | July 1995 | Dev et al. |
| 5555416 | September 1996 | Owens et al. |
| 5726644 | March 1998 | Jednacz et al. |
| 5742829 | April 1998 | Davis et al. |
| 5822731 | October 1998 | Schultz |
| 5831848 | November 1998 | Rielly et al. |
| 5903545 | May 1999 | Sabourin et al. |
| 6012096 | January 2000 | Link et al. |
| 6141595 | October 2000 | Gloudeman et al. |
| 6144962 | November 2000 | Weinberg et al. |
| 6239699 | May 2001 | Ronnen |
| 6247058 | June 2001 | Miller et al. |
| 6249241 | June 2001 | Jordan et al. |
| 6330562 | December 2001 | Boden et al. |
| 6353775 | March 2002 | Nichols |
| 6525658 | February 2003 | Streetman et al. |
| 6546420 | April 2003 | Lemler et al. |
| 6611896 | August 2003 | Mason, Jr. et al. |
| 6654750 | November 2003 | Adams et al. |
| 6728779 | April 2004 | Griffin et al. |
| 6801878 | October 2004 | Hintz et al. |
| 6816461 | November 2004 | Scrandis et al. |
| 6847993 | January 2005 | Novaes et al. |
| 6848106 | January 2005 | Hipp |
| 6925490 | August 2005 | Novaes et al. |
| 6958998 | October 2005 | Shorey |
| 6983323 | January 2006 | Cantrell et al. |
| 6996817 | February 2006 | Birum et al. |
| 6999452 | February 2006 | Drummond-Murray et al. |
| 7002464 | February 2006 | Bruemmer et al. |
| 7024468 | April 2006 | Meyer et al. |
| 7111055 | September 2006 | Falkner |
| 7120934 | October 2006 | Ishikawa |
| 7133923 | November 2006 | MeLampy et al. |
| 7181769 | February 2007 | Keanini et al. |
| 7185103 | February 2007 | Jain |
| 7203740 | April 2007 | Putzolu et al. |
| 7302487 | November 2007 | Ylonen et al. |
| 7337206 | February 2008 | Wen et al. |
| 7349761 | March 2008 | Cruse |
| 7353511 | April 2008 | Ziese |
| 7356679 | April 2008 | Le et al. |
| 7360072 | April 2008 | Soltis et al. |
| 7370092 | May 2008 | Aderton et al. |
| 7395195 | July 2008 | Suenbuel et al. |
| 7444404 | October 2008 | Wetherall et al. |
| 7466681 | December 2008 | Ashwood-Smith et al. |
| 7467205 | December 2008 | Dempster et al. |
| 7496040 | February 2009 | Seo |
| 7496575 | February 2009 | Buccella et al. |
| 7530105 | May 2009 | Gilbert et al. |
| 7539770 | May 2009 | Meier |
| 7568107 | July 2009 | Rathi et al. |
| 7610330 | October 2009 | Quinn et al. |
| 7633942 | December 2009 | Bearden et al. |
| 7644438 | January 2010 | Dash et al. |
| 7676570 | March 2010 | Levy et al. |
| 7681131 | March 2010 | Quarterman et al. |
| 7693947 | April 2010 | Judge et al. |
| 7743242 | June 2010 | Oberhaus et al. |
| 7752307 | July 2010 | Takara |
| 7783457 | August 2010 | Cunningham |
| 7787480 | August 2010 | Mehta et al. |
| 7788477 | August 2010 | Huang et al. |
| 7808897 | October 2010 | Mehta et al. |
| 7813822 | October 2010 | Hoffberg |
| 7844696 | November 2010 | Labovitz et al. |
| 7844744 | November 2010 | Abercrombie et al. |
| 7864707 | January 2011 | Dimitropoulos et al. |
| 7873025 | January 2011 | Patel et al. |
| 7873074 | January 2011 | Boland |
| 7874001 | January 2011 | Beck et al. |
| 7885197 | February 2011 | Metzler |
| 7895649 | February 2011 | Brook et al. |
| 7904420 | March 2011 | Ianni |
| 7930752 | April 2011 | Hertzog et al. |
| 7934248 | April 2011 | Yehuda et al. |
| 7957934 | June 2011 | Greifeneder |
| 7961637 | June 2011 | McBeath |
| 7970946 | June 2011 | Djabarov et al. |
| 7975035 | July 2011 | Popescu et al. |
| 8001610 | August 2011 | Chickering et al. |
| 8005935 | August 2011 | Pradhan et al. |
| 8040232 | October 2011 | Oh et al. |
| 8040822 | October 2011 | Proulx |
| 8115617 | February 2012 | Thubert et al. |
| 8135657 | March 2012 | Kapoor et al. |
| 8156430 | April 2012 | Newman |
| 8160063 | April 2012 | Maltz et al. |
| 8179809 | May 2012 | Eppstein et al. |
| 8185824 | May 2012 | Mitchell et al. |
| 8239365 | August 2012 | Salman |
| 8239915 | August 2012 | Satish et al. |
| 8250657 | August 2012 | Nachenberg et al. |
| 8255972 | August 2012 | Azagury et al. |
| 8266697 | September 2012 | Coffman |
| 8272875 | September 2012 | Jurmain |
| 8281397 | October 2012 | Vaidyanathan et al. |
| 8291495 | October 2012 | Burns et al. |
| 8296847 | October 2012 | Mendonca et al. |
| 8311973 | November 2012 | Zadeh |
| 8370407 | February 2013 | Devarajan et al. |
| 8381289 | February 2013 | Pereira et al. |
| 8391270 | March 2013 | Van Der Stok et al. |
| 8407164 | March 2013 | Malik et al. |
| 8407798 | March 2013 | Lotem et al. |
| 8442073 | May 2013 | Skubacz et al. |
| 8451731 | May 2013 | Lee et al. |
| 8462212 | June 2013 | Kundu et al. |
| 8489765 | July 2013 | Vasseur et al. |
| 8499348 | July 2013 | Rubin |
| 8516590 | August 2013 | Ranadive et al. |
| 8527977 | September 2013 | Cheng et al. |
| 8570861 | October 2013 | Brandwine et al. |
| 8572600 | October 2013 | Chung et al. |
| 8572734 | October 2013 | McConnell et al. |
| 8572735 | October 2013 | Ghosh et al. |
| 8588081 | November 2013 | Salam et al. |
| 8600726 | December 2013 | Varshney et al. |
| 8615803 | December 2013 | Dacier et al. |
| 8630316 | January 2014 | Haba |
| 8640086 | January 2014 | Bonev et al. |
| 8656493 | February 2014 | Capalik |
| 8661544 | February 2014 | Yen et al. |
| 8677487 | March 2014 | Balupari et al. |
| 8683389 | March 2014 | Bar-Yam et al. |
| 8706914 | April 2014 | Duchesneau |
| 8719452 | May 2014 | Ding et al. |
| 8719835 | May 2014 | Kanso et al. |
| 8750287 | June 2014 | Bui et al. |
| 8752042 | June 2014 | Ratica |
| 8755396 | June 2014 | Sindhu et al. |
| 8762951 | June 2014 | Kosche et al. |
| 8769084 | July 2014 | Westerfeld et al. |
| 8775577 | July 2014 | Alford et al. |
| 8776180 | July 2014 | Kumar et al. |
| 8812448 | August 2014 | Anderson et al. |
| 8812725 | August 2014 | Kulkarni |
| 8813236 | August 2014 | Saha et al. |
| 8825848 | September 2014 | Dotan et al. |
| 8832013 | September 2014 | Adams et al. |
| 8832461 | September 2014 | Saroiu et al. |
| 8849926 | September 2014 | Marzencki et al. |
| 8881258 | November 2014 | Paul et al. |
| 8887238 | November 2014 | Howard et al. |
| 8904520 | December 2014 | Nachenberg et al. |
| 8908685 | December 2014 | Patel et al. |
| 8914497 | December 2014 | Xiao et al. |
| 8931043 | January 2015 | Cooper et al. |
| 8954610 | February 2015 | Berke et al. |
| 8966021 | February 2015 | Allen |
| 8973147 | March 2015 | Pearcy et al. |
| 8990386 | March 2015 | He et al. |
| 8996695 | March 2015 | Anderson et al. |
| 8997227 | March 2015 | Mhatre et al. |
| 9014047 | April 2015 | Alcala et al. |
| 9015716 | April 2015 | Fletcher et al. |
| 9071575 | June 2015 | Lemaster et al. |
| 9088598 | July 2015 | Zhang et al. |
| 9110905 | August 2015 | Polley et al. |
| 9130836 | September 2015 | Kapadia et al. |
| 9160764 | October 2015 | Stiansen et al. |
| 9170917 | October 2015 | Kumar et al. |
| 9178906 | November 2015 | Chen et al. |
| 9191400 | November 2015 | Ptasinski et al. |
| 9197654 | November 2015 | Ben-Shalom et al. |
| 9225793 | December 2015 | Dutta et al. |
| 9237111 | January 2016 | Banavalikar et al. |
| 9246702 | January 2016 | Sharma et al. |
| 9246773 | January 2016 | Degioanni |
| 9253042 | February 2016 | Lumezanu et al. |
| 9253206 | February 2016 | Fleischman |
| 9258217 | February 2016 | Duffield et al. |
| 9281940 | March 2016 | Matsuda et al. |
| 9286047 | March 2016 | Avramov et al. |
| 9317574 | April 2016 | Brisebois et al. |
| 9319384 | April 2016 | Yan et al. |
| 9369435 | June 2016 | Short et al. |
| 9378068 | June 2016 | Anantharam et al. |
| 9405903 | August 2016 | Xie et al. |
| 9417985 | August 2016 | Baars et al. |
| 9418222 | August 2016 | Rivera et al. |
| 9426068 | August 2016 | Dunbar et al. |
| 9454324 | September 2016 | Madhavapeddi |
| 9462013 | October 2016 | Boss et al. |
| 9465696 | October 2016 | McNeil et al. |
| 9501744 | November 2016 | Brisebois et al. |
| 9531589 | December 2016 | Clemm et al. |
| 9563517 | February 2017 | Natanzon et al. |
| 9621413 | April 2017 | Lee |
| 9634915 | April 2017 | Bley |
| 9645892 | May 2017 | Patwardhan |
| 9684453 | June 2017 | Holt et al. |
| 9697033 | July 2017 | Koponen et al. |
| 9733973 | August 2017 | Prasad et al. |
| 9749145 | August 2017 | Banavalikar et al. |
| 9800608 | October 2017 | Korsunsky et al. |
| 9904584 | February 2018 | Konig et al. |
| 9916538 | March 2018 | Zadeh et al. |
| 9935851 | April 2018 | Gandham et al. |
| 10009240 | June 2018 | Rao et al. |
| 2001/0028646 | October 2001 | Arts et al. |
| 2002/0053033 | May 2002 | Cooper et al. |
| 2002/0097687 | July 2002 | Meiri et al. |
| 2002/0103793 | August 2002 | Koller et al. |
| 2002/0107857 | August 2002 | Teraslinna |
| 2002/0141343 | October 2002 | Bays |
| 2002/0184393 | December 2002 | Leddy et al. |
| 2003/0023601 | January 2003 | Fortier, Jr. et al. |
| 2003/0065986 | April 2003 | Fraenkel et al. |
| 2003/0097439 | May 2003 | Strayer et al. |
| 2003/0126242 | July 2003 | Chang |
| 2003/0145232 | July 2003 | Poletto et al. |
| 2003/0151513 | August 2003 | Herrmann et al. |
| 2003/0154399 | August 2003 | Zuk et al. |
| 2003/0177208 | September 2003 | Harvey, IV |
| 2004/0019676 | January 2004 | Iwatsuki |
| 2004/0030776 | February 2004 | Cantrell et al. |
| 2004/0213221 | October 2004 | Civanlar |
| 2004/0220984 | November 2004 | Dudfield et al. |
| 2004/0255050 | December 2004 | Takehiro et al. |
| 2004/0268149 | December 2004 | Aaron |
| 2005/0028154 | February 2005 | Smith et al. |
| 2005/0039104 | February 2005 | Shah et al. |
| 2005/0083933 | April 2005 | Fine et al. |
| 2005/0108331 | May 2005 | Osterman |
| 2005/0122325 | June 2005 | Twait |
| 2005/0138157 | June 2005 | Jung et al. |
| 2005/0166066 | July 2005 | Ahuja et al. |
| 2005/0177829 | August 2005 | Vishwanath |
| 2005/0182681 | August 2005 | Bruskotter et al. |
| 2005/0198247 | September 2005 | Perry et al. |
| 2005/0198371 | September 2005 | Smith et al. |
| 2005/0198629 | September 2005 | Vishwanath |
| 2005/0207376 | September 2005 | Ashwood-Smith et al. |
| 2005/0257244 | November 2005 | Joly et al. |
| 2005/0289244 | December 2005 | Sahu et al. |
| 2006/0048218 | March 2006 | Lingafelt et al. |
| 2006/0077909 | April 2006 | Saleh et al. |
| 2006/0080733 | April 2006 | Khosmood et al. |
| 2006/0089985 | April 2006 | Poletto |
| 2006/0095968 | May 2006 | Portolani et al. |
| 2006/0143432 | June 2006 | Rothman et al. |
| 2006/0156408 | July 2006 | Himberger et al. |
| 2006/0159032 | July 2006 | Ukrainetz et al. |
| 2006/0173912 | August 2006 | Lindvall et al. |
| 2006/0195448 | August 2006 | Newport |
| 2006/0212556 | September 2006 | Yacoby |
| 2006/0272018 | November 2006 | Fouant |
| 2006/0274659 | December 2006 | Ouderkirk |
| 2006/0280179 | December 2006 | Meier |
| 2006/0294219 | December 2006 | Ogawa et al. |
| 2007/0014275 | January 2007 | Bettink et al. |
| 2007/0025306 | February 2007 | Cox et al. |
| 2007/0044147 | February 2007 | Choi et al. |
| 2007/0097976 | May 2007 | Wood et al. |
| 2007/0118654 | May 2007 | Jamkhedkar et al. |
| 2007/0127491 | June 2007 | Verzijp et al. |
| 2007/0162420 | July 2007 | Ou et al. |
| 2007/0169179 | July 2007 | Narad |
| 2007/0195729 | August 2007 | Li et al. |
| 2007/0195794 | August 2007 | Fujita et al. |
| 2007/0195797 | August 2007 | Patel et al. |
| 2007/0201474 | August 2007 | Isobe |
| 2007/0211637 | September 2007 | Mitchell |
| 2007/0214348 | September 2007 | Danielsen |
| 2007/0230415 | October 2007 | Malik |
| 2007/0232265 | October 2007 | Park et al. |
| 2007/0250930 | October 2007 | Aziz et al. |
| 2007/0300061 | December 2007 | Kim et al. |
| 2008/0002697 | January 2008 | Anantharamaiah et al. |
| 2008/0022385 | January 2008 | Crowell et al. |
| 2008/0028389 | January 2008 | Genty et al. |
| 2008/0046708 | February 2008 | Fitzgerald et al. |
| 2008/0049633 | February 2008 | Edwards et al. |
| 2008/0082662 | April 2008 | Danliker et al. |
| 2008/0101234 | May 2008 | Nakil et al. |
| 2008/0120350 | May 2008 | Grabowski et al. |
| 2008/0126534 | May 2008 | Mueller et al. |
| 2008/0141246 | June 2008 | Kuck et al. |
| 2008/0155245 | June 2008 | Lipscombe et al. |
| 2008/0250122 | October 2008 | Zsigmond et al. |
| 2008/0270199 | October 2008 | Chess et al. |
| 2008/0282347 | November 2008 | Dadhia et al. |
| 2008/0295163 | November 2008 | Kang |
| 2008/0301765 | December 2008 | Nicol et al. |
| 2009/0059934 | March 2009 | Aggarwal et al. |
| 2009/0064332 | March 2009 | Porras et al. |
| 2009/0109849 | April 2009 | Wood et al. |
| 2009/0138590 | May 2009 | Lee et al. |
| 2009/0180393 | July 2009 | Nakamura |
| 2009/0241170 | September 2009 | Kumar et al. |
| 2009/0292795 | November 2009 | Ford et al. |
| 2009/0296593 | December 2009 | Prescott |
| 2009/0300180 | December 2009 | Dehaan et al. |
| 2009/0307753 | December 2009 | Dupont et al. |
| 2009/0313373 | December 2009 | Hanna et al. |
| 2009/0313698 | December 2009 | Wahl |
| 2009/0319912 | December 2009 | Serr et al. |
| 2009/0328219 | December 2009 | Narayanaswamy |
| 2010/0005288 | January 2010 | Rao et al. |
| 2010/0049839 | February 2010 | Parker et al. |
| 2010/0054241 | March 2010 | Shah et al. |
| 2010/0077445 | March 2010 | Schneider et al. |
| 2010/0095293 | April 2010 | O'Neill et al. |
| 2010/0095367 | April 2010 | Narayanaswamy |
| 2010/0095377 | April 2010 | Krywaniuk |
| 2010/0138526 | June 2010 | DeHaan et al. |
| 2010/0138810 | June 2010 | Komatsu et al. |
| 2010/0148940 | June 2010 | Gelvin et al. |
| 2010/0153316 | June 2010 | Duffield et al. |
| 2010/0153696 | June 2010 | Beachem et al. |
| 2010/0180016 | July 2010 | Bugwadia et al. |
| 2010/0194741 | August 2010 | Finocchio |
| 2010/0220584 | September 2010 | DeHaan et al. |
| 2010/0235514 | September 2010 | Beachem |
| 2010/0235879 | September 2010 | Burnside et al. |
| 2010/0235915 | September 2010 | Memon et al. |
| 2010/0287266 | November 2010 | Asati et al. |
| 2010/0303240 | December 2010 | Beachem |
| 2010/0306180 | December 2010 | Johnson et al. |
| 2010/0317420 | December 2010 | Hoffberg |
| 2010/0319060 | December 2010 | Aiken et al. |
| 2011/0004935 | January 2011 | Moffie et al. |
| 2011/0010585 | January 2011 | Bugenhagen et al. |
| 2011/0022641 | January 2011 | Werth et al. |
| 2011/0055381 | March 2011 | Narasimhan et al. |
| 2011/0055388 | March 2011 | Yumerefendi et al. |
| 2011/0066719 | March 2011 | Miryanov et al. |
| 2011/0069685 | March 2011 | Tofighbakhsh |
| 2011/0072119 | March 2011 | Bronstein et al. |
| 2011/0083125 | April 2011 | Komatsu et al. |
| 2011/0085556 | April 2011 | Breslin et al. |
| 2011/0103259 | May 2011 | Aybay et al. |
| 2011/0107074 | May 2011 | Chan et al. |
| 2011/0107331 | May 2011 | Evans et al. |
| 2011/0126275 | May 2011 | Anderson et al. |
| 2011/0145885 | June 2011 | Rivers |
| 2011/0153039 | June 2011 | Gvelesiani et al. |
| 2011/0153811 | June 2011 | Jeong et al. |
| 2011/0158088 | June 2011 | Lofstrand et al. |
| 2011/0170860 | July 2011 | Smith et al. |
| 2011/0173490 | July 2011 | Narayanaswamy et al. |
| 2011/0185423 | July 2011 | Sallam |
| 2011/0196957 | August 2011 | Ayachitula et al. |
| 2011/0202655 | August 2011 | Sharma et al. |
| 2011/0214174 | September 2011 | Herzog et al. |
| 2011/0225207 | September 2011 | Subramanian et al. |
| 2011/0228696 | September 2011 | Agarwal et al. |
| 2011/0238793 | September 2011 | Bedare et al. |
| 2011/0246663 | October 2011 | Melsen et al. |
| 2011/0283277 | November 2011 | Castillo et al. |
| 2011/0302652 | December 2011 | Westerfeld |
| 2011/0314148 | December 2011 | Petersen et al. |
| 2011/0317982 | December 2011 | Xu et al. |
| 2012/0005542 | January 2012 | Petersen et al. |
| 2012/0079592 | March 2012 | Pandrangi |
| 2012/0089664 | April 2012 | Igelka |
| 2012/0102361 | April 2012 | Sass et al. |
| 2012/0102543 | April 2012 | Kohli et al. |
| 2012/0110188 | May 2012 | Van Biljon et al. |
| 2012/0117226 | May 2012 | Tanaka et al. |
| 2012/0117642 | May 2012 | Lin et al. |
| 2012/0136996 | May 2012 | Seo et al. |
| 2012/0137278 | May 2012 | Draper et al. |
| 2012/0140626 | June 2012 | Anand et al. |
| 2012/0195198 | August 2012 | Regan |
| 2012/0197856 | August 2012 | Banka et al. |
| 2012/0198541 | August 2012 | Reeves |
| 2012/0216271 | August 2012 | Cooper et al. |
| 2012/0218989 | August 2012 | Tanabe et al. |
| 2012/0219004 | August 2012 | Balus et al. |
| 2012/0233348 | September 2012 | Winters |
| 2012/0233473 | September 2012 | Vasseur |
| 2012/0240232 | September 2012 | Azuma |
| 2012/0246303 | September 2012 | Petersen et al. |
| 2012/0254109 | October 2012 | Shukla et al. |
| 2012/0260227 | October 2012 | Shukla et al. |
| 2012/0278021 | November 2012 | Lin et al. |
| 2012/0281700 | November 2012 | Koganti et al. |
| 2012/0300628 | November 2012 | Prescott et al. |
| 2013/0003538 | January 2013 | Greenburg et al. |
| 2013/0003733 | January 2013 | Venkatesan et al. |
| 2013/0006935 | January 2013 | Grisby |
| 2013/0007435 | January 2013 | Bayani |
| 2013/0038358 | February 2013 | Cook et al. |
| 2013/0041934 | February 2013 | Annamalaisami et al. |
| 2013/0054682 | February 2013 | Malik et al. |
| 2013/0085889 | April 2013 | Fitting et al. |
| 2013/0086272 | April 2013 | Chen et al. |
| 2013/0103827 | April 2013 | Dunlap |
| 2013/0107709 | May 2013 | Campbell et al. |
| 2013/0124807 | May 2013 | Nielsen et al. |
| 2013/0125107 | May 2013 | Bandakka et al. |
| 2013/0145099 | June 2013 | Liu et al. |
| 2013/0148663 | June 2013 | Xiong |
| 2013/0159999 | June 2013 | Chiueh et al. |
| 2013/0173784 | July 2013 | Wang et al. |
| 2013/0179487 | July 2013 | Lubetzky et al. |
| 2013/0179879 | July 2013 | Zhang et al. |
| 2013/0198517 | August 2013 | Mazzarella |
| 2013/0198839 | August 2013 | Wei et al. |
| 2013/0201986 | August 2013 | Sajassi et al. |
| 2013/0205293 | August 2013 | Levijarvi et al. |
| 2013/0219161 | August 2013 | Fontignie et al. |
| 2013/0219500 | August 2013 | Lukas et al. |
| 2013/0232498 | September 2013 | Mangtani et al. |
| 2013/0242999 | September 2013 | Kamble et al. |
| 2013/0246925 | September 2013 | Ahuja et al. |
| 2013/0247201 | September 2013 | Alperovitch et al. |
| 2013/0254879 | September 2013 | Chesla et al. |
| 2013/0268994 | October 2013 | Cooper et al. |
| 2013/0275579 | October 2013 | Hernandez et al. |
| 2013/0283374 | October 2013 | Zisapel et al. |
| 2013/0290521 | October 2013 | Labovitz |
| 2013/0297771 | November 2013 | Osterloh et al. |
| 2013/0301472 | November 2013 | Allan |
| 2013/0304900 | November 2013 | Trabelsi et al. |
| 2013/0305369 | November 2013 | Karta et al. |
| 2013/0318357 | November 2013 | Abraham et al. |
| 2013/0326623 | December 2013 | Kruglick |
| 2013/0333029 | December 2013 | Chesla et al. |
| 2013/0336164 | December 2013 | Yang et al. |
| 2013/0346736 | December 2013 | Cook et al. |
| 2013/0347103 | December 2013 | Veteikis et al. |
| 2014/0006610 | January 2014 | Formby et al. |
| 2014/0006871 | January 2014 | Lakshmanan et al. |
| 2014/0012814 | January 2014 | Bercovici et al. |
| 2014/0019972 | January 2014 | Yahalom et al. |
| 2014/0031005 | January 2014 | Sumcad et al. |
| 2014/0033193 | January 2014 | Palaniappan |
| 2014/0036688 | February 2014 | Stassinopoulos et al. |
| 2014/0040343 | February 2014 | Nickolov et al. |
| 2014/0047185 | February 2014 | Peterson et al. |
| 2014/0047372 | February 2014 | Gnezdov et al. |
| 2014/0056318 | February 2014 | Hansson et al. |
| 2014/0059200 | February 2014 | Nguyen et al. |
| 2014/0074946 | March 2014 | Dirstine et al. |
| 2014/0089494 | March 2014 | Dasari et al. |
| 2014/0092884 | April 2014 | Murphy et al. |
| 2014/0096058 | April 2014 | Molesky et al. |
| 2014/0105029 | April 2014 | Jain et al. |
| 2014/0115219 | April 2014 | Ajanovic et al. |
| 2014/0129942 | May 2014 | Rathod |
| 2014/0137109 | May 2014 | Sharma et al. |
| 2014/0140213 | May 2014 | Raleigh |
| 2014/0140244 | May 2014 | Kapadia et al. |
| 2014/0143825 | May 2014 | Behrendt et al. |
| 2014/0149490 | May 2014 | Luxenberg et al. |
| 2014/0156814 | June 2014 | Barabash et al. |
| 2014/0156861 | June 2014 | Cruz-Aguilar et al. |
| 2014/0164607 | June 2014 | Bai et al. |
| 2014/0165200 | June 2014 | Singla |
| 2014/0173623 | June 2014 | Chang et al. |
| 2014/0192639 | July 2014 | Smirnov |
| 2014/0201717 | July 2014 | Mascaro et al. |
| 2014/0215573 | July 2014 | Cepuran |
| 2014/0215621 | July 2014 | Xaypanya et al. |
| 2014/0224784 | August 2014 | Kohler |
| 2014/0225603 | August 2014 | Auguste et al. |
| 2014/0233387 | August 2014 | Zheng et al. |
| 2014/0269777 | September 2014 | Rothstein et al. |
| 2014/0280499 | September 2014 | Basavaiah et al. |
| 2014/0281030 | September 2014 | Cui et al. |
| 2014/0286354 | September 2014 | Van De Poel et al. |
| 2014/0289854 | September 2014 | Mahvi |
| 2014/0298461 | October 2014 | Hohndel et al. |
| 2014/0307686 | October 2014 | Su et al. |
| 2014/0317278 | October 2014 | Kersch et al. |
| 2014/0317737 | October 2014 | Shin et al. |
| 2014/0330616 | November 2014 | Lyras |
| 2014/0331048 | November 2014 | Casas-Sanchez et al. |
| 2014/0331276 | November 2014 | Frascadore et al. |
| 2014/0331280 | November 2014 | Porras |
| 2014/0331304 | November 2014 | Wong |
| 2014/0348182 | November 2014 | Chandra et al. |
| 2014/0351203 | November 2014 | Kunnatur et al. |
| 2014/0351415 | November 2014 | Harrigan et al. |
| 2014/0359695 | December 2014 | Chari et al. |
| 2015/0006689 | January 2015 | Szilagyi et al. |
| 2015/0006714 | January 2015 | Jain |
| 2015/0009840 | January 2015 | Pruthi et al. |
| 2015/0033305 | January 2015 | Shear et al. |
| 2015/0036480 | February 2015 | Huang et al. |
| 2015/0036533 | February 2015 | Sodhi et al. |
| 2015/0039751 | February 2015 | Harrigan et al. |
| 2015/0046882 | February 2015 | Menyhart et al. |
| 2015/0052441 | February 2015 | Degioanni |
| 2015/0058976 | February 2015 | Carney et al. |
| 2015/0067143 | March 2015 | Babakhan et al. |
| 2015/0067786 | March 2015 | Fiske |
| 2015/0082151 | March 2015 | Liang et al. |
| 2015/0085665 | March 2015 | Kompella et al. |
| 2015/0095332 | April 2015 | Beisiegel et al. |
| 2015/0112933 | April 2015 | Satapathy |
| 2015/0113133 | April 2015 | Srinivas et al. |
| 2015/0124608 | May 2015 | Agarwal et al. |
| 2015/0124652 | May 2015 | Dharmapurikar et al. |
| 2015/0128205 | May 2015 | Mahaffey et al. |
| 2015/0138993 | May 2015 | Forster et al. |
| 2015/0142962 | May 2015 | Srinivas et al. |
| 2015/0195291 | July 2015 | Zuk et al. |
| 2015/0222939 | August 2015 | Gallant et al. |
| 2015/0249622 | September 2015 | Phillips et al. |
| 2015/0256555 | September 2015 | Choi et al. |
| 2015/0261842 | September 2015 | Huang et al. |
| 2015/0261886 | September 2015 | Wu et al. |
| 2015/0271008 | September 2015 | Jain et al. |
| 2015/0271255 | September 2015 | Mackay et al. |
| 2015/0295945 | October 2015 | Canzanese, Jr. et al. |
| 2015/0312233 | October 2015 | Graham, III et al. |
| 2015/0347554 | December 2015 | Vasantham et al. |
| 2015/0358352 | December 2015 | Chasin et al. |
| 2016/0006753 | January 2016 | McDaid et al. |
| 2016/0019030 | January 2016 | Shukla et al. |
| 2016/0020959 | January 2016 | Rahaman |
| 2016/0021131 | January 2016 | Heilig |
| 2016/0026552 | January 2016 | Holden et al. |
| 2016/0036636 | February 2016 | Erickson et al. |
| 2016/0036837 | February 2016 | Jain et al. |
| 2016/0050132 | February 2016 | Zhang et al. |
| 2016/0072815 | March 2016 | Rieke et al. |
| 2016/0080414 | March 2016 | Kolton et al. |
| 2016/0087861 | March 2016 | Kuan et al. |
| 2016/0094394 | March 2016 | Sharma et al. |
| 2016/0103692 | April 2016 | Guntaka et al. |
| 2016/0105350 | April 2016 | Greifeneder et al. |
| 2016/0112284 | April 2016 | Pon et al. |
| 2016/0119234 | April 2016 | Valencia Lopez et al. |
| 2016/0127395 | May 2016 | Underwood et al. |
| 2016/0147585 | May 2016 | Konig et al. |
| 2016/0162308 | June 2016 | Chen et al. |
| 2016/0162312 | June 2016 | Doherty et al. |
| 2016/0173535 | June 2016 | Barabash et al. |
| 2016/0183093 | June 2016 | Vaughn et al. |
| 2016/0205002 | July 2016 | Rieke et al. |
| 2016/0216994 | July 2016 | Sefidcon et al. |
| 2016/0217022 | July 2016 | Velipasaoglu et al. |
| 2016/0255082 | September 2016 | Rathod |
| 2016/0269424 | September 2016 | Chandola et al. |
| 2016/0269442 | September 2016 | Shieh |
| 2016/0269482 | September 2016 | Jamjoom et al. |
| 2016/0294691 | October 2016 | Joshi |
| 2016/0308908 | October 2016 | Kirby et al. |
| 2016/0337204 | November 2016 | Dubey et al. |
| 2016/0357424 | December 2016 | Pang et al. |
| 2016/0357546 | December 2016 | Chang et al. |
| 2016/0357587 | December 2016 | Yadav et al. |
| 2016/0357957 | December 2016 | Deen et al. |
| 2016/0359592 | December 2016 | Kulshreshtha et al. |
| 2016/0359628 | December 2016 | Singh et al. |
| 2016/0359658 | December 2016 | Yadav et al. |
| 2016/0359677 | December 2016 | Kulshreshtha et al. |
| 2016/0359678 | December 2016 | Madani et al. |
| 2016/0359679 | December 2016 | Parasdehgheibi et al. |
| 2016/0359680 | December 2016 | Parasdehgheibi et al. |
| 2016/0359686 | December 2016 | Parasdehgheibi et al. |
| 2016/0359695 | December 2016 | Yadav et al. |
| 2016/0359696 | December 2016 | Yadav et al. |
| 2016/0359697 | December 2016 | Scheib et al. |
| 2016/0359698 | December 2016 | Deen et al. |
| 2016/0359699 | December 2016 | Gandham et al. |
| 2016/0359700 | December 2016 | Pang et al. |
| 2016/0359701 | December 2016 | Pang et al. |
| 2016/0359703 | December 2016 | Gandham et al. |
| 2016/0359704 | December 2016 | Gandham et al. |
| 2016/0359705 | December 2016 | Parasdehgheibi et al. |
| 2016/0359708 | December 2016 | Gandham et al. |
| 2016/0359709 | December 2016 | Deen et al. |
| 2016/0359711 | December 2016 | Deen et al. |
| 2016/0359712 | December 2016 | Alizadeh Attar et al. |
| 2016/0359740 | December 2016 | Parasdehgheibi et al. |
| 2016/0359759 | December 2016 | Singh et al. |
| 2016/0359872 | December 2016 | Yadav et al. |
| 2016/0359877 | December 2016 | Kulshreshtha et al. |
| 2016/0359878 | December 2016 | Prasad et al. |
| 2016/0359879 | December 2016 | Deen et al. |
| 2016/0359880 | December 2016 | Pang et al. |
| 2016/0359881 | December 2016 | Yadav et al. |
| 2016/0359888 | December 2016 | Gupta et al. |
| 2016/0359889 | December 2016 | Yadav et al. |
| 2016/0359890 | December 2016 | Deen et al. |
| 2016/0359891 | December 2016 | Pang et al. |
| 2016/0359897 | December 2016 | Yadav et al. |
| 2016/0359905 | December 2016 | Touboul et al. |
| 2016/0359912 | December 2016 | Gupta et al. |
| 2016/0359913 | December 2016 | Gupta et al. |
| 2016/0359914 | December 2016 | Deen et al. |
| 2016/0359915 | December 2016 | Gupta et al. |
| 2016/0359917 | December 2016 | Rao et al. |
| 2016/0373481 | December 2016 | Sultan et al. |
| 2016/0380865 | December 2016 | Dubai et al. |
| 2017/0006141 | January 2017 | Bhadra |
| 2017/0024453 | January 2017 | Raja et al. |
| 2017/0032310 | February 2017 | Mimnaugh |
| 2017/0034018 | February 2017 | Parasdehgheibi et al. |
| 2017/0048121 | February 2017 | Hobbs et al. |
| 2017/0070582 | March 2017 | Desai et al. |
| 2017/0085483 | March 2017 | Mihaly et al. |
| 2017/0208487 | July 2017 | Ratakonda et al. |
| 2017/0250880 | August 2017 | Akens et al. |
| 2017/0250951 | August 2017 | Wang et al. |
| 2017/0289067 | October 2017 | Lu et al. |
| 2017/0295141 | October 2017 | Thubert et al. |
| 2017/0302691 | October 2017 | Singh et al. |
| 2017/0331747 | November 2017 | Singh et al. |
| 2017/0346736 | November 2017 | Chander et al. |
| 2017/0364380 | December 2017 | Frye, Jr. et al. |
| 2018/0006911 | January 2018 | Dickey |
| 2018/0007115 | January 2018 | Nedeltchev et al. |
| 2018/0013670 | January 2018 | Kapadia et al. |
| 2018/0145906 | May 2018 | Yadav et al. |
| 101093452 | Dec 2007 | CN | |||
| 101770551 | Jul 2010 | CN | |||
| 102521537 | Jun 2012 | CN | |||
| 103023970 | Apr 2013 | CN | |||
| 103716137 | Apr 2014 | CN | |||
| 104065518 | Sep 2014 | CN | |||
| 107196807 | Sep 2017 | CN | |||
| 0811942 | Dec 1997 | EP | |||
| 1076848 | Jul 2002 | EP | |||
| 1383261 | Jan 2004 | EP | |||
| 1450511 | Aug 2004 | EP | |||
| 2045974 | Apr 2008 | EP | |||
| 2043320 | Apr 2009 | EP | |||
| 2860912 | Apr 2015 | EP | |||
| 2887595 | Jun 2015 | EP | |||
| 2009-016906 | Jan 2009 | JP | |||
| 1394338 | May 2014 | KR | |||
| WO 2007/014314 | Feb 2007 | WO | |||
| WO 2007/070711 | Jun 2007 | WO | |||
| WO 2008/069439 | Jun 2008 | WO | |||
| WO 2013/030830 | Mar 2013 | WO | |||
| WO 2015/042171 | Mar 2015 | WO | |||
| WO 2016/004075 | Jan 2016 | WO | |||
| WO 2016/019523 | Feb 2016 | WO | |||
Other References
|
Lee, Sihyung, "Reducing Complexity of Large-Scale Network Configuration Management," Ph.D. Dissertation, Carnegie Mellon University, 2010. cited by applicant . Chari, Suresh et al., "Ensuring continuous compliance through reconciling policy with usage," Proceedings of the 18th ACM symposium on Access control models and technologies (SACMAT '13). ACM, New York, NY, USA, 49-60. cited by applicant . Australian Government Department of Defence, Intelligence and Security, "Top 4 Strategies to Mitigate Targeted Cyber Intrusions," Cyber Security Operations Centre Jul. 2013, http://www.asd.gov.au/infosec/top-mitigations/top-4-strategies-explained.- htm. cited by applicant . Author Unknown, "Blacklists & Dynamic Reputation: Understanding Why the Evolving Threat Eludes Blacklists," www.dambala.com, 9 pages, Dambala, Atlanta, GA, USA. cited by applicant . Aydin, Galip, et al., "Architecture and Implementation of a Scalable Sensor Data Storage and Analysis Using Cloud Computing and Big Data Technologies," Journal of Sensors, vol. 2015, Article ID 834217, Feb. 2015, 11 pages. cited by applicant . Backes, Michael, et al., "Data Lineage in Malicious Environments," IEEE 2015, pp. 1-13. cited by applicant . Bayati, Mohsen, et al., "Message-Passing Algorithms for Sparse Network Alignment," Mar. 2013, 31 pages. cited by applicant . Berezinski, Przemyslaw, et al., "An Entropy-Based Network Anomaly Detection Method," Entropy, 2015, vol. 17, www.mdpi.com/joumal/entropy, pp. 2367-2408. cited by applicant . Berthier, Robin, et al. "Nfsight: Netflow-based Network Awareness Tool," 2010, 16 pages. cited by applicant . Bhuyan, Dhiraj, "Fighting Bots and Botnets," 2006, pp. 23-28. cited by applicant . Blair, Dana, et al., U.S. Appl. No. 62/106,006, filed Jan. 21, 2015, entitled "Monitoring Network Policy Compliance." cited by applicant . Chandran, Midhun, et al., "Monitoring in a Virtualized Environment," GSTF International Journal on Computing, vol. 1, No. 1, Aug. 2010. cited by applicant . Chen, Xu, et al., "Automating network application dependency discovery: experiences, limitations, and new solutions," 8th USENIX conference on Operating systems design and implementation (OSDI'08), USENIX Association, Berkeley, CA, USA, 117-130. cited by applicant . Cisco Systems, "Cisco Network Analysis Modules (NAM) Tutorial," Cisco Systems, Inc., Version 3.5. cited by applicant . Cisco Systems, Inc., "Addressing Compliance from One Infrastructure: Cisco Unified Compliance Solution Framework," 2014. cited by applicant . Cisco Systems, Inc., "Cisco Application Dependency Mapping Service," 2009. cited by applicant . Cisco Systems, Inc., "White Paper--New Cisco Technologies Help Customers Achieve Regulatory Compliance," 1992-2008. cited by applicant . Cisco Systems, Inc., "A Cisco Guide to Defending Against Distributed Denial of Service Attacks," May 3, 2016, 34 pages. cited by applicant . Cisco Technology, Inc., "Cisco Lock-and-Key:Dynamic Access Lists," http://www/cicso.com/c/en/us/support/docs/security-vpn/lock-key/7604-13.h- tml; Updated Jul. 12, 2006, 16 pages. cited by applicant . Di Lorenzo, Guisy, et al., "EXSED: An Intelligent Tool for Exploration of Social Events Dynamics from Augmented Trajectories," Mobile Data Management (MDM), pp. 323-330, Jun. 3-6, 2013. cited by applicant . Feinstein, Laura, et al., "Statistical Approaches to DDoS Attack Detection and Response," Proceedings of the DARPA Information Survivability Conference and Exposition (DISCEX '03), Apr. 2003, 12 pages. cited by applicant . George, Ashley, et al., "NetPal: A Dynamic Network Administration Knowledge Base," 2008, pp. 1-14. cited by applicant . Goldsteen, Abigail, et al., "A Tool for Monitoring and Maintaining System Trustworthiness at Run Time," REFSQ (2015), pp. 142-147. cited by applicant . Hamadi, S., et al., "Fast Path Acceleration for Open vSwitch in Overlay Networks," Global Information Infrastructure and Networking Symposium (GIIS), Montreal, QC, pp. 1-5, Sep. 15-19, 2014. cited by applicant . Hewlett-Packard, "Effective use of reputation intelligence in a security operations center," Jul. 2013, 6 pages. cited by applicant . Hideshima, Yusuke, et al., "Starmine: A Visualization System for Cyber Attacks," http://www.researchgate.net/publication/221536306, Feb. 2006, 9 pages. cited by applicant . InternetPerils, Inc., "Control Your Internet Business Risk," 2003-2015, https://www.internetperils.com. cited by applicant . Janoff, Christian, et al., "Cisco Compliance Solution for HIPAA Security Rule Design and Implementation Guide," Cisco Systems, Inc., Updated Nov. 14, 2015, part 1 of 2, 350 pages. cited by applicant . Janoff, Christian, et al., "Cisco Compliance Solution for HIPAA Security Rule Design and Implementation Guide," Cisco Systems, Inc., Updated Nov. 14, 2015, part 2 of 2, 588 pages. cited by applicant . Kerrison, Adam, et al., "Four Steps to Faster, Better Application Dependency Mapping--Laying the Foundation for Effective Business Service Models," BMCSoftware, 2011. cited by applicant . Kraemer, Brian, "Get to know your data center with CMDB," TechTarget, Apr. 5, 2006, http://searchdatacenter.techtarget.com/news/118820/Get-to-know-y- our-data-center-with-CMDB. cited by applicant . Lab SKU, "VMware Hands-on Labs--HOL-SDC-1301" Version: 20140321-160709, 2013; http://docs.hol.vmware.com/HOL-2013/holsdc-1301_html_en/ (part 1 of 2). cited by applicant . Lab SKU, "VMware Hands-on Labs--HOL-SDC-1301" Version: 20140321-160709, 2013; http://docs.hol.vmware.com/HOL-2013/holsdc-1301_html_en/ (part 2 of 2). cited by applicant . Lachance, Michael, "Dirty Little Secrets of Application Dependency Mapping," Dec. 26, 2007. cited by applicant . Landman, Yoav, et al., "Dependency Analyzer," Feb. 14, 2008, http://lfrog.com/confluence/display/DA/Home. cited by applicant . Li, Ang, et al., "Fast Anomaly Detection for Large Data Centers," Global Telecommunications Conference (GLOBECOM 2010, Dec. 2010, 6 pages. cited by applicant . Li, Bingbong, et al, "A Supervised Machine Learning Approach to Classify Host Roles On Line Using sFlow," in Proceedings of the first edition workshop on High performance and programmable networking, 2013, ACM, New York, NY, USA, 53-60. cited by applicant . Liu, Ting, et al., "Impala: A Middleware System for Managing Autonomic, Parallel Sensor Systems," In Proceedings of the Ninth ACM SIGPLAN Symposium On Principles And Practice Of Parallel Programming(PPoPP '03), ACM, New York, NY, USA, Jun. 11-13, 2003, pp. 107-118. cited by applicant . Lu, Zhonghai, et al., "Cluster-based Simulated Annealing for Mapping Cores onto 2D Mesh Networks on Chip," Design and Diagnostics of Electronic Circuits and Systems, pp. 1, 6, 16-18, Apr. 2008. cited by applicant . Matteson, Ryan, "Depmap: Dependency Mapping of Applications Using Operating System Events: a Thesis," Master's Thesis, California Polytechnic State University, Dec., 2010. cited by applicant . Natarajan, Arun, et al., "NSDMiner: Automated Discovery of Network Service Dependencies," Institute of Electrical and Electronics Engineers INFOCOM, Feb. 2012, 9 pages. cited by applicant . Navaz, A.S. Syed, et al., "Entropy based Anomaly Detection System to Prevent DDoS Attacks in Cloud," International Journal of computer Applications (0975-8887), vol. 62, No. 15, Jan. 2013, pp. 42-47. cited by applicant . Neverfail, "Neverfail IT Continuity Architect," 2015, https://web.archive.org.web/20150908090456/http://www.neverfailgroup.com/- products/it-continuity-architect. cited by applicant . Nilsson, Dennis K., et al., "Key Management And Secure Software Updates In Wireless Process Control Environments," In Proceedings of the First ACM Conference On Wireless Network Security (WiSec '08), ACM, New York, NY, USA, Mar. 31-Apr. 2, 2008, pp. 100-108. cited by applicant . Nunnally, Troy, et al., "P3D: A Parallel 3D Coordinate Visualization for Advanced Network Scans," IEEE 2013, Jun. 9-13, 2013, 6 pages. cited by applicant . O'Donnell, Glenn, et al., "The CMDB Imperative: How to Realize the Dream and Avoid the Nightmares," Prentice Hall, Feb. 19, 2009. cited by applicant . Ohta, Kohei, et al., "Detection, Defense, and Tracking of Internet-Wide Illegal Access in a Distributed Manner," 2000, pp. 1-16. cited by applicant . Pathway Systems International Inc., "How Blueprints does Integration," Apr. 15, 2014, 9 pages, http://pathwaysystems.com/company-blog/. cited by applicant . Pathway Systems International Inc., "What is Blueprints?" 2010-2016, http://pathwaysystems.com/blueprints-about/. cited by applicant . Popa, Lucian, et al., "Macroscope: End-Point Approach to Networked Application Dependency Discovery," CoNEXT'09, Dec. 1-4, 2009, Rome, Italy, 12 pages. cited by applicant . Prasad, K. Munivara, et al., "An Efficient Detection of Flooding Attacks to Internet Threat Monitors (ITM) using Entropy Variations under Low Traffic," Computing Communication & Networking Technologies (ICCCNT '12), Jul. 26-28, 2012, 11 pages. cited by applicant . Sachan, Mrinmaya, et al., "Solving Electrical Networks to incorporate Supervision in Random Walks," May 13-17, 2013, pp. 109-110. cited by applicant . Sammarco, Matteo, et al., "Trace Selection for Improved WLAN Monitoring," Aug. 16, 2013, pp. 9-14. cited by applicant . Shneiderman, Ben, et al., "Network Visualization by Semantic Substrates," Visualization and Computer Graphics, vol. 12, No. 5, pp. 733, 740, Sep.-Oct. 2006. cited by applicant . Wang, Ru, et al., "Learning directed acyclic graphs via bootstarp aggregating," 2014, 47 pages, http://arxiv.org/abs/1406.2098. cited by applicant . Wang, Yongjun, et al., "A Network Gene-Based Framework for Detecting Advanced Persistent Threats," Nov. 2014, 7 pages. cited by applicant . Woodberg, Brad, "Snippet from Juniper SRX Series" Jun. 17, 2013, 1 page, O'Reilly Media, Inc. cited by applicant . Zhang, Yue, et al., "CANTINA: A Content-Based Approach to Detecting Phishing Web Sites," May 8-12, 2007, pp. 639-648. cited by applicant . Bosch, Greg, "Virtualization," 2010, 33 pages. cited by applicant . Breen, Christopher, "MAC 911, How to dismiss Mac App Store Notifications," Macworld.com, Mar. 24, 2014, 3 pages. cited by applicant . Chou, C.W., et al., "Optical Clocks and Relativity," Science vol. 329, Sep. 24, 2010, pp. 1630-1633. cited by applicant . Huang, Hing-Jie, et al., "Clock Skew Based Node Identification in Wireless Sensor Networks," IEEE, 2008, 5 pages. cited by applicant . Ives, Herbert, E., et al., "An Experimental Study of the Rate of a Moving Atomic Clock," Journal of the Optical Society of America, vol. 28, No. 7, Jul. 1938, pp. 215-226. cited by applicant . Witze, Alexandra, "Special relativity aces time trial, `Time dilation` predicted by Einstein confirmed by lithium ion experiment," Nature, Sep. 19, 2014, 3 pages. cited by applicant . Zatrochova, Zuzana, "Analysis and Testing of Distributed NoSQL Datastore Riak," Spring, 2015, 76 pages. cited by applicant . Bauch, Petr, "Reader's Report of Master's Thesis, Analysis and Testing of Distributed NoSQL Datastore Riak," May 28, 2015, Brno. 2 pages. cited by applicant . Heckman, Sarah, et al., "On Establishing a Benchmark for Evaluating Static Analysis Alert Prioritization and Classification Techniques," IEEE, 2008; 10 pages. cited by applicant . Kim, Myung-Sup, et al. "A Flow-based Method for Abnormal Network Traffic Detection," IEEE, 2004, pp. 599-612. cited by applicant . Thomas, R., "Bogon Dotted Decimal List," Version 7.0, Team Cymru NOC, Apr. 27, 2012, 5 pages. cited by applicant . Al-Fuqaha, Ala, et al., "Internet of Things: A Survey on Enabling Technologies, Protocols, and Applications," IEEE Communication Surveys & Tutorials. vol. 17, No. 4, Nov. 18, 2015, pp. 2347-2376. cited by applicant . Brocade Communications Systems, Inc., "Chapter 5--Configuring Virtual LANs (VLANs)," Jun. 2009, 38 pages. cited by applicant . Cisco Systems, Inc. "Cisco, Nexus 3000 Series NX-OS Release Notes, Release 5.0(3)U3(1)," Feb. 29, 2012, Part No. OL-26631-01, 16 pages. cited by applicant . Cisco Systems, Inc., "Cisco--VPN Client User Guide for Windows," Release 4.6, Aug. 2004, 148 pages. cited by applicant . Cisco Systems, Inc., "Cisco 4710 Application Control Engine Appliance Hardware Installation Guide," Nov. 2007, 66 pages. cited by applicant . Cisco Systems, Inc., "Cisco Data Center Network Architecture and Solutions Overview," Feb. 2006, 19 pages. cited by applicant . Cisco Systems, Inc., "Cisco IOS Configuration Fundamentals Configuration Guide: Using Autoinstall and Setup," Release 12.2, first published Apr. 2001, last updated Sep. 2003, 32 pages. cited by applicant . Cisco Systems, Inc., "Cisco VN-Link: Virtualization-Aware Networking," White Paper, Mar. 2009, 10 pages. cited by applicant . Cisco Systems, Inc., "Cisco, Nexus 5000 Series and Cisco Nexus 2000 Series Release Notes, Cisco NX-OS Release 5.1(3)N2(1b), NX-OS Release 5.1(3)N2(1a) and NX-OS Release 5.1(3)N2(1)," Sep. 5, 2012, Part No. OL-26652-03 CO, 24 pages. cited by applicant . Cisco Systems, Inc., "Nexus 3000 Series NX-OS Fundamentals Configuration Guide, Release 5.0(3)U3(1): Using PowerOn Auto Provisioning," Feb. 29, 2012, Part No. OL-26544-01, 10 pages. cited by applicant . Cisco Systems, Inc., "Quick Start Guide, Cisco ACE 4700 Series Application Control Engine Appliance," Software Ve740rsion A5(1.0), Sep. 2011, 138 pages. cited by applicant . Cisco Systems, Inc., "Routing and Bridging Guide, Cisco ACE Application Control Engine," Software Version A5(1.0), Sep. 2011, 248 pages. cited by applicant . Cisco Systems, Inc., "VMWare and Cisco Virtualization Solution: Scale Virtual Machine Networking," Jul. 2009, 4 pages. cited by applicant . Cisco Systems, Inc., "Cisco Remote Integrated Service Engine for Citrix NetScaler Appliances and Cisco Nexus 7000 Series Switches Configuration Guide," Last modified Apr. 29, 2014, 78 pages. cited by applicant . Cisco Technology, Inc., "Cisco IOS Software Release 12.4T Features and Hardware Support," Feb. 2009, 174 pages. cited by applicant . Cisco Systems, Inc., "Cisco Application Control Engine (ACE) Troubleshooting Guide--Understanding the ACE Module Architecture and Traffic Flow," Mar. 11, 2011, 6 pages. cited by applicant . Costa, Raul, et al., "An Intelligent Alarm Management System for Large-Scale Telecommunication Companies," In Portuguese Conference on Artificial Intelligence, Oct. 2009, 14 pages. cited by applicant . De Carvalho, Tiago Filipe Rodrigues, "Root Cause Analysis in Large and Complex Networks," Dec. 2008, Repositorio.ul.pt, pp. 1-55 cited by applicant . Foundation for Intelligent Physical Agents, "FIPA Agent Message Transport Service Specification," Dec. 3, 2002, http://www.fipa.org; 15 pages. cited by applicant . Gia, Tuan Nguyen, et al., "Fog Computing in Healthcare Internet of Things: A Case Study on ECG Feature Extraction," 2015 IEEE International Conference on Computer and Information Technology; Ubiquitous Computing and Communications; Dependable, Autonomic and Secure Computing; Pervasive Intelligence and Computing, Oct. 26, 2015, pp. 356-363. cited by applicant . Joseph, Dilip, et al., "Modeling Middleboxes," IEEE Network, Sep./Oct. 2008, pp. 20-25. cited by applicant . Kent, S., et al. "Security Architecture for the Internet Protocol," Network Working Group, Nov. 1998, 67 pages. cited by applicant . Online Collins English Dictionary, 1 page (Year: 2018). cited by applicant . Voris, Jonathan, et al., "Bait and Snitch: Defending Computer Systems with Decoys," Columbia University Libraries, Department of Computer Science, 2013, pp. 1-25. cited by applicant . Baek, Kwang-Hyun, et al., "Preventing Theft of Quality of Service on Open Platforms," 2005 Workshop of the 1.sup.st International Conference on Security and Privacy for Emerging Areas in Communication Networks, 2005, 12 pages. cited by applicant . Theodorakopoulos, George, et al., "On Trust Models and Trust Evaluation Metrics for Ad Hoc Networks," IEEE Journal on Selected Areas in Communications. vol. 24, Issue 2, Feb. 2006, pp. 318-328. cited by applicant . Zeng, Sai, et al., "Managing Risk in Multi-node Automation of Endpoint Management," 2014 IEEE Network Operations and Management Symposium (NOMS), 2014, 6 pages. cited by applicant. |
Primary Examiner: Chacko; Joe
Attorney, Agent or Firm: Polsinelli PC
Parent Case Text
RELATED APPLICATIONS
This application claims priority to U.S. Provisional Application No. 62/171,899, entitled "SYSTEM FOR MONITORING AND MANAGING DATACENTERS," filed 5 Jun. 2015, which is incorporated herein by reference in its entirety.
Claims
The invention claimed is:
1. A method comprising: receiving network traffic data relating to a transmission from a source and reception by a destination of a network; determining a source endpoint group and a destination endpoint group for the network traffic data; determining a policy from among a plurality of policies of the network that is applicable to the source endpoint group and the destination endpoint group; determining whether the policy was enforced by referencing a policy table to determine whether a packed was blocked or allowed; when the policy is determined to have been enforced, incrementing a counter of the policy table; and when the policy is determined to not have been enforced, providing an alert, wherein, the determining of whether the policy was enforced by referencing the policy table includes identifying a match associated with the policy table and the transmission; updating utilization data for the policy in the policy table based on the network traffic data and whether the policy was enforced; and presenting the utilization data by providing an indication of at least one of a number of flows, a number of packets, or a quantity of data received by the network in relation to a specified period of time during which the policy is applicable, the indication including a plurality of indications, the specified period of time including a plurality of times.
2. The method of claim 1, further comprising: reordering a first position of the policy within the policy table and a second position of a second policy within the policy table based on a comparison of the utilization data for the policy and second utilization data for the second policy.
3. The method of claim 1, further comprising: deleting the policy from the policy table based on the utilization data indicating that the policy has not been utilized for a period of time.
4. The method of claim 1, wherein the network traffic data comprises sensor data that is received from a network device, a hypervisor, and a virtual machine.
5. The method of claim 1, further comprising: receiving second network traffic data relating to transmission from a second source and reception by a second destination; determining that a second policy applicable to the second network traffic data denies connectivity between the second source and the second destination; determining that connectivity was allowed from the second source to the second destination; and providing an alert indicating that the second policy was not applied.
6. The method of claim 1, wherein the indication includes the number of flows, the number of packets, and the quantity of data received by the network over the specified period of time to which the policy is applicable.
7. A non-transitory computer-readable medium having computer readable instructions stored thereon that, when executed by a processor of a computer, cause the computer to: receive, via a network, source network traffic data for network packets sent by a source and destination network traffic data for network packets received by a destination from the source; determine a respective policy, from among a plurality of policies, of the network that is applicable to each flow described in the source network traffic data and the destination network traffic data; determine whether the respective policy was enforced by referencing a policy table to determine whether a packed was blocked or allowed; when the policy is determined to have been enforced, incrementing a counter of the policy table; and when the policy is determined to not have been enforced, providing an alert, wherein, the determining of whether the policy was enforced by referencing the policy table includes identifying a match associated with the policy table and the transmission; update utilization data, for the respective policy in the policy table, based on each flow and whether the policy was enforced; and present the utilization data by providing an indication of at least one of a number of flows, a number of packets, or a quantity of data received by the network in relation to a specified period of time during which the respective policy is applicable, the indication including a plurality of indications, the specified period of time including a plurality of times.
8. The non-transitory computer-readable medium of claim 7, wherein the instructions further cause the computer to: reorder a first position of the respective policy within the policy table and a second position of a second policy within the policy table based on a comparison of the utilization data.
9. The non-transitory computer-readable medium of claim 7, wherein the instructions further cause the computer to: delete the respective policy from the policy table based on the utilization data indicating that the respective policy has not been utilized for a period of time.
10. The non-transitory computer-readable medium of claim 7, wherein the source network traffic data describing each flow comprises sensor data that is received from a network device, a hypervisor, and a virtual machine.
11. The non-transitory computer-readable medium of claim 7, wherein the instructions further cause the computer to: receive to the network a second source network traffic data for network packets sent by a second source and a second destination network traffic data received by a second destination from the source; determine that a second policy, applicable to each flow described in the second destination network traffic data and the destination network traffic data sent from the source and received by the destination, denies connectivity between the second source and the second destination; determine that connectivity was allowed from the second source to the second destination based on the destination network traffic data; and provide an alert indicating that the second policy was not applied.
12. The non-transitory computer-readable medium of claim 7, wherein the indication includes the number of flows, the number of packets, and the quantity of data to which the respective policy is applicable.
13. A system comprising: a processor; a non-transitory computer-readable medium; and non-transitory computer-readable instructions stored on the computer-readable medium that, when executed by the processor, cause the system to: receive network traffic data relating to a transmission from a source and reception by a destination of a network; determine a source endpoint group and a destination endpoint group for the network traffic data; determine a policy from among a plurality of policies of the network that is applicable to the source endpoint group and the destination endpoint group; determine whether the policy was enforced by referencing a policy table to determine whether a packed was blocked or allowed; when the policy is determined to have been enforced, incrementing a counter of the policy table; and when the policy is determined to not have been enforced, providing an alert, wherein, the determining of whether the policy was enforced by referencing the policy table includes identifying a match associated with the policy table and the transmission; update utilization data for the policy in the policy table based on the network traffic data and whether the policy was enforced; and present the utilization data by providing an indication of at least one of a number of flows, a number of packets, or a quantity of data received by the network in relation to a specified period of time during which the policy is applicable, the indication including a plurality of indications, the specified period of time including a plurality of times.
14. The system of claim 13, wherein the non-transitory computer-readable instructions, when executed by the processor, further cause the system to: reorder a first position of the policy within the policy table and a second position of a second policy within the policy table based on a comparison of the utilization data for the policy and second utilization data for the second policy.
15. The system of claim 13, wherein the non-transitory computer-readable instructions, when executed by the processor, further cause the system to: delete the policy from the policy table based on the utilization data indicating that the policy has not been utilized for a period of time.
16. The system of claim 13, wherein the network traffic data comprises sensor data that is received from a network device, a hypervisor, and a virtual machine.
17. The system of claim 13, wherein the non-transitory computer-readable instructions, when executed by the processor, further cause the system to: receive second network traffic data relating to transmission from a second source and reception by a second destination; determine that a second policy applicable to the second network traffic data denies connectivity between the second source and the second destination; determine that connectivity was allowed from the second source and the second destination; and provide an alert indicating that the second policy was not applied.
Description
TECHNICAL FIELD
The present technology pertains to network policy management and more specifically pertains to network policy management based on analysis of policy utilization.
BACKGROUND
A network flow is conventionally characterized as one or more packets sharing certain attributes that are sent within a network within a specified period of time. Packet attributes can include a network source address (e.g., Internet Protocol (IP) address, Media Access Control (MAC) address, Domain Name System (DNS) name, or other network address), source port, destination address, destination port, protocol type, class of service, among other characteristics. The network source address may correspond to a first endpoint (e.g., modem, hub, bridge, switch, router, server, workstation, desktop computer, laptop computer, tablet, mobile phone, desk phone, wearable device, or other network or electronic device) of the network, and the network destination address may correspond to a second endpoint of the network. Network flow data is conventionally collected when a switch or a router forwards a packet, and thus, a switch or router interface can also be a packet attribute used to distinguish network flows. Network policies can determine whether a particular flow is allowed or denied by the network as well as a specific route by which a packet traverses the network. Policies can also be used to mark packets so that certain kinds of traffic receive differentiated service when used in combination with queuing techniques such as those based on priority, fairness, weighted fairness, token bucket, random early detection, round robin, among others. Network administrators typically create these policies and configure network devices to enforce them. Over time, policies can accumulate and become difficult and burdensome for the administrators to manage.
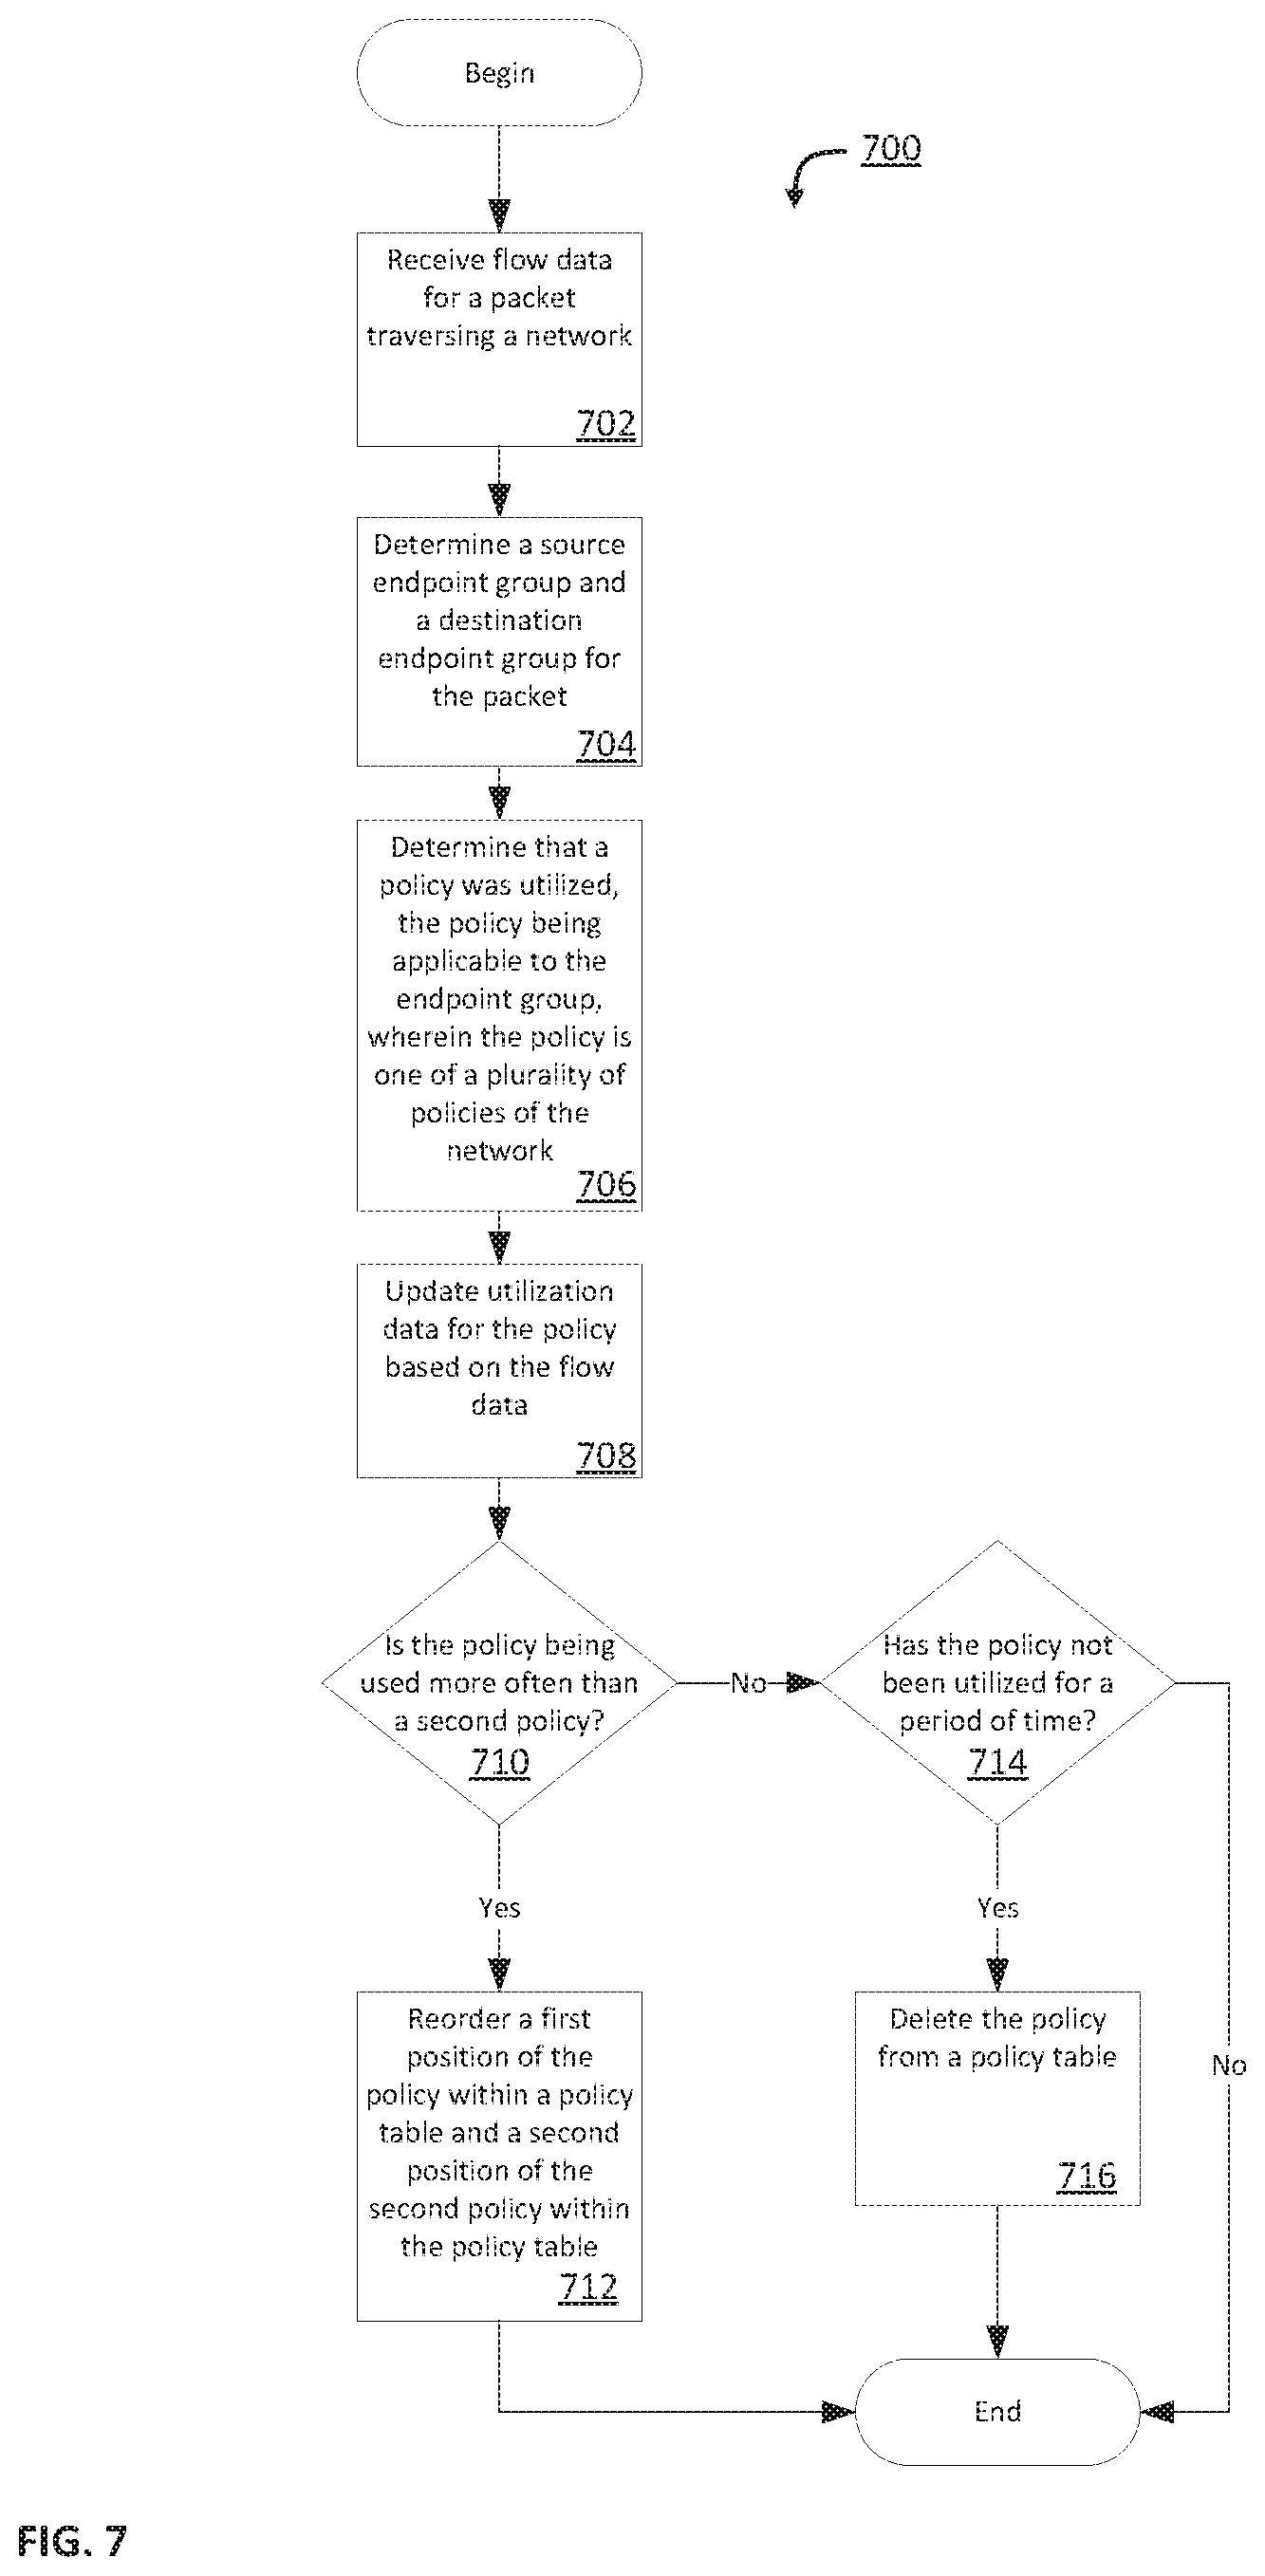
BRIEF DESCRIPTION OF THE FIGURES
In order to describe the manner in which the above-recited and other advantages and features of the disclosure can be obtained, a more particular description of the principles briefly described above will be rendered by reference to specific embodiments that are illustrated in the appended drawings. Understanding that these drawings depict only example embodiments of the disclosure and are not therefore to be considered to be limiting of its scope, the principles herein are described and explained with additional specificity and detail through the use of the accompanying drawings in which:
FIG. 1 shows an example network traffic monitoring system according to some embodiments;
FIG. 2 shows an example network according to some embodiments;
FIG. 3 shows an example policy table according to some embodiments;
FIG. 4 shows an example policy matrix according to some embodiments;
FIG. 5 shows an example policy use chart according to some embodiments;
FIG. 6 shows an example network structure according to some embodiments;
FIG. 7 shows an example process according to some embodiments; and
FIGS. 8A and 8B show example system embodiments.
DESCRIPTION OF EXAMPLE EMBODIMENTS
The detailed description set forth below is intended as a description of various configurations of example embodiments and is not intended to represent the only configurations in which the subject matter of this disclosure can be practiced. The appended drawings are incorporated herein and constitute a part of the detailed description. The detailed description includes specific details for the purpose of providing a more thorough understanding of the subject matter of this disclosure. However, it will be clear and apparent that the subject matter of this disclosure is not limited to the specific details set forth herein and may be practiced without these details. In some instances, structures and components are shown in block diagram form in order to avoid obscuring the concepts of the subject matter of this disclosure.
Overview
A network traffic monitoring system can determine the extent to which a network policy is utilized within a network. Understanding policy utilization can help network administrators and/or network management systems improve operation of the network. In an example embodiment, the network traffic monitoring system can continuously monitor network traffic. The network traffic monitoring system can determine one or more applicable policies for the network traffic and maintain statistics regarding those policies, such as a number of flows, number of packets, and/or number of bytes sent over a configurable time period associated with a particular policy that was enforced or failed to be enforced. The policy utilization statistics can be used to optimize ordering of policies in a policy table, remove unused policies, or provide insight to an analytics engine for recognizing threats to a network, network misconfiguration, or other harmful network traffic, among other possibilities.
Description
Various embodiments of the disclosure are discussed in detail below. While specific implementations are discussed, it should be understood that this is done for illustration purposes only. A person skilled in the relevant art will recognize that other components and configurations may be used without parting from the spirit and scope of the disclosure.
The disclosed technology addresses the need in the art for improved policy management and utilization detection in a data center.
FIG. 1 illustrates an example network traffic monitoring system 100 according to some example embodiments. Network traffic monitoring system 100 can include configuration and image manager 102, sensors 104, external data sources 106, collectors 108, analytics module 110, policy engine 112, and presentation module 116. These modules may be implemented as hardware and/or software components. Although FIG. 1 illustrates an example configuration of the various components of network traffic monitoring system 100, those of skill in the art will understand that the components of network traffic monitoring system 100 or any system described herein can be configured in a number of different ways and can include any other type and number of components. For example, sensors 104 and collectors 108 can belong to one hardware and/or software module or multiple separate modules. Other modules can also be combined into fewer components and/or further divided into more components.
Configuration and image manager 102 can provision and maintain sensors 104. In some example embodiments, sensors 104 can reside within virtual machine images, and configuration and image manager 102 can be the component that also provisions virtual machine images.
Configuration and image manager 102 can configure and manage sensors 104. When a new virtual machine is instantiated or when an existing one is migrated, configuration and image manager 102 can provision and configure a new sensor on the machine. In some example embodiments configuration and image manager 102 can monitor the health of sensors 104. For instance, configuration and image manager 102 may request status updates or initiate tests. In some example embodiments, configuration and image manager 102 can also manage and provision virtual machines.
In some example embodiments, configuration and image manager 102 can verify and validate sensors 104. For example, sensors 104 can be provisioned a unique ID that is created using a one-way hash function of its basic input/output system (BIOS) universally unique identifier (UUID) and a secret key stored on configuration and image manager 102. This UUID can be a large number that is difficult for an imposter sensor to guess. In some example embodiments, configuration and image manager 102 can keep sensors 104 up to date by installing new versions of their software and applying patches. Configuration and image manager 102 can obtain these updates automatically from a local source or the Internet.
Sensors 104 can reside on nodes of a data center network (e.g., virtual partition, hypervisor, physical server, switch, router, gateway, other network device, other electronic device, etc.). In general, a virtual partition may be an instance of a virtual machine (VM) (e.g., VM 104a), sandbox, container (e.g., container 104c), or any other isolated environment that can have software operating within it. The software may include an operating system and application software. For software running within a virtual partition, the virtual partition may appear to be a distinct physical server. In some example embodiments, a hypervisor (e.g., hypervisor 104b) may be a native or "bare metal" hypervisor that runs directly on hardware, but that may alternatively run under host software executing on hardware. Sensors 104 can monitor communications to and from the nodes and report on environmental data related to the nodes (e.g., node IDs, statuses, etc.). Sensors 104 can send their records over a high-speed connection to collectors 108 for storage. Sensors 104 can comprise a piece of software (e.g., running on a VM, container, virtual switch, hypervisor, physical server, or other device), an application-specific integrated circuit (ASIC) (e.g., a component of a switch, gateway, router, standalone packet monitor, or other network device including a packet capture (PCAP) module or similar technology), or an independent unit (e.g., a device connected to a network device's monitoring port or a device connected in series along a main trunk of a datacenter). It should be understood that various software and hardware configurations can be used as sensors 104. Sensors 104 can be lightweight, thereby minimally impeding normal traffic and compute resources in a datacenter. Sensors 104 can "sniff" packets being sent over its host network interface card (NIC) or individual processes can be configured to report traffic to sensors 104. This sensor structure allows for robust capture of granular (i.e., specific) network traffic data from each hop of data transmission.
As sensors 104 capture communications, they can continuously send network traffic data to collectors 108. The network traffic data can relate to a packet, a collection of packets, a flow, a group of flows, etc. The network traffic data can also include other details such as the VM BIOS ID, sensor ID, associated process ID, associated process name, process user name, sensor private key, geo-location of a sensor, environmental details, etc. The network traffic data can include information describing the communication on all layers of the Open Systems Interconnection (OSI) model. For example, the network traffic data can include signal strength (if applicable), source/destination MAC address, source/destination IP address, protocol, port number, encryption data, requesting process, a sample packet, etc.
In some example embodiments, sensors 104 can preprocess network traffic data before sending to collectors 108. For example, sensors 104 can remove extraneous or duplicative data or they can create a summary of the data (e.g., latency, packets and bytes sent per flow, flagged abnormal activity, etc.). In some example embodiments, sensors 104 can be configured to only capture certain types of connection information and disregard the rest. Because it can be overwhelming for a system to capture every packet in a network, in some example embodiments, sensors 104 can be configured to capture only a representative sample of packets (e.g., every 1,000th packet or other suitable sample rate).
Sensors 104 can send network traffic data to one or multiple collectors 108. In some example embodiments, sensors 104 can be assigned to a primary collector and a secondary collector. In other example embodiments, sensors 104 are not assigned a collector, but can determine an optimal collector through a discovery process. Sensors 104 can change where they send their network traffic data if their environments change, such as if a certain collector experiences failure or if a sensor is migrated to a new location and becomes closer to a different collector. In some example embodiments, sensors 104 can send different types of network traffic data to different collectors. For example, sensors 104 can send network traffic data related to one type of process to one collector and network traffic data related to another type of process to another collector.
Collectors 108 can serve as a repository for the data recorded by sensors 104. In some example embodiments, collectors 108 can be directly connected to a top of rack switch. In other example embodiments, collectors 108 can be located near an end of row switch. Collectors 108 can be located on or off premises. It will be appreciated that the placement of collectors 108 can be optimized according to various priorities such as network capacity, cost, and system responsiveness. In some example embodiments, data storage of collectors 108 is located in an in-memory database, such as dashDB by IBM. This approach benefits from rapid random access speeds that typically are required for analytics software. Alternatively, collectors 108 can utilize solid state drives, disk drives, magnetic tape drives, or a combination of the foregoing according to cost, responsiveness, and size requirements. Collectors 108 can utilize various database structures such as a normalized relational database or NoSQL database.
In some example embodiments, collectors 108 may only serve as network storage for network traffic monitoring system 100. In other example embodiments, collectors 108 can organize, summarize, and preprocess data. For example, collectors 108 can tabulate how often packets of certain sizes or types are transmitted from different nodes of a data center. Collectors 108 can also characterize the traffic flows going to and from various nodes. In some example embodiments, collectors 108 can match packets based on sequence numbers, thus identifying traffic flows and connection links. In some example embodiments, collectors 108 can flag anomalous data. Because it would be inefficient to retain all data indefinitely, in some example embodiments, collectors 108 can periodically replace detailed network traffic flow data with consolidated summaries. In this manner, collectors 108 can retain a complete dataset describing one period (e.g., the past minute or other suitable period of time), with a smaller dataset of another period (e.g., the previous 2-10 minutes or other suitable period of time), and progressively consolidate network traffic flow data of other periods of time (e.g., day, week, month, year, etc.). By organizing, summarizing, and preprocessing the network traffic flow data, collectors 108 can help network traffic monitoring system 100 scale efficiently. Although collectors 108 are generally referred to herein in the plurality, it will be appreciated that collectors 108 can be implemented using a single machine, especially for smaller datacenters.
In some example embodiments, collectors 108 can receive data from external data sources 106, such as security reports, white-lists (106a), IP watchlists (106b), who is data (106c), or out-of-band data, such as power status, temperature readings, etc.
In some example embodiments, network traffic monitoring system 100 can include a wide bandwidth connection between collectors 108 and analytics module 110.
Analytics module 110 can include application dependency (ADM) module 160, reputation module 162, vulnerability module 164, malware detection module 166, etc., to accomplish various tasks with respect to the flow data collected by sensors 104 and stored in collectors 108. In some example embodiments, network traffic monitoring system 100 can automatically determine network topology. Using network traffic flow data captured by sensors 104, network traffic monitoring system 100 can determine the type of devices existing in the network (e.g., brand and model of switches, gateways, machines, etc.), physical locations (e.g., latitude and longitude, building, datacenter, room, row, rack, machine, etc.), interconnection type (e.g., 10 Gb Ethernet, fiber-optic, etc.), and network characteristics (e.g., bandwidth, latency, etc.). Automatically determining the network topology can assist with integration of network traffic monitoring system 100 within an already established datacenter. Furthermore, analytics module 110 can detect changes of network topology without the need of further configuration.
Analytics module 110 can determine dependencies of components within the network using ADM module 160. For example, if component A routinely sends data to component B but component B never sends data to component A, then analytics module 110 can determine that component B is dependent on component A, but A is likely not dependent on component B. If, however, component B also sends data to component A, then they are likely interdependent. These components can be processes, virtual machines, hypervisors, VLANs, etc. Once analytics module 110 has determined component dependencies, it can then form a component ("application") dependency map. This map can be instructive when analytics module 110 attempts to determine a root cause of a failure (because failure of one component can cascade and cause failure of its dependent components). This map can also assist analytics module 110 when attempting to predict what will happen if a component is taken offline. Additionally, analytics module 110 can associate edges of an application dependency map with expected latency, bandwidth, etc. for that individual edge.
Analytics module 110 can establish patterns and norms for component behavior. For example, it can determine that certain processes (when functioning normally) will only send a certain amount of traffic to a certain VM using a small set of ports. Analytics module can establish these norms by analyzing individual components or by analyzing data coming from similar components (e.g., VMs with similar configurations). Similarly, analytics module 110 can determine expectations for network operations. For example, it can determine the expected latency between two components, the expected throughput of a component, response times of a component, typical packet sizes, traffic flow signatures, etc. In some example embodiments, analytics module 110 can combine its dependency map with pattern analysis to create reaction expectations. For example, if traffic increases with one component, other components may predictably increase traffic in response (or latency, compute time, etc.).
In some example embodiments, analytics module 110 can use machine learning techniques to identify security threats to a network using malware detection module 166. For example, malware detection module 166 can be provided with examples of network states corresponding to an attack and network states corresponding to normal operation. Malware detection module 166 can then analyze network traffic flow data to recognize when the network is under attack. In some example embodiments, the network can operate within a trusted environment for a time so that analytics module 110 can establish baseline normalcy. In some example embodiments, analytics module 110 can contain a database of norms and expectations for various components. This database can incorporate data from sources external to the network (e.g., external sources 106). Analytics module 110 can then create access policies for how components can interact using policy engine 112. In some example embodiments, policies can be established external to network traffic monitoring system 100 and policy engine 112 can detect the policies and incorporate them into analytics module 110. A network administrator can manually tweak the policies. Policies can dynamically change and be conditional on events. These policies can be enforced by the components depending on a network control scheme implemented by a network. Policy engine 112 can maintain these policies and receive user input to change the policies.
Policy engine 112 can configure analytics module 110 to establish or maintain network policies. For example, policy engine 112 may specify that certain machines should not intercommunicate or that certain ports are restricted. A network and security policy controller (not shown) can set the parameters of policy engine 112. In some example embodiments, policy engine 112 can be accessible via presentation module 116. In some example embodiments, policy engine 112 can include policy data 112. In some example embodiments, policy data 112 can include EPG data 114, which can include the mapping of EPGs to IP addresses and/or MAC addresses. In some example embodiments, policy data 112 can include policies for handling data packets.
In some example embodiments, analytics module 110 can simulate changes in the network. For example, analytics module 110 can simulate what may result if a machine is taken offline, if a connection is severed, or if a new policy is implemented. This type of simulation can provide a network administrator with greater information on what policies to implement. In some example embodiments, the simulation may serve as a feedback loop for policies. For example, there can be a policy that if certain policies would affect certain services (as predicted by the simulation) those policies should not be implemented. Analytics module 110 can use simulations to discover vulnerabilities in the datacenter. In some example embodiments, analytics module 110 can determine which services and components will be affected by a change in policy. Analytics module 110 can then take necessary actions to prepare those services and components for the change. For example, it can send a notification to administrators of those services and components, it can initiate a migration of the components, it can shut the components down, etc.
In some example embodiments, analytics module 110 can supplement its analysis by initiating synthetic traffic flows and synthetic attacks on the datacenter. These artificial actions can assist analytics module 110 in gathering data to enhance its model. In some example embodiments, these synthetic flows and synthetic attacks are used to verify the integrity of sensors 104, collectors 108, and analytics module 110. Over time, components may occasionally exhibit anomalous behavior. Analytics module 110 can analyze the frequency and severity of the anomalous behavior to determine a reputation score for the component using reputation module 162. Analytics module 110 can use the reputation score of a component to selectively enforce policies. For example, if a component has a high reputation score, the component may be assigned a more permissive policy or more permissive policies; while if the component frequently violates (or attempts to violate) its relevant policy or policies, its reputation score may be lowered and the component may be subject to a stricter policy or stricter policies. Reputation module 162 can correlate observed reputation score with characteristics of a component. For example, a particular virtual machine with a particular configuration may be more prone to misconfiguration and receive a lower reputation score. When a new component is placed in the network, analytics module 110 can assign a starting reputation score similar to the scores of similarly configured components. The expected reputation score for a given component configuration can be sourced outside of the datacenter. A network administrator can be presented with expected reputation scores for various components before installation, thus assisting the network administrator in choosing components and configurations that will result in high reputation scores.
Some anomalous behavior can be indicative of a misconfigured component or a malicious attack. Certain attacks may be easy to detect if they originate outside of the datacenter, but can prove difficult to detect and isolate if they originate from within the datacenter. One such attack could be a distributed denial of service (DDOS) where a component or group of components attempt to overwhelm another component with spurious transmissions and requests. Detecting an attack or other anomalous network traffic can be accomplished by comparing the expected network conditions with actual network conditions. For example, if a traffic flow varies from its historical signature (packet size, TCP header options, etc.) it may be an attack.
In some cases, a traffic flow may be expected to be reported by a sensor, but the sensor may fail to report it. This situation could be an indication that the sensor has failed or become compromised. By comparing the network traffic flow data from multiple sensors 104 spread throughout the datacenter, analytics module 110 can determine if a certain sensor is failing to report a particular traffic flow.
Presentation module 116 can include serving layer 118, authentication module 120, web front end 122, public alert module 124, and third party tools 126. In some example embodiments, presentation module 116 can provide an external interface for network monitoring system 100. Using presentation module 116, a network administrator, external software, etc. can receive data pertaining to network monitoring system 100 via a webpage, application programming interface (API), audiovisual queues, etc. In some example embodiments, presentation module 116 can preprocess and/or summarize data for external presentation. In some example embodiments, presentation module 116 can generate a webpage. As analytics module 110 processes network traffic flow data and generates analytic data, the analytic data may not be in a human-readable form or it may be too large for an administrator to navigate. Presentation module 116 can take the analytic data generated by analytics module 110 and further summarize, filter, and organize the analytic data as well as create intuitive presentations of the analytic data.
Serving layer 118 can be the interface between presentation module 116 and analytics module 110. As analytics module 110 generates reports, predictions, and conclusions, serving layer 118 can summarize, filter, and organize the information that comes from analytics module 110. In some example embodiments, serving layer 118 can also request raw data from a sensor or collector.
Web frontend 122 can connect with serving layer 118 to present the data from serving layer 118 in a webpage. For example, web frontend 122 can present the data in bar charts, core charts, tree maps, acyclic dependency maps, line graphs, tables, etc. Web frontend 122 can be configured to allow a user to "drill down" on information sets to get a filtered data representation specific to the item the user wishes to drill down to. For example, individual traffic flows, components, etc. Web frontend 122 can also be configured to allow a user to filter by search. This search filter can use natural language processing to analyze the user's input. There can be options to view data relative to the current second, minute, hour, day, etc. Web frontend 122 can allow a network administrator to view traffic flows, application dependency maps, network topology, etc.
In some example embodiments, web frontend 122 may be solely configured to present information. In other example embodiments, web frontend 122 can receive inputs from a network administrator to configure network traffic monitoring system 100 or components of the datacenter. These instructions can be passed through serving layer 118 to be sent to configuration and image manager 102 or policy engine 112. Authentication module 120 can verify the identity and privileges of users. In some example embodiments, authentication module 120 can grant network administrators different rights from other users according to established policies.
Public alert module 124 can identify network conditions that satisfy specified criteria and push alerts to third party tools 126. Public alert module 124 can use analytic data generated or accessible through analytics module 110. One example of third party tools 126 is a security information and event management system (SIEM). Third party tools 126 may retrieve information from serving layer 118 through an API and present the information according to the SIEM's user interfaces.
FIG. 2 illustrates an example network environment 200 according to some example embodiments. It should be understood that, for the network environment 100 and any environment discussed herein, there can be additional or fewer nodes, devices, links, networks, or components in similar or alternative configurations. Example embodiments with different numbers and/or types of clients, networks, nodes, cloud components, servers, software components, devices, virtual or physical resources, configurations, topologies, services, appliances, deployments, or network devices are also contemplated herein. Further, network environment 200 can include any number or type of resources, which can be accessed and utilized by clients or tenants. The illustrations and examples provided herein are for clarity and simplicity.
Network environment 200 can include network fabric 212, layer 2 (L2) network 206, layer 3 (L3) network 208, endpoints 210a, 210b, . . . , and 210d (collectively, "204"). Network fabric 212 can include spine switches 202a, 202b, . . . , 202n (collectively, "202") connected to leaf switches 204a, 204b, 204c, . . . , 204n (collectively, "204"). Spine switches 202 can connect to leaf switches 204 in network fabric 212. Leaf switches 204 can include access ports (or non-fabric ports) and fabric ports. Fabric ports can provide uplinks to spine switches 202, while access ports can provide connectivity for devices, hosts, endpoints, VMs, or other electronic devices (e.g., endpoints 204), internal networks (e.g., L2 network 206), or external networks (e.g., L3 network 208).
Leaf switches 204 can reside at the edge of network fabric 212, and can thus represent the physical network edge. In some cases, leaf switches 204 can be top-of-rack switches configured according to a top-of-rack architecture. In other cases, leaf switches 204 can be aggregation switches in any particular topology, such as end-of-row or middle-of-row topologies. Leaf switches 204 can also represent aggregation switches, for example.
Network connectivity in network fabric 212 can flow through leaf switches 204. Here, leaf switches 204 can provide servers, resources, VMs, or other electronic devices (e.g., endpoints 210), internal networks (e.g., L2 network 206), or external networks (e.g., L3 network 208), access to network fabric 212, and can connect leaf switches 204 to each other. In some example embodiments, leaf switches 204 can connect endpoint groups (EPGs) to network fabric 212, internal networks (e.g., L2 network 206), and/or any external networks (e.g., L3 network 208). EPGs can be used in network environment 200 for mapping applications to the network. In particular, EPGs can use a grouping of application endpoints in the network to apply connectivity and policy to the group of applications. EPGs can act as a container for buckets or collections of applications, or application components, and tiers for implementing forwarding and policy logic. EPGs also allow separation of network policy, security, and forwarding from addressing by instead using logical application boundaries. For example, each EPG can connect to network fabric 212 via leaf switches 204.
Endpoints 210 can connect to network fabric 212 via leaf switches 204. For example, endpoints 210a and 210b can connect directly to leaf switch 204a, which can connect endpoints 210a and 210b to network fabric 212 and/or any other one of leaf switches 204. Endpoints 210c and 210d can connect to leaf switch 204b via L2 network 206. Endpoints 210c and 210d and L2 network 206 are examples of LANs. LANs can connect nodes over dedicated private communications links located in the same general physical location, such as a building or campus.
Wide area network (WAN) 212 can connect to leaf switches 204c or 204d via L3 network 208. WANs can connect geographically dispersed nodes over long-distance communications links, such as common carrier telephone lines, optical lightpaths, synchronous optical networks (SONET), or synchronous digital hierarchy (SDH) links. LANs and WANs can include layer 2 (L2) and/or layer 3 (L3) networks and endpoints.
The Internet is an example of a WAN that connects disparate networks throughout the world, providing global communication between nodes on various networks. The nodes typically communicate over the network by exchanging discrete frames or packets of data according to predefined protocols, such as the Transmission Control Protocol/Internet Protocol (TCP/IP). In this context, a protocol can refer to a set of rules defining how the nodes interact with each other. Computer networks may be further interconnected by an intermediate network node, such as a router, to extend the effective size of each network. Endpoints 210 can include any communication device or component, such as a computer, server, hypervisor, virtual machine, container, process (e.g., running on a virtual machine), switch, router, gateway, host, device, external network, etc. In some example embodiments, endpoints 210 can include a server, hypervisor, process, or switch configured with virtual tunnel endpoint (VTEP) functionality which connects an overlay network with network fabric 212. The overlay network may allow virtual networks to be created and layered over a physical network infrastructure. Overlay network protocols, such as Virtual Extensible LAN (VXLAN), Network Virtualization using Generic Routing Encapsulation (NVGRE), Network Virtualization Overlays (NVO3), and Stateless Transport Tunneling (STT), can provide a traffic encapsulation scheme which allows network traffic to be carried across L2 and L3 networks over a logical tunnel. Such logical tunnels can be originated and terminated through VTEPs. The overlay network can host physical devices, such as servers, applications, endpoint groups, virtual segments, virtual workloads, etc. In addition, endpoints 210 can host virtual workload(s), clusters, and applications or services, which can connect with network fabric 212 or any other device or network, including an internal or external network. For example, endpoints 210 can host, or connect to, a cluster of load balancers or an EPG of various applications.
Network environment 200 can also integrate a network traffic monitoring system, such as the one shown in FIG. 1. For example, as shown in FIG. 2, the network traffic monitoring system can include sensors 104a, 104b, . . . , 104n (collectively, "104"), collectors 108a, 108b, . . . 108n (collectively, "108"), and analytics module 110. In some example embodiments, spine switches 202 do not have sensors 104. Analytics module 110 can receive and process network traffic data collected by collectors 108 and detected by sensors 104 placed on nodes located throughout network environment 200. In some example embodiments, analytics module 110 can be implemented in an active-standby model to ensure high availability, with a first analytics module functioning in a primary role and a second analytics module functioning in a secondary role. If the first analytics module fails, the second analytics module can take over control. Although analytics module 110 is shown to be a standalone network appliance in FIG. 2, it will be appreciated that analytics module 110 can also be implemented as a VM image that can be distributed onto a VM, a cluster of VMs, a software as a service (SaaS), or other suitable distribution model in various other example embodiments. In some example embodiments, sensors 104 can run on endpoints 210, leaf switches 204, spine switches 202, in-between network elements (e.g., sensor 104h), etc. In some example embodiments, leaf switches 204 can each have an associated collector 108. For example, if leaf switch 204 is a top of rack switch then each rack can contain an assigned collector 108.
Although network fabric 212 is illustrated and described herein as an example leaf-spine architecture, one of ordinary skill in the art will readily recognize that the subject technology can be implemented based on any network topology, including any data center or cloud network fabric. Indeed, other architectures, designs, infrastructures, and variations are contemplated herein. For example, the principles disclosed herein are applicable to topologies including three-tier (including core, aggregation, and access levels), fat tree, mesh, bus, hub and spoke, etc. It should be understood that sensors and collectors can be placed throughout the network as appropriate according to various architectures.
Systems and methods according to some example embodiments provide for network policies that can dynamically change based on security measurements for network endpoints. In some example embodiments, a reputation module (e.g., reputation module 162) can determine the security measurements for network endpoints. FIG. 3 illustrates an example policy table 300 according to some example embodiments. Policy table 300 can include policies 301a-301f (collectively, "301") for enforcement in a network. Each policy 301 can specify packet attributes 302 such as source 304, destination 308, action 316 to be applied to a packet when the packet matches each of packet attributes 302, and policy use count 318. A packet attribute can be a description of a certain characteristic that can be matched with a communication (e.g., a subnet or port range). Source 304 and destination 308 packet attributes can include a MAC address (e.g., source for policy 301c), IP address (e.g., source for policy 301a), endpoint 210, endpoint group (e.g., source for policy 301b), user (e.g., destination for policy 301d), process (e.g., name, PID as in destination for policy 301e), subnet, geographical location (e.g., destination for policy 301a), etc.--including any combination of the foregoing. In some example embodiments, the source and destination are of different types (e.g., source is a MAC address while destination is an endpoint group) while in some example embodiments one or both of source and destination are not specified.
Policy table 300 may be information provided to a network administrator or other user to more easily associate certain endpoints with their applicable policies. In other embodiments, there may be a policy table listing only source EPGs and destination EPGs, and a separate data structure or separate data structures for associating EPGs to MAC addresses (e.g., source for policy 301c), IP addresses (e.g., source for policy 301a), users (e.g., destination for policy 301d), processes (e.g., name, PID as in destination for policy 301e), subnets, geographical locations (e.g., destination for policy 301a), etc. By way of example, policy 301a could match a communication sent by an EPG, defined as the endpoint having a particular IP address (e.g., source for policy 301a), to an EPG defined as endpoints located in the geographic location of France (e.g., destination for policy 301a). The resultant action could be to allow the communication. As another example, policy 301b could match a communication initiated by any endpoint 210 associated with endpoint group 2 to endpoint labelled 3, 4, or 5. The resultant action 316 could be to block the communication.
In some example embodiments, there is a single policy table 300 that is identical across an entire network; alternatively, policy table 300 can be distributed such that parts of it are stored and applied differently on different parts of the network. For example, policies 301 pertaining to one LAN can be stored on a switch associated with that LAN but not stored on other switches that are not on that LAN.
Policy table 300 can be a list, tree, map, matrix, etc. of policies 301. In some example embodiments, the relative position of policies 301 is relevant to their enforcement. For example, enforcement can include going through policy table until a policy 301 matches the communication detected. If policy 300 is a tree structure, enforcement can include traversing the tree by matching policy packet attributes until a match is determined.
A network defined by policies that allow a communication between source and destination or otherwise default to denial of the communication can be called a whitelist policy system while a network defined by policies that block a communication between source and destination or otherwise default to allowing the communication can be called a blacklist system. In some example embodiments, policy table may only include whitelist policies and all other communications can be blocked; in some example embodiments, policy table 300 can only contain blacklist policies and all other communications can be allowed. In some situations, policies may conflict; for example, a general policy may allow a certain communication while a more specific policy may block the communication. In some such example embodiments, various resolution techniques can be implemented; for example, the policies can be ordered according to importance and the first matching policy can be enforced with respect to the communication. In some example embodiments, the most specific policy can be implemented; specific meaning that the match is according to a high degree of granularity. For example, a policy (or EPG) that pertains to an IP address of 192.168.1.5 is more specific than a policy or EPG that pertains to an IP subnet of 192.168.1.0/24 because the former describes a single IP address instead of the latter, which is applicable to 254 IP addresses. Specificity can be determined by any of the packet attributes described in a policy, such as IP address, port, etc.
In some example embodiments, a policy can include a counter of how many communications are described by the policy during a certain time. After a certain number of communications within a certain time are detected, the policy can activate, invoking action 316.
Action 316 can be the action that is applied to a communication when the communication matches a corresponding policy. For example, action 316 can be to permit or allow the flow described in policy 301 (i.e., forward the communication), block or deny the flow described in the policy (i.e., drop the communication), limit the bandwidth consumed by the flow, log the flow, "mark" the flow for quality of service (QoS) (e.g., set a lower or higher priority for the flow), redirect the flow (e.g., to avoid critical paths), copy the flow, etc. In some example embodiments, action 316 can have an expiration time or date. For example, it can only take the designated action (e.g., allow, block, mark, etc.) for a certain amount of time before the communication is dropped. Similarly, action 316 can have designated times of applicability, for example only during peak hours. A policy can be over-inclusive or under-inclusive. For example, in certain situations, a whitelist policy may allow communications that are potentially harmful to the network while a blacklist policy 301 can block communications that are permitted by the network.
In some example embodiments, a policy 301 can include policy use count 318 which can represent how many communications are described by policy 301 during a certain time. Policy use count 318 can represent that policy 301 has been utilized (a binary value), the number of times policy 301 has been utilized, the proportion of communications that utilized policy 301 (e.g., 33 of 204.sub.8 communications), the elapsed time since policy 301 was last invoked, a timestamp of the last time policy 301 was utilized, etc.
Policy use count 318 can reflect the number of flows, packets, connections, communications, distinct flow traffic, and/or the quantity of the traffic (e.g., gigabytes). In some example embodiments, policy 301 can include a historical record of policy use count 318. For example, the historical record can contain values of policy use count for past minutes, hours, days, weeks, months, years, etc.
In some example embodiments, policy use count 318 table can be organized as a policy matrix of n-dimensions, each dimension corresponding to a packet attribute. FIG. 4 illustrates an example policy matrix 400 according to some example embodiments. Policy matrix 400 can include one dimension for the source (e.g., Source Endpoint Group) and a second dimension for the destination (e.g., Destination Endpoint Group). When using such a policy matrix, a certain destination EPG (e.g., EPG 3) and a certain source EPG (e.g., EGP2) can invoke policy result 401 (e.g., result 401.sub.23). Policy result 401 can include no policy (e.g., result 401.sub.32), one policy (e.g., result 401.sub.12), or more than one policy (e.g., result 401.sub.13).
FIG. 5 shows an example policy utilization chart 500. In some example embodiments, policy utilization chart 500 can show how a policy use count changes over time period 510. For example, in example policy utilization chart 500 policy C 506 was used extensively during time period 510 1-4 and then drops off suddenly. This drop-off can represent that an endpoint was taken offline, that a policy was changed (to not apply to certain communications), or that a more specific policy was created that gets applied before policy C 506 could be activated. Policy A 502 shows a gradual decline in usage while policy B 502 shows a gradual ramp up to a stable and consistent value. A representation such as policy utilization chart 500 can be useful for a network administrator for rapid diagnostics of network conditions. It should be understood that other charts and diagrams are possible to represent policies.
Policy utilization chart 500 can be a depiction of the data contained in the historical record of policy use count. A system can identify that a policy is no longer utilized (e.g., policy C 506), that a policy is heavily utilized (e.g., policy B 504), or that a policy is utilized infrequently (e.g., policy A 502). In some example embodiments, a network administrator and/or network management system can delete or remove unused policies (e.g., policy C 506). In some example embodiments, a system can deprioritize unused or infrequently utilized policies (e.g., policy B 504 or policy C 506). "Deprioritizing" a policy can include putting the policy at a lower priority position of a policy table (e.g., policy table 300 of FIG. 3) so that other policies are checked before the deprioritized policy. As will be appreciated by one of ordinary skill in the art, the policy table can be implemented in software as a component of a network controller or network policy management system or in hardware (e.g., encoded in ternary content-addressable memory (TCAM) of a network device). In some example embodiments, deprioritizing a policy includes checking the policy against a sample of flows and not every flow. In some such embodiments, once a policy is implemented in the network for a suitable period of time, the network controller and/or network policy management system can reprioritize the policy relative to other existing policies.
FIG. 6 depicts an example network environment 600 according to some embodiments. Source node 602 can communicate (i.e., initiate a flow) with destination node 608 by sending data (e.g., packets) through network 604. Source node 602 and destination node 608 can be endpoints. Alternatively, source node 602 and/or destination node 608 can represent an intermediary for a flow (e.g., a switch or router). Sensor 104.sub.6s can monitor traffic from source node 602 and sensor 104.sub.6d can monitor traffic from destination node 608. Within network 602, policy enforcement module 606 can enforce policies (e.g., policies 301 of FIG. 3). Analytics module 110 can set and read the policies from the policy table 300 while also gathering and analyzing packet information recovered from sensor 104.sub.6s and 104.sub.6d.
In some example embodiments, sensor 104.sub.6, sends network flow data (e.g., source record) to analytics module 110 describing a packet, communication, flow, etc. that is being sent to network 604 by source node 602. This description of the packet can include various packet attributes 302 such as a destination address, a source address, a sequence number, a port, a protocol, timestamp, etc. Similarly, sensor 104.sub.6d can send network flow data (e.g., destination record) to analytics module 110 describing a packet, communication, flow, etc. that has been received over network 604 by destination node 608.
Analytics module 110 can then review the network flow data that it receives from sensor 104.sub.6s and sensor 104.sub.6d to determine if they describe the same packet, flow, or communication. In some example embodiments, matching a source log from sensor 104.sub.6s and a destination log from sensor 104.sub.6d can be challenging, especially if the logs lack complete information. For example, the destination log may only indicate that destination node 608 received a packet from source node 602 at a certain time. Further, various tunneling, encapsulation, and virtualization techniques may obfuscate certain parameters. Analytics module 110 can predict whether the two logs likely describe the same communication by looking at the time difference between the two logs as well as the descriptions of source node 602 and destination node 608.
In some example embodiments, sensor 104.sub.6s detects that source node 602 received an "ACK" packet from destination node 608 in response to a packet previously sent to destination node 608. Sensor 104.sub.6s can then send network flow data to analytics module 110 that the communication from source node 602 to destination node 608 was successful. If sensor 104.sub.6s detects that "ACK" was not received, it can send network flow data to analytics module 110 indicating that the communication was unsuccessful.
In some example embodiments, multiple sensors 104 report on a single packet as it traverses the network. For example, sensors 104 installed on a virtual machines, hypervisors, switches, network devices, firewalls, etc. may all detect the packet as it passes through the network. Analytics module 110 can then receive network flow data from each sensor 104 and, if a packet was blocked, determine where the blocking occurred.
After determining whether a packet, communication, or flow was blocked or allowed, analytics module 110 can determine if the policy within policy table 300 was applied to allow or block the packet. For example, if the packet described in the source log was never received by destination node 608 (e.g. there may not exist a destination log that describes the packet), the packet was likely blocked and analytics module 110 can look into policy table 300 to determine if a policy 301 matches the attempted transmission. If there is a corresponding destination log that describes the packet from the source log, then the packet was allowed and analytics module can determine if a policy within policy table 300 matches the transmission. When a policy is matched, analytics module 110 can increment a counter (e.g., policy use count 318) in policy table 300 to reflect its use. Analytics module 110 can add an entry in a log either in policy table 300 or elsewhere describing the policy's use.
In some example embodiments, a policy within policy table 300 is inconsistent with the network flow data sent by sensors 104. For example, a policy 301 may say that a flow should be blocked but the sensors 104 may report that the flow was allowed. Analytics module can then indicate that the policy's application was frustrated. This can alert network administrators of potential holes in their network security system. For example, a policy may dictate that communications between two virtual machines should be blocked but the sensors 104 may report that the communication was allowed. This may be the result of a faulty network configuration, for example if policy enforcement module 606 is not placed in the path from source node 602 to destination node 608 (e.g., if source node 602 and destination node 608 are virtual machines on the same bare metal machine).
In some example embodiments, policy enforcement module 606 reports in policy table 300 by incrementing a counter (e.g., policy use count 318) or adding an entry to a log to indicate that policy 301 was applied. In some example embodiments, sensors 104 can include monitor policy enforcement; in some such embodiments sensor 104 can report to policy table 300 or analytics module 110 if a policy is applied.
In some example embodiments, policy table 300 describes source node 602 using one descriptor while the source log from 104.sub.6s describes a packet source using another descriptor. For example, the descriptor from the policy may describe an IP address range or endpoint group while the descriptor from the log describes a single IP address, a MAC address, or an endpoint. In some such embodiments, analytics module 110 can determine an endpoint group, address range, etc. for the packet. Similarly, the destination log may describe the destination using one descriptor (e.g., endpoint) and analytics module 110 can determine a policy descriptor (e.g., endpoint group) that can be associated with the packet.
FIG. 7 depicts an example process 700 according to some embodiments. A network traffic monitoring system (e.g., network traffic monitoring system 100 of FIG. 1) performing the steps in process 700 can begin by receiving flow data for a packet traversing a network (step 702). This flow data can uniquely describe the packet or can describe a collection of packets, communications, or flows. Flow data can also be part of network flow data. Flow data can be received from a sensor 104 or other network device.
The system can then determine a source endpoint group and a destination endpoint group for the packet (step 704). A table can be utilized for step 704. In some example embodiments, the packet is associated with a source and the source is associated with the endpoint group.
The system can then determine whether the policy was enforced (step 706). In some example embodiments, this can be accomplished by finding a policy in policy table 300 applicable to packet. The policy may be applicable if a number of packet attributes of the packet describe the flow (e.g., source address, destination address, port, etc.). In some situations, the policy may allow traffic and enforcement of the policy can be determined based on the destination receiving the packet. In other situations, the policy may be to deny traffic between the source and the destination. Determining whether the policy was successfully enforced may be based on the destination not receiving the packet. Conversely, a policy to allow traffic is not enforced when there is no indication that the packet was received by the destination and a policy to deny traffic is not enforced when it is determined that the packet was received by the destination.
The system can then update utilization data for the policy based on the flow data (step 708). This can include updating statistics for the policy. In some example embodiments, step 708 includes an entry of when the policy 301 was utilized.
The system can then determine whether the policy is being used more often than a second policy (step 710). If yes, the system can reorder a first position of the policy within a policy table and a second position of the second policy within the policy table (712). Some policy tables can include a large number of policies. The position of a policy may influence how long it takes for a system to check the policy. Policies that are utilized more often could be placed in a position where they will be checked faster. This can be useful in systems that apply the first policy that matches the flow.
If step 710 yields a "no", the system can determine if the policy has not been utilized for a period of time (step 714). Over time, policies may accumulate in a data center, even long after they are relevant. For example, an administrator may remove a machine or uninstall a program but is hesitant to remove the relevant policy out of fear that other systems depend on it. Some policies that are no longer used are likely no longer relevant and can be removed by deleting the policy from the policy table (step 716). This can be especially useful with whitelist policies that could be exploited by malicious applications.
Process 700 can end after step 712, step 716, or step 714 (if the determination is "no").
FIG. 8A and FIG. 8B illustrate example system embodiments. The more appropriate embodiment will be apparent to those of ordinary skill in the art when practicing the present technology. Persons of ordinary skill in the art will also readily appreciate that other system embodiments are possible.
FIG. 8A illustrates a conventional system bus computing system architecture 800 wherein the components of the system are in electrical communication with each other using a bus 805. Example system 800 includes a processing unit (CPU or processor) 810 and a system bus 805 that couples various system components including the system memory 815, such as read only memory (ROM) 870 and random access memory (RAM) 875, to the processor 810. The system 800 can include a cache of high-speed memory connected directly with, in close proximity to, or integrated as part of the processor 810. The system 800 can copy data from the memory 815 and/or the storage device 830 to the cache 812 for quick access by the processor 810. In this way, the cache can provide a performance boost that avoids processor 810 delays while waiting for data. These and other modules can control or be configured to control the processor 810 to perform various actions. Other system memory 815 may be available for use as well. The memory 815 can include multiple different types of memory with different performance characteristics. The processor 810 can include any general purpose processor and a hardware module or software module, such as module 1 837, module 8 834, and module 3 836 stored in storage device 830, configured to control the processor 910 as well as a special-purpose processor where software instructions are incorporated into the actual processor design. The processor 810 may essentially be a completely self-contained computing system, containing multiple cores or processors, a bus, memory controller, cache, etc. A multi-core processor may be symmetric or asymmetric.
To enable user interaction with the computing device 800, an input device 845 can represent any number of input mechanisms, such as a microphone for speech, a touch-sensitive screen for gesture or graphical input, keyboard, mouse, motion input, speech and so forth. An output device 835 can also be one or more of a number of output mechanisms known to those of skill in the art. In some instances, multimodal systems can enable a user to provide multiple types of input to communicate with the computing device 800. The communications interface 840 can generally govern and manage the user input and system output. There is no restriction on operating on any particular hardware arrangement and therefore the basic features here may easily be substituted for improved hardware or firmware arrangements as they are developed.
Storage device 830 is a non-volatile memory and can be a hard disk or other types of computer readable media which can store data that are accessible by a computer, such as magnetic cassettes, flash memory cards, solid state memory devices, digital versatile disks, cartridges, random access memories (RAMs) 875, read only memory (ROM) 870, and hybrids thereof.
The storage device 830 can include software modules 837, 834, 836 for controlling the processor 810. Other hardware or software modules are contemplated. The storage device 830 can be connected to the system bus 805. In one aspect, a hardware module that performs a particular function can include the software component stored in a computer-readable medium in connection with the necessary hardware components, such as the processor 810, bus 805, display 835, and so forth, to carry out the function.
FIG. 8B illustrates an example computer system 850 having a chipset architecture that can be used in executing the described method and generating and displaying a graphical user interface (GUI). Computer system 850 is an example of computer hardware, software, and firmware that can be used to implement the disclosed technology. System 850 can include a processor 855, representative of any number of physically and/or logically distinct resources capable of executing software, firmware, and hardware configured to perform identified computations. Processor 855 can communicate with a chipset 860 that can control input to and output from processor 855. In this example, chipset 860 outputs information to output 865, such as a display, and can read and write information to storage device 870, which can include magnetic media, and solid state media, for example. Chipset 860 can also read data from and write data to RAM 875. A bridge 880 for interfacing with a variety of user interface components 885 can be provided for interfacing with chipset 860. Such user interface components 885 can include a keyboard, a microphone, touch detection and processing circuitry, a pointing device, such as a mouse, and so on. In general, inputs to system 850 can come from any of a variety of sources, machine generated and/or human generated.
Chipset 860 can also interface with one or more communication interfaces 890 that can have different physical interfaces. Such communication interfaces can include interfaces for wired and wireless local area networks, for broadband wireless networks, as well as personal area networks. Some applications of the methods for generating, displaying, and using the GUI disclosed herein can include receiving ordered datasets over the physical interface or be generated by the machine itself by processor 855 analyzing data stored in storage 870 or 875. Further, the machine can receive inputs from a user via user interface components 885 and execute appropriate functions, such as browsing functions by interpreting these inputs using processor 855.
It can be appreciated that example systems 800 and 850 can have more than one processor 810 or be part of a group or cluster of computing devices networked together to provide greater processing capability.
For clarity of explanation, in some instances the present technology may be presented as including individual functional blocks including functional blocks comprising devices, device components, steps or routines in a method embodied in software, or combinations of hardware and software.
In some example embodiments the computer-readable storage devices, mediums, and memories can include a cable or wireless signal containing a bit stream and the like. However, when mentioned, non-transitory computer-readable storage media expressly exclude media such as energy, carrier signals, electromagnetic waves, and signals per se.
Methods according to the above-described examples can be implemented using computer-executable instructions that are stored or otherwise available from computer readable media. Such instructions can comprise, for example, instructions and data which cause or otherwise configure a general purpose computer, special purpose computer, or special purpose processing device to perform a certain function or group of functions. Portions of computer resources used can be accessible over a network. The computer executable instructions may be, for example, binaries, intermediate format instructions such as assembly language, firmware, or source code. Examples of computer-readable media that may be used to store instructions, information used, and/or information created during methods according to described examples include magnetic or optical disks, flash memory, USB devices provided with non-volatile memory, networked storage devices, and so on.
Devices implementing methods according to these disclosures can comprise hardware, firmware and/or software, and can take any of a variety of form factors. Typical examples of such form factors include laptops, smart phones, small form factor personal computers, personal digital assistants, rackmount devices, standalone devices, and so on. Functionality described herein also can be embodied in peripherals or add-in cards. Such functionality can also be implemented on a circuit board among different chips or different processes executing in a single device, by way of further example.
The instructions, media for conveying such instructions, computing resources for executing them, and other structures for supporting such computing resources are means for providing the functions described in these disclosures.
Although a variety of examples and other information was used to explain aspects within the scope of the appended claims, no limitation of the claims should be implied based on particular features or arrangements in such examples, as one of ordinary skill would be able to use these examples to derive a wide variety of implementations. Further and although some subject matter may have been described in language specific to examples of structural features and/or method steps, it is to be understood that the subject matter defined in the appended claims is not necessarily limited to these described features or acts. For example, such functionality can be distributed differently or performed in components other than those identified herein. Rather, the described features and steps are disclosed as examples of components of systems and methods within the scope of the appended claims. Moreover, claim language reciting "at least one of" a set indicates that one member of the set or multiple members of the set satisfy the claim.
* * * * *
References
-
asd.gov.au/infosec/top-mitigations/top-4-strategies-explained.htm
-
dambala.com
-
mdpi.com/joumal/entropy
-
www/cicso.com/c/en/us/support/docs/security-vpn/lock-key/7604-13.html
-
researchgate.net/publication/221536306
-
internetperils.com
-
searchdatacenter.techtarget.com/news/118820/Get-to-know-your-data-center-with-CMDB
-
docs.hol.vmware.com/HOL-2013/holsdc-1301_html_en
-
lfrog.com/confluence/display/DA/Home
-
neverfailgroup.com/products/it-continuity-architect
-
pathwaysystems.com/company-blog
-
-
arxiv.org/abs/1406.2098
-
fipa.org
D00000
D00001
D00002
D00003
D00004
D00005
D00006
D00007
D00008
XML
uspto.report is an independent third-party trademark research tool that is not affiliated, endorsed, or sponsored by the United States Patent and Trademark Office (USPTO) or any other governmental organization. The information provided by uspto.report is based on publicly available data at the time of writing and is intended for informational purposes only.
While we strive to provide accurate and up-to-date information, we do not guarantee the accuracy, completeness, reliability, or suitability of the information displayed on this site. The use of this site is at your own risk. Any reliance you place on such information is therefore strictly at your own risk.
All official trademark data, including owner information, should be verified by visiting the official USPTO website at www.uspto.gov. This site is not intended to replace professional legal advice and should not be used as a substitute for consulting with a legal professional who is knowledgeable about trademark law.