Semantic searches in a business intelligence system
Venkata , et al.
U.S. patent number 10,664,488 [Application Number 14/861,893] was granted by the patent office on 2020-05-26 for semantic searches in a business intelligence system. This patent grant is currently assigned to Oracle International Corporation. The grantee listed for this patent is ORACLE INTERNATIONAL CORPORATION. Invention is credited to Satish Gopalakrishna, Ananth Venkata, Jacques Vigeant.


| United States Patent | 10,664,488 |
| Venkata , et al. | May 26, 2020 |
Semantic searches in a business intelligence system
Abstract
A computer-implemented method of executing a user query includes presenting a user interface to allow a user to enter a query, receiving a user-entered textual request through the interface, launching a search service to rewrite the textual request into a search query, sending the search query to a presentation server, receiving an answer to the query, and returning the answer to the user as a graphical representation. A computer-implemented method includes receiving a crawl request from a user, launching a crawl manager to monitor the crawl request and track statistics related to the crawl, starting a crawl task based upon the crawl request, indexing a business intelligence presentation server to create a data index, and storing the data index.
| Inventors: | Venkata; Ananth (Pleasanton, CA), Vigeant; Jacques (Fort Lauderdale, FL), Gopalakrishna; Satish (Fremont, CA) | ||||||||||
|---|---|---|---|---|---|---|---|---|---|---|---|
| Applicant: |
|
||||||||||
| Assignee: | Oracle International
Corporation (Redwood Shores, CA) |
||||||||||
| Family ID: | 55584697 | ||||||||||
| Appl. No.: | 14/861,893 | ||||||||||
| Filed: | September 22, 2015 |
Prior Publication Data
| Document Identifier | Publication Date | |
|---|---|---|
| US 20160092572 A1 | Mar 31, 2016 | |
Related U.S. Patent Documents
| Application Number | Filing Date | Patent Number | Issue Date | ||
|---|---|---|---|---|---|
| 62055402 | Sep 25, 2014 | ||||
| Current U.S. Class: | 1/1 |
| Current CPC Class: | G06F 16/24534 (20190101); G06F 16/248 (20190101) |
| Current International Class: | G06F 16/248 (20190101); G06F 16/2453 (20190101) |
References Cited [Referenced By]
U.S. Patent Documents
| 5418948 | May 1995 | Turtle |
| 7047242 | May 2006 | Ponte |
| 7802195 | September 2010 | Saul et al. |
| 8533619 | September 2013 | Baier et al. |
| 8788514 | July 2014 | Ramanarayanan et al. |
| 8860727 | October 2014 | Beers et al. |
| 8954446 | February 2015 | Vijayan Retnamma et al. |
| 8966386 | February 2015 | Fok et al. |
| 9092802 | July 2015 | Akella |
| 9098183 | August 2015 | Vonshak et al. |
| 9292628 | March 2016 | Beers et al. |
| 9338652 | May 2016 | Allen et al. |
| 9424318 | August 2016 | Anand et al. |
| 9501585 | November 2016 | Gautam |
| 9582913 | February 2017 | Kraft et al. |
| 9600528 | March 2017 | Mackinlay et al. |
| 9613102 | April 2017 | Anand et al. |
| 9665641 | May 2017 | Zhang |
| 9858292 | January 2018 | Setlur et al. |
| 9870629 | January 2018 | Cardno et al. |
| 10048854 | August 2018 | Zhang et al. |
| 10417247 | September 2019 | Venkata et al. |
| 2005/0060286 | March 2005 | Hansen |
| 2005/0076085 | April 2005 | Budd et al. |
| 2007/0279484 | December 2007 | Derocher et al. |
| 2008/0118916 | May 2008 | Sood et al. |
| 2008/0233980 | September 2008 | Englund et al. |
| 2009/0327263 | December 2009 | Maghoul |
| 2010/0057679 | March 2010 | King |
| 2010/0070448 | March 2010 | Omoigui |
| 2011/0055241 | March 2011 | Lewis |
| 2011/0081948 | April 2011 | Shirai et al. |
| 2011/0123115 | May 2011 | Lee et al. |
| 2011/0249900 | October 2011 | Thoern et al. |
| 2012/0066602 | March 2012 | Chai et al. |
| 2012/0084689 | April 2012 | Ledet et al. |
| 2012/0088543 | April 2012 | Lindner et al. |
| 2012/0110565 | May 2012 | O'Sullivan et al. |
| 2012/0134590 | May 2012 | Petrou et al. |
| 2012/0259833 | October 2012 | Paduroiu |
| 2012/0289290 | November 2012 | Chae et al. |
| 2012/0311074 | December 2012 | Arini et al. |
| 2012/0323910 | December 2012 | Ilyas |
| 2013/0006904 | January 2013 | Horvitz |
| 2013/0042259 | February 2013 | Urbach |
| 2013/0113943 | May 2013 | Wormald et al. |
| 2013/0117319 | May 2013 | Soltani et al. |
| 2014/0033079 | January 2014 | Sage |
| 2014/0046934 | February 2014 | Zhou |
| 2014/0040977 | April 2014 | Barton et al. |
| 2014/0108793 | April 2014 | Barton et al. |
| 2014/0172408 | June 2014 | Vukosavljevic et al. |
| 2015/0012830 | January 2015 | Choi et al. |
| 2015/0012854 | January 2015 | Choi et al. |
| 2015/0026145 | January 2015 | Prakash |
| 2015/0026153 | January 2015 | Gupta et al. |
| 2015/0138228 | May 2015 | Lum et al. |
| 2015/0227632 | August 2015 | Lunardi et al. |
| 2015/0242086 | August 2015 | Mindlin |
| 2015/0347920 | December 2015 | Medlock et al. |
| 2015/0356068 | December 2015 | Hill et al. |
| 2015/0365426 | December 2015 | Henocque |
| 2016/0055374 | February 2016 | Zhang et al. |
| 2016/0085602 | March 2016 | Jacobson et al. |
| 2016/0103801 | April 2016 | Bortz et al. |
| 2016/0117072 | April 2016 | Sharifi et al. |
| 2016/0306777 | October 2016 | George et al. |
| 2016/0371495 | December 2016 | Bhat et al. |
| 2017/0031825 | February 2017 | Chen et al. |
| 2017/0031831 | February 2017 | Bohra et al. |
| 2017/0039281 | February 2017 | Venkata et al. |
| 2017/0041296 | February 2017 | Ford et al. |
| 2017/0118308 | April 2017 | Vigeant et al. |
| 2017/0160895 | June 2017 | Hu et al. |
| 2017/0237868 | August 2017 | Sato |
| 2017/0242934 | August 2017 | Bullotta |
| 2017/0308271 | October 2017 | Li |
| 2017/0351708 | December 2017 | Lahmann et al. |
| 2017/0357437 | December 2017 | Peterson et al. |
| 2018/0069947 | March 2018 | Antipa et al. |
| 2018/0121468 | May 2018 | Setlur et al. |
| 2018/0150899 | May 2018 | Waldron et al. |
| 2018/0335911 | November 2018 | Nilo et al. |
| 2018/0335912 | November 2018 | Nilo et al. |
| 2005311621 | Jun 2006 | AU | |||
| 2018204696 | Nov 2018 | WO | |||
Other References
|
Data sources for Power BI service, Microsoft Power BI, https://powerbi.microsoft.com/en-us/documentation/powerbi-service-get-dat- a/, 2015, 7 pages, retrieved on Mar. 10, 2016. cited by applicant . Google Now, available online at https://en.wikipedia.org/wiki/Google_Now, Oct. 29, 2015, 6 pages, retrieved on Jan. 10, 2017. cited by applicant . Microsoft Power BI (Business intelligence), available online at https://en.wikipedia.org/wiki/Power_BI, 2 pages, updated on Aug. 29, 2016; retrieved on Sep. 22, 2016. cited by applicant . Power BI--basic concepts, Microsoft Power BI, available online at https://powerbi.microsoft.com/en-us/documentation/powerbi-service-basic-c- oncepts/, 2015, 11 pages, retrieved on Mar. 10, 2016. cited by applicant . Power BI Support, Q&A in Power BI, available online at https://powerbi.microsoft.com/en-us/documentation/powerbi-service-q-and-a- /, 2015, 4 pages, retrieved on Mar. 10, 2016. cited by applicant . Search-Driven Analytics for Humans-Now anyone can be their own data analyst, Thought Spot, available online at www.thoughtspot.com, 4 pages, retrieved on Mar. 10, 2016. cited by applicant . Novet, Birst lets you search enterprise data like you search Google, VentureBeat, available online at http://venturebeat.com/2013/12/10/birst-boosts-business-intelligence-with- -google-like-search-to-visualize-data/, Dec. 10, 2013, 3 pages, retrieved on Mar. 10, 2016. cited by applicant . U.S. Appl. No. 15/273,567, filed Sep. 12, 2016, 81 pages. cited by applicant . U.S. Appl. No. 15/273,567, Non-Final Office Action dated Sep. 14, 2018, 23 pages. cited by applicant . U.S. Appl. No. 15/297,037, Non-Final Office Action dated Sep. 21, 2018, 9 pages. cited by applicant . U.S. Appl. No. 15/297,037, "Notice of Allowance", dated Mar. 4, 2019, 8 pages. cited by applicant . U.S. Appl. No. 15/273,567, Non-Final Office Action dated Jan. 17, 2019, 25 pages. cited by applicant . U.S. Appl. No. 15/273,567, Notice of Allowance dated Aug. 21, 2019, 16 pages. cited by applicant. |
Primary Examiner: Lin; Shew Fen
Attorney, Agent or Firm: Kilpatrick Townsend & Stockton LLP
Parent Case Text
CROSS REFERENCE TO RELATED APPLICATION
This application claims priority to and the benefit of U.S. Provisional Application No. 62/055,402, filed Sep. 25, 2014, which is incorporated herein in its entirety.
Claims
What is claimed is:
1. A computer-implemented method, comprising: causing a graphical user interface to be displayed on a device, wherein the graphical user interface is generated by a search application executing on the device, and wherein the graphical user interface includes a search bar operable to accept user input; receiving a first search term entered using the search bar; displaying the first search term in the search bar; generating a query using the first search term, wherein the query is generated by rewriting the first search term to a query language form; executing, using the query, a search of one or more data stores by an index searcher; determining a first visualization for presenting a first result obtained from searching the one or more data stores, wherein the first visualization is determined based on a number of search terms in the search bar and the first result, wherein the first visualization includes a chart of a first type; displaying the first visualization in the graphical user interface; receiving an indication of a selection of the first search term within the search bar; in response to receiving the indication of the selection, displaying a drop down list within the graphical user interface, the drop down list including one or more suggested search parameters based on the first search term and a statistic indicating most frequently used search terms; receiving a second search term due to selection of a suggested parameter from the one or more suggested search parameters in the drop down list; displaying the second search term in the search bar, wherein the second search term is displayed simultaneously with the first search term; determining, in response to receiving the second search term, a second result, wherein the second result is based on a number of search terms in the search bar and the second search term; determining, in response to determining the second result, a second visualization for presenting the second result, wherein the second visualization includes a chart of a second type, wherein the second type is different from the first type; and replacing, in response to determining the second visualization, the first visualization with the second visualization adding the first search term, the second search term, and other inputs determined through the graphical user interface to a set of user preferences, wherein the set of user preferences are associated with a particular user, and where the set of user preferences is used to search the one or more data stores or to determine the first visualization or the second visualization; and generating a graph, wherein nodes in the graph are associated with the set of user preferences, and wherein the graph is traversed to determine a user preference.
2. The computer-implemented method of claim 1, wherein the first search term is determined from a text string input into the search bar.
3. The computer-implemented method of claim 1, wherein the one or more suggested search terms are determined based on past searches.
4. The computer-implemented method of claim 1, wherein the second visualization is based on a number of search terms simultaneously displayed in the search bar.
5. The computer-implemented method of claim 1, wherein the first visualization is further based on a stored user preference.
6. The computer-implemented method of claim 1, further comprising: generating one or more additional visualizations, wherein the one or more additional visualizations are based on the first search term, the first result, the second search term, and the second result; and displaying, simultaneously with the second visualization, the one or more additional visualizations in a side bar in the graphical user interface, wherein at least one visualization of the one or more additional visualizations includes a chart of a third type, wherein the third type is different from the second type.
7. The computer-implemented method of claim 1, wherein determining the second result comprises: generating a second query for the second search term; and executing, using the second query, a second search of the one or more data stores, where the second visualization is further based on additional data included with a result of the second search.
8. The computer-implemented method of claim 1, further comprising: adding the first search term and the second search term to a statistical model associated with the particular user, wherein the statistical model is used to determine content relevant to the particular user.
9. The computer-implemented method of claim 1, wherein the set of user preferences include statistics determined from search terms.
10. The computer-implemented method of claim 1, wherein the set of user preferences include information derived from the device when the first search term or the second search term is selected.
11. The computer-implemented method of claim 1, wherein the device is a mobile device.
12. A system, comprising: a search system comprising one or more servers; and a data store storing data indexes; wherein the search system is configured to: cause a graphical user interface to be displayed on a device, wherein the graphical user interface includes a search bar operable to accept user input; receive a first search term entered using the search bar; generate a query using the first search term, wherein the query is generated by rewriting the first search term to a query language form; execute, using the query, a search of one or more data stores by an index searcher; determine a first visualization for presenting a first result obtained from searching the one or more data stores, wherein the first visualization is determined based on a number of search terms in the search bar, context associated with the first search term, and with the first result, wherein the first visualization includes a chart of a first type; display the first visualization in the graphical user interface; receive an indication of a selection of the first search term within the search bar; in response to receiving the indication of the selection, display a drop down list within the graphical user interface, the drop down list including one or more suggested search parameters based on the first search term and a statistic indicating most frequently used search terms; receive a second search term due to selection of a suggested parameter from the one or more suggested search parameters in the drop down list wherein the second search term is present in the search bar, simultaneous with the first search term, and wherein the second search term is entered after the first visualization is displayed; determine, in response to receiving the second search term, a second result, wherein the second result is based on a number of search terms in the search bar and context associated with the second search term; determine, in response to determining the second result, a second visualization for presenting the second result, wherein the second visualization includes a chart of a second type, wherein the second type is different from the first type; and replace, in response to determining the second visualization, the first visualization with the second visualization add the first search term, the second search term, and other inputs determined through the graphical user interface to a set of user preferences, wherein the set of user preferences are associated with a particular user, and where the set of user preferences is used to search the one or more data stores or to determine the first visualization or the second visualization; and generate a graph, wherein nodes in the graph are associated with the set of user preferences, and wherein the graph is traversed to determine a user preference.
13. The computer-implemented method of claim 1, further comprising: determining the chart of the first type, based at least in part on a key term within the search bar, wherein the key term includes at least one of the following terms: versus; target; or projected.
14. The system according to claim 12, wherein the search system is further configured to: generate a second query for the second search term; and execute, using the second query, a second search of the one or more data stores, where the second visualization is further based on additional data included with a result of the second search.
15. The system of claim 14, wherein the first search term is determined from a text string input into the search bar.
16. The system of claim 12, wherein the one or more suggested search terms are determined based on past searches.
17. The system of claim 14, wherein the second visualization is based on a number of search terms simultaneously displayed in the search bar.
18. The system of claim 14, wherein the search system is further configured to: generate one or more additional visualizations, wherein the one or more additional visualizations are based on the first search term, the first result, the second search term, and the second result; and display, simultaneously with the second visualization, the one or more additional visualizations in a side bar in the graphical user interface, wherein at least one visualization of the one or more additional visualizations includes a chart of a third type, wherein the third type is different from the second type.
Description
BACKGROUND
Business intelligence systems typically use large, very complex data stores in the form of databases and data warehouses, as examples. These stores are accessible by sophisticated trained users that can produce the requested information by using complex query structures and reports in the vernacular of the databases.
Typical users do not have this level of sophistication and training to access this information. These users area comfortable with `textual searching` such as that used in Google.RTM. and other search engines. Current systems do not have the capability to provide the user with this type of access, nor do they produce the responses in a format that the user can understand.
Further, with the advent of mobile devices, such as smart phones and tablets, user have become accustomed to accessing data and getting answers wherever they are located. They want to input textual questions, even into complex, large, databases and data warehouses, and receive the answers in an easily understandable format.
BRIEF DESCRIPTION OF THE DRAWINGS
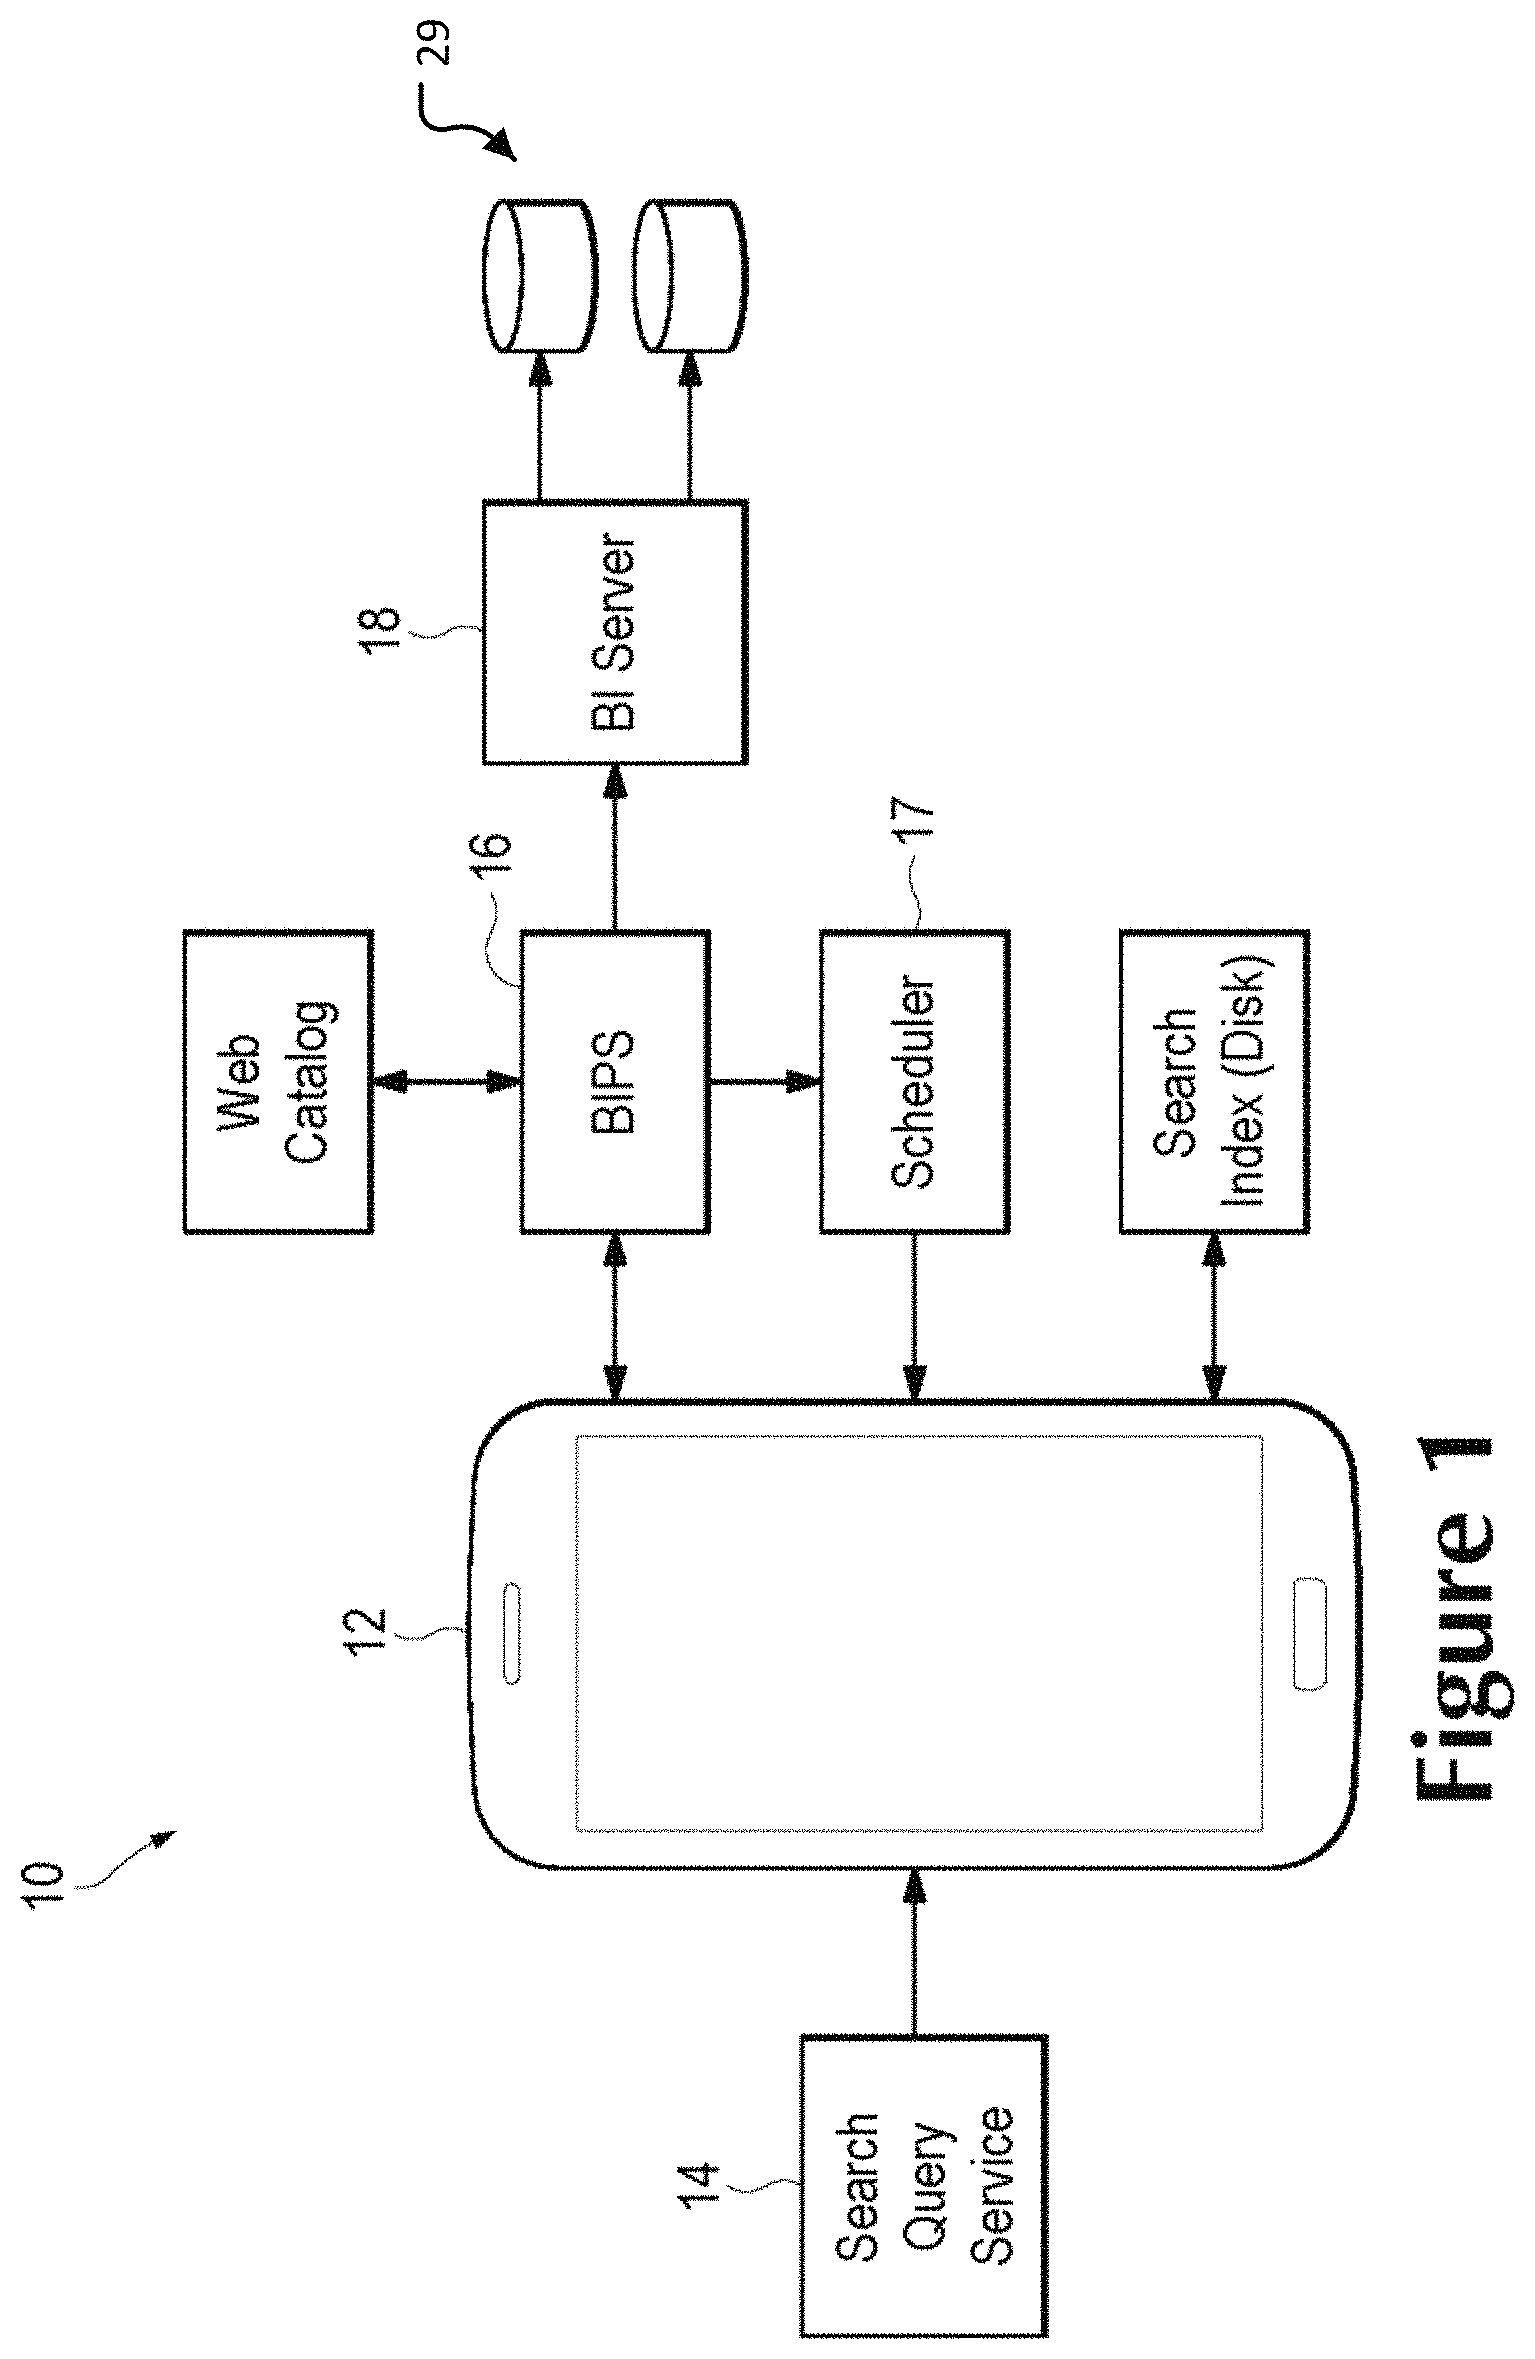
FIG. 1 shows an overall system architecture for a business intelligence search program.
FIG. 2 shows a diagram of a search system usable in a business intelligence program.
FIGS. 3-10 show examples of user interfaces for textual searching.
DETAILED DESCRIPTION OF THE EMBODIMENTS
FIG. 1 shows an overall system diagram for a business intelligence search engine 10. FIG. 1 includes a user device, which may be referred to as a client 12, upon which is running a search query service 14. In one embodiment, the query search service 14 is a Java.RTM. service running in a J2EE environment. The search is provided to a business intelligence presentation service (BIPS 16), also referred to as the presentation layer, and a scheduler 17 that may schedule and manage the data indexing. The data indexing may take the form of data crawls through the data structure and multiple crawls may be occurring at once. The business intelligence (BI) server 18 then accesses the various data stores 29 available, which may include databases, data warehouses, etc.
The search system allows a user that does not have a background in databases and data warehouses to perform a textual search of the data to get an answer to a simple query. The answer may take the form of a graphical representation of the answer, allowing the user to visualize the answer.
The search system has several components that operate to take the user's request and produce an answer in a form the user can quickly understand. Through a user interface, the user can enter a query into the business intelligence system (BI) in the form of a `regular` question. Examples include queries like, "What is the revenue of iPods for the North East in 2011?" or "Compare 2011 Q1 revenue to 2012 Q3."
FIG. 2 illustrates a business intelligence (BI) search application 200. The search service 30 launches a search query rewriter 32 to generate a query in terms that the data index storage repository 29 can `understand.` These are then queried by the index searcher 34. For example, the questions above may be rewritten to queries in a query language such as SQL (Structured Query Language) corresponding to "Revenue iPods North East 2011" and "Revenue 2011 Q1 vs Revenue 2012 Q3." These are then used by the index searcher 34 to access the disk 29. A text to query generator 36 takes the indexed searches and generates a query for which the visualization, such as a bar chart or other graph, is generated. The queries and their visualizations are then sent to the presentation server (BIPS 38) and the BI server 400 to generate SQL Queries.
The Crawl Service 20 may launch according to a schedule. As mentioned before, the Crawl Service 20 and the Query service may be Java.RTM. services running in a J2EE environment. The crawl service 20 invokes a crawl manager 22 that manages the various crawls that may be running at the same time. The crawl manager 22 may, for example, limit the number of crawls operating simultaneously to one, and set up a queue for the other crawl requests.
The crawl manager 22 launches a crawl task 24. The crawl task 24 may be initiated through the BI Search Semantic Indexing Scheduler, an automated process that performs the crawl. The progress of a crawl, such as the statistics of number of areas indexed, number of subject area columns indexed, total number data values indexed, etc., may be stored in the business intelligence log files as informational entries. The areas indexed may include metadata, such as measures, dimensions and data members and attributes. Once a crawl has been completed, the admin user may be notified using the delivery of a message, success or failure. Further, the system may provide monitoring of the crawl. The crawling user may receive an email indicating that the crawl has begun, with the option of a link to allow the user to stop the crawl. When the crawl completes, another email may notify the user of its completion.
The crawl task 24 in turn then launches query executors 26 that convert the queries into SQL, or other language, queries that will execute on the data gathered by the crawl task 24. In order to make use of that data later, the query executors 26 start index writers 28 to index the queries and write them to some sort of storage repository 29. The query executors 26 also send the queries to the presentation server (e.g., the BIPS 38), which in turn sends the queries to the business intelligence server 40. The indexes of the queries will be where the user's search will operate.
When the user enters the desired search, the search process converts it to queries and accesses the index of the semantic layer (rpd file) to provide the answers. As discussed above, the search system allows the user to input `textual searches` in the form most users are familiar and returns a graph that allows a user to understand the answer easily. When the users launches the search interface on the user's device, typically a smart phone or other mobile device, that starts the search service 30. The user then inputs a search term or terms, which can be of varying levels of complexity.
FIGS. 3-10 show examples of these interfaces 50 and help in explaining some assumptions that are made by the system to provide the user with information and options. For example in FIG. 3, the user has selected one search term, `revenue.` Referring back to FIG. 2, the search service 30 receives the user input for revenue and passes it to the search query rewriter 32, which then takes the term and rewrites it into a query language form, such as SQL. The rewritten query is then used by the index searchers 34 to locate the revenue information located in the data repository 29 and retrieves that information for the text-to-query generator 36. The text-to-query generator 36 converts the results of the search into some sort of user-friendly format, referred to here as a visualization, to be presented by the presentation server (e.g., the BIPS 38). The search and its resultant metadata, which may include the SQL statements, the results from the index searchers 34, and the visualization, may then be stored in the BI server 40.
As the user navigates the search and results, the system gathers statistics to find the most relevant content for a given query. This information will be used to make the next execution of that query work faster and produce more relevant results. Similarly, the system `learns` common analysis and visualization patterns. This will become clearer as the discussion goes through the user interfaces.
In FIG. 3, the user wants to know the total revenue, so just types in "Revenue" at the search bar 52 and the system returns the response shown, revenue of $5 million. At any point in the process, the user may have the ability to save the `report` or the visualization and the data upon which is relies. That saving of information may also include the metadata above. As mentioned above, the system has the ability to `learn` or make itself more efficient. One way the system may learn is to store the report and its parameters. When the user logs in again, the system could offer that report for the user's review, or could offer to update the information in the report. This gives the system a head start on generating a new report. As the user continues to use the system, the number of previously-accomplished searches and results will be available for the system to use.
In one embodiment, the system learns based on several different aspects of interactions with the user. These include, but are not limited to: frequently used terms in the search by a user; frequently used visualization by the user, based on the number of metrics and breakdowns (dimensions); frequently used data values, such as product: iPod, iPad etc., frequently queried metrics; time of the day, week and month a user is searching for certain information (for example, during the close of the quarter what metrics do people in the finance department query); and location where the user queries the data if enabled in a mobile device. The system builds a graph of different nodes, such as User, Terms, Metrics, Time of Day and Location. It then uses a combination of graph traversal algorithms in which all of the nodes are visited in a set sequence, updating and/or checking their data during the sequence, text clustering algorithms in which text is clustered using descriptors and descriptor extraction, and Naive Bayesian algorithms in which probabilistic classifiers based upon Bayes' theorem with strong, or naive, independence assumptions between the features, to learn the user preferences and also relative relevancy of matches.
Referring back to FIG. 3, the user only chose one search term, `revenue.` The user may be given the ability to make this more definite, by clicking next to the already-selected term in the search bar. In FIG. 4, the user adds 2010 as an added parameter, and the response shows revenue for $2 million. In addition in FIG. 4, one can see a drop down list 56 of suggested other parameters. As mentioned above, the search process may document and save the search terms and their associated queries for future use. In one embodiment, they are stored by user, so the system can access a list of terms used by the user and the statistics of the most frequently used terms 54. Accessing this list would allow the system to populate the drop down list 56.
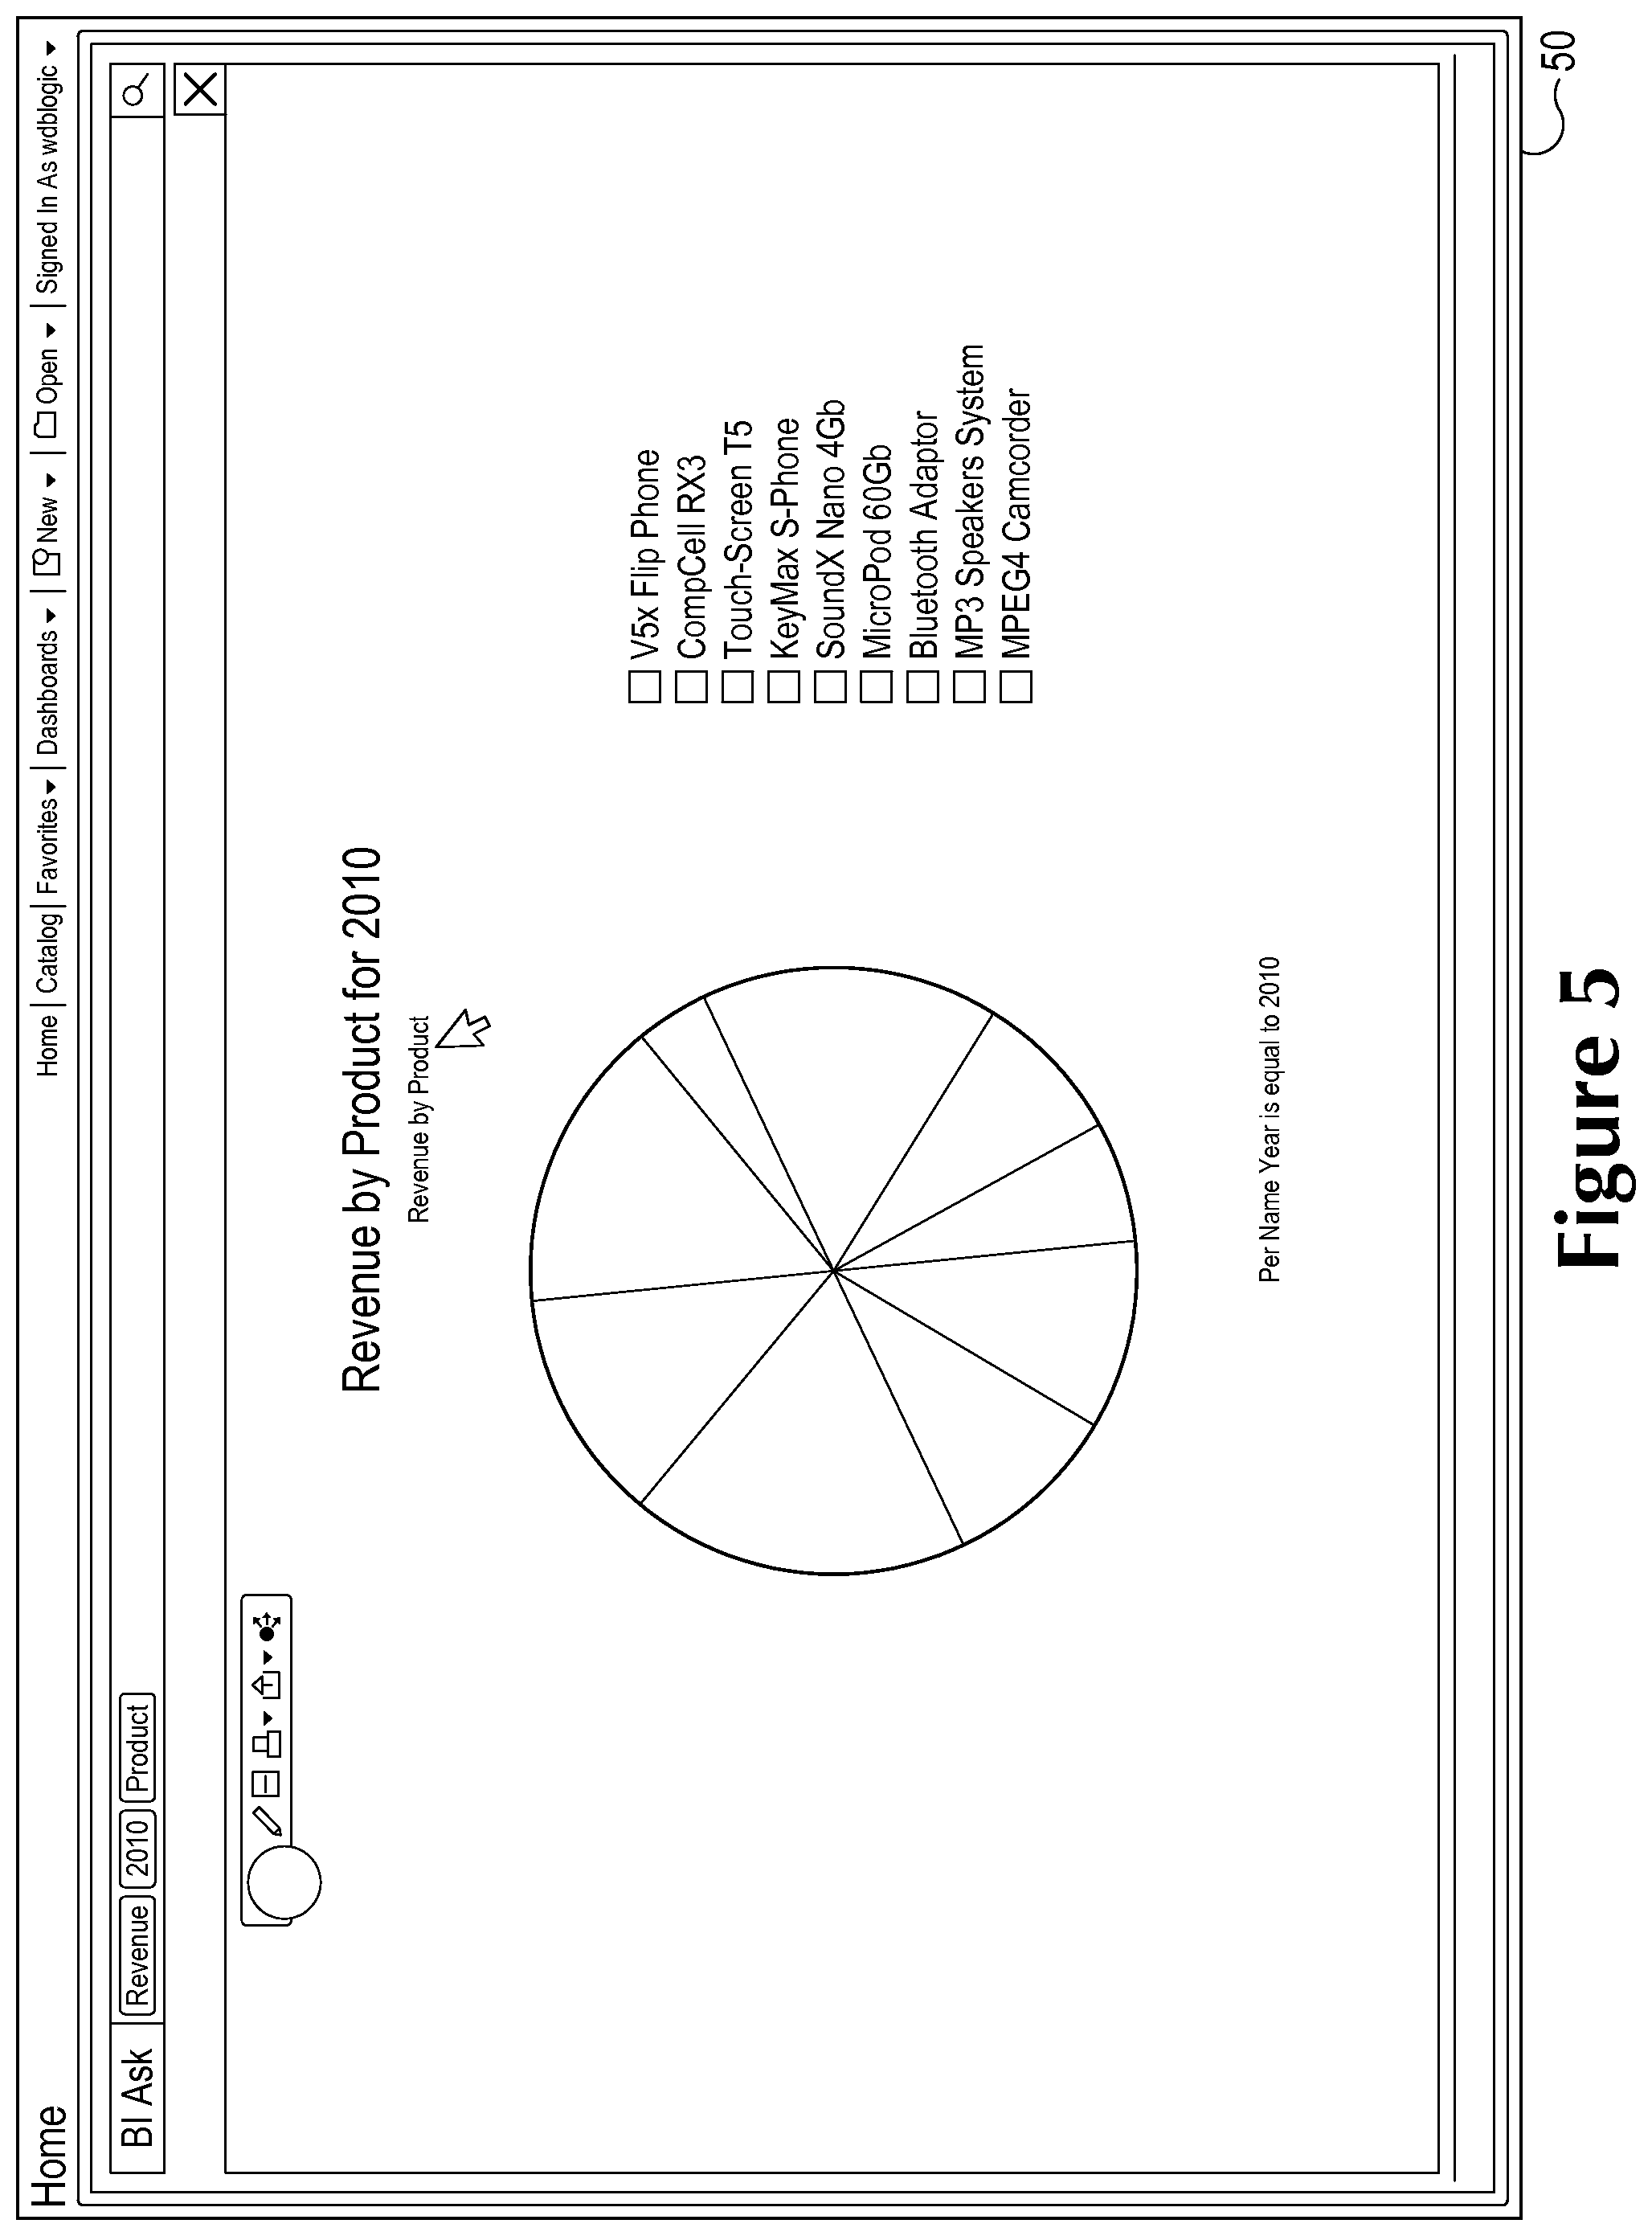
In FIG. 5, the user has added in the parameter of revenue by product. The system automatically generates a new view, in this case a pie chart. The added terms may be typed in by the user or may be accessed by a pulldown list 56 as shown in FIG. 4. These options also include the user typing in the questions discussed above, like "Compare 2011 Q1 revenue to 2012 Q3."
As the system presents visualizations such as the pie chart in FIG. 5, it can also offer other formats for the user. In some cases, the user may type in the terms `pie chart` or `bar graph` in the search bar. The system would then present the appropriate visualization. The system can use this as another opportunity to learn about the user and gather statistics as to what types of visualizations the user prefers. This particular user may prefer pie charts, so the system may default to presenting information to the user in pie charts. The level of complexity of the information is left up to the system designer as to how much information about the user the system should use and to what level of granularity.
For example, in FIG. 6, the additional element of `target revenue` is added. There are now four elements to the user's search, each of which will have its own query statements, results and conversion to visualization. The user may have different visualization depending upon the number of elements of the search, or the nature of the search. He or she may prefer comparative bar charts 60 as shown in FIG. 6 when there is a `target` or `projected` or the term `versus` in the original search request. The system gathers all of this information and accesses it when the user logs in and performs a search. The text-to-query generator 36 can retrieve it from the BI server 40 and use it to generate the visualizations. Also shown in FIG. 6 is a side bar 62 that displays other visualization options to the user. If the user starts selecting one of the other charts more frequently, the system will gather this statistic as well and use it to learn the user's preferences.
FIG. 7 shows an alternative view for presentation to the user. One should note that the sidebar only shows this type of chart and pie charts as options. This may be based upon the user's preferences as noted above, or may be based upon the level of complexity of the query. However, this does not limit the user to those particular types. Under the term `chart` in the search bar, as shown in FIG. 8, the pull down list allows the user to select one of many different charts. As the user uses the system and this information is gathered, the system will start to be more accurate in matching the offered visualizations with the user's preference, making the system more efficient and user friendly.
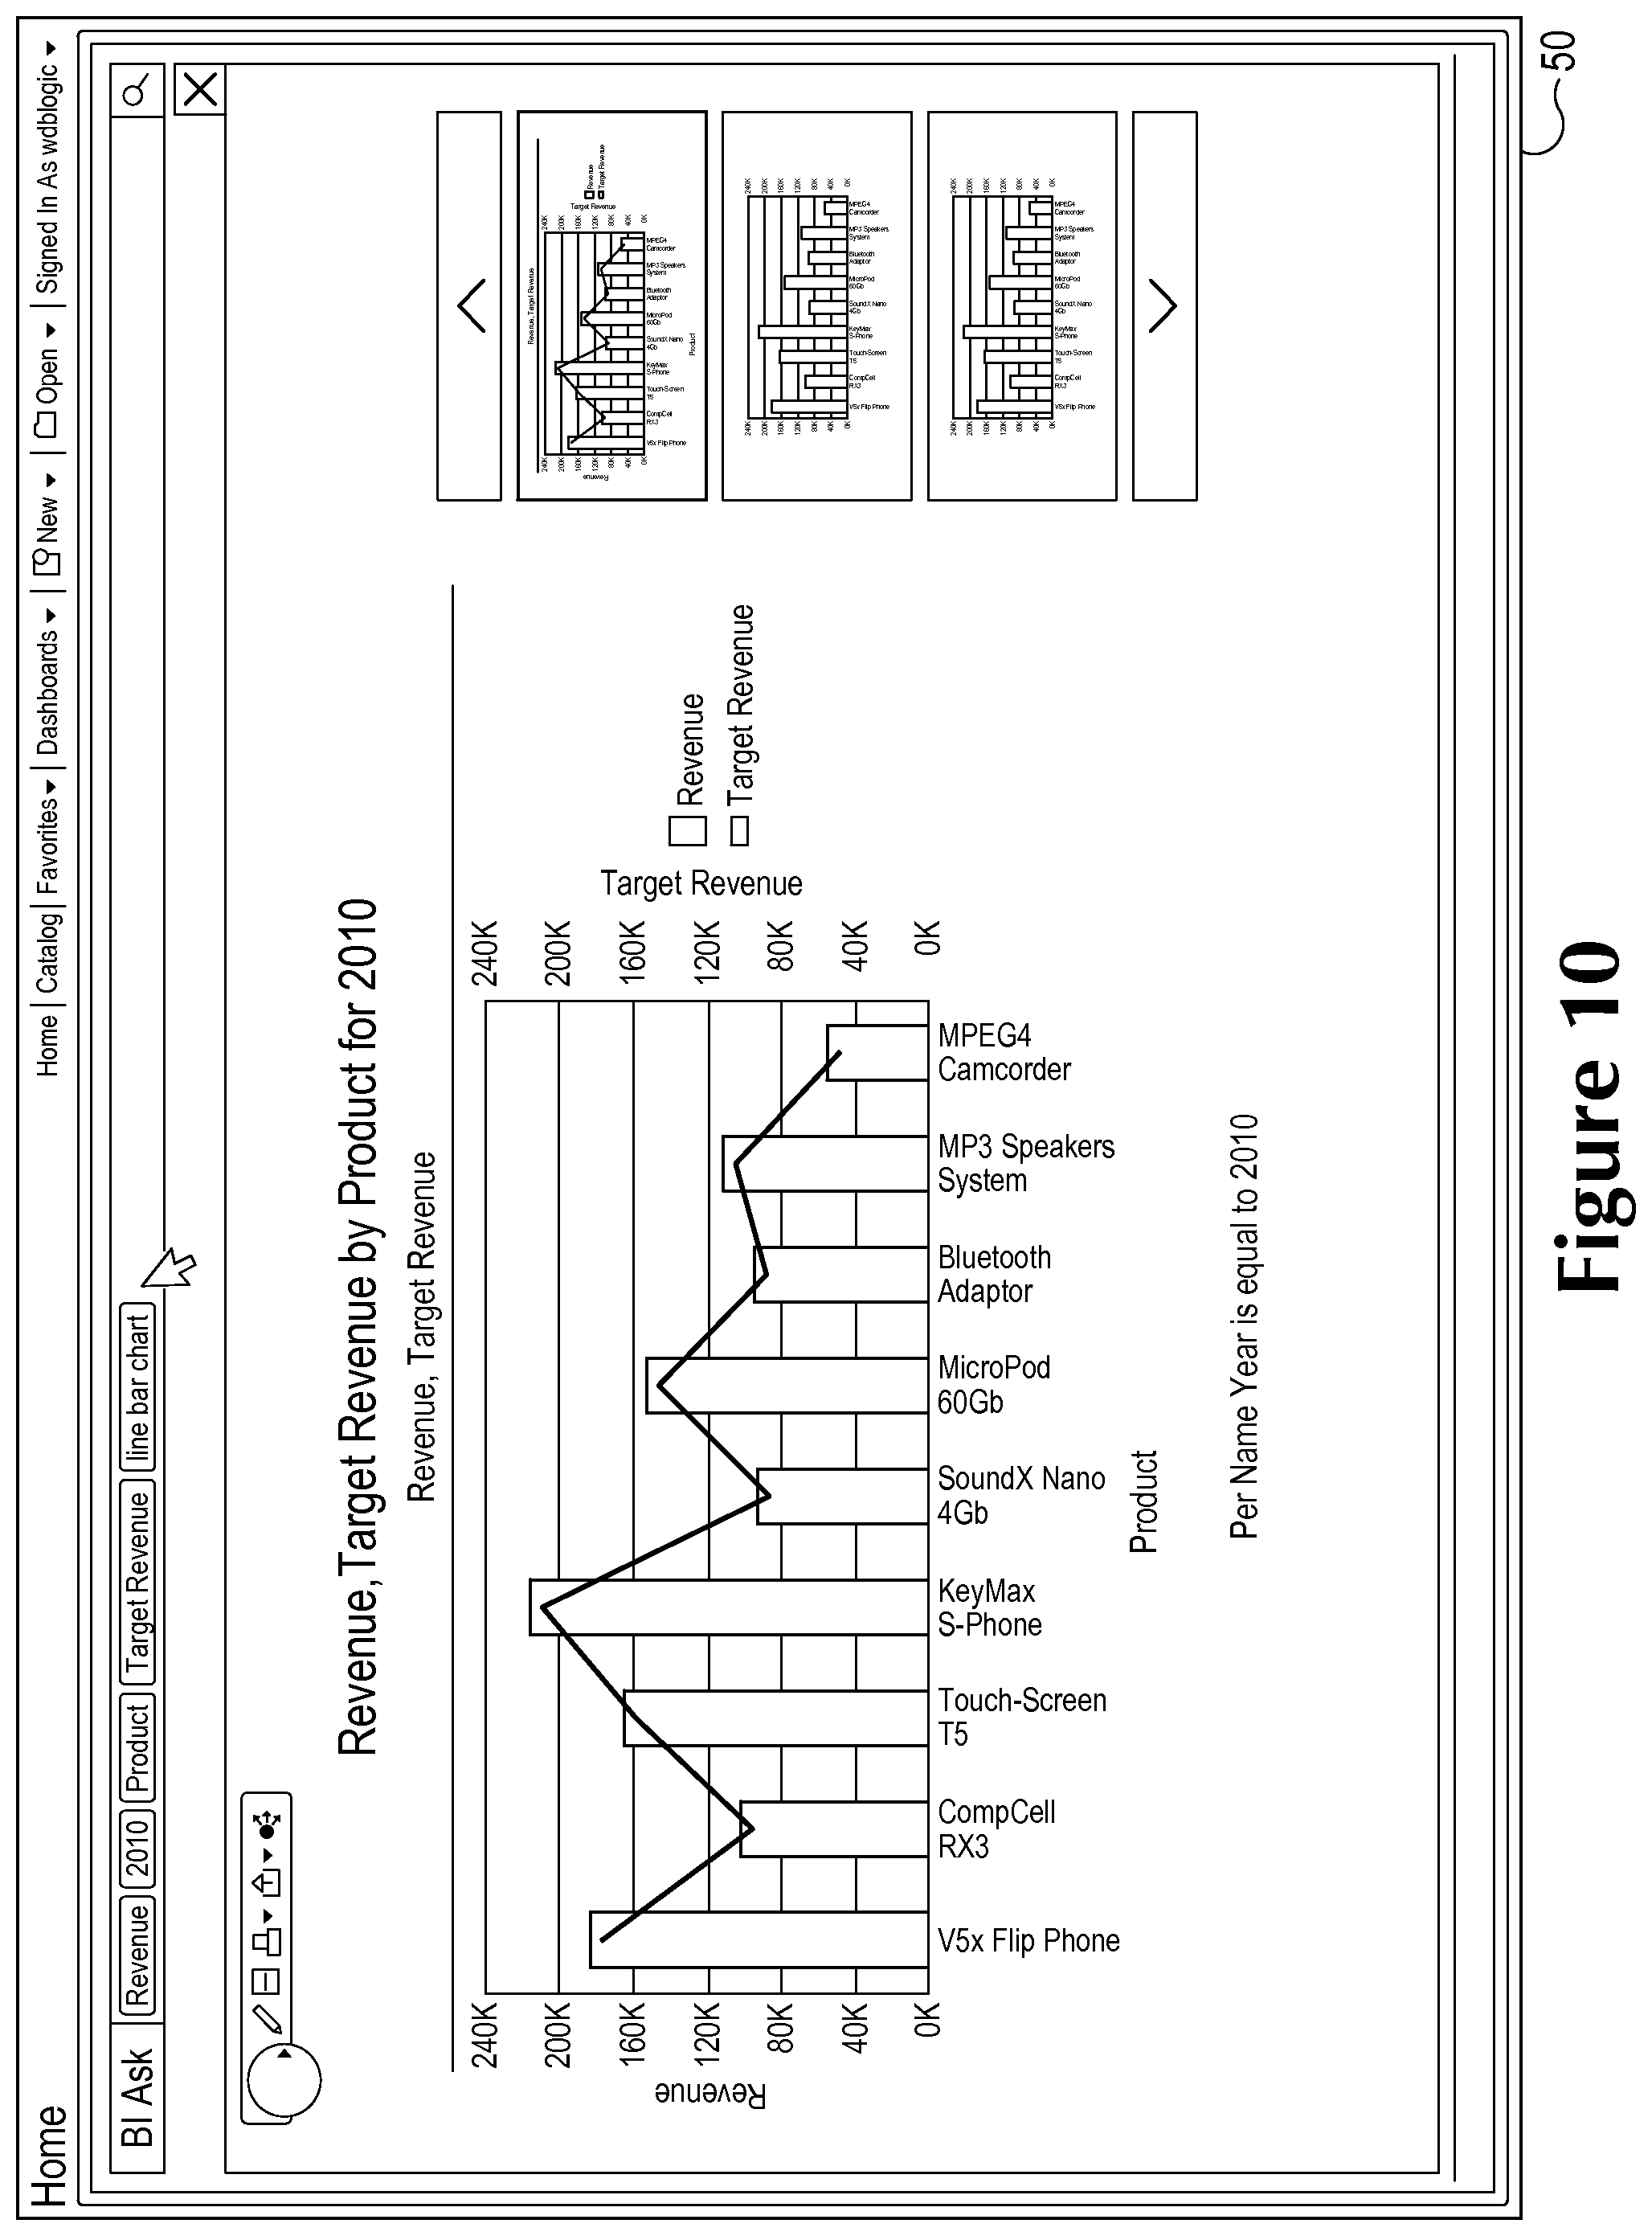
FIG. 9 shows the resulting line bar chart, with other line bar charts offered to the right. If the user decides that he or she does not want to see the discount amount that is included with the chart, highlighted in FIG. 9, the user can remove it. Each of the search terms in the search bar will have their own pull down list to allow the user to change or delete that term. In FIG. 10 shows an example in which the user as removed the discount amount term from the search bar. The removal of a term is not necessarily depending upon the other terms in the search bar.
One should note that the above user interfaces 50 were shown in `desktop` form, but will have mobile versions as well. Using this system, a relatively unsophisticated user can access the wealth of data stored in their organizations business intelligence system. The system can gather statistics on the user's interaction with the system to allow it to offer suggestions as to search terms, visualizations, reports, etc. The storage of the resulting searches and visualizations will also allow the system to have access to already formatted query statements and other information to make it run more efficiently.
It will be appreciated that several of the above-disclosed and other features and functions, or alternatives thereof, may be desirably combined into many other different systems or applications. Also that various presently unforeseen or unanticipated alternatives, modifications, variations, or improvements therein may be subsequently made by those skilled in the art which are also intended to be encompassed by the embodiments here.
* * * * *
References
-
powerbi.microsoft.com/en-us/documentation/powerbi-service-get-data
-
en.wikipedia.org/wiki/Google_Now
-
-
-
-
thoughtspot.com
-
venturebeat.com/2013/12/10/birst-boosts-business-intelligence-with-google-like-search-to-visualize-data
D00000
D00001
D00002
D00003
D00004
D00005
D00006
D00007
D00008
D00009
D00010
XML
uspto.report is an independent third-party trademark research tool that is not affiliated, endorsed, or sponsored by the United States Patent and Trademark Office (USPTO) or any other governmental organization. The information provided by uspto.report is based on publicly available data at the time of writing and is intended for informational purposes only.
While we strive to provide accurate and up-to-date information, we do not guarantee the accuracy, completeness, reliability, or suitability of the information displayed on this site. The use of this site is at your own risk. Any reliance you place on such information is therefore strictly at your own risk.
All official trademark data, including owner information, should be verified by visiting the official USPTO website at www.uspto.gov. This site is not intended to replace professional legal advice and should not be used as a substitute for consulting with a legal professional who is knowledgeable about trademark law.