Gene-expression profiling with reduced numbers of transcript measurements
Lamb , et al.
U.S. patent number 10,619,195 [Application Number 13/646,294] was granted by the patent office on 2020-04-14 for gene-expression profiling with reduced numbers of transcript measurements. This patent grant is currently assigned to The Broad Institute, Inc., Dana-Farber Cancer Institute, Inc., Massachusetts Institute Of Technology. The grantee listed for this patent is THE BROAD INSTITUTE, INC., DANA-FARBER CANCER INSTITUTE, INC., Massachusetts Institute of Technology. Invention is credited to Todd R. Golub, Justin Lamb, David D. Peck, Aravind Subramanian.


| United States Patent | 10,619,195 |
| Lamb , et al. | April 14, 2020 |
Gene-expression profiling with reduced numbers of transcript measurements
Abstract
The present invention provides compositions and methods for making and using a transcriptome-wide gene-expression profiling platform that measures the expression levels of only a select subset of the total number of transcripts. Because gene expression is believed to be highly correlated, direct measurement of a small number (for example, 1,000) of appropriately-selected transcripts allows the expression levels of the remainder to be inferred. The present invention, therefore, has the potential to reduce the cost and increase the throughput of full-transcriptome gene-expression profiling relative to the well-known conventional approaches that require all transcripts to be measured.
| Inventors: | Lamb; Justin (Cambridge, MA), Golub; Todd R. (Newton, MA), Subramanian; Aravind (Cambridge, MA), Peck; David D. (Framingham, MA) | ||||||||||
|---|---|---|---|---|---|---|---|---|---|---|---|
| Applicant: |
|
||||||||||
| Assignee: | Massachusetts Institute Of
Technology (Cambridge, MA) The Broad Institute, Inc. (Cambridge, MA) Dana-Farber Cancer Institute, Inc. (Boston, MA) |
||||||||||
| Family ID: | 48042450 | ||||||||||
| Appl. No.: | 13/646,294 | ||||||||||
| Filed: | October 5, 2012 |
Prior Publication Data
| Document Identifier | Publication Date | |
|---|---|---|
| US 20130090254 A1 | Apr 11, 2013 | |
Related U.S. Patent Documents
| Application Number | Filing Date | Patent Number | Issue Date | ||
|---|---|---|---|---|---|
| PCT/US2011/031395 | Apr 6, 2011 | ||||
| PCT/US2011/031232 | Apr 5, 2011 | ||||
| 61321298 | Apr 6, 2010 | ||||
| 61321385 | Apr 6, 2010 | ||||
| Current U.S. Class: | 1/1 |
| Current CPC Class: | C12Q 1/6809 (20130101); G16B 25/00 (20190201); C12Q 1/6837 (20130101); G16B 40/00 (20190201); C12Q 1/6809 (20130101); C12Q 2537/159 (20130101); C12Q 2537/165 (20130101) |
| Current International Class: | C12Q 1/6837 (20180101); G16B 40/00 (20190101); G16B 25/00 (20190101); C12Q 1/6809 (20180101) |
References Cited [Referenced By]
U.S. Patent Documents
| 6873914 | March 2005 | Winfield et al. |
| 7542959 | June 2009 | Barnhill et al. |
| 2003/0017481 | January 2003 | Golub et al. |
| 2004/0210400 | October 2004 | Konvicka |
| 2004/0265874 | December 2004 | Binder et al. |
| 2005/0100929 | May 2005 | Najarian |
| 2005/0158756 | July 2005 | Hare et al. |
| 2006/0074566 | April 2006 | Najarian |
| 2007/0016390 | January 2007 | Bernardo et al. |
| 2007/0065844 | March 2007 | Golub et al. |
| 2007/0239415 | October 2007 | Saito |
| 2008/0221395 | September 2008 | Potts et al. |
| 2009/0247415 | October 2009 | Van Eijk |
| 2011/0263441 | October 2011 | Golub et al. |
| 2013/0090254 | April 2013 | Lamb et al. |
| 2556185 | Aug 2014 | EP | |||
| 02068579 | Sep 2002 | WO | |||
| 2011127150 | Oct 2011 | WO | |||
Other References
|
Cao, "Recent developments in ligase-mediated amplification and detection" 22(1) Trends in Biotechnology 38-44 (2004). cited by examiner . H. Ben Hsieh, et al., High Speed Detection of Circulating Tumor Cells, Biosensors and Bioelectronics (2006) vol. 21, p. 1893-1899. cited by applicant . K. Y. Yeung, et al., Principal Component Analysis for clustering Gene Expression Data, Bioinformatics (2001) vol. 17, No. 9, p. 763-774. cited by applicant . E. Capobianco, Model Validation for Gene Selection and Regulation Maps, Funct Integr Genomics (2008) vol. No. 2, p. 87-99. cited by applicant . W. G. Finn, Diagnostic Pathology and Laboratory Medicine in the Age of "omics", J. Mol. Diagn. (2007) vol. 9, No. 4, p. 431-436. cited by applicant . Hilario, et al., Approaches to Dimensionality Reduction in Proteomic Biomarker Studies, Brief Bioinform (2008) vol. 9, No. 2, p. 102-118. cited by applicant . Koren, et al., Robust Linear Dimensionality Reduction, IEEE Trans Vis Comput Graph. (2004) vol. 10, No. 4, p. 459-470. cited by applicant . Motsinger, et al., Multifactor Dimensionality Reduction: An Analysis Strategy for Modeling and Detecting Gene-Gene Interactions in Human Genetics and Pharmacogenomics Studies, Hum Genomics (2006) vol. 2, No. 5, p. 318-328. cited by applicant . D'Haeseleer P et al: Genetic network inference: from co-expression clustering to reverse engineering, Bioinformatics, Oxford University Press, Surrey, GB, vol. 16, No. 8, Aug. 1, 2000 (Aug. 1, 2000), pp. 707-726. cited by applicant . Written Opinion dated Oct. 28, 2016, which issued during prosecution of Singapore Application No. 1020151626S. cited by applicant . Peck, et al. "A method for high-throughput gene expression signature analysis" Genome Biology, 2006, 7:R61, doe:10.1186/gb-2006-7-7-r61). cited by applicant . Subramanian, et al. "GSEA-P: a desktop application for Gene Set Enrichment Analysis" Bioinformatics, 2007, 23(23):3251-3253. cited by applicant . Dabney, A.R., et al. "Classificationof microarrays to nearest centroid" Bioinformatics, 2005, 21(22):4148-4154. cited by applicant . Examination Report for the corresponding European application No. 11766644.4, dated Jul. 16, 2018 (9 pages). cited by applicant . First Examination Report in corresponding Indian application No. 9134/CHENP/2012, received Jul. 9, 2018 (8 pages). cited by applicant . Examination Report in corresponding Canadian application No. 2795554, received Dec. 12, 2018 (3 pages). cited by applicant . Readhead et al., Expression-based Drug Screening of Neural Progenitor Cells from Individuals with Schizophrenia, Nature Communications, 2018, 1-13, vol. 9, Article No. 4412. cited by applicant. |
Primary Examiner: Leith; Nancy J
Attorney, Agent or Firm: Hunter-Ensor; Melissa Haaland; Wade Greenberg Traurig, LLP
Government Interests
FEDERAL FUNDING LEGEND
This invention was made with government support under Grant Nos. CA133834 and U54 6916636 awarded by the National Institutes of Health. The government has certain rights in the invention.
Parent Case Text
RELATED APPLICATIONS AND INCORPORATION BY REFERENCE
This application is a continuation-in-part application of international patent application Serial No. PCT/US2011/031395 filed 6 Apr. 2011, which published as PCT Publication No. WO 2011/127150 on 13 Oct. 2011, which claims benefit of U.S. provisional patent application Ser. No. 61/321,298 filed 6 Apr. 2010.
This application is also a continuation-in-part application of international patent application Serial No. PCT/US2011/031232 filed 5 Apr. 2011, which published as PCT Publication No. WO 2011/127042 on 13 Oct. 2011, which claims benefit of U.S. provisional patent application Ser. No. 61/321,385 filed 6 Apr. 2010.
Claims
What is claimed is:
1. A method for making a transcriptome-wide expression profile of a biological sample, said method consisting essentially of: a) measuring simultaneously the expression levels of a selected group of approximately 500 to approximately 1000 centroid genes set forth in Table 3, wherein said measuring comprises ligation-mediated amplification; b) determining the expression levels of unmeasured non-centroid genes and unmeasured non-selected centroid genes from the measured expression levels obtain in step (a); c) combining the results of steps (a) and (b) to produce a transcriptome-wide expression profile; and d) providing the transcriptome-wide expression profile as output data, wherein the biological sample comprises a plurality of centroid transcripts and non-centroid transcripts, and wherein the transcriptome consists of centroid transcripts and non-centroid transcripts.
2. The method according to claim 1, wherein the selection of centroid genes to be measured is provided by a) performing computational analysis on a library of transcriptome-wide transcript expression data, such that a plurality of transcript clusters is created, wherein the number of said clusters is less than the total number of transcripts in the library; b) identifying a centroid transcript and non-centroid transcripts within each of said transcript clusters wherein each centroid transcript is the expression from a respective centroid gene and each non-centroid transcript is the expression from a respective non-centroid gene and wherein the measured expression levels of said centroid gene facilitates the calculation of the levels of at least a portion of transcripts from said non-centroid genes; and c) selecting said centroid genes whose said expression levels facilitate the calculation of the levels of said portion of unmeasured, non-centroid transcripts.
3. The method according to claim 2, wherein said computational analysis includes cluster analysis.
4. The method of claim 2, wherein said method further comprises repeating the steps thereof until validated centroid transcripts for each of said plurality of transcript clusters are identified.
5. The method according to claim 1, wherein expression levels are measured on a device selected from the group consisting of a microarray, a bead array, a liquid array, and a nucleic-acid sequencer.
6. The method according to claim 5, wherein said method steps include: a) performing computational analysis on a first library of transcriptome-wide mRNA expression data from a first collection of biological samples, such that a plurality of transcript clusters is created, wherein the number of said clusters is less than the total number of transcripts in the library; b) identifying a centroid transcript and non-centroid transcripts within each of said transcript clusters, wherein each centroid transcript is the expression from a respective centroid gene and each non-centroid transcript is the expression from a respective non-centroid gene; c) measuring the levels of at least a portion of transcripts from a second collection of biological samples with said device, wherein said portion of transcripts comprises transcripts identified as centroid transcripts from the first library; d) determining if said measured expression levels of said centroid genes facilitates the calculation of the levels of at least a portion of transcripts from said second library, wherein said portion is comprised of non-centroid transcripts; and e) selecting said centroid genes whose said expression levels facilitate the calculation of the levels of said portion of unmeasured, non-centroid transcripts.
7. The method according to claim 6, wherein the expression levels of non-centroid genes are determined by: applying an algorithm to said measured expression level of the selected centroid genes of Table 3 in step (a), wherein the algorithm facilitates the calculation of the level of the non-centroid transcripts that are not measured.
8. The method according to claim 7, wherein said algorithm involves a dependency matrix.
9. The method of claim 7 wherein said measured transcripts consist of 1000 different sample transcripts that are the 1000 centroid transcripts set forth in Table 3.
10. The method of claim 6, wherein said method further comprises repeating the steps for providing the centroid transcripts until validated centroid transcripts for each of said plurality of transcript clusters are identified.
11. The method according to claim 1, wherein said measured transcripts are expressed from approximately 1000 selected centroid genes set forth in Table 3.
12. The method according to claim 11, wherein said method further comprises determining similarity between said determined transcriptome-wide expression profile and expression profiles of diseased and normal cells or tissues, to further identify said biological sample as diseased or as healthy.
13. The method according to claim 11, wherein said transcriptome-wide expression profile provides a functional readout of the action of a perturbagen.
14. The method according to claim 11, wherein said biological sample comprises cultured human cells treated with a plurality of perturbagens, and said method further comprises repeatedly performing the method with different biological samples to obtain a plurality of transcriptome-wide expression profiles, and populating a database with the plurality of transcriptome-wide gene-expression profiles.
15. The method according to claim 11, wherein said method further comprises measuring expression levels of substantially invariant transcripts.
16. The method according to claim 15, wherein said measured expression levels are normalized with respect to said expression levels of said substantially invariant transcripts.
17. The method according to claim 1, wherein said method further comprises establishing a correlation between said expression levels of the selected group of centroid genes and said expression levels of said non-centroid genes.
18. The method according to claim 1, wherein the expression levels of non-centroid genes are determined by: applying an algorithm to said measured expression level of the selected centroid genes of Table 3 in step (a), wherein the algorithm facilitates the calculation of the level of the non-centroid transcripts that are not measured transcripts within said second population.
19. The method according to claim 18, wherein said algorithm involves a dependency matrix.
20. The method according to claim 1, wherein said method further comprises determining similarity between said determined transcriptome-wide expression profile and expression profiles of diseased and normal cells or tissues to characterize said biological sample as diseased or as healthy.
21. The method according to claim 1, wherein said transcriptome-wide expression profile provides a functional readout of the action of a perturbagen.
22. The method according to claim 1, wherein said biological sample comprises cultured human cells treated with a plurality of perturbagens, and said method steps include repeatedly performing the method with different biological samples to obtain a plurality of transcriptome-wide expression profiles, and populating a database with the plurality of transcriptome-wide gene-expression profiles.
23. The method according to claim 22, wherein said method further comprises analyzing the database populated with the plurality of transcriptome-wide gene expression profiles against another gene-expression profile or database of gene-expression profiles for similarities.
24. The method according to claim 1, wherein said method further comprises measuring levels of substantially invariant transcripts.
25. The method according to claim 24, wherein said measured levels of the centroid transcripts are normalized with respect to said levels of said substantially invariant transcripts.
26. The method of claim 1 wherein said ligation mediated amplification comprises using probe pairs for each of the sample transcripts that are centroid transcripts, obtaining and fluorescence labeling amplicons, detecting fluorescence, and associating median fluorescence intensity values for each transcript.
27. The method according to claim 26, wherein the expression levels of non-centroid genes are determined by: applying an algorithm to said measured expression level of the selected centroid genes of Table 3 in step (a), wherein the algorithm facilitates the calculation of the level of the non-centroid transcripts that is not measured.
28. The method according to claim 27, wherein said algorithm involves a dependency matrix.
29. The method according to claim 27, wherein the expression levels of non-centroid genes are determined by: applying an algorithm to said plurality of measurements, wherein the algorithm facilitates the calculation of the level of the non-centroid transcripts that is not measured.
30. The method according to claim 1, wherein said measured transcripts are from approximately 700 selected centroid genes set forth in Table 3.
31. The method according to claim 30, wherein the expression levels of non-centroid genes are determined by: applying an algorithm to said measured expression level of the selected centroid genes of Table 3 in step (a), wherein the algorithm facilitates the calculation of the level of the non-centroid transcripts that are not measured transcripts within said second population, and the measured.
32. A method according to claim 31, wherein said algorithm involves a dependency matrix.
33. The method according to claim 30, wherein the method further comprises determining similarity between said determined transcriptome-wide expression profile and expression profiles of diseased and normal cells or tissues, to further identify said biological sample as diseased or as healthy.
34. A method according to claim 30, wherein said transcriptome-wide expression profile provides a functional readout of the action of a perturbagen.
35. A method according to claim 30, wherein said biological sample comprises cultured human cells treated with a plurality of perturbagens, and said method steps include repeatedly performing the method with different biological samples to obtain a plurality of transcriptome-wide expression profiles, and populating a database with the plurality of transcriptome-wide gene-expression profiles.
36. A method according to claim 30, wherein said method further comprises measuring levels of substantially invariant transcripts.
37. A method according to claim 36, wherein said measured levels are normalized with respect to said levels of said substantially invariant transcripts.
38. The method of claim 30, wherein, said measuring includes oligonucleotide probes which detect at least RNA or cDNA transcripts.
39. The method of claim 1, wherein said measured transcripts consist of 1000 different sample transcripts that are the 1000 centroid transcripts set forth in Table 3.
40. The method of claim 1, wherein said measuring includes amplifying said measured sample transcripts.
41. The method of claim 1, wherein said measuring includes oligonucleotide probes which detect RNA or cDNA transcripts.
42. The method of claim 1, wherein the dataset is stored in a database, is displayed in a format for interpretation, is transmitted to a computer, or is used to generate a report.
43. A method for making a transcriptome-wide expression profile of a biological sample said method comprising: a) measuring simultaneously the expression levels of a selected group approximately 500 to approximately 1000 centroid genes set forth in Table 3, wherein the measuring comprises detecting the measured transcripts using ligation-mediated amplification, optically-addressed and barcoded microspheres, and flow cytometry; b) determining the expression levels of unmeasured non-centroid genes and unmeasured non-selected centroid genes from the measured expression levels obtain in step (a); c) combining the results of steps (a) and (b) to produce a transcriptome-wide expression profile; and d) providing the transcriptome-wide expression profile as output data, wherein the biological sample comprises a plurality of transcripts of centroid transcripts and non-centroid transcripts, and wherein the transcriptome consists of centroid transcripts and non-centroid transcripts.
44. The method of claim 43, wherein, said measuring includes oligonucleotide probes which detect at least RNA or cDNA transcripts.
45. A method for making a transcriptome-wide expression profile of a biological sample without having to measure all the transcripts in the biological sample, said method comprising: (a) measuring simultaneously the expression levels of a selected group of approximately 500 to approximately 1000 selected centroid genes set forth in Table 3, wherein the measuring comprises contacting the sample with at least one probe, (b) measuring the expression levels of a set of substantially invariant genes in said biological sample, (c) normalizing said measured expression levels of the selected centroid genes with respect to said expression levels of said substantially invariant genes, (d) determining the expression levels of unmeasured non-centroid genes and unmeasured non-selected centroid genes from the measured expression levels obtain in step (c); (e) combining the results of steps (c) and (d) to produce a transcriptome-wide expression profile; and (f) providing the transcriptome-wide expression profile as a dataset, wherein the biological sample comprises a plurality of transcripts consisting essentially of centroid transcripts and non-centroid transcripts, and wherein the transcriptome consists of centroid transcripts and non-centroid transcripts.
46. The method of claim 45, wherein the set of substantially invariant genes measured is between 10 and 50 invariant genes.
47. The method of claim 45, wherein the set of substantially invariant genes measured is between 14 and 98 invariant genes.
48. The method of claim 45, wherein 80 invariant genes are measured.
49. The method of claim 45, wherein the set of substantially invariant genes are for quality control.
Description
The foregoing applications, and all documents cited therein or during their prosecution ("appln cited documents") and all documents cited or referenced in the appln cited documents, and all documents cited or referenced herein ("herein cited documents"), and all documents cited or referenced in herein cited documents, together with any manufacturer's instructions, descriptions, product specifications, and product sheets for any products mentioned herein or in any document incorporated by reference herein, are hereby incorporated herein by reference, and may be employed in the practice of the invention. More specifically, all referenced documents are incorporated by reference to the same extent as if each individual document was specifically and individually indicated to be incorporated by reference.
SEQUENCE LISTING
The instant application contains a Sequence Listing which has been submitted in ASCII format via EFS-Web and is hereby incorporated by reference in its entirety. Said ASCII copy, created on Oct. 26, 2012, is named 44792011.txt and is 495,223 bytes in size.
FIELD OF THE INVENTION
The present invention relates to genomic informatics and gene-expression profiling. Gene-expression profiles provide complex molecular fingerprints regarding the relative state of a cell or tissue. Similarities in gene-expression profiles between organic states (i.e., for example, normal and diseased cells and/or tissues) provide molecular taxonomies, classification, and diagnostics. Similarities in gene-expression profiles resulting from various external perturbations (i.e., for example, ablation or enforced expression of specific genes, and/or small molecules, and/or environmental changes) reveal functional similarities between these perturbagens, of value in pathway and mechanism-of-action elucidation. Similarities in gene-expression profiles between organic (e.g. disease) and induced (e.g. by small molecule) states may identify clinically-effective therapies. Improvements described herein allow for the efficient and economical generation of full-transcriptome gene-expression profiles by identifying cluster centroid landmark transcripts that predict the expression levels of other transcripts within the same cluster.
BACKGROUND OF THE INVENTION
High-density, whole-transcriptome DNA microarrays are the method of choice for unbiased gene-expression profiling. These profiles have been found useful for the classification and diagnosis of disease, predicting patient response to therapy, exploring biological mechanisms, in classifying and elucidating the mechanisms-of-action of small molecules, and in identifying new therapeutics. van de Vijver et al., "A gene expression signature as a predictor of survival in breast cancer" N Engl J Med 347:1999-2009 (2002); Lamb et al., "A mechanism of cyclin D1 action encoded in the patterns of gene expression in human cancer" Cell 114:323-334 (2003); Glas et al., "Gene expression profiling in follicular lymphoma to assess clinical aggressiveness and to guide the choice of treatment" Blood 105:301-307 (2005); Burczynski et al., "Molecular classification of Crohn's disease and ulcerative colitis patients using transcriptional profiles in peripheral blood mononuclear cells" J Mol Diagn 8:51-61 (2006); Golub et al., "Molecular classification of cancer: class discovery and class prediction by gene expression monitoring" Science 286:531 (1999); Ramaswamy et al., "Multiclass cancer diagnosis using tumor gene expression signatures" Proc Natl Acad Sci 98: 15149 (2001); Lamb et al., "The Connectivity Map: using gene-expression signatures to connect small molecules, genes and disease" Science 313:1929 (2006). However, the overall success and wide-spread use of these methods is severely limited by the high cost and low throughput of existing transcriptome-analysis technologies. For example, using gene-expression profiling to screen for small molecules with desirable biological effects is practical only if one could analyze thousands of compounds per day at a cost dramatically below that of conventional microarrays.
What is needed in the art is a simple, flexible, cost-effective, and high-throughput transcriptome-wide gene-expression profiling solution that would allow for the analysis of many thousands of tissue specimens and cellular states induced by external perturbations. This would greatly accelerate the rate of discovery of medically-relevant connections encoded therein. Methods have been developed to rapidly assay the expression of small numbers of transcripts in large number of samples; for example, Peck et al., "A method for high-throughput gene expression signature analysis" Genome Biol 7:R61 (2006). If transcripts that faithfully predict the expression levels of other transcripts could be identified, it is conceivable that the measurement of a set of such `landmark` transcripts using such moderate-multiplex assay methods could, in concert with an algorithm that calculates the levels of the non-landmark transcripts from those measurements, provide the full-transcriptome gene-expression analysis solution sought.
Citation or identification of any document in this application is not an admission that such document is available as prior art to the present invention.
SUMMARY OF THE INVENTION
The present invention is related to the field of genomic informatics and gene-expression profiling. Gene-expression profiles provide complex molecular fingerprints regarding the relative state of a cell or tissue. Similarities in gene-expression profiles between organic states (i.e., for example, normal and diseased cells and/or tissues) provide molecular taxonomies, classification, and diagnostics. Similarities in gene-expression profiles resulting from various external perturbations (i.e., for example, ablation or enforced expression of specific genes, and/or small molecules, and/or environmental changes) reveal functional similarities between these perturbagens, of value in pathway and mechanism-of-action elucidation. Similarities in gene-expression profiles between organic (e.g. disease) and induced (e.g. by small molecule) states may identify clinically-effective therapies. Improvements described herein allow for the efficient and economical generation of full-transcriptome gene-expression profiles by identifying cluster centroid landmark transcripts that predict the expression levels of other transcripts within the same cluster.
In one embodiment, the present invention contemplates a method for making a transcriptome-wide mRNA-expression profiling platform using sub-transcriptome numbers of transcript measurements which may comprise: a) providing: i) a first library of transcriptome-wide mRNA-expression data from a first collection of biological samples; ii) a second collection of biological samples; iii) a second library of transcriptome-wide mRNA-expression data from said second collection of biological samples; iv) a device capable of measuring transcript expression levels; b) performing computational analysis on said first library such that a plurality of transcript clusters are created, wherein the number of said clusters is substantially less than the total number of all transcripts; c) identifying a centroid transcript within each of said plurality of transcript clusters, thereby creating a plurality of centroid transcripts, said remaining transcripts being non-centroid transcripts; d) measuring the expression levels of at least a portion of transcripts from said second collection of biological samples with said device, wherein said portion of transcripts comprise transcripts identified as said centroid transcripts from said first library; e) determining the ability of said measurements of the expression levels of said centroid transcripts to infer the levels of at least a portion of transcripts from said second library, wherein said portion is comprised of non-centroid transcripts; f) selecting said centroid transcripts whose said expression levels have said ability to infer the levels of said portion of non-centroid transcripts. In one embodiment, the plurality of centroid transcripts is approximately 1000 centroid transcripts. In one embodiment, the device is selected from the group which may comprise a microarray, a bead array, a liquid array, or a nucleic-acid sequencer. In one embodiment, the computational analysis may comprise cluster analysis. In one embodiment, the method further may comprise repeating steps c) to f) until validated centroid transcripts for each of said plurality of transcript clusters are identified. In one embodiment, the plurality of clusters of transcripts are orthogonal. In one embodiment, the plurality of clusters of transcripts are non-overlapping. In one embodiment, the determining involves a correlation between said expression levels of said centroid transcripts and said expression levels of said non-centroid transcripts. In one embodiment, the expression levels of a set of substantially invariant transcripts are additionally measured with said device in said second collection of biological samples. In one embodiment, the measurements of said centroid transcripts made with said device, and said mRNA-expression data from said first and second libraries, are normalized with respect to the expression levels of a set of substantially invariant transcripts.
In one embodiment, the present invention contemplates a method for identifying a subpopulation of predictive transcripts within a transcriptome, which may comprise: a) providing; i) a first library of transcriptome-wide mRNA-expression data from a first collection of biological samples; ii) a second collection of biological samples or a second library of transcriptome-wide mRNA-expression data from said second collection of biological samples; iii) a device capable of measuring transcript expression levels; b) performing computational analysis on said first library such that a plurality of transcript clusters are created, wherein the number of said clusters is less than the total number of all transcripts in said first library; c) identifying a centroid transcript within each of said transcript clusters thereby creating a plurality of centroid transcripts, said remaining transcripts being non-centroid transcripts; d) processing transcripts from said second collection of biological samples on said device so as to measure expression levels of said centroid transcripts, and e) determining which of said plurality of centroid transcripts measured on said device predict the levels of said non-centroid transcripts in said second library of transcriptome-wide data. In one embodiment, the plurality of centroid transcripts is approximately 1000 centroid transcripts. In one embodiment, the device is selected from the group which may comprise a microarray, a bead array, a liquid array, or a nucleic-acid sequencer. In one embodiment, the computational analysis may comprise cluster analysis. In one embodiment, the determining involves a correlation between said centroid transcript and said non-centroid transcript. In one embodiment, the method further may comprise repeating steps c) to e).
In one embodiment, the present invention contemplates a method for identifying a subpopulation of approximately 1000 predictive transcripts within a transcriptome, which may comprise: a) providing: i) a first library of transcriptome-wide mRNA-expression data from a first collection of biological samples representing greater than 1000 different transcripts, and ii) transcripts from a second collection of biological samples; b) performing computational analysis on said first library such that a plurality of clusters of transcripts are created, wherein the number of said clusters is approximately 1000 and less than the total number of all transcripts in said first library; c) identifying a centroid transcript within each of said transcript clusters, said remaining transcripts being non-centroid transcripts; d) processing the transcripts from said second collection of biological samples so as to measure the expression levels of non-centroid transcripts, so as to create first measurements, and expression levels of centroid transcripts, so as to create second measurements; and e) determining which centroid transcripts based on said second measurements predict the levels of said non-centroid transcripts, based on said first measurements, thereby identifying a subpopulation of predictive transcripts within a transcriptome. In one embodiment, the method further may comprise a device capable of measuring the expression levels of said centroid transcripts. In one embodiment, the device is capable of measuring the expression levels of approximately 1000 of said centroid transcripts. In one embodiment, the computational analysis may comprise cluster analysis. In one embodiment, the determining involves a correlation between said centroid transcript and said non-centroid transcript. In one embodiment, the method further may comprise repeating steps c) to e).
In one embodiment, the present invention contemplates a method for predicting the expression level of a first population of transcripts by measuring the expression level of a second population of transcripts, which may comprise: a) providing: i) a first heterogeneous population of transcripts which may comprise a second heterogeneous population of transcripts, said second population which may comprise a subset of said first population, ii) an algorithm capable of predicting the level of expression of transcripts within said first population which are not within said second population, said predicting based on the measured level of expression of transcripts within said second population; b) processing said first heterogeneous population of transcripts under conditions such that a plurality of different templates representing only said second population of transcripts is created; c) measuring the amount of each of said different templates to create a plurality of measurements; and d) applying said algorithm to said plurality of measurements, thereby predicting the level of expression of transcripts within said first population which are not within said second population. In one embodiment, the first heterogenous population of transcripts comprise a plurality of non-centroid transcripts. In one embodiment, the second heterogenous population of transcripts may comprise a plurality of centroid transcripts. In one embodiment, the method further may comprise a device capable of measuring the amount of approximately 1000 of said different templates. In one embodiment, the device is selected from the group which may comprise a microarray, a bead array, a liquid array, or a nucleic-acid sequencer. In one embodiment, the algorithm involves a dependency matrix.
In one embodiment, the present invention contemplates a method of assaying gene expression, which may comprise: a) providing: i) approximately 1000 different barcode sequences; ii) approximately 1000 beads, each bead which may comprise a homogeneous set of nucleic-acid probes, each set complementary to a different barcode sequence of said approximately 1000 barcode sequences; iii) a population of more than 1000 different transcripts, each transcript which may comprise a gene-specific sequence; iv) an algorithm capable of predicting the level of expression of unmeasured transcripts; b) processing said population of transcripts to create approximately 1000 different templates, each template which may comprise one of said approximately 1000 barcode sequences operably associated with a different gene-specific sequence, wherein said approximately 1000 different templates represents less than the total number of transcripts within said population; c) measuring the amount of each of said approximately 1000 different templates to create a plurality of measurements; and d) applying said algorithm to said plurality of measurements, thereby predicting the level of expression of unmeasured transcripts within said population. In one embodiment, the method further may comprise a device capable of measuring the amount of each of said approximately 1000 different templates. In one embodiment, the beads are optically addressed. In one embodiment, the processing may comprise ligation-mediated amplification. In one embodiment, the measuring may comprise detecting said optically addressed beads. In one embodiment, the measuring may comprise hybridizing said approximately 1000 different templates to said approximately 1000 beads through said nucleic-acid probes complementary to said approximately 1000 barcode sequences. In one embodiment, the measuring may comprise a flow cytometer. In one embodiment, the algorithm involves a dependency matrix.
In one embodiment, the present invention contemplates a composition which may comprise an amplified nucleic acid sequence, wherein said sequence may comprise at least a portion of a cluster centroid transcript sequence and a barcode sequence, wherein said composition further may comprise an optically addressed bead, and wherein said bead may comprise a capture probe nucleic-acid sequence hybridized to said barcode. In one embodiment, the barcode sequence is at least partially complementary to said capture probe nucleic acid. In one embodiment, the amplified nucleic-acid sequence is biotinylated. In one embodiment, the optically addressed bead is detectable with a flow cytometric system. In one embodiment, the flow cytometric system discriminates between approximately 500-1000 optically addressed beads.
In one embodiment, the present invention contemplates a method for creating a genome-wide expression profile, which may comprise: a) providing; i) a plurality of genomic transcripts derived from a biological sample; ii) a plurality of centroid transcripts which may comprise at least a portion of said genomic transcripts, said remaining genomic transcripts being non-centroid transcripts; b) measuring the expression level of said plurality of centroid transcripts; c) inferring the expression levels of said non-centroid transcripts from said centroid transcript expression levels, thereby creating a genome-wide expression profile. In one embodiment, the plurality of centroid transcripts comprise approximately 1,000 transcripts. In one embodiment, the measuring may comprise a device selected from the group which may comprise a microarray, a bead array, a liquid array, or a nucleic-acid sequencer. In one embodiment, the inferring involves a dependency matrix, the genome-wide expression profile identifies said biological sample as diseased. In one embodiment, the genome-wide expression profile identifies said biological sample as healthy. In one embodiment, the genome-wide expression profile provides a functional readout of the action of a perturbagen. In one embodiment, the genome-wide expression profile may comprise an expression profile suitable for use in a connectivity map. In one embodiment, the expression profile is compared with query signatures for similarities. In one embodiment, the genome-wide expression profile may comprise a query signature compatible with a connectivity map. In one embodiment, the query signature is compared with known genome-wide expression profiles for similarities.
In one embodiment, the present invention contemplates a kit, which may comprise: a) a first container which may comprise a plurality of centroid transcripts derived from a transcriptome; b) a second container which may comprise buffers and reagents compatible with measuring the expression level of said plurality of centroid transcripts within a biological sample; c) a set of instructions for inferring the expression level of non-centroid transcripts within said biological sample, based upon the expression level of said plurality of centroid transcripts. In one embodiment, the plurality of centroid transcripts is approximately 1,000 transcripts.
In one embodiment, the present invention contemplates a method for making a transcriptome-wide mRNA-expression profile, which may comprise: a) providing: i) a composition of validated centroid transcripts numbering substantially less than the total number of all transcripts; ii) a device capable of measuring the expression levels of said validated centroid transcripts; iii) an algorithm capable of substantially calculating the expression levels of transcripts not amongst the set of said validated centroid transcripts from expression levels of said validated centroid transcripts measured by said device and transcript cluster information created from a library of transcriptome-wide mRNA-expression data from a collection of biological samples; and iv) a biological sample; b) applying said biological sample to said device whereby expression levels of said validated centroid transcripts in said biological sample are measured; and c) applying said algorithm to said measurements thereby creating a transcriptome-wide mRNA expression profile. In one embodiment, the validated centroid transcripts comprise approximately 1,000 transcripts. In one embodiment, the device is selected from the group which may comprise a microarray, a bead array, a liquid array, or a nucleic-acid sequencer. In one embodiment, the expression levels of a set of substantially invariant transcripts are additionally measured in said biological sample. In one embodiment, the expression levels of said validated centroid transcripts are normalized with respect to said expression levels of said invariant transcripts.
In one embodiment, the present invention contemplates a method for making a transcriptome-wide mRNA-expression profiling platform which may comprise: a) providing: i) a first library of transcriptome-wide mRNA-expression data from a first collection of biological samples; ii) a second library of transcriptome-wide mRNA-expression data from a second collection of biological samples; iii) a device capable of measuring transcript expression levels; b) performing computational analysis on said first library such that a plurality of transcript clusters are created, wherein the number of said clusters is substantially less than the total number of all transcripts; c) identifying a centroid transcript within each of said plurality of transcript clusters, thereby creating a plurality of centroid transcripts; d) identifying a set of substantially invariant transcripts from said first library; e) measuring the expression levels of at least a portion of transcripts from said second collection of biological samples with said device, wherein said portion of transcripts comprise transcripts identified as said centroid transcripts and said invariant transcripts from said first library; f) determining the ability of said measurements of expression levels of said plurality of centroid transcripts to infer the levels of at least a portion of non-centroid transcripts from said second library. In one embodiment, the plurality of centroid transcripts is approximately 1000 centroid transcripts. In one embodiment, the device may comprise a genome-wide microarray. In one embodiment, the method further may comprise repeating steps c) to f) until validated centroid transcripts for each of said plurality of transcript clusters are identified. In one embodiment, the plurality of clusters of transcripts are orthogonal. In one embodiment, the plurality of clusters of transcripts are non-overlapping.
In one embodiment, the present invention contemplates a method for predicting transcript levels within a transcriptome, which may comprise: a) providing: i) a first library of transcriptome-wide mRNA-expression data from a first collection of biological samples; ii) a second library of transcriptome-wide mRNA-expression data from a second collection of biological samples; iii) a device capable of measuring transcript expression levels; b) performing computational analysis on said first library such that a plurality of transcript clusters are created, wherein the number of said clusters is less than the total number of all transcripts in said first library; c) identifying a centroid transcript within each of said transcript clusters thereby creating a plurality of centroid transcripts, said remaining transcripts being non-centroid transcripts; d) processing said second library transcripts on said device so as to measure expression levels of said centroid transcripts and e) determining which of said plurality of centroid transcripts measured on said device predict the levels of said non-centroid transcripts in said second library of transcriptome-wide data. In one embodiment, the plurality of centroid transcripts is approximately 1000 centroid transcripts. In one embodiment, the device is selected from the group which may comprise a microarray, a bead array, or a liquid array. In one embodiment, the computational analysis may comprise cluster analysis. In one embodiment, the identifying may comprise repeating steps c) to e). In one embodiment, the processing utilizes a flow cytometer. In one embodiment, the determining identifies a correlation between said centroid transcript and said non-centroid transcript.
In one embodiment, the present invention contemplates a method for making a transcriptome-wide mRNA-expression profiling platform which may comprise: a) providing: i) a first library of transcriptome-wide mRNA-expression data from a first collection of biological samples; ii) a second collection of biological samples; iii) a second library of transcriptome-wide mRNA-expression data from said second collection of biological samples; iv) a device capable of measuring transcript expression levels; b) performing computational analysis on said first library such that a plurality of transcript clusters are created, wherein the number of said clusters is substantially less than the total number of all transcripts; c) identifying a centroid transcript within each of said plurality of transcript clusters, thereby creating a plurality of centroid transcripts; d) measuring the expression levels of at least a portion of transcripts from said second collection of biological samples with said device, wherein said portion of transcripts comprise transcripts identified as said centroid transcripts from said first library; e) determining the ability of said measurements of the expression levels of said centroid transcripts to infer the levels of at least a portion of transcripts from said second library, wherein said portion is comprised of non-centroid transcripts. In one embodiment, the plurality of centroid transcripts is approximately 1000 centroid transcripts. In one embodiment, the device may comprise a microarray. In one embodiment, the device may comprise a bead array. In one embodiment, the device may comprise a liquid array. In a the method further may comprise repeating steps c) to e) until validated centroid transcripts for each of said plurality of transcript clusters are identified. In one embodiment, the plurality of clusters of transcripts are orthogonal. In one embodiment, the plurality of clusters of transcripts are non-overlapping. In one embodiment, the determining involves a correlation between said centroid transcripts and said non-centroid transcripts. In one embodiment, the expression levels of a set of substantially invariant transcripts are additionally measured with said device in said second collection of biological samples. In one embodiment, the measurements of said centroid transcripts made with said device, and said mRNA-expression data from said first and second libraries, are normalized with respect to the expression levels of a set of substantially invariant transcripts.
In one embodiment, the present invention contemplates a method for identifying a subpopulation of approximately 1000 predictive transcripts within a transcriptome, which may comprise: a) providing i) a first library of transcriptome-wide mRNA-expression data from a first collection of biological samples representing greater than 1000 different transcripts, and ii) transcripts from a second collection of biological samples; b) performing computational analysis on said first library such that a plurality of clusters of transcripts are created, wherein the number of said clusters is approximately 1000 and less than the total number of all transcripts in said first library; c) identifying a centroid transcript within each of said transcript clusters, said remaining transcripts being non-centroid transcripts; d) processing the transcripts from said second collection of biological samples so as to measure the expression levels of non-centroid transcripts, so as to create first measurements, and expression levels of centroid transcripts, so as to create second measurements; and e) determining which centroid transcripts based on said second measurements predict the levels of said non-centroid transcripts, based on said first measurements, thereby identifying a subpopulation of predictive transcripts within a transcriptome. In one embodiment, the method further may comprise a device capable of attaching said centroid transcripts. In one embodiment, the device attaches approximately 1000 of said centroid transcripts. In one embodiment, the computational analysis may comprise cluster analysis. In one embodiment, the identifying may comprise repeating steps c) to e). In one embodiment, the processing utilizes a flow cytometer. In one embodiment, the determining identifies a correlation between said centroid transcript and said non-centroid transcript.
In one embodiment, the present invention contemplates a method for predicting the expression level of a first population of transcripts by measuring the expression level of a second population of transcripts, which may comprise: a) providing; i) a first heterogeneous population of transcripts which may comprise a second heterogeneous population of transcripts, said second population which may comprise a subset of said first population, ii) an algorithm capable of predicting the level of expression of transcripts within said first population which are not within said second population, said predicting based on the measured level of expression of transcripts within said second population; b) processing said first heterogeneous population of transcripts under conditions such that a plurality of different templates representing only said second population of transcripts is created; c) measuring the amount of each of said different templates to create a plurality of measurements; and d) applying said algorithm to said plurality of measurements, thereby predicting the level of expression of transcripts within said first population which are not within said second population. In one embodiment, the first heterogenous population of transcripts comprise a plurality of non-centroid transcripts. In one embodiment, the second heterogenous population of transcripts may comprise a plurality of centroid transcripts. In one embodiment, the method further may comprise a device capable of attaching approximately 1000 of said centroid transcripts. In one embodiment, the measuring may comprise a flow cytometer. In one embodiment, the applying said algorithm identifies a correlation between said centroid transcript and said non-centroid transcript.
In one embodiment, the present invention contemplates a method of assaying gene expression, which may comprise: a) providing i) approximately 1000 different barcode sequences; ii) approximately 1000 beads, each bead which may comprise a homogeneous set of nucleic acid probes, each set complementary to a different barcode sequence of said approximately 1000 barcode sequences; iii) a population of more than 1000 different transcripts, each transcript which may comprise a gene specific sequence; iv) an algorithm capable of predicting the level of expression of unmeasured transcripts; b) processing said population of transcripts to create approximately 1000 different templates, each template which may comprise one of said approximately 1000 barcode sequences operably associated with a different gene specific sequence, wherein said approximately 1000 different templates represents less than the total number of transcripts within said population; c) measuring the amount of each of said approximately 1000 different templates to create a plurality of measurements; and d) applying said algorithm to said plurality measurements, thereby predicting the level of expression of unmeasured transcripts within said population. In one embodiment, the method further may comprise a device capable of attaching approximately 1000 of said centroid transcripts. In one embodiment, the processing may comprise ligation mediated amplification. In one embodiment, the beads are optically addressable. In one embodiment, the measuring may comprise detecting said optically addressable beads. In one embodiment, the applying said algorithm may comprise identifying a correlation between said measured transcripts and said unmeasured transcripts.
In one embodiment, the present invention contemplates a composition which may comprise an amplified nucleic acid sequence, wherein said sequence may comprise at least a portion of a cluster centroid landmark transcript sequence and a barcode sequence, wherein said composition further may comprise an optically addressable bead, and wherein said bead may comprise a capture probe nucleic acid sequence hybridized to said barcode. In one embodiment, the barcode sequence is at least partially complementary to said capture probe nucleic acid. In one embodiment, the optically addressable bead is color coded. In one embodiment, the amplified nucleic acid sequence is biotinylated. In one embodiment, the optically addressable bead is detectable with a flow cytometric system. In one embodiment, the flow cytometric system simultaneously differentiates between approximately 500-1000 optically addressable beads.
In one embodiment, the present invention contemplates a method for creating a genome-wide expression profile, which may comprise: a) providing; i) a plurality of genomic transcripts derived from a biological sample; and ii) a plurality of centroid transcripts which may comprise at least a portion of said genomic transcripts, said remaining genomic transcripts being non-centroid transcripts; b) measuring the expression of said plurality of centroid transcripts; c) inferring the expression levels of said non-centroid transcripts from said centroid transcript expression, thereby creating a genome wide expression profile. In one embodiment, the plurality of centroid transcripts comprise approximately 1,000 transcripts. In one embodiment, the genome-wide expression profile identifies said biological sample as diseased. In one embodiment, the genome-wide expression profile identifies said biological sample as healthy. In one embodiment, the genome-wide expression profile may comprise a query signature compatible with a connectivity map. In one embodiment, the query signature is compared with known genome-wide expression profiles for similarities.
In one embodiment, the present invention contemplates a method for identifying a subpopulation of predictive transcripts within a transcriptome, which may comprise: a) providing i) a device to measure the expression level of transcripts, ii) a first library of transcriptome-wide mRNA-expression data from a first collection of biological samples, and iii) transcripts from a second collection of biological samples; b) performing computational analysis on said first library such that a plurality of clusters of transcripts are created, wherein the number of said clusters is less than the total number of all transcripts in said first library; c) identifying a centroid transcript within each of said transcript clusters, said remaining transcripts being non-centroid transcripts; d) processing the transcripts from said second collection of biological samples so as to measure, with said device, the expression levels of non-centroid transcripts, so as to create first measurements, and expression levels of centroid transcripts, so as to create second measurements; and e) determining which centroid transcripts based on said second measurements predict the levels of said non-centroid transcripts, based on said first measurements, thereby identifying a subpopulation of predictive transcripts within a transcriptome. In one embodiment, the device may comprise a microarray. In one embodiment, the computational analysis may comprise cluster analysis. In one embodiment, the identifying may comprise an iterative validation algorithm. In one embodiment, the processing utilizes a cluster dependency matrix. In one embodiment, the determining identifies a dependency matrix between said centroid transcript and said non-centroid transcript.
In one embodiment, the present invention contemplates a method for identifying a subpopulation of approximately 1000 predictive transcripts within a transcriptome, which may comprise: a) providing i) a device to measure the expression level of transcripts, ii) a first library of transcriptome-wide mRNA-expression data from a first collection of biological samples representing greater than 1000 different transcripts, and iii) transcripts from a second collection of biological samples; b) performing computational analysis on said first library such that a plurality of clusters of transcripts are created, wherein the number of said clusters is approximately 1000 and less than the total number of all transcripts in said first library; c) identifying a centroid transcript within each of said transcript clusters, said remaining transcripts being non-centroid transcripts; d) processing the transcripts from said second collection of biological samples so as to measure, with said device, the expression levels of non-centroid transcripts, so as to create first measurements, and expression levels of centroid transcripts, so as to create second measurements; and e) determining which centroid transcripts based on said second measurements predict the levels of said non-centroid transcripts, based on said first measurements, thereby identifying a subpopulation of predictive transcripts within a transcriptome. In one embodiment, the device may comprise a microarray. In one embodiment, the computational analysis may comprise cluster analysis. In one embodiment, the identifying may comprise an iterative validation algorithm. In one embodiment, the processing utilizes a cluster dependency matrix. In one embodiment, the determining identifies a dependency matrix between said centroid transcript and said non-centroid transcript.
In one embodiment, the present invention contemplates a method for predicting the expression level of a first population of transcripts by measuring the expression level of a second population of transcripts, which may comprise: a) providing i) a first heterogeneous population of transcripts which may comprise a second heterogeneous population of transcripts, said second population which may comprise a subset of said first population, ii) a device, iii) an algorithm capable of predicting the level of expression of transcripts within said first population which are not within said second population, said predicting based on the measured level of expression of transcripts within said second population; b) processing said first heterogeneous population of transcripts under conditions such that a plurality of different templates representing only said second population of transcripts is created; c) measuring the amount of each of said different templates with said device to create a plurality of measurements; and d) applying said algorithm to said plurality of measurements, thereby predicting the level of expression of transcripts within said first population which are not within said second population. In one embodiment, the first heterogenous population of transcripts comprise a plurality of non-centroid transcripts. In one embodiment, the second heterogenous population of transcripts may comprise a plurality of centroid transcripts. In one embodiment, the device may comprise a microarray. In one embodiment, the processing may comprise computations selected from the group consisting of dimensionality reduction and cluster analysis. In one embodiment, the applying said algorithm identifies a dependency matrix between said centroid transcript and said non-centroid transcript.
In one embodiment, the present invention contemplates a method of assaying gene expression, which may comprise: a) providing i) approximately 1000 different barcode sequences; ii) approximately 1000 beads, each bead which may comprise a homogeneous set of nucleic acid probes, each set complementary to a different barcode sequence of said approximately 1000 barcode sequences; iii) a population of more than 1000 different transcripts, each transcript which may comprise a gene specific sequence; iv) a device; and v) an algorithm capable of predicting the level of expression of unmeasured transcripts; b) processing said population of transcripts to create approximately 1000 different templates, each template which may comprise one of said approximately 1000 barcode sequences operably associated with a different gene specific sequence, wherein said approximately 1000 different templates represents less than the total number of transcripts within said population; c) measuring the amount of each of said approximately 1000 different templates with said device to create a plurality of measurements; and d) applying said algorithm to said plurality measurements, thereby predicting the level of expression of unmeasured transcripts within said population. In one embodiment, the device may comprise a microarray. In one embodiment, the processing may comprise ligation mediated amplification. In one embodiment, the beads are optically addressable. In one embodiment, the measuring may comprise detecting said optically addressable beads. In one embodiment, the applying said algorithm identifies a dependency matrix between said measured transcripts and said unmeasured transcripts.
In one embodiment, the present invention contemplates a method for making a transcriptome-wide mRNA-expression profiling platform which may comprise a) providing a library of transcriptome-wide mRNA-expression data from a first collection of biological samples; b) performing computational analysis on said library such that a plurality of (orthogonal/non-overlapping) clusters of transcripts are created, wherein the number of said clusters is substantially less than the total number of all transcripts; c) identifying a centroid transcript within each of said transcript clusters; d) identifying a set of transcripts from said transcriptome-wide mRNA-expression-data library whose levels are substantially invariant across said first collection of biological samples; e) providing a device to measure (simultaneously) the levels of at least a portion of said centroid transcripts and said invariant transcripts; f) determining the ability of said measurements of centroid-transcript levels made using said device to represent the levels of other transcripts within its cluster from a second collection of biological samples; and g) repeating steps c) to f) until validated centroid transcripts for each of said plurality of transcript clusters are identified.
In one embodiment, the present invention contemplates a method for using a transcriptome-wide mRNA-expression profiling platform: a) providing: i) a composition of validated centroid transcripts numbering substantially less than the total number of all transcripts; ii) a device capable of measuring the levels of said validated centroid transcripts; iii) an algorithm capable of substantially calculating the levels of transcripts not amongst the set of said validated centroid transcripts from levels of said validated centroid transcripts measured by said device and transcript cluster information created from a library of transcriptome-wide mRNA-expression data from a collection of biological samples; and iv) a biological sample; b) applying said biological sample to said device whereby levels of said validated centroid transcripts in said biological sample are measured; and c) applying said algorithm to said measurements thereby creating a transcriptome-wide mRNA expression profile.
The present invention is also related to compositions and methods for the detection of analytes. Analytes capable of detection by this invention include, but are not limited to, nucleic acids, proteins, peptides, and/or small organic molecules (i.e., for example, inorganic and/or organic). Any particular analyte may be detected and/or identified from a sample containing a plurality of other analytes. Further, the invention provides for a capability of simultaneously detecting and/or identifying all of the plurality of analytes contained within a sample (i.e., for example, a biological sample).
In one embodiment, the present invention contemplates a method, which may comprise: a) providing: i) a sample which may comprise a plurality of analytes; ii) a plurality of solid substrate populations, wherein each of the solid substrate populations comprise a plurality of subsets, and wherein each subset is present in an unequal proportion from every other subset in the same solid substrate population; iii) a plurality of capture probes capable of attaching to said plurality of analytes, wherein each subset may comprise a different capture probe; vi) a means for detecting said plurality of subsets that is capable of creating a multimodal intensity distribution pattern; b) detecting said plurality of subsets with said means, wherein a multimodal intensity distribution pattern is created; c) identifying said plurality of analytes from said multimodal distribution pattern. In one embodiment, the sample may be selected from the group which may comprise a biological sample, a soil sample, or a water sample. In one embodiment, the plurality of analytes may be selected from the group which may comprise nucleic acids, proteins, peptides, drugs, small molecules, biological receptors, enzymes, antibodies, polyclonal antibodies, monoclonal antibodies, or Fab fragments. In one embodiment, the solid substrate population may comprise a bead-set population. In one embodiment, the unequal proportions comprise two subsets in an approximate ratio of 1.25:0.75. In one embodiment, the unequal proportions comprise three subsets in an approximate ratio of 1.25:1.00:0.75. In one embodiment, the unequal proportions comprise four subsets in an approximate ratio of 1.25:1.00:0.75:0.50. In one embodiment, the unequal proportions comprise five subsets in an approximate ratio of 1.50:1.25:1.00:0.75:0.50. In one embodiment, the unequal proportions comprise six subsets in an approximate ratio of 1.75:1.50:1.25:1.00:0.75:0.50. In one embodiment, the unequal proportions comprise seven subsets in an approximate ratio of 2.00:1.75:1.50:1.25:1.00:0.75:0.50. In one embodiment, the unequal proportions comprise eight subsets in an approximate ratio of 2.00:1.75:1:50:1.25:1.00:0.75:0.50:0.25. In one embodiment, the unequal proportions comprise nine subsets in an approximate ratio of 2.25:2.00:1.75:1.50:1.25:1.00:0.75:0.50:0.25. In one embodiment, the unequal proportions comprise ten subsets in an approximate ratio of 2.5:2.25:2.00:1.75:1.50:1.25:1.00:0.75:0.50:0.25.
In one embodiment, the present invention contemplates a method, which may comprise: a) providing: i) a solid substrate population which may comprise a first subset and a second subset, wherein the first subset is present in a first proportion and the second subset is present in a second proportion; ii) a first analyte attached to said first subset; iii) a second analyte attached to said second subset; vi) a means for detecting said first subset and second subset that is capable of creating a multimodal intensity distribution pattern; b) detecting said first subset and said second subset with said means, wherein a multimodal intensity distribution pattern is created; and c) identifying said first analyte and said second analyte from said multimodal distribution pattern.
In one embodiment, the solid substrate population may comprise a label. In one embodiment, the label may comprise a mixture of at least two different fluorophores. In one embodiment, the first proportion is different from the second proportion. In one embodiment, the first analyte is attached to the first subset with a first capture probe. In one embodiment, the second analyte is attached to the second subset with a second capture probe. In one embodiment, the multimodal intensity distribution pattern may comprise a first peak corresponding to the first subset. In one embodiment, the multimodal intensity distribution pattern may comprise a second peak corresponding to the second subset.
In one embodiment, the present invention contemplates a method, which may comprise: a) providing: i) a solid substrate population which may comprise a plurality of subsets; ii) a sample which may comprise a plurality of analytes, wherein at least one portion of the plurality of analytes comprise related analytes; and iii) a means for detecting said subsets that is capable of creating a multimodal intensity distribution pattern; b) attaching each of the related analyte portions to one of the plurality of subsets; c) detecting said plurality of subsets with said means, wherein a multimodal intensity distribution pattern is created; and d) identifying said related analytes from said multimodal distribution pattern. In one embodiment, the related analytes comprise linked genes.
In one embodiment, the present invention contemplates a method, which may comprise: a) providing: i) a solid substrate population which may comprise a plurality of subsets; ii) a sample which may comprise a plurality of analytes, wherein at least one portion of the plurality of analytes comprise rare event analytes; and iii) a means for detecting said subsets that is capable of creating a multimodal intensity distribution pattern; b) attaching a portion of said plurality of analytes which may contain one or more of the rare event analytes to one of the plurality of subsets; c) detecting said plurality of subsets with said means, wherein a multimodal intensity distribution pattern is created; and d) determining if said rare event analytes occur in said multimodal distribution pattern. In one embodiment, the rare event analyte portion is present in approximately less than 0.01% of said sample. In one embodiment, the rare event analyte may comprise a small molecule or drug. In one embodiment, the rare event analyte may comprise a nucleic acid mutation. In one embodiment, the rare event analyte may comprise a diseased cell. In one embodiment, the rare event analyte may comprise an autoimmune antibody. In one embodiment, the rare event analyte may comprise a microbe.
In one embodiment, the present invention contemplates a method, which may comprise: a) providing: i) a solid substrate population which may comprise a plurality of subsets; ii) a sample which may comprise a first labeled analyte and a second labeled analyte; and iii) a means for detecting said subsets that is capable of creating a multimodal intensity distribution pattern; b) attaching the first and second labeled analytes in an unequal proportion to one of the plurality of subsets; c) detecting said plurality of subsets with said means, wherein a multimodal intensity distribution pattern is created; and d) identifying said first and second labeled analytes from said multimodal distribution pattern. In one embodiment, the first labeled analyte may comprise a normal cell. In one embodiment, the second labeled analyte may comprise a tumor cell. In one embodiment, the multimodal intensity distribution pattern may comprise a first peak corresponding to the first labeled analyte. In one embodiment, the multimodal intensity distribution pattern may comprise a second peak corresponding to the second labeled analyte. In one embodiment, the unequal proportion is equivalent to a ratio of the first and second peaks.
Accordingly, it is an object of the invention not to encompass within the invention any previously known product, process of making the product, or method of using the product such that Applicants reserve the right and hereby disclose a disclaimer of any previously known product, process, or method. It is further noted that the invention does not intend to encompass within the scope of the invention any product, process, or making of the product or method of using the product, which does not meet the written description and enablement requirements of the USPTO (35 U.S.C. .sctn. 112, first paragraph) or the EPO (Article 83 of the EPC), such that Applicants reserve the right and hereby disclose a disclaimer of any previously described product, process of making the product, or method of using the product.
It is noted that in this disclosure and particularly in the claims and/or paragraphs, terms such as "comprises", "comprised", "comprising" and the like can have the meaning attributed to it in U.S. Patent law; e.g., they can mean "includes", "included", "including", and the like; and that terms such as "consisting essentially of" and "consists essentially of" have the meaning ascribed to them in U.S. Patent law, e.g., they allow for elements not explicitly recited, but exclude elements that are found in the prior art or that affect a basic or novel characteristic of the invention.
These and other embodiments are disclosed or are obvious from and encompassed by, the following Detailed Description.
BRIEF DESCRIPTION OF THE FIGURES
The following detailed description, given by way of example, but not intended to limit the invention solely to the specific embodiments described, may best be understood in conjunction with the accompanying drawings.
FIG. 1 presents exemplary simulated data depicting the clustering of PCA loadings of transcripts (purple dots) in the eigenspace by k-means to identify k distinct clusters (gray circles). The transcript closest to the mean of the cluster was selected as the `cluster centroid landmark transcript` (single red dots).
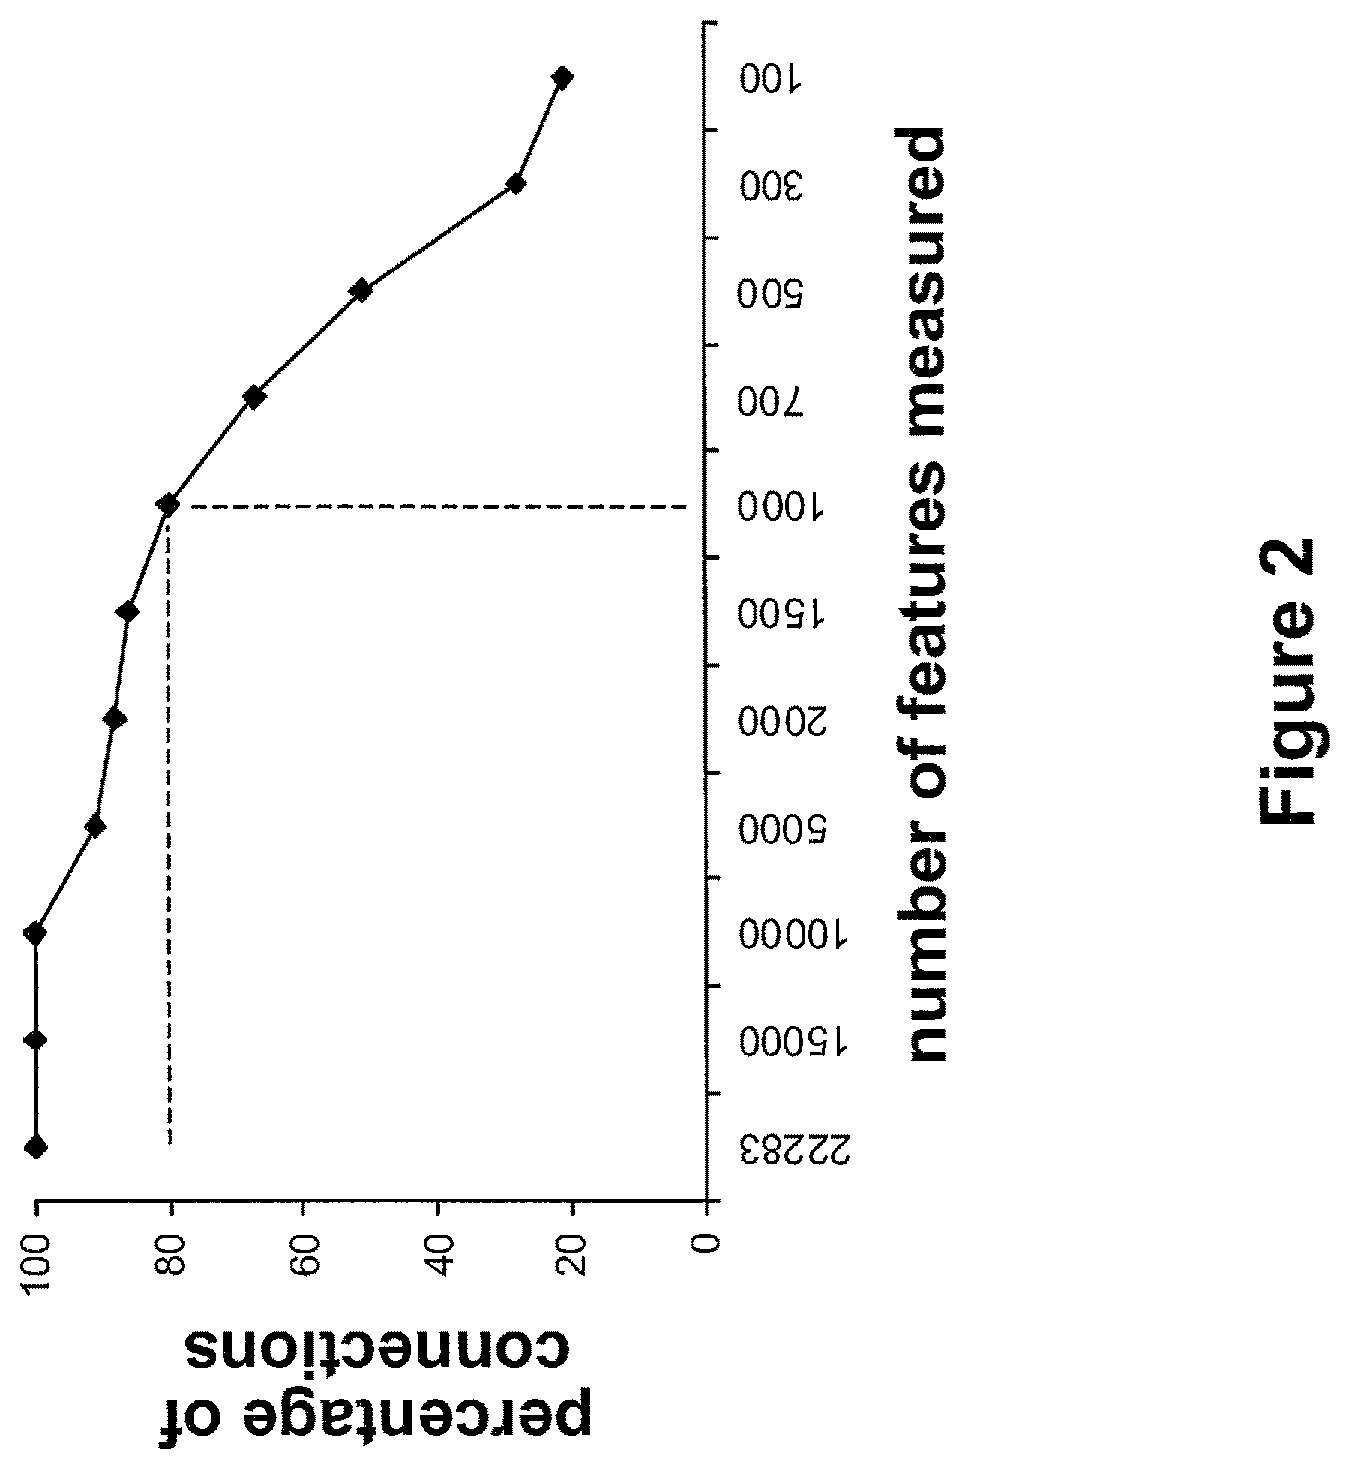
FIG. 2 presents exemplary results using Connectivity Map data demonstrating that approximately 80% of the connections observed between 184 query signatures and gene-expression profiles produced by measuring approximately 22,000 transcripts are recovered using gene-expression profiles created by measuring only approximately 1,000 transcripts and predicted the expression levels of the remainder.
FIG. 3 presents one embodiment of a method for measuring the expression levels of multiple transcripts simultaneously using ligation-mediated amplification and optically-addressed microspheres.
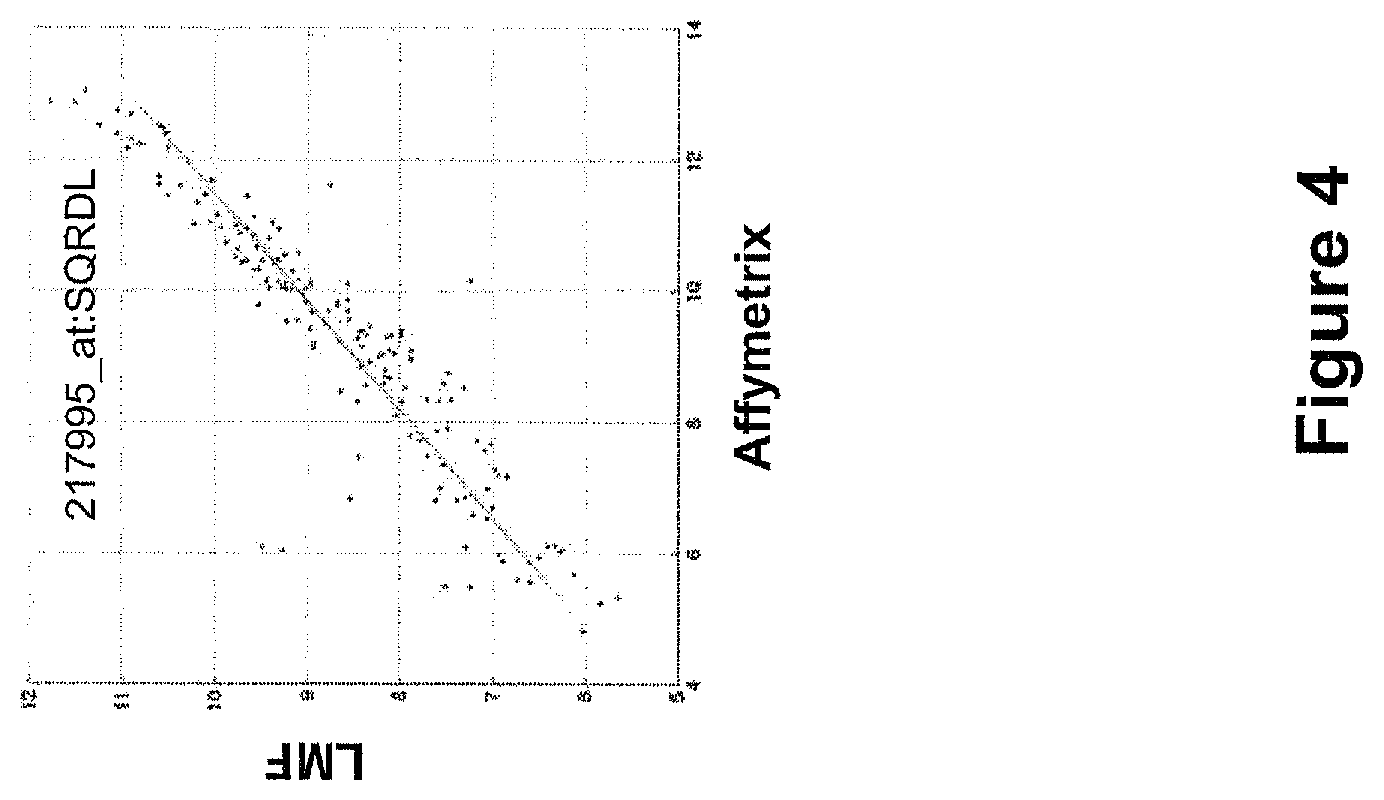
FIG. 4 presents exemplary data for normalized expression levels of a representative cluster centroid landmark transcript (217995_at:SQRDL) in 384 biological samples measured by LMF and Affymetrix microarray.
FIG. 5 presents exemplary data showing a simple (type 1) cluster centroid landmark transcript validation failure; circle. Axes are normalized expression levels.
FIG. 6 presents exemplary data showing a complex (type 2) cluster centroid landmark transcript validation failure.
FIG. 6A: Plots of normalized expression levels for a representative validated transcript/probe pair (blue, 218039_at:NUSAP1) and a representative failed transcript/probe pair (orange, 217762_s_at:RAB31).
FIG. 6B: Histogram showing normalized expression levels for the validated transcript/probe pair from FIG. 6A (blue arrow) and its associated non-centroid transcripts (blue bars); and the failed transcript/probe pair from FIG. 6A (orange arrow) and its associated non-centroid transcripts (orange bars). Red crosses mark non-correlation of gene-expression levels.
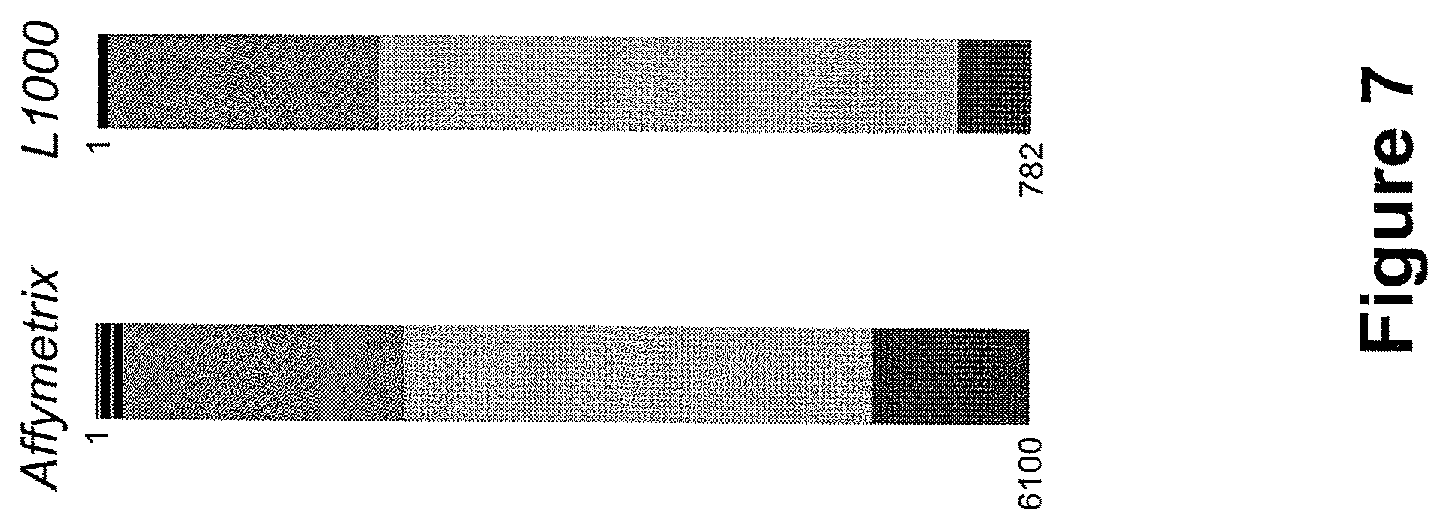
FIG. 7 presents exemplary data comparing the performance of Connectivity Map datasets populated with gene-expression profiles generated with Affymetrix microarrays reporting on approximately 22,000 transcripts (left), and a ligation-mediated amplification and Luminex optically-addressed microsphere assay of 1,000 landmark transcripts with inference of the expression levels of the remaining transcripts (right). Both datasets were queried with an independent HDAC-inhibitor query signature. The `bar views` shown are constructed from 6,100 and 782 horizontal lines, respectively, each representing individual treatment instances and ordered by connectivity score. All instances of the HDAC-inhibitor, vorinostat, are colored in black. Colors applied to the remaining instances reflect their connectivity scores (green, positive; gray, null; red, negative).
FIG. 8 presents exemplary data comparing consensus clustering dendrograms of gene-expression profiles for human cell lines generated with Affymetrix microarrays (A), and one embodiment of a landmark transcript measurement and inference method as contemplated herein (B). Tissue types are: CO=colon; LE=blood (leukemia); ME=skin (melanoma); CNS=brain (central nervous system); OV=ovary; and RE=kidney (renal).
DETAILED DESCRIPTION OF THE INVENTION
The term "device" as used herein, refers to any composition capable of measuring expression levels of transcripts. For example, a device may comprise a solid planar substrate capable of attaching nucleic acids (i.e., an oligonucleotide microarray). Alternatively, a device may comprise a solution-based bead array, wherein nucleic acids are attached to beads and detected using a flow cytometer. Alternatively, a device may comprise a nucleic-acid sequencer. In other examples, a device may comprise a plurality of cluster centroid landmark transcripts as contemplated by the present invention.
The term "capture probe" as used herein, refers to any molecule capable of attaching and/or binding to a nucleic acid (i.e., for example, a barcode nucleic acid). For example, a capture probe may be an oligonucleotide attached to a bead, wherein the oligonucleotide is at least partially complementary to another oligonucleotide. Alternatively, a capture probe may comprise a polyethylene glycol linker, an antibody, a polyclonal antibody, a monoclonal antibody, an Fab fragment, a biological receptor complex, an enzyme, a hormone, an antigen, and/or a fragment or portion thereof.
The term "LMF" as used herein, refers to an acronym for any method that combines ligation-mediated amplication, optically-addressed and barcoded microspheres, and flow cytometric detection. See Peck et al., "A method for high-throughput gene expression signature analysis" Genome Biol 7:R61 (2006).
The term "transcript" as used herein, refers to any product of DNA transcription, generally characterized as mRNA. Expressed transcripts are recognized as a reliable indicator of gene expression.
The term "gene-expression profile" as used herein, refers to any dataset representing the expression levels of a significant portion of genes within the genome (i.e., for example, a transcriptome).
The term "centroid transcript" as used herein, refers to any transcript that is within the center portion, or is representative of, a transcript cluster. Further, the expression level of a centroid transcript may predict the expression levels of the non-centroid transcripts within the same cluster.
The term "non-centroid transcript" as used herein, refers to any transcript in a transcript cluster that is not a centroid transcript. The expression level of a non-centroid transcript may be predicted (e.g., inferred) by the expression levels of centroid transcripts.
The term "cluster centroid landmark transcript" as used herein, refers to any transcript identified as a centroid transcript, the expression level of which predicts (e.g., infers) the expression levels of non-centroid transcripts within the same cluster, and optionally may contribute to prediction of the expression levels of non-centroid transcripts in other clusters.
The term "computational analysis" as used herein, refers to any mathematical process that results in the identification of transcript clusters, wherein the transcripts are derived from a transcriptome. For example, specific steps in a computational analysis may include, but are not limited to, dimensionality reduction and/or cluster analysis.
The term "dependency matrix" as used herein, refers to a table of weights (i.e., factors) relating the expression levels of a plurality of cluster centroid landmark transcripts to the expression levels of non-centroid transcripts generated by a mathematical analysis (i.e., for example, regression) of a library of transcriptome-wide gene-expression profiles. Cluster dependency matrices may be produced from a heterogeneous library of gene-expression profiles or from libraries of gene-expression profiles from specific tissues, organs, or disease classes.
The term "algorithm capable of predicting the level of expression of transcripts" as used herein, refers to any mathematical process that calculates the expression levels of non-centroid transcripts given the expression levels of cluster centroid landmark transcripts and a dependency matrix.
The term "invariant transcript" as used herein, refers to any transcript that remains at approximately the sample level regardless of cell or tissue type, or the presence of a perturbating agent (i.e., for example, a perturbagen). Invariant transcripts, or sets thereof, may be useful as an internal control for normalizing gene-expression data.
The term "moderate-multiplex assay platform" as used herein, refers to any technology capable of producing simultaneous measurements of the expression levels of a fraction of the transcripts in a transcriptome (i.e., for example, more than approximately 10 and less than approximately 2,000).
The term "Connectivity Map" as used herein, refers to a public database of transcriptome-wide gene-expression profiles derived from cultured human cells treated with a plurality of perturbagens, and pattern-matching algorithms for the scoring and identification of significant similarities between those profiles and external gene-expression data, as described by Lamb et al., "The Connectivity Map: using gene-expression signatures to connect small molecules, genes and disease". Science 313:1929 (2006). Build02 of the Connectivity Map contains 7,056 full-transcriptome gene-expression profiles generated with Affymetrix high-density oligonucleotide microarrays representing the biological effects of 1,309 small-molecule perturbagens, and is available at broadinstitute.org/cmap.
The term "query signature" as used herein, refers to any set of up- and down-regulated genes between two cellular states (e.g., cells treated with a small molecule versus cells treated with the vehicle in which the small molecule is dissolved) derived from a gene-expression profile that is suitable to query Connectivity Map. For example, a `query signature` may comprise a list of genes differentially expressed in a distinction of interest; (e.g., disease versus normal), as opposed to an `expression profile` that illustrates all genes with their respective expression levels.
The term "connectivity score" as used herein, refers to a relative measure of the similarity of the biological effects of a perturbagen used to generate a query signature with those of a perturbagen represented in the Connectivity Map based upon the gene-expression profile of a single treatment with that perturbagen. For example, one would expect every treatment instances with vorinostat, a known histone deacetylase (HDAC) inhibitor, to have a high connectivity score with a query signature generated from the effects of treatments with a panel of HDAC inhibitors.
The term "enrichment score" as used herein, refers to a measure of the similarity of the biological effects of a perturbagen used to generate a query signature with those of a perturbagen represented in the Connectivity Map based upon the gene-expression profiles of multiple independent treatments with that perturbagen.
The term "template" as used herein, refers to any stable nucleic acid structure that represents at least a portion of a cluster centroid landmark gene transcript nucleic acid sequence. The template may serve to allow the generation of a complementary nucleic acid sequence.
The term "derived from" as used herein, refers to the source of a biological sample, wherein the sample may comprise a nucleic acid sequence. In one respect, a sample or sequence may be derived from an organism or particular species. In another respect, a sample or sequence may be derived from (i.e., for example, a smaller portion and/or fragment) a larger composition or sequence.
The term, "purified" or "isolated", as used herein, may refer to a component of a composition that has been subjected to treatment (i.e., for example, fractionation) to remove various other components. Where the term "substantially purified" is used, this designation will refer to a composition in which a nucleic acid sequence forms the major component of the composition, such as constituting about 50%, about 60%, about 70%, about 80%, about 90%, about 95% or more of the composition (i.e., for example, weight/weight and/or weight/volume). The term "purified to homogeneity" is used to include compositions that have been purified to "apparent homogeneity" such that there is single nucleic acid species (i.e., for example, based upon SDS-PAGE or HPLC analysis). A purified composition is not intended to mean that some trace impurities may remain.
As used herein, the term "substantially purified" refers to molecules, such as nucleic acid sequences, that are removed from their natural environment, isolated or separated, and are at least 60% free, preferably 75% free, and more preferably 90% free from other components with which they are naturally associated. An "isolated polynucleotide" is therefore a substantially purified polynucleotide.
"Nucleic acid sequence" and "nucleotide sequence" as used herein refer to an oligonucleotide or polynucleotide, and fragments or portions thereof, and to DNA or RNA of genomic or synthetic origin which may be single- or double-stranded, and represent the sense or antisense strand.
The term "an isolated nucleic acid", as used herein, refers to any nucleic acid molecule that has been removed from its natural state (e.g., removed from a cell and is, in a preferred embodiment, free of other genomic nucleic acid).
The term "portion or fragment" when used in reference to a nucleotide sequence refers to smaller subsets of that nucleotide sequence. For example, such portions or fragments may range in size from 5 nucleotide residues to the entire nucleotide sequence minus one nucleic acid residue.
The term "small organic molecule" as used herein, refers to any molecule of a size comparable to those organic molecules generally used in pharmaceuticals. The term excludes biological macromolecules (e.g., proteins, nucleic acids, etc.). Preferred small organic molecules range in size from approximately 10 Da up to about 5000 Da, more preferably up to 2000 Da, and most preferably up to about 1000 Da.
The term "sample" as used herein is used in its broadest sense and includes environmental and biological samples. Environmental samples include material from the environment such as soil and water. Biological samples may be animal, including, human, fluid (e.g., blood, plasma and serum), solid (e.g., stool), tissue, liquid foods (e.g., milk), and solid foods (e.g., vegetables). For example, a pulmonary sample may be collected by bronchoalveolar lavage (BAL) which may comprise fluid and cells derived from lung tissues. A biological sample may comprise a cell, tissue extract, body fluid, chromosomes or extrachromosomal elements isolated from a cell, genomic DNA (in solution or bound to a solid support such as for Southern blot analysis), RNA (in solution or bound to a solid support such as for Northern blot analysis), eDNA (in solution or bound to a solid support) and the like.
The term "functionally equivalent codon", as used herein, refers to different codons that encode the same amino acid. This phenomenon is often referred to as "degeneracy" of the genetic code. For example, six different codons encode the amino acid arginine.
A "variant" of a nucleotide is defined as a novel nucleotide sequence which differs from a reference oligonucleotide by having deletions, insertions and substitutions. These may be detected using a variety of methods (e.g., sequencing, hybridization assays etc.).
A "deletion" is defined as a change in a nucleotide sequence in which one or more nucleotides are absent relative to the native sequence.
An "insertion" or "addition" is that change in a nucleotide sequence which has resulted in the addition of one or more nucleotides relative to the native sequence. A "substitution" results from the replacement of one or more nucleotides by different nucleotides or amino acids, respectively, and may be the same length of the native sequence but having a different sequence.
The term "derivative" as used herein, refers to any chemical modification of a nucleic acid. Illustrative of such modifications would be replacement of hydrogen by an alkyl, acyl, or amino group. For example, a nucleic acid derivative would encode a polypeptide which retains essential biological characteristics.
As used herein, the terms "complementary" or "complementarity" are used in reference to "polynucleotides" and "oligonucleotides" (which are interchangeable terms that refer to a sequence of nucleotides) related by the base-pairing rules. For example, the sequence "C-A-G-T," is complementary to the sequence "G-T-C-A." Complementarity may be "partial" or "total." "Partial" complementarity is where one or more nucleic acid bases is not matched according to the base pairing rules. "Total" or "complete" complementarity between nucleic acids is where each and every nucleic acid base is matched with another base under the base pairing rules. The degree of complementarity between nucleic acid strands has significant effects on the efficiency and strength of hybridization between nucleic acid strands. This is of particular importance in amplification reactions, as well as detection methods which depend upon binding between nucleic acids.
The terms "homology" and "homologous" as used herein in reference to nucleotide sequences refer to a degree of complementarity with other nucleotide sequences. There may be partial homology or complete homology (i.e., identity). A nucleotide sequence which is partially complementary, i.e., "substantially homologous," to a nucleic acid sequence is one that at least partially inhibits a completely complementary sequence from hybridizing to a target nucleic acid sequence. The inhibition of hybridization of the completely complementary sequence to the target sequence may be examined using a hybridization assay (Southern or Northern blot, solution hybridization and the like) under conditions of low stringency. A substantially homologous sequence or probe will compete for and inhibit the binding (i.e., the hybridization) of a completely homologous sequence to a target sequence under conditions of low stringency. This is not to say that conditions of low stringency are such that non-specific binding is permitted; low stringency conditions require that the binding of two sequences to one another be a specific (i.e., selective) interaction. The absence of non-specific binding may be tested by the use of a second target sequence which lacks even a partial degree of complementarity (e.g., less than about 30% identity); in the absence of non-specific binding the probe will not hybridize to the second non-complementary target.
The terms "homology" and "homologous" as used herein in reference to amino acid sequences refer to the degree of identity of the primary structure between two amino acid sequences. Such a degree of identity may be directed a portion of each amino acid sequence, or to the entire length of the amino acid sequence. Two or more amino acid sequences that are "substantially homologous" may have at least 50% identity, preferably at least 75% identity, more preferably at least 85% identity, most preferably at least 95%, or 100% identity.
An oligonucleotide sequence which is a "homolog" is defined herein as an oligonucleotide sequence which exhibits greater than or equal to 50% identity to a sequence, when sequences having a length of 100 bp or larger are compared.
Low stringency conditions comprise conditions equivalent to binding or hybridization at 42.degree. C. in a solution consisting of 5.times.SSPE (43.8 g/l NaCl, 6.9 g/l NaH.sub.2PO.sub.4.H.sub.20 and 1.85 g/l EDTA, pH adjusted to 7.4 with NaOH), 0.1% SDS, 5.times.Denhardt's reagent {50.times.Denhardt's contains per 500 ml: 5 g Ficoll (Type 400, Pharmacia), 5 g BSA (Fraction V; Sigma)} and 100 .mu.g/ml denatured salmon sperm DNA followed by washing in a solution which may comprise 5.times.SSPE, 0.1% SDS at 42.degree. C. when a probe of about 500 nucleotides in length, is employed. Numerous equivalent conditions may also be employed to comprise low stringency conditions; factors such as the length and nature (DNA, RNA, base composition) of the probe and nature of the target (DNA, RNA, base composition, present in solution or immobilized, etc.) and the concentration of the salts and other components (e.g., the presence or absence of formamide, dextran sulfate, polyethylene glycol), as well as components of the hybridization solution may be varied to generate conditions of low stringency hybridization different from, but equivalent to, the above listed conditions. In addition, conditions which promote hybridization under conditions of high stringency (e.g., increasing the temperature of the hybridization and/or wash steps, the use of formamide in the hybridization solution, etc.) may also be used.
As used herein, the term "hybridization" is used in reference to the pairing of complementary nucleic acids using any process by which a strand of nucleic acid joins with a complementary strand through base pairing to form a hybridization complex. Hybridization and the strength of hybridization (i.e., the strength of the association between the nucleic acids) is impacted by such factors as the degree of complementarity between the nucleic acids, stringency of the conditions involved, the Tm of the formed hybrid, and the G:C ratio within the nucleic acids.
As used herein the term "hybridization complex" refers to a complex formed between two nucleic acid sequences by virtue of the formation of hydrogen bonds between complementary G and C bases and between complementary A and T bases; these hydrogen bonds may be further stabilized by base stacking interactions. The two complementary nucleic acid sequences hydrogen bond in an antiparallel configuration. A hybridization complex may be formed in solution (e.g., C0 t or R0 t analysis) or between one nucleic acid sequence present in solution and another nucleic acid sequence immobilized to a solid support (e.g., a nylon membrane or a nitrocellulose filter as employed in Southern and Northern blotting, dot blotting or a glass slide as employed in in situ hybridization, including FISH (fluorescent in situ hybridization)).
As used herein, the term "Tm" is used in reference to the "melting temperature." The melting temperature is the temperature at which a population of double-stranded nucleic acid molecules becomes half dissociated into single strands. As indicated by standard references, a simple estimate of the Tm value may be calculated by the equation: Tm=81.5+0.41 (% G+C), when a nucleic acid is in aqueous solution at 1M NaCl. Anderson et al., "Quantitative Filter Hybridization" In: Nucleic Acid Hybridization (1985). More sophisticated computations take structural, as well as sequence characteristics, into account for the calculation of Tm.
As used herein the term "stringency" is used in reference to the conditions of temperature, ionic strength, and the presence of other compounds such as organic solvents, under which nucleic acid hybridizations are conducted. "Stringency" typically occurs in a range from about Tm to about 20.degree. C. to 25.degree. C. below Tm. A "stringent hybridization" may be used to identify or detect identical polynucleotide sequences or to identify or detect similar or related polynucleotide sequences. For example, when fragments of SEQ ID NO:2 are employed in hybridization reactions under stringent conditions the hybridization of fragments of SEQ ID NO:2 which contain unique sequences (i.e., regions which are either non-homologous to or which contain less than about 50% homology or complementarity with SEQ ID NOs:2) are favored. Alternatively, when conditions of "weak" or "low" stringency are used hybridization may occur with nucleic acids that are derived from organisms that are genetically diverse (i.e., for example, the frequency of complementary sequences is usually low between such organisms).
As used herein, the term "amplifiable nucleic acid" is used in reference to nucleic acids which may be amplified by any amplification method. It is contemplated that "amplifiable nucleic acid" will usually comprise "sample template."
As used herein, the term "sample template" refers to nucleic acid originating from a sample which is analyzed for the presence of a target sequence of interest. In contrast, "background template" is used in reference to nucleic acid other than sample template which may or may not be present in a sample. Background template is most often inadvertent. It may be the result of carryover, or it may be due to the presence of nucleic acid contaminants sought to be purified away from the sample. For example, nucleic acids from organisms other than those to be detected may be present as background in a test sample.
"Amplification" is defined as the production of additional copies of a nucleic acid sequence and is generally carried out using polymerase chain reaction. Dieffenbach C. W. and G. S. Dveksler (1995) In: PCR Primer, a Laboratory Manual, Cold Spring Harbor Press, Plainview, N.Y.
As used herein, the term "polymerase chain reaction" ("PCR") refers to the method of K. B. Mullis U.S. Pat. Nos. 4,683,195 and 4,683,202, herein incorporated by reference, which describe a method for increasing the concentration of a segment of a target sequence in a mixture of genomic DNA without cloning or purification. The length of the amplified segment of the desired target sequence is determined by the relative positions of two oligonucleotide primers with respect to each other, and therefore, this length is a controllable parameter. By virtue of the repeating aspect of the process, the method is referred to as the "polymerase chain reaction" (hereinafter "PCR"). Because the desired amplified segments of the target sequence become the predominant sequences (in terms of concentration) in the mixture, they are said to be "PCR amplified". With PCR, it is possible to amplify a single copy of a specific target sequence in genomic DNA to a level detectable by several different methodologies (e.g., hybridization with a labeled probe; incorporation of biotinylated primers followed by avidin-enzyme conjugate detection; incorporation of 32P-labeled deoxynucleotide triphosphates, such as dCTP or dATP, into the amplified segment). In addition to genomic DNA, any oligonucleotide sequence may be amplified with the appropriate set of primer molecules. In particular, the amplified segments created by the PCR process itself are, themselves, efficient templates for subsequent PCR amplifications.
As used herein, the term "primer" refers to an oligonucleotide, whether occurring naturally as in a purified restriction digest or produced synthetically, which is capable of acting as a point of initiation of synthesis when placed under conditions in which synthesis of a primer extension product which is complementary to a nucleic acid strand is induced, (i.e., in the presence of nucleotides and an inducing agent such as DNA polymerase and at a suitable temperature and pH). The primer is preferably single stranded for maximum efficiency in amplification, but may alternatively be double stranded. If double stranded, the primer is first treated to separate its strands before being used to prepare extension products. Preferably, the primer is an oligodeoxy-ribonucleotide. The primer must be sufficiently long to prime the synthesis of extension products in the presence of the inducing agent. The exact lengths of the primers will depend on many factors, including temperature, source of primer and the use of the method.
As used herein, the term "probe" refers to an oligonucleotide (i.e., a sequence of nucleotides), whether occurring naturally as in a purified restriction digest or produced synthetically, recombinantly or by PCR amplification, which is capable of hybridizing to another oligonucleotide of interest. A probe may be single-stranded or double-stranded. Probes are useful in the detection, identification and isolation of particular gene sequences. It is contemplated that any probe used in the present invention will be labeled with any "reporter molecule," so that it is detectable in any detection system, including, but not limited to enzyme (e.g., ELISA, as well as enzyme-based histochemical assays), fluorescent, radioactive, and luminescent systems. It is not intended that the present invention be limited to any particular detection system or label.
As used herein, the terms "restriction endonucleases" and "restriction enzymes" refer to bacterial enzymes, each of which cut double-stranded DNA at or near a specific nucleotide sequence.
DNA molecules are said to have "5' ends" and "3' ends" because mononucleotides are reacted to make oligonucleotides in a manner such that the 5' phosphate of one mononucleotide pentose ring is attached to the 3' oxygen of its neighbor in one direction via a phosphodiester linkage. Therefore, an end of an oligonucleotide is referred to as the "5' end" if its 5' phosphate is not linked to the 3' oxygen of a mononucleotide pentose ring. An end of an oligonucleotide is referred to as the "3' end" if its 3' oxygen is not linked to a 5' phosphate of another mononucleotide pentose ring. As used herein, a nucleic acid sequence, even if internal to a larger oligonucleotide, also may be said to have 5' and 3' ends. In either a linear or circular DNA molecule, discrete elements are referred to as being "upstream" or 5' of the "downstream" or 3' elements. This terminology reflects the fact that transcription proceeds in a 5' to 3' fashion along the DNA strand. The promoter and enhancer elements which direct transcription of a linked gene are generally located 5' or upstream of the coding region. However, enhancer elements may exert their effect even when located 3' of the promoter element and the coding region. Transcription termination and polyadenylation signals are located 3' or downstream of the coding region.
As used herein, the term "an oligonucleotide having a nucleotide sequence encoding a gene" means a nucleic acid sequence which may comprise the coding region of a gene, i.e. the nucleic acid sequence which encodes a gene product. The coding region may be present in a cDNA, genomic DNA or RNA form. When present in a DNA form, the oligonvoleotide may be single-stranded (i.e., the sense strand) or double-stranded. Suitable control elements such as enhancers/promoters, splice junctions, polyadenylation signals, etc. may be placed in close proximity to the coding region of the gene if needed to permit proper initiation of transcription and/or correct processing of the primary RNA transcript. Alternatively, the coding region utilized in the expression vectors of the present invention may contain endogenous enhancers/promoters, splice junctions, intervening sequences, polyadenylation signals, etc. or a combination of both endogenous and exogenous control elements.
The term "poly A site" or "poly A sequence" as used herein denotes a DNA sequence which directs both the termination and polyadenylation of the nascent RNA transcript. Efficient polyadenylation of the recombinant transcript is desirable as transcripts lacking a poly A tail are unstable and are rapidly degraded. The poly A signal utilized in an expression vector may be "heterologous" or "endogenous." An endogenous poly A signal is one that is found naturally at the 3' end of the coding region of a given gene in the genome. A heterologous poly A signal is one which is isolated from one gene and placed 3' of another gene. Efficient expression of recombinant DNA sequences in eukaryotic cells involves expression of signals directing the efficient termination and polyadenylation of the resulting transcript. Transcription termination signals are generally found downstream of the polyadenylation signal and are a few hundred nucleotides in length.
As used herein, the terms "nucleic acid molecule encoding", "DNA sequence encoding," and "DNA encoding" refer to the order or sequence of deoxyribonucleotides along a strand of deoxyribonucleic acid. The order of these deoxyribonucleotides determines the order of amino acids along the polypeptide (protein) chain. The DNA sequence thus codes for the amino acid sequence.
The term "Southern blot" refers to the analysis of DNA on agarose or acrylamide gels to fractionate the DNA according to size, followed by transfer and immobilization of the DNA from the gel to a solid support, such as nitrocellulose or a nylon membrane. The immobilized DNA is then probed with a labeled oligodeoxyribonucleotide probe or DNA probe to detect DNA species complementary to the probe used. The DNA may be cleaved with restriction enzymes prior to electrophoresis. Following electrophoresis, the DNA may be partially depurinated and denatured prior to or during transfer to the solid support. Southern blots are a standard tool of molecular biologists. J. Sambrook et al. (1989) In: Molecular Cloning: A Laboratory Manual, Cold Spring Harbor Press, NY, pp 9.31-9.58.
The term "Northern blot" as used herein refers to the analysis of RNA by electrophoresis of RNA on agarose gels to fractionate the RNA according to size followed by transfer of the RNA from the gel to a solid support, such as nitrocellulose or a nylon membrane. The immobilized RNA is then probed with a labeled oligodeoxyribonucleotide probe or DNA probe to detect RNA species complementary to the probe used. Northern blots are a standard tool of molecular biologists. J. Sambrook, J. et al. (1989) supra, pp 7.39-7.52.
The term "reverse Northern blot" as used herein refers to the analysis of DNA by electrophoresis of DNA on agarose gels to fractionate the DNA on the basis of size followed by transfer of the fractionated DNA from the gel to a solid support, such as nitrocellulose or a nylon membrane. The immobilized DNA is then probed with a labeled oligoribonucleotide probe or RNA probe to detect DNA species complementary to the ribo probe used.
As used herein the term "coding region" when used in reference to a structural gene refers to the nucleotide sequences which encode the amino acids found in the nascent polypeptide as a result of translation of a mRNA molecule. The coding region is bounded, in eukaryotes, on the 5' side by the nucleotide triplet "ATG" which encodes the initiator methionine and on the 3' side by one of the three triplets which specify stop codons (i.e., TAA, TAG, TGA).
As used herein, the term "structural gene" refers to a DNA sequence coding for RNA or a protein. In contrast, "regulatory genes" are structural genes which encode products which control the expression of other genes (e.g., transcription factors).
As used herein, the term "gene" means the deoxyribonucleotide sequences which may comprise the coding region of a structural gene and including sequences located adjacent to the coding region on both the 5' and 3' ends for a distance of about 1 kb on either end such that the gene corresponds to the length of the full-length mRNA. The sequences which are located 5' of the coding region and which are present on the mRNA are referred to as 5' non-translated sequences. The sequences which are located 3' or downstream of the coding region and which are present on the mRNA are referred to as 3' non-translated sequences. The term "gene" encompasses both cDNA and genomic forms of a gene. A genomic form or clone of a gene contains the coding region interrupted with non-coding sequences termed "introns" or "intervening regions" or "intervening sequences." Introns are segments of a gene which are transcribed into heterogeneous nuclear RNA (hnRNA); introns may contain regulatory elements such as enhancers. Introns are removed or "spliced out" from the nuclear or primary transcript; introns therefore are absent in the messenger RNA (mRNA) transcript. The mRNA functions during translation to specify the sequence or order of amino acids in a nascent polypeptide.
In addition to containing introns, genomic forms of a gene may also include sequences located on both the 5' and 3' end of the sequences which are present on the RNA transcript. These sequences are referred to as "flanking" sequences or regions (these flanking sequences are located 5' or 3' to the non-translated sequences present on the mRNA transcript). The 5' flanking region may contain regulatory sequences such as promoters and enhancers which control or influence the transcription of the gene. The 3' flanking region may contain sequences which direct the termination of transcription, posttranscriptional cleavage and polyadenylation.
The term "label" or "detectable label" is used herein, to refer to any composition detectable by spectroscopic, photochemical, biochemical, immunochemical, electrical, optical or chemical means. Such labels include biotin for staining with labeled streptavidin conjugate, magnetic beads (e.g., Dynabeads.RTM.), fluorescent dyes (e.g., fluorescein, texas red, rhodamine, green fluorescent protein, and the like), radiolabels (e.g., 3H, 125I, 35S, 14C, or 32P), enzymes (e.g., horse radish peroxidase, alkaline phosphatase and others commonly used in an ELISA), and calorimetric labels such as colloidal gold or colored glass or plastic (e.g., polystyrene, polypropylene, latex, etc.) beads. Patents teaching the use of such labels include, but are not limited to, U.S. Pat. Nos. 3,817,837; 3,850,752; 3,939,350; 3,996,345; 4,277,437; 4,275,149; and 4,366,241 (all herein incorporated by reference). The labels contemplated in the present invention may be detected by many methods. For example, radiolabels may be detected using photographic film or scintillation counters, fluorescent markers may be detected using a photodetector to detect emitted light. Enzymatic labels are typically detected by providing the enzyme with a substrate and detecting, the reaction product produced by the action of the enzyme on the substrate, and calorimetric labels are detected by simply visualizing the colored label.
The present invention is related to the field of genomic informatics and gene-expression profiling. Gene-expression profiles provide complex molecular fingerprints regarding the relative state of a cell or tissue. Similarities in gene-expression profiles between organic states (i.e., for example, normal and diseased cells and/or tissues) provide molecular taxonomies, classification, and diagnostics. Similarities in gene-expression profiles resulting from various external perturbations (i.e., for example, ablation or enforced expression of specific genes, and/or small molecules, and/or environmental changes) reveal functional similarities between these perturbagens, of value in pathway and mechanism-of-action elucidation. Similarities in gene-expression profiles between organic (e.g. disease) and induced (e.g. by small molecule) states may identify clinically-effective therapies. Improvements described herein allow for the efficient and economical generation of full-transcriptome gene-expression profiles by identifying cluster centroid landmark transcripts that predict the expression levels of other transcripts within the same cluster.
Some embodiments of the present invention contemplate performing genome-wide transcriptional profiling for applications including, but not limited to, disease classification and diagnosis without resort to expensive and laborious microarray technology (i.e., for example, Affymetrix GeneChip microarrays). Other uses include, but are not limited to, generating gene-expression data for use in and with information databases (i.e., for example, connectivity maps). A connectivity map typically may comprise a collection of a large number of gene-expression profiles together with allied pattern-matching software. The collection of profiles is searched with the pattern-matching algorithm for profiles that are similar to gene-expression data derived from a biological state of interest. The utility of this searching and pattern-matching exercise resides in the belief that similar biological states may be identified through the transitory feature of common gene-expression changes. The gene-expression profiles in a connectivity map may be derived from known cellular states, or cells or tissues treated with known chemical or genetic perturbagens. In this mode, the connectivity map is a tool for the functional annotation of the biological state of interest. Alternatively, the connectivity map is populated with gene-expression profiles from cells or tissues treated with previously uncharacterized or novel perturbagens. In this mode, the connectivity map functions as a screening tool. Most often, a connectivity map is populated with profiles of both types. Connectivity maps, in general, establish biologically-relevant connections between disease states, gene-product function, and small-molecule action. In particular, connectivity maps have wide-ranging applications including, but not limited to, functional annotation of unknown genes and biological states, identification of the mode of action or functional class of a small molecule, and the identification of perturbagens that modulate or reverse a disease state towards therapeutic advantage as potential drugs. See Lamb et al, "The Connectivity Map: using gene-expression signatures to connect small molecules, genes and disease" Science 313: 1929-1935 (2006), and Lamb, "The Connectivity Map: a new tool for biomedical research" Nature Reviews Cancer 7: 54-60 (2007). However, the high cost of generating gene-expression profiles severely limits the size and scope of connectivity maps. A connectivity map populated with gene-expression profiles derived from every member of an industrial small-molecule drug-screening library, a saturated combinatorial or diversity-orientated chemical library, a comprehensive collection of crude or purified plant or animal extracts, or from the genetic ablation or forced expression of every gene in a mammalian genome, for example, would be expected to facilitate more, and more profound, biological discoveries than those of existing connectivity maps. Although it is not necessary to understand the mechanism of an invention, it is believed that the presently disclosed method for gene-expression profiling reduces the cost of generating these profiles by more than 30-fold. The present invention contemplates the creation of connectivity maps with at least 100,000 gene-expression profiles, and ultimately, many millions of gene-expression profiles.
The present invention contemplates compositions and methods for making and using a transcriptome-wide gene-expression profiling platform that measures the expression levels of only a select subset of the total number of transcripts. Because gene expression is believed to be highly correlated, direct measurement of a small number (for example, 1,000) of appropriately-selected "landmark" transcripts allows the expression levels of the remainder to be inferred. The present invention, therefore, has the potential to reduce the cost and increase the throughput of full-transcriptome gene-expression profiling relative to the well-known conventional approaches that require all transcripts to be measured.
In one embodiment, the present invention contemplates identifying landmark transcripts from a computational analysis of a large collection of transcriptome-wide gene-expression profiles. In one embodiment, the profiles contain identities and expression levels of a large proportion (preferably more than 70%) of the known transcripts in the genome. In one preferred embodiment, the profiles are generated by the use of high-density DNA microarrays commercially-available from, but not limited to, Affymetrix, Agilent, and Illumina. Suitable profiles may also be generated by other transcriptome-analysis methods including, but not limited to, Serial Analysis of Gene Expression (SAGE) and deep cDNA sequencing. In one preferred embodiment, all profiles are generated with the same analysis method. In one especially preferred embodiment, all profiles are generated using Affymetrix oligonucleotide microarrays. In one embodiment, the number of profiles in the collection exceeds 1,000, and preferably is more than 10,000. In one preferred embodiment, the profiles derive from a broad diversity of normal and diseased tissue and/or cell types. As known to those skilled in the art, collections of suitable gene-expression profiles are available from public and private, commercial sources. In one preferred embodiment, gene-expression profiles are obtained from NCBI's Gene Expression Omnibus (GEO). In one embodiment, expression levels in the profiles in the collection are scaled relative to each other. Those skilled in the art will be aware of a variety of methods to achieve such normalization, including, but not limited to, quantile normalization (preferably RMA). In one preferred embodiment, expression levels in the profiles in the collection are scaled relative to each other using a set of transcripts (numbering approximately 100, and preferably approximately 350) having the lowest coefficients-of-variation (CV) of all transcripts at each of a number (preferably approximately 14) of expression levels chosen to span the range of expression levels observed, from an independent collection of transcriptome-wide gene-expression profiles (numbering at least 1,000 and preferably approximately 7,000).
In one preferred embodiment, profiles used to identify landmark transcripts are required to exceed a minimum standard for data quality (i.e., for example, quality control (QC) analysis). The samples passing the QC analysis are identified as a core dataset. Suitable data-quality measures are known to those skilled in the art and include, but are not limited to, percentage-of-P-calls and 3'-to-5' ratios. In one embodiment, an empirical distribution of data-quality measures is built and outlier profiles eliminated from the collection. In one preferred embodiment, profiles with data-quality measures beyond the 95th percentile of the distribution are eliminated from the collection. In one preferred embodiment, the set of transcripts represented in all profiles in the collection is identified, and the remainder eliminated from all of the profiles. In one embodiment, the set of transcripts below the limit of detection in a large proportion of the profiles (preferably 99%) are eliminated from the profiles.
In one embodiment, the present invention contemplates using dimensionality reduction in combination with cluster analysis to select transcripts to be measured (i.e., for example, landmark transcripts). While dimensionality reduction may be performed by a number of known methods, the embodiments described herein utilize principal component analysis. In one embodiment, the method further may comprise using a linear dimension reduction method (i.e., for example, using eigenvectors). In one embodiment, the cluster analysis creates a plurality of clusters wherein each cluster may comprise a single cluster centroid landmark transcript and a plurality of cluster non-centroid transcripts. See FIG. 1. In one preferred embodiment, clusters are achieved by using k-means clustering, wherein the k-means clustering is repeated a number of times allowing a consensus matrix to be constructed (i.e., for example, a gene-by-gene pairwise consensus matrix).
In one preferred embodiment, pockets of high local correlation are identified by hierarchically clustering the gene-by-gene pairwise consensus matrix. As is known to those skilled in the art, the tree from the hierarchical clustering may then be cut at multiple levels. At each level, there are numerous nodes, wherein the leaves (i.e., for example, illustrated herein as transcripts) in each node represent a tight cluster. For each tight cluster, a representative centroid `landmark` transcript may be chosen by picking the transcript whose individual profile most closely correlates with the tight-cluster's mean profile. In one preferred embodiment, the cluster analysis identifies multiple (preferably more than 3 and less than 10) centroid landmark transcripts. Although it is not necessary to understand the mechanism of an invention, it is believed that the expression level of cluster centroid landmark transcripts may be used to infer the expression level of the associated cluster non-centroid transcripts.
In one embodiment, the present invention contemplates a method which may comprise creating gene-expression profiles from data consisting only of cluster centroid landmark transcript expression-level measurements. In one embodiment, medically-relevant similarities between biological samples are identified by similarities in their corresponding gene-expression profiles produced in the space of cluster centroid landmark transcripts.
In one preferred embodiment, the levels of non-measured transcripts in a new biological sample are inferred (i.e., for example, predicted) from the measurements of the landmark transcripts with reference to a dependency matrix, thereby creating a full-transcriptome gene-expression profile. In one embodiment, a dependency matrix is constructed by performing linear regression between the expression levels of each of the cluster centroid landmark genes (g) and the expression levels of all of the non-landmark transcripts (G) in a collection of transcriptome-wide expression profiles. In one preferred embodiment, a pseudo-inverse is used to build the dependency matrix (G non-landmark transcripts.times.g landmark transcripts). In one preferred embodiment, the collection of transcriptome-wide expression profiles used to build the dependency matrix is the same collection used to identify the cluster centroid landmark transcripts. In another embodiment, the collection of transcriptome-wide expression profiles used to build the dependency matrix is different from that used to identify the cluster centroid landmark transcripts. In one preferred embodiment, multiple dependence matrices are constructed from collections of transcriptome-wide expression profiles, each collection populated with profiles derived from the same type of normal or diseased tissues or cells. In one embodiment, the choice of dependency matrix to use for the inference is made based upon knowledge of the tissue, cell and/or pathological state of the sample. In one preferred embodiment, the expression level of each non-landmark transcript in a new biological sample is inferred by multiplying the expression levels of each of the landmark transcripts by the corresponding weights looked up from the dependency matrix, and summing those products.
In one preferred embodiment, the present invention contemplates a method which may comprise the creation of full-transcriptome gene-expression profiles using measurements of a plurality of landmark transcripts and inference of non-landmark transcript levels, wherein those profiles have at least 80% of the performance of gene-expression profiles produced by direct measurement of all transcripts, in a useful application of gene-expression profiling.
In one embodiment, the present invention contemplates determining the number of cluster centroid landmark transcripts suitable for the creation of transcriptome-wide gene-expression profiles by experimentation. In one embodiment, the number of cluster centroid landmark transcripts suitable for the creation of transcriptome-wide gene-expression profiles is determined by simulation.
A computational simulation presented herein (Examples I and II) demonstrates that dimensionality reduction may be applied to the identification of a plurality of cluster centroid landmark transcripts, and that surprisingly few landmark-transcript measurements are sufficient to faithfully recreate full-transcriptome profiles. It is shown that the expression levels of only 1,000 cluster centroid landmark transcripts (i.e., for example, <5% of transcripts in the transcriptome) may be used to recreate full-transcriptome expression profiles that perform as well as profiles in which all transcripts were measured directly in 80% of tests for profile similarity examined. Further, these data demonstrate that 500 centroid landmark transcripts (i.e., for example, <2.5% of transcripts in the transcriptome) recovers approximately 50% of such similarities (FIG. 2).
In one preferred embodiment, the present invention contemplates a method which may comprise approximately 1,000 cluster centroid landmark transcripts from which the expression levels of the remainder of the transcriptome may be inferred.
In one embodiment, the present invention contemplates measuring the expression levels of a set of cluster centroid landmark transcripts in a biological sample which may comprise a plurality of transcripts, and using a corresponding dependency matrix to predict the expression levels of the transcripts not measured, thereby creating a full-transcriptome expression profile. In one preferred embodiment, the expression levels of the set of cluster centroid landmark transcripts are measured simultaneously. In another preferred embodiment, the number of cluster centroid landmark transcripts measured is approximately 1,000. In another preferred embodiment, the expression levels of the set of cluster centroid landmark transcripts are measured using a moderate-multiplex assay platform. As is well known to those skilled in the art, there are many methods potentially capable of determining the expression level of a moderate number (i.e. approximately 10 to approximately 1,000) of transcripts simultaneously. These include, but are not limited to, multiplexed nuclease-protection assay, multiplexed RT-PCR, DNA microarrays, nucleic-acid sequencing, and various commercial solutions offered by companies including, but not limited to, Panomics, High Throughput Genomics, NanoString, Fluidigm, Nimblegen, Affymetrix, Agilent, and Illumina.
In one preferred embodiment, the present invention contemplates a method for generating a full-transcriptome gene-expression profile by simultaneously measuring the expression levels of a set of cluster centroid landmark transcripts in a biological sample which may comprise a plurality of transcripts, and using a corresponding dependency matrix to predict the expression levels of the transcripts not measured, where the said simultaneous measurements are made using nucleic-acid sequencing.
In one preferred embodiment, the present invention contemplates a method for generating a full-transcriptome gene-expression profile by simultaneously measuring the expression levels of a set of cluster centroid landmark transcripts in a biological sample which may comprise a plurality of transcripts, and using a corresponding dependency matrix to predict the expression levels of the transcripts not measured, where the said simultaneous measurements are made using multiplex ligation-mediated amplification with Luminex FlexMAP optically-addressed and barcoded microspheres and flow-cytometric detection (LMF); Peck et al., "A method for high-throughput gene expression signature analysis" Genome Biology 7:R61 (2006). See FIG. 3. In this technique, transcripts are captured on immobilized poly-dT and reverse transcribed. Two oligonucleotide probes are designed for each transcript of interest. Upstream probes contain 20 nt complementary to a universal primer (T7) site, one of a set of unique 24 nt barcode sequences, and a 20 nt sequence complementary to the corresponding first-strand cDNA. Downstream probes are 5'-phosphorylated and contain 20 nt contiguous with the gene-specific fragment of the corresponding upstream probe and a 20 nt universal-primer (T3) site. Probes are annealed to target cDNAs, free probes removed, and juxtaposed probes joined by the action of ligase enzyme to yield 104 nt amplification templates. PCR is performed with T3 and 5'-biotinylated T7 primers. Biotinylated barcoded amplicons are hybridized against a pool of optically-addressed microspheres each expressing capture probes complementary to a barcode, and incubated with streptavidin-phycoerythrin to label biotin moieties fluorescently. Captured labeled amplicons are quantified and beads decoded by flow cytometry in Luminex detectors. The above reported LMF method was limited to measuring 100 transcripts simultaneously due to the availability of only 100 optical addresses. In one embodiment, the present invention contemplates a method for generating gene-expression profiles using simultaneous measurement of the levels of cluster centroid landmark transcripts that is compatible with an expanded number (approximately 500, and preferably 1,000) of barcode sequences, and optically-addressed microspheres and a corresponding flow-cytometric detection device. In one embodiment, the present invention contemplates a method which may comprise two assays per biological sample, each capable of measuring the expression levels of approximately 500 cluster centroid transcripts. In one embodiment, the present invention contemplates a method were the expression levels of approximately 1,000 cluster centroid landmark transcripts are measured in one assay per biological sample using less than 1,000 populations of optically-addressed microspheres by arranging for microspheres to express more than one type of capture probe complementary to a barcode. In one embodiment, the present invention contemplates a method which may comprise one assay per sample, each capable of measuring the expression levels of 1,000 cluster centroid landmark transcripts.
As is well known to those skilled in the art, an estimate of the expression level of a transcript made with one method (e.g. RT-PCR) does not always agree with the estimate of the expression level of that same transcript in the same biological sample made with another method (e.g. DNA microarray). In one embodiment, the present invention contemplates a method for selecting the set of cluster centroid landmark transcripts to be measured by a given moderate-multiplex assay platform for the purposes of predicting the expression levels of transcripts not measured, and thereby to create a full-transcriptome gene-expression profile, from the set of all possible cluster centroid landmark transcripts by experimentation. In one preferred embodiment, the set of cluster centroid landmark transcripts to be measured by a given moderate-multiple assay platform is selected by empirically confirming concordance between measurements of expression levels of cluster centroid landmark transcripts made by that platform and those made using the transcriptome-wide gene-expression profiling technology used to generate the collection of gene-expression profiles from which the universe of cluster centroid landmark transcripts was originally selected. In one especially preferred embodiment, the expression levels of all possible cluster centroid landmark transcripts (preferably numbering approximately 1,300) in a collection of biological samples (preferably numbering approximately 384) are estimated by both LMF and Affymetrix oligonucleotide microarrays, where Affymetrix oligonucleotide microarrays were used to produce the transcriptome-wide gene-expression profiles from which the universe of possible cluster centroid landmark transcripts was selected, resulting in the identification of a set of cluster centroid landmark transcripts (preferably numbering approximately 1,100) whose expression level estimated by LMF is consistently concordant with the expression levels estimated by Affymetrix oligonucleotide microarrays. Data presented herein (Example III) show unanticipated discordances between expression-level measurements made using LMF and Affymetrix oligonucleotide microarrays.
In one embodiment, the present invention contemplates a method for selecting the final set of cluster centroid landmark transcripts to be measured by a given moderate-multiplex assay platform for the purposes of predicting the expression levels of transcripts not measured, and thereby to create a full-transcriptome gene-expression profile, from the set of all possible cluster centroid landmark transcripts by experimentation. In one preferred embodiment, the set of cluster centroid landmark transcripts to be measured by a given moderate-multiple assay platform is selected by empirically confirming that measurements of their expression levels made by that platform may be used to predict the expression level of non-landmark transcripts in their cluster measured using the transcriptome-wide gene-expression profiling technology used to generate the collection of gene-expression profiles from which the universe of cluster centroid landmark transcripts was selected.
In one especially preferred embodiment, the expression levels of all possible cluster centroid landmark transcripts (preferably numbering approximately 1,300) in a collection of biological samples (preferably numbering approximately 384) are measured by LMF, and the expression levels of all non-landmark transcripts are measured in that same collection of biological samples by Affymetrix oligonucleotide microarrays, where Affymetrix oligonucleotide microarrays were used to produce the transcriptome-wide gene-expression profiles from which the universe of possible cluster centroid landmark transcripts was selected, resulting in the identification of a final set of cluster centroid landmark transcripts (preferably numbering approximately 1,000) whose expression levels estimated by LMF may consistently be used to predict the expression level of transcripts in their clusters as measured by Affymetrix oligonucleotide microarrays. Data presented herein (Example III) show unanticipated failures of measurements of the expression levels of certain cluster centroid landmark made using LMF to be useful for predicting the expression levels of transcripts in their cluster measured using Affymetrix oligonucleotide microarrays.
In one embodiment, the present invention contemplates creating a dependency matrix specific to the final set of cluster centroid landmark transcripts selected for a given moderate-multiplex assay platform.
Data presented herein (Examples IV, V, VI, VII) demonstrate the generation of useful transcriptome-wide gene-expression profiles from the measurement of the expression levels of a set of cluster centroid landmark transcripts selected for use with a specific moderate-multiplex assay platform.
In one embodiment, the present invention contemplates a method which may comprise normalization (i.e., for example, scaling) of gene-expression data to correct for day-to-day or detector-to-detector variability in signal intensities. Although it is not necessary to understand the mechanism of an invention, it is believed that in transcriptome-wide gene-expression profiles (i.e., for example, high-density microarray data with approximately 20,000 dimensions) convention assumes that the vast majority of the transcripts do not change in a given state. Such an assumption allows a summation of the expression levels for all transcripts to be taken as a measure of overall signal intensity. Those using conventional systems then normalize the expression level of each transcript against that overall signal-intensity value.
However, when using gene-expression profiles of lower dimensionality (i.e., for example, 1,000 transcripts) it is not reasonable to suppose that only a small fraction of those transcripts change, especially in the special case of cluster centroid landmark transcripts where the transcripts were selected, in part, because each exhibited different levels across a diversity of samples. Consequently, normalization relative to a sum of the levels of all transcripts is not suitable.
In one embodiment, the present invention contemplates normalizing gene-expression profiles relative to a set of transcripts whose levels do not change across a large collection of diverse sample (i.e., for example, invariant transcripts). Such a process is loosely analogous to the use of a so-called housekeeping gene (i.e., for example, GAPDH) as a reference in a qRT-PCR. Although it is not necessary to understand the mechanism of an invention, it is believed that the normalization described herein is superior to other known normalization techniques because the invariant transcripts are empirically determined to have invariant expression across a broad diversity of samples.
In one embodiment, the set of transcripts (numbering between 10 and 50, preferably 25) having the lowest coefficients-of-variation (CV) of all transcripts at each of a number (preferably approximately 14) of expression levels chosen to span the range of expression levels observed from a collection of transcriptome-wide gene-expression profiles (numbering at least 1,000 and preferably approximately 7,000), are identified as invariant transcripts. In one preferred embodiment, the collection of transcriptome-wide gene-expression profiles used to selected invariant transcripts is build02 of the Connectivity Map dataset (broadinstitute.org/cmap). In one preferred embodiment, a final set of invariant transcripts (numbering between 14 and 98, preferably 80) to be used to normalize measurements of expression levels of cluster centroid landmark transcripts made using a given moderate-multiplex assay platform is selected from the set of all invariant transcripts by empirically confirming concordance between measurements of their expression levels made by that platform and those made using the transcriptome-wide gene-expression profiling technology used to generate the collection of gene-expression profiles from which the invariant transcripts were originally identified, and that their expression levels are indeed substantially invariant, in a collection of biological samples (numbering preferably approximately 384).
Data presented herein (Examples IV, V, VI, VII) demonstrate the generation of useful transcriptome-wide gene-expression profiles from the measurement of the expression levels of a set of cluster centroid landmark transcripts measured on a selected moderate-multiple assay platform scaled relative to the expression levels of a set of invariant transcripts measured together on the same platform.
It has been reported that gene regulation may be studied on a genomic level using dimensionality reduction in combination with clustering techniques. For example, gene co-regulation may be inferred from gene co-expression dynamics (i.e., for example, gene-gene interactions) using a dimensionally reduced biological dataset. Capobianco E., "Model Validation For Gene Selection And Regulation Maps" Funct Integr Genomics 8(2):87-99 (2008). This approach suggests three feature extraction methods that may detect genes with the greatest differential expression by clustering analysis (i.e., for example, k-means) in combination with principal and/or independent component analysis. In transcriptomics, for instance, clusters may be formed by genes having similar expression patterns. Dimensionality reduction, however, is used primarily to eliminate "noise" from useful biological information. A correlation matrix may be computed whose decomposition applies according to an eigensystem including eigenvalues (i.e., for example, the energies of the modes) and eigenvectors (i.e., for example, .gamma., determined by maximizing the energy in each mode). Selecting representative differentially expressed genes may be performed by `regularization via shrinkage` that isolates cluster outliers to pick the genes having the greatest differential levels of expression.
Other dimensionality reduction methods have been used in proteomic biomarker studies. For example, mass-spectra based proteomic profiles have been used as disease biomarkers that generate datasets having extremely high dimensionality (i.e. number of features or variables) of proteomic data with a small sample size. Among these methods, one report suggests using a feature selection method described as centroid shrinkage, wherein data sets may be evaluated using causal inference techniques. Training samples are used to identify class centroids, wherein a test sample is assigned to a class belonging to the closest centroid. Hilario et al., "Approaches To Dimensionality Reduction In Proteomic Biomarker Studies" Brief Bioinform 9(2):102-118 (2008). Centroid shrinkage analysis has been previously used in gene expression analysis to diagnose cancers.
One dimensionality reduction report identifies a subset of features from within a large set of features. Such a selection process is performed by training a support vector machine to rank the features according to classifier weights. For example, a selection may be made for the smallest number of genes that are capable of accurately distinguishing between medical conditions (i.e., for example, cancer versus non-cancer). Principal component analysis is capable of clustering gene expression data, wherein specific genes are selected within each cluster as highly correlated with the expression of cancer. Golub's eigenspace vector method to predict gene function with cancer is directly compared and contrasted as an inferior method. Barnhill et al., "Feature Selection Method Using Support Vector Machine Classifier" U.S. Pat. No. 7,542,959 (col 35-49).
Linear transformations (i.e., for example, principal component analysis) may also be capable of identifying low-dimensional embeddings of multivariate data, in a way that optimally preserves the structure of the data. In particular, the performance of dimensionality reduction may be enhanced. Furthermore, the resulting dimensionality reduction may maintain data coordinates and pairwise relationships between the data elements. Subsequent clustering of decomposition information may be integrated in the linear transformation that clearly show separation between the clusters, as well as their internal structure. Koren et al., "Robust Linear Dimensionality Reduction" IEEE Trans Vis Comput Graph. 10(4):459-470 (2004).
Further, the invention encompasses methods and systems for organizing complex and disparate data. Principal component analysis may be used to evaluate phenotypic, gene expression, and metabolite data collected from Arabidopsis plants treated with eighteen different herbicides. Gene expression and transcription analysis was limited to evaluating gene expression in the context of cell function. Winfield et al., "Methods And Systems For Analyzing Complex Biological Systems" U.S. Pat. No. 6,873,914.
Functional genomics and proteomics may be studied involving the simultaneous analysis of hundreds or thousands of expressed genes or proteins. From these large datasets, dimensionality reduction strategies have been used to identify clinically exploitable biomarkers from enormous experimental datasets. The field of transcriptomics could benefit from using dimensionality reduction methods in high-throughput methods using microarrays. Finn W G., "Diagnostic Pathology And Laboratory Medicine In The Age Of "omics" J Mol Diagn. 9(4):431-436 (2007).
Multifactor dimensionality reduction (MDR) may also be useful for detecting and modeling epistasis, including the identification of single nucleotide polymorphisms (SNPs). MDR pools genotypes into `high-risk` and `low-risk` or `response` and `non-response` groups in order to reduce multidimensional data into only one dimension. MDR has detected gene-gene interactions in diseases such as sporadic breast cancer, multiple sclerosis and essential hypertension. MDR may be useful in evaluating most common diseases that are caused by the non-linear interaction of numerous genetic and environmental variables. Motsinger et al., "Multifactor Dimensionality Reduction: An Analysis Strategy For Modeling And Detecting Gene-Gene Interactions In Human Genetics And Pharmacogenomics Studies" Hum Genomics 2(5):318-328 (2006).
Another report attempted to use 6,100 transcripts to represent the entire transcriptome in an effort to avoid measuring for genes that were not expected to be expressed. Hoshida et al, "Gene Expression in Fixed Tissues and Outcome in Hepatocellular Carcinoma" New Engl J Med 259:19 (2008).
mRNA expression may be measured by any suitable method, including but not limited to, those disclosed below.
In some embodiments, RNA is detected by Northern blot analysis. Northern blot analysis involves the separation of RNA and hybridization of a complementary labeled probe.
In other embodiments, RNA expression is detected by enzymatic cleavage of specific structures (INVADER assay, Third Wave Technologies; See e.g., U.S. Pat. Nos. 5,846,717, 6,090,543; 6,001,567; 5,985,557; and 5,994,069; each of which is herein incorporated by reference). The INVADER assay detects specific nucleic acid (e.g., RNA) sequences by using structure-specific enzymes to cleave a complex formed by the hybridization of overlapping oligonucleotide probes.
In still further embodiments, RNA (or corresponding cDNA) is detected by hybridization to an oligonucleotide probe. A variety of hybridization assays using a variety of technologies for hybridization and detection are available. For example, in some embodiments, TaqMan assay (PE Biosystems, Foster City, Calif.; See e.g., U.S. Pat. Nos. 5,962,233 and 5,538,848, each of which is herein incorporated by reference) is utilized. The assay is performed during a PCR reaction. The TaqMan assay exploits the 5'-3' exonuclease activity of the AMPLITAQ GOLD DNA polymerase. A probe consisting of an oligonucleotide with a 5'-reporter dye (e.g., a fluorescent dye) and a 3'-quencher dye is included in the PCR reaction. During PCR, if the probe is bound to its target, the 5'-3' nucleolytic activity of the AMPLITAQ GOLD polymerase cleaves the probe between the reporter and the quencher dye. The separation of the reporter dye from the quencher dye results in an increase of fluorescence. The signal accumulates with each cycle of PCR and may be monitored with a fluorimeter.
In yet other embodiments, reverse-transcriptase PCR (RT-PCR) is used to detect the expression of RNA. In RT-PCR, RNA is enzymatically converted to complementary DNA or "cDNA" using a reverse transcriptase enzyme. The cDNA is then used as a template for a PCR reaction. PCR products may be detected by any suitable method, including but not limited to, gel electrophoresis and staining with a DNA specific stain or hybridization to a labeled probe. In some embodiments, the quantitative reverse transcriptase PCR with standardized mixtures of competitive templates method described in U.S. Pat. Nos. 5,639,606, 5,643,765, and 5,876,978 (each of which is herein incorporated by reference) is utilized.
The method most commonly used as the basis for nucleic acid sequencing, or for identifying a target base, is the enzymatic chain-termination method of Sanger. Traditionally, such methods relied on gel electrophoresis to resolve, according to their size, wherein nucleic acid fragments are produced from a larger nucleic acid segment. However, in recent years various sequencing technologies have evolved which rely on a range of different detection strategies, such as mass spectrometry and array technologies.
One class of sequencing methods assuming importance in the art are those which rely upon the detection of PPi release as the detection strategy. It has been found that such methods lend themselves admirably to large scale genomic projects or clinical sequencing or screening, where relatively cost-effective units with high throughput are needed.
Methods of sequencing based on the concept of detecting inorganic pyrophosphate (PPi) which is released during a polymerase reaction have been described in the literature for example (WO 93/23564, WO 89/09283, WO 98/13523 and WO 98/28440). As each nucleotide is added to a growing nucleic acid strand during a polymerase reaction, a pyrophosphate molecule is released. It has been found that pyrophosphate released under these conditions may readily be detected, for example enzymically e.g. by the generation of light in the luciferase-luciferin reaction. Such methods enable a base to be identified in a target position and DNA to be sequenced simply and rapidly whilst avoiding the need for electrophoresis and the use of labels.
At its most basic, a PPi-based sequencing reaction involves simply carrying out a primer-directed polymerase extension reaction, and detecting whether or not that nucleotide has been incorporated by detecting whether or not PPi has been released. Conveniently, this detection of PPi-release may be achieved enzymatically, and most conveniently by means of a luciferase-based light detection reaction termed ELIDA (see further below).
It has been found that dATP added as a nucleotide for incorporation, interferes with the luciferase reaction used for PPi detection. Accordingly, a major improvement to the basic PPi-based sequencing method has been to use, in place of dATP, a dATP analogue (specifically dATP.alpha.s) which is incapable of acting as a substrate for luciferase, but which is nonetheless capable of being incorporated into a nucleotide chain by a polymerase enzyme (WO 98/13523).
Further improvements to the basic PPi-based sequencing technique include the use of a nucleotide degrading enzyme such as apyrase during the polymerase step, so that unincorporated nucleotides are degraded, as described in WO 98/28440, and the use of a single-stranded nucleic acid binding protein in the reaction mixture after annealing of the primers to the template, which has been found to have a beneficial effect in reducing the number of false signals, as described in WO00/43540.
In other embodiments, gene expression may be detected by measuring the expression of a protein or polypeptide. Protein expression may be detected by any suitable method. In some embodiments, proteins are detected by immunohistochemistry. In other embodiments, proteins are detected by their binding to an antibody raised against the protein. The generation of antibodies is described below.
Antibody binding may be detected by many different techniques including, but not limited to (e.g., radioimmunoassay, ELISA (enzyme-linked immunosorbant assay), "sandwich" immunoassays, immunoradiometric assays, gel diffusion precipitation reactions, immunodiffusion assays, in situ immunoassays (e.g., using colloidal gold, enzyme or radioisotope labels, for example), Western blots, precipitation reactions, agglutination assays (e.g., gel agglutination assays, hemagglutination assays, etc.), complement fixation assays, immunofluorescence assays, protein A assays, and immunoelectrophoresis assays, etc.
In one embodiment, antibody binding is detected by detecting a label on the primary antibody. In another embodiment, the primary antibody is detected by detecting binding of a secondary antibody or reagent to the primary antibody. In a further embodiment, the secondary antibody is labeled.
In some embodiments, an automated detection assay is utilized. Methods for the automation of immunoassays include those described in U.S. Pat. Nos. 5,885,530, 4,981,785, 6,159,750, and 5,358,691, each of which is herein incorporated by reference. In some embodiments, the analysis and presentation of results is also automated. For example, in some embodiments, software that generates a prognosis based on the presence or absence of a series of proteins corresponding to cancer markers is utilized.
In other embodiments, the immunoassay described in U.S. Pat. Nos. 5,599,677 and 5,672,480; each of which is herein incorporated by reference.
In some embodiments, a computer-based analysis program is used to translate the raw data generated by the detection assay (e.g., the presence, absence, or amount of a given transcript or transcripts) into data of predictive value for a clinician or researcher. The clinician or researcher may access the predictive data using any suitable means. Thus, in some preferred embodiments, the present invention provides the further benefit that the clinician or researcher, who is not likely to be trained in genetics or genomics, need not understand the raw data. The data is presented directly to the clinician or researcher in its most useful form. The clinician or researcher is then able to immediately utilize the information in order to optimize the care of the subject or advance the discovery objectives.
The present invention contemplates any method capable of receiving, processing, and transmitting the information to and from laboratories conducting the assays, wherein the information is provided to medical personnel and/or subjects and/or researchers. For example, in some embodiments of the present invention, a sample (e.g., a biopsy or a serum or urine sample or perturbed cells or tissue) is obtained from a subject or experimental procedure and submitted to a profiling service (e.g., clinical laboratory at a medical facility, genomic profiling business, etc.), located in any part of the world (e.g., in a country different than the country where the subject resides, the experiment performed, or where the information is ultimately used) to generate raw data. Where the sample may comprise a tissue or other biological sample, the subject may visit a medical center to have the sample obtained and sent to the profiling center, or subjects may collect the sample themselves (e.g., a urine sample) and directly send it to a profiling center. Where the sample may comprise previously determined biological information, the information may be directly sent to the profiling service by the subject (e.g., an information card containing the information may be scanned by a computer and the data transmitted to a computer of the profiling center using an electronic communication system). Once received by the profiling service, the sample is processed and a profile is produced (i.e., expression data) specific for the diagnostic or prognostic information desired for the subject, or the discovery objective of the researcher.
The profile data is then prepared in a format suitable for interpretation by a treating clinician or researcher. For example, rather than providing raw expression data, the prepared format may represent a diagnosis or risk assessment for the subject, along with recommendations for particular treatment options, or mechanism-of-action, protein-target prediction, or potential therapeutic use for an experimental perturbagen. The data may be displayed to the clinician or researcher by any suitable method. For example, in some embodiments, the profiling service generates a report that may be printed for the clinician or researcher (e.g., at the point of care or laboratory) or displayed to the clinician or researcher on a computer monitor.
In some embodiments, the information is first analyzed at the point of care or laboratory or at a regional facility. The raw data is then sent to a central processing facility for further analysis and/or to convert the raw data to information useful for a clinician, patient or researcher. The central processing facility provides the advantage of privacy (all data is stored in a central facility with uniform security protocols), speed, and uniformity of data analysis. The central processing facility may then control the fate of the data following treatment of the subject or completion of the experiment. For example, using an electronic communication system, the central facility may provide data to the clinician, the subject, or researchers.
In some embodiments, the subject is able to directly access the data using the electronic communication system. The subject may chose further intervention or counseling based on the results. In some embodiments, the data is used for research use. For example, the data may be used to further optimize the inclusion or elimination of markers as useful indicators of a particular condition or stage of disease.
One method for differentiating between cell types within a heterogeneous cell mixture has been reported that generates a multimodal distribution pattern following simultaneous flow cytometric data collection. Specifically, multimodal/multispectral images of a population of cells were simultaneously collected, wherein photometric and/or morphometric features identifiable in the images were used to separate the population of cells into subpopulations. A multi-spectral flow cytometer was configured to detect light signals generated by a variety of labels such as, DAPI, FITC, dark field, PE, bright field, and Deep Red. These respective labels were conjugated to specific antibodies that had differential specific binding for normal cells versus diseased cells. Consequently, an abnormal ratio of detected cell patterns provides a basis for disease diagnosis. As such this method was limited to the ability to detect and label antigenic sites on biological cell surfaces that identified the cell's physiological state. Ortyn et al., "Blood And Cell Analysis Using An Imaging Flow Cytometer" United States Patent Application 2009/0190822 (herein incorporated by reference).
A qualitative and quantitative assessment of a plurality of analytes from a biological sample using microwell technology has been developed wherein the biological analytes are attached to a lithographic grid via known biological recognition elements. Identification of the analytes is accomplished by attaching luminescent labels having different emission wavelengths to either the analyte or the recognition element. Consequently, the assay may differentiate between analytes by using two or more labels having the same excitation wavelength, but differing in emission wavelength. Once the analytes are contacted with the lithographic grid, the analyte/recognition element complexes are detected using optically generated luminescent detection technology. Cross-reactivity between analytes could be differentiated by providing recognition elements having differing affinities for the respective analytes. Pawlak et al., "Kit and method for determining a plurality of analytes" U.S. Pat. No. 7,396,675 (herein incorporated by reference).
A method specific for detecting circulating antibodies has been reported that uses microspheres conjugated to labeled antigens for the antibodies. The labeled antigens are usually other antibodies having specific affinity for species-specific Fc portions of a circulating antibody. The labels are described as generally fluorescent labels that are detected using a conventional flow cytometer. A multiplex calibration technique is described that uses several subsets of microspheres or beads, wherein the surface of each microsphere subset has a different concentration of the same antigen. This calibration procedure thereby generates "a standard curve" such that the concentration of a circulating antibody may be estimated. Connelly et al., "Method and composition for homogeneous multiplexed microparticle-based assay" U.S. Pat. No. 7,674,632 (herein incorporated by reference).
Solution-based methods are generally based upon the use of detectable target-specific bead sets which comprise a capture probe coupled to a detectable bead, where the capture probe binds to an individual labeled target nucleic acid. Each population of bead sets is a collection of individual bead sets, each of which has a unique detectable label which allows it to be distinguished from the other bead sets within the population of bead sets (i.e., for example, ranging from 5-500 bead sets depending upon assay sensitivity parameters). Any labels or signals may be used to detect the bead sets as long as they provide unique detectable signals for each bead set within the population of bead sets to be processed in a single reaction. Detectable labels include but are not limited to fluorescent labels and enzymatic labels, as well as magnetic or paramagnetic particles (see, e.g., Dynabeads8 (Dynal, Oslo, Norway)). The detectable label may be on the surface of the bead or within the interior of the bead.
The composition of the beads may vary. Suitable materials include, but are not limited to, any materials used as affinity matrices or supports for chemical and biological molecule syntheses and analyses, including but not limited to: polystyrene, polycarbonate, polypropylene, nylon, glass, dextran, chitin, sand, pumice, agarose, polysaccharides, dendrimers, buckyballs, polyacrylamide, silicon, rubber, and other materials used as supports for solid phase syntheses, affinity separations and purifications, hybridization reactions, immunoassays and other such applications. Typically the beads have at least one dimension in the 5-10 mm range or smaller. The beads may have any shape and dimensions, but typically have at least one dimension that is 100 mm or less, for example, 50 mm or less, 10 mm or less, 1 mm or less, 100 pm or less, 50 pm or less, and typically have a size that is 10 pm or less such as, 1 pm or less, 100 nm or less, and 10 nm or less. In one embodiment, the beads have at least one dimension between 2-20 pm. Such beads are often, but not necessarily, spherical e.g. elliptical. Such reference, however, does not constrain the geometry of the matrix, which may be any shape, including random shapes, needles, fibers, and elongated. Roughly spherical, particularly microspheres that may be used in the liquid phase, also are contemplated. The beads may include additional components, as long as the additional components do not interfere with the methods and analyses herein.
Commercially available beads which may be used in the methods of the present invention include, but are not limited to, bead-based technologies available from Luminex, Illumina, and/or Lynx. In one embodiment, microbeads may be labeled with different spectral properties and/or fluorescent (or colorimetric) intensities. For example, polystyrene microspheres are provided by Luminex Corp, Austin, Tex. that are internally dyed with two spectrally distinct fluorochromes. Using precise ratios of these fluorochromes, a large number of different fluorescent bead sets may be produced (i.e., for example, 5-100 bead sets). Each set of the beads may be distinguished by its spectral address, a combination of which allows for measurement of a large number of analytes in a single reaction vessel. Alternatively, a detectable target molecule may be labeled with a third fluorochrome. Because each of the different bead sets is uniquely labeled with a distinguishable spectral address, the resulting hybridized bead-target complexes will be distinguishable for each different target nucleic acid, which may be detected by passing the hybridized bead-target complexes through a rapidly flowing fluid stream. In the stream, the beads are interrogated individually as they pass two separate lasers. High speed digital signal processing classifies each of the beads based on its spectral address and quantifies the reaction on the surface. Thousands of beads may be interrogated per second, resulting a high speed, high throughput and accurate detection of multiple different target nucleic acids in a single reaction. In addition to a detectable label, the bead sets may also contain a capture probe which may bind to an individual target analyte. For example, a capture probe may comprise a nucleic acid, a protein, a peptide, a biological receptor, an enzyme, a hormone, an antibody, a polyclonal antibody, a monoclonal antibody, and/or an Fab fragment. If the capture probe is a short unique DNA sequence, it may comprise uniform hybridization characteristics with a target nucleic acid analyte. The capture probe may be coupled to the beads using any suitable method which generates a stable linkage between probe and the bead, and permits handling of the bead without compromising the linkage using further methods of the invention. Nucleic acid coupling reactions include, but are not limited to, the use of capture probes modified with a 5' amine for coupling to carboxylated microsphere or bead.
Most bead-based analyte detection systems are based upon Luminex colored beads, and/or the Luminex flow cytometric measurement system. The flow cytometric measurement system provides a summary report of median fluorescent intensity (MFI) values for each measured analyte as well as bead-level output data for each sample. The bead-level output data is usually stored in a standard flow cytometry data format, includes a set membership and fluorescent intensity of each individual bead that is detected. Although it is not necessary to understand the mechanism of an invention, it is believed that data collection and storage capability suggests that the capacity of the commercially available Luminex system may be expanded beyond its commonly accepted limitations of 500 bead-sets per well.
The Luminex xMAP.RTM. technology is a commercially available bead-based system that has a limitation for simultaneous measurements of up to 500 analytes per sample. Measurement instruments used to support Luminex technology are basically flow cytometers capable of detecting and/or identifying 500 color bead set variations. Usually, each specific color bead variation provides a unique identification for an individual analyte. In particular, the system assigns each bead detected in a sample to a set based on its color. The system then summarizes the measurement value for each set by reporting the median fluorescent intensity (MFI) of all beads belonging to that set.
Recent advances in biotechnology, and in particular genomics, have exceeded the usefulness of data sets restricted to a 500 analyte assay. For example, in gene expression profiling, one might be interested in measuring the expression of more than 500 genes. One approach to overcome this limitation is to use two or more collections of the 500 bead sets, wherein each collection interrogates a different set of 500 genes. This approach requires measurement of the same sample in two separate wells to provide a complete assay. The problem with this approach is that it requires twice the amount of sample and takes twice the amount of time for detection. Duplicate sampling techniques is also prone to failures since failure of a single well also renders the data obtained from the duplicate sample well unusable. In addition, batch artifacts arise during the process of combining the wells that constitute a single sample.
The Luminex detector is analogous to a flow cytometer in that the instrument measures the fluorescent intensity of beads upon passage through a flow chamber. Alternatively, the detector may be a charged coupled device. Generally, at least two fluorescence measurements are recorded from a maximum of 500 differentially colored bead sets. As a single analyte is usually attached to each differentially colored bead, the fluorescent counts may be used to uniquely identify individual analytes. In particular, the system assigns each bead detected in a sample to a set based on its color. A complete Luminex bead-set which may comprise these 500 differentially colored beads may be depicted using a three dimensional coordinate plot. It is generally believed that the number of differentially colored beads that may be accurately classified to a bead-color-region is limited by the overlapping spectral regimes of the different colors used. For example, a bead-color-region may include, but not be limited to 500 beads each identified by a unique 3d coordinate using three classification laser measurements (CL1, CL2 and CL3) In addition to classifying the beads, the instrument records another fluorescence measurement known as a "reporter" for each bead. The "reporter" measurement is used to quantify the chemical reaction of interest and/or determine the presence or absence of an analyte (i.e., for example, mRNA).
Microfluidic devices have also been suggested to be used with methods where labeled microspheres (Luminex beads) would simultaneously detect multiple analytes in one of several sample chambers. These devices are constructed by a process known as multilayer soft lithography (MSL) that create multilayer microfluidic systems by binding multiple patterned layers of elastomers. For example, the presence of the multi-layered microchannels allows delivery of a different labeled microparticle to a specific sample chamber where a different analyte is detected. Each microparticle is specifically functionalized to bind a particular analyte. Therefore, each microparticle in a given sample chamber is capable of analyzing an analyte different from the analyte for each other microparticle in the same sample chamber. As the delivery of each microsphere is independently controlled, labeled microspheres may be added to their respective samples chambers in different proportions, presumably to optimize the detection of each specific analyte (i.e., for example, to prevent and/or overcome sample signal saturation). Diercks et al., "Multiplexed, microfluidic molecular assay device and assay method" United States Patent Application 2007/0183934 (herein incorporated by reference).
Microspheres, such as Luminex beads, has been described as a platform to support the amplification of nucleic acids and production of proteins, in addition to the phototransfer from one substrate to another substrate. In particular, the microspheres may be spectrally encoded through incorporation of semiconductor nanocrystals (or SCNCs). A desired fluorescence characteristic may be obtained by mixing SCNCs of different sizes and/or compositions in a fixed amount and ratio to create a solution having a specific fluorescence spectra. Therefore, a number of SCNC solutions may be prepared, each having a distinct distribution of semiconductor nanocrystal labeled microsphere size and composition, wherein each solution has a different fluorescence characteristic. Further, these solutions may be mixed in fixed proportions to arrive at a spectrum having predetermined ratios and intensities of emission from the distinct SCNCs suspended in that solution. Lim et al., "Methods for capturing nascent proteins" United States Patent Application 2010/0075374 (herein incorporated by reference).
Luminex bead systems have been described to improve the detection precision of a single analyte. A set of differently numbered microparticles (i.e., for example, belonging to different bead-sets or differential colors) are all coated with the same reagent so as to make them identical in sensitivity to the analyte being assayed. For example, an intra-assay titration curve may be constructed by coating the same fluorophore with different concentrations of labeled antibody, such that the same concentration of analyte is measured by detecting different signal magnitudes. Hanley B., "Intraplexing method for improving precision of suspended microarray assays" U.S. Pat. No. 7,501,290 (herein incorporated by reference).
The use of color coded beads has been described which may comprise nucleic acid capture moieties capable of `tandem hybridization` with target nucleotides. Generally, a short capture probe is present on a color coded bead that binds a unique sequence of the target nucleic acid, while a longer labeled stacking probe has been preannealed to the target nucleic acid to facilitate subsequent detection. Each color coded bead therefore uniquely distinguishes between specific target nucleotides based upon the capture moiety nucleic acid sequence. Beattie et al., "Nucleic acid analysis using sequence-targeted tandem hybridization" U.S. Pat. No. 6,268,147 (herein incorporated by reference).
A solution-based method for determining the expression level of a population of labeled target nucleic acids has been developed that is based upon capturing the labeled target nucleic acids with color coded beads. Each bead is conjugated to a specific capture probe that binds to an individual labeled target nucleic acid. Usually, the capture probes are nucleic acids capable of hybridization to the labeled target nucleic acids such that their respective expression level may be determined within a biological sample. The method describes specific populations of target-specific bead sets, wherein each target-specific bead set is individually detectable and hybridizes to only one target nucleic acid. Specifically, the target-specific bead sets are described as having at least 5 individual bead sets that may bind with a corresponding set of target nucleic acids. As such, the bead population of a target-specific bead set may contain at least 100 individual beads that bind with a corresponding set of target nucleic acid. Golub et al., "Solution-based methods for RNA expression profiling" United States Patent Application 2007/0065844 (herein incorporated by reference).
In one embodiment, the present invention contemplates a solution-based method for highly multiplexed determination of populations of analyte levels present in a biological sample. For example, the population of target analytes may be a collection of individual target nucleic acids of interest, such as a member of a gene expression signature or just a particular gene of interest. Alternatively, the population of target analytes may be a collection of individual target proteins and/or peptides. Each individual target analyte of interest is conjugated to a detectable solid substrate (i.e., for example, a differentially colored bead) in a quantitative or semi-quantitative manner, such that the level of each target analyte may be measured using a detectable signal generated by the detectable solid substrate. The detectable signal of the detectable solid substrate is sometimes referred to as the target molecule signal or simply as the target signal. The method also involves a population of target-specific bead sets, where each target-specific bead set is individually detectable and has a capture probe which corresponds to an individual analyte. The population of analytes is attached in solution with the population of detectable solid substrates to form a solid substrate-analyte complex. To determine the level of the population of target analytes present, one detects the solid substrate signal for each solid-substrate-analyte complex, such that the level of the solid substrate signal indicates the level of the target analyte, and the location of the solid substrate signal within a multi-modal signal distribution pattern indicates the identity of the analyte being detected.
Limitations of existing bead-based systems is that, due to relatively large microliter-scale volume of sample used per well, each analyte must be assayed with multiple beads of the same type to prevent signal saturation. Similar beads will compete with each other to bind to the same analyte. This situation decreases the sensitivity of the assay because the target analyte present in the sample is distributed over all of the beads specific for that analyte; and each bead will be reporting only a fraction of the analyte concentration. The mean value of the analyte concentration will, therefore, have a large standard error due to variable concentration values reported by each bead. The improvements of bead-based analyte detection described below make possible a highly accurate, and sensitive, high capacity analyte detection system wherein an analyte may be detected using a single bead.
In one embodiment, the present invention contemplates a method which may comprise combining a plurality of 500 bead-set collections in a single well, wherein each collection interrogates a different set of 500 genes. In one embodiment, the method further may comprise detecting the plurality of 500 bead-set collections using the single well. In one embodiment, the method further may comprise generating a multi-modal fluorescent intensity distribution for each of the 500 bead color variations. Although it is not necessary to understand the mechanism of an invention, it is believed that the number of beads that support each multi-modal peak may be determined by determining the local height and width. In one embodiment, the method further may comprise comparing the number of beads within a specific multi-modal peak to the mixing proportion of a bead for a specific gene. In one embodiment, the multi-modal peak bead number matches the bead mixing proportion such that the specific analyte is identified.
As detailed above, the standard commercially available high capacity analyte detection systems are limited to simultaneously processing 500 analytes. While the ability of measuring up to 500 analytes may be sufficient for many applications, this limitation is restrictive for most practical genomics applications. For example, in assessing transcriptome-wide gene expression profiling a practical assay requires a simultaneous processing of much more than 500 genes.
One obvious approach to solve this problem would be to detect more than 500 analytes (i.e., for example, 1,000 genes) by using two wells per sample (i.e., for example, 500 genes per well.times.2 wells). This technique would then assay a complete collection of 500 differentially dyed bead sets in both wells, where the bead sets in the first well are coupled to genes 1-500 and the bead sets in the second well are couples to genes 501-1000. Consequently, equal aliquots of a biological sample are added to each well and detected separately. In order to determine the final result, the data from the two separate detections would have to be combined.
Several disadvantages are inherent in this approach including but not limited to: i) logistically cumbersome; ii) requires twice as much sample; iii) takes twice as much detection time; iv) loss of one well compromises both wells of data; or v) susceptible to batch artifacts which makes it difficult to re-constitute the whole sample.
In one embodiment, the present invention contemplates a method which may comprise interrogating multiple analytes, wherein said analytes are conjugated to individual, but identical, differentially colored beads. In one embodiment, a first analyte is conjugated to the individual, but identical, differentially colored bead that is selected from a first 500 bead-set. In one embodiment, a second analyte is conjugated to the individual, but identical, differentially colored variant that is selected from a second 500 bead-set.
The Luminex bead-level intensity data distributions suggested that expansion of the system's capacity might be possible by combining two collections of 500 bead-sets in a single well, wherein each 500 bead-set collection interrogates a different set of 500 genes. This approach would allow detection of a single sample in a single well. In some embodiments, various analytical methods are applied to the resulting bead level intensity data to obtain the correct identity for all 1,000 analytes.
Usually, colored bead intensities belonging to a particular bead set are summarized as a single value, wherein a median fluorescent intensity (MFI) is reported as the data point. For example, when the measured analytes are genes, the MFI of a particular bead set color represents the expression value of a particular gene. A significant disadvantage to the median-based algorithm is the presence of inaccuracy if the number of outliers is significantly large (e.g. if a number of beads have an intensity value close to zero), or where low bead counts could lead to misleading MFI values. For example, suggested Luminex data analysis methods ignore data wherein the bead count is less than thirty (30).
In addition to the MFI value, however, Luminex detectors also make available data for each individual bead (e.g., bead-level data). These data are stored in a standard flow cytometry data format (i.e., for example, an LXB file) and include information such as, set membership and/or a fluorescent intensity of each individual bead that is detected. Certain embodiments of the present invention have taken advantage of this alternative data by developing a kernel density based intensity summarization method as an alternative to the default MFI summarization method. In a kernel density method, a smoothed Gaussian density estimate is first fit to the data. A peak detection algorithm then detects local maxima. The most prominent peak (defined as the peak which may comprise the highest bead count) is reported as the summary intensity value. Unlike the standard MFI algorithm, the kernel algorithm may also ignore spurious outliers and/or identify analytes with low bead counts for further consideration. For example, the data presented herein show the differences between intensity distributions for two analytes between MFI values and kernel density based measurements.
Detection and analysis of multimodal peaks have been discussed in relation to mass spectrometry analysis. Old et al., "Methods and systems for peak detection and quantitation" U.S. Pat. No. 7,279,679 (herein incorporated by reference). However, some embodiments of the present invention provide significant improvements that provide superior detection of analytes.
In one embodiment, the present invention contemplates a method which may comprise detecting peaks from a multi-modal fluorescent intensity distribution using an algorithm. In one embodiment, the algorithm recovers an expression value of each gene interrogated with each bead color variation.
In one embodiment, the present invention contemplates a method for improving the accuracy of the peak detection algorithm. In one embodiment, the accuracy is improved by selecting paired genes. In one embodiment, the paired genes are frequently distant. Although it is not necessary to understand the mechanism of an invention, it is believed that a linear programming approach may be employed to maximize the pairwise distances across all genes.
Peak detection usually involves the identification of sufficient statistics comparing different populations from a multimodally distributed signal pattern. For example, the statistical analysis may identify two different populations from a bi-modal distribution signal pattern. Generally, a first step in peak identification involves assigning each data point (i.e., for example, a bead-level data point) to its most salient population. Once these data points have been mapped to their respective population, suitable statistics may be computed (i.e., for example, a median or mean) to summarize the values localized to a population of interest.
A kernel density method may comprise a non-parametric method that does not make assumptions of the underlying distribution of the data. In general, the steps of the KDM algorithm may be performed in the following manner: i) log transform the data; ii) obtain a smoothed Gaussian kernel density estimate. An optimal bandwidth for the kernel is chosen automatically; iii) detect local maxima by comparing each element of the smoothed estimate to its neighboring values. If an element is larger than both of its neighbors, it is a local peak; iv) assign every data point to the nearest peak. The support for a peak is the number of points that are assigned to it; and 5) rank order the peaks according to the support.
Another method, the Gaussian mixture models, assumes that the signal is a mixture of two Gaussian populations.
It should be noted that a GMM parameter estimation may be sensitive to non-Gaussian components of the signal. Consequently, exploratory data analysis has resulted in a definition of a set of heuristics coupled with GMM estimation, which produce accurate peak calls. For example, the data presented herein shows an example output of the GMM for a single analyte measured using the dual tag approach.
In one embodiment, the present invention contemplates a peak detection algorithm further which may comprise a strategy to select paired genes for conjugation to individual, but identical differentially colored beads. In one embodiment, the paired genes are frequently distant. For example, a linear programming approach is used to maximize the pairwise distances across all genes.
In one embodiment, the present invention contemplates a peak detection algorithm further which may comprise a strategy under circumstances where it is difficult to achieve exact mixing proportions of beads, the actual bead counts are measured and then employed as priors within the peak assignment algorithm.
In one embodiment, the detected peak signal may be improved by conjugating every member of an analyte set to the same differentially colored bead. Although it is not necessary to understand the mechanism of an invention, it is believed that multiple analytes on the same bead color will increase the signal-to-noise ratio.
Once peaks within a multimodal distribution pattern have been detected, the peaks need unambiguous assignment to specific genes. In one embodiment, the present invention contemplates a method for unambiguous gene assignment which may comprise combining a plurality of bead-set collections, wherein each differentially colored bead is present in an unequal proportion between each bead-set collection. In one embodiment, a first differentially colored bead may be present in a proportion that is 1.25 times the standard volume selected from a first bead-set collection, while a second differentially colored bead, that is identical to the first differentially colored bead, may be present in a proportion that is 0.75 times the standard volume selected from a second bead-set collection. Then, by examining the support for each peak (e.g. peak height, neighboring bead count or mixing proportion) and using the prior knowledge of the mixing proportion of a bead for a specific gene, an unambiguous assignment for each gene is made.
mRNA expression may be measured by any suitable method, including but not limited to, those disclosed below.
In some embodiments, RNA is detected by Northern blot analysis. Northern blot analysis involves the separation of RNA and hybridization of a complementary labeled probe.
In other embodiments, RNA expression is detected by enzymatic cleavage of specific structures (INVADER assay, Third Wave Technologies; See e.g., U.S. Pat. Nos. 5,846,717, 6,090,543; 6,001,567; 5,985,557; and 5,994,069; each of which is herein incorporated by reference). The INVADER assay detects specific nucleic acid (e.g., RNA) sequences by using structure-specific enzymes to cleave a complex formed by the hybridization of overlapping oligonucleotide probes.
In still further embodiments, RNA (or corresponding cDNA) is detected by hybridization to a oligonucleotide probe. A variety of hybridization assays using a variety of technologies for hybridization and detection are available. For example, in some embodiments, TaqMan assay (PE Biosystems, Foster City, Calif.; See e.g., U.S. Pat. Nos. 5,962,233 and 5,538,848, each of which is herein incorporated by reference) is utilized. The assay is performed during a PCR reaction. The TaqMan assay exploits the 5'-3' exonuclease activity of the AMPLITAQ GOLD DNA polymerase. A probe consisting of an oligonucleotide with a 5'-reporter dye (e.g., a fluorescent dye) and a 3'-quencher dye is included in the PCR reaction. During PCR, if the probe is bound to its target, the 5'-3' nucleolytic activity of the AMPLITAQ GOLD polymerase cleaves the probe between the reporter and the quencher dye. The separation of the reporter dye from the quencher dye results in an increase of fluorescence. The signal accumulates with each cycle of PCR and may be monitored with a fluorimeter.
In yet other embodiments, reverse-transcriptase PCR (RT-PCR) is used to detect the expression of RNA. In RT-PCR, RNA is enzymatically converted to complementary DNA or "cDNA" using a reverse transcriptase enzyme. The cDNA is then used as a template for a PCR reaction. PCR products may be detected by any suitable method, including but not limited to, gel electrophoresis and staining with a DNA specific stain or hybridization to a labeled probe. In some embodiments, the quantitative reverse transcriptase PCR with standardized mixtures of competitive templates method described in U.S. Pat. Nos. 5,639,606, 5,643,765, and 5,876,978 (each of which is herein incorporated by reference) is utilized.
The method most commonly used as the basis for nucleic acid sequencing, or for identifying a target base, is the enzymatic chain-termination method of Sanger. Traditionally, such methods relied on gel electrophoresis to resolve, according to their size, wherein nucleic acid fragments are produced from a larger nucleic acid segment. However, in recent years various sequencing technologies have evolved which rely on a range of different detection strategies, such as mass spectrometry and array technologies.
One class of sequencing methods assuming importance in the art are those which rely upon the detection of PPi release as the detection strategy. It has been found that such methods lend themselves admirably to large scale genomic projects or clinical sequencing or screening, where relatively cost-effective units with high throughput are needed.
Methods of sequencing based on the concept of detecting inorganic pyrophosphate (PPi) which is released during a polymerase reaction have been described in the literature for example (WO 93/23564, WO 89/09283, WO 98/13523 and WO 98/28440). As each nucleotide is added to a growing nucleic acid strand during a polymerase reaction, a pyrophosphate molecule is released. It has been found that pyrophosphate released under these conditions may readily be detected, for example enzymically e.g. by the generation of light in the luciferase-luciferin reaction. Such methods enable a base to be identified in a target position and DNA to be sequenced simply and rapidly whilst avoiding the need for electrophoresis and the use of labels.
At its most basic, a PPi-based sequencing reaction involves simply carrying out a primer-directed polymerase extension reaction, and detecting whether or not that nucleotide has been incorporated by detecting whether or not PPi has been released. Conveniently, this detection of PPi-release may be achieved enzymatically, and most conveniently by means of a luciferase-based light detection reaction termed ELIDA (see further below).
It has been found that dATP added as a nucleotide for incorporation, interferes with the luciferase reaction used for PPi detection. Accordingly, a major improvement to the basic PPi-based sequencing method has been to use, in place of dATP, a dATP analogue (specifically dATP.sub.alphas) which is incapable of acting as a substrate for luciferase, but which is nonetheless capable of being incorporated into a nucleotide chain by a polymerase enzyme (WO98/13523).
Further improvements to the basic PPi-based sequencing technique include the use of a nucleotide degrading enzyme such as apyrase during the polymerase step, so that unincorporated nucleotides are degraded, as described in WO 98/28440, and the use of a single-stranded nucleic acid binding protein in the reaction mixture after annealing of the primers to the template, which has been found to have a beneficial effect in reducing the number of false signals, as described in WO00/43540.
In other embodiments, gene expression may be detected by measuring the expression of a protein or polypeptide. Protein expression may be detected by any suitable method. In some embodiments, proteins are detected by immunohistochemistry. In other embodiments, proteins are detected by their binding to an antibody raised against the protein. The generation of antibodies is described below.
Antibody binding may be detected by many different techniques including, but not limited to (e.g., radioimmunoassay, ELISA (enzyme-linked immunosorbant assay), "sandwich" immunoassays, immunoradiometric assays, gel diffusion precipitation reactions, immunodiffusion assays, in situ immunoassays (e.g., using colloidal gold, enzyme or radioisotope labels, for example), Western blots, precipitation reactions, agglutination assays (e.g., gel agglutination assays, hemagglutination assays, etc.), complement fixation assays, immunofluorescence assays, protein A assays, and immunoelectrophoresis assays, etc.
In one embodiment, antibody binding is detected by detecting a label on the primary antibody. In another embodiment, the primary antibody is detected by detecting binding of a secondary antibody or reagent to the primary antibody. In a further embodiment, the secondary antibody is labeled.
In some embodiments, an automated detection assay is utilized. Methods for the automation of immunoassays include those described in U.S. Pat. Nos. 5,885,530, 4,981,785, 6,159,750, and 5,358,691, each of which is herein incorporated by reference. In some embodiments, the analysis and presentation of results is also automated. For example, in some embodiments, software that generates a prognosis based on the presence or absence of a series of proteins corresponding to cancer markers is utilized.
In other embodiments, the immunoassay described in U.S. Pat. Nos. 5,599,677 and 5,672,480; each of which is herein incorporated by reference.
In some embodiments, a computer-based analysis program is used to translate the raw data generated by the detection assay (e.g., the presence, absence, or amount of a given marker or markers) into data of predictive value for a clinician. The clinician may access the predictive data using any suitable means. Thus, in some preferred embodiments, the present invention provides the further benefit that the clinician, who is not likely to be trained in genetics or molecular biology, need not understand the raw data. The data is presented directly to the clinician in its most useful form. The clinician is then able to immediately utilize the information in order to optimize the care of the subject.
The present invention contemplates any method capable of receiving, processing, and transmitting the information to and from laboratories conducting the assays, wherein the information is provided to medical personnel and/or subjects. For example, in some embodiments of the present invention, a sample (e.g., a biopsy or a serum or urine sample) is obtained from a subject and submitted to a profiling service (e.g., clinical lab at a medical facility, genomic profiling business, etc.), located in any part of the world (e.g., in a country different than the country where the subject resides or where the information is ultimately used) to generate raw data. Where the sample may comprise a tissue or other biological sample, the subject may visit a medical center to have the sample obtained and sent to the profiling center, or subjects may collect the sample themselves (e.g., a urine sample) and directly send it to a profiling center. Where the sample may comprise previously determined biological information, the information may be directly sent to the profiling service by the subject (e.g., an information card containing the information may be scanned by a computer and the data transmitted to a computer of the profiling center using an electronic communication systems). Once received by the profiling service, the sample is processed and a profile is produced (i.e., expression data), specific for the diagnostic or prognostic information desired for the subject.
The profile data is then prepared in a format suitable for interpretation by a treating clinician. For example, rather than providing raw expression data, the prepared format may represent a diagnosis or risk assessment for the subject, along with recommendations for particular treatment options. The data may be displayed to the clinician by any suitable method. For example, in some embodiments, the profiling service generates a report that may be printed for the clinician (e.g., at the point of care) or displayed to the clinician on a computer monitor.
In some embodiments, the information is first analyzed at the point of care or at a regional facility. The raw data is then sent to a central processing facility for further analysis and/or to convert the raw data to information useful for a clinician or patient. The central processing facility provides the advantage of privacy (all data is stored in a central facility with uniform security protocols), speed, and uniformity of data analysis. The central processing facility may then control the fate of the data following treatment of the subject. For example, using an electronic communication system, the central facility may provide data to the clinician, the subject, or researchers.
In some embodiments, the subject is able to directly access the data using the electronic communication system. The subject may choose further intervention or counseling based on the results. In some embodiments, the data is used for research use. For example, the data may be used to further optimize the inclusion or elimination of markers as useful indicators of a particular condition or stage of disease.
In one embodiment, the present invention contemplates kits for the practice of the methods of this invention. The kits preferably include one or more containers containing various compositions and/or reagents to perform methods of this invention. The kit may optionally include a plurality of cluster centroid landmark transcripts. The kit may optionally include a plurality of nucleic-acid sequences wherein the sequence is complementary to at least a portion of a cluster centroid landmark transcript sequence, and wherein the sequences may optionally comprise a primer sequence and/or a barcode nucleic-acid sequence. The kit may optionally include a plurality of optically addressed beads, wherein each bead may comprise a different nucleic-acid sequence that is complementary to a barcode nucleic-acid sequence.
The kit may optionally include enzymes capable of performing PCR (i.e., for example, DNA polymerase, thermostable polymerase). The kit may optionally include enzymes capable of performing nucleic-acid ligation (for example, a ligase). The kit may optionally include buffers, excipients, diluents, biochemicals and/or other enzymes or proteins. The kits may also optionally include appropriate systems (e.g. opaque containers) or stabilizers (e.g. antioxidants) to prevent degradation of the reagents by light or other adverse conditions.
The kits may optionally include instructional materials containing directions (i.e., protocols) providing for the use of the reagents in the performance of any method described herein. While the instructional materials typically comprise written or printed materials they are not limited to such. Any medium capable of storing such instructions and communicating them to an end user is contemplated by this invention. Such media include, but are not limited to electronic storage media (e.g., magnetic discs, tapes, cartridges, chips), optical media (e.g., CD ROM), and the like. Such media may include addresses to internet sites that provide such instructional materials.
The kits may optionally include computer software (i.e., algorithms, formulae, instrument settings, instructions for robots, etc) providing for the performance of any method described herein, simplification or automation of any method described herein, or manipulation, analysis, display or visualization of data generated thereby. Any medium capable of storing such software and conveying it to an end user is contemplated by this invention. Such media include, but are not limited to, electronic storage media (e.g., magnetic discs), optical media (e.g., CD ROM), and the like. Such media may include addresses to internet sites that provide such software.
In other embodiments, the present invention provides kits for the detection and characterization of proteins and/or nucleic acids. In some embodiments, the kits contain antibodies specific for a protein expressed from a gene of interest, in addition to detection reagents and buffers. In other embodiments, the kits contain reagents specific for the detection of mRNA or cDNA (e.g., oligonucleotide probes or primers). In preferred embodiments, the kits contain all of the components necessary to perform a detection assay, including all controls, directions for performing assays, and any necessary software for analysis and presentation of results.
Samples (i.e., for example, biological samples) may be optionally concentrated using a commercially available concentration filter, for example, an Amicon or Millipore Pellicon ultrafiltration unit. Following the concentration step, the concentrate may be applied to a suitable purification matrix as previously described. For example, a suitable affinity matrix may comprise a ligand or antibody molecule bound to a suitable support. Alternatively, an anion exchange resin may be employed, for example, a matrix or substrate having pendant diethylaminoethyl (DEAE) groups. The matrices may be acrylamide, agarose, dextran, cellulose or other types commonly employed in protein purification. Alternatively, a cation exchange step may be employed. Suitable cation exchangers include various insoluble matrices which may comprise sulfopropyl or carboxymethyl groups. Sulfopropyl groups are preferred.
Finally, one or more reversed-phase high performance liquid chromatography (RP-HPLC) steps employing hydrophobic RP-HPLC media, e.g., silica gel having pendant methyl or other aliphatic groups, may be employed to further purify an IL-1R composition. Some or all of the foregoing purification steps, in various combinations, may also be employed to provide a substantially pure recombinant protein.
Protein may be isolated by initial extraction from cell pellets, followed by one or more concentration, salting-out, hydrophobic interaction chromatography (HIC), aqueous ion exchange or size exclusion chromatography steps. Finally, high performance liquid chromatography (HPLC) may be employed for final purification steps. Most biological cells may be disrupted by any convenient method, including freeze-thaw cycling, sonication, mechanical disruption, or use of cell lysing agents.
The present invention provides isolated antibodies (i.e., for example, polyclonal or monoclonal). In one embodiment, the present invention provides antibodies that specifically bind to a subset of a solid particle population. These antibodies find use in the detection methods described above.
An antibody against a protein of the present invention may be any monoclonal or polyclonal antibody, as long as it may recognize the protein. Antibodies may be produced by using a protein of the present invention as the antigen according to a conventional antibody or antiserum preparation process.
The present invention contemplates the use of both monoclonal and polyclonal antibodies. Any suitable method may be used to generate the antibodies used in the methods and compositions of the present invention, including but not limited to, those disclosed herein. For example, for preparation of a monoclonal antibody, protein, as such, or together with a suitable carrier or diluent is administered to an animal (e.g., a mammal) under conditions that permit the production of antibodies. For enhancing the antibody production capability, complete or incomplete Freund's adjuvant may be administered. Normally, the protein is administered once every 2 weeks to 6 weeks, in total, about 2 times to about 10 times. Animals suitable for use in such methods include, but are not limited to, primates, rabbits, dogs, guinea pigs, mice, rats, sheep, goats, etc.
For preparing monoclonal antibody-producing cells, an individual animal whose antibody titer has been confirmed (e.g., a mouse) is selected, and 2 days to 5 days after the final immunization, its spleen or lymph node is harvested and antibody-producing cells contained therein are fused with myeloma cells to prepare the desired monoclonal antibody producer hybridoma. Measurement of the antibody titer in antiserum may be carried out, for example, by reacting the labeled protein, as described hereinafter and antiserum and then measuring the activity of the labeling agent bound to the antibody. The cell fusion may be carried out according to known methods, for example, the method described by Koehler and Milstein (Nature 256:495 [1975]). As a fusion promoter, for example, polyethylene glycol (PEG) or Sendai virus (HVJ), preferably PEG is used.
Examples of myeloma cells include NS-1, P3U1, SP2/0, AP-1 and the like. The proportion of the number of antibody producer cells (spleen cells) and the number of myeloma cells to be used is preferably about 1:1 to about 20:1. PEG (preferably PEG 1000-PEG 6000) is preferably added in concentration of about 10% to about 80%. Cell fusion may be carried out efficiently by incubating a mixture of both cells at about 20.degree. C. to about 40.degree. C., preferably about 30.degree. C. to about 37.degree. C. for about 1 minute to 10 minutes.
Various methods may be used for screening for a hybridoma producing the antibody (e.g., against a tumor antigen or autoantibody of the present invention). For example, where a supernatant of the hybridoma is added to a solid phase (e.g., microplate) to which antibody is adsorbed directly or together with a carrier and then an anti-immunoglobulin antibody (if mouse cells are used in cell fusion, anti-mouse immunoglobulin antibody is used) or Protein A labeled with a radioactive substance or an enzyme is added to detect the monoclonal antibody against the protein bound to the solid phase. Alternately, a supernatant of the hybridoma is added to a solid phase to which an anti-immunoglobulin antibody or Protein A is adsorbed and then the protein labeled with a radioactive substance or an enzyme is added to detect the monoclonal antibody against the protein bound to the solid phase.
Selection of the monoclonal antibody may be carried out according to any known method or its modification. Normally, a medium for animal cells to which HAT (hypoxanthine, aminopterin, thymidine) are added is employed. Any selection and growth medium may be employed as long as the hybridoma may grow. For example, RPMI 1640 medium containing 1% to 20%, preferably 10% to 20% fetal bovine serum, GIT medium containing 1% to 10% fetal bovine serum, a serum free medium for cultivation of a hybridoma (SFM-101, Nissui Seiyaku) and the like may be used. Normally, the cultivation is carried out at 20.degree. C. to 40.degree. C., preferably 37.degree. C. for about 5 days to 3 weeks, preferably 1 week to 2 weeks under about 5% CO.sub.2 gas. The antibody titer of the supernatant of a hybridoma culture may be measured according to the same manner as described above with respect to the antibody titer of the anti-protein in the antiserum.
Separation and purification of a monoclonal antibody may be carried out according to the same manner as those of conventional polyclonal antibodies such as separation and purification of immunoglobulins, for example, salting-out, alcoholic precipitation, isoelectric point precipitation, electrophoresis, adsorption and desorption with ion exchangers (e.g., DEAE), ultracentrifugation, gel filtration, or a specific purification method wherein only an antibody is collected with an active adsorbent such as an antigen-binding solid phase, Protein A or Protein G and dissociating the binding to obtain the antibody.
Polyclonal antibodies may be prepared by any known method or modifications of these methods including obtaining antibodies from patients. For example, a complex of an immunogen (an antigen against the protein) and a carrier protein is prepared and an animal is immunized by the complex according to the same manner as that described with respect to the above monoclonal antibody preparation. A material containing the antibody against is recovered from the immunized animal and the antibody is separated and purified.
As to the complex of the immunogen and the carrier protein to be used for immunization of an animal, any carrier protein and any mixing proportion of the carrier and a hapten may be employed as long as an antibody against the hapten, which is crosslinked on the carrier and used for immunization, is produced efficiently. For example, bovine serum albumin, bovine cycloglobulin, keyhole limpet hemocyanin, etc. may be coupled to a hapten in a weight ratio of about 0.1 part to about 20 parts, preferably, about 1 part to about 5 parts per 1 part of the hapten.
In addition, various condensing agents may be used for coupling of a hapten and a carrier. For example, glutaraldehyde, carbodiimide, maleimide activated ester, activated ester reagents containing thiol group or dithiopyridyl group, and the like find use with the present invention. The condensation product as such or together with a suitable carrier or diluent is administered to a site of an animal that permits the antibody production. For enhancing the antibody production capability, complete or incomplete Freund's adjuvant may be administered. Normally, the protein is administered once every 2 weeks to 6 weeks, in total, about 3 times to about 10 times.
The polyclonal antibody is recovered from blood, ascites and the like, of an animal immunized by the above method. The antibody titer in the antiserum may be measured according to the same manner as that described above with respect to the supernatant of the hybridoma culture. Separation and purification of the antibody may be carried out according to the same separation and purification method of immunoglobulin as that described with respect to the above monoclonal antibody.
The protein used herein as the immunogen is not limited to any particular type of immunogen. For example, a protein expressed resulting from a virus infection (further including a gene having a nucleotide sequence partly altered) may be used as the immunogen. Further, fragments of the protein may be used. Fragments may be obtained by any methods including, but not limited to expressing a fragment of the gene, enzymatic processing of the protein, chemical synthesis, and the like.
Although the present invention and its advantages have been described in detail, it should be understood that various changes, substitutions and alterations may be made herein without departing from the spirit and scope of the invention as defined in the appended claims.
The present invention will be further illustrated in the following Examples which are given for illustration purposes only and are not intended to limit the invention in any way.
EXAMPLES
Example 1: Identification of Cluster Centroid Landmark Transcripts and Creation of a Dependency Matrix
The present example describes one method for the identification of cluster centroid landmark transcripts having inferential relationships.
Thirty-five thousand eight-hundred and sixty-seven transcriptome-wide gene-expression profiles generated with the Affymetrix U133 family of oligonucleotide microarrays were downloaded from NCBI's Gene Expression Omnibus (GEO) repository in the form of .cel files. The .cel files were preprocessed to produce average-difference values (i.e. expression levels) for each probe set using MAS5 (Affymetrix). Expression levels in each profile were then scaled with respect to the expression levels of 350 previously-determined invariant probe sets whose expression levels together spanned the range of expression levels observed. The minimal common feature space in the dataset was determined to be 22,268 probe sets.
The quality of each profile was assessed by reference to two data-quality metrics: percentage of P-calls and 3':5' ratios. Empirical distributions of both metrics were built and the 10% of profiles at both extremes of each distribution were eliminated from further consideration. A total of 16,428 profiles remained after this quality filtering. A further 1,941 profiles were found to be from a single source, and were also eliminated.
Probe sets below a predetermined arbitrary detection threshold of 20 average-difference units in over 99% of the profiles were eliminated, bringing the total number of probe sets under consideration to 14,812.
Principal component analysis (PCA) dimensionality reduction was then applied to the dataset (i.e. 14,487 samples.times.14,812 features). Two-hundred eight-seven components were identified that explained 90% of the variation in the dataset. The matrix of the PCA loadings of the features in the eigenspace (i.e. 287.times.14,812) was then clustered using k-means. The k-means clustering was repeated a number of times because the high-dimensionality matrix obtained partitions non-deterministically based on the starting seeds, and the results were used to build a gene-by-gene pairwise consensus matrix.
Pockets of high local correlation were identified by hierarchically clustering the gene-by-gene pairwise consensus matrix. The leaves on each node of the dendrogram `tree` together constitute a cluster. The tree was then cut a multiple levels to identify 100, 300, 500, 700, 1,000, 1,500, 2,000, 5,000, and 10,000 clusters.
The probe sets whose individual expression-level vector across all 14,487 profiles most closely correlated with that of the mean of all probe sets in each cluster was selected as the centroid of that cluster. This produced sets of 100, 300, 500, 700, 1,000, 1,500, 2,000, 5,000, and 10,000 centroid probe sets. Multiple individual probe sets had attributes that approximate the definition of a centroid probe set of any given cluster.
A dependency matrix was created for each set of centroid probe sets by linear regression between the expression levels of the g centroid probe sets and the remaining 14,812-g probe sets in the space of the 14,487 profiles. A pseudo-inverse was used because the number of profiles did not necessarily match the number of features being modeled. Dependency matrices were thereby populated with weights (i.e. factors) relating the expression level of each non-centroid probe set to the expression level of each centroid probe set.
The identity and gene symbol of the transcript represented by each centroid probe set was determined using a mapping provided by Affymetrix (affymetrix.com) and taken as a `cluster centroid landmark transcript.` Non-centroid probe sets were mapped to gene symbols in the same manner.
Example II: Determining a Suitable Number of Cluster Centroid Landmark Transcripts
The present example describes one method for selecting the number of cluster centroid landmark transcripts required to create useful transcriptome-wide gene-expression profiles. This method makes use of a large collection of transcriptome-wide gene-expression profiles produced from cultured human cells treated with small-molecule perturbagens made with Affymetrix oligonucleotide microarrays provided in build02 of the public Connectivity Map resource (broadinstitute.org/cmap). One use of Connectivity Map is the identification of similarities between the biological effects of small-molecule perturbagens. This is achieved by detecting similarities in the gene-expression profiles produced by treating cells with those perturbagens (Lamb et al., "The Connectivity Map: using gene-expression signatures to connect small molecules, genes and disease" Science 313:1929 2006), and represents one valuable application of transcriptome-wide gene-expression profiling. In summary of the present method, expression values for the sets of cluster centroid landmark transcripts (specifically their corresponding probe sets) identified according to Example I (above) are extracted from the Connectivity Map data and used to create transcriptome-wide gene-expression profiles using the dependency matrices generated also according to Example I (above). Note that the collection of expression profiles used in Example I did not include any Connectivity Map data. The proportion of similarities identified using the actual transcriptome-wide gene-expression profiles also identified by the inferred transcriptome-wide gene-expression profiles created from different numbers of cluster centroid landmark transcript measurements are then compared.
First, a matrix of enrichment scores was constructed by executing 184 independent query signatures obtained from Lamb et al. and the Molecular Signatures Database (MSigDB; release 1.5; broadinstitute.org/gsea/msigdb) against the full Connectivity Map dataset, as described (Lamb et al.) producing a `reference connectivity matrix` (i.e. 184 queries.times.1,309 treatments).
The 7,056 transcriptome-wide gene-expression profiles were downloaded from the Connectivity Map website in the form of .cel files. The .cel files were then preprocessed to produce average-difference values (i.e. expression levels) for each probe set using MAS5 (Affymetrix). Expression levels for each set of centroid probe sets were extracted, and 9.times.7,056 sets of transcriptome-wide gene-expression profiles created using the corresponding dependency matrices; expression levels of non-centroid probe sets were computed by multiplying the expression levels for each centroid probe set by their dependency-matrix factors and summed. Rank-ordered lists of probe sets were computed for each treatment-and-vehicle pair using these (inferred) transcriptome-wide gene-expression profiles as described (Lamb et al.). Matrices of enrichment scores were created for each of the 9 datasets with the set of 184 query signatures exactly as was done to create the reference connectivity matrix.
The number of query signatures for which the treatment with the highest enrichment score in the reference connectivity matrix was also the top scoring treatment in the connectivity matrix produced from each of the 9 inferred datasets was plotted (FIG. 2). The dataset generated using expression values for only 1,000 centroid probe sets identified the same treatment as the dataset generated using expression values for all 22,283 probe sets in 147 of 184 (80%) of cases. These findings indicate that 1,000 cluster centroid landmark transcripts may be used to create useful transcriptome-wide gene-expression profiles.
Example III: Platform-Specific Selection of Cluster Centroid Landmark Transcripts
This example describes one method for validating the performance of cluster centroid landmark transcripts on a selected moderate-multiplex assay platform. This example relates specifically to the measurement of expression levels of cluster centroid landmark transcripts derived from gene-expression profiles generated using Affymetrix microarrays using the LMF method of Peck et al., "A method for high-throughput gene expression signature analysis" Genome Biology 7:R61 (2006). See FIG. 3.
Probe pairs were designed for 1,000 cluster centroid landmark transcripts selected according to Example I (above) as described by Peck et al. The expression levels of these transcripts were measured by LMF in a collection of 384 biological samples which may comprise unperturbed cell lines, cell lines treated with bioactive small molecules, and tissue specimens for which transcriptome-wide gene-expression profiles generated using Affymetrix microarrays was available. A plot of normalized expression level measured by LMF against normalized expression level measured by Affymetrix microarray for a representative cluster centroid landmark transcript (217995_at:SQRDL) across all 384 biological samples is shown as FIG. 4. Vectors of expression levels across all 384 samples were constructed for every feature from both measurement platforms.
For each cluster centroid landmark transcript, the corresponding LMF vector was used as the index in a nearest-neighbors analysis to rank the Affymetrix probe sets. Cluster centroid landmark transcripts were considered to be `validated` for measurement by LMF when the Affymetrix probe set mapping to that cluster centroid landmark transcript had a rank of 5 or greater, and the Affymetrix probe sets mapping to 80% or more of the non-centroid transcripts in the corresponding cluster had a rank of 100 or greater.
Not all attempts to create validated cluster centroid landmark transcripts were successful. Transcripts failing to meet the validation criteria were found to be of two types: (1) simple, where the measurements of the centroid transcript itself were poorly correlated across the 384 samples; and (2) complex, where the measurements of the centroid transcripts were well correlated but those levels were not well correlated with those of the non-centroid transcripts from its cluster. Neither type of failure could be anticipated. A plot of normalized expression levels determined by LMF and Affymetrix microarray for three validated transcripts (218039_at:NUSAP1, 201145_at:HAX1, 217874_at:SUCLG1), one representative type-1 failure (202209_at:LSM3), and one representative type-2 failure (217762_at:RAB31) in one of the 384 biological samples is presented as FIG. 5. A plot of normalized expression levels determined by LMF and Affymetrix microarray for one of these validated transcripts and the same representative type-2 failure in a different one of the 384 biological samples is presented as FIG. 6A. FIG. 6B shows the expression levels of the same transcripts in the same biological sample together with those of three transcripts from their clusters (measured using Affymetrix microarray only). Only the expression level of the validated transcript (218039_at:NUSAP1) is correlated with the levels of the transcripts in its cluster (35685_at:RING1, 36004_at:IKBKG, 41160_at:MBD3). The expression level of the type-2 failed transcript (217762_at:RAB31) is not correlated with the levels of all of the transcripts in its cluster (48612_at:N4BP1, 57516_at:ZNF764, 57539_at:ZGPAT). A representative list of transcripts exhibiting simple (type 1) failures, together with the gene-specific portions of their LMF probe pairs, is provided as Table 1. A representative list of transcripts exhibiting complex (type 2) failures, together with the gene-specific portions of their LMF probe pairs is provided as Table 2.
The use of alternative probe pairs allowed a proportion of failed cluster centroid landmark transcripts to be validated. When this was not successful, failed cluster centroid landmark transcripts were substituted with other transcripts from the same cluster. This process was continued until validated cluster centroid landmark transcripts for all 1,000 clusters were obtained. The list of these landmark transcripts, together with the gene-specific portions of their corresponding LMF probe pairs, is provided in Table 3. A dependency matrix specific for this set of validated landmark transcripts was created according to Example I (above).
Example IV: Generation and Use of Transcriptome-Wide Gene-Expression Profiles Made by Measurement of 1,000 Transcripts
This example described one method for the generation of transcriptome-wide gene-expression profiles using measurement of the expression levels of a sub-transcriptome number of cluster centroid landmark transcripts. The present method uses the LMF moderate multiplex gene-expression analysis platform described by Peck et al. ("A method for high-throughput gene expression signature analysis" Genome Biology 7:R61 2006), the Luminex FlexMAP 3D optically-addressed microspheres and flow-cytometric detection system, 1,000 cluster centroid landmark transcripts (and corresponding gene-specific sequences) validated for LMF from Example III (above), a corresponding dependency matrix from Example III (above), 50 empirically-determined invariant transcripts with expression levels spanning the range of those observed, and 1,050 barcode sequences developed. The FlexMAP 3D system allows simultaneous quantification of 500 distinct analytes in samples arrayed in the wells of a 384-well plate. Measurement of the expression levels of 1,000 landmark transcripts plus 50 invariant transcripts was therefore divided over 3 wells. Four hundred landmark transcripts were assayed in one well, and three hundred landmark transcripts were assayed in each of 2 additional wells. The 50 invariant genes were assayed in all 3 wells. This overall method, referred to herein as L1000, was then used to generate a total of 1,152 transcriptome-wide gene-expression profiles from cultured human cells treated with each of 137 distinct bioactive small molecules. These data were used to create an analog of a small portion of Connectivity Map de novo, and the relative performance of the L1000 version compared to that of the original.
LMF probe pairs were constructed for each of the 1,000 landmark and 50 invariant transcripts such that each pair incorporated one of the 1,050 barcode sequences. Probes were mixed in equimolar amounts to form a probe-pair pool. Capture probes complementary to each of the barcode sequences were obtained and coupled to one of 500 homogenous populations of optically-distinguishable microspheres using standard procedures. Three pools of capture-probe expressing microspheres were created: one pool contained beads coupled to capture probes complementary to the barcodes in 400 of the landmark probe pairs, a second pool contained beads matching a different 300 landmark probes, and a third pool contained beads matching the remaining 300 landmark probes. Each pool contained beads expressing barcodes matching the probe pairs corresponding to the 50 invariant transcripts.
MCF7 cells were treated with small molecules and corresponding vehicles in 384-well plates. Cells were lysed, mRNA captured, first-strand cDNA synthesized, and ligation-mediated amplification performed using the 1,000 landmark plus 50 invariant transcript probe-pair pool in accordance with the published LMF method (Peck et al.). The amplicon pools obtained after the PCR step were divided between 3 wells of fresh 384-well plates, and each hybridized to one of the three bead pools at a bead density of approximately 500 beads of each address per well, also in accordance with the published LMF method. The captured amplicons were labeled with phycoerythrin and the resulting microsphere populations were analyzed using a FlexMAP 3D instrument in accordance with the manufacturer's instructions.
Median fluorescence intensity (MFI) values from each microsphere population from each detection well were associated with their corresponding transcript and sample. MFI values for each landmark transcript were scaled relative to those for the set of invariant transcripts obtained from the same detection well, and all scaled MFI values derived from the same samples were concatenated to produce a list of normalized expression levels for each of the 1,000 landmark transcripts in each treatment sample.
Predicted expression levels for transcripts that were not measured were calculated by multiplying the expression levels of each of the landmark transcripts by the weights contained in the dependency matrix, and summed. Computed and measured expression levels were combined to create full-transcriptome gene-expression profiles for each sample. Rank-ordered lists of transcripts were computed for each pair of treatment and corresponding vehicle-control profiles as described by Lamb et al. ("The Connectivity Map: using gene-expression signatures to connect small molecules, genes and disease" Science 313: 1929-1935 2006), resulting in an analog of the Connectivity Map dataset containing a total of 782 small-molecule treatment instances.
Enrichment scores for each of the perturbagens in the original Connectivity Map (created with Affymetrix microarrays) and the L1000 analog were computed according to the method of Lamb et al. for a published query signature derived from an independent transcriptome-wide gene-expression analysis of the effects of three biochemically-verified histone-deacetylase (HDAC) inhibitor compounds. Glaser et al., "Gene expression profiling of multiple histone deacetylase (HDAC) inhibitors: defining a common gene set produced by HDAC inhibition in T24 and MDA carcinoma cell lines." Mol Cancer Ther 2:151-163 (2003). As anticipated, the small molecule with the highest score in the original Affymetrix Connectivity Map was vorinostat, an established HDAC inhibitor (enrichment score=0.973, n=12, p-value<0.001). However, vorinostat was also the highest scoring perturbagen in the L1000 dataset (score=0.921, n=8, p-value<0.001). See FIG. 7. An additional 95 query signatures were executed against both datasets. The perturbagen with the highest score in the original Connectivity Map also had the highest score of those in the L1000 dataset in 79 (83%) of those cases.
These data show that L1000 may substitute for a technology that directly measures the expression levels of all transcripts in the transcriptome--specifically, Affymetrix high-density oligonucleotide microarrays--in one useful application of transcriptome-wide gene-expression profiling.
Example V: Use of Transcriptome-Wide Gene-Expression Profiles Made by Measurement of 1,000 Transcripts for Clustering of Cell Lines
Transcriptome-wide gene-expression profiles were generated from total RNA isolated from 44 cultured human cancer cells lines derived from six tissue types using measurement of the expression levels of a sub-transcriptome number of cluster centroid transcripts and inference of the remaining transcripts according to the L1000 methods described in Example IV. Full-transcriptome gene-expression data were produced from these same total RNA samples using Affymetrix U133 Plus 2.0 high-density oligonucleotide microarrays for comparison.
Cell lines were grouped together according to consensus hierarchical clustering of their corresponding gene-expression profiles (Monti et al "Consensus Clustering: A resampling-based method for class discovery and visualization of gene expression microarray data." Machine Learning Journal 52: 91-118 2003). The similarity metric used was Pearson correlation. One hundred twenty-five clustering iterations were made. In each iteration, 38 (85%) of the samples were used and 6 excluded.
As anticipated, the results of the consensus clustering made with the Affymetrix data placed cell lines from the same tissue in the same branch of the dendrogram, with only few exceptions (FIG. 8A). Many similar such findings have been reported. Ross et al., "Systematic variation in gene expression patterns in human cancer cell lines" Nature Genetics 24: 227-235 2000). Remarkably, clustering of the L1000 data also placed cell lines with the same tissues of origin in the same branch of the dendrogram (FIG. 8B).
This example shows that L1000 may substitute for a technology that directly measures the expression levels of all transcripts in the transcriptome-specifically, Affymetrix high-density oligonucleotide microarrays--in a second useful application of transcriptome-wide gene-expression profiling; that is, grouping of samples on the basis of biological similarity.
Example VI: Use of Transcriptome-Wide Gene-Expression Profiles Made by Measurement of 1,000 Transcripts for Gene-Set Enrichment Analysis
The expression levels of 1,000 cluster centroid transcripts were measured in primary human macrophages following treatment with lipopolysaccharide (LPS) or vehicle control, and used to create gene-expression profiles composed of expression levels for 22,268 transcripts, according to the L1000 methods described in Example IV. These data were used as input for a Gene-Set Enrichment Analysis (GSEA) with a library of 512 gene sets from version 3 of the Molecular Signatures Database (Subramanian et al., "Gene set enrichment analysis: A knowledge-based approach for interpreting genome-wide expression profiles" Proc Natl Acad Sci 102: 15545-15550 2005).
LPS is known to be a potent activator of the NF-KB transcription-factor complex (Qin et al., "LPS induces CD40 gene expression through the activation of NF-.kappa.B and STAT-1a in macrophages and microglia" Blood 106: 3114-3122 2005). It was therefore not unexpected that a gene set composed of 23 members of the canonical NF-.kappa.B signaling pathway (BIOCARTA_NFKB_PATHWAY) received the highest score of all gene sets tested (p<0.001). This example shows that L1000 may generate data compatible with a third useful application of full-transcriptome gene-expression profiling; that is, gene-set enrichment analysis. However, closer examination of the analysis revealed that none of the 23 transcripts in the BIOCARTA_NFKB_PATHWAY gene set had been explicitly measured. This example then also demonstrates the utility of the method even in the extreme case when the expression levels of all of the transcripts of interest were inferred.
Example VII: Creation of a Full-Transcriptome Gene-Expression Dataset of Unprecedented Size
The L1000 methods described in Example IV were used to create a connectivity map with in excess of 100,000 full-transcriptome gene-expression profiles from a panel of cultured human cells treated with a diversity of chemical and genetic perturbations at a range of doses and treatment durations.
Creation of a dataset of this size is impractical with existing transcriptome-wide gene-expression profiling technologies (e.g. Affymetrix GeneChip) due to high cost and low throughput. This example therefore demonstrates the transformative effect of the present invention on the field of gene-expression profiling in general, and its potential to impact medically-relevant problems in particular.
TABLE-US-00001 TABLE 1 Representative Type I (simple) Landmark Transcript/Probe-Pair Failures (SEQ ID NOS 1-134, respectively, in order of appearance) ## name alternate name left probe sequence right probe sequence 1 FFA6B6 200058_s_at:SNRNP200 CCATCAAGAGGCTGACCTTG CAGCAGAAGGCCAAGGTGAA 2 RE1F1 200064_at:HSP90AB1 GGCGATGAGGATGCGTCTCG CATGGAAGAAGTCGATTAGG 3 YC7D7 200729_s_at:ACTR2 GAAAATCCTATTTATGAATC CTGTCGGTATTCCTTGGTAT 4 GGG6H6 200792_at:XRCC6 TGCTGGAAGCCCTCACCAAG CACTTCCAGGACTGACCAGA 5 CC1D1 200870_at:STRAP GTGTCAGATGAAGGGAGGTG GAGTTATCCTCTTATAGTAC 6 AG12H12 200991_s_at:SNX17 TTCTCTTGGCCAGGGGCCTC GTATCCTACCTTTCCTTGTC 7 DDC7D7 201488_x_at:KHDRBS1 TCTTGTATCTCCCAGGATTC CTGTTGCTTTACCCACAACA 8 BBA1B1 201511_at:AAMP CACGTCAGGAGACCACAAAG CGAAAGTATTTTGTGTCCAA 9 LG12H12 201620_at:MBTPS1 CAGGGGAAGGATGTACTTTC CAAACAAATGATACAACCCT 10 YC12D12 201652_at:COPS5 AAAGTTAGAGCAGTCAGAAG CCCAGCTGGGACGAGGGAGT 11 FFE11F11 201683_x_at:TOX4 AATGACAGACATGACATCTG GCTTGATGGGGCATAGCCAG 12 FFG11H11 201684_s_at:TOX4 TTATCTGCTGGGAAAGTGTC CAAGAGCCTGTTTTTGAAAC 13 OG3H3 201696_at:SFRS4 TAACCTGGACGGCTCTAAGG CTGGAATGACCACATAGGTA 14 YA1B1 201710_at:MYBL2 ATGTTTACAGGGGTTGTGGG GGCAGAGGGGGTCTGTGAAT 15 VC3D3 201729_s_at:KIAA0100 GGCAGGCGCAAATGATTTGG CGATTCGAGTGGCTGCAGTA 16 AAC9D9 201773_at:ADNP ACTTAGTTTTTGCACATAAC CTTGTACAATCTTGCAACAG 17 BBA7B7 201949_x_at:CAPZB AGCTCTGGGAGCAGAGGTGG CCCTCGGTGCCGTCCTGCGC 18 CCE4F4 202116_at:DPF2 TTGTTCTTCCTGGACCTGGG CATTCAGCCTCCTGCTCTTA 19 ME8F8 202123_s_at:ABL1 CGACTGCCTGTCTCCATGAG GTACTGGTCCCTTCCTTTTG 20 UUA11B11 202178_at:PRKCZ CACGGAAACAGAACTCGATG CACTGACCTGCTCCGCCAGG 21 MA1B1 202261_at:VPS72 TGTTCCGTTTCTTCTCCCTG CTTCTCCCCTTTGTCATCTC 22 RG1H1 202298_at:NDUFA1 GCTCATTTTGGGTATCACTG GAGTCTGATGGAAAGAGATA 23 OE2F2 202408_s_at:PRPF31 CCGCCCAGTATGGGCTAGAG CAGGTCTTCATCATGCCTTG 24 LC9D9 202452_at:ZER1 CCTGGGGAGCAGCGCTAACC CTGGAGGCAGCCTTTGGGTG 25 ZC12D12 202477_s_at:TUBGCP2 ACACGGAGCGCCTGGAGCGC CTGTCTGCAGAGAGGAGCCA 26 UUE8F8 202717_s_at:CDC16 ACTCTGCTATTGGATATATC CACAGTCTGATGGGCAACTT 27 VA5B5 202757_at:COBRA1 ACGGGGCCAGCTGGACACAC GGTGAGATTTTCTCGTATGT 28 EEE4F4 203118_at:PCSK7 CCTGTCTTCCTCTGCAAGTG CTCAGGGAAATGGCCTTCCC 29 AAA12B12 203154_s_at:PAK4 TCATTTTATAACACTCTAGC CCCTGCCCTTATTGGGGGAC 30 LE8F8 203190_at:NDUFS8 CCACGGAGACCCATGAGGAG CTGCTGTACAACAAGGAGAA 31 ZC9D9 203201_at:PMM2 GGAAGGATCCCGGGTCTCAG CTAGAACACGGTGGAAGAGA 32 BE3F3 203517_at:MTX2 TCTGTAGGAGAATTGAACAG CACTATTTTGAAGATCGTGG 33 TE8F8 203530_s_at:STX4 CATCACCGTCGTCCTCCTAG CAGTCATCATTGGCGTCACA 34 FFC9D9 203572_s_at:TAF6 CCTCTGGTCCTGGGAGTGTC CAGAAGTACATCGTGGTCTC 35 MC4D4 204549_at:IKBKE AGGGCAGTAGGTCAAACGAC CTCATCACAGTCTTCCTTCC 36 UC11D11 204757_s_at:C2CD2L GCCTCTGAGAATGTTGGCAG CTCACAGAGAGCAGGGCCGG 37 FFE1F1 206050_s_at:RNH1 GTCCTGTACGACATTTACTG GTCTGAGGAGATGGAGGACC 38 AAA1B1 206075_s_at:CSNK2A1 CTCCCAGGCTCCTTACCTTG GTCTTTTCCCTGTTCATCTC 39 SG10H10 207988_s_at:ARPC2 TAAGAGGAGGAAGCGGCTGG CAACTGAAGGCTGGAACACT 40 AE8F8 208093_s_at:NDEL1 GCATGTTAATGACTCTGATG GTGTCCTCCTCTGGGCAGCT 41 CG1H1 208152_s_at:DDX21 GGAAGTTAAGGTTTCCTCAG CCACCTGCCGAACAGTTTCT 42 GGG9H9 208174_x_at:ZRSR2 TCGGGAGAGGCACAATTCAC GAAGCAGAGGAAGAAATAGG 43 EEA12B12 208720_s_at:RBM39 GATGGGATACCGAGATTAAG GATGATGTGATTGAAGAATG 44 BA10B10 208887_at:EIF3G GCTAAGGACAAGACCACTGG CCAATCCAAGGGCTTCGCCT 45 EEA6B6 208996_s_at:POLR2C CCAGTGCACCTGTAGGGAAC CAACTAGACTTCTCTCCTGG 46 JE11F11 209044_x_at:SF3B4 TCCCCCTCACTACCTTCCTC CTGTACAACTTTGCTGACCT 47 SE12F12 209659_s_at:CDC16 AAACGGGGCTTACGCCATTG GAAACCTCAAGGAAAACTCC 48 IIA3B3 210947_s_at:MSH3 TGGAATTGCCATTGCCTATG CTACACTTGAGTATTTCATC 49 YYA10B10 211233_x_at:ESR1 CTGCTGGCTACATCATCTCG GTTCCGCATGATGAATCTGC 50 FFC1D1 212047_s_at:RNF167 GTGACCTATTTGCACAGACC GTCGTCTTCCCTCCAGTCTT 51 TTC2D2 212087_s_at:ERAL1 CACAGGAGGCAGGCCATGAC CTCATGGACATCTTCCTCTG 52 UUA10B10 212216_at:PREPL CCTGAAATTCTGAAACACTG CATTCAACTGGGAATTGGAA 53 OA4B4 212544_at:ZNHIT3 AGGTCATGCAGGCCTTTACC GGCATTGATGTGGCTCATGT 54 DDG6H6 212564_at:KCTD2 ACGCAGGTGATGCCAGCCAG GCCCAGGAGTGCCCAGCATC 55 IIE7F7 212822_at:HEG1 GCGGATGAACTGACATGCTC CTACCATGACCAGGCTCTGG 56 ZG12H12 212872_s_at:MED20 AAGCCTCTGCAACAAGTCAG GTGGTGGTCATGTTTCCCTT 57 NC5D5 212968_at:RFNG ACCACAGAGATGTTTTCTCC GCTCTGACTTGTGGCTCAGG 58 GGA5B5 214004_s_at:VGLL4 GCCAAAGCTCTGGGTGACAC GTGGCTCCAGATCAAAGCGG 59 AAC1D1 216525_x_at:PMS2L3 TTTCTACCTGCCACGCGTCG GTGAAGGTTGGGACTCGACT 60 FFA9B9 217832_at:SYNCRIP TATATCACATACCCAATAGG CACCACGATGAAGATCAGAG 61 BG1H1 217987_at:ASNSD1 TTTTACGCCTTGCAGCTGTG GAACTTGGTCTTACAGCCTC 62 UUC9D9 218114_at:GGA1 TGGGGCACCTAGAGTTCTCG GTGTGTCTCCTTCATTCATT 63 LE4F4 218386_x_at:USP16 CAGCGACACACATGTGCAAG CTGTGCCTACAACTAAAGTA 64 FFE3F3 218649_x_at:SDCCAG1 GAAACTGAACAGTGAAGTGG CTTGATTGCTTAAACTATTG 65 NG4H4 218725_at:SLC25A22 CTGGCCATGTGATCGTGTTG GTGACAGACCCTGATGTGCT 66 BBE10F10 218760_at:COQ6 GGCTTTGGGGATATCTCCAG CTTGGCCCATCACCTCAGTA 67 BE11F11 202209_at:LSM3 GCCCCTCCACTGAGAGTTGG CTGAAACAAAGAATTTGTCC
TABLE-US-00002 TABLE 2 Representative Type II (complex) Landmark Transcript/Probe-Pair Failures (SEQ ID NOS 135-170, respectively, in order of appearance) ## name alternate name left probe sequence right probe sequence 1 AA3B3 221049_s_at:POLL ATTTTAAGCAGGAGCAGGTG GCTGGTTTGAAGCCCCAGGT 2 AAG3H3 41160_at:MBD3 GCTCCCTGTCAGAGTCAAAG CACAAATCCTCAGGACGGGC 3 AC6D6 218912_at:GCC1 TTTCTGCCCAGTGGGTCTTG GCATAAGTAGATTAATCCTG 4 AE7F7 221560_at:MARK4 GAGTTAAAGAAGAGGCGTGG GAATCCAGGCAGTGGTTTTT 5 AG4H4 219445_at:GLTSCR1 AACAAGAAACTGGGGTCTTC CTCTCCCCCGAACCTCTCCC 6 CA6B6 218936_s_at:CCDC59 GCCTCTGAAGGAAGGTTGGC CTGAAGAACTGAAAGAACCT 7 FFA4B4 221471_at:SERINC3 CTTCCCTAGAAGAATGGTTG CTGATATGGCTACTGCTTCT 8 GGA1B1 221490_at:UBAP1 GGTTCTGCAATATCTCTGAG GTGCAAAGAATGCACTTTTC 9 HHG1H1 222039_at:KIF18B TGAAGATGTGGATGATAATG GTGCCTTGATTTCCAAATGA 10 VG10H10 217762_s_at:RAB31 GAACAATCAAAGTTGAGAAG CCAACCATGCAAGCCAGCCG 11 NA5B5 221196_x_at:BRCC3 GTTGCCAGGGATAGGGACTG GAGGGGGTGTGGGGTATGTA 12 RRE10F10 222351_at:PPP2R1B AGAGGACATGGGGAAGGGAC CAGTGTATCAGTTGCGTGGA 13 SSE6F6 220079_s_at:USP48 AGATGCGTTGGTCCATAAAG GATTGTATCAAGTAGATGGG 14 TA5B5 221567_at:NOL3 GTGAGACTAGAAGAGGGGAG CAGAAAGGGACCTTGAGTAG 15 UUG11H11 221858_at:TBC1D12 ATGGGTCATTCTAGTCTAAG GACTACTAGTAGAACCCTCA 16 WC8D8 90610_at:LRCH4 AAGACGCGCCTGGGCTCCGC GCTCTCAGAGAAGCACGTGG 17 XE6F6 222199_s_at:BIN3 ACGACTGAGCCCTGCTTCTG CTGGGGCTGTGTACAGAGTG 18 YG1H1 221856_s_at:FAM63A CTAGGATTGGTGGGTTTCTG GTTCTCAACTCCCGGTCCCT
TABLE-US-00003 TABLE 3 Representative Cluster Centroid Landmark Transcripts/Probe Pairs Validated for LMF (SEQ ID NOS 171-2, 170, respectively, in order of appearance) ## name Affymetrix gene symbol left probe sequence right probe sequence 1 QC7D7 209083_at CORO1A CCCTCCTCATCTCCCTCAAG GATGGCTACGTACCCCCAAA 2 AAAG5H5 221223_x_at CISH TGTGTCTCACCCCCTCACAG GACAGAGCTGTATCTGCATA 3 TE6F6 203458_at SPR GGAAAGAGTGATCTGGTGTC GAATAGGAGGACCCATGTAG 4 MME12F12 203217_s_at ST3GAL5 AACTGTGAAGCCACCCTGGG CTACAGAAACCACAGTCTTC 5 LLLC12D12 202862_at FAH TCCATGTTGGAACTGTCGTG GAAGGGAACGAAGCCCATAG 6 IIC3D3 201393_s_at IGF2R AGAAGCAAACCGCCCTGCAG CATCCCTCAGCCTGTACCGG 7 PPE8F8 203233_at IL4R CGGGCAATCCAGACAGCAGG CATAAGGCACCAGTTACCCT 8 MMMA8B8 209531_at GSTZ1 TAGGGAGATGCGGGGAGCAG GGTGGGCAGGAATACTGTTA 9 BBE6F6 218462_at BXDC5 ATCCTCAATTTATCGGAAGG CAGGTTGCCACATTCCACAA 10 IIG7H7 213417_at TBX2 TAGACCGCGTGATAAAACTG GGTTGAGGGATGCTGGAACC 11 NNA11B11 201795_at LBR TGGTGGCGTTTTCTGTACTG GATTGCACCAAGGAAGCTTT 12 XG1H1 204752_x_at PARP2 TGGGAGTACAGTGCCATTAG GACCAGCAAGTGACACAGGA 13 YA8B8 200713_s_at MAPRE1 CTTTGTTTGGCAGGATTCTG CAAAATGTGTCTCACCCACT 14 MMME2F2 203138_at HAT1 AGCTGGAAGAGAGTTTTCAG GAACTAGTGGAAGATTACCG 15 NG5H5 209515_s_at RAB27A ACTGTACTTGCTGGGTCTTG CCAAGATCATTTATTCCGCT 16 SSG2H2 211605_s_at RARA CTCTCATCCAGGAAATGTTG GAGAACTCAGAGGGCCTGGA 17 PG4H4 201078_at TM9SF2 TTACCAAAATATACAGTGTG GTGAAGGTTGACTGAAGAAG 18 TE2F2 202401_s_at SRF GGTGATATTTTTATGTGCAG CGACCCTTGGTGTTTCCCTT 19 ZZE5F5 203787_at SSBP2 GCTCCTGCCCCCTCCCTGAA CTATTTTGTGCTGTGTATAT 20 MMG1H1 200972_at TSPAN3 GACTGATGCCGAAATGTCAC CAGGTCCTTTCAGTCTTCAC 21 XXG10H10 217766_s_at TMEM50A AAAAGCATGATTCCCACAAG GACTAAGTATCAGTGATTTG 22 MC1D1 212166_at XPO7 GTGGATATTTATATATGTAC CCTGCACTCATGAATGTATG 23 JJG3H3 204812_at ZW10 GGCCCTAGCTTTGGAACGAG GAATTGGGAGATTCCAGGAG 24 ZZE7F7 218489_s_at ALAD CTGATGGCACATGGACTTGG CAACAGGGTATCGGTGATGA 25 NA4B4 201739_at SGK1 TAGTATATTTAAACTTACAG GCTTATTTGTAATGTAAACC 26 IIIA7B7 206770_s_at SLC35A3 CAAGACTGCTGAAAGCAATC CAGTTGCTCCTGTGCTAGAT 27 QQC6D6 205774_at F12 GATTCCGCAGTGAGAGAGTG GCTGGGGCATGGAAGGCAAG 28 NNE10F10 201611_s_at ICMT GCCTTAGGTAGTTGGGCTTG CCCACCCTAGTTTGCTTTTG 29 VA3B3 209092_s_at GLOD4 ATGAGTGTGTGACGTTGCTG CACGCCTGACTCTGTGCGAG 30 LLA1B1 219382_at SERTAD3 GAAAGCTGGGCCTGTCGAAG GATGACAGGGATGTGCTGCC 31 NNE9F9 217872_at PIH1D1 AAGCCTCACCTGAACCTGTG GCTGGAAGCCCCCGACCTCC 32 KKE12F12 207196_s_at TNIP1 CACAGTAGCCTTGCTGAAGC CATCACAGATGGGAGAAGGC 33 NG12H12 202417_at KEAP1 TACATAGAAGCCACCGGATG GCACTTCCCCACCGGATGGA 34 XG8H8 203630_s_at COG5 TTCACTAAATAAGCATGTAG CTCAGTGGTTTCCAAATTTG 35 OOA7B7 219952_s_at MCOLN1 ATTCGACCTGACTGCCGTTG GACCGTAGGCCCTGGACTGC 36 PPA9B9 203291_at CNOT4 ACGAGGGCACTCTGAGATAG CACTGCTCTGGGGCCATCTG 37 HHHA5B5 217789_at SNX6 GCAGGTTTGCTTGACCTCTG CCTCAGTTCTCGACTCTAAA 38 LLA7B7 203117_s_at PAN2 AGCAAGTAGAGTGTTGGTGG CCCAAGCAAACCAGTGTTGC 39 QG3H3 202673_at DPM1 GATGGAGATGATTGTTCGGG CAAGACAGTTGAATTATACT 40 MC11D11 203373_at SOCS2 AAAAACCAATGTAGGTATAG GCATTCTACCCTTTGAAATA 41 VVA2B2 217719_at EIF3L TTATGGGGATTTCTTCATCC GTCAGATCCACAAATTTGAG 42 FFFC6D6 210695_s_at WWOX CTGCTTGGTGTGTAGGTTCC GTATCTCCCTGGAGAAGCAC 43 MMG8H8 201829_at NET1 GTGTAGTAAGTTGTAGAAGG CTCGAGGGGACGTGGACTTA 44 JJJE10F10 203379_at RPS6KA1 CACACACCTCCGAGACAGTC CAGTGTCACCTCTCTCAGAG 45 TTC4D4 204757_s_at C2CD2L AGACCAGCACCAGTGTCTGC CTCTGAGAATGTTGGCAGCT 46 HHC11D11 203725_at GADD45A TCAACTACATGTTCTGGGGG CCCGGAGATAGATGACTTTG 47 LLE12F12 202466_at POLS GGGTGTGCATTTTAAAACTC GATTCATAGACACAGGTACC 48 IIE1F1 212124_at ZMIZ1 CATAAACACACCCACCAGTG CAGCCTGAAGTAACTCCCAC 49 HHG8H8 200816_s_at PAFAH1B1 AAGCTGGATTTACAGGTCAC GGCTGGACTGAATGGGCCTT 50 JJJA2B2 202635_s_at POLR2K AATCAGATGCAGAGAATGTG GATACAGAATAATGTACAAG 51 JJJA10B10 203186_s_at S100A4 TGGACAGCAACAGGGACAAC GAGGTGGACTTCCAAGAGTA 52 IIA5B5 207163_s_at AKT1 TAGCACTTGACCTTTTCGAC GCTTAACCTTTCCGCTGTCG 53 RA9B9 218346_s_at SESN1 CAGCACCAAAGTTGTGGGAC ATGTTGCTGTAGACTGCTGC 54 NA8B8 201896_s_at PSRC1 GAATTTTATCTTCTTCCTTG GCATTGGTTCACTGGACATT 55 MME3F3 203013_at ECD GACCAGGAACTAGCACACAC CTGCATCAGCAAAAGTTTCA 56 IIIE12F12 207620_s_at CASK AAAAGCCTCTTTGTTATCGG CCTTGTGTCAGCAGGTCATG 57 ZE4F4 201980_s_at RSU1 CAACACTTCATTCTCTCTTG CCCTGTCTCTCAAATAAACC 58 OE6F6 204825_at MELK GCTGCAAGGTATAATTGATG GATTCTTCCATCCTGCCGGA 59 ZZA12B12 201170_s_at BHLHE40 ACTTGTTTTCCCGATGTGTC CAGCCAGCTCCGCAGCAGCT 60 ZZE11F11 211715_s_at BDH1 CTGCGAATGCAGATCATGAC CCACTTGCCTGGAGCCATCT 61 NNG3H3 208078_s_at SIK1 TTGGGGCAGCCAGGCCCTTG CCTTCATTTTTACAGAGGTA 62 QC3D3 203338_at PPP2R5E CGTTCTATATCTCATCACAG CGCCAGCCCTGTTTTTAGCC 63 MMMG11H11 217956_s_at ENOPH1 ACAGCAAGCAGTTGCCTTAC CAGTGAAAAAGGTGCACTGA 64 JJJA9B9 202095_s_at BIRC5 CCAACCTTCACATCTGTCAC GTTCTCCACACGGGGGAGAG 65 MMME3F3 216836_s_at ERBB2 TCCCTGAAACCTAGTACTGC CCCCCATGAGGAAGGAACAG 66 LLLE10F10 212694_s_at PCCB TCCACACGTGCCCGAATCTG CTGTGACCTGGATGTCTTGG 67 ZZC6D6 204497_at ADCY9 TGAGAGCCCCACAGGCTCTG CCACACCCGTGACTTCATCC 68 UUC1D1 221142_s_at PECR GTGTCCTCCATCCCCCAGTG CCTTCACATCTTGAGGATAT 69 RE10F10 203246_s_at TUSC4 ATCTGCTGGAAGTGAGGCTG GTAGTGACTGGATGGACACA 70 XE5F5 203071_at SEMA3B CAGGCCCTGGCTGAGGGCAG CTGCGCGGGCTTATTTATTA 71 LLLC6D6 217784_at YKT6 AGGACCCTGGGGAGAGATGG GGGCGGGGAAAATGGAGGTA 72 LE10F10 202784_s_at NNT CTATGCTGCAGTGGACAATC CAATCTTCTACAAACCTAAC 73 NNNE6F6 200887_s_at STAT1 TGTAACTGCATTGAGAACTG CATATGTTTCGCTGATATAT 74 WWC5D5 202540_s_at HMGCR GACTCTGAAAAACATTCCAG GAAACCATGGCAGCATGGAG 75 MMG6H6 220643_s_at FAIM TGGTAAAAAATTGGAGACAG CGGGTGAGTTTGTAGATGAT 76 ZG7H7 202446_s_at PLSCR1 AAATCAGGAGTGTGGTAGTG GATTAGTGAAAGTCTCCTCA 77 HHHG9H9 219888_at SPAG4 GCTGGGCTTTTGAAGGCGAC CAAGGCCAGGTGGTGATCCA 78 EEEE11F11 204653_at TFAP2A GTATTCTGTATTTTCACTGG CCATATTGGAAGCAGTTCTA 79 MME5F5 217080_s_at HOMER2 AAACAAGCTTCTGGTGGGTG CATTTTCTGGCCCGGAGTTG 80 NE9F9 212846_at RRP1B CTAAGTAAAATTGCCAAGTG GACTTGGAAGTCCAGAAAGG 81 YYA9B9 203442_x_at EML3 GCCTTGACTCCCGCTGCCTG CTGAGGGGCAATAAACCAGA 82 HHE2F2 202324_s_at ACBD3 AGCTCATAGGTGTTCATACT GTTACATCCAGAACATTTGT 83 NNNA5B5 214473_x_at PMS2L3 CATCAGAATTACTTTGAAGG CTACTATTAATATGCAGACT 84 PA1B1 203008_x_at TXNDC9 TGATGTTGAATCAACTGATG CCAGCAGAAAGCTATTTTGA 85 KKKC9D9 209526_s_at HDGFRP3 TTTCCTCTCTGTGACAGAAC CCAGGAATTAATTCCTAAAT 86 PPG5H5 202794_at INPP1 GCAGAGACGCATACCTAGAG GAACTCTAACCCCGGTGTAC 87 OA6B6 202990_at PYGL CAAAGGCCTGGAACACAATG GTACTCAAAAACATAGCTGC 88 QQC5D5 205452_at PIGB CACTTCCCATGAGATTTCTC CAGTGCCCGCCAGACCTGAC 89 UG11H11 204458_at PLA2G15 TTTTCTCTGTTGCATACATG CCTGGCATCTGTCTCCCCTT 90 QE4F4 207842_s_at CASC3 GGTGGTTGTGCCTTTTGTAG GCTGTTCCCTTTGCCTTAAA 91 QQA9B9 211071_s_at MLLT11 CTTCACACCTACTCACTTTA CAACTTTGCTCCTAACTGTG 92 PC12D12 206846_s_at HDAC6 CCCATCCTGAATATCCTTTG CAACTCCCCAAGAGTGCTTA 93 SSC3D3 201498_at USP7 TGCTGCCTTGGCAGACTTAC GATCTCAACAGTTCATACGA 94 IIIG4H4 213851_at TMEM110 GACCACCGAGTGGCAAGGTG GAAGGAAGCACAGGCACACA 95 RRG5H5 219492_at CHIC2 AGTATGTTGTCTTTCCAATG GTGCCTTGCTTGGTGCTCTC 96 PPG4H4 202703_at DUSP11 ATTCTACCTGGAGACCAGAG CTGGCCTGAAAATTACTGGT 97 ZA4B4 218145_at TRIB3 TCTAACTCAAGACTGTTCTG GAATGAGGGTCCAGGCCTGT 98 MC7D7 212255_s_at ATP2C1 CCAGGAGTGCCATATTTCAG CTACTGTATTTCCTTTTTCT 99 VE9F9 200083_at USP22 CACCACTGCAACATATAGAC CTGAGTGCTATTGTATTTTG 100 SG7H7 202630_at APPBP2 CTTCATTGTGTCAGGATGAC CTTTCATATCATTCTCACCA 101 RC2D2 201774_s_at NCAPD2 CTGTGCAGGGTATCCTGTAG GGTGACCTGGAATTCGAATT 102 AAA7B7 203279_at EDEM1 TCACAGGGCTCAGGGTTATG CTCCCGCTTGAATCTGGACG 103 RRA12B12 204225_at HDAC4 GGCTAAGATTTCACTTTAAG CAGTCGTGAACTGTGCGAGC 104 UE5F5 201671_x_at USP14 TCAGTCAGATTCTTTCCTTG GCTCAGTTGTGTTTGTATTT 105 NNNA8B8 218046_s_at MRPS16 CACCAATCGGCCGTTCTACC GCATTGTGGCTGCTCACAAC 106 HHC8D8 209263_x_at TSPAN4 CACCTACATTCCATAGTGGG CCCGTGGGGCTCCTGGTGCA 107 QE3F3 200621_at CSRP1 AGGCATGGGCTGTACCCAAG CTGATTTCTCATCTGGTCAA 108 KKA2B2 200766_at CTSD GGGGTAGAGCTGATCCAGAG CACAGATCTGTTTCGTGCAT 109 YA5B5 201985_at KIAA0196 GTGCCCTTCTGTTCCTGGAG GATTATGTTCGGTACACAAA 110 HHG5H5 203154_s_at PAK4 CCTGCAGCAAATGACTACTG CACCTGGACAGCCTCCTCTT 111 PPG1H1 202284_s_at CDKN1A CAGACATTTTAAGATGGTGG CAGTAGAGGCTATGGACAGG 112 EEEA11B11 218584_at TCTN1 TGCAGAGGCAGGCTTCAGAG CTCCACCAGCCATCAATGCC 113 VE10F10 212943_at KIAA0528 CCCCCAGGACAACAAACTGC CCTTAAGAGTCATTTCCTTG 114 ZZA5B5 204656_at SHB TCCAAAGAGATGCCTTCCAG GATGAACAAAGGCAGACCAG 115 EEEG6H6 205573_s_at SNX7 TGCTAATAATGCCCTGAAAG CAGATTGGGAGAGATGGAAA 116 OOE7F7 200670_at XBP1 AGTTTGCTTCTGTAAGCAAC GGGAACACCTGCTGAGGGGG 117 YYC10D10 201328_at ETS2 TCTGTTTACTAGCTGCGTGG CCTTGGACGGGTGGCTGACA 118 QQE9F9 212765_at CAMSAP1L1 GTTTCATGGACACTGTTGAG CAATGTACAGTGTATGGTGT 119 IIE12F12 202986_at ARNT2 GTGCAGGCACATTTCCAAGC GTAGGTGTCCCTGGCTTTTG 120 XA8B8 201997_s_at SPEN AGACTGGCTAACCCCTCTTC CTATTACCTTGATCTCTTCC 121 VA8B8 203218_at MAPK9 CATGTGACCACAAATGCTTG CTTGGACTTGCCCATCTAGC 122 UUA3B3 219281_at MSRA TTATCTGTGCTCTCTGCCCG CCAGTGCCTTACAATTTGCA
123 MME8F8 201649_at UBE2L6 CTTGCCATCCTGTTAGATTG CCAGTTCCTGGGACCAGGCC 124 MA4B4 202282_at HSD17B10 TCAATGGAGAGGTCATCCGG CTGGATGGGGCCATTCGTAT 125 UUG6H6 218794_s_at TXNL4B CTTGCTTTTGGCTCATACAG GAGAGAGGGAAGGCTGCCAG 126 AAAE9F9 202866_at DNAJB12 AGATTATAAGAACTGATGTG GCCAGAGTGCCTACCCACTG 127 LC7D7 203050_at TP53BP1 TGTCACAAGAGTGGGTGATC CAGTGCCTCATTGTTGGGGA 128 IIC12D12 200045_at ABCF1 GGTGGTGCTGTTCTTTTCTG GTGGATTTAATGCTGACTCA 129 HHC10D10 218523_at LHPP GGCACACAGGGTACTTTCTG GACCCACTGCTGGACAGACT 130 AC11D11 202535_at FADD GAGTCTCCTCTCTGAGACTG CTAAGTAGGGGCAGTGATGG 131 PE9F9 202331_at BCKDHA TCAGGGGACAGCATCTGCAG CAGTTGCTGAGGCTCCGTCA 132 IIC4D4 204087_s_at SLC5A6 AGAGCAAGCACGTTTTCCAC CTCACTGTCTCCATCCTCCA 133 HHE7F7 201555_at MCM3 TTGCATCTTCATTGCAAAAG CACTGGCTCATCCGCCCTAC 134 OOG4H4 212557_at ZNF451 AGGAGGTAGTCACTGAGCTG GACCTTAAACACATCTGCAG 135 QQC2D2 204809_at CLPX GCCCCGCCAAGCAGATGCTG CAAACAGCTAAACTGTCATA 136 PPC9D9 203301_s_at DMTF1 CGAGAGAATAGTTTGTCATC CACTTAGTGTGTTAGCTGGT 137 PPE2F2 202361_at SEC24C CCTGCTGGGACACCGCTTGG GCTTTGGTATTGACTGAGTG 138 XG12H12 202716_at PTPN1 CGAGGTGTCACCCTGCAGAG CTATGGTGAGGTGTGGATAA 139 PPE12F12 204042_at WASF3 GCACAAGGCAAGTGAGTTTG CACTGTCAGCCCCAGACCGT 140 HHE11F11 201675_at AKAP1 AGACATGAACTGACTAATTG GTATCCACTACTTGTACAGC 141 BBBE11F11 217989_at HSD17B11 TCCAATGCCAAACATTTCTG CACAGGGAAGCTAGAGGTGG- 142 SSA8B8 202260_s_at STXBP1 GTCTCCCTCCCAACTTATAC GACCTGATTTCCTTAGGACG 143 AAE5F5 201225_s_at SRRM1 GAAATGAATCAGGATTCGAG CTCTAGGATGAGACAGAAAA 144 IIE11F11 202624_s_at CABIN1 GTAAATCTGCCCACACCCAG CTGGCCATATCCACCCCTCG 145 UC2D2 202705_at CCNB2 TTGTGCCCTTTTTCTTATTG GTTTAGAACTCTTGATTTTG 146 MMA11B11 202798_at SEC24B TTGAACTCTGGCAAGAGATG CCAAAAGGCATTGGTACCGT 147 IIG5H5 200053_at SPAG7 TGCTATTAGAGCCCATCCTG GAGCCCCACCTCTGAACCAC 148 HHG2H2 202945_at FPGS CACACCTGCCTGCGTTCTCC CCATGAACTTACATACTAGG 149 OOE9F9 201292_at TOP2A AATCTCCCAAAGAGAGAAAC CAATTTCTAAGAGGACTGGA 150 NC9D9 209760_at KIAA0922 GCCCCATCAACCCCACCACG GAACATTCGACCCACATGGA 151 XA4B4 204755_x_at HLF TCGTCAATCCATCAGCAATG CTTCTCTCATAGTGTCATAG 152 AAG6H6 209147_s_at PPAP2A ACGCCCCACACTGCAATTTG GTCTTGTTGCCGTATCCATT 153 QQE4F4 205190_at PLS1 TCCATCTTCCACTGTTAGTG CCAGTGAGCAATACTGTTGT 154 XC4D4 201391_at TRAP1 CGAGAACGCCATGATTGCTG CTGGACTTGTTGACGACCCT 155 UUG2H2 218807_at VAV3 TGGGCCTGGGGGTTTCCTAG CAGAGGATATTGGAGCCCCT 156 TTG9H9 209806_at HIST1H2BK GGGGTTGGGGTAATATTCTG TGGTCCTCAGCCCTGTACCT 157 PPG10H10 203755_at BUB1B GCTTGCAGCAGAAATGAATG GGGTTTTTGACACTACATTC 158 MA9B9 203465_at MRPL19 CCAGAATGGTCTTTAATGAG CATGGAACCTGAGCAAAGGG 159 VA9B9 202679_at NPC1 CCTTTTAGGAGTAAGCCATC CCACAAGTTCTATACCATAT 160 RRE8F8 218051_s_at NT5DC2 CTTCTCTGACCTCTACATGG CCTCCCTCAGCTGCCTGCTC 161 JJA4B4 204828_at RAD9A GCCTTGGACCCGAGTGTGTG GCTAGGGTTGCCCTGGCTGG 162 PPA12B12 203965_at USP20 ATCAGGATCAAAGCAGACGG GGCGTGGGTGGGGAAGGGGC 163 JJA9B9 209507_at RPA3 TGGAATTGTGGAAGTGGTTG GAAGAGTAACCGCCAAGGCC 164 XE1F1 203068_at KLHL21 CAGTTCACCCCAGAGGGTCG GGCAGGTTGACATATTTATT 165 NNNG3H3 201339_s_at SCP2 TCAGCTTCAGCCAGGCAACG CTAAGCTCTGAAGAACTCCC 166 PPG2H2 202369_s_at TRAM2 TGAAGGATGAACTAAGGCTG CTGGTGCCCTGAGCAACTGA 167 UUC11D11 208716_s_at TMCO1 AAGGCACTGTGTATGCCCTG CAAGTTGGCTGTCTATGAGC 168 CG4H4 218271_s_at PARL GGGATTGGACAGTAGTGGTG CATCTGGTCCTTGCCGCCTG 169 KKC6D6 202188_at NUP93 AGGTCCTCATGAATTAAGTG CCATGCTTTGTGGGAGTCTG 170 BBBA5B5 221245_s_at FZD5 GAGCCAAATGAGGCACATAC CGAGTCAGTAGTTGAAGTCC 171 RRE5F5 219485_s_at PSMD10 TGTGAGTCTTCAGCACCCTC CCATGTACCTTATATCCCTC 172 LA6B6 201263_at TARS CAGTGGCACTGTTAATATCC GCACAAGAGACAATAAGGTC 173 NNC5D5 213196_at ZNF629 AAACTGCTATGGACATGGAG GTCAGATGGGAACTTGGAAC 174 TC8D8 201932_at LRRC41 GCAAACAGGCATTCTCACAG CTGGGTTTATAGTCTTTGGG 175 SG8H8 204758_s_at TRIM44 GTCCTGACTCACTAAAGATG CCAGGATATTGGGGCTGAGG 176 IIIG8H8 213669_at FCHO1 CGCATGTCGCTGGTGAAGAG GAGGTTTGCCACAGGGATGT 177 NNA7B7 219581_at TSEN2 CACTTTCATACGCAGGCATC TCTTGTTACCTACATCTAAG 178 LE7F7 201704_at ENTPD6 TTCTGGACACCAACTGTGTC CTGTGAATGTATCGCTACTG 179 ZA7B7 205225_at ESR1 CCCTTTGCATTCACAGAGAG GTCATTGGTTATAGAGACTT 180 CCCG4H4 210582_s_at LIMK2 AAGCTCGATGGGTTCTGGAG GACAGTGTGGCTTGTCACAG 181 NNE11F11 202382_s_at GNPDA1 GTGCCTGTTTGAAGCTACTG CTGCCTCCATTTCTGGGAAA 182 PPE6F6 202809_s_at INTS3 TATGACGTGGTCAGGGTGTC CATTCCTAATCATGGGGCAG 183 SSG9H9 201833_at HDAC2 ACCAAATCAGAACAGCTCAG CAACCCCTGAATTTGACAGT 184 BBBE9F9 200697_at HK1 TCCGTGGAACCAGTCCTAGC CGCGTGTGACAGTCTTGCAT 185 NA7B7 208741_at SAP18 GGAATTGGTGTCCCTGTTAG CAATGGCAGAGACCAGCCTG 186 UC6D6 202117_at ARHGAP1 CTGGTCTGTACCCCAGGGAG CGGGTGCTTGTACTGTGTGA 187 TE9F9 202651_at LPGAT1 GCTGGTCACACGTGGATCTG GTTTATGAATGCATTTGGGA 188 LE3F3 203073_at COG2 TGGGCTTTCTAAAGAGGCTG CGGGAAGCCATCCTCCACTC 189 IIIC2D2 218108_at UBR7 GCAGCACAATAGTACCGATC AGTTAACTCAGCGCTGAAGG 190 HHHC9D9 201855_s_at ATMIN GCATGTAATAATACAAGAAC TGTTTCCCCCTCAAAACCTG 191 PPE5F5 202763_at CASP3 ACTGCACCAAGTCTCACTGG CTGTCAGTATGACATTTCAC 192 OOA3B3 206109_at FUT1 TGAGATAAAACGATCTAAAG GTAGGCAGACCCTGGACCCA 193 VE3F3 202891_at NIT1 GAACCTTGACTCTCTTGATG GAACACAGATGGGCTGCTTG 194 RRC12D12 204313_s_at CREB1 TGTCCTTGGTTCTTAAAAGC ATTCTGTACTAATACAGCTC 195 QA9B9 209029_at COPS7A TTTCCTCTCTCTGGCCCTTG GGTCCTGGGAATGCTGCTGC 196 PG7H7 209304_x_at GADD45B GGGAGCTGGGGCTGAAGTTG CTCTGTACCCATGAACTCCC 197 PPC4D4 202691_at SNRPD1 CTAGAATTGATTCTCCTTTC CTGAGTTTTACTCCACGGAG 198 RRA2B2 218375_at NUDT9 GCCATGCGTTGTAGCTGATG GTCTCCGTGTAAGCCAAAGG 199 PPC8D8 203080_s_at BAZ2B AACCACTGTGTTTTATCTAC TGTGTGTTGTGGTGGCCTGT 200 BBBC10D10 221750_at HMGCS1 GGGCAGGCCTGCAAATACTG GCACAGAGCATTAATCATAC 201 QQA11B11 213119_at SLC36A1 GACATAAATGGTGCTGGTAG GAGGTTATCAGAGTAAGGAA 202 EEEC12D12 202011_at TJP1 GGGGCAGTGGTGGTTTTCTG TTCTTTCTGGCTATGCATTT 203 QQC7D7 208190_s_at LSR TGGGCGGCTACTGGAGGAGG CTGTGAGGAAGAAGGGGTCG 204 UC10D10 202468_s_at CTNNAL1 ATGACAAGCTTATGCTTCTC CTGGAAATAAACAAGCTAAT 205 QA7B7 218206_x_at SCAND1 TCGGGCCCGGGGGCCTGAGC CTGGGACCCCACCCCGTGTT 206 EEEG10H10 204158_s_at TCIRG1 TGCTGGTCCCCATCTTTGCC GCCTTTGCCGTGATGACCGT- 207 XG2H2 202128_at KIAA0317 TTAGCGTCTTTGAAGGAGAC CAGACATGAGTGAATACCTA 208 RG3H3 203105_s_at DNM1L TTATGAACTCCTGTGTATTG CAATGGTATGAATCTGCTCA 209 QQE5F5 205633_s_at ALAS1 TCCTATTTCTCAGGCTTGAG CAAGTTGGTATCTGCTCAGG 210 NG7H7 203228_at PAFAH1B3 TGGCTTTGTGCACTCAGATG GCACCATCAGCCATCATGAC 211 RC1D1 208820_at PTK2 ACCAGAGCACCTCCAAACTG CATTGAGGAGAAGTTCCAGA 212 ZZG8H8 204765_at ARHGEF5 GCTTAAACATTCTCCGCCTC CAGGGTGCAGATTCAGAGCT 213 IIE9F9 201719_s_at EPB41L2 TGGTTACAAGAAAGTTATAC CATTTAAAGCTGGCACCAGA 214 JJG10H10 212591_at RBM34 AGGATTGTGAGAGACAAAAT GACAGGCATCGGCAAAGGGT 215 OE11F11 202633_at TOPBP1 TCTTTTAACAGGAGCCTGAG CACAAGGTTTAATGAGGAAG 216 AAAG1H1 209213_at CBR1 TGACATGGCGGGACCCAAGG CCACCAAGAGCCCAGAAGAA 217 EEEE6F6 208879_x_at PRPF6 GCCTGCAACATTCGGCCGTG GTTACGATGAGTTTACCCCT 218 NE3F3 206398_s_at CD19 TGACTCTGAAATCTGAAGAC CTCGAGCAGATGATGCCAAC 219 TTA1B1 209095_at DLD CTTTTGTAGAAGTCACATTC CTGAACAGGATATTCTCACA 220 HHA9B9 201207_at TNFAIP1 AGTCTTTTTTGCCGAGAAAG CACAGTAGTCTGGGACTGGG 221 IIC9D9 201462_at SCRN1 CAGTCCCAGGTCCCAGCTCC CCTCTTATGGTTTCTGTCAT 222 FFFA3B3 218245_at TSKU GCAGTGAGCTCTGTCTTCCC CCACCTGCCTAGCCCATCAT 223 PC4D4 212910_at THAP11 TTTTCCTTCCCAGGTGCAGC CTGTGATTCTGATGGGGACT 224 IIG2H2 219968_at ZNF589 AGGAATGGCTGGTCCAGAGG CTTTTGTCCACTCCCTCTCA 225 MMMC11D11 221531_at WDR61 ATGCCTCCTGGGTGCTGAAC GTTGCATTCTGTCCTGATGA 226 NNNG7H7 205172_x_at CLTB GTCGGGGTGGAGACTCGCAG CAGCTGCTACCCACAGCCTA 227 WE7F7 202788_at MAPKAPK3 GGTATACTTGTGTGAAAGTG GCTGGTTGGGAGCAGAGCTA 228 ZG4H4 212054_x_at TBC1D9B GTGTTAGCCCCCACATGGGG CTGCTCTTGCTTCTACTAAA 229 SSG4H4 208510_s_at PPARG TGCTCCAGAAAATGACAGAC CTCAGACAGATTGTCACGGA 230 QG10H10 203574_at NFIL3 GAGACTTATAGCCACACAAC CAATCTCTGCTTCAGACTCT 231 YE1F1 201032_at BLCAP CGCTTCAGTAACAAGTGTTG GCAAACGAGACTTTCTCCTG 232 TE12F12 201889_at FAM3C ATATGCTAAATCACATTCAG CATGTGTATTTTGACATTTA 233 MMG11H11 202946_s_at BTBD3 GGCAGTCTTTGTCGTTGTTC ATTCTGGGGATAAAGGGGAA 234 UUG10H10 201380_at CRTAP TGCATCTCCAAAATTACAAC GGTTGGCCGATCCCATTTGA 235 FFFA8B8 219711_at ZNF586 CCTGCCAGTCATGAATCTCA GACAGCCTGCCACCTATTGC 236 QC8D8 203646_at FDX1 GAAGGCAGAGATCTAACCTG GCTTGTTTAGGGCCATACCA 237 HHHA6B6 204985_s_at TRAPPC6A AGGTGGGGGTGTCAGAGGAG GCAAAGGGGTCCCAGCTGCG- 238 SA3B3 202680_at GTF2E2 TTTTTCTCCACTTCTAAATG GTTCCTGGTTCCTTTCTTCC 239 EEEA12B12 213135_at TIAM1 TATCATCTCCGGTTCGATCG CGTCCAGATGGAAAACGGAA 240 VG7H7 201761_at MTHFD2 AAGTACGCAACTTACTTTTC CACCAAAGAACTGTCAGCAG 241 TTG3H3 217825_s_at UBE2J1 CCTTGATTCAGTGCTCAGTG GTCTCCTAGTAAGAAGTCAC 242 OOC8D8 201158_at NMT1 GGTGCCATGTCTGGGAACAG GGACGGGGGAGCTTCACCTT 243 PPA7B7 202813_at TARBP1 TTCCTCAACAGGGCATTATC CGCTCCCTGAATGTCCATGT 244 JJJG4H4 206066_s_at RAD51C CACTGGAACTTCTTGAGCAG GAGCATACCCAGGGCTTCAT 245 PA5B5 217934_x_at STUB1 TGTTTCCCCTCTCAGCATCG CTTTTGCTGGGCCGTGATCG 246 MMA3B3 202394_s_at ABCF3 TATTCCCAAATGTCTCTATC CTTTTGACTGGAGCATCTTC
247 TA6B6 208647_at FDFT1 CATTCAGTGCCACGGTTTAG GTGAAGTCGCTGCATATGTG 248 LE1F1 202733_at P4HA2 TGTCTGGAGCAGAGGGAGAC CATACTAGGGCGACTCCTGT 249 JJJG6H6 201589_at SMC1A CAATCCATCTTCTGTAATTG CTGTATAGATTGTCATCATA 250 IIIC4D4 215000_s_at FEZ2 GGTGGTGATGGATTTTGTAG CTTGCTGCTTGTTTCACCAC 251 LC11D11 203963_at CA12 CACAGACAGTTTCTGACAGG CGCAACTCCTCCATTTTCCT 252 YC3D3 206662_at GLRX ATGGATCAGAGGCACAAGTG CAGAGGCTGTGGTCATGCGG 253 BBBG2H2 202942_at ETFB TGCTGGGCAAACAGGCCATC GATGATGACTGTAACCAGAC 254 XC6D6 201234_at ILK AGAAGATGCAGGACAAGTAG GACTGGAAGGTCCTTGCCTG 255 UUG9H9 212206_s_at H2AFV CCCTGTTTCCTGTTGATATG GTGATAGTTGGAGAGTCAAA 256 RRA1B1 217906_at KLHDC2 TGATCACCTTGCATGGACAG CAATCCTGTAAACATCACAG 257 OE12F12 201494_at PRCP ATCAGTGGCCCTCATAACTG GAGTAGAGTTCCTGGTTGCT 258 RA1B1 204054_at PTEN CTACCCCTTTGCACTTGTGG CAACAGATAAGTTTGCAGTT 259 RRC9D9 218856_at TNFRSF21 GGTCCAATCTGCTCTCAAGG CCTTGGTCCTGGTGGGATTC 260 LLLE7F7 211747_s_at LSM5 AGCTAAGTTTCCCGTTAAAG GGAAGTGCTTTGAAGATGTG 261 RRE12F12 206364_at KIF14 TTGCTGGCACAGTAGTTTAC CCTGTTATCTGTGTTTCATA 262 JJC4D4 204849_at TCFL5 TTGTCATGACTCTGAGTCAC GTGCTGCTGTATTGCAACGT 263 PPA1B1 202153_s_at NUP62 ACAATGAAGCCCAGTGTAAC GTCAGTCCACAGAAATAGCC 264 HHE5F5 218014_at NUP85 ACGTCTCGGATTGCCCCTCG GTCTTTCTGGATGACTCTGC 265 KKG10H10 205088_at MAMLD1 GCACCCTCGTGGGGTTAAGG CGAGCTGTTCCTGGTTTAAA 266 JJC6D6 205340_at ZBTB24 TGAAACACCTCGTTTTGAAG GTGAATCTTTGGTTTTCTCC 267 KKE3F3 203130_s_at KIF5C TCCATGTAACAAAAGATCTG GAAGTCACCCTCCTCTGGCC 268 YC5D5 208309_s_at MALT1 CTGTCATTGCAGCCGGACTC CAGATGCATTTATTTCAAGT 269 TTE4F4 221567_at NOL3 ACCCCACGCAAGTTCCTGAG CTGAACATGGAGCAAGGGGA 270 NE1F1 219650_at ERCC6L ATCTCAAAAAGCAACTTCTG CCCTGCAACGCCCCCCACTC 271 KKC10D10 201121_s_at PGRMC1 CTCTCCTAAGAGCCTTCATG CACACCCCTGAACCACGAGG 272 SSA1B1 203201_at PMM2 GTTCCCTCCAAACCTCCCAG CCACTCGGGCTTGTAACTGT 273 LLE4F4 218170_at ISOC1 GGATAGAAGGGTTTGCAATG CCATATTATTGGTGGAGGGC 274 IIIC5D5 203288_at KIAA0355 TGTGTGAAGCCGTTTGTGTG GTCTCCATGTAGGTGCTGTG 275 BBBA3B3 217838_s_at EVL TAAGGGGCCGGCCTCGCTGC GCTGATTCGTCGAGCCCATC 276 HHG4H4 213292_s_at SNX13 CTCAAATACTGTTGTGTCTG CACCAGTCTTTTAGTGTCTC 277 UC1D1 202602_s_at HTATSF1 GGGCCCCTATCCACTGGCAG CAGCTTTATTCTCAGTAGCG 278 ZC4D4 202349_at TOR1A CACCTTAGCAACAATGGGAG CTGTGGGAGTGATTTTGGCC 279 MMME10F10 201560_at CLIC4 CCAGAGTTGCATGTAGATAG CATTTATTTCTGTGCCCTTA 280 ZZA4B4 207749_s_at PPP2R3A TTTGCCTCAAACCTCTTACG GAGCTTCTCCTCAGAAGTGG 281 MMC12D12 203188_at B3GNT1 TGTGGCCTTGAGTAAATCCC GTTACCTCTCTGAGCCTCGG 282 LLC12D12 202187_s_at PPP2R5A CCTCACAACCTGTCCTTCAC CTAGTCCCTCCTGACCCAGG- 283 IIG4H4 205607_s_at SCYL3 TAGGCAGTTCCTGACTGTTC CACATGTAGTACATTGTACC 284 LLE9F9 205130_at RAGE CATTTCTGTGATGTGTTGGG CGTGGTTGGAAGGTGGGTTC 285 IIIE11F11 218854_at DSE CTGGTCTCTGCACACATATG CTTGGTTACTTGCATGCATT 286 OOA2B2 203857_s_at PDIA5 TGTTCTACGCCCCTTGGTGC CCACACTGTAAGAAGGTCAT 287 QQE7F7 208445_s_at BAZ1B ACTGCGGAATGTGGCCTCTG CTTCCTCCGTCCTCCTGCCC 288 NNNE4F4 203360_s_at MYCBP AAAATCCAGAAATAGAGCTG CTTCGCCTAGAACTGGCCGA 289 JJC7D7 205909_at POLE2 AGGACATCTGACTCCCCTAC CTCTTTATGTCTGCCCAGTG 290 YYG6H6 210563_x_at CFLAR CTTGAAGATGGACAGAAAAG CTGTGGAGACCCACCTGCTC 291 UC4D4 200071_at SMNDC1 GGATGTGTGATGTTTATATG GGAGAACAAAAAGCTGATGT 292 PA9B9 209259_s_at SMC3 TTGGAAAATACTACCTACTG GTTTGGGAGATGTATATAGT 293 OOC2D2 203931_s_at MRPL12 TCCAAGGCATCAACCTCGTC CAGGCAAAGAAGCTGGTGGA 294 KKE1F1 200678_x_at GRN CCTGTCAGAAGGGGGTTGTG GCAAAAGCCACATTACAAGC 295 JJJE9F9 202735_at EBP CCTGCCAGAAGAGTCTAGTC CTGCTCCCACAGTTTGGAGG 296 BC8D8 201804_x_at TBCB TTGGTGTCCGCTATGATGAG CCACTGGGGAAAAATGATGG 297 LLE2F2 219573_at LRRC16A CGGAGTACTGCTAAGTGTAC CTGTGTCAAATCCGCACAGG 298 XC8D8 201614_s_at RUVBL1 GCTGCCGTCCCCACTCAGGC GTGGTCTGCAGCGCTGTCAG 299 EEEE10F10 336_at TBXA2R CCCTGAATTTGACCTACTTG CTGGGGTACAGTTGCTTCCT 300 AAG2H2 202052_s_at RAI14 TTCAGAAAATACACAACAGC CCCTTCTGCCCCCGCACAGA 301 RC12D12 212899_at CDC2L6 TTTCCTGCTTTTGAGTTGAC CTGACTTCCTTCTTGAAATG 302 TE3F3 202433_at SLC35B1 TGGCCTCTGTGATCCTCTTC GCCAATCCCATCAGCCCCAT 303 AAG10H10 201591_s_at NISCH TCTGACTTTCTCTTCTACAC GTCCTTTCCTGAAGTGTCGA 304 OG4H4 202518_at BCL7B TGAGGTTCTGACAACAGTAC CCATCCCCCACAGTACCCCT 305 RRG4H4 219184_x_at TIMM22 GCTGAGGGGCTGTTCACCAC CATCCTCGTTCTCCAGGGTC 306 WE1F1 203334_at DHX8 GAAAGGGACAATTTGTGCAG CTCCAGGATGGGAAGGTGGA 307 LLLC9D9 204517_at PPIC GTCACCCTTTAGTTTGCTTG AACTTTAGTAAACCACCTGC 308 WA2B2 202396_at TCERG1 GCATTTGTGGCTTGAACTTG CCAGATGCAAATACCACAGA 309 NE2F2 218034_at FIS1 TTTCTGCTCCCCTGAGATTC GTCCTTCAGCCCCATCATGT 310 VC7D7 209189_at FOS CCCAGTGACACTTCAGAGAG CTGGTAGTTAGTAGCATGTT 311 HHG3H3 212462_at MYST4 TGTACAGGGTGACAGTAAGG GCCAAGCAGGAGAGGCGTAA 312 AAG12H12 202329_at CSK GGGCATTTTACAAGAAGTAC GAATCTTATTTTTCCTGTCC 313 JJJG12H12 206571_s_at MAP4K4 GGAGCTGCACCGAGGGCAAC CAGGACAGCTGTGTGTGCAG- 314 VG6H6 202778_s_at ZMYM2 ACTGGGTTCTTAACCAGATG GTTGTGTATGGGTAGCACTA 315 OC9D9 205376_at INPP4B TCAACATGCTACAGCTGATG GCTTTCCCCAAGTACTACAG 316 FFFG8H8 218916_at ZNF768 GAAGTGACATGCCCTGGAGA CTTGTGGGAAGTGGGTTGGA 317 IIA8B8 219499_at SEC61A2 CACCGAGCTAAGTCTGTGTG CAGCATTAGTACCCGCTGCC 318 JJA12B12 218898_at FAM57A CCCATTCCTGTGTGTCCGTC CTGCCATTTAGCCACAGAAG 319 BBBG1H1 220161_s_at EPB41L4B CCCTAGTCTGTTGGTAGAAC CAGAAATCAATATGTTGTCT- 320 RRA6B6 200981_x_at GNAS GCATGCACCTTCGTCAGTAC GAGCTGCTCTAAGAAGGGAA 321 QQC8D8 209191_at TUBB6 TCGGCCCCTCACAAATGCAG CCAAGTCATGTAATTAGTCA 322 RC7D7 202776_at DNTTIP2 GGAAGTACTCAGAGATCATG GCTGAAAAAGCAGCAAATGC 323 NNNA6B6 203582_s_at RAB4A ACAGATGCCCGAATGCTAGC GAGCCAGAACATTGTGATCA 324 QQC3D3 204977_at DDX10 AGATCGAGGGTGGATGATAC CATTTCCTGACCCCGTTTTC 325 OOA10B10 201412_at LRP10 GCACCGGAATGCCAATTAAC TAGAGACCCTCCAGCCCCCA 326 RC3D3 203367_at DUSP14 CACTTTGGGGCCTCATTAAC CCTTTAGAGACAAGCTTTGC 327 MMMG8H8 201379_s_at TPD52L2 GGGTTAAAATCGGCCTGTGG GGTGTGGTGAGAAGGCAGGT 328 AAAG3H3 203973_s_at CEBPD TGCCCGCTGCAGTTTCTTGG GACATAGGAGCGCAAAGAAG 329 EEEE12F12 212770_at TLE3 GTCTCTTGTGGCCCAAACAG GTTAGGTAGACTATCGCCTC 330 AAE9F9 203192_at ABCB6 AACCTCTGAAGACACTAAGC CTCAGACCATGGAACGGTGA 331 SSE10F10 202180_s_at MVP CTGAAATCAACCCTCATCAC CGATGGCTCCACTCCCATCA 332 PPC6D6 202801_at PRKACA TTCAAGGCTAGAGCTGCTGG GGAGGGGCTGCCTGTTTTAC 333 JJE9F9 209691_s_at DOK4 GTGGCAGGAGGATGATAAAG CACGCGGCCCCTCCCAAAGG 334 LLLA2B2 201185_at HTRA1 ATGCGTAGATAGAAGAAGCC CCACGGGAGCCAGGATGGGA 335 OA9B9 207700_s_at NCOA3 ATAGTATACTCTCCTGTTTG GAGACAGAGGAAGAACCAGG 336 UUG1H1 219460_s_at TMEM127 TACACCCAGCCCCGAGTGTG CATCACGGTAAAAGAGCTGA 337 YG10H10 205548_s_at BTG3 CATTGTGACCGGAATCACTG GATTAATCCTCACATGTTAG 338 RG10H10 218039_at NUSAP1 AGCTGGGATAGAAAGGCCAC CTCTTCACTCTCTATAGAAT 339 LLG4H4 218290_at PLEKHJ1 CATCCAAAGCCTGAAGCCAG GTGGGTGTGGGCAGGGGCTG 340 PPA2B2 202328_s_at PKD1 GGGCAAGTAGCAGGACTAGG CATGTCAGAGGACCCCAGGG 341 XG5H5 201976_s_at MYO10 GGGGGAGAGACGCTGCATTC CAGAAACGTCTTAACACTTG 342 LLG7H7 212726_at PHF2 CTGGATGTTTTTGTCCACTG GGAGAGGCAGCTTGGTGGAG 343 YC4D4 201000_at AARS GAACACACTTGGGAGCAGTC CTATGTCTCAGTGCCCCTTA 344 PA8B8 210640_s_at GPER CCCTCTGTGGAGCGCCCGCC GTCTGCTCCGGGGTGGTTCA 345 SSC9D9 201727_s_at ELAVL1 CACTCCTCTCGCAGCTGTAC CACTCGCCAGCGCGACGGTT 346 MMA7B7 207290_at PLXNA2 GCCTGGCCACCCACACTCTG CATGCCCTCACCCCACTTCT 347 HHA12B12 210074_at CTSL2 GATGGATGGTGAGGAGGAAG GACTTAAGGACAGCATGTCT 348 LLLG4H4 202087_s_at CTSL1 TTCATCTTCAGTCTACCAGC CCCCGCTGTGTCGGATACAC 349 OOG3H3 209435_s_at ARHGEF2 GGGGATTTTTCAGTGGAACC CTTGCCCCCAAATGTCGACC 350 JJJC5D5 203126_at IMPA2 ACCCCAGAGGGAGTTGTCAC GCTACAGTGAGTGGCTGGCC 351 YE10F10 217722_s_at NGRN AATAGGAAGAGGTGTTGAGC CTGGACTGTGGGAGGAAAGA 352 ZZC9D9 202207_at ARL4C GTGGTCACCAGGGGGACAGG GAGCCCCCCACCAATGTATC 353 QG7H7 206688_s_at CPSF4 ATTTTCTCTTGGGGTACGTG CCTGACAGTGTTTAAGGTGT 354 NNNC6D6 218193_s_at GOLT1B TGAAATCCATGTTAATGATG CTTAAGAAACTCTTGAAGGC 355 SSC11D11 202675_at SDHB AAGGCAAGCAGCAGTATCTG CAGTCCATAGAAGAGCGTGA 356 XE2F2 203266_s_at MAP2K4 TGCTGTCAACTTCCCATCTG GCTCAGCATAGGGTCACTTT 357 PA7B7 201967_at RBM6 GTTGGAGCCTCAGGAAGAAC CAGCAAAAGACAGTCCAACG 358 IIIG5H5 212851_at DCUN1D4 AGTGGACAAGAAACCACCAG CATTGAGCTAACCCAGTACA 359 UA12B12 203640_at MBNL2 GGAACTACATTTCACTCTTG GTTTTCAGGATATAACAGCA 360 UA6B6 201960_s_at MYCBP2 TCAAACTTGTGAGGTGTTTG CATGTGGCCATTACCGTCAT 361 UUC4D4 200636_s_at PTPRF GTCCTTATTATCCCAGCTTG CTGAGGGGCAGGGAGAGCGC 362 NNG11H11 202427_s_at BRP44 CTTTGTGGGGGCAGCAGGAG CCTCTCAGCTTTTTCGTATT 363 AAAA12B12 200789_at ECH1 TGGCCGAGAGCCTCAACTAC GTGGCGTCCTGGAACATGAG 364 AAAE5F5 218597_s_at CISD1 ACCACCTCTGTCTGATTCAC CTTCGCTGGATTCTAAATGT 365 RRA11B11 202550_s_at VAPB AACTCTGTTGGGTGAACTGG TATTGCTGCTGGAGGGCTGT 366 MMMA11B11 209337_at PSIP1 GGTCATTTGGCACTTCTCAG CAAGTAGGATACTTCTCATG 367 OOE3F3 208626_s_at VAT1 AGGACCTGGGCCATTGCAAC CAAAATGGGGACTTCCTGGG 368 NNNE1F1 222125_s_at P4HTM CCCCGCCAGCCGCGATACGG CGCAGTTCCTATATTCATGT 369 KKG9H9 200078_s_at ATP6V0B TCCAGAGTGAAGATGGGTGA CTAGATGATATGTGTGGGTG 370 YA2B2 200752_s_at CAPN1 CTTCAGGGACTTGTGTACTG GTTATGGGGGTGCCAGAGGC
371 WE9F9 217874_at SUCLG1 TCAGTATGTCTCCTGCACAG CTGGGAACCACGATCTACAA 372 HHC4D4 212723_at JMJD6 ACCCATTCACTTAGCGTTTG CTCCAGTAGCTTTCCCTCTG 373 ZZC5D5 212811_x_at SLC1A4 GAAGGGGAAGATCTGAGAGC GTGCTGTTTGTGGCTGTTGA 374 MME4F4 212140_at PDS5A GGCCCACCCCAATTTTGTAA CATGATGCAAGTGTCTGGCA 375 AAE11F11 219222_at RBKS GCTTACTATCCAAATCTGTC CTTGGAAGACATGCTCAACA 376 TTE12F12 217950_at NOSIP CTGGGGCTGTGGTCACCCTC GAATGCGTGGAGAAGCTGAT 377 OOC10D10 201432_at CAT TTAATACAGCAGTGTCATCA GAAGATAACTTGAGCACCGT 378 NNNC1D1 218845_at DUSP22 TTATCCCCACTGCTGTGGAG GTTTCTGTACCTCGCTTGGA 379 YG2H2 201314_at STK25 GCCTTGTGGTGTTGGATCAG GTACTGTGTCTGCTCATAAG 380 MMG9H9 202414_at ERCC5 AAACCAGTGCTTCAGATTCG CAGAACTCAGTGAAGGAAGC 381 PE5F5 203659_s_at TRIM13 TTCTTTGCCTCAAGACACTG GCACATTCATTAGCAAGATT 382 FFFA2B2 210241_s_at TP53TG1 CATGATGCTGGGGAGCTTGG CGCCTGACCCAGGATCTAGA 383 RRE7F7 204761_at USP6NL TAGTAGAAAACCCGACATTG ATGTTTCTTCCTGTTGCAAG 384 XA9B9 208946_s_at BECN1 ATCTATAGTTGCCAGCCCTG GTCAGTTTTGATTCTTAACC 385 CCCE2F2 204017_at KDELR3 CCTTCAGGCCAGAAGCAAAC CAAATTTACCAGGTTTGGCT 386 BBBA1B1 204256_at ELOVL6 GATGGCAAGGGCTTTTTCAG CATCTCGTTTATGTGTGGAA 387 RRC11D11 221848_at ZGPAT ACTGCTGAGTGGAGACAGAG CTGCGGGGTCCCATCTGGAC 388 JJG5H5 205161_s_at PEX11A TGATGTGGGCAGAGATGAGG CCAAGAACGGAGAAGGGAGG 389 VC2D2 202894_at EPHB4 GGTGGAACCCAGAAACGGAC GCCGGTGCTTGGAGGGGTTC 390 YG9H9 209710_at GATA2 CGCTGCAGGGAGCACCACGG CCAGAAGTAACTTATTTTGT 391 TTC9D9 215980_s_at IGHMBP2 AGAGCCTCCCGGCCTTCTCC GGTGTCCTGTACCAACTCTT 392 RE9F9 203221_at TLE1 TTGCCCAAGTGTGAGATTAC CTTTCTGTTCCTTGCAGTTC 393 IIC6D6 202950_at CRYZ AGTTTCCAAGGGTTTTCAAG CCTACTTACCTTTATAAAGG 394 OG10H10 40562_at GNA11 CTCTCCCTCCGTACACTTCG CGCACCTTCTCACCTTTTGT 395 RE11F11 203302_at DCK TCAAAGATGATAATTTAGTG GATTAACCAGTCCAGACGCA 396 NNG12H12 202545_at PRKCD TTCTTCAAGACCATAAACTG GACTCTGCTGGAAAAGCGGA 397 PPE11F11 203884_s_at RAB11FIP2 GGGCCTGTTAGTCTTCGAAG CTTCCAGATGGTTTGTGT- TT 398 QQE10F10 212973_at RPIA GGGGTTTCTTCATATTCCTG CTGTTGGAAGCAGTTGACCA 399 HHE6F6 202452_at ZER1 GGCAGGACGGCAGGGGTGAG CAGCTTTGGGAGAGACACCT 400 LG6H6 221046_s_at GTPBP8 TGACCTTTTCTGGAATCCAC CTGTTGAGATGCTTTATAGC 401 OA8B8 201366_at ANXA7 AGCTCTGCCTTCCGGAATCC CTCTAAGTCTGCTTGATAGA 402 WG12H12 202954_at UBE2C CCCAGGCTGCCCAGCCTGTC CTTGTGTCGTCTTTTTAATT 403 SSA10B10 201984_s_at EGFR ATCTGTGTGTGCCCTGTAAC CTGACTGGTTAACAGCAGTC 404 XA2B2 201161_s_at CSDA GGGACAGACCTTTGACCGTC GCTCACGGGTCTTACCCCAT 405 LLA9B9 206173_x_at GABPB1 CTGTGGATGGTGCCATTCAG CAAGTAGTTAGTTCAGGGGG 406 LA2B2 207038_at SLC16A6 GACACAAGGAGGCAGAGGAG CTAACCCCTCTACTCCACTT 407 AAE10F10 202179_at BLMH AGACCTAATGCTCCTTGTTC CTAGAGTAGAGTGGAGGGAG 408 IIIA1B1 209567_at RRS1 TGCCTTCATTGAGTTTAAAG GGACAGGATTGCCCTTCCGT 409 NNNE10F10 209109_s_at TSPAN6 CGCCTACTGCCTCTCTCGTG CCATAACAAATAACCAGTAT- 410 TTA12B12 209260_at SFN GCATGTCTGCTGGGTGTGAC CATGTTTCCTCTCAATAAAG 411 SSG3H3 201729_s_at KIAA0100 ATGATTTGGCGATTCGAGTG GCTGCAGTACAGGATCTGAC 412 HHE10F10 209166_s_at MAN2B1 GCGCCCCCGTTACCTTGAAC TTGAGGGACCTGTTCTCCAC 413 LC6D6 201794_s_at SMG7 GACAAGCTAACCAGGTTTAC CATCTCACTCCCAGTAATAC 414 LLA4B4 208936_x_at LGALS8 AATCACCAATCAAGGCCTCC GTTCTTCTAAAGATTAGTCC 415 QQA2B2 204788_s_at PPOX CAATTCCTGACTGCTCACAG GTTGCCCCTGACTCTGGCTG 416 OOE2F2 204106_at TESK1 GTCTCAGGCCTCCAACTTTG GCCTTCAGGACACCCTGTAA 417 MG11H11 201849_at BNIP3 CAGTTTTCTGCTGAAGGCAC CTACTCAGTATCTTTTCCTC 418 TE7F7 203685_at BCL2 TTTCATTAAGTTTTTCCCTC CAAGGTAGAATTTGCAAGAG 419 HHHE11F11 205205_at RELB GATGTCTAGCACCCCCATCC CCTTGGCCCTTCCTCATGCT 420 XA10B10 203575_at CSNK2A2 GGGTATGCAGAATGTTGTTG GTTACTGTTGCTCCCCGAGC 421 MMG2H2 202022_at ALDOC GCCAGGGCCAAATAGCTATG CAGAGCAGAGATGCCTTCAC 422 OOC12D12 201817_at UBE3C GGGGGGAGGGGATCTAAATC CTCATTTATCTCTTCTATGT 423 NNC9D9 201236_s_at BTG2 GTGTTCTTGCATCTTGTCTG CAAACAGGTCCCTGCCTTTT 424 RG7H7 210022_at PCGF1 CTGATCACATGACAATGAAG CAGATATGGCTCTCCCGCTG 425 YYC12D12 201565_s_at ID2 CTGTGGACGACCCGATGAGC CTGCTATACAACATGAACGA 426 NE12F12 201186_at LRPAP1 AGGACCTCGATGTCCAGCTG CTGTCAGGTCTGATAGTCCT 427 SC7D7 204324_s_at GOLIM4 AAGGCCGAGAGGAACACTAC GAGGAGGAAGAAGAGGAGGA 428 KKA3B3 213370_s_at SFMBT1 GTATCAGCTTGCTCTCTTTG CACTTTCGGGGAAGGAGGAC 429 VG1H1 201270_x_at NUDCD3 AGAGTGAGGTGTCCAGCCTG CAAAGCTATTCCAGCTCCTT 430 NC10D10 204217_s_at RTN2 CTAATTACCTGAGCGACCAG GACTACATTTCCCAAGAGGC 431 RRC8D8 201707_at PEX19 AGATCATCTTTGAGTAGCAC TGTTTTGGGGCCCTCGGTCT 432 OOE12F12 201963_at ACSL1 GAGAGTACATGTATTATATA CAAGCACAACAGGGCTTGCA 433 UA8B8 203038_at PTPRK TTTTTCAGCCTGTGGCCCAG CACTGGTCAAGAAAACAAGA 434 RA5B5 205202_at PCMT1 GATGTCCTGTAAACACTCAG CTGTTCAGATTGGACATAAC 435 MME2F2 201924_at AFF1 GCTCTCAATGGGAAGATGTG CAACACAAATTAAGGGGAAC 436 HHA5B5 213772_s_at GGA2 CTTGTTGCACTGTTCCCAGG CGAGTGGCTGCCATGAGACC 437 YYC6D6 203773_x_at BLVRA ACTGGCTGCTGAAAAGAAAC GCATCCTGCACTGCCTGGGG 438 PPA6B6 202797_x_at SACM1L CAAAGACCAAATCTGAACTG CTAATGTGGCTGCTTTGTAG 439 PPE3F3 202431_s_at MYC CCACAGCATACATCCTGTCC GTCCAAGCAGAGGAGCAAAA 440 MMMG6H6 209367_at STXBP2 GCTCATCGTGTATGTCATGG GCGGTGTGGCCATGTCAGAG 441 RRE11F11 201361_at TMEM109 GAGGTGGATGTCCTTCTCTG CCAGGCTTGGCACATGATGT 442 MMME12F12 210788_s_at DHRS7 TACATGCCAACCTGGGCCTG GTGGATAACCAACAAGATGG 443 AAG8H8 203119_at CCDC86 CTTTCCCAAACCAGTCTCTG CAGAAGCCCCAGAGAATCTA 444 SSC8D8 1007_s_at DDR1 GCTTCTTCCTCCTCCATCAC CTGAAACACTGGACCTGGGG 445 OG7H7 203304_at BAMBI GGCACGGGAAGCTGGAATTC GTATGACGGAGTCTTATCTG 446 DDC2D2 201007_at HADHB TTTCAATAATCAGTTTACTG CTCTTTCAGGGATTTCTAAG 447 RRC7D7 201710_at MYBL2 CCCATTCTCATGTTTACAGG GGTTGTGGGGGCAGAGGGGG 448 NNE2F2 204729_s_at STX1A CATGTTTGGGATGGTGGCTC CTGTTGTCTTGCGCTCTGGG 449 IIE8F8 217398_x_at GAPDH CTGCCACCCAGAAGACTGTG GATGGCCCCTCCGGGAAACT 450 LA1B1 209899_s_at PUF60 TAGCCTCTGAGACTCATAAG GCCATCCAGGCCCTCAATGG 451 HHHC7D7 212660_at PHF15 GCAATAGAATGTATGGTCAC CTGGGTGTGGCCAGTGCCCG 452 CCCC5D5 206723_s_at LPAR2 GCAGCAGAGACTGAGGGGTG CAGAGTGTGAGCTGGGAAAG 453 TG2H2 202423_at MYST3 ATCCCCTGTGAATCAGAGTG CACAAGCACCTCTCCTGTGA 454 RE6F6 203570_at LOXL1 ACCAACAACGTGGTGAGATG CAACATTCACTACACAGGTC 455 UUE4F4 202738_s_at PHKB ACATCCTTGGCGGGGTTATG GACCTCTTGCATGTCATAGC 456 UUA4B4 221610_s_at STAP2 TTGGCCAGTCATCCTGAAGC CAAAGAAGTTGCCAAAGCCT 457 SSC4D4 204549_at IKBKE TCACCACTGCCAGCCTCAGG CAACATAGAGAGCCTCCTGT 458 VE7F7 203596_s_at IFIT5 GACTTAATTGGCATGGGGTG CAGTCCAGGCATCATGATTT 459 UUE11F11 218255_s_at FBRS ACCTCTTAATGGCTCAGTCC CCTTCACCCCATTTCCAAGT 460 PC2D2 201528_at RPA1 TCCCCTAAGGAAATCCGAGC GGCTACAAAGCGTTTCTTTA 461 IIG9H9 201738_at EIF1B CTGCCTTGTGAAATGATTCC CTGCAGTAAACGGACTTTTC 462 TG3H3 201146_at NFE2L2 CCTGCAGCAAACAAGAGATG GCAATGTTTTCCTTGTFCCC 463 RRG6H6 221081_s_at DENND2D ATTGATTTCTCAGGACTTTG GAGGGCTCTGACACCATGCT 464 TTC7D7 218529_at CD320 GCCCTGTGCTTAAGACACTC CTGCTGCCCCGTCTGAGGGT 465 KKKC10D10 218086_at NPDC1 CCTCGGATGAGGAGAATGAG GACGGAGACTTCACGGTGTA 466 HHHG8H8 219051_x_at METRN GACGCTGAGCTGCTCCTGGC CGCATGCACCAGCGACTTCG 467 JJJA7B7 201014_s_at PAICS AACATCTGCGCATAAAGGAC CAGATGAAACTCTGAGGATT 468 MMC7D7 200757_s_at CALU AGAGCCTCACACCTCACTAG GTGCAGAGAGCCCAGGCCTT 469 CCCE4F4 201212_at LGMN TCCAGGACCTTCTTCACAAG ATGACTTGCTCGCTGTTACC 470 XC3D3 212850_s_at LRP4 CTGGCGAGCCCTTAGCCTTG CTGTAGAGACTTCCGTCACC 471 WE12F12 201243_s_at ATP1B1 AAAGCTGTGTCTGAGATCTG GATCTGCCCATCACTTTGGC 472 PPE4F4 202696_at OXSR1 CCCCTTGTCCCTGGAGTAGG GACTAACTATAGCACAAAGT 473 IIA12B12 222217_s_at SLC27A3 GGCCGTTGCAGGTGTACTGG GCTGTCAGGGATCTTTTCTA- 474 NNA5B5 212795_at KIAA1033 CTGGAAACGAATTTAAATGG TGTCAAACTGCAGAGCAACA 475 MMMA1B1 212815_at ASCC3 CTGCCGCATAAACTATAAAT CTGTAAGGTGGTACACAGCG 476 JJC1D1 203512_at TRAPPC3 AAGCCACCCAGGTCTCATTC CTCCCTGCTGTTGGAGGCAA 477 TTC10D10 218948_at QRSL1 ATGCGCATGGCAAGAACTTG CCTTACCCCAGATTCTCTAT 478 XE10F10 209224_s_at NDUFA2 CCCTTTGAACAACTTCAGTG CTGATCAGGTAACCAGAGCC 479 JJA7B7 205811_at POLG2 TAGGAAGAGGCCCCACATTG GAACTAAGACAGGTTTGTCA 480 JJJE11F11 204608_at ASL CTCAAGGGACTTCCCAGCAC CTACAACAAAGACTTACAGG 481 LE6F6 209161_at PRPF4 TACAGTGAAGAAGACTTCAC CTCTTCCTATTGAGTTTGCT 482 JJJC12D12 205120_s_at SGCB CTCTTCAAGGTGCAAGTAAC CAGCCAGAACATGGGCTGCC 483 ZZC2D2 208634_s_at MACF1 ACCAGTAACTCTTGTGTTCA CCAGGACCCAGACCCTTGGC 484 YG4H4 202160_at CREBBP TTCTTGAATTCATGTACATG GTATTAACACTTAGTGTTCG 485 AAE7F7 201807_at VPS26A CAAAAGGGTCCATGTACCAC CATGTGCTGGAGCATCTGTT 486 ME4F4 205406_s_at SPA17 GCCTTCCGGGGACACATAGC CAGAGAGGAGGCAAAGAAAA 487 AAC2D2 214404_x_at SPDEF CCCCTGAGTTGGGCAGCCAG GAGTGCCCCCGGGAATGGAT 488 HHA6B6 57703_at SENP5 ATGCCCCGAGTGCGGAAGAG GATTTACAAGGAGCTATGTG 489 YA3B3 213720_s_at SMARCA4 GATGCATGTGCGTCACCGTC CACTCCTCCTACTGTATTTT 490 QQA4B4 212047_s_at RNF167 AGCTTCTCCCTTACCCACAC CTATCCTTTTGAGGGGCTTT 491 LLLG11H11 202083_s_at SEC14L1 CACCCAGCGGCGACATTGTA CAGACTCCTCTCACCTCTA- G 492 PPG11H11 203919_at TCEA2 CCGTTGACACAGCTTCTCTG GAGACCCTAGAAGGCGGCAT 493 QC6D6 200666_s_at DNAJB1 CTCTGTATAGGGCCATAATG GAATTCTGAAGAAATCTTGG
494 AAG5H5 203409_at DDB2 GTTAAAGGGCCAAAAGTATC CAAGGTTAGGGTTGGAGCAG 495 PPA4B4 202623_at EAPP GGAAGATGCTGCCGAGAAGG CAGAGACAGATGTGGAAGAA 496 LLE10F10 212955_s_at POLR2I CACGAAGTGGACGAACTGAC CCAGATTATCGCCGACGTGT 497 PPE1F1 202241_at TRIB1 CTAGAAACACTAGGTTCTTC CTGTACATACGTGTATATAT 498 QG6H6 203054_s_at TCTA CCCACCCACTAATACTACTG CACAGAGTCAGGATCTCACA 499 HHHA10B10 204514_at DPH2 GTTCAGACAGCCACATGAGG GGACAGTGCAGCTACAGGAT 500 KKKC3D3 208872_s_at REEP5 AATTAAAGCTATAGAGAGTC CCAACAAAGAAGATGATACC 501 NNG8H8 201125_s_at ITGB5 TGAGTCCTGAGACTTTTCCG CGTGATGGCTATGCCTTGCA 502 JJJE7F7 201127_s_at ACLY GGGGTACAGGCACCGAAGAC CAACATCCACAGGCTAACAC 503 OG9H9 201558_at RAE1 GGGTTGAGGTTATTGTAGAC GTTAGATTGCGGGCACCGCC 504 KKE8F8 201664_at SMC4 GGTTTACCAGGATGTAGTCC CACTGTTGAGGAGCATCTAT 505 SA1B1 203026_at ZBTB5 TGCCTCTCCACTGCTAGATG GAACCTGGAATCTCTCATCT 506 KKA6B6 202025_x_at ACAA1 AATGAGCTGAAGCGCCGTGG GAAGAGGGCATACGGAGTGG 507 MMG3H3 204978_at SFRS16 CAAGATCCGCATGAAGGAGC GGGAACGCCGAGAGAAGGAG 508 AAG1H1 202732_at PKIG ACCTCTGCCCTGTCCACCAG GATAAGTGACACCTAGGACC 509 LLA12B12 205667_at WRN AAATCAGCCTTCCGCAATTC ATGTAGTTTCTGGGTCTTCT 510 NG1H1 202038_at UBE4A CATGCCAGAGGCTGATGCTG CACTGTTGATGTCATGTGAG 511 HHA4B4 89476_r_at NPEPL1 AGGACCCTCTGCTGAACCTG GTGTCCCCACTGGGCTGTGA 512 KKKG3H3 208950_s_at ALDH7A1 CCTAAAGGATCAGACTGTGG CATTGTAAATGTCAACATTC 513 RRG3H3 218788_s_at SMYD3 ATGCGACGCCAACATCAGAG CATCCTAAGGGAACGCAGTC 514 JJE8F8 209045_at XPNPEP1 AGATGCCCCGACTTCTTTGG CCAGTGATGGGGAATCAGTG 515 LLG2H2 219459_at POLR3B CCTGGCTTTTGTCGTGGTGG CTGGCTCGGATAAATTTTCC 516 QQG9H9 206050_s_at RNH1 CTGGCTCTGTGCTGCGGGTG CTCTGGTTGGCCGACTGCGA 517 LLG10H10 218064_s_at AKAP8L GCAAGAAGCTGGAGCGCTAC CTGAAGGGCGAGAACCCTTT 518 HHHE7F7 202185_at PLOD3 TGAATATGTCACCTTGCTCC CAAGACACGGCCCTCTCAGG 519 WWE4F4 201145_at HAX1 CTCAGGGGCTTGGATATGTG GAATAGTGAACTGGGGCCAT 520 PPG6H6 202812_at GAA AATAAGATTGTAAGGTTTGC CCTCCTCACCTGTTGCCGGC 521 VC9D9 202125_s_at TRAK2 ATGCATGCAGACCTGTACTC CACATGCAACCCAACAGCAG 522 WA3B3 202927_at PIN1 CCGAATTGTTTCTAGTTAGG CCACGCTCCTCTGTTCAGTC 523 MMG12H12 203306_s_at SLC35A1 ACTCGGACAATTTCTGGGTG GTGACTGAGTACCCCTTTAG- 524 PG11H11 203727_at SKIV2L ACATCGTATTTGCGGCCAGC CTCTACACCCAGTGAATGCC 525 KKC11D11 202829_s_at VAMP7 ATGGTACCTGTTCTTCTATC CAAACCTTTCAATTCATGCT 526 KKC8D8 201513_at TSN ACTTAAGTGGCTAAAGAGAT GAGACAAACATGCAGGTCGC 527 EEA10B10 220964_s_at RAB1B CCCCTCTGGTGTCATGTCAG GCATTTTGCAAGGAAAAGCC 528 LLE5F5 203897_at LYRM1 GGTAGAGTCAGGTGAGAGTC CCTTGGTGAGTCATTTGTAC 529 AAA9B9 203573_s_at RABGGTA GCCCTGCCCCCTACCCTTGC CCTTTAACTTATTGGGACTG 530 TTE1F1 204089_x_at MAP3K4 CATTACTACTGTACACGGAC CATCGCCTCTGTCTCCTCCG 531 MMMG2H2 219076_s_at PXMP2 TCCGGGTGCTCTTCGCCAAC CTGGCAGCTCTGTTCTGGTA 532 MMC5D5 212648_at DHX29 ACGTCTTCTTTCTATTGATG GCTGGATCTATTTTCAGGCC 533 ZZA9B9 212614_at ARID5B GTTGGCTGTTAGTGTATTTG ATATTCTGCCTGTCTCCTCA 534 FFFC2D2 210986_s_at TPM1 CAGCTCATGACAATCTGTAG GATAACAATCAGTGTGGATT 535 OOG1H1 203616_at POLB GGAAATACCGGGAACCCAAG GACCGGAGCGAATGAGGCCT 536 AAA11B11 202491_s_at IKBKAP TTCCACTCATTCCTGTTGTC CTACCACCCCTTGCTCTTTG 537 QQC9D9 212500_at ADO GTGTGCATAAACTGTTAGTC GTGACTGACTTGGTGTGTTG 538 EEEC11D11 202720_at TES TACTTCCAAGCCTGTCCATG GATATATCAAATGTCTTCAC 539 HHG10H10 214259_s_at AKR7A2 TGAAAGGTGGGGGGTGAGTC CCACTTGAGCGCTTCCTGTT 540 TG11H11 201594_s_at PPP4R1 TCTTCACATACTGTACATAC CTGTGACCACTCTTGGGAGT 541 PA6B6 217933_s_at LAP3 ACCAACAAAGATGAAGTTCC CTATCTACGGAAAGGCATGA 542 UG3H3 202868_s_at POP4 AGCCAATTCCATTTATAGAC CACCTCCAGCCAGTGACGCT 543 IIA4B4 202949_s_at FHL2 CCAGGCAATCTTGCCTTCTG GTTTCTTCCAGCCACATTGA 544 UC9D9 209341_s_at IKBKB TTTGTTGGAGAAGAAAGTTG GAGTAGGAGACTTTCACAAG 545 ZZG4H4 201811_x_at SH3BP5 GATTTATTCTAAGAGAAGTG CATGTGAAGAATGGTTGCCA 546 YYC9D9 204143_s_at ENOSF1 ACCGATCAAGATGAGTTCAG CTAGAAGTCATACCACCCTC 547 UUE7F7 217931_at CNPY3 AAACTCACCATCCCTCAGTC CTCCCCAACAGGGTACTAGG 548 MG10H10 209100_at IFRD2 GGAGACTTTCTATGCCCTTG GTCCGTATTTTTAACAGAAG 549 ZA3B3 201466_s_at JUN TGCGATGTTTCAGGAGGCTG GAGGAAGGGGGGTTGCAGTG 550 VE5F5 202830_s_at SLC37A4 GGCCATCATTCTCACTGTAC CACTAGGCGCAGTTGGATAT 551 ZZC8D8 218910_at ANO10 TGAGTGAGCCACCAGCTCTC CACGTTCCCCTCATAGCAGT 552 SSA12B12 203530_s_at STX4 GACAGTTCTTCTGGGGTTGG CAGCTGCTCATTCATGATGG 553 LLE7F7 203562_at FEZ1 GCGGGGTCCTTTGCCGTTGG CTTCTAGTGCTAGTAATCAT 554 NE11F11 209364_at BAD GGCGGAAGTACTTCCCTCAG GCCTATGCAAAAAGAGGATC 555 PPG9H9 203405_at PSMG1 TTGTCCATTGCTAGAACAAC CGAATATAGTACACGACCTT 556 JJE2F2 203885_at RAB21 GTTCAGTGGTATGAGCAGAG GAAGAGATCCCAGATAGTAG 557 NNE6F6 219170_at FSD1 AAGCGAGGCAGTGCTACCAG CAGCTCCAACACCAGCCTCA 558 UE8F8 207939_x_at RNPS1 CGTTCATGGTGGTCTTTCAG GTTATCTTGGCAACATGTAC 559 MMMG5H5 221492_s_at ATG3 GTGATGAAGAAAATCATTGA GACTGTTGCAGAAGGAGGGG 560 HHC3D3 210719_s_at HMG20B GACCCTGGTGGGGGTGGCTC CTTCTCACTGCTGGATCCGG 561 HHE8F8 204605_at CGRRF1 AGAATGGGACTGTGAACTGG GTACTCTTACCATGCAGACA 562 PPC2D2 218450_at HEBP1 ATAGACCAGAAAAATCCTGG CAGCTTTTCTCCAGGCATCT 563 ZG2H2 212049_at WIPF2 TCTCAGTCCCTGGCCATGTG GTCAAGGTGGCTTTCTGTTA 564 PPC11D11 203848_at AKAP8 GCCCTGCTGTGTCAGTTTCC CTGTGGCCTTTTGAACTGTA 565 NNA2B2 204587_at SLC25A14 ACTTGGGCTAGAGCAGAAGG CATAGGCCAGGGTGGTTATT 566 BBBE8F8 204418_x_at GSTM2 TCTCCCGATTTGAGGGCTTG GAGAAGATCTCTGCCTACAT 567 YC1D1 203047_at STK10 TTCTCTTCAGGAAGAAAAAG CATCAGGGGGAAATGGAATG 568 IIC2D2 205451_at FOXO4 GTGTCAGCGCCTGGCCTACC CAGATTGTATCATGTGCTAG 569 PE11F11 203346_s_at MTF2 ACGTCGGGTGACACTTGATG GAAAGGTGCAGTATCTTGTG 570 OOE6F6 218571_s_at CHMP4A GGCTCCCTTCTCTTTGATAG CAGTTATAATGCCCTTGTTC 571 RG9H9 203241_at UVRAG GGTGTCTGGTAGGCAAACTG CAAGGCAGTTGAGATAGTTG 572 OOG11H11 201695_s_at NP GATGCCCAGGATTTGACTCG GGCCTTAGAACTTTGCATAG 573 RE8F8 203764_at DLGAP5 TTTCCTTCATATTATCAATG CTTATATATTCCTTAGACTA 574 NNG10H10 201631_s_at IER3 CTTTGTGGGACTGGTGGAAG CAGGACACCTGGAACTGCGG 575 SSG5H5 214221_at ALMS1 GGTGATTAAAATTCCTAATG GTTTGGGAGCAATACTTTCT 576 JJG12H12 219742_at PRR7 GCTTGGCGTCTGCCGGTCTC CATCCCCTTGTTCGGGAGGA 577 LE12F12 202016_at MEST TGATTCCTTTATGATGACTG CTTAACTCCCCACTGCCTGT 578 WA11B11 202108_at PEPD GCTTCGGCATTTGATCAGAC CAAACAGTGCTGTTTCCCGG 579 MMA8B8 201074_at SMARCC1 GGAGTCCGAGAAGGAAAATG GAATTCTGGTTCATACTGTG 580 PE6F6 202780_at OXCT1 CCACATGGTTAAATGCATAC CTTCCCAGTACTGGGGGGAA 581 HHHG11H11 209253_at SORBS3 CTAGCCTGGCTCAAATATTC CCCAGGGAGACTGCTGTGTG 582 NE6F6 203256_at CDH3 TACAGTGGACTTTCTCTCTG GAATGGAACCTTCTTAGGCC 583 PC8D8 208398_s_at TBPL1 AGCAGAGCTGTCACAGTGTG CACTACCTTAGATTGTTTTA 584 OOE10F10 201519_at TOMM70A TCTCCCTTCTTTCATCTTGG GGTTGGGTAGAGAAACACAA 585 LA10B10 217745_s_at NAT13 ACTATGTTAGTTGCATTTAG GTTTTAAAGCAAAGAATCTG 586 ZA11B11 210811_s_at DDX49 AGGAGATCAACAAACGGAAG CAGCTGATCCTGGAGGGGAA 587 NNC11D11 201887_at IL13RA1 GGTCTTGGGAGCTCTTGGAG GTGTCTGTATCAGTGGATTT 588 PPG3H3 202447_at DECR1 ACCAAGGAGCAGTGGGACAC CATAGAAGAACTCATCAGGA 589 SC12D12 202749_at WRB GAAATGTTTAGGGACATCTC CATGCTGTCACTTGTGATTT 590 IIE6F6 204285_s_at PMAIP1 CCGCTGGCCTACTGTGAAGG GAGATGACCTGTGATTAGAC 591 KKA10B10 201036_s_at HADH GAATGGGTCAGCATATCTCT GTTTGCATGGTTTGCAGGAG 592 NNE3F3 207877_s_at NVL CGGCAGAGAATCCCCCACAC GCTCTGAAGGACCCACTTTC 593 RRG7H7 203806_s_at FANCA GGAACCCACAGACCTCACAC CTGGGGGACAGAGGCAGATA 594 RRG12H12 201819_at SCARB1 CACTGCATCGGGTTGTCTGG CGCCCTTTTCCTCCAGCCTA 595 OG12H12 201709_s_at NIPSNAP1 CTGTTCCCTCACCCTGTATC CTGTCTCCCCTAATTGACAT- 596 OOC7D7 221741_s_at YTHDF1 TGAGTTGAAGCATGAAAATG GTGCCCATGCCTGACGCTCC 597 KKE10F10 202916_s_at FAM20B CAATTCCTCAAGTCTGGGTG GTGACAAGGTAGGGGCTAGG 598 SG4H4 202148_s_at PYCR1 GGTTTCCAGCCCCCAGTGTC CTGACTTCTGTCTGCCACAT 599 LC1D1 218316_at TIMM9 CAGTAGCCACCATGTTCAAC CATCTGTCATGACTGTTTGG 600 QQC10D10 212894_at SUPV3L1 CCAGCCCCGATGCAGGAGAG CTGTCCCTTGCTTCCAGATT 601 QQA12B12 215903_s_at MAST2 GCCAAGAACCAGGGGGCCAT CAAAAGCATCGGGATTTGGC 602 PPG8H8 203285_s_at HS2ST1 TGCAGTGGCTGAACAAAGAG CATGGCTTGAGAATCAAAGG 603 SE4F4 203594_at RTCD1 AAACAGGACCAGTTACACTC CATACGCAAACCGCGATACA 604 UUA2B2 219384_s_at ADAT1 TACTACCTAGAGAAAGCCAG CAAAGAATGAAGGCAACAAA 605 SSE9F9 201825_s_at SCCPDH ATTGATGCTGCCTCATTCAC GCTGACATTCTTTGGTCAAG 606 RC5D5 204168_at MGST2 CCTAGGTGCCCTGGGAATTG CAAACAGCTTTCTGGATGAA 607 AAAA6B6 221227_x_at COQ3 AGAAACAGAAGAGCTCCAAG CTAATGCCTGCACCAATCCA 608 UUC2D2 219390_at FKBP14 TAGGACTTAAGCTGATGAAG CTTGGCTCCTAGTGATTGGT 609 YG8H8 202184_s_at NUP133 AGTTCTTGTCCTGGTTCTAG CTGCTCACATGTACAAATCA 610 VE2F2 202521_at CTCF ATATGTAATGGGGTTGAAAG CTGGGGAGGAGGATCTACTG 611 MMMC2D2 209215_at MFSD10 TCAGTGACTCCGAGCTGCAG CACTCCAAGGCTGTCAGGGC 612 OOE8F8 201174_s_at TERF2IP CCTTCTCAGTCAAGTCTGCC GGATGTCTTTCTTTACCTAC 613 PG1H1 217758_s_at TM9SF3 ATCTGTTCAGGTTGGTGTAC CGTGTAAAGTGGGGATGGGG 614 LLC7D7 212453_at KIAA1279 CCTTGTAAGAAAAAATGCTG GGTAATGTACCTGGTAACAA 615 NNNE9F9 218435_at DNAJC15 CAAGGCTAAGATTAGAACAG CTCATAGGAGAGTCATGATT 616 TTC11D11 209911_x_at HIST1H2BD CCACCCAAATCCAACTCATC CTGGTTTGCTGCACACTG- GT 617 BBBE10F10 212115_at HN1L GGGAGAAGAAGAGTTCCTGC GCATGCAAGCCCTGCTGTGT
618 KKA7B7 217995_at SQRDL GCTAAGGGGTTACTGGGGAG GACCAGCGTTTCTGCGCAAG 619 LLLC5D5 210058_at MAPK13 CCTTCCTTGGCTCTTTTTAG CTTGTGGCGGCAGTGGGCAG 620 IIC5D5 218642_s_at CHCHD7 TTGCAGGATGAGTTGGGCAG GGAAAAGGGTCAGGGTTCAT 621 ZC5D5 204000_at GNB5 GCCCAGCCCTTCTTCTAGTG GTAGCTCTGGCTTTGCAGGC 622 MMA4B4 208249_s_at TGDS TGATTCGGACAACCATGAGG GGTAGTGGTGCTAGGGAGAA 623 FFFC8D8 218068_s_at ZNF672 AGGCCAAAACCATGTGGGTG CACAAAGCCAGGCACTGCCA 624 AAAC10D10 217901_at DSG2 CAAAGGATTTATATAGTGTG CTCCCACTAACTGTACAGAT 625 YYA6B6 213419_at APBB2 GAACTAACGCTGCGTCCTTG GAATGAATGATGCGTGAGTT 626 MC2D2 202683_s_at RNMT ATTCCCTTCCAGTTAACTAC CTCTCCAAGGGAAACCACTA 627 PPA10B10 203456_at PRAF2 TGCCCCTCACCCCAATGTTC CACACCATCGACAACCAAGG 628 PG5H5 201266_at TXNRD1 TCACGTCCTCATCTCATTTG GCTGTGTAAAGAAATGGGAA 629 SSG1H1 202261_at VPS72 GAAGTACATTACTGCCCATG GACTGCCGCCCACTGCCTCA 630 QQE8F8 209460_at ABAT CAGCAGAAGCTGGTAAAAAC ATGGGGAGCCCGGAGGACAG 631 RC9D9 213390_at ZC3H4 TGTGGATGAAATAGAAGCTG GAGCCCTCCTCTTGGAATAT 632 HHHG4H4 205036_at LSM6 ATCAGTACACAGAAGAGACG GATGTGAAGACACCAAGAGA 633 JJE4F4 204937_s_at ZNF274 GCCTTTTCAGCTTGACCCTG CAATATAACATGCACAGGCC 634 MMMA4B4 212624_s_at CHN1 TGCGTCCTGGGTAGTCTGTG CTTGTAATCCAGCATGTTTC 635 SE9F9 218350_s_at GMNN CCTCCACTAGTTCTTTGTAG CAGAGTACATAACTACATAA 636 JJA3B3 204484_at PIK3C2B ATAACTGGAGAAAGAAGCTC CATTGACCGAAGCCACAGGG 637 PPC1D1 202230_s_at CHERP AATCGGCCACACCTGGTGTC CATGGGCAGCCTGGTGCAAT 638 QQE1F1 204617_s_at ACD CCTTCCAGTATGAGTATGAG CCACCCTGCACGTCCCTCTG 639 KKE6F6 202761_s_at SYNE2 TTGAGCTGCCGGTTATACAC CAAAATGTTCTGTTCAGTAC 640 MMC10D10 202756_s_at GPC1 TCAGGAGCCCCCAACACAGG CAAGTCCACCCCATAATAAC 641 RRA10B10 204808_s_at TMEM5 TTGCTCCTATGGCTCCATTC CTGTGGTGGAAGACGTGATG 642 JJE6F6 205450_at PHKA1 CCTAATCACTCCAACCCTGC CCCTTTCTGTCCCATCCTTC 643 XG10H10 201875_s_at MPZL1 CTTTCCTGGTTGCAGATAAC GAACTAAGGTTGCCTAAAGG 644 KKKA12B12 221482_s_at ARPP19 GAAAGATTTGTATCTCTGTG CTTGAACTTGAATGGCCTTA- 645 KKA11B11 202598_at S100A13 AAATCAGGAAGAAGAAAGAC CTGAAGATCAGGAAGAAGTA 646 JJG11H11 218215_s_at NR1H2 CTTGCCTGACCACCCTCCAG CAGATAGACGCCGGCACCCC 647 XG6H6 202689_at RBM15B CACTAAGGACATTGGGCAAG CTAGAAGAAGAACACATGGT 648 OOC3D3 218050_at UFM1 CCCCGTTTCTTACAATAAAT GTTGAGTCTTAGTTAAGCAG 649 IIIC6D6 205963_s_at DNAJA3 TGGTAGCATGTCGCAGTTTC CATGTGTTTCAGGATCTTCG 650 IIIA5B5 201561_s_at CLSTN1 CCCTGACTGCTAGTTCTGAG GACACTGGTGGCTGTGCTAT 651 RC8D8 201899_s_at UBE2A GCTGACTGGGCACACTCATG CCAAGTTTCAGAATTATTGG 652 UUA7B7 219127_at ATAD4 CAAGTCACACACCCTCAAAG GGAAGCTACACGGGCCAAAT 653 MMC11D11 202811_at STAMBP GGGTGAGGGACAGCTTACTC CATTTGACCAGATTGTTTGG 654 ZZG6H6 208847_s_at ADH5 ATCCTGTCGTGATGTGATAG GAGCAGCTTAACAGGCAGGG 655 NNG4H4 212485_at GPATCH8 CAAACACAACTCTTGACTGC CCTCCCACCCTCCTACCTGT 656 RRA4B4 218852_at PPP2R3C GCTTCTGGACTTACGAGAAC AGAGAGGCTCTTGTTGCAAA 657 MA12B12 221732_at CANT1 GTGGCTGAATTGAGACCTTG CTGATGTATTCATGTCAGCA 658 UUE6F6 218780_at HOOK2 CCTGGCATCTCTGAACCTTC GCCCCACTGACAAGCACTGA 659 HHG12H12 217870_s_at CMPK1 TCATCAGGTATCTTTCTGTG GCATTTGAGAACAGAAACCA 660 HHA8B8 203709_at PHKG2 TGAAGAGGAGGGAGACTCTG CTGCTATAACTGAGGATGAG 661 JJG9H9 209724_s_at ZFP161 GGGGCAGTACCAGTCCATAC CAGCTGCGATTTGTGAGTGG 662 ZZA3B3 202889_x_at MAP7 ACTTCCATGTACAACAAACG CTCCGGGAAATGGAAAGCCA 663 TTA11B11 218809_at PANK2 CAGTTGACTGGTTTTGTGTC CTGTTTGAACTTGCTGAATG 664 LG11H11 201489_at PPIF CAATGTGAATTCCTGTGTTG CTAACAGAAGTGGCCTGTAA 665 IIC10D10 201767_s_at ELAC2 CCCTGCACACCAGAGACAAG CAGAGTAACAGGATCAGTGG 666 LLC10D10 212070_at GPR56 TTGCTGGCCTGTTGTAGGTG GTAGGGACACAGATGACCGA 667 NNNA9B9 200929_at TMED10 CTAAGGCATCCTACCAACAG CACCATCAAGGCACGTTGGA 668 AAAC2D2 220094_s_at CCDC90A GAAATAGTGGCATTGCATGC CCAGCAAGATCGGGCCCTTA 669 OOA5B5 212833_at SLC25A46 TCAGAGACAACATCCTTGTC CATATCCAAACCCAGTGTTT 670 YE2F2 202371_at TCEAL4 CTTTTGACCTATCTGCAATG CAGTGTTCTCAGTAGGAAAT 671 RRG1H1 218249_at ZDHHC6 CTGGTTAAGATGTTCTTTTC CTCAAAGGTGCCCTAGTGCC 672 PPE9F9 203395_s_at HES1 TCCCTCCGGACTCTAAACAG GAACTTGAATACTGGGAGAG 673 IIE4F4 205562_at RPP38 GGCTCAGTGAGAGAATCGCC CCCGTCATTGGCTTAAAATG 674 QQG5H5 205750_at BPHL GGTGGTTCCTTCGTGTGGGG CTTGATCGTGTTGCTGCCTG 675 JJC11D11 212871_at MAPKAPK5 GTGATAGAAGAGCAAACCAC GTCCCACGAATCCCAATAAT 676 HHC6D6 201620_at MBTPS1 TCTTCTGACTGCAGGGGAAG GATGTACTTTCCAAACAAAT 677 UC7D7 202996_at POLD4 GAGGCACCACGTAAGACCTC CTGCCCTTAGCTCTCTTGCT 678 IIIG12H12 218826_at SLC35F2 CAAAGAGTATGCCTGGGAGC CTCCAGCTGTTAAAAGACAA 679 RC10D10 202626_s_at LYN GGGATCATCTGCCGTGCCTG GATCCTGAAATAGAGGCTAA 680 GGE5F5 218397_at FANCL TCTTGGTATAAATACACTTC CACAGTCAGCACGGGGATCA 681 HHC2D2 201548_s_at KDM5B TCAGCAAAGCTACAGGACTG GTACTCAAGCCAGCCTGTAA 682 YE5F5 213689_x_at FAM69A CACACGTATACTCAGATTTG GCATGTACCTTTCAACATCT 683 VG8H8 201223_s_at RAD23B CCCCTTCCCTCAGCAGAAAC GTGTTTATCAGCAAGTCGTG 684 BBBC12D12 203627_at IGF1R AAGCAGTCAATGGATTCAAG CATTCTAAGCTTTGTTGACA 685 MMMG1H1 217867_x_at BACE2 TATTAAGAAAATCACATTTC CAGGGCAGCAGCCGGGATCG 686 UG2H2 204952_at LYPD3 CTTCTCATCCTTGTCTCTCC GCTTGTCCTCTTGTGATGTT 687 KKG7H7 221449_s_at ITFG1 GGAAAAGAAAGCAGATGATA GAGAAAAACGACAAGAAGCC 688 MMA12B12 203124_s_at SLC11A2 TTGGCTCCCTTGAGGTTCTG CTAGTGGTGTTAGGAGTGGT- 689 EEE10F10 202362_at RAP1A AATATGATTATACAAAAGAG CATGGATGCATTTCAAATGT 690 MMME7F7 212449_s_at LYPLA1 TAATAAAGGCTAGTCAGAAC CCTATACCATAAAGTGTAGT 691 VVC12D12 209015_s_at DNAJB6 GCCGTTCATGTTGCTTTCTC CTTTGTCCTCTTGGACTTGA 692 MMC4D4 209662_at CETN3 ATGGAGAAATAAACCAAGAG GAGTTCATTGCTATTATGAC 693 CC5D5 200618_at LASP1 GGGGTTGTTGTCTCATTTTG GTCTGTTTTGGTCCCCTCCC 694 DDA9B9 217971_at MAPKSP1 TACATTGATCCACTTGAGCC GTTAAGTGCTGCCAATTGTA 695 LE9F9 218595_s_at HEATR1 AGTGCCAAAAGACTATTCAG CAACTGGAAACTGTCCTGGG 696 KKA9B9 201735_s_at CLCN3 GTCTCGAAGGAAGCGAGAAC GAAATCTCTCATTGTGTGCC 697 QQC11D11 213531_s_at RAB3GAP1 GGAGCTCAAGATGTCTTGTG TCTGTGTGGCTAGATGGCC- T 698 SSG11H11 203447_at PSMD5 AAATTATTTTAAAGTGACTG GAATTATCTAGTCCCCAGAT 699 HHHC6D6 212345_s_at CREB3L2 GGTTTTAGCTCTGTTCTCTG CTCCCATCCTTCGCTCACCA 700 JJG8H8 209179_s_at MBOAT7 CCCTGGGCAGTGGGTTTTGG GCAAATTCCCTTTCTTTGCA 701 JJE3F3 202093_s_at PAF1 GTGATGCTGATTCTGAGGAC GATGCCGACTCTGATGATGA 702 UUG3H3 219363_s_at MTERFD1 TTTGTGCACAATGTGATGAG CATTCCCCACCACATCATTG 703 WWA8B8 203094_at MAD2L1BP GATTTCCTGATAGGCTGATG GCATGTGGCTGTGACTGTGA 704 MC3D3 202458_at PRSS23 TGACACAGTGTTCCCTCCTG GCAGCAATTAAGGGTCTTCA 705 HHA10B10 202708_s_at HIST2H2BE AGTGATTCAGCTGTTTTTGG CTAAGGGCTTTTGGAGCT- GA 706 OE5F5 202847_at PCK2 AGTCTAGCAAGAGGACATAG CACCCTCATCTGGGAATAGG 707 IIIG3H3 201331_s_at STAT6 GCTGCATCTTTTCTGTTGCC CCATCCACCGCCAGCTTCCC 708 MMA6B6 218961_s_at PNKP AAGGCTTCTCTGCCATCCTG GAGATCCCGTTCCGGCTATG 709 TTA2B2 211015_s_at HSPA4 GGCAGATAGACAGAGAGATG CTCAACTTGTACATTGAAAA 710 QE1F1 212231_at FBXO21 CTCCAGGAAGCCTGTATCAC CTGTGTAAGTTGGTATTTGG 711 TTE11F11 215497_s_at WDTC1 CCGAGCCTTTTTGTTGCTCC GCTCCCAGGAGAGTGAGGGT 712 RRC4D4 219016_at FASTKD5 CTCGGCTTGGCTACCGTGTG GTAGAGTTATCCTACTGGGA 713 LLA2B2 218542_at CEP55 TGTTCCCCAACTCTGTTCTG CGCACGAAACAGTATCTGTT 714 OOG5H5 218358_at CRELD2 GATGTCCCGTGGAAAATGTG GCCCTGAGGATGCCGTCTCC 715 SC11D11 209586_s_at PRUNE CCTACCCCACAGCTCTGTTC CATGTAAGTTGCCAACAGTT 716 FFFC1D1 218113_at TMEM2 ATGGCCTCTACCTTTGTATC CAGGAGAAACTGCAGAGCAG 717 TTA8B8 220661_s_at ZNF692 ACTGGGCTGTAGGGGAGCTG GACTACTTTAGTCTTCCTAA 718 VE6F6 209394_s_at ASMTL CATGCTGGTGCAGACTGAAG GCAAGGAGCGGAGCCTGGGC 719 PE7F7 202109_at ARFIP2 TTGCTGCCCTGTCTATCTTC CTGGCCACAGGGCTTCATTC 720 MG5H5 202528_at GALE AGGCTCTGGCACAAAACCTC CTCCTCCCAGGCACTCATTT 721 LLG11H11 201870_at TOMM34 GTTTTTTGTTCCAACAGTGG CCTTCTCCGGGCTTCATAGT 722 BBBC7D7 210473_s_at GPR125 GGACCAATTAAAAGCAATGG GCAGGAGGGACCCTTGCTCG 723 IIIC9D9 218744_s_at PACSIN3 GGCTGAGGGCAAGATGGGAG GTCAGAGGTGACAGAAGCGT 724 WC1D1 1053_at RFC2 TACAGGTGCCCTATTCTGAG GTACAGGAGCCGCGGCTTTC 725 JJE11F11 217809_at BZW2 ATGGAGCCCTGAGGCATCAG CTATTATACTTGGGACTCTA 726 TTE8F8 219270_at CHAC1 ACAGGCCCTGGCAACCTTCC CAGTCTGTCCCATACTGTTA 727 KKE7F7 219082_at AMDHD2 TCGACGACTCCCTTCACGTC CAGGCCACCTACATCTCGGG 728 YG7H7 201968_s_at PGM1 CATGCCCTCCTGCATTGCTG CTGCGTGGGTATTTGTCTCC 729 SE3F3 202722_s_at GFPT1 GCAGTGTATGCTCATACTTG GACAGTTAGGGAAGGGTTTG 730 QQG4H4 205251_at PER2 CTCTCAGAGTTTCTGTGATG ATTTGTTGAGCCTTGCTGGA 731 UUG7H7 201416_at SOX4 GCACGCTCTTTAAGAGTCTG CACTGGAGGAACTCCTGCCA 732 OOG10H10 201531_at ZFP36 CTCAAATTACCCTCCAAAAG CAAGTAGCCAAAGCCGTTGC 733 JJJE5F5 203336_s_at ITGB1BP1 CTGAAGACCACAGATGCAAG CAATGAGGAATACAGCCTGT- 734 FFFE1F1 212282_at TMEM97 CCATATTGGCCCGATTAGTG GTACTGTCTGACTCACGTGT 735 KKA5B5 213995_at ATP5S TGTGCAAGTGTCATTATATC GAGGATGACTGTTTGCTGAG 736 AAA4B4 213918_s_at NIPBL GGAGTCAACGTATTTCGCAG CGTATTACGTAAAATGATTT 737 PPC7D7 202854_at HPRT1 ACTATGAGCCTATAGACTAT CAGTTCCCTTTGGGCGGATT 738 KKA1B1 221549_at GRWD1 GAGGTGTGGGTTCCTCCAAC ACAATTTGCTTCTGCCCGTT 739 LLLA3B3 202900_s_at NUP88 CCATTATTCTCAGTGCCTAC CAGCGAAAGTGCATTCAGTC 740 NA2B2 201673_s_at GYS1 GCCCACTGTGAAACCACTAG GTTCTAGGTCCTGGCTTCTA
741 RE5F5 217777_s_at PTPLAD1 AGGCTCAGCCCACCCCAACC CTATCTCATGTTCAGTCTGT 742 MME1F1 200843_s_at EPRS TCAAACCACTCTGTGAACTG CAGCCTGGAGCCAAATGTGT 743 RRE1F1 218175_at CCDC92 GGCACCGATCACCGAGCAGC CGTGCGTGTATCTCAAGGAA 744 HHG11H11 204711_at KIAA0753 GGCTCAGTGAAGGAAACATG CAGAAAGAATGCCTGAGACG 745 NA11B11 218001_at MRPS2 TCAATCTAAATGCCTTTCAG GTGGGCCGCTTCCTTGGCTA 746 PPA11B11 203775_at SLC25A13 CAGACAGAAAAAACTGAGAT GTAGCCCCTCTCCTGGAAGT 747 QQE6F6 205895_s_at NOLC1 GGGAACCCTCAGGTCTCTAG GTGAGGGTCTTGATGAGGAC 748 HHHG12H12 209262_s_at NR2F6 TAGCATGAACTTGTGGGATG GTGGGGTTGGCTTCCCTGGC 749 IIIE8F8 218828_at PLSCR3 CTGCCTTCAGCTGGTGCTTG CTGCGATTCCTGTGCCTTAT 750 AAAC11D11 203303_at DYNLT3 GAGCGGAACCATAACTCATT GAATTTTGGAGAGGAATAAG 751 TTE3F3 216913_s_at RRP12 CCTGGACTCAGGATGACTTG GAACTAGGGCTTGGCTCTCA 752 OOA11B11 201572_x_at DCTD AGCTTACTGCAGCACTGTTG GTGTTCGGAGCTCTTCTGTG 753 MMA10B10 202734_at TRIP10 GGACCTATGCACTTTATTTC TGACCCCGTGGCTTCGGCTG 754 OE1F1 203258_at DRAP1 GAAGATTACGACTCCTAGCG CCTTCTGCCCCCCAGACCAT 755 GGA6B6 217734_s_at WDR6 TTGTAGTAGGAGCTGAAATC CATGCTGAGCTGTACCAGGA 756 XC10D10 203905_at PARN TTGAAACAGATCACAGCAAC GACAAACGCTCATGGCGCTG 757 ME7F7 218577_at LRRC40 ATTGACTTGAATATGACTAG CCAGTTTCTATGTTTTTGTT 758 BBBG7H7 209409_at GRB10 ACAGTATGACCGATCTCTGC GCCTTTCTGGGGGCGGGCAA 759 NG11H11 201098_at COPB2 TCCTACTCCGGTTATTGTGG CCTCCCACACAGCCAACAAA 760 TTC3D3 216321_s_at NR3C1 GTCCACCCAGGATTAGTGAC CAGGTTTTCAGGAAAGGATT 761 VA10B10 201995_at EXT1 AGAAATACCGAGACATTGAG CGACTTTGAGGAATCCGGCT 762 JJC3D3 204742_s_at PDS5B TGCTGCAGTGCAACAGGAGG CTTTTTCAGTGATCTTCACT 763 SSE2F2 212180_at CRKL CAGGAGGAACAGTGGCCTTG CTTCTTAGACGGTCTTCACT 764 HHA3B3 203171_s_at RRP8 ACAAGCGCAGGTGACCTCTG GATCTTCCTTGAAAGGGGAG 765 MMMC5D5 209608_s_at ACAT2 CTTTGCAGCTGTCTCTGCTG CAATAGTTAAAGAACTTGGA 766 PPA8B8 203046_s_at TIMELESS CCTTTGGCTTTCTCTTGGAG GTGGGTCGCAGCACCAGATG 767 QG9H9 203341_at CEBPZ CAAACAGCTTAGATGGGAGG CTGAACGTGATGACTGGCTA 768 OOA8B8 201153_s_at MBNL1 TCCAGCCTTCACTCCAGCTG GTTAAAAATGTTGCACTTAT 769 NC6D6 207831_x_at DHPS AAACCTTTGCCCAGAAGATG GATGCCTTCATGCATGAGAA 770 IIE10F10 201778_s_at KIAA0494 GTCACAGTTGAGGATTTTGG CTGTGATGGGCTCATACTC- A 771 JJA10B10 210151_s_at DYRK3 GTATTGCCAAAACTGATTAG CTAGTGGACAGAGATATGCC 772 OOG6H6 218743_at CHMP6 GTTATGAGACGATCTCGCTG GGACCGCCCCTGCCCGTGGA 773 IIC8D8 200791_s_at IQGAP1 AAGGCCACATCCAAGACAGG CAATAATGAGCAGAGTTTAC 774 IIG1H1 205055_at ITGAE CTTGGAGAGCATCAGGAAGG CCCAGCTGAAATCAGAGAAT 775 MMMG4H4 201503_at G3BP1 AAGAAGGAATGTTACTTTAA TATTGGACTTTGCTCATGTG 776 HHC5D5 217900_at IARS2 GTCTTCAGATACACTGTGTC CTCGATGTGCAGAAGTTGTC 777 JJE7F7 206015_s_at FOXJ3 TTTTGTGCAGATACAACCTG CTCTCTGTACTGCTGTTGGA 778 KKKA5B5 210153_s_at ME2 CCAGTGAAACTTACAGATGG GCGAGTCTTTACACCAGGTC 779 NNNA7B7 203328_x_at IDE GGAAATGTTGGCAGTAGATG CTCCAAGGAGACATAAGGTA 780 RRC2D2 218474_s_at KCTD5 GCATCCTCTCTGGGGAGCTG CTGGCCGCTTAGCGTTGTTT 781 ZZC4D4 202429_s_at PPP3CA ACCCAAACAAAGATGTTCTC GATACAGTCTGGCAAAGACT 782 RRA9B9 203911_at RAP1GAP TGGCCCCAATACCCATTTTG GAAGCCCCTGTGGCCGTGTG 783 LLLG7H7 215116_s_at DNM1 ACTACCAGAGAACGCTGTCC CCCGACATCCCACTCCAAAG 784 IIIG2H2 213844_at HOXA5 AACTCCCTTGTGTTCCTTCT GTGAAGAAGCCCTGTTCTCG 785 TTG11H11 218547_at DHDDS GCATCTCTCTTTGGCCTGAG GTTCTGTATTCTGGGAAAGG 786 TG5H5 203521_s_at ZNF318 ATTGAACTCATTCCCTGTTC CACAAACCCATATGTATCCT 787 TG7H7 213150_at HOXA10 CTAGGAGGACTGGGGTAAGC GGAATAAACTAGAGAAGGGA 788 TG9H9 203720_s_at ERCC1 GTACCTGGAGACCTACAAGG CCTATGAGCAGAAACCAGCG 789 NNA1B1 203546_at IPO13 AGAGGCGGGTGAAGGAGATG GTGAAGGAGTTCACACTGCT 790 IIG10H10 202388_at RGS2 TGCAGTGTCCGTTATGAGTG CCAAAAATCTGTCTTGAAGG 791 XC12D12 200617_at MLEC TTTCCCATCCTCTCTCTGTG GAGGCCAAACCAACTCTTTG 792 OC7D7 213233_s_at KLHL9 ACCAAGGCAAAATGAATTGG CTTCTAGGGGTCTGAACCTT 793 SG12H12 212997_s_at TLK2 TCCGTCTGGTCTCCTGTTTG CAATTGCTTCCCTCATCTCA 794 JJA11B11 212689_s_at KDM3A GGCTGTAAAAGCAAAACCTC GTATCAGCTCTGGAACAATA 795 HHC9D9 212189_s_at COG4 CAGCAGAGAAACAAAGTCTG GACCCACTCCATGCTCTGCC 796 OOC1D1 202911_at MSH6 TAGGACATATGGCATGCATG GTAGAAAATGAATGTGAAGA 797 NNNE3F3 200698_at KDELR2 ACAAAAGCTCTGTAGGGCTG CAGACATTTAAAGTTCACAT 798 VVG7H7 201913_s_at COASY GTCCAAGCTATACTGTGCAG GACATGGCCAGGCCTGGTGG 799 SE10F10 202604_x_at ADAM10 GCTCGACCACCTCAACATTG GAGACATCACTTGCCAATGT 800 MMA1B1 202910_s_at CD97 TGTCCCATCCTGGACTTTTC CTCTCATGTCTTTGCTGCAG 801 VG9H9 205051_s_at KIT TCTATGCTCTCGCACCTTTC CAAAGTTAACAGATTTTGGG 802 LLLA6B6 202772_at HMGCL GCTGGCAGAGGCCATTTGTG GAAAGTGGAGAGCTACGTGG 803 KKC3D3 218667_at PJA1 GTTCCCTCCCCCACTCTAAA GACCAAGGCCGTTTACTCCT 804 CCCG3H3 203726_s_at LAMA3 GGTGGCAGTCACCATAAAAC AACACATCCTGCACCTGGAA 805 KKKA10B10 217960_s_at TOMM22 CGGAGAAGTTGCAAATGGAG CAACAGCAGCAACTGCAGCA- 806 RRE3F3 218755_at KIF20A TCCTACGCTCACGGCGTTCC CCTTTACTCAAATCTGGGCC 807 RRE4F4 219069_at ANKRD49 GATAGTCCTACCTCACCCTG GTCAACCTACATGATCCTTA 808 OOA1B1 202880_s_at CYTH1 TTTCCTAGACAGAGAGGCAC CTGGGTCAGTATTAGTCTAT 809 RE4F4 200825_s_at HYOU1 AGCTAGGGCTGCTGCCTCAG CTCCAAGACAAGAATGAACC 810 LA4B4 214061_at WDR67 TCTTTTGGCTGCATAGAATG CATGTCACCTTGAGACGGTC 811 SE7F7 204772_s_at TTF1 CACTAAAATCCAGACTCCTG CAGCACCCAAGCAAGTTTTC 812 NNA9B9 201178_at FBXO7 GTGGTATGACCCAAAGGTTC CTCTGTGACAAGGTTGGCCT 813 LLC6D6 204611_s_at PPP2R5B GTCTATTTATTCTCGCCCAG CTCACCCTCTACACAGACAC 814 ZG3H3 202500_at DNAJB2 ACCCTGCTGCCCATTCTTTC CAACATCACAGATGAACTGC 815 YYC11D11 201347_x_at GRHPR GTAGCCAAACAGTAGAGATG GAGGGCCGGGAAGCAAACCG 816 RA7B7 214106_s_at GMDS TGGGTCGCTTTGCGTTTGTC GAAGCCTCCTCTGAATGGCT 817 ZZG7H7 205640_at ALDH3B1 AAACCTACATTTGGACAATG AGAGGCTGCTCCTGCGGCCT 818 HHHA9B9 205379_at CBR3 GACAGGATTCTGGTGAATGC GTGCTGCCCAGGACCAGTGA 819 OA12B12 204662_at CP110 AGCTTATTCATAGCATTGTG GGTCTCTCCAGTAAGAAAGA 820 YA4B4 202174_s_at PCM1 AAGCTCTCTGGCTGGAAGTC CTGATACTGAATCTCCAGTG 821 JJJG7H7 201351_s_at YME1L1 CAGAAACCCAATCTGCCATC GAACAAGAAATAAGAATCCT 822 ZE7F7 202032_s_at MAN2A2 AGAAACTAGCCAAGGGCAAG CTATTATTCAGCAGTGTCCC 823 AAAE10F10 205741_s_at DTNA CTGTCACCACAGAGATTGGC CTACGGTTTCTGTTTTGAGG 824 GGGA6B6 220091_at SLC2A6 GCCCAACCTCTGGGAACAGG CAGCTCCTATCTGCAAACTG 825 AAAE3F3 203213_at CDC2 AAGTCTTACAAAGATCAAGG GCTGTCCGCAACAGGGAAGA 826 BBBE12F12 205227_at IL1RAP CGTTCCATGCCCAGGTTAAC AAAGAACTGTGATATATAGA 827 LA3B3 203566_s_at AGL TGCTTCATACTTGAGTGATG CTGGATAAGGTATTGTATTT 828 LC5D5 214741_at ZNF131 CGTTGAAACACATTGATTCC CCTCCCCCTACTTATTGCCA 829 YYA11B11 213343_s_at GDPD5 AGCAGACCTCAAGGCAGAAG GGTCACCTAACCCAGGAGTC 830 LLLG6H6 210115_at RPL39L ACTTGAAAAAGTGGTGTGTG GTTGACTCTGTTTCTCGCCA 831 LLC4D4 218104_at TEX10 GAGGAGCTGCCTGTTGTGGG CCAGCTGCTTCGACTGCTGC 832 EEEE7F7 203127_s_at SPTLC2 AAAATTGGCGCCTTTGGACG GGAGATGCTGAAGCGGAACA 833 RRG9H9 203209_at RFC5 ACGCACTTGTTTTCATGCAG GAGCGGGGCAAGTAAGGTTG 834 IIA11B11 202441_at ERLIN1 CCCTCTCAGCTCTGAGGCTG GCCGTCTTTCGGGGTGTTCC 835 KKA8B8 201011_at RPN1 AAACCAGGCCCTGCGTCAGG CAGTGTGAGTTTGCCGTTTG 836 BBBE7F7 219327_s_at GPRC5C ATGGGTGTCCCCACCCACTC CTCAGTGTTTGTGGAGTCGA 837 IIA7B7 205085_at ORC1L GCCGTGTGTTCTCACCTGGG CTCCTGTCGCCTCCTGCTTG 838 VVC7D7 210416_s_at CHEK2 CTGTCTGAGGAAAATGAATC CACAGCTCTACCCCAGGTTC 839 LLG6H6 212830_at MEGF9 CCCTAGAAAGTAAGCCCAGG GCTTCAGATCTAAGTTAGTC 840 AAAA7B7 214074_s_at CTTN TGTGTTTTAAACAGAATTTC GTGAACAGCCTTTTATCTCC 841 KKC7D7 202908_at WFS1 CCTGCCAGTGTTTAGAAGAG CCTGACTGTGTTCAGTGCCT 842 HHE4F4 212968_at RFNG CGCTCTGACTTGTGGCTCAG GACTACTTTCTGGGTCGTGC 843 IIIE1F1 212665_at TIPARP CTGTTGTTTGCTGCCATTGG CATGAAATGGCCAACTGTGG 844 WWG11H11 208717_at OXA1L TTTTCCCTGGTCCAAGTATC CTGTCTCCGGATTCCAGCAG 845 LC4D4 203557_s_at PCBD1 TTTAGACCTTTTCCCTGCAC CACTCTCTTCATCCTGGGGG 846 AAE2F2 201579_at FAT1 AGTGTAACGGGGACCTTCTG CATACCTGTTTAGAACCAAA 847 SSA5B5 202006_at PTPN12 GTTTCTGAATTTTAAACTTG CTGGATTCATGCAGCCAGCT 848 OOE4F4 211783_s_at MTA1 GTTTACTTTTTGGCTGGAGC GGAGATGAGGGGCCACCCCG 849 YA7B7 201260_s_at SYPL1 TTGTTTCCTGTCCTTTGTTG CTCATGCTGTTTAAGTGCAG 850 QQC1D1 215884_s_at UBQLN2 GAAGGATCAGTGTAGTAATG CCAGGAAAGTGCTTTTTACC 851 IIIA2B2 203418_at CCNA2 CTCATGGACCTTCACCAGAC CTACCTCAAAGCACCACAGC 852 TTG12H12 221779_at MICALL1 GGAAGAGGCTCGCTCCCGCC CATGGTCATCACTGGTCTGT 853 JJJG3H3 203167_at TIMP2 AAGAAGAGCCTGAACCACAG GTACCAGATGGGCTGCGAGT 854 KKA12B12 204998_s_at ATF5 AGTGTTTCGTGAAGGTGTTG GAGAGGGGCTGTGTCTGGGT 855 MA11B11 217830_s_at NSFL1C CCCTGCAATGAGCCAAGAAC CAACACTACATCCACCTAGA 856 ZZA7B7 217761_at ADI1 AATTCCGAGATAGGATTATG CCTAGTTTGTCATATCACAG 857 ZZE12F12 218168_s_at CABC1 GAGCTGGGAGAGGTGCTGAG CTAACAGTGCCAACAAGTGC 858 MMC6D6 219821_s_at GFOD1 AAAGTGAGCCTAGCCAGGAG GTGTTTGGGGCTCTATCGCG 859 IIIE3F3 203648_at TATDN2 TGCAGGTGAAACCAACCAGC CCTGTGTTAGAGGAGGAAAA 860 MA3B3 203250_at RBM16 GTCAAGGAAATGAATAACAG CTTGTCAGAGACTTCCTATG 861 RA2B2 202040_s_at KDM5A AGCCCTGACCCCAATGTCTG CTGTTTCCAACACTGGTGAT 862 ZZC12D12 211725_s_at BID CCTGGAGCAGCTGCTGCAGG CCTACCCTAGAGACATGGAG 863 SG6H6 203208_s_at MTFR1 TTCCTGGCTGGGAGTATTAG GAGATGGGAGTAGAGATTCA 864 TTG8H8 220140_s_at SNX11 AGACAATGAGGCATTCTGTC CTCCTGCTGCCATTCTTCAT 865 UUA12B12 201080_at PIP4K2B ACAACTGTTCCCCAATCTAC CAGCCATCTGCAGGGGTCAG
866 NNG9H9 201250_s_at SLC2A1 GATTGAGGGTAGGAGGTTTG GATGGGAGTGAGACAGAAGT 867 PPG12H12 204126_s_at CDC45L CTGAAAGCTGAGGATCGGAG CAAGTTTCTGGACGCACTTA 868 MMA9B9 202220_at KIAA0907 TCTCCCAGAACTGGTTGCAG CTAAAACAGAGAGATCTGAC 869 SSE3F3 218742_at NARFL GAGCAAGACGGGTTCTCACC CCTGACTTCTGGAGGCTTCC 870 QA2B2 208424_s_at CIAPIN1 CCCACTTTAGAAGAGTCCAG GTTGGTGAGCATTTAGAGGG 871 SSC5D5 212644_s_at MAPK1IP1L TTAGGGAACCTTAAGTCATG CAGACATGACTGTTCTCTTT- 872 YYA1B1 205480_s_at UGP2 AGCGGGAATTTCCTACAGTG CCCTTGGTTAAATTAGGCAG 873 ZG1H1 203499_at EPHA2 AGTCGGCCCCATCTCTCATC CTTTTGGATAAGTTTCTATT 874 GGGE7F7 204949_at ICAM3 CATAATGGTACTTATCAGTG CCAAGCGTCCAGCTCACGAG 875 LLLG3H3 219654_at PTPLA GTGTGGTGCTTTTTCTGGTC GCGTGGACTGTGACAGAGAT 876 ZE6F6 215093_at NSDHL CACCCTACTCTTTCCGTGAC GATGAGGGCGGCAAAAACAG 877 QQE2F2 204826_at CCNF GGGTGAGAACCCAAGCGTTG GAACTGTAGACCCGTCCTGT 878 ZE12F12 201756_at RPA2 GAGAAACCTGCTGGCCTCTG CCTGTTTTCATTTCCCACTT 879 OA2B2 202678_at GTF2A2 AGGCTATAAATGCAGCACTG GCTCAGAGGGTCAGGAACAG 880 NC1D1 221230_s_at ARID4B TCTTTGTTTCCTGGCAATAC GACGTGGGAATTTCAATGCG 881 JJA1B1 203155_at SETDB1 TGATCCCTTCCAATGTGGTG CTAGCAGGCAGGATCCCTTC 882 JJC10D10 212458_at SPRED2 CCGACCCCCCAAGCTATTTG CTCACATTAACAAATTAAAG 883 OG8H8 213153_at SETD1B GAGTTTTAGGGATGTTTGTG CGGGTAGACTCCATCATCCA 884 LLLG2H2 208690_s_at PDLIM1 TGAGTCCCCTCCCTGCCTTG GTTAATTGACTCACACCAGC 885 SA8B8 218102_at DERA TGCCCTAGCAGAGGAAAATG CAACATCTCGCAAGCGCTGC 886 AAAC7D7 211919_s_at CXCR4 CCGACTTCATCTTTGCCAAC GTCAGTGAGGCAGATGACAG 887 TG4H4 203343_at UGDH TGCTGAGAATGTACAGTTTG CATTAAACATCCCAGGTCTC 888 QG5H5 203464_s_at EPN2 GCTGTTTCTCAGTCCCAGAG GCCGGTGGCTGGTTTTGAAC 889 QQG3H3 205173_x_at CD58 CCAAGCAGCGGTCATTCAAG ACACAGATATGCACTTATAC 890 YYE2F2 212399_s_at VGLL4 TGCCTGCAGTGCGCTCTGAC CTTCTCTTCATGTGTGTAAA 891 RRA7B7 221552_at ABHD6 TGTTCTGAGTGAACCCACAG CAGTCGCAGAATGAGCACCT 892 NNE7F7 220127_s_at FBXL12 GGGCACCTGAGGGTCTGAGC CCCCTTATGAGTACCCAAGA 893 MMG5H5 217873_at CAB39 AGGTCGTAGCCTTTTAGGTG GAAGAAGTGAGGGTGCAGCG 894 QE2F2 203342_at TIMM17B CGAAGTTCTCACCCCAGCTC CTTTGTGTGGCACCCTGATG 895 PA12B12 201697_s_at DNMT1 ACATGGTGTTTGTGGCCTTG GCTGACATGAAGCTGTTGTG 896 RRC5D5 221887_s_at DFNB31 CCTCCAGCTAGGACCCAGCC CATCCCCAGATGCCTGAGCC 897 OOC11D11 201608_s_at PWP1 AGTGGCCCTTTTGGCAGCAG GAGCTCAGATACACCCATGG 898 QQG12H12 217168_s_at HERPUD1 GCTGTTGGAGGCTTTGACAG GAATGGACTGGATCACCTGA- 899 MG2H2 201847_at LIPA GGTTGCCCATGAGAAGTGTC CTTGTTCATTTTCACCCAAA 900 KKKC12D12 221641_s_at ACOT9 ACTCTACCCACAGTGACGTG GTATCTGATGAAGACCTGAT 901 LLC9D9 207871_s_at ST7 CTGTGGCACCAGCTAACACG GATCTGAGAGAAGCCCTGTC 902 YC6D6 208407_s_at CTNND1 ACCACTGGGCCATAATGTTG CTTCTCAGGCTATATGCAGT 903 LLC2D2 218581_at ABHD4 GGTGGTTCCCACTGCATGAC CCTCTATCCCTGCCATCTGT 904 AAE4F4 201626_at INSIG1 ATTTCCAATGAAGATGTCAG CATTTTATGAAAAACCAGAA 905 QE10F10 203989_x_at ZNF160 GAAGAGAGAGGCCAGGCGCG GTGGCTCACACCTGTAATCC 906 NG6H6 202494_at PPIE TGGGCCTCTCCTGGGACTAC CAGTGTGGCTCTTACGTGTT 907 ZA1B1 201628_s_at RRAGA AGTGGGCTTTGAAGTGTGTG CTGCTTACTCCTTTCATCTT 908 ME5F5 207467_x_at CAST CTCCAAAGCACCTAAGAATG GAGGTAAAGCGAAGGATTCA 909 IIA1B1 217911_s_at BAG3 TGCAGCCCTGTCTACTTGGG CACCCCCACCACCTGTTAGC 910 NNC8D8 201040_at GNAI2 TGTCTTGTTCTGTGATGAGG GGAGGGGGGCACATGCTGAG 911 MC5D5 203120_at TP53BP2 CCTGCCAGAAAGGACCAGTG CCGTCACATCGCTGTCTCTG 912 SC5D5 202825_at SLC25A4 AACCAGACTGAAAGGAATAC CTCAGAAGAGATGCTTCATT 913 YG11H11 201644_at TSTA3 GGGCAGTTTAAGAAGACAGC CAGTAACAGCAAGCTGAGGA 914 VC8D8 202599_s_at NRIP1 TCCCATTGCAAACATTATTC CAAGAGTATCCCAGTATTAG 915 IIIE4F4 215945_s_at TRIM2 CGCTGTGCATCAAAGTGTTT GTATGTTCGTAGCTACATAC 916 NNC10D10 201397_at PHGDH GAGAAAATCCACATTCTTGG GCTGAACGCGGGCCTCTGAC 917 MMMC7D7 209163_at CYB561 CCAGTCTCCTCTAATGCTCA GATTTCCCATAGTTGGCTTT 918 RRG10H10 200895_s_at FKBP4 GGACATGGGAAAAACCACTG CTATGCCATTTCTTCTCTCT 919 KKC2D2 200811_at CIRBP TGTGGCTTTTTTCCAACTCC GTGTGACGTTTCTGAGTGTA 920 QQG10H10 213110_s_at COL4A5 GAATCCTCCTGTGGCCTCTG CTTGTACAGAACTGGGAAAC 921 SSE1F1 202009_at TWF2 CGGGCTGGCATTTTGTGACC CTTCCCTGTTGCTGTCCCTG 922 HHG7H7 202123_s_at ABL1 CTGTGGTGGCTCCCCCTCTG CTTCTCGGGGTCCAGTGCAT 923 IIA10B10 201743_at CD14 CTGACGAGCTGCCCGAGGTG GATAACCTGACACTGGACGG 924 AAA8B8 203494_s_at CEP57 AAGTGAGAAACAGTGCTCTG GTGACATGATAAATATATGT 925 SSC6D6 221856_s_at FAM63A GTTTCTGGTTCTCAACTCCC GGTCCCTGAATAGTCACACG 926 UUA1B1 218695_at EXOSC4 GGCAGATGGTGGGACCTATG CAGCTTGTGTGAATGCAGCC 927 NNA10B10 201323_at EBNA1BP2 GAAAGGGTCAAATAAGAGAC CTGGAAAACGAACAAGAGAG 928 GGGE2F2 203358_s_at EZH2 TCGAAAGAGAAATGGAAATC CCTTGACATCTGCTACCTCC 929 KKG12H12 207515_s_at POLR1C AAGCTAAAGAAGGTTGTGAG GCTTGCCCGGGTTCGAGATC 930 PPC5D5 202726_at LIG1 CCCTCGGTTTATTCGAGTCC GTGAAGACAAGCAGCCGGAG 931 LG1H1 212875_s_at C2CD2 CGGAAAGGTTTGGCCTGACG CTGGAGTGCGGTGATGAACT 932 XG3H3 218093_s_at ANKRD10 TGGATTTATTGTTTTTATTC CACACTTCCTACTTGGTCTC 933 QC10D10 207059_at DDX41 CTGGCTGCCTGTTCCCTGTG CTCTTCAGAATTACTGTTTT 934 KKG4H4 218421_at CERK AAGTCTGAGTGAAAGGATGG CCTCATTCTCTTTCTAATCT 935 QC4D4 209380_s_at ABCC5 AGACCTACCTCAGGTTGCTG GTTGCTGTGTGGTTTGGTGT 936 LLG9H9 202963_at RFX5 GTTCTGTGGTCAGGCGGCAC CAATGAGAAAGGAATGCAGA 937 QE12F12 201944_at HEXB AGCTGCACAACCTCTTTATG CTGGATATTGTAACCATGAG 938 ZA2B2 200915_x_at KTN1 TAAACCAACAGCTCACAAAG GAGAAAGAGCACTACCAGGT 939 KKE5F5 212403_at UBE3B CCCATCCTAATTTTTATCAC CTGAAGGTTGGAACCAGTGA 940 EEEG5H5 205398_s_at SMAD3 TCAAAGAGATTCGAATGACG GTAAGTGTTCTCATGAAGCA 941 HHA2B2 121_at PAX8 TGTGCTTCCTGCAGCTCACG CCCACCAGCTACTGAAGGGA 942 HHE3F3 212300_at TXLNA CAGCTTTTTTGTCTCCTTTG GGTATTCACAACAGCCAGGG 943 NNE8F8 201087_at PXN TCTCCACTTTCACCCGCAGG CCTTACCGCTCTGTTTATAG 944 LLLE8F8 201136_at PLP2 CAACAACATTCCCAGCAGAC CAACTCCCACCCCCTCTTTG 945 HHHE5F5 212038_s_at VDAC1 TTCCCTAACCCTAATTGATG AGAGGCTCGCTGCTTGATGG 946 XA11B11 209408_at KIF2C TTTAGTACAGCTATCTGCTG GCTCTAAACCTTCTACGCCT 947 JJG2H2 204252_at CDK2 TGATCCCATTTTCCTCTGAC GTCCACCTCCTACCCCATAG 948 RA12B12 204542_at ST6GALNAC2 TCCCATTAGAGATGTATCAC CACCTTGTCACCAACAGGAT- 949 KKE2F2 202114_at SNX2 GACCCTCTTTGAATTAAGTG GACTGTGGCATGACATTCTG 950 FFG4H4 213152_s_at SFRS2B CATGCAGTGAGCACATCTAG CTGACGATAATCACACCTTT 951 LLE3F3 212651_at RHOBTB1 GGCAGTGGAAACACCAGATA GAAGATCTTAGGAGAGGCCC 952 YC8D8 202925_s_at PLAGL2 TAGCTGATTGTTCCCACTTG CACCTCTCCACCTTTGGCAC 953 TC10D10 205324_s_at FTSJ1 ACAACCCTGAAGACAACAAG GAAAGAAACCATGAAAGTCT 954 QQG7H7 208898_at ATP6V1D TCAGGCCAATTACTGTGGAG CAGCTTTCATTCCTACCCAC 955 LLE1F1 218399_s_at CDCA4 TAGATCACAGGCACCAGTTG GTCTTCAGGGACCTCATAGC 956 QQE3F3 205031_at EFNB3 TGGCCACCTCAATCACCAGC CAAGATGGTTGCTTTGTCCA 957 NNC3D3 205691_at SYNGR3 GACACCAGCCCTGTCCTAGC CCTTCAGTAAGACCTTGCCA 958 TTE10F10 221514_at UTP14A ATGCTCTGTAGATTGAGTTG CTGGAGGAGTGACAGCCAGG 959 MC12D12 203675_at NUCB2 AACGTCAGCATGATCAACTG GAGGCTCAGAAGCTGGAATA 960 TC7D7 202119_s_at CPNE3 GTAAATTCAGGGCCCCATTG CTACTTATGCCATATTTGGA 961 OOG7H7 200783_s_at STMN1 TTCTCTGCCCCGTTTCTTGC CCCAGTGTGGTTTGCATTGT 962 PPA3B3 202413_s_at USP1 CTTGATTCACTTAGAAGTGT CTCAGAAAACCTGGACAGTT 963 FFA8B8 218140_x_at SRPRB GGTCTAGTGTGTTCTTAGTG GTTATACTGGGAAGTGTGTG 964 MA7B7 219352_at HERC6 GGAATGTACTTTCACTTTTG CTGCTTCACTGCCTTGTGCT 965 QQA10B10 212880_at WDR7 CAACCAAGGCCAGTAGAAAG CTATGGCTGCAAAACCCTGG 966 ZZC7D7 200848_at AHCYL1 ATGAACTGAGATCATAAAGG GCAACTGATGTGTGAAGAAA 967 UUA6B6 212536_at ATP11B ACCTGAGACACTGTGGCTGT CTAATGTAATCCTTTAAAAA 968 TG10H10 204489_s_at CD44 GCCAACCTTTCCCCCACCAG CTAAGGACATTTCCCAGGGT 969 MMC1D1 204781_s_at FAS AGAAAGTAGCTTTGTGACAT GTCATGAACCCATGTTTGCA 970 JJE5F5 205079_s_at MPDZ ACCCCTAGCTCACCTCCTAC TGTAAAGAGAATGCACTGGT 971 QQA3B3 205046_at CENPE GGCAAGGATGTGCCTGAGTG CAAAACTCAGTAGACTCCTC 972 TG1H1 206414_s_at ASAP2 GCATTTTGCATGCCATTCTC CATCAGATCTGGGATGATGG 973 NNC2D2 204610_s_at CCDC85B CTAGCGCTTAAGGAGCTCTG CCTGGCGCTGGGCGAAGAAT 974 NNA3B3 204756_at MAP2K5 GGCCATCCCCATACCTTCTG GTTTGAAGGCGCTGACACTG 975 QC9D9 202318_s_at SENP6 GGACACTTACTCAACAGAAG CACCTTTAGGCGAAGGAACA 976 HHHA11B11 218407_x_at NENF TTCTTGGGAGCGTGAGGCAG GAAGACACTAGGTGCTGAAT 977 OOC5D5 213190_at COG7 TTACTGACCCCACCACACAC CGGACCACCAAGAGAGCCAG 978 XG9H9 203576_at BCAT2 GCCAGCACTCGCCTCCCTAC CAATGACTCACCTGAAGTGC 979 OE3F3 201827_at SMARCD2 GTTTTCAGGGAGCCTGTTAG GTGCCTCCTTCTTTTCTTTC 980 IIG12H12 203067_at PDHX TGGCCATTAACTTAGCAGTG GGACCTCACTTTTACAAGCA 981 OOA6B6 221560_at MARK4 AAAGAAGAGGCGTGGGAATC CAGGCAGTGGTTTTTCCTTT 982 UA5B5 212737_at GM2A GTGGCCTCGACATCAAACTG CCTGGATTTTTCTACCACCC 983 AAAG6H6 204925_at CTNS CCAGGACGTGCCTCATACAT GACTTGAGCTTGTCAGTCCA 984 OA11B11 212717_at PLEKHM1 GTCTTTGCAATGTATTGAAG GAATTGCTGCCGTGTGAGTT 985 IIG8H8 201200_at CREG1 TTCAGCCAGGGACAAAATCC CCTCCCAAACCACTCTCCAC 986 MA6B6 209603_at GATA3 GCTACCAGCGTGCATGTCAG CGACCCTGGCCCGACAGGCC 987 CCCE3F3 219061_s_at LAGE3 CTGGAAAGCTGAAGACTGTC GCCTGCTCCGAATTTCCGTC 988 CCCA2B2 204679_at KCNK1 TAGGAGGAGAATACTTGAAG CAGTATGCTGCTGTGGTTAG 989 XC11D11 201931_at ETFA GCTTTGTTCCCAATGACATG CAAGTTGGACAGACGGGAAA
990 ZC1D1 202398_at AP3S2 CACTGCTCAATACAGCCTCC GATCCTCACTCTTGAAAGCT 991 WE4F4 209307_at SWAP70 TCACATGTGGACCTTGATAC GACTAAGCGGTTACATATGT 992 BBBA9B9 205919_at HBE1 TGGCTACTCACTTTGGCAAG GAGTTCACCCCTGAAGTGCA 993 YYG8H8 208290_s_at EIF5 TGGAGTGTGTGGTAGCAATG CATCAAGCTCAGCTTATCTC 994 NC4D4 218679_s_at VPS28 CAACTCACTGTCTGCAGCTG CCTGTCTGGTGTCTGTCTTT 995 OOA12B12 201788_at DDX42 GCTCTGAAGATTCCCAGAAG CCACAAGGATTGAAGGGAAA 996 ZC3D3 218149_s_at ZNF395 GACGTCTGTGGCCAAGCGAG GTCTCAGGTGCAAAGCAAAA 997 BBBG3H3 211330_s_at HFE TCGTCTGAAAGAGGAAGCAG CTATGAAGGCCAAAACAGAG 998 FFFG2H2 208763_s_at TSC22D3 AACCAGCCTTGGGAGTATTG ACTGGTCCCTTACCTCTTAT 999 TA3B3 203232_s_at ATXN1 GCACTACCAGACTGACATGG CCAGTACAGAGGAGAACTAG 1000 TA9B9 202655_at ARMET CTGGAGCTTTCCTGATGATG CTGGCCCTACAGTACCCCCA
The invention is further described by the following numbered paragraphs:
1. A method for making a transcriptome-wide mRNA-expression profiling platform using sub-transcriptome numbers of transcript measurements comprising:
a) providing:
i) a first library of transcriptome-wide mRNA-expression data from a first collection of biological samples;
ii) a second collection of biological samples;
iii) a second library of transcriptome-wide mRNA-expression data from said second collection of biological samples;
iv) a device capable of measuring transcript expression levels;
b) performing computational analysis on said first library such that a plurality of transcript clusters are created, wherein the number of said clusters is substantially less than the total number of all transcripts;
c) identifying a centroid transcript within each of said plurality of transcript clusters, thereby creating a plurality of centroid transcripts, said remaining transcripts being non-centroid transcripts;
d) measuring the expression levels of at least a portion of transcripts from said second collection of biological samples with said device, wherein said portion of transcripts comprise transcripts identified as said centroid transcripts from said first library; e) determining the ability of said measurements of the expression levels of said centroid transcripts to infer the levels of at least a portion of transcripts from said second library, wherein said portion is comprised of non-centroid transcripts; f) selecting said centroid transcripts whose said expression levels have said ability to infer the levels of said portion of non-centroid transcripts. 2. The method of Paragraph 1, wherein said plurality of centroid transcripts is approximately 1000 centroid transcripts. 3. The method of Paragraph 1, wherein said device is selected from the group consisting of a microarray, a bead array, a liquid array, and a nucleic-acid sequencer. 4. The method of Paragraph 1, wherein said computational analysis comprises cluster analysis. 5. The method of Paragraph 1, wherein said method further comprises repeating steps c) to f) until validated centroid transcripts for each of said plurality of transcript clusters are identified. 6. The method of Paragraph 1, wherein said plurality of clusters of transcripts are orthogonal. 7. The method of Paragraph 1, wherein said plurality of clusters of transcripts are non-overlapping. 8. The method of Paragraph 1, wherein said determining involves a correlation between said expression levels of said centroid transcripts and said expression levels of said non-centroid transcripts. 9. The method of Paragraph 1, wherein expression levels of a set of substantially invariant transcripts are additionally measured with said device in said second collection of biological samples. 10. The method of Paragraph 9, wherein said measurements of said centroid transcripts made with said device, and said mRNA-expression data from said first and second libraries, are normalized with respect to the expression levels of a set of substantially invariant transcripts. 11. A method for identifying a subpopulation of predictive transcripts within a transcriptome, comprising: a) providing: i) a first library of transcriptome-wide mRNA-expression data from a first collection of biological samples; ii) a second collection of biological samples; ii) a second library of transcriptome-wide mRNA-expression data from said second collection of biological samples; iii) a device capable of measuring transcript expression levels; b) performing computational analysis on said first library such that a plurality of transcript clusters are created, wherein the number of said clusters is less than the total number of all transcripts in said first library; c) identifying a centroid transcript within each of said transcript clusters thereby creating a plurality of centroid transcripts, said remaining transcripts being non-centroid transcripts; d) processing transcripts from said second collection of biological samples on said device so as to measure expression levels of said centroid transcripts, and e) determining which of said plurality of centroid transcripts measured on said device predict the levels of said non-centroid transcripts in said second library of transcriptome-wide data. 12. The method of Paragraph 11, wherein said plurality of centroid transcripts is approximately 1000 centroid transcripts. 13. The method of Paragraph 11, wherein said device is selected from the group consisting of a microarray, a bead array, a liquid array, and a nucleic-acid sequencer. 14. The method of Paragraph 11, wherein said computational analysis comprises cluster analysis. 15. The method of Paragraph 11, wherein said determining involves a correlation between said centroid transcript and said non-centroid transcript. 16. The method of Paragraph 11, wherein said method further comprises repeating steps c) to e). 17. A method for identifying a subpopulation of approximately 1000 predictive transcripts within a transcriptome, comprising: a) providing: i) a first library of transcriptome-wide mRNA-expression data from a first collection of biological samples representing greater than 1000 different transcripts, and ii) transcripts from a second collection of biological samples; b) performing computational analysis on said first library such that a plurality of clusters of transcripts are created, wherein the number of said clusters is approximately 1000 and less than the total number of all transcripts in said first library; c) identifying a centroid transcript within each of said transcript clusters, said remaining transcripts being non-centroid transcripts; d) processing the transcripts from said second collection of biological samples so as to measure the expression levels of non-centroid transcripts, so as to create first measurements, and expression levels of centroid transcripts, so as to create second measurements; and e) determining which centroid transcripts based on said second measurements predict the levels of said non-centroid transcripts, based on said first measurements, thereby identifying a subpopulation of predictive transcripts within a transcriptome. 18. The method of Paragraph 17, wherein said method further comprises a device capable of measuring the expression levels of said centroid transcripts. 19. The method of Paragraph 18, wherein said device is capable of measuring the expression levels of approximately 1000 of said centroid transcripts. 20. The method of Paragraph 17, wherein said computational analysis comprises cluster analysis. 21. The method of Paragraph 17, wherein said determining involves a correlation between said centroid transcript and said non-centroid transcript. 22. The method of Paragraph 17, wherein said method further comprises repeating steps c) to e). 23. A method for predicting the expression level of a first population of transcripts by measuring the expression level of a second population of transcripts, comprising: a) providing: i) a first heterogeneous population of transcripts comprising a second heterogeneous population of transcripts, said second population comprising a subset of said first population, ii) an algorithm capable of predicting the level of expression of transcripts within said first population which are not within said second population, said predicting based on the measured level of expression of transcripts within said second population; b) processing said first heterogeneous population of transcripts under conditions such that a plurality of different templates representing only said second population of transcripts is created; c) measuring the amount of each of said different templates to create a plurality of measurements; and d) applying said algorithm to said plurality of measurements, thereby predicting the level of expression of transcripts within said first population which are not within said second population. 24. The method of Paragraph 23, wherein said first heterogenous population of transcripts comprise a plurality of non-centroid transcripts. 25. The method of Paragraph 23, wherein said second heterogenous population of transcripts comprises a plurality of centroid transcripts. 26. The method of Paragraph 23, wherein said method further comprises a device capable of measuring the amount of approximately 1000 of said different templates. 27. The method of Paragraph 26, wherein said device is selected from the group consisting of a microarray, a bead array, a liquid array, and a nucleic-acid sequencer. 28. The method of Paragraph 23, wherein said algorithm involves a dependency matrix. 29. A method of assaying gene expression, comprising: a) providing: i) approximately 1000 different barcode sequences; ii) approximately 1000 beads, each bead comprising a homogeneous set of nucleic-acid probes, each set complementary to a different barcode sequence of said approximately 1000 barcode sequences; iii) a population of more than 1000 different transcripts, each transcript comprising a gene-specific sequence; iv) an algorithm capable of predicting the level of expression of unmeasured transcripts; b) processing said population of transcripts to create approximately 1000 different templates, each template comprising one of said approximately 1000 barcode sequences operably associated with a different gene-specific sequence, wherein said approximately 1000 different templates represents less than the total number of transcripts within said population; c) measuring the amount of each of said approximately 1000 different templates to create a plurality of measurements; and d) applying said algorithm to said plurality of measurements, thereby predicting the level of expression of unmeasured transcripts within said population. 30. The method of Paragraph 29, wherein said method further comprises a device capable of measuring the amount of each of said approximately 1000 different templates. 31. The method of Paragraph 29, wherein said beads are optically addressed. 32. The method of Paragraph 29, wherein said processing comprises ligation-mediated amplification. 33. The method of Paragraph 31, wherein said measuring comprises detecting said optically addressed beads. 34. The method of Paragraph 31, wherein said measuring comprises hybridizing said approximately 1000 different templates to said approximately 1000 beads through said nucleic-acid probes complementary to said approximately 1000 barcode sequences. 35. The method of Paragraph 31, wherein said measuring comprises a flow cytometer. 36. The method of Paragraph 29, wherein said algorithm involves a dependency matrix. 37. A composition comprising an amplified nucleic acid sequence, wherein said sequence comprises at least a portion of a cluster centroid transcript sequence and a barcode sequence, wherein said composition further comprises an optically addressed bead, and wherein said bead comprises a capture probe nucleic-acid sequence hybridized to said barcode. 38. The composition of Paragraph 37, wherein said barcode sequence is at least partially complementary to said capture probe nucleic acid. 39. The composition of Paragraph 37, wherein said amplified nucleic-acid sequence is biotinylated. 40. The composition of Paragraph 37, wherein said optically addressable bead is detectable with a flow cytometric system. 41. The composition of Paragraph 40, wherein said flow cytometric system discriminates between approximately 500-1000 optically addressed beads. 42. A method for creating a genome-wide expression profile, comprising: a) providing: i) a plurality of genomic transcripts derived from a biological sample; ii) a plurality of centroid transcripts comprising at least a portion of said genomic transcripts, said remaining genomic transcripts being non-centroid transcripts; b) measuring the expression level of said plurality of centroid transcripts; c) inferring the expression levels of said non-centroid transcripts from said centroid transcript expression levels, thereby creating a genome-wide expression profile. 43. The method of Paragraph 42, wherein said plurality of centroid transcripts comprise approximately 1,000 transcripts. 44. The method of Paragraph 42, wherein said measuring comprises a device selected from the group consisting of a microarray, a bead array, a liquid array, and a nucleic-acid sequencer. 45. The method of Paragraph 42, wherein said inferring involves a dependency matrix. 46. The method of Paragraph 42, wherein said genome-wide expression profile identifies said biological sample as diseased. 47. The method of Paragraph 42, wherein said genome-wide expression profile identifies said biological sample as healthy. 48. The method of Paragraph 42, wherein said genome-wide expression profile provides a functional readout of the action of a perturbagen. 49. The method of Paragraph 42, wherein said genome-wide expression profile comprises an expression profile suitable for use in a connectivity map. 50. The method of Paragraph 49, wherein said expression profile is compared with query signatures for similarities. 51. The method of Paragraph 42, wherein said genome-wide expression profile comprises a query signature compatible with a connectivity map. 52. The method of Paragraph 51, wherein said query signature is compared with known genome-wide expression profiles for similarities. 53. A kit, comprising: a) a first container comprising a plurality of centroid transcripts derived from a transcriptome; b) a second container comprising buffers and reagents compatible with measuring the expression level of said plurality of centroid transcripts within a biological sample; c) a set of instructions for inferring the expression level of non-centroid transcripts within said biological sample, based upon the expression level of said plurality of centroid transcripts. 54. The kit of Paragraph 53, wherein said plurality of centroid transcripts is approximately 1,000 transcripts. 55. A method for making a transcriptome-wide mRNA-expression profile, comprising: a) providing: i) a composition of validated centroid transcripts numbering substantially less than the total number of all transcripts; ii) a device capable of measuring the expression levels of said validated centroid transcripts; iii) an algorithm capable of substantially calculating the expression levels of transcripts not amongst the set of said validated centroid transcripts from expression levels of said validated centroid transcripts measured by said device and transcript cluster information created from a library of transcriptome-wide mRNA-expression data from a collection of biological samples; and iv) a biological sample; b) applying said biological sample to said device whereby expression levels of said validated centroid transcripts in said biological sample are measured; c) applying said algorithm to said measurements thereby creating a transcriptome-wide mRNA expression profile. 56. The method of Paragraph 55, wherein said validated centroid transcripts comprise approximately 1,000 transcripts. 57. The method of Paragraph 55, wherein said device is selected from the group consisting of a microarray, a bead array, a liquid array, and a nucleic-acid sequencer. 58. The method of Paragraph 55, wherein expression levels of a set of substantially invariant transcripts are additionally measured in said biological sample. 59. The method of Paragraph 55, wherein said expression levels of said validated centroid transcripts are normalized with respect to said expression levels of said invariant transcripts. 101. A method, comprising: a) providing: i) a sample comprising a plurality of analytes; ii) a plurality of solid substrate populations, wherein each of said solid substrate populations comprise a plurality of subsets, and wherein each subset is present in an unequal proportion from every other subset in the same solid substrate population; iii) a plurality of capture probes capable of attaching to said plurality of analytes, wherein each subset comprises a different capture probe; and vi) a means for detecting said plurality of subsets that is capable of creating a multimodal intensity distribution pattern; b) detecting said plurality of subsets with said means, wherein a multimodal intensity distribution pattern is created; c) identifying said plurality of analytes from said multimodal distribution pattern. 102. The method of Paragraph 101, wherein said sample may be selected from the group comprising a biological sample, a soil sample, or a water sample. 103. The method of Paragraph 101, wherein said plurality of analytes may be selected from the group comprising nucleic acids, proteins, peptides, biological receptors, enzymes, antibodies, polyclonal antibodies, monoclonal antibodies, or Fab fragments. 104. The method of Paragraph 101, wherein said solid substrate population comprises a bead-set population. 105. The method of Paragraph 101, wherein said unequal proportions comprise two subsets in an approximate ratio of 1.25:0.75. 106. The method of Paragraph 101, wherein said unequal proportions comprise three subsets in an approximate ratio of 1.25:1.00:0.75. 107. The method of Paragraph 101, wherein said unequal proportions comprise four subsets in an approximate ratio of 1.25:1.00:0.75:0.50. 108. The method of Paragraph 101, wherein said unequal proportions comprise five subsets in an approximate ratio of 1.50:1.25:1.00:0.75:0.50. 109. The method of Paragraph 101, wherein said unequal proportions comprise six subsets in an approximate ratio of 1.75:1.50:1.25:1.00:0.75:0.50. 110. The method of Paragraph 101, wherein said unequal proportions comprise seven subsets in an approximate ratio of 2.00:1.75:1.50:1.25:1.00:0.75:0.50. 111. The method of Paragraph 101, wherein said unequal proportions comprise eight subsets in an approximate ratio of 2.00:1.75:1.50:1.25:1.00:0.75:0.50:0.25. 112. The method of Paragraph 101, wherein said unequal proportions comprise nine subsets in an approximate ratio of 2.25:2.00:1.75:1.50:1.25:1.00:0.75:0.50:0.25. 113. The method of Paragraph 101, wherein said unequal proportions comprise ten subsets in an approximate ratio of 2.50:2.25:2.00:1.75:1.50:1.25:1.00:0.75:0.50:0.25. 114. A method, comprising: a) providing; i) a solid substrate population comprising a first subset and a second subset, wherein the first subset is present in a first proportion and the second subset is present in a second proportion; ii) a first analyte attached to said first subset; iii) a
second analyte attached to said second subset; and vi) a means for detecting said first subset and second subset that is capable of creating a multimodal intensity distribution pattern; b) detecting said first subset and said second subset with said means, wherein a multimodal intensity distribution pattern is created; and c) identifying said first analyte and said second analyte from said multimodal distribution pattern. 115. The method of Paragraph 114, wherein said solid substrate population comprises a label. 116. The method of Paragraph 115, wherein said label comprises a mixture of at least two different fluorophores. 117. The method of Paragraph 114, wherein said first proportion is different from said second proportion. 118. The method of Paragraph 114, wherein said first analyte is attached to said first subset with a first capture probe. 119. The method of Paragraph 114, wherein said second analyte is attached to said second subset with a second capture probe. 120. The method of Paragraph 114, wherein said multimodal intensity distribution pattern comprises a first peak corresponding to said first subset. 121. The method of Paragraph 114, wherein said multimodal intensity distribution pattern comprises a second peak corresponding to said second subset. 122. A method, comprising: a) providing: i) a solid substrate population comprising a plurality of subsets; ii) a sample comprising a plurality of analytes, wherein at least one portion of said plurality of analytes comprise related analytes; and iii) a means for detecting said subsets that is capable of creating a multimodal intensity distribution pattern; b) attaching each of said related analyte portions to one of said plurality of subsets; c) detecting said plurality of subsets with said means, wherein a multimodal intensity distribution pattern is created; and d) identifying said related analytes from said multimodal distribution pattern. 123. The method of Paragraph 122, wherein said related analytes comprise linked genes. 124. A method, comprising: a) providing: i) a solid substrate population comprising a plurality of subsets; ii) a sample comprising a plurality of analytes, wherein at least one portion of the plurality of analytes comprise rare event analytes; and iii) a means for detecting said subsets that is capable of creating a multimodal intensity distribution pattern; b) attaching a portion of said plurality of analytes comprising one or more of the rare event analytes to one of the plurality of subsets; c) detecting said plurality of subsets with said means, wherein a multimodal intensity distribution pattern is created; and d) determining if said rare event analytes occur in said multimodal distribution pattern. 125. The method of Paragraph 124, wherein said rare event analyte portion is present in approximately less than 0.01% of said sample. 126. The method of Paragraph 124, wherein said rare event analyte comprises a small molecule or drug. 127. The method of Paragraph 124, wherein said rare event analyte comprises a nucleic acid mutation. 128. The method of Paragraph 124, wherein said rare event analyte comprises a diseased cell. 129. The method of Paragraph 124, wherein said rare event analyte comprises an autoimmune antibody. 130. The method of Paragraph 124, wherein said rare event analyte comprises a microbe. 131. A method, comprising: a) providing: i) a solid substrate population comprising a plurality of subsets; ii) a sample comprising a first labeled analyte and a second labeled analyte; and iii) a means for detecting said subsets that is capable of creating a multimodal intensity distribution pattern; b) attaching said first and second labeled analytes in an unequal proportion to one of said plurality of subsets; c) detecting said plurality of subsets with said means, wherein a multimodal intensity distribution pattern is created; and d) identifying said first and second labeled analytes from said multimodal distribution pattern. 132. The method of Paragraph 131, wherein said first labeled analyte comprises a normal cell. 133. The method of Paragraph 131, wherein said second labeled analyte comprises a tumor cell. 134. The method of Paragraph 131, wherein said multimodal intensity distribution pattern comprises a first peak corresponding to said first labeled analyte. 135. The method of Paragraph 131, wherein said multimodal intensity distribution pattern comprises a second peak corresponding to said second labeled analyte. 136. The method of Paragraph 131, wherein said unequal proportion is equivalent to a ratio of said first and second peaks.
Having thus described in detail preferred embodiments of the present invention, it is to be understood that the invention defined by the above paragraphs is not to be limited to particular details set forth in the above description as many apparent variations thereof are possible without departing from the spirit or scope of the present invention.
SEQUENCE LISTINGS
0 SQTB SEQUENCE LISTING The patent contains a lengthy "Sequence Listing" section. A copy of the "Sequence Listing" is available in electronic form from the USPTO web site (http://seqdata.uspto.gov/?pageRequest=docDetail&DocID=US10619195B2)- . An electronic copy of the "Sequence Listing" will also be available from the USPTO upon request and payment of the fee set forth in 37 CFR 1.19(b)(3).
* * * * *
References
uspto.report is an independent third-party trademark research tool that is not affiliated, endorsed, or sponsored by the United States Patent and Trademark Office (USPTO) or any other governmental organization. The information provided by uspto.report is based on publicly available data at the time of writing and is intended for informational purposes only.
While we strive to provide accurate and up-to-date information, we do not guarantee the accuracy, completeness, reliability, or suitability of the information displayed on this site. The use of this site is at your own risk. Any reliance you place on such information is therefore strictly at your own risk.
All official trademark data, including owner information, should be verified by visiting the official USPTO website at www.uspto.gov. This site is not intended to replace professional legal advice and should not be used as a substitute for consulting with a legal professional who is knowledgeable about trademark law.