Multi-sense environmental monitoring device and method
Arunachalam Feb
U.S. patent number 10,557,839 [Application Number 15/376,823] was granted by the patent office on 2020-02-11 for multi-sense environmental monitoring device and method. This patent grant is currently assigned to Industrial Scientific Corporation. The grantee listed for this patent is Industrial Scientific Corporation. Invention is credited to Raghu Arunachalam.


View All Diagrams
| United States Patent | 10,557,839 |
| Arunachalam | February 11, 2020 |
| **Please see images for: ( Certificate of Correction ) ** |
Multi-sense environmental monitoring device and method
Abstract
Environmental monitoring devices for detecting and warning users of unhealthy levels of a given substance are disclosed having more than one sensor for each substance to be detected. A processing unit, wirelessly coupled to the sensors in the devices can be configured to receive each of the output signals from the sensors, determine a detection signal for the substance based on the output signals, determine a gain of a majority of the sensors, and generate a calibration action responsive to the output signals deviating by a threshold amount, wherein the calibration action comprises adjusting a gain of a deviating sensor to correspond with the gain of the majority of sensors.
| Inventors: | Arunachalam; Raghu (Pittsburgh, PA) | ||||||||||
|---|---|---|---|---|---|---|---|---|---|---|---|
| Applicant: |
|
||||||||||
| Assignee: | Industrial Scientific
Corporation (Pittsburgh, PA) |
||||||||||
| Family ID: | 44511478 | ||||||||||
| Appl. No.: | 15/376,823 | ||||||||||
| Filed: | December 13, 2016 |
Prior Publication Data
| Document Identifier | Publication Date | |
|---|---|---|
| US 20170102369 A1 | Apr 13, 2017 | |
Related U.S. Patent Documents
| Application Number | Filing Date | Patent Number | Issue Date | ||
|---|---|---|---|---|---|
| 14676443 | Apr 1, 2015 | 9575043 | |||
| 13168577 | Jun 24, 2011 | 9000910 | |||
| 61358729 | Jun 25, 2010 | ||||
| Current U.S. Class: | 1/1 |
| Current CPC Class: | G01N 33/0063 (20130101); G08B 29/24 (20130101); G01N 33/0031 (20130101); G08B 5/22 (20130101); G08B 21/16 (20130101); G01N 33/0006 (20130101); G08B 21/14 (20130101); G08B 29/26 (20130101); G08B 21/182 (20130101); G08B 29/16 (20130101) |
| Current International Class: | G01N 33/00 (20060101); G08B 5/22 (20060101); G08B 21/18 (20060101); G08B 21/14 (20060101); G08B 29/24 (20060101); G08B 29/26 (20060101); G08B 21/16 (20060101); G08B 29/16 (20060101) |
References Cited [Referenced By]
U.S. Patent Documents
| 1797891 | March 1931 | Young et al. |
| 4416911 | November 1983 | Wilkinson-Tough |
| 4457954 | July 1984 | Dabill et al. |
| 4473797 | September 1984 | Shiota |
| 4525872 | June 1985 | Zochowski et al. |
| 4775083 | October 1988 | Burger et al. |
| 4931780 | May 1990 | Lamont et al. |
| 4963855 | October 1990 | Kojima et al. |
| 5005419 | April 1991 | O'Donnell et al. |
| 5101271 | March 1992 | Andrews |
| 5138559 | August 1992 | Kuehl et al. |
| 5243152 | September 1993 | Magid et al. |
| 5493273 | February 1996 | Smurlo |
| 5568121 | October 1996 | Lamensdorf |
| 5778062 | July 1998 | Vanmoor et al. |
| 5916180 | June 1999 | Cundari |
| 5932176 | August 1999 | Yannopoulos et al. |
| 6182497 | February 2001 | Krajci |
| 6466608 | October 2002 | Hong et al. |
| 6629152 | September 2003 | Kingsbury et al. |
| 6644098 | November 2003 | Cardinale et al. |
| 6649876 | November 2003 | Cardinale |
| 6703840 | March 2004 | Cardinale |
| 6822573 | November 2004 | Basir et al. |
| 7020508 | March 2006 | Stivoric et al. |
| 7463142 | December 2008 | Lindsay et al. |
| 7471200 | December 2008 | Otranen |
| 7587619 | September 2009 | Ryan |
| 7613156 | November 2009 | Rittle et al. |
| 7649872 | January 2010 | Naghian et al. |
| 7688802 | March 2010 | Gonia et al. |
| 7697893 | April 2010 | Kossi et al. |
| 7778431 | August 2010 | Feng et al. |
| 7880607 | February 2011 | Olson et al. |
| 7885291 | February 2011 | Delaney |
| 7888825 | February 2011 | Koshi et al. |
| 7895309 | February 2011 | Belali et al. |
| 7917673 | March 2011 | Suh |
| 7970871 | June 2011 | Ewing et al. |
| 7978717 | July 2011 | Banks et al. |
| 8009437 | August 2011 | Shelton et al. |
| 8035491 | October 2011 | Banks |
| 8081590 | December 2011 | Patterson et al. |
| 8085144 | December 2011 | Appelt et al. |
| 8086285 | December 2011 | McNamara et al. |
| 8180075 | May 2012 | Nelson et al. |
| 8204971 | June 2012 | Ewing et al. |
| 8224246 | July 2012 | Suumaki et al. |
| 8294568 | October 2012 | Barrett et al. |
| 8358214 | January 2013 | Gingrave et al. |
| 8385322 | February 2013 | Colling et al. |
| 8400317 | March 2013 | Johnson et al. |
| 8416120 | April 2013 | Kim |
| 8418064 | April 2013 | Guagenti et al. |
| 8438250 | May 2013 | Ewing et al. |
| 8442801 | May 2013 | Gonla et al. |
| 8462707 | June 2013 | Husney |
| 8494502 | July 2013 | Abel et al. |
| 8514087 | August 2013 | Little et al. |
| 8547888 | October 2013 | Filoso et al. |
| 8585606 | November 2013 | McDonald et al. |
| 8587414 | November 2013 | Bandyopadhyay et al. |
| 8638228 | January 2014 | Amigo et al. |
| 8665097 | March 2014 | Stinson et al. |
| 8792401 | July 2014 | Banks et al. |
| 8805430 | August 2014 | Olsen et al. |
| 8818397 | August 2014 | Shikowitz et al. |
| 8868703 | October 2014 | Ewing et al. |
| 8885513 | November 2014 | Ewing |
| 9000910 | April 2015 | Arunachalam |
| 9195866 | November 2015 | Mehranfar et al. |
| 9536418 | January 2017 | Mao et al. |
| 9575043 | February 2017 | Arunachalam |
| 9743221 | February 2017 | Javer et al. |
| 9619986 | April 2017 | Seol |
| 9721456 | August 2017 | Thurlow et al. |
| 9792808 | October 2017 | Gnanasekaran et al. |
| 9847008 | December 2017 | Hunter et al. |
| 10055971 | August 2018 | M R et al. |
| 10062260 | August 2018 | Hunter et al. |
| 2001/0050612 | December 2001 | Shaffer |
| 2002/0009195 | January 2002 | Schon et al. |
| 2002/0126002 | September 2002 | Patchell et al. |
| 2002/0146352 | October 2002 | Wang et al. |
| 2002/0155622 | October 2002 | Slater et al. |
| 2003/0150252 | August 2003 | Wang et al. |
| 2003/0159497 | August 2003 | Warburton et al. |
| 2003/0180445 | September 2003 | Wang et al. |
| 2005/0083194 | April 2005 | Shen et al. |
| 2005/0202582 | September 2005 | Eversmann |
| 2005/0243794 | November 2005 | Yoon et al. |
| 2006/0019402 | January 2006 | Wang et al. |
| 2006/0224357 | October 2006 | Taware et al. |
| 2006/0257289 | November 2006 | Martens et al. |
| 2007/0000310 | January 2007 | Yamartino et al. |
| 2007/0078608 | April 2007 | Broy et al. |
| 2007/0171042 | July 2007 | Metes et al. |
| 2007/0241261 | October 2007 | Wendt |
| 2007/0257806 | November 2007 | Madden |
| 2008/0015794 | January 2008 | Eiler |
| 2008/0038590 | February 2008 | Nakakubo et al. |
| 2008/0058614 | March 2008 | Banet et al. |
| 2008/0122641 | May 2008 | Amidi et al. |
| 2008/0146895 | June 2008 | Olson et al. |
| 2008/0240463 | October 2008 | Florencio et al. |
| 2009/0089108 | April 2009 | Angell et al. |
| 2009/0115654 | May 2009 | Lo et al. |
| 2009/0210257 | August 2009 | Chalfant et al. |
| 2009/0312976 | December 2009 | Bingham et al. |
| 2010/0072334 | March 2010 | Le Gette et al. |
| 2010/0267407 | October 2010 | Liao et al. |
| 2011/0022421 | January 2011 | Brown et al. |
| 2011/0115623 | May 2011 | Gnanasekaran et al. |
| 2011/0161885 | June 2011 | Gonia et al. |
| 2012/0150755 | June 2012 | Kumar et al. |
| 2012/0176237 | July 2012 | Tabe et al. |
| 2013/0006064 | January 2013 | Reiner et al. |
| 2013/0057391 | March 2013 | Salvador et al. |
| 2013/0253809 | September 2013 | Jones et al. |
| 2013/0278412 | October 2013 | Kelly et al. |
| 2014/0122537 | May 2014 | Stivoric et al. |
| 2014/0233458 | August 2014 | Georgescu et al. |
| 2014/0274155 | September 2014 | Langberg |
| 2014/0310349 | October 2014 | Rainisto |
| 2014/0368354 | December 2014 | Skourlis |
| 2015/0025917 | January 2015 | Stempora |
| 2015/0145649 | May 2015 | Michaud et al. |
| 2015/0145685 | May 2015 | Albinger et al. |
| 2015/0161876 | June 2015 | Castillo |
| 2015/0163652 | June 2015 | Michaud et al. |
| 2016/0209386 | July 2016 | Belski et al. |
| 2016/0334378 | November 2016 | Maddila et al. |
| 2017/0132884 | May 2017 | Kumar et al. |
| 2017/0303187 | October 2017 | Crouthamel et al. |
| 2018/0024091 | January 2018 | Wang et al. |
| 2018/0082565 | March 2018 | Braiman |
| 2017219135 | Nov 2018 | AU | |||
| 2803246 | Dec 2011 | CA | |||
| 2135808 | Jun 1993 | CN | |||
| 104903953 | Sep 2015 | CN | |||
| 105092796 | Dec 2018 | CN | |||
| 2586018 | May 2013 | EP | |||
| 3227808 | Oct 2017 | EP | |||
| 3228068 | Oct 2017 | EP | |||
| 2287789 | Nov 2017 | EP | |||
| 3510386 | Jul 2019 | EP | |||
| 2423400 | Aug 2006 | GB | |||
| 2002344602 | Nov 2002 | JP | |||
| 2007193773 | Aug 2007 | JP | |||
| 1995026492 | Oct 1995 | WO | |||
| 2008111755 | Sep 2008 | WO | |||
| 2011163604 | Dec 2011 | WO | |||
| 2014184638 | Nov 2014 | WO | |||
| 2016005805 | Jan 2016 | WO | |||
| 2017142847 | Aug 2017 | WO | |||
| 2018048517 | Mar 2018 | WO | |||
| 2018165883 | Sep 2018 | WO | |||
Other References
|
"RECON/4 Manual", ENMET Corporation, Jun. 22, 2009, p. 1-10. cited by applicant . "Solaris Multigas Detector", "Solaris Multigas Detector", Solaris Mul tigas Manual, Jan. 1, 2005, p. 1-162. cited by applicant . "Wearable Sensors in Transportation--Exploratory Advanced Research Program Initial Stage Investigation", The Exploratory Advanced Research Program, Mar. 2016, 52 pages. cited by applicant . 13741909.9, "European Application Serial No. 13741909.9, Communication pursuant to Article 94(3) EPC dated Jan. 4, 2017", Industrial Scientific Corporation, 7 Pages. cited by applicant . 2013325257, "Australian Application Serial No. 2013325257, First Examination Report dated Jul. 24, 2017", Industrial Scientific Corporation, 3 Pages. cited by applicant . 2015261602, "Australian Application Serial No. 2015261602, First Examiner Report dated Sep. 2, 2016", Industrial Scientific Corporation, 3 Pages. cited by applicant . 2015261602, "Australian Application Serial No. 2015261602, Second Examiner Report dated Aug. 17, 2017", Industrial Scientific Corporation, 4 Pages. cited by applicant . Azhari, et al., "On the Performance of Off-Body Links for a Wireless Body Area Network in an Underground Mining Environment", International Journal of Computer Science and Innovation, vol. 2015, No. 2,, 2015, pp. 53-67. cited by applicant . Ding, et al., "Redundant Sensor Calibration Monitoring Using Independent Component Analysis and Pricipal Component Analysis", p. 27-47. cited by applicant . Dorsavi, "ViPerform--Provides Objective Data to Accurately Assess Risk of Injury, Guide Training Programs, and Help Determine When It's Safe to Return to Play", Available online at <http://us.dorsavi.com/viperform/>, retrieved on Jul. 10, 2016, 12 pages. cited by applicant . Giang, "Companies Are Putting Sensors on Employees to Track Their Every Move", http://www.businessinsider.com/tracking-employees-with-productivit- y-sensors-2013-3, Mar. 14, 2013, 1-4. cited by applicant . Giang, "Companies Are Putting Sensors on Employees to Track Their Every Move", Tracking Employees With Productivity Sensors--Business Insider, Available online at <http://www.businessinsider.com/tracking-employees-with-productivity-s- ensors-2013-3>, Mar. 14, 2013, pp. 1-4. cited by applicant . Mayton, et al., "TRUSS: Tracking Risk with Ubiquitous Smart Sensing", In 2012 IEEE Sensors, Institute of Electrical and Electronics Engineers (IEEE) 2012, pp. 1-4. cited by applicant . Peaksoft Technologies, "Big Idea Seeing Crime Before It Happens", Available online at <http://www.pstpl.com/news184.html>, Dec. 3, 2011, pp. 1-2. cited by applicant . 2017219135, "Australian Application Serial No. 2017219135, First Examination Report dated Mar. 27, 2018", Industrial Scientific Corporation, 4 pages. cited by applicant . PCT/US2017/044735, "International Application Serial No. PCT/US2017/044735, International Search Report and Written Opinion dated Jan. 18, 2018", Industrial Scientific Corporation, 14 Pages. cited by applicant . PCT/US2017/044735, "International Application Serial No. PCT/US2017/044735, Invitation to Pay Additional Fees and, Where Applicable, Protest Fee dated Nov. 7, 2017", Industrial Scientific Corporation, 2 Pages. cited by applicant . PCT/US2017/044735, "International Application Serial No. PCT/US2017/044735, International Preliminary Report on Patentability and Written Opinion dated Mar. 21, 2019", Industrial Scientific Corporation, 6 pages. cited by applicant. |
Primary Examiner: Fan; Hongmin
Attorney, Agent or Firm: GTC Law Group PC & Affiliates
Parent Case Text
CROSS-REFERENCE TO RELATED APPLICATION
This application is a continuation of U.S. application Ser. No. 14/676,443, entitled "Multi-Sense Environmental Monitoring Device and Method", filed Apr. 1, 2015 which is a continuation of U.S. application Ser. No. 13/168,577 entitled "Multi-Sense Environmental Monitoring Device and Method," filed Jun. 24, 2011, which claims benefit of priority to U.S. Provisional Patent Application No. 61/358,729 filed on Jun. 25, 2010 entitled "Multi-Sense Environmental Monitoring Device and Method," the entire contents of which are hereby incorporated by reference in their entirety.
Claims
What is claimed is:
1. A system, comprising: a plurality of monitoring devices, wherein each of the plurality of monitoring devices comprises at least one sensor configured to detect a substance and to generate an output signal indicative of a concentration of the substance in response to a detection of the substance, wherein the at least one sensor in each of the plurality of monitoring devices is configured to detect a same substance, wherein an amount of the substance has not been determined prior to the detection of the substance; a processing unit, wirelessly coupled to the at least one sensor in each of the plurality of monitoring devices, configured to: receive each output signal from each of the at least one sensor in each of the plurality of monitoring devices in response to the detection of the sub stance; generate a detection signal for the substance indicative of the amount of the substance based on the output signals from the at least one sensor in each of the plurality of monitoring devices; determine a corresponding gain of each of the at least one sensor in each of the plurality of monitoring devices and an overall gain of a majority of the at least one sensor in each of the plurality of monitoring devices based on the determined corresponding gains; generate a calibration action responsive to any of the output signals deviating by an amount from the detection signal, wherein the calibration action comprises only adjusting a corresponding gain of a corresponding deviating sensor to correspond with the determined overall gain of the majority of the at least one sensor in each of the plurality of monitoring devices; determine a weight of each of the at least one sensor configured to indicate a reliability of each of the at least one sensor, wherein the weight for each of the at least one sensor is determined based on at least one of a span reserve of the at least one sensor, a historic calibration performance of the at least one sensor, or a historic bump test performance of the at least one sensor; and determine an aggregate substance concentration reading by aggregating the output signals from each of the at least one sensor biased toward output signals from sensors indicated as being more reliable based on the weight.
2. The system of claim 1, further comprising, an alarm operably coupled to the processing unit, the alarm configured to be activated responsive to the detection signal deviating from a level that corresponds to a predetermined concentration of the substance.
3. The system of claim 1, wherein the plurality of monitoring devices are configured to wirelessly communicate with one another.
4. The system of claim 1, further comprising, a display operably coupled to the processing unit configured to display a reading for the substance in accordance with the output signals.
5. The system of claim 4, wherein the reading is at least one of a maximum, a minimum, a mean, a median, or a mode of the output signals.
6. The system of claim 4, wherein the reading is based on artificial intelligence (AI) logic that takes into account at least one of the output signals from the sensors, a historic sensor performance data, a span reserve of the sensors, a gain of the sensors, or a temperature.
Description
FIELD OF THE INVENTION
Embodiments of the present invention generally relate to environmental monitoring devices.
BACKGROUND OF THE INVENTION
In a number of industrial work environments workers are at risk of being exposed to a variety of hazardous environmental substances such as toxic or highly combustible gases, oxygen depleted environments, or radiation, etc. that pose a serious threat to worker safety. In order to keep workers safe, specialized environmental monitoring devices are used to alert workers of dangerous changes in their immediate environment.
Current practice involves using fixed point monitoring devices that monitor the environment around where they are deployed or portable monitoring devices that are carried by the workers to monitor their immediate vicinity. Fixed point monitoring devices are typically used around potential hazard locations such as confined spaces to warn workers of the environment before they enter. Portable monitoring devices are often used for personal protection. These monitoring devices may have a single sensor to monitor one specific substance or multiple sensors (typically two to six) each monitoring a distinct substance.
Given that these environmental monitoring devices are life critical, it is important the device functions properly and accurately. Current practice involves periodic bump testing and calibration of monitoring devices to guarantee proper functioning. Bump tests involve exposing the monitoring device to a measured quantity of gas and verifying that the device responds as designed, i.e., it senses the gas and goes into alarm. Calibration involves exposing the device to a measured quantity of gas and adjusting the gain of the sensors so it reads the quantity of gas accurately. The purpose of calibration is to maintain the accuracy of the monitoring device over time.
Current best practice followed by leading manufacturers of environmental monitors recommends bump testing the monitoring device before every days work and calibrating the device once at least every thirty days. While a number of manufacturers sell automated docking stations that automatically perform calibration and bump testing when a monitoring device is docked, there are still a number of disadvantages to the current practice.
A fixed bump and calibration policy, such as currently practiced, does not take into account the actual state of the sensors or the environmental monitoring device. Such a fixed policy (bump test every day and calibrate every thirty days) by its very nature is a compromise that is too stringent in many cases and too liberal in many others.
Given that the docking operation requires the user to bring the monitor to a central location, which typically is outside the work area, to perform the bump test and calibration, there is value in minimizing/optimizing this operation as much as possible without compromising safety.
Threshold limit values (TLV), namely the maximum exposure of a hazardous substance repeatedly over time which causes no adverse health effects in most people is constantly being reduced by regulatory authorities as scientific understanding and evidence grows and we accumulate more experience. Often these reductions are quite dramatic as in the case of the recent (February 2010) reduction recommended by the American Congress of Governmental Industrial Hygienists (ACGIH) for H2S exposure. The ACGIH reduced the TLV for H2S from a time weighted average (TWA) of 10 ppm to 1 ppm TWA averaged over eight hours. The effect of such reductions puts a premium on accuracy of measurements. Current practice of a fixed calibration policy, such as calibrate every thirty days, may not be enough to guarantee the level of accuracy to meet the more stringent emerging TLV's. While a blanket reduction in the frequency of the calibration interval, i.e., from thirty days, will help to improve accuracy, it would add significant cost to the use and maintenance of the environmental monitoring devices.
One solution to this problem, pursued by some, is to use newer and more advanced technology sensors with a higher degree of accuracy and tolerance to drift that minimize the need for calibration and bump testing. While there certainly is value in this approach, the cost of these emerging sensor often preclude its widespread use, particularly in personal monitoring applications where a large number of these monitors need to be deployed.
For all the aforementioned reasons there is value in developing monitors that use current low cost sensor technologies while still meeting emerging TLV regulations and allow for a more adaptive calibration/bump policy that takes into account the state of the sensors and monitoring devices.
SUMMARY OF THE INVENTION
In one general aspect, embodiments of the present invention generally pertain to a monitoring device having at least two sensors for each substance to be detected, a display, a processing unit, and an alarm. The sensors may be positioned on more than one plane or surface of the device. The processing unit may auto or self calibrate the sensors. Another embodiment relates to a network of monitoring devices. Other embodiments pertain to methods of monitoring a substance with a monitoring device having at least two sensors for that substance and auto or self calibrating the sensors.
Those and other details, objects, and advantages of the present invention will become better understood or apparent from the following description and drawings showing embodiments thereof.
BRIEF DESCRIPTION OF THE DRAWINGS
The accompanying drawings illustrate examples of embodiments of the invention. In such drawings:
FIGS. 1A, 1B and 1C illustrate monitoring devices having two sensors that detect the same substance and positioned on different planes or surfaces of the device, and FIG. 1D shows a monitoring device having three sensors according to various embodiments of the present invention;
FIG. 2 shows a block diagram illustrating a few of the components of the monitoring device according to various embodiments of the present invention;
FIG. 3 illustrates a flowchart of an example AI logic according to various embodiments of the present invention; and
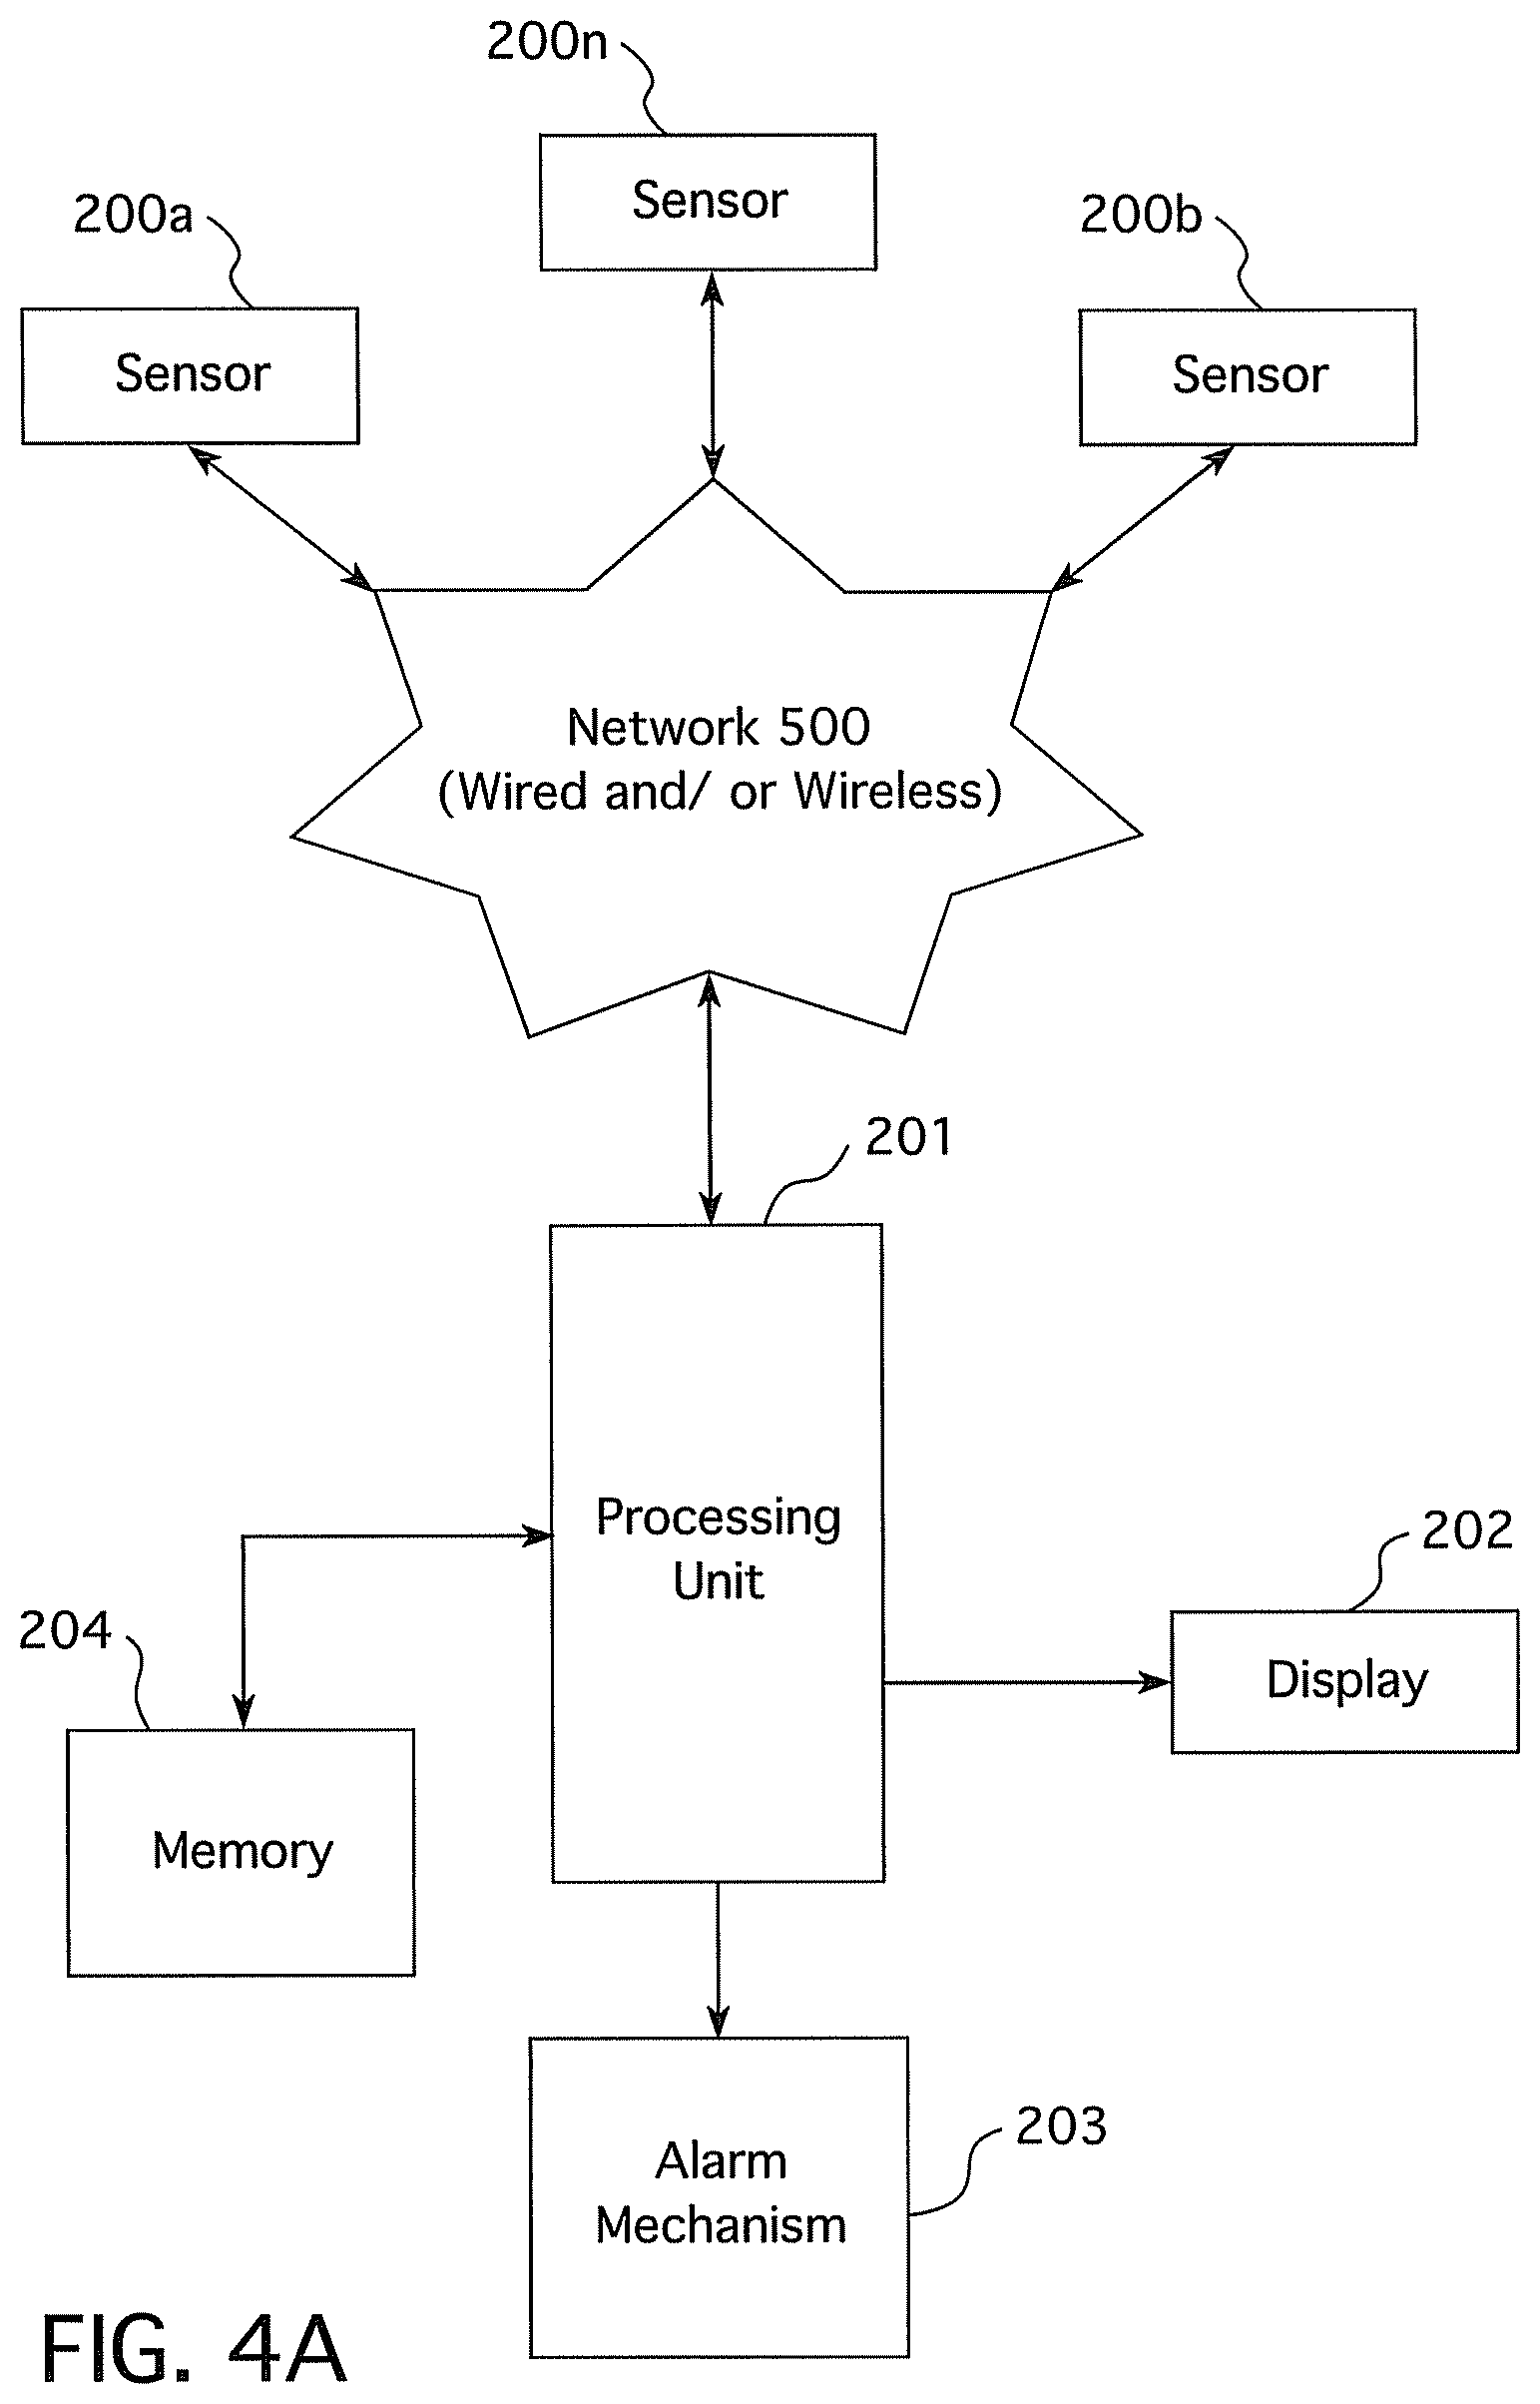
FIG. 4A illustrates a monitoring device with the plurality of sensors housed in multiple housings and connected to a central processing unit and FIG. 4B illustrates a network of monitoring devices according to various embodiments of the present invention.
DETAILED DESCRIPTION
Various embodiments of the present invention pertain to a monitoring device and methods used for environmental monitoring of substances, such as, for example and without limitation, gases, liquids, nuclear radiation, etc.
In an embodiment, as illustrated in FIGS. 1A-C, the monitoring device 90 has at least two sensors, 200a and 200b, which detect the same substance. The sensors may be positioned in more than one plane or surface of the device 90. The device 90 also has a display 202; a user interface 102, such as, for example and without limitation, at least one key or key pad, button, or touch screen, for control and data entry; an alarm 203, shown in FIGS. 1C and 1D, such as, for example and without limitation, audio, visual, or vibration; and a housing 104. The monitoring device 90 may have a user panic button 106, shown in FIGS. 1A and 1B, that allows the user to trigger an alarm mechanism. In an example, as shown in FIGS. 1A and 1B, sensor 200a and 200b are on opposite sides of the device 90. In another example, as shown in FIG. 1C, sensor 200a is on the front of the device 90 and sensor 200b on the top. In yet another example, as shown in FIG. 1D, the device 90 has three sensors, 200a-c, sensing the same substance and positioned in different planes or surfaces of the device 90. The position of the sensors 200 in different and multiple planes greatly reduces the likelihood of more than one sensor failing, for example by being clogged by debris from the device 90 being dropped. The monitoring device 90 may have more than one sensor 200 for each substance to be detected, i.e., the device 90 may detect more than one substance. The sensors 200 for each substance may be positioned on more than one plane or surface of the device 90. For example, the device 90 may have two sensors 200a and 200b for H2S positioned on different surfaces or planes, e.g., one on the top and one on the side, of the device 90 and two sensors 200c and 200d for oxygen positioned on different surfaces or planes of the device 90, e.g., one on top and one on the side.
In another embodiment the monitoring device 90, as shown in FIG. 2, has a plurality of sensors 200a-n that detect the same substance. One benefit of using more than one sensor 200 for each substance to be detected is reduction in the frequency of bump testing and calibration of the monitoring devices. As an example, in practice monitoring device types typically used for gas detection have been found to fail at a rate of 0.3% a day based on field analysis data and thus daily bump tests have been mandated; however, equivalent safety may be gained with two sensors by bump testing every week, thereby reducing bump testing by seven fold.
In further embodiments, the monitoring device 90, as shown in FIG. 2, has a processing unit 201; a plurality of sensors 200a-n that sense the same substance, such as, for example and without limitation, a gas; a display 202; an alarm 203 that would generate an alarm, for example and without limitation, an audio, visual, and/or vibratory alarm; and a memory 204 to store, for example and without limitation, historic sensor and calibration/bump test data. The processing unit 201 interfaces with the sensors 200a-n and determines the actual reading to be displayed. The actual reading may be, for example and without limitation, the maximum, minimum, arithmetic, mean, median, or mode of the sensor 200a-n readings. The actual reading may be based on artificial intelligence (AI) logic. The AI logic mechanism takes into account, for example and without limitation, the readings from the plurality of sensors 200a-n, historic sensor performance data in the memory 204, span reserve of the sensor 200, gain of the sensor 200, temperature, etc., to determine the actual reading. In another example, as an alternative to the displayed actual reading being the maximum of the aggregate of the n sensors 200a-n, the displayed actual reading may be calculated as follows, where R denotes the displayed reading and R.sub.i denotes the reading sensed by sensor i:
.SIGMA..times. ##EQU00001## Then, the processing unit may display possible actions that need to be taken based on the actual reading derived, for example and without limitation, activate the alarm, request calibration by user, indicate on the display that the sensors are not functioning properly, indicate the current reading of gas or other substance in the environment, auto calibrate sensors that are out of calibration, etc.
One example of the artificial intelligence logic method would be for the greater readings of the two sensors 200a and 200b or the greater readings of a multitude of sensors 200a-n to be compared with a threshold amount, and if the sensor reading crosses the threshold amount, an alarm mechanism would be generated. Another example of AI logic entails biasing the comparison between the sensor readings and the threshold amount by weights that are assigned based on the current reliability of the sensors 200a-n, i.e., a weighted average. These weights can be learned, for example and without limitation, from historic calibration and bump test performance. Standard machine learning, AI, and statistical techniques can be used for the learning purposes. As an example, reliability of the sensor 200 may be gauged from the span reserve or alternatively the gain of the sensor 200. The higher the gain or lower the span reserve, then the sensor 200 may be deemed less reliable. Weights may be assigned appropriately to bias the aggregate substance concentration reading (or displayed reading) towards the more reliable sensors 200a-n. Consider R to denote the displayed reading, R.sub.i to denote the reading sensed by sensor I, and w.sub.i to denote the weight associated by sensor i:
.SIGMA..times. ##EQU00002## where the weight w.sub.i (0<w.gtoreq.1) is proportional to span reading of sensor i or inversely proportional to the gain G.sub.i. Alternatively, w.sub.i can be derived from historical data analysis of the relationship between the gain w.sub.i and span reserve or gain G.sub.i. Historical data of bump tests and calibration tests performed in the field, for example and without limitation, can be used to derive this data.
In addition, as illustrated in FIG. 3, if the difference in readings between any two or more sensors 200 is greater than some threshold value t.sub.c, which could be determined in absolute terms or relative percentage terms and may vary by substance, then the monitoring device 90 would generate an alarm or visual indication in the display 202 requesting a calibration by docking on a docking station or manually be performed on the device 90. Further, if the difference in readings is greater than some higher threshold value t.sub.f, the monitoring device 190 would generate an alarm and or indicate on the display 202 a message indicating a sensor failure.
In some circumstances, for example and without limitation, in the case of an oxygen sensor, the minimum reading of a multitude of sensors 200a-n may be used to trigger an alarm to indicate a deficient environment.
In another embodiment, the monitoring device 90 may have an orientation sensor, such as, for example and without limitation, an accelerometer, that would allow the artificial intelligence logic to factor in relative sensor orientation to account for the fact that heavier than air gases, for example, would affect sensors in a lower position more than on a higher position and lighter than air sensors would. The degree of adjustment to the reading based on orientation can be learned, for example and without limitation, from the calibration data, field testing, distance between sensors, etc. and used to adjust readings from multiple positions on the device 90 to give the most accurate reading at the desired location, such as the breathing area of a user or a specific location in a defined space using the environmental monitoring device 90 as a personnel protection device.
Another embodiment pertains to a network 500 having the plurality of sensors 200a-n that detect a single substance housed in separate enclosures, placed in the vicinity of one another, e.g., from inches to feet depending on the area to be monitored, and communicate with one another directly and/or the central processing unit through a wireless or wired connection. See FIGS. 4A and 4B. Each of the housings 104 may have a separate processing unit 201, memory 204, and AI processing logic, as shown in FIG. 4B. Alternatively, or in combination, sensor units would share a central processing unit 201 and memory 204, as shown in FIG. 4A.
Based on the plurality of sensor readings 200a-n, the processing unit, using standard AI and machine learning techniques, etc., will adjust the gain of the sensors 200a-n to match closer to the majority of sensors 200a-n for each substance, i.e., minimize variance among the sensors. The variance may be, for example and without limitation, a statistical variance, other variance metrics such as Euclidean distance, or calculated from the average, weighted average, mean, median, etc. readings of the sensors. This would allow auto or self calibration of outlying sensors 200a-n without the use of calibration gas using a manual method or a docking station. In an example, if n sensors 200a-n sensing a particular gas, such as H2S, are considered and R.sub.i is the reading that represents the concentration of H2S sensed by sensor i and M is the median value of the reading among the n sensors, then the gain, given by G.sub.i,, of each sensor can be adjusted so that the reading R.sub.i moves towards the median value by a small amount given by weight w(0<w.gtoreq.1). For each sensor i in (1,n):
##EQU00003## Performing such gain adjustment whenever the monitoring device 90 is exposed to a substance in the field, for example, as part of day-to-day operation will reduce the frequency of calibrations required, thus saving money both directly from the reduction in calibration consumption, such as gas, and also costs involved in taking time away to perform the calibration. Current monitoring devices that use a single gas sensor for detecting each gas type require a more frequent calibration schedule, thereby incurring significant costs.
While presently preferred embodiments of the invention have been shown and described, it is to be understood that the detailed embodiments and Figures are presented for elucidation and not limitation. The invention may be otherwise varied, modified or changed within the scope of the invention as defined in the appended claims.
EXAMPLE
The following discussion illustrates a non-limiting example of embodiments of the present invention.
A single gas monitor that is used as a small portable device worn on the person and used primarily as personal protection equipment may be used to detect the gases within the breathing zone of the bearer of the device. The gas monitor is designed to monitor one of the following gases:
TABLE-US-00001 Measuring Ranges: Gas Symbol Range Increments Carbon Monoxide CO 0-1,500 1 ppm Hydrogen Sulfide H.sub.2S 0-500 ppm 0.1 ppm Oxygen O.sub.2 0-30% of volume 0.1% Nitrogen Dioxide NO.sub.2 0-150 ppm 0.1 ppm Sulfur Dioxide SO.sub.2 0-150 ppm 0.1 ppm
The sensors are placed on two separate planes of the monitoring device, for example as depicted in FIGS. 1A-C. The gas concentration of the reading is calculated in the following manner:
.times..times..times..times. ##EQU00004##
If the reading is higher (or lower in the case of oxygen) than a user defined alarm threshold, then an audio and visual alarm is generated.
Further, if reading>0.5*abs(alarmThreshold-normalReading) and if
.ltoreq..function..times..times..times..times..function..times..times..ti- mes..times..ltoreq. ##EQU00005## then an auto calibrate function based on gain as described below is performed. The auto calibration may be done, based on a user defined setting in the monitoring device, without further input from the user of the monitoring device, and/or the user will be informed that the gas monitor has detected an anomaly and requests permission to auto calibrate.
If
.function..times..times..times..times..function..times..times..times..tim- es.> ##EQU00006## then a message is displayed to the user to calibrate the gas monitor immediately using a calibration gas.
Gain of each of the sensors is modified as follows in the auto or self calibration process:
.function..times..times..times..times..function..times..times..times..tim- es. ##EQU00007##
* * * * *
References
D00000
D00001
D00002
D00003
D00004
D00005
D00006
D00007
M00001
M00002
M00003
M00004
M00005

M00006

M00007

XML
uspto.report is an independent third-party trademark research tool that is not affiliated, endorsed, or sponsored by the United States Patent and Trademark Office (USPTO) or any other governmental organization. The information provided by uspto.report is based on publicly available data at the time of writing and is intended for informational purposes only.
While we strive to provide accurate and up-to-date information, we do not guarantee the accuracy, completeness, reliability, or suitability of the information displayed on this site. The use of this site is at your own risk. Any reliance you place on such information is therefore strictly at your own risk.
All official trademark data, including owner information, should be verified by visiting the official USPTO website at www.uspto.gov. This site is not intended to replace professional legal advice and should not be used as a substitute for consulting with a legal professional who is knowledgeable about trademark law.