Compositions of steviol multiglycosylated derivatives and stevia components
Jackson Dec
U.S. patent number 10,517,321 [Application Number 15/204,479] was granted by the patent office on 2019-12-31 for compositions of steviol multiglycosylated derivatives and stevia components. This patent grant is currently assigned to SWEET GREEN FIELDS USA LLC. The grantee listed for this patent is Sweet Green Fields USA LLC. Invention is credited to Mel Clinton Jackson.


View All Diagrams
| United States Patent | 10,517,321 |
| Jackson | December 31, 2019 |
Compositions of steviol multiglycosylated derivatives and stevia components
Abstract
The invention describes a sweetener of glycosylated steviol glycosides and a rebaudioside in an aqueous solution for convenience of use in the food and beverage industry.
| Inventors: | Jackson; Mel Clinton (Honolulu, HI) | ||||||||||
|---|---|---|---|---|---|---|---|---|---|---|---|
| Applicant: |
|
||||||||||
| Assignee: | SWEET GREEN FIELDS USA LLC
(Bellingham, WA) |
||||||||||
| Family ID: | 57729897 | ||||||||||
| Appl. No.: | 15/204,479 | ||||||||||
| Filed: | July 7, 2016 |
Prior Publication Data
| Document Identifier | Publication Date | |
|---|---|---|
| US 20170006906 A1 | Jan 12, 2017 | |
Related U.S. Patent Documents
| Application Number | Filing Date | Patent Number | Issue Date | ||
|---|---|---|---|---|---|
| 62190964 | Jul 10, 2015 | ||||
| 62262060 | Dec 2, 2015 | ||||
| Current U.S. Class: | 1/1 |
| Current CPC Class: | A23L 27/36 (20160801); A23V 2002/00 (20130101); A23V 2002/00 (20130101); A23V 2250/262 (20130101) |
| Current International Class: | A23L 27/30 (20160101); A23L 27/40 (20160101) |
References Cited [Referenced By]
U.S. Patent Documents
| 2010/0166679 | July 2010 | Abelyan |
| 2010/0189861 | July 2010 | Abelyan |
| 2012/0157553 | June 2012 | Dewis |
| 2013/0136838 | May 2013 | San Miguel |
| 2013/0203867 | August 2013 | Tezuka |
| 2014/0017378 | January 2014 | Purkayastha |
Attorney, Agent or Firm: Ye; Michael Morris, Manning & Martin, LLP
Parent Case Text
CROSS REFERENCE TO RELATED APPLICATIONS
This application claims priority to U.S. Provisional Patent Application No. 62/190,964, filed Jul. 10, 2015, entitled "Compositions of Steviol Multiglycosylated Derivatives and Stevia Components" and U.S. Provisional Patent Application No. 62/262,060, filed Dec. 2, 2015 entitled "Compositions of Steviol Multiglycosylated Derivatives and Stevia Components", the contents of which are incorporated herein in their entirety for all purposes.
Claims
What is claimed is:
1. A sweetener composition comprising: (A) a glycosylated steviol glycoside (GSG) composition, wherein the GSG composition comprises at least 70% by weight GSGs and is derived from a first steviol glycoside (SG) composition comprising 20-99.5% rebaudioside A (RA) by weight; and (B) a second SG composition comprising 20-99.5% rebaudioside A by weight, wherein the weight ratio of A:B is in the range of 1:6 to 3.5:1 and wherein the sweetener composition has a measured sucrose equivalence that is greater than the calculated sucrose equivalence of the sweetener composition.
2. The sweetener composition of claim 1, wherein the amount of GSGs in the sweetener composition is less than about 70% by weight.
3. The sweetener composition of claim 2, wherein the amount of GSGs in the sweetener composition is less than about 50% by weight.
4. The sweetener composition of claim 1, wherein the amount of GSGs in the sweetener composition is between 10% to 70% by weight.
5. The sweetener composition of claim 4, wherein the amount of GSGs in the sweetener composition is between 10% to 50% by weight.
6. The sweetener composition of claim 1, wherein the first SG composition comprises rebaudioside A in an amount from about 20% to about 49% by weight.
7. The sweetener composition of claim 1, wherein the first SG composition comprises rebaudioside A in an amount from about 60% to about 97% by weight.
8. The sweetener composition of claim 1, wherein the GSGs in the GSG composition comprise: (a) glycosylated rebaudioside A, or (b) glycosylated stevioside, or (c) glycosylated stevioside and glycosylated rebaudioside A, or (d) glycosylated rebaudioside B, or (e) glycosylated rebaudioside D, or (f) glycosylated rebaudioside A and glycosylated rebaudioside B, or (g) glycosylated rebaudioside A and glycosylated rebaudioside C, or (h) glycosylated rebaudioside A, glycosylated rebaudioside C and glycosylated stevioside, or (i) glycosylated rebaudioside A, glycosylated rebaudioside B and glycosylated rebaudioside C, or (j) glycosylated rebaudioside A, glycosylated rebaudioside B, glycosylated rebaudioside C and glycosylated stevioside, or (k) glycosylated rebaudioside A and glycosylated rebaudioside D, or (l) glycosylated rebaudioside D and glycosylated rebaudioside B, or (m) glycosylated rebaudioside A, glycosylated rebaudioside B and glycosylated rebaudioside D.
9. The sweeter composition of claim 1, wherein the first SG composition comprises from about 20% to about 97% by weight of rebaudioside A, and from about 0% to about 10% by weight of rebaudioside B and/or from about 5% to about 20% by weight of rebaudioside C.
10. The sweetener composition of claim 1, wherein the second SG composition comprises from about 50% to about 99.5% by weight of rebaudioside A.
11. The sweetener composition of claim 10, wherein the second SG composition comprises from about 75% to about 97% by weight of rebaudioside A.
12. The sweetener composition of claim 10, wherein the second SG composition further comprises from 0% to about 20% by weight of rebaudioside B and/or from 0% to about 10% by weight of rebaudioside D.
13. The sweetener composition of claim 12, wherein the second SG composition further comprises from about 10% to about 15% by weight of rebaudioside B and/or from about 6% to about 10% by weight of rebaudioside D.
14. The sweetener composition of claim 1, wherein the first SG composition is RA20, RA30, RA40, RA50, RA60, RA80, or RA95.
15. The sweetener composition of claim 14, wherein the sweetener composition comprises rebaudioside A, rebaudioside A-G1, rebaudioside A-G2, rebaudioside A-G3, rebaudioside A-G4, rebaudioside A-G5, rebaudioside A-G6, rebaudioside A-G7, glycosylated rebaudioside A having more than 7 glycosyl groups, stevioside, stevioside-G1, stevioside-G2, stevioside-G3, stevioside-G4, stevioside-G5, stevioside-G6, stevioside-G7, and glycosylated stevioside having more than 7 glycosyl groups.
16. The sweetener composition of claim 1, further comprising one or more sweeteners selected from the group consisting of cane sugar, beet sugar, honey, sucrose, fructose, maltose, xylitol, sorbitol, dextrose, glucose, mannitol, arabinose, galactose, mannose, rhamnose, xylose, sucralose, aspartame, acesulfame-K, neotame, thaumatin, erythritol, trehalose, raffinose, cellobiose, tagatose, allulose, inulin, N--[N-[3-(3-hydroxy-4-methoxyphenyl)propyl]-alpha-aspartyl]-L-phenylalani- ne 1-methyl ester, glycyrrhizin, thaumatin, and monellin.
17. The sweetener composition of claim 1, further comprising one or more salts selected from the group consisting of sodium carbonate, sodium bicarbonate, sodium chloride, potassium chloride, magnesium chloride, sodium sulfate, magnesium sulfate, and potassium sulfate.
18. The sweetener composition of claim 1, wherein the amount of rebaudioside A in the sweetener composition is between 20% to 49% by weight.
19. The sweetener composition of claim 1, wherein the amount of rebaudioside A in the sweetener composition is between 20% to 40% by weight.
20. The sweetener composition of claim 1, wherein the amount of rebaudioside A in the sweetener composition is between 50% to 59% by weight.
21. The sweetener composition of claim 1, wherein the GSG composition comprises at least 74.25% by weight GSGs.
Description
FIELD OF THE INVENTION
The present invention generally relates to a stevia sweetener that includes one or more glycosylated steviol glycosides and a stevia extract or stevia component.
BACKGROUND OF THE INVENTION
Stevia is a genus of about 240 species of herbs and shrubs in the sunflower family (Asteraceae), native to subtropical and tropical South America and Central America.
The species Stevia rebaudiana Bertoni, commonly known as sweet leaf, sugarleaf, or simply stevia, is widely grown for its sweet leaves. The leaves have traditionally been used as a sweetener. Steviosides and rebaudiosides are the major constituents of glycosides found in the leaves of the stevia plant.
Over 100 phytochemicals have been discovered in stevia. It is rich in terpenes and flavonoids. Of these eight glycosides, stevioside is considered the sweetest and has been tested to be approximately 300 times sweeter than sugar. Stevioside, comprising 6-18% of the stevia leaf, is also the most prevalent glycoside in the leaf. Other sweet constituents include steviolbioside, rebaudiosides A-E, and dulcoside A.
Stevia extracts generally contain a high percentage of the glycosides of the diterpene steviol. The leaves of Stevia rebaudiana contain over 10 different steviol glycosides. Steviol glycosides are considered high intensity sweeteners (about 250-300 times that of sucrose) and have been used for several years in a number of countries as a sweetener for a range of food products. Stevioside and rebaudioside A are the principal sweetening compounds and generally accompanied by smaller amounts of other steviol glycosides. The taste quality of rebaudioside A is better than stevioside, because of increased sweetness and decreased bitterness (Phytochemistry 68, 2007, 1855-1863).
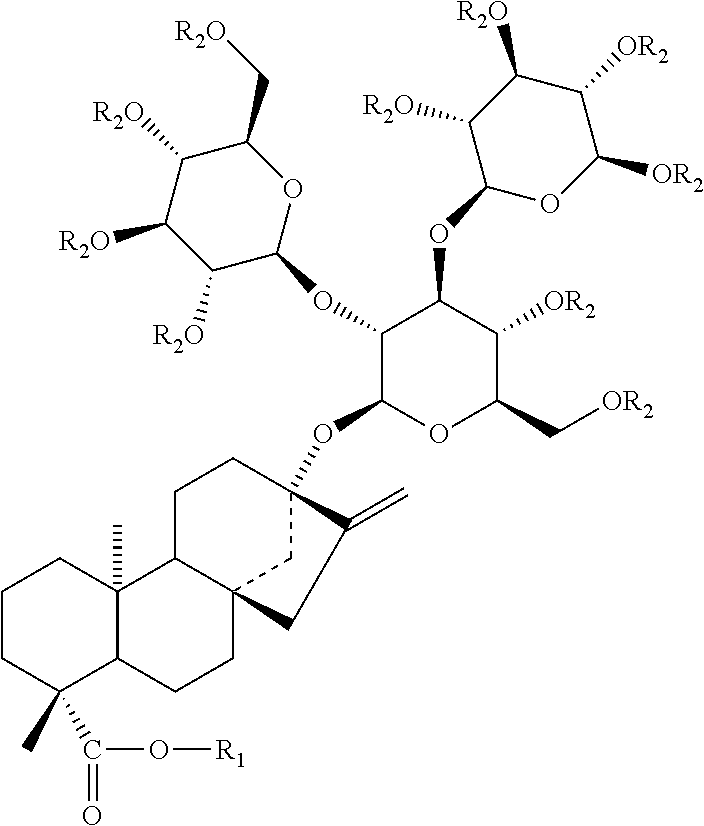
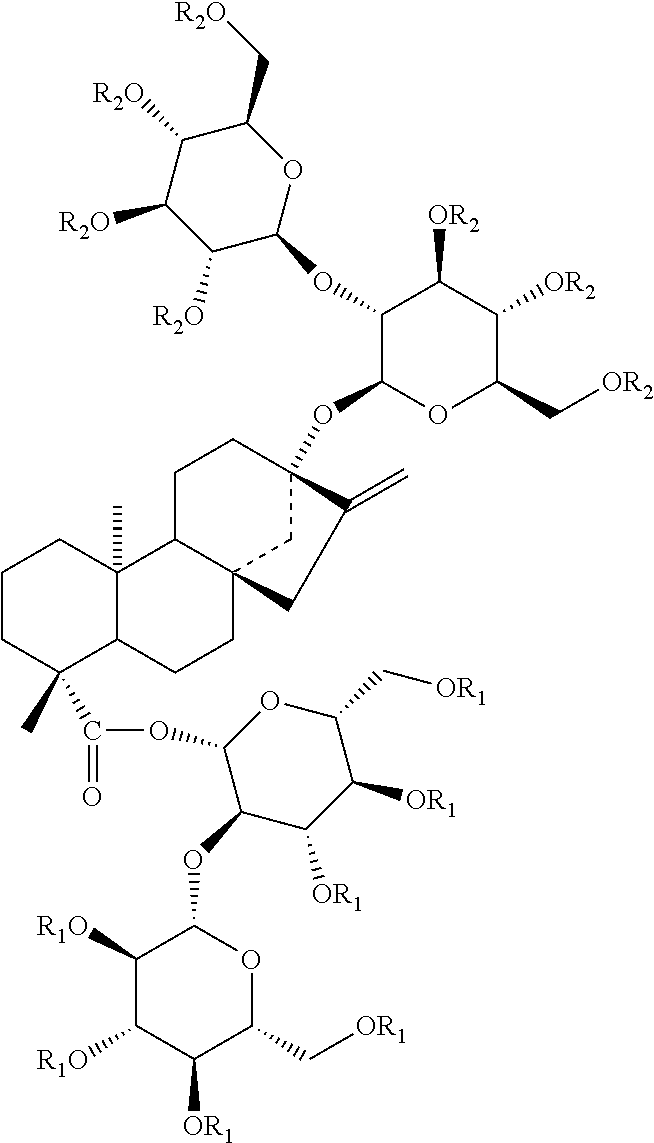
The structures and chemical abstract service registry numbers for steviol and its glycosides that are the main sweetening agents of the additive steviol glycosides are shown below:
##STR00001##
TABLE-US-00001 Compound name C.A.S. No. R.sub.1 R.sub.2 1 Steviol 471-80-7 H H 2 Steviolbioside 41093-60-1 H .beta.-Glc-.beta.- Glc(2.fwdarw.1) 3 Stevioside 57817-89-7 .beta.-Glc .beta.-Glc-.beta.- Glc(2.fwdarw.1) 4 Rebaudioside A 58543-16-1 .beta.-Glc .beta.-Glc-.beta.- Glc(2.fwdarw.1)| .beta.-Glc(3.fwdarw.1) 5 Rebaudioside B 58543-17-2 H .beta.-Glc-.beta.- Glc(2.fwdarw.1)| .beta.-Glc(3.fwdarw.1) 6 Rebaudioside C 63550-99-2 .beta.-Glc .beta.-Glc-.beta.- Rha(2.fwdarw.1)| .beta.-Glc(3.fwdarw.1) 7 Rebaudioside D 63279-13-0 .beta.-Glc-.beta.- .beta.-Glc-.beta.- Glc(2.fwdarw.1) Glc(2.fwdarw.1)| .beta.-Glc(3.fwdarw.1) 8 Rebaudioside E 63279-14-1 .beta.-Glc-.beta.- .beta.-Glc-.beta.- Glc(2.fwdarw.1) Glc(2.fwdarw.1) 9 Rebaudioside F 438045-89-7 .beta.-Glc .beta.-Glc-.beta.- Xly(2.fwdarw.1)| .beta.-Glc(3.fwdarw.1) 10 Rubusoside 63849-39-4 .beta.-Glc .beta.-Glc 11 Dulcoside A 64432-06-0 .beta.-Glc .beta.-Glc-.alpha.- Rha(2.fwdarw.1) 12 Rebaudioside M 1220616-44-3 (.beta.-Glc).sub.2-.beta.- (.beta.-Glc).sub.2-.beta.-glc- (also known as glc- Rebaudioside X)
In addition to the above mentioned steviol glycosides, many steviol glycoside derivatives can be obtained for example, by synthetic manipulation or by enzymatic processes. KR10-2008-0085811 wherein incorporated by reference, discloses the following steviol glycoside derivatives obtained from enzymatic processes.
TABLE-US-00002 ##STR00002## Name R.sub.1 R.sub.2 Stevioside (ST) --H --H Stevioside-G1 -glucosyl --H (ST-G1) --H -glucosyl Stevioside-G2 -(glucosy).sub.2 --H (ST-G2) -glucosyl -glucosyl --H -(glucosy).sub.2
TABLE-US-00003 ##STR00003## Name R.sub.1 R.sub.2 R.sub.3 Rebaudioside A --H --H --H Rebaudioside A -glucosyl --H --H G1 (RA-G1) --H -glucosyl --H --H --H -glucosyl Rebaudioside A -(glucosyl).sub.2 --H --H G2 (RA-G2) --H -(glucosy).sub.2 --H --H --H -(glucosy).sub.2 -glucosyl -glucosyl --H --H -glucosyl -glucosyl -glucosyl --H -glucosyl
As shown, several glucosyl groups can be added on the backbone of a steviol glycoside such as, stevioside and rebaudioside A, by the disclosed enzymatic process. The glycosylated steviol materials with 1 additional glucosyl are referred to as G1, the materials with 2 additional glucosyls are referred to as G2, and so forth. Without limitation, glycosylated steviol glycosides containing even more glucosyl groups can be made.
As a sweetener and sugar substitute, rebaudioside A has a slower onset and longer duration than that of sugar, and be deemed very close to sucrose, although some of its extracts may have a bitter or licorice-like aftertaste at high concentrations. All steviol glycosides are bitter or lingering, some in less degree and some in greater degree.
The relationship between steviol glycoside mixtures, solubility, and how solubility of these mixtures affects the overall taste profile of stevia sweeteners has not been studied in detail.
Therefore, a need exists for glycosidic compositions with superior taste profiles for the food and beverage industry.
BRIEF SUMMARY OF THE INVENTION
Embodiments are presented that surprisingly provide compositions containing a glycosylated steviol glycoside (GSG) or glycosylated steviol glycosides (GSGs) and a steviol glycoside(s). Components in combination with the GSG(s) can include stevia extract, or individual components found in stevia with improved solubility and/or taste profiles over previously reported stevia compositions.
In one aspect of the present invention, a composition is provided that includes one or more glycosylated steviol glycoside and one or more steviol glycoside, wherein the composition is in solid or liquid form. The amount of glycosylated steviol glycoside in the composition is less than about 70 percentage by weight, preferably, less than about 50 percentage by weight, more preferably, from about 10 to less than about 50 percentage by weight, from about 20 to less than about 50 percentage by weight, from about 30 to less than about 50 percentage by weight, from about 40 to less than about 50 percentage by weight, from about 20 to 45 percentage by weight.
The one or more glycosylated steviol glycoside can include glycosylated rebaudioside A, glycosylated stevioside, glycosylated stevioside+glycosylated rebaudioside A, glycosylated rebaudioside B, glycosylated rebaudioside D, glycosylated rebaudioside A+glycosylated rebaudioside B, glycosylated rebaudioside A+glycosylated rebaudioside B+glycosylated stevioside, glycosylated rebaudioside A+glycosylated rebaudioside C, glycosylated rebaudioside A+glycosylated rebaudioside C+glycosylated stevioside, glycosylated rebaudioside A+glycosylated rebaudioside B+glycosylated rebaudioside C, glycosylated rebaudioside A+glycosylated rebaudioside B+glycosylated rebaudioside C+glycosylated stevioside, glycosylated rebaudioside A+glycosylated rebaudioside D, glycosylated rebaudioside D+glycosylated rebaudioside B, or glycosylated rebaudioside A+glycosylated rebaudioside B+glycosylated rebaudioside D.
In particular aspect glycosylated steviol glycoside derived from RA20, RA30, RA40, RA50, RA60, RA80, RA90, RA95, RA97, RA98, RA99, or RA99.5. The glycosylated steviol glycoside can be GSG-RA20, GSG-RA30, GSG-RA40, GSG-RA50, GSG-RA60, GSG-RA80, GSG-RA90, or GSG-RA95, and the GSG-RA20, GSG-RA30, GSG-RA40, GSG-RA50, and GSG-RA60 can include rebaudioside A, rebaudioside A-G1, rebaudioside A-G2, rebaudioside A-G3, rebaudioside A-G4, rebaudioside A-G5, rebaudioside A-G6, rebaudioside A-G7, stevioside, stevioside-G1, stevioside-G2, stevioside-G3, stevioside-G4, stevioside-G5, stevioside G6, and stevioside-G7, and GSG-RA80, or GSG-RA95 can include rebaudioside A, strebaudioside A-G1, rebaudioside A-G2, rebaudioside A-G3, rebaudioside A-G4, rebaudioside A-G5, rebaudioside A-G6, and rebaudioside A-G7.
In another aspect, the composition is an amorphous solid. In some aspects the total glycosides concentration ranges from about 100 ppm to about 1000 ppm, from about 300 ppm to about 500 ppm and preferably about 350 ppm, 400 ppm, or 450 ppm in solution. The compositions of the current embodiments containing any combination of GSG-RA20, GSG-RA30, GSG-RA40, GSG-RA50, GSG-RA95, GSG-RA80, and RA97 together from about 350 ppm to about 450 ppm in solution can provide a SE of 1-20%, preferably 5-15%, and most preferably 7-12%, e.g., 7%, 8%, 9%, 10%, 11%, 12% in solution. In some aspects the compositions further include one or more sweeteners, such as cane sugar, beet sugar, honey, sucrose, fructose, maltose, xylitol, sorbitol, dextrose, glucose, mannitol, arabinose, galactose, mannose, rhamnose, xylose, sucralose, aspartame. stevia acesulfame-K, neotame, thaumatin, erythritol, trehalose, raffinose, cellobiose, tagatose. DOLCIA PRIMA.TM. allulose, inulin, N--[N-[3-(3-hydroxy-4-methoxyphenyl)propyl]-alpha-aspartyl]-L-phenylalani- ne 1-methyl ester, glycyrrhizin, thaumatin, monellin, monk fruit and derivatives, mogorosides 1 through 5, or Luohan Guo juice. In other aspects the compositions further include one or more salts, such as sodium carbonate, sodium bicarbonate, sodium chloride, potassium chloride, magnesium chloride, sodium sulfate, magnesium sulfate, and potassium sulfate, or any edible salt. The compositions can also further include cyclodextrin.
In another aspect, a composition is provided that includes one or more partially glycosylated steviol glycoside and one or more steviol glycoside, wherein the composition is in solid or liquid form. The one or more partially glycosylated steviol glycoside prepared by controlling the glycosylation process can contain from about 50% to about 90% glycosylated rebaudioside A, glycosylated stevioside, glycosylated stevioside+glycosylated rebaudioside A, glycosylated rebaudioside B, glycosylated rebaudioside D, glycosylated rebaudioside A+glycosylated rebaudioside B, glycosylated rebaudioside A+glycosylated rebaudioside D, glycosylated rebaudioside D+glycosylated rebaudioside B, or glycosylated rebaudioside A+glycosylated rebaudioside B+glycosylated rebaudioside D, and from about 10% to about 50% stevioside, rebaudioside A, rebaudioside B, rebaudioside C, or rebaudioside D, based on total glycosides or total glycosylated steviol glycosides in the composition.
In another aspect of the current invention, there is disclosed a composition containing a highly soluble multiple glycosylated rebaudioside A glycoside or glycosylated stevioside glycoside, wherein glycosylated rebaudioside A glycoside or glycosylated stevioside glycoside comprises one or more of rebaudioside A, strebaudioside A-G1, rebaudioside A-G2, rebaudioside A-G3, rebaudioside A-G4, rebaudioside A-G5, rebaudioside A-G6, rebaudioside A-G7, stevioside, stevioside-G1, stevioside-G2, stevioside-G3, stevioside-G4, stevioside-G5, stevioside G6, and stevioside-G7. The highly soluble multiple glycosylated rebaudioside A glycoside or glycosylated stevioside glycoside can be dissolved in solution, wherein the solubility of the glycosylated material is greater than 0.5 g per 100 g of water, and wherein the solubilized glycosylated glycoside material remains stable in the water for greater than 10 days at room temperature. In some aspects, a composition including a spray dried or recrystallized multiple glycosylated rebaudioside A glycoside or glycosylated stevioside glycoside and a spray dried or recrystallized stevia extract. Wherein the spray dried or recrystallized stevia extract includes rebuadioside A, rebaudioside B, rebaudioside C, rebaudioside D, or rubusoside has a solubility of 0.5 g per 100 g of water and remains stable in the water for greater than 10 days at room temperature. The glycosylated rebaudioside A glycoside or glycosylated stevioside glycoside, for example, and a spray dried or recrystallized stevia extract can be spray dried or recrystallized together or spray dried or recrystallized separately. In other aspects, a composition is provided including a spray dried or recrystallized multiple glycosylated rebaudioside A glycoside or glycosylated stevioside glycoside and a stevia extract or a spray dried or recrystallized stevia extract.
In another aspect there is disclosed a process for the preparation of a composition comprising one or more glycosylated steviol glycosides and one or more steviol glycosides with improved solubility in an aqueous solution comprising the following steps: (1) mixing a steviol glycoside and a GSG with water. (2) heating the mixture while stirring, until the mixture was completely dissolved to obtain a clear solution, (3) further stirring the solution at the temperature, and then cooling to ambient temperature. Step (4) can include subjecting the solution to crystallization or spray drying and the mixture can be heated to 40-100.degree. C., 50-90.degree. C., or even 60-70.degree. C., in step (2).
BRIEF DESCRIPTION OF THE DRAWINGS
FIG. 1 is a graphical illustration showing sweetness plotted against the concentration of GSG-RA50.
FIG. 2 is a graphical illustration showing the contribution of GSG-RA50 per ppm to SE.
FIGS. 3-4 are graphical illustrations showing taste profiles of GSG-RA50/RA97 compositions.
FIG. 5 is a graphical illustration showing sweetness plotted against the concentration of GSG-RA95.
FIG. 6 is a graphical illustration showing the contribution of GSG-RA95 per ppm to SE.
FIGS. 7-8 are graphical illustrations showing taste profiles of GSG-RA95/RA97 compositions.
FIG. 9 is a graphical illustration showing the sweetness curve of GSG-RA50 and RA97.
FIG. 10 is a graphical illustration showing the calculated and measured sweetness of GSG-RA50 per ppm in 350 ppm GSG-RA50 and RA97 compositions.
FIG. 11 is a graphical illustration showing the calculated and measured sweetness of GSG-RA50 per ppm in 400 ppm GSG-RA50 and RA97 compositions.
FIG. 12 is a graphical illustration showing the calculated and measured sweetness of GSG-RA50 per ppm in 450 ppm GSG-RA50 and RA97 compositions.
FIG. 13 is a graphical illustration showing the sweetness curve of GSG-RA95 and RA97.
FIG. 14 is a graphical illustration showing the calculated and measured sweetness of GSG-RA95 per ppm in 350 ppm GSG-RA95 and RA97 compositions.
FIG. 15 is a graphical illustration showing the calculated and measured sweetness of GSG-RA95 per ppm in 400 ppm GSG-RA95 and RA97 compositions.
FIG. 16 is a graphical illustration showing the calculated and measured sweetness of GSG-RA95 per ppm in 450 ppm GSG-RA95 and RA97 compositions.
FIG. 17 is an optimized HPLC spectrum of GSG-RA50.
FIG. 18 is an optimized HPLC spectrum of GSG-RA80.
FIG. 19 is an optimized HPLC spectrum of GSG-RA95.
FIG. 20 is an optimized HPLC spectrum of GSG-RA20.
FIG. 21 is an optimized HPLC spectrum of GSG-RA40.
FIG. 22 is an optimized HPLC spectrum of GSG-RA85.
FIG. 23 is an optimized HPLC spectrum of GSG-RA90.
FIG. 24 is a graphical illustration showing the sweetness curve of GSG-RA50 and RA97.
FIG. 25 is a graphical illustration showing the calculated and measured sweetness of GSG-RA50 per ppm in 200 ppm GSG-RA50 and RA97 compositions.
FIG. 26 is a graphical illustration showing the calculated and measured sweetness of GSG-RA50 per ppm in 350 ppm GSG-RA50 and RA97 compositions.
FIG. 27 is a graphical illustration showing the calculated and measured sweetness of GSG-RA50 per ppm in 400 ppm GSG-RA50 and RA97 compositions.
FIG. 28 is a graphical illustration showing the calculated and measured sweetness of GSG-RA50 per ppm in 450 ppm GSG-RA50 and RA97 compositions.
FIG. 29 is a graphical illustration showing the calculated and measured sweetness curves of 500 ppm GSG-RA50 and RA97 compositions.
FIG. 30 is a graphical illustration showing the sweetness curve of GSG-RA60 and RA97.
FIG. 31 is a graphical illustration showing the calculated and measured sweetness of GSG-RA60 per ppm in 350 ppm GSG-RA60 and RA97 compositions.
FIG. 32 is a graphical illustration showing the sweetness curve of GSG-RA70 and RA97.
FIG. 33 is a graphical illustration showing the calculated and measured sweetness of GSG-RA70 per ppm in 350 ppm GSG-RA70 and RA97 compositions.
FIG. 34 is a graphical illustration showing the sweetness curve of GSG-RA80 and RA97.
FIG. 35 is a graphical illustration showing the calculated and measured sweetness of GSG-RA80 per ppm in 350 ppm GSG-RA80 and RA97 compositions.
FIG. 36 is a graphical illustration showing the sweetness curve of GSG-RA90 and RA97.
FIG. 37 is a graphical illustration showing the calculated and measured sweetness of GSG-RA90 per ppm in 350 ppm GSG-RA90 and RA97 compositions.
FIG. 38 is a graphical illustration showing the sweetness curve of GSG-RA95 and RA97.
FIG. 39 is a graphical illustration showing the calculated and measured sweetness of GSG-RA95 per ppm in 200 ppm GSG-RA95 and RA97 compositions.
FIG. 40 is a graphical illustration showing the calculated and measured sweetness of GSG-RA95 per ppm in 350 ppm GSG-RA95 and RA97 compositions.
FIG. 41 is a graphical illustration showing the calculated and measured sweetness of GSG-RA95 per ppm in 400 ppm GSG-RA95 and RA97 compositions.
FIG. 42 is a graphical illustration showing the calculated and measured sweetness of GSG-RA95 per ppm in 450 ppm GSG-RA95 and RA97 compositions.
FIG. 43 is a graphical illustration showing the calculated and measured sweetness curves of GSG-RA95 per ppm in 500 ppm GSG-RA95 and RA97 compositions.
FIG. 44 is a graphical illustration showing the sweetness curve of GSG-(RA50+RC5) and RA97.
FIG. 45 is a graphical illustration showing the calculated and measured sweetness of GSG-RA80 per ppm in 400 ppm GSG-(RA50+RC5) and RA97 compositions.
FIG. 46 is a graphical illustration showing the sweetness curve of GSG-(RA30+RC15) and RA97.
FIG. 47 is a graphical illustration showing the calculated and measured sweetness of GSG-(RA50+RC5) per ppm in 400 ppm GSG-(RA50+RC5) and RA97 compositions.
FIG. 48 is a graphical illustration showing the sweetness curve of GSG-(RA40+RB8) and RA97.
FIG. 49 is a graphical illustration showing the calculated and measured sweetness of GSG-(RA40+RB8) per ppm in 400 ppm GSG-(RA40+RB8) and RA97 compositions.
FIG. 50 is a graphical illustration showing the sweetness curve of GSG-RA20 and RA/RB/RD.
FIG. 51 is a graphical illustration showing the calculated and measured sweetness of GSG-RA20 per ppm in 400 ppm GSG-RA20 and RA/RB/RD compositions.
FIG. 52 is a graphical illustration showing the sweetness curve of GSG-RA95 and RA75/RB15.
FIG. 53 is a graphical illustration showing the calculated and measured sweetness of GSG-RA95 per ppm in 400 ppm GSG-RA95 and RA75/RB15 compositions.
FIG. 54 is a graphical illustration showing the sweetness curve of GSG-RA95 and RA/RD.
FIG. 55 is a graphical illustration showing the calculated and measured sweetness of GSG-RA95 per ppm in 400 ppm GSG-RA95 and RA/RD compositions.
FIG. 56 is a graphical illustration showing the sweetness curve of GSG-RA95 and RA80/RB10/RD6.
FIG. 57 is a graphical illustration showing the calculated and measured sweetness of GSG-RA95 per ppm in 400 ppm GSG-RA95 and RA80/RB10/RD6 compositions.
FIG. 58 is a graphical illustration showing the sweetness curve of GSG-RA80 and RA75/RB15.
FIG. 59 is a graphical illustration showing the calculated and measured sweetness of GSG-RA80 per ppm in 400 ppm GSG-RA80 and RA75/RB15 compositions.
FIG. 60 is a graphical illustration showing the sweetness curve of GSG-RA80 and RA/RD.
FIG. 61 is a graphical illustration showing the calculated and measured sweetness of GSG-RA80 per ppm in 400 ppm GSG-RA80 and RA/RD compositions.
FIG. 62 is a graphical illustration showing the sweetness curve of GSG-RA80 and RA80/RB10/RD6.
FIG. 63 is a graphical illustration showing the calculated and measured sweetness of GSG-RA80 per ppm in 400 ppm GSG-RA80 and RA80/RB10/RD6 compositions.
FIG. 64 is a graphical illustration showing the sweetness curve of GSG-RA50 and RA75/RB15.
FIG. 65 is a graphical illustration showing the calculated and measured sweetness of GSG-RA50 per ppm in 400 ppm GSG-RA50 and RA75/RB15 compositions.
FIG. 66 is a graphical illustration showing the sweetness curve of GSG-RA50 and RA/RD.
FIG. 67 is a graphical illustration showing the calculated and measured sweetness of GSG-RA50 per ppm in 400 ppm GSG-RA50 and RA/RD compositions.
FIG. 68 is a graphical illustration showing the sweetness curve of GSG-RA50 and RA80/RB10/RD6.
FIG. 69 is a graphical illustration showing the calculated and measured sweetness of GSG-RA50 per ppm in 400 ppm GSG-RA50 and RA80/RB10/RD6 compositions.
FIG. 70 is a graphical illustration showing the sweetness curve of GSG-RA40 and RA75/RB15.
FIG. 71 is a graphical illustration showing the calculated and measured sweetness of GSG-RA40 per ppm in 400 ppm GSG-RA40 and RA75/RB5, compositions.
FIG. 72 is a graphical illustration showing the sweetness curve of GSG-RA40 and RA/RD.
FIG. 73 is a graphical illustration showing the calculated and measured sweetness of GSG-RA40 per ppm in 400 ppm GSG-RA40 and RA/RD compositions.
FIG. 74 is a graphical illustration showing the sweetness curve of GSG-RA40 and RA80/RB10/RD6.
FIG. 75 is a graphical illustration showing the calculated and measured sweetness of GSG-RA40 per ppm in 400 ppm GSG-RA40 and RA80/RB10/RD6 compositions.
FIG. 76 is a graphical illustration showing the sweetness curve of GSG-RA20 and RA75/RB15.
FIG. 77 is a graphical illustration showing the calculated and measured sweetness of GSG-RA20 per ppm in 400 ppm GSG-RA20 and RA75/RB15 compositions.
FIG. 78 is a graphical illustration showing the sweetness curve of GSG-RA20 and RA/RD.
FIG. 79 is a graphical illustration showing the calculated and measured sweetness of GSG-RA20 per ppm in 400 ppm GSG-RA20 and RA/RD compositions.
FIG. 80 is a graphical illustration showing the sweetness curve of GSG-RA20 and RA80/RB10/RD6.
FIG. 81 is a graphical illustration showing the calculated and measured sweetness of GSG-RA20 per ppm in 400 ppm GSG-RA20 and RA80/RB10/RD6 compositions.
DETAILED DESCRIPTION
In the specification and in the claims, the terms "including" and "comprising" are open-ended terms and should be interpreted to mean "including, but not limited to . . . ". These terms encompass the more restrictive terms "consisting essentially of" and "consisting of."
It must be noted that as used herein and in the appended claims, the singular forms "a". "an", and "the" include plural reference unless the context clearly dictates otherwise. As well, the terms "a" (or "an"). "one or more" and "at least one" can be used interchangeably herein. It is also to be noted that the terms "comprising". "including", "characterized by" and "having" can be used interchangeably.
Unless defined otherwise, all technical and scientific terms used herein have the same meanings as commonly understood by one of ordinary skill in the art to which this invention belongs. All publications and patents specifically mentioned herein are incorporated by reference in their entirety for all purposes including describing and disclosing the chemicals, instruments, statistical analyses and methodologies which are reported in the publications which might be used in connection with the invention. All references cited in this specification are to be taken as indicative of the level of skill in the art. Nothing herein is to be construed as an admission that the invention is not entitled to antedate such disclosure by virtue of prior invention.
The phrase "steviol glycoside" is recognized in the art and is intended to include the major and minor constituents of stevia. These include, but are not limited to components of stevia such as Steviol. Steviolbioside, Stevioside. Rebaudioside A (RA), Rebaudioside B (RB), Rebaudioside C (RC), Rebaudioside D (RD), Rebaudioside E (RE). Rebaudioside F (RF), Rebaudioside M (RM, also referred to as Rebaudioside X (RX). Rubusoside and Dulcoside A (DA), or Dulcoside (Dul.), herein Dulcoside A has the same definition as Dulcoside.
A "steviol glycoside" as referred to herein, pertains to a material that includes a steviol glycoside found in the stevia plant, such as rebaudioside A (RA), rebaudioside B (RB), rebaudioside D (RD), Stevioside, and the mixture thereof. The steviol glycoside can be purified before use.
A "glycosylated steviol glycoside" as referred to herein, pertains to a steviol glycoside that is glycosylated at multiple positions (including partially glycosylated steviol glycosides) obtained, for example, by synthetic manipulation or by enzymatic processes, such as GSG-RA50.
The phrase "GSG composition(s)" as used herein is intended to mean a combination of at least one GSG and at least one steviol glycoside. The phrase is also intended to include multiple GSGs and multiple steviol glycosides. Further, a GSG composition can further include additional additives described throughout the specification.
The phrase "stevia containing sweetener" is intended to include any composition that is prepared from a stevia plant, such as a stevia extract, or the individual components found in stevia. The sweetener can include one or more of the components associated with the stevia plant, such as those noted above. The sweetener can also include conventional artificial or natural sweeteners, such as sucrose, glucose, maltose, fructose, mannitol, sorbitol, aspartame, inulin, sucralose, acesulfame-K, sodium cyclamate, mogroside and its derivatives, etc.
The acronym "RAxx" is used herein to denote a purity of Rebaudioside A final product isolated from crude extract of Stevia, where "xx" is a number between 01 and 99 and is the percentage of Rebaudioside A in the dried product. More generally, acronyms of the type "YYxx" are used herein to denote the purity of a given ingredient denoted by the placeholder "YY", as a mass percentage of a compound, where "xx" is a number between 01 and 99 and is the percentage of product YY in the product. For instance, a compound that is 95% steviol glycosides ("SG") would be denoted by "SG95", and a compound that is 97% stevioside ("STV") would be denoted by "STV97". A product of that is 97% Rebaudioside A would be denoted by "RA97". Denoted percentages for RA ranged from 90 to 99.5 include a margin of plus or minus 0.5% point (any from 90% to 99.5%), unless otherwise indicated. Denoted percentages for RA ranged from 70 to less than 90 include a margin of plus or minus 0.5% point (any from 70% to less than 90%), unless otherwise indicated. Denoted percentages for RA ranged from 20 to less than 70 include a margin of plus or minus 0.5% point (any from 20% to less than 70%), unless otherwise indicated. For instance. "99% or higher purity Reb A" would include purity between 98.5% Reb A and RA99.5, whereas "RA97" would include a range of 96.5% to 97.5%. "RA99+" means greater than 99.0% purity Reb A. "Pure Reb A" is denoted as RA99.5, and is defined in U.S. Patent Application Publication No. 2006/0083838.
The phrase "sucrose equivalence" or "SE" is the amount of non-sucrose sweetener required to provide the sweetness of a given percentage of sucrose in the same food, beverage, or solution. For instance, a non-diet soft drink typically contains 12 grams of sucrose per 100 ml of water, i.e., 12% sucrose. This means that to be commercially accepted, diet soft drinks must have the same sweetness as a 12% sucrose soft drink, i.e., a diet soft drink must have a 12% SE. Soft drink dispensing equipment assumes an SE of 12%, since such equipment is set up for use with sucrose-based syrups.
The phrase "taste profile" is defined as the temporal profile of all basic tastes of a sweetener. The onset and decay of sweetness when a sweetener is consumed, as perceived by trained human tasters and measured in seconds from first contact with a taster's tongue ("onset") to a cutoff point (typically 180 seconds after onset), is called the "temporal profile of sweetness". A plurality of such human tasters is called a "sensory panel". In addition to sweetness, sensory panels can also judge the temporal profile of the other "basic tastes": bitterness, saltiness, sourness, piquance (aka spiciness), and umami (aka savoriness or meatiness). The onset and decay of bitterness when a sweetener is consumed, as perceived by trained human tasters and measured in seconds from first perceived taste to the last perceived aftertaste at the cutoff point, is called the "temporal profile of bitterness".
The term "flavor" or "flavor characteristic", as used herein, is the combined sensory perception of the components of taste, odor, and/or texture. The term "enhance", as used herein, includes augmenting, intensifying, accentuating, magnifying, and potentiating the sensory perception of a flavor characteristic without changing the nature or quality thereof. The term "modify", as used herein, includes altering, varying, suppressing, depressing, fortifying and supplementing the sensory perception of a flavor characteristic where the quality or duration of such characteristic was deficient.
The term "treated" as used herein describes a GSG+steviol glycoside(s) of the current invention with improved solubility and/or taste profiles in an aqueous solution, in comparison with untreated compositions. Treatment includes the following steps: (1) mixing the composition with water, (2) heating the mixture while stirring, until the mixture was completely dissolved to obtain a clear solution. (3) further stirring the solution at the elevated temperature, (4) cooling to ambient temperature, and (5) subjecting the solution to spray drying. In step (2), the mixture can be heated to 30-200.degree. C., preferably 40-120.degree. C., more preferably 50-90.degree. C., most preferably 60-70.degree. C. In an alternative process of the present invention, the step (5) can be replaced by crystallization of the GSG+steviol glycoside(s).
While not to be bound by theory, the inventors have discovered compositions containing glycosylated steviol glycoside (GSG) or glycosylated steviol glycosides (GSGs) and one or more steviol glycosides resulting in improved taste profiles over previously reported stevia compositions.
The abbreviation "GX" is noted throughout the specification and refers to glycosyl groups "G" where "X" is a value from 1 to 20 and refers to the number of glycosyl groups present in the molecule. For example. Stevioside G1 (ST-G1) has one (1) glycosyl group (G), thus "GG". Stevioside G2 (ST-G2) has two (2) glycosyl groups present, Stevioside G3 (ST-G3) has three (3) glycosyl groups present, Stevioside G4 (ST-G4) has four (4) glycosyl groups present. Stevioside G5 (ST-G5) has five (5) glycosyl groups present, Stevioside G6 (ST-G6) has six (6) glycosyl groups present. Stevioside G7 (ST-G7) has seven (7) groups present. Stevioside G8 (ST-G8) has eight (8) glycosyl groups present. Stevioside G9 (ST-G9) has nine (9) glycosyl groups present, etc. The glycosylation of the molecule can be determined by HPLC-MS as described herein and as exemplified by Example 17.
The technical problems solved by the invention are disclosed and claimed herein.
In one embodiment, glycosylated steviol glycosides (GSGs) can be obtained for example, by synthetic manipulation or by enzymatic processes. The GSGs obtained by these methods are not naturally occurring steviol glycosides. The methods and GSGs found in KR10-2008-0085811 are herein incorporated by reference. Stevioside G1 (ST-G1). Stevioside G2 (ST-G2). Stevioside G3 (ST-G3). Stevioside G4 (ST-G4). Stevioside G5 (ST-G5). Stevioside G6 (ST-G6). Stevioside G7 (ST-G7). Stevioside G8 (ST-G8). Stevioside G9 (ST-G9), Rebaudioside A G1 (RA-G1), Rebaudioside A G2 (RA-G2), Rebaudioside A G3 (RA-G3), Rebaudioside A G4 (RA-G4), Rebaudioside A G5 (RA-G5), Rebaudioside A G6 (RA-G6), Rebaudioside A G7 (RA-G7), Rebaudioside A G8 (RA-G8), Rebaudioside A G9 (RA-G9), Rebaudioside B G1 (RB-G1). Rebaudioside B G2 (RB-G2), Rebaudioside B G3 (RB-G3), Rebaudioside B G4 (RB-G4), Rebaudioside B G5 (RB-G5), Rebaudioside B G6 (RB-G6), Rebaudioside B G7 (RB-G7), Rebaudioside B G8 (RB-G8), Rebaudioside B G9 (RB-G9), Rebaudioside C G1 (RC-G1), Rebaudioside C G2 (RC-G2), Rebaudioside C G3 (RC-G3), Rebaudioside C G4 (RC-G4), Rebaudioside C G5 (RC-G5), Rebaudioside C G6 (RC-G6), Rebaudioside C G7 (RC-G7), Rebaudioside C G8 (RC-G8), Rebaudioside C G9 (RC-G9), or any combination thereof can be incorporated into the sweetener compositions of the current invention. Alternatively in the current embodiments, the glycosylation process can be modified as to provide partially glycosylated steviol glycosides that can have further unique solubility and/or taste profiles.
A suitable method to prepare the glycosylated steviol glycosides (GSGs) can be found, for example, in KR10-2008-0085811 in Examples 1 and 2. It is also anticipated that other steviol glycosides, for example steviol, steviolbioside, rebaudioside B, rebaudioside C, rebaudioside D, rebaudioside E, rebaudioside F, rebaudioside M, rubusoside and dulcoside A can be enzymatically modified to afford their corresponding multiple glycosylated glycosides: Steviol G1, Steviol G2 Steviol G3, Steviol G4, Steviol G5, Steviol G6, Steviol G7, Steviol G8, Steviol G9, Steviobioside G1, Steviobioside G2, Steviobioside G3, Steviobioside G4, Steviobioside G5, Steviobioside G6, Steviobioside G7, Steviobioside G8, Steviobioside G9, Rebaudioside B G1, Rebaudioside B G2, Rebaudioside B G3, Rebaudioside B G4, Rebaudioside B G5, Rebaudioside B G6, Rebaudioside B G7, Rebaudioside B G8, Rebaudioside B G9, Rebaudioside C G1, Rebaudioside C G2, Rebaudioside C G3, Rebaudioside C G4, Rebaudioside C G5, Rebaudioside C G6, Rebaudioside C G7, Rebaudioside C G8, Rebaudioside C G9, Rebaudioside D G1, Rebaudioside D G2, Rebaudioside D G3, Rebaudioside D G4, Rebaudioside D G5, Rebaudioside D G6, Rebaudioside D G7, Rebaudioside D G8, Rebaudioside D G9, Rebaudioside E G1, Rebaudioside E G2, Rebaudioside E G3, Rebaudioside E G4, Rebaudioside E G5, Rebaudioside E G6, Rebaudioside E G7, Rebaudioside E 08, Rebaudioside E G9, Rebaudioside F G1, Rebaudioside F G2, Rebaudioside F G3, Rebaudioside F G4, Rebaudioside F G5, Rebaudioside F G6, Rebaudioside F G7, Rebaudioside F G8, Rebaudioside F G9, Rebaudioside M G1, Rebaudioside M G2, Rebaudioside M G3, Rebaudioside E G4, Rebaudioside M G5, Rebaudioside M G6, Rebaudioside M G7, Rebaudioside M G8, Rebaudioside M G9, Rubusoside G1, Rubusoside G2, Rubusoside G3, Rubusoside G4. Rubusoside G5, Rubusoside G6, Rubusoside G7, Rubusoside G8, Rubusoside G9. Dulcoside A G1, Dulcoside A G2. Dulcoside A G3. Dulcoside A G4. Dulcoside A G5. Dulcoside A G6, Dulcoside A G7, Dulcoside A G8, and Dulcoside A G9. For example, G1 and G2 of steviol, steviolbioside, rebaudioside B, rebaudioside C, rebaudioside D, rebaudioside E, rebaudioside F, rubusoside and ducoside A are shown below.
##STR00004##
TABLE-US-00004 Name R.sub.1 R.sub.2 Steviol -H -H Steviol G1 (S-G1) -glucosyl -H -H -glucosyl Steviol G2 (S-G2) -glucosyl -glucosyl -(glucosyl).sub.2 -H -H -(glucosyl).sub.2
##STR00005##
TABLE-US-00005 Name R.sub.1 R.sub.2 Steviolbioside -H -7H Steviol G1 (S-G1) -glucosyl -7H -H -6H, -glucosyl Steviol G2 (S-G2) -glucosyl -6H, -glucosyl -(glucosyl).sub.2 -7H -H -5H, -2 .times. glucosyl -H -6H, -(glucosyl).sub.2
##STR00006##
TABLE-US-00006 Name R.sub.1 R.sub.2 Rebaudioside B -H -10H Rebaudioside B G1 (RB-G1) -glucosyl -10H -H -9H, -glucosyl Rebaudioside B G2 (RB-G2) -glucosyl, -9H, -glucosyl -(glucosyl).sub.2 -7H -H -8H, -2 .times. glucosyl -H -9H, -(glucosyl).sub.2
##STR00007##
TABLE-US-00007 Name R.sub.1 R.sub.2 Rebaudioside C -4H -9H Rebaudioside C G1 (RC-G1) -3H, -glucosyl -9H -4H -8H, -glucosyl Rebaudioside C G2 (RC-G2) -3H, -glucosyl -8H, -glucosyl -3H, -(glucosyl).sub.2 -9H -2H, -2 .times. glucosyl -9H -4H -7H, -2 .times. glucosyl -4H -8H, -(glucosyl).sub.2
##STR00008##
TABLE-US-00008 Name R.sub.1 R.sub.2 Rebaudioside D -7H -10H Rebaudioside D G1 (RD-G1) -6H, -glucosyl -10H -7H -9H, -glucosyl Rebaudioside D G2 (RD-G2) -6H, -glucosyl -9H, -glucosyl -6H, -(glucosyl).sub.2 -10H -5H, -2 .times. glucosyl -10H -7H -8H, -2 .times. glucosyl -7H -9H, -(glucosyl).sub.2
##STR00009##
TABLE-US-00009 Name R.sub.1 R.sub.2 Rebaudioside E -7H -7H Rebaudioside E G1 (RE-G1) -6H, -glucosyl -7H -7H -6H, -glucosyl Rebaudioside E G2 (RE-G2) -6H, -glucosyl -6H, -glucosyl -6H, -(glucosyl).sub.2 -7H -5H, -2 .times. glucosyl -7H -7H -5H, -2 .times. glucosyl -7H -6H, -(glucosyl).sub.2
##STR00010##
TABLE-US-00010 Name R.sub.1 R.sub.2 Rebaudioside F -4H -9H Rebaudioside F G1 (RF-G1) -3H, -glucosyl -9H -4H -8H, -glucosyl Rebaudioside F G2 (RF-G2) -3H, -glucosyl -8H, -glucosyl -3H, -(glucosyl).sub.2 -9H -2H, -2 .times. glucosyl -9H -4H -7H, -2 .times. glucosyl -4H -8H, -(glucosyl).sub.2
##STR00011##
TABLE-US-00011 Name R.sub.1 R.sub.2 Rubusoside -4H -4H Rubusoside G1 (R-G1) -3H, -glucosyl -4H -4H -3H, -glucosyl Rubusoside G2 (R-G2) -3H, -glucosyl -3H, -glucosyl -3H, -(glucosyl).sub.2 -4H -2H, -2 .times. glucosyl -4H -4H -2H, -2 .times. glucosyl -4H -3H, -(glucosyl).sub.2
##STR00012##
TABLE-US-00012 Name R.sub.1 R.sub.2 Dulcoside A -4H -6H Dulcoside A G1 (DA-G1) -3H, -glucosyl -6H -4H -5H, -glucosyl Dulcoside A G2 (DA-G2) -3H, -glucosyl -5H, -glucosyl -3H, -(glucosyl).sub.2 -6H -2H, -2 .times. glucosyl -6H -4H -4H, -2 .times. glucosyl -4H -5H, -(glucosyl).sub.2
##STR00013##
TABLE-US-00013 Name R.sub.1 R.sub.2 Rebaudioside M -10H -10H Rebaudioside M G1 (RM-G1) -9H, -glucosyl -10H -10H -9H, -glucosyl Rebaudioside M G2 (RM-G2) -9H, -glucosyl -9H, -glucosyl -9H, -(glucosyl).sub.2 -10H -8H, -2 .times. glucosyl -10H -10H -8H, -2 .times. glucosyl -10H -9H, -(glucosyl).sub.2
The GSGs can be treated individually or in combination as defined in the current application or treated in combination with other steviol glycosides that have not been enzymatically modified that are found in the stevia plant or sweet tea extract. The mixtures of GSGs with steviol glycosides found in the stevia plant or sweet tea extract can provide sweetener compositions with increased solubility and/or improved taste.
In a particular aspect, GSG-RA20, GSG-RA30, GSG-RA40, GSG-RA50, GSG-RA60, GSG-RA70, GSG-RA80, GSG-RA90, GSG-RA95, GSG-RA97, GSG-(RA50+RB8), GSG-(RA30+RC15), and GSG-(RA40+RB8) are GSGs which are used to be combined with steviol glycosides, such as RA. RB. RD, etc. GSG-RA20 is typically prepared from RA20 as a key starting material, GSG-RA30 is typically prepared from RA30 as a key starting material, GSG-RA40 is typically prepared from RA40 as a key starting material. GSG-RA50 is typically prepared from RA50 as a key starting material. GSG-RA60 is typically prepared from RA60 as a key starting material, GSG-RA70 is typically prepared from RA70 as a key starting material. GSG-RA80 is prepared from RA80 as the key starting material, GSG-RA90 is typically prepared from RA90 as a key starting material, GSG-RA95 is typically prepared from RA95 as a key starting material, and GSG-RA97 is prepared from RA97 as a key starting material. Since each composition contains varying concentrations of GSGs and steviol glycosides, then each composition may have different solubility and taste properties. It is envisioned that specific ratios of GSGs and steviol glycosides may have unique and beneficial physical and chemical properties that are unknown and have not been previously disclosed.
All of the components of the composition disclosed herein can be purchased or be made by processes known to those of ordinary skill in the art and combined (e.g., precipitation/co-precipitation, mixing, blending, grounding, mortar and pestal, microemulsion, solvothermal, sonochemical, etc.) or treated as defined by the current invention. Specifically in the current disclosure, any one or more of GSG-RA20, GSG-RA30, GSG-RA40, GSG-RA50, GSG-RA60, GSG-RA70, GSG-RA80, GSG-RA90, GSG-RA95, GSG-RA97, GSG-(RA50+RB8). GSG-(RA30+RC15), and GSG-(RA40+RB8) can be combined with one or more of steviol, stevioside, steviolbioside, rebaudioside A, rebaudioside B, rebaudioside C, rebaudioside D, rebaudioside E, rebaudioside F, rebaudioside M, rubusoside and dulcoside A to provide sweetener compositions with improved solubility and/or improved sweetness. The content of GSG or GSGs from any one or more of GSG-RA20, GSG-RA30, GSG-RA40, GSG-RA50, GSG-RA60, GSG-RA70, GSG-RA80, GSG-RA90, GSG-RA95, GSG-RA97, GSG-(RA50+RB8). GSG-(RA30+RC15), and GSG-(RA40+RB8) mixed with the disclosed steviol glycosides such as the steviol glycosides found in the stevia plant or sweet tea extract can be from 1% wt/wt to 100% wt/wt. A GSG or GSGs, such as any one or more of GSG-RA20, GSG-RA30, GSG-RA40, GSG-RA50, GSG-RA60, GSG-RA70, GSG-RA80, GSG-RA90, GSG-RA95, GSG-RA97, GSG-(RA50+RB8). GSG-(RA30+RC15), and GSG-(RA40+RB8) can be included in the composition at 1% wt/wt, 2% wt/wt, 3% wt/wt, 4% wt/wt, 5% wt/wt, 6% wt/wt, 7% wt/wt, 8% wt/wt, 9% wt/wt, 10% wt/wt, II 1% wt/wt, 12% wt/wt, 13% wt/wt, 14% wt/wt, 15% wt/wt, 16% wt/wt, 17% wt/wt, 18% wt/wt, 19% wt/wt, 20% wt/wt, 21% wt/wt, 22% wt/wt, 23% wt/wt, 24% wt/wt, 25% wt/wt, 26% wt/wt, 27% wt/wt, 28% wt/wt, 29% wt/wt, 30% wt/wt, 31% wt/wt, 32% wt/wt, 33% wt/wt, 34% wt/wt, 35% wt/wt, 36% wt/wt, 37% wt/wt, 38% wt/wt, 39% wt/wt, 40% wt/wt, 41% wt/wt, 42% wt/wt, 43% wt/wt, 44% wt/wt, 45% wt/wt, 46% wt/wt, 47% wt/wt, 48% wt/wt, 49% wt/wt, 50% wt/wt, 51% wt/wt, 52% wt/wt, 53% wt/wt, 54% wt/wt, 55% wt/wt, 56% wt/wt, 57% wt/wt, 58% wt/wt, 59% wt/wt, 60% wt/wt, 61% wt/wt, 62% wt/wt, 63% wt/wt, 64% wt/wt, 65% wt/wt, 66% wt/wt, 67% wt/wt, 68% wt/wt, 69% wt/wt, 70% wt/wt, 71% wt/wt, 72% wt/wt, 73% wt/wt, 74% wt/wt, 75% wt/wt, 76% wt/wt, 77% wt/wt, 78% wt/wt, 79% wt/wt, 80% wt/wt, 81% wt/wt, 82% wt/wt, 83% wt/wt, 84% wt/wt, 85% wt/wt, 86% wt/wt, 87% wt/wt, 88% wt/wt, 89% wt/wt, 90% wt/wt, 91% wt/wt, 92% wt/wt, 93% wt/wt, 94% wt/wt, 95% wt/wt, 96% wt/wt, 97% wt/wt, 98% wt/wt, 99% wt/wt, or 100% wt/wt and all ranges between 1 and 100% wt/wt, for example less than about 70 percentage by weight, less than about 50 percentage by weight, from about 1% wt/wt to about 99% wt/wt, from about 1% wt/wt to about 98% wt/wt, from about 1% wt/wt to about 97% wt/wt, from about 1% wt/wt to about 95% wt/wt, from about 1% wt/wt to about 90% wt/wt, from about 1% wt/wt to about 80% wt/wt, from about 1% wt/wt to about 70% wt/wt, from about 1% wt/wt to about 60% wt/wt, from about 1% wt/wt to about 50% wt/wt, from about 1% wt/wt to about 40% wt/wt, from about 1% wt/wt to about 30% wt/wt, from about 1% wt/wt to about 20% wt/wt, from about 1% wt/wt to about 10% wt/wt, from about 1% wt/w to about 5% wt/wt, from about 2% wt/wt to about 99% wt/wt, from about 2% wt/wt to about 98% wt/wt, from about 2% wt/wt to about 97% wt/wt, from about 2% wt/wt to about 95% wt/wt, from about 2% wt/wt to about 90% wt/wt, from about 2% wt/wt to about 80% wt/wt, from about 2% wt/wt to about 70% wt/it, from about 2% wt/wt to about 60% wt/wt, from about 2% wt/wt to about 50% wt/wt, from about 2% wt/wt to about 40% wt/wt, from about 2% wt/wt to about 30% wt/wt, from about 2% wt/wt to about 20% wt/wt, from about 2% wt/wt to about 10% wt/wt, from about 2% wt/wt to about 5% wt/wt, from about 3% wt/wt to about 99% wt/wt, from about 3% wt/wt to about 98% wt/wt, from about 3% wt/wt to about 97% wt/wt, from about 3% % t/wt to about 95% wt/wt, from about 3% wt/wt to about 90% wt/wt, from about 3% wt/wt to about 80% wt/wt, from about 3% wt/wt to about 70% wt/wt, from about 3% wt/wt to about 60% wt/wt, from about 3% wt/wt to about 50% wt/wt, from about 3% wt/wt to about 40% wt/wt, from about 3% wt/wt to about 30% wt/wt, from about 3% wt/wt to about 20% wt/wt, from about 3% wt/wt to about 10% wt/wt, from about 3% wt/wt to about 5% wt/wt, from about 5% wt/wt to about 99% wt/wt, from about 5% wt/wt to about 98% wt/wt, from about 5% wt/wt to about 97% wt/wt, from about 5% wt/wt to about 95% wt/wt, from about 5% wt/wt to about 90% wt/wt, from about 5% wt/wt to about 80% wt/wt, from about 5% wt/wt to about 70% wt/wt, from about 5% wt/wt to about 60% wt/wt, from about 5% wt/wt to about 50% wt/wt, from about 5% wt/wt to about 40% wt/wt, from about 5%1/wt/wt to about 30% wt/wt, from about 5% wt/wt to about 20% wt/wt, from about 5% wt/wt to about 10% wt/wt, from about 10% wt/wt to about 99% wt/wt, from about 10% wt/wt to about 98% wt/wt, from about 10% wt/wt to about 97% wt/wt, from about 10% wt/wt to about 95% wt/wt, from about 10% wt/wt to about 90% wt/wt, from about 10% wt/wt to about 80% wt/wt, from about 10% wt/wt to about 70% wt/wt, from about 10% wt/wt to about 60% wt/wt, from about 10% wt/wt to about 50% wt/wt, from about 10% wt/wt to about 40% wt/wt, from about 10% wt/wt to about 30% wt/wt, from about 10% wt/wt to about 20% wt/wt, from about 20 to less than about 50 percentage by weight, from about 30 to less than about 50 percentage by weight, from about 40 to less than about 50 percentage by weight, and from about 20 to 45 percentage by weight of the sweetening composition.
In another aspect, the one or more steviol glycosides including steviol, stevioside, steviolbioside, rebaudioside A, rebaudioside B, rebaudioside C, rebaudioside D, rebaudioside E, rebaudioside F, rebaudioside M, rubusoside, and dulcoside A are contained in the composition with improved solubility and/or sweetness. The steviol glycosides of the compositions can make up 1% wt/wt, 2% wt/wt, 3% wt/wt, 4% wt/wt, 5% wt/wt, 6% wt/wt, 7% wt/wt, 8% wt/wt, 9% wt/wt, 10% wt/wt, 11% wt/wt, 12% wt/wt, 13% wt/wt, 14% wt/wt, 15% wt/wt, 16% wt/wt, 17% wt/wt, 18% wt/wt, 19% wt/wt, 20% wt/wt, 21% wt/wt, 22% wt/wt, 23% wt/wt, 24% wt/wt, 25% wt/wt, 26% wt/wt, 27% wt/wt, 28% wt/wt, 29% wt/wt, 30% wt/wt, 31% wt/wt, 32% wt/wt, 33% wt/wt, 34% wt/wt, 35% wt/wt, 36% wt/wt, 37% wt/wt, 38% wt/wt, 39% wt/wt, 40% wt/wt, 41% wt/wt, 42% wt/wt, 43% wt/wt, 44% wt/wt, 45% wt/wt, 46% wt/wt, 47% wt/wt, 48% wt/wt, 49% wt/wt, 50% wt/wt, 51% wt/wt, 52% wt/wt, 53% wt/wt, 54% wt/wt, 55% wt/wt, 56% wt/wt, 57% wt/wt, 58% wt/wt, 59% wt/wt, 60% wt/wt, 61% wt/wt, 62% wt/wt, 63% wt/wt, 64% wt/wt, 65% wt/wt, 66% wt/wt, 67% wt/wt, 68% wt/wt, 69% wt/wt, 70% wt/wt, 71% wt/wt, 72% wt/wt, 73% wt/wt, 74% wt/wt, 75% wt/wt, 76% wt/wt, 77% wt/wt, 78% wt/wt, 79% wt/wt, 80% wt/wt, 81% wt/wt, 82% wt/wt, 83% wt/wt, 84% wt/wt, 85% wt/wt, 86% wt/wt, 87% wt/wt, 88% wt/wt, 89% wt/wt, 90% wt/wt, 91% wt/wt, 92% wt/wt, 93% wt/wt, 94% wt/wt, 95% wt/wt, 96% wt/wt, 97% wt/wt, 98% wt/wt, 99% wt/wt, or 100% wt/wt and all ranges between 1 and 100% wt/wt, for example from about 1% wt/wt to about 99% wt/wt, from about 1% a wt/wt to about 98% wt/wt, from about 1% wt/wt to about 97% wt/wt, from about 1% wt/wt to about 95% wt/wt, from about 1% wt/wt to about 90% wt/wt, from about 1% wt/wt to about 80% wt/wt, from about 1% wt/wt to about 70% wt/wt, from about 1% wt/wt to about 60% wt/wt, from about 1% wt/wt to about 50% wt/wt, from about 1% wt/wt to about 40% wt/wt, from about 1% wt/wt to about 30% wt/wt, from about 1% wt/wt to about 20% wt/wt, from about 1% wt/wt to about 10% wt/wt, from about 1% wt/wt to about 5% wt/wt, from about 2% wt/wt to about 99% wt/wt, from about 2 V a wt/wt to about 98% wt/wt, from about 2% wt/wt to about 97% wt/wt, from about 2% wt/wt to about 95% wt/wt, from about 2% wt/wt to about 90% wt/wt, from about 2% wt/wt to about 80% wt/wt, from about 20% wt/wt to about 70% t/wt, from about 2% wt/wt to about 60% wt/wt, from about 20% wt/wt to about 50% wt/wt, from about 2% wt/wt to about 40% wt/wt, from about 2% wt/wt to about 30% wt/wt, from about 2% wt/wt to about 20% wt/wt, from about 2% wt/wt to about 10% wt/wt, from about 2% wt/wt to about 5% wt/wt, from about 3% wt/wt to about 99% wt/wt, from about 3% wt/wt to about 98% wt/wt, from about 3% wt/wt to about 97% wt/wt, from about 3% wt/wt to about 95% wt/wt, from about 3% wt/wt to about 90% wt/wt, from about 3% wt/wt to about 80% wt/wt, from about 3% wt/wt to about 70% wt/wt, from about 3% wt/wt to about 60% wt/wt, from about 3% wt/wt to about 50% wt/wt, from about 3% wt/wt to about 40% wt/wt, from about 3% wt/wt to about 30% wt/wt, from about 3% wt/wt to about 20% wt/wt, from about 3% wt/wt to about 10% wt/wt, from about 3% wt/wt to about 5% wt/wt, from about 5% wt/wt to about 99% wt/wt, from about 5% wt/wt to about 98% wt/wt, from about 5% wt/wt to about 97% wt/wt, from about 5% wt/wt to about 95% wt/wt, from about 5% wt/wt to about 90% wt/wt, from about 5% wt/wt to about 80% wt/wt, from about 5% wt/wt to about 70% wt/wt, from about 5% wt/wt to about 60% wt/wt, from about 5% wt/wt to about 50% wt/wt, from about 5% wt/wt to about 40% wt/wt, from about 5% wt/wt to about 30% wt/wt, from about 5% wt/wt to about 20% wt/w, from about 5% wt/wt to about 10% wt/wt, from about 10% wt/wt to about 99% wt/wt, from about 10% wt/wt to about 98% wt/wt, from about 10% wt/wt to about 97% wt/wt, from about 10% wt/wt to about 95% wt/wt, from about 10% wt/wt to about 90% wt/wt, from about 10% wt/wt to about 80% wt/wt, from about 10% wt/wt to about 70% wt/wt, from about 10% wt/wt to about 60% wt/wt, from about 10% wt/wt to about 50% wt/wt, from about 10% wt/wt to about 40% wt/wt, from about 10% wt/wt to about 30% wt/wt, and from about 10% wt/wt to about 20% wt/wt, of the sweetening composition.
In another aspect, the glycosylated steviol glycoside is derived from steviol glycoside comprising rebaudioside A. The rebaudioside A can range from about 20 to about 100 percentage by weight, from about 20 to about 49 percentage by weight, from about 20 to about 40 percentage by weight, from about 60 to about 97 percentage by weight, and from about 50 to about 59 percentage by weight.
In another aspect, the glycosylated steviol glycoside is derived from steviol glycoside comprising rebaudioside A, and rebaudioside B and/or rebaudioside C. The glycosylated steviol glycoside is derived from steviol glycoside comprising from about 20 to about 97 percentage by weight of rebaudioside A, and from about 0 to about 10 percentage by weight of rebaudioside B and/or from about 5 to about 20 percentage by weight of rebaudioside C, from about 30 to about 60 percentage by weight of rebaudioside A, and from about 0.5 to about 8 percentage by weight of rebaudioside B and/or from about 5 to about 18 percentage by weight of rebaudioside C.
In some aspects, the GSG compositions described herein can contain cyclodextrin (CD), such as alpha, beta, and/or gamma cyclodextrin to help improve solubility and/or taste profile. Cyclodextrins are a family of compounds made up of sugar molecules bound together in a ring, cyclic oligosaccharides. They are composed of 5 or more alpha-D-glucopyranoside units linked 1.fwdarw.4, as in amylose. Cyclodextrins are also referred to as cycloamyloses. Cyclodextrin can make up 1% wt/wt, 2% wt/wt, 3% wt/wt, 4% wt/wt, 5% wt/wt, 6% wt/wt, 7% wt/wt, 8% wt/wt, 9% wt/wt, 10% wt/wt, 11% wt/wt, 12% wt/wt, 13% wt/wt, 14% wt/wt, 15% wt/wt, 16% wt/wt, 17% wt/wt, 18% wt/wt, 19% wt/wt, 20% wt/wt, 21% wt/wt, 22% wt/wt, 23% wt/wt, 24% wt/wt, 25% wt/wt, 26% wt/wt, 27% wt/wt, 28% wt/wt, 29% wt/wt, 30% wt/wt, 31% wt/wt, 32% wt/wt, 33% wt/wt, 34% wt/wt, 35% wt/w, 36% wt/wt, 37% wt/wt, 38% wt/wt, 39% wt/wt, 40% wt/wt, 41% wt/wt, 42% wt/wt, 43% wt/wt, 44% wt/wt, 45% wt/wt, 46% wt/wt, 47% wt/wt, 48% wt/wt, 49% wt/wt, 50% wt/wt, 51% wt/wt, 52% wt/wt, 53% wt/wt, 54% wt/wt, 55% wt/wt, 56% wt/wt, 57% wt/wt, 58% wt/wt, 59% wt/wt, 60% wt/wt, 61% wt/wt, 62% wt/w, 63% wt/wt, 64% wt/wt, 65% wt/wt, 66% wt/wt, 67% wt/wt, 68% wt/wt, 69% wt/wt, 70% wt/wt, 71% wt/wt, 72% wt/wt, 73% wt/wt, 74% wt/wt, 75% wt/wt, 76% wt/wt, 77% wt/wt, 78% wt/wt, 79% wt/wt, 80% wt/wt, 81% wt/wt, 82% wt/wt, 83% wt/wt, 84% wt/wt, 85% wt/wt, 86% wt/wt, 87% wt/wt, 88% wt/wt, 89% wt/wt, 90% wt/wt, 91% wt/wt, 92% wt/wt, 93% wt/wt, 94% wt/wt, 95% wt/wt, 96% wt/wt, 97% wt/wt, 98% wt/wt, 99% wt/wt, or 100% wt/wt and all ranges between 1 and 100% wt/wt, for example from about 1% wt/wt to about 99% wt/wt, from about 1% wt/wt to about 98% wt/wt, from about 1% wt/wt to about 97% wt/wt, from about 1% wt/wt to about 95% wt/wt, from about 1% wt/wt to about 90% wt/wt, from about 1% wt/wt to about 80% wt/wt, from about 1% wt/wt to about 70% wt/wt, from about 1% wt/wt to about 60% wt/wt, from about 1% wt/wt to about 50% wt/wt, from about 1% wt/wt to about 40% wt/wt, from about 1% wt/wt to about 30% wt/wt, from about 1% wt/w to about 20% wt/wt, from about 1% wt/wt to about 10% wt/wt, from about 1% wt/wt to about 5% wt/wt, from about 2% wt/wt to about 99% wt/wt, from about 2% wt/wt to about 98% wt/wt, from about 2% wt/w to about 97% wt/wt, from about 2% wt/wt to about 95% wt/wt, from about 2% wt/w to about 90% wt/wt, from about 2% wt/wt to about 80% wt/wt, from about 2% wt/wt to about 70% wt/wt, from about 2% wt/wt to about 60% wt/wt, from about 2% wt/wt to about 50% wt/wt, from about 2% wt/wt to about 40% wt/wt, from about 2% wt/wt to about 30% wt/wt, from about 2% wt/wt to about 20% wt/wt, from about 2% wt/wt to about 10% wt/wt, from about 2% wt/wt to about 5% wt/wt, from about 3% wt/wt to about 99% wt/wt, from about 3% wt/wt to about 98% wt/wt, from about 3% wt/wt to about 97% wt/wt, from about 3% wt/wt to about 95% wt/wt, from about 3% wt/wt to about 90% wt/wt, from about 3% wt/wt to about 80% wt/w, from about 3% wt/wt to about 70% wt/wt, from about 3% wt/wt to about 60% wt/wt, from about 3% wt/wt to about 50% wt/wt, from about 3% wt/wt to about 40% wt/wt, from about 3% wt/wt to about 30% wt/wt, from about 3% wt/wt to about 20% wt/wt, from about 3% wt/wt to about 10% wt/wt, from about 3% wt/wt to about 5% wt/wt, from about 5% wt/wt to about 99% wt/wt, from about 5% wt/wt to about 98% wt/wt, from about 5% wt/wt to about 97% wt/wt, from about 5% wt/wt to about 95% wt/wt, from about 5% wt/wt to about 90% wt/wt, from about 5% wt/wt to about 80% wt/wt, from about 5% wt/wt to about 70% wt/wt, from about 5% wt/wt to about 60% wt/wt, from about 5% wt/wt to about 50% wt/wt, from about 5% wt/wt to about 40% wt/wt, from about 5% wt/wt to about 30% wt/wt, from about 5% wt/wt to about 20% wt/wt, from about 5% wt/wt to about 10% wt/wt, from about 10% wt/wt to about 99% wt/wt, from about 10% wt/w to about 98% wt/wt, from about 10% wt/wt to about 97% wt/wt, from about 10% wt/wt to about 95% wt/wt, from about 10% wt/wt to about 90% wt/wt, from about 10% wt/wt to about 80% wt/wt, from about 10% wt/wt to about 70% wt/wt, from about 10% wt/wt to about 60% wt/wt, from about 10% wt/wt to about 50% wt/wt, from about 10% wt/wt to about 40% wt/wt, from about 10% wt/wt to about 30% wt/wt, and from about 10% wt/wt to about 20% wt/wt, of the composition.
In another aspect, the GSG compositions disclosed herein may be solubilized in an aqueous solution. The aqueous solution can include water and/or an alcohol, such as one or more of methanol, ethanol, propanol, isopropanol, n-butanol, isobutanol, sec-butanol, tert-butanol, n-pentanol, isopentanol, neopentanol, or combinations thereof.
The water alcohol solution can be less than 60% alcohol, less than 50% alcohol, less than 40% alcohol, less than 30% alcohol, less than 20% alcohol, less than 10% alcohol, less than 5% alcohol, less than 2% alcohol, or less than 1% alcohol by volume.
In another aspect, the compositions containing glycosylated steviol glycosides and steviol glycosides disclosed herein can be provided as solutions with improved sweetness. Specifically, a GSG or GSGs can be combined with one or more of steviol, stevioside, steviolbioside, rebaudioside A, rebaudioside B, rebaudioside C, rebaudioside D, rebaudioside E, rebaudioside F, rebaudioside M, rubusoside, or dulcoside A to provide a sweetened solution with improved sweetness in comparison to each component separately. Alternatively, a GSG or GSGs can be combined with one or more of steviol, stevioside, steviolbioside, rebaudioside A, rebaudioside B, rebaudioside C, rebaudioside D, rebaudioside E, rebaudioside F, rebaudioside M, rubusoside, and dulcoside A and can be treated according to the current invention to provide a sweetened solution with a higher concentration of sweetener having improved sweetness. In a particular aspect, any one or more of GSG or GSGs from GSG-RA20, GSG-RA30, GSG-RA40, GSG-RA50. GSG-RA60, GSG-RA70, GSG-RA80, GSG-RA90, GSG-RA95, GSG-RA97, GSG-(RA50+RB8), GSG-(RA30+RC15), and GSG-(RA40+RB8), combined with steviol, stevioside, steviolbioside, rebaudioside A, rebaudioside B, rebaudioside C, rebaudioside D, rebaudioside E, rebaudioside F, rebaudioside M, rubusoside, or ducoside A can be included in the solution and can range from about 0 to about 2000 ppm of total glycosides, preferably from about 100 ppm to about 1000 ppm of total glycosides, and most preferably from about 300 ppm to about 500 ppm.
In one embodiment, a composition is provided including a GSG and rebaudioside A in solution that has improved sweetness. The GSG can be from GSG-RA50 and the rebaudioside A can be RA50, RA60, RA80, RA95, RA97, RA98, RA99, or RA99.5. The GSG-RA50 can be present in solution at 50 ppm, 100 ppm, 150 ppm, 200 ppm, 250 ppm, 300 ppm, 350 ppm, 400 ppm, 450 ppm, 500 ppm, 550 ppm, 600 ppm, 650 ppm, 700 ppm, 750 ppm, 800 ppm, 850 ppm, 900 ppm, 950 ppm, 1000 ppm or any value or range there between and rebaudioside A can be present at the solution at 50 ppm, 100 ppm, 150 ppm, 200 ppm, 250 ppm, 300 ppm, 350 ppm, 400 ppm, 450 ppm, 500 ppm, 550 ppm, 600 ppm, 650 ppm, 700 ppm, 750 ppm, 800 ppm, 850 ppm, 900 ppm, 950 ppm, 1000 ppm or any value or range there between so the total of steviol glycosides in solution ranges from about 100 ppm to about 2000 ppm, preferably from about 200 ppm to about 1000 ppm, and more preferably from about 300 ppm to about 500 ppm and any value or range there between, specifically 350 ppm, 400 ppm, or 450 ppm. In another embodiment the GSG can be from GSG-RA80 and rebaudioside A can be RA50, RA60, RA80, RA95, RA97, RA98, RA99, or RA99.5. The GSG-RA80 can be present in solution at 50 ppm, 100 ppm, 150 ppm, 200 ppm, 250 ppm, 300 ppm, 350 ppm, 400 ppm, 450 ppm, 500 ppm, 550 ppm, 600 ppm, 650 ppm, 700 ppm, 750 ppm, 800 ppm, 850 ppm, 900 ppm, 950 ppm, 1000 ppm or any value or range there between and rebaudioside A can be present at the solution at 50 ppm, 100 ppm, 150 ppm, 200 ppm, 250 ppm, 300 ppm, 350 ppm, 400 ppm, 450 ppm, 500 ppm, 550 ppm, 600 ppm, 650 ppm, 700 ppm, 750 ppm, 800 ppm, 850 ppm, 900 ppm, 950 ppm, 1000 ppm or any value or range there between so the total of steviol glycosides in solution ranges from about 100 ppm to about 2000 ppm, preferably from about 200 ppm to about 1000 ppm, and more preferably from about 300 ppm to about 500 ppm and any value or range there between, specifically 350 ppm, 400 ppm, or 450 ppm. In yet another embodiment the GSG can be from GSG-RA95 and rebaudioside A can be RA50, RA60, RA80, RA95, RA97, RA98, RA99, or RA99.5. The GSG-RA95 can be present in solution at 50 ppm, 100 ppm, 150 ppm, 200 ppm, 250 ppm, 300 ppm, 350 ppm, 400 ppm, 450 ppm, 500 ppm, 550 ppm, 600 ppm, 650 ppm, 700 ppm, 750 ppm, 800 ppm, 850 ppm, 900 ppm, 950 ppm, 1000 ppm or any value or range there between and rebaudioside A can be present at the solution at 50 ppm, 100 ppm, 150 ppm, 200 ppm, 250 ppm, 300 ppm, 350 ppm, 400 ppm, 450 ppm, 500 ppm, 550 ppm, 600 ppm, 650 ppm, 700 ppm, 750 ppm, 800 ppm, 850 ppm, 900 ppm, 950 ppm, 1000 ppm or any value or range there between so the total of steviol glycosides in solution ranges from about 100 ppm to about 2000 ppm, preferably from about 200 ppm to about 1000 ppm, and more preferably from about 300 ppm to about 500 ppm and any value or range there between, specifically 350 ppm, 400 ppm, or 450 ppm. In yet another embodiment, the GSG can be from GSG-RA20, and rebaudioside A can be RA50, RA60. RA50, RA95, RA97, RA98, RA99, or RA99.5. The GSG-RA20 can be present in solution at 50 ppm, 100 ppm, 150 ppm, 200 ppm, 250 ppm, 300 ppm, 350 ppm, 400 ppm, 450 ppm, 500 ppm, 550 ppm, 600 ppm, 650 ppm, 700 ppm, 750 ppm, 800 ppm, 850 ppm, 900 ppm, 950 ppm, 1000 ppm or any value or range there between and rebaudioside A can be present at the solution at 50 ppm, 100 ppm, 150 ppm, 200 ppm, 250 ppm, 300 ppm, 350 ppm, 400 ppm, 450 ppm, 500 ppm, 550 ppm, 600 ppm, 650 ppm, 700 ppm, 750 ppm, 800 ppm, 850 ppm, 900 ppm, 950 ppm, 1000 ppm or any value or range there between so the total of steviol glycosides in solution ranges from about 100 ppm to about 2000 ppm, preferably from about 200 ppm to about 1000 ppm, and more preferably from about 300 ppm to about 500 ppm and any value or range there between, specifically 350 ppm, 400 ppm, or 450 ppm. In yet another embodiment the GSG can be from GSG-RA40, and rebaudioside A can be RA50, RA60, RA80, RA95, RA97, RA98, RA99, or RA99.5. The GSG-RA40 can be present in solution at 50 ppm, 100 ppm, 150 ppm, 200 ppm, 250 ppm, 300 ppm, 350 ppm, 400 ppm, 450 ppm, 500 ppm, 550 ppm, 600 ppm, 650 ppm, 700 ppm, 750 ppm, 800 ppm, 850 ppm, 900 ppm, 950 ppm, 1000 ppm or any value or range there between and rebaudioside A can be present at the solution at 50 ppm, 100 ppm, 150 ppm, 200 ppm, 250 ppm, 300 ppm, 350 ppm, 400 ppm, 450 ppm, 500 ppm, 550 ppm, 600 ppm, 650 ppm, 700 ppm, 750 ppm, 800 ppm, 850 ppm, 900 ppm, 950 ppm, 1000 ppm or any value or range there between so the total of steviol glycosides in solution ranges from about 100 ppm to about 2000 ppm, preferably from about 200 ppm to about 1000 ppm, and more preferably from about 300 ppm to about 500 ppm and any value or range there between, specifically 350 ppm, 400 ppm, or 450 ppm. Increasing the amount of GSG-RA20, GSG-RA30, or GSG-RA40, or GSG-RA50 or GSG-RA80 or GSG-RA95 can provide a stevia containing composition with increased sweetness and/or solubility compared to an identical composition not containing GSG-RA20, or GSG-RA30, or GSG-RA40, or GSG-RA50 or GSG-RA80 or GSG-RA95. A GSG-RA20, or GSG-RA30, or GSG-RA40, or GSG-RA50 or GSG-RA80 or GSG-RA95 containing composition having increased sweetness can also reduce the amount of other more costly steviol glycosides while at the same time lowering the total amount of steviol glycosides present in the composition. While not to be bound by theory, it is believed that the combination of GSG-RA20, or GSG-RA30, or GSG-RA40, or GSG-RA50 or GSG-RA80 or GSG-RA95 with stevuol glycoside such as RA97, RA75+RB15, RA+RD. RA80+RB10+RD6 at certain ratios provides a synergistic effect to increase sweetness beyond the sweetness expected by simply combining the two different sweeteners, and the combination of GSG-(RA50+RB8). GSG-(RA30+RC15), and GSG-(RA40+RB8) with stevuol glycoside such as RA97 at certain ratios provides a synergistic effect to increase sweetness beyond the sweetness expected by simply combining the two different sweeteners.
The GSG compositions of the current embodiments can also contain one or more salts. The one or more salt can include sodium carbonate, sodium bicarbonate, sodium chloride, potassium chloride, magnesium chloride, sodium sulfate, magnesium sulfate, and potassium sulfate, or any edible salt, for example calcium salts, a metal or metal alkali halide, a metal or metal alkali carbonates, bicarbonates, a metal or metal alkali phosphates, biphosphates, pyrophospate, triphosphate, metaphosphate, a metal or metal alkali sulfate or metabisulfate.
Alternatively other additives can be used in the GSG compositions to enhance flavor characteristics that are sweet, fruity, floral, herbaceous, spicy, aromatic, pungent, "nut-like" (e.g., almond, pecan), "spicy" (e.g., cinnamon, clove, nutmeg, anise and wintergreen). "non-citrus fruit" flavor (e.g., strawberry, cherry, apple, grape, currant, tomato, gooseberry and blackberry), "citrus fruit" flavor (e.g., orange, lemon and grapefruit), and other useful flavors, including coffee, cocoa, peppermint, spearmint, vanilla and maple.
The GSG compositions noted herein can be used as a sugar substitute alone or in combination with a food product.
The GSG compositions noted herein can be used in beverages, broths, and beverage preparations selected from the group comprising carbonated, non-carbonated, frozen, semi-frozen ("slush"), non-frozen, ready-to-drink, concentrated (powdered, frozen, or syrup), dairy, non-dairy, herbal, non-herbal, caffeinated, non-caffeinated, alcoholic, non-alcoholic, flavored, non-flavored, vegetable-based, fruit-based, root/tuber/corm-based, nut-based, other plant-based, cola-based, chocolate-based, meat-based, seafood-based, other animal-based, algae-based, calorie enhanced, calorie-reduced, and calorie-free products, optionally dispensed in open containers, cans, bottles or other packaging. Such beverages and beverage preparations can be in ready-to-drink, ready-to-cook, ready-to-mix, raw, or ingredient form and can use the stevia composition as a sole sweetener or as a co-sweetener.
The GSG compositions noted herein can be used in foods and food preparations (e.g., sweeteners, soups, sauces, flavorings, spices, oils, fats, and condiments) from dairy-based, cereal-based, baked, vegetable-based, fruit-based, root/tuber/corm-based, nut-based, other plant-based, egg-based, meat-based, seafood-based, other animal-based, algae-based, processed (e.g., spreads), preserved (e.g., meals-ready-to-eat rations), and synthesized (e.g., gels) products.
Such foods and food preparations can be in ready-to-eat, ready-to-cook, ready-to-mix, raw, or ingredient form and can use the stevia compositions as a sole sweetener or as a co-sweetener.
The GSG compositions noted herein can be used in candies, confections, desserts, and snacks selected from the group comprising dairy-based, cereal-based, baked, vegetable-based, fruit-based, root/tuber/corm-based, nut-based, gum-based, other plant-based, egg-based, meat-based, seafood-based, other animal-based, algae-based, processed (e.g., spreads), preserved (e.g., meals-ready-to-eat rations), and synthesized (e.g., gels) products. Such candies, confections, desserts, and snacks can be in ready-to-eat, ready-to-cook, ready-to-mix, raw, or ingredient form, and can use the stevia based compositions as a sole sweetener or as a co-sweetener.
The GSG compositions noted herein can be used in prescription and over-the-counter pharmaceuticals, assays, diagnostic kits, and therapies selected from the group comprising weight control, nutritional supplement, vitamins, infant diet, diabetic diet, athlete diet, geriatric diet, low carbohydrate diet, low fat diet, low protein diet, high carbohydrate diet, high fat diet, high protein diet, low calorie diet, non-caloric diet, oral hygiene products (e.g, toothpaste, mouthwash, rinses, floss, toothbrushes, other implements), personal care products (e.g., soaps, shampoos, rinses, lotions, balms, salves, ointments, paper goods, perfumes, lipstick, other cosmetics), professional dentistry products in which taste or smell is a factor (e.g., liquids, chewables, inhalables, injectables, salves, resins, rinses, pads, floss, implements), medical, veterinarian, and surgical products in which taste or smell is a factor (e.g., liquids, chewables, inhalables, injectables, salves, resins, rinses, pads, floss, implements), and pharmaceutical compounding fillers, syrups, capsules, gels, and coating products.
The GSG compositions noted herein can be used in consumer goods packaging materials and containers selected from the group comprising plastic film, thermoset and thermoplastic resin, gum, foil, paper, bottle, box, ink, paint, adhesive, and packaging coating products.
The GSG compositions noted herein can be used in goods including sweeteners, co-sweeteners, coated sweetener sticks, frozen confection sticks, medicine spoons (human and veterinary uses), dental instruments, presweetened disposable tableware and utensils, sachets, edible sachets, potpourris, edible potpourris, artificial flowers, edible artificial flowers, clothing, edible clothing, massage oils, and edible massage oils.
The GSG compositions described herein can also be used with conventional sweeteners (cane sugar, beet sugar, honey, syrups, sucrose, fructose, maltose, xylitol, sorbitol, dextrose, glucose, mannitol, arabinose, glatactose, mannose, rhamnose, xylose, monk fruit and derivatives, mogorosides 1 through 5. Lohan Guo juice, and other "natural" sweeteners) and artificial or synthetic sweeteners (cyclamates and salts thereof, saccharin and salts thereof, sucralose, aspartame, a stevia composition, acesulfame-K, neotame, thaumatin, erythritol, trehalose, raffinose, cellobiose, tagatose, DOLCIA PRIMA.TM. allulose, inulin. N--[N-[3-(3-hydroxy-4-methoxyphenyl)propyl]-alpha-aspartyl]-L-phenylalani- ne 1-methyl ester (hereinafter abbreviated as "ANS9801"), glycyrrhizin, thaumatin, monellin, and other chemically produced high-intensity sweeteners).
Without limitation, the GSG compositions described herein can each individually be in an amorphous form, each individually in a polymorphic form, each individually in a hydrate form, or mixtures thereof.
The following paragraphs enumerated consecutively from 1 through 48 provide for various aspects of the present invention. In one embodiment, in a first paragraph (1), the present invention provides:
1. A composition comprising one or more glycosylated steviol glycoside and one or more steviol glycoside, wherein the composition is in solid or liquid form.
2. The composition of paragraph 1, wherein the amount of glycosylated steviol glycoside in the composition is less than about 70 percentage by weight.
3. The composition of paragraph 2, wherein the amount of glycosylated steviol glycoside in the composition is less than about 50 percentage by weight.
4. The composition of paragraph 2, wherein the amount of glycosylated steviol glycoside in the composition is about 10 or more by weight, less than about 70 percentage by weight.
5. The composition of paragraph 3, wherein the amount of glycosylated steviol glycoside in the composition is about 10 or more by weight, less than about 50 percentage by weight.
6. The composition of paragraph 5, wherein the amount of glycosylated steviol glycoside in the composition is from about 20 to less than about 50 percentage by weight.
7. The composition of paragraph 5, wherein the amount of glycosylated steviol glycoside in the composition is from about 30 to less than about 50 percentage by weight.
8. The composition of paragraph 5, wherein the amount of glycosylated steviol glycoside in the composition is from about 40 to less than about 50 percentage by weight.
9. The composition of paragraph 5, wherein the amount of glycosylated steviol glycoside in the composition is from about 20 to 45 percentage by weight.
10. The composition of paragraph 1, wherein the glycosylated steviol glycoside is derived from steviol glycoside comprising rebaudioside A.
11. The composition of paragraph 2, wherein the glycosylated steviol glycoside is derived from steviol glycoside comprising rebaudioside A.
12. The composition of paragraph 3, wherein the glycosylated steviol glycoside is derived from steviol glycoside comprising rebaudioside A.
13. The composition of paragraph 4, wherein the glycosylated steviol glycoside is derived from steviol glycoside comprising rebaudioside A.
14. The composition of paragraph 5, wherein the glycosylated steviol glycoside is derived from steviol glycoside comprising rebaudioside A.
15. The composition of paragraph 6, wherein the glycosylated steviol glycoside is derived from steviol glycoside comprising rebaudioside A.
16. The composition of paragraph 7, wherein the glycosylated steviol glycoside is derived from steviol glycoside comprising rebaudioside A.
17. The composition of paragraph 8, wherein the glycosylated steviol glycoside is derived from steviol glycoside comprising rebaudioside A.
18. The composition of paragraph 9, wherein the glycosylated steviol glycoside is derived from steviol glycoside comprising rebaudioside A.
19. The composition of paragraph 10, wherein the glycosylated steviol glycoside is derived from steviol glycoside comprising rebaudioside A ranged from about 20 to about 100 percentage by weight.
20. The composition of paragraph 11, wherein the glycosylated steviol glycoside is derived from glycosylating steviol glycoside comprising rebaudioside A ranged from about 20 to about 100 percentage by weight.
21. The composition of paragraph 12, wherein the glycosylated steviol glycoside is derived from glycosylating steviol glycoside comprising rebaudioside A ranged from about 20 to about 100 percentage by weight.
22. The composition of paragraph 13, wherein the glycosylated steviol glycoside is derived from glycosylating steviol glycoside comprising rebaudioside A ranged from about 20 to about 100 percentage by weight.
23. The composition of paragraph 14, wherein the glycosylated steviol glycoside is derived from glycosylating steviol glycoside comprising rebaudioside A ranged from about 20 to about 100 percentage by weight.
24. The composition of paragraph 15, wherein the glycosylated steviol glycoside is derived from glycosylating steviol glycoside comprising rebaudioside A ranged from about 20 to about 100 percentage by weight.
25. The composition of paragraph 16, wherein the glycosylated steviol glycoside is derived from glycosylating steviol glycoside comprising rebaudioside A ranged from about 20 to about 100 percentage by weight.
26. The composition of paragraph 17, wherein the glycosylated steviol glycoside is derived from glycosylating steviol glycoside comprising rebaudioside A ranged from about 20 to about 100 percentage by weight.
27. The composition of paragraph 18, wherein the glycosylated steviol glycoside is derived from glycosylating steviol glycoside comprising rebaudioside A ranged from about 20 to about 100 percentage by weight.
28. The composition of paragraph 19, wherein the amount of rebaudioside A ranges from about 20 to about 49 percentage by weight.
29. The composition of paragraph 20, wherein the amount of rebaudioside A ranges from about 20 to about 49 percentage by weight.
30. The composition of paragraph 21, wherein the amount of rebaudioside A ranges from about 20 to about 49 percentage by weight.
31. The composition of paragraph 22, wherein the amount of rebaudioside A ranges from about 20 to about 49 percentage by weight.
32. The composition of paragraph 23, wherein the amount of rebaudioside A ranges from about 20 to about 49 percentage by weight.
33. The composition of paragraph 24, wherein the amount of rebaudioside A ranges from about 20 to about 49 percentage by weight.
34. The composition of paragraph 25, wherein the amount of rebaudioside A ranges from about 20 to about 49 percentage by weight.
35. The composition of paragraph 26, wherein the amount of rebaudioside A ranges from about 20 to about 49 percentage by weight.
36. The composition of paragraph 27, wherein the amount of rebaudioside A ranges from about 20 to about 49 percentage by weight.
37. The composition of paragraph 28, wherein the amount of rebaudioside A ranges from about 20 to about 40 percentage by weight.
38. The composition of paragraph 29, wherein the amount of rebaudioside A ranges from about 20 to about 40 percentage by weight.
39. The composition of paragraph 30, wherein the amount of rebaudioside A ranges from about 20 to about 40 percentage by weight.
40. The composition of paragraph 31, wherein the amount of rebaudioside A ranges from about 20 to about 40 percentage by weight.
41. The composition of paragraph 32, wherein the amount of rebaudioside A ranges from about 20 to about 40 percentage by weight.
42. The composition of paragraph 33, wherein the amount of rebaudioside A ranges from about 20 to about 40 percentage by weight.
43. The composition of paragraph 34, wherein the amount of rebaudioside A ranges from about 20 to about 40 percentage by weight.
44. The composition of paragraph 35, wherein the amount of rebaudioside A ranges from about 20 to about 40 percentage by weight.
45. The composition of paragraph 36, wherein the amount of rebaudioside A ranges from about 20 to about 40 percentage by weight.
46. The composition of paragraph 19, wherein the amount of rebaudioside A ranges from about 60 to about 97 percentage by weight.
47. The composition of paragraph 20, wherein the amount of rebaudioside A ranges from about 60 to about 97 percentage by weight.
48. The composition of paragraph 21, wherein the amount of rebaudioside A ranges from about 60 to about 97 percentage by weight.
49. The composition of paragraph 22, wherein the amount of rebaudioside A ranges from about 60 to about 97 percentage by weight.
50. The composition of paragraph 23, wherein the amount of rebaudioside A ranges from about 60 to about 97 percentage by weight.
51. The composition of paragraph 24, wherein the amount of rebaudioside A ranges from about 60 to about 97 percentage by weight.
52. The composition of paragraph 25, wherein the amount of rebaudioside A ranges from about 60 to about 97 percentage by weight.
53. The composition of paragraph 26, wherein the amount of rebaudioside A ranges from about 60 to about 97 percentage by weight.
54. The composition of paragraph 27, wherein the amount of rebaudioside A ranges from about 60 to about 97 percentage by weight.
55. The composition of paragraph 19, wherein the amount of rebaudioside A ranges from about 50 to about 59 percentage by weight.
56. The composition of paragraph 20, wherein the amount of rebaudioside A ranges from about 50 to about 59 percentage by weight.
57. The composition of paragraph 21, wherein the amount of rebaudioside A ranges from about 50 to about 59 percentage by weight.
58. The composition of paragraph 22, wherein the amount of rebaudioside A ranges from about 50 to about 59 percentage by weight.
59. The composition of paragraph 23, wherein the amount of rebaudioside A ranges from about 50 to about 59 percentage by weight.
60. The composition of paragraph 24, wherein the amount of rebaudioside A ranges from about 50 to about 59 percentage by weight.
61. The composition of paragraph 25, wherein the amount of rebaudioside A ranges from about 50 to about 59 percentage by weight.
62. The composition of paragraph 26, wherein the amount of rebaudioside A ranges from about 50 to about 59 percentage by weight.
63. The composition of paragraph 27, wherein the amount of rebaudioside A ranges from about 50 to about 59 percentage by weight.
64. The composition of paragraph 1, wherein the one or more glycosylated steviol glycoside comprises glycosylated rebaudioside A, glycosylated stevioside, glycosylated stevioside+glycosylated rebaudioside A, glycosylated rebaudioside B, glycosylated rebaudioside D, glycosylated rebaudioside A+glycosylated rebaudioside B, glycosylated rebaudioside A+glycosylated rebaudioside D, glycosylated rebaudioside D+glycosylated rebaudioside B, or glycosylated rebaudioside A+glycosylated rebaudioside B+glycosylated rebaudioside D.
65. The composition of paragraph 1, wherein the one or more glycosylated steviol glycoside comprises .gtoreq.20% glycosylated rebaudioside A, glycosylated stevioside, glycosylated stevioside+glycosylated rebaudioside A, glycosylated rebaudioside B, glycosylated rebaudioside D, glycosylated rebaudioside A+glycosylated rebaudioside B, glycosylated rebaudioside A+glycosylated rebaudioside D, glycosylated rebaudioside D+glycosylated rebaudioside B, or glycosylated rebaudioside A+glycosylated rebaudioside B+glycosylated rebaudioside D, based on total glycosides or total glycosylated steviol glycosides in the composition.
66. The composition of paragraph 65, wherein the one or more glycosylated steviol glycoside comprises .gtoreq.30% glycosylated rebaudioside A, glycosylated stevioside, glycosylated stevioside+glycosylated rebaudioside A, glycosylated rebaudioside B, glycosylated rebaudioside D, glycosylated rebaudioside A+glycosylated rebaudioside B, glycosylated rebaudioside A+glycosylated rebaudioside D, glycosylated rebaudioside D+glycosylated rebaudioside B, or glycosylated rebaudioside A+glycosylated rebaudioside B+glycosylated rebaudioside D, based on total glycosides or total glycosylated steviol glycosides in the composition.
67. The composition of paragraph 66, wherein the one or more glycosylated steviol glycoside comprises 240% glycosylated rebaudioside A, glycosylated stevioside, glycosylated stevioside+glycosylated rebaudioside A, glycosylated rebaudioside B, glycosylated rebaudioside D, glycosylated rebaudioside A+glycosylated rebaudioside B, glycosylated rebaudioside A+glycosylated rebaudioside D, glycosylated rebaudioside D+glycosylated rebaudioside B, or glycosylated rebaudioside A+glycosylated rebaudioside B+glycosylated rebaudioside D, based on total glycosides or total glycosylated steviol glycosides in the composition.
68. The composition of paragraph 67, wherein the one or more glycosylated steviol glycoside comprises .gtoreq.60% glycosylated rebaudioside A, glycosylated stevioside, glycosylated stevioside+glycosylated rebaudioside A, glycosylated rebaudioside B, glycosylated rebaudioside D, glycosylated rebaudioside A+glycosylated rebaudioside B, glycosylated rebaudioside A+glycosylated rebaudioside D, glycosylated rebaudioside D+glycosylated rebaudioside B, or glycosylated rebaudioside A+glycosylated rebaudioside B+glycosylated rebaudioside D, based on total glycosides or total glycosylated steviol glycosides in the composition.
69. The composition of paragraph 1, wherein the glycosylated steviol glycoside is derived from steviol glycoside comprising rebaudioside A, and rebaudioside B and/or rebaudioside C.
70. The composition of paragraph 2, wherein the glycosylated steviol glycoside is derived from steviol glycoside comprising rebaudioside A, and rebaudioside B and/or rebaudioside C.
71. The composition of paragraph 65, wherein the glycosylated steviol glycoside is derived from steviol glycoside comprising from about 20 to about 97 percentage by weight of rebaudioside A, and from about 0 to about 10 percentage by weight of rebaudioside B and/or from about 5 to about 20 percentage by weight of rebaudioside C.
72. The composition of paragraph 67, wherein the glycosylated steviol glycoside is derived from steviol glycoside comprising from about 30 to about 60 percentage by weight of rebaudioside A, and from about 0.5 to about 8 percentage by weight of rebaudioside B and/or from about 5 to about 18 percentage by weight of rebaudioside C.
73. The composition of paragraph 1, wherein the one or more steviol glycoside is steviol, stevioside, steviolbioside, rebaudioside A, rebaudioside B, rebaudioside C, rebaudioside D, rebaudioside E, rebaudioside F, rebaudioside M, rubusoside, or dulcoside A.
74. The composition of paragraph 73, wherein the one or more steviol glycoside is rebaudioside A, rebaudioside B, rebaudioside D, rebaudioside A+rebaudioside B, rebaudioside A+rebaudioside D, rebaudioside B+rebaudioside D, or rebaudioside A+rebaudioside B+rebaudioside D.
75. The composition of paragraph 73, wherein the steviol glycoside comprises from about 50 to about 99.5 percentage by weight of rebaudioside A.
76. The composition of paragraph 75, wherein the steviol glycoside comprises from about 75 to about 97 percentage by weight of rebaudioside A.
77. The composition of paragraph 76, wherein steviol glycoside further comprises from 0 to about 20 percentage by weight of rebaudioside B and/or from 0 to about 10 percentage by weight of rebaudioside D.
78. The composition of claim 77, wherein steviol glycoside further comprises from about 10 to about 15 percentage by weight of rebaudioside B and/or from about 6 to about 10 percentage by weight of rebaudioside D.
79. The composition of paragraph 75, wherein the rebaudioside A is RA20. RA40, RA50, RA60, RA80, RA95, RA97, RA98, RA99, or RA99.5.
80. The composition of paragraph 79, wherein the glycosylated steviol glycoside derived from the glycosylation of RA50 comprises rebaudioside A, rebaudioside A-G1, rebaudioside A-G2, stevioside, and stevioside-G1, stevioside-G2.
81. The composition of paragraph 80, wherein the glycosylated steviol glycoside derived from the glycosylation of RA50 comprises rebaudioside A, strebaudioside A-G1, rebaudioside A-G2, rebaudioside A-G3, rebaudioside A-G4, rebaudioside A-G5, rebaudioside A-G6, rebaudioside A-G7, glycosylated rebaudioside A having glycosyl group to be more than 7, stevioside, stevioside-G1, stevioside-G2, stevioside-G3, stevioside-G4, stevioside-G5, stevioside G6, stevioside-G7, and glycosylated stevioside having glycosyl group to be more than 7. Glycosylated rebaudioside C can not be detected in the glycosylated steviol glycoside derived from the glycosylation of RA50.
82. The composition of paragraph 79, wherein the glycosylated steviol glycoside derived from the glycosylation of RA80 comprises rebaudioside A, rebaudioside A-G1, rebaudioside A-G2.
83. The composition of paragraph 82, wherein the glycosylated steviol glycoside derived from the glycosylation of RA80 comprises rebaudioside A, rebaudioside A-G1, rebaudioside A-G2, rebaudioside A-G3, rebaudioside A-G4, rebaudioside A-G5, rebaudioside A-G6, rebaudioside A-G7 and glycosylated rebaudioside A having glycosyl group to be more than 7. Glycosylated rebaudioside C can not be detected in the glycosylated steviol glycoside derived from the glycosylation of RA80.
84. The composition of paragraph 79, wherein the glycosylated steviol glycoside derived from the glycosylation of RA95 comprises rebaudioside A, rebaudioside A-G1, rebaudioside A-G2.
85. The composition of paragraph 84, wherein the glycosylated steviol glycoside derived from the glycosylation of RA95 comprises rebaudioside A, rebaudioside A-G1, rebaudioside A-G2, rebaudioside A-G3, rebaudioside A-G4, rebaudioside A-G5, rebaudioside A-G6, rebaudioside A-G7 and glycosylated rebaudioside A having glycosyl group to be more than 7. Glycosylated rebaudioside C can not be detected in the glycosylated steviol glycoside derived from the glycosylation of RA95.
86. The composition of paragraph 79, wherein the glycosylated steviol glycoside derived from the glycosylation of RA20 comprises rebaudioside A, rebaudioside A-G1, rebaudioside A-G2, stevioside, stevioside-G1, stevioside-G2, rebaudioside C, rebaudioside C-G1, and rebaudioside C-G2.
87. The composition of paragraph 86, wherein the glycosylated steviol glycoside derived from the glycosylation of RA20 comprises rebaudioside A, rebaudioside A-G1, rebaudioside A-G2, rebaudioside A-G3, rebaudioside A-G4, rebaudioside A-G5, rebaudioside A-G6, rebaudioside A-G7, glycosylated rebaudioside A having glycosyl group to be more than 7, stevioside, stevioside-G1, stevioside-G2, stevioside-G3, stevioside-G4, stevioside-G5, stevioside G6, stevioside-G7, glycosylated stevioside having glycosyl group to be more than 7, rebaudioside C, rebaudioside C-G1, rebaudioside C-G2, rebaudioside C-G3, rebaudioside C-G4, rebaudioside C-G5, rebaudioside C-G6, rebaudioside C-G7, and glycosylated rebaudioside C having glycosyl group to be more than 7.
88. The composition of paragraph 87, wherein the amount of glycosylated steviol glycoside derived by rebaudioside A is from about 30 to about 40 percentage by weight, the amount of glycosylated steviol glycoside derived by stevioside is from about 20 to about 30 percentage by weight, and the amount of glycosylated steviol glycoside derived by rebaudioside C is from about 10 to about 20 percentage by weight.
89. The composition of paragraph 88, wherein the glycosylated steviol glycoside derived from the glycosylation of RA40 comprises rebaudioside A, rebaudioside A-G1, rebaudioside A-G2, stevioside, stevioside-G1, stevioside-G2, rebaudioside C, rebaudioside C-G1, and rebaudioside C-G2.
90. The composition of paragraph 89, wherein the glycosylated steviol glycoside derived from the glycosylation of RA40 comprises rebaudioside A, rebaudioside A-G1, rebaudioside A-G2, rebaudioside A-G3, rebaudioside A-G4, rebaudioside A-G5, rebaudioside A-G6, rebaudioside A-G7, glycosylated rebaudioside A having glycosyl group to be more than 7, stevioside, stevioside-G1, stevioside-G2, stevioside-G3, stevioside-G4, stevioside-G5, stevioside G6, stevioside-G7, and glycosylated stevioside having glycosyl group to be more than 7. Glycosylated rebaudioside C can not be detected in the glycosylated steviol glycoside derived from the glycosylation of RA40.
91. The composition of paragraph 1, wherein the composition is an amorphous solid.
92. The composition of paragraph 91, wherein the ratio of the one or more glycosylated steviol glycoside to the one or more steviol glycoside is 1 to 0.4 or more; preferably 1 to 1 or more.
93. The composition of paragraph 92, wherein the ratio of the one or more glycosylated steviol glycoside to the one or more steviol glycoside is from about 1:0.4 to about 1:9, preferably 1:1 to 1:9.
94. The composition of paragraph 93, wherein the ratio of the one or more glycosylated steviol glycoside to the one or more steviol glycoside is from about 1:1 to about 1:2.3, preferably 1:1 to 1:1.5, more preferably 1:1.2 to 1:4.
95. The composition of any of paragraph 1, wherein the total glycosides concentration ranges from about 100 ppm to about 1000 ppm in solution.
96. The composition of paragraph 95, wherein the total glycosides concentration ranges from about 300 ppm to about 500 ppm in solution.
97. The composition of paragraph 96, wherein the total glycosides concentration is about 350 ppm, 400 ppm, or 450 ppm in solution.
98. The composition of paragraph 97, wherein glycosylated steviol glycoside derived from RA50 and steviol glycoside of RA97 together comprise from about 350 ppm to about 450 ppm in solution.
99. The composition of paragraph 97, wherein glycosylated steviol glycoside derived from RA95 and steviol glycoside of RA97 together comprise from about 350 ppm to about 450 ppm in solution.
100. The composition of paragraph 97, wherein glycosylated steviol glycoside derived from RA80 and steviol glycoside of RA97 together comprise from about 350 ppm to about 450 ppm in solution.
101. The composition of paragraph 97, wherein glycosylated steviol glycoside derived from RA50, RA80, RA95, and steviol glycoside of RA97 together comprise from about 350 ppm to about 450 ppm in solution.
102. The composition of paragraph 1, wherein the composition provides a SE of 1-20%, preferably 5-15%, and most preferably 7-12%, e.g., 7%, 8%, 9%, 10%, 11%, 12% in solution.
103. The composition of paragraph 1, further comprising one or more sweeteners, such as cane sugar, beet sugar, honey, sucrose, fructose, maltose, xylitol, sorbitol, dextrose, glucose, mannitol, arabinose, glatactose, mannose, rhamnose, xylose, sucralose, aspartame. stevia acesulfame-K, neotame, thaumatin, erythritol, trehalose, raffinose, cellobiose, tagatose. DOLCIA PRIMA.TM. allulose, inulin, N--[N-[3-(3-hydroxy-4-methoxyphenyl)propyl]-alpha-aspartyl]-L-phenylalani- ne 1-methyl ester, glycyrrhizin, thaumatin, monellin, monk fruit and derivatives, mogorosides 1 through 5, or Lohan Guo juice.
104. The composition of paragraph 103, the amount of sweeteners is 0.5-10% by weight.
105. The composition of paragraph 1, further comprising one or more salts, such as sodium carbonate, sodium bicarbonate, sodium chloride, potassium chloride, magnesium chloride, sodium sulfate, magnesium sulfate, and potassium sulfate, or any edible salt.
106. A composition comprising one or more half-glycosylated steviol glycoside and one or more steviol glycoside, wherein the composition is in solid or liquid form.
107. The composition of paragraph 106, wherein the one or more half-glycosylated steviol glycoside comprises from about 50% to about 90% glycosylated rebaudioside A, glycosylated stevioside, glycosylated stevioside+glycosylated rebaudioside A, glycosylated rebaudioside B, glycosylated rebaudioside D, glycosylated rebaudioside A+glycosylated rebaudioside B, glycosylated rebaudioside A+glycosylated rebaudioside D, glycosylated rebaudioside D+glycosylated rebaudioside B, or glycosylated rebaudioside A+glycosylated rebaudioside B+glycosylated rebaudioside D, based on total glycosides or total glycosylated steviol glycosides in the composition.
108. The composition of paragraph 107, wherein the one or more steviol glycoside comprises from about 10% to about 50% stevioside, rebaudioside A, rebaudioside B, rebaudioside C, or rebaudioside D, based on total glycosides or total glycosylated steviol glycosides in the composition.
109. A composition comprising a highly soluble multiple glycosylated rebaudioside A glycoside or glycosylated stevioside glycoside, wherein the glycosylated rebaudioside A glycoside or glycosylated stevioside glycoside comprises one or more of rebaudioside A, strebaudioside A-G1, rebaudioside A-G2, rebaudioside A-G3, rebaudioside A-G4, rebaudioside A-G5, rebaudioside A-G6, rebaudioside A-G7, stevioside, stevioside-G1, stevioside-G2, stevioside-G3, stevioside-G4, stevioside-G5, stevioside G6, and stevioside-G7.
110. The highly soluble multiple glycosylated rebaudioside A glycoside or glycosylated stevioside glycoside, wherein the solubility of the glycoside is greater than 0.5 g per 100 g of water.
111. The composition of paragraph 110, wherein the ratio of glycosylated steviol glycoside derived from RA50 to steviol glycosides is 9:1 or more.
112. The highly soluble multiple glycosylated rebaudioside A glycoside or glycosylated stevioside glycoside of paragraph 33, wherein the solubilized glycoside remains stable in the water for greater than 10 days at room temperature.
113. A composition comprising a spray dried or recrystallized multiple glycosylated rebaudioside A glycoside or glycosylated stevioside glycoside and a spray dried or recrystallized stevia extract.
114. The composition of paragraph 113, wherein the spray dried or recrystallized stevia extract comprises rebuadioside A, rebaudioside B, rebaudioside C, rebaudioside D, or rubusoside.
115. The composition of paragraph 114, wherein the spray dried or recrystallized stevia extract has a solubility of 0.5 g per 100 g of water.
116. The composition of paragraph 115 wherein the composition remains stable in the water for greater than 10 days at room temperature.
117. The composition of paragraph 113, wherein the glycosylated rebaudioside A glycoside or glycosylated stevioside glycoside and a spray dried or recrystallized stevia extract are spray dried or recrystallized together.
118. The composition of paragraph 113, wherein the glycosylated rebaudioside A glycoside or glycosylated stevioside glycoside and a spray dried or recrystallized stevia extract are spray dried or recrystallized separately.
119. A composition comprising a spray dried or recrystallized multiple glycosylated rebaudioside A glycoside or glycosylated stevioside glycoside and a stevia extract.
120. A composition comprising a multiple glycosylated rebaudioside A glycoside or glycosylated stevioside glycoside and a spray dried or recrystallized stevia extract.
121. A process for the preparation of a composition comprising one or more glycosylated steviol glycosides and one or more steviol glycosides to provide improved solubility in an aqueous solution comprising the following steps: (1) mixing a glycosylated steviol glycoside and a steviol glycoside with water, (2) heating the mixture while stirring, until the mixture was completely dissolved to obtain a clear solution, (3) further stirring the solution at the temperature, and then cooling to ambient temperature.
122. The process according to paragraph 121, wherein a further step (4) is added to include subjecting the solution to crystallization or spray drying.
123. The process according to paragraph 121 or 122, wherein the mixture is heated to 40-100.degree. C., in step (2).
124. The process according to paragraph 123, wherein the mixture is heated to 50-90.degree. C., in step (2).
125. The process according to paragraph 124, wherein the mixture is heated to 60-70.degree. C., in step (2).
126. The composition of paragraph 1, further comprising cyclodextrin.
In a preferred embodiment, the GSGs used in the present invention are prepared as follows:
i) dissolving tapioca dextrin in RO water,
ii) adding the stevia extract with total steviol glycosides content between 70% and 99% to liquefied dextrin to obtain a mixture, wherein the ratio of dexrin to stevia extract was optimized between 40:60 and 60:40.
iii) adding CGTase enzyme to the mixture and incubating at 60.degree. C., for a desired length of reaction time to glycosylate steviol glycosides with glucose molecules derived from Tapioca dextrin.
iv) after achieving desired ratio of GSG and residual steviol glycoside contents, heating the reaction mixture to 90-100.degree. C., for 30 min to inactivate the CGTase, which is then removed by filter.
v) decoloring and spray drying the resulting solution of GSG, residual steviol glycosides and dextrin.
The invention will be further described with reference to the following non-limiting Examples. It will be apparent to those skilled in the art that many changes can be made in the embodiments described without departing from the scope of the present invention. Thus the scope of the present invention should not be limited to the embodiments described in this application, but only by embodiments described by the language of the claims and the equivalents of those embodiments. Unless otherwise indicated, all percentages are by weight.
EXAMPLES
Compositions of GSGs and Steviol Glycosides.
TABLE-US-00014 TABLE 1 Raw materials RA RD RB RC STV Total GSG RA97 98% RA/RD 93.96% 4.54% RA50 57.1% 30.3% RA95 95.1% RA98 98.4% 0.4% RA99.5 99.6% RA75/ 77.46% 16.45% 0.45% RB15 RA80/ 77.0% 6.0% 11.0% RB10/ RD6 GSG- 2.39% 1.39% 89.35% RA50 GSG- 6.00% 90.6% RA95 GSG- 3.22% 1.07% 89.64% RA60 GSG- 3.98% 0.78% 89.90% RA70 GSG- 4.23% 0.43% 89.00% RA80 GSG- 5.42% 0.14% 90.07% RA90 GSG- 3.7% 2.86% 74.25% RA20 GSG(RA50 + RC5) 77.3% RA50/ 55.01% 0.5% 5.65% RC5 GSG(RA30 + RC15) 75.9% RA30/ 29.8% 4.6% 17.62% RC15 GSG(RA40 + RB8) 80.2% RA40/ 41.57% 7.65% 6.49% RB8
GSG-RA20, GSG-RA30, GSG-RA40, GSG-RA50, GSG-RA60, GSG-RA70, GSG-RA80, GSG-RA90, GSG-RA95, GSG-(RA50+RC5), GSG-(RA30+RC15), GSG-(RA40+RB8) were used in the follow examples. GSG-RA20, GSG-RA30, GSG-RA40, GSG-RA50, GSG-RA60, GSG-RA70, GSG-RA80, GSG-RA90, and GSG-RA95 uses RA with stevioside as starting material. Therefore, it is assumed that GSG-RA20, GSG-RA30, GSG-RA40, GSG-RA50 GSG-RA60, GSG-RA70, GSG-RA80, GSG-RA90, and GSG-RA95 contains stevioside, stevioside-G1, stevioside-G2, stevioside-G3, stevioside-G4, stevioside-G5, RA, RA-G1, RA-G2, RA-G3, RA-G4, and RA-G5 as the main components.
GSG-RA50 used in the following examples can be prepared as follows:
120 g Tapioca dextrin was dissolved in 21, water;
100 g stevia extract (RA 53.1%, total steviol glycosides 80.6%) was added to liquefied dextrin to obtain a mixture; the dexrin to stevia extract ratio was 55:45;
5 ml CGTase enzyme was added to the mixture and incubated at 60.degree. C., for 48 hours to glycosylate steviol glycosides with glucose molecules derived from Tapioca dextrin.
after desired ratio of GSG and residual steviol glycoside contents achieved, the reaction mixture was heated to 95.degree. C., for 30 min to inactivate the CGTase, which is then removed by filter.
the resulting solution of GSG, residual steviol glycosides and dextrin is decolored and spray dried. Thus yield 230 g white powder GSG-RA50.
GSG-RA95, GSG-RA60, GSG-RA70, GSG-RA50, GSG-RA90, GSG-RA20, GSG-(RA50+RC5). GSG-(RA30+RC15), GSG-(RA40+RB8) can be prepared respectively by the method as the same as that of GSG-RA50.
Evaluation of Taste Profile:
1. The components where mixed and then dissolved in aqueous citric acid (pH 3.8) with ultrasound at room temperature and left to sit for 30 min.
2. Panel: 6 persons
3. Method: For the sweetness evaluation of each sample, the sample was tested in pairwise with several sucrose solutions of given sweetness. The sweetness of each sample was compared with those of the sucrose solutions, and the sweetness was evaluated and recorded according to the judgement that the sweetness of the sample was similar to a specific sugar solution or between specific sugar solutions. The results were recorded as the mean value of the results provided by the panel.
For evaluation of taste profile, the samples were tested and were scored 0-5 according to the increasing sugar like, bitterness, aftertaste and lingering taste profiles. The results were recorded as the mean value of the results provided by the panel.
Example 1: Evaluating the Taste Profile of GSG-RA50 and RA97 Compositions in Order to Find Optimized Ratios with Preferred Synergistic Taste Effects
Conditions: The sample were tested in aqueous solution of citric acid at pH 3.8. The control sample was RA97 at 350 ppm, corresponding to 8% SE.
TABLE-US-00015 TABLE 2 Samples Sample No. RA97 GSG-RA50 total GSG 1 350 ppm -- 2-1 300 ppm 50 ppm 12.76% 2-2 300 ppm 100 ppm 22.34% 2-3 300 ppm 150 ppm 29.78% 3-1 250 ppm 100 ppm 25.53% 3-2 250 ppm 150 ppm 33.51% 3-3 250 ppm 200 ppm 39.71% 4-1 200 ppm 150 ppm 38.29% 4-2 200 ppm 200 ppm 44.68% 4-3 200 ppm 250 ppm 49.64% 5-1 150 ppm 200 ppm 51.06% 5-2 150 ppm 250 ppm 55.84% 5-3 150 ppm 300 ppm 59.57% 6-1 100 ppm 250 ppm 63.82% 6-2 100 ppm 300 ppm 67.01% 6-3 100 ppm 350 ppm 69.49%
TABLE-US-00016 TABLE 3 Results Total Sample GSG- solid Sugar After- No. RA97 RA50 content SE like Bitterness taste Lingering 1 350 ppm -- 350 ppm 8%* 3 2 3 4 2-1 300 ppm 50 ppm 350 ppm 7% 3.5 0.5 2.5 3 2-2 300 ppm 100 ppm 400 ppm 8% 3.5 0 2 2 2-3 300 ppm 150 ppm 450 ppm 8.5% 3.5 0 2 2 3-1 250 ppm 100 ppm 350 ppm 8% 4 0 0.5 3 3-2 250 ppm 150 ppm 400 ppm 8.2% 4 0 0.5 2 3-3 250 ppm 200 ppm 450 ppm 8.5% 4.5 0 0 2 4-1 200 ppm 150 ppm 350 ppm 7.8% 4.5 0 0 2 4-2 200 ppm 200 ppm 400 ppm 8% 4 0 0.5 2 4-3 200 ppm 250 ppm 450 ppm 8.5% 4.5 0 0 2 5-1 150 ppm 200 ppm 350 ppm 7% 4.5 0 0 2 5-2 150 ppm 250 ppm 400 ppm 7.5% 4 0 0.5 2 5-3 150 ppm 300 ppm 450 ppm 7.5% 4 0 1 2 6-1 100 ppm 250 ppm 350 ppm 7% 4.8 0 0 2 6-2 100 ppm 300 ppm 400 ppm 7.5% 4.8 0 0 2 6-3 100 ppm 350 ppm 450 ppm 7.5% 4.8 0 0 2 *The concentration of the solutions depends on the desired sweetness. In the working examples, the sweetness is set to 8%, but it can be lower or higher, depending on desired applications. Therefore, the concentration can also be lower or higher, depending on desired applications.
Conclusion: GSG-RA50 improved the taste profile of RA97. Increasing the concentration of GSG-RA50 in the composition increases sugar like (i.e. feels and tastes like sugar). However, the sweetness of the composition decreases at higher ratio of GSG-RA50.
The samples with a solid content of 350 ppm (1, 2-1, 3-1, 4-1, 5-1, 6-1) were selected and examined further as depicted in FIGS. 1-4. As evident from the FIGS. 1-4 the best synergistic effect at 350 ppm total solid content was achieved at a GSG-RA50/RA97 ratio of between 100/250 and 150/200 having a sweetness equal to 350 ppm RA, while achieving the best taste profile.
The samples with about 8% SE (1, 2-2, 3-3, 4-1, 5-2, 6-3) were selected and examined further. In these samples at high and low RA97 concentration, increased GSG-RA50 was needed to achieve desired sweetness. At lower RA97 concentration, the same sweetness of 100% RA97 could not be obtained even with a large amount of GSG-RA50. Thus in order to maintain 8% SE with a decrease in RA97 concentration using GSG-RA50, the concentration of total solid content was increased until the concentration of RA97 reached 200 ppm, demonstrating that there was synergistic effect at this concentration. At low RA97 concentration, the addition of GSG-RA50 cannot compensate for the sweetness of the reduction of same amount RA97, i.e. additional amount of GSG-RA50 should be added. The tendency was reversed until RA97 reached 200 ppm.
Example 2: Evaluating the Taste Profiles of GSG-RA95 and RA97 Compositions to Identify Optimized Ratios with Preferred Synergistic Tastes Effects
Conditions: The samples were tested in aqueous solution of citric acid at pH 3.8. The control sample was RA97 at 350 ppm, corresponding to 8% SE.
TABLE-US-00017 TABLE 4 Samples Sample No. RA97 GSG-RA95 total GSG 1 350 ppm -- 2-1 300 ppm 50 ppm 12.94% 2-2 300 ppm 100 ppm 22.65% 2-3 300 ppm 150 ppm 30.20% 3-1 250 ppm 100 ppm 25.89% 3-2 250 ppm 150 ppm 33.98% 3-3 250 ppm 200 ppm 40.27% 4-1 200 ppm 150 ppm 38.83% 4-2 200 ppm 200 ppm 45.30% 4-3 200 ppm 250 ppm 50.33% 5-1 150 ppm 200 ppm 51.77% 5-2 150 ppm 250 ppm 56.63% 5-3 150 ppm 300 ppm 60.40% 6-1 100 ppm 250 ppm 64.71% 6-2 100 ppm 300 ppm 67.95% 6-3 100 ppm 350 ppm 70.47%
TABLE-US-00018 TABLE 5 Results Total Sample GSG- Solid Sugar After- No. RA97 RA95 contents SE like Bitterness taste Lingering 1 350 ppm -- 350 ppm 8% 3 2 3 4 2-1 300 ppm 50 ppm 350 ppm 7.80% 3.5 0 1.5 3 2-2 300 ppm 100 ppm 400 ppm 8% 4 0 0.5 2 2-3 300 ppm 150 ppm 450 ppm 8.50% 4 0 0.5 2 3-1 250 ppm 100 ppm 350 ppm 8% 4 0 0.5 2 3-2 250 ppm 150 ppm 400 ppm 8.30% 4 0 0.5 2 3-3 250 ppm 200 ppm 450 ppm 8.50% 4.5 0 0.5 2 4-1 200 ppm 150 ppm 350 ppm 8% 4 0 0 2 4-2 200 ppm 200 ppm 400 ppm 8.30% 4 0 0 2 4-3 200 ppm 250 ppm 450 ppm 8.50% 4.5 0 0 2 5-1 150 ppm 200 ppm 350 ppm 7.50% 4.5 0 0 2 5-2 150 ppm 250 ppm 400 ppm 7.80% 4.5 0 0 2 5-3 150 ppm 300 ppm 450 ppm 7.80% 4.5 0 0 2 6-1 100 ppm 250 ppm 350 ppm 6.80% 4.5 0 0 2 6-2 100 ppm 300 ppm 400 ppm 7.20% 4.5 0 0 2 6-3 100 ppm 350 ppm 450 ppm 7.50% 4.8 0 0 2
Conclusion: GSG-RA95 improved the taste profile of RA97. With the increase of the ratio of GSG-RA95, the overall taste profile of the composition became more sugar like (i.e. like sugar). However, the sweetness of the composition decreased at a high ratio of GSG-RA95.
The samples with a solid content of 350 ppm (1, 2-1, 3-1, 4-1, 5-1, 6-1) were selected and examined further in FIGS. 5-8. As evident from the FIGS. 5-8 the best synergistic effect at 350 ppm total solid content was achieved at a GSG-RA95/RA97 ratio of between 100/250 and 150/200 having a sweetness equal to 350 ppm RA, while achieving the best taste profile.
The samples with about 8% SE (1, 2-2, 3-3, 4-1, 5-2, 6-3) were selected and examined further. In these samples at high and low RA97 concentration, increased GSG-RA95 was needed to achieve desired sweetness. At lower RA97 concentration, the same sweetness of 100% RA97 could not be obtained even with a large amount of GSG-RA95. Thus in order to maintain 8% SE with a decrease in RA97 concentration using GSG-RA95, the concentration of total solid content was increased until the concentration of RA97 reached 250 ppm and the effect was maintained until the concentration of RA97 reached 200 ppm, demonstrating that there was synergistic effect at these concentrations.
Example 3: Evaluating the Taste Profile of GSG-RA50, GSG-RA95 and RA97 Compositions in Order to Find Optimized Ratios with Preferred Synergistic Taste Effects
Conditions: The samples were tested in aqueous solution of citric acid at pH 3.8. The control sample was RA97 at 350 ppm, corresponding to 8% SE.
TABLE-US-00019 TABLE 6 Samples Sample No. RA97 GSG-RA50 GSG-RA95 total GSG 1 350 -- -- 2 200 25 175 45.22% 3 200 50 150 45.14% 4 200 75 125 45.07% 5 200 100 100 44.99% 6 200 125 75 44.91% 7 200 150 50 44.83% 8 200 175 25 44.75%
TABLE-US-00020 TABLE 7 Results GSG- GSG- Sample RA97 RA50 RA95 Sugar Bit- After- Lin- No. (ppm) (ppm) (ppm) like terness taste gering 1 350 -- -- 3 2 3 4 2 200 25 175 4.5 0 1 2 3 200 50 150 5 0 1 2 4 200 75 125 5 0 0 1 5 200 100 100 4.5 0 0 2 6 200 125 75 4.5 0 0.5 2 7 200 150 50 4.5 0 0.5 2 8 200 175 25 4.5 0 0.5 2
Conclusion: The mixture of GSG-RA50 and GSG-RA95 improved the taste profile of RA97 at all ratios. The improvement was more significant at a GSG-RA50/GSG-RA95 ratio of 50/150 and 75/125 where the taste profile was more sugar like.
Example 4: Evaluating the Taste Profile of GSG-RA95 and Steviol Glycoside Comprising RD (RA/RD) Compositions in Order to Find Optimized Ratio with Preferred Synergistic Taste Effects
Raw material: RA/RD (RA 93.96%. RD 4.54%)
TABLE-US-00021 TABLE 8 Samples Sample No. RA/RD GSG-RA95 total GSG 1 350 ppm -- 2-1 200 ppm 150 ppm 38.83% 2-2 200 ppm 200 ppm 45.30% 2-3 200 ppm 250 ppm 50.33% 3-1 150 ppm 200 ppm 51.77% 3-2 150 ppm 250 ppm 56.63% 3-3 150 ppm 300 ppm 60.40%
TABLE-US-00022 TABLE 9 Results GSG- Sample RA/RD RA95 Total solid Sugar After- No. (ppm) (ppm) content (ppm) SE like Bitterness taste Lingering 1 350 -- 350 8.5% 3.5 1 2 2.5 2-1 200 150 350 8.5% 4 0 0.5 2 2-2 200 200 400 8.5% 4 0 0 2 2-3 200 250 450 8.8% 4 0 0.5 2 3-1 150 200 350 8.2% 4.5 0 0 2 3-2 150 250 400 8.7% 4.5 0 0.5 2 3-3 150 300 450 8.8% 4.5 0 0.5 2
Conclusion: GSG-RA95 improved both the bitterness and the aftertaste of RA/RD having a wide effective range. In comparison to RA97. RA/RD had wider synergistic range with GSG-RA95.
Example 5: Evaluating the Taste Profile of GSG-RA50 and Steviol Glycoside Comprising RD (RA/RD) Compositions in Order to Find Optimized Ratios with Preferred Synergistic Taste Effects
Raw material: RA/RD, (RA 93.96%, RD 4.54%)
TABLE-US-00023 TABLE 10 Samples Sample No. (RA/RD) GSG-RA50 total GSG 1 350 ppm -- 2-1 200 ppm 150 ppm 38.29% 2-2 200 ppm 200 ppm 44.68% 2-3 200 ppm 250 ppm 49.64% 3-1 150 ppm 200 ppm 51.06% 3-2 150 ppm 250 ppm 55.84% 3-3 150 ppm 300 ppm 59.57%
TABLE-US-00024 TABLE 11 Results GSG- Total solid Sample RA/RD RA50 content Sugar After- No. (ppm) (ppm) (ppm) SE like Bitterness taste Lingering 1 350 -- 350 8.5% 3.5 1 2 2.5 2-1 200 150 350 8.0% 4 0 0 2 2-2 200 200 400 8.5% 4 0 0 2 2-3 200 250 450 8.8% 4 0 0 2 3-1 150 200 350 7.7% 4 0 0 2 3-2 150 250 400 8% 4.5 0 0 2 3-3 150 300 450 8% 4 0 0.5 2
GSG-RA50 improved both the bitterness and the aftertaste of RA/RD. As for the synergistic effects in sweetness, GSG-RA50 was not as good as GSG-RA95 due to a narrow synergistic range.
Example 6: Effects of GSG-RA50 on the Taste Profile of Steviol Glycosides
GSG-RA50 was mixed with various steviol glycosides at a ratio of 1:1, and the taste profile of the mixtures water (500 ppm) were tested.
TABLE-US-00025 TABLE 12 RA50 Aftertaste (bitter, GSG- Bitter metallic, Sample RA50 RA50 SE taste licorice) Lingering 1-1 250 ppm 250 ppm 6.8% 0.5 1.5 3.5 1-2 -- 500 ppm 6.5% 2 5 5
GSG-RA50 Rich improved the taste profile of RA50.
TABLE-US-00026 TABLE 13 RA95 Aftertaste (bitter, Lin- Sam- GSG- Bitter metallic, ger- total ple RA50 RA95 SE taste licorice) ing GSG 1-1 250 ppm 250 ppm 7.4% 0 1 3 44.68% 1-2 -- 500 ppm 7.5% 0.5 3 3
GSG-RA50 improved the bitter and metallic aftertaste of RA95, but did not alter the sweetness significantly.
TABLE-US-00027 TABLE 14 RA97 Aftertaste (bitter, Lin- Sam- GSG- Bitter metallic, ger- total ple RA50 RA97 SE taste licorice) ing GSG 1-1 250 ppm 250 ppm 7.4% 0 2 2.5 44.68% 1-2 -- 500 ppm 7.5% 0.5 3.5 3
GSG-RA50 improved the bitter and metallic aftertaste of RA97, but did not alter the sweetness significantly.
TABLE-US-00028 TABLE 15 RA98 Aftertaste (bitter, Lin- Sam- GSG- Bitter metallic, ger- total ple RA50 RA98 SE taste licorice) ing GSG 1-1 250 ppm 250 ppm 7.5% 0.5 0.5 2.5 44.68% 1-2 -- 500 ppm 7.5% 0.5 2 3
GSG-RA50 improved the bitter and metallic aftertaste of RA98, but did not alter the sweetness significantly.
TABLE-US-00029 TABLE 16 RA99.5 Aftertaste (bitter, Lin- Sam- GSG- Bitter metallic, ger- total ple RA50 RA99.5 SE taste licorice) ing GSG 1-1 250 ppm 250 ppm 7.8% 0 1 2 44.68% 1-2 -- 500 ppm 8.0% 0 2 2
GSG-RA50 improved the bitter aftertaste of RA99.5, but did not alter the sweetness significantly.
TABLE-US-00030 TABLE 17 RA/RD Aftertaste (bitter, Lin- Sam- GSG- Bitter metallic, ger- total ple RA50 RA/RD SE taste licorice) ing GSG 1-1 250 ppm 250 ppm 7.7% 0 1 2 44.68% 1-2 -- 500 ppm 7.8% 0 1 2
GSG-RA50 did not affect the taste profile of RA/RD, however GSG-RA50 is cheaper than RD and thus will reduce cost.
TABLE-US-00031 TABLE 18 Control sample. Aftertaste (bitter, Sample GSG-RA50 SE Bitter taste metallic, licorice) Lingering 500 ppm 6.5% 0.5 2 4
Example 7: Sweetness of GSG-RA50 and RA97 Compositions
The sweetness of GSG-RA50 and RA97 compositions at varying concentrations was measured according to the sweetness curve (FIG. 9), and the combined sweetness of each composition of GSG-RA50 and RA97 was calculated and compared with the measured value in Table 19.
TABLE-US-00032 TABLE 19 Calculated Calculated Calculated Measured SE RA97 SE of GSG-RA50 SE of SE of the of the concentration RA97 concentration GSG-RA50 composition composition 350 ppm -- -- -- -- 8%* 300 ppm 6.9% 50 ppm 0.5% 7.4% 7% 300 ppm 6.9% 100 ppm 1% 7.9% 8% 300 ppm 6.9% 150 ppm 1.5% 8.4% 8.5% 250 ppm 6% 100 ppm 1% 7% 8% 250 ppm 6% 150 ppm 1.5% 7.5% 8.2% 250 ppm 6% 200 ppm 2% 8% 8.5% 200 ppm 5% 150 ppm 1.5% 6.5% 7.8% 200 ppm 5% 200 ppm 2% 7% 8% 200 ppm 5% 250 ppm 2.4% 7.4% 8.5% 150 ppm 4.2% 200 ppm 2% 6.2% 7% 150 ppm 4.2% 250 ppm 2.4% 6.6% 7.5% 150 ppm 4.2% 300 ppm 2.75% 6.95% 7.5% 100 ppm 3% 250 ppm 2.4% 5.4% 7% 100 ppm 3% 300 ppm 2.75% 5.75% 7.5% 100 ppm 3% 350 ppm 3% 6% 7.5% *Control sample. 8% SE is equal to the sweetness of 8 g of sucrose dissolved in 100 g
Conclusion: The sweetness of GSG-RA50 and RA97 compositions benefit from a synergistic effect that first appears when the concentration of GSG-RA50 reaches 100 ppm.
Example 8: Sweetness of 350 ppm GSG-RA50 and RA97 Compositions are Shown in Table 20
TABLE-US-00033 TABLE 20 Calc. Measured sweetness sweetness (ppm (ppm Calc. sugar) of sugar) of Calc. SE of Calc. SE Measured GSG- GSG- SE of GSG- GSG- of the SE of the RA50 per RA50 per RA97 RA97 RA50 RA50 composition composition ppm ppm 350 ppm -- -- -- -- 8% 0 0 300 ppm 6.9% 50 ppm 0.5% 7.4% 7% 100 20 250 ppm 6% 100 ppm 1% 7% 8% 100 200 200 ppm 5% 150 ppm 1.5% 6.5% 7.8% 100 186 150 ppm 4.2% 200 ppm 2% 6.2% 7% 100 140 100 ppm 3% 250 ppm 2.4% 5.4% 7% 96 160
Calculated SE (ppm sucrose) of GSG-RA50 per ppm=calculated SE of GSG-RA50/concentration of GSG-RA50. Measured sweetness (ppm sucrose) of GSG-RA50 per ppm=(Measured SE-Calculated SE of RA97)/concentration of GSG-RA50.
Conclusion: At 350 ppm total solid content, increasing the amount of GSG-RA50 results in a measured contribution to sweetness that was higher than the calculated value (FIG. 10). A positive synergistic sweetness effect was found when GSG-RA50>100 ppm, although the optimized range was 100-150 ppm.
Example 9: Sweetness of 400 ppm GSG-RA50 and RA97 Compositions are Shown in Table 21
TABLE-US-00034 TABLE 21 Calc. Measured sweetness sweetness (ppm (ppm Calc. sugar) of sugar) of Calc. SE of Calc. SE Measured GSG- GSG- SE of GSG- GSG- of the SE of the RA50 per RA50 per RA97 RA97 RA50 RA50 composition composition ppm ppm 300 ppm 6.9% 100 ppm 1% 7.9% 8% 100 110 250 ppm 6% 150 ppm 1.5% 7.5% 8.2% 100 146.67 200 ppm 5% 200 ppm 2% 7% 8% 100 150 150 ppm 4.2% 250 ppm 2.4% 6.6% 7.5% 96 132 100 ppm 3% 300 ppm 2.75% 5.75% 7.5% 91.7 150
Calculated SE (ppm sucrose) of GSG-RA50 per ppm=calculated SE of GSG-RA50/concentration of GSG-RA50. Measured sweetness (ppm sucrose) of GSG-RA50 per ppm=(Measured SE-Calculated SE of RA97)/concentration of GSG-RA50.
Conclusion: At 400 ppm total solid content, increasing the amount of GSG-RA50 results in a measured contribution to sweetness that was higher than the calculated value (FIG. 11). A positive synergistic sweetness effect was found when GSG-RA50>100 ppm.
Example 10: Sweetness of 450 ppm GSG-RA50 and RA97 Compositions are Shown in Table 22
TABLE-US-00035 TABLE 22 Calc. Measured sweetness sweetness (ppm (ppm Calc. sugar) of sugar) of Calc. SE of Calc. SE Measured GSG- GSG- SE of GSG- GSG- of the SE of the RA50 per RA50 per RA97 RA97 RA50 RA50 composition composition ppm ppm 300 ppm 6.9% 150 ppm 1.5% 8.4% 8.5% 100 106.67 250 ppm 6% 200 ppm 2% 8% 8.5% 100 125 200 ppm 5% 250 ppm 2.4% 7.4% 8.5% 96 140 150 ppm 4.2% 300 ppm 2.75% 6.95% 7.5% 91.7 110 100 ppm 3% 350 ppm 3% 6% 7.5% 85.7 128.57
Calculated SE (ppm sucrose) of GSG-RA50 per ppm=calculated SE of GSG-RA50/concentration of GSG-RA50. Measured sweetness (ppm sucrose) of GSG-RA50 per ppm=(Measured SE-Calculated SE of RA97)/concentration of GSG-RA50.
Conclusion: At 450 ppm total solid content, increasing the amount of GSG-RA50 results in a measured contribution to sweetness that was higher than the calculated value (FIG. 12). A positive synergistic sweetness effect was found when GSG-RA50>150 ppm, although the optimized range was 200-250 ppm.
Example 11: Sweetness of GSG-RA95 and RA97 Compositions
The sweetness of GSG-RA95 and rebaudioside A, 97% purity (RA) RA97 compositions at varying concentrations was measured according to the sweetness curve (FIG. 13), and the combined sweetness of each composition of GSG-RA95 and RA97 was calculated and compared with the measured value in Table 23.
TABLE-US-00036 TABLE 23 Calculated Calculated Calculated Measured SE RA97 SE of GSG-RA95 SE of SE of the of the concentration RA97 concentration GSG-RA95 composition composition 350 ppm -- -- -- -- 8% 300 ppm 6.9% 50 ppm 0.7% 7.6% 7.8% 300 ppm 6.9% 100 ppm 1.4% 8.3% 8% 300 ppm 6.9% 150 ppm 1.9% 8.8% 8.5% 250 ppm 6% 100 ppm 1.4% 7.4% 8% 250 ppm 6% 150 ppm 1.9% 7.9% 8.3% 250 ppm 6% 200 ppm 2.2% 8.2% 8.5% 200 ppm 5% 150 ppm 1.9% 6.9% 8% 200 ppm 5% 200 ppm 2.2% 7.2% 8.3% 200 ppm 5% 250 ppm 2.5% 7.5% 8.5% 150 ppm 4.2% 200 ppm 2.2% 6.4% 7.5% 150 ppm 4.2% 250 ppm 2.5% 6.7% 7.8% 150 ppm 4.2% 300 ppm 2.9% 7.1% 7.8% 100 ppm 3% 250 ppm 2.5% 5.5% 6.8% 100 ppm 3% 300 ppm 2.9% 5.9% 7.2% 100 ppm 3% 350 ppm 3.1% 6.1% 7.5%
Conclusion: The sweetness of GSG-RA95 and RA97 compositions benefit from a synergistic effect that first appears when the concentration of GSG-RA95 reaches 100 ppm.
Example 12: Sweetness of 350 ppm GSG-RA95 and RA97 Compositions are Shown in Table 24
TABLE-US-00037 TABLE 24 Calc. Measured sweetness sweetness Calc. (ppm (ppm Calc. GSG- Calc. SE SE of Measured sucrose) of sucrose) of RA97 SE of RA95 of GSG- the SE of the GSG-RA95 GSG-RA95 (ppm) RA97 (ppm) RA95 composition composition per ppm per ppm 350 -- -- -- -- 8% 0 0 300 6.9% 50 0.7% 7.6% 7.8% 140 180 250 6% 100 1.4% 7.4% 8% 140 200 200 5% 150 1.9% 6.9% 8% 126.7 200 150 4.2% 200 2.2% 6.4% 7.5% 110 165 100 3% 250 2.5% 5.5% 6.8% 100 152
Calculated SE (ppm sucrose) of GSG-RA95 per ppm=calculated SE of GSG-RA95/concentration of GSG-RA95. Measured sweetness (ppm sucrose) of GSG-RA95 per ppm=(Measured SE-Calculated SE of RA97)/concentration of GSG-RA95.
Conclusion: At 350 ppm total solid content, increasing the amount of GSG-RA95 results in a measured contribution to sweetness that was higher than the calculated value (FIG. 14). A positive synergistic sweetness effect was found when GSG-RA95>100 ppm with an optimized range of 100-150 ppm.
Example 13: Sweetness of 400 ppm GSG-RA95 and RA97 Compositions are Shown in Table 25
TABLE-US-00038 TABLE 25 Calc. Measured sweetness sweetness (ppm (ppm sucrose) sucrose) Calc. GSG- Calc. SE Calc. SE Measured of GSG- of GSG- RA97 SE of RA95 of GSG- of the SE of the RA95 per RA95 per (ppm) RA97 (ppm) RA95 composition composition ppm ppm 300 6.9% 100 1.4% 8.3% 8% 140 110 250 6% 150 1.9% 7.9% 8.3% 126.7 153.33 200 5% 200 2.2% 7.2% 8.3% 110 165 150 4.2% 250 2.5% 6.7% 7.8% 100 144 100 3% 300 2.9% 5.9% 7.2% 96.7 140
Calculated SE (ppm sucrose) of GSG-RA95 per ppm=calculated SE of GSG-RA95/concentration of GSG-RA95. Measured sweetness (ppm sucrose) of GSG-RA95 per ppm=(Measured SE-Calculated SE of RA97)/concentration of GSG-RA95.
Conclusion: At 400 ppm total solid content, increasing the amount of GSG-RA95 results in a measured contribution to sweetness that was higher than the calculated value (FIG. 15). A positive synergistic sweetness effect was found when GSG-RA95>150 ppm with an optimized range of 150-200 ppm.
Example 14: Sweetness of 450 ppm GSG-RA95 and RA97 Compositions are Shown in Table 26
TABLE-US-00039 TABLE 26 Calc. SE Measured (ppm SE (ppm Calc. sucrose) sucrose) Calc. SE of Calc. SE Measured of GSG- of GSG- SE of GSG- GSG- of the SE of the RA95 per RA95 per RA97 RA97 RA95 RA95 composition composition ppm ppm 300 ppm 6.9% 150 ppm 1.5% 8.4% 8.5% 100 106.67 250 ppm 6% 200 ppm 2% 8% 8.5% 100 125 200 ppm 5% 250 ppm 2.4% 7.4% 8.5% 96 140 150 ppm 4.2% 300 ppm 2.75% 6.95% 7.5% 91.7 110 100 ppm 3% 350 ppm 3% 6% 7.5% 85.7 128.57
Calculated SE (ppm sucrose) of GSG-RA95 per ppm=calculated SE of GSG-RA95/concentration of GSG-RA95. Measured sweetness (ppm sucrose) of GSG-RA95 per ppm=(Measured SE-Calculated SE of RA97)/concentration of GSG-RA95.
Conclusion: At 450 ppm total solid content, increasing the amount of GSG-RA95 results in a measured contribution to sweetness that was higher than the calculated value (FIG. 16). A positive synergistic sweetness effect was found when GSG-RA95>200 ppm with an optimized range of 200-250 ppm.
Example 15: Compositions of Steviol Glycosides and GSG-RA50
TABLE-US-00040 TABLE 27 Untreated Treated Steviol GSG- (room (room glycoside RA50 Water temperature) temperature) Stability RA, 0.85 g 0.15 g 10 g Soluble Soluble >10 days RA, 0.9 g 0.1 g 10 g Soluble Soluble >10 days RB, 0.5 g 0.5 g 10 g Insoluble Insoluble -- RC, 0.5 g 0.5 g 10 g Insoluble Insoluble -- RD, 0.5 g 0.5 g 10 g Insoluble Insoluble -- RB, 0.1 g 0.9 g 10 g Insoluble Insoluble -- RC, 0.1 g 0.9 g 10 g Insoluble Soluble >10 days RD, 0.1 g 0.9 g 10 g Insoluble Soluble >10 days RB, 0.05 g 0.95 g 10 g Insoluble Soluble >10 days
For compositions of RA and GSG-RA50, the solubility can be improved by the treatment of according to the present invention. For composition of RA. RC, or RD and GSG-RA50, the solubility is improved by the treatment according to the present invention, only at higher GSG-RA50 to steviol glycoside ratio.
Example 16: HPLC-MS Experiments
HPLC-system: Agilent 1100 (quart. Pump, Autosampler. Column oven, UV/VIS-detector coupled to Agilent ESI MS (G1956 A) operated at 350.degree. C. 12 L/min N.sup.2. Fragmentor: 150, pos. Scan mode.
Mobile Phase: Acetonitrile/0.01% acetic acid=95/5 at 0 min to 80/20 at 20 min (linear gradient) hold for another 20 minutes, return to source conditions.
Column: Supelcosil-LC-NH.sub.2, 250.times.4.6 mm, 5 .mu.m
Flow rate: 1 mL/min
Temperature: 35.degree. C.
Injection vol: 0.015 mL
GSG-RA50 was characterized by HPLC-MS (FIG. 17) and the ratios of GSGs are shown in Table 28.
TABLE-US-00041 TABLE 28 mol % of Compound Area mg RA/100 ml mass mg/100 ml total sample -- 52.9 2.42 2.42 1.79 ST-G1 250 3.82 967 3.82 2.83 ST-G1 114 2.85 967 2.85 2.11 RA-G1 288 4.09 1129 4.77 3.54 RA-G1 393 4.84 1129 5.65 4.18 ST-G2 110 2.82 1129 3.30 2.44 RA-G2 479 5.44 1291 7.27 5.38 RA-G2 341 4.46 1291 5.96 4.41 ST-G3 105 2.78 1291 3.72 2.75 RA-G3 470 5.39 1453 8.09 5.99 RA-G3 319 4.31 1453 6.47 4.80 ST-G4 87.6 2.66 1453 4.00 2.97 RA-G4 408 4.94 1615 8.25 6.11 ST-G5 346 4.50 1615 7.51 5.57 RA-G5 329 4.38 1777 8.05 5.96 ST-G6 286 4.07 1777 7.48 5.54 RA-G6 311 4.25 1939 8.53 6.32 ST-G7 173 3.27 1939 6.56 4.86 RA-G7 184 3.35 2101 7.28 5.39 >RA/ST-G7 232 3.69 2263 8.64 6.40 Sum: 78.35 120.63 89.35
GSG-RA95 was characterized by HPLC-MS (FIG. 18) and the ratios of GSGs are shown in Table 29.
TABLE-US-00042 TABLE 29 mol % of Compound Area mg RA/100 ml mass mg/100 ml total sample -- 65.4 2.51 2.5 2.04 -- 33.4 2.28 2.3 1.85 RA-G1 687 6.93 1129 8.10 6.59 -- 38.5 2.32 2.32 1.88 RA-G2 886 8.34 1291 11.2 9.07 -- 36.9 2.30 2.30 1.87 RA-G3 873 8.24 1453 12.4 10.09 RA-G4 811 7.81 1615 13.1 10.63 RA-G5 681 6.88 1777 12.7 10.31 RA-G6 548 5.94 1939 11.9 9.70 RA-G7 411 4.96 2101 10.8 8.79 >RA-G7 920 8.58 2263 20.1 16.36 Sum: 67.1 110 89
GSG-RA95 was characterized by HPLC-MS (FIG. 19) and the ratios of GSGs are shown in Table 30.
TABLE-US-00043 TABLE 30 mol % of Compound Area mg RA/100 ml mass mg/100 ml total sample RA-G1 1545 13.0 1129 15.2 12.7 RA-G2 1848 15.2 1291 20.3 16.9 RA-G3 1458 12.4 1453 18.7 15.6 RA-G4 1001 9.15 1615 15.3 12.8 RA-G5 631 6.53 1777 12.0 10.0 RA-G6 383 4.77 1939 9.58 8.0 RA-G7 179 3.32 2101 7.22 6.0 >RA-G7 332 4.40 2263 10.3 8.6 Sum: 68.8 109 90.6
Example 17 HPLC-MS Experiments
HPLC-system: Agilent 1100/1200.
TABLE-US-00044 Mobile Phase: Time Solv.A* Solv.B** Flow Pressure 0.00 72.2 27.8 1.000 300 8.00 55.6 44.4 1.000 300 12.00 55.6 44.4 1.000 300 18.00 62.2 37.8 1.000 300 20.00 72.2 27.8 1.000 300 *Solv.A: 0.01M NH4-Acetate with 0.1% Acetic Acid and 0.01% trimethylamine, saturated with dichloromethane **Solv.B: 90% Acetonitrile/10% water with 0.1% Acetic Acid and 0.01% trimethylamine and 0.1% dichloromethane
Injector volume 30.00 .mu.l
Detector: Diode Array Detector and UV
Wavelength 210 nm
Temperature settings: 45.0.degree. C. Flow rate: 1 mL/min
MS: Agilent G 1956 A
Ionization Mode: API-ES
Scan Parameters
Gas Temp: 300.degree. C. maximum 350.degree. C.
DryingGas: 11.0 l/min maximum 13.0 l/min
Neb Pres: 29 psig maximum 60 psig
Quad Temp: 0.degree. C. maximum 0.degree. C.
VCap (Positive): 3000 V
VCap (Negative): 4000 V
GSG-RA20 was characterized by HPLC-MS (FIG. 20) and the ratios of GSGs are shown in Table 31.
TABLE-US-00045 TABLE 31 R-A Stv Reb C Actual Test Mass Mass derived derived derived Result fragment fragment (% (% (% Basic struchture Specification (% m/m) [M - 2H.sup.+].sup.-2 [M - H.sup.+].sup.-1 m/m)* m/m)* m/m)** ST-G1 11.52 563 1128 4.98 3.63 2.91 ST-G2 8.48 644 1290 3.57 2.90 2.00 ST-G3 10.21 725 1452 4.30 3.21 2.70 ST-G4 12.02 806 1614 5.37 3.84 2.80 ST-G5 8.02 887 1776 3.45 2.71 1.86 ST-G8 5.85 968 1938 2.58 1.94 1.33 ST-G7 2.24 1049 2100 1.00 0.77 0.46 ST-G8 5.83 1130 2262 2.65 1.89 1.29 ST-G9 4.69 1211 2424 1.97 1.55 1.16 ST-G10 3.74 1292 2586 1.58 1.28 0.88 ST-G11 1.65 1373 2748 0.75 0.57 0.33 Total GSG 75 74.25 1454 2910 34.30 24.65 15.30 Stevioside 6 6.56 SGs 4 Dextrin 20 <=20 *estimated from chromatogram comparison of Reb-A GSGs to STV GSGs **estimated from unique mass of Reb-C fragment
GSG-RA40 was characterized by HPLC-MS (FIG. 21) and the ratios of GSGs are shown in Table 32.
TABLE-US-00046 TABLE 32 GSG Mass Mass R-A Stev Basic (% fragment fragment derived derived structure m/m) [M - 2H.sup.+].sup.-2 [M - H.sup.+].sup.-1 (% m/m) (% m/m) ST-G1 0.02 563 1128 0.01 0.00 ST-G2 5.89 644 1290 4.71 1.18 ST-G3 1.14 725 1452 0.91 0.23 ST-G4 0.09 806 1614 0.07 0.02 ST-G5 0.82 887 1776 0.65 0.16 ST-G6 1.60 968 1938 1.28 0.32 ST-G7 0.85 1049 2100 0.68 0.17 ST-G8 2.71 1130 2262 2.17 0.54 ST-G9 0.72 1211 2424 0.58 0.14 ST-G10 0.38 1292 2586 0.31 0.08 ST-G11 1.15 1373 2748 0.92 0.23 unidentified 7.0 Total GSG 22.4 Reb-A/Stev 53.6
GSG-RA85 was characterized by HPLC-MS (FIG. 22) and the ratios of GSGs are shown in Table 33A.
TABLE-US-00047 TABLE 33A Basic R-A derived Mass fragment Mass fragment structure (% m/m) [M - 2H.sup.+].sup.-2 [M - H.sup.+].sup.-1 ST-G1 1.36 563 1128 ST-G2 13.77 644 1290 ST-G3 20.87 725 1452 ST-G4 20.70 806 1614 ST-G5 4.14 887 1776 ST-G6 4.29 968 1938 ST-G7 1.82 1049 2100 ST-G8 1.87 1130 2262 ST-G9 0.67 1211 2424 ST-G10 0.45 1292 2586 ST-G11 0.60 1373 2748 Total GSG 70.5 1454 2910 Reb-A 1.8 482 965
GSG-RA90 was characterized by HPLC-MS (FIG. 23) and the ratios of GSGs are shown in Table 33B.
TABLE-US-00048 TABLE 33B Basic R-A derived Mass fragment Mass fragment structure (% m/m) [M - 2H.sup.+].sup.-2 [M - H+].sup.-1 ST-G1 1.28 563 1128 ST-G2 17.76 644 1290 ST-G3 24.22 725 1452 ST-G4 16.26 806 1614 ST-G5 7.04 887 1776 ST-G6 3.46 968 1938 ST-G7 1.39 1049 2100 ST-G8 1.51 1130 2262 ST-G9 0.42 1211 2424 ST-G10 0.31 1292 2586 ST-G11 0.28 1373 2748 Total GSG 73.9 1454 2910 Reb-A 1.7 482 965
Example 18: Synergistic Effects of GSG-RA50 with RA97
A sweetness curve was prepared for GSG-RA50 and RA97 compositions (FIG. 24), and the taste profiles of 200 ppm total solid content samples were taken as shown in Table 34.
TABLE-US-00049 TABLE 34 Calc. Measured sweetness sweetness (ppm (ppm Calc. Calc. Calc. Measured sugar) of sugar)of SE GSG- SE of SE of SE GSG- GSG- RA97 of RA50 GSG- the of the RA50 per RA50 per (ppm) RA97 (ppm) RA50 composition composition ppm ppm total GSG 150 4.2% 50 0.5% 4.70% 5.00% 100 160.00 22.34% 100 3.0% 100 1.0% 4.00% 5.00% 100 200.00 44.68% 50 1.5% 150 1.5% 3.00% 4.50% 100 200.00 67.01
Calculated sweetness (ppm sugar) of GSG-RA50 per ppm=calculated SE of GSG-RA50/concentration of GSG-RA50. Measured sweetness (ppm sugar) of GSG-RA50 per ppm=(Measured SE-calculated SE of RA97)/concentration of GSG-RA50.
Conclusion: At 200 ppm total solid content, increasing the amount of GSG-RA50 results in a measured contribution to sweetness that was higher than the calculated value as shown in FIG. 25. A positive synergistic sweetness effect was found when GSG-RA50.gtoreq.50 ppm.
The samples with total solid content of 350 ppm are shown in Table 35.
TABLE-US-00050 TABLE 35 Calc. Measured sweetness sweetness (ppm (ppm Calc. GSG- Calc. SE Calc. SE Measured sucrose) of sucrose) of RA97 SE of RA50 of GSG- of the SE of the GSG-RA50 GSG-RA50 (ppm) RA97 (ppm) RA50 composition composition per ppm per ppm 350 -- -- -- -- 8% 0 0 300 6.9% 50 0.5% 7.4% 7% 100 20.00 250 6% 100 1% 7% 8% 100 200.00 200 5% 150 1.5% 6.5% 7.8% 100 186.67 150 4.2% 200 2% 6.2% 7% 100 140.00 100 3% 250 2.4% 5.4% 7% 96 160.00
Conclusion: At 350 ppm total solid content, increasing the amount of GSG-RA50 results in a measured contribution of sweetness that was higher than the calculated value as shown in FIG. 26. A positive synergistic sweetness effect was found when GSG-RA50.gtoreq.100 ppm, with an optimal range of 100-150 ppm.
The samples with total solid content of 400 ppm are shown in Table 36.
TABLE-US-00051 TABLE 36 Calc. Measured sweetness sweetness (ppm (ppm Calc. GSG- Calc. SE Calc. SE Measured sucrose) of sucrose) of RA97 SE of RA50 of GSG- of the SE of the GSG-RA50 GSG-RA50 (ppm) RA97 (ppm) RA50 composition composition per ppm per ppm 300 6.9% 100 1% 7.9% 8% 100 110.00 250 6% 150 1.5% 7.5% 8.2% 100 146.67 200 5% 200 2% 7% 8% 100 150.00 150 4.2% 250 2.4% 6.6% 7.5% 96 132.00 100 3% 300 2.75% 5.75% 7.5% 91.7 150.00
Conclusion: At 400 ppm total solid content, increasing the amount of GSG-RA50 results in a measured contribution of sweetness that was higher than the calculated value as shown in FIG. 27. A positive synergistic sweetness effect was found when GSG-RA50.gtoreq.100 ppm.
The samples with total solid content of 450 ppm are shown in Table 37.
TABLE-US-00052 TABLE 37 Calc. Measured sweetness sweetness (ppm (ppm Calc. GSG- Calc. SE Calc. SE Measured sucrose) of sucrose) of RA97 SE of RA50 of GSG- of the SE of the GSG-RA50 GSG-RA50 (ppm) RA97 (ppm) RA50 composition composition per ppm per ppm 300 6.9% 150 1.5% 8.4% 8.5% 100 106.67 250 6% 200 2% 8% 8.5% 100 125.00 200 5% 250 2.4% 7.4% 8.5% 96 140.00 150 4.2% 300 2.75% 6.95% 7.5% 91.7 110.00 100 3% 350 3% 6% 7.5% 85.7 128.57
Conclusion: At 450 ppm total solid content, increasing the amount of GSG-RA50 results in a measured contribution of sweetness that was higher than the calculated value as shown in FIG. 28. A positive synergistic sweetness effect was found when GSG-RA50.gtoreq.150 ppm.
The samples with total solid content of 500 ppm are shown in Table 38.
TABLE-US-00053 TABLE 38 Calc. Measured sweetness sweetness (ppm (ppm Calc. GSG- Calc. SE Calc. SE Measured sucrose) of sucrose) of RA97 SE of RA50 of GSG- of the SE of the GSG-RA50 GSG-RA50 (ppm) RA97 (ppm) RA50 composition composition per ppm per ppm 400 8.25% 100 1% 9.25% 9% 100 75.00 300 7% 200 2% 8.9% 9% 100 105.00 200 5% 300 2.75% 7.75% 8% 91.66667 100.00 100 3% 400 3% 6% 7.5% 75 112.50
Conclusion: At 500 ppm total solid content, increasing the amount of GSG-RA50 results in a measured contribution of sweetness that was higher than the calculated value as shown in FIG. 29. A positive synergistic sweetness effect was found when GSG-RA50.gtoreq.200 ppm.
Example 19: Synergistic Effects of GSG-RA60 with RA97
A sweetness curve was prepared for GSG-RA60 and RA97 compositions (FIG. 30), and the taste profiles of 350 ppm total solid content samples were taken as shown in Table 39.
TABLE-US-00054 TABLE 39 Calc. Measured sweetness sweetness (ppm (ppm Calc. Calc. Calc. Measured sugar) of sugar) of SE GSG- SE of SE of SE GSG- GSG- RA97 of RA50 GSG- the of the RA60 per RA60 per (ppm) RA97 (ppm) RA60 composition composition ppm ppm total GSG 300 6.9% 50 0.6% 7.5% 7.2% 120 60.00 12.81% 250 6% 100 1.2% 7.2% 6.8% 120 80.00 25.61% 200 5% 150 1.8% 6.8% 7.2% 120 146.67 38.42% 150 4% 200 2.3% 6.3% 7.5% 115 175.00 51.22% 100 3.2% 250 2.7% 5.9% 7.5% 108 172.00 64.03% 50 1.5% 300 3% 4.5% 6% 100 150.00 76.83%
Calculated sweetness (ppm sugar) of GSG-RA60 per ppm=calculated SE of GSG-RA60/concentration of GSG-RA60. Measured sweetness (ppm sugar) of GSG-RA60 per ppm=(Measured SE-calculated SE of RA97)/concentration of GSG-RA60.
Conclusion: At 350 ppm total solid content, increasing the amount of GSG-RA60 results in a measured contribution of sweetness that rises continuously as shown in FIG. 31. When the concentration of GSG-RA60 is more than 150 ppm, the measured contribution of sweetness is higher than calculated. A positive synergistic sweetness effect was found when the concentration of GSG-RA60 was 150-300 ppm.
Example 20: Synergistic Effects of GSG-RA70 with RA97
A sweetness curve was prepared for GSG-RA70 and RA97 compositions (FIG. 32), and the taste profiles of 350 ppm total solid content samples were taken as shown in Table 40.
TABLE-US-00055 TABLE 40 Calc. Measured sweetness sweetness (ppm (ppm Calc. Calc. Calc. Measured sugar) of sugar) of SE GSG- SE of SE of SE GSG- GSG- RA97 of RA70 GSG- the of the RA70 per RA70 per (ppm) RA97 (ppm) RA70 composition composition ppm ppm total GSG 300 6.9% 50 0.8% 7.7% 7.2% 160 60.00 12.84% 250 6% 100 1.5% 7.5% 7% 150 100.00 25.69% 200 5% 150 2% 7% 7.5% 133 166.67 38.53% 150 4% 200 2.5% 6.5% 7.5% 125 175.00 51.37% 100 3.2% 250 3% 6.2% 7% 120 152.00 64.21% 50 1.5% 300 3% 5.1% 6% 120 150.00 77.06%
Calculated sweetness (ppm sugar) of GSG-RA70 per ppm=calculated SE of GSG-RA70/concentration of GSG-RA70. Measured sweetness (ppm sugar) of GSG-RA70 per ppm=(Measured SE-calculated SE of RA97)/concentration of GSG-RA70.
Conclusion: At 350 ppm total solid content, increasing the amount of GSG-RA70 results in a measured contribution of sweetness that rises continuously as shown in FIG. 33. When the concentration of GSG-RA70 is more than 150 ppm, the measured contribution of sweetness is higher than calculated. A positive synergistic sweetness effect was found when the concentration of GSG-RA70 was 150-200 ppm.
Example 21: Synergistic Effects of GSG-RA80 with RA97
A sweetness curve was prepared for GSG-RA80 and RA97 compositions (FIG. 34), and the taste profiles of 350 ppm total solid content samples were taken as shown in Table 41.
TABLE-US-00056 TABLE 41 GSG- Total solid RA97 RA80 content Sugar After- total (ppm) (ppm) (ppm) SE like Bitterness taste Lingering GSG 350 -- 350 8% 3 2 3 4 300 50 350 7.5% 4 0 1 2 12.71% 250 100 350 8% 4 0 0.5 2 25.43% 200 150 350 7.8% 4.5 0 0 2 38.14% 150 200 350 7.2% 4 0 0 2 50.86% 100 250 350 7% 4 0 0 2 63.57%
At 350 ppm total solid content, a synergistic effect was found at a range of 200-250 ppm RA97 and 100-150 ppm GSG-RA80.
The sweetness of GSG-RA80 or RA97 at each concentration was read according to the sweetness curve, and the combined sweetness of each composition of GSG-RA80 and RA97 was calculated and compared with measured value in Table 42.
TABLE-US-00057 TABLE 42 Calc. Measured sweetness sweetness (ppm (ppm Calc. sugar) of sugar) of Calc. SE of Calc. SE Measured GSG- GSG- RA97 SE of GSG- GSG- of the SE of the RA80 per RA80 per (ppm) RA97 RA80 RA80 composition composition ppm ppm 350 -- -- -- -- 8% 0 0 300 6.9% 50 1% 7.9% 7.5% 200 120 250 6% 100 1.5% 7.5% 8% 150 200 200 5% 150 2% 7% 7.8% 133.33 186.67 150 4.2% 200 2.5% 6.7% 7.2% 125 150 100 3% 250 3% 6% 7% 120 160
Calculated sweetness (ppm sucrose) of GSG-RA80 per ppm=calculated SE of GSG-RA80/concentration of GSG-RA80. Measured sweetness (ppm sucrose) of GSG-RA50 per ppm=(Measured SE-calculated SE of RA97)/concentration of GSG-RA80.
Conclusion: At 350 ppm total solid content, increasing the amount of GSG-RA80 results in a measured contribution of sweetness that rises continuously as shown in FIG. 35. When the concentration of GSG-RA80 is more than 100 ppm, the measured contribution of sweetness is higher than calculated. A positive synergistic sweetness effect was found when the concentration of GSG-RA80 was more than 100 ppm.
Example 22: Synergistic Effects of GSG-RA90 with RA97
A sweetness curve was prepared for GSG-RA90 and RA97 compositions (FIG. 36), and the taste profiles of 350 ppm total solid content samples were taken as shown in Table 43.
TABLE-US-00058 TABLE 43 Calc. Measured sweetness sweetness (ppm (ppm Calc. Calc. Calc. Measured sugar) of sugar)of SE GSG- SE of SE of SE GSG- GSG- RA97 of RA90 GSG- the of the RA90 per RA90 per (ppm) RA97 (ppm) RA90 composition composition ppm ppm total GSG 300 6.9% 50 0.7% 7.6% 7.2% 140 60.00 12.87% 250 6% 100 1.6% 7.6% 7% 160 100.00 25.73% 200 5% 150 2% 7% 7.5% 133 166.67 38.60% 150 4% 200 2.5% 6.5% 7.5% 125 175.00 51.47% 100 3.2% 250 3% 6.2% 7% 120 152.00 64.34% 50 1.5% 300 3.2% 4.7% 6% 107 150.00 77.20%
Calculated sweetness (ppm sugar) of GSG-RA90 per ppm=calculated SE of GSG-RA90/concentration of GSG-RA90. Measured sweetness (ppm sugar) of GSG-RA90 per ppm=(Measured SE-calculated SE of RA97)/concentration of GSG-RA90.
Conclusion: At 350 ppm total solid content, increasing the amount of GSG-RA90 results in a measured contribution of sweetness that rises continuously as shown in FIG. 37. When the concentration of GSG-RA90 is more than 150 ppm, the measured contribution of sweetness is higher than calculated. A positive synergistic sweetness effect was found when the concentration of GSG-RA90 was 150-200 ppm.
Example 23: Synergistic Effects of GSG-RA95 with RA97
A sweetness curve was prepared for GSG-RA95 and RA97 compositions (FIG. 38), and the taste profiles of 200 ppm total solid content samples were taken as shown in Table 44.
TABLE-US-00059 TABLE 44 Calc. Measured sweetness sweetness (ppm (ppm Calc. Calc. Calc. Measured sugar) of sugar)of SE GSG- SE of SE of SE GSG- GSG- RA97 of RA95 GSG- the of the RA95 per RA95 per (ppm) RA97 (ppm) RA95 composition composition ppm ppm total GSG 150 4.2% 50 1% 5.2% 5% 200 160.00 22.65% 100 3% 100 1.8% 4.8% 4.5% 180 150.00 45.30% 50 1.5% 150 2.2% 3.7% 4% 146.67 166.67 67.95%
Calculated sweetness (ppm sugar) of GSG-RA95 per ppm=calculated SE of GSG-RA95/concentration of GSG-RA95. Measured sweetness (ppm sugar) of GSG-RA95 per ppm=(Measured SE-calculated SE of RA97)/concentration of GSG-RA95.
Conclusion: At 200 ppm total solid content, increasing the amount of GSG-RA95 results in a measured contribution to sweetness that was higher than the calculated value as shown in FIG. 39. A positive synergistic sweetness effect was found when GSG-RA95>100 ppm.
The samples with total solid content of 350 ppm are shown in Table 45.
TABLE-US-00060 TABLE 45 Calc. Measured sweetness sweetness (ppm (ppm Calc. GSG- Calc. SE Calc. SE Measured sucrose) of sucrose) of RA97 SE of RA95 of GSG- of the SE of the GSG-RA95 GSG-RA95 (ppm) RA97 (ppm) RA95 composition composition per ppm per ppm 300 6.9% 50 1% 7.9% 7% 200 20.00 250 6% 100 1.8% 7.8% 7.4% 180 140.00 200 5% 150 2.2% 7.2% 7.3% 146.67 153.33 150 4% 200 2.6% 6.6% 7.6% 130 180.00 100 3.2% 250 3% 6.2% 7.8% 120 184.00 50 1.5% 300 3.4% 4.9% 7.5% 113.33 200.00
Conclusion: At 350 ppm total solid content, increasing the amount of GSG-RA95 results in a measured contribution of sweetness that was higher than the calculated value as shown in FIG. 40. A positive synergistic sweetness effect was found when GSG-RA95>150 ppm, specifically >200 ppm.
The samples with total solid content of 400 ppm are shown in Table 46.
TABLE-US-00061 TABLE 46 Calc. Measured sweetness sweetness (ppm (ppm Calc. GSG- Calc. SE Calc. SE Measured sucrose) of sucrose) of RA97 SE of RA95 of GSG- of the SE of the GSG-RA95 GSG-RA95 (ppm) RA97 (ppm) RA95 composition composition per ppm per ppm 300 6.9% 100 1.8% 8.7% 8% 180 110.00 250 6% 150 2.2% 8.2% 8.3% 146.67 153.33 200 5% 200 2.6% 7.6% 8.3% 130 165.00 150 4.2% 250 3% 7.2% 7.8% 120 144.00 100 3% 300 3.4% 6.4% 7.2% 113.33 140.00
Conclusion: At 400 ppm total solid content, increasing the amount of GSG-RA50 results in a measured contribution of sweetness that was higher than the calculated value as shown in FIG. 41. A positive synergistic sweetness effect was found when GSG-RA95>150 ppm, with an optimal range of 150-200 ppm.
The samples with total solid content of 450 ppm are shown in Table 47.
TABLE-US-00062 TABLE 47 Calc. Measured sweetness sweetness (ppm (ppm Calc. GSG- Calc. SE Calc. SE Measured sucrose) of sucrose) of RA97 SE of RA95 of GSG- of the SE of the GSG-RA95 GSG-RA95 (ppm) RA97 (ppm) RA95 composition composition per ppm per ppm 300 6.9% 150 2.2% 9.1% 8.5% 146.67 106.67 250 6% 200 2.6% 8.6% 8.5% 130.00 125.00 200 5% 250 3% 8% 8.5% 120.00 140.00 150 4.2% 300 3.4% 7.6% 8% 113.33 126.67 100 3% 350 3.8% 6.8% 7.5% 108.57 128.57
Conclusion: At 450 ppm total solid content, increasing the amount of GSG-RA50 results in a measured contribution of sweetness that was higher than the calculated value as shown in FIG. 42. A positive synergistic sweetness effect was found when GSG-RA50>200 ppm, with an optimal range about 250 ppm.
The samples with total solid content of 500 ppm are shown in Table 48.
TABLE-US-00063 TABLE 48 Calc. Measured sweetness sweetness (ppm (ppm Calc. GSG- Calc. SE Calc. SE Measured sucrose) of sucrose) of RA97 SE of RA95 of GSG- of the SE of the GSG-RA95 GSG-RA95 (ppm) RA97 (ppm) RA95 composition composition per ppm per ppm 400 8.25% 100 1.8% 10.05% 9% 180 75.00 300 7% 200 2.6% 9.5% 9.8% 130 145.00 200 5% 300 3.4% 8.4% 9.2% 113 140.00 100 3% 400 4% 7% 8.2% 100 130.00
Conclusion: At 500 ppm total solid content, increasing the amount of GSG-RA95 results in a measured contribution of sweetness that was higher than the calculated value as shown in FIG. 43. A positive synergistic sweetness effect was found when GSG-RA95>200 ppm.
Example 24
Evaluating the taste profile of RA50/RC5 and GSG-RC5, in order to find out the taste improvement effect to RA50/RC5 by glycosylating.
Conditions: The samples were tested in aqueous solution of citric acid at pH 3.8.
The samples were as follows
TABLE-US-00064 TABLE 49 RA50/RC5 GSG-(RA50 + RC5) 500 ppm -- -- 1000 ppm
The concentration of GSG-(RA50+RC5) is twice as high as RA50/RC5 in order to make the sweetness of them similar.
TABLE-US-00065 TABLE 50 Results GSG- (RA50 + RA50/RC5 RC5) Sugar like Bitterness Aftertaste Lingering 500 ppm -- 1 5 5 4 -- 1000 ppm 3 0.5 3 2
Glycosylating can improve the taste profile of RA50/RC5 significantly.
Example 25
Evaluating the taste profile of RA30/RC15 and GSG-(RA50+RC5), in order to find out the taste improvement effect to RA30/RC15 by glycosylating.
The samples were tested in aqueous solution of citric acid at pH 3.8.
The samples were as follows:
TABLE-US-00066 TABLE 51 RA30/RC15 GSG-(RA30 + RC15) 1500 ppm -- -- 1000 ppm
The concentration of GSG-(RA30+RC15) is twice as high as RA30/RC15 in order to make the sweetness of them similar.
TABLE-US-00067 TABLE 52 Results GSG- (RA30 + RA30/RC15 RC15) Sugar like Bitterness Aftertaste Lingering 500 ppm -- 0.5 5 5 4 -- 1000 ppm 3.5 0.5 2.5 2
Glycosylating can improve the taste profile of RA30/RC15 significantly.
Example 26
Evaluating the taste profile of RA40/RB8 and GSG-(RA40+RB8), in order to find out the taste improvement effect to RA40/RB8 by glycosylating.
The samples were tested in aqueous solution of citric acid at pH 3.8.
The samples were as follows:
TABLE-US-00068 TABLE 53 RA40/RB8 GSG-(RA40 + RB8) 500 ppm -- -- 1000 ppm
The concentration of GSG-(RA40+RB8) is twice as high as RA40/RB8 in order to make the sweetness of them similar.
TABLE-US-00069 TABLE 54 Results GSG- (RA40 + RA40/RB8 RB8) Sugar like Bitterness Aftertaste Lingering 500 ppm -- 2 2 3 4 -- 1000 ppm 4 0 1 2
Glycosylating can improve the taste profile of RA40/RB8 significantly.
Example 27
Evaluating the taste profile of compositions of GSG-(RA50+RC5) and RA97, in order to find out the optimized ratio with the best synergistic taste effects.
The samples were tested in aqueous solution of citric acid at pH 3.8.
The control sample was RA97 at 400 ppm, corresponding to 8.3% SE.
The samples were as follows:
TABLE-US-00070 TABLE 55 RA97 GSG-(RA50 + RC5) 400 ppm -- 300 ppm 100 ppm 250 ppm 150 ppm 200 ppm 200 ppm 150 ppm 250 ppm 100 ppm 300 ppm
Sweetness curve of GSG-(RA50+RC5) and RA97 was shown as FIG. 44.
Taste profile of RA97/GSG-(RA50+RC5) composition was shown as follows:
TABLE-US-00071 TABLE 56 GSG- (RA50 + Sugar Bitter- RA97 RC5) SE like ness Aftertaste Lingering 400 ppm -- 8.30% 3 2 3 4 300 ppm 100 ppm 8.30% 3.5 0.5 2 3 250 ppm 150 ppm 8.50% 4 0.5 1.5 3 200 ppm 200 ppm 8.50% 3.5 0.5 2 2 150 ppm 250 ppm 8.00% 3.5 0.5 3 3 100 ppm 300 ppm 7.00% 3.5 0.5 3 2
The taste of RA97 was improved by GSG-(RA50+RC5), especially at the ratio of 3:1 to 1:1.
As for the synergistic effect, it can be found that
TABLE-US-00072 TABLE 57 Calculated Measured sweetness sweetness (ppm (ppm Calculated Calculated Calculated Measured sucrose) of sucrose) of SE GSG- SE of SE SE of GSG- GSG- RA97 of (RA50 + RC5) GSG- of the the (RA50 + RC5) (RA50 + RC5) concentration RA97 concentration (RA50 + RC5) composition composition per ppm per ppm 400 ppm 0 0.00 0 300 ppm 6.90% 100 1.80% 8.70% 8.30% 180.00 140.00 250 ppm 6% 150 2.30% 8.30% 8.50% 153.33 166.67 200 ppm 5% 200 2.80% 7.80% 8.50% 140.00 175.00 150 ppm 4.20% 250 3.00% 7.20% 8.00% 120.00 152.00 100 ppm 3% 300 3.20% 6.20% 7.00% 106.67 133.33
Calculated sweetness (ppm sugar) of GSG-(RA50+RC5) per ppm=calculated SE of GSG-(RA50+RC5)/concentration of GSG-RC5.
Measured sweetness (ppm sugar) of GSG-(RA50+RC5) per ppm=(Measured SE-calculated SE of RA97)/concentration of GSG-(RA50+RC5).
The data were showed in FIG. 45.
It is found that at 400 ppm total solid content, with the increase of the amount of GSG-(RA50+RC5), its measured contribution of sweetness was higher than calculated value. Significant synergistic effect was found when GSG-(RA50+RC5)>150 ppm, although the optimized range was 150-200 ppm.
Example 28
Evaluating the taste profile of compositions of GSG-(RA30+RC15) and RA97, in order to find out the optimized ratio with the best synergistic taste effects.
The samples were tested in aqueous solution of citric acid at pH 3.8.
The control sample was RA97 at 400 ppm, corresponding to 8.3% SE.
The samples were as follows:
TABLE-US-00073 TABLE 58 RA97 GSG-(RA30 + RC15) 400 ppm -- 300 ppm 100 ppm 250 ppm 150 ppm 200 ppm 200 ppm 150 ppm 250 ppm 100 ppm 300 ppm
Sweetness curve of GSG-(RA30+RC15) and RA97 was shown in FIG. 46.
Taste profile of RA97/GSG-(RA30+RC15) composition was shown as follows:
TABLE-US-00074 TABLE 59 GSG- (RA30 + Sugar Bitter- RA97 RC15) SE like ness Aftertaste Lingering 400 ppm -- 8.30% 3 2 3 4 300 ppm 100 ppm 8.50% 3.5 0.5 1.5 2.5 250 ppm 150 ppm 7.90% 3.5 0.5 1.5 2 200 ppm 200 ppm 7.30% 3.5 0.5 1 2 150 ppm 250 ppm 7.00% 3.5 0.5 1 2 100 ppm 300 ppm 6.50% 3.5 0.5 1.5 2
The taste of RA97 was improved by GSG-(RA30+RC15).
As for the synergistic effect, it can be found in Table 60.
TABLE-US-00075 TABLE 60 Calculated Measured sweetness sweetness (ppm (ppm sucrose) sucrose) Calculated of GSG- of GSG- Calculated GSG- SE of Calculated Measured (RA30 + RC15) (RA30 + RC15) RA97 SE of (RA30 + RC15) GSG- SE of the SE of the per per concentration RA97 concentration (RA30 + RC15) composition composition ppm ppm 400 ppm 0 0.00 0 300 ppm 6.90% 100 1.00% 7.90% 8.50% 100.00 160.00 250 ppm 6% 150 1.40% 7.40% 7.90% 93.33 126.67 200 ppm 5% 200 1.80% 6.80% 7.30% 90.00 115.00 150 ppm 4.20% 250 2.20% 6.40% 7.00% 88.00 112.00 100 ppm 3% 300 2.60% 5.60% 6.50% 86.67 116.67
Calculated sweetness (ppm sugar) of GSG-(RA30+RC15) per ppm=calculated SE of GSG-(RA30+RC15)/concentration of GSG-(RA30+RC15)
Measured sweetness (ppm sugar) of GSG-(RA30+RC15) per ppm=(Measured SE-calculated SE of RA97)/concentration of GSG-(RA30+RC15)
The data were showed in FIG. 47.
It is found that at 400 ppm total solid content, with the increase of the amount of GSG-(RA30+RC15), its measured contribution of sweetness was higher than calculated value. Significant synergistic effect was found when GSG-(RA30+RC15)>100 ppm, although the optimized range was 100-150 ppm.
Example 29
Evaluating the taste profile of compositions of GSG-(RA40+RB8) and RA97, in order to find out the optimized ratio with the best synergistic taste effects.
The samples were tested in aqueous solution of citric acid at pH 3.8.
The control sample was RA97 at 400 ppm, corresponding to 8.3% SE.
The samples were as follows:
TABLE-US-00076 TABLE 61 RA97 GSG-(RA40 + RB8) 400 ppm -- 300 ppm 100 ppm 250 ppm 150 ppm 200 ppm 200 ppm 150 ppm 250 ppm 100 ppm 300 ppm
Sweetness curve of GSG-(RA40+RB8) and RA97 was shown in FIG. 48.
Taste profile of RA97/GSG-(RA40+RB8) composition was shown in Table 62.
TABLE-US-00077 TABLE 62 GSG- (RA40 + Sugar Bitter- RA97 RB8) SE like ness Aftertaste Lingering 400 ppm -- 8.30% 3 2 3 4 300 ppm 100 ppm 8.30% 3 1 2 2.5 250 ppm 150 ppm 8.00% 4.5 0 0.5 1 200 ppm 200 ppm 7.80% 4 0 1 1 150 ppm 250 ppm 7.50% 3.5 0 2 2 100 ppm 300 ppm 7.00% 3.5 0 1.5 2
The taste of RA97 was improved by GSG-(RA40+RB8).
As for the synergistic effect, it can be found in table 63.
TABLE-US-00078 TABLE 63 Calculated Measured sweetness sweetness (ppm (ppm Calculated Calculated Calculated Measured sucrose) of sucrose) of SE GSG- SE of SE SE of GSG- GSG- RA97 of (RA40 + RB8) GSG- of the the (RA40 + RB8) (RA40 + RB8) concentration RA97 concentration (RA40 + RB8) composition compostion per ppm per ppm 400 ppm 0 0.00 0 300 ppm 6.90% 100 1.50% 8.40% 8.30% 150.00 140.00 250 ppm 6% 150 2.00% 8.00% 8.00% 133.33 133.33 200 ppm 5% 200 2.40% 7.40% 7.80% 120.00 140.00 150 ppm 4.20% 250 2.70% 6.90% 7.50% 108.00 132.00 100 ppm 3% 300 2.80% 5.80% 7.00% 93.33 133.33
Calculated sweetness (ppm sugar) of GSG-(RA40+RB8) per ppm=calculated SE of GSG-(RA40+RB8)/concentration of GSG-(RA40+RB8)
Measured sweetness (ppm sugar) of GSG-(RA40+RB8) per ppm=(Measured SE-calculated SE of RA97)/concentration of GSG-(RA40+RB8)
The data was showed in FIG. 49.
It is found that at 400 ppm total solid content, with the increase of the amount of GSG-(RA40+RB8), its measured contribution of sweetness was higher than calculated value. Significant synergistic effect was found when GSG-(RA40+RB8)>150 ppm, although the optimized range was 200-300 ppm.
Example 30
Evaluating the taste profile of compositions of GSG-RA20 and RA/RB/RD composition, in order to find out the optimized ratio with the best synergistic taste effects.
The samples were tested in aqueous solution of citric acid at pH 3.8.
The control sample was RA/RB/RD at 400 ppm, corresponding to 8.3% SE.
The samples were as follows:
TABLE-US-00079 TABLE 64 RA/RB/RD composition GSG-RA20 400 ppm -- 300 ppm 100 ppm 250 ppm 150 ppm 200 ppm 200 ppm 150 ppm 250 ppm 100 ppm 300 ppm
Sweetness curve of GSG-RA20 and RA/RB/RD composition was shown as FIG. 50.
Taste profile of RA/RB/RD/GSG-RA20 composition was shown in table 65.
TABLE-US-00080 TABLE 65 RA/RB/RD composition GSG-RA20 SE 400 ppm -- 8.30% 300 ppm 100 ppm 8.70% 250 ppm 150 ppm 9.00% 200 ppm 200 ppm 8.80% 150 ppm 250 ppm 8.50% 100 ppm 300 ppm 8.00%
As for the synergistic effect, it can be found in table 66.
TABLE-US-00081 TABLE 66 Calculated Measured sweetness sweetness Calculated Calculated Calculated Measured (ppm (ppm SE GSG- SE of SE SE of sucrose) of sucrose) of RA-B-D of RA- RA20 GSG- of the the GSG-RA20 GSG-RA20 concentration B-D concentration RA20 composition composition per ppm per ppm 400 ppm 0 0.00 0 300 ppm 7.20% 100 1.50% 8.70% 8.70% 150.00 150.00 250 ppm 6.00% 150 2.00% 8.00% 9.00% 133.33 200.00 200 ppm 5.40% 200 2.40% 7.80% 8.80% 120.00 170.00 150 ppm 4.20% 250 2.70% 6.90% 8.50% 108.00 172.00 100 ppm 3.00% 300 2.80% 5.80% 8.00% 93.33 166.67
Calculated sweetness (ppm sugar) of GSG-RA20 per ppm=calculated SE of GSG-RA20/concentration of GSG-RA20
Measured sweetness (ppm sugar) of GSG-RA20 per ppm=(Measured SE-calculated SE of RA-B-D composition)/concentration of GSG-RA20
The data were showed in FIG. 51.
It is found that at 400 ppm total solid content, with the increase of the amount of GSG-RA20, its measured contribution of sweetness was higher than calculated value. Significant synergistic effect was found when GSG-RA20>100 ppm, although the optimized range was 150-200 ppm.
Example 31
Evaluating the taste profile of compositions of GSG-RA95 and RA75/RB15, in order to find out the optimized ratio with the best synergistic taste effects.
The samples were tested in aqueous solution of citric acid at pH 3.8.
The control sample was RA75/RB15 at 400 ppm, corresponding to 7.0% SE.
The samples were as follows:
TABLE-US-00082 TABLE 67 RA75/RB15 GSG-RA95 total GSG 400 ppm -- 300 ppm 100 ppm 22.65% 250 ppm 150 ppm 33.98% 200 ppm 200 ppm 45.30% 150 ppm 250 ppm 56.63% 100 ppm 300 ppm 67.95%
Sweetness curve of GSG-RA95 and RA75/RB15 was shown in FIG. 52.
Taste profile of RA75/RB15/GSG-RA95 composition was shown in table 68.
TABLE-US-00083 TABLE 68 RA75/ GSG- Sugar RB15 RA95 SE like Bitterness Aftertaste Lingering 400 ppm -- 7.0% 4.5 0 1.5 1.5 300 ppm 100 ppm 7.0% 4.5 0 1 1.5 250 ppm 150 ppm 7.8% 4 0 2 2 200 ppm 200 ppm 7.5% 4 0 2 2 150 ppm 250 ppm 6.5% 4.5 0 0.5 1 100 ppm 300 ppm 6.0% 4.5 0 0.5 1.5
The taste of RA75/RB15 was improved by GSG-RA95 although the taste of itself is good enough.
As for the synergistic effect, it can be found in table 69.
TABLE-US-00084 TABLE 69 Measured Calculated sweetness sweetness (ppm Calculated Calculated Calculated Measured (ppm sucrose) of RA75/ SE of GSG- SE of SE of SE of sucrose) of GSG- RB15 RA75/ RA95 GSG- the the GSG-RA95 RA95 per concentration RB15 concentration RA95 composition composition per ppm ppm 400 ppm 0 0.00 0 300 ppm 5.80% 100 1.80% 7.60% 7.40% 180.00 160.00 250 ppm 5% 150 2.20% 7.20% 7.90% 146.67 193.33 200 ppm 4% 200 2.60% 6.80% 7.70% 130.00 175.00 150 ppm 3.40% 250 3.00% 6.40% 6.80% 120.00 136.00 100 ppm 3% 300 3.40% 5.90% 6.50% 113.33 133.33
Calculated sweetness (ppm sugar) of GSG-RA95 per ppm=calculated SE of GSG-RA95/concentration of GSG-RA95
Measured sweetness (ppm sugar) of GSG-RA95 per ppm=(Measured SE-calculated SE of RA75/RB15)/concentration of GSG-RA95
The data were showed in FIG. 53.
It is found that at 400 ppm total solid content, with the increase of the amount of GSG-RA95, its measured contribution of sweetness was higher than calculated value. Significant synergistic effect was found when GSG-RA95>150 ppm, although the optimized range was 150-200 ppm.
Example 32
Evaluating the taste profile of compositions of GSG-RA95 and RA/RD, in order to find out the optimized ratio with the best synergistic taste effects.
The samples were tested in aqueous solution of citric acid at pH 3.8.
The control sample was RA/RD at 400 ppm, corresponding to 6.5% SE.
The samples were as follows:
TABLE-US-00085 TABLE 70 RA/RD GSG-RA95 total GSG 400 ppm -- 300 ppm 100 ppm 22.65% 250 ppm 150 ppm 33.98% 200 ppm 200 ppm 45.30% 150 ppm 250 ppm 56.63% 100 ppm 300 ppm 67.95%
Sweetness curve of GSG-RA95 and RA/RD was shown as FIG. 4.
Taste profile of RA/RD/GSG-RA95 composition was shown in table 71.
TABLE-US-00086 TABLE 71 GSG- Sugar Bitter- RA/RD RA95 SE like ness Aftertaste Lingering 400 ppm -- 6.5% 3.5 1 1 1.5 300 ppm 100 ppm 8% 4.5 0 0.5 0.5 250 ppm 150 ppm 8.30% 4 0 1 0.5 200 ppm 200 ppm 7.80% 4.5 0 0.5 0.5 150 ppm 250 ppm 7.50% 4.5 0 0.5 0.5 100 ppm 300 ppm 6.80% 4.5 0 0 0.5
The taste of RA/RD was improved by GSG-RA95 by reducing the bitterness and lingering.
As for the synergistic effect, it can be found in table 72.
TABLE-US-00087 TABLE 72 Measured Calculated sweetness sweetness (ppm Calculated Calculated Measured (ppm sucrose) of Calculated GSG- SE of SE of SE of sucrose) of GSG- RA/RD SE of RA95 GSG- the the GSG-RA95 RA95 per concentration RA/RD concentration RA95 composition composition per ppm ppm 400 ppm 0 0.00 0 300 ppm 6.00% 100 1.80% 7.80% 8% 180.00 200.00 250 ppm 5.50% 150 2.20% 7.70% 8.30% 146.67 186.67 200 ppm 4.80% 200 2.60% 7.40% 7.80% 130.00 150.00 150 ppm 4.00% 250 3.00% 7.00% 7.50% 120.00 140.00 100 ppm 3.00% 300 3.40% 6.40% 6.80% 113.33 126.67
Calculated sweetness (ppm sugar) of GSG-RA95 per ppm=calculated SE of GSG-RA95/concentration of GSG-RA95
Measured sweetness (ppm sugar) of GSG-RA95 per ppm=(Measured SE-calculated SE of RA/RD)/concentration of GSG-RA95
The data were showed in FIG. 55.
It is found that at 400 ppm total solid content, with the increase of the amount of GSG-RA95, its measured contribution of sweetness was higher than calculated value. Significant synergistic effect was found when GSG-RA95>100 ppm, although the optimized range was 100-250 ppm.
Example 33
Evaluating the taste profile of compositions of GSG-RA95 and RA80/RB10/RD6, in order to find out the optimized ratio with the best synergistic taste effects.
The samples were tested in aqueous solution of citric acid at pH 3.8.
The control sample was RA80/RB10/RD6 at 400 ppm, corresponding to 8.3% SE.
The samples were as follows:
TABLE-US-00088 TABLE 73 RA80/RB10/RD6 GSG-RA95 total GSG 400 ppm -- 300 ppm 100 ppm 22.65% 250 ppm 150 ppm 33.98% 200 ppm 200 ppm 45.30% 150 ppm 250 ppm 56.63% 100 ppm 300 ppm 67.95%
Sweetness curve of GSG-RA95 and RA80/RB10/RD6 was shown as FIG. 56.
Taste profile of RA80/RB10/RD6/GSG-RA95 composition was shown in table 74.
TABLE-US-00089 TABLE 74 RA80/ RB10/ GSG- Sugar Bitter- RD6 RA95 SE like ness Aftertaste Lingering 400 ppm -- 8.3% 4.5 0 0 0.5 300 ppm 100 ppm 7.70% 4.5 0 0.5 0.5 250 ppm 150 ppm 8.30% 4.5 0 0 0.5 200 ppm 200 ppm 8.30% 4 0 0.5 0.5 150 ppm 250 ppm 8.20% 4.5 0 0 0.5 100 ppm 300 ppm 7.20% 3.5 0 1 1
As for the synergistic effect, it can be found in table 75.
TABLE-US-00090 TABLE 75 Measured Calculated sweetness Calculated sweetness (ppm RA80/ SE of Calculated Calculated Measured (ppm sucrose) of RB10/ RA80/ GSG- SE of SE of SE of sucrose) of GSG- RD6 RB10/ RA95 GSG- the the GSG-RA95 RA95 per concentration RD6 concentration RA95 composition composition per ppm ppm 400 ppm 0 0.00 0 300 ppm 7.20% 100 1.80% 9.00% 7.70% 180.00 50.00 250 ppm 6.00% 150 2.20% 8.20% 8.30% 146.67 153.33 200 ppm 5.40% 200 2.60% 8.00% 8.30% 130.00 145.00 150 ppm 4.20% 250 3.00% 7.20% 8.20% 120.00 160.00 100 ppm 3.00% 300 3.40% 6.40% 7.20% 113.33 140.00
Calculated sweetness (ppm sugar) of GSG-RA95 per ppm=calculated SE of GSG-RA95/concentration of GSG-RA95
Measured sweetness (ppm sugar) of GSG-RA95 per ppm=(Measured SE-calculated SE of RA80/RB10/RD6)/concentration of GSG-RA95
The data were showed in FIG. 57.
It is found that at 400 ppm total solid content, with the increase of the amount of GSG-RA95, its measured contribution of sweetness was higher than calculated value. Significant synergistic effect was found when GSG-RA95>150 ppm, although the optimized range was 200-250 ppm.
Example 34
Evaluating the taste profile of compositions of GSG-RA80 and RA75/RB15, in order to find out the optimized ratio with the best synergistic taste effects.
The samples were tested in aqueous solution of citric acid at pH 3.8.
The control sample was RA75/RB15 at 400 ppm, corresponding to 7.0% SE.
The samples were as follows:
TABLE-US-00091 TABLE 76 RA75/RB15 GSG-RA80 total GSG 400 ppm -- 300 ppm 100 ppm 22.25% 250 ppm 150 ppm 33.38% 200 ppm 200 ppm 44.50% 150 ppm 250 ppm 55.63% 100 ppm 300 ppm 66.75%
Sweetness curve of GSG-RA80 and RA75/RB15 was shown as FIG. 58.
Taste profile of RA75/RB15/GSG-RA80 composition was shown in table 77.
TABLE-US-00092 TABLE 77 RA75/ GSG- Sugar RB15 RA80 SE like Bitterness Aftertaste Lingering 400 ppm -- 7.0% 4.5 0 1.5 1.5 300 ppm 100 ppm 7.2% 4 0 0.5 1 250 ppm 150 ppm 7.7% 4 0 0.5 1 200 ppm 200 ppm 7.5% 4 0 0.5 1 150 ppm 250 ppm 6.8% 4.5 0 0 0.5 100 ppm 300 ppm 6.3% 4 0 1 0.5
As for the synergistic effect, it can be found in table 78.
TABLE-US-00093 TABLE 78 Measured Calculated sweetness sweetness (ppm Calculated Calculated Calculated Measured (ppm sucrose) of RA75/ SE of SE of SE of SE of sucrose) of GSG- RB15 RA75/ GSG- GSG- the the GSG-RA80 RA80 per concentration RB15 RA80concentration RA80 composition composition per ppm ppm 400 ppm 0 0.00 0 300 ppm 5.80% 100 1.50% 7.30% 7.20% 150.00 140.00 250 ppm 5% 150 2.00% 7.00% 7.70% 133.33 180.00 200 ppm 4% 200 2.50% 6.70% 7.50% 125.00 165.00 150 ppm 3.40% 250 2.90% 6.30% 6.80% 116.00 136.00 100 ppm 3% 300 3.30% 5.80% 6.30% 110.00 126.67
Calculated sweetness (ppm sugar) of GSG-RA80 per ppm=calculated SE of GSG-RA80/concentration of GSG-RA80
Measured sweetness (ppm sugar) of GSG-RA80 per ppm=(Measured SE-calculated SE of RA75/RB15)/concentration of GSG-RA80
The data were showed in FIG. 59.
It is found that at 400 ppm total solid content, with the increase of the amount of GSG-RA80, its measured contribution of sweetness was higher than calculated value. Significant synergistic effect was found when GSG-RA80>150 ppm, although the optimized range was 150-250 ppm.
Example 35
Evaluating the taste profile of compositions of GSG-RA80 and RA/RD, in order to find out the optimized ratio with the best synergistic taste effects.
The samples were tested in aqueous solution of citric acid at pH 3.8.
The control sample was RA/RD at 400 ppm, corresponding to 6.5% SE.
The samples were as follows:
TABLE-US-00094 TABLE 79 RA/RD GSG-RA80 total GSG 400 ppm -- 300 ppm 100 ppm 22.25% 250 ppm 150 ppm 33.38% 200 ppm 200 ppm 44.50% 150 ppm 250 ppm 55.63% 100 ppm 300 ppm 66.75%
Sweetness curve of GSG-RA80 and RA/RD was shown as FIG. 60.
Taste profile of RA/RD/GSG-RA80 composition was shown in table 80.
TABLE-US-00095 TABLE 80 GSG- Sugar RA/RD RA80 SE like Bitterness Aftertaste Lingering 400 ppm -- 6.5% 3.5 1 1 1.5 300 ppm 100 ppm 8.2% 3.5 2 2 2 250 ppm 150 ppm 7.9% 4 0.5 0.5 1 200 ppm 200 ppm 7.2% 4 0 1 1 150 ppm 250 ppm 6.5% 4.5 0 0.5 1 100 ppm 300 ppm 6.0% 4 0 0.5 1
The taste of RA/RD was improved by GSG-RA80 by reducing the bitterness and lingering.
As for the synergistic effect, it can be found in table 81.
TABLE-US-00096 TABLE 81 Measured Calculated sweetness sweetness (ppm Calculated Calculated Measured (ppm sucrose) of Calculated GSG- SE of SE of SE of sucrose) of GSG- RA/RD SE of RA80 GSG- the the GSG-RA80 RA80 per concentration RA/RD concentration RA80 composition composition per ppm ppm 400 ppm 0 0.00 0 300 ppm 6.00% 100 1.50% 7.50% 8.20% 150.00 220.00 250 ppm 5.50% 150 2.00% 7.50% 7.90% 133.33 160.00 200 ppm 4.80% 200 2.50% 7.30% 7.20% 125.00 120.00 150 ppm 4.00% 250 2.90% 6.90% 6.50% 116.00 100.00 100 ppm 3.00% 300 3.30% 6.30% 6.00% 110.00 100.00
Calculated sweetness (ppm sugar) of GSG-RA80 per ppm=calculated SE of GSG-RA80/concentration of GSG-RA80
Measured sweetness (ppm sugar) of GSG-RA80 per ppm=(Measured SE-calculated SE of RA/RD)/concentration of GSG-RA80
The data were showed in FIG. 61.
It is found that at 400 ppm total solid content, with the increase of the amount of GSG-RA80, its measured contribution of sweetness was higher than calculated value. Significant synergistic effect was found when GSG-RA80 was 100-200 ppm, although the optimized range was 100-150 ppm.
Example 36
Evaluating the taste profile of compositions of GSG-RA80 and RA80/RB10/RD6, in order to find out the optimized ratio with the best synergistic taste effects.
The samples were tested in aqueous solution of citric acid at pH 3.8.
The control sample was RA80/RB10/RD6 at 400 ppm, corresponding to 8.3% SE.
The samples were as follows:
TABLE-US-00097 TABLE 82 RA80/RB10/RD6 GSG-RA80 total GSG 400 ppm -- 300 ppm 100 ppm 22.25% 250 ppm 150 ppm 33.38% 200 ppm 200 ppm 44.50% 150 ppm 250 ppm 55.63% 100 ppm 300 ppm 66.75%
Sweetness curve of GSG-RA80 and RA80/RB10/RD6 was shown in FIG. 62.
Taste profile of RA80/RB10/RD6/GSG-RA80 composition was shown in table 83.
TABLE-US-00098 TABLE 83 RA80/ RB10/ GSG- Sugar RD6 RA80 SE like Bitterness Aftertaste Lingering 400 ppm -- 8.3% 4.5 0 0 0.5 300 ppm 100 ppm 7.5% 4 0 1 0.5 250 ppm 150 ppm 8.3% 3.5 0.5 2 2 200 ppm 200 ppm 8.1% 4.5 0 0.5 0.5 150 ppm 250 ppm 7.8% 4.5 0 0.5 0.5 100 ppm 300 ppm 7.0% 4 0 1 1
As for the synergistic effect, it can be found in table 84.
TABLE-US-00099 TABLE 84 Measured Calculated sweetness Calculated sweetness (ppm RA80/ SE of Calculated Calculated Measured (ppm sucrose) of RB10/ RA80/ SE of SE of SE of sucrose) of GSG- RD6 RB10/ GSG- GSG- the the GSG-RA80 RA80 per concentration RD6 RA80concentration RA80 composition composition per ppm ppm 400 ppm 0 0.00 0 300 ppm 7.20% 100 1.50% 8.70% 7.50% 150.00 30.00 250 ppm 6.00% 150 2.00% 8.00% 8.30% 133.33 153.33 200 ppm 5.40% 200 2.50% 7.90% 8.10% 125.00 135.00 150 ppm 4.20% 250 2.90% 7.10% 7.80% 116.00 144.00 100 ppm 3.00% 300 3.30% 6.30% 7.00% 110.00 133.33
Calculated sweetness (ppm sugar) of GSG-RA80 per ppm=calculated SE of GSG-RA80/concentration of GSG-RA80
Measured sweetness (ppm sugar) of GSG-RA80 per ppm=(Measured SE-calculated SE of RA80/RB10/RD6)/concentration of GSG-RA80
The data were showed in FIG. 63.
It is found that at 400 ppm total solid content, with the increase of the amount of GSG-RA80, its measured contribution of sweetness was higher than calculated value. Significant synergistic effect was found when GSG-RA80>150 ppm, although the optimized range was 250-300 ppm.
Example 37
Evaluating the taste profile of compositions of GSG-RA50 and RA75/RB15, in order to find out the optimized ratio with the best synergistic taste effects.
The samples were tested in aqueous solution of citric acid at pH 3.8.
The control sample was RA75/RB5 at 400 ppm, corresponding to 7.0% SE.
The samples were as follows:
TABLE-US-00100 TABLE 85 RA75/RB15 GSG-RA50 total GSG 400 ppm -- 300 ppm 100 ppm 22.34% 250 ppm 150 ppm 33.51% 200 ppm 200 ppm 44.68% 150 ppm 250 ppm 55.84% 100 ppm 300 ppm 67.01%
Sweetness curve of GSG-RA50 and RA75/RB15 was shown in FIG. 64.
Taste profile of RA75/RB15/GSG-RA50 composition was shown in table. 86.
TABLE-US-00101 TABLE 86 RA75/ GSG- Sugar RB15 RA50 SE like Bitterness Aftertaste Lingering 400 ppm -- 7.0% 4.5 0 1.5 1.5 300 ppm 100 ppm 7.8% 4.5 0 0.5 1 250 ppm 150 ppm 8.0% 4.5 0 0.5 1 200 ppm 200 ppm 7.8% 4 0 1 1.5 150 ppm 250 ppm 7.0% 4.5 0 0.5 0.5 100 ppm 300 ppm 6.4% 4.5 0 0.5 0.5
As for the synergistic effect, it can be found in table 87.
TABLE-US-00102 TABLE 87 Measured Calculated sweetness sweetness (ppm Calculated Calculated Calculated Measured (ppm sucrose) of RA75/ SE of GSG- SE of SE of SE of sucrose) of GSG- RB15 RB75/ RA50 GSG- the the GSG-RA50 RA50 per concentration RB15 concentration RA50 composition composition per ppm ppm 400 ppm 0 0.00 0 300 ppm 5.80% 100 1% 6.80% 7.80% 100.00 200.00 250 ppm 5% 150 1.50% 6.50% 8.00% 100.00 200.00 200 ppm 4% 200 2% 6.20% 7.80% 100.00 180.00 150 ppm 3.40% 250 2.40% 5.80% 7.00% 96.00 144.00 100 ppm 3% 300 2.75% 5.25% 6.40% 91.67 130.00
Calculated sweetness (ppm sugar) of GSG-RA50 per ppm=calculated SE of GSG-RA50/concentration of GSG-RA50
Measured sweetness (ppm sugar) of GSG-RA50 per ppm=(Measured SE-calculated SE of RA75/RB15)/concentration of GSG-RA50
The data were showed in FIG. 65.
It is found that at 400 ppm total solid content, with the increase of the amount of GSG-RA50, its measured contribution of sweetness was higher than calculated value. Significant synergistic effect was found when GSG-RA50>100 ppm, although the optimized range was 100-200 ppm.
Example 38
Evaluating the taste profile of compositions of GSG-RA50 and RA/RD, in order to find out the optimized ratio with the best synergistic taste effects.
The samples were tested in aqueous solution of citric acid at pH 3.8.
The control sample was RA/RD at 400 ppm, corresponding to 6.5% SE.
The samples were as follows:
TABLE-US-00103 TABLE 88 RA/RD GSG-RA50 total GSG 400 ppm -- 300 ppm 100 ppm 22.34% 250 ppm 150 ppm 33.51% 200 ppm 200 ppm 44.68% 150 ppm 250 ppm 55.84% 100 ppm 300 ppm 67.01%
Sweetness curve of GSG-RA50 and RA/RD was shown in FIG. 66.
Taste profile of RA/RD/GSG-RA50 composition was shown in table 89.
TABLE-US-00104 TABLE 89 GSG- Sugar RA/RD RA50 SE like Bitterness Aftertaste Lingering 400 ppm -- 6.5% 3.5 1 1 1.5 300 ppm 100 ppm 7.8% 4 1 1 1 250 ppm 150 ppm 8.0% 4 0.5 1 1 200 ppm 200 ppm 7.5% 4.5 0 0.5 0.5 150 ppm 250 ppm 7.0% 4.5 0 0.5 0.5 100 ppm 300 ppm 7.0% 4.5 0 0.5 1
The taste of RA/RD was improved by GSG-RA50 by reducing the bitterness and lingering.
As for the synergistic effect, it can be found in table 90.
TABLE-US-00105 TABLE 90 Measured Calculated sweetness sweetness (ppm Calculated Calculated Measured (ppm sucrose) of Calculated GSG- SE of SE of SE of sucrose) of GSG- RA/RD SE of RA50 GSG- the the GSG-RA50 RA50 per concentration RA/RD concentration RA50 composition composition per ppm ppm 400 ppm 0 0.00 0 300 ppm 6.00% 100 1% 7.00% 7.80% 100.00 180.00 250 ppm 5.50% 150 1.50% 7.00% 8.00% 100.00 166.67 200 ppm 4.80% 200 2% 6.80% 7.50% 100.00 135.00 150 ppm 4.00% 250 2.40% 6.40% 7.00% 96.00 120.00 100 ppm 3.00% 300 2.75% 5.75% 7.00% 91.67 133.33
Calculated sweetness (ppm sugar) of GSG-RA50 per ppm=calculated SE of GSG-RA50/concentration of GSG-RA50
Measured sweetness (ppm sugar) of GSG-RA50 per ppm=(Measured SE-calculated SE of RA/RD)/concentration of GSG-RA50
The data were showed in FIG. 67.
It is found that at 400 ppm total solid content, with the increase of the amount of GSG-RA50, its measured contribution of sweetness was higher than calculated value. Significant synergistic effect was found when GSG-RA50>100 ppm, although the optimized range was 100-200 ppm.
Example 39
Evaluating the taste profile of compositions of GSG-RA50 and RA80/RB10 0/RD6, in order to find out the optimized ratio with the best synergistic taste effects.
The samples were tested in aqueous solution of citric acid at pH 3.8.
The control sample was RA80/RB10/RD6 at 400 ppm, corresponding to 8.3% SE.
The samples were as follows:
TABLE-US-00106 TABLE 91 RA80/RB10/RD6 GSG-RA50 total GSG 400 ppm -- 300 ppm 100 ppm 22.34% 250 ppm 150 ppm 33.51% 200 ppm 200 ppm 44.68% 150 ppm 250 ppm 55.84% 100 ppm 300 ppm 67.01%
Sweetness curve of GSG-RA50 and RA80/RB10/RD6 was shown as FIG. 68.
Taste profile of RA80/RB10/RD6/GSG-RA50 composition was shown in table 92.
TABLE-US-00107 RA80/ RB10/ GSG- Sugar RD6 RA50 SE like Bitterness Aftertaste Lingering 400 ppm -- 8.3% 4.5 0 0 0.5 300 ppm 100 ppm 7.8% 4.5 0 0.5 0.5 250 ppm 150 ppm 8.0% 4.5 0 0.5 0.5 200 ppm 200 ppm 7.8% 4.5 0 0.5 0.5 150 ppm 250 ppm 7.0% 4.5 0 0 0.5 100 ppm 300 ppm 6.5% 4.5 0 0 0.5
As for the synergistic effect, it can be found in table 93.
TABLE-US-00108 TABLE 93 Measured Calculated sweetness Calculated sweetness (ppm RA80/ SE of Calculated Calculated Measured (ppm sucrose) of RB10/ RA80/ GSG- SE of SE of SE of sucrose) of GSG- RD6 RB10/ RA80 GSG- the the GSG-RA80 RA80 per concentration RD6 concentration RA80 composition composition per ppm ppm 400 ppm 0 0.00 0 300 ppm 7.20% 100 1% 8.20% 7.80% 100.00 60.00 250 ppm 6.00% 150 1.50% 7.50% 8.00% 100.00 133.33 200 ppm 5.40% 200 2% 7.40% 7.80% 100.00 120.00 150 ppm 4.20% 250 2.40% 6.60% 7.00% 96.00 112.00 100 ppm 3.00% 300 2.75% 5.75% 6.50% 91.67 116.67
Calculated sweetness (ppm sugar) of GSG-RA50 per ppm=calculated of GSG-RA50/concentration of GSG-RA50
Measured sweetness (ppm sugar) of GSG-RA50 per ppm=(Measured SE-calculated SE of RA80/RB10/RD6)/concentration of GSG-RA50
The data were showed in FIG. 69.
It is found that at 400 ppm total solid content, with the increase of the amount of GSG-RA50, its measured contribution of sweetness was higher than calculated value. Significant synergistic effect was found when GSG-RA50>150 ppm, although the optimized range was 150-200 ppm.
Example 40
Evaluating the taste profile of compositions of GSG-RA40 and RA75/RB15, in order to find out the optimized ratio with the best synergistic taste effects.
The samples were tested in aqueous solution of citric acid at pH 3.8.
The control sample was RA75/RB15 at 400 ppm, corresponding to 7.0% SE.
The samples were as follows:
TABLE-US-00109 TABLE 94 RA75/RB15 GSG-RA40 400 ppm -- 300 ppm 100 ppm 250 ppm 150 ppm 200 ppm 200 ppm 150 ppm 250 ppm 100 ppm 300 ppm
Sweetness curve of GSG-RA40 and RA75/RB15 was shown in FIG. 70.
Taste profile of RA75/RB15/GSG-RA40 composition was shown in table 95.
TABLE-US-00110 TABLE 95 RA75/ GSG- Sugar RB15 RA40 SE like Bitterness Aftertaste Lingering 400 ppm -- 7.0% 4.5 0 1.5 1.5 300 ppm 100 ppm 7.4% 4 0 1 1 250 ppm 150 ppm 7.5% 4 0 1 1 200 ppm 200 ppm 7.0% 3.5 0 2 2 150 ppm 250 ppm 6.8% 3.5 0 1.5 1.5 100 ppm 300 ppm 6.5% 4 0 1 1
As for the synergistic effect, it can be found in table 96.
TABLE-US-00111 TABLE 96 Measured Calculated sweetness sweetness (ppm Calculated Calculated Calculated Measured (ppm sucrose) of RA75/ SE of GSG- SE of SE of SE of sucrose) of GSG- RB15 RA75/ RA40 GSG- the the GSG-RA40 RA40 per concentration RB15 concentration RA40 composition composition per ppm ppm 400 ppm 0 0.00 0 300 ppm 5.80% 100 1.50% 7.30% 7.40% 150.00 160.00 250 ppm 5% 150 2.00% 7.00% 7.50% 133.33 166.67 200 ppm 4% 200 2.40% 6.60% 7.00% 120.00 140.00 150 ppm 3.40% 250 2.70% 6.10% 6.80% 108.00 136.00 100 ppm 3% 300 2.80% 5.30% 6.50% 93.33 133.33
Calculated sweetness (ppm sugar) of GSG-RA40 per ppm=calculated SE of GSG-RA40/concentration of GSG-RA40
Measured sweetness (ppm sugar) of GSG-RA40 per ppm=(Measured SE-calculated SE of RA75/RB15)/concentration of GSG-RA40
The data were showed in FIG. 71.
It is found that at 400 ppm total solid content, with the increase of the amount of GSG-RA40, its measured contribution of sweetness was higher than calculated value. Significant synergistic effect was found when GSG-RA40>150 ppm, although the optimized range was 150-200 ppm.
Example 41
Evaluating the taste profile of compositions of GSG-RA40 and RA/RD, in order to find out the optimized ratio with the best synergistic taste effects.
The samples were tested in aqueous solution of citric acid at pH 3.8.
The control sample was RA/RD at 400 ppm, corresponding to 6.5% SE.
The samples were as follows:
TABLE-US-00112 TABLE 97 RA/RD GSG-RA40 400 ppm -- 300 ppm 100 ppm 250 ppm 150 ppm 200 ppm 200 ppm 150 ppm 250 ppm 100 ppm 300 ppm
Sweetness curve of GSG-RA40 and RA/RD was shown in FIG. 72.
Taste profile of RA/RD/GSG-RA40 composition was shown in table 98.
TABLE-US-00113 TABLE 98 GSG- Sugar RA/RD RA40 SE like Bitterness Aftertaste Lingering 400 ppm -- 6.5% 3.5 1 1 1.5 300 ppm 100 ppm 7.2% 3.5 0.5 1.5 2 250 ppm 150 ppm 7.8% 3.5 1 1 1.5 200 ppm 200 ppm 7.5% 3 0.5 2 2 150 ppm 250 ppm 7.2% 4 0.5 1 1.5 100 ppm 300 ppm 6.5% 3.5 0.5 2 1.5
As for the synergistic effect, it can be found in table 99.
TABLE-US-00114 TABLE 99 Measured Calculated sweetness sweetness (ppm Calculated Calculated Measured (ppm sucrose) of Calculated GSG- SE of SE of SE of sucrose) of GSG- RA/RD SE of RA40 GSG- the the GSG-RA40 RA40 per concentration RA/RD concentration RA40 composition composition per ppm ppm 400 ppm 0 0.00 0 300 ppm 6.00% 100 1.50% 7.50% 7.20% 150.00 120.00 250 ppm 5.50% 150 2.00% 7.50% 7.80% 133.33 153.33 200 ppm 4.80% 200 2.40% 7.20% 7.50% 120.00 135.00 150 ppm 4.00% 250 2.70% 6.70% 7.20% 108.00 128.00 100 ppm 3.00% 300 2.80% 5.80% 6.50% 93.33 116.67
Calculated sweetness (ppm sugar) of GSG-RA40 per ppm=calculated SE of GSG-RA40/concentration of GSG-RA40
Measured sweetness (ppm sugar) of GSG-RA40 per ppm=(Measured SE-calculated SE of RA/RD)/concentration of GSG-RA40
The data were showed in FIG. 73.
It is found that at 400 ppm total solid content, with the increase of the amount of GSG-RA40, its measured contribution of sweetness was higher than calculated value. Significant synergistic effect was found when GSG-RA40>150 ppm, although the optimized range was 150-250 ppm.
Example 42
Evaluating the taste profile of compositions of GSG-RA40 and RA80/RB10/RD6, in order to find out the optimized ratio with the best synergistic taste effects.
The samples were tested in aqueous solution of citric acid at pH 3.8.
The control sample was RA80/RB10/RD6 at 400 ppm, corresponding to 8.3% SE.
The samples were as follows:
TABLE-US-00115 TABLE 100 RA80/RB10/RD6 GSG-RA40 400 ppm -- 300 ppm 100 ppm 250 ppm 150 ppm 200 ppm 200 ppm 150 ppm 250 ppm 100 ppm 300 ppm
Sweetness curve of GSG-RA40 and RA80/RB10/RD6 was shown as FIG. 74.
Taste profile of RA80/RB10/RD6/GSG-RA40 composition was shown in table 101.
TABLE-US-00116 TABLE 101 RA80/ RB10/ GSG- Sugar RD6 RA40 SE like Bitterness Aftertaste Lingering 400 ppm -- 8.3% 4.5 0 0 0.5 300 ppm 100 ppm 8.1% 3.5 0 2 2 250 ppm 150 ppm 8.5% 4 0 1 1 200 ppm 200 ppm 8.2% 4 0 1 1 150 ppm 250 ppm 7.5% 4 0 1 1 100 ppm 300 ppm 7.0% 3 0 2.5 2
As for the synergistic effect, it can be found in table 102.
TABLE-US-00117 TABLE 102 Measured Calculated sweetness Calculated sweetness (ppm RA80/ SE of Calculated Calculated Measured (ppm sucrose) of RA10/ RA80/ GSG- SE of SE of SE of sucrose) of GSG- RD6 RA10/ RA40 GSG- the the GSG-RA40 RA40 per concentration RD6 concentration RA40 composition composition per ppm ppm 400 ppm 0 0.00 0 300 ppm 7.20% 100 1.50% 8.70% 8.10% 150.00 90.00 250 ppm 6.00% 150 2.00% 8.00% 8.50% 133.33 166.67 200 ppm 5.40% 200 2.40% 7.80% 8.20% 120.00 140.00 150 ppm 4.20% 250 2.70% 6.90% 7.50% 108.00 132.00 100 ppm 3.00% 300 2.80% 5.80% 7.00% 93.33 133.33
Calculated sweetness (ppm sugar) of GSG-RA40 per ppm=calculated SE of GSG-RA40/concentration of GSG-RA40
Measured sweetness (ppm sugar) of GSG-RA40 per ppm=(Measured SE-calculated SE of RA80/RB10/RD6)/concentration of GSG-RA40
The data were showed in FIG. 75.
It is found that at 400 ppm total solid content, with the increase of the amount of GSG-RA40, its measured contribution of sweetness was higher than calculated value. Significant synergistic effect was found when GSG-RA40>150 ppm, although the optimized range was 150-250 ppm.
Example 43
Evaluating the taste profile of compositions of GSG-RA20 and RA75/RB15, in order to find out the optimized ratio with the best synergistic taste effects.
The samples were tested in aqueous solution of citric acid at pH 3.8.
The control sample was RA75/RB15 at 400 ppm, corresponding to 7.0% SE.
The samples were as follows:
TABLE-US-00118 TABLE 103 RA75/RB15 GSG-RA20 total GSG 400 ppm -- 300 ppm 100 ppm 18.56% 250 ppm 150 ppm 27.84% 200 ppm 200 ppm 37.13% 150 ppm 250 ppm 46.41% 100 ppm 300 ppm 55.69%
Sweetness curve of GSG-RA20 and RA75/RB15 was shown as FIG. 76.
Taste profile of RA75/RB15/GSG-RA20 composition was shown in table 104.
TABLE-US-00119 TABLE 104 RA75/ GSG- Sugar RB15 RA20 SE like Bitterness Aftertaste Lingering 400 ppm -- 7.0% 4.5 0 1.5 1.5 300 ppm 100 ppm 7.2% 4 0 1 1 250 ppm 150 ppm 7.5% 4 0 1 1 200 ppm 200 ppm 6.8% 3.5 0 2 2 150 ppm 250 ppm 6.9% 3.5 0 1.5 1.5 100 ppm 300 ppm 6.5% 4 0 1 1
As for the synergistic effect, it can be found in table 105
TABLE-US-00120 TABLE 105 Measured Calculated sweetness sweetness (ppm Calculated Calculated Calculated Measured (ppm sucrose) of RA75/ SE of GSG- SE of SE of SE of sucrose) of GSG- RA15 RA75/ RA20 GSG- the the GSG-RA20 RA20 per concentration RB15 concentration RA20 composition composition per ppm ppm 400 ppm 0 0.00 0 300 ppm 5.80% 100 1.00% 6.80% 7.20% 100.00 140.00 250 ppm 5% 150 1.40% 6.40% 7.50% 93.33 166.67 200 ppm 4% 200 1.80% 6.00% 6.80% 90.00 130.00 150 ppm 3.40% 250 2.20% 5.60% 6.90% 88.00 140.00 100 ppm 3% 300 2.60% 5.10% 6.50% 86.67 133.33
Calculated sweetness (ppm sugar) of GSG-RA20 per ppm=calculated SE of GSG-RA20/concentration of GSG-RA20
Measured sweetness (ppm sugar) of GSG-RA20 per ppm=(Measured SE-calculated SE of RA75/RB15)/concentration of GSG-RA20
The data were showed in FIG. 77.
It is found that at 400 ppm total solid content, with the increase of the amount of GSG-RA20, its measured contribution of sweetness was higher than calculated value. Significant synergistic effect was found when GSG-RA20>100 ppm, although the optimized range was 100-200 ppm.
Example 44
Evaluating the taste profile of compositions of GSG-RA20 and RA/RD, in order to find out the optimized ratio with the best synergistic taste effects.
The samples were tested in aqueous solution of citric acid at pH 3.8.
The control sample was RA/RD at 400 ppm, corresponding to 6.5% SE.
The samples were as follows:
TABLE-US-00121 TABLE 106 RA/RD GSG-RA20 total GSG 400 ppm -- 300 ppm 100 ppm 18.56% 250 ppm 150 ppm 27.84% 200 ppm 200 ppm 37.13% 150 ppm 250 ppm 46.41% 100 ppm 300 ppm 55.69%
Sweetness curve of GSG-RA20 and RA/RD was shown as FIG. 78.
Taste profile of RA/RD/GSG-RA20 composition was shown in table 107.
TABLE-US-00122 TABLE 107 GSG- Sugar RA/RD RA20 SE like Bitterness Aftertaste Lingering 400 ppm -- 6.5% 3.5 1 1 1.5 300 ppm 100 ppm 7.0% 4 0 1 1 250 ppm 150 ppm 7.4% 4 0 1 1 200 ppm 200 ppm 7.1% 4.5 0 0.5 1 150 ppm 250 ppm 6.9% 4 0 1 1 100 ppm 300 ppm 6.2% 3.5 0 2 1.5
As for the synergistic effect, it can be found in FIG. 108.
TABLE-US-00123 Measured Calculated sweetness sweetness (ppm Calculated Calculated Measured (ppm sucrose) of Calculated GSG- SE of SE of SE of sucrose) of GSG- RA/RD SE of RA20 GSG- the the GSG-RA20 RA20 per concentration RA/RD concentration RA20 composition composition per ppm ppm 400 ppm 0 0.00 0 300 ppm 6.00% 100 1.00% 7.00% 7.00% 100.00 100.00 250 ppm 5.50% 150 1.40% 6.90% 7.40% 93.33 126.67 200 ppm 4.80% 200 1.80% 6.60% 7.10% 90.00 115.00 150 ppm 4.00% 250 2.20% 6.20% 6.90% 88.00 116.00 100 ppm 3.00% 300 2.60% 5.60% 6.20% 86.67 106.67
Calculated sweetness (ppm sugar) of GSG-RA20 per ppm=calculated SE of GSG-RA20/concentration of GSG-RA20
Measured sweetness (ppm sugar) of GSG-RA20 per ppm=(Measured SE-calculated SE of RA/RD)/concentration of GSG-RA20
The data were showed in FIG. 79.
It is found that at 400 ppm total solid content, with the increase of the amount of GSG-RA20, its measured contribution of sweetness was higher than calculated value. Significant synergistic effect was found when GSG-RA20>150 ppm, although the optimized range was 150-250 ppm.
Example 45
Evaluating the taste profile of compositions of GSG-RA20 and RA80/RB10/RD6, in order to find out the optimized ratio with the best synergistic taste effects.
The samples were tested in aqueous solution of citric acid at pH 3.8.
The control sample was RA80/RB10/RD6 at 400) ppm, corresponding to 8.3% SE.
The samples were as follows:
TABLE-US-00124 TABLE 109 RA80/RB10/RD6 GSG-RA20 total GSG 400 ppm -- 300 ppm 100 ppm 18.56% 250 ppm 150 ppm 27.84% 200 ppm 200 ppm 37.13% 150 ppm 250 ppm 46.41% 100 ppm 300 ppm 55.69%
Sweetness curve of GSG-RA20 and RA80/RB10/RD6 was shown in FIG. 80.
Taste profile of RA80/RB10/RD6/GSG-RA20 composition was shown in table 110.
TABLE-US-00125 TABLE 110 RA80/ RB10/ GSG- Sugar RD6 RA20 SE like Bitterness Aftertaste Lingering 400 ppm -- 8.3% 4.5 0 0 0.5 360 ppm 100 ppm 7.8% 4.5 0 0.5 0.5 250 ppm 150 ppm 7.5% 4 0 1 1 200 ppm 200 ppm 7.5% 3.5 0 1.5 1.5 150 ppm 250 ppm 7.0% 4 0 0.5 1 100 ppm 300 ppm 6.5% 3.5 0 1.5 1.5
As for the synergistic effect, it can be found in table 111.
TABLE-US-00126 TABLE 111 Measured Calculated sweetness Calculated sweetness (ppm RA80/ SE of Calculated Calculated Measured (ppm sucrose) of RB10/ RA80/ GSG- SE of SE of SE of sucrose) of GSG- RD6 RB10/ RA20 GSG- the the GSG-RA20 RA20 per concentration RD6 concentration RA20 composition composition per ppm ppm 400 ppm 0 0.00 0 300 ppm 7.20% 100 1.00% 8.20% 7.80% 100.00 60.00 250 ppm 6.00% 150 1.40% 7.40% 7.50% 93.33 100.00 200 ppm 5.40% 200 1.80% 7.20% 7.50% 90.00 105.00 150 ppm 4.20% 250 2.20% 6.40% 7.00% 88.00 112.00 100 ppm 3.00% 300 2.60% 5.60% 6.50% 86.67 116.67
Calculated sweetness (ppm sugar) of GSG-RA20 per ppm=calculated SE of GSG-RA20/concentration of GSG-RA20
Measured sweetness (ppm sugar) of GSG-RA20 per ppm=(Measured SE-calculated SE of RA80/RB10/RD6)/concentration of GSG-RA20
The data were showed in FIG. 81.
It is found that at 400 ppm total solid content, with the increase of the amount of GSG-RA20, its measured contribution of sweetness was higher than calculated value. Significant synergistic effect was found when GSG-RA20>150 ppm, although the optimized range was 200-300 ppm.
Example 46
Evaluating the taste profile of compositions of GSG-RA20, RA97 and sugar, in order to find out the optimized ratio with the best synergistic taste effects.
The samples were tested in aqueous solution of citric acid at pH 3.8.
The samples were as follows:
TABLE-US-00127 TABLE 112 RA97 GSG-RA20 sugar total GSG 250 ppm 100 ppm 3% 21.21% 200 ppm 150 ppm 3% 31.82% 150 ppm 200 ppm 3% 42.43%
Taste profile of RA97/GSG-RA20/sugar composition was shown in table 113.
TABLE-US-00128 TABLE 113 GSG- RA97 RA20 sugar SE Taste profile 250 ppm 100 ppm 3% 12% Taste is as same as sugar 200 ppm 150 ppm 3% 13% Taste is as same as sugar 150 ppm 200 ppm 3% 11.5% Taste is as same as sugar
As for the synergistic effect, it can be found in table 114.
TABLE-US-00129 TABLE 114 Calculated Measured sweetness sweetness (ppm (ppm sucrose) sucrose) of of Calculated GSG- GSG- SE of RA20 RA20 Calculated Calculated GSG- Calculated Measured plus plus SE GSG- SE of RA20 SE SE RA97 RA97 RA97 of RA20 GSG- plus sugar of the of the per per concentration RA97 concentration RA20 RA97 concentration composition compo- sition ppm ppm 250 ppm 6.00% 100 ppm 1.50% 7.5% 3% 10.5% 12% 214.29 257.14 200 ppm 5.00% 150 ppm 2.00% 7.0% 3% 10.0% 13% 200.00 285.71 150 ppm 4.00% 200 ppm 2.40% 6.4% 3% 9.4% 11.50% 182.86 242.86
Calculated sweetness (ppm sugar) of GSG-RA20 plus RA97 per ppm=calculated SE of GSG-RA20 plus RA97/concentration of GSG-RA20 plus RA97
Measured sweetness (ppm sugar) of GSG-RA20 plus RA97 per ppm=(Measured SE of GSG-RA20 plus RA97-sugar concentration)/concentration of GSG-RA20 plus RA97
It is found that at 350 ppm total GSG-RA20 plus RA97 content, when blend with 3% sugar, its measured contribution of sweetness was higher than calculated value. The composition of GSG-RA20 plus RA97 has significant synergic effect to the sweetness of sugar.
Example 47
Evaluating the taste profile of compositions of GSG-RA20, RA75/RB15 and sugar, in order to find out the optimized ratio with the best synergistic taste effects.
The samples were tested in aqueous solution of citric acid at pH 3.8.
The samples were as follows:
TABLE-US-00130 TABLE 115 RA75/RB15 GSG-RA20 sugar total GSG 300 ppm 100 ppm 3% 18.56% 200 ppm 200 ppm 3% 37.13% 100 ppm 300 ppm 3% 55.69%
Taste profile of RA75/RB15/GSG-RA20/sugar composition was shown in table 116.
TABLE-US-00131 TABLE 116 GSG- RA75/RB15 RA20 sugar SE Taste profile 300 ppm 100 ppm 3% 12.5% Taste is as same as sugar 200 ppm 200 ppm 3% 12.5% Taste is as same as sugar 100 ppm 300 ppm 3% 12% Taste is as same as sugar
As for the synergistic effect, it can be found in table 117.
TABLE-US-00132 TABLE 117 Calculated Measured sweetness sweetness (ppm (ppm sucrose) sucrose) of of Calculated GSG- GSG- SE RA20 RA20 Calculated of GSG- plus plus SE Calculated RA20 Calculated Measured RA75/ RA75/ of GSG- SE of plus SE of SE of RB15 RB15 RA75/RB15 RA75/ RA20 GSG- RA75/ sugar the the per per concentration RB15 concentration RA20 RB15 concentration composition compo- sition ppm ppm 300 ppm 5.8% 100 ppm 1.50% 7.3% 3% 10.3% 12.50% 208.57 271.43 200 ppm 4.2% 200 ppm 2.40% 6.6% 3% 9.6% 12.50% 188.57 271.43 100 ppm 3.0% 300 ppm 2.80% 5.8% 3% 8.8% 12% 165.71 257.14
Calculated sweetness (ppm sugar) of GSG-RA20 plus RA75/RB15 per ppm=calculated SE of GSG-RA20 plus RA75/RB15/concentration of GSG-RA20 plus RA75/RB15
Measured sweetness (ppm sugar) of GSG-RA20 plus RA75/RB15 per ppm=(Measured SE of GSG-RA20 plus RA75/RB15-sugar concentration)/concentration of GSG-RA20 plus RA75/RB15
It is found that at 400 ppm total GSG-RA20 plus RA75/RB15 content, when blend with 3% sugar, its measured contribution of sweetness was higher than calculated value. The composition of GSG-RA20 plus RA75/RB15 has significant synergic effect to the sweetness of sugar.
Example 48
Evaluating the taste profile of compositions of GSG-RA20, RA80/RB10/RD6 and sugar, in order to find out the optimized ratio with the best synergistic taste effects.
The samples were tested in aqueous solution of citric acid at pH 3.8.
The samples were as follows:
TABLE-US-00133 TABLE 118 RA80/RB10/RD6 GSG-RA20 sugar total GSG 300 ppm 100 ppm 3% 18.56% 200 ppm 200 ppm 3% 37.13% 100 ppm 300 ppm 3% 55.69%
Taste profile of RA80/RB10/RD6/GSG-RA20/sugar composition was shown in table 119.
TABLE-US-00134 TABLE 119 RA80/RB10/ GSG- RD6 RA20 sugar SE Taste profile 300 ppm 100 ppm 3% 13% Taste is as same as sugar 200 ppm 200 ppm 3% 12.5% Taste is as same as sugar 100 ppm 300 ppm 3% 12% Taste is as same as sugar
As for the synergistic effect, it can be found in table 120.
TABLE-US-00135 TABLE 120 Measured sweetness Calculated (ppm sweetness sucrose) Calculated (ppm of GSG- SE of sucrose) of RA20 GSG- GSG-RA20 plus Calculated Calculated RA20 Calculated Measured plus RA80/RB10/ RA80/RB10/ SE of GSG- SE of plus SE of SE of RA80/RB10/ RD6 RD6 RA80/RB10/ RA20 GSG- RA80/RB10/ sugar the the RD6 per per concentration RD6 concentration RA20 RD6 concentration composition composi- tion ppm ppm 300 ppm 7.2% 100 ppm 1.50% 8.7% 3% 11.7% 13% 248.57 285.71 200 ppm 5.4% 200 ppm 2.40% 7.8% 3% 10.8% 12.50% 222.86 271.43 100 ppm 3.0% 300 ppm 2.80% 5.8% 3% 8.8% 12% 165.71 257.14
Calculated sweetness (ppm sugar) of GSG-RA20 plus RA80/RB10/RD6 per ppm=calculated SE of GSG-RA20 plus RA80/RB10/RD6/concentration of GSG-RA20 plus RA80/RB10/RD6
Measured sweetness (ppm sugar) of GSG-RA20 plus RA80/RB10/RD6 per ppm=(Measured SE of GSG-RA20 plus RA80/RB10/RD6-sugar concentration)/concentration of GSG-RA20 plus RA RA80/RB10/RD6
It is found that at 400 ppm total GSG-RA20 plus RA80/RB10/RD6 content, when blend with 3% sugar, its measured contribution of sweetness was higher than calculated value. The composition of GSG-RA20 plus RA80/RB10/RD6 has significant synergic effect to the sweetness of sugar.
Example 49
Evaluate the taste profile of compositions of GSG-RA50, RA97 and sugar, in order to find out the optimized ratio with the best synergistic taste effects.
The samples were tested in aqueous solution of citric acid at pH 3.8.
The samples were as follows:
TABLE-US-00136 TABLE 121 RA97 GSG-RA50 sugar total GSG 250 ppm 100 ppm 3% 25.53% 200 ppm 150 ppm 3% 38.29% 150 ppm 200 ppm 3% 51.06%
Taste profile of RA97/GSG-RA50/sugar composition was shown in table 122.
TABLE-US-00137 TABLE 122 GSG- RA97 RA50 sugar SE Taste profile 250 ppm 100 ppm 3% 13% Taste is as same as sugar 200 ppm 150 ppm 3% 13% Taste is as same as sugar 150 ppm 200 ppm 3% 12% Taste is as same as sugar
As for the synergistic effect, it can be found in table 123.
TABLE-US-00138 Calculated Measured sweetness sweetness (ppm (ppm sucrose) sucrose) of of Calculated GSG- GSG- SE of RA50 RA50 Calculated GSG- Calculated Measured plus plus Calculated GSG- SE of RA50 SE of SE of RA97 RA97 RA97 SE of RA50 GSG- plus sugar the the per per concentration RA97 concentration RA50 RA97 concentration composition compo- sition ppm ppm 250 ppm 6.00% 100 ppm 1.00% 7.0% 3% 10.0% 13% 200.00 285.71 200 ppm 5.00% 150 ppm 1.50% 6.5% 3% 9.5% 13% 185.71 285.71 150 ppm 4.00% 200 ppm 2.00% 6.0% 3% 9.0% 12% 171.43 257.14
Calculated sweetness (ppm sugar) of GSG-RA50 plus RA97 per ppm=calculated SE of GSG-RA50 plus RA97/concentration of GSG-RA50 plus RA97
Measured sweetness (ppm sugar) of GSG-RA50 plus RA97 per ppm=(Measured SE of GSG-RA50 plus RA97-sugar concentration)/concentration of GSG-RA50 plus RA97
It is found that at 350 ppm total GSG-RA50 plus RA97 content, when blend with 3% sugar, its measured contribution of sweetness was higher than calculated value. The composition of GSG-RA50 plus RA97 has significant synergic effect to the sweetness of sugar.
Example 50
Evaluating the taste profile of compositions of GSG-RA50, RA75/RB15 and sugar, in order to find out the optimized ratio with the best synergistic taste effects.
The samples were tested in aqueous solution of citric acid at pH 3.8.
The samples were as follows:
TABLE-US-00139 TABLE 124 RA75/RB15 GSG-RA50 sugar total GSG 300 ppm 100 ppm 3% 25.53% 200 ppm 200 ppm 3% 38.29% 100 ppm 300 ppm 3% 51.06%
Taste profile of RA75/RB15/GSG-RA50/sugar composition was shown in table 125.
TABLE-US-00140 TABLE 125 GSG- RA75/RB15 RA50 sugar SE Taste profile 300 ppm 100 ppm 3% 13.5% Taste is as same as sugar 200 ppm 200 ppm 3% 13% Taste is as same as sugar 100 ppm 300 ppm 3% 12% Taste is as same as sugar
As for the synergistic effect, it can be found in table 126.
TABLE-US-00141 TABLE 126 Calculated Measured sweetness sweetness (ppm (ppm sucrose) sucrose) of of Calculated GSG- GSG- SE RA50 RA50 Calculated of GSG- plus plus SE Calculated RA50 Calculated Measured RA75/ RA75/ of GSG- SE of plus SE of SE of RB15 RB15 RA75/RB15 RA75/ RA50 GSG- RA75/ sugar the the per per concentration RB15 concentration RA50 RB15 concentration composition compo- sition ppm ppm 300 ppm 5.8% 100 ppm 1.00% 6.8% 3% 9.8% 13.5% 194.29 300.00 200 ppm 4.2% 200 ppm 2.00% 6.2% 3% 9.2% 13% 177.14 285.71 100 ppm 3.0% 300 ppm 2.75% 5.8% 3% 8.8% 12% 164.29 257.14
Calculated sweetness (ppm sugar) of GSG-RA50 plus RA75/RB15 per ppm=calculated SE of GSG-RA50 plus RA75/RB15/concentration of GSG-RA50 plus RA75/RB15
Measured sweetness (ppm sugar) of GSG-RA50 plus RA75/RB5 per ppm=(Measured SE of GSG-RA50 plus RA75/RB15-sugar concentration)/concentration of GSG-RA50 plus RA75/RB15
It is found that at 400 ppm total GSG-RA50 plus RA75/RB15 content, when blend with 3% sugar, its measured contribution of sweetness was higher than calculated value. The composition of GSG-RA50 plus RA75/RB15 has significant synergic effect to the sweetness of sugar.
Example 51
Evaluating the taste profile of compositions of GSG-RA50, RA80/RB10/RD6 and sugar, in order to find out the optimized ratio with the best synergistic taste effects.
The samples were tested in aqueous solution of citric acid at pH 3.8.
The samples were as follows:
TABLE-US-00142 TABLE 127 RA80/RB10/RD6 GSG-RA50 sugar total GSG 300 ppm 100 ppm 3% 25.53% 200 ppm 200 ppm 3% 38.29% 100 ppm 300 ppm 3% 51.06%
Taste profile of RA80/RB10/RD6/GSG-RA50/sugar composition was shown in table 128.
TABLE-US-00143 TABLE 128 RA80/RB10/ GSG- RD6 RA50 sugar SE Taste profile 300 ppm 100 ppm 3% 12% Taste is as
C00001
C00002
C00003
C00004
C00005
C00006
C00007
C00008
C00009
C00010
C00011
C00012
C00013

D00001

D00002

D00003

D00004

D00005

D00006
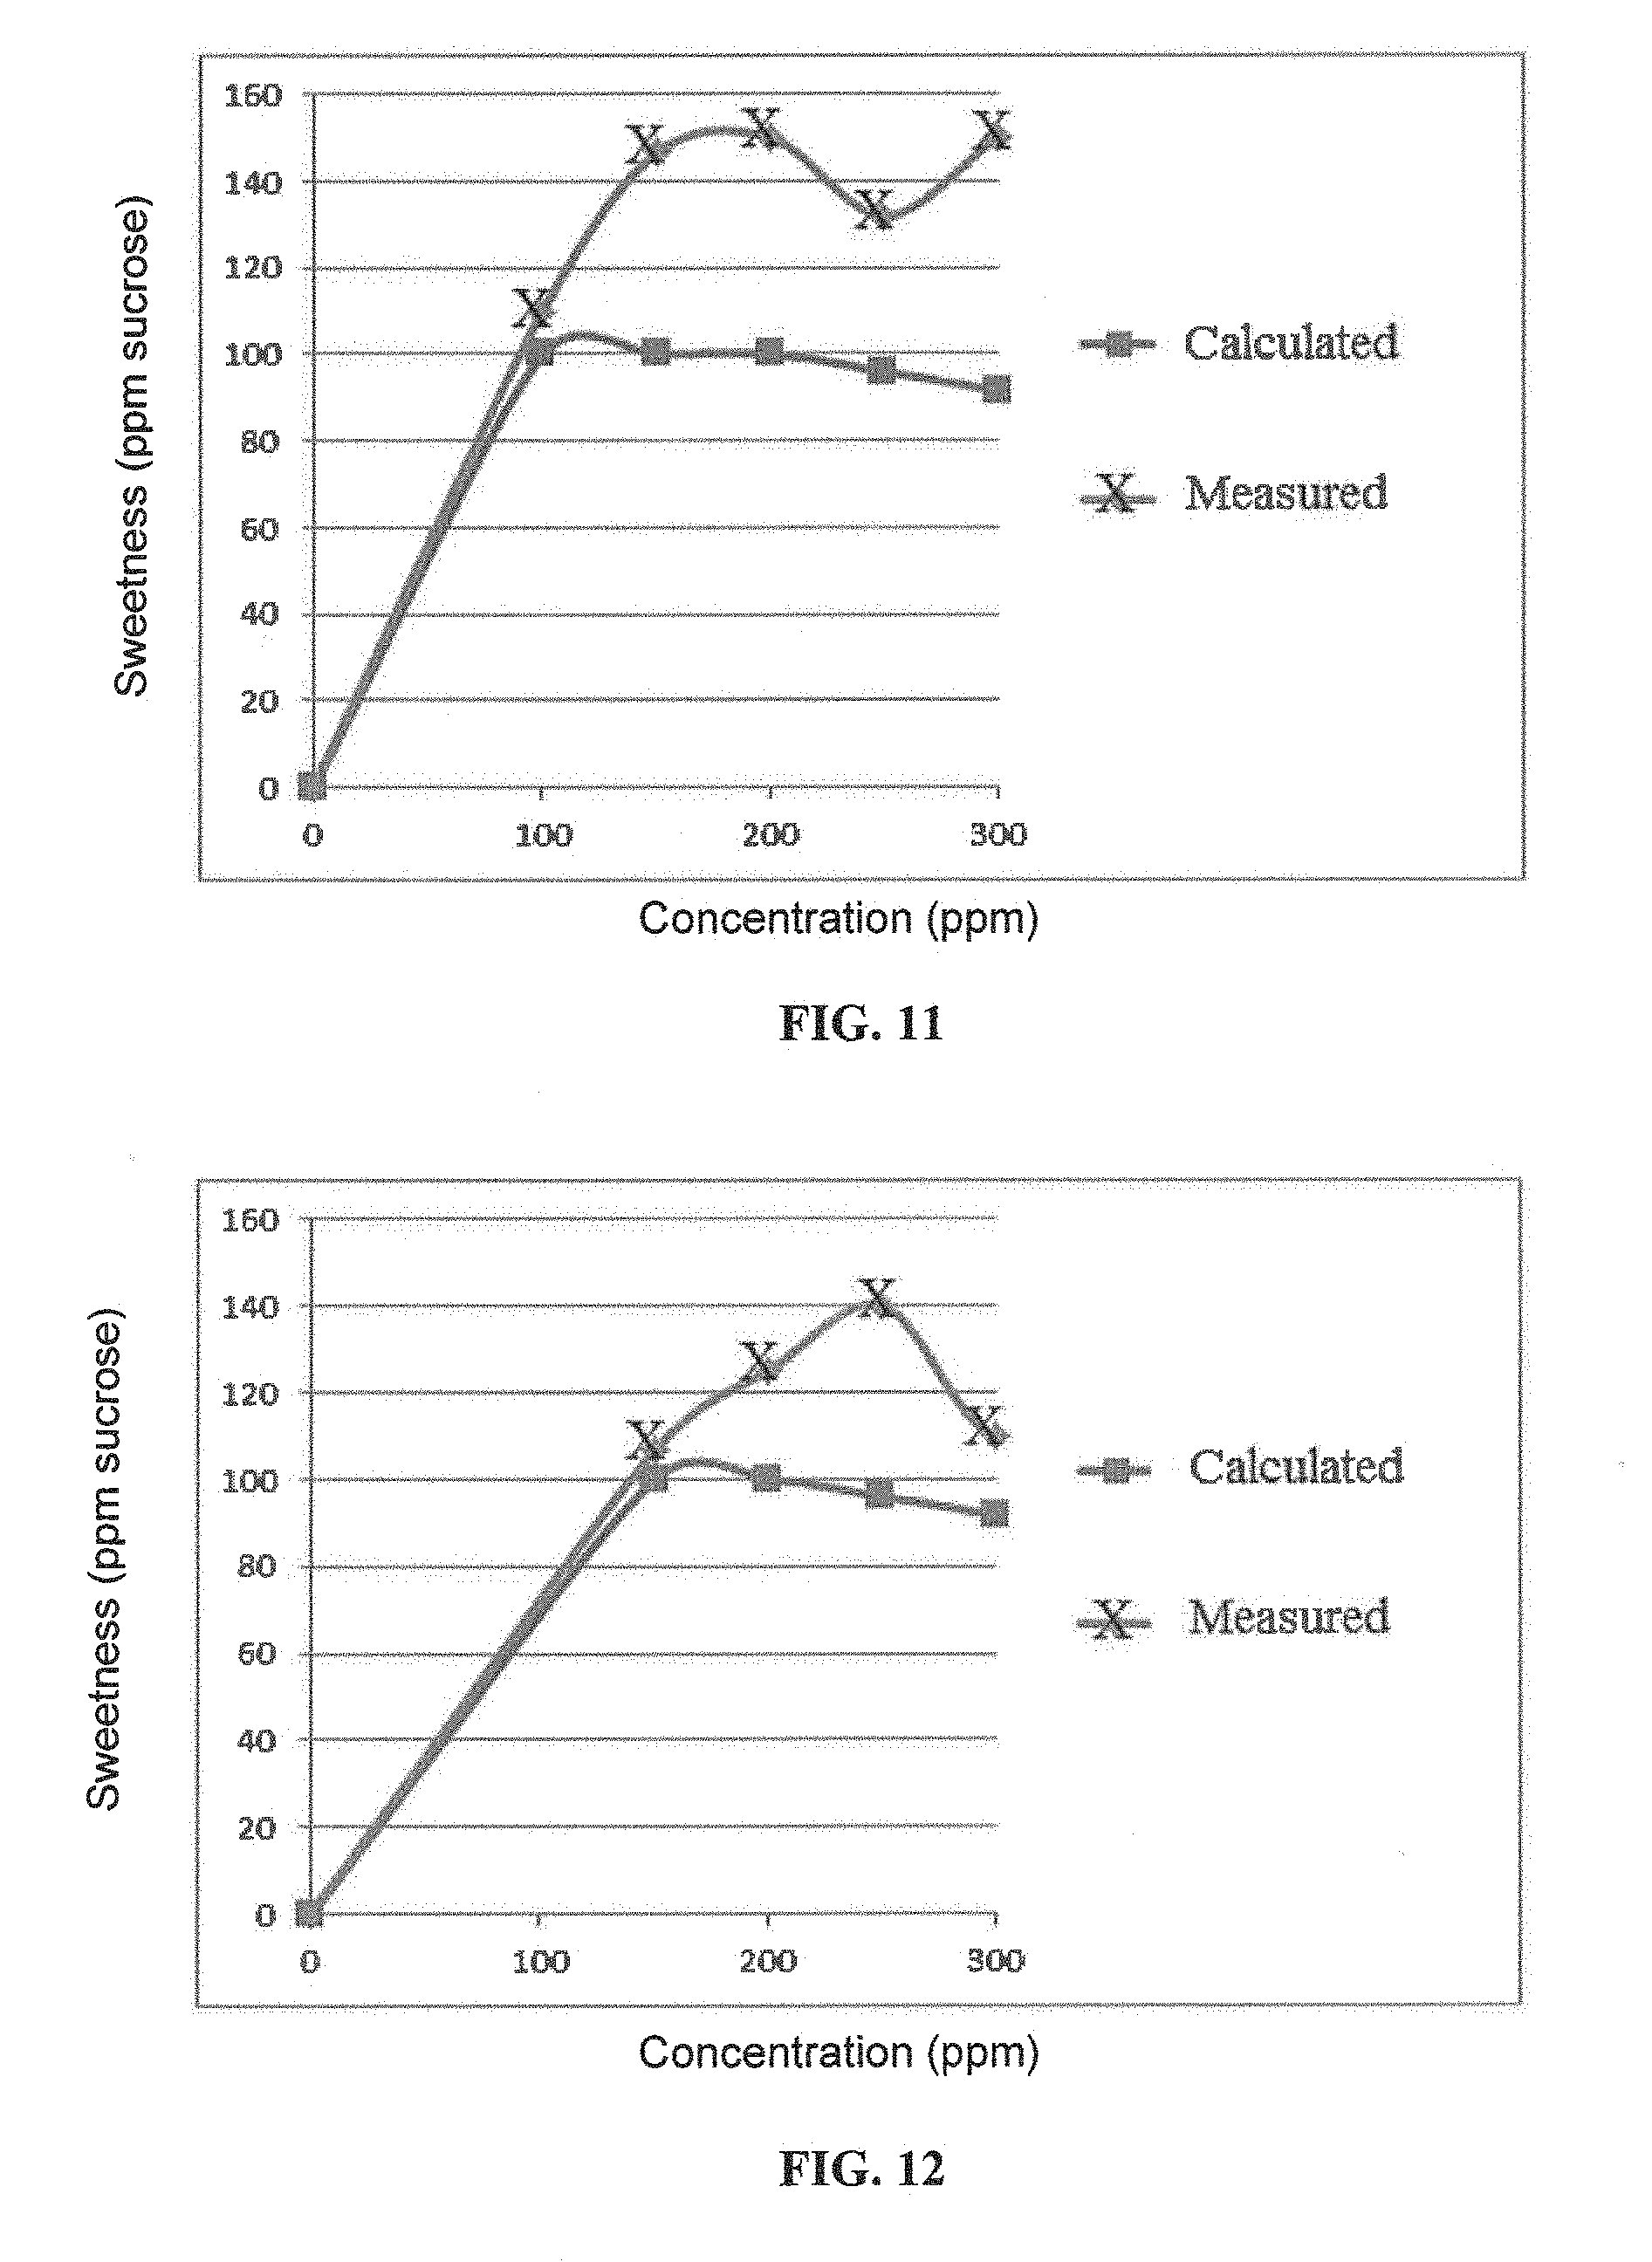
D00007

D00008

D00009

D00010

D00011

D00012

D00013

D00014

D00015

D00016
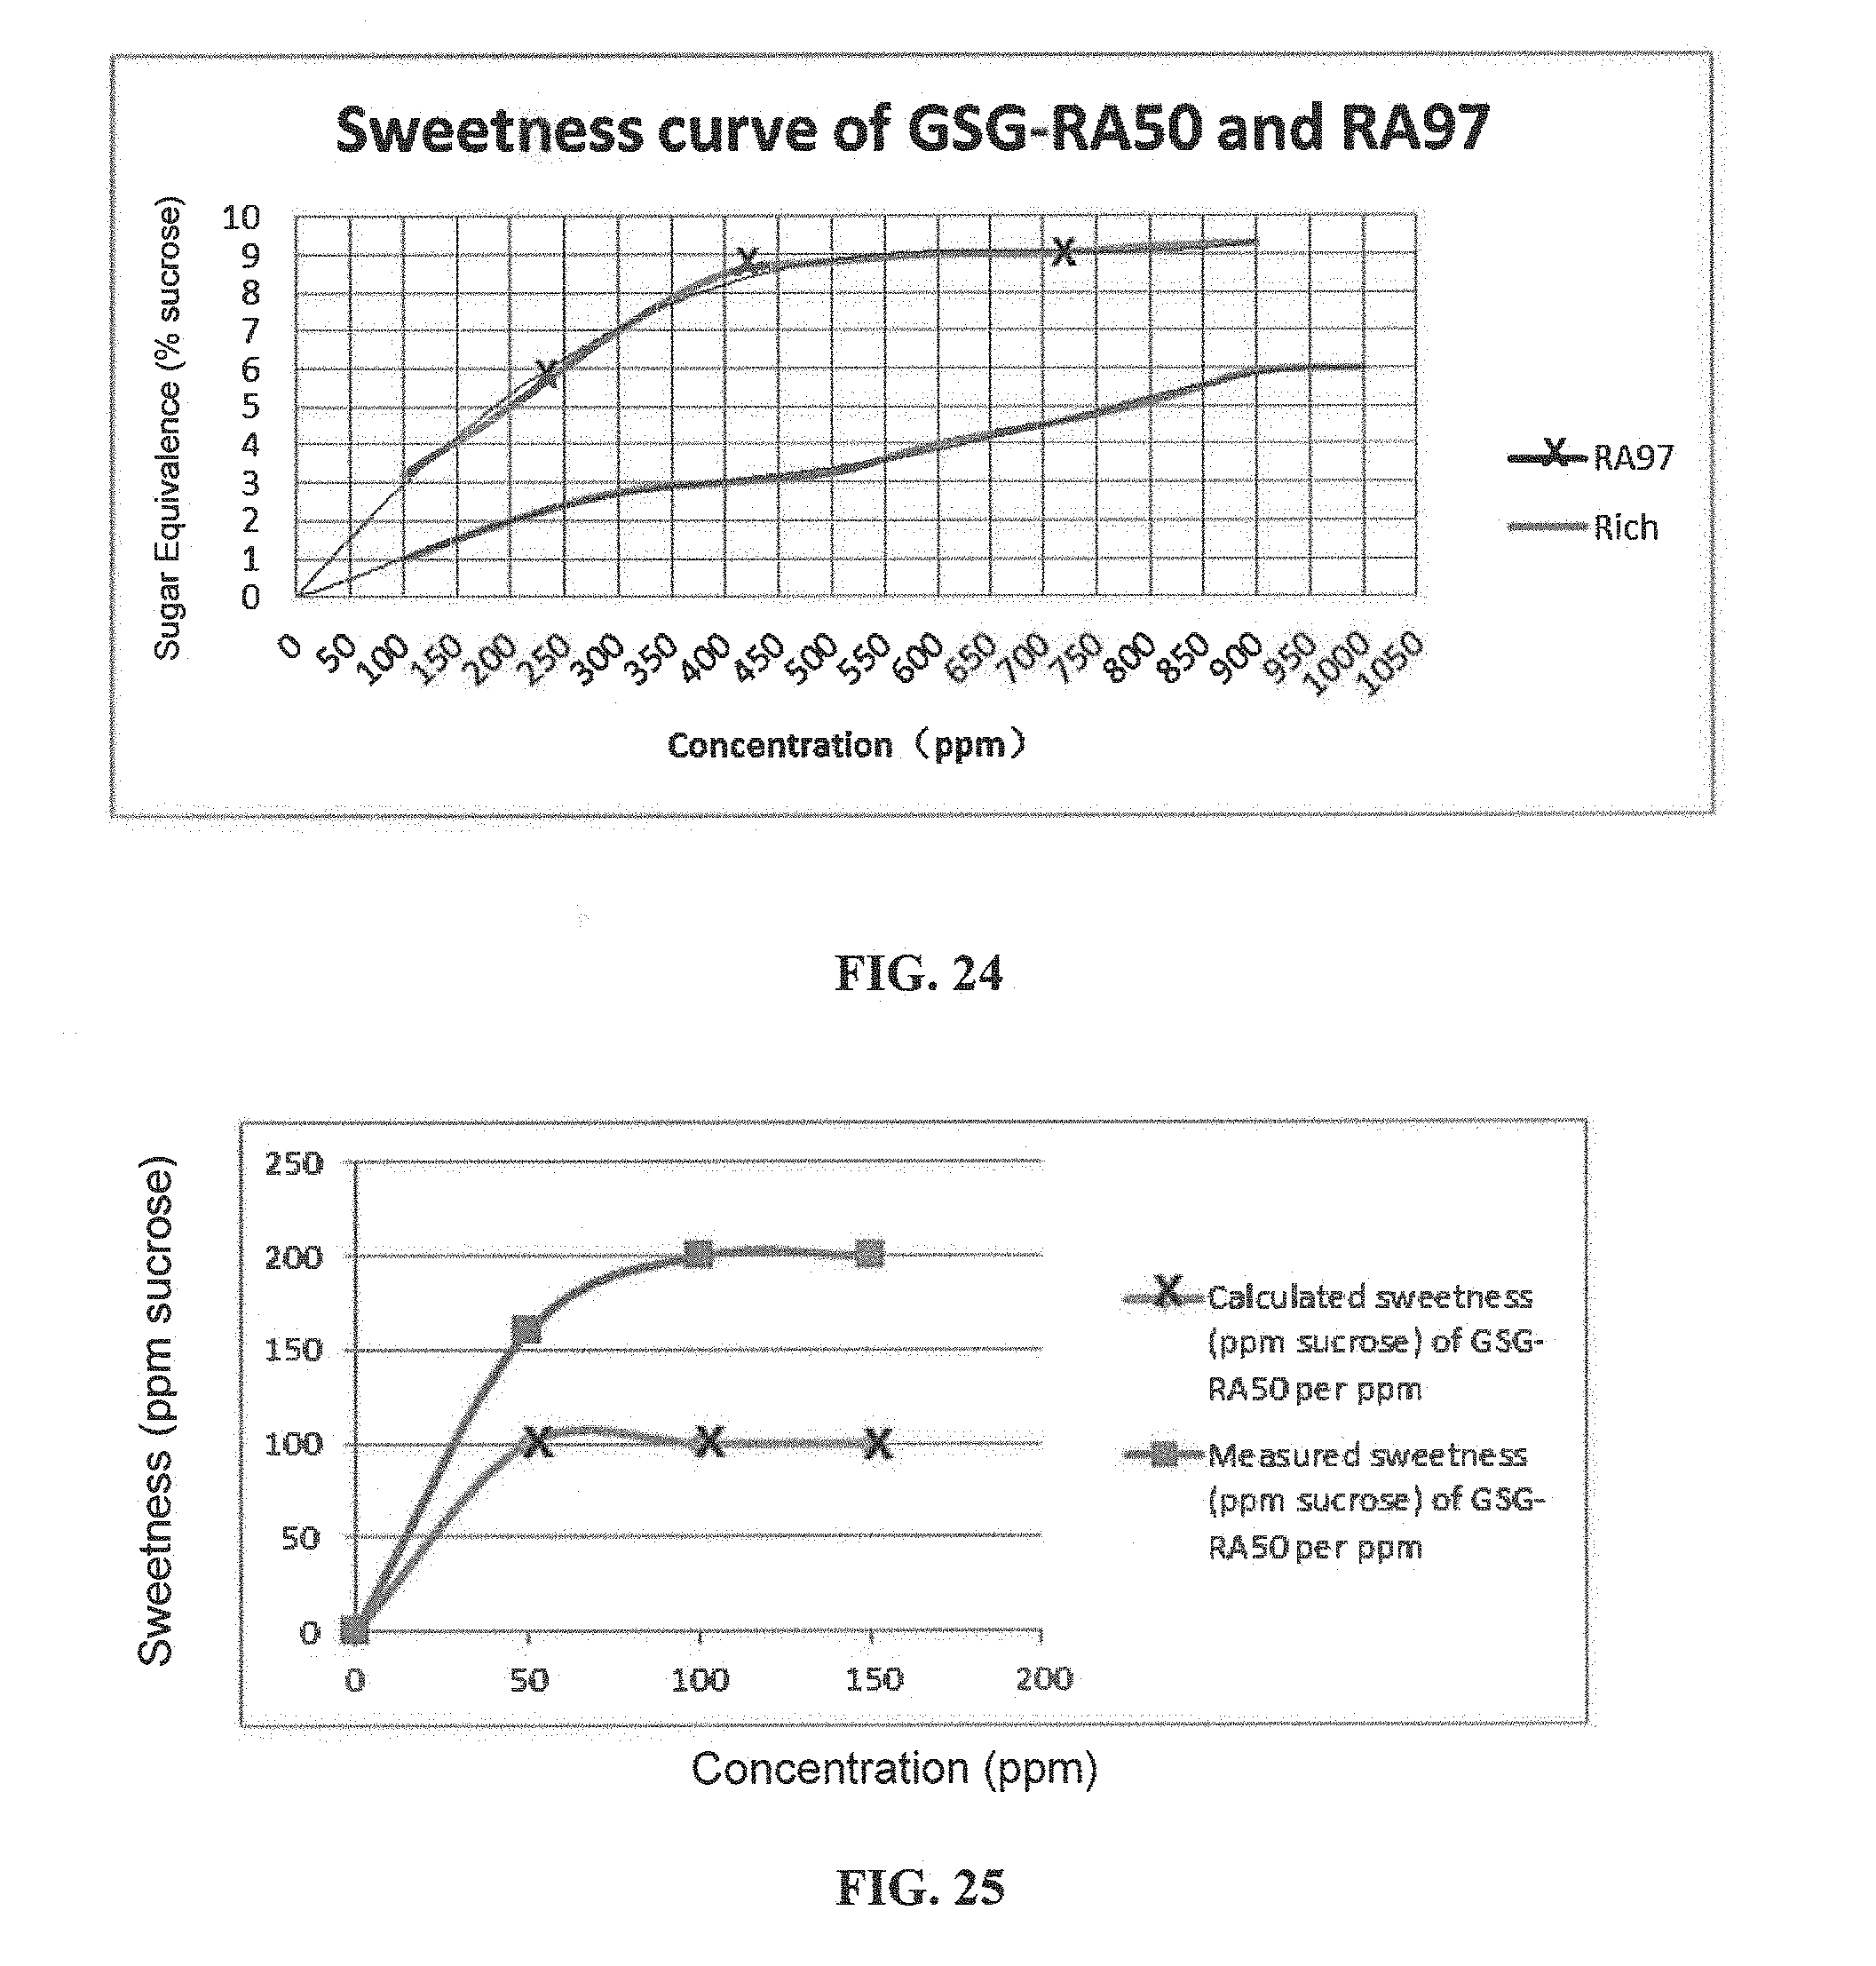
D00017

D00018

D00019

D00020

D00021

D00022

D00023

D00024

D00025
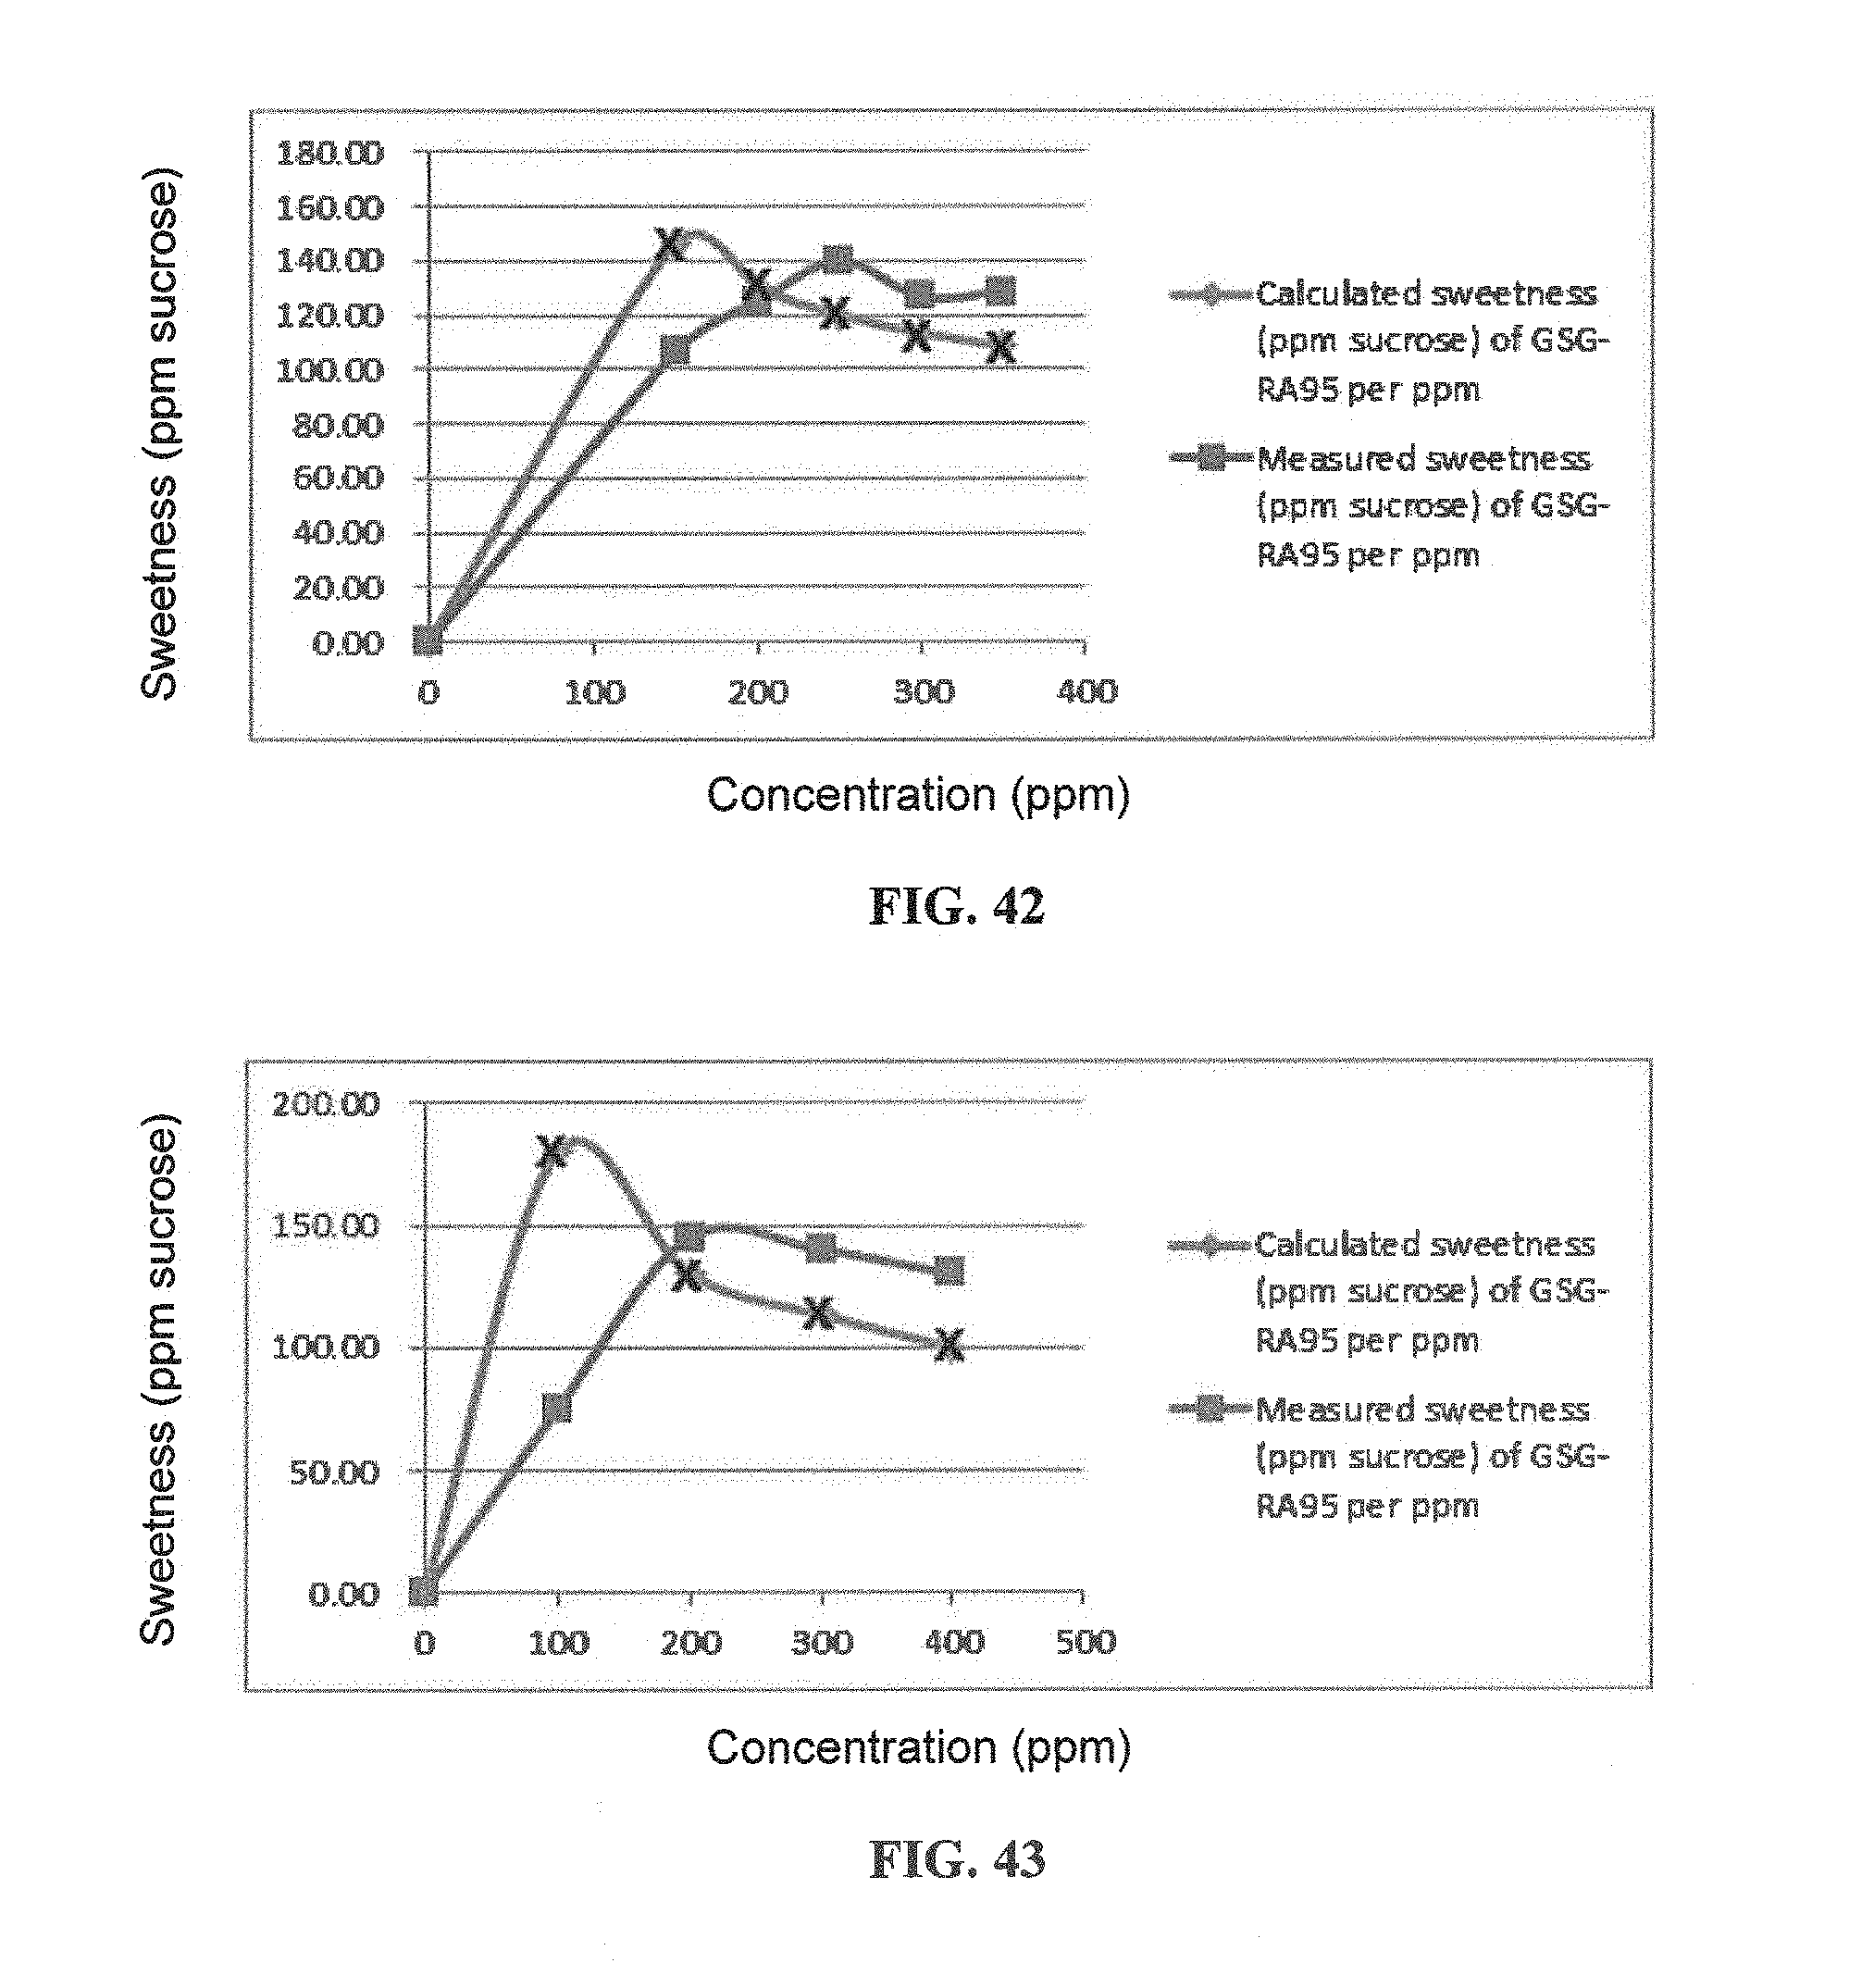
D00026

D00027

D00028

D00029

D00030

D00031
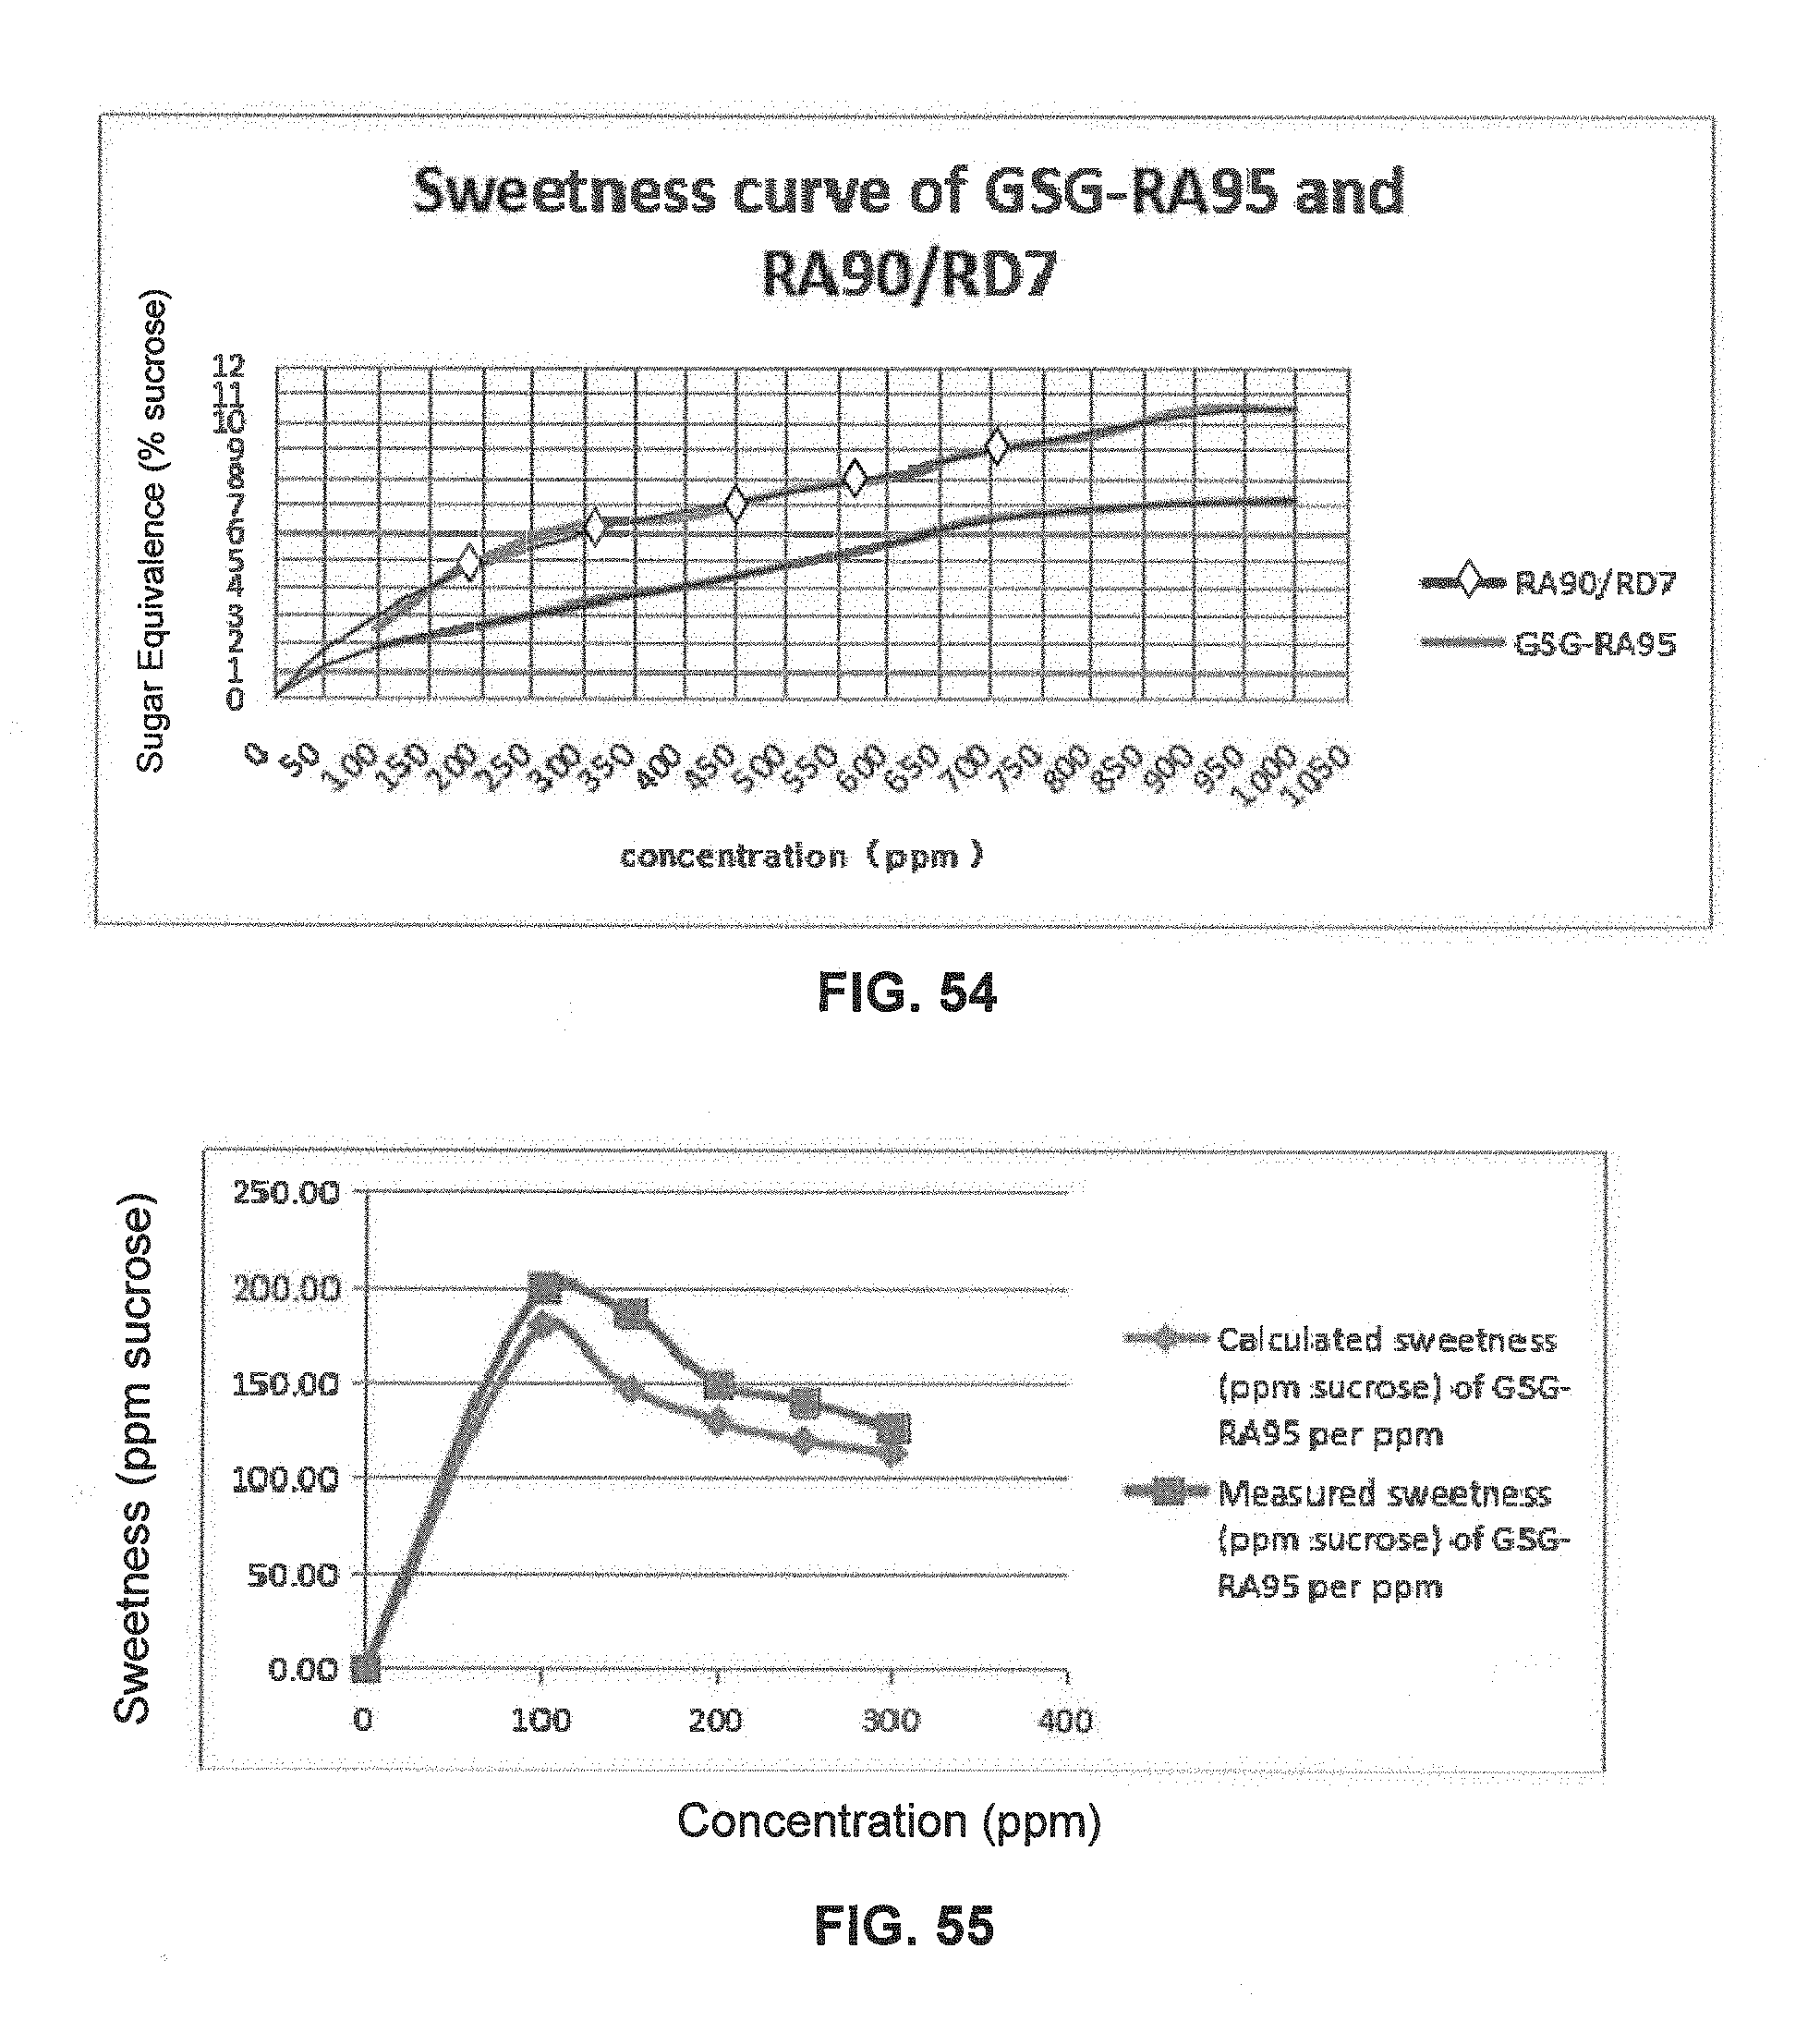
D00032

D00033

D00034

D00035
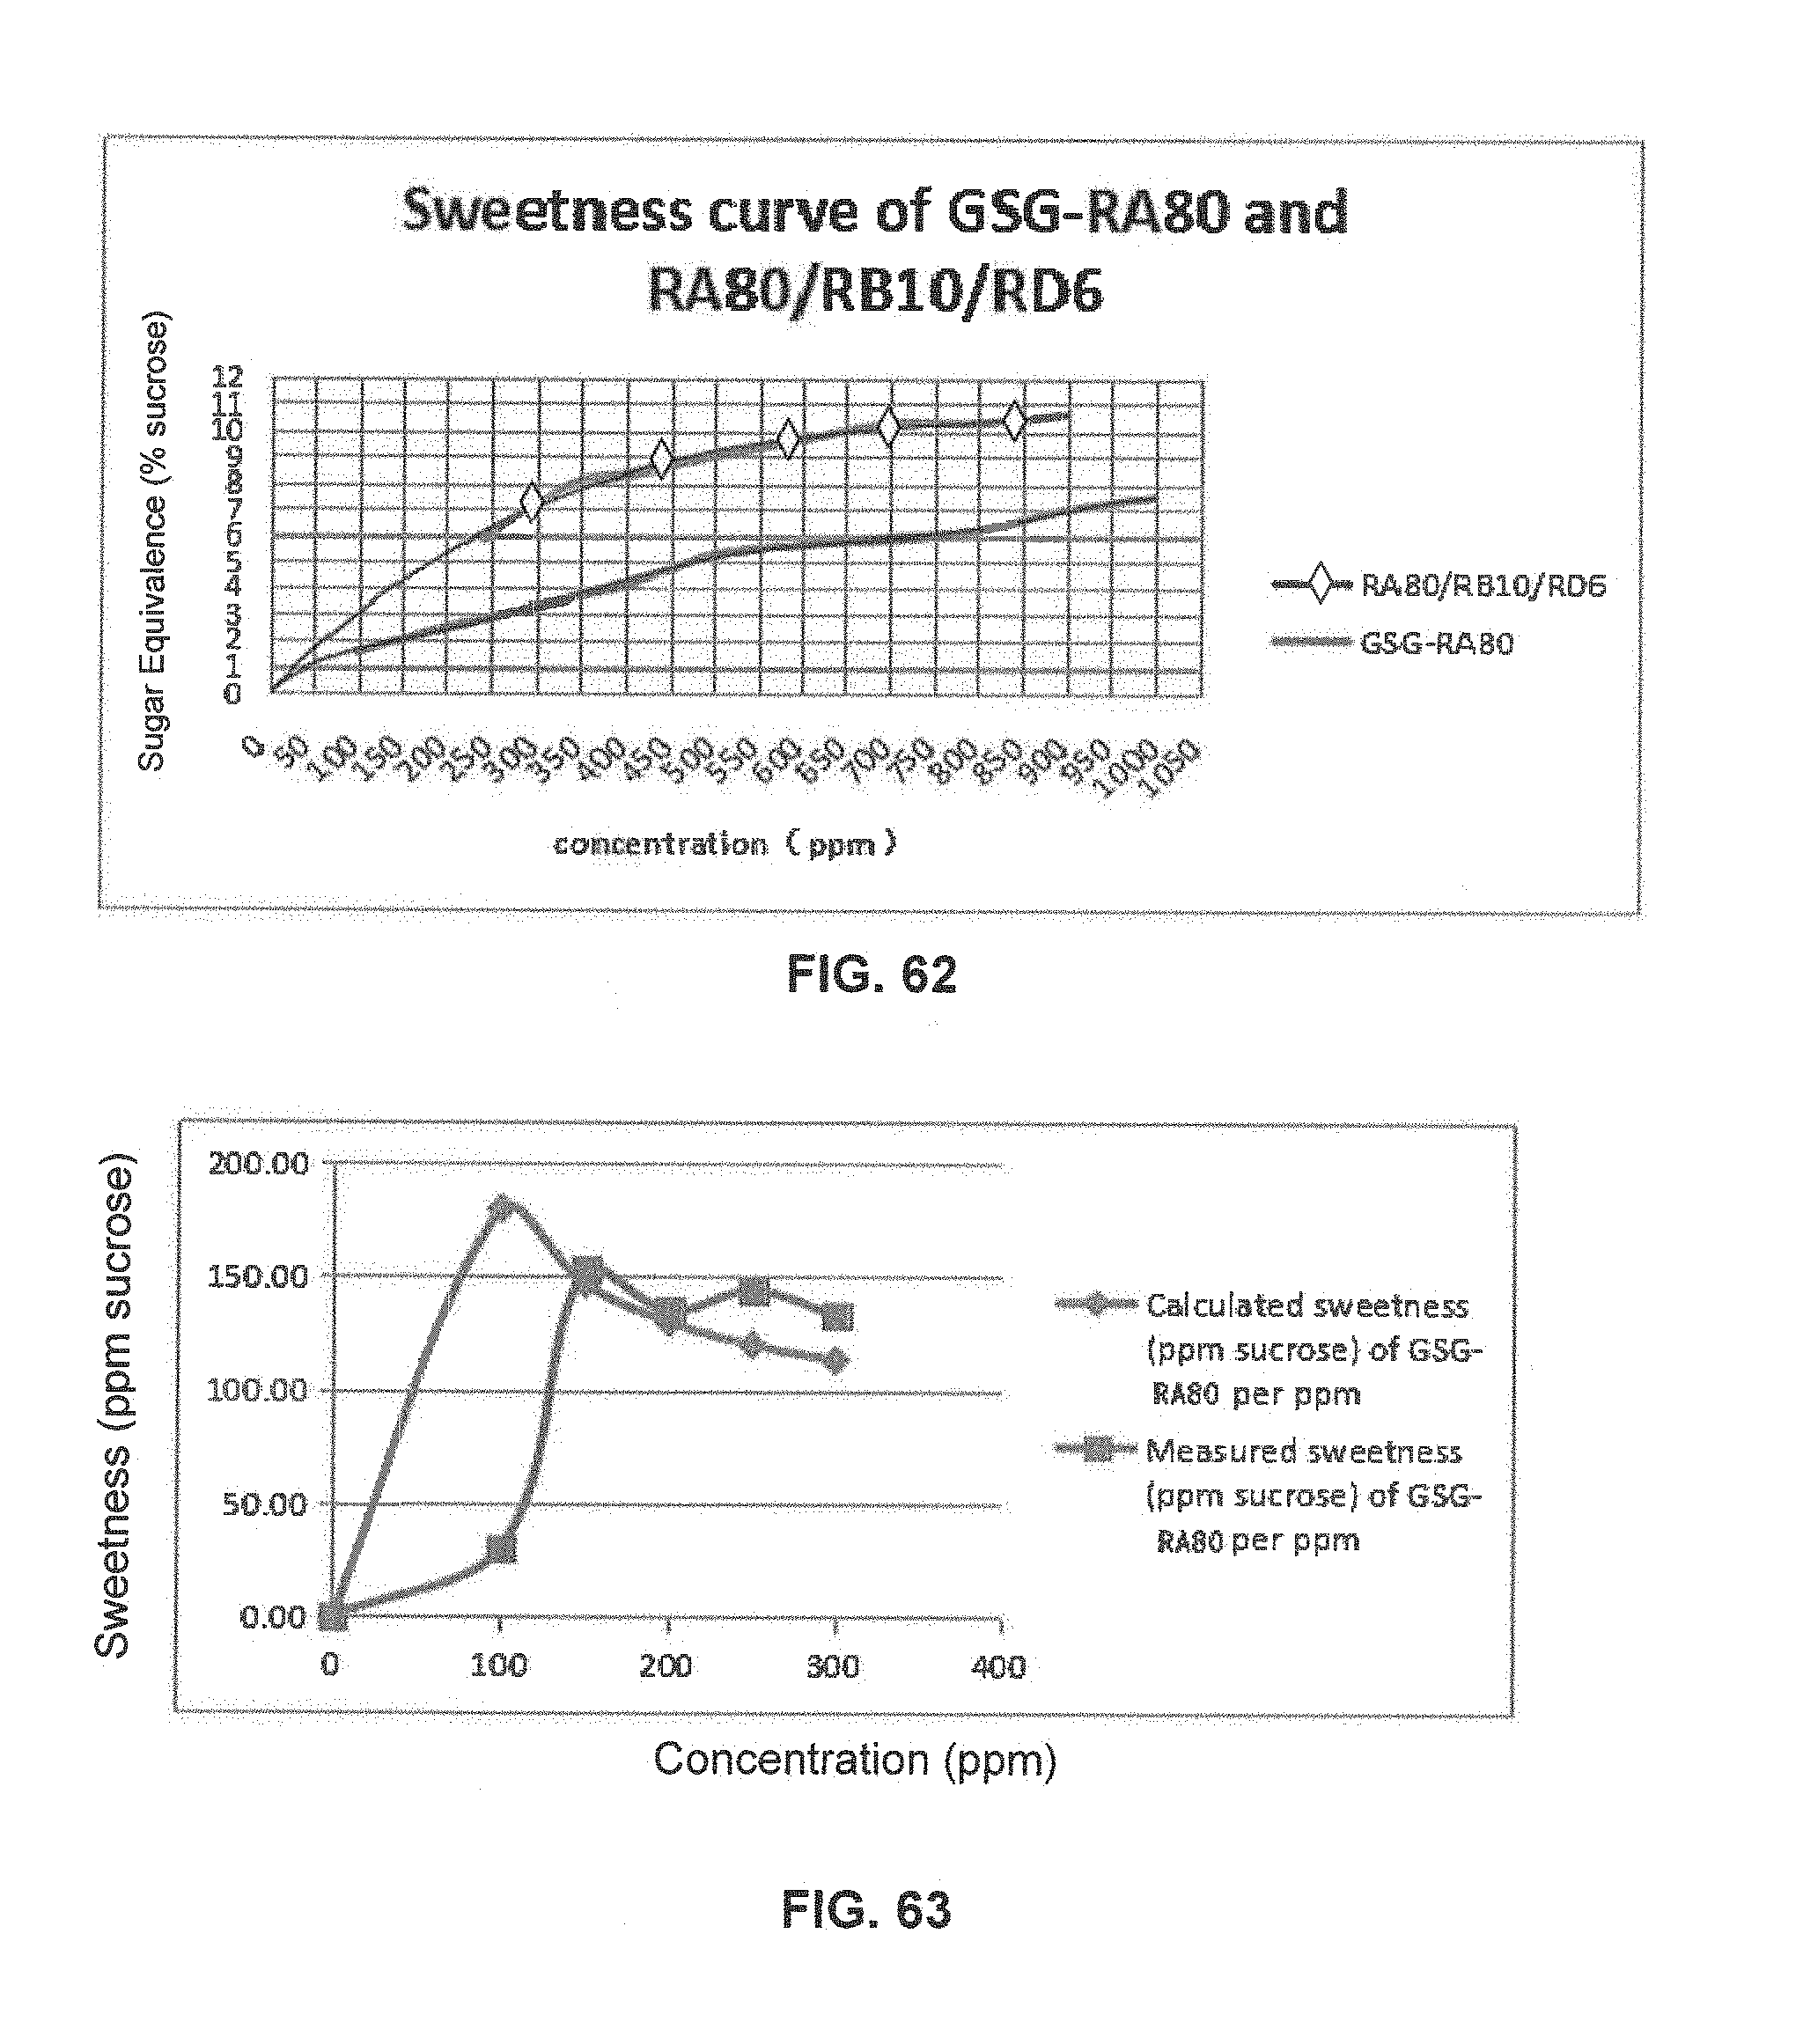
D00036

D00037

D00038

D00039

D00040
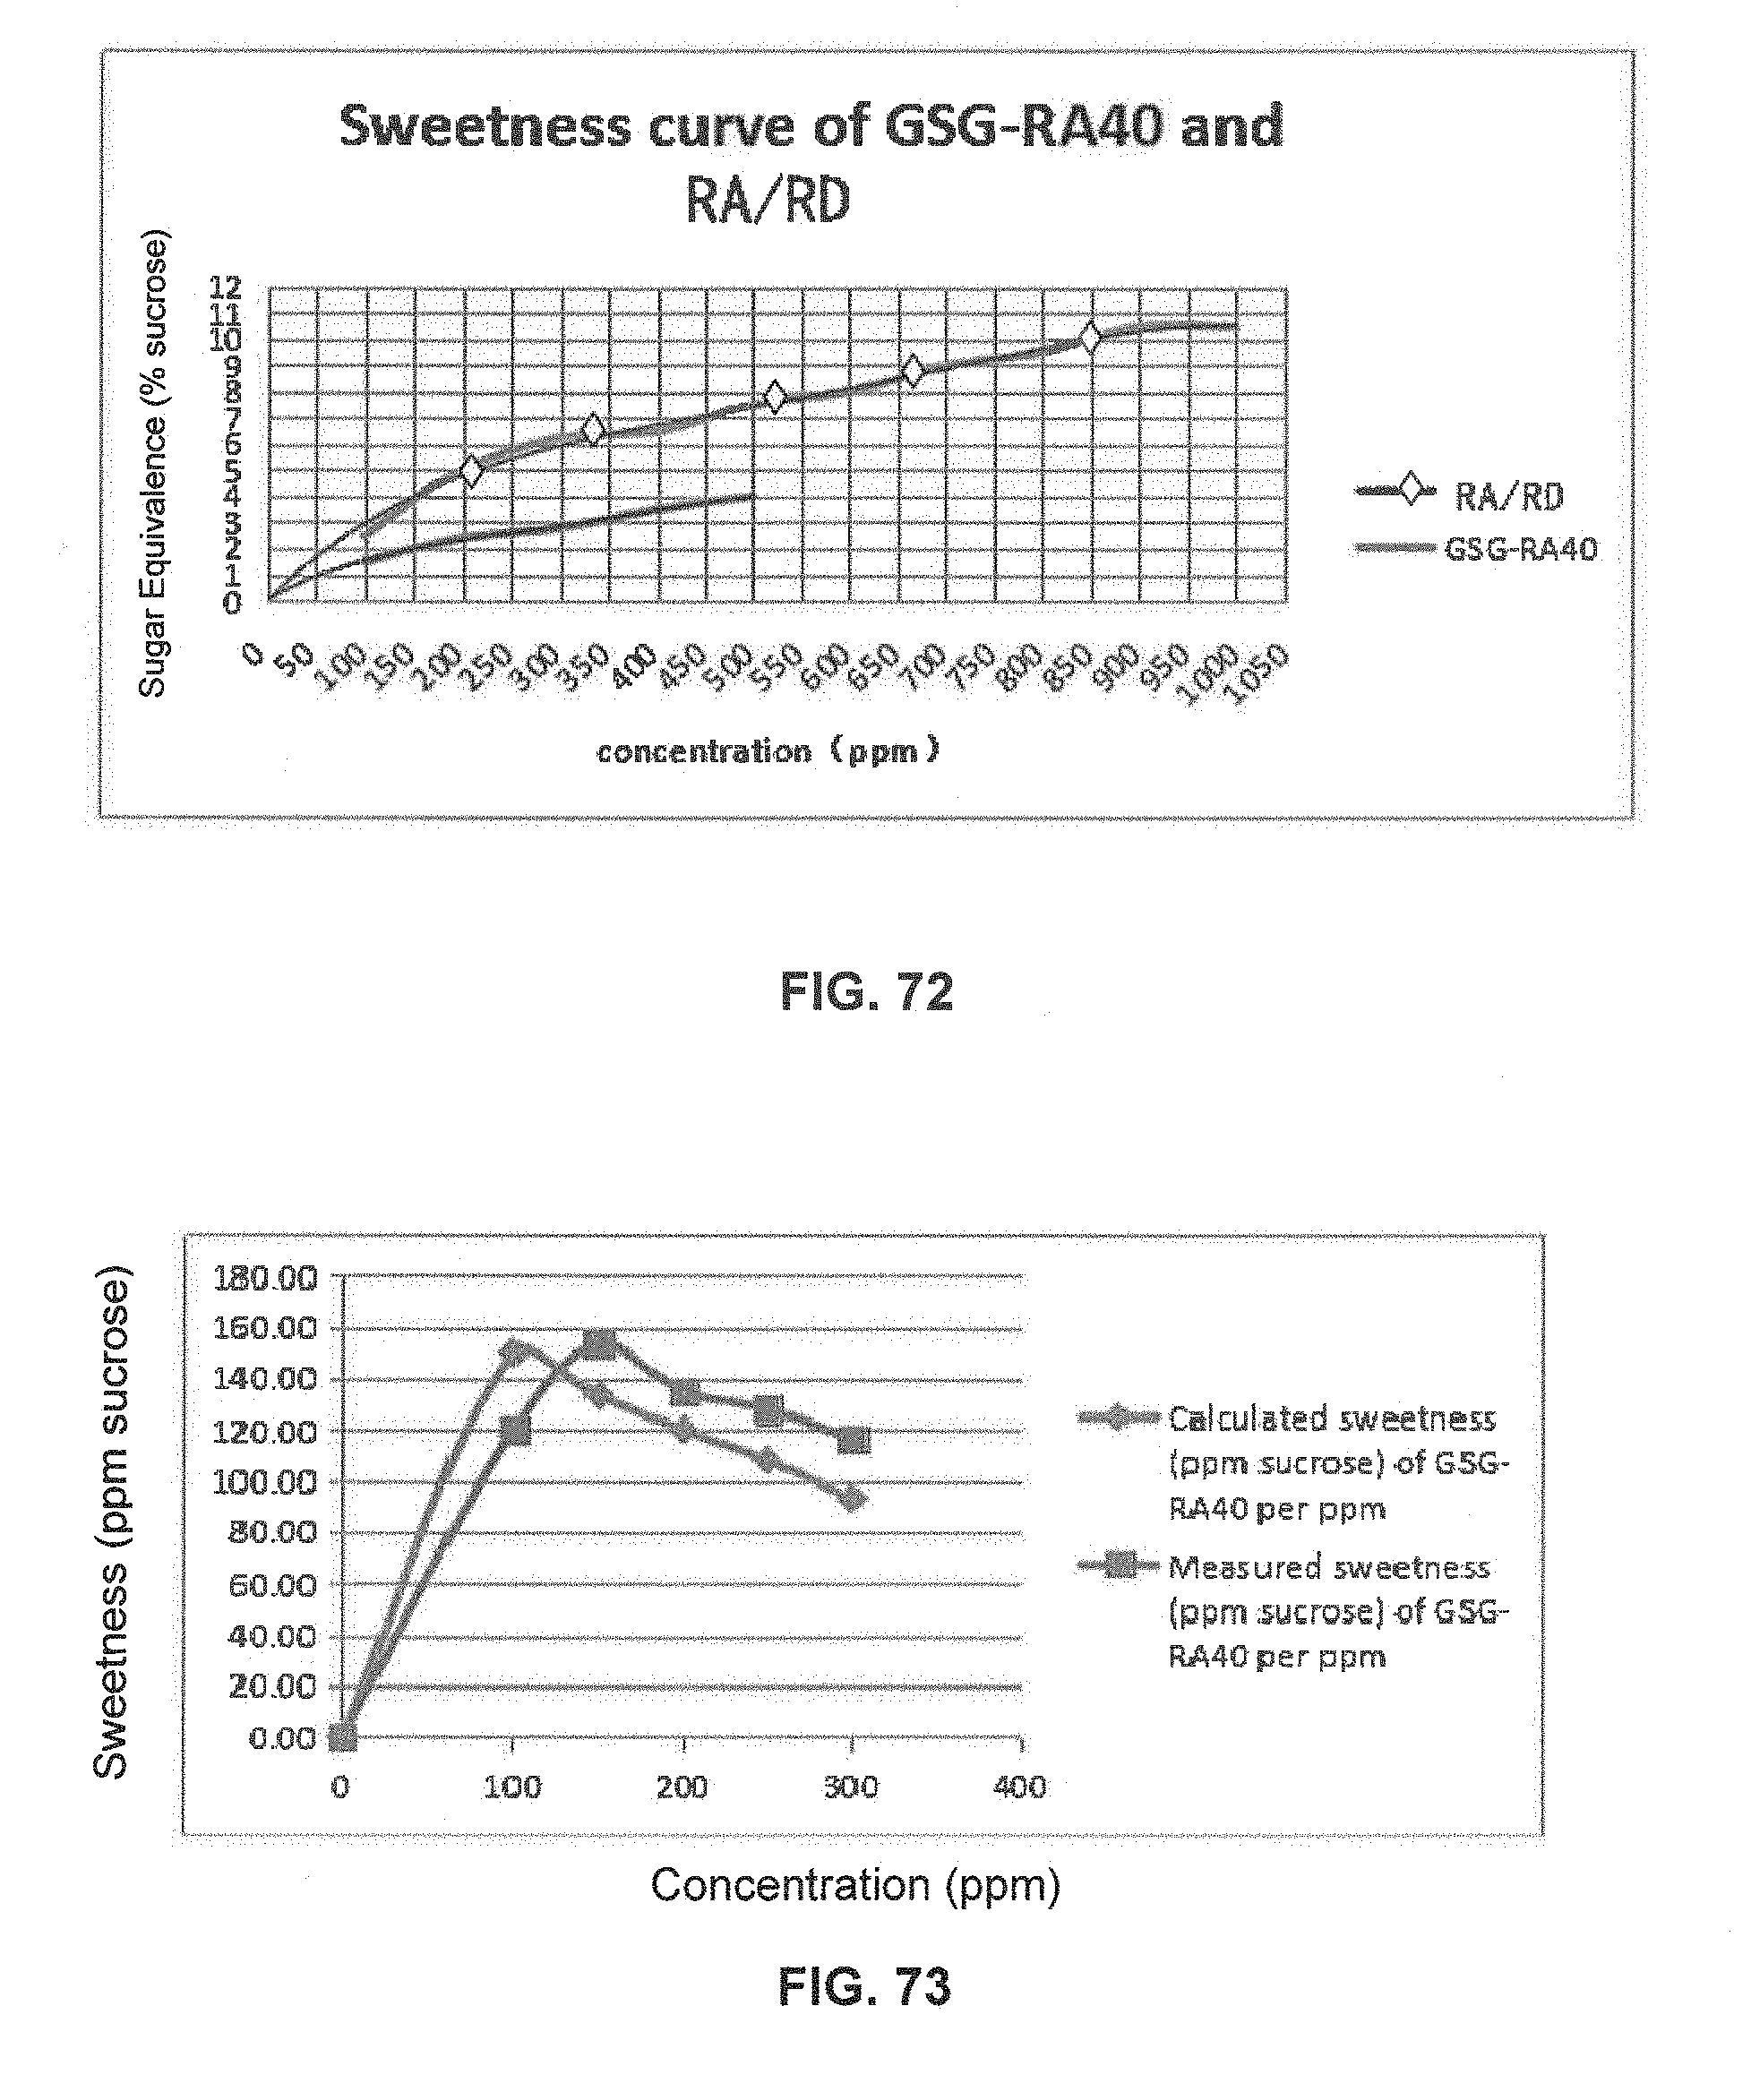
D00041
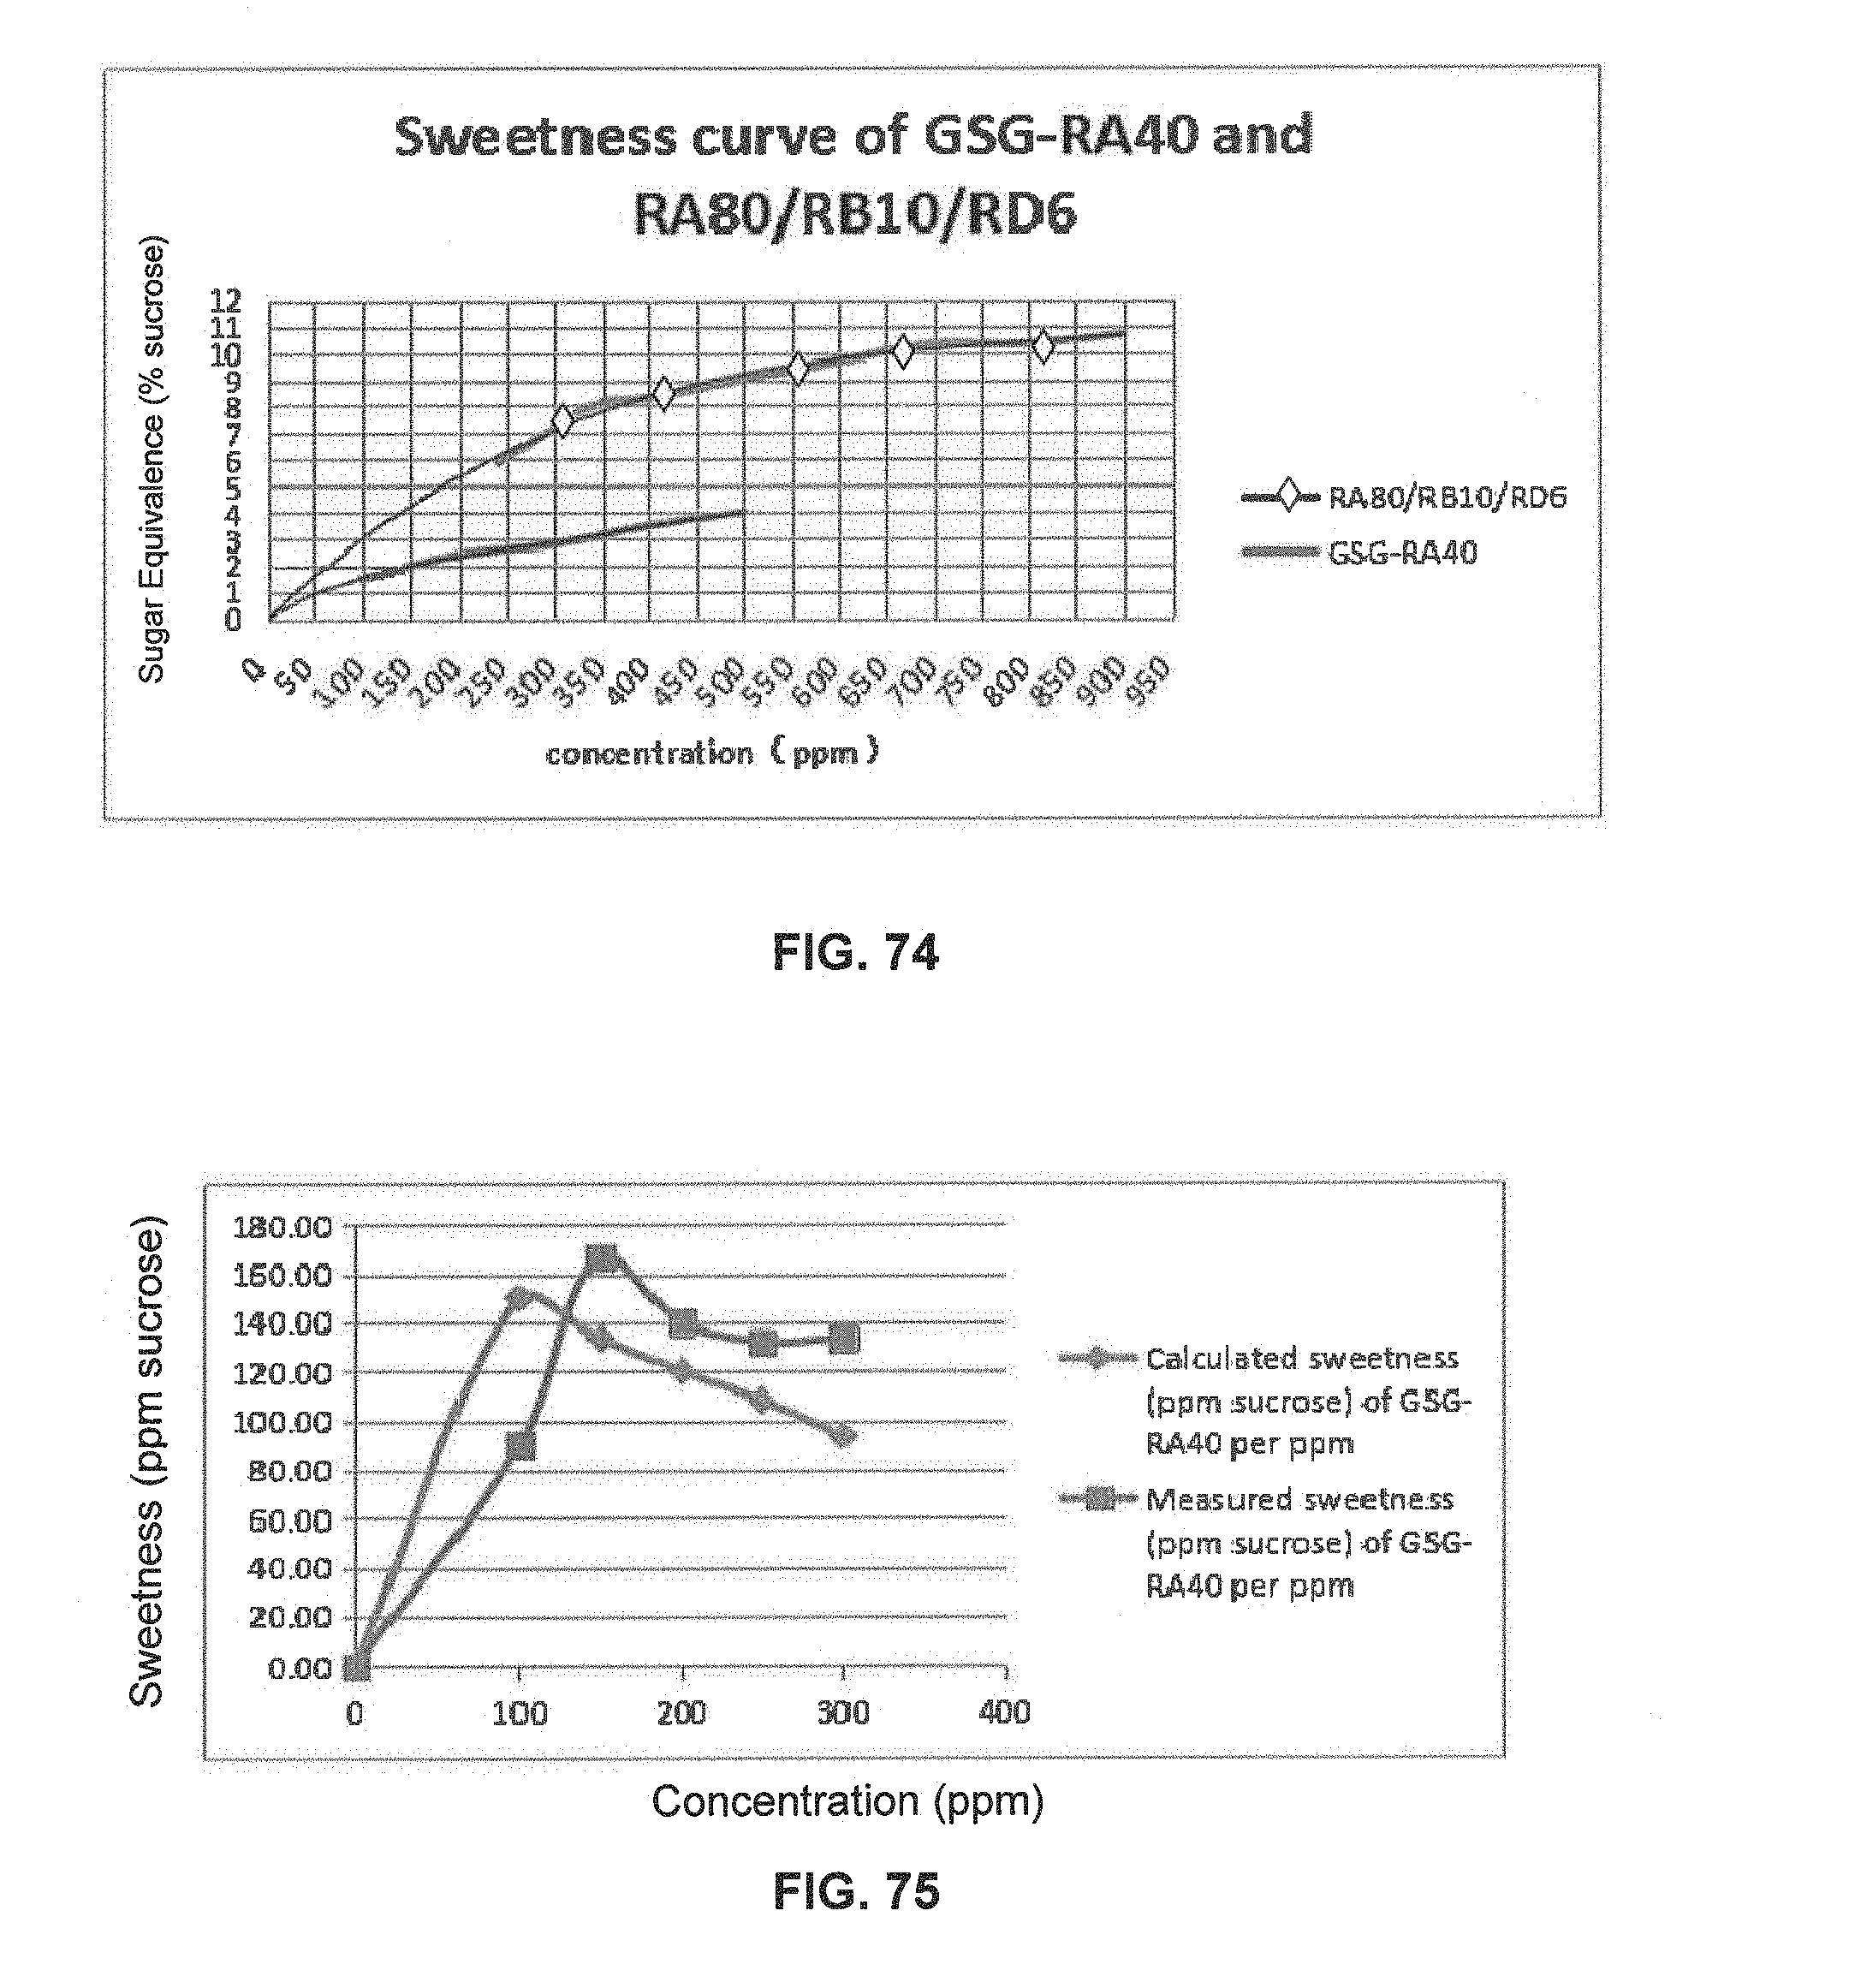
D00042

D00043
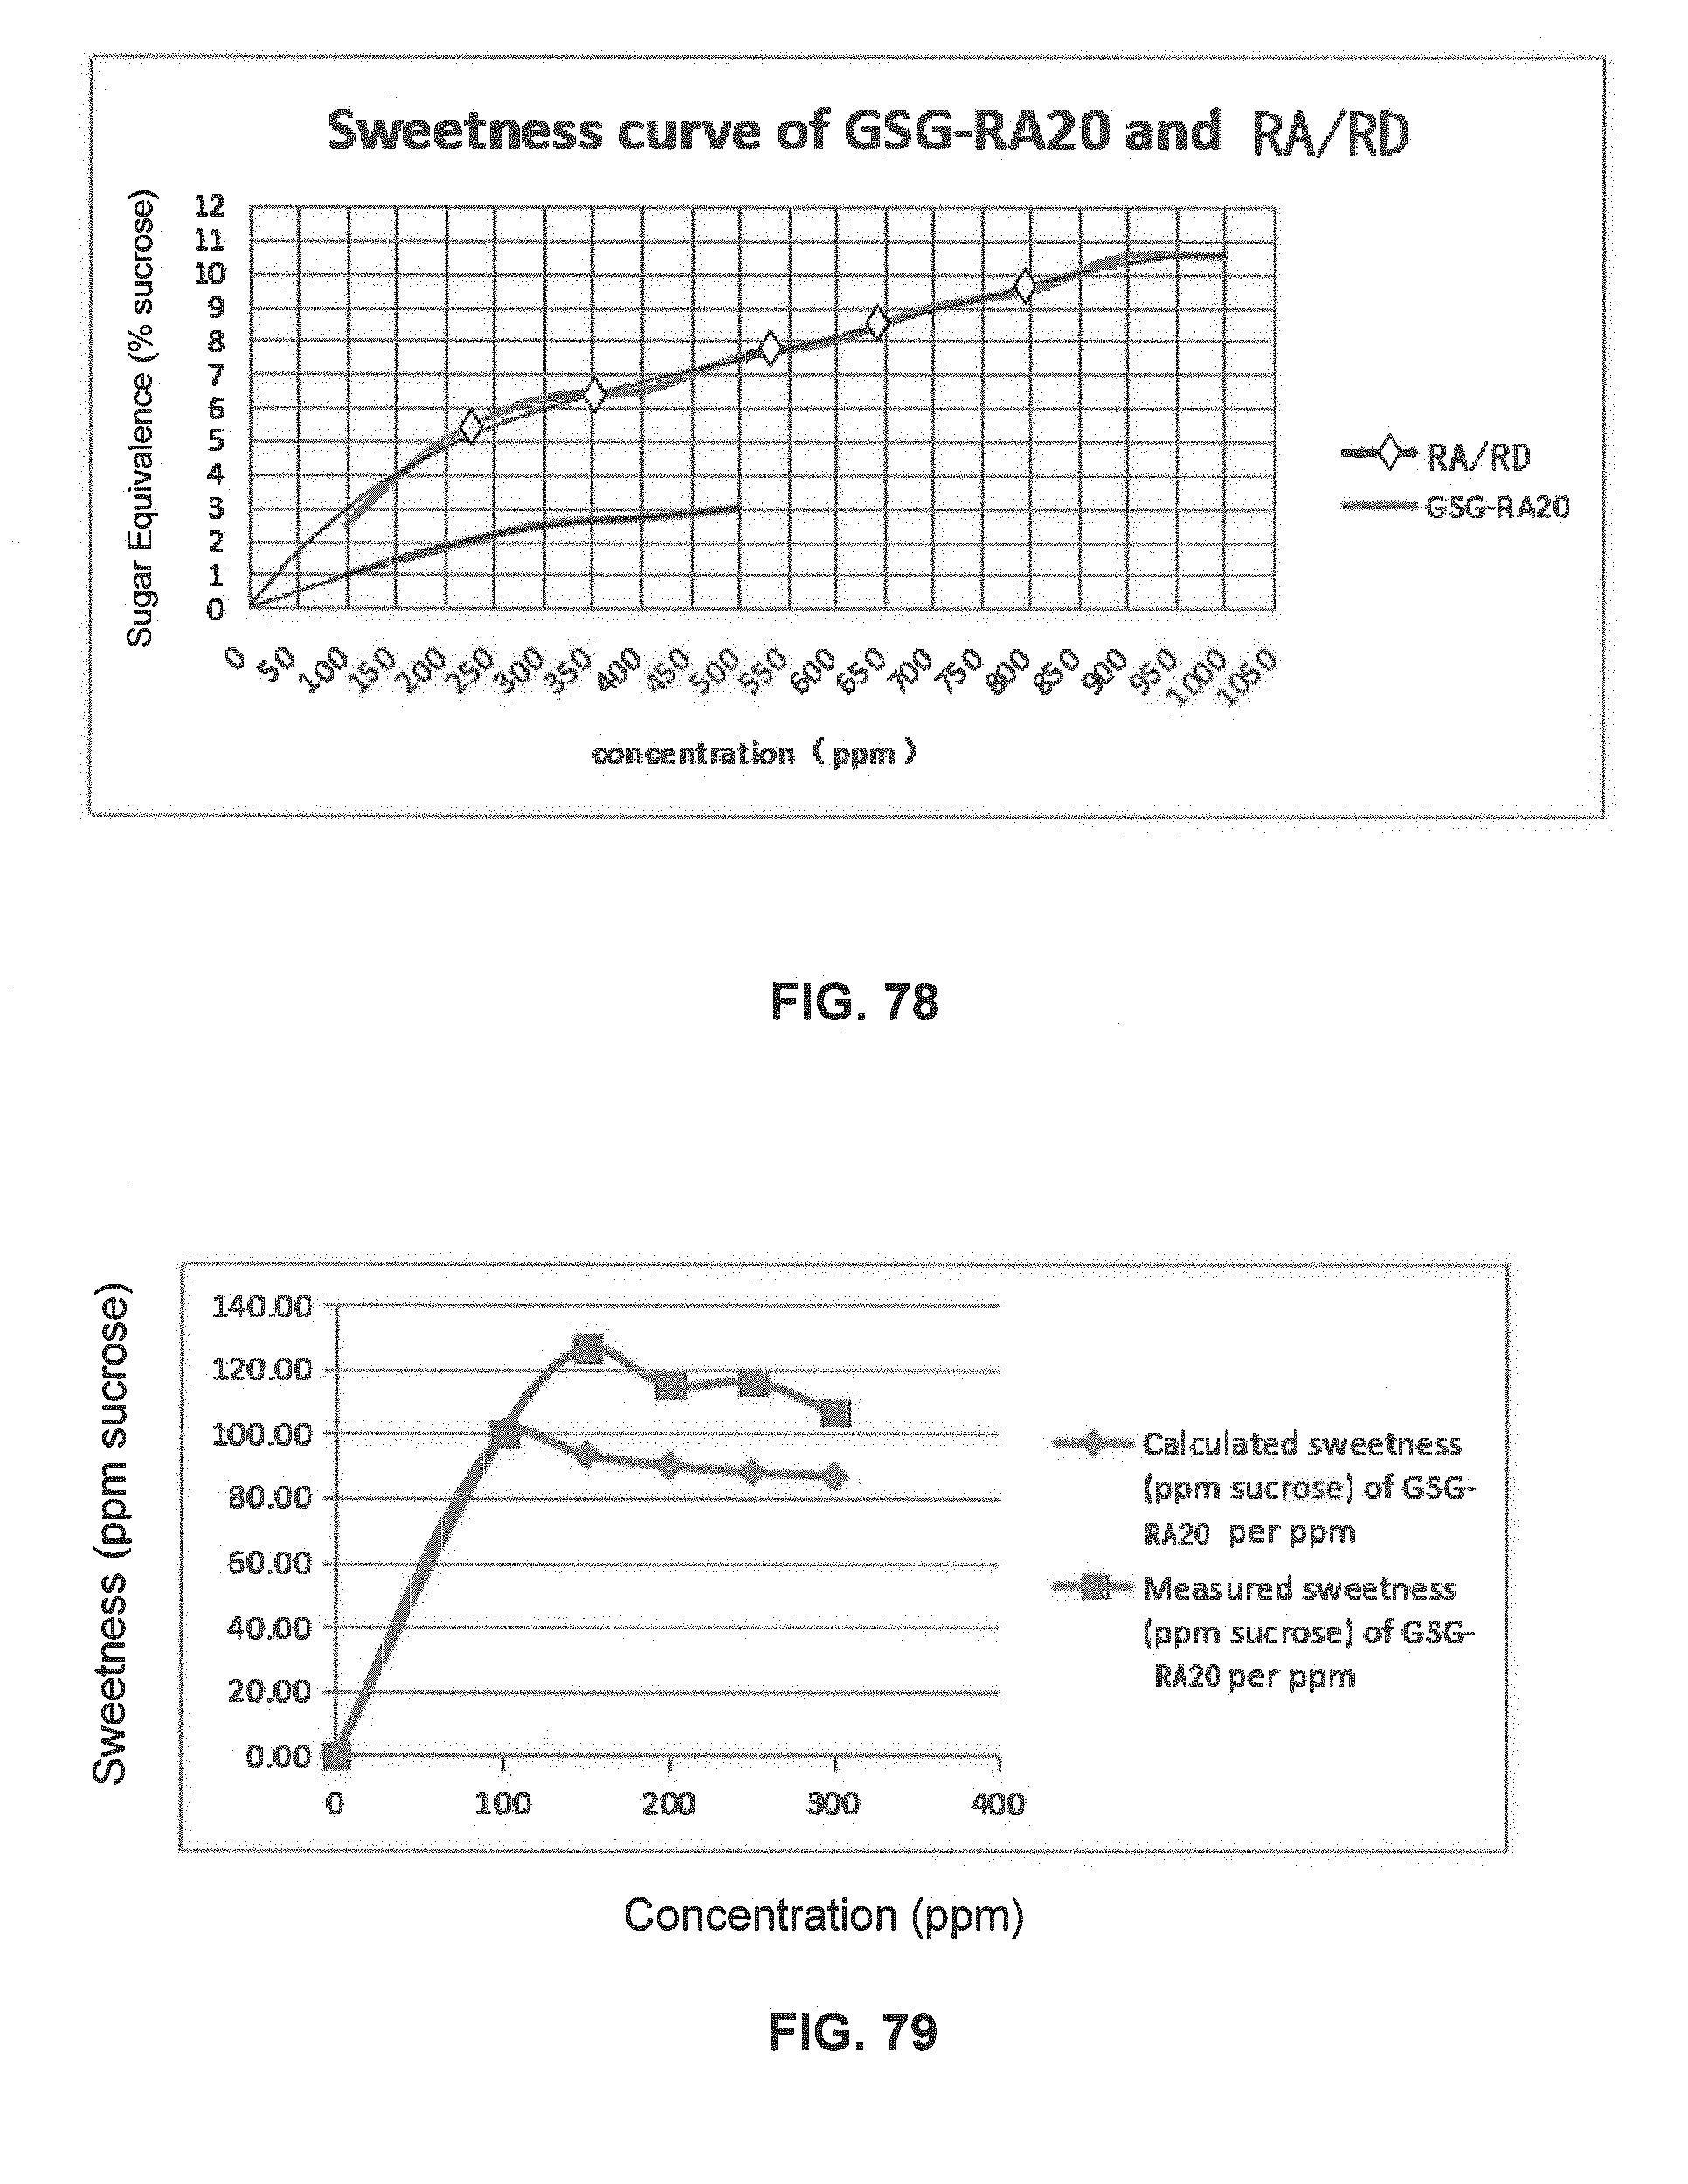
D00044

XML
uspto.report is an independent third-party trademark research tool that is not affiliated, endorsed, or sponsored by the United States Patent and Trademark Office (USPTO) or any other governmental organization. The information provided by uspto.report is based on publicly available data at the time of writing and is intended for informational purposes only.
While we strive to provide accurate and up-to-date information, we do not guarantee the accuracy, completeness, reliability, or suitability of the information displayed on this site. The use of this site is at your own risk. Any reliance you place on such information is therefore strictly at your own risk.
All official trademark data, including owner information, should be verified by visiting the official USPTO website at www.uspto.gov. This site is not intended to replace professional legal advice and should not be used as a substitute for consulting with a legal professional who is knowledgeable about trademark law.