Real time map rendering with data clustering and expansion and overlay
Mason , et al. No
U.S. patent number 10,467,558 [Application Number 15/629,640] was granted by the patent office on 2019-11-05 for real time map rendering with data clustering and expansion and overlay. This patent grant is currently assigned to Verizon Patent and Licensing Inc.. The grantee listed for this patent is VERIZON PATENT AND LICENSING INC.. Invention is credited to Jason Mathew Koch, Ralph James Mason.


View All Diagrams
| United States Patent | 10,467,558 |
| Mason , et al. | November 5, 2019 |
Real time map rendering with data clustering and expansion and overlay
Abstract
Systems and methods are provided for the organization, management, and graphical display of multiple logically related entities. In some embodiments, the systems and methods provide the real-time display of status and location information for a fleet of tracked vehicles. In some embodiments, the systems and methods permit the automatic clustering of assets based on a user's view of an underlying map. In some embodiments, the assets are vehicles that are a part of a managed fleet. In some embodiments, the assets are logically arranged into clusters of like assets. In some embodiments, the clusters provide graphical indications of status or class information of their underlying assets.
| Inventors: | Mason; Ralph James (Christchurch, NZ), Koch; Jason Mathew (Huntington Beach, CA) | ||||||||||
|---|---|---|---|---|---|---|---|---|---|---|---|
| Applicant: |
|
||||||||||
| Assignee: | Verizon Patent and Licensing
Inc. (Basking Ridge, NJ) |
||||||||||
| Family ID: | 43586890 | ||||||||||
| Appl. No.: | 15/629,640 | ||||||||||
| Filed: | June 21, 2017 |
Prior Publication Data
| Document Identifier | Publication Date | |
|---|---|---|
| US 20170286878 A1 | Oct 5, 2017 | |
Related U.S. Patent Documents
| Application Number | Filing Date | Patent Number | Issue Date | ||
|---|---|---|---|---|---|
| 14285112 | May 22, 2014 | 9697485 | |||
| 12882930 | Sep 15, 2010 | 8745516 | |||
| PCT/US2010/045630 | Aug 16, 2010 | ||||
| 61274221 | Aug 14, 2009 | ||||
| Current U.S. Class: | 1/1 |
| Current CPC Class: | G09B 29/007 (20130101); G06F 3/04817 (20130101); G06Q 10/0631 (20130101); G06Q 10/0833 (20130101); G09B 29/10 (20130101); G06Q 10/087 (20130101); G06F 2203/04806 (20130101) |
| Current International Class: | G06Q 10/06 (20120101); G06F 3/0481 (20130101); G09B 29/00 (20060101); G09B 29/10 (20060101); G06Q 10/08 (20120101) |
References Cited [Referenced By]
U.S. Patent Documents
| 5003317 | March 1991 | Gray et al. |
| 5638523 | June 1997 | Mullet et al. |
| 5808907 | September 1998 | Shetty et al. |
| 5904727 | May 1999 | Prabhakaran |
| 6025843 | February 2000 | Sklar |
| 6075530 | June 2000 | Lucas et al. |
| 6097998 | August 2000 | Lancki |
| 6112015 | August 2000 | Planas et al. |
| 6144920 | November 2000 | Mikame |
| 6216134 | April 2001 | Heckeman |
| 6252605 | June 2001 | Beesley et al. |
| 6308120 | October 2001 | Good |
| 6339745 | January 2002 | Novik |
| 6377210 | April 2002 | Moore |
| 6477452 | November 2002 | Good |
| 6556899 | April 2003 | Harvey |
| 6609061 | August 2003 | MacPhail |
| 6609064 | August 2003 | Dean |
| 6611755 | August 2003 | Coffee et al. |
| 6718263 | April 2004 | Glass |
| 6879910 | April 2005 | Shike et al. |
| 7143100 | November 2006 | Carlson et al. |
| 7158136 | January 2007 | Gannon |
| 7174243 | February 2007 | Lightner et al. |
| 7246009 | July 2007 | Hamblen |
| 7323982 | January 2008 | Staton et al. |
| 7395140 | July 2008 | Christie et al. |
| 7499925 | March 2009 | Moore |
| 7587411 | September 2009 | De Vorchik |
| 7743346 | June 2010 | Kyle |
| 7756615 | July 2010 | Barfoot et al. |
| 7788134 | August 2010 | Manber |
| 7828655 | November 2010 | Uhlir et al. |
| 7913179 | March 2011 | Sheha et al. |
| 7913188 | March 2011 | Krenz et al. |
| 7949330 | May 2011 | Yuhara |
| 8200376 | June 2012 | Mattingly et al. |
| 2001/0041566 | November 2001 | Xanthos |
| 2002/0022984 | February 2002 | Daniel |
| 2002/0059075 | May 2002 | Shick |
| 2002/0077750 | June 2002 | McDonald et al. |
| 2002/0111715 | August 2002 | Richard |
| 2002/0152115 | October 2002 | Morita |
| 2003/0055666 | March 2003 | Roddy |
| 2003/0149526 | August 2003 | Zhou |
| 2003/0158635 | August 2003 | Pillar |
| 2004/0039504 | February 2004 | Coffee et al. |
| 2004/0073468 | April 2004 | Vyas |
| 2004/0077347 | April 2004 | Lauber et al. |
| 2004/0090950 | May 2004 | Lauber et al. |
| 2004/0148090 | July 2004 | Melen |
| 2004/0254698 | December 2004 | Hubbard et al. |
| 2005/0080520 | April 2005 | Kline et al. |
| 2005/0090978 | April 2005 | Bathory et al. |
| 2005/0143909 | June 2005 | Orwant |
| 2005/0171835 | August 2005 | Mook |
| 2005/0195096 | September 2005 | Ward et al. |
| 2005/0198576 | September 2005 | Childress |
| 2005/0222933 | October 2005 | Wesby |
| 2006/0026170 | February 2006 | Kreitler |
| 2006/0074553 | April 2006 | Foo |
| 2006/0099959 | May 2006 | Stanton et al. |
| 2006/0100777 | May 2006 | Station et al. |
| 2006/0129691 | June 2006 | Coffee et al. |
| 2006/0187026 | August 2006 | Kochis |
| 2006/0190280 | August 2006 | Hoebel |
| 2006/0212327 | September 2006 | Norman |
| 2006/0244587 | November 2006 | Humphries |
| 2006/0276204 | December 2006 | Simpson |
| 2006/0287783 | December 2006 | Walker |
| 2007/0173993 | July 2007 | Nielsen et al. |
| 2008/0014908 | January 2008 | Vasant |
| 2008/0036778 | February 2008 | Sheha et al. |
| 2008/0045234 | February 2008 | Reed |
| 2008/0052142 | February 2008 | Bailey et al. |
| 2008/0071428 | March 2008 | Kim |
| 2008/0097731 | April 2008 | Lanes |
| 2008/0121690 | May 2008 | Carani |
| 2008/0125964 | May 2008 | Carani |
| 2008/0174485 | July 2008 | Carani |
| 2008/0252487 | October 2008 | McClellan |
| 2008/0255722 | October 2008 | McClellan |
| 2008/0258890 | October 2008 | Follmer |
| 2008/0261565 | October 2008 | Kunz |
| 2008/0294690 | November 2008 | McClellan |
| 2008/0318597 | December 2008 | Berns |
| 2009/0003657 | January 2009 | Deardorff |
| 2009/0051510 | February 2009 | Follmer |
| 2009/0073034 | March 2009 | Lin |
| 2009/0077221 | March 2009 | Eisenstadt |
| 2009/0131012 | May 2009 | Ashley, Jr. |
| 2009/0132163 | May 2009 | Ashley, Jr. |
| 2009/0137255 | May 2009 | Ashley, Jr. |
| 2009/0138336 | May 2009 | Ashley, Jr. |
| 2009/0292464 | November 2009 | Fuchs |
| 2009/0326991 | December 2009 | Wei et al. |
| 2010/0023162 | January 2010 | Gresak |
| 2010/0076675 | March 2010 | Barth et al. |
| 2010/0076968 | March 2010 | Boyns |
| 2010/0115462 | May 2010 | Spencer |
| 2010/0153005 | June 2010 | Cerecke et al. |
| 2010/0205022 | August 2010 | Brown |
| 2010/0207751 | August 2010 | Follmer |
| 2010/0211340 | August 2010 | Lowenthal et al. |
| 2010/0274479 | October 2010 | Sheha et al. |
| 2010/0281381 | November 2010 | Meaney et al. |
| 2011/0016199 | January 2011 | De Carlo et al. |
| 2011/0016514 | January 2011 | De Carlo et al. |
| 2011/0040440 | February 2011 | de Oliveira et al. |
| 2011/0093306 | April 2011 | Nielsen et al. |
| 2011/0238457 | September 2011 | Mason et al. |
| 2011/0288762 | November 2011 | Kuznetsov |
| 2011/0289019 | November 2011 | Radloff et al. |
| 2012/0072244 | March 2012 | Collins et al. |
| 2012/0101855 | April 2012 | Collins et al. |
| 2012/0179361 | July 2012 | Mineta et al. |
| 2607465 | Apr 2008 | CA | |||
| WO 00/22595 | Apr 2000 | WO | |||
| WO 02/075667 | Sep 2002 | WO | |||
| WO 2008/034097 | Mar 2008 | WO | |||
| WO 2008/110962 | Sep 2008 | WO | |||
| WO 2011/116330 | Sep 2011 | WO | |||
Other References
|
"Extended European Search Report", for Application No. 10754608.7-1958/2465024 PCT/US2010/045630, dated Dec. 23, 2014, in 6 pages. cited by applicant . "Extended Supplementary Search Report", for Application No. 11776666.7-1955/2663930, dated Nov. 5, 2014, in 6 pages. cited by applicant . "International Preliminary Report on Patentability", issued in application No. PCT/US2010/045630 dated Feb. 23, 2012. cited by applicant . "International Search Report and Written Opinion", International Application No. PCT/US2010/045630, dated Mar. 30, 2011. cited by applicant . "Notice of the Third Office Action for corresponding Chinese Application", No. 201080036125.X, dated Jan. 12, 2015, in 11 pages. cited by applicant . "Office Action", issued in New Zealand application No. 597951 dated Nov. 8, 2012. cited by applicant . "Office Action issued in Chinese application", No. 201080036125.X dated Jun. 3, 2014. cited by applicant . Ammar, et al., "Marine fleet allocation using data mining techniques", Logistics (LOGISTIQUA), 2011 4th International Conference on; Digital Object Identifier: 10.11 09/LOGISTIQUA.2011.5939394 Publication Year: 2011, pp. 1-5. cited by applicant . Barcelo, et al., "Vehicle Routing and Scheduling Models, Simulation and City Logistics", Dept. of Statistics and Operations Research, Universidad Politecnica de Catalunya, pp. 1-29 (accessed Aug. 22, 2011). cited by applicant . Beard, et al., "Estimating positions and paths of moving objects", Temporal Representation and Reasoning, 2000. TIME 2000. Proceedings. Seventh International Workshop on; Digital Object Identifier: 10.11 09/TIME.2000.856597 Publication Year: 2000 , pp. 155-162. cited by applicant . Chadil, et al., "Real-time tracking management system using GPS, GPRS and Google earth", Electrical Engineering/Electronics, Computer, Telecommunications and Information Technology, 2008. ECTI-CON 2008. 5th Inter. Conf. on; vol. 1; Digital Object Id: 10.11 09/ECTICON.2008.4600454; Pub.yr. 2008, pp. 393-396. cited by applicant . Chou, "Automatic bus routing and passenger geocoding with a geographic information system", Vehicle Navigation and Information Systems Conference, 1995. Proceedings. In conjunction with the Pacific Rim TransTech Conference. 6th International VNIS. A Ride into the Future; Digital Object Identifier: 10.11 09IVNIS. 1995.518861. cited by applicant . El-Medany, et al., "A Cost Effective Real-Time Tracking System Prototype Using Integrated GPS/CPRS Module", Wireless and Mobile Communications (ICWMC), 2010 6th International Conference on Digital Object Identifier: 10.11 09/ICWMC.201 0.1 04; Publication Year: 2010, pp. 521-525. cited by applicant . Hess, "Prognostics, from the need to reality-from the fleet users and PHM system designer/developers perspectives", Aerospace Conference Proceedings, 2002. IEEE; vol. 6; Digital Object Identifier: 10.11 09/AER0.2002.1 036118 Publication Year: 2002 , pp. 6-2791-6-2797 vol. 6. cited by applicant . Maclean, et al., "Real-time Bus Information on Mobile Devices", Department of Electrical Engineering, University of Washington, pp. 1-6 (accessed Aug. 22, 2011). cited by applicant . Mustapha, et al., "UKM campus bus monitoring system using RFID and GIS", Signal Processing and Its Applications (CSPA), 2010 6th International Colloquium on; Digital Object Identifier: 10.11 09/CSPA.201 0.5545246; Publication Year: 2010, pp. 1-5. cited by applicant . Pham, et al., "A framework algorithm for a real-world variant of the vehicle routing problem", Industrial Engineering and Engineering Management (IEEM), 2011 IEEE International Conference on; Digital Object Identifier: 10.1109/IEEM.2011.6118237. Publication Year: 2011 , pp. 1859-1863. cited by applicant . Shepard, "Multidimensional Scaling, Tree-Filling, and Clustering", Science, New Series, 210(4468):390-398 (Oct. 24, 1980). cited by applicant . Stodolsky, et al., "Technology Options to Reduce Truck Idling", Argonne National Laboratory, Transportation Technology R&D Center, University of Chicago, 16 pages, Mar. 15, 2001. cited by applicant . Van De Peer, et al., "TREECON: a Software Package for the Construction and Drawing of Evolutionary Trees", Computer Applications in the Biosciences, IRL Press at Oxford University Press, 9(2):177-182 (1993). cited by applicant . Wang, "Research on cartographic visualization for statistical data", China Master Dissertations Full-text database, vol. 6 (Jun. 15, 2008). cited by applicant . Zhang, et al., "BIRCH: An Efficient Data Clustering Method for Very Large Databases", Sigmod, pp. 103-114 (1996). cited by applicant . A Cost Effective Real-Time Tracking System Prototype Using Integrated GPS/GPRS Module; El-Medany, W.; Al-Omary, A.; Al-Hakim, R.; Al-Irhayim, S.; Nusaif, M.; Wireless and Mobile Communications (ICWMC), 2010 6th International Conference on Digital Object Identifier: 10.11 09/ICWMC.2010 0. 1 04; Publication Year: 2010, pp. 521-525. cited by applicant . A framework algorithm for a real-world variant of the vehicle routing problem; Vu Pham; Tien Dinh; Industrial Engineering and Engineering Management (IEEM), 2011 IEEE International Conference on; Digital Object Identifier: 10. 1109/IEEM.2011.6118237. Publication Year: 2011 , pp. 1859-1863. cited by applicant . Automatic bus routing and passenger geocoding with a geographic information system; Yue-Hong Chou; Vehicle Navigation and Information Systems Conference, 1995. Proceedings. In conjunction with the Pacific Rim TransTech Conference. 6th International VNIS. A Ride into the Future; Digital Object Identifier: 10.11 09IVNIS.1995.518861. cited by applicant . Barcelo et al., "Vehicle Routing and Scheduling Models, Simulation and City Logistics", Dept of Statistics and Operations Research, Universitat Politecnica de Catalunya, pp. 1-29 (accessed Aug. 22, 2011). cited by applicant . Estimating positions and paths of moving objects; Beard, K.; Palancioglu, H.M.; Temporal Representation and Reasoning, 2000. TIME 2000. Proceedings. Seventh International Workshop on; Digital Object Identifier: 10.11 09/TIME.2000.856597 Publication Year: 2000 , pp. 155-162. cited by applicant . Marine fleet allocation using data mining techniques; Ammar, M.H.; Ben Hafssia, S.; Masmoudi, Y.; Chabchoub, H. Logistics (LOGISTIQUA), 2011 4th International Conference on; Digital Object Identified: 10.11 09/LOGISTIQUA.2011.5939394 Publication Year: 2011 , pp. 1-5. cited by applicant . Prognostics, from the need to reality-from the fleet users and PHM system designer/developers perspectives; Hess, A. Aerospace Conference Proceedings, 2002. IEEE; vol. 6; Digital Object Identifier: 10.11 09/AERO.2002. 1 036118 Publication Year: 2002 , pp. 6-2791-6-2797 vol. 6. cited by applicant . Real-time tracking management system using GPS, GPRS and Google earth; Chadil, N.; Russameesawang, A.; Keeratiwintakorn, P.; Electrical Engineering/Electronics, Computer, Telecommunications and Information Technology, 2008. ECTI-CON 2008, 5th Inter. Conf. on;vol. 1; Digital Object Id: 10.11 09/ECTICON.2008.4600454; Pub.yr 2008, pp. 393-396. cited by applicant . Shepard, "Multidimensional Scaling, Tree-Fitting, and Clustering", Science, New Series, 210(4468):390-398 (Oct. 24, 1980). cited by applicant . UKM campus bus monitoring system using RFID and GIS; Mustapha, A.M.; Hannan, M.A.; Hussain, A.; Basri, H.; Signal Processing and Its Applications (CSPA), 2010 6th International Colloquium on; Digital Object Identifier: 10.11 09/CSPA.201 0.5545246; Publication Year: 2010, pp. 1-5. cited by applicant. |
Primary Examiner: Song; Daeho D
Parent Case Text
CROSS-REFERENCE TO RELATED APPLICATIONS
This application is a continuation application of U.S. patent application Ser. No. 14/285,112 filed May 22, 2014 and entitled "Real Time Map Rendering with Data Clustering and Expansion and Overlay", which is a continuation of application of U.S. patent application Ser. No. 12/882,930 filed Sep. 15, 2010 and entitled "Real Time Map Rendering with Data Clustering and Expansion and Overlay", which is a continuation application of International Patent Application No. PCT/US2010/45630, filed Aug. 16, 2010 and entitled "Real Time Map Rendering with Data Clustering and Expansion and Overlay", which claims priority to U.S. Provisional Patent Application Ser. No. 61/274,221, filed Aug. 14, 2009 and entitled "Real Time Map Rendering with Data Clustering and Expansion and Overlay," each of these applications are incorporated herein by reference to the extent they are not inconsistent with the disclosure herein.
Claims
What is claimed is:
1. A system for controlling display of information pertaining to a fleet of vehicles, the system comprising: a memory device configured to store position information for a plurality of vehicles in the fleet of vehicles, the position information comprising locations of the plurality of vehicles on a network of streets in a geographic region; a communication device configured to transmit and receive the position information pertaining to the plurality of vehicles in the fleet of vehicles; and a hardware processor in communication with the memory device, the hardware processor configured to: retrieve the position information from the memory device; assign each of the plurality of vehicles to one of a plurality of groups according to the position information; and generate a vehicle management user interface comprising a map and a plurality of group indicators including a first group indicator, the map depicting at least part of the geographic region, the plurality of group indicators being overlaid on the map and each group indicator of the plurality of group indicators providing status information and class information for the each of the plurality of vehicles assigned to the one of the plurality of groups; wherein the first group indicator corresponds to a first group of the plurality of groups, the first group indicator comprising a geometric shape having an inner area, the inner area comprising an outer periphery section encompassing a perimeter of the inner area and denoting a total number of vehicles assigned to the first group at a center of the inner area, wherein the outer periphery section depicts the status information as coloring of portions of the outer periphery section in a plurality of colors and the inner area depicts color coded pie chart of the class information for one or more of the vehicles assigned to the first group based on a type of the one or more vehicles; and wherein, when the first group indicator is selected, a pop-up box with vehicle information for the vehicles assigned to the first group is provided to the vehicle management user interface.
2. The system of claim 1, wherein the vehicle information comprises any of name, status, class, and a plurality of links associated with each vehicle assigned to the first group, and when one of the plurality of links associated with a first vehicle assigned to the first group is selected, first vehicle information associated with the first vehicle is provided.
3. The system of claim 1, wherein the total number of vehicles assigned to the first group is less than five.
4. The system of claim 1, wherein the pop-up box displays the vehicle information associated with the vehicles assigned to the first group, the vehicle information comprising a number of vehicles in each status, in each color, and in each category, and a plurality of links, and when a first link of the plurality of links is selected, a scrollable list of the vehicles assigned to the first group is displayed, the scrollable list provides an option for a user to select one of the vehicles assigned to the first group to obtain individual information associated with the selected vehicle.
5. The system of claim 4, wherein the total number of vehicles assigned to the first group is more than four.
6. The system of claim 1, wherein the position information comprising the locations of the plurality of vehicles on the network of streets in the geographic region stored in memory is updated based on any of periodic interval update, random interval update, and an alarm condition update by obtaining the position information through the communication device, the updated position information is reflected in assignment of the each of the plurality of vehicles to the one of the plurality of groups in real-time.
7. The system of claim 1, wherein, when the map on which the first group indicator is displayed is zoomed in, the first group indicator is replaced with a plurality of second group indicators belonging to the first group with detailed positioning on the zoomed-in map.
8. The system of claim 7, wherein when the zoomed-in map is further zoomed in, one of the plurality of the second group indicators is replaced with a first vehicle in the one of the plurality of second groups with an accurate real-time location of the first vehicle.
9. The system of claim 7, wherein when one of the plurality of second group indicators is selected, each location of vehicles in the one of the plurality of second group indicators is displayed.
10. The system of claim 7, wherein when the zoomed-in map on which the plurality of second group indicators is displayed is zoomed out, one or more of the plurality of second group indicators are combined to form a third group indicator.
11. A method of controlling display of information pertaining to a fleet of vehicles, the method comprising: by a computer system comprising computer hardware and a communication device: retrieving, from a memory device, position information for a plurality of vehicles in the fleet of vehicles, the position information comprising locations of the plurality of vehicles on a network of streets in a geographic region; assigning each of the plurality of vehicles to one of a plurality of groups according to the position information; and generating a vehicle management user interface comprising a map and a plurality of group indicators including a first group indicator, the map depicting at least part of the geographic region, the plurality of group indicators being overlaid on the map and each group indicator of the plurality of group indicators providing status information and class information, for the each of the plurality of vehicles assigned to the one of the plurality of groups; wherein the first group indicator corresponds to a first group of the plurality of groups, the first group indicator comprising a geometric shape having an inner area, the inner area comprising an outer periphery section encompassing a perimeter of the inner area and denoting a total number of vehicles assigned to the first group at a center of the inner area, wherein the outer periphery section depicts the status information as coloring of portions of the outer periphery section in a plurality of colors and the inner area depicts color coded pie chart of the class information for one or more of the vehicles assigned to the first group based on a type of the one or more vehicles; and when the first group indicator is selected, providing a pop-up box with vehicle information for the vehicles assigned to the first group to the vehicle management user interface.
12. The method of claim 11, wherein the vehicle information comprises any of name, status, class, and a plurality of links for each vehicle assigned to the first group, and when one of the plurality of links associated with a first vehicle assigned to the first group is selected, first vehicle information associated with the first vehicle is provided.
13. The method of claim 11, wherein the total number of vehicles assigned to the first group is less than five.
14. The method of claim 11, wherein the pop-up box displays the vehicle information associated with the vehicles assigned to the first group, the vehicle information comprising a number of vehicles in each status, in each color, and in each category and a plurality of links, and when a first link of the plurality of links is selected, a scrollable list of the vehicles assigned to the first group is displayed, the scrollable list provides an option for a user to select one of the vehicles assigned to the first group to obtain individual information associated with the selected vehicle.
15. The method of claim 14, wherein the total number of vehicles assigned to the first group is more than four.
16. The method of claim 11, wherein the position information comprising the locations of the plurality of vehicles on the network of streets in the geographic region stored in memory is updated based on any of periodic interval update, random interval update, and an alarm condition update by obtaining the position information through the communication device, the updated position information is reflected in assignment of the each of the plurality of vehicles to the one of the plurality of groups in real-time.
17. The method of claim 11, wherein, when the map on which the first group indicator is displayed is zoomed in, the first group indicator is replaced with a plurality of second group indicators belonging to the first group with detailed positioning on the zoomed-in map.
18. The method of claim 17, wherein when the zoomed-in map is further zoomed in, one of the plurality of the second group indicators is replaced with a first vehicle in the one of the plurality of second groups with an accurate real-time location of the first vehicle.
19. The method of claim 17, wherein when one of the plurality of second group indicators is selected, each location of vehicles in the one of the plurality of second group indicators is displayed.
Description
INCORPORATION BY REFERENCE TO ANY PRIORITY APPLICATIONS
Any and all applications for which a foreign or domestic priority claim is identified in the Application Data Sheet as filed with the present application are hereby incorporated by reference under 37 CFR 1.57.
BACKGROUND
1. Field
This invention generally relates to systems and methods for organizing, managing, and graphically displaying multiple logically related entities and, more specifically, in one embodiment, to systems and methods for the real time organization and display of clusters of tracked vehicles in connection with a geographical map.
2. Description of Related Art
As the use of electronic maps to display information has increased in popularity, so has the volume and complexity of information to be displayed. Accordingly, it has become more and more difficult to take in the wide range of data that may be overlaid and viewed on maps without the viewer becoming confused or overwhelmed by the display.
This problem is acutely expressed in the field of map-based or location-based services and tools, where the ever increasingly detailed nature of the information to be displayed, together with the potentially limitless number of sources from which data is gathered, combine to make it extremely challenging to display such information on a map in a logical manner that is accessible and useful to viewers. For instance, the management of large numbers of people and equipment involves obtaining timely information about location, status, and potential alarm conditions. Management preferably wants to be able to observe when and where scheduled events have occurred and how schedules and status have changed since the previous observations, but doing so in prior systems was difficult if not impossible with so much data available. For example, in the field of fleet management, it is desirable to know the status of vehicles in a fleet, where the vehicles currently are, whether the vehicles are operating properly, etc. For fleets with hundreds or thousands of vehicles, such information quickly became overwhelming when accessed through a map-based interface.
Developers have attempted to facilitate the ease of use of such map-based displays by allowing viewers to zoom in and out of the maps at issue; however, this is often an ineffective solution since the problem of viewing an overwhelming amount of data is only amplified as the viewer zooms out to get a more general picture of the data. As a result, in order to make sense of the displayed data, the viewer's only choice is to zoom in so far on the map that important information is no longer displayed onscreen. Other systems simply operate too slowly to meet the demands of full time asset management.
SUMMARY
The present embodiments overcome these and other deficiencies of the prior art by providing systems and methods for smart zooming that cluster geographically or spatially related information together to create useful overlays of data to facilitate the management of such information. In some embodiments, the information pertains to vehicles being tracked. In some embodiments, the systems and methods provide the real-time display of status and location information for a fleet of tracked vehicles. In some embodiments, the systems and methods permit the automatic clustering of assets based on a user's view of an underlying map, which change dynamically as a user zooms in or out of a map. In some embodiments, the assets are vehicles that are a part of a managed fleet. In some embodiments, the assets are logically arranged into clusters of like assets. In some embodiments, the clusters provide graphical indications of status or class information of their underlying assets.
In some embodiments, a method for displaying information pertaining to a plurality of geographically related assets is provided. The method includes receiving information pertaining to a plurality of assets; selecting the assets from the plurality of assets that are geographically related; forming a cluster comprising the selected assets; and providing a graphical user interface comprising a geographic map and the cluster. In some embodiments, the assets, are geographically related if the physical location of the assets are within a geographic area defined by a virtual bounding area. In some embodiments, the cluster is overlayed on the geographic map in the geographic area defined by the bounding area. In some embodiments, the cluster displays on the graphical user interface at least one item of information pertaining to the selected assets. In some embodiments, the assets are vehicles. The information pertaining to the plurality of assets is, in some embodiments, updated in real time. In some embodiments, at least one item of information is a chart displaying status information for the selected assets. In some embodiments, at least one item of information is a chart displaying the class information for the selected assets. In some embodiments, at least one item of information is a numerical indication of the number of selected assets. In some embodiments, the graphical user interface displays the virtual bounding area. In some embodiments, the method also includes adding the cluster to a new cluster if a user of the graphical user interface zooms out from the geographic map. In some embodiments, the method also includes splitting the cluster into a plurality of clusters if a user of the graphical user interface zooms in on the geographic map.
In some embodiments, a method for splitting a cluster of assets is provided, where each asset has pixel coordinates based on its geospatial location and in reference to a virtual area representing an end user's display. The method, in some embodiments, comprises identifying the coordinates of each asset; dividing the virtual area into slots; grouping the assets into the slots based on each assets' pixel coordinates; and generating new clusters, wherein each new cluster comprises at least one asset and comprises every asset which was grouped into the same slot.
In some embodiments, a method for clustering assets is provided. The method, in some embodiments, includes generating pixel coordinates for each asset based on the asset's geospatial location and in reference to a virtual area representing an end user's display; determining an icon shape with specific pixel dimensions for use in connection with each asset; querying a data structure with the icon shape for each asset; adding an asset as a new cluster in the data structure if the area defined by the pixel dimensions of the asset's icon shape, when centered over the asset's pixel coordinates, does not overlap with the area covered by another cluster in the data structure; and adding an asset to an existing cluster in the data structure if the area defined by the pixel dimensions of the asset's icon shape, when centered over the asset's pixel coordinates, overlaps with the area covered by the existing cluster.
BRIEF DESCRIPTION OF THE DRAWINGS
For a more complete understanding of the present embodiments, the objects and advantages thereof, reference is now made to the following descriptions taken in connection with the accompanying drawings in which:
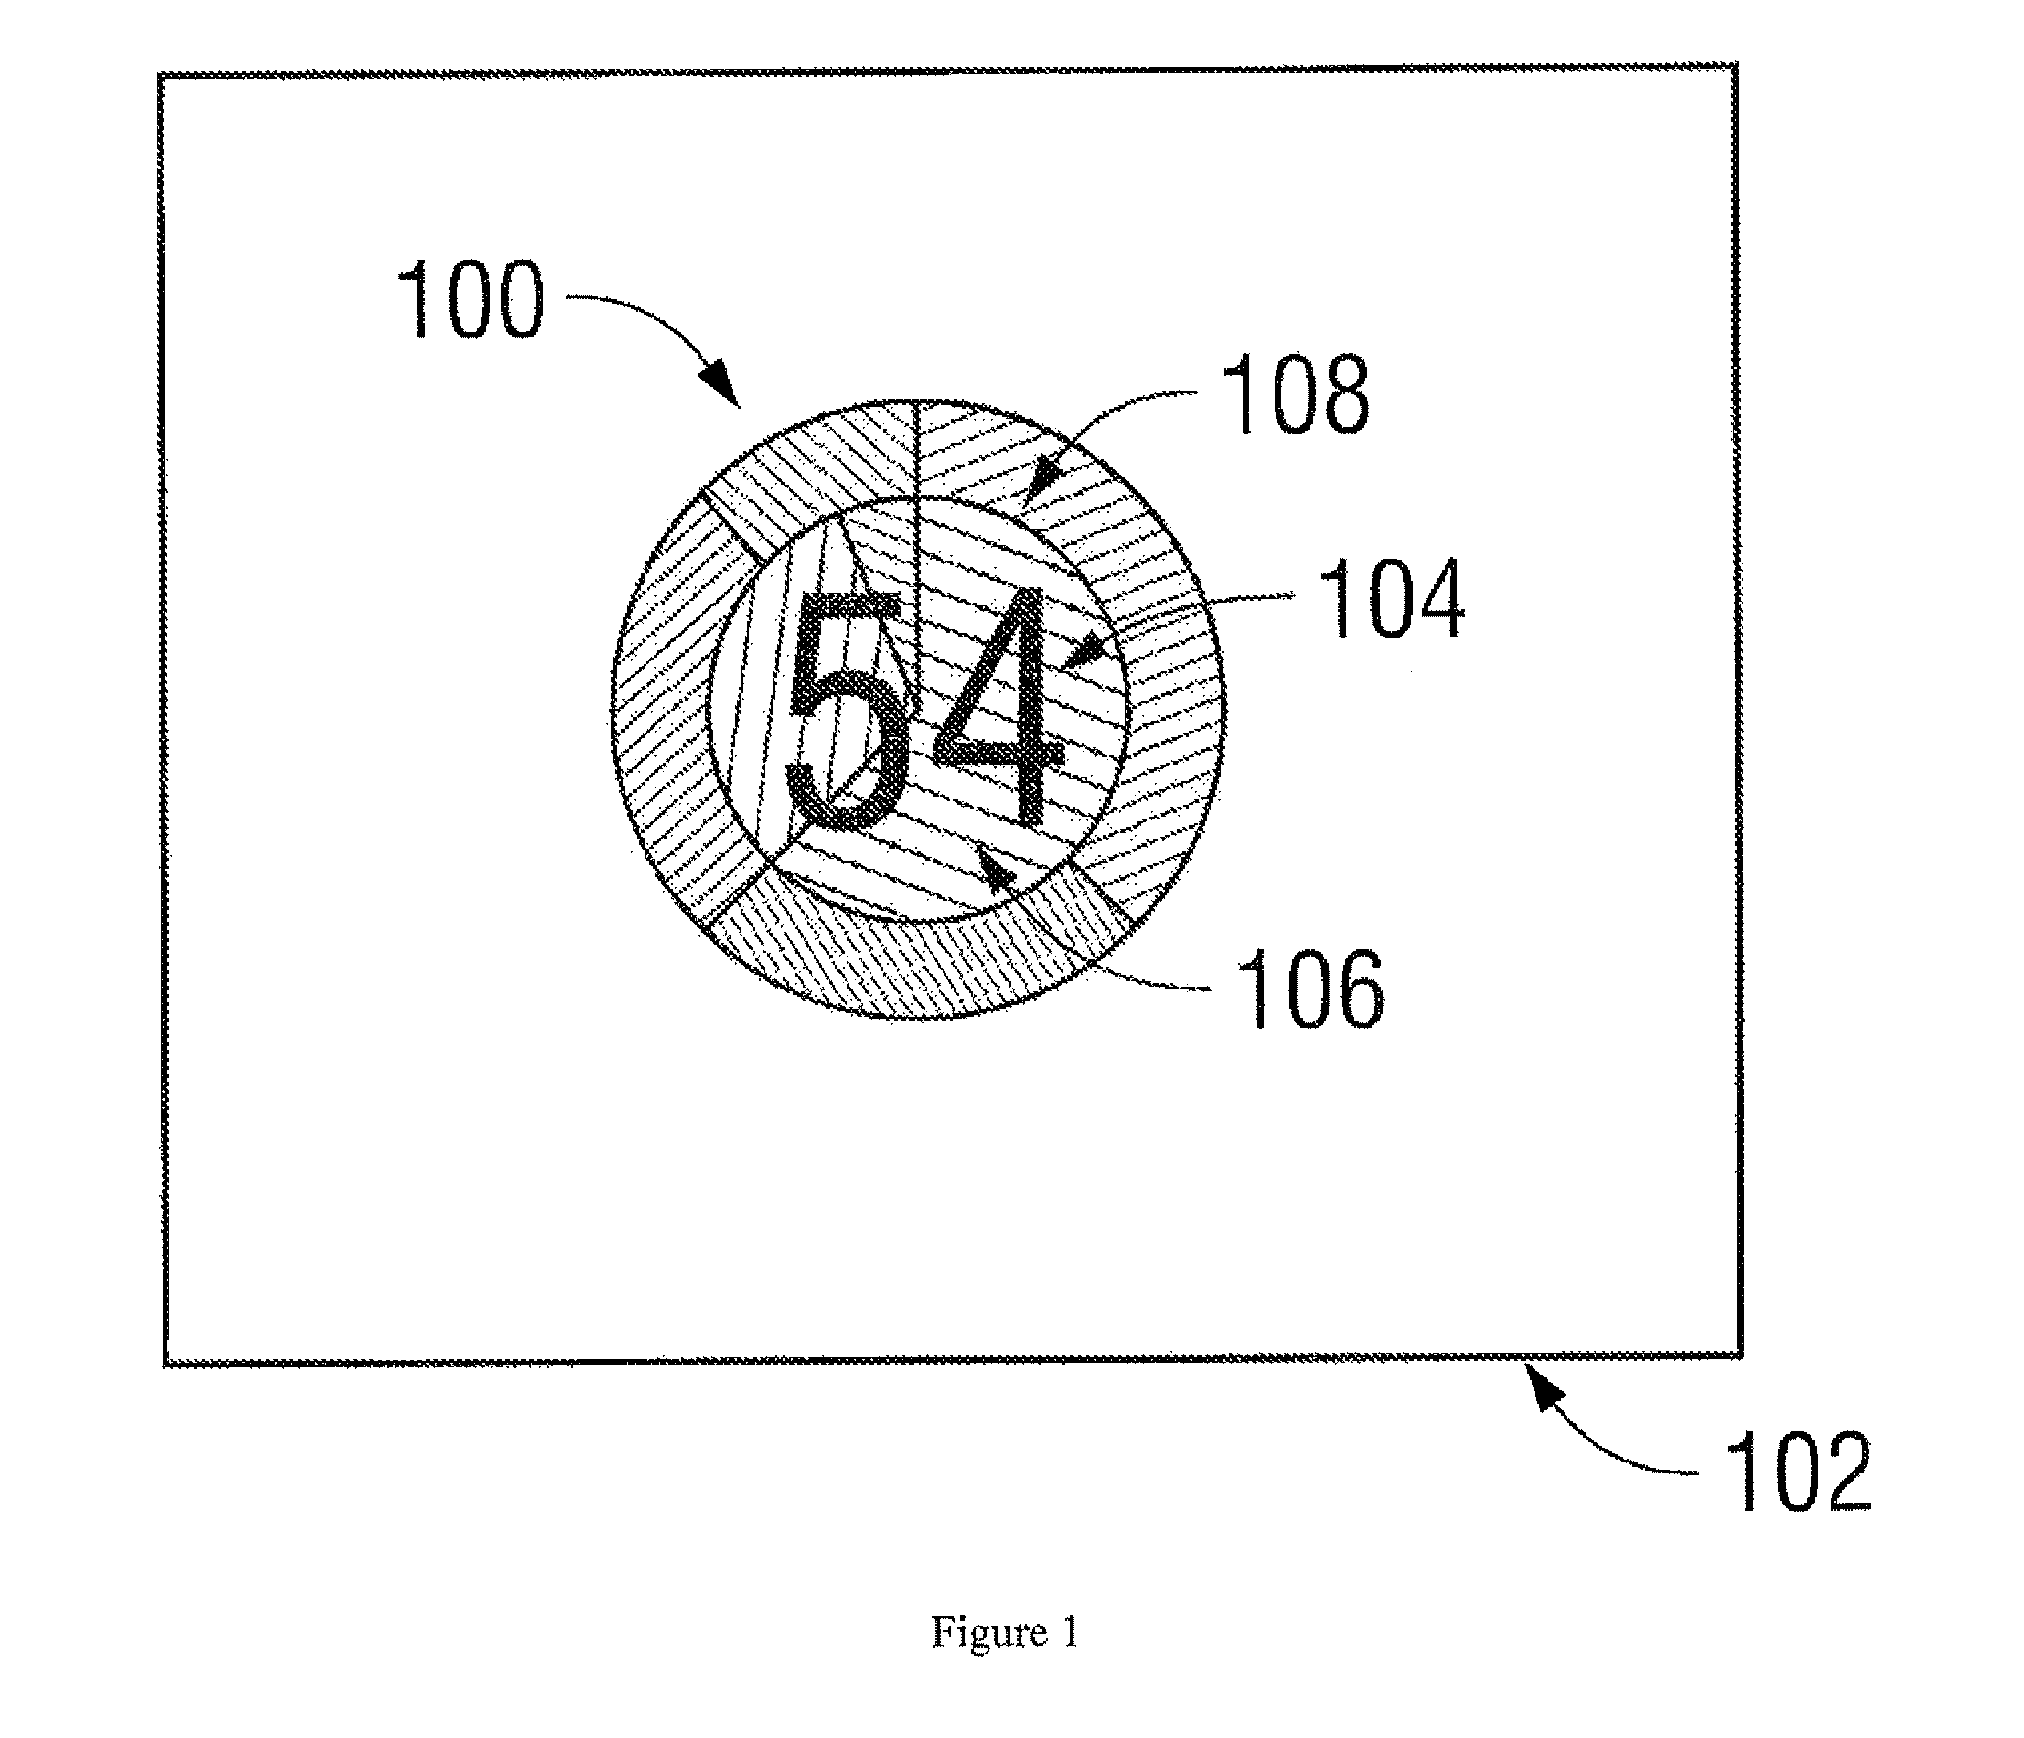
FIG. 1 depicts a cluster of assets, according to an embodiment.
FIG. 2 depicts a geographical map comprising a plurality of clusters, according to an embodiment.
FIG. 3 depicts additional informational features available to the user of the system, according to one embodiment.
FIG. 4 depicts informational features available to the user of the system when a cluster contains a large number of assets, according to an embodiment.
FIG. 5 illustrates a scrollable list of a cluster's assets, according to an embodiment.
FIGS. 6A and 6B illustrate the function of clusters with reference to a specific geographical location, according to an embodiment.
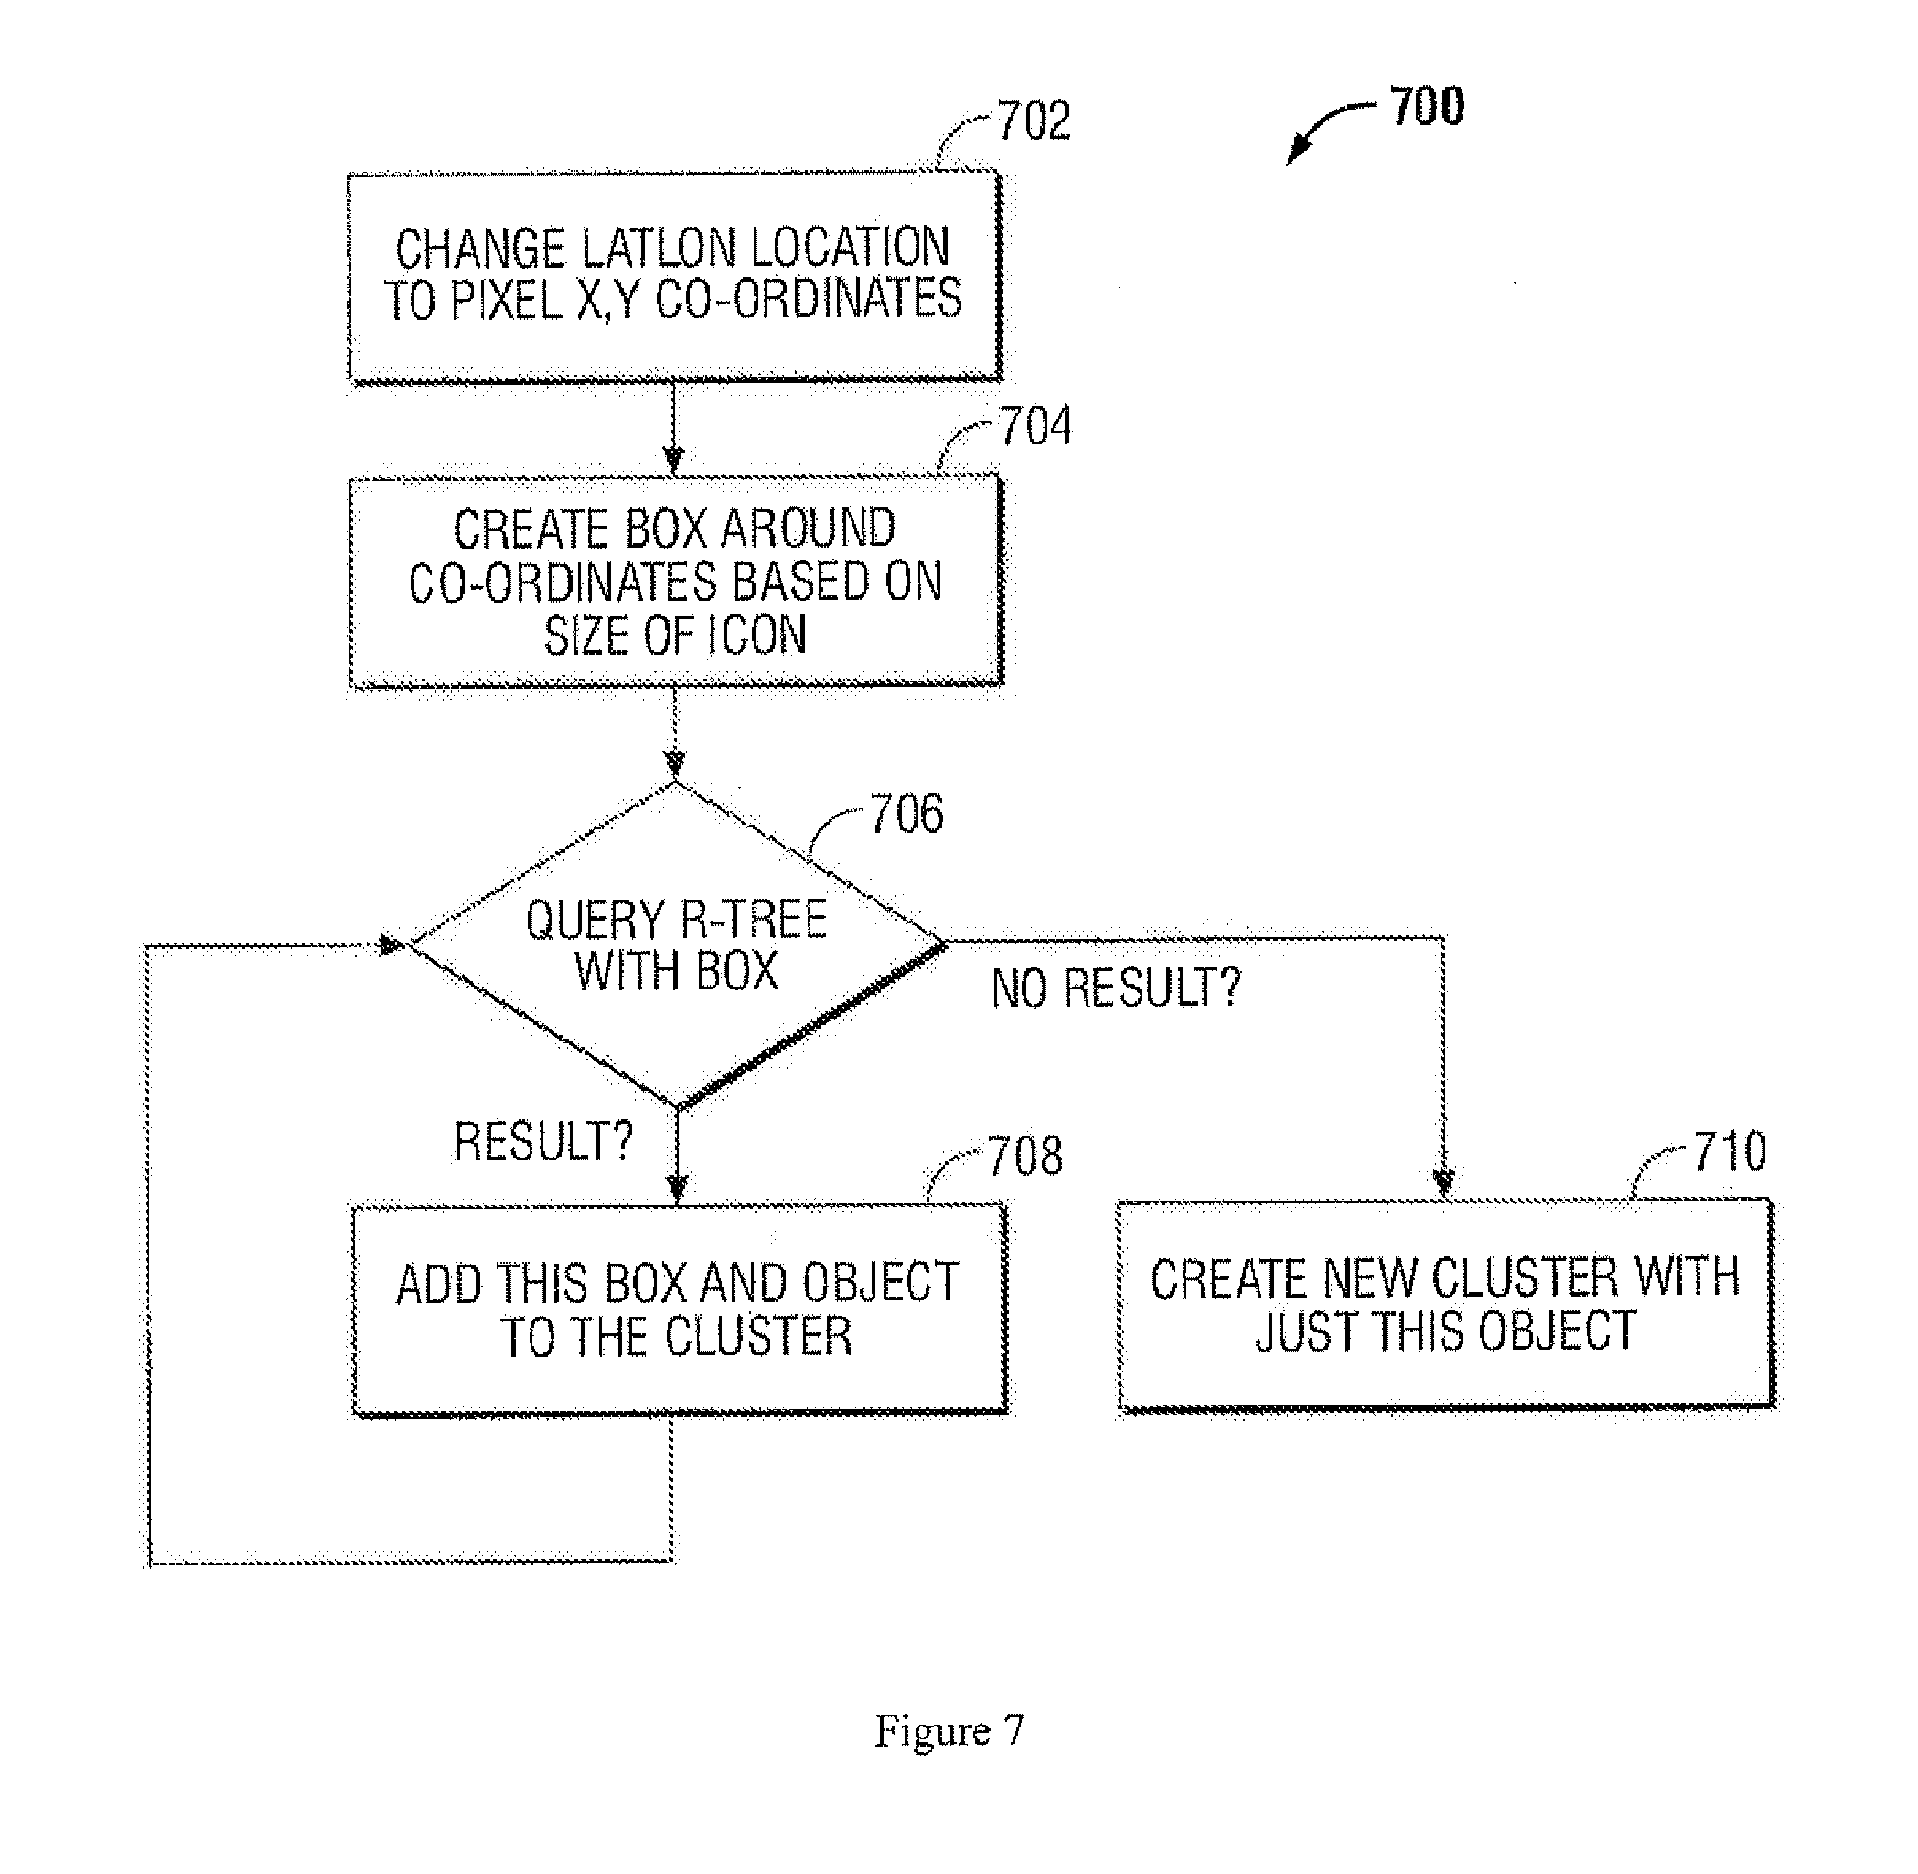
FIG. 7 illustrates is a flow chart describing the creation of a cluster, according to an embodiment.
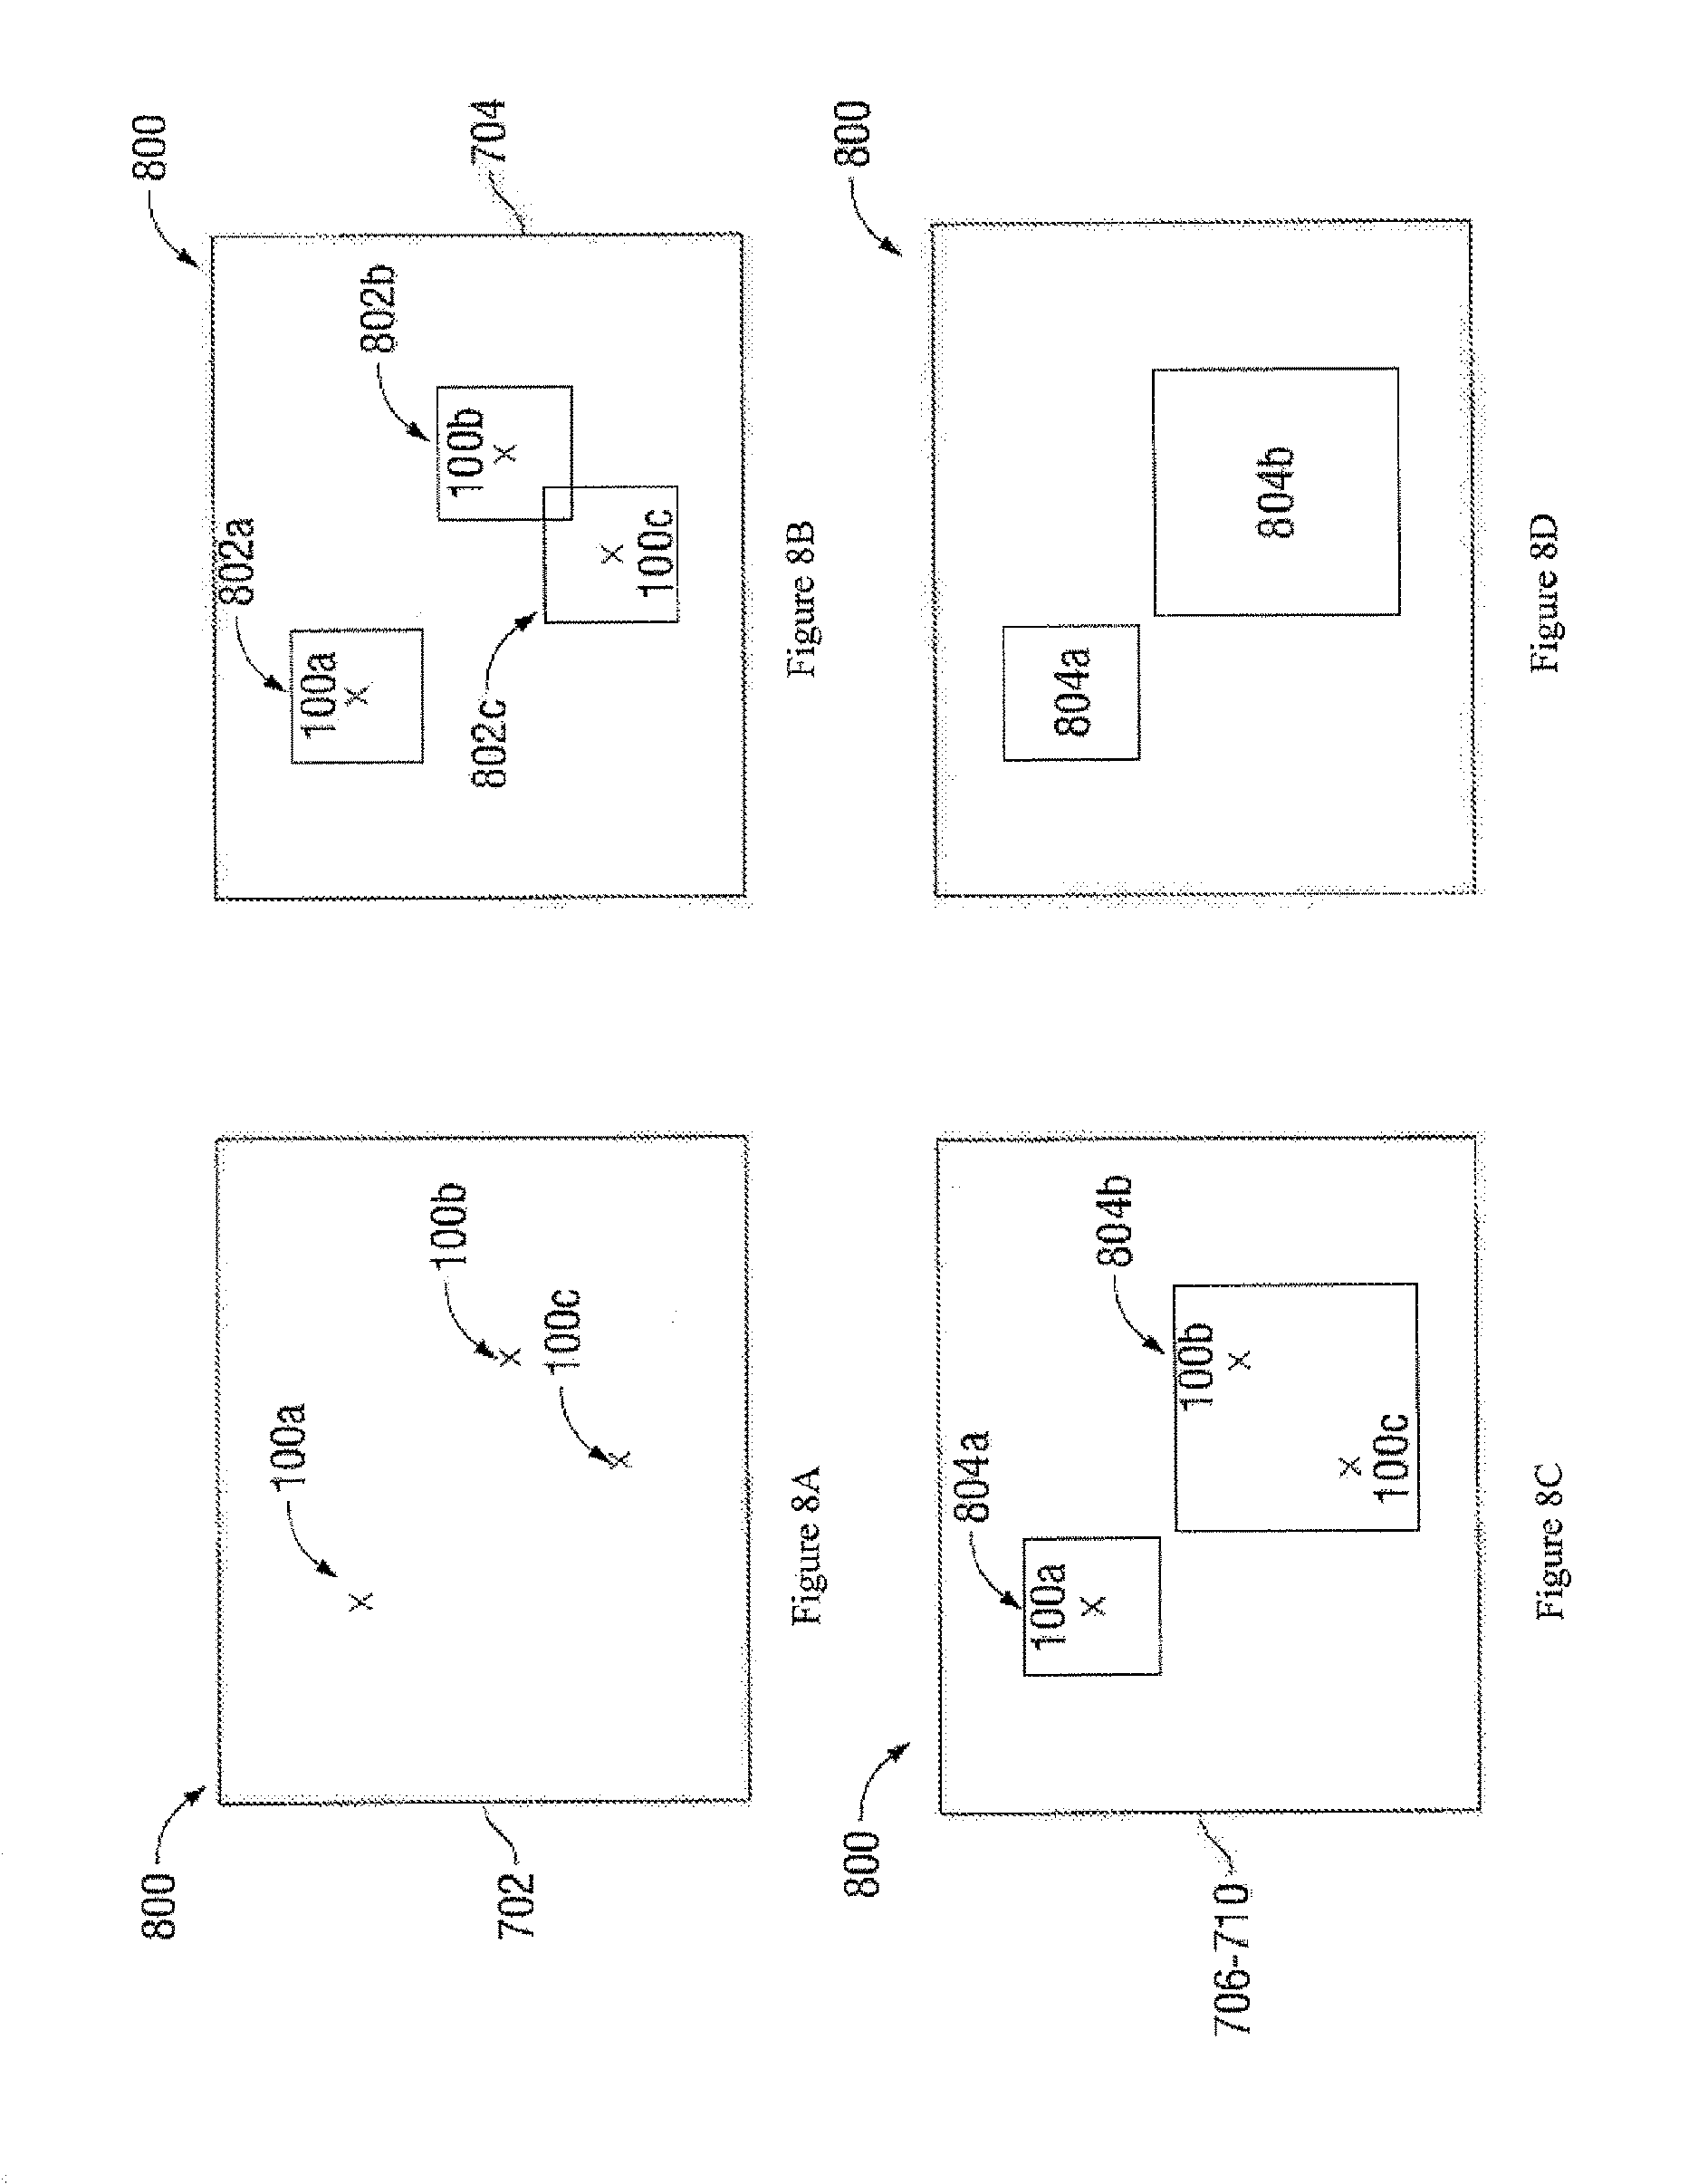
FIGS. 8A through 8D depict a graphical example of the steps carried out in FIG. 7, according to an embodiment.
FIGS. 9A, 9B, and 9C depict a process for splitting a cluster, according to an embodiment.
FIG. 10 illustrates items being moved from odd slots to even slots during the splitting process, according to an embodiment.
FIG. 11 depicts a sample cluster with reference to a display screen that is to be split, according to an embodiment.
FIG. 12 depicts the location of a cluster's items with reference to a display screen, according to an embodiment.
FIG. 13 illustrates a cluster being split, according to an embodiment.
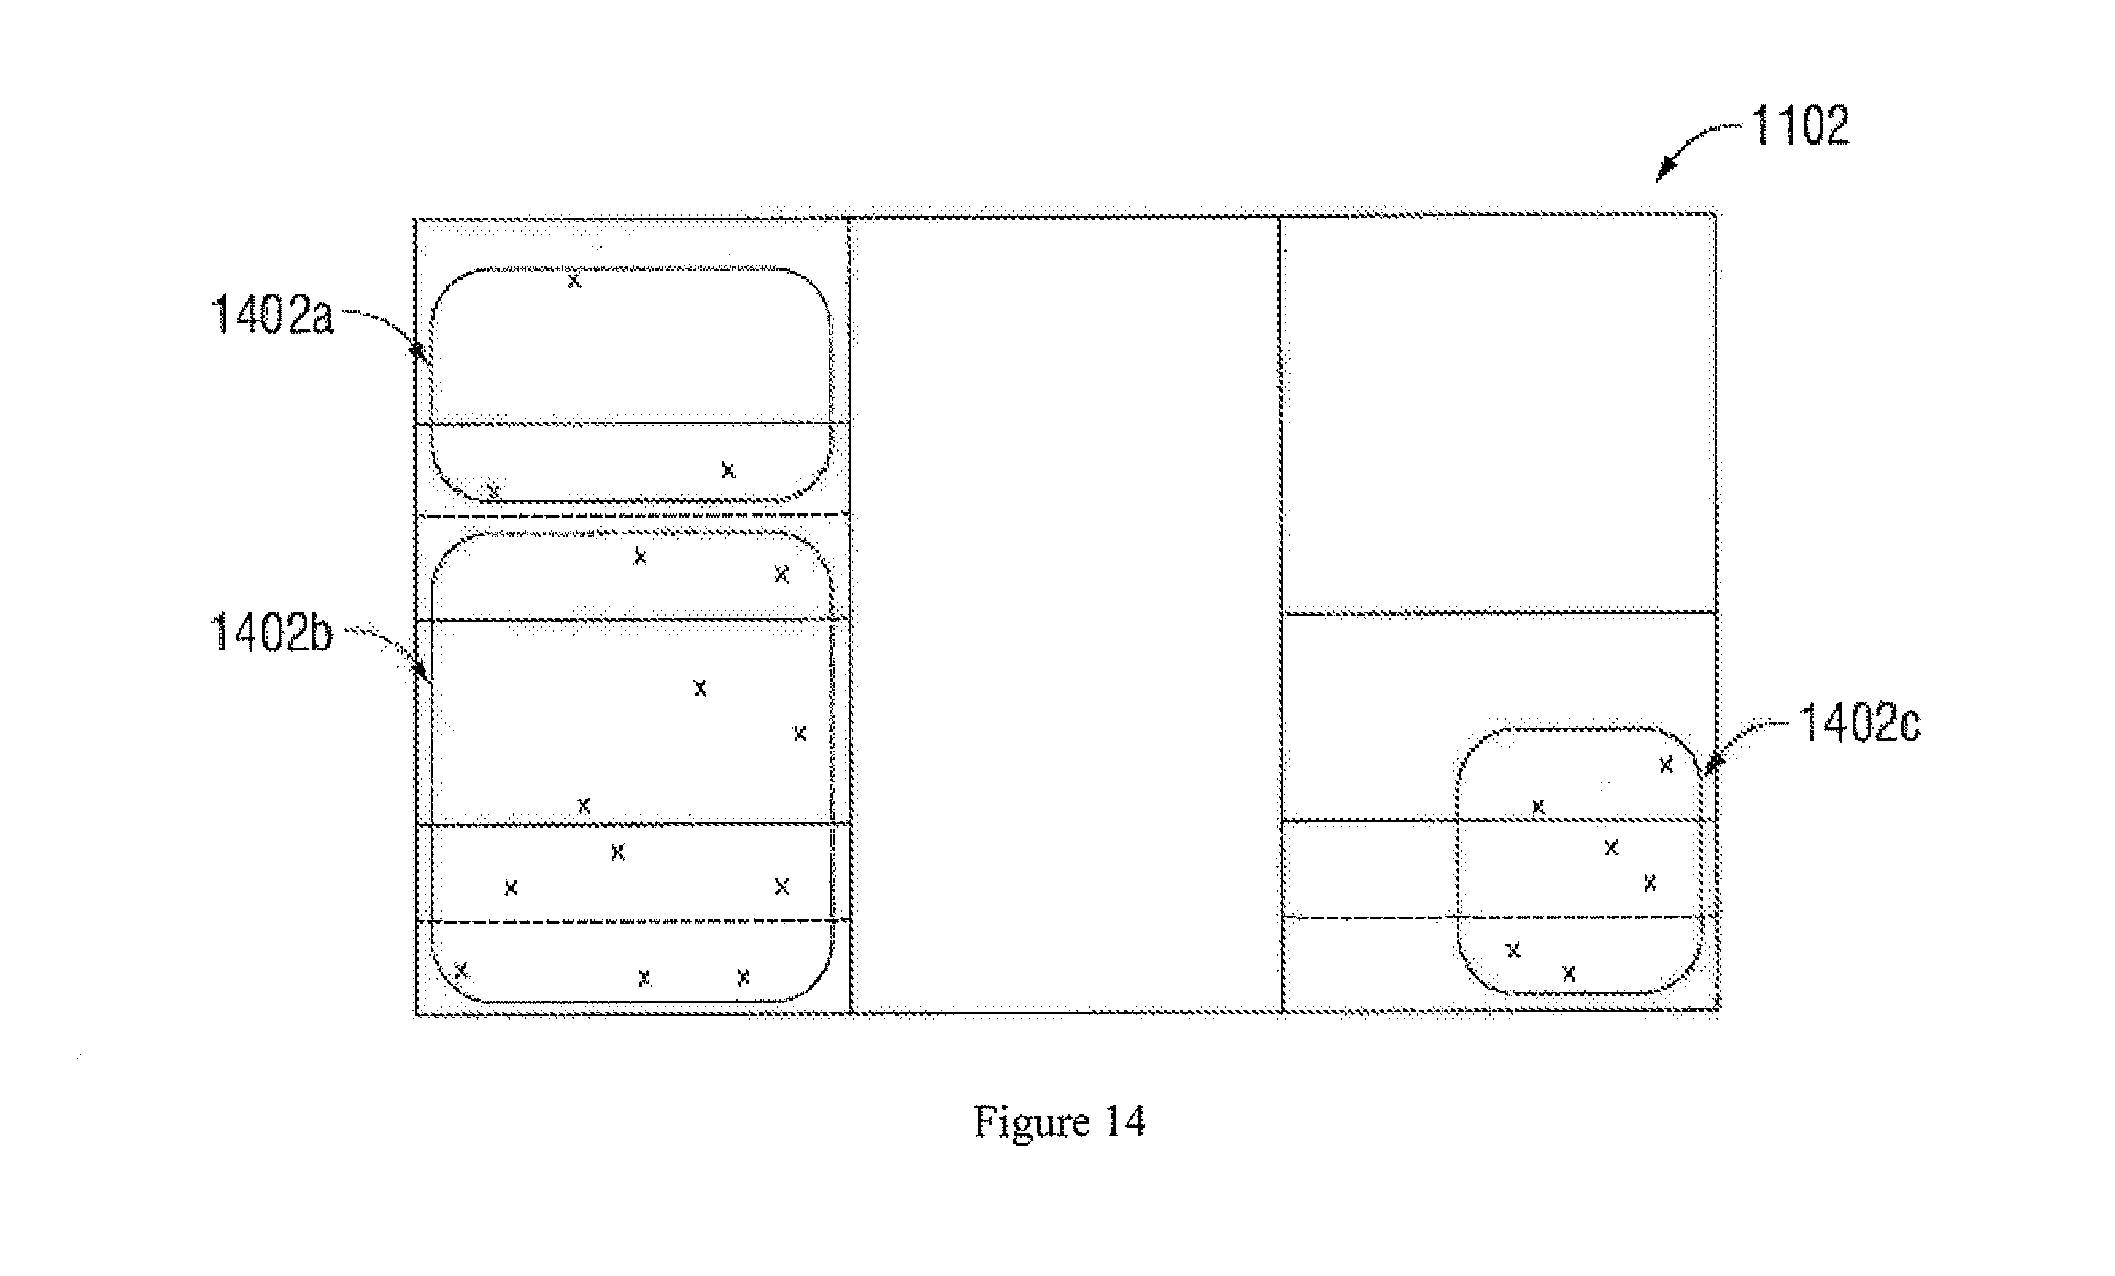
FIG. 14 shows the creation of new clusters from a single prior cluster, according to an embodiment.
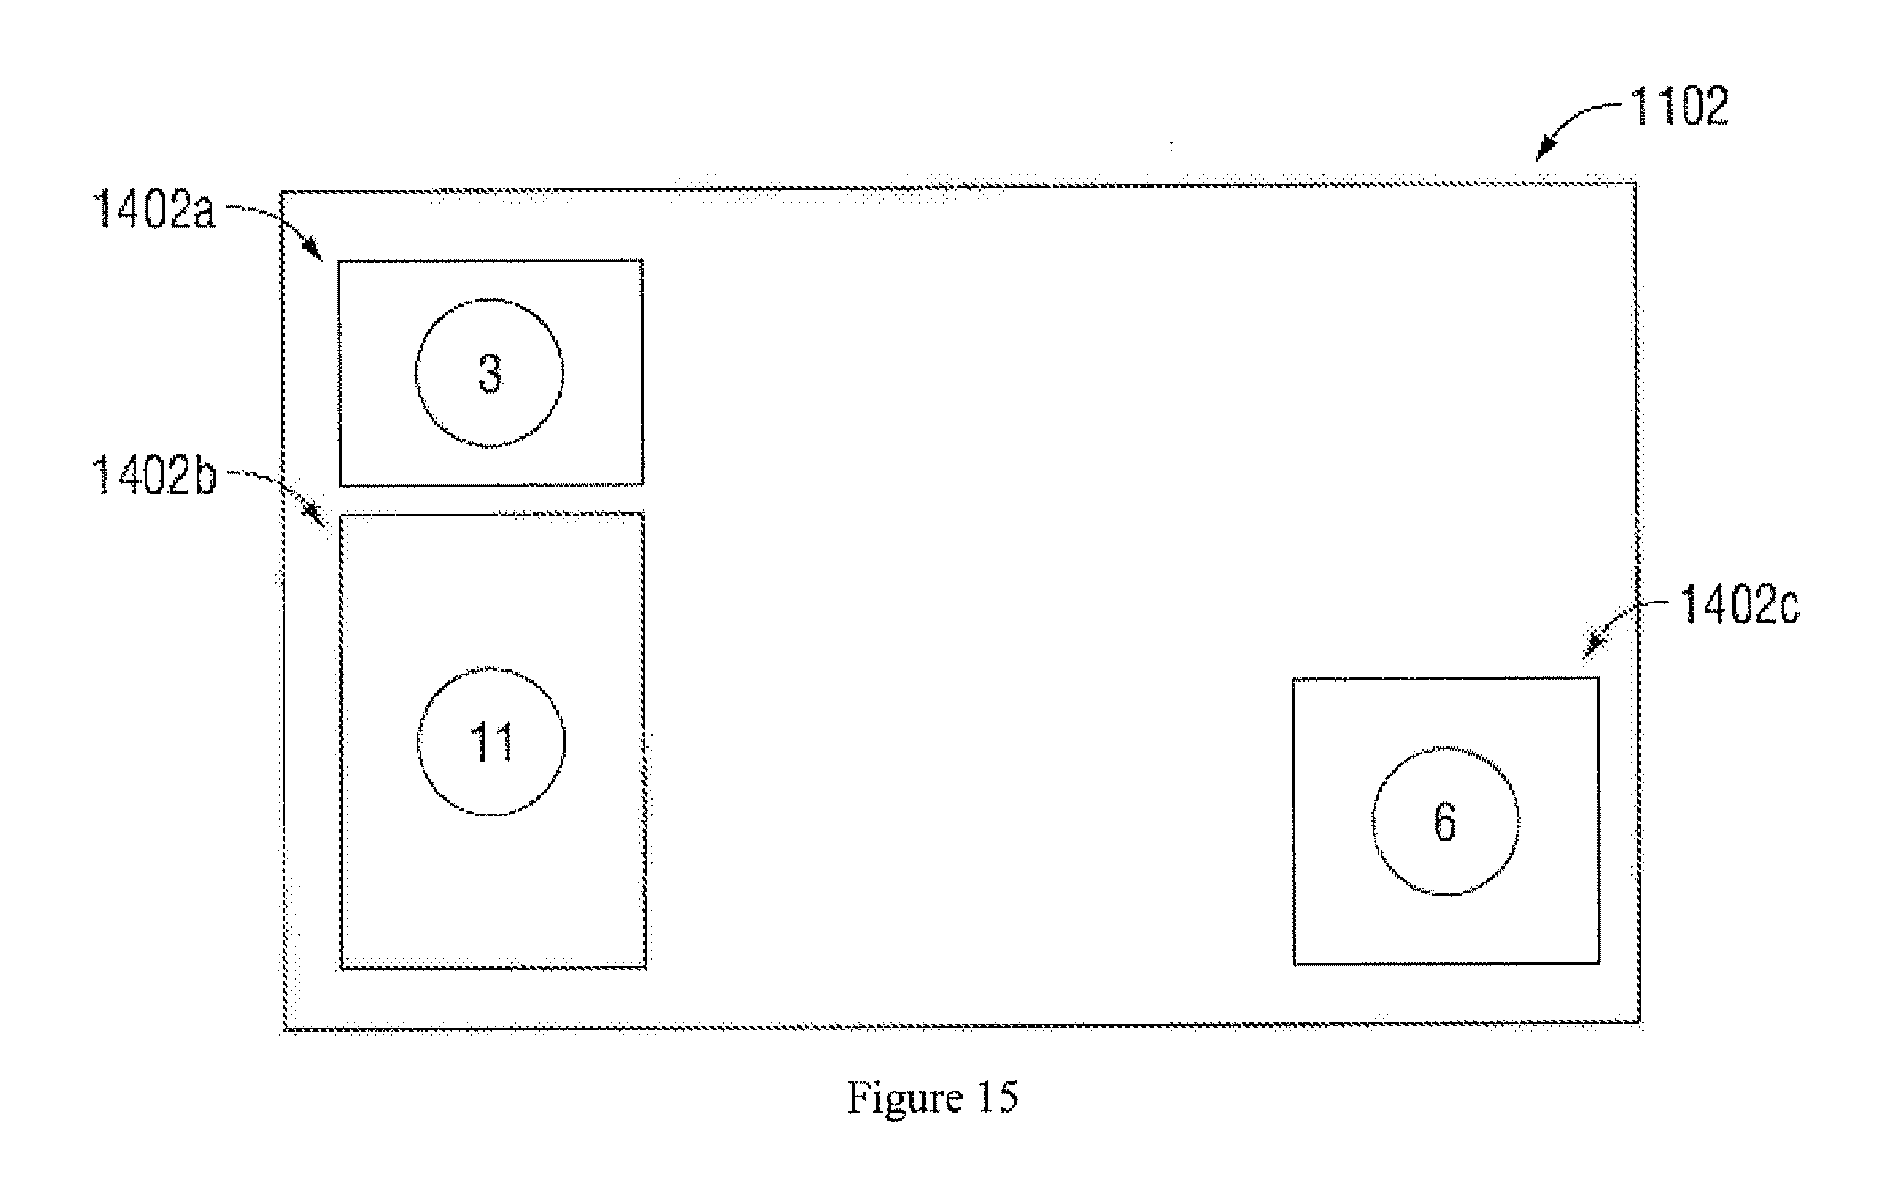
FIG. 15 illustrates three new clusters after completion of the splitting process, according to an embodiment.
FIG. 16 depicts an overall system diagram of components and devices used in connection with embodiments.
Corresponding reference characters indicate corresponding components throughout the several views of the drawings. Skilled artisans will appreciate that elements in the figures are illustrated for simplicity and clarity and have not necessarily been drawn to scale. For example, the dimensions, sizing, and/or relative placement of some of the elements in the figures may be exaggerated relative to other elements to help to improve understanding of various embodiments of the present invention. Also, common but well-understood elements that are useful or necessary in a commercially feasible embodiment are often not depicted in order to facilitate a less obstructed view of these various embodiments of the present invention. It will also be understood that the terms and expressions used herein have the ordinary meaning as is usually accorded to such terms and expressions by those skilled in the corresponding respective areas of inquiry and study except where other specific meanings have otherwise been set forth herein.
DETAILED DESCRIPTION OF THE DRAWINGS
Further features and advantages of the present embodiments, as well as the structure and operation of the various embodiments, are described in detail below with reference to the accompanying FIGS. 1-16. The embodiments are described in the context of a system for displaying clusters of tracked vehicles on a map. Nonetheless, one of ordinary skill in the art readily recognizes that these embodiments are applicable in numerous fields and contexts which require the display of multiple disparate pieces of information in a useful manner, and particularly with respect information with geographical or special components, such as real estate information, package or delivery information, communications information, etc.
Referring now to FIG. 1, depicted is a cluster 100. The cluster 100 provides information about underlying assets in a specific geographical or spatial location, defined by a bounding area 102. The cluster 100, in some embodiments, comprises a numerical value 104 and an inner chart 106. In some embodiments, the cluster 100 comprises an outer chart 108, or additional charts or graphical information (not depicted). For example, if the assets are vehicles, then the numerical value 104 displays the number of vehicles within the cluster 100, and the charts 106 and 108 provide detailed class and status information about those vehicles. Inner chart 106, for example, contains color coded class information for each asset in the cluster 100. For example, in the context of vehicles, the vehicles may be classified as semi-trucks, pickups, mobile cranes, cars, or other type of vehicle, each with a unique color. Inner chart 106 will therefore display a color coded pie chart representing the percentage of vehicles in the cluster 100 that make up each class. Outer chart 108, for example, depicts color coded status information for each asset in the cluster 100. For example, in the context of vehicles, the vehicles may be moving, stopped, idle, out of contact, or have another status depending upon the specific application. Outer chart 108 will therefore display a color coded pie chart representing the percentage of vehicles in the cluster 100 with each given status. The specific class and status information to be depicted by the charts 106 and 108, as well as the colors assigned to such information, are configurable by the user of the system using known methods. Furthermore, the size, shape, and configuration of the cluster 100 is also modifiable. For instance, in some embodiments, clusters are given different shapes to indicate that the clusters pertain to different types of assets or different types of information. For example, a first cluster may be round, indicating it pertains to vehicles, and a second cluster may be square, indicating it pertains to jobs to be performed during a day. As the jobs are completed, the colored status information for the cluster changes, reflecting the progress made on the job. In some embodiments, the corners of a square or other angular cluster changes colors. For ease of understanding only, the present application generally depicts clusters herein as circles or squares, with circular inner and outer charts.
The information in the cluster 100 is, in some embodiments, updated in real time. For example, as a vehicle leaves or enters the bounding area 102, the numerical value 104 and charts 106 and 108 are updated accordingly. If the status of an asset changes, the outer chart 108 likewise is updated. Such real-time updates are configurable by the user of the system and may be dependant on the communication systems of the assets. For instance, a user of the system may only desire updates once every five minutes. Alternatively, an asset may be programmed to only provide its location and other status information once every thirty seconds, or only when its status or location changes. Those of ordinary skill in the art will therefore recognize the information displayed by the cluster 100 may, in some embodiments, be delayed based on these contingencies or preferences. Alternatively, the updating of information can be done, for example, when the map is resized.
In some embodiments, not all assets in a specific bounding area 102 are included in the cluster 100. For instance, the cluster 100 may only comprise assets of a certain type, such as only vehicles. In other embodiments, the cluster 100 may only comprise assets owned by a specific entity, such as a single rental car company. The specific assets that are included in a cluster 100 may be selected based on numerous attributes, such as the asset's status, class, physical attributes, type, ownership information, etc. In some embodiments (not shown), the bounding area 102 comprises more than one cluster. Each of clusters may comprise assets that, but for the preferences of the user specified to the system, would be included in the same cluster, or assets that, due to different attributes, belong in different clusters. For the sake of clarity, the following discussion only discusses a single cluster 100 being within a single bounding area 102. The bounding area 102, as shown, is a square or rectangle, but other shapes, such as polygons, circles, triangles, or other regular or irregular shapes or any combination thereof, are used in other embodiments. Furthermore, in some embodiments, the bounding area 102 may have different colors or levels of opacity. By altering the alpha channel value (the opacity) and/or the color of the bounding area 102, additional information can be displayed pertaining to each bounding area 102 displayed on a map, such as which bounding area 102 contains more assets.
Referring now to FIG. 2, depicted is a geographical map 200 comprising a plurality of clusters 100a-n, according to an embodiment. As depicted, the map 200 displays the entire continental United States. Because of the high-level of the map 200, each cluster 100 and its corresponding bounding area 102a-n covers a large area of the United States, and therefore includes a relatively large number of assets. For instance, cluster 100a, whose bounding box 102a encompasses Los Angeles, contains over four-thousand, five-hundred assets. In other embodiments, however, a large area can encompasses only a small number of assets.
Referring now to FIG. 3, depicted are additional informational features available to the user of the system, according to one embodiment. As depicted, when a user selects a cluster 100, such as when a user points his or her mouse over the cluster 100, clicks on the cluster 100, uses a touch screen to select the cluster 100 or otherwise selects or interacts with the cluster 100, the system provides the user with certain information pertaining to the assets in the cluster 100. For instance, depicted is a pop-up box 300 with detailed asset information for each asset in the cluster 100. The pop-up box 300 displays, for example, the name, status, and class of each asset in the cluster 100, and provides the option for the user to look at the history for each asset by clicking the "Today" or "Yesterday" links. In some embodiments, scaled icons representative of the assets are depicted on the map to provide visual identification to the user where the assets are. In some embodiments, the user can also click on each asset in the pop-up box 300 to be directed to the specific location of the asset on the map. The embodiment discussed with reference to FIG. 3 is useful for clusters 100 with a few assets, such as, for example, four or fewer assets, but may provide too much detailed information when a cluster has a many assets.
Referring now to FIG. 4, depicted are additional informational features available to the user of the system when a cluster 100 contains a large number of assets, according to an embodiment. As depicted, when a user selects a cluster 100, the system provides the user with pop-up box 400 displaying certain high level information pertaining to the assets in the cluster 100, such as general status and category information about the assets. In some embodiments, the cluster 100 further displays a "+" sign or similar notation 402, signifying even more information pertaining to the assets in the cluster 100 is available. Referring now to FIG. 5, when the user clicks the "+" sign 402, in one embodiment, a scrollable list 502 of the cluster's assets is displayed to the user in the pop-up box 400. The user can select an asset from the scrollable list 502, the detailed information of which is thereafter displayed pop-up box 400 in a similar manner to that depicted in FIG. 3. In this manner, detailed information pertaining to each asset in the cluster 100 is available to the user, even when the cluster 100 has a large number of assets.
Referring now to FIGS. 6a and 6b, the function of clusters with reference to a specific geographical location, according to an embodiment, is now discussed in more detail. Depicted in FIG. 6a is a cluster 600 with a bounding area 602 encompassing much of Eureka, Calif. As is apparent, the cluster 600 comprises 34 assets. When a user zooms in on the cluster 600, as depicted in FIG. 6b, cluster 600 is replaced with four new clusters 604-610. Collectively, the new clusters 604-610 comprise the same assets as cluster 600. New clusters 604-610, however, are more accurately positioned on the map to reflect the location of their underlying assets. Thus, as depicted in FIG. 6b, a user can see there are 3 assets in Fortuna, and 2 assets in McKinleyville, with the remaining assets located near Eureka and Fields Landing. If a user zooms in to the point where it is useful to display individual assets, a cluster is replaced with the accurate real-time location of each asset within the cluster. Alternatively, in some embodiments, a user can click one of the clusters 604-610 to display the location of each of its assets. If a user zooms out of a specific area, such as zooming out from FIG. 6b to FIG. 6a, or from FIG. 6a to FIG. 2, the clusters are combined and become more general and less tied to a specific spatial location. Thus, the rendering and re-rendering of maps and their respective clusters is hierarchical.
In some embodiments, the structure of assets and clusters can be thought of as follows:
(a) Asset CLASS STATUS ATTRIBUTES
(b) Point CO RISING: Assets LOCATION (longitude, latitude)
(c) Zone CO RISING: Points
(d) Area CO RISING: Zones
(e) Regions CO RISING: Areas and so on, through higher levels of clusters.
The manner in which the system clusters assets (or clusters) and splits clusters as discussed above is now described in more detail, according to an embodiment. Referring to FIG. 7, depicted is a flow chart 700 describing in detail the creation of a cluster. First, at step 702, the latitudinal and longitudinal coordinates of the item to be clustered (either an asset or a cluster) are determined, and, using standard reprojection techniques, are converted to x and y pixel coordinates based on the user's display. Next, in step 704, a box (or other shape) is created around the x and y coordinates indicative of the size of the item's icon size. For instance, in some embodiments, the icon a user sees for a cluster is 30 pixels by 30 pixels. Thus, in step 704, a 30.times.30 pixel box is placed around the determined x and y coordinates for such cluster. In step 706, an .R-Tree, a well-known data structure familiar to those with skill in the art, is queried with the box to determine whether the box is already in the system. As shown in outcome 708, if the box is already part of an existing cluster in the system, the box and its item is added to that cluster. Otherwise, as shown in outcome 710, the box and its item are added as a new cluster. The forgoing process repeats for each item to be clustered. While the embodiments are described herein with reference to an R-Tree, those of ordinary skill in the art will recognize other types of trees and data structures may be used to implement other embodiments, and that the type and configuration of such data structures will depend, for example, on the specific application and functionality desired.
Referring now to FIGS. 8a-d, depicted is a graphical example of the steps carried out in the flow chart 700, according to an embodiment. As shown in FIG. 8a, and as described with reference to step 702, assets 100a-100c with real world latitudes and longitudes are reprojected to x and y pixel coordinates based on a user's display 800. In FIG. 5b, and in accordance with step 704, a box or other icon shape 802a-c is created around each asset 100a-c. In accordance with steps 706-710, each box 802a-c is then used to query the R-Tree. The R-Tree is first queried with box 802a. Since the R-Tree is empty, the R-Tree will not return a result, and box 802a is added to the R-Tree as a new cluster 804a, as shown in FIG. 8c. The R-Tree is next queried with box 802b. As depicted in FIG. 8b, since there is no overlap between box 802a (which is already in the R-Tree) and box 802b, the R-Tree again will not return a result, and box 802b is added to the R-Tree as a new cluster 804b. The R-Tree is next queried with box 802c. As shown in FIG. 8b, there is overlap between box 802b and 802c. The R-Tree will therefore return cluster 804b as a result, and box 802c is added that cluster, as shown in FIG. 8c. As shown in FIG. 8c, cluster 804b expands to comprise boxes 802b and 802c. As a result of the foregoing steps, the two clusters 804a-b are depicted to the user, with the underlying boxes and asset information are no longer displayed, as shown in FIG. 8d.
In some embodiments, the method described with reference to FIGS. 7 and 8 may produce clusters with too many items (either too many assets or other clusters). In order to make the clusters that have been created more usable, the clusters are thereafter split into smaller, more usable clusters. By splitting clusters, the information contained in the clusters is, in some embodiments, more evenly distributed across the user's screen view.
In some embodiments, clusters are split if they are either horizontally or vertically larger than a defined variable M (cluster maximum size). This variable, for example, is based on the resolution of the user's screen and on the size of typically icons used with the system. On a standard screen using icons of 32 pixels wide, M is, in some embodiments, set at 100 pixels. Those of ordinary skill in the art will recognize that other values for M may be optimal, depending on the user's screen's resolution and size, the size of the icons used in connection with the system, or other variables.
If a cluster is to be split, then the cluster is split both horizontally and vertically. Vertical and horizontal maximum pixel values for the new clusters are, in some embodiments, based on the following formulas: Y.sub.split=M-2(ICON.sub.width) X.sub.split=Y.sub.split/2+Y.sub.split Where Y.sub.split is the maximum horizontal pixel value and X.sub.split is the maximum vertical pixel value, and ICON.sub.width is the width, in pixels, of the asset or cluster icons. The foregoing formulas take into account the dimensions of the icons to ensure clusters will not overlap on a user's screen. Based on the foregoing, where M is set to 100 pixels and the icons are 32 pixels, each new cluster must be less than 54 pixels wide, and must be less than 36 pixels tall.
Referring now to FIGS. 9A, 9B, and 9C, depicted is a process for splitting a cluster 900 according to an embodiment. For example, given a cluster with a width of 132 pixels wide, the cluster is first split horizontally in step 902 into the minimum number of sections for which each section is less than X.sub.split (54 pixels) wide. The cluster is therefore first divided into three sections, each with a width of 44 pixels. As shown in step 904, each section obtained in step 902 is then split horizontally into sections less than Y.sub.split (36 pixels) tall. As a result, the original cluster 900 is, divided into 12 slots 906a-l, each with dimensions of 44 pixels by 30 pixels. In step 906, the new clusters are created. In some embodiments, the even numbered slots are retained (i.e. slots 908a, 908e, 908e, 908g, 908i, and 908k), while the odd numbered slots are discarded. Any items in the odd numbered slots are moved one slot up (i.e. items in slot 908b are moved to slot 908a, and so on). The retained slots become the new clusters.
Referring now to FIG. 10, depicted is an example of items being moved from odd slots 908b and 908d to even slots 908a and 908c, according to an embodiment. As depicted, the odd slots 908b and 908d are divided in half horizontally, as shown with the dotted lines 1002a and 1002b. Items in the odd numbered slots 908b and 908d that are above their respective dotted lines 1002a and 1002b are moved to the even numbered slots above, while items in the odd numbered slots 908b and 908d that are below their respective dotted lines 1002a and 1002b are moved to the even numbered slots below. Where, as in the case of slot 908d, there is no even numbered slot below the odd numbered slot, all of the items in the odd numbered slot are moved to the even numbered slot above. Thus, as depicted, all of the items in odd slot 908d are moved to even slot 908c.
Referring now to FIG. 11, depicted is a sample cluster 1100, with reference to a display screen 1102, that is to be split, according to an embodiment. As is apparent, cluster 1100 comprises 20 items (either assets or smaller clusters). As shown in FIG. 12, the cluster's items (indicated by Xs in the screen 1102) are located near both vertical edges of the screen 1102. As shown in FIG. 13, cluster 1100 (not shown) is split according to the embodiments discussed above with reference to FIGS. 9 and 10. The items in odd slots (1302b, 1302d, and 1302f) are moved to the even slots 1302a, 1302c, and 1302e. As shown in FIG. 14, three resulting new clusters 1402a-e are created. The final result, as shown in FIG. 15, are new clusters 1402a-e shown to the user in place of the old cluster, while the underlying items in the clusters 1402a-c are hidden from view.
Referring now to FIG. 16, depicted is an overall system diagram 1600 of components and devices used in connection with the forgoing systems and methods, according to an embodiment. Each asset (not shown) comprises a communication device 1602a-c. For instance, a vehicle may have a small transceiver device installed in its cabin, or an individual may carry a smartphone or similar device with location determination capabilities. Such devices 1602a-c may utilize, for example, GPS, inertial (gyro) systems, or cellular network based technologies, such as triangulation, to determine the latitude and longitude information for the asset.
Location, status, alarm, class, speed, and other types of pertinent information pertaining to a devices' asset may be provided by the devices 1602a-c to a central processing system 1604. In some embodiments, the devices 1602a-e communicate such information in real time. In other embodiments, such information is transmitted periodically, at random intervals, or on an alarm condition. Such transmissions are made, in some embodiments, via a wireless or satellite based communication system and/or over the internet or similar wide area network 1606, to the central processing system 1604.
The central processing system 1604, in some embodiments, comprises one or more web servers 1608 in communication with one or more databases 1610. The web servers 1608 may, in some embodiments, have high performance or computer clustering capabilities. The central processing system 1604, operates, in some embodiments, as follows: Information received by the devices 1602a-c is stored in the databases 1610. The web servers 1608 receive update requests from a client 1612a-c via the Internet or similar wide area network 1614 The central processing system 1604 accesses pertinent information from the database 1610 and performs the clustering and map delivery processes discussed above in response to received requests, and The web servers 1604 transmit the resulting data to the client 1612a-c via the network 1614.
In some embodiments, the central processing system 1604 utilizes distributed or cloud computing capabilities and/or technology. In some embodiments, the central processing system 1604 shares computing responsibilities with a requesting client 1612a-c. In other embodiments, the central processing system 1604 is responsible for all or substantially all of the computing responsibilities. A benefit of the foregoing arrangements, in some embodiments, is that the amount of data that needs to be transferred from the web server 1608 to the client 1612a-c is very small. In some embodiments, little, if any, of the underlying asset information is transferred to clients 1612a-c. In these embodiments, merely the high-level cluster information showing the aggregated asset information (e.g. charts, numerical value, and/or bounding area information, such as that discussed with reference to FIG. 1) is transferred to the clients 1612-a-c. These embodiments make it is possible to deal with a practically unlimited number of items, even when having a limited network capability and/or a hardware client 1612a-c with limited processing ability. Those of ordinary skill in the art will recognize that networks 1606 and 1614 may be the same or different networks. In some embodiments, both such networks will be the Internet. In other embodiments, networks 1606 and 1614 may comprise private and/or public networks.
A client 1612a-c may be, for example, a personal computer or a smart phone. In other embodiments, a client 1612a-c may itself be a server or central computer which is configured to transmit the information received by the central processing system 1640 to end-user clients (not shown). In some embodiments, the clients 1612a-c comprise a graphical user interface displayed in a browser window of a browser application. Such an arrangement permits an end user of a client 1612a-c to easily view the map, geographic information, cluster information, and the underlying asset data provided by the central processing system 1604. Thus, the system and its smart zooming capabilities can be utilized by any user with a client computing device capable of running a web browser and accessing a wide area network, such as the Internet.
In some embodiments, the graphical user interface is implemented using HTML, JavaScript, CSS, BON, and/or XML programming. Such programming may be AJAX compliant. In some embodiments, a dynamic HTML page or XML content is created by the central processing system 1604 in response to a request by a client 1612-a-c. Such interaction, in some embodiments, proceeds by the user of a client 1612a-c making XML API calls and/or Java Applet calls to the web server 1608 of the central processing system 1604. Using the techniques previously discussed, the central processing system 1604 generates clusters, asset information, and or other information requested by the user, and provides such content, along with the corresponding map data, to the client 1612-a-c. The graphical user interface of the browser window thereafter displays such content for viewing by a user.
The smart zoom system and its graphical user interface can be implemented using technologies other than those described. For instance, in one embodiment, the graphical user interface is implemented as an Adobe Flash object. In some embodiments, where the graphical user interface is implemented using Flash, the graphical user interface is embedded in an HTML page and executed by a Flash compatible plug-in for the browser application. The Flash object stores data files and/or communicates with the central processing system receive updated map, cluster, and asset information. In other embodiments, technologies such as Java, Java Applets, Synchronized Multimedia Integration Language (SMIL), or Microsoft Silverlight are used to implement the graphical user interface and to interact with the central processing system 1604. In other embodiments, the graphical user interface is executed by a standalone player external from the browser application or other specialized program used to access the central processing system 1604.
As is apparent, the described smart zoom clustering methods and systems allow diverse user tools and interfaces to permit any number of end user clients to visualize hundreds or thousands of assets and their real time location and status. By utilizing the forgoing smart zoom systems and methods, a vehicle fleet or other asset manager can quickly and easily determine the status of hundred of assets, identify problems with the assets, redeploy assets as needed, and make other managerial decisions in a manner not possible using other methods and systems.
A further embodiment is computer readable code or program instructions on one or more computer readable mediums capable of carrying out processes discussed above. A computer readable medium is any data storage device that is capable of storing data, or capable of permitting stored data to be read by a computer system. Examples include hard disk drives (HDDs), flash memory cards, such as CF cards, SD cards, MS cards, and xD cards, network attached storage (NAS), read-only memory (ROM), random-access memory (RAM), CD-ROMs, CD-Rs, CD-RWs, DVDs, DVD-Rs, DVD-RWs, holographic storage mediums, magnetic tapes and other optical and non-optical data storage devices. The computer readable medium can also be in distributed fashion over multiple computer systems or devices which are coupled or otherwise networked together and capable of presenting a single view to a user of the medium.
Yet another embodiment is a computer system or similar device configured to access computer readable code or program instructions from a computer readable medium and to execute program instructions using one or more CPUs to carry out embodiments as described. Such computer system can be, but is not limited to, a typical personal computer, microcomputers, a handheld device such as a cell phone, PDA, BlackBerry, or a more advanced system such as a computer cluster, distributed computer system, server accessed over wired or wireless devices, a mainframe, or a supercomputer. In another embodiment, the server(s) of the system are also stored in and accessed from the computer readable medium. In other embodiments, they are implemented using hardware.
In some embodiments, some or all of the content stored in the computer readable medium is transmitted via a similar network. In other embodiments, the central processing system generates signals or instructions based on the results of the program instructions and/or the contents of the computer readable medium.
In other embodiments, the foregoing systems and methods are applicable to environments other than those in two dimensions. For instance, three dimensional clusters, maps, bounding areas, and assets can be implemented using the same techniques and methods discussed above.
The invention has been described herein using specific embodiments for the purposes of illustration only. It will be readily apparent to one of ordinary skill in the art, however, that the principles of the invention can be embodied in other ways. Therefore, the invention should not be regarded as being limited in scope to the specific embodiments disclosed herein.
* * * * *
D00000
D00001
D00002
D00003
D00004
D00005
D00006
D00007
D00008
D00009
D00010
D00011
D00012

D00013

D00014
D00015
D00016

XML
uspto.report is an independent third-party trademark research tool that is not affiliated, endorsed, or sponsored by the United States Patent and Trademark Office (USPTO) or any other governmental organization. The information provided by uspto.report is based on publicly available data at the time of writing and is intended for informational purposes only.
While we strive to provide accurate and up-to-date information, we do not guarantee the accuracy, completeness, reliability, or suitability of the information displayed on this site. The use of this site is at your own risk. Any reliance you place on such information is therefore strictly at your own risk.
All official trademark data, including owner information, should be verified by visiting the official USPTO website at www.uspto.gov. This site is not intended to replace professional legal advice and should not be used as a substitute for consulting with a legal professional who is knowledgeable about trademark law.