Compositions, methods and kits for diagnosis of lung cancer
Kearney , et al.
U.S. patent number 10,338,074 [Application Number 15/051,153] was granted by the patent office on 2019-07-02 for compositions, methods and kits for diagnosis of lung cancer. This patent grant is currently assigned to Biodesix, Inc.. The grantee listed for this patent is Biodesix, Inc.. Invention is credited to Kenneth Charles Fang, Clive Hayward, Paul Edward Kearney, Xiao-Jun Li.


View All Diagrams
| United States Patent | 10,338,074 |
| Kearney , et al. | July 2, 2019 |
Compositions, methods and kits for diagnosis of lung cancer
Abstract
Methods are provided for identifying biomarker proteins that exhibit differential expression in subjects with a first lung condition versus healthy subjects or subjects with a second lung condition. Also provided are compositions comprising these biomarker proteins and methods of using these biomarker proteins or panels thereof to diagnose, classify, and monitor various lung conditions. The methods and compositions provided herein may be used to diagnose or classify a subject as having lung cancer or a non-cancerous condition, and to distinguish between different types of cancer (e.g., malignant versus benign, SCLC versus NSCLC).
| Inventors: | Kearney; Paul Edward (Seattle, WA), Fang; Kenneth Charles (San Francisco, CA), Li; Xiao-Jun (Bellevue, WA), Hayward; Clive (Seattle, WA) | ||||||||||
|---|---|---|---|---|---|---|---|---|---|---|---|
| Applicant: |
|
||||||||||
| Assignee: | Biodesix, Inc. (Boulder,
CO) |
||||||||||
| Family ID: | 49043054 | ||||||||||
| Appl. No.: | 15/051,153 | ||||||||||
| Filed: | February 23, 2016 |
Prior Publication Data
| Document Identifier | Publication Date | |
|---|---|---|
| US 20160169900 A1 | Jun 16, 2016 | |
Related U.S. Patent Documents
| Application Number | Filing Date | Patent Number | Issue Date | ||
|---|---|---|---|---|---|
| 13775494 | Feb 25, 2013 | 9304137 | |||
| 13724823 | Dec 21, 2012 | 9201044 | |||
| 61578712 | Dec 21, 2011 | ||||
| 61589920 | Jan 24, 2012 | ||||
| 61676859 | Jul 27, 2012 | ||||
| 61725153 | Nov 12, 2012 | ||||
| Current U.S. Class: | 1/1 |
| Current CPC Class: | G01N 33/57423 (20130101); G01N 33/6893 (20130101); G16B 40/00 (20190201); G16B 20/00 (20190201); G01N 33/6848 (20130101) |
| Current International Class: | G01N 33/574 (20060101); G01N 33/68 (20060101) |
References Cited [Referenced By]
U.S. Patent Documents
| 7183188 | February 2007 | Kronke et al. |
| 9201044 | December 2015 | Keamey et al. |
| 9297805 | March 2016 | Kearney et al. |
| 9304137 | April 2016 | Kearney et al. |
| 2006/0257857 | November 2006 | Keene et al. |
| 2007/0099251 | May 2007 | Zhang et al. |
| 2007/0111322 | May 2007 | Yang |
| 2007/0128598 | June 2007 | Boender |
| 2007/0202539 | August 2007 | Aebersold et al. |
| 2007/0269895 | November 2007 | Aebersold et al. |
| 2009/0176228 | July 2009 | Birse |
| 2009/0317392 | December 2009 | Nakamura et al. |
| 2010/0093108 | April 2010 | Khattar et al. |
| 2010/0184034 | July 2010 | Bankaitis-Davis et al. |
| 2010/0279382 | November 2010 | Aebersold et al. |
| 2012/0142558 | June 2012 | Li et al. |
| 2013/0230877 | September 2013 | Kearney |
| 2011527414 | Oct 2011 | JP | |||
| WO 2009/067546 | May 2009 | WO | |||
| WO 2010/030697 | Mar 2010 | WO | |||
| WO 11085163 | Jul 2011 | WO | |||
| WO 2012075042 | Jun 2012 | WO | |||
| WO 2013096845 | Jun 2013 | WO | |||
Other References
|
Wang et al., Cancer Biology and Therapy, 2009, 8:1083-1094. cited by examiner . Bouchal et al. "Biomarker Discovery in Low-Grade Breast Cancer Using Isobaric Stable Isotope Tags and Two-Dimensional Liquid Chromatography-Tandem Mass Spectrometry (iTRAQ-2DLC-MS/MS) Based Quantitative Proteomic Analysis", Journal of Proteome Research, 2009, vol. 8, p. 362-373. cited by applicant . Addona et al. "A Pipeline that Integrates the Discovery and Verification of Plasma Protein Biomarkers Reveals Candidate Markers for Cardiovascular Disease." Nat. Biotechnol. 29.7(2011):635-643. cited by applicant . Addona et al. "Multi-Site Assessment of the Precision and Reproducibility of Multiple Reaction Monitoring-Based Measurements of Proteins in Plasma." Nat. Biotechnol. 27.7(2009):633-641. cited by applicant . Albert et al. "Evaluation of the Solitary Pulmonary Nodule." Am. Fam. Physician. 80.8(2009):827-831. cited by applicant . Bigbee et al. "A Multiplexed Serum Biomarker Immunoassay Panel Discriminates Clinical Lung Cancer Patients from High-Risk Individuals Found to be Cancer-Free by CT Scanning." J. Thorac Oncol. 7.4(2012):698-708. cited by applicant . Bouchal et al. "Biomarker Discovery in Low-Grade Breast Cancer Using Isobaric Stable Isotope Tags and Two-Dimensional Liquid Chromatography-Tandem Mass Spectrometry (iTRAQ-2DLC-MS/MS) Based Quantitative Proteomic Analysis", Journal of Proteome Research, (2009), vol. 8, p. 362-373, Supplementary Table 2. cited by applicant . Brusniak et al. "Corra: Computational Framework and Tools for LC-MS Discovery and Targeted Mass Spectrometry-Based Proteomics." BMC Bioinformatics. 9(2008):542. cited by applicant . Carozzi et al. "Molecular Profile in Body Fluids in Subjects Enrolled in a Randomised Trial for Lung Cancer Screening: Perspectives of Integrated Strategies for Early Diagnosis." Lung Cancer. 68.2(2010):216-221. cited by applicant . Chapman et al. "EarlyCDT.RTM.-Lung Test: Improved Clinical Utility Through Additional Autoantibody Assays." Tumor Biol. 33.5(2012):1319-1326. cited by applicant . Cima et al. "Cancer Genetics-Guided Discovery of Serum Biomarker Signatures for Diagnosis and Prognosis of Prostate Cancer." PNAS. 108.8(2011):3342-3347. cited by applicant . Desiere et al. "The PeptideAtlas Project." Nucleic Acids Res. 34(2006):D655-D658. cited by applicant . Fracchia A. et al., "A comparative study on ferritin concentration in serum and bilateral bronchoalveolar lavage fluid of patients with peripheral lung cancer versus control subjects", Oncology. Apr. 1999;56(3):181-8. cited by applicant . Farrah et al. "A High-Confidence Human Plasma Proteome Reference Set with Estimated Concentrations in PeptideAtlas." Mol. Cell. Proteomics. 10.9(2011):M110.006353. cited by applicant . Gould et al. "Evaluation of Patients with Pulmonary Nodules: When is it Lung Cancer?" Chest. 132.53(2007):1085-1305. cited by applicant . Halliwell et al. "Oxidative Stress and Cancer: Have We Moved Forward?" Biochem. J. 401.1(2007): 1-11. cited by applicant . Hanash et al. "Emerging Molecular Biomarkers--Blood-Based Strategies to Detect and Monitor Cancer." Nat. Rev. Chin. Oncol. 8.3(2011):142-150. cited by applicant . Hassanein et al. "Advances in Proteomic Strategies Toward the Early Detection of Lung Cancer." Proc. Am. Thorac. Soc. 8.2(2011):183-188. cited by applicant . Hennessey et al. "Serum MicroRNA Biomarkers for Detection of Non-Small Cell Lung Cancer." PLoS One. 7.2(2012):e32307. cited by applicant . Henschke et al. "CT Screening for Lung Cancer: Suspiciousness of Nodules According to Size on Baseline Scans." Radiology. 231.1(2004):164-168. cited by applicant . Henschke et al. "Early Lung Cancer Action Project: Overall Design and Findings from Baseline Screenings." Lancet. 354.9173(1999):99-105. cited by applicant . Huttenhain et al. "Reproducible Quantification of Cancer-Associated Proteins in Body Fluids using Targeted Proteomics." Sci. Transl. Med. 4.142(2012):149ra194. cited by applicant . Kearney et al. "Protein Identification and Peptide Expression Resolver: Harmonizing Protein Identification with Protein Expression Data." J. Proteome Res. 7.1(2008):234-244. cited by applicant . Kitada et al. "Role of treatment for solitary pulmonary nodule in breast cancer patients", World Journal of Surgical Oncology, (2011), vol. 9, p. 124 (internet pp. 1-5). cited by applicant . Kitada et al., "Role of treatment for solitary pulomonary nodule in breast cancer patients," World Journal of Surgical Oncology 9.124(2011), internet pp. 1-5. cited by applicant . Kitteringham et al. "Multiple Reaction Monitoring for Quantitative Biomarker Analysis in Proteomics and Metabolomics." J. Chromatogr. B. 877.13(2009).1229-1239. cited by applicant . Lam et al. "EarlyCDT-Lung: An Immunobiomarker Test as an Aid to Early Detection of Lung Cancer." Cancer Prev. Res. 4.7(2011):1126-1134. cited by applicant . Lange et al. "Selected Reaction Monitoring for Quantitative Proteomics: A Tutorial." Mol. Sys. Biol. 4.222(2008):1-14. cited by applicant . Lehtio et al. "Lung Cancer Proteomics, Clinical and Technological Considerations." J. Proteomics. 73.10(2010):1851-1863. cited by applicant . Lombardi et al. "Clinical Significance of a Multiple Biomarker Assay in Patients with Lung Cancer". Chest. 97.3(1990):639-644. cited by applicant . MacMahon et al. "Guidelines for Management of Small Pulmonary Nodules Detected on CT Scans: A Statement from the Fleischner Society." Radiology. 237.2(2005):395-400. cited by applicant . Makawita et al. "The Bottleneck in the Cancer Biomarker Pipeline and Protein Quantification through Mass Spectrometry-Based Approaches: Current Strategies for Candidate Verification." Clin. Chem. 56.2(2010):212-222. cited by applicant . McClish. "Analyzing a Portion of the ROC Curve." Med. Decis. Making 9.3(1989):190-195. cited by applicant . Micheel et al., eds."Evolution of Translational Omics: Lessons Learned and the Path Forward." Committee on the Review of Omics-Based Tests for Predicting Patient Outcomes in Clinical Trials. (2012):xv-338. cited by applicant . Miller et al "Minimizing Unintended Consequences of Detecting Lung Nodules by Computed Tomography." Am. J. Resp. Crit. Care Med. 178.9(2008):891-892. cited by applicant . Milman et al., "The serum ferritin concentration is a significant prognostic indicator of survival in primary lung cancer," Oncol Rep. 9.1(2002):193-8. cited by applicant . Ocak et al. "Mass Spectrometry-Based Proteomic Profiling of Lung Cancer." Proc. Am. Thorac. Soc. 6.2(2009):159-170. cited by applicant . Omenn et al. "Overview of the HUPO Plasma Proteome Project: Results from the Pilot Phase with 35 Collaborating Laboratories and Multiple Analytical Groups, Generating a Core Dataset of 3020 Proteins and a Publicly-Available Database." Proteomics. 5.13(2005):3226-3245. cited by applicant . Ost et al. "Decision Making in Patients with Pulmonary Nodules." Am. J. Respir. Crit. Care Med. 185.4(2012):363-372. cited by applicant . Ostroff et al. "Unlocking Biomarker Discovery: Large Scale Application of Aptamer Proteomic Technology for Early Detection of Lung Cancer." PLoS One. 5.12(2010):e15003. cited by applicant . Ozaki et al., "Expression and Immunogenicity of Tumor-Associated Antigen, 90K/Mac-2 Binding Protein, in Lung Carcinoma," Cancer 95 (2002):1954-1962. cited by applicant . Pecot et al. "Added Value of a Serum Proteomic Signature in the Diagnostic Evaluation of Lung Nodules." Cancer Epidemiol. Biomarkers Prev. 21.5(2012):786-792. cited by applicant . Perkins et al. "Probability-Based Protein Identification by Searching Sequence Databases Using Mass Spectrometry Data." Electrophoresis. 20.18(1999):3551-3567. cited by applicant . Picotti et al. "High-Throughput Generation of Selected Reaction-Monitoring Assays for Proteins and Proteomes." Nat. Meth. 7.1(2010):43-46. cited by applicant . Polanski et al. "A List of Candidiate Cancer Biomarkers for Targeted Proteomics." Biomarker Insights. 1(2007):1-48. cited by applicant . Price et al. "Highly Accurate Two-Gene Classifier for Differentiating Gastrointestinal Stromal Tumors and Leiomyosarcomas." PNAS. 104.9(2007):3414-3419. cited by applicant . Qin et al. "SRM Targeted Proteomics in Seach for Biomarkers of HCV-Induced Progression of Fibrosis to Cirrhosis in HALT-C Patients." Proteomics. 12.8(2012):1244-1252. cited by applicant . Radulovic et al. "Informatics Platform for Global Proteomic Profiling and Biomarker Discovery Using Liquid Chromatography-Tandem Mass Spectrometry." 3.10(2004):984-997. cited by applicant . Reiter et al. "mProphet: Automated Data Processing and Statistical Validation for Large-Scale SRM Experiments." Nat. Meth. 8.5(2011):430-435. cited by applicant . Rho et al. "Glycoproteomic Analysis of Human Lung Adenocarcinomas Using Glycoarrays and Tandem Mass Spectrometry: Differential Expression and Glycosylation Patterns of Vimentin and Fetuin A Isoforms." Protein J. 28.3-4(2009):148-160. cited by applicant . Rom et al. "Identification of an Autoantibody Panel to Separate Lung Cancer from Smokers and Nonsmokers." BMC Cancer. 10(2010):234. cited by applicant . Schauer et al. "National Council on Radiation Protection and Measurements Report Shows Substantial Medical Exposure Increase." Radiol. 253.2(2009):293-296. cited by applicant . States et al. "Challenges in Deriving High-Confidence Protein Identifications from Data Gathered by a Hupo Plasma Proteome Collaborative Study." Nat. Biotechnol. 24.3(2006):333-338. cited by applicant . Stern et al. "Nationwide Evaluation of X-Ray Trends (NEXT) Jan. 2000 Survey of Patient Radiation Exposure from Computed Tomographic (CT) Examinations in the United States." 87th Scientific Assembly and Annual Meeting of the Radiological Society of North America, Chicago, Nov. 25-30, 2001. cited by applicant . Swensen et al., "Lung Cancer Screening with CT: Mayo Clinic Experience", Radiology 226 (2003):756-761. cited by applicant . Taguchi et al. "Unleashing the Power of Proteomics to Develop Blood-Based Cancer Markers." Clin. Chem. 59(2013):1. cited by applicant . Teutsch et al. "The Evaluation of Genomic Applications in Practice and Prevention (EGAPP) Initiative: Methods of the EGAPP Working Group." Genet. Med. 11.1(2009):3-14. cited by applicant . Tockman et al., "Considerations in Bringing a Cancer Biomarker to Clinical Application," Cancer Res. (1992) 52:2711s-2718s. cited by applicant . Ueda et al., "A Comprehensive Peptidome Profling Technology for the Identification of Early Detection Biomarkers for Lung Adenocarcinoma," PloS One 6.4 (2011):e18567, pp. 1-12. cited by applicant . Walser et al. "Smoking and Lung Cancer: The Role of Inflammation." Proc. Am. Thorac. Soc. 5.8(2008):811-815. cited by applicant . Wang et al., "The evolving role of mass spectrometry in cancer biomarker discovery," Cancer Biology and Therapy 8(2009):1083-1094. cited by applicant . Wei et al., "Primary Tumor Xenografts of Human Lung Adeno and Squamous Cell Carcinoma Express distinct Proteomic Signatures," Journal of Proteome Research 10(2011):161-174, published online Sep. 3, 2010. cited by applicant . Whiteaker et al. "A Targeted Proteomics-Based Pipeline for Verification of Biomarkers in Plasma." Nat. Biotechnol. 29.7(2011):625-634. cited by applicant . Wiener et al. "Population-Based Risk for Complications after Transthoracic Needle Lung Biopsy of a Pulmonary Nodule: an Analysis of Discharge Records." Ann. Int. Med. 155.3(2011): 137-144. cited by applicant . Yildiz et al. "Diagnostic Accuracy of MALDI Mass Spectrometic Analysis of Unfractionated Serum in Lung Cancer." J. Thorac. Oncol. 2.10(2007):893-901. cited by applicant . Zeng et al. "Lung Cancer Serum Biomarker Discovery Using Glycoprotein Capture and Liquid Chromatography Mass Spectrometry." J. Proteome Res. 9.12(2010):6440-6449. cited by applicant. |
Primary Examiner: Sang; Hong
Attorney, Agent or Firm: Foley Hoag LLP Russell; Hathaway P. Dio; Thi K.
Parent Case Text
RELATED APPLICATIONS
This application is a continuation of U.S. application Ser. No. 13/775,494, filed Feb. 25, 2013, now U.S. Pat. No. 9,304,137, which is a continuation-in-part of U.S. application Ser. No. 13/724,823, filed Dec. 21, 2012, now U.S. Pat. No. 9,201,044, which claims priority to, and the benefit of, U.S. Application No. 61/578,712, filed Dec. 21, 2011, U.S. Application No. 61/589,920, filed Jan. 24, 2012, U.S. Application No. 61/676,859, filed Jul. 27, 2012 and U.S. Application No. 61/725,153, filed Nov. 12, 2012, the contents of each of which are incorporated herein by reference in their entireties.
Claims
The invention claimed is:
1. A method of determining the likelihood that a pulmonary nodule in a subject is not lung cancer, comprising: (a) contacting a blood sample obtained from the subject with a proteolytic enzyme to produce peptide fragments from a panel of proteins present in the blood sample, wherein the panel comprises LG3BP and C163A; (b) combining the produced peptide fragments from the panel from step (a) with labeled, synthetic peptide fragments which correspond to the produced peptide fragments from the panel; (c) performing selected reaction monitoring mass spectrometry to measure the abundance of the peptide fragments from step (b); (d) calculating a probability of lung cancer score based on the peptide fragment measurements of step (c); and (e) ruling out lung cancer for the subject if the score in step (d) is lower than a pre-determined score.
2. The method of claim 1, wherein when lung cancer is ruled out, the subject does not receive a treatment protocol.
3. The method of claim 2, wherein said treatment protocol is a pulmonary function test (PFT), pulmonary imaging, a biopsy, a surgery, a chemotherapy, a radiotherapy, or any combination thereof.
4. The method of claim 3, where said imaging is an x-ray, a chest computed tomography (CT) scan, or a positron emission tomography (PET) scan.
5. The method of claim 1, wherein said pulmonary nodule has a diameter of less than or equal to 3 cm.
6. The method of claim 1, wherein said pulmonary nodule has a diameter of about 0.8 cm to 2.0 cm.
7. The method of claim 1, wherein said score is calculated from a logistic regression model applied to the peptide fragment measurements.
8. The method of claim 1, wherein said score is determined as, P.sub.S=1/[1+exp(-.alpha.-.SIGMA..sub.i=1.sup.N.beta..sub.i* .sub.i,s)], where .sub.i,s is logarithmically transformed and normalized intensity of transition i in said sample (s), .beta..sub.i is the corresponding logistic regression coefficient, .alpha. was a panel-specific constant, and N was the total number of transitions in said panel.
9. The method of claim 1, wherein the determining the likelihood that a pulmonary nodule is not lung cancer is determined by the sensitivity, specificity, negative predictive value or positive predictive value associated with the score.
10. The method of claim 1, wherein said score determined in step (d) has a negative predictive value (NPV) of at least about 80%.
11. The method of claim 1, wherein the selected reaction monitoring mass spectrometry is performed using an antibody that specifically binds the peptide fragments being detected.
12. The method of claim 1, wherein the subject is at risk of developing lung cancer.
13. The method of claim 1, wherein the proteolytic enzyme is trypsin.
Description
INCORPORATION-BY-REFERENCE OF SEQUENCE LISTING
The contents of the text file named "IDIA-005_X02US_SequenceListing_ST25.txt", which was created on Feb. 27, 2015 and is 14 KB in size, are hereby incorporated by reference in their entireties.
BACKGROUND
Lung conditions and particularly lung cancer present significant diagnostic challenges. In many asymptomatic patients, radiological screens such as computed tomography (CT) scanning are a first step in the diagnostic paradigm. Pulmonary nodules (PNs) or indeterminate nodules are located in the lung and are often discovered during screening of both high risk patients or incidentally. The number of PNs identified is expected to rise due to increased numbers of patients with access to health care, the rapid adoption of screening techniques and an aging population. It is estimated that over 3 million PNs are identified annually in the US. Although the majority of PNs are benign, some are malignant leading to additional interventions. For patients considered low risk for malignant nodules, current medical practice dictates scans every three to six months for at least two years to monitor for lung cancer. The time period between identification of a PN and diagnosis is a time of medical surveillance or "watchful waiting" and may induce stress on the patient and lead to significant risk and expense due to repeated imaging studies. If a biopsy is performed on a patient who is found to have a benign nodule, the costs and potential for harm to the patient increase unnecessarily. Major surgery is indicated in order to excise a specimen for tissue biopsy and diagnosis. All of these procedures are associated with risk to the patient including: illness, injury and death as well as high economic costs.
Frequently, PNs cannot be biopsied to determine if they are benign or malignant due to their size and/or location in the lung. However, PNs are connected to the circulatory system, and so if malignant, protein markers of cancer can enter the blood and provide a signal for determining if a PN is malignant or not.
Diagnostic methods that can replace or complement current diagnostic methods for patients presenting with PNs are needed to improve diagnostics, reduce costs and minimize invasive procedures and complications to patients. The present invention provides novel compositions, methods and kits for identifying protein markers to identify, diagnose, classify and monitor lung conditions, and particularly lung cancer. The present invention uses a blood-based multiplexed assay to distinguish benign pulmonary nodules from malignant pulmonary nodules to classify patients with or without lung cancer. The present invention may be used in patients who present with symptoms of lung cancer, but do not have pulmonary nodules.
SUMMARY
The present invention provides a method of determining the likelihood that a lung condition in a subject is cancer by measuring an abundance of a panel of proteins in a sample obtained from the subject; calculating a probability of cancer score based on the protein measurements and ruling out cancer for the subject if the score is lower than a pre-determined score. When cancer is ruled out, the subject does not receive a treatment protocol. Treatment protocols include for example pulmonary function test (PFT), pulmonary imaging, a biopsy, a surgery, a chemotherapy, a radiotherapy, or any combination thereof. In some embodiments, the imaging is an x-ray, a chest computed tomography (CT) scan, or a positron emission tomography (PET) scan.
The present invention further provides a method of ruling in the likelihood of cancer for a subject by measuring an abundance of panel of proteins in a sample obtained from the subject, calculating a probability of cancer score based on the protein measurements and ruling in the likelihood of cancer for the subject if the score is higher than a pre-determined score.
In another aspect, the invention further provides a method of determining the likelihood of the presence of a lung condition in a subject by measuring an abundance of panel of proteins in a sample obtained from the subject, calculating a probability of cancer score based on the protein measurements and concluding the presence of said lung condition if the score is equal or greater than a pre-determined score. The lung condition is lung cancer such as for example, non-small cell lung cancer (NSCLC). The subject is at risk of developing lung cancer.
In some embodiments, the panel includes at least 3 proteins selected from ALDOA, FRIL, LG3BP, IBP3, LRP1, ISLR, TSP1, COIA1, GRP78, TETN, PRDX1 and CD14. Optionally, the panel further includes at least one protein selected from BGH3, COIA1, TETN, GRP78, PRDX, FIBA and GSLG1.
In some embodiments, the panel includes at least 4 proteins selected from ALDOA, FRIL, LG3BP, IBP3, LRP1, ISLR, TSP1, COIA1, GRP78, TETN, PRDX1 and CD14.
In a preferred embodiment, the panel comprises LRP1, COIA1, ALDOA, and LG3BP.
In another preferred embodiment, the panel comprises LRP1, COIA1, ALDOA, LG3BP, BGH3, PRDX1, TETN, and ISLR.
In yet another preferred embodiment, the panel comprises LRP1, COIA1, ALDOA, LG3BP, BGH3, PRDX1, TETN, ISLR, TSP1, GRP78, FRIL, FIBA and GSLG1.
The subject has or is suspected of having a pulmonary nodule. The pulmonary nodule has a diameter of less than or equal to 3 cm. In one embodiment, the pulmonary nodule has a diameter of about 0.8 cm to 2.0 cm.
The score is calculated from a logistic regression model applied to the protein measurements. For example, the score is determined as P.sub.s=1/[1+exp(-.alpha.-.SIGMA..sub.i=1.sup.N.beta..sub.i*{hacek over (I)}.sub.i,s)], where {hacek over (I)}.sub.i,s is logarithmically transformed and normalized intensity of transition i in said sample (s), .beta..sub.i is the corresponding logistic regression coefficient, .alpha. was a panel-specific constant, and N was the total number of transitions in said panel.
In various embodiments, the method of the present invention further comprises normalizing the protein measurements. For example, the protein measurements are normalized by one or more proteins selected from PEDF, MASP1, GELS, LUM, C163A and PTPRJ.
The biological sample includes, such as for example tissue, blood, plasma, serum, whole blood, urine, saliva, genital secretion, cerebrospinal fluid, sweat and excreta.
In one aspect, the determining the likelihood of cancer is determined by the sensitivity, specificity, negative predictive value or positive predictive value associated with the score. The score determined has a negative predictive value (NPV) at least about 80%.
The measuring step is performed by selected reaction monitoring mass spectrometry, using a compound that specifically binds the protein being detected or a peptide transition. In one embodiment, the compound that specifically binds to the protein being measured is an antibody or an aptamer.
BRIEF DESCRIPTION OF THE DRAWINGS
FIG. 1 is a line graph showing area under the curve for a receiving operating curve for 15 protein LC-SRM-MS panels.
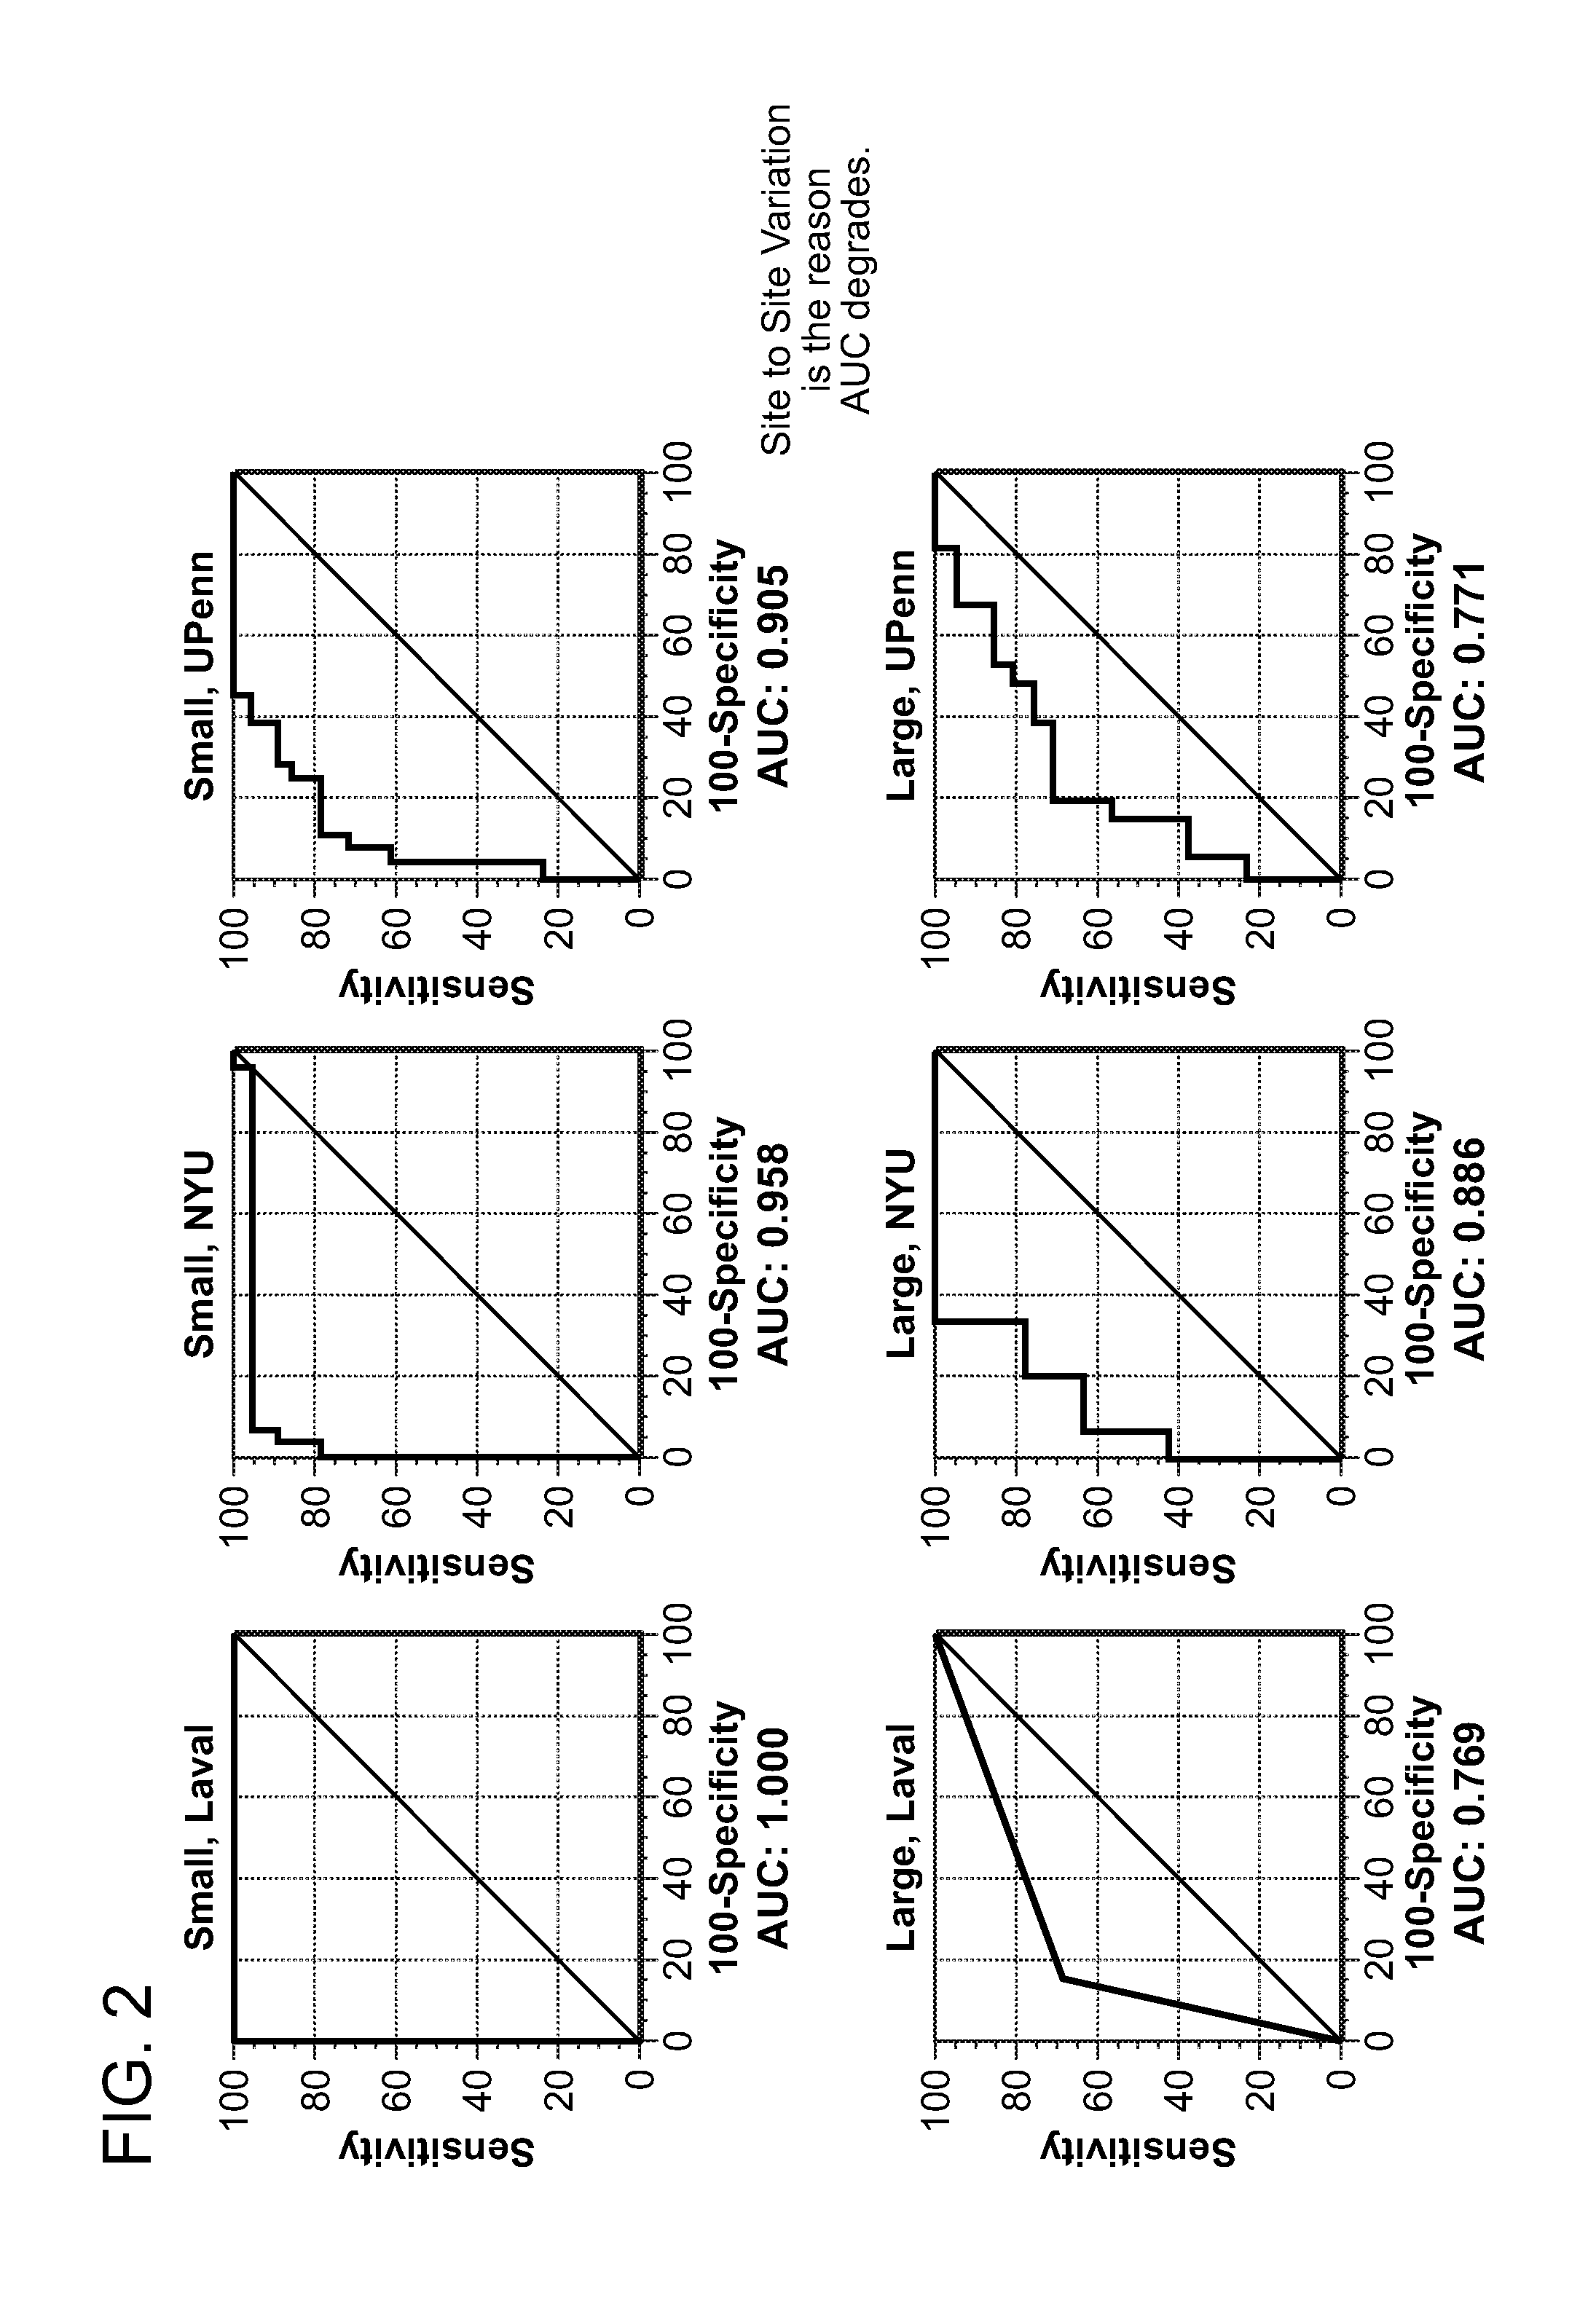
FIG. 2 shows six line graphs each showing area under the curve for a receiving operating curve for 15 protein LC-SRM-MS panels for different patient populations and for subjects with large and small PN
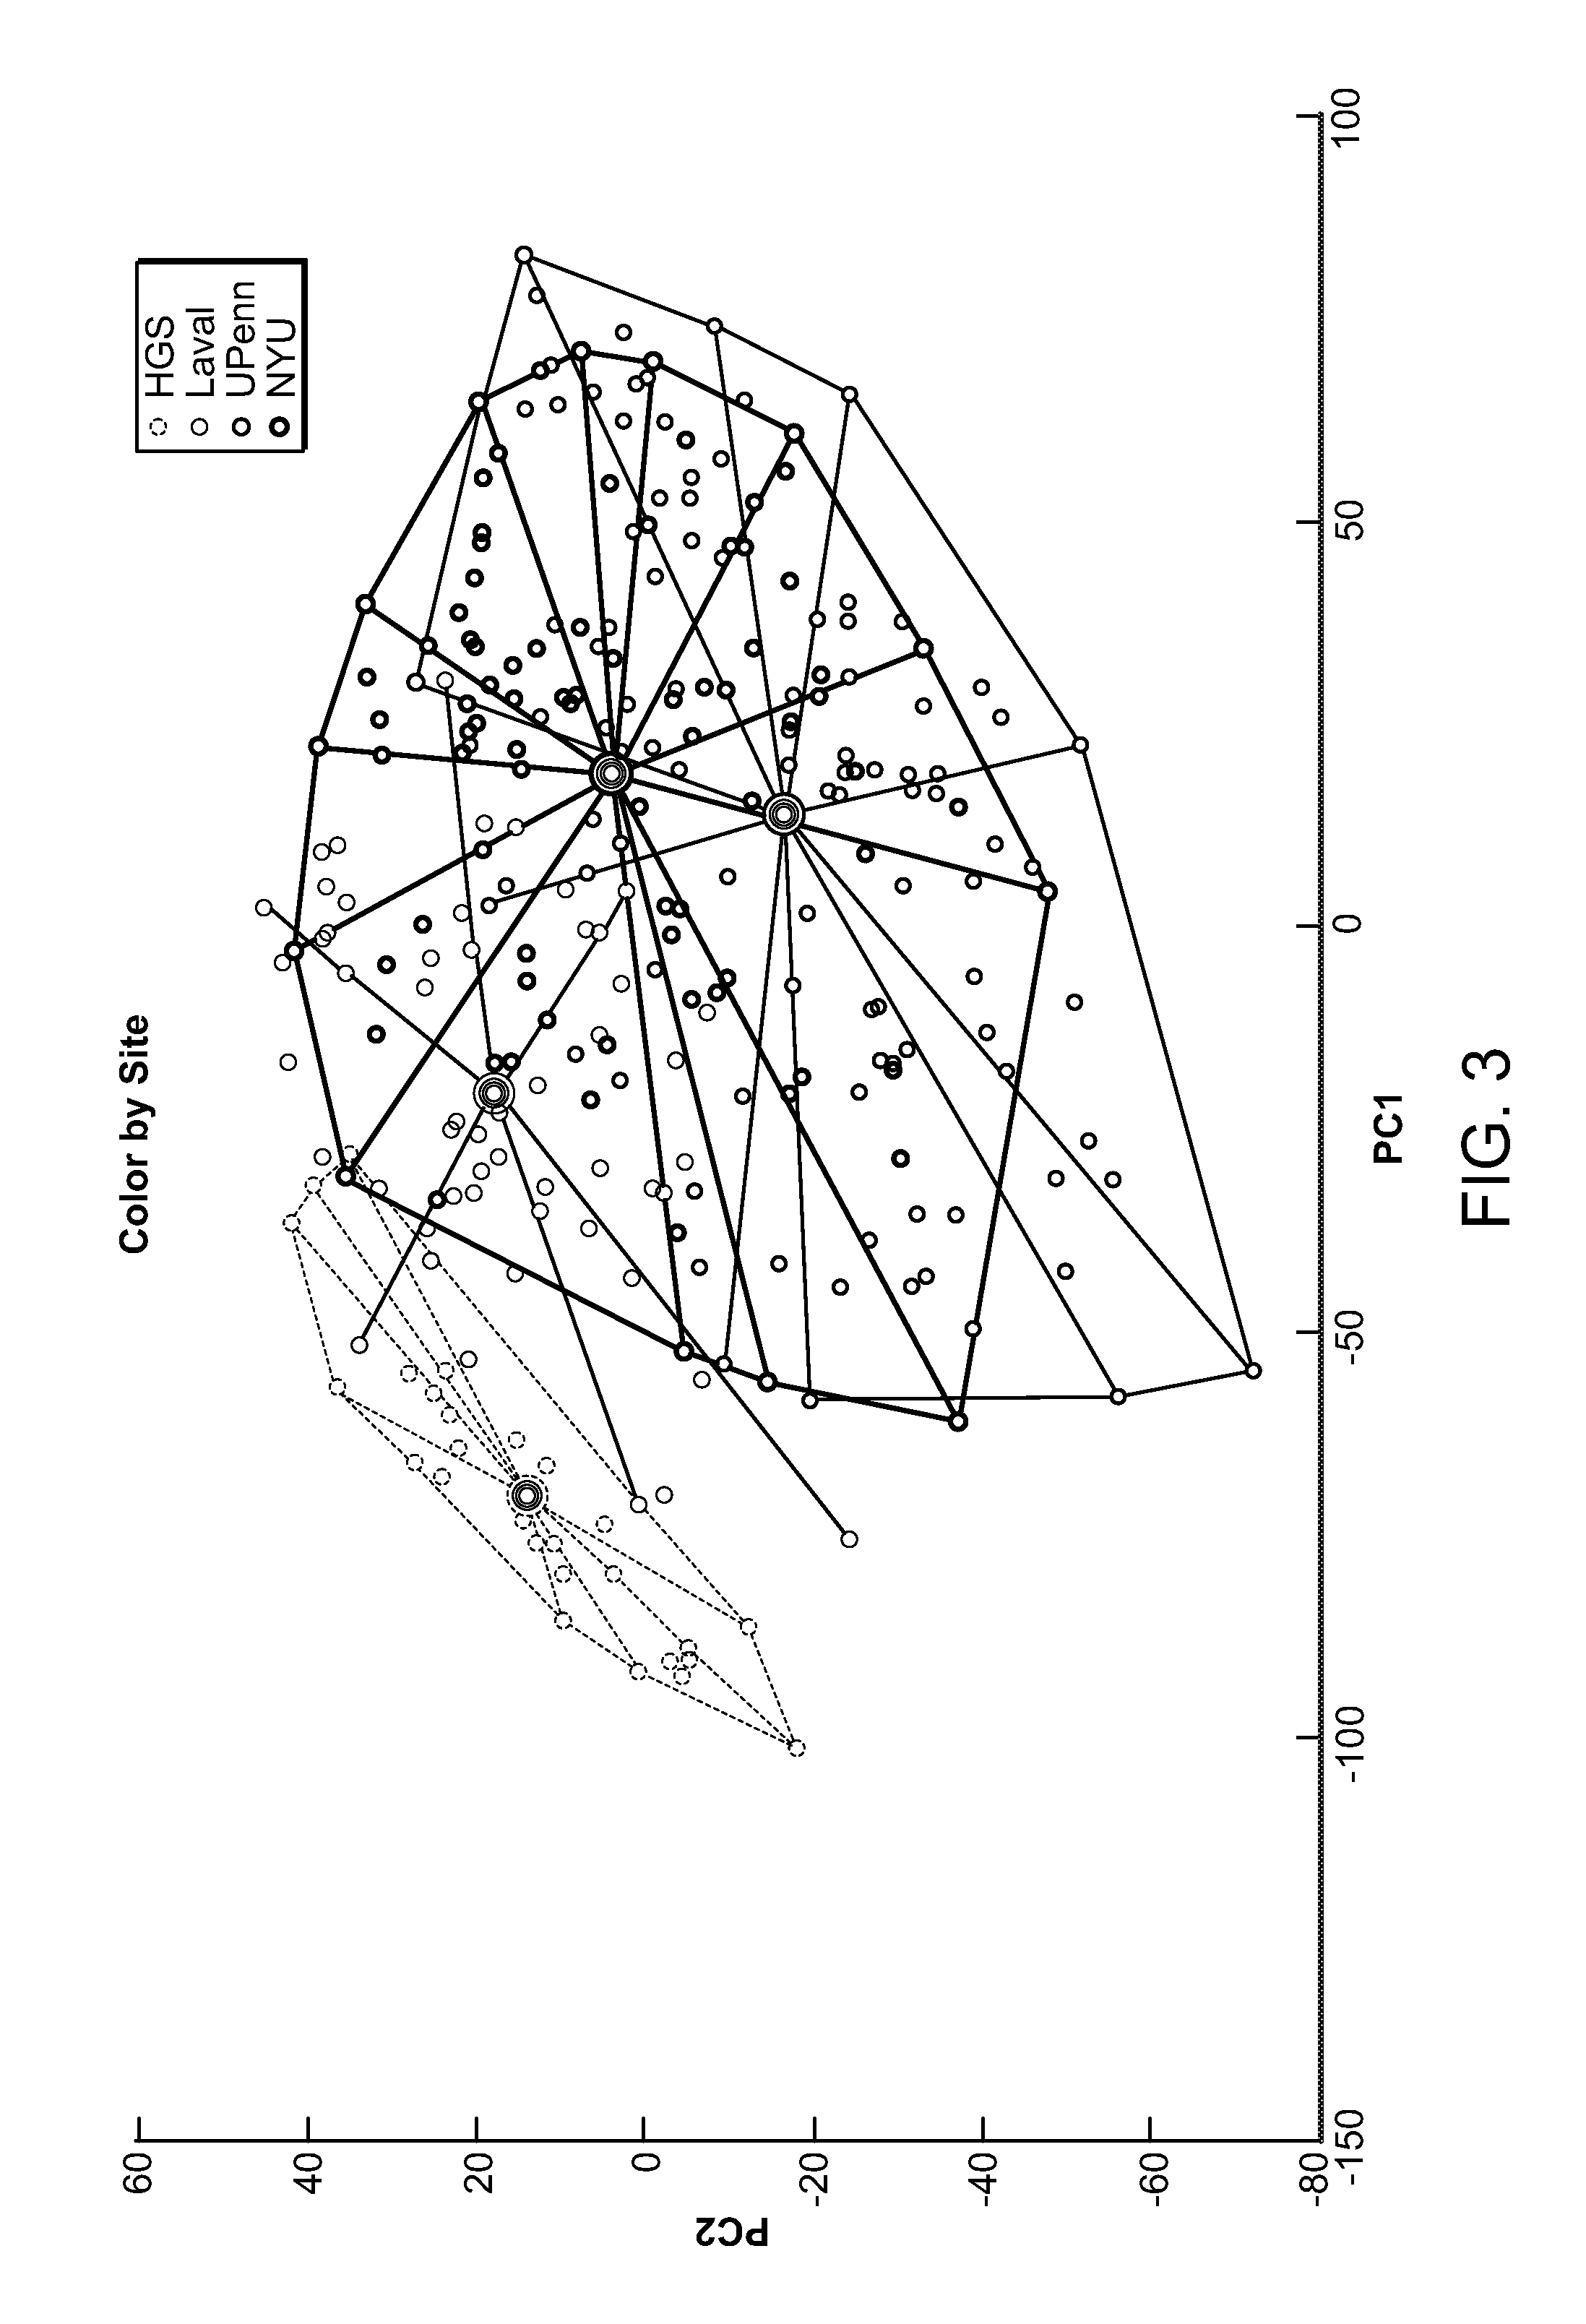
FIG. 3 is a graph showing variability among three studies used to evaluate 15 protein panels.
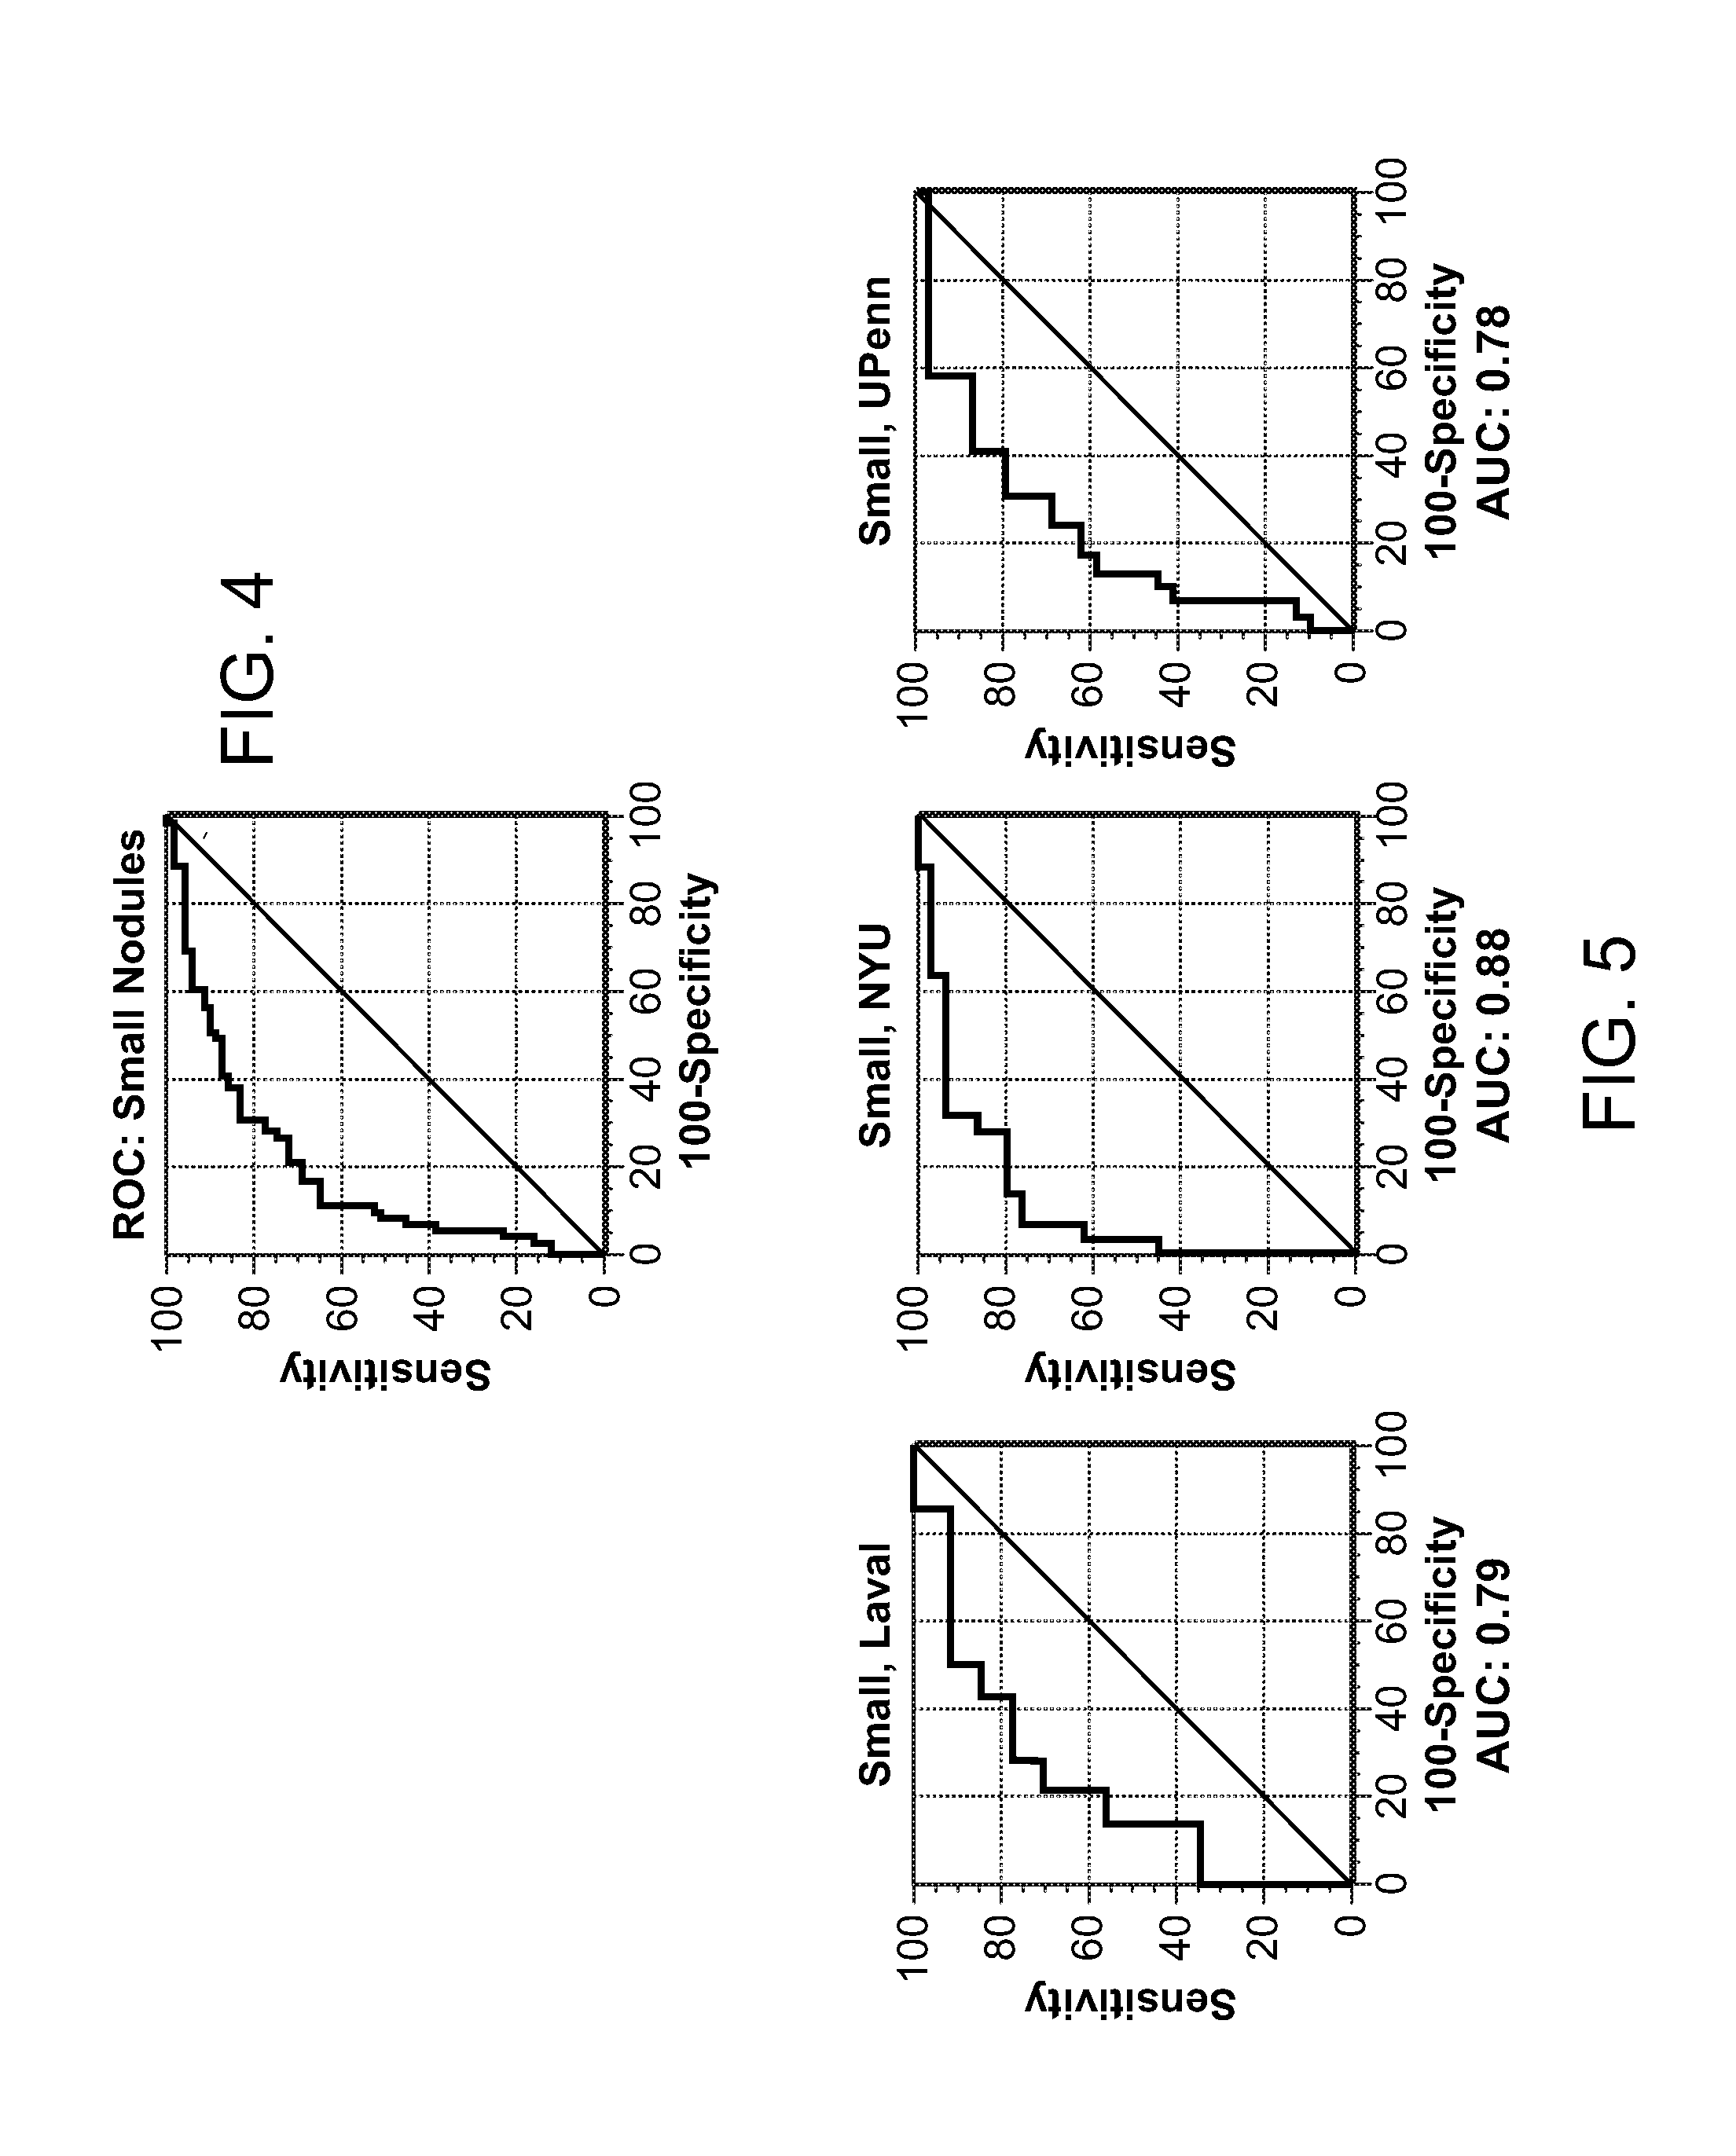
FIG. 4 is a line graph showing area under the curve for a receiving operating curve for a 15 protein LC-SRM-MS panel.
FIG. 5 shows three line graphs each showing area under the curve for a receiving operating curve for a 15 protein LC-SRM-MS panel for a different patient population.
FIG. 6 shows the results of a query of blood proteins used to identify lung cancer using the "Ingenuity" .RTM. program.
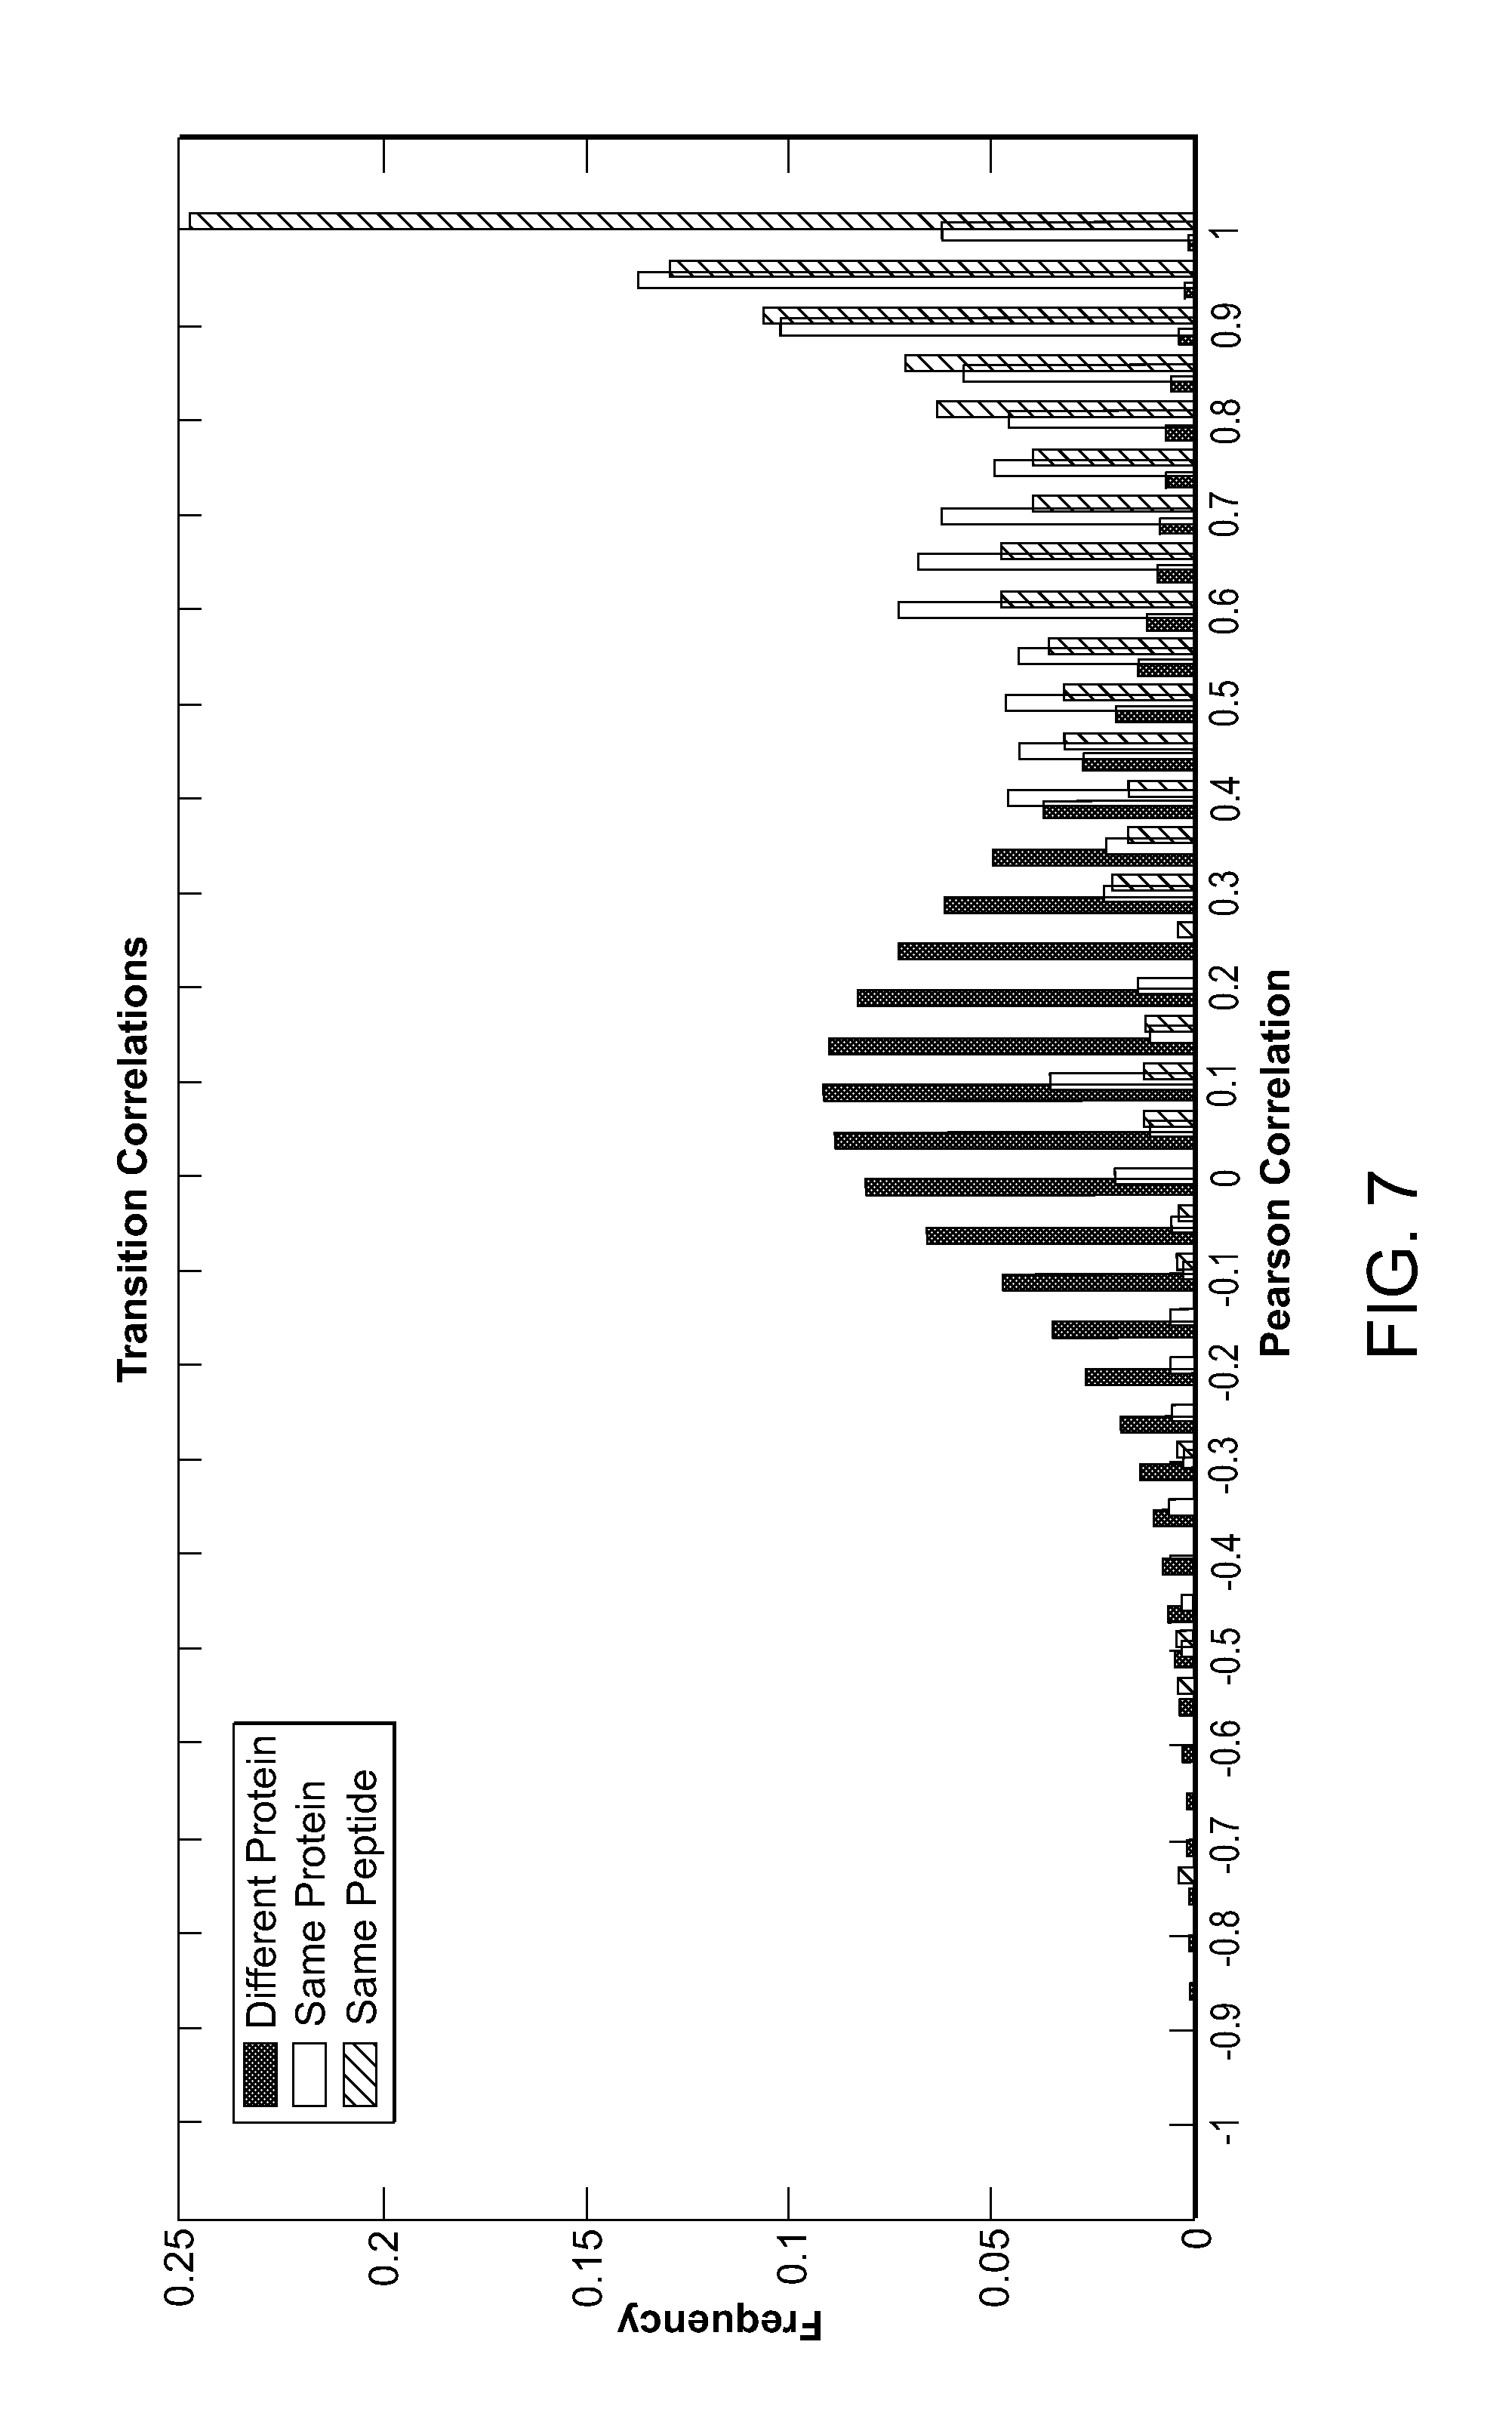
FIG. 7 is a bar diagram showing Pearson correlations for peptides from the same peptide, from the same protein and from different proteins.
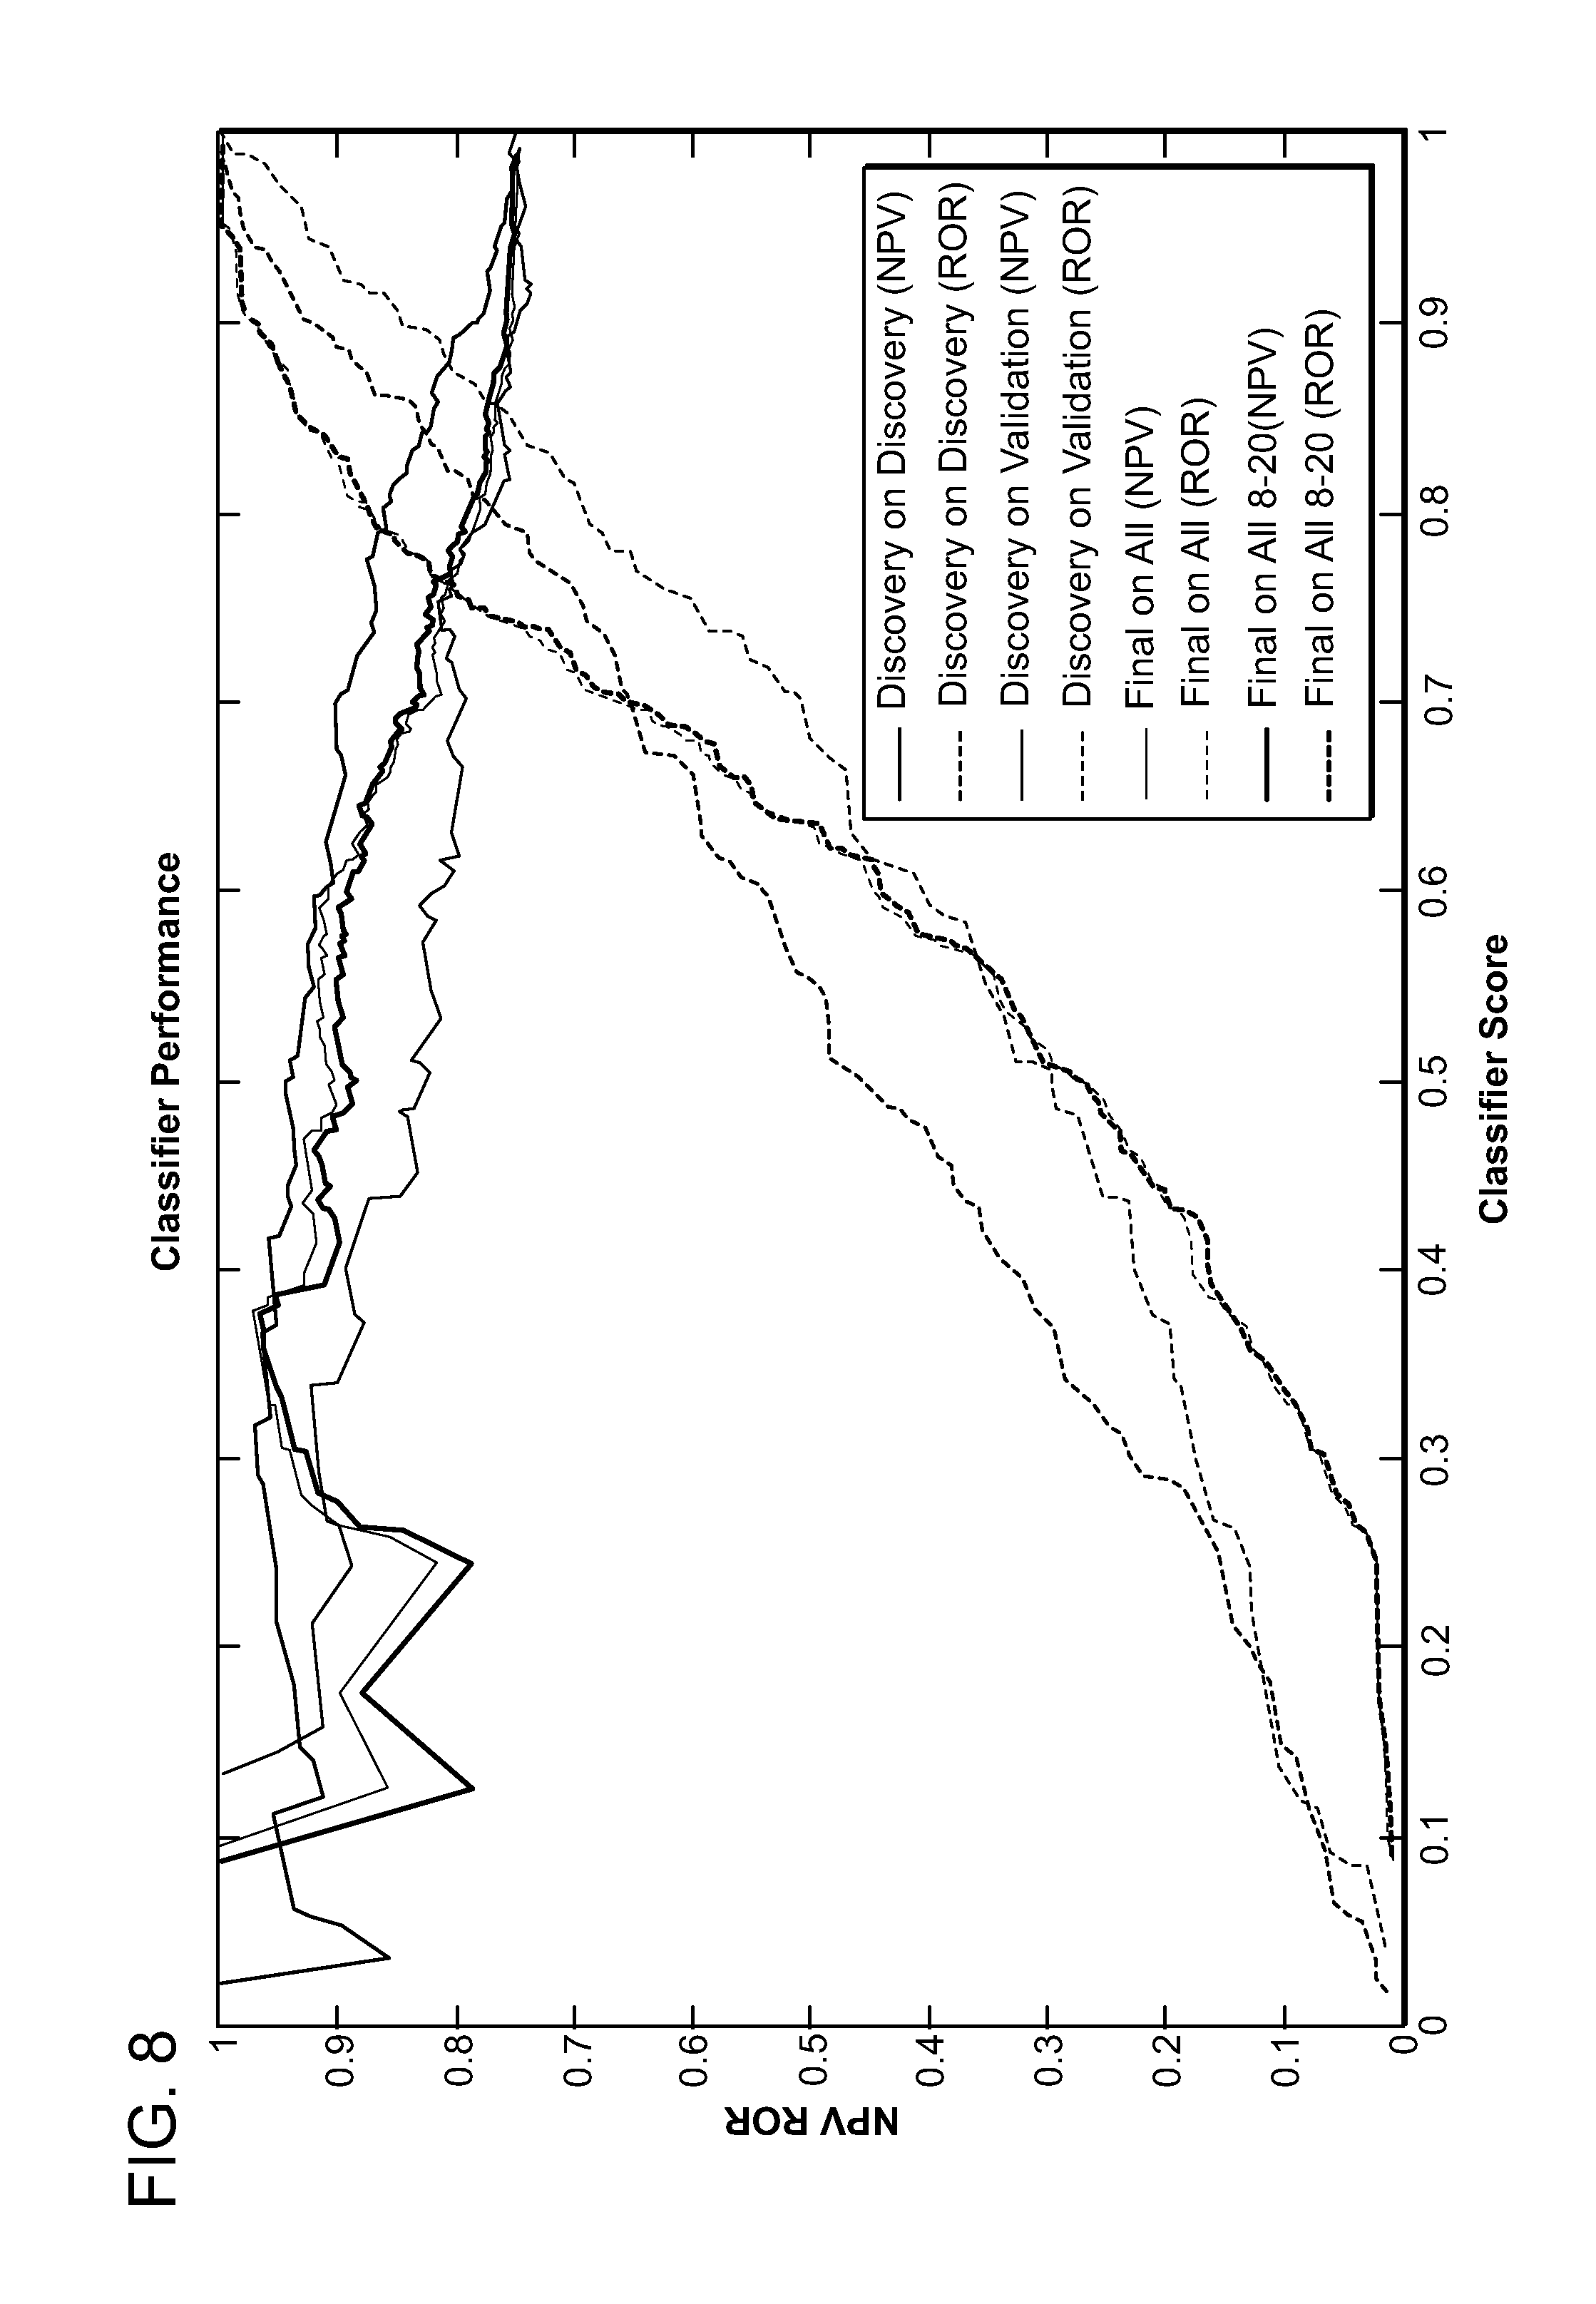
FIG. 8 is a graph showing performance of the classifier on the training samples, validation samples and all samples combined.
FIG. 9 is a graph showing clinical and molecular factors.
FIG. 10 is a schematic showing the molecular network containing the 13 classifier proteins (green), 5 transcription factors (blue) and the three networks (orange lines) of lung cancer, response to oxidative stress and lung inflammation.
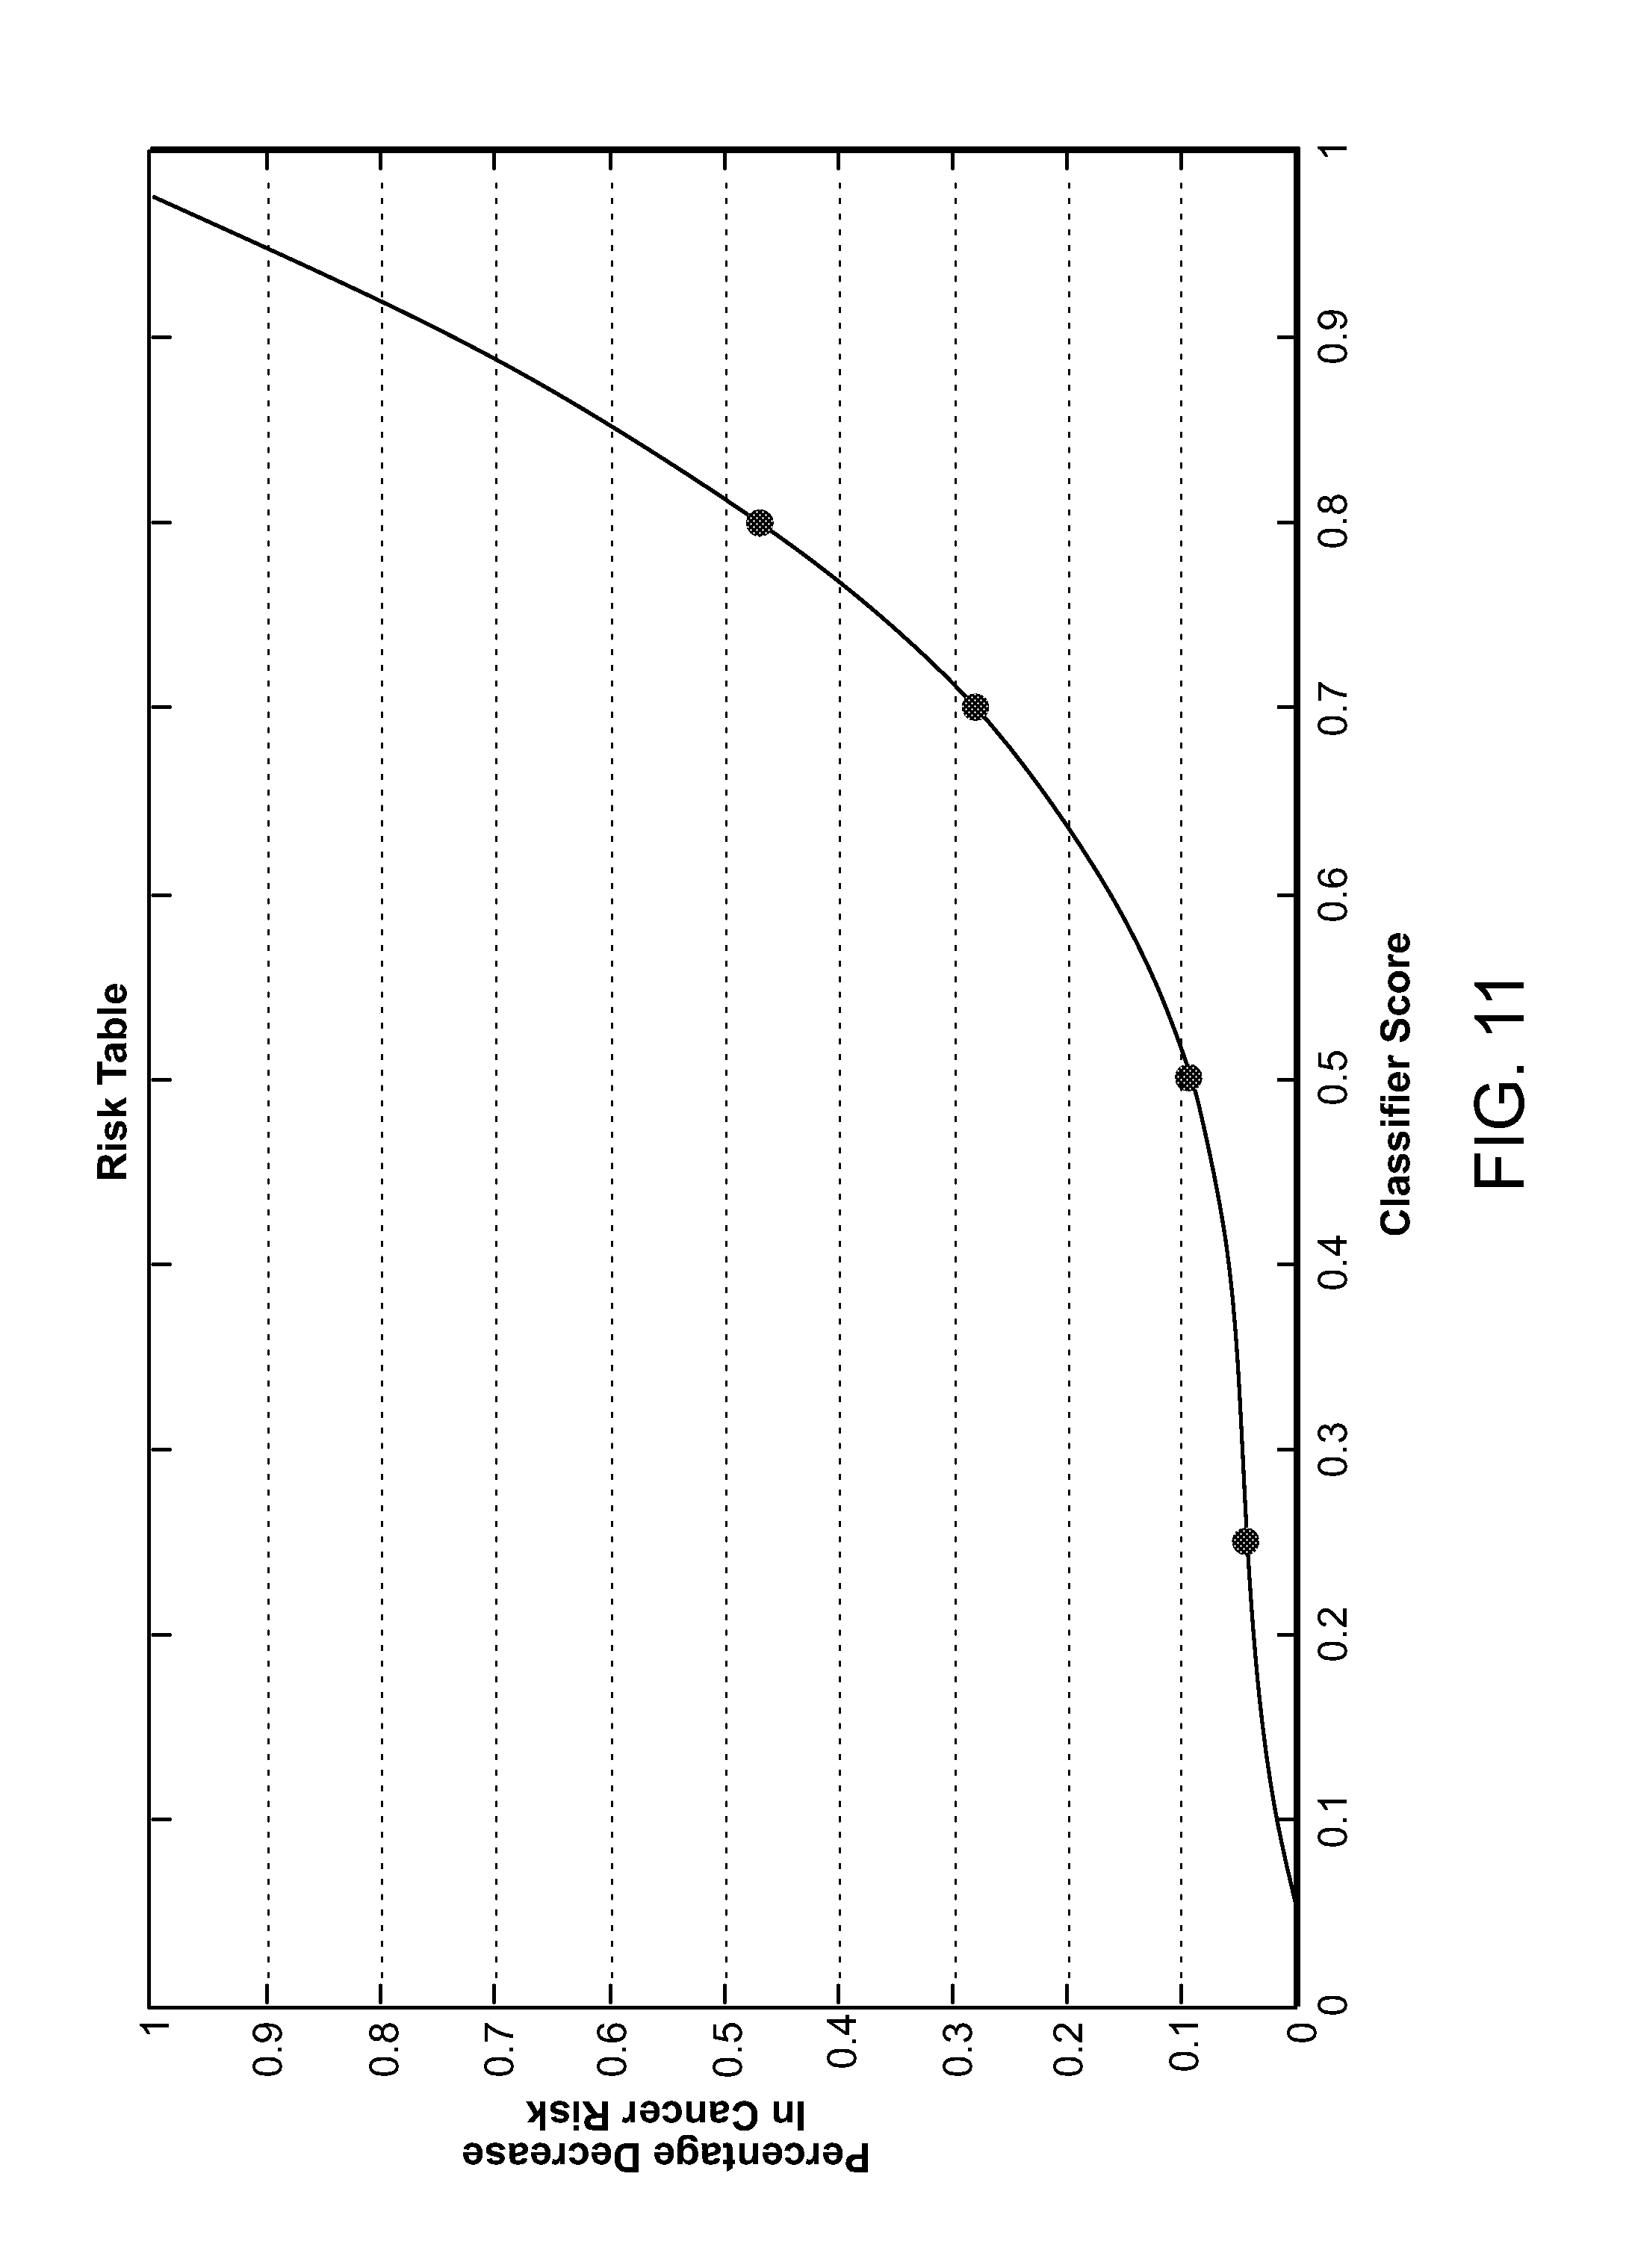
FIG. 11 is a graph depicting interpretation of classifier score in terms of risk.
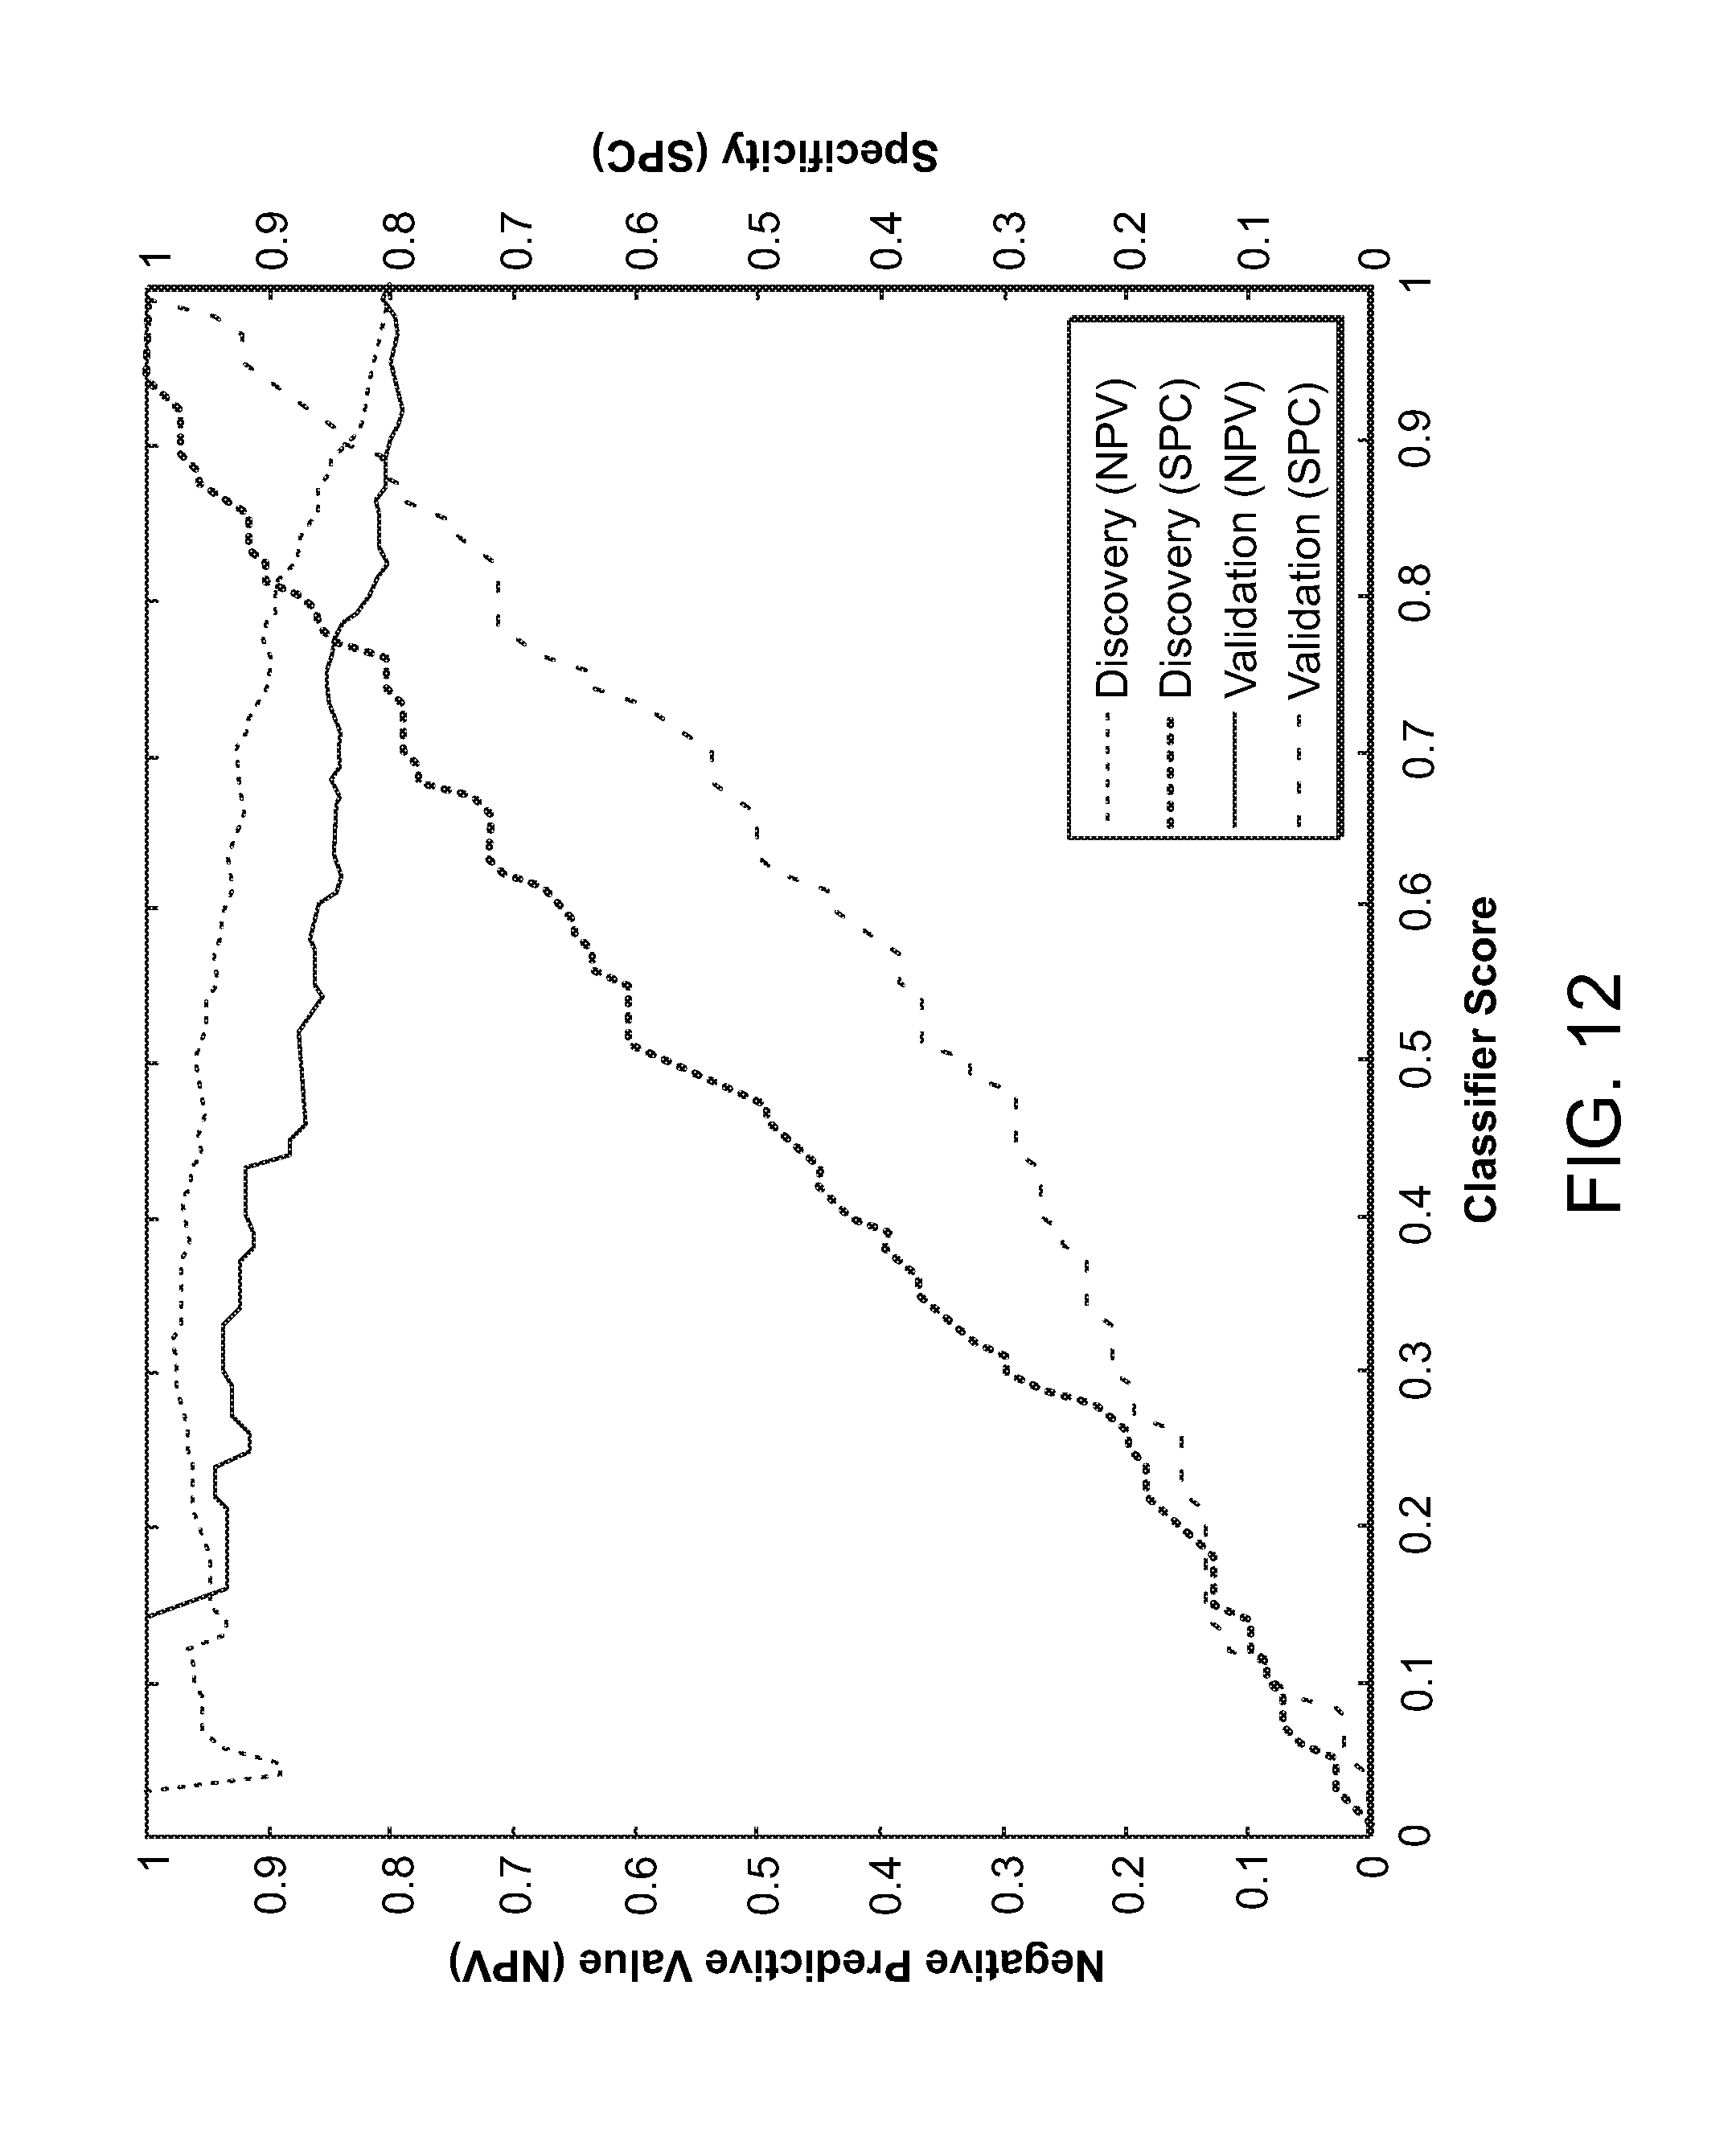
FIG. 12 is a graph showing performance of the classifier on the discovery samples (n=143) and validation samples (n=104). Negative predictive value (NPV) and specificity (SPC) are presented in terms of classifier score. A cancer prevalence of 20% was assumed.
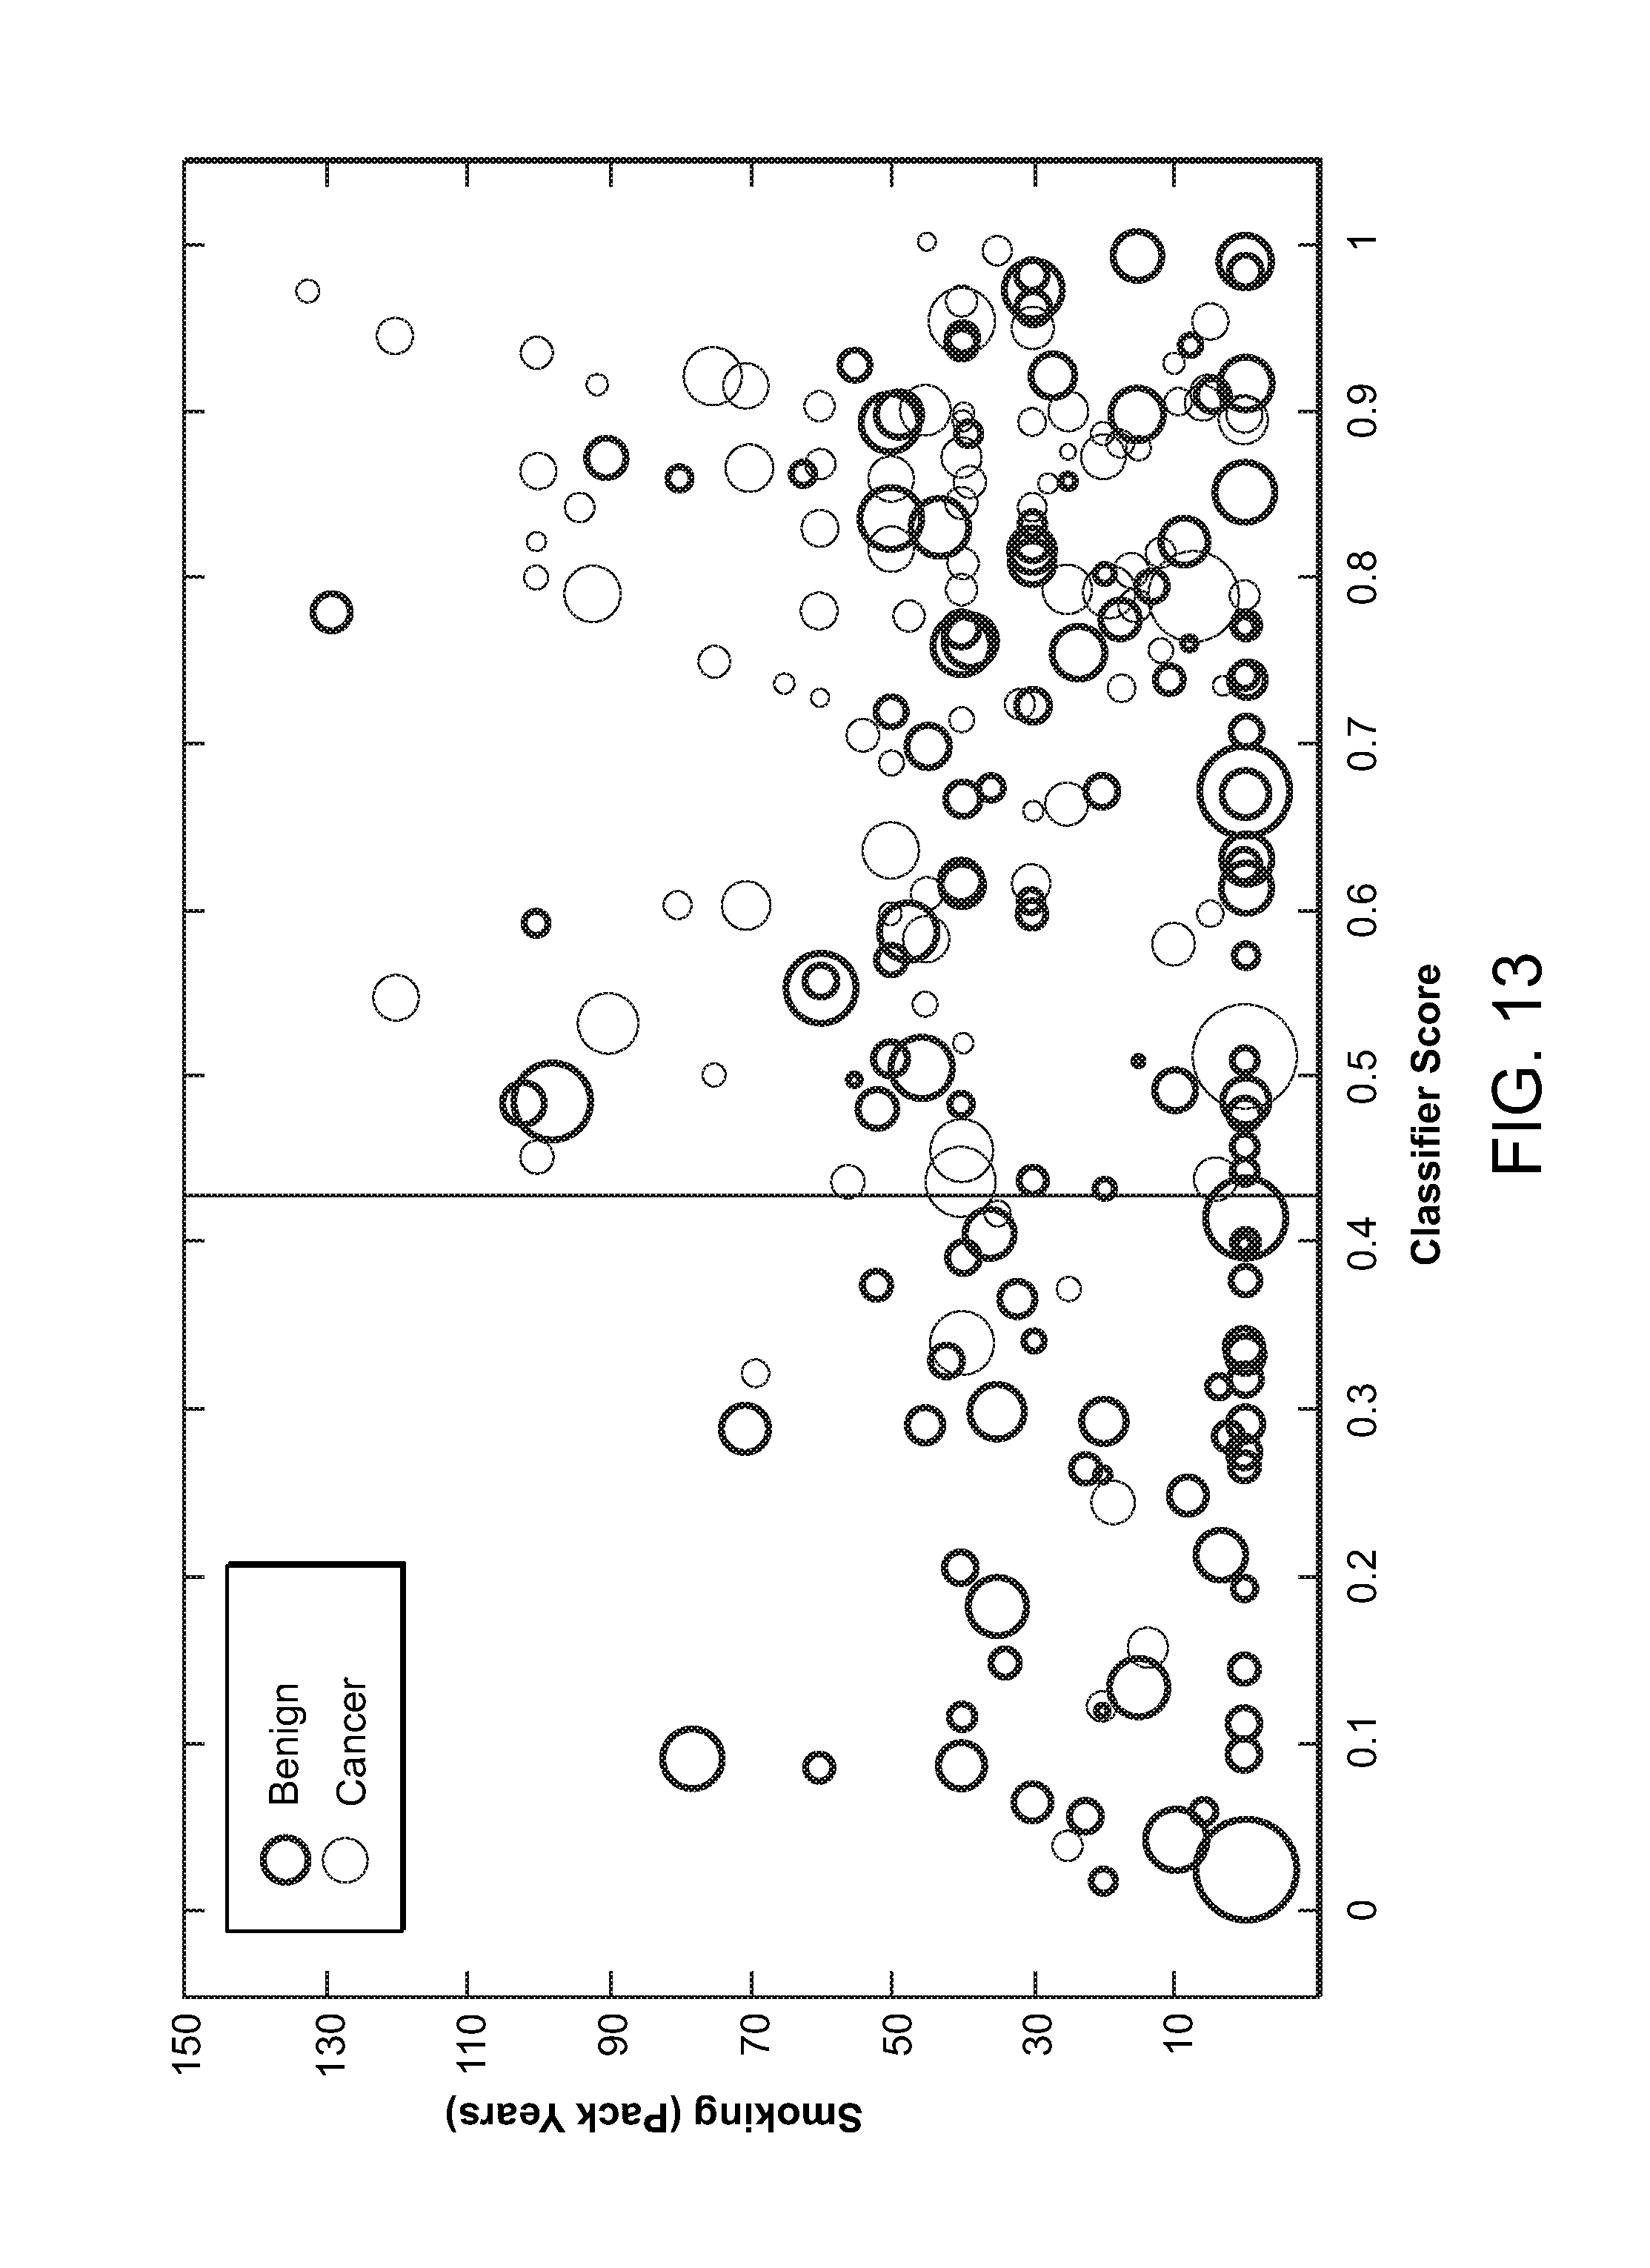
FIG. 13 is a graph showing multivariate analysis of clinical (smoking, nodule size) and molecular (classifier score) factors as they relate to cancer and benign samples (n=247) in the discovery and validation studies. Smoking is measured by pack-years on the vertical. Nodule size is represented by circle diameter. A reference value of 0.43 is presented to illustrate the discrimination between low numbers of cancer samples less than the reference value as compared to the high number of cancer samples above the reference value.
FIG. 14 is a graph showing the 13 classifier proteins (green), 4 transcription regulators (blue) and the three networks (orange lines) of lung cancer, oxidative stress response and lung inflammation. All references are human UniProt identifiers.
FIG. 15 is a graph showing scattering plot of nodule size vs. classifier score of all 247 patients, demonstrating the lack of correlation between the two variables.
FIG. 16 is a diagram showing the Pearson correlations for peptides from the same peptide (blue), from the same protein (green) and from different proteins (red).
DETAILED DESCRIPTION
The disclosed invention derives from the surprising discovery, that in patients presenting with pulmonary nodule(s), protein markers in the blood exist that specifically identify and classify lung cancer. Accordingly the invention provides unique advantages to the patient associated with early detection of lung cancer in a patient, including increased life span, decreased morbidity and mortality, decreased exposure to radiation during screening and repeat screenings and a minimally invasive diagnostic model. Importantly, the methods of the invention allow for a patient to avoid invasive procedures.
The routine clinical use of chest computed tomography (CT) scans identifies millions of pulmonary nodules annually, of which only a small minority are malignant but contribute to the dismal 15% five-year survival rate for patients diagnosed with non-small cell lung cancer (NSCLC). The early diagnosis of lung cancer in patients with pulmonary nodules is a top priority, as decision-making based on clinical presentation, in conjunction with current non-invasive diagnostic options such as chest CT and positron emission tomography (PET) scans, and other invasive alternatives, has not altered the clinical outcomes of patients with Stage I NSCLC. The subgroup of pulmonary nodules between 8 mm and 20 mm in size is increasingly recognized as being "intermediate" relative to the lower rate of malignancies below 8 mm and the higher rate of malignancies above 20 mm [9]. Invasive sampling of the lung nodule by biopsy using transthoracic needle aspiration or bronchoscopy may provide a cytopathologic diagnosis of NSCLC, but are also associated with both false-negative and non-diagnostic results. In summary, a key unmet clinical need for the management of pulmonary nodules is a non-invasive diagnostic test that discriminates between malignant and benign processes in patients with indeterminate pulmonary nodules (IPNs), especially between 8 mm and 20 mm in size.
The clinical decision to be more or less aggressive in treatment is based on risk factors, primarily nodule size, smoking history and age [9] in addition to imaging. As these are not conclusive, there is a great need for a molecular-based blood test that would be both non-invasive and provide complementary information to risk factors and imaging.
Accordingly, these and related embodiments will find uses in screening methods for lung conditions, and particularly lung cancer diagnostics. More importantly, the invention finds use in determining the clinical management of a patient. That is, the method of invention is useful in ruling in or ruling out a particular treatment protocol for an individual subject.
Cancer biology requires a molecular strategy to address the unmet medical need for an assessment of lung cancer risk. The field of diagnostic medicine has evolved with technology and assays that provide sensitive mechanisms for detection of changes in proteins. The methods described herein use a LC-SRM-MS technology for measuring the concentration of blood plasma proteins that are collectively changed in patients with a malignant PN. This protein signature is indicative of lung cancer. LC-SRM-MS is one method that provides for both quantification and identification of circulating proteins in plasma. Changes in protein expression levels, such as but not limited to signaling factors, growth factors, cleaved surface proteins and secreted proteins, can be detected using such a sensitive technology to assay cancer. Presented herein is a blood-based classification test to determine the likelihood that a patient presenting with a pulmonary nodule has a nodule that is benign or malignant. The present invention presents a classification algorithm that predicts the relative likelihood of the PN being benign or malignant.
More broadly, it is demonstrated that there are many variations on this invention that are also diagnostic tests for the likelihood that a PN is benign or malignant. These are variations on the panel of proteins, protein standards, measurement methodology and/or classification algorithm.
As disclosed herein, archival plasma samples from subjects presenting with PNs were analyzed for differential protein expression by mass spectrometry and the results were used to identify biomarker proteins and panels of biomarker proteins that are differentially expressed in conjunction with various lung conditions (cancer vs. non-cancer).
In one aspect of the invention, one hundred and sixty three panels were discovered that allow for the classification of PN as being benign or malignant. These panels include those listed on Table 1. In some embodiments the panel according to the invention includes measuring 1, 2, 3, 4, 5 or more proteins selected from ISLR, ALDOA, KIT, GRP78, AIFM1, CD14, COIA1, IBP3, TSP1, BGH3, TETN, FRI, LG3BP, GGH, PRDX1 or LRP1. In other embodiments the panel includes any panel or protein exemplified on Table 1. For, example the panel includes ALDOA, GRP78, CD14, COIA1, IBP3, FRIL, LG3BP, and LRP1
TABLE-US-00001 TABLE 1 Iden- Number pAUC Proteins tifier Proteins Factor ISLR ALDOA KIT GRP78 AIFM1 CD14 COIA1 1 9 4.562 0 1 0 1 0 1 1 2 8 4.488 0 1 0 1 0 1 1 3 11 4.451 1 1 0 1 0 0 1 4 11 4.357 1 1 0 1 0 0 1 5 11 4.331 1 1 0 0 0 1 1 6 13 4.324 1 1 0 0 0 1 1 7 10 4.205 1 1 0 1 0 0 1 8 11 4.193 1 1 0 0 0 0 1 9 12 4.189 1 1 0 1 0 0 1 10 12 4.182 1 0 0 0 0 1 1 11 12 4.169 1 1 0 1 0 0 1 12 8 4.107 1 1 0 1 0 1 1 13 13 4.027 0 1 1 1 0 1 1 14 10 3.994 0 1 1 1 0 1 1 15 11 3.979 1 1 1 1 0 1 1 16 10 3.932 1 1 0 1 0 1 1 17 11 3.926 1 1 0 0 0 1 1 18 12 3.913 1 0 1 1 0 0 1 19 12 3.872 0 1 1 1 0 1 1 20 12 3.864 1 1 1 0 0 1 1 21 14 3.853 1 1 0 1 0 1 1 22 9 3.849 1 1 0 1 0 0 1 23 12 3.846 1 1 1 1 0 0 1 24 10 3.829 0 1 1 1 0 1 0 25 10 3.829 0 1 1 1 0 1 1 26 12 3.826 1 0 0 0 1 0 1 27 7 3.804 1 1 0 1 0 1 1 28 10 3.802 0 1 0 1 0 1 1 29 10 3.787 0 1 0 1 0 1 0 30 9 3.779 1 1 0 1 0 1 1 31 11 3.774 0 1 0 1 0 1 1 32 8 3.759 1 1 0 0 0 0 1 33 13 3.758 1 1 0 0 0 1 1 34 11 3.757 1 1 0 1 0 0 0 35 12 3.754 0 1 1 1 0 1 1 36 10 3.750 1 1 0 1 0 1 1 37 11 3.747 0 1 1 1 0 1 1 38 12 3.744 1 0 1 1 0 0 1 39 11 3.742 1 1 0 1 0 1 1 40 9 3.740 1 1 0 1 0 1 1 41 12 3.740 1 1 1 1 0 1 1 42 12 3.739 1 1 0 1 0 1 1 43 9 3.734 1 1 0 0 0 0 1 44 12 3.730 1 1 0 1 0 0 1 45 11 3.725 0 1 1 1 0 1 1 46 12 3.717 0 1 0 0 1 1 1 47 9 3.713 0 1 0 1 0 1 1 48 9 3.713 1 1 1 1 0 1 1 49 10 3.709 0 1 0 1 0 1 1 50 11 3.709 1 1 0 1 0 1 1 51 11 3.701 0 1 1 1 1 1 1 52 12 3.685 1 1 0 1 0 1 1 53 10 3.680 0 0 0 1 0 1 0 54 11 3.676 1 1 1 1 0 0 1 55 9 3.668 0 1 0 1 0 1 1 56 9 3.659 0 0 0 1 0 1 0 57 14 3.657 1 1 0 1 1 1 1 58 10 3.655 1 1 0 1 0 0 1 59 11 3.643 0 1 1 1 0 1 1 60 9 3.643 0 1 0 1 0 1 0 61 8 3.640 1 1 0 1 0 1 0 62 12 3.640 1 1 1 1 0 1 1 63 10 3.638 1 1 0 1 0 0 1 64 12 3.633 1 0 0 1 1 0 1 65 10 3.632 1 1 0 1 0 1 1 66 11 3.627 1 1 0 1 0 1 0 67 10 3.627 1 1 0 0 0 1 0 68 10 3.623 1 1 1 0 0 0 1 69 11 3.619 1 0 0 1 0 1 1 70 6 3.617 1 1 0 1 0 0 1 71 12 3.617 1 0 0 1 0 1 1 72 11 3.613 1 1 0 1 0 1 0 73 11 3.608 1 1 0 1 0 1 0 74 13 3.608 1 1 1 1 0 1 1 75 11 3.605 0 1 1 1 0 1 1 76 11 3.602 0 1 1 1 0 1 1 77 10 3.600 1 1 0 1 0 0 0 78 11 3.596 1 1 0 1 0 0 1 79 10 3.592 1 1 0 1 0 1 0 80 11 3.587 1 0 1 0 0 0 1 81 13 3.584 1 1 0 1 1 1 1 82 8 3.584 0 1 0 1 0 1 0 83 11 3.581 1 1 1 1 0 1 0 84 13 3.578 1 1 0 1 0 1 0 85 9 3.573 1 1 1 0 0 1 1 86 9 3.572 1 1 0 1 0 0 1 87 13 3.571 1 1 1 1 0 1 0 88 10 3.569 1 1 0 1 0 0 1 89 9 3.569 0 1 0 1 0 1 0 90 8 3.559 0 1 0 1 0 1 0 91 10 3.558 0 1 0 1 0 1 0 92 12 3.554 1 1 0 1 0 1 1 93 11 3.552 0 1 0 1 0 1 0 94 12 3.549 0 1 0 1 0 1 0 95 8 3.547 1 1 1 0 0 1 1 96 12 3.545 1 1 1 1 0 1 1 97 8 3.542 1 1 1 0 0 0 0 98 11 3.536 1 1 1 1 0 0 1 99 14 3.530 1 1 1 1 0 1 1 100 9 3.527 1 1 0 1 0 1 1 101 10 3.522 0 1 1 0 1 1 1 102 12 3.509 1 1 0 1 0 1 1 103 5 3.505 0 1 0 0 0 1 0 104 11 3.500 1 1 0 0 1 0 1 105 11 3.497 1 1 1 1 0 0 1 106 9 3.491 1 1 0 0 0 1 0 107 7 3.489 0 1 1 0 0 1 0 108 13 3.486 1 1 1 1 0 1 1 109 11 3.483 1 1 1 1 0 0 1 110 10 3.477 1 1 1 1 0 1 1 111 10 3.473 1 1 0 0 0 1 1 112 15 3.468 1 1 0 1 1 1 1 113 10 3.467 0 1 0 0 1 1 0 114 12 3.467 1 1 0 0 1 1 1 115 13 3.467 1 1 0 1 1 0 1 116 10 3.467 0 1 0 1 0 1 0 117 8 3.465 1 1 0 1 0 0 1 118 10 3.464 0 1 0 1 1 1 1 119 15 3.464 1 1 0 1 1 1 1 120 11 3.462 1 1 0 1 0 1 1 121 9 3.460 1 1 0 0 0 1 0 122 13 3.453 1 1 0 1 0 1 1 123 12 3.449 1 1 1 0 0 1 0 124 10 3.448 1 1 0 1 0 1 0 125 10 3.445 0 1 1 1 0 1 0 126 6 3.441 0 1 0 0 0 1 0 127 11 3.440 1 1 0 1 0 1 0 128 12 3.440 1 1 0 1 1 0 0 129 11 3.439 1 1 0 1 0 1 0 130 10 3.426 0 1 0 0 1 1 0 131 11 3.423 1 1 0 0 0 0 1 132 10 3.420 1 1 0 0 0 1 0 133 10 3.419 1 1 1 1 0 1 0 134 11 3.417 1 1 0 1 1 0 1 135 12 3.414 0 1 0 1 1 1 1 136 10 3.413 0 1 1 1 0 1 0 137 11 3.400 0 1 0 0 1 1 0 138 12 3.398 1 1 0 1 0 1 0 139 13 3.396 1 1 0 1 0 1 0 140 9 3.386 1 1 0 0 0 1 0 141 9 3.373 1 1 0 1 0 1 0 142 12 3.363 1 1 0 0 1 0 1 143 8 3.362 0 1 0 1 0 1 0 144 10 3.360 1 1 0 1 0 1 1 145 9 3.359 1 1 1 0 0 1 0 146 7 3.349 0 1 0 0 0 0 0 147 7 3.348 1 1 0 0 0 1 1 148 9 3.340 1 0 0 0 0 1 0 149 9 3.335 1 1 0 1 0 1 0 150 11 3.333 0 1 1 1 0 1 0 151 9 3.333 0 0 0 1 0 1 0 152 10 3.328 1 1 0 1 0 1 0 153 7 3.315 0 1 0 1 0 1 0 154 11 3.311 1 1 0 1 1 1 1 155 11 3.293 1 1 0 1 0 1 0 156 8 3.292 1 1 0 1 0 0 0 157 9 3.289 0 1 0 1 0 1 0 158 7 3.229 0 1 0 0 0 1 0 159 7 3.229 1 1 0 0 0 1 0 160 7 3.203 1 1 0 1 0 0 0 161 12 3.161 1 1 1 0 1 1 0 162 9 3.138 1 1 0 0 1 0 1 163 13 3.078 1 1 0 0 1 0 1 Iden- Proteins tifier IBP3 TSP1 BGH3 TETN FRIL LG3BP GGH PRDX1 LRP1 1 1 0 0 0 1 1 0 0 1 2 1 0 0 0 1 1 0 0 1 3 1 1 1 1 1 0 0 1 1 4 1 1 0 0 1 1 1 1 1 5 0 1 1 1 1 0 1 1 1 6 1 1 1 1 1 1 1 1 1 7 0 1 1 1 1 0 0 1 1 8 0 1 1 1 1 0 1 1 1 9 1 1 1 1 1 0 0 1 1 10 1 1 1 1 1 1 0 1 1 11 1 1 0 0 1 1 1 1 1 12 0 0 0 0 1 1 0 0 1 13 1 1 0 0 1 1 1 1 1 14 1 0 0 0 1 1 0 0 1 15 0 0 0 0 1 1 1 0 1 16 0 0 0 1 1 1 0 0 1 17 1 1 1 1 1 0 0 1 1 18 1 1 0 0 1 1 1 1 1 19 1 0 0 0 1 1 1 1 1 20 0 1 1 1 1 1 0 1 1 21 1 1 1 1 1 1 0 1 1 22 0 1 1 1 1 0 0 0 1 23 1 1 0 0 1 1 1 1 1 24 1 0 0 0 1 1 1 1 1 25 1 0 0 0 1 1 1 0 1 26 1 1 1 1 1 0 1 1 1 27 0 0 0 0 0 1 0 0 1 28 1 0 0 0 1 1 1 1 1 29 1 1 0 0 1 1 1 1 1 30 0 0 0 0 1 1 0 0 1 31 1 0 0 0 1 1 1 1 1 32 0 0 1 1 1 0 0 1 1 33 1 1 1 1 1 1 0 1 1 34 1 1 1 1 1 1 0 1 1 35 1 1 0 0 1 1 1 1 1 36 1 0 0 0 1 1 0 1 1 37 1 1 0 0 1 1 1 1 0 38 1 1 1 1 1 0 0 1 1 39 1 1 0 1 1 1 0 0 1 40 1 0 0 0 1 1 0 0 1 41 1 0 0 1 1 1 0 0 1 42 1 1 0 0 1 1 1 1 1 43 0 1 1 1 1 0 0 1 1 44 1 1 1 1 1 1 0 1 1 45 1 0 0 1 1 1 0 0 1 46 1 1 1 1 1 1 1 1 0 47 1 0 0 0 1 1 0 1 1 48 0 0 0 0 1 1 0 0 1 49 1 0 0 0 1 1 1 0 1 50 0 1 1 1 1 1 0 0 1 51 1 0 0 0 1 1 0 0 1 52 1 1 1 1 1 1 0 0 1 53 1 1 1 1 1 1 0 1 1 54 0 1 1 1 1 0 0 1 1 55 1 0 0 0 1 1 1 0 1 56 1 1 0 0 1 1 1 1 0 57 1 1 1 1 1 0 0 1 1 58 0 1 0 0 1 1 1 0 1 59 1 0 0 0 1 1 1 1 1 60 1 0 1 0 1 1 0 0 1 61 1 0 0 0 1 1 0 0 1 62 0 0 0 1 1 1 0 1 1 63 0 1 1 1 1 1 0 0 1 64 1 1 1 1 1 0 0 1 1 65 1 0 0 0 1 1 0 0 1 66 1 1 1 1 1 1 0 0 1 67 1 1 1 1 1 1 0 0 1 68 0 1 1 1 1 1 0 0 1 69 1 1 1 0 1 1 0 0 1 70 0 0 0 0 0 1 0 0 1 71 1 1 1 1 1 0 0 1 1 72 1 1 0 0 1 1 1 1 1 73 1 1 1 0 1 1 0 1 1 74 1 1 0 0 1 1 0 1 1 75 1 0 0 0 1 1 0 1 1 76 1 0 0 0 1 1 1 0 1 77 1 1 1 1 1 1 0 1 0 78 1 1 1 1 1 0 1 0 1
79 1 1 0 0 1 1 0 1 1 80 1 1 1 1 0 1 0 1 1 81 1 1 1 1 1 1 0 0 1 82 1 1 0 0 1 1 0 1 0 83 1 1 0 0 1 1 1 1 0 84 1 1 1 1 1 1 0 1 1 85 1 0 0 0 1 1 0 0 0 86 0 1 0 0 1 1 0 0 1 87 1 1 0 0 1 1 1 1 1 88 1 1 0 1 1 0 0 1 1 89 1 1 0 0 1 1 0 1 1 90 1 0 0 0 1 1 0 0 1 91 1 0 0 1 1 1 1 1 1 92 0 1 1 1 1 0 1 1 1 93 1 1 0 0 1 1 1 1 1 94 1 1 1 1 1 1 1 1 1 95 1 1 0 0 0 1 0 0 0 96 1 0 0 0 1 1 1 0 1 97 1 1 0 1 0 1 0 0 0 98 1 0 0 0 1 1 1 1 1 99 1 1 0 1 1 1 1 1 0 100 0 1 0 0 1 1 0 0 1 101 1 1 0 0 1 1 0 1 0 102 0 0 1 1 1 1 0 1 1 103 1 1 0 0 0 1 0 0 0 104 1 1 1 1 1 0 1 1 0 105 1 1 0 0 1 1 0 0 1 106 1 1 0 0 0 1 1 1 0 107 1 1 0 0 0 1 0 1 0 108 1 0 0 1 1 1 0 1 1 109 1 0 0 0 1 1 1 0 1 110 1 0 0 0 1 1 0 0 1 111 0 0 1 1 1 1 0 0 1 112 1 1 1 1 1 0 1 1 1 113 1 1 1 1 1 1 0 1 0 114 1 1 1 1 0 1 0 1 1 115 1 1 1 1 1 0 0 1 1 116 1 1 0 0 1 1 1 0 1 117 0 1 0 0 1 1 0 0 1 118 1 0 0 0 1 1 0 0 1 119 1 1 1 1 1 1 1 1 0 120 0 0 0 1 1 1 0 1 1 121 1 1 1 1 0 1 0 1 0 122 1 1 1 1 1 1 1 1 0 123 1 1 0 1 1 1 1 1 0 124 1 1 0 0 1 1 1 1 0 125 1 1 0 0 1 1 0 1 1 126 1 1 0 0 0 1 0 0 0 127 1 1 0 0 1 1 1 0 1 128 1 1 1 1 1 0 0 1 1 129 1 0 0 0 1 1 1 1 1 130 1 1 1 1 0 1 0 1 0 131 1 1 1 1 1 1 1 1 0 132 1 1 0 1 1 1 1 1 0 133 1 0 0 0 1 1 0 0 1 134 0 0 1 1 1 0 0 1 1 135 1 1 0 1 1 1 0 0 1 136 1 1 0 0 1 1 0 1 0 137 1 1 1 1 1 1 0 1 0 138 1 0 1 1 1 1 1 1 1 139 1 1 1 1 1 1 1 1 1 140 1 1 0 0 1 1 1 1 0 141 1 0 0 0 1 1 0 0 1 142 1 1 1 1 1 1 1 1 0 143 1 0 0 0 1 1 0 1 1 144 0 0 0 1 1 1 0 1 0 145 1 1 0 0 1 1 0 0 0 146 1 1 1 1 0 1 0 0 0 147 1 1 0 0 0 1 0 0 0 148 1 1 1 1 0 1 0 1 0 149 1 1 0 0 1 1 0 0 1 150 1 1 0 0 1 1 0 1 1 151 1 1 1 0 1 1 0 0 1 152 1 0 0 0 1 1 1 0 1 153 1 0 0 0 1 1 0 0 1 154 0 0 0 1 1 1 1 0 0 155 1 0 1 0 1 1 0 1 1 156 1 1 0 0 1 1 0 0 1 157 1 1 0 0 1 1 0 1 0 158 1 1 0 0 1 1 0 0 0 159 1 1 0 0 0 1 0 1 0 160 1 0 0 0 1 1 0 0 1 161 1 1 1 1 1 1 0 1 0 162 0 0 1 1 1 1 0 0 0 163 1 1 1 1 1 1 1 1 0 1 = in the panel; 0 = not in the panel.
The one hundred best random panels of proteins out of the million generated are shown in Table 2.
TABLE-US-00002 TABLE 2 Protein 1 Protein 2 Protein 3 Protein 4 Protein 5 Protein 6 Protein 7 Protein 8 Protein 9 Protein 10 1 IBP3 TSP1 CO6A3 PDIA3 SEM3G SAA 6PGD EF1A1 PRDX1 TERA 2 EPHB6 CNTN1 CLUS IBP3 BGH3 6PGD FRIL LRP1 TBB3 ERO1A 3 PPIB LG3BP MDHC DSG2 BST1 CD14 DESP PRDX1 CDCP1 MMP9 4 TPIS COIA1 IBP3 GGH ISLR MMP2 AIFM1 DSG2 1433T CBPB2 5 TPIS IBP3 CH10 SEM3G 6PGD FRIL ICAM3 TERA FINC ERO1A 6 BGH3 ICAM1 MMP12 6PGD CD14 EF1A1 HYOU1 PLXC1 PROF1 ERO1A 7 KIT LG3BP TPIS IBP3 LDHB GGH TCPA ISLR CBPB2 EF1A1 8 LG3BP IBP3 LDHB TSP1 CRP ZA2G CD14 LRP1 PLIN2 ERO1A 9 COIA1 TSP1 ISLR TFR1 CBPB2 FRIL LRP1 UGPA PTPA ERO1A 10 CO6A3 SEM3G APOE FRIL ICAM3 PRDX1 EF2 HS90B NCF4 PTPA 11 PPIB LG3BP COIA1 APOA1 DSG2 APOE CD14 PLXC1 NCF4 GSLG1 12 SODM EPHB6 C163A COIA1 LDHB TETN 1433T CD14 PTPA ERO1A 13 SODM KPYM IBP3 TSP1 BGH3 SEM3G 6PGD CD14 RAP2B EREG 14 EPHB6 ALDOA MMP7 COIA1 TIMP1 GRP78 MMP12 CBPB2 G3P PTPA 15 KIT TSP1 SCF TIMP1 OSTP PDIA3 GRP78 TNF12 PRDX1 PTPA 16 IBP2 LG3BP GELS HPT FIBA GGH ICAM1 BST1 HYOU1 GSLG1 17 KIT CD44 CH10 PEDF ICAM1 6PGD S10A1 ERO1A GSTP1 MMP9 18 LG3BP C163A GGH ERBB3 TETN BGH3 ENOA GDIR2 LRP1 ERO1A 19 SODM KPYM BGH3 FOLH1 6PGD DESP LRP1 TBA1B ERO1A GSTP1 20 CNTN1 TETN ICAM1 K1C19 ZA2G 6PGD EF2 RAN ERO1A GSTP1 21 GELS ENPL OSTP PEDF ICAM1 BST1 TNF12 GDIR2 LRP1 ERO1A 22 KIT LDHA IBP3 PEDF DSG2 FOLH1 CD14 LRP1 UGPA ERO1A 23 KIT TSP1 ISLR BGH3 COF1 PTPRJ 6PGD LRP1 S10A6 MPRI 24 LG3BP C163A GGH DSG2 ICAM1 6PGD GDIR2 HYOU1 EREG ERO1A 25 IBP2 C163A ENPL FIBA BGH3 CERU 6PGD LRP1 PRDX1 MMP9 26 LG3BP C163A TENX PDIA3 SEM3G BST1 VTNC FRIL PRDX1 ERO1A 27 ALDOA COIA1 TETN 1433T CBPB2 CD14 G3P CD59 ERO1A MMP9 28 IBP3 TENX CRP TETN MMP2 SEM3G VTNC CD14 PROF1 ERO1A 29 SODM EPHB6 TPIS TENX ERBB3 SCF TETN FRIL LRP1 ERO1A 30 LG3BP IBP3 POSTN DSG2 MDHM 1433Z CD14 EF1A1 PLXC1 ERO1A 31 IBP2 LG3BP COIA1 CNTN1 IBP3 POSTN TETN BGH3 6PGD ERO1A 32 PVR TSP1 GGH CYTB AIFM1 ICAM1 MDHM 1433Z 6PGD FRIL 33 LYOX GELS COIA1 IBP3 AIFM1 ICAM1 FRIL PRDX1 RAP2B NCF4 34 KIT AMPN TETN TNF12 6PGD FRIL LRP1 EF2 ERO1A MMP9 35 LG3BP GELS COIA1 CLUS CALU AIFM1 1433T CD14 UGPA S10A1 36 ALDOA IBP3 TSP1 TETN SEM3G ICAM1 EF1A1 G3P RAP2B NCF4 37 ALDOA COIA1 CH10 TETN PTPRJ SEM3G 1433T 6PGD FRIL ERO1A 38 LG3BP COIA1 PLSL FIBA TENX POSTN CD14 LRP1 NCF4 ERO1A 39 LUM IBP3 CH10 AIFM1 MDHM 6PGD PLXC1 EF2 CD59 GSTP1 40 SODM LG3BP LUM LDHA MDHC GGH ICAM1 LRP1 TBA1B ERO1A 41 LG3BP CD44 IBP3 CALU CERU 1433T CD14 CLIC1 NCF4 ERO1A 42 LG3BP TPIS COIA1 HPT FIBA AIFM1 1433Z 6PGD CD14 EF2 43 ALDOA CD44 MMP2 CD14 FRIL PRDX1 RAN NCF4 MPRI PTPA 44 COIA1 CLUS OSTP ICAM1 1433T PLXC1 PTGIS RAP2B PTPA GSTP1 45 KIT LYOX IBP3 GRP78 FOLH1 MASP1 CD14 LRP1 ERO1A GSTP1 46 LG3BP GGH CRP SCF ICAM1 ZA2G 1433T RAN NCF4 ERO1A 47 LG3BP C163A BGH3 MMP2 GRP78 LRP1 RAN ITA5 HS90B PTPA 48 ALDOA CLUS TENX ICAM1 K1C19 MASP1 6PGD CBPB2 PRDX1 PTPA 49 IBP3 PDIA3 PEDF FOLH1 ICAM1 NRP1 6PGD UGPA RAN ERO1A 50 ENPL FIBA ISLR SAA 6PGD PRDX1 EF2 PLIN2 HS90B GSLG1 51 LG3BP COIA1 CO6A3 GGH ERBB3 FOLH1 ICAM1 RAN CDCP1 ERO1A 52 GELS ENPL A1AG1 SCF COF1 ICAM1 6PGD RAP2B EF2 HS90B 53 SODM IBP2 COIA1 CLUS IBP3 ENPL PLSL TNF12 6PGD ERO1A 54 KIT MMP7 COIA1 TSP1 CO6A3 GGH PDIA3 ICAM1 LRP1 GSLG1 55 ALDOA COIA1 TSP1 CH10 NRP1 CD14 DESP LRP1 CLIC1 ERO1A 56 C163A GELS CALU A1AG1 AIFM1 DSG2 ICAM1 6PGD RAP2B NCF4 57 PPIB LG3BP IBP3 TSP1 PLSL GRP78 FOLH1 6PGD HYOU1 RAP2B 58 KIT LG3BP LUM GELS OSTP ICAM1 CD14 EF1A1 NCF4 MMP9 59 KIT PPIB LG3BP GELS FOLH1 ICAM1 MASP1 GDIR2 ITA5 NCF4 60 IBP3 ENPL ERBB3 BGH3 VTNC 6PGD EF1A1 TBA1B S10A6 HS90B 61 LG3BP CLUS IBP3 SCF TCPA ISLR GRP78 6PGD ERO1A GSTP1 62 LG3BP LEG1 GELS GGH TETN ENOA ICAM1 MASP1 FRIL NCF4 63 LG3BP CD44 TETN BGH3 G3P LRP1 PRDX1 CDCP1 PTPA MMP9 64 CALU ENPL ICAM1 VTNC FRIL LRP1 PROF1 TBB3 GSLG1 ERO1A 65 PPIB PLSL TENX A1AG1 COF1 6PGD FRIL LRP1 CLIC1 ERO1A 66 IBP2 IBP3 CERU ENOA 6PGD CD14 LRP1 PDGFB ERO1A GSTP1 67 COIA1 1433T CD14 DESP GDIR2 PLXC1 PROF1 RAP2B RAN ERO1A 68 LYOX OSTP TETN SEM3G ICAM1 ZA2G FRIL EREG RAN ERO1A 69 LG3BP IBP3 TSP1 PEDF FOLH1 MDHM TNF12 NRP1 S10A6 RAP2B 70 KIT ALDOA LG3BP COIA1 TSP1 A1AG1 BGH3 SEM3G FOLH1 RAN 71 ALDOA OSTP BST1 CD14 G3P PRDX1 PTGIS FINC PTPA MMP9 72 EPHB6 TETN PEDF ICAM1 APOE PROF1 UGPA NCF4 GSLG1 PTPA 73 LG3BP COIA1 ENPL MMP2 1433T EF1A1 LRP1 HS90B GSLG1 ERO1A 74 KIT IBP3 CYTB MMP2 1433Z 6PGD CLIC1 EF2 NCF4 PTPA 75 SODM LYOX IBP3 TETN SEM3G CD14 PRDX1 PTPA ERO1A GSTP1 76 SODM KPYM COIA1 MDHC TCPA CD14 FRIL LRP1 EF2 ERO1A 77 PPIB LG3BP FIBA GRP78 AIFM1 ICAM1 6PGD NCF4 GSLG1 PTPA 78 LG3BP C163A PVR MDHC TETN SEM3G AIFM1 6PGD EREG ERO1A 79 GELS ISLR BGH3 DSG2 ICAM1 SAA HYOU1 ICAM3 PTGIS RAP2B 80 KPYM TPIS IBP3 TIMP1 GRP78 ICAM1 LRP1 TERA ERO1A MMP9 81 IBP3 HPT TSP1 GRP78 SAA MMP12 1433Z 6PGD CD14 S10A6 82 TENX A1AG1 ENOA AIFM1 6PGD CD14 FRIL LRP1 RAP2B CD59 83 ALDOA KPYM ISLR TETN BGH3 VTNC LRP1 ITA5 PTPA MMP9 84 SODM TENX ISLR TETN VTNC 6PGD LRP1 EF2 ERO1A MMP9 85 LG3BP C163A COIA1 FOLH1 CD14 LRP1 TBA1B GSLG1 ERO1A GSTP1 86 SODM PVR COIA1 ISLR PDIA3 APOE CD14 FRIL LRP1 CDCP1 87 ALDOA PEDF ICAM1 6PGD CD14 FINC RAN NCF4 GSLG1 PTPA 88 LG3BP KPYM GELS COIA1 IBP3 CD14 EF1A1 PLIN2 HS90B ERO1A 89 LG3BP PVR CLUS TETN COF1 SEM3G DESP EF2 HS90B ERO1A 90 LG3BP COIA1 FIBA TETN TFR1 ICAM1 MDHM CD14 PLXC1 ERO1A 91 PPIB LG3BP GELS CLUS TENX ICAM1 SAA NCF4 PTPA ERO1A 92 COIA1 TSP1 ISLR BGH3 SAA 6PGD LRP1 PROF1 EREG ERO1A 93 CALU FIBA OSTP ISLR PDIA3 SEM3G K1C19 6PGD HYOU1 RAP2B 94 FIBA CH10 GRP78 SEM3G AIFM1 ICAM1 MDHM FRIL UGPA GSTP1 95 COIA1 IBP3 PDIA3 ICAM1 K1C19 CD14 EF1A1 FRIL PTGIS PDGFB 96 LG3BP C163A COIA1 LDHA 1433T 1433Z FRIL LRP1 ERO1A MMP9 97 LG3BP GELS COIA1 GRP78 SEM3G FRIL PLXC1 PROF1 S10A1 ERO1A 98 LG3BP COIA1 ENPL GRP78 AIFM1 ICAM1 1433Z CD14 LRP1 ERO1A 99 COIA1 PLSL NRP1 1433T CD14 FRIL LRP1 RAP2B PDGFB ERO1A 100 IBP2 COIA1 TETN DSG2 FOLH1 1433T CD14 FRIL LRP1 ERO1A
Preferred panels for ruling in treatment for a subject include the panels listed on Table 3 and 4. In various other embodiments, the panels according to the invention include measuring at least 2, 3, 4, 5, 6, 7, or more of the proteins listed on Tables 2 and 3.
TABLE-US-00003 TABLE 3 Average (19) Rule-out (20) Rule-in (16) ERO1A ERO1A ERO1A 6PGD 6PGD 6PGD FRIL FRIL FRIL GSTP1 GSTP1 GSTP1 COIA1 COIA1 COIA1 GGH GGH GGH PRDX1 PRDX1 PRDX1 LRP1 CD14 SEM3G ICAM1 LRP1 GRP78 CD14 LG3BP TETN LG3BP PTPA AIFM1 PTPA ICAM1 TSP1 TETN TSP1 MPRI GRP78 IBP3 TNF12 AIFM1 FOLH1 MMP9 SEM3G SODM OSTP BGH3 FIBA PDIA3 GSLG1 FINC RAP2B C163A
TABLE-US-00004 TABLE 4 Average (13) Rule-out (13) Rule-in (9) LRP1 LRP1 ( LRP1 BGH3 COIA1 COIA1 COIA1 TETN TETN TETN TSP1 TSP1 TSP1 ALDOA ALDOA PRDX1 GRP78 GRP78 PROF1 FRIL FRIL GRP78 LG3BP APOE FRIL BGH3 TBB3 LG3BP ISLR CD14 PRDX1 GGH FIBA AIFM1 GSLG1
A preferred normalizer panel is listed in Table 5.
TABLE-US-00005 TABLE 5 Normalizer (6) PEDF MASP1 GELS LUM C163A PTPRJ
The term "pulmonary nodules" (PNs) refers to lung lesions that can be visualized by radiographic techniques. A pulmonary nodule is any nodules less than or equal to three centimeters in diameter. In one example a pulmonary nodule has a diameter of about 0.8 cm to 2 cm.
The term "masses" or "pulmonary masses" refers to lung nodules that are greater than three centimeters maximal diameter.
The term "blood biopsy" refers to a diagnostic study of the blood to determine whether a patient presenting with a nodule has a condition that may be classified as either benign or malignant.
The term "acceptance criteria" refers to the set of criteria to which an assay, test, diagnostic or product should conform to be considered acceptable for its intended use. As used herein, acceptance criteria are a list of tests, references to analytical procedures, and appropriate measures, which are defined for an assay or product that will be used in a diagnostic. For example, the acceptance criteria for the classifier refers to a set of predetermined ranges of coefficients.
The term "average maximal AUC" refers to the methodology of calculating performance. For the present invention, in the process of defining the set of proteins that should be in a panel by forward or backwards selection proteins are removed or added one at a time. A plot can be generated with performance (AUC or partial AUC score on the Y axis and proteins on the X axis) the point which maximizes performance indicates the number and set of proteins the gives the best result.
The term "partial AUC factor or pAUC factor" is greater than expected by random prediction. At sensitivity=0.90 the pAUC factor is the trapezoidal area under the ROC curve from 0.9 to 1.0 Specificity/(0.1*0.1/2).
The term "incremental information" refers to information that may be used with other diagnostic information to enhance diagnostic accuracy. Incremental information is independent of clinical factors such as including nodule size, age, or gender.
The term "score" or "scoring" refers to the refers to calculating a probability likelihood for a sample. For the present invention, values closer to 1.0 are used to represent the likelihood that a sample is cancer, values closer to 0.0 represent the likelihood that a sample is benign.
The term "robust" refers to a test or procedure that is not seriously disturbed by violations of the assumptions on which it is based. For the present invention, a robust test is a test wherein the proteins or transitions of the mass spectrometry chromatograms have been manually reviewed and are "generally" free of interfering signals
The term "coefficients" refers to the weight assigned to each protein used to in the logistic regression equation to score a sample.
In certain embodiments of the invention, it is contemplated that in terms of the logistic regression model of MC CV, the model coefficient and the coefficient of variation (CV) of each protein's model coefficient may increase or decrease, dependent upon the method (or model) of measurement of the protein classifier. For each of the listed proteins in the panels, there is about, at least, at least about, or at most about a 2-, 3-, 4-, 5-, 6-, 7-, 8-, 9-, or 10-, -fold or any range derivable therein for each of the coefficient and CV. Alternatively, it is contemplated that quantitative embodiments of the invention may be discussed in terms of as about, at least, at least about, or at most about 10, 20, 30, 40, 50, 51, 52, 53, 54, 55, 56, 57, 58, 59, 60, 61, 62, 63, 64, 65, 66, 67, 68, 69, 70, 71, 72, 73, 74, 75, 76, 77, 78, 79, 80, 81, 82, 83, 84, 85, 86, 87, 88, 89, 90, 91, 92, 93, 94, 95, 96, 97, 98, 99% or more, or any range derivable therein.
The term "best team players" refers to the proteins that rank the best in the random panel selection algorithm, i.e., perform well on panels. When combined into a classifier these proteins can segregate cancer from benign samples. "Best team player" proteins is synonymous with "cooperative proteins". The term "cooperative proteins" refers proteins that appear more frequently on high performing panels of proteins than expected by chance. This gives rise to a protein's cooperative score which measures how (in)frequently it appears on high performing panels. For example, a protein with a cooperative score of 1.5 appears on high performing panels 1.5.times. more than would be expected by chance alone.
The term "classifying" as used herein with regard to a lung condition refers to the act of compiling and analyzing expression data for using statistical techniques to provide a classification to aid in diagnosis of a lung condition, particularly lung cancer.
The term "classifier" as used herein refers to an algorithm that discriminates between disease states with a predetermined level of statistical significance. A two-class classifier is an algorithm that uses data points from measurements from a sample and classifies the data into one of two groups. In certain embodiments, the data used in the classifier is the relative expression of proteins in a biological sample. Protein expression levels in a subject can be compared to levels in patients previously diagnosed as disease free or with a specified condition.
The "classifier" maximizes the probability of distinguishing a randomly selected cancer sample from a randomly selected benign sample, i.e., the AUC of ROC curve.
In addition to the classifier's constituent proteins with differential expression, it may also include proteins with minimal or no biologic variation to enable assessment of variability, or the lack thereof, within or between clinical specimens; these proteins may be termed endogenous proteins and serve as internal controls for the other classifier proteins.
The term "normalization" or "normalizer" as used herein refers to the expression of a differential value in terms of a standard value to adjust for effects which arise from technical variation due to sample handling, sample preparation and mass spectrometry measurement rather than biological variation of protein concentration in a sample. For example, when measuring the expression of a differentially expressed protein, the absolute value for the expression of the protein can be expressed in terms of an absolute value for the expression of a standard protein that is substantially constant in expression. This prevents the technical variation of sample preparation and mass spectrometry measurement from impeding the measurement of protein concentration levels in the sample.
The term "condition" as used herein refers generally to a disease, event, or change in health status.
The term "treatment protocol" as used herein including further diagnostic testing typically performed to determine whether a pulmonary nodule is benign or malignant. Treatment protocols include diagnostic tests typically used to diagnose pulmonary nodules or masses such as for example, CT scan, positron emission tomography (PET) scan, bronchoscopy or tissue biopsy. Treatment protocol as used herein is also meant to include therapeutic treatments typically used to treat malignant pulmonary nodules and/or lung cancer such as for example, chemotherapy, radiation or surgery.
The terms "diagnosis" and "diagnostics" also encompass the terms "prognosis" and "prognostics", respectively, as well as the applications of such procedures over two or more time points to monitor the diagnosis and/or prognosis over time, and statistical modeling based thereupon. Furthermore the term diagnosis includes: a. prediction (determining if a patient will likely develop a hyperproliferative disease) b. prognosis (predicting whether a patient will likely have a better or worse outcome at a pre-selected time in the future) c. therapy selection d. therapeutic drug monitoring e. relapse monitoring.
In some embodiments, for example, classification of a biological sample as being derived from a subject with a lung condition may refer to the results and related reports generated by a laboratory, while diagnosis may refer to the act of a medical professional in using the classification to identify or verify the lung condition.
The term "providing" as used herein with regard to a biological sample refers to directly or indirectly obtaining the biological sample from a subject. For example, "providing" may refer to the act of directly obtaining the biological sample from a subject (e.g., by a blood draw, tissue biopsy, lavage and the like). Likewise, "providing" may refer to the act of indirectly obtaining the biological sample. For example, providing may refer to the act of a laboratory receiving the sample from the party that directly obtained the sample, or to the act of obtaining the sample from an archive.
As used herein, "lung cancer" preferably refers to cancers of the lung, but may include any disease or other disorder of the respiratory system of a human or other mammal. Respiratory neoplastic disorders include, for example small cell carcinoma or small cell lung cancer (SCLC), non-small cell carcinoma or non-small cell lung cancer (NSCLC), squamous cell carcinoma, adenocarcinoma, broncho-alveolar carcinoma, mixed pulmonary carcinoma, malignant pleural mesothelioma, undifferentiated large cell carcinoma, giant cell carcinoma, synchronous tumors, large cell neuroendocrine carcinoma, adenosquamous carcinoma, undifferentiated carcinoma; and small cell carcinoma, including oat cell cancer, mixed small cell/large cell carcinoma, and combined small cell carcinoma; as well as adenoid cystic carcinoma, hamartomas, mucoepidermoid tumors, typical carcinoid lung tumors, atypical carcinoid lung tumors, peripheral carcinoid lung tumors, central carcinoid lung tumors, pleural mesotheliomas, and undifferentiated pulmonary carcinoma and cancers that originate outside the lungs such as secondary cancers that have metastasized to the lungs from other parts of the body. Lung cancers may be of any stage or grade. Preferably the term may be used to refer collectively to any dysplasia, hyperplasia, neoplasia, or metastasis in which the protein biomarkers expressed above normal levels as may be determined, for example, by comparison to adjacent healthy tissue.
Examples of non-cancerous lung condition include chronic obstructive pulmonary disease (COPD), benign tumors or masses of cells (e.g., hamartoma, fibroma, neurofibroma), granuloma, sarcoidosis, and infections caused by bacterial (e.g., tuberculosis) or fungal (e.g. histoplasmosis) pathogens. In certain embodiments, a lung condition may be associated with the appearance of radiographic PNs.
As used herein, "lung tissue", and "lung cancer" refer to tissue or cancer, respectively, of the lungs themselves, as well as the tissue adjacent to and/or within the strata underlying the lungs and supporting structures such as the pleura, intercostal muscles, ribs, and other elements of the respiratory system. The respiratory system itself is taken in this context as representing nasal cavity, sinuses, pharynx, larynx, trachea, bronchi, lungs, lung lobes, aveoli, aveolar ducts, aveolar sacs, aveolar capillaries, bronchioles, respiratory bronchioles, visceral pleura, parietal pleura, pleural cavity, diaphragm, epiglottis, adenoids, tonsils, mouth and tongue, and the like. The tissue or cancer may be from a mammal and is preferably from a human, although monkeys, apes, cats, dogs, cows, horses and rabbits are within the scope of the present invention. The term "lung condition" as used herein refers to a disease, event, or change in health status relating to the lung, including for example lung cancer and various non-cancerous conditions.
"Accuracy" refers to the degree of conformity of a measured or calculated quantity (a test reported value) to its actual (or true) value. Clinical accuracy relates to the proportion of true outcomes (true positives (TP) or true negatives (TN) versus misclassified outcomes (false positives (FP) or false negatives (FN)), and may be stated as a sensitivity, specificity, positive predictive values (PPV) or negative predictive values (NPV), or as a likelihood, odds ratio, among other measures.
The term "biological sample" as used herein refers to any sample of biological origin potentially containing one or more biomarker proteins. Examples of biological samples include tissue, organs, or bodily fluids such as whole blood, plasma, serum, tissue, lavage or any other specimen used for detection of disease.
The term "subject" as used herein refers to a mammal, preferably a human.
The term "biomarker protein" as used herein refers to a polypeptide in a biological sample from a subject with a lung condition versus a biological sample from a control subject. A biomarker protein includes not only the polypeptide itself, but also minor variations thereof, including for example one or more amino acid substitutions or modifications such as glycosylation or phosphorylation.
The term "biomarker protein panel" as used herein refers to a plurality of biomarker proteins. In certain embodiments, the expression levels of the proteins in the panels can be correlated with the existence of a lung condition in a subject. In certain embodiments, biomarker protein panels comprise 2, 3, 4, 5, 6, 7, 8, 9, 10, 11, 12, 13, 14, 15, 16, 17, 18, 19, 20, 21, 22, 23, 24, 25, 26, 27, 28, 29, 30, 31, 32, 33, 34, 35, 36, 37, 38, 39, 40, 41, 42, 43, 44, 45, 46, 47, 48, 49, 50, 60, 70, 80, 90 or 100 proteins. In certain embodiments, the biomarker proteins panels comprise from 100-125 proteins, 125-150 proteins, 150-200 proteins or more.
"Treating" or "treatment" as used herein with regard to a condition may refer to preventing the condition, slowing the onset or rate of development of the condition, reducing the risk of developing the condition, preventing or delaying the development of symptoms associated with the condition, reducing or ending symptoms associated with the condition, generating a complete or partial regression of the condition, or some combination thereof.
The term "ruling out" as used herein is meant that the subject is selected not to receive a treatment protocol.
The term "ruling-in" as used herein is meant that the subject is selected to receive a treatment protocol.
Biomarker levels may change due to treatment of the disease. The changes in biomarker levels may be measured by the present invention. Changes in biomarker levels may be used to monitor the progression of disease or therapy.
"Altered", "changed" or "significantly different" refer to a detectable change or difference from a reasonably comparable state, profile, measurement, or the like. One skilled in the art should be able to determine a reasonable measurable change. Such changes may be all or none. They may be incremental and need not be linear. They may be by orders of magnitude. A change may be an increase or decrease by 1%, 5%, 10%, 20%, 30%, 40%, 50%, 60%, 70%, 80%, 90%, 95%, 99%, 100%, or more, or any value in between 0% and 100%. Alternatively the change may be 1-fold, 1.5-fold 2-fold, 3-fold, 4-fold, 5-fold or more, or any values in between 1-fold and five-fold. The change may be statistically significant with a p value of 0.1, 0.05, 0.001, or 0.0001.
Using the methods of the current invention, a clinical assessment of a patient is first performed. If there exists is a higher likelihood for cancer, the clinician may rule in the disease which will require the pursuit of diagnostic testing options yielding data which increase and/or substantiate the likelihood of the diagnosis. "Rule in" of a disease requires a test with a high specificity.
"FN" is false negative, which for a disease state test means classifying a disease subject incorrectly as non-disease or normal.
"FP" is false positive, which for a disease state test means classifying a normal subject incorrectly as having disease.
The term "rule in" refers to a diagnostic test with high specificity that coupled with a clinical assessment indicates a higher likelihood for cancer. If the clinical assessment is a lower likelihood for cancer, the clinician may adopt a stance to rule out the disease, which will require diagnostic tests which yield data that decrease the likelihood of the diagnosis. "Rule out" requires a test with a high sensitivity.
The term "rule out" refers to a diagnostic test with high sensitivity that coupled with a clinical assessment indicates a lower likelihood for cancer.
The term "sensitivity of a test" refers to the probability that a patient with the disease will have a positive test result. This is derived from the number of patients with the disease who have a positive test result (true positive) divided by the total number of patients with the disease, including those with true positive results and those patients with the disease who have a negative result, i.e. false negative.
The term "specificity of a test" refers to the probability that a patient without the disease will have a negative test result. This is derived from the number of patients without the disease who have a negative test result (true negative) divided by all patients without the disease, including those with a true negative result and those patients without the disease who have a positive test result, e.g. false positive. While the sensitivity, specificity, true or false positive rate, and true or false negative rate of a test provide an indication of a test's performance, e.g. relative to other tests, to make a clinical decision for an individual patient based on the test's result, the clinician requires performance parameters of the test with respect to a given population.
The term "positive predictive value" (PPV) refers to the probability that a positive result correctly identifies a patient who has the disease, which is the number of true positives divided by the sum of true positives and false positives.
The term "negative predictive value" or "NPV" is calculated by TN/(TN+FN) or the true negative fraction of all negative test results. It also is inherently impacted by the prevalence of the disease and pre-test probability of the population intended to be tested.
The term "disease prevalence" refers to the number of all new and old cases of a disease or occurrences of an event during a particular period. Prevalence is expressed as a ratio in which the number of events is the numerator and the population at risk is the denominator.
The term disease incidence refers to a measure of the risk of developing some new condition within a specified period of time; the number of new cases during some time period, it is better expressed as a proportion or a rate with a denominator.
Lung cancer risk according to the "National Lung Screening Trial" is classified by age and smoking history. High risk--age .gtoreq.55 and .gtoreq.30 pack-years smoking history; Moderate risk--age .gtoreq.50 and .gtoreq.20 pack-years smoking history; Low risk--<age 50 or <20 pack-years smoking history.
The term "negative predictive value" (NPV) refers to the probability that a negative test correctly identifies a patient without the disease, which is the number of true negatives divided by the sum of true negatives and false negatives. A positive result from a test with a sufficient PPV can be used to rule in the disease for a patient, while a negative result from a test with a sufficient NPV can be used to rule out the disease, if the disease prevalence for the given population, of which the patient can be considered a part, is known.
The clinician must decide on using a diagnostic test based on its intrinsic performance parameters, including sensitivity and specificity, and on its extrinsic performance parameters, such as positive predictive value and negative predictive value, which depend upon the disease's prevalence in a given population.
Additional parameters which may influence clinical assessment of disease likelihood include the prior frequency and closeness of a patient to a known agent, e.g. exposure risk, that directly or indirectly is associated with disease causation, e.g. second hand smoke, radiation, etc., and also the radiographic appearance or characterization of the pulmonary nodule exclusive of size. A nodule's description may include solid, semi-solid or ground glass which characterizes it based on the spectrum of relative gray scale density employed by the CT scan technology.
"Mass spectrometry" refers to a method comprising employing an ionization source to generate gas phase ions from an analyte presented on a sample presenting surface of a probe and detecting the gas phase ions with a mass spectrometer.
The technology liquid chromatography selected reaction monitoring mass spectrometry (LC-SRM-MS) was used to assay the expression levels of a cohort of 388 proteins in the blood to identify differences for individual proteins which may correlate with the absence or presence of the disease. The individual proteins have not only been implicated in lung cancer biology, but are also likely to be present in plasma based on their expression as membrane-anchored or secreted proteins. An analysis of epithelial and endothelial membranes of resected lung cancer tissues (including the subtypes of adenocarcinoma, squamous, and large cell) identified 217 tissue proteins. A review of the scientific literature with search terms relevant to lung cancer biology identified 319 proteins. There was an overlap of 148 proteins between proteins identified by cancer tissue analysis or literature review, yielding a total of 388 unique proteins as candidates. The majority of candidate proteins included in the multiplex LC-SRM-MS assay were discovered following proteomics analysis of secretory vesicle contents from fresh NSCLC resections and from adjacent non-malignant tissue. The secretory proteins reproducibly upregulated in the tumor tissue were identified and prioritized for inclusion in the LC-SRM-MS assay using extensive bioinformatic and literature annotation. An additional set of proteins that were present in relevant literature was also added to the assay. In total, 388 proteins associated with lung cancer were prioritized for SRM assay development. Of these, 371 candidate protein biomarkers were ultimately included in the assay. These are listed in Table 6, below.
TABLE-US-00006 TABLE 6 Sources of Subcellular Evidence for Gene Tissue Biomarkers Location Presence in UniProt Protein Protein Name Symbol Biomarkers in Literature (UniProt) Blood 1433B_HUMAN 14-3-3 YWHAB Secreted, LungCancers Cytoplasm. Literature, protein EPI Melanosome. Detection beta/alpha Note = Identified by mass spectrometry in melanosome fractions from stage I to stage IV. 1433E_HUMAN 14-3-3 YWHAE ENDO LungCancers, Cytoplasm (By Literature, protein Benign-Nodules similarity). Detection epsilon Melanosome. Note = Identified by mass spectrometry in melanosome fractions from stage I to stage IV. 1433S_HUMAN 14-3-3 SFN Secreted, LungCancers Cytoplasm. UniProt, protein EPI Nucleus (By Literature, sigma similarity). Detection Secreted. Note = May be secreted by a non-classical secretory pathway. 1433T_HUMAN 14-3-3 YWHAQ EPI LungCancers, Cytoplasm. Detection protein Benign-Nodules Note = In theta neurons, axonally transported to the nerve terminals. 1433Z_HUMAN 14-3-3 YWHAZ EPI LungCancers, Cytoplasm. Detection protein Benign-Nodules Melanosome. zeta/delta Note = Located to stage I to stage IV melanosomes. 6PGD_HUMAN 6-phosphogluconate PGD EPI, ENDO Cytoplasm (By Detection dehydrogenase, similarity). decarboxylating A1AG1_HUMAN Alpha-1- ORM1 EPI Symptoms Secreted. UniProt, acid Literature, glycoprotein 1 Detection, Prediction ABCD1_HUMAN ATP- ABCD1 ENDO Peroxisome Detection, binding membrane; Prediction cassette Multi-pass sub-family membrane D member 1 protein. ADA12_HUMAN Disintegrin ADAM12 LungCancers, Isoform 1: Cell UniProt, and Benign-Nodules, membrane; Detection, metalloproteinase Symptoms Single-pass Prediction domain- type I containing membrane protein 12 protein.|Isoform 2: Secreted.|Isoform 3: Secreted (Potential).|Isoform 4: Secreted (Potential). ADML_HUMAN ADM ADM LungCancers, Secreted. UniProt, Benign-Nodules, Literature, Symptoms Detection, Prediction AGR2_HUMAN Anterior AGR2 EPI LungCancers Secreted. UniProt, gradient Endoplasmic Prediction protein 2 reticulum (By homolog similarity). AIFM1_HUMAN Apoptosis- AIFM1 EPI, ENDO LungCancers Mitochondrion Detection, inducing intermembrane Prediction factor 1, space. Nucleus. mitochondrial Note = Translocated to the nucleus upon induction of apoptosis. ALDOA_HUMAN Fructose- ALDOA Secreted, LungCancers, Literature, bisphosphate EPI Symptoms Detection aldolase A AMPN_HUMAN Aminopeptidase N ANPEP EPI, ENDO LungCancers, Cell membrane; UniProt, Benign-Nodules, Single-pass Detection Symptoms type II membrane protein. Cytoplasm, cytosol (Potential). Note = A soluble form has also been detected. ANGP1_HUMAN Angiopoietin-1 ANGPT1 LungCancers, Secreted. UniProt, Benign-Nodules Literature, Prediction ANGP2_HUMAN Angiopoietin-2 ANGPT2 LungCancers, Secreted. UniProt, Benign-Nodules Literature, Prediction APOA1_HUMAN Apolipoprotein A-I APOA1 LungCancers, Secreted. UniProt, Benign-Nodules, Literature, Symptoms Detection, Prediction APOE_HUMAN Apolipoprotein E APOE EPI, ENDO LungCancers, Secreted. UniProt, Benign-Nodules, Literature, Symptoms Detection, Prediction ASM3B_HUMAN Acid SMPDL3B EPI, ENDO Secreted (By UniProt, sphingomyelinase-like similarity). Prediction phosphodiesterase 3b AT2A2_HUMAN Sarcoplasmic/ ATP2A2 EPI, ENDO LungCancers, Endoplasmic Detection endoplasmic Benign-Nodules reticulum reticulum membrane; calcium Multi-pass ATPase 2 membrane protein. Sarcoplasmic reticulum membrane; Multi-pass membrane protein. ATS1_HUMAN A ADAMTS1 LungCancers, Secreted, UniProt, disintegrin Benign-Nodules, extracellular Literature, and Symptoms space, Prediction metalloproteinase with extracellular thrombospondin matrix (By motifs 1 similarity). ATS12_HUMAN A ADAMTS12 LungCancers Secreted, UniProt, disintegrin extracellular Detection, and space, Prediction metalloproteinase with extracellular thrombospondin matrix (By motifs 12 similarity). ATS19_HUMAN A ADAMTS19 LungCancers Secreted, UniProt, disintegrin extracellular Prediction and space, metalloproteinase with extracellular thrombospondin matrix (By motifs 19 similarity). BAGE1_HUMAN B BAGE LungCancers Secreted UniProt, melanoma (Potential). Prediction antigen 1 BAGE2_HUMAN B BAGE2 LungCancers Secreted UniProt, melanoma (Potential). Prediction antigen 2 BAGE3_HUMAN B BAGE3 LungCancers Secreted UniProt, melanoma (Potential). Prediction antigen 3 BAGE4_HUMAN B BAGE4 LungCancers Secreted UniProt, melanoma (Potential). Prediction antigen 4 BAGE5_HUMAN B BAGE5 LungCancers Secreted UniProt, melanoma (Potential). Prediction antigen 5 BASP1_HUMAN Brain acid BASP1 Secreted, Cell membrane; Detection soluble EPI Lipid-anchor. protein 1 Cell projection, growth cone. Note = Associated with the membranes of growth cones that form the tips of elongating axons. BAX_HUMAN Apoptosis BAX EPI LungCancers, Isoform Alpha: UniProt, regulator Benign-Nodules Mitochondrion Literature, BAX membrane; Prediction Single-pass membrane protein. Cytoplasm. Note = Colocalizes with 14- 3-3 proteins in the cytoplasm. Under stress conditions, redistributes to the mitochondrion membrane through the release from JNK- phosphorylated 14-3-3 proteins.|Isoform Beta: Cytoplasm.|Isoform Gamma: Cytoplasm.|Isoform Delta: Cytoplasm (Potential). BDNF_HUMAN Brain- BDNF Benign-Nodules, Secreted. UniProt, derived Symptoms Literature, neurotrophic Prediction factor BGH3_HUMAN Transforming TGFBI LungCancers, Secreted, UniProt, growth Benign-Nodules extracellular Detection factor-beta- space, induced extracellular protein ig- matrix. h3 Note = May be associated both with microfibrils and with the cell surface. BMP2_HUMAN Bone BMP2 LungCancers, Secreted. UniProt, morphogenetic Benign-Nodules, Literature protein 2 Symptoms BST1_HUMAN ADP- BST1 EPI Symptoms Cell membrane; Detection, ribosyl Lipid-anchor, Prediction cyclase 2 GPI-anchor. C163A_HUMAN Scavenger CD163 EPI Symptoms Soluble CD163: UniProt, receptor Secreted.|Cell Detection cysteine- membrane; rich type 1 Single-pass protein type I M130 membrane protein. Note = Isoform 1 and isoform 2 show a lower surface expression when expressed in cells. C4BPA_HUMAN C4b- C4BPA LungCancers, Secreted. UniProt, binding Symptoms Detection, protein Prediction alpha chain CAH9_HUMAN Carbonic CA9 LungCancers, Nucleus. UniProt anhydrase Benign-Nodules, Nucleus, 9 Symptoms nucleolus. Cell membrane;
Single-pass type I membrane protein. Cell projection, microvillus membrane; Single-pass type I membrane protein. Note = Found on the surface microvilli and in the nucleus, particularly in nucleolus. CALR_HUMAN Calreticulin CALR EPI Symptoms Endoplasmic UniProt, reticulum Literature, lumen. Detection, Cytoplasm, Prediction cytosol. Secreted, extracellular space, extracellular matrix. Cell surface. Note = Also found in cell surface (T cells), cytosol and extracellular matrix. Associated with the lytic granules in the cytolytic T- lymphocytes. CALU_HUMAN Calumenin CALU EPI Symptoms Endoplasmic UniProt, reticulum Detection, lumen. Prediction Secreted. Melanosome. Sarcoplasmic reticulum lumen (By similarity). Note = Identified by mass spectrometry in melanosome fractions from stage I to stage IV. CALX_HUMAN Calnexin CANX Secreted, Benign-Nodules Endoplasmic UniProt, EPI, ENDO reticulum Literature, membrane; Detection Single-pass type I membrane protein. Melanosome. Note = Identified by mass spectrometry in melanosome fractions from stage I to stage IV. CAP7_HUMAN Azurocidin AZU1 EPI Symptoms Cytoplasmic Prediction granule. Note = Cytoplasmic granules of neutrophils. CATB_HUMAN Cathepsin CTSB Secreted LungCancers Lysosome. Literature, B Melanosome. Detection, Note = Identified Prediction by mass spectrometry in melanosome fractions from stage I to stage IV. CATG_HUMAN Cathepsin CTSG Secreted, Benign-Nodules Cell surface. Detection, G ENDO Prediction CBPB2_HUMAN Carboxypeptidase CPB2 LungCancers, Secreted. UniProt, B2 Benign-Nodules, Detection, Symptoms Prediction CCL22_HUMAN C-C motif CCL22 LungCancers, Secreted. UniProt, chemokine 22 Benign-Nodules Prediction CD14_HUMAN Monocyte CD14 EPI LungCancers, Cell membrane; Literature, differentiation Benign-Nodules, Lipid-anchor, Detection, antigen Symptoms GPI-anchor. Prediction CD14 CD24_HUMAN Signal CD24 LungCancers, Cell membrane; Literature transducer Benign-Nodules Lipid-anchor, CD24 GPI-anchor. CD2A2_HUMAN Cyclin- CDKN2A LungCancers, Cytoplasm. Literature, dependent Benign-Nodules Nucleus.|Nucleus, Prediction kinase nucleolus inhibitor (By similarity). 2A, isoform 4 CD38_HUMAN ADP- CD38 EPI, ENDO Symptoms Membrane; UniProt, ribosyl Single-pass Literature cyclase 1 type II membrane protein. CD40L_HUMAN CD40 CD40LG LungCancers, Cell membrane; UniProt, ligand Benign-Nodules, Single-pass Literature Symptoms type II membrane protein.|CD40 ligand, soluble form: Secreted. CD44_HUMAN CD44 CD44 EPI LungCancers, Membrane; UniProt, antigen Benign-Nodules, Single-pass Literature, Symptoms type I Detection, membrane Prediction protein. CD59_HUMAN CD59 CD59 LungCancers, Cell membrane; UniProt, glycoprotein Benign-Nodules, Lipid-anchor, Literature, Symptoms GPI-anchor. Detection, Secreted. Prediction Note = Soluble form found in a number of tissues. CD97_HUMAN CD97 CD97 EPI, ENDO Symptoms Cell membrane; UniProt antigen Multi-pass membrane protein.|CD97 antigen subunit alpha: Secreted, extracellular space. CDCP1_HUMAN CUB CDCP1 LungCancers Isoform 1: Cell UniProt, domain- membrane; Prediction containing Single-pass protein 1 membrane protein (Potential). Note = Shedding may also lead to a soluble peptide.|Isoform 3: Secreted. CDK4_HUMAN Cell CDK4 LungCancers, Literature division Symptoms protein kinase 4 CEAM5_HUMAN Carcinoembryonic CEACAM5 EPI LungCancers, Cell membrane; Literature, antigen- Benign-Nodules, Lipid-anchor, Prediction related cell Symptoms GPI-anchor. adhesion molecule 5 CEAM8_HUMAN Carcinoembryonic CEACAM8 EPI LungCancers Cell membrane; Detection, antigen- Lipid-anchor, Prediction related cell GPI-anchor. adhesion molecule 8 CERU_HUMAN Ceruloplasmin CP EPI LungCancers, Secreted. UniProt, Symptoms Literature, Detection, Prediction CH10_HUMAN 10 kDa HSPE1 ENDO LungCancers Mitochondrion Literature, heat shock matrix. Detection, protein, Prediction mitochondrial CH60_HUMAN 60 kDa HSPD1 Secreted, LungCancers, Mitochondrion Literature, heat shock EPI, ENDO Symptoms matrix. Detection protein, mitochondrial CKAP4_HUMAN Cytoskeleton- CKAP4 EPI, ENDO LungCancers Endoplasmic UniProt associated reticulum-Golgi protein 4 intermediate compartment membrane; Single-pass membrane protein (Potential). CL041_HUMAN Uncharacterized C12orf41 ENDO Prediction protein C12orf41 CLCA1_HUMAN Calcium- CLCA1 LungCancers, Secreted, UniProt, activated Benign-Nodules extracellular Prediction chloride space. Cell channel membrane; regulator 1 Peripheral membrane protein; Extracellular side. Note = Protein that remains attached to the plasma membrane appeared to be predominantly localized to microvilli. CLIC1_HUMAN Chloride CLIC1 EPI Nucleus. UniProt, intracellular Nucleus Literature, channel membrane; Detection protein 1 Single-pass membrane protein (Probable). Cytoplasm. Cell membrane; Single-pass membrane protein (Probable). Note = Mostly in the nucleus including in the nuclear membrane. Small amount in the cytoplasm and the plasma membrane. Exists both as soluble cytoplasmic protein and as membrane protein with probably a single transmembrane domain. CLUS_HUMAN Clusterin CLU EPI, ENDO LungCancers, Secreted. UniProt, Benign-Nodules, Literature, Symptoms Detection, Prediction CMGA_HUMAN Chromogranin-A CHGA LungCancers, Secreted. UniProt, Benign-Nodules Note = Neuro- Literature, endocrine and Detection, endocrine Prediction secretory granules.
CNTN1_HUMAN Contactin-1 CNTN1 LungCancers Isoform 1: Cell Detection, membrane; Prediction Lipid-anchor, GPI- anchor; Extracellular side.|Isoform 2: Cell membrane; Lipid-anchor, GPI- anchor; Extracellular side. CO4A1_HUMAN Collagen COL4A1 LungCancers Secreted, UniProt, alpha-1(IV) extracellular Detection, chain space, Prediction extracellular matrix, basement membrane. CO5A2_HUMAN Collagen COL5A2 LungCancers Secreted, UniProt, alpha-2(V) extracellular Detection, chain space, Prediction extracellular matrix (By similarity). CO6A3_HUMAN Collagen COL6A3 Secreted Symptoms Secreted, UniProt, alpha-3(VI) extracellular Detection, chain space, Prediction extracellular matrix (By similarity). COCA1_HUMAN Collagen COL12A1 ENDO LungCancers, Secreted, UniProt, alpha-1(XII) Symptoms extracellular Prediction chain space, extracellular matrix (By similarity). COF1_HUMAN Cofilin-1 CFL1 Secreted, LungCancers, Nucleus matrix. Detection, EPI Benign-Nodules Cytoplasm, Prediction cytoskeleton. Note = Almost completely in nucleus in cells exposed to heat shock or 10% dimethyl sulfoxide. COIA1_HUMAN Collagen COL18A1 LungCancers, Secreted, UniProt, alpha-1(XVIII) Benign-Nodules extracellular Literature, chain space, Detection, extracellular Prediction matrix (By similarity). COX5A_HUMAN Cytochrome COX5A Secreted, Mitochondrion Prediction c oxidase ENDO inner subunit 5A, membrane. mitochondrial CRP_HUMAN C-reactive CRP LungCancers, Secreted. UniProt, protein Benign-Nodules, Literature, Symptoms Detection, Prediction CS051_HUMAN UPF0470 C19orf51 ENDO Prediction protein C19orf51 CSF1_HUMAN Macrophage CSF1 LungCancers, Cell membrane; UniProt, colony- Benign-Nodules Single-pass Literature, stimulating membrane Detection factor 1 protein (By similarity).|Processed macrophage colony- stimulating factor 1: Secreted, extracellular space (By similarity). CSF2_HUMAN Granulocyte- CSF2 LungCancers, Secreted. UniProt, macrophage Benign-Nodules Literature, colony- Prediction stimulating factor CT085_HUMAN Uncharacterized C20orf85 LungCancers, Prediction protein Benign-Nodules C20orf85 CTGF_HUMAN Connective CTGF LungCancers, Secreted, UniProt, tissue Benign-Nodules extracellular Literature, growth space, Detection, factor extracellular Prediction matrix (By similarity). Secreted (By similarity). CYR61_HUMAN Protein CYR61 LungCancers, Secreted. UniProt, CYR61 Benign-Nodules Prediction CYTA_HUMAN Cystatin-A CSTA LungCancers Cytoplasm. Literature, Detection CYTB_HUMAN Cystatin-B CSTB Secreted Cytoplasm. Literature, Nucleus. Detection DDX17_HUMAN Probable DDX17 ENDO LungCancers, Nucleus. Detection, ATP- Benign-Nodules Prediction dependent RNA helicase DDX17 DEFB1_HUMAN Beta- DEFB1 LungCancers, Secreted. UniProt, defensin 1 Benign-Nodules Prediction DESP_HUMAN Desmoplakin DSP EPI, ENDO LungCancers Cell junction, Detection desmosome. Cytoplasm, cytoskeleton. Note = Innermost portion of the desmosomal plaque. DFB4A_HUMAN Beta- DEFB4A LungCancers, Secreted. UniProt defensin 4A Benign-Nodules DHI1L_HUMAN Hydroxysteroid HSD11B1L LungCancers Secreted UniProt, 11-beta- (Potential). Prediction dehydrogenase 1-like protein DMBT1_HUMAN Deleted in DMBT1 LungCancers, Secreted (By UniProt, malignant Benign-Nodules similarity). Detection, brain Note = Some Prediction tumors 1 isoforms may protein be membrane- bound. Localized to the lumenal aspect of crypt cells in the small intestine. In the colon, seen in the lumenal aspect of surface epithelial cells. Formed in the ducts of von Ebner gland, and released into the fluid bathing the taste buds contained in the taste papillae (By similarity). DMKN_HUMAN Dermokine DMKN LungCancers Secreted. UniProt, Detection, Prediction DPP4_HUMAN Dipeptidyl DPP4 EPI LungCancers, Dipeptidyl UniProt, peptidase 4 Benign-Nodules, peptidase 4 Detection Symptoms soluble form: Secreted.|Cell membrane; Single-pass type II membrane protein. DSG2_HUMAN Desmoglein-2 DSG2 ENDO Symptoms Cell membrane; UniProt, Single-pass Detection type I membrane protein. Cell junction, desmosome. DX39A_HUMAN ATP- DDX39A EPI Nucleus (By Prediction dependent similarity). RNA helicase DDX39A DX39B_HUMAN Spliceosome DDX39B EPI Nucleus. Prediction RNA Nucleus helicase speckle. DDX39B DYRK2_HUMAN Dual DYRK2 ENDO LungCancers Cytoplasm. Literature specificity Nucleus. tyrosine- Note = Translocates phosphorylation- into the regulated nucleus kinase 2 following DNA damage. EDN2_HUMAN Endothelin-2 EDN2 LungCancers Secreted. UniProt, Prediction EF1A1_HUMAN Elongation EEF1A1 Secreted, LungCancers, Cytoplasm. Detection factor 1- EPI Benign-Nodules alpha 1 EF1D_HUMAN Elongation EEF1D Secreted, LungCancers Prediction factor 1- EPI delta EF2_HUMAN Elongation EEF2 Secreted, Cytoplasm. Literature, factor 2 EPI Detection EGF_HUMAN Pro- EGF LungCancers, Membrane; UniProt, epidermal Benign-Nodules, Single-pass Literature growth Symptoms type I factor membrane protein. EGFL6_HUMAN Epidermal EGFL6 LungCancers Secreted, UniProt, growth extracellular Detection, factor-like space, Prediction protein 6 extracellular matrix, basement membrane (By similarity). ENOA_HUMAN Alpha- ENO1 Secreted, LungCancers, Cytoplasm. Cell Literature, enolase EPI, ENDO Benign-Nodules, membrane. Detection, Symptoms Cytoplasm, Prediction myofibril, sarcomere, M- band. Note = Can translocate to the plasma membrane in either the homodimeric (alpha/alpha) or heterodimeric (alpha/gamma) form. ENO1 is localized to the M-band.|Isoform MBP-1: Nucleus. ENOG_HUMAN Gamma- ENO2 EPI LungCancers, Cytoplasm (By Literature, enolase Symptoms similarity). Cell Detection, membrane (By Prediction similarity). Note = Can translocate to the plasma membrane in either the homodimeric (alpha/alpha) or heterodimeric (alpha/gamma) form (By similarity). ENOX2_HUMAN Ecto-NOX ENOX2 LungCancers Cell membrane. UniProt, disulfide- Secreted, Detection thiol extracellular exchanger space. 2 Note = Extracellular and plasma membrane- associated. ENPL_HUMAN Endoplasmin HSP90B1 Secreted, LungCancers, Endoplasmic Literatu- re, EPI, ENDO Benign-Nodules, reticulum Detection,
Symptoms lumen. Prediction Melanosome. Note = Identified by mass spectrometry in melanosome fractions from stage I to stage IV. EPHB6_HUMAN Ephrin EPHB6 LungCancers Membrane; UniProt, type-B Single-pass Literature receptor 6 type I membrane protein.|Isoform 3: Secreted (Probable). EPOR_HUMAN Erythropoietin EPOR LungCancers, Cell membrane; UniProt, receptor Benign-Nodules, Single-pass Literature, Symptoms type I Detection membrane protein.|Isoform EPOR-S: Secreted. Note = Secreted and located to the cell surface. ERBB3_HUMAN Receptor ERBB3 LungCancers, Isoform 1: Cell UniProt, tyrosine- Benign-Nodules membrane; Literature, protein Single-pass Prediction kinase type I erbB-3 membrane protein.|Isoform 2: Secreted. EREG_HUMAN Proepiregulin EREG LungCancers Epiregulin: UniProt Secreted, extracellular space. Proepiregulin: Cell membrane; Single-pass type I membrane protein. ERO1A_HUMAN ERO1-like ERO1L Secreted, Symptoms Endoplasmic Prediction protein EPI, ENDO reticulum alpha membrane; Peripheral membrane protein; Lumenal side. Note = The association with ERP44 is essential for its retention in the endoplasmic reticulum. ESM1_HUMAN Endothelial ESM1 LungCancers, Secreted. UniProt, cell- Benign-Nodules Prediction specific molecule 1 EZRI_HUMAN Ezrin EZR Secreted LungCancers, Apical cell Literature, Benign-Nodules membrane; Detection, Peripheral Prediction membrane protein; Cytoplasmic side. Cell projection. Cell projection, microvillus membrane; Peripheral membrane protein; Cytoplasmic side. Cell projection, ruffle membrane; Peripheral membrane protein; Cytoplasmic side. Cytoplasm, cell cortex. Cytoplasm, cytoskeleton. Note = Localization to the apical membrane of parietal cells depends on the interaction with MPP5. Localizes to cell extensions and peripheral processes of astrocytes (By similarity). Microvillar peripheral membrane protein (cytoplasmic side). F10A1_HUMAN Hsc70- ST13 EPI Cytoplasm (By Detection, interacting similarity).|Cytoplasm Prediction protein (Probable). FAM3C_HUMAN Protein FAM3C EPI, ENDO Secreted UniProt, FAM3C (Potential). Detection FAS_HUMAN Fatty acid FASN EPI LungCancers, Cytoplasm. Literature, synthase Benign-Nodules, Melanosome. Detection Symptoms Note = Identified by mass spectrometry in melanosome fractions from stage I to stage IV. FCGR1_HUMAN High FCGR1A EPI LungCancers, Cell membrane; UniProt affinity Benign-Nodules, Single-pass immunoglobulin Symptoms type I gamma Fc membrane receptor I protein. Note = Stabilized at the cell membrane through interaction with FCER1G. FGF10_HUMAN Fibroblast FGF10 LungCancers Secreted UniProt, growth (Potential). Prediction factor 10 FGF2_HUMAN Heparin- FGF2 LungCancers, Literature binding Benign-Nodules, growth Symptoms factor 2 FGF7_HUMAN Keratinocyte FGF7 LungCancers, Secreted. UniProt, growth Benign-Nodules Literature, factor Prediction FGF9_HUMAN Glia- FGF9 LungCancers Secreted. UniProt, activating Literature, factor Prediction FGFR2_HUMAN Fibroblast FGFR2 LungCancers, Cell membrane; UniProt, growth Benign-Nodules Single-pass Literature, factor type I Prediction receptor 2 membrane protein.|Isoform 14: Secreted.|Isoform 19: Secreted. FGFR3_HUMAN Fibroblast FGFR3 LungCancers Membrane; UniProt, growth Single-pass Literature, factor type I Prediction receptor 3 membrane protein. FGL2_HUMAN Fibroleukin FGL2 Benign-Nodules, Secreted. UniProt, Symptoms Detection, Prediction FHIT_HUMAN Bis(5'- FHIT LungCancers, Cytoplasm. Literature adenosyl)- Benign-Nodules, triphosphatase Symptoms FIBA_HUMAN Fibrinogen FGA LungCancers, Secreted. UniProt, alpha chain Benign-Nodules, Literature, Symptoms Detection, Prediction FINC_HUMAN Fibronectin FN1 Secreted, LungCancers, Secreted, UniProt, EPI, ENDO Benign-Nodules, extracellular Literature, Symptoms space, Detection, extracellular Prediction matrix. FKB11_HUMAN Peptidyl- FKBP11 EPI, ENDO Membrane; UniProt, prolyl cis- Single-pass Prediction trans membrane isomerase protein FKBP11 (Potential). FOLH1_HUMAN Glutamate FOLH1 ENDO LungCancers, Cell membrane; UniProt, carboxypeptidase Symptoms Single-pass Literature 2 type II membrane protein.|Isoform PSMA': Cytoplasm. FOLR1_HUMAN Folate FOLR1 LungCancers Cell membrane; UniProt receptor Lipid-anchor, alpha GPI-anchor. Secreted (Probable). FOXA2_HUMAN Hepatocyte FOXA2 LungCancers Nucleus. Detection, nuclear Prediction factor 3- beta FP100_HUMAN Fanconi C17orf70 ENDO Symptoms Nucleus. Prediction anemia- associated protein of 100 kDa FRIH_HUMAN Ferritin FTH1 EPI LungCancers, Literature, heavy Benign-Nodules Detection, chain Prediction FRIL_HUMAN Ferritin FTL Secreted, Benign-Nodules, Literature, light chain EPI, ENDO Symptoms Detection G3P_HUMAN Glyceralde- GAPDH Secreted, LungCancers, Cytoplasm. Detection hyde-3- EPI, ENDO Benign-Nodules, Cytoplasm, phosphate Symptoms perinuclear dehydrogenase region. Membrane. Note = Postnuclear and Perinuclear regions. G6PD_HUMAN Glucose-6- G6PD Secreted, LungCancers, Literature, phosphate EPI Symptoms Detection 1- dehydrogenase G6PI_HUMAN Glucose-6- GPI Secreted, Symptoms Cytoplasm. UniProt, phosphate EPI Secreted. Literature, isomerase Detection GA2L1_HUMAN GAS2-like GAS2L1 ENDO Cytoplasm, Prediction protein 1 cytoskeleton (Probable). GALT2_HUMAN Polypeptide N- GALNT2 EPI, ENDO Golgi UniProt, acetylgalactosaminyl- apparatus, Detection transferase 2 Golgi stack membrane; Single-pass type II membrane protein. Secreted. Note = Resides preferentially in the trans and medial parts of the Golgi stack. A secreted form also exists. GAS6_HUMAN Growth GAS6 LungCancers Secreted. UniProt, arrest- Detection, specific Prediction protein 6 GDIR2_HUMAN Rho GDP- ARHGDIB EPI Cytoplasm. Detection dissociation inhibitor 2 GELS_HUMAN Gelsolin GSN LungCancers, Isoform 2: UniProt, Benign-Nodules Cytoplasm, Literature, cytoskeleton.|Isoform Detection, 1: Secreted. Prediction GGH_HUMAN Gamma- GGH LungCancers Secreted, UniProt, glutamyl extracellular Detection, hydrolase space. Prediction
Lysosome. Melanosome. Note = While its intracellular location is primarily the lysosome, most of the enzyme activity is secreted. Identified by mass spectrometry in melanosome fractions from stage I to stage IV. GPC3_HUMAN Glypican-3 GPC3 LungCancers, Cell membrane; UniProt, Symptoms Lipid-anchor, Literature, GPI-anchor; Prediction Extracellular side (By similarity).|Secreted glypican-3: Secreted, extracellular space (By similarity). GRAN_HUMAN Grancalcin GCA EPI Cytoplasm. Prediction Cytoplasmic granule membrane; Peripheral membrane protein; Cytoplasmic side. Note = Primarily cytosolic in the absence of calcium or magnesium ions. Relocates to granules and other membranes in response to elevated calcium and magnesium levels. GREB1_HUMAN Protein GREB1 ENDO Membrane; UniProt, GREB1 Single-pass Prediction membrane protein (Potential). GREM1_HUMAN Gremlin-1 GREM1 LungCancers, Secreted UniProt, Benign-Nodules (Probable). Prediction GRP_HUMAN Gastrin- GRP LungCancers, Secreted. UniProt, releasing Symptoms Prediction peptide GRP78_HUMAN 78 kDa HSPA5 Secreted, LungCancers, Endoplasmic Detection, glucose- EPI, ENDO Benign-Nodules reticulum Prediction regulated lumen. protein Melanosome. Note = Identified by mass spectrometry in melanosome fractions from stage I to stage IV. GSLG1_HUMAN Golgi GLG1 EPI, ENDO Benign-Nodules Golgi apparatus UniProt apparatus membrane; protein 1 Single-pass type I membrane protein. GSTP1_HUMAN Glutathione GSTP1 Secreted LungCancers, Literature, S- Benign-Nodules, Detection, transferase Symptoms Prediction P GTR1_HUMAN Solute SLC2A1 EPI, ENDO LungCancers, Cell membrane; Literature carrier Benign-Nodules, Multi-pass family 2, Symptoms membrane facilitated protein (By glucose similarity). transporter Melanosome. member 1 Note = Localizes primarily at the cell surface (By similarity). Identified by mass spectrometry in melanosome fractions from stage I to stage IV. GTR3_HUMAN Solute SLC2A3 EPI Membrane; Detection carrier Multi-pass family 2, membrane facilitated protein. glucose transporter member 3 H2A1_HUMAN Histone HIST1H2AG Secreted Nucleus. Detection, H2A type 1 Prediction H2A1B_HUMAN Histone HIST1H2AB Secreted Nucleus. Detection, H2A type Prediction 1-B/E H2A1C_HUMAN Histone HIST1H2AC Secreted Nucleus. Literature, H2A type Detection, 1-C Prediction H2A1D_HUMAN Histone HIST1H2AD Secreted Nucleus. Detection, H2A type Prediction 1-D HG2A_HUMAN HLA class CD74 LungCancers, Membrane; UniProt, II Benign-Nodules, Single-pass Literature histocompatibility Symptoms type II antigen membrane gamma protein chain (Potential). HGF_HUMAN Hepatocyte HGF LungCancers, Literature, growth Benign-Nodules, Prediction factor Symptoms HMGA1_HUMAN High HMGA1 LungCancers, Nucleus. Literature mobility Benign-Nodules, group Symptoms protein HMG- I/HMG-Y HPRT_HUMAN Hypoxanthine- HPRT1 EPI Cytoplasm. Detection, guanine Prediction phosphoribosyl- transferase HPSE_HUMAN Heparanase HPSE LungCancers, Lysosome UniProt, Benign-Nodules, membrane; Prediction Symptoms Peripheral membrane protein. Secreted. Note = Secreted, internalised and transferred to late endosomes/ lysosomes as a proheparanase. In lysosomes, it is processed into the active form, the heparanase. The uptake or internalisation of proheparanase is mediated by HSPGs. Heparin appears to be a competitor and retain proheparanase in the extracellular medium. HPT_HUMAN Haptoglobin HP LungCancers, Secreted. UniProt, Benign-Nodules, Literature, Symptoms Detection, Prediction HS90A_HUMAN Heat shock HSP90AA1 Secreted, LungCancers, Cytoplasm. Literature, protein EPI Symptoms Melanosome. Detection HSP 90- Note = Identified alpha by mass spectrometry in melanosome fractions from stage I to stage IV. HS90B_HUMAN Heat shock HSP90AB1 Secreted, LungCancers Cytoplasm. Literature, protein EPI Melanosome. Detection HSP 90- Note = Identified beta by mass spectrometry in melanosome fractions from stage I to stage IV. HSPB1_HUMAN Heat shock HSPB1 Secreted, LungCancers, Cytoplasm. Literature, protein EPI Benign-Nodules Nucleus. Detection, beta-1 Cytoplasm, Prediction cytoskeleton, spindle. Note = Cytoplasmic in interphase cells. Colocalizes with mitotic spindles in mitotic cells. Translocates to the nucleus during heat shock. HTRA1_HUMAN Serine HTRA1 LungCancers Secreted. UniProt, protease Prediction HTRA1 HXK1_HUMAN Hexokinase-1 HK1 ENDO Symptoms Mitochondrion Literature, outer Detection membrane. Note = Its hydrophobic N- terminal sequence may be involved in membrane binding. HYAL2_HUMAN Hyaluronidase-2 HYAL2 LungCancers Cell membrane; Prediction Lipid-anchor, GPI-anchor. HYOU1_HUMAN Hypoxia HYOU1 EPI, ENDO Symptoms Endoplasmic Detection up- reticulum regulated lumen. protein 1 IBP2_HUMAN Insulin-like IGFBP2 LungCancers Secreted. UniProt, growth Literature, factor- Detection, binding Prediction protein 2 IBP3_HUMAN Insulin-like IGFBP3 LungCancers, Secreted. UniProt, growth Benign-Nodules, Literature, factor- Symptoms Detection, binding Prediction protein 3 ICAM1_HUMAN Intercellular ICAM1 LungCancers, Membrane; UniProt, adhesion Benign-Nodules, Single-pass Literature, molecule 1 Symptoms type I Detection membrane protein. ICAM3_HUMAN Intercellular ICAM3 EPI, ENDO LungCancers, Membrane; UniProt, adhesion Benign-Nodules, Single-pass Detection molecule 3 Symptoms type I membrane protein. IDHP_HUMAN Isocitrate IDH2 Secreted, Mitochondrion. Prediction dehydrogenase ENDO [NADP], mitochondrial
IF4A1_HUMAN Eukaryotic EIF4A1 Secreted, Detection, initiation EPI, ENDO Prediction factor 4A-I IGF1_HUMAN Insulin-like IGF1 LungCancers, Secreted.|Secreted. UniProt, growth Benign-Nodules, Literature, factor I Symptoms Detection, Prediction IKIP_HUMAN Inhibitor of IKIP ENDO Symptoms Endoplasmic UniProt, nuclear reticulum Prediction factor membrane; kappa-B Single-pass kinase- membrane interacting protein. protein Note = Isoform 4 deletion of the hydrophobic, or transmembrane region between AA 45-63 results in uniform distribution troughout the cell, suggesting that this region is responsible for endoplasmic reticulum localization. IL18_HUMAN Interleukin-18 IL18 LungCancers, Secreted. UniProt, Benign-Nodules, Literature, Symptoms Prediction IL19_HUMAN Interleukin-19 IL19 LungCancers Secreted. UniProt, Detection, Prediction IL22_HUMAN Interleukin-22 IL22 LungCancers, Secreted. UniProt, Benign-Nodules Prediction IL32_HUMAN Interleukin-32 IL32 LungCancers, Secreted. UniProt, Benign-Nodules Prediction IL7_HUMAN Interleukin-7 IL7 LungCancers, Secreted. UniProt, Benign-Nodules Literature, Prediction IL8_HUMAN Interleukin-8 IL8 LungCancers, Secreted. UniProt, Benign-Nodules, Literature Symptoms ILEU_HUMAN Leukocyte SERPINB1 Secreted, Cytoplasm (By Detection, elastase EPI similarity). Prediction inhibitor ILK_HUMAN Integrin- ILK Secreted LungCancers, Cell junction, Literature, linked Benign-Nodules, focal adhesion. Detection protein Symptoms Cell membrane; kinase Peripheral membrane protein; Cytoplasmic side. INHBA_HUMAN Inhibin INHBA LungCancers, Secreted. UniProt, beta A Benign-Nodules Literature, chain Prediction ISLR_HUMAN Immunoglobulin ISLR LungCancers Secreted UniProt, superfamily (Potential). Detection, containing Prediction leucine- rich repeat protein ITA5_HUMAN Integrin ITGA5 EPI LungCancers, Membrane; UniProt, alpha-5 Benign-Nodules, Single-pass Literature, Symptoms type I Detection membrane protein. ITAM_HUMAN Integrin ITGAM EPI, ENDO LungCancers, Membrane; UniProt, alpha-M Benign-Nodules, Single-pass Literature Symptoms type I membrane protein. K0090_HUMAN Uncharacterized KIAA0090 EPI Symptoms Membrane; UniProt, protein Single-pass Prediction KIAA0090 type I membrane protein (Potential). K1C18_HUMAN Keratin, KRT18 Secreted LungCancers, Cytoplasm, Literature, type I Benign-Nodules perinuclear Detection, cytoskeletal 18 region. Prediction K1C19_HUMAN Keratin, KRT19 LungCancers, Literature, type I Benign-Nodules Detection, cytoskeletal 19 Prediction K2C8_HUMAN Keratin, KRT8 EPI LungCancers Cytoplasm. Literature, type II Detection cytoskeletal 8 KIT_HUMAN Mast/stem KIT LungCancers Membrane; UniProt, cell growth Single-pass Literature, factor type I Detection receptor membrane protein. KITH_HUMAN Thymidine TK1 LungCancers Cytoplasm. Literature, kinase, Prediction cytosolic KLK11_HUMAN Kallikrein-11 KLK11 LungCancers Secreted. UniProt, Literature, Prediction KLK13_HUMAN Kallikrein-13 KLK13 LungCancers Secreted UniProt, (Probable). Literature, Detection, Prediction KLK14_HUMAN Kallikrein-14 KLK14 LungCancers, Secreted, UniProt, Symptoms extracellular Literature, space. Prediction KLK6_HUMAN Kallikrein-6 KLK6 LungCancers, Secreted. UniProt, Benign-Nodules, Nucleus, Literature, Symptoms nucleolus. Detection, Cytoplasm. Prediction Mitochondrion. Microsome. Note = In brain, detected in the nucleus of glial cells and in the nucleus and cytoplasm of neurons. Detected in the mitochondrial and microsomal fractions of HEK-293 cells and released into the cytoplasm following cell stress. KNG1_HUMAN Kininogen-1 KNG1 LungCancers, Secreted, UniProt, Benign-Nodules, extracellular Detection, Symptoms space. Prediction KPYM_HUMAN Pyruvate PKM2 Secreted, LungCancers, Cytoplasm. Literature, kinase EPI Symptoms Nucleus. Detection isozymes Note = Translocates M1/M2 to the nucleus in response to different apoptotic stimuli. Nuclear translocation is sufficient to induce cell death that is caspase independent, isoform-specific and independent of its enzymatic actvity. KRT35_HUMAN Keratin, KRT35 ENDO Detection, type I Prediction cuticular Ha5 LAMB2_HUMAN Laminin LAMB2 ENDO LungCancers, Secreted, UniProt, subunit Symptoms extracellular Detection, beta-2 space, Prediction extracellular matrix, basement membrane. Note = S-laminin is concentrated in the synaptic cleft of the neuromuscular junction. LDHA_HUMAN L-lactate LDHA Secreted, LungCancers Cytoplasm. Literature, dehydrogenase EPI, ENDO Detection, A chain Prediction LDHB_HUMAN L-lactate LDHB EPI LungCancers Cytoplasm. Detection, dehydrogenase Prediction B chain LEG1_HUMAN Galectin-1 LGALS1 Secreted LungCancers Secreted, UniProt, extracellular Detection space, extracellular matrix. LEG3_HUMAN Galectin-3 LGALS3 LungCancers, Nucleus. Literature, Benign-Nodules Note = Cytoplasmic Detection, in adenomas and Prediction carcinomas. May be secreted by a non- classical secretory pathway and associate with the cell surface. LEG9_HUMAN Galectin-9 LGALS9 ENDO Symptoms Cytoplasm (By UniProt similarity). Secreted (By similarity). Note = May also be secreted by a non-classical secretory pathway (By similarity). LG3BP_HUMAN Galectin-3- LGALS3BP Secreted LungCancers, Secreted. UniProt, binding Benign-Nodules, Secreted, Literature, protein Symptoms extracellular Detection, space, Prediction extracellular matrix. LPLC3_HUMAN Long C20orf185 LungCancers Secreted (By UniProt, palate, lung similarity). Prediction and nasal Cytoplasm. epithelium Note = According to carcinoma- PubMed: 12837268 associated it is cytoplasmic. protein 3 LPLC4_HUMAN Long C20orf186 LungCancers Secreted (By UniProt, palate, lung similarity). Prediction and nasal Cytoplasm. epithelium carcinoma- associated protein 4 LPPRC_HUMAN Leucine- LRPPRC Secreted, LungCancers, Mitochondrion. Predicti- on rich PPR ENDO Symptoms Nucleus, motif- nucleoplasm. containing Nucleus inner protein, membrane. mitochondrial Nucleus outer membrane. Note = Seems to be predominantly mitochondrial. LRP1_HUMAN Prolow- LRP1 EPI LungCancers, Low-density UniProt, density Symptoms lipoprotein Detection lipoprotein receptor-related receptor- protein 1 85 related kDa subunit: protein 1 Cell membrane; Single-pass type I membrane protein. Membrane, coated pit.|Low- density lipoprotein receptor-related protein 1 515 kDa subunit:
Cell membrane; Peripheral membrane protein; Extracellular side. Membrane, coated pit.|Low- density lipoprotein receptor-related protein 1 intracellular domain: Cytoplasm. Nucleus. Note = After cleavage, the intracellular domain (LRPICD) is detected both in the cytoplasm and in the nucleus. LUM_HUMAN Lumican LUM Secreted, LungCancers, Secreted, UniProt, EPI Benign-Nodules, extracellular Detection, Symptoms space, Prediction extracellular matrix (By similarity). LY6K_HUMAN Lymphocyte LY6K LungCancers, Secreted. UniProt, antigen Symptoms Cytoplasm. Cell Prediction 6K membrane; Lipid- anchor, GPI-anchor (Potential). LYAM2_HUMAN E-selectin SELE LungCancers, Membrane; UniProt, Benign-Nodules, Single-pass Literature, Symptoms type I Detection membrane protein. LYAM3_HUMAN P-selectin SELP LungCancers, Membrane; UniProt, Benign-Nodules, Single-pass Literature, Symptoms type I Detection membrane protein. LYOX_HUMAN Protein- LOX LungCancers, Secreted, UniProt, lysine 6- Benign-Nodules extracellular Detection, oxidase space. Prediction LYPD3_HUMAN Ly6/PLAUR LYPD3 LungCancers Cell membrane; Detection, domain- Lipid-anchor, Prediction containing GPI-anchor. protein 3 MAGA4_HUMAN Melanoma- MAGEA4 LungCancers Literature, associated Prediction antigen 4 MASP1_HUMAN Mannan- MASP1 LungCancers, Secreted. UniProt, binding Symptoms Detection, lectin Prediction serine protease 1 MDHC_HUMAN Malate MDH1 Secreted Cytoplasm. Literature, dehydrogenase, Detection, cytoplasmic Prediction MDHM_HUMAN Malate MDH2 ENDO LungCancers Mitochondrion Detection, dehydrogenase, matrix. Prediction mitochondrial MIF_HUMAN Macrophage MIF Secreted LungCancers, Secreted. UniProt, migration Benign-Nodules, Cytoplasm. Literature, inhibitory Symptoms Note = Does not Prediction factor have a cleavable signal sequence and is secreted via a specialized, non- classical pathway. Secreted by macrophages upon stimulation by bacterial lipopolysaccharide (LPS), or by M. tuberculosis antigens. MLH1_HUMAN DNA MLH1 ENDO LungCancers, Nucleus. Literature mismatch Benign-Nodules, repair Symptoms protein Mlh1 MMP1_HUMAN Interstitial MMP1 LungCancers, Secreted, UniProt, collagenase Benign-Nodules, extracellular Literature, Symptoms space, Prediction extracellular matrix (Probable). MMP11_HUMAN Stromelysin-3 MMP11 LungCancers, Secreted, UniProt, Symptoms extracellular Literature, space, Prediction extracellular matrix (Probable). MMP12_HUMAN Macrophage MMP12 LungCancers, Secreted, UniProt, metalloelastase Benign-Nodules, extracellular Literature, Symptoms space, Prediction extracellular matrix (Probable). MMP14_HUMAN Matrix MMP14 ENDO LungCancers, Membrane; UniProt, metallopro- Benign-Nodules, Single-pass Literature, teinase-14 Symptoms type I Detection membrane protein (Potential). Melanosome. Note = Identified by mass spectrometry in melanosome fractions from stage I to stage IV. MMP2_HUMAN 72 kDa MMP2 LungCancers, Secreted, UniProt, type IV Benign-Nodules, extracellular Literature, collagenase Symptoms space, Detection, extracellular Prediction matrix (Probable). MMP26_HUMAN Matrix MMP26 LungCancers Secreted, UniProt, metallopro- extracellular Prediction teinase-26 space, extracellular matrix. MMP7_HUMAN Matrilysin MMP7 LungCancers, Secreted, UniProt, Benign-Nodules, extracellular Literature, Symptoms space, Prediction extracellular matrix (Probable). MMP9_HUMAN Matrix MMP9 LungCancers, Secreted, UniProt, metallopro- Benign-Nodules, extracellular Literature, teinase-9 Symptoms space, Detection, extracellular Prediction matrix (Probable). MOGS_HUMAN Mannosyl- MOGS ENDO Endoplasmic UniProt, oligosaccharide reticulum Prediction glucosidase membrane; Single-pass type II membrane protein. MPRI_HUMAN Cation- IGF2R EPI, ENDO LungCancers, Lysosome UniProt, independent Symptoms membrane; Literature, mannose-6- Single-pass Detection phosphate type I receptor membrane protein. MRP3_HUMAN Canalicular ABCC3 EPI LungCancers Membrane; Literature, multispecific Multi-pass Detection organic membrane anion protein. transporter 2 MUC1_HUMAN Mucin-1 MUC1 EPI LungCancers, Apical cell UniProt, Benign-Nodules, membrane; Literature, Symptoms Single-pass Prediction type I membrane protein. Note = Exclusively located in the apical domain of the plasma membrane of highly polarized epithelial cells. After endocytosis, internalized and recycled to the cell membrane. Located to microvilli and to the tips of long filopodial protusions.|Isoform 5: Secreted.|Isoform 7: Secreted.|Isoform 9: Secreted.|Mucin-1 subunit beta: Cell membrane. Cytoplasm. Nucleus. Note = On EGF and PDGFRB stimulation, transported to the nucleus through interaction with CTNNB1, a process which is stimulated by phosphorylation. On HRG stimulation, colocalizes with JUP/gamma- catenin at the nucleus. MUC16_HUMAN Mucin-16 MUC16 LungCancers Cell membrane; UniProt, Single-pass Detection type I membrane protein. Secreted, extracellular space. Note = May be liberated into the extracellular space following the phosphorylation of the intracellular C- terminus which induces the proteolytic cleavage and liberation of the extracellular domain. MUC4_HUMAN Mucin-4 MUC4 LungCancers, Membrane; UniProt Benign-Nodules Single-pass membrane protein (Potential). Secreted. Note = Isoforms lacking the Cys- rich region, EGF-like domains and transmembrane region are secreted. Secretion occurs by
splicing or proteolytic processing. Mucin- 4 beta chain: Cell membrane; Single- pass membrane protein.|Mucin- 4 alpha chain: Secreted.|Isoform 3: Cell membrane; Single-pass membrane protein.|Isoform 15: Secreted. MUC5B_HUMAN Mucin-5B MUC5B LungCancers, Secreted. UniProt, Benign-Nodules Detection, Prediction MUCL1_HUMAN Mucin-like MUCL1 LungCancers Secreted UniProt, protein 1 (Probable). Prediction Membrane (Probable). NAMPT_HUMAN Nicotinamide NAMPT EPI LungCancers, Cytoplasm (By Literature, phosphoribosyl- Benign-Nodules, similarity). Detection transferase Symptoms NAPSA_HUMAN Napsin-A NAPSA Secreted LungCancers Prediction NCF4_HUMAN Neutrophil NCF4 ENDO Cytoplasm. Prediction cytosol factor 4 NDKA_HUMAN Nucleoside NME1 Secreted LungCancers, Cytoplasm. Literature, diphosphate Benign-Nodules, Nucleus. Detection kinase A Symptoms Note = Cell- cycle dependent nuclear localization which can be induced by interaction with Epstein-barr viral proteins or by degradation of the SET complex by GzmA. NDKB_HUMAN Nucleoside NME2 Secreted, Benign-Nodules Cytoplasm. Literature,- diphosphate EPI Nucleus. Detection kinase B Note = Isoform 2 is mainly cytoplasmic and isoform 1 and isoform 2 are excluded from the nucleolus. NDUS1_HUMAN NADH- NDUFS1 Secreted, Symptoms Mitochondrion Prediction ubiquinone ENDO inner oxidoreductase membrane. 75 kDa subunit, mitochondrial NEBL_HUMAN Nebulette NEBL ENDO Prediction NEK4_HUMAN Serine/threonine- NEK4 ENDO LungCancers Nucleus Prediction protein (Probable). kinase Nek4 NET1_HUMAN Netrin-1 NTN1 LungCancers, Secreted, UniProt, Benign-Nodules extracellular Literature, space, Prediction extracellular matrix (By similarity). NEU2_HUMAN Vasopressin- AVP LungCancers, Secreted. UniProt, neurophysin 2- Symptoms Prediction copeptin NGAL_HUMAN Neutrophil LCN2 EPI LungCancers, Secreted. UniProt, gelatinase- Benign-Nodules, Detection, associated Symptoms Prediction lipocalin NGLY1_HUMAN Peptide- NGLY1 ENDO Cytoplasm. Detection, N(4)-(N- Prediction acetyl-beta- glucosaminyl)as- paragine amidase NHRF1_HUMAN Na(+)/H(+) SLC9A3R1 EPI Benign-Nodules Endomembrane Detection exchange system; regulatory Peripheral cofactor membrane NHE-RF1 protein. Cell projection, filopodium. Cell projection, ruffle. Cell projection, microvillus. Note = Colocalizes with actin in microvilli-rich apical regions of the syncytiotrophoblast. Found in microvilli, ruffling membrane and filopodia of HeLa cells. Present in lipid rafts of T-cells. NIBAN_HUMAN Protein FAM129A EPI Cytoplasm. Literature, Niban Detection NMU_HUMAN Neuromedin-U NMU LungCancers Secreted. UniProt, Prediction NRP1_HUMAN Neuropilin-1 NRP1 LungCancers, Cell membrane; UniProt, Benign-Nodules, Single-pass Literature, Symptoms type I Detection, membrane Prediction protein.|Isoform 2: Secreted. ODAM_HUMAN Odontogenic ODAM LungCancers Secreted (By UniProt, ameloblast- similarity). Prediction associated protein OSTP_HUMAN Osteopontin SPP1 LungCancers, Secreted. UniProt, Benign-Nodules, Literature, Symptoms Detection, Prediction OVOS2_HUMAN Ovostatin OVOS2 ENDO Secreted (By UniProt, homolog 2 similarity). Prediction P5CS_HUMAN Delta-1- ALDH18A1 ENDO Mitochondrion Prediction pyrroline-5- inner carboxylate membrane. synthase PA2GX_HUMAN Group 10 PLA2G10 Symptoms Secreted. UniProt secretory phospholipase A2 PAPP1_HUMAN Pappalysin-1 PAPPA LungCancers, Secreted. UniProt, Benign-Nodules, Literature, Symptoms Prediction PBIP1_HUMAN Pre-B-cell PBXIP1 EPI Cytoplasm, Prediction leukemia cytoskeleton. transcription Nucleus. factor- Note = Shuttles interacting between the protein 1 nucleus and the cytosol. Mainly localized in the cytoplasm, associated with microtubules. Detected in small amounts in the nucleus. PCBP1_HUMAN Poly(rC)- PCBP1 EPI, ENDO Nucleus. Detection, binding Cytoplasm. Prediction protein 1 Note = Loosely bound in the nucleus. May shuttle between the nucleus and the cytoplasm. PCBP2_HUMAN Poly(rC)- PCBP2 EPI Nucleus. Detection, binding Cytoplasm. Prediction protein 2 Note = Loosely bound in the nucleus. May shuttle between the nucleus and the cytoplasm. PCD15_HUMAN Protocadherin- PCDH15 ENDO Cell membrane; UniProt, 15 Single-pass Detection type I membrane protein (By similarity).|Isoform 3: Secreted. PCNA_HUMAN Proliferating PCNA EPI LungCancers, Nucleus. Literature, cell nuclear Benign-Nodules, Prediction antigen Symptoms PCYOX_HUMAN Prenylcysteine PCYOX1 Secreted LungCancers, Lysosome. Detectio- n, oxidase 1 Symptoms Prediction PDGFA_HUMAN Platelet- PDGFA LungCancers Secreted. UniProt, derived Literature, growth Prediction factor subunit A PDGFB_HUMAN Platelet- PDGFB LungCancers, Secreted. UniProt, derived Benign-Nodules, Literature, growth Symptoms Detection, factor Prediction subunit B PDGFD_HUMAN Platelet- PDGFD LungCancers Secreted. UniProt, derived Prediction growth factor D PDIA3_HUMAN Protein PDIA3 ENDO LungCancers Endoplasmic Detection, disulfide- reticulum Prediction isomerase lumen (By A3 similarity). Melanosome. Note = Identified by mass spectrometry in melanosome fractions from stage I to stage IV. PDIA4_HUMAN Protein PDIA4 Secreted, Endoplasmic Detection, disulfide- EPI, ENDO reticulum Prediction isomerase lumen. A4 Melanosome. Note = Identified by mass spectrometry in melanosome fractions from stage I to stage IV. PDIA6_HUMAN Protein PDIA6 Secreted, Endoplasmic Detection, disulfide- EPI, ENDO reticulum Prediction isomerase lumen (By A6 similarity). Melanosome. Note = Identified by mass spectrometry in melanosome fractions from stage I to stage IV. PECA1_HUMAN Platelet PECAM1 LungCancers, Membrane; UniProt, endothelial Benign-Nodules, Single-pass Literature, cell Symptoms type I Detection adhesion membrane molecule protein. PEDF_HUMAN Pigment SERPINF1 LungCancers, Secreted. UniProt, epithelium- Symptoms Melanosome. Literature, derived Note = Enriched Detection, factor in stage I Prediction melanosomes. PERM_HUMAN Myeloperoxidase MPO Secreted, LungCancers, Lysosome. Literature- , EPI, ENDO Benign-Nodules, Detection, Symptoms Prediction PERP1_HUMAN Plasma PACAP EPI, ENDO Secreted UniProt, cell- (Potential). Detection, induced Cytoplasm. Prediction resident Note = In
endoplasmic (PubMed: 11350957) reticulum diffuse granular protein localization in the cytoplasm surrounding the nucleus. PGAM1_HUMAN Phosphoglycerate PGAM1 Secreted, LungCancers, Detection mutase 1 EPI Symptoms PLAC1_HUMAN Placenta- PLAC1 LungCancers Secreted UniProt, specific (Probable). Prediction protein 1 PLACL_HUMAN Placenta- PLAC1L LungCancers Secreted UniProt, specific 1- (Potential). Prediction like protein PLIN2_HUMAN Perilipin-2 ADFP ENDO LungCancers Membrane; Prediction Peripheral membrane protein. PLIN3_HUMAN Perilipin-3 M6PRBP1 EPI Cytoplasm. Detection, Endosome Prediction membrane; Peripheral membrane protein; Cytoplasmic side (Potential). Lipid droplet (Potential). Note = Membrane associated on endosomes. Detected in the envelope and the core of lipid bodies and in lipid sails. PLOD1_HUMAN Procollagen- PLOD1 EPI, ENDO Rough Prediction lysine, 2- endoplasmic oxoglutarate 5- reticulum dioxygenase 1 membrane; Peripheral membrane protein; Lumenal side. PLOD2_HUMAN Procollagen- PLOD2 ENDO Benign-Nodules, Rough Prediction lysine, 2- Symptoms endoplasmic oxoglutarate 5- reticulum dioxygenase 2 membrane; Peripheral membrane protein; Lumenal side. PLSL_HUMAN Plastin-2 LCP1 Secreted, LungCancers Cytoplasm, Detection, EPI cytoskeleton. Prediction Cell junction. Cell projection. Cell projection, ruffle membrane; Peripheral membrane protein; Cytoplasmic side (By similarity). Note = Relocalizes to the immunological synapse between peripheral blood T lymphocytes and antibody- presenting cells in response to costimulation through TCR/CD3 and CD2 or CD28. Associated with the actin cytoskeleton at membrane ruffles (By similarity). Relocalizes to actin-rich cell projections upon serine phosphorylation. PLUNC_HUMAN Protein PLUNC LungCancers, Secreted (By UniProt, Plunc Benign-Nodules similarity). Prediction Note = Found in the nasal mucus (By similarity). Apical side of airway epithelial cells. Detected in nasal mucus (By similarity). PLXB3_HUMAN Plexin-B3 PLXNB3 ENDO Membrane; UniProt, Single-pass Detection, type I Prediction membrane protein. PLXC1_HUMAN Plexin-C1 PLXNC1 EPI Membrane; UniProt, Single-pass Detection type I membrane protein (Potential). POSTN_HUMAN Periostin POSTN Secreted, LungCancers, Secreted, UniProt, ENDO Benign-Nodules, extracellular Literature, Symptoms space, Detection, extracellular Prediction matrix. PPAL_HUMAN Lysosomal ACP2 EPI Symptoms Lysosome UniProt, acid membrane; Prediction phosphatase Single-pass membrane protein; Lumenal side. Lysosome lumen. Note = The soluble form arises by proteolytic processing of the membrane- bound form. PPBT_HUMAN Alkaline ALPL EPI LungCancers, Cell membrane; Literature, phosphatase, Benign-Nodules, Lipid-anchor, Detection, tissue- Symptoms GPI-anchor. Prediction nonspecific isozyme PPIB_HUMAN Peptidyl- PPIB Secreted, Endoplasmic Detection, prolyl cis- EPI, ENDO reticulum Prediction trans lumen. isomerase Melanosome. B Note = Identified by mass spectrometry in melanosome fractions from stage I to stage IV. PRDX1_HUMAN Peroxiredoxin- PRDX1 EPI LungCancers Cytoplasm. Detection, 1 Melanosome. Prediction Note = Identified by mass spectrometry in melanosome fractions from stage I to stage IV. PRDX4_HUMAN Peroxiredoxin- PRDX4 Secreted, Cytoplasm. Literature, 4 EPI, ENDO Detection, Prediction PROF1_HUMAN Profilin-1 PFN1 Secreted, LungCancers Cytoplasm, Detection EPI cytoskeleton. PRP31_HUMAN U4/U6 PRPF31 ENDO Nucleus Prediction small speckle. nuclear Nucleus, Cajal ribonucleo body. protein Note = Predominantly Prp31 found in speckles and in Cajal bodies. PRS6A_HUMAN 26S PSMC3 EPI Benign-Nodules Cytoplasm Detection protease (Potential). regulatory Nucleus subunit 6A (Potential). PSCA_HUMAN Prostate PSCA LungCancers Cell membrane; Literature, stem cell Lipid-anchor, Prediction antigen GPI-anchor. PTGIS_HUMAN Prostacyclin PTGIS EPI LungCancers, Endoplasmic UniProt, synthase Benign-Nodules reticulum Detection, membrane; Prediction Single-pass membrane protein. PTPA_HUMAN Serine/threonine- PPP2R4 ENDO Symptoms Detection, protein Prediction phosphatase 2A activator PTPRC_HUMAN Receptor- PTPRC Secreted, LungCancers Membrane; UniProt, type EPI, ENDO Single-pass Detection, tyrosine- type I Prediction protein membrane phosphatase C protein. PTPRJ_HUMAN Receptor- PTPRJ EPI LungCancers, Membrane; UniProt, type Symptoms Single-pass Detection, tyrosine- type I Prediction protein membrane phosphatase eta protein. PVR_HUMAN Poliovirus PVR Symptoms Isoform Alpha: UniProt, receptor Cell membrane; Detection, Single-pass Prediction type I membrane protein.|Isoform Delta: Cell membrane; Single-pass type I membrane protein.|Isoform Beta: Secreted.|Isoform Gamma: Secreted. RAB32_HUMAN Ras-related RAB32 EPI Mitochondrion. Prediction protein Rab-32 RAGE_HUMAN Advanced AGER Secreted LungCancers, Isoform 1: Cell UniProt, glycosylation Benign-Nodules membrane; Literature end product- Single-pass specific type I receptor membrane protein.|Isoform 2: Secreted. RAN_HUMAN GTP- RAN Secreted, LungCancers, Nucleus. Detection, binding EPI Benign-Nodules Cytoplasm. Prediction nuclear Melanosome. protein Ran Note = Becomes dispersed throughout the cytoplasm during mitosis. Identified by mass spectrometry in melanosome fractions from stage I to stage IV. RAP2B_HUMAN Ras-related RAP2B EPI Cell membrane; Prediction protein Lipid-anchor; Rap-2b Cytoplasmic side (Potential). RAP2C_HUMAN Ras-related RAP2C EPI Cell membrane; Prediction protein Lipid-anchor; Rap-2c Cytoplasmic side (Potential). RCN3_HUMAN Reticulocalbin- RCN3 EPI Symptoms Endoplasmic Prediction 3 reticulum lumen (Potential).
RL24_HUMAN 60S RPL24 EPI Prediction ribosomal protein L24 S10A1_HUMAN Protein S100A1 Symptoms Cytoplasm. Literature, S100-A1 Prediction S10A6_HUMAN Protein S100A6 Secreted LungCancers Nucleus Literature, S100-A6 envelope. Detection, Cytoplasm. Prediction S10A7_HUMAN Protein S100A7 LungCancers Cytoplasm. UniProt, S100-A7 Secreted. Literature, Note = Secreted Detection, by a non- Prediction classical secretory pathway. SAA_HUMAN Serum SAA1 Symptoms Secreted. UniProt, amyloid A Literature, protein Detection, Prediction SCF_HUMAN Kit ligand KITLG LungCancers, Isoform 1: Cell UniProt, Symptoms membrane; Literature Single-pass type I membrane protein (By similarity). Secreted (By similarity). Note = Also exists as a secreted soluble form (isoform 1 only) (By similarity).|Isoform 2: Cell membrane; Single-pass type I membrane protein (By similarity). Cytoplasm, cytoskeleton (By similarity). SDC1_HUMAN Syndecan-1 SDC1 LungCancers, Membrane; UniProt, Benign-Nodules, Single-pass Literature, Symptoms type I Detection membrane protein. SEM3G_HUMAN Semaphorin-3G SEMA3G LungCancers Secreted (By UniProt, similarity). Prediction SEPR_HUMAN Seprase FAP ENDO Symptoms Cell membrane; UniProt, Single-pass Literature, type II Detection membrane protein. Cell projection, lamellipodium membrane; Single-pass type II membrane protein. Cell projection, invadopodium membrane; Single-pass type II membrane protein. Note = Found in cell surface lamellipodia, invadopodia and on shed vesicles. SERPH_HUMAN Serpin H1 SERPINH1 Secreted, LungCancers, Endoplasmic Detection, EPI, ENDO Benign-Nodules reticulum Prediction lumen. SFPA2_HUMAN Pulmonary SFTPA2 Secreted LungCancers, Secreted, UniProt, surfactant- Benign-Nodules extracellular Prediction associated space, protein A2 extracellular matrix. Secreted, extracellular space, surface film. SFTA1_HUMAN Pulmonary SFTPA1 Secreted LungCancers, Secreted, UniProt, surfactant- Benign-Nodules, extracellular Prediction associated Symptoms space, protein A1 extracellular matrix. Secreted, extracellular space, surface film. SG3A2_HUMAN Secretoglobin SCGB3A2 LungCancers, Secreted. UniProt, family Benign-Nodules Prediction 3A member 2 SGPL1_HUMAN Sphingosine-1- SGPL1 ENDO Endoplasmic UniProt, phosphate reticulum Prediction lyase 1 membrane; Single-pass type III membrane protein. SIAL_HUMAN Bone IBSP LungCancers Secreted. UniProt, sialoprotein Literature, 2 Prediction SLPI_HUMAN Antileukopro- SLPI LungCancers, Secreted. UniProt, teinase Benign-Nodules Literature, Detection, Prediction SMD3_HUMAN Small SNRPD3 Secreted Benign-Nodules Nucleus. Prediction nuclear ribonucleo protein Sm D3 SMS_HUMAN Somatostatin SST LungCancers Secreted. UniProt, Literature, Prediction SODM_HUMAN Superoxide SOD2 Secreted LungCancers, Mitochondrion Literature,- dismutase Benign-Nodules, matrix. Detection, [Mn], Symptoms Prediction mitochondrial SORL_HUMAN Sortilin- SORL1 EPI LungCancers, Membrane; UniProt, related Symptoms Single-pass Detection receptor type I membrane protein (Potential). SPB3_HUMAN Serpin B3 SERPINB3 LungCancers, Cytoplasm. Literature, Benign-Nodules Note = Seems to Detection also be secreted in plasma by cancerous cells but at a low level. SPB5_HUMAN Serpin B5 SERPINB5 LungCancers Secreted, UniProt, extracellular Detection space. SPON2_HUMAN Spondin-2 SPON2 LungCancers, Secreted, UniProt, Benign-Nodules extracellular Prediction space, extracellular matrix (By similarity). SPRC_HUMAN SPARC SPARC LungCancers, Secreted, UniProt, Benign-Nodules, extracellular Literature, Symptoms space, Detection, extracellular Prediction matrix, basement membrane. Note = In or around the basement membrane. SRC_HUMAN Proto- SRC ENDO LungCancers, Literature oncogene Benign-Nodules, tyrosine- Symptoms protein kinase Src SSRD_HUMAN Translocon- SSR4 Secreted, Endoplasmic UniProt, associated ENDO reticulum Prediction protein membrane; subunit Single-pass delta type I membrane protein. STAT1_HUMAN Signal STAT1 EPI LungCancers, Cytoplasm. Detection transducer Benign-Nodules Nucleus. and Note = Translocated activator of into the transcription nucleus in 1-alpha/beta response to IFN-gamma- induced tyrosine phosphorylation and dimerization. STAT3_HUMAN Signal STAT3 ENDO LungCancers, Cytoplasm. Prediction transducer Benign-Nodules, Nucleus. and Symptoms Note = Shuttles activator of between the transcription nucleus and the 3 cytoplasm. Constitutive nuclear presence is independent of tyrosine phosphorylation. STC1_HUMAN Stanniocalcin- STC1 LungCancers, Secreted. UniProt, 1 Symptoms Prediction STT3A_HUMAN Dolichyl- STT3A EPI Symptoms Endoplasmic Literature diphosphooligosac- reticulum charide--protein membrane; glycosyltransferase Multi-pass subunit membrane STT3A protein. TAGL_HUMAN Transgelin TAGLN EPI LungCancers Cytoplasm Literature, (Probable). Prediction TARA_HUMAN TRIO and TRIOBP ENDO Nucleus. Detection, F-actin- Cytoplasm, Prediction binding cytoskeleton. protein Note = Localized to F-actin in a periodic pattern. TBA1B_HUMAN Tubulin TUBA1B EPI LungCancers Detection alpha-1B chain TBB2A_HUMAN Tubulin TUBB2A EPI LungCancers, Detection, beta-2A Benign-Nodules Prediction chain TBB3_HUMAN Tubulin TUBB3 EPI LungCancers, Detection beta-3 Benign-Nodules chain TBB5_HUMAN Tubulin TUBB EPI LungCancers, Detection beta chain Benign-Nodules TCPA_HUMAN T-complex TCP1 EPI Cytoplasm. Prediction protein 1 subunit alpha TCPD_HUMAN T-complex CCT4 EPI Cytoplasm. Detection, protein 1 Melanosome. Prediction subunit Note = Identified delta by mass spectrometry in melanosome fractions from stage I to stage IV. TCPQ_HUMAN T-complex CCT8 Secreted, Cytoplasm. Prediction protein 1 EPI subunit theta TCPZ_HUMAN T-complex CCT6A Secreted, Cytoplasm. Detection protein 1 EPI subunit zeta TDRD3_HUMAN Tudor TDRD3 ENDO Cytoplasm. Prediction domain- Nucleus. containing Note = Predominantly protein 3 cytoplasmic. Associated with actively
translating polyribosomes and with mRNA stress granules. TENA_HUMAN Tenascin TNC ENDO LungCancers, Secreted, UniProt, Benign-Nodules, extracellular Literature, Symptoms space, Detection extracellular matrix. TENX_HUMAN Tenascin-X TNXB ENDO LungCancers, Secreted, UniProt, Symptoms extracellular Detection, space, Prediction extracellular matrix. TERA_HUMAN Transitional VCP EPI LungCancers, Cytoplasm, Detection endoplasmic Benign-Nodules cytosol. reticulum Nucleus. ATPase Note = Present in the neuronal hyaline inclusion bodies specifically found in motor neurons from amyotrophic lateral sclerosis patients. Present in the Lewy bodies specifically found in neurons from Parkinson disease patients. TETN_HUMAN Tetranectin CLEC3B LungCancers Secreted. UniProt, Literature, Detection, Prediction TF_HUMAN Tissue F3 LungCancers, Membrane; UniProt, factor Benign-Nodules, Single-pass Literature Symptoms type I membrane protein. TFR1_HUMAN Transferrin TFRC Secreted, LungCancers, Cell membrane; UniProt, receptor EPI, ENDO Benign-Nodules, Single-pass Literature, protein 1 Symptoms type II Detection membrane protein. Melanosome. Note = Identified by mass spectrometry in melanosome fractions from stage I to stage IV.|Transferrin receptor protein 1, serum form: Secreted. TGFA_HUMAN Protransforming TGFA LungCancers, Transforming UniProt, growth Benign-Nodules growth factor Literature factor alpha alpha: Secreted, extracellular space.|Protransforming growth factor alpha: Cell membrane; Single-pass type I membrane protein. THAS_HUMAN Thromboxane- TBXAS1 EPI, ENDO LungCancers, Membrane; Prediction A Benign-Nodules, Multi-pass synthase Symptoms membrane protein. THY1_HUMAN Thy-1 THY1 EPI Symptoms Cell membrane; Detection, membrane Lipid-anchor, Prediction glycoprotein GPI-anchor (By similarity). TIMP1_HUMAN Metalloproteinase TIMP1 LungCancers, Secreted. UniProt, inhibitor 1 Benign-Nodules, Literature, Symptoms Detection, Prediction TIMP3_HUMAN Metalloproteinase TIMP3 LungCancers, Secreted, UniProt, inhibitor 3 Benign-Nodules extracellular Literature, space, Prediction extracellular matrix. TLL1_HUMAN Tolloid- TLL1 ENDO Secreted UniProt, like protein (Probable). Prediction 1 TNF12_HUMAN Tumor TNFSF12 LungCancers, Cell membrane; UniProt necrosis Benign-Nodules Single-pass factor type II ligand membrane superfamily protein.|Tumor member 12 necrosis factor ligand superfamily member 12, secreted form: Secreted. TNR6_HUMAN Tumor FAS LungCancers, Isoform 1: Cell UniProt, necrosis Benign-Nodules, membrane; Literature, factor Symptoms Single-pass Prediction receptor type I superfamily membrane member 6 protein.|Isoform 2: Secreted.|Isoform 3: Secreted.|Isoform 4: Secreted.|Isoform 5: Secreted.|Isoform 6: Secreted. TPIS_HUMAN Triosephosphate TPI1 Secreted, Symptoms Literature, isomerase EPI Detection, Prediction TRFL_HUMAN Lactotransferrin LTF Secreted, LungCancers, Secreted. UniProt, EPI, ENDO Benign-Nodules, Literature, Symptoms Detection, Prediction TSP1_HUMAN Thrombospondin- THBS1 LungCancers, Literature, 1 Benign-Nodules, Detection, Symptoms Prediction TTHY_HUMAN Transthyretin TTR LungCancers, Secreted. UniProt, Benign-Nodules Cytoplasm. Literature, Detection, Prediction TYPH_HUMAN Thymidine TYMP EPI LungCancers, Literature, phosphorylase Benign-Nodules, Detection, Symptoms Prediction UGGG1_HUMAN UDP-glucose: UGGT1 Secreted, Endoplasmic Detection, glycoprotein ENDO reticulum Prediction glucosyltransferase lumen. 1 Endoplasmic reticulum-Golgi intermediate compartment. UGGG2_HUMAN UDP-glucose: UGGT2 ENDO Endoplasmic Prediction glycoprotein reticulum glucosyltransferase lumen. 2 Endoplasmic reticulum-Golgi intermediate compartment. UGPA_HUMAN UTP-- UGP2 EPI Symptoms Cytoplasm. Detection glucose-1- phosphate uridylyltransferase UPAR_HUMAN Urokinase PLAUR LungCancers, Isoform 1: Cell UniProt, plasminogen Benign-Nodules, membrane; Literature, activator Symptoms Lipid-anchor, Prediction surface GPI- receptor anchor.|Isoform 2: Secreted (Probable). UTER_HUMAN Uteroglobin SCGB1A1 LungCancers, Secreted. UniProt, Benign-Nodules, Literature, Symptoms Detection, Prediction VA0D1_HUMAN V-type ATP6V0D1 EPI Prediction proton ATPase subunit d 1 VAV3_HUMAN Guanine VAV3 ENDO Prediction nucleotide exchange factor VAV3 VEGFA_HUMAN Vascular VEGFA LungCancers, Secreted. UniProt, endothelial Benign-Nodules, Note = VEGF121 Literature, growth Symptoms is acidic and Prediction factor A freely secreted. VEGF165 is more basic, has heparin-binding properties and, although a signicant proportion remains cell- associated, most is freely secreted. VEGF189 is very basic, it is cell-associated after secretion and is bound avidly by heparin and the extracellular matrix, although it may be released as a soluble form by heparin, heparinase or plasmin. VEGFC_HUMAN Vascular VEGFC LungCancers, Secreted. UniProt, endothelial Benign-Nodules Literature, growth Prediction factor C VEGFD_HUMAN Vascular FIGF LungCancers Secreted. UniProt, endothelial Literature, growth Prediction factor D VGFR1_HUMAN Vascular FLT1 LungCancers, Isoform Flt1: UniProt, endothelial Benign-Nodules, Cell membrane; Literature, growth Symptoms Single-pass Detection, factor type I Prediction receptor 1 membrane protein.|Isoform sFlt1: Secreted. VTNC_HUMAN Vitronectin VTN ENDO Symptoms Secreted, UniProt, extracellular Literature, space. Detection, Prediction VWC2_HUMAN Brorin VWC2 LungCancers Secreted, UniProt, extracellular Prediction space, extracellular matrix, basement membrane (By similarity). WNT3A_HUMAN Protein WNT3A LungCancers, Secreted, UniProt, Wnt-3a Symptoms extracellular Prediction space, extracellular matrix. WT1_HUMAN Wilms WT1 LungCancers, Nucleus. Literature, tumor Benign-Nodules, Cytoplasm (By Prediction protein Symptoms similarity). Note = Shuttles between nucleus and cytoplasm (By similarity).|Isoform 1: Nucleus speckle.|Isoform 4: Nucleus, nucleoplasm. ZA2G_HUMAN Zinc-alpha- AZGP1 LungCancers, Secreted. UniProt, 2- Symptoms Literature, glycoprotein Detection, Prediction ZG16B_HUMAN Zymogen ZG16B LungCancers Secreted UniProt, granule (Potential). Prediction
protein 16 homolog B
190 of these candidate protein biomarkers were shown to be measured reproducibly in blood. A moderately powered multisite and unbiased study of 242 blood samples from patients with PN was designed to determine whether a statistically significant subpanel of proteins could be identified to distinguish benign and malignant nodules of sizes under 2 cm. The three sites contributing samples and clinical data to this study were the University of Laval, University of Pennsylvania and New York University.
In an embodiment of the invention, a panel of 15 proteins effectively distinguished between samples derived from patients with benign and malignant nodules less than 2 cm diameter.
Bioinformatic and biostatistical analyses were used first to identify individual proteins with statistically significant differential expression, and then using these proteins to derive one or more combinations of proteins or panels of proteins, which collectively demonstrated superior discriminatory performance compared to any individual protein. Bioinformatic and biostatistical methods are used to derive coefficients (C) for each individual protein in the panel that reflects its relative expression level, i.e. increased or decreased, and its weight or importance with respect to the panel's net discriminatory ability, relative to the other proteins. The quantitative discriminatory ability of the panel can be expressed as a mathematical algorithm with a term for each of its constituent proteins being the product of its coefficient and the protein's plasma expression level (P) (as measured by LC-SRM-MS), e.g. C.times.P, with an algorithm consisting of n proteins described as: C1.times.P1+C2.times.P2+C3.times.P3+ . . . +Cn.times.Pn. An algorithm that discriminates between disease states with a predetermined level of statistical significance may be refers to a "disease classifier". In addition to the classifier's constituent proteins with differential expression, it may also include proteins with minimal or no biologic variation to enable assessment of variability, or the lack thereof, within or between clinical specimens; these proteins may be termed typical native proteins and serve as internal controls for the other classifier proteins.
In certain embodiments, expression levels are measured by MS. MS analyzes the mass spectrum produced by an ion after its production by the vaporization of its parent protein and its separation from other ions based on its mass-to-charge ratio. The most common modes of acquiring MS data are 1) full scan acquisition resulting in the typical total ion current plot (TIC), 2) selected ion monitoring (SIM), and 3) selected reaction monitoring (SRM).
In certain embodiments of the methods provided herein, biomarker protein expression levels are measured by LC-SRM-MS. LC-SRM-MS is a highly selective method of tandem mass spectrometry which has the potential to effectively filter out all molecules and contaminants except the desired analyte(s). This is particularly beneficial if the analysis sample is a complex mixture which may comprise several isobaric species within a defined analytical window. LC-SRM-MS methods may utilize a triple quadrupole mass spectrometer which, as is known in the art, includes three quadrupole rod sets. A first stage of mass selection is performed in the first quadrupole rod set, and the selectively transmitted ions are fragmented in the second quadrupole rod set. The resultant transition (product) ions are conveyed to the third quadrupole rod set, which performs a second stage of mass selection. The product ions transmitted through the third quadrupole rod set are measured by a detector, which generates a signal representative of the numbers of selectively transmitted product ions. The RF and DC potentials applied to the first and third quadrupoles are tuned to select (respectively) precursor and product ions that have m/z values lying within narrow specified ranges. By specifying the appropriate transitions (m/z values of precursor and product ions), a peptide corresponding to a targeted protein may be measured with high degrees of sensitivity and selectivity. Signal-to-noise ratio is superior to conventional tandem mass spectrometry (MS/MS) experiments, which select one mass window in the first quadrupole and then measure all generated transitions in the ion detector. LC-SRM-MS.
In certain embodiments, an SRM-MS assay for use in diagnosing or monitoring lung cancer as disclosed herein may utilize one or more peptides and/or peptide transitions derived from the proteins set forth in Table 6. In certain embodiments, the assay may utilize peptides and/or peptide transitions from 100 or more, 150 or more, 200 or more, 250 or more, 300 or more, 345 or more, or 371 or more biomarker proteins. In certain embodiments, two or more peptides may be utilized per biomarker proteins, and in certain of these embodiments three or more of four or more peptides may be utilized. Similarly, in certain embodiments two or more transitions may be utilized per peptide, and in certain of these embodiments three or more; four or more; or five or more transitions may be utilized per peptide. In one embodiment, an LC-SRM-MS assay for use in diagnosing lung cancer may measure the intensity of five transitions that correspond to selected peptides associated with each biomarker protein. The achievable limit of quantification (LOQ) may be estimated for each peptide according to the observed signal intensities during this analysis. For examples, for sets of target proteins associated with lung cancer see Table 12.
The expression level of a biomarker protein can be measured using any suitable method known in the art, including but not limited to mass spectrometry (MS), reverse transcriptase-polymerase chain reaction (RT-PCR), microarray, serial analysis of gene expression (SAGE), gene expression analysis by massively parallel signature sequencing (MPSS), immunoassays (e.g., ELISA), immunohistochemistry (IHC), transcriptomics, and proteomics.
To evaluate the diagnostic performance of a particular set of peptide transitions, a ROC curve is generated for each significant transition.
An "ROC curve" as used herein refers to a plot of the true positive rate (sensitivity) against the false positive rate (specificity) for a binary classifier system as its discrimination threshold is varied. A ROC curve can be represented equivalently by plotting the fraction of true positives out of the positives (TPR=true positive rate) versus the fraction of false positives out of the negatives (FPR=false positive rate). Each point on the ROC curve represents a sensitivity/specificity pair corresponding to a particular decision threshold. FIGS. 7 and 9 provide a graphical representation of the functional relationship between the distribution of biomarker or biomarker panel sensitivity and specificity values in a cohort of diseased subjects and in a cohort of non-diseased subjects.
AUC represents the area under the ROC curve. The AUC is an overall indication of the diagnostic accuracy of 1) a biomarker or a panel of biomarkers and 2) a ROC curve. AUC is determined by the "trapezoidal rule." For a given curve, the data points are connected by straight line segments, perpendiculars are erected from the abscissa to each data point, and the sum of the areas of the triangles and trapezoids so constructed is computed. In certain embodiments of the methods provided herein, a biomarker protein has an AUC in the range of about 0.75 to 1.0. In certain of these embodiments, the AUC is in the range of about 0.8 to 0.8, 0.9 to 0.95, or 0.95 to 1.0.
The methods provided herein are minimally invasive and pose little or no risk of adverse effects. As such, they may be used to diagnose, monitor and provide clinical management of subjects who do not exhibit any symptoms of a lung condition and subjects classified as low risk for developing a lung condition. For example, the methods disclosed herein may be used to diagnose lung cancer in a subject who does not present with a PN and/or has not presented with a PN in the past, but who nonetheless deemed at risk of developing a PN and/or a lung condition. Similarly, the methods disclosed herein may be used as a strictly precautionary measure to diagnose healthy subjects who are classified as low risk for developing a lung condition.
The present invention provides a method of determining the likelihood that a lung condition in a subject is cancer by measuring an abundance of a panel of proteins in a sample obtained from the subject; calculating a probability of cancer score based on the protein measurements and ruling out cancer for the subject if the score) is lower than a pre-determined score, wherein when cancer is ruled out the subject does not receive a treatment protocol. Treatment protocols include for example pulmonary function test (PFT), pulmonary imaging, a biopsy, a surgery, a chemotherapy, a radiotherapy, or any combination thereof. In some embodiments, the imaging is an x-ray, a chest computed tomography (CT) scan, or a positron emission tomography (PET) scan.
The present invention further provides a method of ruling in the likelihood of cancer for a subject by measuring an abundance of panel of proteins in a sample obtained from the subject, calculating a probability of cancer score based on the protein measurements and ruling in the likelihood of cancer for the subject if the score in step is higher than a pre-determined score
In another aspect the invention further provides a method of determining the likelihood of the presence of a lung condition in a subject by measuring an abundance of panel of proteins in a sample obtained from the subject, calculating a probability of cancer score based on the protein measurements and concluding the presence of said lung condition if the score is equal or greater than a pre-determined score. The lung condition is lung cancer such as for example, non-small cell lung cancer (NSCLC). The subject at risk of developing lung cancer
The panel includes at least 4 proteins selected from ALDOA, FRIL, LG3BP, IBP3, LRP1, ISLR, TSP1, COIA1, GRP78, TETN, PRDX1 and CD14. Optionally, the panel further includes at least one protein selected from BGH3, COIA1, TETN, GRP78, PRDX, FIBA and GSLG1.
Alternatively, the panel includes at least 3 proteins selected from ALDOA, FRIL, LG3BP, IBP3, LRP1, ISLR, TSP1, COIA1, GRP78, TETN, PRDX1 and CD14. In some embodiments, the panel comprises at least 1, 2, 3, or 4 proteins selected from LRP1, COIA1, ALDOA, and LG3BP. In some embodiments, the panel comprises at least 1, 2, 3, 4, 5, 6, 7, or 8 proteins selected from LRP1, COIA1, ALDOA, LG3BP, BGH3, PRDX1, TETN, and ISLR. In some embodiments, the panel comprises at least 1, 2, 3, 4, 5, 6, 7, 8, 9, 10, 11, 12, or 13 proteins selected from LRP1, COIA1, ALDOA, LG3BP, BGH3, PRDX1, TETN, ISLR, TSP1, GRP78, FRIL, FIBA, GSLG1.
Optionally, the panel includes at least 1, 2, 3, 4, 5, 6, 7, 8, 9, 10, 11, 12, 13, 14, 15, 16, 17, 18, 19, 20, 21, 22, 23, 24, 25, 26, 27, 28, 29, 30, 31, 32, 33, 34, 35, or 36 proteins selected from TSP1, COIA1, ISLR, TETN, FRIL, GRP78, ALDOA, BGH3, LG3BP, LRP1, FIBA, PRDX1, GSLG1, KIT, CD14, EF1A1, TENX, AIFM1, GGH, IBP3, ENPL, ERO1A, 6PGD, ICAM1, PTPA, NCF4, SEM3G, 1433T, RAP2B, MMP9, FOLH1, GSTP1, EF2, RAN, SODM, and DSG2.
Optionally, the panel includes at least 1, 2, 3, 4, 5, 6, 7, 8, 9, 10, 11, 12, 13, 14, 15, 16, 17, 18, 19, 20, 21, 22, 23, 24, 25, 26, 27, 28, 29, 30, 31, 32, 33, 34, 35, 36, 37, 38, 39, 40, 41, 42, 43, 44 proteins selected from FRIL, TSP1, LRP1, PRDX1, TETN, TBB3, COIA1, GGH, A1AG1, AIFM1, AMPN, CRP, GSLG1, IBP3, KIT, NRP1, 6PGD, CH10, CLIC1, COF1, CSF1, CYTB, DMKN, DSG2, EREG, ERO1A, FOLH1, ILEU, K1C19, LYOX, MMP7, NCF4, PDIA3, PTGIS, PTPA, RAN, SCF, SEM3G, TBA1B, TCPA, TERA, TIMP1, TNF12, and UGPA.
The subject has or is suspected of having a pulmonary nodule. The pulmonary nodule has a diameter of less than or equal to 3 cm. In one embodiment, the pulmonary nodule has a diameter of about 0.8 cm to 2.0 cm. The subject may have stage IA lung cancer (i.e., the tumor is smaller than 3 cm).
The score is calculated from a logistic regression model applied to the protein measurements. For example, the score is determined as P.sub.s=1/[1+exp(-.alpha.-.SIGMA..sub.i=1.sup.N.beta..sub.i*{hacek over (I)}.sub.i,s)], where {hacek over (I)}.sub.i,s is logarithmically transformed and normalized intensity of transition i in said sample (s), .beta..sub.i is the corresponding logistic regression coefficient, .alpha. was a panel-specific constant, and N was the total number of transitions in said panel.
In various embodiments, the method of the present invention further comprises normalizing the protein measurements. For example, the protein measurements are normalized by one or more proteins selected from PEDF, MASP1, GELS, LUM, C163A and PTPRJ.
The biological sample such as for example tissue, blood, plasma, serum, whole blood, urine, saliva, genital secretion, cerebrospinal fluid, sweat and excreta.
In one aspect, the determining the likelihood of cancer is determined by the sensitivity, specificity, negative predictive value or positive predictive value associated with the score. The score determined has a negative predictive value (NPV) is at least about 60%, at least 70% or at least 80%.
The measuring step is performed by selected reaction monitoring mass spectrometry, using a compound that specifically binds the protein being detected or a peptide transition. In one embodiment, the compound that specifically binds to the protein being measured is an antibody or an aptamer.
In specific embodiments, the diagnostic methods disclosed herein are used to rule out a treatment protocol for a subject, measuring the abundance of a panel of proteins in a sample obtained from the subject, calculating a probability of cancer score based on the protein measurements and ruling out the treatment protocol for the subject if the score determined in the sample is lower than a pre-determined score. In some embodiments the panel contains at least 3 proteins selected ALDOA, FRIL, LG3BP, IBP3, LRP1, ISLR, TSP1, COIA1, GRP78, TETN, PRDX1 and CD14.
Optionally, the panel further comprises one or more proteins selected from ERO1A, 6PGD, GSTP1, GGH, PRDX1, CD14, PTPA, ICAM1, FOLH1, SODM, FIBA, GSLG1, RAP2B, or C163A or one or more proteins selected from LRP1, COIA1, TSP1, ALDOA, GRP78, FRIL, LG3BP, BGH3, ISLR, PRDX1, FIBA, or GSLG. In preferred embodiments, the panel contains at least TSP1, LG3BP, LRP1, ALDOA, and COIA1. In more a preferred embodiment, the panel contains at least TSP1, LRP1, ALDOA and COIA1.
In specific embodiments, the diagnostic methods disclosed herein are used to rule in a treatment protocol for a subject by measuring the abundance of a panel of proteins in a sample obtained from the subject, calculating a probability of cancer score based on the protein measurements and ruling in the treatment protocol for the subject if the score determined in the sample is greater than a pre-determined score. In some embodiments the panel contains at least 3 proteins selected ALDOA, FRIL, LG3BP, IBP3, LRP1, ISLR or TSP1 or ALDOA, FRIL, LG3BP, IBP3, LRP1, ISLR, TSP1, COIA1, GRP78, TETN, PRDX1 and CD14. Optionally, the panel further comprises one or more proteins selected from ERO1A, 6PGD, GSTP1, COIA1, GGH, PRDX1, SEM3G, GRP78, TETN, AIFM1, MPRI, TNF12, MMP9 or OSTP or COIA1, TETN, GRP78, APOE or TBB3.
In certain embodiments, the diagnostic methods disclosed herein can be used in combination with other clinical assessment methods, including for example various radiographic and/or invasive methods. Similarly, in certain embodiments, the diagnostic methods disclosed herein can be used to identify candidates for other clinical assessment methods, or to assess the likelihood that a subject will benefit from other clinical assessment methods.
The high abundance of certain proteins in a biological sample such as plasma or serum can hinder the ability to assay a protein of interest, particularly where the protein of interest is expressed at relatively low concentrations. Several methods are available to circumvent this issue, including enrichment, separation, and depletion. Enrichment uses an affinity agent to extract proteins from the sample by class, e.g., removal of glycosylated proteins by glycocapture. Separation uses methods such as gel electrophoresis or isoelectric focusing to divide the sample into multiple fractions that largely do not overlap in protein content. Depletion typically uses affinity columns to remove the most abundant proteins in blood, such as albumin, by utilizing advanced technologies such as IgY14/Supermix (Sigma St. Louis, Mo.) that enable the removal of the majority of the most abundant proteins.
In certain embodiments of the methods provided herein, a biological sample may be subjected to enrichment, separation, and/or depletion prior to assaying biomarker or putative biomarker protein expression levels. In certain of these embodiments, blood proteins may be initially processed by a glycocapture method, which enriches for glycosylated proteins, allowing quantification assays to detect proteins in the high pg/ml to low ng/ml concentration range. Exemplary methods of glycocapture are well known in the art (see, e.g., U.S. Pat. No. 7,183,188; U.S. Patent Appl. Publ. No. 2007/0099251; U.S. Patent Appl. Publ. No. 2007/0202539; U.S. Patent Appl. Publ. No. 2007/0269895; and U.S. Patent Appl. Publ. No. 2010/0279382). In other embodiments, blood proteins may be initially processed by a protein depletion method, which allows for detection of commonly obscured biomarkers in samples by removing abundant proteins. In one such embodiment, the protein depletion method is a Supermix (Sigma) depletion method.
In certain embodiments, a biomarker protein panel comprises two to 100 biomarker proteins. In certain of these embodiments, the panel comprises 2 to 5, 6 to 10, 11 to 15, 16 to 20, 21-25, 5 to 25, 26 to 30, 31 to 40, 41 to 50, 25 to 50, 51 to 75, 76 to 100, biomarker proteins. In certain embodiments, a biomarker protein panel comprises one or more subpanels of biomarker proteins that each comprise at least two biomarker proteins. For example, biomarker protein panel may comprise a first subpanel made up of biomarker proteins that are overexpressed in a particular lung condition and a second subpanel made up of biomarker proteins that are under-expressed in a particular lung condition.
In certain embodiments of the methods, compositions, and kits provided herein, a biomarker protein may be a protein that exhibits differential expression in conjunction with lung cancer. For example, in certain embodiments a biomarker protein may be one of the proteins associated with lung cancer set forth in Table 6.
In other embodiments, the diagnosis methods disclosed herein may be used to distinguish between two different lung conditions. For example, the methods may be used to classify a lung condition as malignant lung cancer versus benign lung cancer, NSCLC versus SCLC, or lung cancer versus non-cancer condition (e.g., inflammatory condition).
In certain embodiments, kits are provided for diagnosing a lung condition in a subject. These kits are used to detect expression levels of one or more biomarker proteins. Optionally, a kit may comprise instructions for use in the form of a label or a separate insert. The kits can contain reagents that specifically bind to proteins in the panels described, herein. These reagents can include antibodies. The kits can also contain reagents that specifically bind to mRNA expressing proteins in the panels described, herein. These reagents can include nucleotide probes. The kits can also include reagents for the detection of reagents that specifically bind to the proteins in the panels described herein. These reagents can include fluorophores.
The following examples are provided to better illustrate the claimed invention and are not to be interpreted as limiting the scope of the invention. To the extent that specific materials are mentioned, it is merely for purposes of illustration and is not intended to limit the invention. One skilled in the art may develop equivalent means or reactants without the exercise of inventive capacity and without departing from the scope of the invention
EXAMPLES
Example 1: Identification of Lung Cancer Biomarker Proteins
A retrospective, case-control study design was used to identify biomarker proteins and panels thereof for diagnosing various lung diseases in pre-defined control and experimental groups. The first goal of these studies was to demonstrate statistically significant differential expression for individual proteins between control and experimental groups. The second goal is to identify a panel of proteins which all individually demonstrate statistically significant differential expression between control and experimental groups. This panel of proteins can then be used collectively to distinguish between dichotomous disease states.
Specific study comparisons may include 1) cancer vs. non-cancer, 2) small cell lung cancer versus non-small cell lung cancer (NSCLC), 3) cancer vs. inflammatory disease state (e.g., infectious granuloma), or 4) different nodule size, e.g., <10 mm versus .gtoreq.10 mm (alternatively using 10, 15 or 20 mm cut-offs depending upon sample distributions).
Data for each subject consisted of the following:
Archived plasma samples from subjects previously enrolled in Institute Review Board (IRB)-approved studies was used to identify biomarker proteins and biomarker panels for distinguishing lung malignancies from non-malignancies. Plasma samples were originally obtained by routine phlebotomy, aliquotted, and stored at -80.degree. C. or lower. Sample preparation, assignment of subject identification codes, initial subject record entry, and specimen storage were performed as per IRB study protocols. Sample eligibility is based on clinical parameters, including the subject, PN, and clinical staging parameters. Parameters for inclusion and exclusion are set forth in Table 7.
TABLE-US-00007 TABLE 7 Inclusion Criteria Sample Sample eligibility will be based on clinical parameters, Inclusion including the following subject, nodule and clinical Criteria staging parameters: Subject age .gtoreq.40 any smoking status, e.g. current, former, or never co-morbid conditions, e.g. COPD prior malignancy - only skin carcinomas - squamous or basal cell Nodule radiology size .gtoreq.4 mm and .ltoreq.30 mm solid, semi-solid or non-solid any spiculation or ground glass opacity pathology malignant - e.g. adenocarcinoma, squamous, or large cell benign - inflammatory (e.g. granulomatous, infectious) or non-inflammatory (e.g. hamartoma) confirmed by biopsy, surgery or stability of lung nodule for 2 years or more. Clinical stage Primary tumor: .ltoreq.T1 (e.g. 1A, 1B) Regional lymph nodes: N0 or N1 only Distant metastasis: M0 only Sample Subject Exclusion prior malignancy within 5 years of lung nodule diagnosis Criteria Nodule size data unavailable for cancer or benign nodule, no pathology or follow-up CT data available Clinical stage Primary tumor: .gtoreq.T2 Regional lymph nodes: .gtoreq.N2 Distant metastasis: .gtoreq.M1
The assignment of a sample to a control or experimental group, and its further stratification or matching to other samples within and between these groups, is dependent on various clinical data about the subject. This data includes, for example, demographic information such as age, gender, and clinical history (e.g., smoking status), co-morbid conditions, PN characterization, and pathologic interpretation of resected lesions and tissues (Table 8).
TABLE-US-00008 TABLE 8 1. Enrollment Data a. Demographics - age, birth date, gender, ethnicity b. Measurements - Height (cm) and weight (kg) c. Smoking history - never, former, or current with pack-year estima- tion d. Medical history - details of co-morbid conditions, e.g. chronic obstructive pulmonary disease (COPD), inflammatory or autoimmune diseases, endocrine (diabetes), and cardiovascular e. Medication history - current medications, dosages and indications f. Radiographic data and nodule characteristics 1) nodule size in millimeters (width .times. height .times. length) 2) location, e.g. right or left and upper, lower or middle 3) quality, e.g. solid, semi-solid, ground glass, calcified, etc. 2. Diagnostic Evaluation Data a. Primary diagnosis and associated reports (clinical history, physical exam, and laboratory tests report) b. Pulmonary Function Tests (PFTs), if available c. Follow-up CT scans - subsequent nodule evaluations by chest CT d. PET scan e. Clinical Staging f. Biopsy procedures 1) FNA or TTNA 2) bronchoscopy with transbronchial or needle biopsy 3) surgical diagnostic procedures, e.g. VATS and/or thoracotomy 3. Radiology Report(s) 4. Pathology Report(s) 5. Blood Sample Collection Information 6. Reporting of Adverse Events a. AEs resulting from center's SOC, e.g. procedural morbidity. Subject demographics - e.g. age, gender, ethnicity smoking status - e.g. never-, former- ("ex-") or current- smoker; pack-years clinical history - e.g. co-morbid conditions, e.g. COPD, infection Nodule size - e.g. planar (width .times. height .times. length) and volume dimensions appearance - e.g. calcifications, ground glass appearance, eccentricity Pathology primary lung vs. systemic disorder malignancy status - malignant vs. benign (vs. indeterminate) histopathology - e.g. small cell lung cancer (SCLC) vs. non-small cell lung cancer (NSCLC - adenocarcinoma, squamous carcinoma, large cell carcinoma); other types, e.g. hematologic, carcinoid, etc. immunologically quiescent, e.g. hamartoma, vs. inflammatory, e.g. granulomatous and/or infectious, e.g. fungal
The study design and analytical plan prioritizes the control:experimental group pairings set forth in Table 9. Additional clinical and molecular insights may be gained by selective inclusion of phenotypes, e.g. effect of smoking, in the assignment of experimental and control groups. Demographic information available in the clinical database will enable further refinements in sample selection via the stratification or matching of samples in the case-control analyses with respect to clinical parameters, e.g., age and nodule size.
TABLE-US-00009 TABLE 9 Assignment of Experimental and Control Groups to Achieve Proteomic Analysis Objectives Experimental Control Analysis Objective Group Group 1 Differentiate A. Cancer Any non- cancer from benign nodule malignant lung nodule (benign) phenotype with nodule .gtoreq.4 mm in diameter 2 Differentiate A. Cancer Non-malignant cancer from non- nodule (non-benign) lung malignant disorder, e.g. (inflammatory, granulomatous infectious) (fungal) disease, lung nodule with nodule
LC-SRM-MS is performed to identify and quantify various plasma proteins in the plasma samples. Prior to LC-SRM-MS analysis, each sample is depleted using IgY14/Supermix (Sigma) and then trypsin-digested. Samples from each control or experimental group are batched randomly and processed together on a QTrap 5500 instrument (AB SCIEX, Foster City, Calif.) for unbiased comparisons. Each sample analysis takes approximately 30 minutes. Peak areas for two transitions (native and heavy label) are collected and reported for all peptides and proteins. The data output for each protein analyzed by LC-SRM-MS typically yields four measurements consisting of two transition measurements from each of two peptides from the same protein. These measurements enable an inference of the relative abundance of the target protein, which will be used as its expression level in the bioinformatics and statistical analyses.
Identification of biomarker proteins having differential expression levels between the control and experimental groups yields one or more novel proteomic profiles. For example, biomarker proteins are identified with expression levels that differ in subjects with PNs who are diagnosed with NSCLC versus those without an NSCLC diagnosis, or in subjects with PNs who are diagnosed with NSCLC versus an inflammatory disorder. Panels of biomarker proteins are also identified which can collectively discriminate between dichotomous disease states.
Analyses may be (a priori) powered appropriately to control type 1 and type 2 errors at 0.05 and to detect inter-cohort differences of 25% per analyte. The diagnostic power of individual proteins is generally assessed to distinguish between two cohorts, assuming a one-sided paired non-parametric test is used. This provides a lower bound on the sample size required to demonstrate differential expression between experimental and control groups. Multiple testing effects apply for the identification of panels of proteins for assessing diagnostic efficacy, which requires larger sample sizes.
The sequence of steps for determining statistical significance for differential expression of an individual protein includes the following: 1) assessing and correlating the calibrated values of transitions of a single protein (a quality control measure); 2) comparing paired analysis of groups to control for other influences using the Mann-Whitney U-test (rank sum) to determine statistical significance; and 3) determining its significance based on a pre-defined significance threshold. Transitions within a protein that are not correlated across samples (e.g., Pearson correlation <0.5) will be deemed unreliable and excluded from the analysis.
Comparison of calibrated samples between two cohorts, e.g., cancer and non-cancer, requires pairing or matching using a variety of clinical parameters such as nodule size, age and gender. Such pairing controls for the potential influence of these other parameters on the actual comparison goal, e.g. cancer and non-cancer. A non-parametric test such as the Mann-Whitney U-test (rank sum) will then be applied to measure the statistical difference between the groups. The resulting p value can be adjusted using multiple testing corrections such as the false discovery rate. Permutation tests can be used for further significance assessments.
Significance will be determined by the satisfaction of a pre-defined threshold, such as 0.05, to filter out assays, with the potential use of higher threshold values for additional filtering. An additional significance criterion is that two of three replicate assays must individually be significant in order for the assay, e.g., single protein, to be significant.
Panels of proteins that individually demonstrate statistically significant differential expression as defined above and which can collectively be used to distinguish dichotomous disease states are identified using statistical methods described herein. This requires developing multivariate classifiers and assessing sensitivity, specificity, and ROC AUC for panels. In addition, protein panels with optimal discriminatory performance, e.g., ROC AUC, are identified and may be sufficient for clinical use in discriminating disease states.
The sequence of steps for determining the statistical significance of the discriminatory ability of a panel of proteins includes 1) developing multivariate classifiers for protein panels, and 2) identifying a protein panel with optimal discriminatory performance, e.g. ROC AUC, for a set of disease states.
A multivariate classifier (e.g., majority rule) will be developed for protein panels, including single protein assays deemed to be significant. The sensitivity and specificity of each classifier will be determined and used to generate a receiver operating characteristics (ROC) curve and its AUC to assess a given panel's discriminatory performance for a specific comparison, e.g. cancer versus non-cancer.
Protocol
1. Review clinical data from a set of subjects presenting with lung disease.
2. Provide plasma samples from the subjects wherein the samples are either benign, cancerous, COPD or another lung disease.
3. Group the plasma samples that are benign or cancerous by PNs that are separated by size of the nodule.
4. Target a pool of 371 putative lung cancer biomarker proteins consisting of at least two peptides per protein and at least two LC-SRM-MS transitions per peptide. Measuring the LC-SRM-MS transitions in each specimen along with 5 synthetic internal standards consisting of 10 transitions to compare peptide transitions from the plasma to the synthetic internal standards by LC-SRM-MS mass spectroscopy.
5. Quantitate the intensity of each transition.
6. Normalize the quantitated transitions to internal standards to obtain a normalized intensity.
7. Review the measured peptide transitions for correlations from the same peptide, rejecting discordant transitions.
8. Generate an ROC for each transition by comparing cancerous with benign samples. (ROC compare specificity (true positive) to (1-sensitivity) false positive).
9. Define the AUC for each transition. (An AUC of 0.5 is a random classifier; 1.0 is a perfect classifier).
10. Determine an AUC cut-off point to determine transitions that are statistically significant.
11. Define the transitions that exceed the AUC cutoff point.
12. Combine all pairings of significant transitions.
13. Define a new AUC for each transition pair by means of logistical regression.
14. Repeat pairing combinations into triples, quad, etc.; defining a new AUC based upon the logistical regression of combined transitions until a panel of biomarker transitions with combined desired performance (sensitivity & specificity) have been achieved.
15. The panel of biomarker transitions is verified against previously unused set of plasma panels.
Example 2: Diagnosis/Classification of Lung Disease Using Biomarker Proteins
Plasma samples will be obtained from one or more subjects presenting with PNs to evaluate whether the subjects have a lung condition. The plasma samples will be depleted using IgY14/Supermix (Sigma) and optionally subjected to one or more rounds of enrichment and/or separation, and then trypsinized. The expression level of one or more biomarker proteins previously identified as differentially expressed in subjects with the lung condition will be measured using an LC-SRM-MS assay. The LC-SRM-MS assay will utilize two to five peptide transitions for each biomarker protein. For example, the assay may utilize one or more of the peptide transitions generated from any of the proteins listed in Table 6. Subjects will be classified as having the lung condition if one or more of the biomarker proteins exhibit expression levels that differ significantly from the pre-determined control expression level for that protein.
Example 3: Blood-Based Diagnostic Test to Determine the Likelihood that a Pulmonary Nodule (PN) is Benign or Malignant
A panel of 15 proteins was created where the concentration of these 15 proteins relative to the concentration of 6 protein standards is indicative of likelihood of cancer. The relative concentration of these 15 proteins to the 6 protein standards was measured using a mass spectrometry methodology. A classification algorithm is used to combine these relative concentrations into a relative likelihood of the PN being benign or malignant. Further it has been demonstrated that there are many variations on these panels that are also diagnostic tests for the likelihood that a PN is benign or malignant. Variations on the panel of proteins, protein standards, measurement methodology and/or classification algorithm are described herein.
Study Design
A Single Reaction Monitoring (SRM) mass spectrometry (MS) assay was developed consisting of 1550 transitions from 345 lung cancer associated proteins. The SRM-MS assay and methodology is described above. The goal of this study was to develop a blood-based diagnostic for classifying PNs under 2 cm in size as benign or malignant. The study design appears in Table 10.
TABLE-US-00010 TABLE 10 Study Design Small (<2 cm) Large (>2 cm) Laval UPenn NYU Laval UPenn NYU Benign 14 29 29 13 21 15 Malignant 14 29 29 13 21 15 Batches 1 2 2 1 2 1 72 vs. 72 (94% power) 49 vs. 49 (74% power)
The study consisted of 242 plasma samples from three sites (Laval, UPenn and NYU). The number of benign and malignant samples from each site are indicated in Table 10. The study consisted of 144 plasma samples from patients with PNs of size 2 cm or less and of 98 samples from patients with PNs of size larger than 2 cm. This resulted in an estimated power of 94% for discovering proteins with blood concentrations of 1.5 fold or more between benign and malignant cancer samples of size 2 cm or less. Power is 74% for PNs of size larger than 2 cm.
This study was a retrospective multisite study that was intended to derive protein biomarkers of lung cancer that are robust to site-to-site variation. The study included samples larger than 2 cm to ensure that proteins not detectable due to the limit of detection of the measurement technology (LC-SRM-MS) for tumors of size 2 cm or less could still be detected in tumors of size 2 cm or larger.
Samples from each site and in each size class (above and below 2 cm) were matched on nodule size, age and gender.
Sample Analysis
Each sample was analyzed using the LC-SRM-MS measurement methodology as follows:
1. Samples were depleted of high abundance proteins using the IGy14 and Supermix depletion columns from Sigma-Aldrich.
2. Samples were digested using trypsin into tryptic peptides.
3. Samples were analyzed by LC-SRM-MS using a 30 minute gradient on a Waters nanoacuity LC system followed by SRM-MS analysis of the 1550 transitions on a AB-Sciex 5500 triple quad device.
4. Raw transition ion counts were obtained and recorded for each of the 1550 transitions.
It is important to note that matched samples were processed at each step either in parallel (steps 2 and 4) or back-to-back serially (steps 1 and 3). This minimizes analytical variation. Finally, steps 1 and 2 of the sample analysis are performed in batches of samples according to day of processing. There were five batches of `small` samples and four batches of `large` samples as denoted in Table 10.
Protein Shortlist
A shortlist of 68 proteins reproducibly diagnostic across sites was derived as follows. Note that each protein can be measured by multiple transitions.
Step 1: Normalization
Six proteins were identified that had a transition detected in all samples of the study a with low coefficient of variation. For each protein the transition with highest median intensity across samples was selected as the representative transition for the protein. These proteins and transitions are found in Table 11.
TABLE-US-00011 TABLE 11 Normalizing Factors Protein (Uniprot Peptide Transition ID) (Amino Acid Sequence) (m/z) CD44_HUMAN YGFIEGHVVIPR (SEQ ID NO: 1) 272.2 TENX_HUMAN YEVTVVSVR (SEQ ID NO: 2) 759.5 CLUS_HUMAN ASSIIDELFQDR (SEQ ID NO: 3) 565.3 IBP3_HUMAN FLNVLSPR (SEQ ID NO: 4) 685.4 GELS_HUMAN TASDFITK (SEQ ID NO: 5) 710.4 MASP1_HUMAN TGVITSPDFPNPYPK 258.10 (SEQ ID NO: 6)
We refer to the transitions in Table 11 as normalizing factors (NFs). Each of the 1550 transitions were normalized by each of the six normalizing factors where the new intensity of a transition t in a sample s by NF f, denoted New(s, t, f), is calculated as follows: New(s,t,f)=Raw(s,t)*Median(f)/Raw(s,f)
where Raw(s,t) is the original intensity of transition t in sample s; Median(f) is the median intensity of the NF f across all samples; and Raw(s,f) is the original intensity of the NF f in sample s.
For each protein and normalized transition, the AUC of each batch was calculated. The NF that minimized the coefficient of variation across the 9 batches was selected as the NF for that protein and for all transitions of that protein. Consequently, every protein (and all of its transitions) are now normalized by a single NF.
Step 2: Reproducible Diagnostic Proteins
For each normalized transition its AUC for each of the nine batches in the study is calculated as follows. If the transition is detected in fewer than half of the cancer samples and in fewer than half of the benign samples then the batch AUC is `ND`. Otherwise, the batch AUC is calculated comparing the benign and cancer samples in the batch.
The batch AUC values are transformed into percentile AUC scores for each transition. That is, if a normalized transition is in the 82nd percentile of AUC scores for all transitions then it is assigned percentile AUC 0.82 for that batch.
Reproducible transitions are those satisfying at least one of the following criteria:
1. In at least four of the five small batches the percentile AUC is 75% or more (or 25% and less).
2. In at least three of the five small batches the percentile AUC is 80% or more (or 20% and less) AND the remaining percentile AUCs in the small batches are above 50% (below 50%).
3. In all five small batches the percentile AUC is above 50% (below 50%).
4. In at least three of the four large batches the percentile AUC is 85% or more (or 15% and less).
5. In at least three of the four large batches the percentile AUC is 80% or more (or 20% and less) AND the remaining percentile AUCs in the large batches are above 50% (below 50%).
6. In all four large batches the percentile AUC is above 50% (below 50%).
These criteria result in a list of 67 proteins with at least one transition satisfying one or more of the criteria. These proteins appear in Table 12.
TABLE-US-00012 TABLE 12 Percentage Occurrence Occurrence Across131 Across 131 Uniprot Protein (Uniprot) Panels Panels Protein Names Accession No. G3P_HUMAN 113 86% Glyceraldehyde-3-phosphate P04406 dehydrogenase; Short name = GAPDH; Alternative name(s): Peptidyl-cysteine S-nitrosylase GAPDH FRIL_HUMAN 107 82% Recommended name: P02792 Ferritin light chain Short name = Ferritin L subunit HYOU1_HUMAN 69 53% Recommended name: Q9Y4L1 Hypoxia up-regulated protein 1 Alternative name(s): 150 kDa oxygen-regulated protein Short name = ORP-150 170 kDa glucose-regulated protein Short name = GRP-170 ALDOA_HUMAN 66 50% Recommended name: P04075 Fructose-bisphosphate aldolase A EC = 4.1.2.13 Alternative name(s): Lung cancer antigen NY-LU-1 Muscle-type aldolase HXK1_HUMAN 65 50% Recommended name: P19367 Hexokinase-1 EC = 2.7.1.1 Alternative name(s): Brain form hexokinase Hexokinase type I Short name = HK I APOE_HUMAN 63 48% Recommended name: P02649 Apolipoprotein E Short name = Apo-E TSP1_HUMAN 63 48% Recommended name: P07996 Thrombospondin-1 FINC_HUMAN 62 47% Recommended name: P02751 Fibronectin Short name = FN Alternative name(s): Cold-insoluble globulin Short name = CIG Cleaved into the following 4 chains: 1. Anastellin 2. Ugl-Y1 3. Ugl-Y2 4. Ugl-Y3 LRP1_HUMAN 58 44% Recommended name: Prolow-density lipoprotein receptor- related protein 1 Short name = LRP-1 Alternative name(s): Alpha-2-macroglobulin receptor Short name = A2MR Apolipoprotein E receptor Short name = APOER CD_antigen = CD91 Cleaved into the following 3 chains: 1. Low-density lipoprotein receptor-related protein 1 85 kDa subunit Short name = LRP-85 2. Low-density lipoprotein receptor-related protein 1 515 kDa subunit Short name = LRP-515 3. Low-density lipoprotein receptor-related protein 1 intracellular domain Short name = LRPICD 6PGD_HUMAN 50 38% Recommended name: P52209 6-phosphogluconate dehydrogenase, decarboxylating S10A6_HUMAN 47 36% Recommended name: P06703 Protein S100-A6 Alternative name(s): Calcyclin Growth factor-inducible protein 2A9 MLN 4 Prolactin receptor-associated protein Short name = PRA S100 calcium-binding protein A6 CALU_HUMAN 45 34% Recommended name: O43852 Calumenin Alternative name(s): Crocalbin IEF SSP 9302 PRDX1_HUMAN 45 34% Recommended name: Q06830 Peroxiredoxin-1 EC = 1.11.1.15 Alternative name(s): Natural killer cell-enhancing factor A Short name = NKEF-A Proliferation-associated gene protein Short name = PAG Thioredoxin peroxidase 2 Thioredoxin-dependent peroxidereductase 2 RAN_HUMAN 45 34% Recommended name: P62826 GTP-binding nuclear protein Ran Alternative name(s): Androgen receptor-associated protein 24 GTPase Ran Ras-like protein TC4 Ras-related nuclear protein CD14_HUMAN 43 33% Recommended name: P08571 Monocyte differentiation antigen CD14 Alternative name(s): Myeloid cell-specific leucine-rich glycoprotein CD_antigen = CD14 Cleaved into the following 2 chains: 1. Monocyte differentiation antigen CD14, urinary form 2. Monocyte differentiation antigen CD14, membrane-bound form AMPN_HUMAN 41 31% Recommended name: P15144 Aminopeptidase N Short name = AP-N Short name = hAPN EC = 3.4.11.2 Alternative name(s): Alanyl aminopeptidase Aminopeptidase M Short name = AP-M Microsomal aminopeptidase Myeloid plasma membrane glycoprotein CD13 gp150 CD_antigen = CD13 GSLG1_HUMAN 36 27% Recommended name: Q92896 Golgi apparatus protein 1 Alternative name(s): CFR-1 Cysteine-rich fibroblast growth factor receptor E-selectin ligand 1 Short name = ESL-1 Golgi sialoglycoprotein MG-160 1433Z_HUMAN 32 24% Recommended name: P63104 14-3-3 protein zeta/delta Alternative name(s): Protein kinase C inhibitor protein 1 Short name = KCIP-1 IBP3_HUMAN 31 24% Recommended name: P17936 Insulin-like growth factor-binding protein 3 Short name = IBP-3 Short name = IGF-binding protein 3 Short name = IGFBP-3 ILK_HUMAN 31 24% Recommended name: Q13418 Integrin-linked protein kinase EC = 2.7.11.1 Alternative name(s): 59 kDa serine/threonine-protein kinase ILK-1 ILK-2 p59ILK LDHB_HUMAN 30 23% Recommended name: P07195 L-lactate dehydrogenase B chain Short name = LDH-B EC = 1.1.1.27 Alternative name(s): LDH heart subunit Short name = LDH-H Renal carcinoma antigen NY-REN-46 MPRI_HUMAN 29 22% Recommended name: P11717 Cation-independent mannose-6-phosphate receptor Short name = CI Man-6-P receptor Short name = CI-MPR Short name = M6PR Alternative name(s): 300 kDa mannose 6-phosphate receptor Short name = MPR 300 Insulin-like growth factor 2 receptor Insulin-like growth factor II receptor Short name = IGF-II receptor M6P/IGF2 receptor Short name = M6P/IGF2R CD_antigen = CD222 PROF1_HUMAN 29 22% Recommended name: P07737 Profilin-1 Alternative name(s): Profilin I PEDF_HUMAN 28 21% Recommended name: P36955 Pigment epithelium-derived factor Short name = PEDF Alternative name(s): Cell proliferation-inducing gene 35 protein EPC-1 Serpin F1 CLIC1_HUMAN 26 20% Recommended name: O00299 Chloride intracellular channel protein 1 Alternative name(s): Chloride channel ABP Nuclear chloride ion channel 27 Short name = NCC27 Regulatory nuclear chloride ion channel protein Short name = hRNCC GRP78_HUMAN 25 19% Recommended name: P11021 78 kDa glucose-regulated protein Short name = GRP-78 Alternative name(s): Endoplasmic reticulum lumenal Ca(2+)- binding protein grp78 Heat shock 70 kDa protein 5 Immunoglobulin heavy chain-binding protein Short name = BiP CEAM8_HUMAN 24 18% Recommended name: P31997 Carcinoembryonic antigen-related cell adhesion molecule 8 Alternative name(s): CD67 antigen Carcinoembryonic antigen CGM6 Non-specific cross-reacting antigen NCA-95 CD_antigen = CD66b VTNC_HUMAN 24 18% Recommended name: P04004 Vitronectin Alternative name(s): S-protein Serum-spreading factor V75 Cleaved into the following 3 chains: 1. Vitronectin V65 subunit 2. Vitronectin V10 subunit 3. Somatomedin-B CERU_HUMAN 22 17% Recommended name: P00450 Ceruloplasmin EC = 1.16.3.1 Alternative name(s): Ferroxidase DSG2_HUMAN 22 17% Recommended name: Q14126 Desmoglein-2 Alternative name(s): Cadherin family member 5 HDGC KIT_HUMAN 22 17% Recommended name: P10721 Mast/stem cell growth factor receptor Kit Short name = SCFR EC = 2.7.10.1 Alternative name(s): Piebald trait protein Short name = PBT Proto-oncogene c-Kit Tyrosine-protein kinase Kit p145 c-kit v-kit Hardy-Zuckerman 4 feline sarcoma
viral oncogene homolog CD_antigen = CD117 TBB3_HUMAN 22 17% Recommended name: Q13509 Tubulin beta-3 chain Alternative name(s): Tubulin beta-4 chain Tubulin beta-III CH10_HUMAN 21 16% Recommended name: P61604 10 kDa heat shock protein, mitochondrial Short name = Hsp10 Alternative name(s): 10 kDa chaperonin Chaperonin 10 Short name = CPN10 Early-pregnancy factor Short name = EPF ISLR_HUMAN 21 16% Immunoglobulin superfamily containing O14498 leucine-rich repeat protein MASP1_HUMAN 21 16% Recommended name: P48740 Mannan-binding lectin serine protease 1 EC = 3.4.21.-- Alternative name(s): Complement factor MASP-3 Complement-activating component of Ra- reactive factor Mannose-binding lectin-associated serine protease 1 Short name = MASP-1 Mannose-binding protein-associated serine protease Ra-reactive factor serine protease p100 Short name = RaRF Serine protease 5 Cleaved into the following 2 chains: 1. Mannan-binding lectin serine protease 1 heavy chain 2. Mannan-binding lectin serine protease 1 light chain ICAM3_HUMAN 20 15% Recommended name: P32942 Intercellular adhesion molecule 3 Short name = ICAM-3 Alternative name(s): CDw50 ICAM-R CD_antigen = CD50 PTPRJ_HUMAN 20 15% Recommended name: Q12913 Receptor-type tyrosine-protein phosphatase eta Short name = Protein-tyrosine phosphatase eta Short name = R-PTP-eta EC = 3.1.3.48 Alternative name(s): Density-enhanced phosphatase 1 Short name = DEP-1 HPTP eta Protein-tyrosine phosphatase receptor type J Short name = R-PTP-J CD_antigen = CD148 A1AG1_HUMAN 19 15% Recommended name: P02763 Alpha-1-acid glycoprotein 1 Short name = AGP 1 Alternative name(s): Orosomucoid-1 Short name = OMD 1 CD59_HUMAN 18 14% Recommended name: P13987 CD59 glycoprotein Alternative name(s): 1F5 antigen 20 kDa homologous restriction factor Short name = HRF-20 Short name = HRF20 MAC-inhibitory protein Short name = MAC-IP MEM43 antigen Membrane attack complex inhibition factor Short name = MACIF Membrane inhibitor of reactive lysis Short name = MIRL Protectin CD_antigen = CD59 MDHM_HUMAN 18 14% commended name: P40926 Malate dehydrogenase, mitochondrial PVR_HUMAN 18 14% Recommended name: P15151 Poliovirus receptor Alternative name(s): Nectin-like protein 5 Short name = NECL-5 CD_antigen = CD155 SEM3G_HUMAN 18 14% Recommended name: Q9NS98 Semaphorin-3G Alternative name(s): Semaphorin sem2 CO6A3_HUMAN 17 13% Collagen alpha-3(VI) chain P12111 MMP9_HUMAN 17 13% Recommended name: P14780 Matrix metalloproteinase-9 Short name = MMP-9 EC = 3.4.24.35 Alternative name(s): 92 kDa gelatinase 92 kDa type IV collagenase Gelatinase B Short name = GELB Cleaved into the following 2 chains: 1. 67 kDa matrix metalloproteinase-9 2. 82 kDa matrix metalloproteinase-9 TETN_HUMAN 17 13% Recommended name: P05452 Tetranectin Short name = TN Alternative name(s): C-type lectin domain family 3 member B Plasminogen kringle 4-binding protein TNF12_HUMAN 17 13% Recommended name: O43508 Tumor necrosis factor ligand superfamily member 12 Alternative name(s): APO3 ligand TNF-related weak inducer of apoptosis Short name = TWEAK Cleaved into the following 2 chains: 1. Tumor necrosis factor ligand superfamily member 12, membrane form 2. Tumor necrosis factor ligand superfamily member 12, secreted form BST1_HUMAN 16 12% Recommended name: Q10588 ADP-ribosyl cyclase 2 EC = 3.2.2.5 Alternative name(s): Bone marrow stromal antigen 1 Short name = BST-1 Cyclic ADP-ribose hydrolase 2 Short name = cADPr hydrolase 2 CD_antigen = CD157 COIA1_HUMAN 16 12% Recommended name: P39060 Collagen alpha-1(XVIII) chain Cleaved into the following chain: 1. Endostatin CRP_HUMAN 16 12% Recommended name: P02741 C-reactive protein Cleaved into the following chain: 1. C-reactive protein(1-205) PLSL_HUMAN 16 12% Recommended name: P13796 Plastin-2 Alternative name(s): L-plastin LC64P Lymphocyte cytosolic protein 1 Short name = LCP-1 BGH3_HUMAN 15 11% Recommended name: Q15582 Transforming growth factor-beta-induced protein ig-h3 Short name = Beta ig-h3 Alternative name(s): Kerato-epithelin RGD-containing collagen-associated protein Short name = RGD-CAP CD44_HUMAN 15 11% Recommended name: P16070 CD44 antigen Alternative name(s): CDw44 Epican Extracellular matrix receptor III Short name = ECMR-III GP90 lymphocyte homing/adhesion receptor HUTCH-I Heparan sulfate proteoglycan Hermes antigen Hyaluronate receptor Phagocytic glycoprotein 1 Short name = PGP-1 Phagocytic glycoprotein I Short name = PGP-I CD_antigen = CD44 ENOA_HUMAN 15 11% Recommended name: P06733 Alpha-enolase EC = 4.2.1.11 Alternative name(s): 2-phospho-D-glycerate hydro-lyase C-myc promoter-binding protein Enolase 1 MBP-1 MPB-1 Non-neural enolase Short name = NNE Phosphopyruvate hydratase Plasminogen-binding protein LUM_HUMAN 15 11% SCF_HUMAN 15 11% Recommended name: P21583 Kit ligand Alternative name(s): Mast cell growth factor Short name = MGF Stem cell factor Short name = SCF c-Kit ligand Cleaved into the following chain: 1. Soluble KIT ligand Short name = sKITLG UGPA_HUMAN 15 11% Recommended name: Q16851 UTP--glucose-1-phosphate uridylyltransferase EC = 2.7.7.9 Alternative name(s): UDP-glucose pyrophosphorylase Short name = UDPGP Short name = UGPase ENPL_HUMAN 14 11% Recommended name: P14625 Endoplasmin Alternative name(s): 94 kDa glucose-regulated protein Short name = GRP-94 Heat shock protein 90 kDa beta member 1 Tumor rejection antigen 1 gp96 homolog GDIR2_HUMAN 14 11% Recommended name: P52566 Rho GDP-dissociation inhibitor 2 Short name = Rho GDI 2 Alternative name(s): Ly-GDI Rho-GDI beta GELS_HUMAN 14 11% Recommended name: P06396 Gelsolin Alternative name(s): AGEL Actin-depolymerizing factor Short name = ADF Brevin SODM_HUMAN 14 11% Recommended name: P04179 Superoxide dismutase [Mn], mitochondrial TPIS_HUMAN 14 11% Recommended name: P60174 Triosephosphate isomerase Short name = TIM EC = 5.3.1.1 Alternative name(s): Triose-phosphate isomerase TENA_HUMAN 13 10% Recommended name: P24821 Tenascin Short name = TN Alternative name(s): Cytotactin GMEM GP 150-225 Glioma-associated-extracellular matrix antigen Hexabrachion JI Myotendinous antigen
Neuronectin Tenascin-C Short name = TN-C ZA2G_HUMAN 13 10% Recommended name: P25311 Zinc-alpha-2-glycoprotein Short name = Zn-alpha-2-GP Short name = Zn-alpha-2-glycoprotein LEG1_HUMAN 11 8% Recommended name: P09382 Galectin-1 Short name = Gal-1 Alternative name(s): 14 kDa laminin-binding protein Short name = HLBP14 14 kDa lectin Beta-galactoside-binding lectin L-14-I Galaptin HBL HPL Lactose-binding lectin 1 Lectin galactoside-binding soluble 1 Putative MAPK-activating protein PM12 S-Lac lectin 1 FOLH1_HUMAN 9 7% Recommended name: Q04609 Glutamate carboxypeptidase 2 EC = 3.4.17.21 Alternative name(s): Cell growth-inhibiting gene 27 protein Folate hydrolase 1 Folylpoly-gamma-glutamate carboxypeptidase Short name = FGCP Glutamate carboxypeptidase II Short name = GCPII Membrane glutamate carboxypeptidase Short name = mGCP N-acetylated-alpha-linked acidic dipeptidase I Short name = NAALADase I Prostate-specific membrane antigen Short name = PSM Short name = PSMA Pteroylpoly-gamma-glutamate carboxypeptidase PLXC1_HUMAN 9 7% PTGIS_HUMAN 9 7% Recommended name: Q16647 Prostacyclin synthase EC = 5.3.99.4 Alternative name(s): Prostaglandin I2 synthase
Step 3: Significance and Occurrence
To find high performing panels, 10,000 trials were performed where on each trial the combined AUC of a random panel of 15 proteins selected from Table 12 was estimated. To calculate the combined AUC of each panel of 15 proteins, the highest intensity normalized transition was utilized. Logistic regression was used to calculate the AUC of the panel of 15 across all small samples. 131 panels of 15 proteins had combined AUC above 0.80, as shown in FIG. 1. (The significance by study separated into small (<2.0 cm) and large (>2.0 cm) PN are shown in FIG. 2). The resilience of the panels persisted despite site based variation in the samples as shown in FIG. 3. The panels are listed in Table 13.
TABLE-US-00013 TABLE 13 AUC P1 P2 P3 P4 P5 P6 P7 P8 0.8282 CD59 CALU LDHB ALDOA DSG2 MDHM TENA 6PGD 0.8255 CD59 TSP1 KIT ISLR ALDOA DSG2 1433Z CD14 0.8194 S10A6 ALDOA PVR TSP1 CD44 CH10 PEDF APOE 0.8189 ALDOA LEG1 CALU LDHB TETN FOLH1 MASP1 1433Z 0.8187 PVR CD59 CRP ALDOA GRP78 DSG2 6PGD CD14 0.8171 AMPN IBP3 CALU CD44 BGH3 GRP78 1433Z 6PGD 0.8171 CALU CH10 ALDOA BST1 MDHM VTNC APOE CD14 0.8165 LDHB CO6A3 CD44 A1AG1 GRP78 DSG2 MDHM VTNC 0.8163 TPIS CD59 S10A6 CALU ENPL CH10 ALDOA DSG2 0.8163 LEG1 AMPN S10A6 CALU ISLR ENOA VTNC 6PGD 0.8161 AMPN S10A6 TSP1 MPRI VTNC LUM 6PGD APOE 0.8159 ALDOA AMPN TSP1 BGH3 GRP78 PTPRJ MASP1 CERU 0.8159 ALDOA CO6A3 MPRI SEM3G CERU LUM APOE CD14 0.8159 AMPN CALU ISLR SODM CERU LUM 6PGD APOE 0.8159 CALU PEDF CRP GRP78 VTNC 1433Z CD14 FRIL 0.8157 TPIS LEG1 S10A6 LDHB TSP1 ENPL MDHM 6PGD 0.8155 CALU CRP ALDOA SODM SEM3G 1433Z FRIL G3P 0.8153 CALU MPRI ALDOA PEDF DSG2 CERU APOE G3P 0.814 LEG1 COIA1 AMPN S10A6 TSP1 MPRI PEDF GRP78 0.8138 TSP1 KIT CERU 6PGD APOE CD14 FRIL G3P 0.8132 S10A6 COIA1 AMPN TSP1 PEDF ISLR PTPRJ CERU 0.8128 TPIS LEG1 AMPN S10A6 IBP3 CALU DSG2 PTPRJ 0.8128 TPIS AMPN TSP1 PEDF A1AG1 MPRI ALDOA VTNC 0.8124 ALDOA CALU LDHB PLSL PEDF MASP1 6PGD APOE 0.8124 AMPN S10A6 TSP1 ENOA GRP78 6PGD APOE FRIL 0.812 IBP3 TSP1 CRP A1AG1 SCF ALDOA PEDF DSG2 0.8106 COIA1 CALU CD44 BGH3 ALDOA TETN BST1 LUM 0.8106 TSP1 PLSL CRP ALDOA GRP78 MDHM APOE FRIL 0.8099 CD59 CALU ENPL CD44 ALDOA TENA 6PGD FRIL 0.8097 AMPN S10A6 IBP3 A1AG1 MPRI ALDOA GRP78 FRIL 0.8093 ALDOA S10A6 TSP1 ENPL PEDF A1AG1 GRP78 APOE 0.8093 PVR IBP3 LDHB SCF TNF12 LUM 1433Z FRIL 0.8093 CALU LDHB CO6A3 PEDF CH10 BGH3 PTPRJ ALDOA 0.8087 ALDOA AMPN ENPL KIT MPRI GRP78 LUM 1433Z 0.8087 CD59 S10A6 IBP3 TSP1 ENPL SODM MDHM 6PGD 0.8083 ALDOA AMPN S10A6 IBP3 PLSL CRP SCF MPRI 0.8081 PVR IBP3 TSP1 CRP ALDOA SODM MDHM TNF12 0.8081 S10A6 LDHB ENPL PLSL CH10 CERU FRIL G3P 0.8081 IBP3 LDHB PEDF MPRI SEM3G VTNC APOE CD14 0.8079 ALDOA AMPN CALU PLSL PEDF CH10 MASP1 TNF12 0.8077 S10A6 IBP3 LDHB MDHM ZA2G FRIL G3P HYOU1 0.8077 CD59 S10A6 LDHB TSP1 CD44 ISLR CERU 1433Z 0.8077 AMPN CALU LDHB TSP1 PLSL CD44 ALDOA TETN 0.8075 TPIS AMPN S10A6 TSP1 CH10 COIA1 CERU ZA2G 0.8073 CALU PEDF MPRI ISLR BGH3 ENOA CERU 1433Z 0.8071 TPIS CALU CO6A3 KIT DSG2 MASP1 6PGD APOE 0.8071 LEG1 COIA1 TSP1 CD44 MPRI ALDOA FOLH1 TNF12 0.8065 AMPN S10A6 CALU CO6A3 TSP1 PLSL KIT MASP1 0.8063 S10A6 TSP1 A1AG1 BGH3 ZA2G 1433Z FRIL G3P 0.8063 CALU KIT ENOA 6PGD APOE CD14 G3P ICAM3 0.8061 AMPN MPRI GRP78 DSG2 TENA APOE CD14 FRIL 0.8059 TPIS IBP3 TSP1 PEDF TNF12 1433Z 6PGD APOE 0.8059 CALU LDHB PLSL CRP PEDF SEM3G MDHM APOE 0.8058 ALDOA TSP1 PLSL CD44 KIT CRP ISLR TNF12 0.8058 TPIS TSP1 MPRI ISLR ALDOA PEDF GRP78 SEM3G 0.8054 ALDOA S10A6 CALU CRP A1AG1 VTNC TENA ZA2G 0.8054 TPIS CO6A3 TSP1 MPRI DSG2 TNF12 FRIL G3P 0.8054 CALU LDHB DSG2 1433Z CD14 FRIL G3P HYOU1 0.805 CALU MPRI ENOA FOLH1 LUM ZA2G APOE CD14 0.8048 PVR S10A6 IBP3 PEDF ALDOA BST1 MDHM VTNC 0.8048 AMPN CALU CH10 DSG2 TNF12 CERU 6PGD APOE 0.8046 ALDOA LDHB TSP1 KIT ISLR DSG2 MASP1 1433Z 0.8046 ALDOA COIA1 CD59 IBP3 PTPRJ SEM3G CERU CD14 0.8046 PVR CD59 S10A6 PLSL PEDF CH10 SCF BST1 0.8046 COIA1 IBP3 MASP1 DSG2 TENA ZA2G 1433Z APOE 0.8042 BGH3 CD59 CALU LDHB CO6A3 SODM TENA APOE 0.8042 IBP3 TSP1 ENPL CH10 CD14 FRIL G3P HYOU1 0.8042 IBP3 TSP1 KIT ZA2G 6PGD APOE CD14 FRIL 0.804 TPIS BGH3 S10A6 LDHB CO6A3 CH10 PEDF TENA 0.804 CALU LDHB BGH3 TETN FOLH1 TNF12 VTNC FRIL 0.8038 TPIS PVR COIA1 CALU SCF MPRI ALDOA ENOA 0.8036 S10A6 TPIS COIA1 CD59 CO6A3 TSP1 MPRI ALDOA 0.8036 LEG1 CD59 AMPN CALU CH10 GRP78 SEM3G TETN 0.8036 AMPN S10A6 TSP1 ENPL PEDF SODM FOLH1 6PGD 0.8036 S10A6 CALU MASP1 A1AG1 MPRI ALDOA VTNC TENA 0.8036 IBP3 CALU PLSL CD44 KIT CERU 6PGD CD14 0.8036 TSP1 PLSL FOLH1 COIA1 TNF12 VTNC 6PGD FRIL 0.8034 ALDOA BGH3 CD59 TSP1 KIT CH10 SODM VTNC 0.8034 S10A6 CALU LDHB TSP1 GRP78 1433Z 6PGD G3P 0.8032 S10A6 CALU TSP1 KIT CH10 PEDF GRP78 SEM3G 0.8032 TSP1 MASP1 CRP ALDOA GRP78 TETN TNF12 1433Z 0.803 AMPN TSP1 KIT MPRI SEM3G TETN DSG2 1433Z 0.803 CALU CO6A3 PLSL A1AG1 ALDOA GRP78 6PGD APOE 0.8028 COIA1 CD59 AMPN TSP1 KIT ISLR ALDOA MDHM 0.8024 S10A6 CD44 SCF MPRI ISLR ALDOA APOE FRIL 0.8024 S10A6 TSP1 ALDOA SODM ENOA BST1 FRIL HYOU1 0.8024 IBP3 TSP1 SCF ALDOA SODM DSG2 VTNC 1433Z 0.802 ALDOA TSP1 PLSL CD44 CH10 A1AG1 ENOA TETN 0.802 LEG1 CALU LDHB TSP1 CH10 ALDOA MDHM APOE 0.802 CD59 IBP3 TSP1 A1AG1 MPRI PTPRJ 6PGD APOE 0.802 IBP3 TSP1 CRP BST1 TNF12 VTNC 1433Z FRIL 0.8018 LEG1 S10A6 IBP3 CALU TSP1 MASP1 A1AG1 SCF 0.8018 COIA1 CD59 AMPN CALU MASP1 BST1 VTNC CERU 0.8018 AMPN ALDOA SODM GRP78 MDHM VTNC 6PGD FRIL 0.8018 LDHB CO6A3 ALDOA SEM3G DSG2 6PGD APOE FRIL 0.8016 S10A6 LDHB SCF MPRI ALDOA PEDF ENOA SEM3G 0.8016 LDHB CO6A3 TSP1 1433Z APOE CD14 FRIL G3P 0.8014 ALDOA PEDF MPRI ISLR FOLH1 TNF12 MASP1 CERU 0.8014 COIA1 PEDF CRP A1AG1 ENOA CERU FRIL G3P 0.8014 CD59 IBP3 TSP1 KIT MASP1 ENOA TNF12 CD14 0.8014 LDHB KIT SCF BGH3 SEM3G VTNC 1433Z FRIL 0.8013 PVR AMPN LDHB CD44 DSG2 TETN MDHM FRIL 0.8013 S10A6 LDHB TSP1 ISLR LUM G3P HYOU1 ICAM3 0.8013 CALU A1AG1 MPRI ALDOA PEDF DSG2 VTNC ZA2G 0.8013 TSP1 ENPL KIT SODM SEM3G DSG2 TETN LUM 0.8013 TSP1 PLSL ISLR ALDOA ENOA MDHM APOE G3P 0.8011 ALDOA AMPN CO6A3 SEM3G APOE CD14 FRIL G3P 0.8011 TPIS BGH3 AMPN S10A6 CALU LDHB KIT TENA 0.8011 COIA1 IBP3 TSP1 A1AG1 TETN DSG2 6PGD FRIL 0.8011 AMPN S10A6 IBP3 CALU KIT SCF ALDOA APOE 0.8011 IBP3 A1AG1 PEDF SEM3G MDHM TNF12 VTNC 1433Z 0.8009 ALDOA BGH3 AMPN LDHB TSP1 PLSL MPRI ISLR 0.8009 LEG1 COIA1 IBP3 CH10 MASP1 SCF ALDOA TNF12 0.8009 AMPN ENPL ALDOA TETN FOLH1 BST1 ZA2G 6PGD 0.8009 CALU CO6A3 ENPL ALDOA GRP78 PTPRJ VTNC APOE 0.8009 TSP1 CH10 PTPRJ TETN TNF12 VTNC TENA 1433Z 0.8007 CD59 S10A6 IBP3 CO6A3 TSP1 KIT ISLR GRP78 0.8007 AMPN TSP1 KIT SCF TETN ZA2G 1433Z 6PGD 0.8007 S10A6 IBP3 TSP1 CD44 PEDF A1AG1 PTPRJ SODM 0.8007 CALU CO6A3 TSP1 CH10 SCF BGH3 ALDOA ENOA 0.8007 ENPL CD44 MASP1 GRP78 1433Z CD14 FRIL G3P 0.8005 TPIS LEG1 LDHB TSP1 MASP1 A1AG1 MPRI ALDOA 0.8005 PEDF CRP ISLR ALDOA GRP78 PTPRJ ZA2G 6PGD 0.8003 ALDOA S10A6 CALU CRP BGH3 TETN 6PGD CD14 0.8003 AMPN TSP1 A1AG1 MPRI ISLR ALDOA MASP1 LUM 0.8003 CO6A3 TSP1 SCF MPRI ISLR FOLH1 1433Z APOE 0.8001 S10A6 IBP3 TSP1 KIT TETN COIA1 CERU 6PGD 0.8001 S10A6 CALU CH10 ISLR ALDOA SODM PTPRJ MDHM 0.8001 IBP3 TSP1 ENPL CH10 CRP ISLR ALDOA SODM 0.8001 IBP3 TSP1 PTPRJ ALDOA BST1 LUM 1433Z APOE 0.8001 LDHB TSP1 MPRI GRP78 SEM3G LUM ZA2G FRIL AUC P9 P10 P11 P12 P13 P14 P15 0.8282 APOE FRIL G3P HYOU1 LRP1 RAN HXK1 0.8255 FRIL HYOU1 LRP1 PROF1 TBB3 FINC CEAM8 0.8194 FRIL G3P HYOU1 LRP1 TBB3 CLIC1 RAN 0.8189 APOE G3P HYOU1 PRDX1 PROF1 ILK HXK1 0.8187 FRIL G3P PRDX1 ILK FINC GSLG1 HXK1 0.8171 CD14 FRIL G3P LRP1 TBB3 FINC RAN 0.8171 FRIL G3P ICAM3 PRDX1 PROF1 PVR HXK1 0.8165 1433Z FRIL G3P S10A6 FINC GSLG1 HXK1 0.8163 6PGD FRIL G3P HYOU1 ICAM3 PRDX1 FINC 0.8163 APOE G3P LRP1 UGPA RAN CEAM8 HXK1 0.8161 CD14 FRIL G3P LRP1 PROF1 RAN CEAM8 0.8159 6PGD FRIL G3P HYOU1 LRP1 PRDX1 CEAM8 0.8159 FRIL G3P LRP1 TBB3 FINC GSLG1 HXK1 0.8159 CD14 FRIL G3P PRDX1 CLIC1 ILK HXK1 0.8159 G3P TBB3 ILK GELS FINC RAN GSLG1 0.8157 APOE FRIL G3P HYOU1 CLIC1 ILK HXK1 0.8155 HYOU1 LRP1 PRDX1 PROF1 FINC RAN GSLG1 0.8153 HYOU1 PLXC1 PRDX1 ILK CEAM8 HXK1 BST1 0.814 CERU FRIL G3P PLXC1 PRDX1 ILK HXK1 0.8138 HYOU1 PLXC1 RAN CEAM8 HXK1 BST1 MMP9 0.8132 6PGD CD14 FRIL HYOU1 FINC GSLG1 BST1 0.8128 BST1 6PGD G3P HYOU1 ILK FINC HXK1 0.8128 1433Z APOE FRIL G3P LRP1 PTGIS RAN 0.8124 CD14 FRIL G3P GDIR2 FINC GSLG1 HXK1 0.8124 GDIR2 LRP1 CLIC1 FINC GSLG1 HXK1 BST1 0.812 1433Z APOE FRIL LRP1 PRDX1 PROF1 FINC 0.8106 1433Z 6PGD FRIL G3P HYOU1 PRDX1 CLIC1 0.8106 G3P PRDX1 UGPA ILK CEAM8 GSLG1 HXK1 0.8099 G3P HYOU1 PRDX1 PROF1 FINC GSLG1 HXK1 0.8097 G3P HYOU1 LRP1 PTGIS ILK FINC MMP9 0.8093 CD14 FRIL G3P LRP1 PLXC1 CLIC1 GSLG1 0.8093 G3P GDIR2 PRDX1 UGPA CLIC1 FINC HXK1 0.8093 SEM3G MASP1 G3P HYOU1 FINC CEAM8 HXK1 0.8087 6PGD CD14 FRIL HYOU1 TBB3 CLIC1 FINC 0.8087 FRIL G3P HYOU1 LRP1 FINC CEAM8 HXK1 0.8083 GRP78 CERU CD14 FRIL LRP1 FINC CEAM8 0.8081 TENA FRIL G3P HYOU1 PROF1 RAN HXK1 0.8081 HYOU1 ICAM3 PLXC1 CLIC1 ILK FINC GSLG1 0.8081 FRIL G3P HYOU1 S10A6 CEAM8 GSLG1 HXK1 0.8079 LUM 6PGD APOE FRIL HYOU1 RAN HXK1 0.8077 LRP1 PTGIS CLIC1 FINC RAN GSLG1 MMP9 0.8077 FRIL G3P HYOU1 LRP1 ILK GSLG1 HXK1 0.8077 APOE CD14 FRIL G3P LRP1 PRDX1 GSLG1 0.8075 6PGD FRIL G3P LRP1 UGPA ILK HXK1 0.8073 6PGD FRIL G3P HYOU1 LRP1 PRDX1 FINC 0.8071 CD14 FRIL G3P LRP1 AMPN RAN HXK1 0.8071 APOE FRIL HYOU1 LRP1 PTGIS CLIC1 AMPN 0.8065 ALDOA APOE FRIL G3P TBB3 RAN HXK1 0.8063 LRP1 PROF1 TBB3 UGPA CLIC1 AMPN RAN 0.8063 LRP1 PLXC1 PROF1 FINC RAN HXK1 MMP9 0.8061 G3P LRP1 PLXC1 PROF1 PVR FINC CEAM8 0.8059 CD14 FRIL G3P LRP1 TBB3 RAN GSLG1 0.8059 G3P HYOU1 PRDX1 TBB3 ILK RAN HXK1 0.8058 APOE CD14 FRIL G3P HYOU1 RAN HXK1 0.8058 FRIL G3P HYOU1 PROF1 GELS PVR RAN 0.8054 6PGD FRIL G3P HYOU1 ILK GSLG1 HXK1 0.8054 HYOU1 ICAM3 PLXC1 TBB3 GELS RAN BST1 0.8054 PLXC1 PRDX1 PROF1 FINC CEAM8 GSLG1 MMP9 0.805 G3P HYOU1 ICAM3 PRDX1 UGPA ILK HXK1 0.8048 CD14 FRIL G3P HYOU1 PTGIS FINC RAN 0.8048 FRIL G3P LRP1 PRDX1 UGPA RAN CEAM8 0.8046 FRIL G3P GDIR2 HYOU1 RAN GSLG1 HXK1 0.8046 FRIL G3P LRP1 PRDX1 FINC GSLG1 MMP9 0.8046 FRIL G3P CLIC1 ILK AMPN FINC HXK1 0.8046 CD14 FRIL G3P ICAM3 AMPN FINC HXK1 0.8042 G3P HYOU1 S10A6 ILK FINC RAN HXK1 0.8042 ICAM3 LRP1 PRDX1 PROF1 GELS FINC GSLG1 0.8042 GDIR2 HYOU1 LRP1 PRDX1 PROF1 CLIC1 HXK1 0.804 FRIL G3P HYOU1 LRP1 PRDX1 ILK GSLG1 0.804 G3P GDIR2 PRDX1 CLIC1 GELS FINC HXK1 0.8038 MASP1 APOE FRIL G3P PRDX1 FINC HXK1 0.8036 ENOA 6PGD FRIL G3P GDIR2 LRP1 PRDX1 0.8036 APOE G3P HYOU1 ICAM3 RAN CEAM8 HXK1 0.8036 APOE FRIL G3P HYOU1 LRP1 HXK1 MMP9 0.8036 FRIL G3P PROF1 PTGIS FINC CEAM8 HXK1 0.8036 FRIL G3P HYOU1 PRDX1 FINC CEAM8 HXK1 0.8036 G3P LRP1 PRDX1 PROF1 GELS FINC RAN 0.8034 TENA 6PGD G3P HYOU1 LRP1 TBB3 ILK 0.8034 HYOU1 ICAM3 PROF1 ILK GELS AMPN FINC 0.8032 MASP1 6PGD CD14 FRIL G3P HYOU1 ILK 0.8032 APOE CD14 G3P HYOU1 PVR RAN HXK1 0.803 APOE FRIL G3P TBB3 UGPA PVR RAN 0.803 CD14 FRIL G3P HYOU1 ICAM3 PRDX1 RAN 0.8028 CERU LUM ZA2G APOE FRIL LRP1 MMP9 0.8024 G3P HYOU1 PRDX1 GELS FINC CEAM8 HXK1 0.8024 LRP1 PROF1 CLIC1 GELS FINC CEAM8 GSLG1 0.8024 APOE FRIL G3P LRP1 PRDX1 UGPA PTPRJ 0.802 TENA APOE FRIL G3P TBB3 AMPN GSLG1 0.802 FRIL G3P HYOU1 ILK PVR GSLG1 PTPRJ 0.802 FRIL G3P LRP1 ILK RAN CEAM8 MMP9 0.802 G3P GDIR2 HYOU1 LRP1 PRDX1 TBB3 FINC 0.8018 ALDOA SEM3G VTNC FRIL G3P LRP1 CLIC1 0.8018 6PGD APOE CD14 FRIL HYOU1 PROF1 GSLG1 0.8018 G3P HYOU1 LRP1 PTGIS GELS FINC RAN 0.8018 G3P HYOU1 ICAM3 PROF1 FINC PTPRJ HXK1 0.8016 APOE FRIL G3P HYOU1 PRDX1 CLIC1 GSLG1 0.8016 HYOU1 PROF1 UGPA CLIC1 RAN CEAM8 PTPRJ 0.8014 6PGD FRIL G3P HYOU1 PRDX1 FINC HXK1 0.8014 GDIR2 LRP1 S10A6 GELS FINC GSLG1 HXK1 0.8014 FRIL G3P PRDX1 UGPA FINC PTPRJ HXK1 0.8014 G3P HYOU1 LRP1 PRDX1 PROF1 FINC HXK1 0.8013 G3P LRP1 PRDX1 ILK FINC HXK1 MMP9 0.8013 LRP1 PROF1 UGPA ILK FINC PTPRJ HXK1 0.8013 6PGD FRIL G3P CLIC1 S10A6 ILK PVR 0.8013 APOE FRIL G3P HYOU1 CLIC1 RAN HXK1 0.8013 GDIR2 LRP1 PTGIS FINC RAN HXK1 MMP9 0.8011 GDIR2 HYOU1 ICAM3 PRDX1 FINC HXK1 MMP9 0.8011 6PGD APOE G3P LRP1 PROF1 GELS MMP9 0.8011 GDIR2 HYOU1 LRP1 CLIC1 S10A6 PVR GSLG1 0.8011 G3P ICAM3 LRP1 GELS FINC RAN CEAM8 0.8011 G3P HYOU1 PRDX1 FINC GSLG1 PTPRJ HXK1 0.8009 APOE FRIL LRP1 PVR FINC RAN PTPRJ
0.8009 CERU APOE CD14 FRIL TBB3 ILK FINC 0.8009 CD14 FRIL CLIC1 S10A6 ILK FINC MMP9 0.8009 CD14 G3P TBB3 CLIC1 GELS RAN HXK1 0.8009 6PGD FRIL G3P HYOU1 RAN HXK1 MMP9 0.8007 MDHM CD14 FRIL G3P HYOU1 GSLG1 HXK1 0.8007 APOE G3P GDIR2 LRP1 PRDX1 TBB3 RAN 0.8007 CERU APOE FRIL ICAM3 LRP1 UGPA GSLG1 0.8007 TETN LUM APOE FRIL G3P RAN HXK1 0.8007 GDIR2 ICAM3 LRP1 PRDX1 PROF1 FINC HXK1 0.8005 ENOA FRIL G3P LRP1 UGPA ILK FINC 0.8005 G3P HYOU1 PRDX1 TBB3 FINC RAN CEAM8 0.8003 FRIL G3P CLIC1 FINC GSLG1 HXK1 MMP9 0.8003 6PGD APOE FRIL ICAM3 TBB3 GSLG1 BST1 0.8003 G3P HYOU1 ICAM3 PRDX1 UGPA RAN HXK1 0.8001 CD14 FRIL G3P PROF1 FINC HXK1 MMP9 0.8001 VTNC FRIL G3P CLIC1 ILK AMPN HXK1 0.8001 1433Z G3P HYOU1 LRP1 PRDX1 PROF1 CEAM8 0.8001 G3P HYOU1 LRP1 PTGIS TBB3 PVR RAN 0.8001 G3P ICAM3 PROF1 TBB3 FINC RAN GSLG1
To calculate the combined AUC of each panel of 15 proteins, the highest intensity normalized transition was utilized. Logistic regression was used to calculate the AUC of the panel of 15 across all small samples. 5 panels of 15 proteins had combined AUC above 0.80.
Finally, the frequency of each of the 67 proteins on the 131 panels listed in Table 13 is presented in Table 12 both as raw counts (column 2) and percentage (column 3). It is an important observation that the panel size of 15 was pre-selected to prove that there are diagnostic proteins and panels. Furthermore, there are numerous such panels. Smaller panels selected from the list of 67 proteins can also be formed and can be generated using the same methods here.
Example 4: A Diagnostic Panel of 15 Proteins for Determining the Probability that a Blood Sample from a Patient with a PN of Size 2 cm or Less is Benign or Malignant
In Table 14 a logistic regression classifier trained on all small samples is presented.
TABLE-US-00014 TABLE 14 Normal- Transition ized column By column Logistic SEQ ID SEQ ID Regression Protein Transition NO: Normalized By NO: Coefficient ALDOA_HUMAN ALQASALK_401.25_617.40 7 YGFIEGHVVIPR_462.92_272.20 1 -1.96079- BGH3_HUMAN LTLLAPLNSVFK_658.40_804.50 8 YEVTVVSVR_526.29_759.50 2 2.21074 CLIC1_HUMAN LAALNPESNTAGLDIFAK_922.99_256.20 9 ASSIIDELFQDR_465.24_565.30 - 3 0.88028 CO6A3_HUMAN VAVVQYSDR_518.77_767.40 10 ASSIIDELFQDR_465.24_565.30 3 -1.520- 46 COIA1_HUMAN AVGLAGTFR_446.26_721.40 11 YGFIEGHVVIPR_462.92_272.20 1 -0.767- 86 FINC_HUMAN VPGTSTSATLTGLTR_487.94_446.30 12 FLNVLSPR_473.28_685.40 4 0.988- 42 G3P_HUMAN GALQNIIPASTGAAK_706.40_815.50 13 TASDFITK_441.73_710.40 5 0.5884- 3 ISLR_HUMAN ALPGTPVASSQPR_640.85_841.50 14 FLNVLSPR_473.28_685.40 4 1.02005- LRP1_HUMAN TVLWPNGLSLDIPAGR_855.00_400.20 15 YEVTVVSVR_526.29_759.50 2 -2.- 14383 PRDX1_HUMAN QITVNDLPVGR_606.30_428.30 16 YGFIEGHVVIPR_462.92_272.20 1 -1.3- 8044 PROF1_HUMAN STGGAPTFNVTVTK_690.40_503.80 17 TASDFITK_441.73_710.40 5 -1.78- 666 PVR_HUMAN SVDIWLR_444.75_702.40 18 TASDFITK_441.73_710.40 5 2.26338 TBB3_HUMAN ISVYYNEASSHK_466.60_458.20 19 FLNVLSPR_473.28_685.40 4 -0.46786- TETN_HUMAN LDTLAQEVALLK_657.39_330.20 20 TASDFITK_441.73_710.40 5 -1.99972- TPIS_HUMAN VVFEQTK_425.74_652.30 21 YGFIEGHVVIPR_462.92_272.20 1 2.65334 Constant 21.9997 (C.sub.0)
The classifier has the structure
.function..function. ##EQU00001## .times. ##EQU00001.2##
Where C.sub.0 and C.sub.i are logistic regression coefficients, P.sub.i are logarithmically transformed normalized transition intensities. Samples are predicted as cancer if Probability .gtoreq.0.5 or as benign otherwise. In Table 14 the coefficients C.sub.i appear in the sixth column, C.sub.0 in the last row, and the normalized transitions for each protein are defined by column 2 (protein transition) and column 4 (the normalizing factor).
The performance of this classifier, presented as a ROC plot, appears in FIG. 4. Overall AUC is 0.81. The performance can also be assessed by applying the classifier to each study site individually which yields the three ROC plots appearing in FIG. 5. The resulting AUCs are 0.79, 0.88 and 0.78 for Laval, NYU and UPenn, respectively.
Example 5: The Program "Ingenuity".RTM. was Used to Query the Blood Proteins that are Used to Identify Lung Cancer in Patients with Nodules that were Identified Using the Methods of the Present Invention
Using a subset of 35 proteins (Table 15) from the 67 proteins identified as a diagnostic panel (Table 13), a backward systems analysis was performed. Two networks were queried that are identified as cancer networks with the identified 35 proteins. The results show that the networks that have the highest percentage of "hits" when the proteins are queried that are found in the blood of patients down to the level of the nucleus are initiated by transcription factors that are regulated by either cigarette smoke or lung cancer among others. See also Table 16 and FIG. 6.
These results are further evidence that the proteins that were identified using the methods of the invention as diagnostic for lung cancer are prognostic and relevant.
TABLE-US-00015 TABLE 15 No. Protein Protein Name Gene Symbol Gene Name 1 6PGD_HUMAN 6-phosphogluconate PGD phosphogluconate dehydrogenase dehydrogenase, decarboxylating 2 AIFM1_HUMAN Apoptosis-inducing AIFM1 apoptosis-inducing factor, mitochondrion- factor 1, mitochondrial associated, 1 3 ALDOA_HUMAN Fructose-bisphosphate ALDOA aldolase A, fructose-bisphosphate aldolase A 4 BGH3_HUMAN Transforming growth TGFBI transforming growth factor, beta- factor-beta-induced induced, 68 kDa protein ig-h3 5 C163A_HUMAN Scavenger receptor CD163 CD163 molecule cysteine-rich type 1 protein M130 6 CD14_HUMAN Monocyte differentiation CD14 CD14 molecule antigen CD14 7 COIA1_HUMAN Collagen alpha- COL18A1 collagen, type XVIII, alpha 1 1(XVIII) chain 8 ERO1A_HUMAN ERO1-like protein alpha ERO1L ERO1-like (S. cerevisiae) 9 FIBA_HUMAN Fibrinogen alpha chain FGA fibrinogen alpha chain 10 FINC_HUMAN Fibronectin FN1 fibronectin 1 11 FOLH1_HUMAN Glutamate carboxypeptidase 2 FOLH1 folate hydrolase (prostate-specific membrane antigen) 1 12 FRIL_HUMAN Ferritin light chain FTL ferritin, light polypeptide 13 GELS_HUMAN Gelsolin GSN gelsolin (amyloidosis, Finnish type) 14 GGH_HUMAN Gamma-glutamyl hydrolase GGH gamma-glutamyl hydrolase (conjugase, folylpolygammaglutamyl hydrolase) 15 GRP78_HUMAN 78 kDa glucose- HSPA5 heat shock 70 kDa protein 5 (glucose- regulated protein regulated protein, 78 kDa) 16 GSLG1_HUMAN Golgi apparatus protein 1 GLG1 golgi apparatus protein 1 17 GSTP1_HUMAN Glutathione S- GSTP1 glutathione S-transferase pi 1 transferase P 18 IBP3_HUMAN Insulin-like growth IGFBP3 insulin-like growth factor binding factor-binding protein 3 protein 3 19 ICAM1_HUMAN Intercellular adhesion ICAM1 intercellular adhesion molecule 1 molecule 1 20 ISLR_HUMAN Immunoglobulin super- ISLR immunoglobulin superfamily family containing leucine- containing leucine-rich repeat rich repeat protein 21 LG3BP_HUMAN Galectin-3-binding protein LGALS3BP lectin, galactoside-binding, soluble, 3 binding protein 22 LRP1_HUMAN Prolow-density lipoprotein LRP1 low density lipoprotein-related receptor-related protein 1 (alpha-2-macroglobulin protein 1 receptor) 23 LUM_HUMAN Lumican LUM lumican 24 MASP1_HUMAN Mannan-binding lectin MASP1 mannan-binding lectin serine peptidase serine protease 1 1 (C4/C2 activating component of Ra-reactive factor) 25 PDIA3_HUMAN Protein disulfide- PDIA3 protein disulfide isomerase family isomerase A3 A, member 3 26 PEDF_HUMAN Pigment epithelium- SERPINF1 serpin peptidase inhibitor, clade F derived factor (alpha-2 antiplasmin, pigment epithelium derived factor), member 1 27 PRDX1_HUMAN Peroxiredoxin-1 PRDX1 peroxiredoxin 1 28 PROF1_HUMAN Profilin-1 PFN1 profilin 1 29 PTPA_HUMAN Serine/threonine- PPP2R4 protein phosphatase 2A activator, protein phosphatase 2A regulatory subunit 4 activator 30 PTPRJ_HUMAN Receptor-type tyrosine- PTPRJ protein tyrosine phosphatase, receptor protein phosphatase eta type, J 31 RAP2B_HUMAN Ras-related protein RAP2B RAP2B, member of RAS oncogene Rap-2b family 32 SEM3G_HUMAN Semaphorin-3G SEMA3G sema domain, immunoglobulin domain (Ig), short basic domain, secreted, (semaphorin) 3G 33 SODM_HUMAN Superoxide dismutase SOD2 superoxide dismutase 2, mitochondrial [Mn], mitochondrial 34 TETN_HUMAN Tetranectin CLEC3B C-type lectin domain family 3, member B 35 TSP1_HUMAN Thrombospondin-1 THBS1 thrombospondin 1
TABLE-US-00016 TABLE 16 Gene Lung Cancer PubMed Name Protein Associations Sample Publications NFE2L2 nuclear 92 Cigarette Smoking Blocks the Protective (NRF2) factor transcription Expression of Nrf2/ARE Pathway . . . (erythroid- factor Molecular mechanisms for the regulation derived 2)- protecting cell from oxidative of Nrf2-mediated cell proliferation in non- like 2 stress small-cell lung cancers . . . EGR1 early 38 Cigarette smoke-induced Egr-1 upregulates growth response transcription proinflammatory cytokines in pulmonary factor epithelial cells . . . involved oxidative stress EGR-1 regulates Ho-1 expression induced by cigarette smoke . . . Chronic hypoxia induces Egr-1 via activation of ERK1/2 and contributes to pulmonary vascular remodeling. Early growth response-1 induces and enhances vascular endothelial growth factor- A expression in lung cancer cells . . .
Example 6: Cooperative Proteins for Diagnosing Pulmonary Nodules
To achieve unbiased discovery of cooperative proteins, selected reaction monitoring (SRM) mass spectrometry (Addona, Abbatiello et al. 2009) was utilized. SRM is a form of mass spectrometry that monitors predetermined and highly specific mass products of particularly informative (proteotypic) peptides of selected proteins. These peptides are recognized as specific transitions in mass spectra. SRM possesses the following required features that other technologies, notably antibody-based technologies, do not possess: Highly multiplexed SRM assays can be rapidly and cost-effectively developed for tens or hundreds of proteins. The assays developed are for proteins of one's choice and are not restricted to a catalogue of pre-existing assays. Furthermore, the assays can be developed for specific regions of a protein, such as the extracellular portion of a transmembrane protein on the cell surface of a tumor cell, or for a specific isoform. SRM technology can be used from discovery to clinical testing. Peptide ionization, the foundation of mass spectrometry, is remarkably reproducible. Using a single technology platform avoids the common problem of translating an assay from one technology platform to another. SRM has been used for clinical testing of small molecule analytes for many years, and recently in the development of biologically relevant assays [10].
Labeled and unlabeled SRM peptides are commercially available, together with an open-source library and data repository of mass spectra for design and conduct of SRM analyses. Exceptional public resources exist to accelerate assay development including the PeptideAtlas [11] and the Plasma Proteome Project [12, 13], the SRM Atlas and PASSEL, the PeptideAtlas SRM Experimental Library.
Two SRM strategies that enhance technical performance were introduced. First, large scale SRM assay development introduces the possibility of monitoring false signals. Using an extension of expression correlation techniques [14], the rate of false signal monitoring was reduced to below 3%. This is comparable and complementary to the approach used by mProphet (Reiter, Rinner et al. 2011).
Second, a panel of endogenous proteins was used for normalization. However, whereas these proteins are typically selected as "housekeeping" proteins (Lange, Picotti et al. 2008), proteins that were strong normalizers for the technology platform were identified. That is, proteins that monitored the effects of technical variation so that it could be controlled effectively. This resulted, for example, in the reduction of technical variation due to sample depletion of high abundance proteins from 23.8% to 9.0%. The benefits of endogenous signal normalization has been previously discussed (Price, Trent et al. 2007).
The final component of the strategy was to carefully design the discovery and validation studies using emerging best practices. Specifically, the cases (malignant nodules) and controls (benign nodules) were pairwise matched on age, nodule size, gender and participating clinical site. This ensures that the candidate markers discovered are not markers of age or variations in sample collection from site to site. The studies were well-powered, included multiple sites, a new site participated in the validation study, and importantly, were designed to address the intended use of the test. The careful selection and matching of samples resulted in an exceptionally valuable feature of the classifier. The classifier generates a score that is independent of nodule size and smoking status. As these are currently used risk factors for clinical management of IPNs, the classifier is a complementary molecular tool for use in the diagnosis of IPNs.
Selection of Biomarker Candidates for Assay Development
To identify lung cancer biomarkers in blood that originate from lung tumor cells, resected lung tumors and distal normal tissue of the same lobe were obtained. Plasma membranes were isolated from both endothelial and epithelial cells and analyzed by tandem mass spectrometry to identify cell surface proteins over expressed on tumor cells. Similarly, Golgi apparatus were isolated to identify over-secreted proteins from tumor cells. Proteins with evidence of being present in blood or secreted were prioritized resulting in a set of 217 proteins. See Example 7: Materials and Methods for details.
To ensure other viable lung cancer biomarkers were not overlooked, a literature search was performed and manually curated for lung cancer markers. As above, proteins with evidence of being present in blood or secreted were prioritized. This resulted in a set of 319 proteins. See Example 7: Materials and Methods for details.
The tissue (217) and literature (319) candidates overlapped by 148 proteins resulting in a final candidate list of 388 protein candidates. See Example 7: Materials and Methods.
Development of SRM Assays
SRM assays for the 388 proteins were developed using standard synthetic peptide techniques (See Example 7: Materials and Methods). Of the 388 candidates, SRM assays were successfully developed for 371 candidates. The 371 SRM assays were applied to benign and lung cancer plasma samples to evaluate detection rate in blood. 190 (51% success rate) of the SRM assays were detected. This success rate compares favorably to similar attempts to develop large scale SRM assays for detection of cancer markers in plasma. Recently 182 SRM assays for general cancer markers were developed from 1172 candidates (16% success rate) [15]. Despite focusing only on lung cancer markers, the 3-fold increase in efficiency is likely due to sourcing candidates from cancer tissues with prior evidence of presence in blood. Those proteins of the 371 that were previously detected by mass spectrometry in blood had a 64% success rate of detection in blood whereas those without had a 35% success rate. Of the 190 proteins detected in blood, 114 were derived from the tissue-sourced candidates and 167 derived from the literature-sourced candidates (91 protein overlap). See Example 7: Materials and Methods and Table 6.
Typically, SRM assays are manually curated to ensure assays are monitoring the intended peptide. However, this becomes unfeasible for large scale SRM assays such as this 371 protein assay. More recently, computational tools such as mProphet (Reiter, Rinner et al. 2011) enable automated qualification of SRM assays. A complementary strategy to mProphet was introduced that does not require customization for each dataset set. It utilizes correlation techniques (Kearney, Butler et al. 2008) to confirm the identity of protein transitions with high confidence. In FIG. 7 a histogram of the Pearson correlations between every pair of transitions in the assay is presented. The correlation between a pair of transitions is obtained from their expression profiles over all 143 samples in the discovery study detailed below. As expected, transitions from the same peptide are highly correlated. Similarly, transitions from different peptide fragments of the same protein are also highly correlated. In contrast, transitions from different proteins are not highly correlated and enables a statistical analysis of the quality of a protein's SRM assay. For example, if the correlation of transitions from two peptides from the same protein is above 0.5 then there is less than a 3% probability that the assay is false. See Example 7: Materials and Methods.
Classifier Discovery
A summary of the 143 samples used for classifier discovery appears in Table 17. Samples were obtained from three sites to avoid overfitting to a single site. Participating sites were Laval (Institut Universitaire de Cardiologie et de Pneumologie de Quebec), NYU (New York University) and UPenn (University of Pennsylvania). Samples were also selected to be representative of the intended use population in terms of nodule size (diameter), age and smoking status.
Benign and cancer samples were paired by matching on age, gender, site and nodule size (benign and cancer samples were required to have a nodule identified radiologically). The benign and cancer samples display a bias in smoking (pack years), however, the majority of benign and cancer samples were current or past smokers. In comparing malignant and benign samples, the intent was to find proteins that were markers of lung cancer; not markers of age, nodule size or differences in site sample collection. Note that cancer samples were pathologically confirmed and benign samples were either pathologically confirmed or radiologically confirmed (no tumor growth demonstrated over two years of CT scan surveillance).
TABLE-US-00017 TABLE 17 Clinical data summaries and demographic analysis for discovery and validation sets. Discovery Validation Cancer Benign P value Cancer Benign P value Sample 72 71 52 52 (total) Sample Laval 14 14 1.00.dagger. 13 12 0.89.dagger. (Center) NYU 29 28 6 9 UPenn 29 29 14 13 Vanderbilt 0 0 19 18 Sample Male 29 28 1.00.dagger. 25 27 0.85.dagger. (Gender) Female 43 43 27 25 Sample Never 5 19 0.006.dagger. 3 15 0.006.dagger. (Smoking Past 60 44 38 29 History) Current 6 6 11 7 No data 1 2 0 1 Age Median 65 (59-72) 64 (52-71) 0.46.dagger-dbl. 63 (60-73) 62 (56-67) 0.03.dagger-dbl. (quartile range) Nodule Median 13 (10-16) 13 (10-18) 0.69.dagger-dbl. 16 (13-20) 15 (12-22) 0.68.dagger-dbl. Size (mm) (quartile range) Pack-year.sctn. Median 37 (20-52) 20 (0-40) 0.001.dagger-dbl. 40 (19-50) 27 (0-50) 0.09.dagger-dbl. (quartile range) .dagger.Based on Fisher's exact test. .dagger-dbl.Based on Mann-Whitney test. .sctn.No data (cancer, benign): Discovery (4, 6), Validation (2, 3)
The processing of samples was conducted in batches. Each batch contained a set of randomly selected cancer-benign pairs and three plasma standards, included for calibration and quality control purposes.
All plasma samples were immunodepleted, trypsin digested and analyzed by reverse phase HPLC-SRM-MS. Protein transitions were normalized using an endogenous protein panel. The normalization procedure was designed to reduce overall variability, but in particular, the variability introduced by the depletion step. Overall technical variability was reduced from 32.3% to 25.1% and technical variability due to depletion was reduced from 23.8% to 9.0%. Details of the sample analysis and normalization procedure are available in Example 7: Materials and Methods.
To assess panels of proteins, they were fit to a logistic regression model. Logistic regression was chosen to avoid the overfitting that can occur with non-linear models, especially when the number of variables measured (transitions) is similar or larger than the number of samples in the study. The performance of a panel was measured by partial area under the curve (AUC) with sensitivity fixed at 90% (McClish 1989). Partial AUC correlates to high NPV performance while maximizing ROR.
To derive the 13 protein classifier, four criteria were used: The protein must have transitions that are reliably detected above noise across samples in the study. The protein must be highly cooperative. The protein must have transitions that are robust (high signal to noise, no interference, etc.) The protein's coefficient within the logistic regression model must have low variability during cross validation, that is, it must be stable. Details of how each of these criteria were applied appear in Example 7: Materials and Methods.
Finally, the 13 protein classifier was trained to a logistic regression model by Monte Carlo cross validation (MCCV) with a hold out rate of 20% and 20,000 iterations. The thirteen proteins for the rule-out classifier are listed in Table 18 along with their highest intensity transition and model coefficient.
TABLE-US-00018 TABLE 18 The 13 protein classifier. SEQ ID Protein Transition NO Coefficient Constant(.alpha.) 36.16 LRP1_HUMAN TVLWPNGLSLDIPAGR_855.00_400.20 15 -1.59 BGH3_HUMAN LTLLAPLNSVFK_658.40_804.50 8 1.73 COIA1_HUMAN AVGLAGTFR_446.26_721.40 11 -1.56 TETN_HUMAN LDTLAQEVALLK_657.39_330.20 20 -1.79 TSP1_HUMAN GFLLLASLR_495.31_559.40 22 0.53 ALDOA_HUMAN ALQASALK_401.25_617.40 7 -0.80 GRP78_HUMAN TWNDPSVQQDIK_715.85_260.20 23 1.41 ISLR_HUMAN ALPGTPVASSQPR_640.85_841.50 14 1.40 FRIL_HUMAN LGGPEAGLGEYLFER_804.40_913.40 24 0.39 LG3BP_HUMAN VEIFYR_413.73_598.30 25 -0.58 PRDX1_HUMAN QITVNDLPVGR_606.30_428.30 16 -0.34 FIBA_HUMAN NSLFEYQK_514.76_714.30 26 0.31 GSLG1_HUMAN IIIQESALDYR_660.86_338.20 27 -0.70
Validation of the Rule-Out Classifier
52 cancer and 52 benign samples (see Table 17) were used to validate the performance of the 13 protein classifier. All samples were independent of the discovery samples, in addition, over 36% of the validation samples were sourced from a new fourth site (Vanderbilt University). Samples were selected to be consistent with intended use and matched in terms of gender, clinical site and nodule size. We note a slight age bias, which is due to 5 benign samples from young patients. Anticipating a NPV of 90%, the 95% confidence interval is +/-5%.
At this point we refer to the 13 protein classifier trained on 143 samples the Discovery classifier. However, once validation is completed, to find the optimal coefficients for the classifier, it was retrained on all 247 samples (discovery and validation sets) as this is most predictive of future performance. We refer to this classifier as the Final classifier. The coefficients of the Final classifier appear in Table 21.
The performance of the Discovery and Final classifiers is summarized in FIG. 8. Reported are the NPV and ROR for the Discovery classifier when applied to the discovery set, the validation set. The NPV and ROR for the Final classifier are reported for all samples and also for all samples restricted to nodule size 8 mm to 20 mm (191 samples).
NPV and ROR are each reported as a fraction from 0 to 1. Similarly, the classifier produces a score between 0 and 1, which is the probability of cancer predicted by the classifier.
The discovery and validation curves for NPV and ROR are similar with the discovery curves superior as expected. This demonstrates the reproducibility of performance on an independent set of samples. A Discovery classifier rule out threshold of 0.40 achieves NPV of 96% and 90%, whereas ROR is 33% and 23%, for the discovery samples and the validation samples, respectively. Final classifier rule threshold of 0.60 achieves NPV of 91% and 90%, whereas ROR is 45% and 43%, for all samples and all samples restricted to be 8 mm-20 mm, respectively.
Applications of the Classifier
FIG. 9 presents the application of the final classifier to all 247 samples from the discovery and validation sets. The intent of FIG. 9 is to contrast the clinical risk factors of smoking (measured in pack years) and nodule size (proportional to the size of each circle) to the classifier score assigned to each sample.
First, note the density of cancer samples with high classifier scores. The classifier has been designed to detect a cancer signature in blood with high sensitivity. As a consequence, to the left of the rule out threshold (0.60) there are very few (<10%) cancer samples, assuming cancer prevalence of 25% [16, 17].
Third is the observation that nodule size does not appear to increase with the classifier score. Both large and small nodules are spread across the classifier score spectrum. Similarly, although there are a few very heavy smokers with very high classifier scores, increased smoking does not seem to increase with classifier score. To quantify this observation the correlation between the classifier score and nodule size, smoking and age were calculated and appear in Table 19. In all cases there is no significant relationship between the classifier score and the risk factors. The one exception is a weak correlation between benign classifier scores and benign ages. However, this correlation is so weak that the classifier score increases by only 0.04 every 10 years.
TABLE-US-00019 TABLE 19 Correlation between classifier scores and clinical risk factors. Age Nodule Size Smoking Benign 0.25 -0.06 0.11 Cancer 0.01 -0.01 0.06
This lack of correlation has clinical utility. It implies that the classifier provides molecular information about the disease status of an IPN that is incremental upon risk factors such as nodule size and smoking status. Consequently, it is a clinical tool for physicians to make more informed decisions around the clinical management of an IPN.
To visual how this might be accomplished, we demonstrate how the cancer probability score generated by the classifier can be related to cancer risk (see FIG. 11)
At a given classifier score, some percentage of all cancer nodules will have a smaller score. This is the sensitivity of the classifier. For example, at classifier score 0.8, 47% of cancer patients have a lower score, at classifier score 0.7, 28% of cancer patients have a lower score, at classifier score 0.5, only 9% are lower and finally at score 0.25, only 4% are lower. This enables a physician to interpret a patient's classifier score in terms of relative risk.
The Molecular Foundations of the Classifier
The goal was to identify the molecular signature of a malignant pulmonary nodule by selecting proteins that were the cooperative, robustly detected by SRM and stable within the classifier. How well associated with lung cancer is the derived classifier? Is there a molecular foundation for the perturbation of these 13 proteins in blood? And finally, how unique is the classifier among other possible protein combinations?
To answer these questions the 13 proteins of the classifier were submitted for pathway analysis using IPA (Ingenuity Systems). The first step was to work from outside the cell inwards to identify the transcription factors most likely to cause a modulation of these 13 proteins. The five most significant were FOS, NRF2, AHR, HD and MYC. FOS is common to many forms of cancer. However, NRF2 and AHR are associated with lung cancer, response to oxidative stress and lung inflammation. MYC is associated with lung cancer and response to oxidative stress while HD is associated with lung inflammation and response to oxidative stress.
The 13 classifier proteins are also highly specific to these three networks (lung cancer, response to oxidative stress and lung inflammation). This is summarized in FIG. 10 where the classifier proteins (green), transcription factors (blue) and the three merged networks (orange) are depicted. Only ISLR is not connected through these three lung specific networks to the other proteins, although it is connected through cancer networks not specific to cancer. In summary, the modulation of the 13 classifier proteins can be tracked back to a few transcription factors specific to lung cancer, lung inflammation and oxidative stress networks.
To address the question of classifier uniqueness, every classifier from the 21 robust and cooperative proteins was formed (Table 20). Due to the computational overhead, these classifiers could not be fully trained by Monte Carlo cross validation, consequently, only estimates of their performance could be obtained. Five high preforming alternative classifiers were identified and then fully trained. The classifier and the five high performing alternatives appear in Table 20. The frequency of each protein appears in the tally column, in particular, the first 11 proteins appear in 4 out of the 6 classifiers. These 11 proteins have significantly higher cooperative scores than the remaining proteins. By this analysis it appears that there is a core group of proteins that form the blood signature of a malignant nodule.
TABLE-US-00020 TABLE 20 The classifier and the high performing alternatives; coefficients for proteins on the respective panels are shown. Coop- Panel Panel Panel Panel Panel Protein erative Protein Classifier 110424 130972 126748 109919 60767 Tally Score Constant 36.16 27.72 27.69 23.47 21.32 23.17 -- -- ALDOA -0.8 -0.67 -0.87 -0.83 -0.64 -0.68 6 1.3 COIA1 -1.56 -1.04 -1.68 -1.37 -0.94 -1.2 6 3.7 TSP1 0.53 0.53 0.39 0.42 0.47 0.41 6 1.8 FRIL 0.39 0.45 0.39 0.41 0.41 0.41 6 2.8 LRP1 -1.59 -0.84 -1.32 1.15 -0.84 -0.87 6 4.0 GRP78 1.41 1.14 1.31 -0.34 0.78 0.6 6 1.4 ISLR 1.4 1.03 1.08 0.75 0.74 5 1.4 IBP3 -0.23 -0.21 -0.38 -0.33 -0.54 5 3.4 TETN -1.79 -1.23 -1.99 -1.26 4 2.5 PRDX1 -0.34 -0.38 -0.36 -0.4 4 1.5 LG3BP -0.58 -0.61 -0.38 -0.48 4 4.3 CD14 0.99 1.08 1.4 3 4.0 BGH3 1.73 1.67 -0.83 3 1.8 KIT -0.31 -0.56 3 1.4 GGH 0.44 0.52 3 1.3 AIFM1 -0.51 1 1.4 FIBA 0.31 1 1.1 GSLG1 -0.7 1 1.2 ENPL 0 1.1 EF1A1 0 1.2 TENX 0 1.1
This result suggests that there is a core group of proteins that define a high performance classifier, but alternative panels exist. However, changes in panel membership affect the tradeoff between NPV and ROR.
Example 7: Materials and Methods
Assay Development Candidates Sourced from Tissue
Patient samples obtained from fresh lung tumor resections were collected from Centre Hospitalier de l'Universite de Montreal and McGill University Health Centre under IRB approval and with informed patient consent. Samples were obtained from the tumor as well as from distal normal tissue in the same lung lobe. Plasma membranes of each pair of samples were then isolated from the epithelial cells of 30 patients (19 adenocarcinoma, 6 squamous, 5 large cell carcinoma) and endothelial cells of 38 patients (13 adenocarcinoma, 18 squamous, 7 large cell carcinoma) using immune-affinity protocols. Golgi apparatus were isolated from each pair of samples from 33 patients (18 adenocarcinoma, 14 squamous, 1 adenosquamous) using isopycnic centrifugation followed by ammonium carbonate extraction. Plasma membrane isolations and Golgi isolations were then analyzed by tandem mass spectrometry to identify proteins overexpressed in lung cancer tissue over normal tissue, for both plasma membranes and Golgi.
Assay Development Candidates Sourced from Literature
Candidate lung cancer biomarkers were identified from two public and one commercial database: Entrez, NBK3836, UniProt and NextBio. Terminologies were predefined for the database queries which were automated using PERL scripts. The mining was carried out on May 6, 2010 (UniProt), May 17, 2010 (Entrez) and Jul. 8, 2010 (NextBio), respectively. Biomarkers were then assembled and mapped to UniProt identifiers.
Evidence of Presence in Blood
The tissue-sourced and literature-source biomarker candidates were required to have evidence of presence in blood. For evidence by mass spectrometry detection, three datasets were used. HUPO9504 contains 9504 human proteins identified by tandem mass spectrometry [13]. HUPO889, a higher confidence subset of HUPO9504, contains 889 human proteins [18]. The PeptideAtlas (November 2009 build) was also used. A biomarker candidate was marked as previously detected if it contained at least one HUPO889, or at least two HUPO9504 peptides, or at least two PeptideAtlas peptides.
In addition to direct evidence of detection in blood by mass spectrometry, annotation as secreted proteins or as single-pass membrane proteins [19] were also accepted as evidence of presence in blood. Furthermore, proteins in UniProt or designation as plasma proteins three programs for predicting whether or not a protein is secreted into the blood were used. These programs were TMHMM [20], SignalP [21] and SecretomeP [22]. A protein was predicted as secreted if TMHMM predicted the protein had one transmembrane domain and SignalP predicted the transmembrane domain was cleaved; or TMHMM predicted the protein had no transmembrane domain and either SignalP or SecretomeP predicted the protein was secreted.
SRM Assay Development
SRM assays for 388 targeted proteins were developed based on synthetic peptides, using a protocol similar to those described in the literature [15, 23, 24]. Up to five SRM suitable peptides per protein were identified from public sources such as the PeptideAtlas, Human Plasma Proteome Database or by proteotypic prediction tools [25] and synthesized. SRM triggered MS/MS spectra were collected on an ABSciex 5500 QTrap for both doubly and triply charged precursor ions. The obtained MS/MS spectra were assigned to individual peptides using MASCOT (cutoff score .gtoreq.15) [26]. Up to four transitions per precursor ion were selected for optimization. The resulting corresponding optimal retention time, declustering potential and collision energy were assembled for all transitions. Optimal transitions were measured on a mixture of all synthetic peptides, a pooled sample of benign patients and a pooled sample of cancer patients. Transitions were analyzed in batches, each containing up to 1750 transitions. Both biological samples were immuno-depleted and digested by trypsin and were analyzed on an ABSciex 5500 QTrap coupled with a reversed-phase (RP) high-performance liquid chromatography (HPLC) system. The obtained SRM data were manually reviewed to select the two best peptides per protein and the two best transitions per peptide. Transitions having interference with other transitions were not selected. Ratios between intensities of the two best transitions of peptides in the synthetic peptide mixture were also used to assess the specificity of the transitions in the biological samples. The intensity ratio was considered as an important metric defining the SRM assays.
Processing of Plasma Samples
Plasma samples were sequentially depleted of high- and medium-abundance proteins using immuno-depletion columns packed with the IgY14-Supermix resin from Sigma. The depleted plasma samples were then denatured, digested by trypsin and desalted. Peptide samples were separated using a capillary reversed-phase LC column (Thermo BioBasic 18 KAPPA; column dimensions: 320 .mu.m.times.150 mm; particle size: 5 .mu.m; pore size: 300 .ANG.) and a nano-HPLC system (nanoACQUITY, Waters Inc.). The mobile phases were (A) 0.2% formic acid in water and (B) 0.2% formic acid in acetonitrile. The samples were injected (8 .mu.l) and separated using a linear gradient (98% A to 70% A over 19 minutes, 5 .mu.l/minute). Peptides were eluted directly into the electrospray source of the mass spectrometer (5500 QTrap LC/MS/MS, AB Sciex) operating in scheduled SRM positive-ion mode (Q1 resolution: unit; Q3 resolution: unit; detection window: 180 seconds; cycle time: 1.5 seconds). Transition intensities were then integrated by software MultiQuant (AB Sciex). An intensity threshold of 10,000 was used to filter out noisy data and undetected transitions.
Plasma Samples Used for Discovery and Validation Studies
Aliquots of plasma samples were provided by the Institut Universitaire de Cardiologie et de Pneumologie de Quebec (IUCPQ, Hospital Laval), New York University, the University of Pennsylvania, and Vanderbilt University (see Table 17). Subjects were enrolled in clinical studies previously approved by their Ethics Review Board (ERB) or Institutional Review Boards (IRB), respectively. In addition, plasma samples were provided by study investigators after review and approval of the sponsor's study protocol by the respective institution's IRB as required. Sample eligibility for the proteomic analysis was based on the satisfaction of the study inclusion and exclusion criteria, including the subject's demographic information, the subject's corresponding lung nodule radiographic characterization by chest computed tomography (CT), and the histopathology of the lung nodule obtained at the time of diagnostic surgical resection. Cancer samples had a histopathologic diagnosis of either non-small cell lung cancer (NSCLC), including adenocarcinoma, squamous cell, large cell, or bronchoalveolar cell carcinoma and a radiographic nodule of 30 mm or smaller. Benign samples, including granulomas, hamartomas and scar tissue, were also required to have a radiographic nodule of 30 mm or smaller and either histopathologic confirmation of being non-malignant or radiological confirmation in alignment with clinical guidelines. To ensure the accuracy of the clinical data, independent monitoring and verification of the clinical data associated with both the subject and lung nodule were performed in accordance with the guidance established by the Health Insurance Portability and Accountability Act (HIPAA) of 1996 to ensure subject privacy.
Study Design
The objective of the study design was to eliminate clinical and technical bias. Clinically, cancer and benign samples were paired so that they were from the same site, same gender, nodule sizes within 10 mm, age within 10 years, and smoking history within 20 pack years. Up to 15 pairs of matched cancer and benign samples per batch were assigned iteratively to processing batches until no statistical bias was demonstrable based on age, gender or nodule size.
Paired samples within each processing batch were further randomly and repeatedly assigned to positions within the processing batch, until the absolute values of the corresponding Pearson correlation coefficients between position and gender, nodule size, and age were less than 0.1. Afterwards, each pair of cancer and benign samples was randomized to their relative positions. To provide a control for sample batching, three 200 .mu.l aliquots of a pooled human plasma standard (HPS) (Bioreclamation, Hicksville, N.Y.) were positioned at the beginning, middle and end of each processing batch, respectively. Samples within a batch were analyzed together.
Logistic Regression Model
The logistic regression classification method [27] was used to combine a panel of transitions into a classifier and to calculate a classification probability score between 0 and 1 for each sample. The probability score (P.sub.s) of a sample was determined as P.sub.s=1/[1+exp(-.alpha.-.SIGMA..sub.i=1.sup.N.beta..sub.i*{hacek over (I)}.sub.i,s)], where {hacek over (I)}.sub.i,s was the logarithmically transformed (base 2), normalized intensity of transition i in sample s, .beta..sub.i was the corresponding logistic regression coefficient, .alpha. was a classifier-specific constant, and N was the total number of transitions in the classifier. A sample was classified as benign if P.sub.s was less than a decision threshold. The decision threshold can be increased or decreased depending on the desired NPV. To define the classifier, the panel of transitions (i.e. proteins), their coefficients, the normalization transitions, classifier coefficient .alpha. and the decision threshold must be learned (i.e. trained) from the discovery study and then confirmed using the validation study.
Discovery of the Rule-Out Classifier
A summary of the 143 samples used for classifier discovery appears in Table 17 and processed as described above.
Protein transitions were normalized as described above. Transitions that were not detected in at least 50% of the cancer samples or 50% of the benign samples were eliminated leaving 117 transitions for further consideration. Missing values for these transitions were replaced by half the minimum detected value over all samples for that transition.
The next step was finding the set of most cooperative proteins. The cooperative score of a protein is the number of high performing panels it participates in divided by the number of such panels it could appear on by chance alone. Hence, a cooperative score above 1 is good, and a score below 1 is not. The cooperative score for each protein is estimated by the following procedure:
One million random panels of 10 proteins each, selected from the 117 candidates, were generated. Each panel of 10 proteins was trained using the Monte Carlo cross validation (MCCV) method with a 20% hold-off rate and one hundred sample permutations per panel) to fit a logistic regression model and its performance assessed by partial AUC [28].
By generating such a large number of panels, we sample the space of classifiers sufficiently well to find some high performers by chance. The one hundred best random panels (see Table 2) out of the million generated were kept and for each of the 117 proteins we determined how frequently each occurred on these top panels. Of the 117 proteins, 36 had frequency more than expected by chance, after endogenous normalizers were removed. (Table 22) The expected number of panels on which a protein would appear by chance is 100* 10/117=8.33. The cooperative score for a protein is the number of panels it appears on divided by 8.33.
TABLE-US-00021 TABLE 21 Official Protein Gene Cooperative Partial Coefficient Category (UniProt) Name Score AUC CV Transition Classifier TSP1_HUMAN THBS1 1.8 0.25 0.24 GFLLLASLR_495.31_559.40 Classifier COIA1_HUMAN COL18A1 3.7 0.16 0.25 AVGLAGTFR_446.26_721.40 Classifier ISLR_HUMAN ISLR 1.4 0.32 0.25 ALPGTPVASSQPR_640.85_841.50 Classifier TETN_HUMAN CLEC3B 2.5 0.26 0.26 LDTLAQEVALLK_657.39_330.20 Classifier FRIL_HUMAN FTL 2.8 0.31 0.26 LGGPEAGLGEYLFER_804.40_913.40 Classifier GRP78_HUMAN HSPA5 1.4 0.27 0.27 TWNDPSVQQDIK_715.85_260.20 Classifier ALDOA_HUMAN ALDOA 1.3 0.26 0.28 ALQASALK_401.25_617.40 Classifier BGH3_HUMAN TGFBI 1.8 0.21 0.28 LTLLAPLNSVFK_658.40_804.50 Classifier LG3BP_HUMAN LGALS3BP 4.3 0.29 0.29 VEIFYR_413.73_598.30 Classifier LRP1_HUMAN LRP1 4.0 0.13 0.32 TVLWPNGLSLDIPAGR_855.00_400.20 Classifier FIBA_HUMAN FGA 1.1 0.31 0.35 NSLFEYQK_514.76_714.30 Classifier PRDX1_HUMAN PRDX1 1.5 0.32 0.37 QITVNDLPVGR_606.30_428.30 Classifier GSLG1_HUMAN GLG1 1.2 0.34 0.45 IIIQESALDYR_660.86_338.20 Robust KIT_HUMAN KIT 1.4 0.33 0.46 Robust CD14_HUMAN CD14 4.0 0.33 0.48 Robust EF1A1_HUMAN EEF1A1 1.2 0.32 0.56 Robust TENX_HUMAN TNXB 1.1 0.30 0.56 Robust AIFM1_HUMAN AIFM1 1.4 0.32 0.70 Robust GGH_HUMAN GGH 1.3 0.32 0.81 Robust IBP3_HUMAN IGFBP3 3.4 0.32 1.82 Robust ENPL_HUMAN HSP90B1 1.1 0.29 5.90 Non-Robust ERO1A_HUMAN ERO1L 6.2 Non-Robust 6PGD_HUMAN PGD 4.3 Non-Robust ICAM1_HUMAN ICAM1 3.9 Non-Robust PTPA_HUMAN PPP2R4 2.1 Non-Robust NCF4_HUMAN NCF4 2.0 Non-Robust SEM3G_HUMAN SEMA3G 1.9 Non-Robust 1433T_HUMAN YWHAQ 1.5 Non-Robust RAP2B_HUMAN RAP2B 1.5 Non-Robust MMP9_HUMAN MMP9 1.4 Non-Robust FOLH1_HUMAN FOLH1 1.3 Non-Robust GSTP1_HUMAN GSTP1 1.3 Non-Robust EF2_HUMAN EEF2 1.3 Non-Robust RAN_HUMAN RAN 1.2 Non-Robust SODM_HUMAN SOD2 1.2 Non-Robust DSG2_HUMAN DSG2 1.1 Coefficient Coefficient (Final) Predicted Protein SEQ ID (Discovery) alpha = Tissue Concentration Category (UniProt) NO alpha = 36.16 26.25 Candidate (ng/ml) Classifier TSP1_HUMAN 22 0.53 0.44 510 Classifier COIA1_HUMAN 11 -1.56 -0.91 35 Classifier ISLR_HUMAN 14 1.40 0.83 -- Classifier TETN_HUMAN 20 -1.79 -1.02 58000 Classifier FRIL_HUMAN 24 0.39 0.17 Secreted, Epi, 12 Endo Classifier GRP78_HUMAN 23 1.41 0.55 Secreted, Epi, 100 Endo Classifier ALDOA_HUMAN 7 -0.80 -0.26 Secreted, Epi 250 Classifier BGH3_HUMAN 8 1.73 0.54 Epi 140 Classifier LG3BP_HUMAN 25 -0.58 -0.21 Secreted 440 Classifier LRP1_HUMAN 15 -1.59 -0.83 Epi 20 Classifier FIBA_HUMAN 26 0.31 0.13 130000 Classifier PRDX1_HUMAN 16 -0.34 -0.26 Epi 60 Classifier GSLG1_HUMAN 27 -0.70 -0.44 Epi, Endo -- Robust KIT_HUMAN 8.2 Robust CD14_HUMAN Epi 420 Robust EF1A1_HUMAN Secreted, Epi 61 Robust TENX_HUMAN Endo 70 Robust AIFM1_HUMAN Epi, Endo 1.4 Robust GGH_HUMAN 250 Robust IBP3_HUMAN 5700 Robust ENPL_HUMAN Secreted, Epi, 88 Endo Non-Robust ERO1A_HUMAN Secreted, Epi, -- Endo Non-Robust 6PGD_HUMAN Epi, Endo 29 Non-Robust ICAM1_HUMAN 71 Non-Robust PTPA_HUMAN Endo 3.3 Non-Robust NCF4_HUMAN Endo -- Non-Robust SEM3G_HUMAN -- Non-Robust 1433T_HUMAN Epi 180 Non-Robust RAP2B_HUMAN Epi -- Non-Robust MMP9_HUMAN 28 Non-Robust FOLH1_HUMAN -- Non-Robust GSTP1_HUMAN Endo 32 Non-Robust EF2_HUMAN Secreted, Epi 30 Non-Robust RAN_HUMAN Secreted, Epi 4.6 Non-Robust SODM_HUMAN Secreted 7.1 Non-Robust DSG2_HUMAN Endo 2.7
The 36 most cooperative proteins are listed in Table 22.
TABLE-US-00022 TABLE 22 Official Protein Gene Cooperative Partial Coefficient Category (UniPort) Name Score AUC CV Transition Classifier TSP1_HUMAN THBS1 1.8 0.25 0.24 GFLLLASLR_495.31_559.40 Classifier COIA1_HUMAN COL18A1 3.7 0.16 0.25 AVGLAGTFR_446.26_721.40 Classifier ISLR_HUMAN ISLR 1.4 0.32 0.25 ALPGTPVASSQPR_640.85_841.50 Classifier TETN_HUMAN CLEC3B 2.5 0.26 0.26 LDTLAQEVALLK_657.39_330.20 Classifier FRIL_HUMAN FTL 2.8 0.31 0.26 LGGPEAGLGEYLFER_804.40_913.40 Classifier GRP78_HUMAN HSPA5 1.4 0.27 0.27 TWNDPSVQQDIK_715.85_260.20 Classifier ALDOA_HUMAN ALDOA 1.3 0.26 0.28 ALQASALK_401.25_617.40 Classifier BGH3_HUMAN TGFBI 1.8 0.21 0.28 LTLLAPLNSVFK_658.40_804.50 Classifier LG3BP_HUMAN LGALS3BP 4.3 0.29 0.29 VEIFYR_413.73_598.30 Classifier LRP1_HUMAN LRP1 4.0 0.13 0.32 TVLWPNGLSLDIPAGR_855.00_400.20 Classifier FIBA_HUMAN FGA 1.1 0.31 0.35 NSLFEYQK_514.76_714.30 Classifier PRDX1_HUMAN PRDX1 1.5 0.32 0.37 QITVNDLPVGR_606.30_428.30 Classifier GSLG1_HUMAN GLG1 1.2 0.34 0.45 IIIQESALDYR_660.86_338.20 Robust KIT_HUMAN KIT 1.4 0.33 0.46 Robust CD14_HUMAN CD14 4.0 0.33 0.48 Robust EF1A1_HUMAN EEF1A1 1.2 0.32 0.56 Robust TENX_HUMAN TNXB 1.1 0.30 0.56 Robust AIFM1_HUMAN AIFM1 1.4 0.32 0.70 Robust GGH_HUMAN GGH 1.3 0.32 0.81 Robust IBP3_HUMAN IGFBP3 3.4 0.32 1.82 Robust ENPL_HUMAN HSP90B1 1.1 0.29 5.90 Non-Robust ERO1A_HUMAN ERO1L 6.2 Non-Robust 6PGD_HUMAN PGD 4.3 Non-Robust ICAM1_HUMAN ICAM1 3.9 Non-Robust PTPA_HUMAN PPP2R4 2.1 Non-Robust NCF4_HUMAN NCF4 2.0 Non-Robust SEM3G_HUMAN SEMA3G 1.9 Non-Robust 1433T_HUMAN YWHAQ 1.5 Non-Robust RAP2B_HUMAN RAP2B 1.5 Non-Robust MMP9_HUMAN MMP9 1.4 Non-Robust FOLH1_HUMAN FOLH1 1.3 Non-Robust GSTP1_HUMAN GSTP1 1.3 Non-Robust EF2_HUMAN EEF2 1.3 Non-Robust RAN_HUMAN RAN 1.2 Non-Robust SODM_HUMAN SOD2 1.2 Non-Robust DSG2_HUMAN DSG2 1.1 Coefficient Coefficient (Discovery) (Final) Predicted Protein SEQ alpha = alpha = Tissue Concentration Category (UniPort) ID NO 36.16 26.25 Candidate (ng/ml) Classifier TSP1_HUMAN 22 0.53 0.44 510 Classifier COIA1_HUMAN 11 -1.56 -0.91 35 Classifier ISLR_HUMAN 14 1.40 0.83 -- Classifier TETN_HUMAN 20 -1.79 -1.02 58000 Classifier FRIL_HUMAN 24 0.39 0.17 Secreted, 12 Epi, Endo Classifier GRP78_HUMAN 23 1.41 0.55 Secreted, 100 Epi, Endo Classifier ALDOA_HUMAN 7 -0.80 -0.26 Secreted, 250 Epi Classifier BGH3_HUMAN 8 1.73 0.54 Epi 140 Classifier LG3BP_HUMAN 25 -0.58 -0.21 Secreted 440 Classifier LRP1_HUMAN 15 -1.59 -0.83 Epi 20 Classifier FIBA_HUMAN 26 0.31 0.13 130000 Classifier PRDX1_HUMAN 16 -0.34 -0.26 Epi 60 Classifier GSLG1_HUMAN 27 -0.70 -0.44 Epi, -- Endo Robust KIT_HUMAN 8.2 Robust CD14_HUMAN Epi 420 Robust EF1A1_HUMAN Secreted, 61 Epi Robust TENX_HUMAN Endo 70 Robust AIFM1_HUMAN Epi, 1.4 Endo Robust GGH_HUMAN 250 Robust IBP3_HUMAN 5700 Robust ENPL_HUMAN Secreted, 88 Epi, Endo Non-Robust ERO1A_HUMAN Secreted, -- Epi, Endo Non-Robust 6PGD_HUMAN Epi, 29 Endo Non-Robust ICAM1_HUMAN 71 Non-Robust PTPA_HUMAN Endo 3.3 Non-Robust NCF4_HUMAN Endo -- Non-Robust SEM3G_HUMAN -- Non-Robust 1433T_HUMAN Epi 180 Non-Robust RAP2B_HUMAN Epi -- Non-Robust MMP9_HUMAN 28 Non-Robust FOLH1_HUMAN -- Non-Robust GSTP1_HUMAN Endo 32 Non-Robust EF2_HUMAN Secreted, 30 Epi Non-Robust RAN_HUMAN Secreted, 4.6 Epi Non-Robust SODM_HUMAN Secreted 7.1 Non-Robust DSG2_HUMAN Endo 2.7
The set of 36 cooperative proteins was further reduced to a set of 21 proteins by manually reviewing raw SRM data and eliminating proteins that did not have robust SRM transitions due to low signal to noise or interference. Proteins were iteratively eliminated from the set of 21 proteins until a classifier with the optimal partial AUC was obtained. The criteria for elimination was coefficient stability. In a logistic regression model each protein has a coefficient. In the process of training the model the coefficient for each protein is determined. When this is performed using cross validation (MCCV), hundreds of coefficient estimates for each protein are derived. The variability of these coefficients is an estimate of the stability of the protein. At each step the proteins were trained using MCCV (hold out rate 20%, ten thousand sample permutations per panel) to a logistic regression model and their stability measured. The least stable protein was eliminated. This process continued until a 13 protein classifier with optimal partial AUC was reached.
Finally, the 13 protein classifier was trained to a logistic regression model by MCCV (hold out rate 20%, twenty thousand sample permutations). The thirteen proteins for the rule-out classifier are listed in Table 18 along with their highest intensity transition and model coefficient.
Selection of a Decision Threshold
Assuming the cancer prevalence of lung nodules is prev, the performance of a classifier (NPV and ROR) on the patient population with lung nodules was calculated from sensitivity (sens) and specificity (spec) as follows:
.times..times..times..times..times..times..times..times. ##EQU00002##
The threshold separating calls for cancer or benign samples was then selected as the probability score with NPV .gtoreq.90% and ROR .gtoreq.20%. As we expect the classifier's performance measured on the discovery set to be an overestimate, the threshold is selected to be a range, as performance will usually degrade on an independent validation set.
Validation of the Rule-Out Classifier
52 cancer and 52 benign samples (see Table 17) were used to validate the performance of the 13 protein classifier. Half of the samples were placed in pre-determined processing batches analyzed immediately after the discovery samples and the other half of samples were analyzed at a later date. This introduced variability one would expect in practice. More specifically, the three HPS samples run in each processing batch were utilized as external calibrators. Details on HPS calibration are described below.
Calibration by HPS Samples
For label-free MS approach, variation on signal intensity between different experiments is expected. To reduce this variation, we utilized HPS samples as an external standard and calibrated the intensity between the discovery and validation studies. Assume that {hacek over (I)}.sub.i,s is the logarithmically transformed (base 2), normalized intensity of transition i in sample s, {hacek over (I)}.sub.i,dis and {hacek over (I)}.sub.i,val are the corresponding median values of HPS samples in the discovery and the validation studies, respectively. Then the HPS corrected intensity is .sub.i,s= .sub.i,s- .sub.i,val+ .sub.i,dis Consequently, assume that the probability for cancer of a clinical sample in the validation study is predicted as prob by the classifier. Then the HPS corrected probability of cancer of the clinical sample is calculated as follows:
e ##EQU00003## ##EQU00003.2## ##EQU00003.3## ##EQU00003.4## .times. ##EQU00003.5##
Here S.sub.HPS,dis and S.sub.HPS,val were the median value of S of all HPS samples in the discovery and validation studies, respectively.
Statistical Analysis
All statistical analyses were performed with Stata, R and/or MatLab.
Depletion Column Drift
We observed an increase of signal intensity as more and more samples were depleted by the same column. We used transition intensity in HPS samples to quantify this technical variability. Assuming I.sub.i,s was the intensity of transition i in a HPS sample s, the drift of the sample was defined as
.times..times. ##EQU00004## where I.sub.i was the mean value of I.sub.i,s among all HPS samples that were depleted by the same column and the median was taken over all detected transitions in the sample. Then the drift of the column was defined as drift.sub.col=median(drift.sub.s>0)-median(drift.sub.s<0).
Here the median was taken over all HPS samples depleted by the column. If no sample drift was greater or less than zero, the corresponding median was taken as 0. The median column drift was the median of drifts of all depletion columns used in the study.
Identification of Endogenous Normalizing Proteins
The following criteria were used to identify a transition as a normalizer: Possessed the highest median intensity of all transitions from the same protein. Detected in all samples. Ranked high in reducing median technical CV (median CV of transition intensities that were measured on HPS samples) as a normalizer. Ranked high in reducing median column drift that was observed in sample depletion. Possessed low median technical CV and low median biological CV (median CV of transition intensities that were measured on clinical samples). Six transitions were selected and appear in Table 23.
TABLE-US-00023 TABLE 23 Panel of endogenous normalizers. Median Median SEQ ID Technical Column Drift Normalizer Transition NO CV (%) (%) PEDF_HUMAN LQSLFDSPDFSK_692.34_593.30 28 25.8 6.8 MASP1_HUMAN TGVITSPDFPNPYPK_816.92_258.10 6 26.5 18.3 GELS_HUMAN TASDFITK_441.73_710.40 5 27.1 16.8 LUM_HUMAN SLEDLQLTHNK_433.23_499.30 29 27.1 16.1 C163A_HUMAN INPASLDK_429.24_630.30 30 26.6 14.6 PTPRJ_HUMAN VITEPIPVSDLR_669.89_896.50 31 27.2 18.2 Normalization by Panel of Transitions 25.1 9.0 Without Normalization 32.3 23.8
Data Normalization
A panel of six normalization transitions (see Table 23) were used to normalize raw SRM data for two purposes: (A) to reduce sample-to-sample intensity variations within same study and (B) to reduce intensity variations between different studies. For the first purpose, a scaling factor was calculated for each sample so that the intensities of the six normalization transitions of the sample were aligned with the corresponding median intensities of all HGS samples. Assuming that N.sub.i,s is the intensity of a normalization transition i in sample s and {circumflex over (N)}.sub.i the corresponding median intensity of all HGS samples, then the scaling factor for sample s is given by S/S.sub.s, where
.times..times..times. ##EQU00005## is the median of the intensity ratios and S is the median of S.sub.s over all samples in the study. For the second purpose, a scaling factor was calculated between the discovery and the validation studies so that the median intensities of the six normalization transitions of all HGS samples in the validation study were comparable with the corresponding values in the discovery study. Assuming that the median intensities of all HGS samples in the two studies are {circumflex over (N)}.sub.i,dis and {circumflex over (N)}.sub.i,val, respectively, the scaling factor for the validation study is given by
.times..times..times. ##EQU00006## Finally, for each transition of each sample, its normalized intensity was calculated as .sub.i,s=I.sub.i,s*R*S/S.sub.s where I.sub.i,s was the raw intensity.
Isolation of Membrane Proteins from Tissues
Endothelial plasma membrane proteins were isolated from normal and tumor lung tissue samples that were obtained from fresh lung resections. Briefly, tissues were washed in buffer and homogenates were prepared by disrupting the tissues with a Polytron. Homogenates were filtered through a 180-.mu.m mesh and filtrates were centrifuged at 900.times.g for 10 min, at 4.degree. C. Supernatants were centrifuged on top of a 50% (w:v) sucrose cushion at 218,000.times.g for 60 min at 4.degree. C. to pellet the membranes. Pellets were resuspended and treated with micrococcal nuclease. Membranes from endothelial cells were incubated with a combination of anti-thrombomodulin, anti-ACE, anti-CD34 and anti-CD144 antibodies, and then centrifuged on top of a 50% (w:v) sucrose cushion at 280,000.times.g for 60 min at 4.degree. C. After pellets were resuspended, endothelial cell plasma membranes were isolated using MACS microbeads, treated with potassium iodide to remove cytoplasmic peripheral proteins.
Epithelial plasma membrane proteins from normal and tumor lung tissue samples were isolated from fresh lung resections. Tissues were washed and homogenates as described above for endothelial plasma membrane proteins preparation. Membranes from epithelial cells were labeled with a combination of anti-ESA, anti-CEA, anti-CD66c and anti-EMA antibodies, and then centrifuged on top of a 50% (w:v) sucrose cushion at 218,000.times.g for 60 min at 4.degree. C. Epithelial cell plasma membranes were isolated using MACS microbeads and the eluate was centrifuged at 337,000.times.g for 30 minutes at 4.degree. C. over a 33% (w:v) sucrose cushion. After removing the supernatant and sucrose cushion, the pellet was resuspended in Laemmli/Urea/DTT.
Isolation of Secreted Proteins from Tissues
Secreted proteins were isolated from normal and tumor lung tissue samples that were isolated from fresh lung resections. Tissues were washed and homogenized using a Polytron homogenization. The density of the homogenates was adjusted to 1.4 M with concentrated sucrose prior to isolating the secretory vesicles by isopycnic centrifugation at 100,000.times.g for 2 hr at 4.degree. C. on a 0.8 and 1.2 M discontinuous sucrose gradient. Vesicles concentrating at the 0.8/1.2 M interface were collected and further incubated for 25 minutes with 0.5 M KCl (final concentration) to remove loosely bound peripheral proteins. Vesicles were recuperated by ultracentrifugation at 150,000.times.g for one hour at 4.degree. C. and then opened with 100 mM ammonium carbonate pH 11.0 for 30 minutes at 4.degree. C. Secreted proteins were recovered in the supernatant following a 1-hour ultracentrifugation at 150,000.times.g at 4.degree. C.
Preparation of IgY14-SuperMix Immunoaffinity Columns
Immunoaffinity columns were prepared in-house using a slurry containing a 2:1 ratio of IgY14 and SuperMix immunoaffinity resins, respectively (Sigma Aldrich). Briefly, a slurry (10 ml, 50%) of mixed immunoaffinity resins was added to a glass chromatography column (Tricorn, GE Healthcare) and the resin was allowed to settle under gravity flow, resulting in a 5 ml resin volume in the column. The column was capped and placed on an Agilent 1100 series HPLC system for further packing (20 minutes, 0.15M ammonium bicarbonate, 2 ml/min). The performance of each column used in the study was then assessed by replicate injections of aliquots of HPS sample. Column performance was assessed prior to beginning immunoaffinity separation of each batch of clinical samples.
IgY14-Sumermix Immunoaffinity Chromatography
Plasma samples (60 .mu.l) were diluted (0.15M ammonium bicarbonate, 1:2 v/v, respectively) and filtered (0.2 .mu.m AcroPrep 96-well filter plate, Pall Life Sciences) prior to immunoaffinity separation. Dilute plasma (90 .mu.l) was separated on the IgY14-SuperMix column connected to an Agilent 1100 series HPLC system using a three buffers (loading/washing: 0.15M ammonium bicarbonate; stripping/elution: 0.1M glycine, pH 2.5; neutralization: 0.01M Tris-HCl, 0.15M NaCl, pH 7.4) with a load-wash-elute-neutralization-re-equilibration cycle (36 minutes total time). The unbound and bound fractions were monitored using a UV absorbance (280 nm) and were baseline resolved after separation. Only the unbound fraction containing the low abundance proteins was collected for downstream processing and analysis. Unbound fractions were lyophilized prior to enzymatic digestion.
Enzymatic Digestion of Low Abundance Proteins
Low abundance proteins were reconstituted under mild denaturing conditions (200 .mu.l of 1:1 0.1M ammonium bicarbonate/trifluoroethanol v/v) and allowed to incubate (30 minutes, room temperature, orbital shaker). Samples were then diluted (800 .mu.l of 0.1M ammonium bicarbonate) and digested with trypsin (Princeton Separations; 0.4 .mu.g trypsin per sample, 37.degree. C., 16 hours). Digested samples were lyophilized prior to solid-phase extraction.
Solid-Phase Extraction
Solid phase extraction was used to reduce salt and buffer contents in the samples prior to mass spectrometry. The lyophilized samples containing tryptic peptides were reconstituted (350 .mu.l 0.01M ammonium bicarbonate) and allowed to incubate (15 minutes, room temperature, orbital shaker). A reducing agent was then added to the samples (30 .mu.l 0.05M TCEP) and the samples were incubated (60 minutes, room temperature). Dilute acid and a low percentage of organic solvent (375 .mu.l 90% water/10% acetonitrile/0.2% trifluoroacetic acid) were added to optimize the solid phase extraction of peptides. The extraction plate (Empore C18, 3M Bioanalytical Technologies) was conditioned according to manufacturer protocol. Samples were loaded onto the solid phase extraction plate, washed (500 .mu.l 95% water/5% acetonitrile/0.1% trifluoroacetic acid) and eluted (200 .mu.l 52% water/48% acetonitrile/0.1% trifluoroacetic acid) into a collection plate. The eluate was split into two equal aliquots and each aliquot was taken to dryness in a vacuum concentrator. One aliquot was used immediately for mass spectrometry, while the other was stored (-80.degree. C.) and used as needed. Samples were reconstituted (12 .mu.l 90% water/10% acetonitrile/0.2% formic acid) just prior to LC-SRM MS analysis.
Inclusion and Exclusion Criteria
Plasma samples were eligible for the studies if they were (A) obtained in EDTA tubes, (B) obtained from subjects previously enrolled in IRB-approved studies at the participating institutions, and (C) archived, e.g. labeled, aliquotted and frozen, as stipulated by the study protocols. The samples must also satisfy the following inclusion and exclusion criteria: 1) Inclusion Criteria: 2) Sample eligibility was based on clinical parameters, including the following subject, nodule and clinical staging parameters: a) Subject i) age .gtoreq.40 ii) any smoking status, e.g. current, former, or never iii) co-morbid conditions, e.g. COPD iv) prior malignancy with a minimum of 5 years in clinical remission v) prior history of skin carcinomas--squamous or basal cell b) Nodule i) Radiology (1) size .gtoreq.4 mm and .ltoreq.70 mm (up to Stage 2B eligible) (2) any spiculation or ground glass opacity ii) pathology (1) malignant--adenocarcinoma, squamous, or large cell (2) benign--inflammatory (e.g. granulomatous, infectious) or non-inflammatory (e.g. hamartoma) c) Clinical stage i) Primary tumor: .ltoreq.T2 (e.g. 1A, 1B, 2A and 2B) ii) Regional lymph nodes: N0 or N1 only iii) Distant metastasis: M0 only 3) Exclusion Criteria a) Subject: prior malignancy within 5 years of IPN diagnosis b) Nodule: i) size data unavailable ii) for cancer or benign SPNs, no pathology data available iii) pathology--small cell lung cancer c) Clinical stage i) Primary tumor: .gtoreq.T3 ii) Regional lymph nodes: .gtoreq.N2 iii) Distant metastasis: .gtoreq.M1
Power Analysis for the Discovery Study
The power analysis for the discovery study was based on the following assumptions: 1) The overall false positive rate (a) was set to 0.05. 2) idak correction for multiple testing was used to calculate the effective .alpha..sub.eff for testing 200 proteins, i.e.,
.alpha..alpha. ##EQU00007## The effective sample size was reduced by a factor of 0.864 to account for the larger sample requirement for the Mann-Whitney test than for the t-test. 4) The overall coefficient of variation was set to 0.43 based on a previous experience. 5) The power (1-.beta.) of the study was calculated based on the formula for the two-sample, two-sided t-test, using effective .alpha..sub.eff and effective sample size. The power for the discovery study was tabulated in Table 24 by the sample size per cohort and the detectable fold difference between control and disease samples.
TABLE-US-00024 TABLE 24 Cohort size required to detect protein fold changes with a given probability. Detectable Protein Fold Difference Cohort Size 1.25 1.5 1.75 2 20 0.011 0.112 0.368 0.653 30 0.025 0.277 0.698 0.925 40 0.051 0.495 0.905 0.992 50 0.088 0.687 0.977 0.999 60 0.129 0.812 0.994 1 70 0.183 0.902 0.999 1 80 0.244 0.953 1 1 90 0.302 0.977 1 1 100 0.369 0.99 1 1
Power Analysis for the Validation Study
Sufficient cancer and benign samples are needed in the validation study to confirm the performance of the rule-out classifier obtained from the discovery study. We are interested in obtaining the 95% confidence intervals (CIs) on NPV and ROR for the rule-out classifier. Using the Equations in the Selection of a Decision Threshold section herein, one can derive sensitivity (sens) and specificity (spec) as functions of NPV and ROR, i.e., sens=1-ROR*(1-NPV)/prev, spec=ROR*NPV/(1-prev), where prev is the cancer prevalence in the intended use population. Assume that the validation study contains N.sub.C cancer samples and N.sub.B benign samples. Based on binomial distribution, variances of sensitivity and specificity are given by var(sens)=sens*(1-sens)/N.sub.C var(spec)=spec*(1-spec)/N.sub.B Using the Equations in the Selection of a Decision Threshold section herein, the corresponding variances of NPV and ROR can be derived under the large-sample, normal-distribution approximation as
.function..times..times..times..times..times..times..times..times..functi- on..times..times..times..times..function..function..function..times..funct- ion..function..function. ##EQU00008## The two-sided 95% CIs of NPV and ROR are then given by .+-.z.sub..alpha./2 {square root over (var(NPV))} and .+-.z.sub..alpha./2 {square root over (var(ROR))}, respectively, where z.sub..alpha./2=1.959964 is the 97.5% quantile of the normal distribution. The anticipated 95% CIs for the validation study were tabulated in Table 25 by the sample size (N.sub.C=N.sub.B=N) per cohort.
TABLE-US-00025 TABLE 25 The 95% confidence interval (CI) of NPV as a function of cohort size. The corresponding 95% CI of ROR is also listed. The prevalence was set at 28.5%. The expected NPV and ROR were set to values in the discovery study, i.e., 90% and 52%, respectively. 95% CI of 95% CI of ROR Cohort Size NPV (.+-.%) (.+-.%) 10 12.5 22.1 20 8.8 15.7 30 7.2 12.8 40 6.2 11.1 50 5.6 9.9 60 5.1 9.0 70 4.7 8.4 80 4.4 7.8 90 4.2 7.4 100 3.9 7.0 150 3.2 5.7 200 2.8 5.0
Calculation of Q-Values of Peptide and Protein Assays
To determine the false positive assay rate the q-values of peptide SRM assays were calculated as follows. Using the distribution of Pearson correlations between transitions from different proteins as the null distribution (FIG. 7), an empirical p-value was assigned to a pair of transitions from the same peptide, detected in at least five common samples otherwise a value of `NA` is assigned. The empirical p-value was converted to a q-value using the "qvalue" package in Bioconductor. Peptide q-values were below 0.05 for all SRM assays presented in Table 6.
The q-values of protein SRM assays were calculated in the same way except Pearson correlations of individual proteins were calculated as those between two transitions from different peptides of the protein. For proteins not having two peptides detected in five or more common samples, their q-values could not be properly evaluated and were assigned `NA`.
Impact of Categorical Confounding Factors
TABLE-US-00026 TABLE 26 Impact of categorical confounding factors on classifier score. Cancer p-value Benign p-value Gender # 70 0.786* 68 0.387* Female Median 0.701 0.570 score (quartile (0.642-0.788) (0.390-0.70) range) # Male 54 55 Median 0.736 0.621 (quartile (0.628-0.802) (0.459-0.723) range) Smoking # Never 8 0.435** 34 0.365** Status Median 0.664 0.554 score (quartile (0.648-0.707) (0.452-0.687) range) # Past 98 73 Median 0.703 0.586 (quartile (0.618-0.802) (0.428-0.716) range) # 17 13 Current Median 0.749 0.638 score (quartile (0.657-0.789) (0.619-0.728) range) *p-value by Mann-Whitney test **p-value by Kruskal-Wallis test
Impact of Continuous Confounding Factors
TABLE-US-00027 TABLE 27 Impact of continuous confounding factors on classifier score. Coefficient of linear fit Correlation (95% CI) p-value Age All 0.198 0.003 0.002 (0.001-0.005) Cancer 0.012 0.000 0.893 (-0.003-0.003) Benign 0.248 0.004 0.006 (0.001-0.007) Nodule All -0.057 -0.002 0.372 size (-0.005-0.002) Cancer -0.013 0.000 0.889 (-0.005-0.004) Benign -0.055 -0.001 0.542 (-0.006-0.003) Pack- All 0.154 0.001 0.019 year (0.00-0.002) Cancer 0.060 0.000 0.520 (-0.001-0.001) Benign 0.108 0.001 0.254 (0.00-0.002)
Example 8: A Systems Biology-Derived, Blood-Based Proteomic Classifier for the Molecular Characterization of Pulmonary Nodules
SUMMARY
Each year millions of pulmonary nodules are discovered by computed tomography but remain undiagnosed as malignant or benign. As the majority of these nodules are benign, many patients undergo unnecessary and costly invasive procedures. This invention presents a 13-protein blood-based classifier for the identification of benign nodules. Using a systems biology strategy, 371 protein candidates were identified and selected reaction monitoring (SRM) assays developed for each. The SRM assays were applied in a multisite discovery study (n=143) with benign and cancer plasma samples matched on nodule size, age, gender and clinical site. Rather than identify the best individual performing proteins, the 13-protein classifier was formed from proteins performing best on panels. The classifier was validated on an independent set of plasma samples (n=104) demonstrating high negative predictive value (92%) and specificity (27%) sufficiently high to obviate one-in-four patients with benign nodules from invasive procedures. Importantly, validation performance on a nondiscovery clinical site showed NPV of 100% and specificity of 28%, arguing for the general effectiveness of the classifier. A pathway analysis demonstrated that the classifier proteins are likely modulated by a few transcription regulators (NF2L2, AHR, MYC, FOS) highly associated with lung cancer, lung inflammation and oxidative stress networks. Remarkably, the classifier score was independent of patient nodule size, smoking history and age. As these are the currently used risk factors for clinical management of pulmonary nodules, the application of this molecular test would provide a powerful complementary tool for physicians to use in lung cancer diagnosis.
Rationale
Computed tomography (CT) identifies millions of pulmonary nodules annually with many being undiagnosed as malignant or benign. The vast majority of these nodules are benign, but due to the threat of cancer, a significant number of patients with benign nodules undergo unnecessary invasive medical procedures costing the healthcare system billions of dollars annually. Consequently, there is a high unmet need for a non-invasive clinical test that can identify benign nodules with high probability.
Presented is a 13-protein plasma test, or classifier, for identifying benign nodules. To develop the classifier, a systems biology approach based on the supposition that biological networks in tumors become disease-perturbed and alter the expression of their cognate proteins was adopted. This systems approach employs a variety of strategies to identify blood proteins that directly reflect lung cancer-perturbed networks.
First, candidate biomarkers prioritized for inclusion on the classifier were those proteins secreted by or shed from the cell surface of lung cancer cells in contrast to normal lung cells. These are proteins both associated with lung cancer and also most likely to be emitted by a malignant pulmonary nodule into blood. The literature was also surveyed to identify blood proteins associated with lung cancer. In total, an initial list of 388 protein candidates for inclusion on the classifier were derived from these three sources.
Another system-driven approach was to prioritize the 388 protein candidates for inclusion on the classifier by how frequently they appear on high performing protein panels, as opposed to their individual diagnostic performance. This strategy is motivated by the intent to capture the integrated behavior of proteins within lung cancer-perturbed networks. Proteins that appear frequently on high performing panels are called cooperative proteins. This is a defining step in the discovery of the classifier as the most cooperative proteins are often not the proteins with best individual performance.
Third, the classifier is deconstructed in terms of its relationship to lung cancer networks. Ideally, the classifier consists of multiple proteins from multiple lung cancer-perturbed networks. We conjecture that measuring multiple proteins from the same lung cancer associated pathway increases the signal-to-noise ratio thus enhancing performance of the classifier.
Selected reaction monitoring (SRM) mass spectrometry (MS) was utilized to measure the concentrations of the candidate proteins in plasma. SRM is a form of MS that monitors predetermined and highly specific mass products, called transitions, of particularly informative (proteotypic or protein-specific) peptides of targeted proteins. Briefly, SRM assays for proteins are based on the high reproducibility of peptide ionization, the foundation of MS. During a SRM analysis, the mass spectrometer is programmed to monitor for transitions of the specific protein(s) being assayed. The resulting chromatograms are integrated to provide quantitative or semi-quantitative protein abundance information. The benefits of SRM assays include high protein specificity, large multiplexing capacity, and both rapid and reliable assay development and deployment. SRM has been used for clinical testing of small molecule analytes for many years, and recently in the development of biologically relevant assays. Exceptional public resources exist to accelerate SRM assay development including the PeptideAtlas, the Plasma Proteome Project, the SRM Atlas and the PeptideAtlas SRM Experimental Library.
In accordance with evolving guidelines for clinical test development, the classifier was discovered (n=143) and validated (n=104) using independent plasma sets from multiple clinical sites consistent with an intended use population of patients with lung nodules, defined as round opacities up to 30 mm in size. In contrast to other biomarker studies, utilizing biospecimens associated with the broad clinical spectrum of lung cancer (Stages I to IV), the cancer plasma samples analyzed were limited to Stage IA, which corresponds to the intended use population of lung nodules of size 30 mm or less. The classifier yielded a performance amendable to further clinical stratification of the intended use by parameters such as age, smoking history or nodule size, as guided by a clinician's diagnostic needs.
Validated performance of the 13-protein classifier demonstrated a negative predictive value (NPV) of 92% and a specificity of 27%. For clinical utility, the classifier must reliably and frequently provide information that can participate in a physician's decision to avoid an invasive procedure. High NPV is required to ensure that the classifier reliably identifies benign nodules. Equivalently, malignant nodules are rarely (8% or less) reported as benign by the classifier. A specificity of 27% implies that one-in-four patients with a benign nodule can avoid invasive procedures, and so, frequently provides information of clinical utility. All validation samples were independent of discovery samples, and 37 came from a new clinical site. Performance on the samples from the new site demonstrated a NPV of 100% and a specificity of 28% suggesting that the classifier performance extends to new clinical settings. Remarkably, the classifier score is demonstrated to be independent of the patient's age, smoking history and nodule size, thereby complementing current clinical risk factors with an informative molecular dimension for evaluating the disease status of a pulmonary nodule.
Results
Table 28 presents the steps taken in the refinement of the initial 388 protein candidates down to the set of 13 classifier proteins used for validation and performance assessment. The results are presented in the same sequence.
TABLE-US-00028 TABLE 28 Steps in refining the 388 candidates down to the 13-protein classifier Number of Proteins Refinement 388 Lung cancer associated protein candidates sourced from tissue and literature. 371 Number of the 388 protein candidates successfully developed into a SRM assay. 190 Number of the 371 SRM protein assays detected in plasma. 125 Number of the 190 SRM protein assays detected in at least 50% of cancer or 50% of benign discovery samples. 36 Number of the 125 detected proteins that were cooperative. 21 Number of the 36 cooperative proteins with robust SRM assays (i.e. no interfering signals, good signal-to-noise, etc.) 13 Number of the 21 robust and cooperative proteins with stable logistic regression coefficients.
Selection of Biomarker Candidates for Assay Development. To identify lung cancer biomarkers in blood that are shed or secreted from lung tumor cells, proteins overexpressed on the cell surface or over-secreted from lung cancer tumor cells relative to normal lung cells were identified from freshly resected lung tumors using organelle isolation techniques combined with mass spectrometry. In addition, an extensive literature search for lung cancer biomarkers was performed using public and private resources. Both the tissue-sourced biomarkers and literature-sourced biomarkers were required to have evidence of previous detection in blood. The tissue (217) and literature (319) candidates overlapped by 148 proteins, resulting in a list of 388 protein candidates.
Development of SRM Assays. Standard synthetic peptide techniques were used to develop a 371-protein multiplexed SRM assay from the 388 protein candidates. For 17 of the candidates, appropriate synthetic peptides could not be developed or confidently identified. The 371 SRM assays were applied to plasma samples from patients with pathologically confirmed benign nodules and pathologically confirmed malignant lung nodules to determine how many of the 371 proteins could be detected in plasma. A total of 190 SRM assays were able to detect their target proteins in plasma (51% success rate). This success rate (51%) compares very favorably to similar efforts (16%) to develop large scale SRM assays for the detection of diverse cancer markers in blood. Of the 190 proteins detected in blood, 114 were derived from the tissue-sourced candidates and 167 derived from the literature-sourced candidates (91 protein overlap). It is conjectured that the 49% of candidate proteins not detected in blood were present, but below the level of detection of the technology.
Classifier Discovery. A summary of the features of the 143 samples used for classifier discovery appears in Table 29. Samples were obtained from three clinical sites to avoid overfitting to a single clinical site. Participating clinical sites were Institut Universitaire de Cardiologie et de Pneumologie de Quebec (IUCPQ), New York University (NYU) and University of Pennsylvania (UPenn). All samples were selected to be consistent with intended use, specifically, having nodule size 30 mm or less. Cancer and benign samples were pathologically confirmed.
TABLE-US-00029 TABLE 29 Clinical characteristics of subjects and nodules in the discovery and validation studies Cancer Benign Cancer Benign n n p value n n p value Characteristics Discovery Study Validation Study Subjects 72 71 52 52 Age (year)* 65 (59-72) 64 (52-71) 0.46.sup..dagger. 63 (60-73) 62 (56-67) 0.03.sup..dagger. Gender 1.00.sup..dagger-dbl. 0.85.sup..dagger-dbl. Male 29 28 25 27 Female 43 43 27 25 Smoking History Status 0.006.sup..dagger-dbl. 0.006.sup..dagger-dbl. Never.sup..sctn. 5 19 3 15 Former 60 44 38 29 Current 6 6 11 7 No Data 1 2 0 1 Pack-Year*.sup. 37 (20-52) 20 (0-40) 0.001.sup..dagger. 40 (19-50) 27 (0-50) 0.09.sup..dagger. Nodules Size (mm)* 13 (10-16) 13 (10-18) 0.69.sup..dagger. 16 (13-20) 15 (12-22) 0.68.sup..dagger. Source 1.00.sup..dagger-dbl. 0.89.sup..dagger-dbl. IUCPQ.sup..parallel. 14 14 13 12 New York 29 28 6 9 Pennsylvania 29 29 14 13 Vanderbilt 0 0 19 18 Histopathology Benign Diagnosis Granuloma -- 48 -- 26 Hamartoma -- 9 -- 6 Scar -- 2 -- 2 Other** -- 12 -- 18 Cancer Diagnosis Adenocarcinoma 41 -- 25 -- Squamous Cell 3 -- 15 -- Large Cell 0 -- 2 -- Bronchioloalveolar 3 -- 0 -- (BAC) Adenocarcinoma/BAC 21 -- 5 -- Other.sup..dagger..dagger. 4 -- 5 -- *Data shown are median values with quartile ranges indicated in parentheses. .sup..dagger.Mann-Whitney test. .sup..dagger-dbl.Fisher's exact test. .sup..sctn.A never smoker is defined as an individual who has a lifetime history of smoking less than 100 cigarettes. .sup. A pack-year is defined as the product of the total number of years of smoking and the average number of packs of cigarettes smoked daily. Pack-year data were not available for 4 cancer and 6 benign subjects in the discovery set and 2 cancer and 3 benign subjects in the validation set. .sup..parallel.IUCPQ is the Institute Universitaire de Cardiologie et de Pneumologie de Quebec. **For the discovery study, the Benign Diagnosis "Other" category included: amyloidosis, n = 2; fibroelastic nodule, n = 1; fibrosis, n = 1; hemorrhagic infarct, n = 1; lymphoid aggregate, n = 1; organizing pneumonia, n = 3; pulmonary infarct, n = 1; sclerosing hemangioma, n = 1; and subpleural fibrosis with benign lymphoid hyperplasia, n = 1. For the validation study, the Benign Diagnosis "Other" category included: amyloidosis, n = 1; bronchial epithelial cells, n = 4; bronchiolitis interstitial fibrosis, n = 1; emphysematous lung, n = 1; fibrotic inflammatory lesion, n = 1; inflammation, n = 1; parenchymal intussusception, n = 1; lymphangioma, n = 1; mixed lymphocytes and histiocytes, n = 1; normal parenchyma, n = 1; organizing pneumonia, n = 1; pulmonary infarct, n = 2; respiratory bronchiolitis, n = 1; and squamous metaplasia, n = 1. .sup..dagger..dagger.For the discovery study, the non-small cell lung cancer (NSCLC) Diagnosis "Other" category included: adenocarcinoma squamous cell mixed, n = 1; large cell squamous cell mixed, n = 1; pleomorphic carcinoma, n = 1, and not specified, n = 1. For the validation study, the NSCLC Diagnosis "Other" category included: carcinoid, n = 2; large cell squamous cell mixed, n = 1; and not specified, n = 2.
Benign and cancer samples were paired by matching on age, gender, nodule size and clinical site to avoid bias during SRM analysis and also to ensure that the biomarkers discovered were not markers of age, gender, nodule size or clinical site.
The 371-protein SRM assay was applied to the 143 discovery samples and the resulting transition data were analyzed to derive a 13-protein classifier using a logistic regression model (Table 30). The key step in this refinement (Table 28) was the identification of 36 cooperative proteins of which 21 had robust SRM signal. A protein was deemed cooperative if found more frequently on the best performing panels than expected by chance alone, with the significance determined using the following statistical estimation procedure. Briefly, a million random 10-protein panels were generated and the frequency of each protein among the best performing panels (p value .ltoreq.10.sup.-4) was calculated. These proteins were sampled from the list of 125 proteins reproducibly detected in either benign samples or in cancer samples (see Table 28). Full details of the estimation procedure and the full discovery process are described in Materials and Methods in Example 9. Importantly, the 13-protein classifier was fully defined before validation was performed.
TABLE-US-00030 TABLE 30 The 13-protein logistic regression classifier Constant (.alpha.) equals to 36.16. SEQ Protein ID Coef- (Human) Transition NO ficient LRP1 TVLWPNGLSLDIPAGR_855.00_400.20 15 -1.59 BGH3 LTLLAPLNSVFK_658.40_804.50 8 1.73 COIA1 AVGLAGTFR_446.26_721.40 11 -1.56 TETN LDTLAQEVALLK_657.39_330.20 20 -1.79 TSP1 GFLLLASLR_495.31_559.40 22 0.53 ALDOA ALQASALK_401.25_617.40 7 -0.80 GRP78 TWNDPSVQQDIK_715.85_260.20 23 1.41 ISLR ALPGTPVASSQPR_640.85_841.50 14 1.40 FRIL LGGPEAGLGEYLFER_804.40_913.40 24 0.39 LG3BP VEIFYR_413.73_598.30 25 -0.58 PRDX1 QITVNDLPVGR_606.30_428.30 16 -0.34 FIBA NSLFEYQK_514.76_714.30 26 0.31 GSLG1 IIIQESALDYR_660.86_338.20 27 -0.70
Classifier Validation. A total of 52 cancer and 52 benign samples (Table 29) were used to validate the performance of the 13-protein classifier. All validation samples were from different patients than the discovery samples. In addition, 36% of the validation samples were sourced from a new fourth clinical site, Vanderbilt University (Vanderbilt). A new clinical site participating in the validation study provides greater confidence that the classifier's performance generalizes beyond the discovery study. The remaining validation samples were selected randomly from the discovery sites. Samples were selected to be consistent with intended use and matched as in the discovery study.
The classifier was applied to the validation samples and analyzed (Materials and Methods in Example 9). The performance of the classifier is presented in FIG. 12 in terms of negative predictive value (NPV) and specificity (SPC), as these are the two most clinically relevant measures. NPV is the population-based probability that a nodule predicted to be benign by the classifier is truly benign. As the NPV is representative of the classifier's performance on the intended use population, it can be calculated from the classifier's sensitivity, specificity and the estimated cancer prevalence (20%) in the intended use population. Specificity is the percentage of benign nodules that are predicted to be benign by the classifier. The classifier generates a cancer probability score, ranging from 0 to 1. Any reference value in this range can be defined so that a sample is predicted to be benign if the sample's classifier score is below the reference value, or predicted to be malignant if the sample's classifier score is above the reference value. The reference value used in practice depends primarily on the physician and his/her minimum required NPV. For the purposes of illustration we assume that the NPV requirement is 90%.
At reference value 0.43, the classifier has NPV of 96%+/-4% and specificity of 45%+/-13% on the discovery samples, where 95% confidence intervals are reported. At the same reference value of 0.43, the classifier has NPV of 92%+/-7% and specificity of 27%+/-12% on the validation samples. Table 31 reports the classifier's performance for discovery and validation sample sets and for multiple lung cancer prevalences. For each lung cancer prevalence, the reference value was selected to ensure NPV is 90% or more.
TABLE-US-00031 TABLE 31 Performance of the classifier in discovery and validation at three cancer prevalences Preva- Refer- Sensi- Speci- lence ence tivity ficity NPV PPV Dataset (%) Value (%) (%) (%) (%) Discovery 20 0.43 93 45 96 30 (n = 143) 25 0.37 96 38 96 34 30 0.33 96 34 95 38 Validation 20 0.43 90 27 92 24 (n = 104) 25 0.37 92 23 90 29 30 0.33 94 21 90 34 Vanderbilt 20 0.43 100 28 100 26 (n = 37) 25 0.37 100 22 100 30 30 0.33 100 17 100 34 NPV is negative predictive value. PPV is positive predictive value.
The performance of the 13-protein classifier on validation samples from the new clinical site (Vanderbilt) is a great indicator of the classifier's performance on future samples, and a strong sign that the classifier is not overfit to the three discovery sites. The NPV and specificity on the Vanderbilt samples are 100% and 28%, respectively, at the same reference value 0.43.
FIG. 13 presents the application of the classifier to all 247 discovery and validation samples. FIG. 13 compares the clinical risk factors of smoking (measured in pack years) and nodule size (proportional to the diameter of each circle) to the classifier score assigned to each sample. Nodule size does not appear to increase with the classifier score. Indeed, both large and small nodules are spread across the classifier score spectrum. To quantify this observation, the Pearson correlation between the classifier score and nodule size, smoking history pack-year and age were calculated and found to be insignificant (Table 32). The implication of this observation is remarkable. The classifier provides information on the disease status of a pulmonary nodules that is independent of the three currently used risk factors for malignancy (age, smoking history and nodule size), and thus provides incremental molecular information of great added clinical value. For a similar plot of nodule size vs. classifier score, see FIG. 15.
TABLE-US-00032 TABLE 32 Impact of clinical characteristics on classifier score Continuous Clinical Characteristics Coefficient Sample Pearson of 95% CI* of p-value on Characteristics Group Correlation Linear Fit Coefficient Coefficient Subject Age All 0.190 0.005 (0.002, -0.008) 0.003 Cancer 0.015 0.000 (-0.004, -0.004) 0.871 Benign 0.227 0.005 (0.001, -0.010) 0.012 Smoking All 0.185 0.002 (0.000, -0.003) 0.005 History Cancer 0.089 0.001 (-0.001, -0.002) 0.339 Pack-Years Benign 0.139 0.001 (0.000, -0.003) 0.140 Nodule Size All -0.071 -0.003 (-0.008, -0.002) 0.267 Cancer -0.081 -0.003 (-0.009, -0.003) 0.368 Benign -0.035 -0.001 (-0.008, -0.005) 0.700 Categorical Clinical Characteristics p-value p-value Classifier on on Characteristics Score Cancer Cancer Benign Benign Gender 0.477.dagger. 0.110.dagger. Female Median 0.786 0.479 (quartile range) (0.602-0.894) (0.282-0.721) Male Median 0.815 0.570 (quartile range) (0.705-0.885) (0.329-0.801) Smoking 0.652.dagger-dbl. 0.539.dagger-dbl. History Status Never Median 0.707 0.468 (quartile range) (0.558-0.841) (0.317-0.706) Past Median 0.804 0.510 (quartile range) (0.616-0.892) (0.289-0.774) Current Median 0.790 0.672 (quartile range) (0.597-0.876) (0.437-0.759)
The Molecular Foundations of the Classifier. To address the biological relevance of the 13 classifier proteins, they were submitted for pathway analysis using IPA (Ingenuity Systems). It is identified that the transcription regulators most likely to cause a modulation of these 13 proteins. Using standard IPA analysis parameters, the four most significant (see Materials and Methods in Example 9) nuclear transcription regulators were FOS (proto-oncogene c-Fos), NF2L2 (nuclear factor erythroid 2-related factor 2), AHR (aryl hydrocarbon receptor) and MYC (myc proto-oncogene protein). These proteins regulate 12 of the 13 classifier proteins, with ISLR being the exception (see below).
FOS is common to many forms of cancer. NF2L2 and AHR are associated with lung cancer, oxidative stress response and lung inflammation. MYC is associated with lung cancer and oxidative stress response. These four transcription regulators and the 13 classifier proteins, collectively, are also highly associated (p-value 1.0e-07) with the same three biological networks, namely, lung cancer, lung inflammation and oxidative stress response. This is summarized in FIG. 14 where the classifier proteins (green), transcription regulators (blue) and the three merged networks (orange) are depicted. Only ISLR (Immunoglobulin superfamily containing leucine-rich repeat protein) is not connected through these three networks to other classifier proteins, although it is connected through cancer networks not specific to lung. In summary, the modulation of the 13 classifier proteins can be linked back to a few transcription regulators highly associated with lung cancer, lung inflammation and oxidative stress response networks; three biological processes reflecting aspects of lung cancer.
The present invention distinguishes itself in multiple ways. First, the performance of the 13-protein classifier achieves intended use performance requirements with NPV (and sensitivity) of at least 90% or higher in validation, across multiple prevalence estimates (see Table 31). Second, intended use population samples (nodule size 30 mm or less and/or Stage IA) were used in discovery and validation, in contrast to prior studies where non-intended use samples ranging from Stage I to Stage IV were used. In some cases, nodule size information was not disclosed in prior work. Third, the 13-protein classifier was demonstrated to provide a score that is independent of the currently used cancer risk parameters of nodule size, smoking history and age.
The utilization of SRM technology enables global interrogation of proteins associated with lung cancer processes in contrast to technologies such as those that multiplex antibodies where it is often not feasible to multiplex hundreds of candidate markers for a specific disease.
Clinical Study Designs. The design and conduct of biomarker studies is necessarily impacted by the eventual intended use population and performance requirements for the clinical test. Emerging guidelines help in the design of studies that have greater chance of translating into clinical impact. In the design of the discovery and validation studies presented here, four requirements were especially important. First, conducting a multiple clinical site discovery study enabled us to determine those proteins robust to variations introduced by differences in site-to-site sample processing and management, as well as from any biological differences in the populations being served by the different site hospitals. Such a design is critical as site-to-site sources of variations can often exceed biological signal. Second, utilizing intended use samples, as defined by age, smoking history and nodule size, in discovery and validation phases enabled us to obtain a realistic estimate of the performance envelop of the classifier. Third, careful matching of cancer and benign cohorts on age, gender, nodule size and clinical site was critical in not only avoiding bias, but in the discovery and validation of a classifier that provides a score independent of these clinical factors as well as smoking history. Fourth, validation samples were from different patients than the discovery samples. Furthermore, 36% of the validation samples were from an entirely new clinical site, a critical validation step to show that results are not overfit to the sites used in the discovery phase. Performance on samples from the new clinical site was exceptionally high (NPV of 100%, specificity of 28%), yielding a high level of confidence in the performance of the test in clinical practice.
Systems Biology and Blood Signatures. The integration of a systems biology approach to biomarker discovery with SRM technology enabled the simultaneous exploration of a large number of lung cancer relevant proteins, resulting in a highly sensitive classifier. The systems approach employed several strategies.
First, proteins secreted or shed from the cell surface of lung cancer cells were identified (i.e. tissue-sourced) as these are likely lung cancer perturbed proteins to be detected in blood. Of the classifier's 13 proteins, seven were tissue-sourced, demonstrating that tissue-sourcing is an effective method for prioritizing proteins for SRM assay development.
A second systems driven approach was the identification of the most cooperative protein biomarkers. Cooperative proteins are those that may not be the best individual performers but appear frequently on high performance panels. Motivating this approach is the desire to derive a classifier with multiple proteins from multiple lung cancer associated networks. By monitoring multiple proteins and networks, it was expected that the classifier would be highly sensitive to the circulating signature of a malignant nodule, as demonstrated in validation.
There are two confirmations of the effectiveness of the cooperative protein approach. A pathway analysis demonstrated that the classifier proteins are likely modulated by a small number of transcription regulators (AHR, NF2L2, MYC, FOS) highly associated with lung cancer, lung inflammation and oxidative stress response networks/processes. Chronic lung inflammation and oxidative stress response are both linked to NSCLC development. A strength of the classifier is that it monitors multiple proteins from these multiple lung cancer associated processes. This multiple protein, multiple process survey accounts for the high sensitivity of the classifier for detecting the circulating signature emitted by malignant nodules, and so, high NPV when the classifier calls a nodule benign.
The second validation of the cooperative approach is a direct comparison to traditional biomarker strategies. Typically, proteins are shortlisted in the discovery process by filtering on individual diagnostic performance. To contrast the difference between filtering proteins based on strong individual performance as opposed to frequency on high performance panels, we calculated a p-value for each protein using the Mann-Whitney non-parametric test. Only 2 of the 36 cooperative proteins had a p-value below 0.05, a commonly used significance threshold for measuring individual performance. More importantly, we derived a "p-classifier" using the same steps for the 13-protein classifier derivation (see Table 28 and Materials and Methods in Example 9) except that the Mann Whitney p-value was used in place of cooperative score. The p-classifier achieved NPV 96% and specificity 18% in discovery and NPV 91% and specificity 19% in validation as compared to the 13-protein classifier performance of NPV 96% and specificity 45% in discovery and NPV 92% and specificity 27% in validation. Note that the reference value thresholds were selected to ensure NPV of at least 90%. Hence, we expect similar high NPV performance between the 13-protein cooperative classifier and the p-classifier. Specificity is the performance measure where a comparison can be made. This is where a significant drop in performance from the 13-protein cooperative classifier to the p-classifier is observed. This confirms that the best individual protein performers are not necessarily the best proteins for classifiers
Most Informative Proteins. Which proteins in the classifier are most informative? To answer this question all possible classifiers were constructed from the set of robust cooperative proteins and their performance measured. The frequency of each protein among the 100 best performing panels was determined. Four proteins (LRP1, COIA1, ALDOA, LG3BP) were highly enriched with 95% of the 100 best classifiers having at least three of these four proteins (p-value <1.0e-100). Seven of eight proteins (LRP1, COIA1, ALDOA, LG3BP, BGH3. PRDX1, TETN, ISLR) appeared together on over half of all the best classifiers (p-value <1.0e-100). Note that the 13-protein classifier contains additional proteins as they further increase performance, likely by measuring proteins in the same three lung cancer networks (lung cancer, lung inflammation and oxidative stress). The conclusion is that high performance panels of cooperative proteins for pulmonary nodule characterization are similar in composition to one another with a preference for a set of particularly informative (cooperative) proteins.
In summary, by integrating systems biology strategies for biomarker discovery (tissue-sourced candidates with cancer relevance, cooperative proteins, multiple proteins from multiple lung cancer associated networks), enabling technologies (SRM for global proteomic interrogation) and clinical focus (designing studies for intended use), this invention identifies a 13-protein proteomic classifier that provides molecular insight into the disease status of pulmonary nodules.
Example 9: Materials and Methods
Identification of Candidate Plasma Proteins. Two approaches were employed to identify candidate proteins for a lung cancer classifier, including analysis of the proteome of lung tissues with a histopathologic diagnosis of NSCLC and a search of literature databases for lung cancer-associated proteins. All candidate proteins were also assessed for evidence of blood circulation and satisfied one or more requirement(s) for the evidence.
Analysis of Plasma Samples Using SRM-MS. Briefly, the protocol for SRM-MS analysis of plasma aliquots included immunodepletion on IgY14-Supermix resin columns (Sigma) of medium- and high-abundance proteins, denaturation, trypsin digestion, and desalting, followed by reversed-phase liquid chromatography and SRM-MS analysis of the obtained peptide samples.
Development of SRM Assays. SRM assays for candidate proteins were developed based on synthetic peptides, as previously described. After identification and synthesis of up to five suitable peptides per protein, SRM triggered MS/MS spectra were collected on a 5500 QTrap.RTM. mass spectrometer for both doubly and triply charged precursor ions. The obtained MS/MS spectra were assigned to individual peptides using MASCOT and with a minimum cutoff score of 15. Up to four transitions per precursor ion were then selected for optimization. The resulting corresponding optimal retention time, declustering potential and collision energy were assembled for all transitions. Optimal transitions were measured on a mixture of all synthetic peptides and on two pooled plasma samples, each obtained from ten subjects with either benign or malignant, i.e. NSCLC, lung nodules at the Institut Universitaire de Cardiologie et de Pneumologie de Quebec (IUCPQ, Quebec, Canada). All subjects provided informed consent and contributed biospecimens in studies approved by the institution's Ethics Review Board (ERB). Plasma samples were processed as described above. Batches of 1750 transitions were analyzed by SRM-MS, with SRM-MS data manually reviewed to select the two best peptides per protein and the two best transitions per peptide. The intensity ratio, defined as the ratio between the intensities of the two best transitions of a peptide in the synthetic peptide mixture, was used to assess the specificity of the transitions in a biological sample. Transitions demonstrating interference with other transitions were not selected. A method to ensure the observed transitions corresponded to the peptides and proteins they were intended to measure was developed. In particular, 93% of peptide transitions developed had an error rate below 5%.
Discovery Study Design. A retrospective, multi-center, case-control study was performed using archival K2-EDTA plasma aliquots previously obtained from subjects who provided informed consent and contributed biospecimens in studies approved by the Ethics Review Board (ERB) or the Institutional Review Boards (IRB) at the IUCPQ or New York University (New York, N.Y.) and the University of Pennsylvania (Philadelphia, Pa.), respectively. In addition, plasma samples were provided by study investigators after review and approval of the sponsor's study protocol by the respective institution's ERB or IRB, as required. Sample eligibility for the proteomic analysis was based on the satisfaction of the study inclusion and exclusion criteria, including the subject's demographic information; the subject's corresponding lung nodule radiographic characterization by chest CT scan and a maximal linear dimension of 30 mm; and the histopathology of the lung nodule obtained at the time of diagnostic surgical resection, i.e. either NSCLC or a benign, i.e. non-malignant, process. Each cancer-benign sample pair was matched, as much as possible among eligible samples, by gender, nodule size (.+-.10 mm), age (.+-.10 years), smoking history pack-years (.+-.20 pack-years), and by center. Independent monitoring and verification of the clinical data associated with both the subject and lung nodule were performed in accordance with the guidance established by the Health Insurance Portability and Accountability Act (HIPAA) of 1996 to ensure subject privacy. The study was powered with a probability of 92% to detect 1.5 fold differences in protein abundance between malignant and benign lung nodules.
Logistic Regression Model. The logistic regression classification method was used to combine a panel of transitions into a classifier and to calculate a classification probability score between 0 and 1 for each sample. The probability score (P.sub.s) of a sample was determined as P.sub.s=1/[1+exp(-.alpha.-.SIGMA..sub.i=1.sup.N.beta..sub.i*{hacek over (I)}.sub.i,s)], (1) where {hacek over (I)}.sub.i,s was the logarithmically transformed (base 2), normalized intensity of transition i in sample s, .beta..sub.i was the corresponding logistic regression coefficient, .alpha. was a classifier-specific constant, and N was the total number of transitions in the classifier. A sample was classified as benign if P.sub.s was less than a reference value or cancer otherwise. The reference value can be increased or decreased depending on the desired NPV. To define the classifier, the panel of transitions (i.e. proteins), their coefficients, the normalization transitions, classifier coefficient .alpha. and the reference value must be learned (i.e. trained) from the discovery study and then confirmed using the validation study.
Lung Nodule Classifier Development. The goal of the discovery study was to derive a multivariate classifier with a target performance sufficient for clinical utility in the intended use population, i.e. a classifier having an NPV of 90% or higher. This goal was incorporated in the data analysis strategies. The classifier development included the following: normalization and filtering of raw SRM-MS data; identification of candidate proteins that occurred with a high frequency in top-performing panels; evaluation of candidate proteins based on SRM-MS signal quality; selection of candidate proteins for the final classifier based on their stability in performance; and training to a logistic regression model to derive the final classifier. Table 28 provides a summary overview of the primary steps.
Normalization of raw SRM-MS data was performed to reduce sample-to-sample intensity variations using a panel of six endogenous proteins. After data normalization, SRM-MS data were filtered down to transitions having the highest intensities of the corresponding proteins and satisfying the criterion for detection in a minimum of 50% of the cancer or 50% of the benign samples. A total of 125 proteins satisfied these criteria of reproducible detection. Missing values were replaced by half the minimum detected values of the corresponding transitions in all samples.
Remaining transitions were then used to identify proteins, defined as cooperative proteins, that occurred with high frequency on top-performing protein panels. The cooperative proteins were derived using the following estimation procedure as it is not computational feasible to evaluate the performance of all possible protein panels.
Monte Carlo cross validation (MCCV) (36) was performed on 1.times.10.sup.6 panels, each panel comprised of 10 randomly selected proteins and fitted to a logistic regression model, as described above, using a 20% holdout rate and 10.sup.2 sample permutations. The receiver operating characteristic (ROC) curve of each panel was generated and the corresponding partial area under the ROC curve (AUC) but above the boundary of sensitivity being 90%, defined as the partial AUC (37, 38), was used to assess the performance of the panel. By focusing on the performance of individual panels at high sensitivity region, the partial AUC allows for the identification of panels with high and reliable performance on NPV. The candidate proteins that occurred in the top 100 performing panels with a frequency greater than that expected by chance were identified as cooperative proteins. For each protein the cooperative score is defined as its frequency on the 100 high performance panels divided by the expected frequency. Highly cooperative proteins had a score of 1.75 or higher (the corresponding one-sided p value <0.05) while non-cooperative proteins had a score of 1 or less. Note that one million panels were sampled to ensure that the 100 top performing panels were exceptional (empirical p value .ltoreq.10.sup.-4). In addition, panels of size 10 were used in this procedure based on empirical evidence that larger panels did not change the resulting list of cooperative proteins. We also wanted to avoid overfitting the logistic regression model. In total, 36 cooperative proteins were identified, including 15 highly cooperative proteins.
Raw chromatograms of all transitions of cooperative proteins were then manually reviewed. Proteins with low signal-to-noise ratios and/or showing evidence of any interference were removed from further consideration for the final classifier. In total, 21 cooperative and robust proteins were identified.
Remaining candidate proteins were then evaluated in an iterative, stepwise procedure to derive the final classifier. In each step, MCCV was performed using a holdout rate of 20% and 104 sample permutations to train the remaining candidate proteins to a logistic regression model and to assess the variability, i.e. stability, of the coefficient derived for each protein by the model. The protein having the least stable coefficient was identified and removed. Proteins for the final classifier were identified when the corresponding partial AUC was optimal. Seven of the 13 proteins in the final classifier were highly cooperative.
Proteins in the final classifier were further trained to a logistic regression model by MCCV with a holdout rate of 20% and 2.times.10.sup.4 sample permutations.
Lung Nodule Classifier Validation. The design of the validation study was identical to that of the discovery study, but involved K2-EDTA plasma samples associated with independent subjects and independent lung nodules not evaluated in the discovery study. Additional specimens were obtained from Vanderbilt University (Nashville, Tenn.) with similar requirements for patient consent, IRB approval, and satisfaction of HIPAA requirements. Of the 104 total cancer and benign samples in the validation study, half were analyzed immediately after the discovery study, while the other half was analyzed later. The study was powered to observe the expected 95% confidence interval (CI) of NPV being 90.+-.8%.
The raw SRM-MS dataset in the validation study was normalized in the same way as the discovery dataset. Variability between the discovery and the validation studies was mitigated by utilizing human plasma standard (HPS) samples in both studies as external calibrator. Missing data in the validation study were then replaced by half the minimum detected values of the corresponding transitions in the discovery study. Transition intensities were applied to the logistic regression model of the final classifier learned previously in the training phase, from which classifier scores were assigned to individual samples. The performance of the lung nodule classifier on the validation samples was then assessed based on the classifier scores.
IPA Pathway Analysis. Standard parameters were used. Specifically, in the search for nuclear transcription regulators, requirements were p-value <0.01 with a minimum of 3 proteins modulated. Significance was determined using a right-tailed Fisher's exact test using the IPA Knowledge Database as background.
Candidate Biomarker Identification.
Candidate Biomarkers Identified by Tissue Proteomics. Specimens of resected NSCLC (adenocarcinoma, squamous cell and large cell) lung tumors and non-adjacent normal tissue in the same lobe were obtained from patients who provided informed consent in studies approved by the Ethics Review Boards at the Centre Hospitalier de l'Universite de Montreal and the McGill University Health Centre.
The proteomic analyses of lung tumor tissues targeted membrane-associated proteins on endothelial cells (adenocarcinoma, n=13; squamous cell, n=18; and large cell, n=7) and epithelial cells (adenocarcinoma, n=19; squamous cell, n=6; and large cell, n=5), and those associated with the Golgi apparatus (adenocarcinoma, n=13; squamous cell, n=15; and large cell, n=5).
Membrane proteins from endothelial cells or epithelial cells and secreted proteins were isolated from normal or tumor tissues from fresh lung resections after washing in buffer and disruption with a Polytron to prepare homogenates. The cell membrane protocol included filtration using 180 .mu.m mesh and centrifugation at 900.times.g for 10 min at 4.degree. C., supernatants prior to layering on 50% (w:v) sucrose and centrifugation at 218,000.times.g for 1 h at 4.degree. C. to pellet the membranes. Membrane pellets were resuspended and treated with micrococcal nuclease, and incubated with the following antibodies specified by plasma membrane type: endothelial membranes (anti-thrombomodulin, anti-ACE, anti-CD34 and anti-CD144 antibodies); epithelial membranes (anti-ESA, anti-CEA, anti-CD66c and anti-EMA antibodies), prior to centrifugation on top of a 50% (w:v) sucrose cushion at 280,000.times.g (endothelial) or 218,000.times.g (epithelial) for 1 h at 4.degree. C. After pellet resuspension, plasma membranes were isolated using MACS microbeads. Endothelial plasma membranes were treated with KI to remove cytoplasmic peripheral proteins. The eluate of epithelial plasma membranes was centrifuged at 337,000.times.g for 30 min at 4.degree. C. over a 33% (w:v) sucrose cushion, with resuspension of the pellet in Laemmli/Urea/DTT after removal of the supernatant and sucrose cushion.
To isolate secreted tissue proteins, the density of the tissue homogenates (prepared as described above) was adjusted to 1.4 M sucrose prior to isolating the secretory vesicles by isopycnic centrifugation at 100,000.times.g for 2 h at 4.degree. C. on a 0.8 and 1.2 M discontinuous sucrose gradient. Vesicles concentrating at the 0.8/1.2 M interface were collected and further incubated for 25 min with 0.5 M KCl to remove loosely bound peripheral proteins. Vesicles were recuperated by ultracentrifugation at 150,000.times.g for 1 h at 4.degree. C. and then opened with 100 mM (NH.sub.4)HCO.sub.3 (pH 11.0) for 30 min at 4.degree. C. Secreted proteins were recovered in the supernatant following ultracentrifugation at 150,000.times.g for 1 h at 4.degree. C.
Membrane or secreted proteins were then analyzed by CellCarta.RTM. (Caprion, Montreal, Quebec) proteomics platform, including digestion by trypsin, separation by strong cation exchange chromatography, and analysis by reversed-phase liquid chromatography coupled with electrospray tandem mass spectrometry (MS/MS). Peptides in the samples were identified by database searching of MS/MS spectra using MASCOT and quantified by a label-free approach based on their signal intensity in the samples, similar to those described in the literature. Proteins whose tumor-to-normal abundance ratio was either .gtoreq.1.5 or .ltoreq.2/3 were then identified as candidate biomarkers.
Candidate Biomarkers Identified by Literature Searches. Automated literature searches using predefined terms and automated PERL scripts were performed on the following databases: UniProt on May 6, 2010, Entrez, NBK3836 on May 17, 2010, and NextBio on Jul. 8, 2010. Biomarker candidates were compiled and mapped to UniProt identifiers using the UniProt Knowledge Base.
Presence of Candidate Biomarkers in the Blood. The tissue- and literature-identified biomarker candidates were required to demonstrate documented evidence in the literature or a database as a soluble or solubilized circulating protein. The first criterion was evidence by mass spectrometry detection, with a candidate designated as previously detected by the following database-specific criteria: a minimum of 2 peptides in HUPO9504, which contains 9,504 human proteins identified by MS/MS; a minimum of 1 peptide in HUPO889, which is a higher confidence subset of HUPO9504 containing 889 human proteins; or at least 2 peptides in Peptide Atlas (November 2009 build). The second criterion was annotation as either a secreted or single-pass membrane protein in UniProt. The third criterion was designation as a plasma protein in the literature. The fourth criterion was prediction as a secreted protein based on the use of various programs: prediction by TMHMM as a protein with one transmembrane domain, which however is cleaved based on prediction by SignalP; or prediction by TMHMM as having no transmembrane domain and prediction by either SignalP or SecretomeP as a secreted protein. All candidate proteins satisfied one or more of the criteria.
Study Designs and Power Analyses.
Sample, Subject and Lung Nodule Inclusion and Exclusion Criteria. The inclusion criteria for plasma samples were collection in EDTA-containing blood tubes; obtained from subjects previously enrolled in the Ethics Review Board (ERB) or the Institutional Review Boards (IRB) approved studies at the participating institutions; and archived, e.g. labeled, aliquoted and frozen, as stipulated by the study protocols.
The inclusion criteria for subjects were the following: age .gtoreq.40; any smoking status, e.g. current, former, or never; any co-morbid conditions, e.g. chronic obstructive pulmonary disease (COPD); any prior malignancy with a minimum of 5 years in clinical remission; any prior history of skin carcinomas, e.g. squamous or basal cell. The only exclusion criterion was prior malignancy within 5 years of lung nodule diagnosis.
The inclusion criteria for the lung nodules included radiologic, histopathologic and staging parameters. The radiologic criteria included size .gtoreq.4 mm and .ltoreq.30 mm, and any spiculation or ground glass opacity. The histopathologic criteria included either diagnosis of malignancy, e.g. non-small cell lung cancer (NSCLC), including adenocarcinoma (and bronchioloalveolar carcinoma (BAC), squamous, or large cell, or a benign process, including inflammatory (e.g. granulomatous, infectious) or non-inflammatory (e.g. hamartoma) processes. The clinical staging parameters included: primary tumor: .ltoreq.T1 (e.g. 1A and 1B); regional lymph nodes: N0 or N1 only; distant metastasis: M0 only. The exclusion criteria for lung nodules included the following: nodule size data unavailable; no pathology data available, histopathologic diagnosis of small cell lung cancer; and the following clinical staging parameters: primary tumor: .gtoreq.T2, regional lymph nodes: .gtoreq.N2, and distant metastasis: .gtoreq.M1.
Sample Layout. Up to 15 paired samples per batch were assigned randomly and iteratively to experimental processing batches until no statistical bias was demonstrable on age, gender or nodule size. Paired samples within each processing batch were further randomly and repeatedly assigned to positions within the processing batch until the absolute values of the corresponding Pearson correlation coefficients between position and age, gender and nodule size were less than 0.1. Each pair of cancer and benign samples was then randomized to their relative positions in the batch. To provide a positive control for quality assessment, three 200 .mu.l aliquots of a pooled human plasma standard (HPS) (Bioreclamation, Hicksville, N.Y.) were positioned at the beginning, middle and end of each processing batch, respectively. Samples within a batch were analyzed together: sequentially during immunodepletion and SRM-MS analysis but in parallel during denaturing, digestion, and desalting.
Power Analysis for the Classifier Discovery Study. The power analysis for the discovery study was based on the following assumptions: (A) The overall false positive rate (.alpha.) was set to 0.05. (B) idak correction for multiple testing was used to calculate the effective .alpha..sub.eff for testing 200 proteins, i.e.
.alpha..alpha. ##EQU00009## (C) The effective sample size was reduced by a factor of 0.864 to account for the larger sample requirement for the Mann-Whitney test than for the t-test (13). (D) The overall coefficient of variation was set to 0.43 based on a previous experience. (E) The power (1-.beta.) of the study was calculated based on the formula for the two-sample, two-sided t-test, using effective .alpha..sub.eff and effective sample size.
Power Analysis for the Classifier Validation Study. Sufficient cancer and benign samples are needed in the validation study to confirm the performance of the lung nodule classifier obtained from the discovery study. We are interested in obtaining the 95% confidence intervals (CIs) on NPV and specificity for the classifier. Assuming the cancer prevalence of lung nodules is prev, the negative predictive value (NPV) and the positive predictive value (PPV) of a classifier on the patient population with lung nodules were calculated from sensitivity (sens) and specificity (spec) as follows:
.times..times..times..times..times..times..times..times..times..times..ti- mes..times. ##EQU00010## Using Eq. (S1) above, one can derive sensitivity as a function of NPV and specificity, i.e.
.times..times..times..times..times..times..times..times..times..times..ti- mes..times. ##EQU00011## Assume that the validation study contains N.sub.C cancer samples and N.sub.B benign samples. Based on binomial distribution, variances of sensitivity and specificity are given by var(sens)=sens*(1-sens)/N.sub.C (S4) var(spec)=spec*(1-spec)/N.sub.B (S5) Using Eqs. (S1, S2) above, the corresponding variances of NPV and PPV can be derived under the large-sample, normal-distribution approximation as
.function..times..times..times..times..times..times..times..times..functi- on..times..times..times..times..function..function..function..function..ti- mes..times..times..times..times..times..times..times..function..times..tim- es..times..times..function..function..function. ##EQU00012## The two-sided 95% CIs of sensitivity, specificity, NPV and PPV are then given by .+-.z.sub..alpha./2 {square root over (var(sens))},.+-.z.sub..alpha./2 {square root over (var(spec))},.+-.z.sub..alpha./2 {square root over (var(NPV))} and .+-.z.sub..alpha./2 {square root over (var(PPV))}, respectively, where z.sub..alpha./2=1.959964 is the 97.5% quantile of the normal distribution.
EXPERIMENTAL PROCEDURES
Immunoaffinity Chromatography. An immunoaffinity column was prepared by adding 10 ml of a 50% slurry containing a 2:1 ratio of IgY14 and SuperMix resins (Sigma Aldrich), respectively, to a glass chromatography column (Tricorn, GE Healthcare) and allowed to settle by gravity, yielding a 5 ml volume of resin in the column. The column was capped and placed on an HPLC system (Agilent 1100 series) for further packing with 0.15 M (NH.sub.4)HCO.sub.3 at 2 ml/min for 20 min, with performance assessed by replicate injections of HPS aliquots. Column performance was assessed prior to immunoaffinity separation of each sample batch.
To isolate low abundance proteins, 60 .mu.l of plasma were diluted in 0.15M (NH.sub.4)HCO.sub.3 (1:2 v/v) to a 180 .mu.l final volume and filtered using a 0.2 .mu.m AcroPrep 96-well filter plate (Pall Life Sciences). Immunoaffinity separation was conducted on a IgY14-SuperMix column connected to an HPLC system (Agilent 1100 series) using 3 buffers (loading/washing: 0.15 M (NH.sub.4)HCO.sub.3; stripping/elution: 0.1 M glycine, pH 2.5; and neutralization: 0.01 M Tris-HCl and 0.15 M NaCl, pH 7.4) with a cycle comprised of load, wash, elute, neutralization and re-equilibration lasting 36 min. The unbound and bound fractions were monitored at 280 nm and were baseline resolved after separation. Unbound fractions (containing the low abundance proteins) were collected for downstream processing and analysis, and lyophilized prior to enzymatic digestion.
Enzymatic Digestion and Solid-Phase Extraction. Lyophilized fractions containing low abundance proteins were digested with trypsin after being reconstituted under mild denaturing conditions in 200 .mu.l of 1:1 0.1 M (NH.sub.4)HCO.sub.3/trifluoroethanol (TFE) (v/v) and then allowed to incubate on an orbital shaker for 30 min at RT. Samples were diluted in 800 .mu.l of 0.1 M (NH.sub.4)HCO.sub.3 and digested with 0.4 .mu.g trypsin (Princeton Separations) per sample for 16 h at 37.degree. C. and lyophilized. Lyophilized tryptic peptides were reconstituted in 350 .mu.l of 0.01 M (NH.sub.4)HCO.sub.3 and incubated on an orbital shaker for 15 min at RT, followed by reduction using 30 .mu.l of 0.05 M TCEP and incubation for 1 h at RT and dilution in 375 .mu.l of 90% water/10% acetonitrile/0.2% trifluoroacetic acid. The extraction plate (Empore C18, 3M Bioanalytical Technologies) was conditioned according to the manufacturer's protocol, and after sample loading were washed in 500 .mu.l of 95% water/5% acetonitrile/0.1% trifluroacetic acid and eluted by 200 .mu.l of 52% water/48% acetonitrile/0.1% trifluoroacetic acid into a collection plate. The eluate was split into 2 equal aliquots and was taken to dryness in a vacuum concentrator. One aliquot was used immediately for mass spectrometry, while the other was stored at -80.degree. C. Samples were reconstituted in 12 .mu.l of 90% water/10% acetonitrile/0.2% formic acid just prior to LC-SRM MS analysis.
SRM-MS Analysis. Peptide samples were separated using a capillary reversed-phase LC column (Thermo BioBasic 18 KAPPA; column dimensions: 320 .mu.m.times.150 mm; particle size: 5 .mu.m; pore size: 300 .ANG.) and a nano-HPLC system (nanoACQUITY, Waters Inc.). The mobile phases were (A) 0.2% formic acid in water and (B) 0.2% formic acid in acetonitrile. The samples were injected (8 .mu.l) and separated using a linear gradient (98% A to 70% A) at 5 .mu.l/minute for 19 min. Peptides were eluted directly into the electrospray source of the mass spectrometer (5500 QTrap LC/MS/MS, AB Sciex) operating in scheduled SRM positive-ion mode (Q1 resolution: unit; Q3 resolution: unit; detection window: 180 seconds; cycle time: 1.5 seconds). Transition intensities were then integrated by software MultiQuant (AB Sciex). An intensity threshold of 10,000 was used to filter out non-specific data and undetected transitions.
Normalization and Calibration of Raw SRM-MS Data.
Definition of Depletion Column Drift. Due to changes in observed signal intensity after repetitive use of each immunoaffinity column, the column's performance was assessed by quantifying the transition intensity in the control HPS samples. Assuming I.sub.i,s was the intensity of transition i in an HPS sample s, the drift of the sample was defined as
.times..times. ##EQU00013## where I.sub.i was the mean value of I.sub.i,s among all HPS samples that were depleted by the same column, and the median was taken over all detected transitions in the sample. The column variability, or drift, was defined as drift.sub.col=median(drift.sub.s>0)-median(drift.sub.s<0). (S9) Here the median was taken over all HPS samples depleted by the column. If no sample drift were greater or less than zero, the corresponding median was taken as 0. The median column drift was the median of drifts of all depletion columns used in the study.
Identification of Endogenous Normalizing Proteins. The following criteria were used to identify a transition of a normalization protein: (A) possession of the highest median intensity of all transitions from the same protein; (B) detected in all samples; (C) ranking high in reducing median technical coefficient of variation (CV), i.e. median CV of transition intensities that were measured on HPS samples, as a normalizer; (D) ranking high in reducing median column drift that was observed in sample depletion; and (E) possession of low median technical CV and low median biological CV, i.e. median CV of transition intensities that were measured on clinical samples. Six endogenous normalizing proteins were identified and are listed in Table 33.
TABLE-US-00033 TABLE 33 List of endogenous normalizing proteins Median Median Normalizing SEQ ID Technical CV Column Drift Protein Transition NO (%) (%) PEDF_HUMAN LQSLFDSPDFSK_692.34_593.30 28 25.8 6.8 MASP1_HUMAN TGVITSPDFPNPYPK_816.92_258.10 6 26.5 18.3 GELS_HUMAN TASDFITK_441.73_710.40 5 27.1 16.8 LUM_HUMAN SLEDLQLTHNK_433.23_499.30 29 27.1 16.1 C163A_HUMAN INPASLDK_429.24_630.30 30 26.6 14.6 PTPRJ_HUMAN VITEPIPVSDLR_669.89_896.50 31 27.2 18.2 Normalization by Panel of 25.1 9.0 Transitions Without Normalization 32.3 23.8
Normalization of Raw SRM-MS Data. Six normalization transitions were used to normalize raw SRM-MS data to reduce sample-to-sample intensity variations within same study. A scaling factor was calculated for each sample so that the intensities of the six normalization transitions of the sample were aligned with the corresponding median intensities of all HPS samples. Assuming that N.sub.i,s is the intensity of a normalization transition i in sample s and {circumflex over (N)}.sub.i the corresponding median intensity of all HPS samples, then the scaling factor for sample s is given by S/S.sub.s, where
.times..times..times. ##EQU00014## is the median of the intensity ratios and S is the median of S.sub.s over all samples in the study. Finally, for each transition of each sample, its normalized intensity was calculated as .sub.i,s=I.sub.i,s*S/S.sub.s (S11) where I.sub.i,s was the raw intensity.
Calibration by Human Plasma Standard (HPS) Samples. For a label-free MS approach, variation on signal intensity between different experiments is expected. To reduce this variation, we utilized HPS samples as an external standard and calibrated the intensity between the discovery and validation studies. Assume that {hacek over (I)}.sub.i,s is the logarithmically transformed (base 2), normalized intensity of transition i in sample s, {hacek over (I)}.sub.i,dis and {hacek over (I)}.sub.i,val are the corresponding median values of HPS samples in the discovery and the validation studies, respectively. Then the HPS corrected intensity is .sub.i,s= .sub.i,s- .sub.i,val+ .sub.i,dis (S12)
Calculation of q-Values of Peptide and Protein Assays. In the development of SRM assays, it is important to ensure that the transitions detected correspond to the peptides and proteins they were intended to measure. Computational tools such as mProphet (15) enable automated qualification of SRM assays. We introduced a complementary strategy to mProphet that does not require customization for each dataset. It utilizes expression correlation techniques (16) to confirm the identity of transitions from the same peptide and protein with high confidence. In FIG. 16, a histogram of the Pearson correlations between every pair of transitions in the assay is presented. The correlation between a pair of transitions is obtained from their expression profiles over all samples in the discovery study. As expected, transitions from the same peptide are highly correlated. Similarly, transitions from different peptide fragments of the same protein are also highly correlated. In contrast, transitions from different proteins are not highly correlated, which enables a statistical analysis of the quality of a protein's SRM assay.
To determine the false positive assay rate we calculated the q-values (17) of peptide SRM assays. Using the distribution of Pearson correlations between transitions from different proteins as the null distribution (FIG. 16), an empirical p-value was assigned to a pair of transitions from the same peptide, detected in at least five common samples. A value of `NA` is assigned if the pair of transitions was detected in less than five common samples. The empirical p-value was converted to a q-value using the "qvalue" package in Bioconductor. We calculated the q-values of protein SRM assays in the same way except Pearson correlations of individual proteins were calculated as those between two transitions from different peptides of the protein. For proteins not having two peptides detected in five or more common samples, their q-values could not be properly evaluated and were assigned `NA`. If the correlation of transitions from two peptides from the same protein is above 0.5 then there was less than a 3% probability that the assay is false.
Most 36 cooperative proteins are shown in table below.
TABLE-US-00034 TABLE 34 Cooperative classifiers Official Protein Gene Cooperative Partial Coefficient Category (UniProt) Name Score AUC CV Frequency Classifier TSP1_HUMAN THBS1 1.8 0.25 0.24 59 Classifier COIA1_HUMAN COL18A1 3.7 0.16 0.25 91 Classifier ISLR_HUMAN ISLR 1.4 0.32 0.25 64 Classifier TETN_HUMAN CLEC3B 2.5 0.26 0.26 67 Classifier FRIL_HUMAN FTL 2.8 0.31 0.26 53 Classifier GRP78_HUMAN HSPA5 1.4 0.27 0.27 40 Classifier ALDOA_HUMAN ALDOA 1.3 0.26 0.28 88 Classifier BGH3_HUMAN TGFBI 1.8 0.21 0.28 69 Classifier LG3BP_HUMAN LGALS3BP 4.3 0.29 0.29 76 Classifier LRP1_HUMAN LRP1 4.0 0.13 0.32 93 Classifier FIBA_HUMAN FGA 1.1 0.31 0.35 11 Classifier PRDX1_HUMAN PRDX1 1.5 0.32 0.37 68 Classifier GSLG1_HUMAN GLG1 1.2 0.34 0.45 23 Robust KIT_HUMAN KIT 1.4 0.33 0.46 28 Robust CD14_HUMAN CD14 4.0 0.33 0.48 73 Robust EF1A1_HUMAN EEF1A1 1.2 0.32 0.56 52 Robust TENX_HUMAN TNXB 1.1 0.30 0.56 22 Robust AIFM1_HUMAN AIFM1 1.4 0.32 0.70 6 Robust GGH_HUMAN GGH 1.3 0.32 0.81 43 Robust IBP3_HUMAN IGFBP3 3.4 0.32 1.82 58 Robust ENPL_HUMAN HSP90B1 1.1 0.29 5.90 22 Non- ERO1A_HUMAN ERO1L 6.2 Robust Non- 6PGD_HUMAN PGD 4.3 Robust Non- ICAM1_HUMAN ICAM1 3.9 Robust Non- PTPA_HUMAN PPP2R4 2.1 Robust Non- NCF4_HUMAN NCF4 2.0 Robust Non- SEM3G_HUMAN SEMA3G 1.9 Robust Non- 1433T_HUMAN YWHAQ 1.5 Robust Non- RAP2B_HUMAN RAP2B 1.5 Robust Non- MMP9_HUMAN MMP9 1.4 Robust Non- FOLH1_HUMAN FOLH1 1.3 Robust Non- GSTP1_HUMAN GSTP1 1.3 Robust Non- EF2_HUMAN EEF2 1.3 Robust Non- RAN_HUMAN RAN 1.2 Robust Non- SODM_HUMAN SOD2 1.2 Robust Non- DSG2_HUMAN DSG2 1.1 Robust Protein Transition for SEQ Category (UniProt) Quantitation ID NO Classifier TSP1_HUMAN GFLLLASLR_495.31_559.40 22 Classifier COIA1_HUMAN AVGLAGTFR_446.26_721.40 11 Classifier ISLR_HUMAN ALPGTPVASSQPR_640.85_841.50 14 Classifier TETN_HUMAN LDTLAQEVALLK_657.39_330.20 20 Classifier FRIL_HUMAN LGGPEAGLGEYLFER_804.40_913.40 24 Classifier GRP78_HUMAN TWNDPSVQQDIK_715.85_260.20 23 Classifier ALDOA_HUMAN ALQASALK_401.25_617.40 7 Classifier BGH3_HUMAN LTLLAPLNSVFK_658.40_804.50 8 Classifier LG3BP_HUMAN VEIFYR_413.73_598.30 25 Classifier LRP1_HUMAN TVLWPNGLSLDIPAGR_855.00_400.20 15 Classifier FIBA_HUMAN NSLFEYQK_514.76_714.30 26 Classifier PRDX1_HUMAN QITVNDLPVGR_606.30_428.30 16 Classifier GSLG1_HUMAN IIIQESALDYR_660.86_338.20 27 Robust KIT_HUMAN YVSELHLTR_373.21_263.10 32 Robust CD14_HUMAN ATVNPSAPR_456.80_527.30 33 Robust EF1A1_HUMAN IGGIGTVPVGR_513.30_428.30 34 Robust TENX_HUMAN YEVTVVSVR_526.29_759.50 2 Robust AIFM1_HUMAN ELWFSDDPNVTK_725.85_558.30 35 Robust GGH_HUMAN YYIAASYVK_539.28_638.40 36 Robust IBP3_HUMAN FLNVLSPR_473.28_685.40 4 Robust ENPL_HUMAN SGYLLPDTK_497.27_460.20 37 Non- ERO1A_HUMAN VLPFFERPDFQLFTGNK_685.70_318.20 38 Robust Non- 6PGD_HUMAN LVPLLDTGDIIIDGGNSEYR_1080.60_897.40 39 Robust Non- ICAM1_HUMAN VELAPLPSWQPVGK_760.93_342.20 40 Robust Non- PTPA_HUMAN FGSLLPIHPVTSG_662.87_807.40 41 Robust Non- NCF4_HUMAN GATGIFPLSFVK_618.85_837.50 42 Robust Non- SEM3G_HUMAN LFLGGLDALYSLR_719.41_837.40 43 Robust Non- 1433T_HUMAN TAFDEAIAELDTLNEDSYK_1073.00_748.40 44 Robust Non- RAP2B_HUMAN VDLEGER_409.21_603.30 45 Robust Non- MMP9_HUMAN AFALWSAVTPLTFTR_840.96_290.20 46 Robust Non- FOLH1_HUMAN LGSGNDFEVFFQR_758.37_825.40 47 Robust Non- GSTP1_HUMAN ALPGQLKPFETLLSQNQGGK_709.39_831.40 48 Robust Non- EF2_HUMAN FSVSPVVR_445.76_470.30 49 Robust Non- RAN_HUMAN LVLVGDGGTGK_508.29_591.30 50 Robust Non- SODM_HUMAN NVRPDYLK_335.52_260.20 51 Robust Non- DSG2_HUMAN GQIIGNFQAFDEDTGLPAHAR_753.04_299.20 52 Robust P Value (Mann- Transition Protein Whitney for Category (UniProt) test) Qualification Classifier TSP1_HUMAN 0.23 GFLLLASLR_495.31_318.20 Classifier COIA1_HUMAN 0.16 AVGLAGTFR_446.26_551.30 Classifier ISLR_HUMAN 0.74 ALPGTPVASSQPR_640.85_440.30 Classifier TETN_HUMAN 0.14 LDTLAQEVALLK_657.39_871.50 Classifier FRIL_HUMAN 0.19 LGGPEAGLGEYLFER_804.40_525.30 Classifier GRP78_HUMAN 0.44 TWNDPSVQQDIK_715.85_288.10 Classifier ALDOA_HUMAN 0.57 ALQASALK_401.25_489.30 Classifier BGH3_HUMAN 0.57 LTLLAPLNSVFK_658.40_875.50 Classifier LG3BP_HUMAN 0.45 VEIFYR_413.73_485.30 Classifier LRP1_HUMAN 0.26 TVLWPNGLSLDIPAGR_855.00_605.30 Classifier FIBA_HUMAN 0.57 NSLFEYQK_514.76_315.20 Classifier PRDX1_HUMAN 0.24 QITVNDLPVGR_606.30_770.40 Classifier GSLG1_HUMAN 0.27 IIIQESALDYR_660.86_724.40 Robust KIT_HUMAN 0.27 YVSELHLTR_373.21_526.30 Robust CD14_HUMAN 0.72 ATVNPSAPR_456.80_386.20 Robust EF1A1_HUMAN 0.53 IGGIGTVPVGR_513.30_628.40 Robust TENX_HUMAN 0.54 YEVTVVSVR_526.29_660.40 Robust AIFM1_HUMAN 0.20 ELWFSDDPNVTK_725.85_875.40 Robust GGH_HUMAN 0.24 YYIAASYVK_539.28_567.30 Robust IBP3_HUMAN 0.04 FLNVLSPR_473.28_359.20 Robust ENPL_HUMAN 0.57 SGYLLPDTK_497.27_573.30 Non- ERO1A_HUMAN 0.06 VLPFFERPDFQLFTGNK_685.70_419.20 Robust Non- 6PGD_HUMAN 0.03 LVPLLDTGDIIIDGGNSEYR_1080.60_974.50 Robust Non- ICAM1_HUMAN 0.31 VELAPLPSWQPVGK_760.93_413.20 Robust Non- PTPA_HUMAN 0.26 FGSLLPIHPVTSG_662.87_292.10 Robust Non- NCF4_HUMAN 0.11 GATGIFPLSFVK_618.85_690.40 Robust Non- SEM3G_HUMAN 0.20 LFLGGLDALYSLR_719.41_538.30
Robust Non- 1433T_HUMAN 0.69 TAFDEAIAELDTLNEDSYK_1073.00_969.50 Robust Non- RAP2B_HUMAN 0.34 VDLEGER_409.21_361.20 Robust Non- MMP9_HUMAN 0.36 AFALWSAVTPLTFTR_840.96_589.30 Robust Non- FOLH1_HUMAN 0.06 LGSGNDFEVFFQR_758.37_597.30 Robust Non- GSTP1_HUMAN 0.46 ALPGQLKPFETLLSQNQGGK_709.39_261.20 Robust Non- EF2_HUMAN 0.79 FSVSPVVR_445.76_557.30 Robust Non- RAN_HUMAN 0.27 LVLVGDGGTGK_508.29_326.20 Robust Non- SODM_HUMAN 0.86 NVRPDYLK_335.52_423.30 Robust Non- DSG2_HUMAN 0.08 GQIIGNFQAFDEDTGLPAHAR_753.04_551.30 Robust Predicted Protein Peptide Q Tissue Concentration Category (UniProt) Value Candidate (ng/ml) Classifier TSP1_HUMAN 1.90E-05 .box-solid.510 Classifier COIA1_HUMAN 6.70E-04 35 Classifier ISLR_HUMAN 4.40E-03 -- Classifier TETN_HUMAN 3.70E-05 58000 Classifier FRIL_HUMAN 4.30E-05 Secreted, 12 Epi, Endo Classifier GRP78_HUMAN 1.80E-03 Secreted, 100 Epi, Endo Classifier ALDOA_HUMAN 3.70E-05 Secreted, 250 Epi Classifier BGH3_HUMAN 1.40E-04 140 Classifier LG3BP_HUMAN 2.80E-05 Secreted 440 Classifier LRP1_HUMAN 1.40E-04 Epi 20 Classifier FIBA_HUMAN 1.90E-05 130000 Classifier PRDX1_HUMAN 1.90E-05 Epi 60 Classifier GSLG1_HUMAN 6.70E-03 Epi, -- Endo Robust KIT_HUMAN 2.40E-03 8.2 Robust CD14_HUMAN 4.30E-04 Epi 420 Robust EF1A1_HUMAN 4.50E-04 Secreted, 61 Epi Robust TENX_HUMAN 1.10E-03 Endo 70 Robust AIFM1_HUMAN 3.70E-02 Epi, 1.4 Endo Robust GGH_HUMAN 1.70E-03 250 Robust IBP3_HUMAN 2.80E-05 5700 Robust ENPL_HUMAN 1.10E-03 Secreted, 88 Epi, Endo Non- ERO1A_HUMAN 1.20E-02 Secreted, -- Robust Epi, Endo Non- 6PGD_HUMAN 5.50E-03 Epi, 29 Robust Endo Non- ICAM1_HUMAN 2.80E-02 71 Robust Non- PTPA_HUMAN 1.90E-03 Endo 3.3 Robust Non- NCF4_HUMAN 7.90E-04 Endo -- Robust Non- SEM3G_HUMAN 1.10E-03 -- Robust Non- 1433T_HUMAN 1.10E-02 Epi 180 Robust Non- RAP2B_HUMAN 1.20E-03 Epi -- Robust Non- MMP9_HUMAN 4.00E-03 28 Robust Non- FOLH1_HUMAN 5.80E-03 -- Robust Non- GSTP1_HUMAN 1.70E-04 Endo 32 Robust Non- EF2_HUMAN 1.10E-02 Secreted, 30 Robust Epi Non- RAN_HUMAN 2.80E-03 Secreted, 4.6 Robust Epi Non- SODM_HUMAN 2.40E-02 Secreted 7.1 Robust Non- DSG2_HUMAN 5.70E-03 Endo 2.7 Robust
A P-classifier using the same steps for the 13-protein classifier derivation (see Table 28 and Materials and Methods in Example 9) except that the Mann Whitney p-value was used in place of cooperative score was also derived.
TABLE-US-00035 TABLE 35 P-Classifiers P Value Coef- Coope- Official SEQ (Mann- ficient Coef- rative Protein Gene ID Whitney (.alpha. = ficient Pro- Category (UniProt) Name Transition for Quantitation NO test) 27.24) CV tein P- FRIL_HUMAN FTL LGGPEAGLGEYLFER_804.40_913.40 24 0.19 0.39 0.21 Yes Classifier P- TSP1_HUMAN THBS1 GFLLLASLR_495.31_559.40 22 0.23 0.48 0.21 Yes Classifier P- LRP1_HUMAN LRP1 TVLWPNGLSLDIPAGR_855.00_400.20 15 0.26 -0.81 0.22 Yes Classifier P- PRDX1_HUMAN PRDX1 QITVNDLPVGR_606.30_428.30 16 0.24 -0.51 0.24 Yes Classifier P- TETN_HUMAN CLEC3B LDTLAQEVALLK_657.39_330.20 20 0.14 -1.08 0.27 Yes Classifier P- TBB3_HUMAN TUBB3 ISVYYNEASSHK_466.60_458.20 19 0.08 -0.21 0.29 No Classifier P- COIA1_HUMAN COL18A1 AVGLAGTFR_446.26_721.40 11 0.16 -0.72 0.29 Yes Classifier P- GGH_HUMAN GGH YYIAASYVK_539.28_638.40 36 0.24 0.74 0.33 Yes Classifier P- A1AG1_HUMAN ORM1 YVGGQEHFAHLLILR_584.99_263.10 53 0.27 0.30 0.36 No Classifier Robust AIFM1_HUMAN AIFM1 ELWFSDDPNVTK_725.85_558.30 35 0.20 Yes Robust AMPN_HUMAN ANPEP DHSAIPVINR_374.54_402.20 54 0.16 No Robust CRP_HUMAN CRP ESDTSYVSLK_564.77_347.20 55 0.17 No Robust GSLG1_HUMAN GLG1 IIIQESALDYR_660.86_338.20 27 0.27 Yes Robust IBP3_HUMAN IGFBP3 FLNVLSPR_473.28_685.40 4 0.04 Yes Robust KIT_HUMAN KIT YVSELHLTR_373.21_263.10 32 0.27 Yes Robust NRP1_HUMAN NRP1 SFEGNNNYDTPELR_828.37_514.30 56 0.22 No Non- 6PGD_HUMAN PGD LVPLLDTGDIIIDGGNSEYR_1080.60_897.40 39 0.03 Yes Robust Non- CH10_HUMAN HSPE1 VLLPEYGGTK_538.80_751.40 57 0.07 No Robust Non- CLIC1_HUMAN CLIC1 FSAYK_364.70_581.30 9 0.14 No Robust Non- COF1_HUMAN CFL1 YALYDATYETK_669.32_827.40 58 0.08 No Robust Non- CSF1_HUMAN CSF1 ISSLRPQGLSNPSTLSAQPQLSR_813.11_600.30 59 0.23 No Robust Non- CYTB_HUMAN CSTB SQVVAGTNYFIK_663.86_315.20 60 0.16 No Robust Non- DMKN_HUMAN DMKN VSEALGQGTR_509.27_631.40 61 0.17 No Robust Non- DSG2_HUMAN DSG2 GQIIGNFQAFDEDTGLPAHAR_753.04_299.20 52 0.08 Yes Robust Non- EREG_HUMAN EREG VAQVSITK_423.26_448.30 62 0.16 No Robust Non- ERO1A_HUMAN ERO1L VLPFFERPDFQLFTGNK_685.70_318.20 38 0.06 Yes Robust Non- FOLH1_HUMAN FOLH1 LGSGNDFEVFFQR_758.37_825.40 47 0.06 Yes Robust Non- ILEU_HUMAN SERPINB1 TYNFLPEFLVSTQK_843.94_379.20 63 0.09 No Robust Non- K1C19_HUMAN KRT19 FGAQLAHIQALISGIEAQLGDVR_803.11_274.20 64 0.17 No Robust Non- LYOX_HUMAN LOX TPILLIR_413.28_514.40 65 0.22 No Robust Non- MMP7_HUMAN MMP7 LSQDDIK_409.72_705.30 66 0.23 No Robust Non- NCF4_HUMAN NCF4 GATGIFPLSFVK_618.85_837.50 42 0.11 Yes Robust Non- PDIA3_HUMAN PDIA3 ELSDFISYLQR_685.85_779.40 67 0.04 No Robust Non- PTGIS_HUMAN PTGIS LLLFPFLSPQR_665.90_340.30 68 0.06 No Robust Non- PTPA_HUMAN PPP2R4 FGSLLPIHPVTSG_662.87_807.40 41 0.26 Yes Robust Non- RAN_HUMAN RAN LVLVGDGGTGK_508.29_591.30 50 0.27 Yes Robust Non- SCF_HUMAN KITLG LFTPEEFFR_593.30_261.20 69 0.16 No Robust Non- SEM3G_HUMAN SEMA3G LFLGGLDALYSLR_719.41_837.40 43 0.20 Yes Robust Non- TBA1B_HUMAN TUBA1B AVFVDLEPTVIDEVR_851.50_928.50 70 0.15 No Robust Non- TCPA_HUMAN TCP1 IHPTSVISGYR_615.34_251.20 71 0.17 No Robust Non- TERA_HUMAN VCP GILLYGPPGTGK_586.80_284.20 72 0.29 No Robust Non- TIMP1_HUMAN TIMP1 GFQALGDAADIR_617.32_717.40 73 0.26 No Robust Non- TNF12_HUMAN TNFSF12 AAPFLTYFGLFQVH_805.92_700.40 74 0.29 No Robust Non- UGPA_HUMAN UGP2 LVEIAQVPK_498.80_784.50 75 0.08 No Robust
REFERENCES
1. Albert & Russell Am Fam Physician 80:827-831 (2009) 2. Gould et al. Chest 132:108S-130S (2007) 3. Kitteringham et al. J Chromatrog B Analyt Technol Biomed Life Sci 877:1229-1239 (2009) 4. Lange et al. Mol Syst Biol 4:222 (2008) 5. Lehtio & De Petris J Proteomics 73:1851-1863 (2010) 6. MacMahon et al. Radiology 237:395-400 (2005) 7. Makawita Clin Chem 56:212-222 (2010) 8. Ocak et al. Proc Am Thorac Soc 6:159-170 (2009) 9. Ost, D. E. and M. K. Gould, Decision making in patients with pulmonary nodules. Am J Respir Crit Care Med, 2012. 185(4): p. 363-72. 10. Cima, I., et al., Cancer genetics-guided discovery of serum biomarker signatures for diagnosis and prognosis of prostate cancer. Proc Natl Acad Sci USA, 2011. 108(8): p. 3342-7. 11. Desiere, F., et al., The PeptideAtlas project. Nucleic Acids Res, 2006. 34 (Database issue): p. D655-8. 12. Farrah, T., et al., A high-confidence human plasma proteome reference set with estimated concentrations in PeptideAtlas. Mol Cell Proteomics, 2011. 10(9): p. M110 006353. 13. Omenn, G. S., et al., Overview of the HUPO Plasma Proteome Project: results from the pilot phase with 35 collaborating laboratories and multiple analytical groups, generating a core dataset of 3020 proteins and a publicly-available database. Proteomics, 2005. 5(13): p. 3226-45. 14. Kearney, P., et al., Protein identification and Peptide expression resolver: harmonizing protein identification with protein expression data. J Proteome Res, 2008. 7(1): p. 234-44. 15. Huttenhain, R., et al., Reproducible quantification of cancer-associated proteins in body fluids using targeted proteomics. Sci Transl Med, 2012. 4(142): p. 142ra94. 16. Henschke, C. I., et al., CT screening for lung cancer: suspiciousness of nodules according to size on baseline scans. Radiology, 2004. 231(1): p. 164-8. 17. Henschke, C. I., et al., Early Lung Cancer Action Project: overall design and findings from baseline screening. Lancet, 1999. 354(9173): p. 99-105. 18. States, D. J., et al., Challenges in deriving high-confidence protein identifications from data gathered by a HUPO plasma proteome collaborative study. Nat Biotechnol, 2006. 24(3): p. 333-8. 19. Polanski, M. and N. L. Anderson, A list of candidate cancer biomarkers for targeted proteomics. Biomark Insights, 2007. 1: p. 1-48. 20. Krogh, A., et al., Predicting transmembrane protein topology with a hidden Markov model: application to complete genomes. J Mol Biol, 2001. 305(3): p. 567-80. 21. Bendtsen, J. D., et al., Improved prediction of signal peptides: SignalP 3.0. J Mol Biol, 2004. 340(4): p. 783-95. 22. Bendtsen, J. D., et al., Feature-based prediction of non-classical and leaderless protein secretion. Protein Eng Des Sel, 2004. 17(4): p. 349-56. 23. Lange, V., et al., Selected reaction monitoring for quantitative proteomics: a tutorial. Mol Syst Biol, 2008. 4: p. 222. 24. Picotti, P., et al., High-throughput generation of selected reaction-monitoring assays for proteins and proteomes. Nat Methods, 2010. 7(1): p. 43-6. 25. Mallick, P., et al., Computational prediction of proteotypic peptides for quantitative proteomics. Nat Biotechnol, 2007. 25(1): p. 125-31. 26. Perkins, D. N., et al., Probability-based protein identification by searching sequence databases using mass spectrometry data. Electrophoresis, 1999. 20(18): p. 3551-67. 27. Hastie, T., R. Tibshirani, and J. H. Friedman, The elements of statistical learning: data mining, inference, and prediction: with 200 full-color illustrations. Springer series in statistics. 2001, New York: Springer. xvi, 533 p. 28. McClish, D. K., Analyzing a portion of the ROC curve. Med Decis Making, 1989. 9(3): p. 190-5.
SEQUENCE LISTINGS
1
75112PRTArtificial SequenceSynthetic Polypeptide 1Tyr Gly Phe Ile Glu Gly His Val Val Ile Pro Arg1 5 1029PRTArtificial SequenceSynthetic Polypeptide 2Tyr Glu Val Thr Val Val Ser Val Arg1 5312PRTArtificial SequenceSynthetic Polypeptide 3Ala Ser Ser Ile Ile Asp Glu Leu Phe Gln Asp Arg1 5 1048PRTArtificial SequenceSynthetic Polypeptide 4Phe Leu Asn Val Leu Ser Pro Arg1 558PRTArtificial SequenceSynthetic Polypeptide 5Thr Ala Ser Asp Phe Ile Thr Lys1 5615PRTArtificial SequenceSynthetic Polypeptide 6Thr Gly Val Ile Thr Ser Pro Asp Phe Pro Asn Pro Tyr Pro Lys1 5 10 1578PRTArtificial SequenceSynthetic Polypeptide 7Ala Leu Gln Ala Ser Ala Leu Lys1 5812PRTArtificial SequenceSynthetic Polypeptide 8Leu Thr Leu Leu Ala Pro Leu Asn Ser Val Phe Lys1 5 10918PRTArtificial SequenceSynthetic Polypeptide 9Leu Ala Ala Leu Asn Pro Glu Ser Asn Thr Ala Gly Leu Asp Ile Phe1 5 10 15Ala Lys109PRTArtificial SequenceSynthetic Polypeptide 10Val Ala Val Val Gln Tyr Ser Asp Arg1 5119PRTArtificial SequenceSynthetic Polypeptide 11Ala Val Gly Leu Ala Gly Thr Phe Arg1 51215PRTArtificial SequenceSynthetic Polypeptide 12Val Pro Gly Thr Ser Thr Ser Ala Thr Leu Thr Gly Leu Thr Arg1 5 10 151315PRTArtificial SequenceSynthetic Polypeptide 13Gly Ala Leu Gln Asn Ile Ile Pro Ala Ser Thr Gly Ala Ala Lys1 5 10 151413PRTArtificial SequenceSynthetic Polypeptide 14Ala Leu Pro Gly Thr Pro Val Ala Ser Ser Gln Pro Arg1 5 101516PRTArtificial SequenceSynthetic Polypeptide 15Thr Val Leu Trp Pro Asn Gly Leu Ser Leu Asp Ile Pro Ala Gly Arg1 5 10 151611PRTArtificial SequenceSynthetic Polypeptide 16Gln Ile Thr Val Asn Asp Leu Pro Val Gly Arg1 5 101714PRTArtificial SequenceSynthetic Polypeptide 17Ser Thr Gly Gly Ala Pro Thr Phe Asn Val Thr Val Thr Lys1 5 10187PRTArtificial SequenceSynthetic Polypeptide 18Ser Val Asp Ile Trp Leu Arg1 51912PRTArtificial SequenceSynthetic Polypeptide 19Ile Ser Val Tyr Tyr Asn Glu Ala Ser Ser His Lys1 5 102012PRTArtificial SequenceSynthetic Polypeptide 20Leu Asp Thr Leu Ala Gln Glu Val Ala Leu Leu Lys1 5 10217PRTArtificial SequenceSynthetic Polypeptide 21Val Val Phe Glu Gln Thr Lys1 5229PRTArtificial SequenceSynthetic Polypeptide 22Gly Phe Leu Leu Leu Ala Ser Leu Arg1 52312PRTArtificial SequenceSynthetic Polypeptide 23Thr Trp Asn Asp Pro Ser Val Gln Gln Asp Ile Lys1 5 102415PRTArtificial SequenceSynthetic Polypeptide 24Leu Gly Gly Pro Glu Ala Gly Leu Gly Glu Tyr Leu Phe Glu Arg1 5 10 15256PRTArtificial SequenceSynthetic Polypeptide 25Val Glu Ile Phe Tyr Arg1 5268PRTArtificial SequenceSynthetic Polypeptide 26Asn Ser Leu Phe Glu Tyr Gln Lys1 52711PRTArtificial SequenceSynthetic Polypeptide 27Ile Ile Ile Gln Glu Ser Ala Leu Asp Tyr Arg1 5 102812PRTArtificial SequenceSynthetic Polypeptide 28Leu Gln Ser Leu Phe Asp Ser Pro Asp Phe Ser Lys1 5 102911PRTArtificial SequenceSynthetic Polypeptide 29Ser Leu Glu Asp Leu Gln Leu Thr His Asn Lys1 5 10308PRTArtificial SequenceSynthetic Polypeptide 30Ile Asn Pro Ala Ser Leu Asp Lys1 53112PRTArtificial SequenceSynthetic Polypeptide 31Val Ile Thr Glu Pro Ile Pro Val Ser Asp Leu Arg1 5 10329PRTArtificial SequenceSynthetic Polypeptide 32Tyr Val Ser Glu Leu His Leu Thr Arg1 5339PRTArtificial SequenceSynthetic Polypeptide 33Ala Thr Val Asn Pro Ser Ala Pro Arg1 53411PRTArtificial SequenceSynthetic Polypeptide 34Ile Gly Gly Ile Gly Thr Val Pro Val Gly Arg1 5 103512PRTArtificial SequenceSynthetic Polypeptide 35Glu Leu Trp Phe Ser Asp Asp Pro Asn Val Thr Lys1 5 10369PRTArtificial SequenceSynthetic Polypeptide 36Tyr Tyr Ile Ala Ala Ser Tyr Val Lys1 5379PRTArtificial SequenceSynthetic Polypeptide 37Ser Gly Tyr Leu Leu Pro Asp Thr Lys1 53817PRTArtificial SequenceSynthetic Polypeptide 38Val Leu Pro Phe Phe Glu Arg Pro Asp Phe Gln Leu Phe Thr Gly Asn1 5 10 15Lys3920PRTArtificial SequenceSynthetic Polypeptide 39Leu Val Pro Leu Leu Asp Thr Gly Asp Ile Ile Ile Asp Gly Gly Asn1 5 10 15Ser Glu Tyr Arg 204014PRTArtificial SequenceSynthetic Polypeptide 40Val Glu Leu Ala Pro Leu Pro Ser Trp Gln Pro Val Gly Lys1 5 104113PRTArtificial SequenceSynthetic Polypeptide 41Phe Gly Ser Leu Leu Pro Ile His Pro Val Thr Ser Gly1 5 104212PRTArtificial SequenceSynthetic Polypeptide 42Gly Ala Thr Gly Ile Phe Pro Leu Ser Phe Val Lys1 5 104313PRTArtificial SequenceSynthetic Polypeptide 43Leu Phe Leu Gly Gly Leu Asp Ala Leu Tyr Ser Leu Arg1 5 104419PRTArtificial SequenceSynthetic Polypeptide 44Thr Ala Phe Asp Glu Ala Ile Ala Glu Leu Asp Thr Leu Asn Glu Asp1 5 10 15Ser Tyr Lys457PRTArtificial SequenceSynthetic Polypeptide 45Val Asp Leu Glu Gly Glu Arg1 54615PRTArtificial SequenceSynthetic Polypeptide 46Ala Phe Ala Leu Trp Ser Ala Val Thr Pro Leu Thr Phe Thr Arg1 5 10 154713PRTArtificial SequenceSynthetic Polypeptide 47Leu Gly Ser Gly Asn Asp Phe Glu Val Phe Phe Gln Arg1 5 104820PRTArtificial SequenceSynthetic Polypeptide 48Ala Leu Pro Gly Gln Leu Lys Pro Phe Glu Thr Leu Leu Ser Gln Asn1 5 10 15Gln Gly Gly Lys 20498PRTArtificial SequenceSynthetic Polypeptide 49Phe Ser Val Ser Pro Val Val Arg1 55011PRTArtificial SequenceSynthetic Polypeptide 50Leu Val Leu Val Gly Asp Gly Gly Thr Gly Lys1 5 10518PRTArtificial SequenceSynthetic Polypeptide 51Asn Val Arg Pro Asp Tyr Leu Lys1 55221PRTArtificial SequenceSynthetic Polypeptide 52Gly Gln Ile Ile Gly Asn Phe Gln Ala Phe Asp Glu Asp Thr Gly Leu1 5 10 15Pro Ala His Ala Arg 205315PRTArtificial SequenceSynthetic Polypeptide 53Tyr Val Gly Gly Gln Glu His Phe Ala His Leu Leu Ile Leu Arg1 5 10 155410PRTArtificial SequenceSynthetic Polypeptide 54Asp His Ser Ala Ile Pro Val Ile Asn Arg1 5 105510PRTArtificial SequenceSynthetic Polypeptide 55Glu Ser Asp Thr Ser Tyr Val Ser Leu Lys1 5 105614PRTArtificial SequenceSynthetic Polypeptide 56Ser Phe Glu Gly Asn Asn Asn Tyr Asp Thr Pro Glu Leu Arg1 5 105710PRTArtificial SequenceSynthetic Polypeptide 57Val Leu Leu Pro Glu Tyr Gly Gly Thr Lys1 5 105811PRTArtificial SequenceSynthetic Polypeptide 58Tyr Ala Leu Tyr Asp Ala Thr Tyr Glu Thr Lys1 5 105923PRTArtificial SequenceSynthetic Polypeptide 59Ile Ser Ser Leu Arg Pro Gln Gly Leu Ser Asn Pro Ser Thr Leu Ser1 5 10 15Ala Gln Pro Gln Leu Ser Arg 206012PRTArtificial SequenceSynthetic Polypeptide 60Ser Gln Val Val Ala Gly Thr Asn Tyr Phe Ile Lys1 5 106110PRTArtificial SequenceSynthetic Polypeptide 61Val Ser Glu Ala Leu Gly Gln Gly Thr Arg1 5 10628PRTArtificial SequenceSynthetic Polypeptide 62Val Ala Gln Val Ser Ile Thr Lys1 56314PRTArtificial SequenceSynthetic Polypeptide 63Thr Tyr Asn Phe Leu Pro Glu Phe Leu Val Ser Thr Gln Lys1 5 106423PRTArtificial SequenceSynthetic Polypeptide 64Phe Gly Ala Gln Leu Ala His Ile Gln Ala Leu Ile Ser Gly Ile Glu1 5 10 15Ala Gln Leu Gly Asp Val Arg 20657PRTArtificial SequenceSynthetic Polypeptide 65Thr Pro Ile Leu Leu Ile Arg1 5667PRTArtificial SequenceSynthetic Polypeptide 66Leu Ser Gln Asp Asp Ile Lys1 56711PRTArtificial SequenceSynthetic Polypeptide 67Glu Leu Ser Asp Phe Ile Ser Tyr Leu Gln Arg1 5 106811PRTArtificial SequenceSynthetic Polypeptide 68Leu Leu Leu Phe Pro Phe Leu Ser Pro Gln Arg1 5 10699PRTArtificial SequenceSynthetic Polypeptide 69Leu Phe Thr Pro Glu Glu Phe Phe Arg1 57015PRTArtificial SequenceSynthetic Polypeptide 70Ala Val Phe Val Asp Leu Glu Pro Thr Val Ile Asp Glu Val Arg1 5 10 157111PRTArtificial SequenceSynthetic Polypeptide 71Ile His Pro Thr Ser Val Ile Ser Gly Tyr Arg1 5 107212PRTArtificial SequenceSynthetic Polypeptide 72Gly Ile Leu Leu Tyr Gly Pro Pro Gly Thr Gly Lys1 5 107312PRTArtificial SequenceSynthetic Polypeptide 73Gly Phe Gln Ala Leu Gly Asp Ala Ala Asp Ile Arg1 5 107414PRTArtificial SequenceSynthetic Polypeptide 74Ala Ala Pro Phe Leu Thr Tyr Phe Gly Leu Phe Gln Val His1 5 10759PRTArtificial SequenceSynthetic Polypeptide 75Leu Val Glu Ile Ala Gln Val Pro Lys1 5
* * * * *
D00001
D00002
D00003
D00004
D00005
D00006
D00007
D00008
D00009
D00010
D00011
D00012
D00013
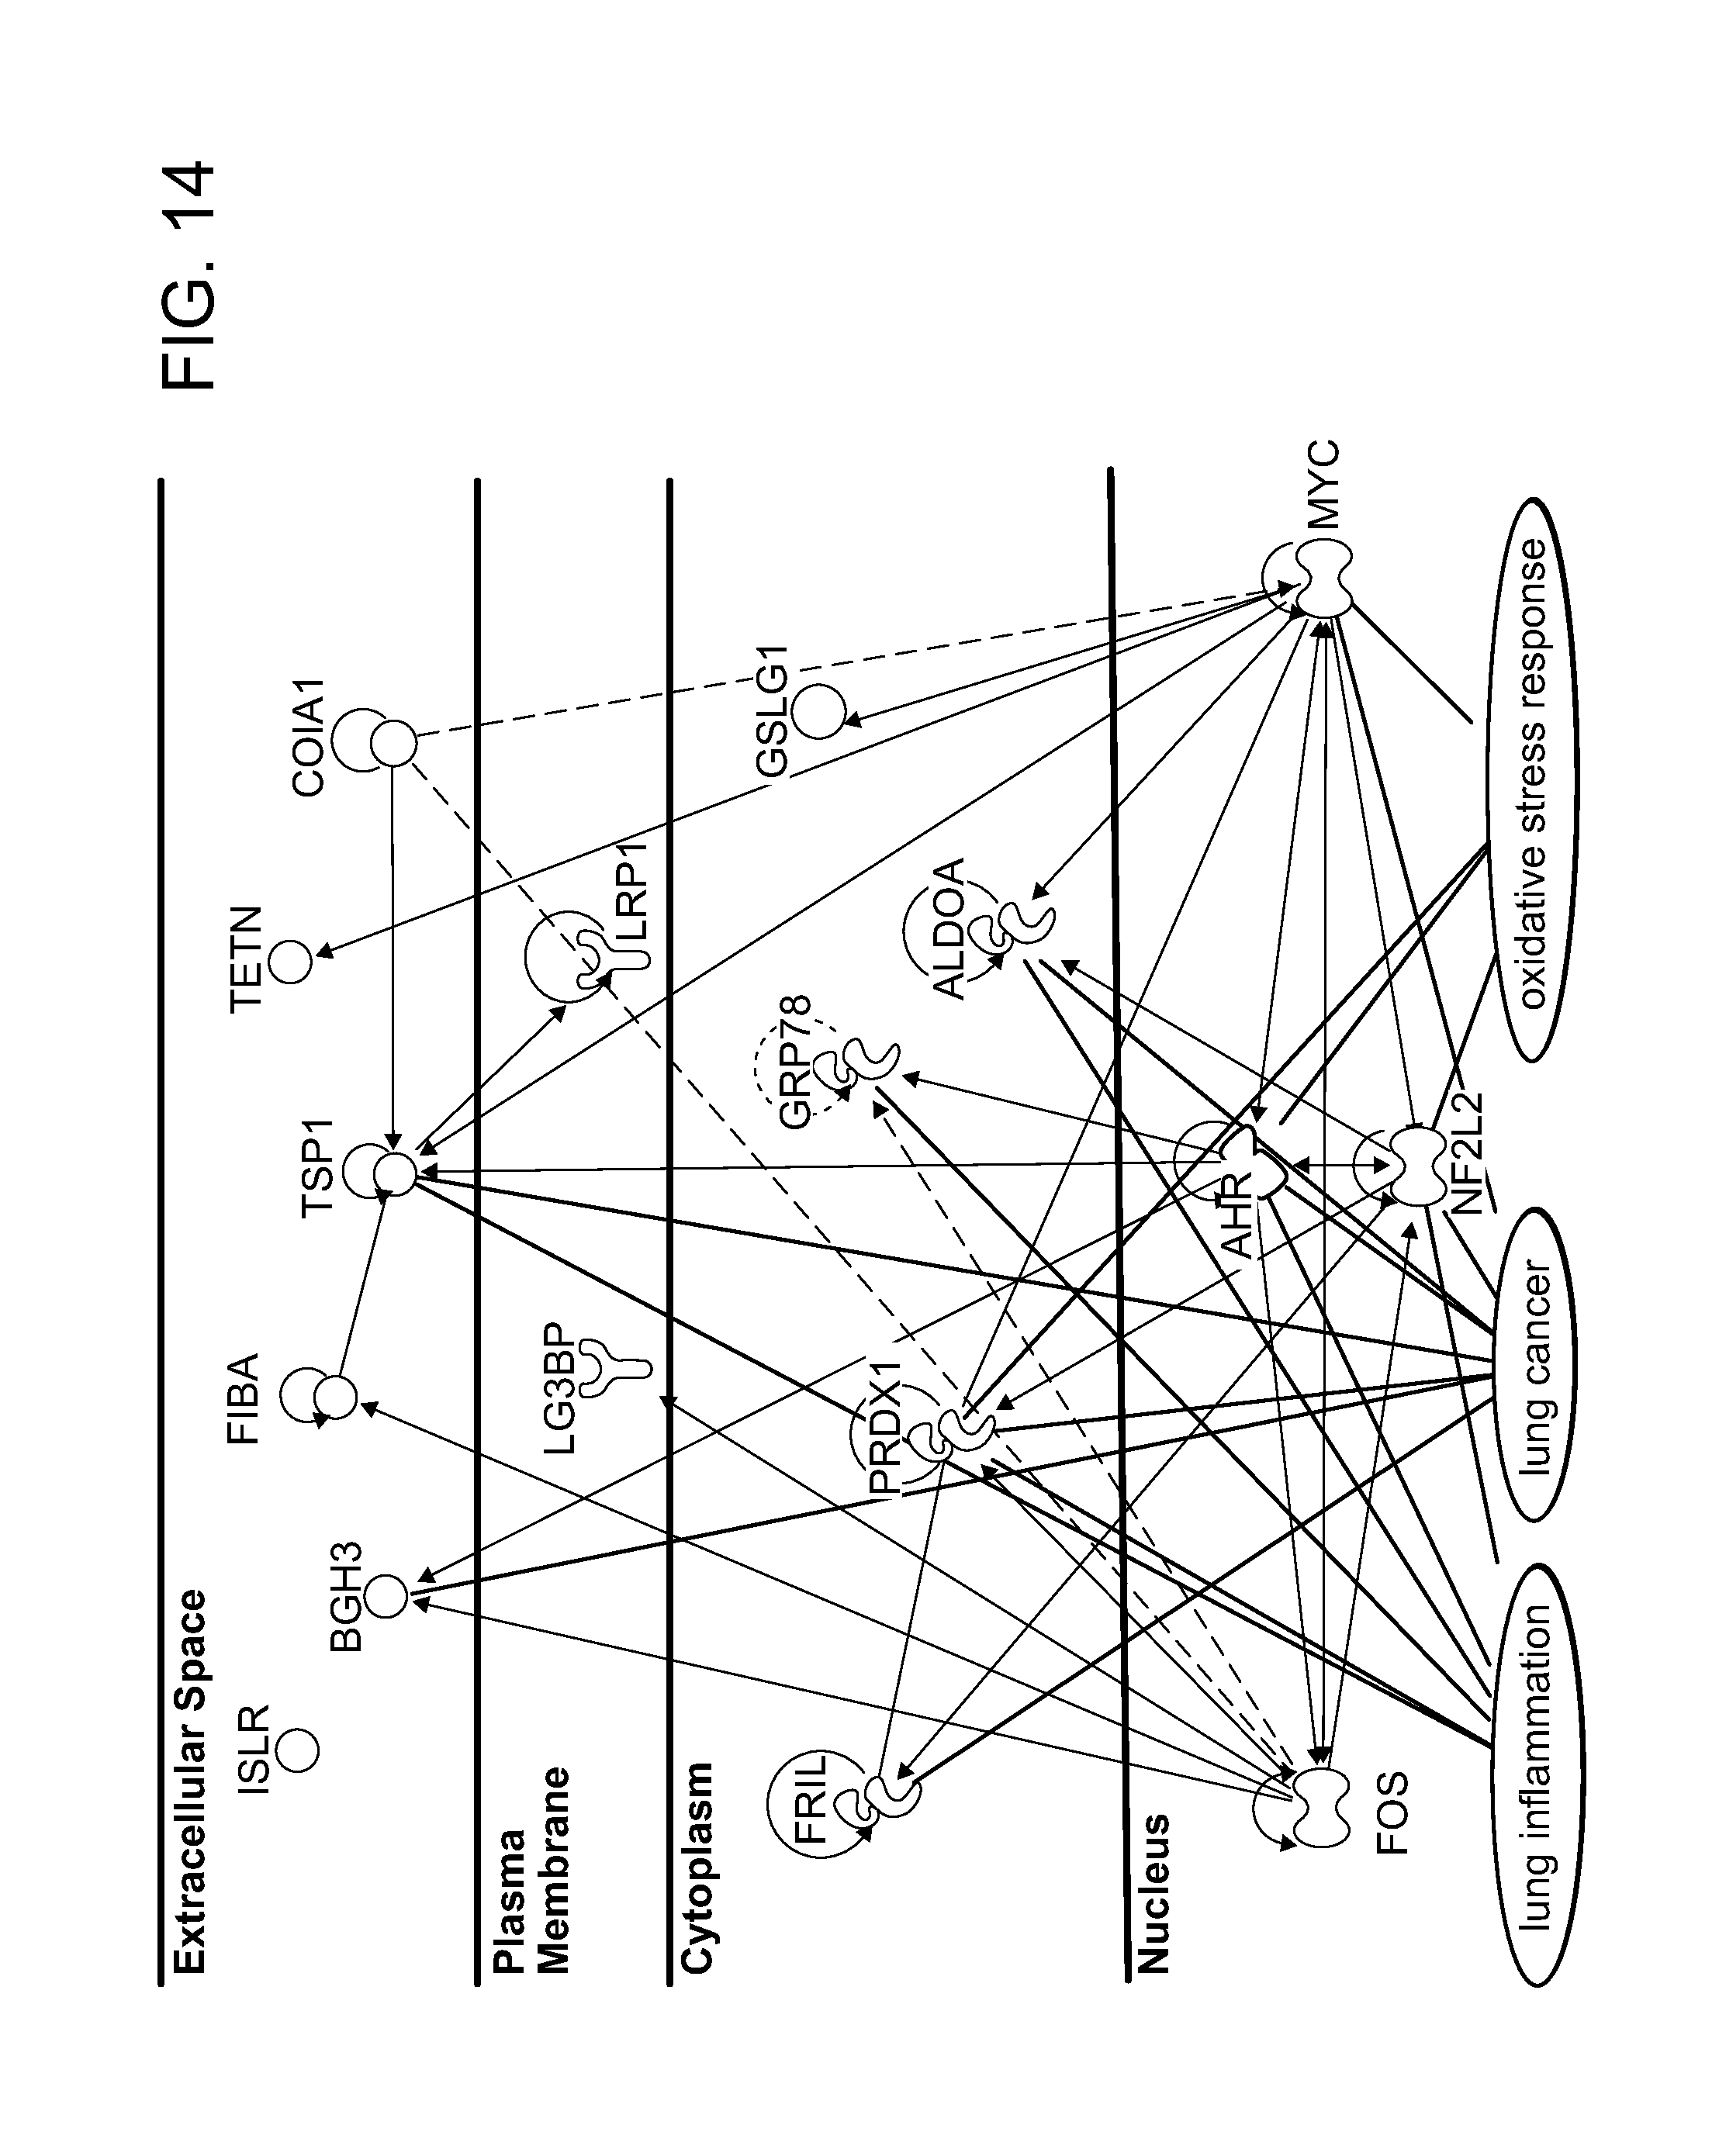
D00014
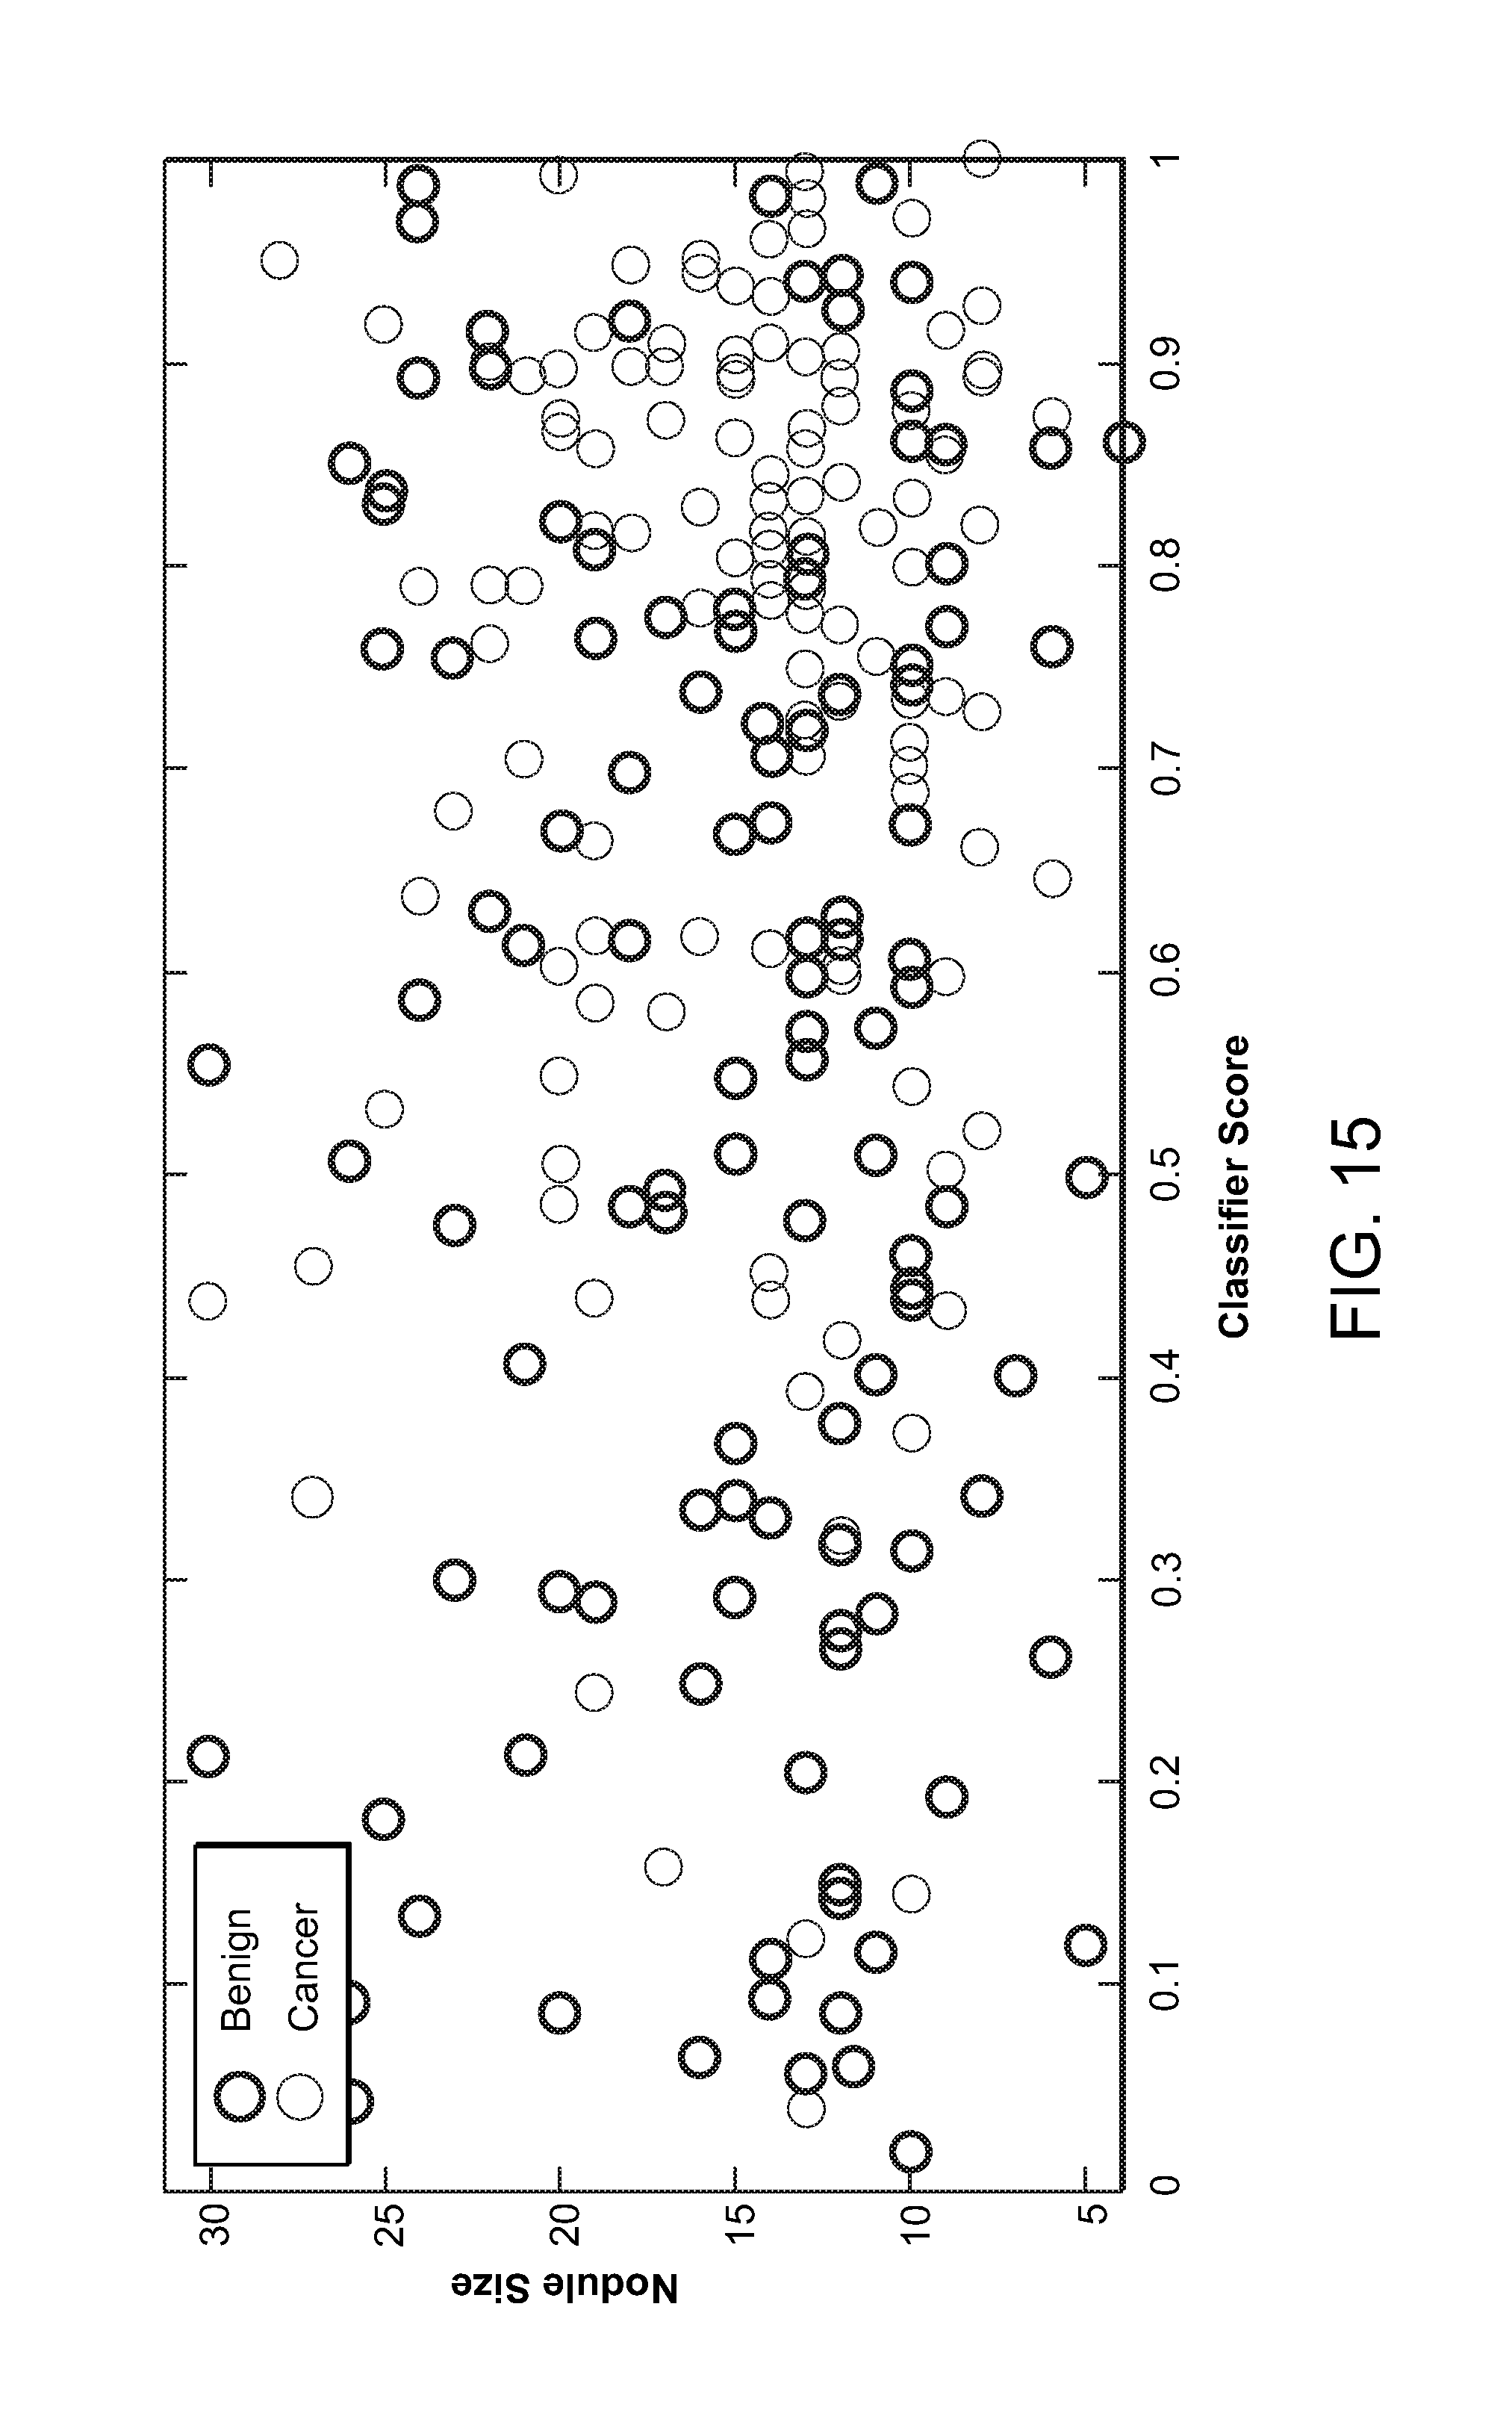
D00015
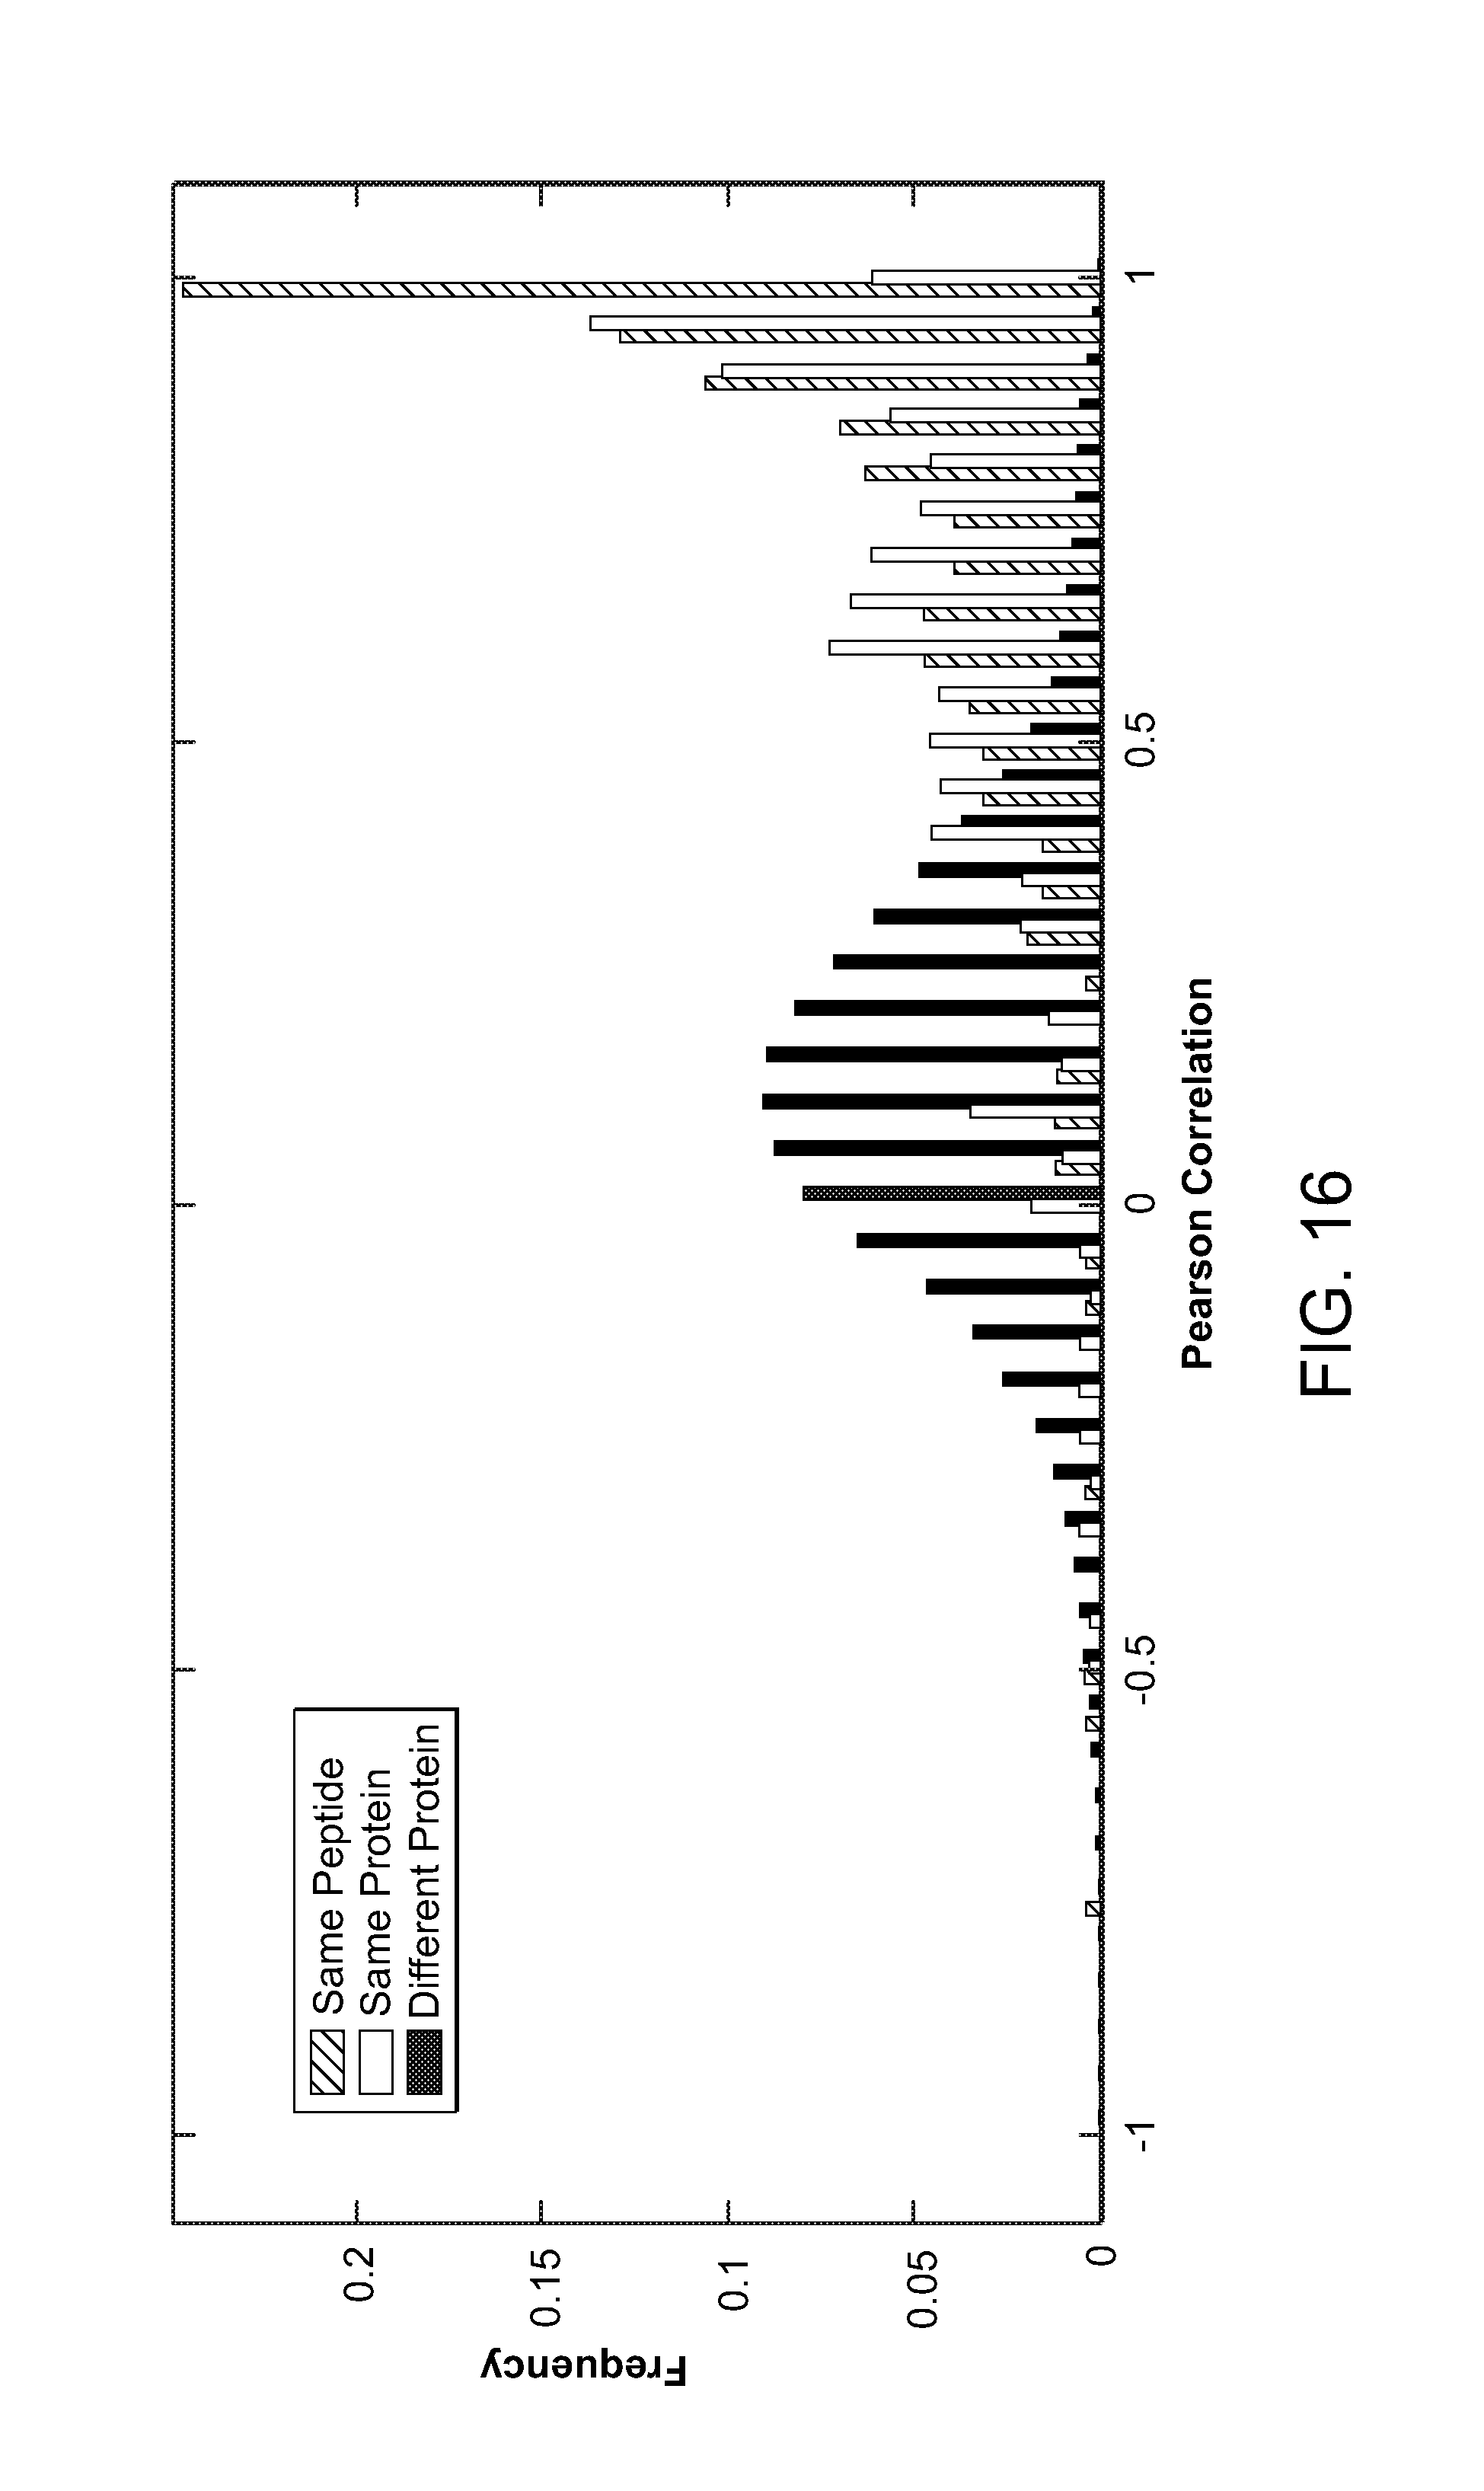
M00001
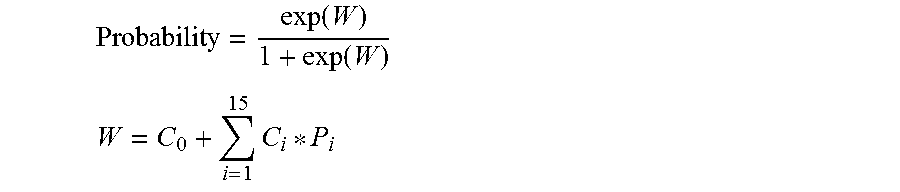
M00002
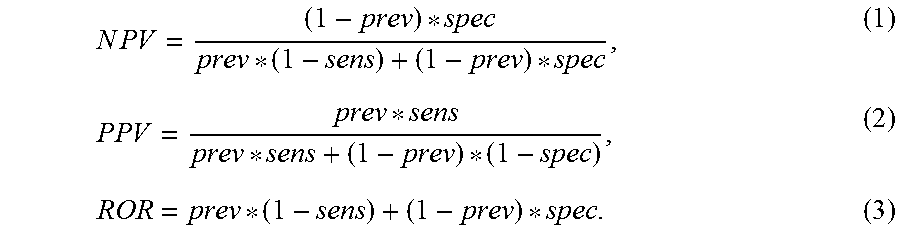
M00003

M00004

M00005

M00006

M00007

M00008

M00009

M00010
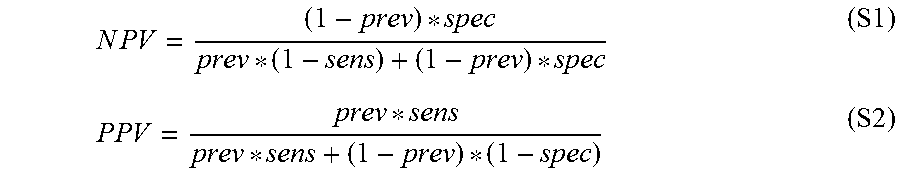
M00011

M00012

M00013

M00014

S00001
XML
uspto.report is an independent third-party trademark research tool that is not affiliated, endorsed, or sponsored by the United States Patent and Trademark Office (USPTO) or any other governmental organization. The information provided by uspto.report is based on publicly available data at the time of writing and is intended for informational purposes only.
While we strive to provide accurate and up-to-date information, we do not guarantee the accuracy, completeness, reliability, or suitability of the information displayed on this site. The use of this site is at your own risk. Any reliance you place on such information is therefore strictly at your own risk.
All official trademark data, including owner information, should be verified by visiting the official USPTO website at www.uspto.gov. This site is not intended to replace professional legal advice and should not be used as a substitute for consulting with a legal professional who is knowledgeable about trademark law.