Biomarkers for cardiovascular diseases and methods using the same
Hu , et al. J
U.S. patent number 10,175,233 [Application Number 14/975,988] was granted by the patent office on 2019-01-08 for biomarkers for cardiovascular diseases and methods using the same. This patent grant is currently assigned to METABOLON, INC.. The grantee listed for this patent is Metabolon, Inc.. Invention is credited to Danny Alexander, Costel Chirila, Walter Gall, Yun Fu Hu, Kay A. Lawton, Michael Milburn, Matthew W. Mitchell.


View All Diagrams
| United States Patent | 10,175,233 |
| Hu , et al. | January 8, 2019 |
Biomarkers for cardiovascular diseases and methods using the same
Abstract
Biomarkers relating to cardiovascular disease, including atherosclerosis and cardiomyopathy, are provided, as well as methods for using such biomarkers as biomarkers for cardiovascular disease. In addition, methods for modulating the respective disorders or conditions of a subject are also provided. Also provided are suites of small molecule entities as biomarkers for cardiovascular disease, including atherosclerosis and cardiomyopathy.
| Inventors: | Hu; Yun Fu (Chapel Hill, NC), Chirila; Costel (Durham, NC), Alexander; Danny (Cary, NC), Milburn; Michael (Cary, NC), Mitchell; Matthew W. (Durham, NC), Gall; Walter (Chapel Hill, NC), Lawton; Kay A. (Raleigh, NC) | ||||||||||
|---|---|---|---|---|---|---|---|---|---|---|---|
| Applicant: |
|
||||||||||
| Assignee: | METABOLON, INC. (Morrisville,
NC) |
||||||||||
| Family ID: | 40282019 | ||||||||||
| Appl. No.: | 14/975,988 | ||||||||||
| Filed: | December 21, 2015 |
Prior Publication Data
| Document Identifier | Publication Date | |
|---|---|---|
| US 20160178620 A1 | Jun 23, 2016 | |
Related U.S. Patent Documents
| Application Number | Filing Date | Patent Number | Issue Date | ||
|---|---|---|---|---|---|
| 14324689 | Jul 7, 2014 | 9250225 | |||
| 13966475 | Aug 19, 2014 | 8809008 | |||
| 13457620 | Oct 1, 2013 | 8546098 | |||
| 12218980 | May 29, 2012 | 8187830 | |||
| 61037628 | Mar 18, 2008 | ||||
| 60950286 | Jul 17, 2007 | ||||
| Current U.S. Class: | 1/1 |
| Current CPC Class: | G01N 33/5091 (20130101); G01N 33/483 (20130101); A61P 9/10 (20180101); A61P 3/10 (20180101); G01N 33/5308 (20130101); A61P 3/04 (20180101); G01N 33/487 (20130101); G01N 33/6893 (20130101); G01N 2800/50 (20130101); G01N 2800/044 (20130101); G01N 2800/042 (20130101); G01N 2800/52 (20130101); G01N 2800/56 (20130101); G01N 2800/04 (20130101); G01N 2800/32 (20130101) |
| Current International Class: | G01N 33/68 (20060101); G01N 33/53 (20060101); G01N 33/483 (20060101); G01N 33/50 (20060101); G01N 33/487 (20060101) |
References Cited [Referenced By]
U.S. Patent Documents
| 5367052 | November 1994 | Cooper et al. |
| 6153419 | November 2000 | Aisaka et al. |
| 6653094 | November 2003 | Anderson et al. |
| 7005255 | February 2006 | Kaddurah-Daouk et al. |
| 7329489 | February 2008 | Kaddurah-Daouk et al. |
| 7648825 | January 2010 | Ellis et al. |
| 8187830 | May 2012 | Hu et al. |
| 8321154 | November 2012 | Adourian |
| 8546098 | October 2013 | Hu et al. |
| 2004/0101874 | May 2004 | Ghosh et al. |
| 2005/0014132 | January 2005 | Kaddurah-Daouk et al. |
| 2005/0014257 | January 2005 | Crooke et al. |
| 2006/0134676 | June 2006 | Kaddurah-Daouk et al. |
| 2006/0134677 | June 2006 | Kaddurah-Daouk et al. |
| 2006/0134678 | June 2006 | Kaddurah-Daouk et al. |
| 2006/0148690 | July 2006 | Bougueleret |
| 2006/0172311 | August 2006 | Cohen |
| 2007/0003946 | January 2007 | Ma et al. |
| 2007/0026389 | February 2007 | Kaddurah-Daouk et al. |
| 2007/0026458 | February 2007 | Polidori et al. |
| 2007/0072203 | March 2007 | Kaddurah-Daouk et al. |
| 2008/0261317 | October 2008 | Fifer |
| 2009/0155826 | June 2009 | Hu et al. |
| 2010/0236321 | September 2010 | Bethan et al. |
| 2012/0122981 | May 2012 | Hu et al. |
| 2013/0295692 | November 2013 | Wiemer et al. |
| 2001-190299 | Jul 2001 | JP | |||
| 2006-64457 | Mar 2003 | JP | |||
| 2004-505913 | Feb 2004 | JP | |||
| 2006-119036 | May 2006 | JP | |||
| 2008-523398 | Jul 2008 | JP | |||
| 2009-505648 | Feb 2009 | JP | |||
| 5701601 | Apr 2015 | JP | |||
| 5876918 | Mar 2016 | JP | |||
| 2006066263 | Jun 2006 | WO | |||
Other References
|
Sanders T. et al. High Intakes of Trans Monounsaturated Fatty Acids Taken for 2 Weeks . . . British J Nutrition 89(6)767-776, Jun. 2003. cited by examiner . Bonora et al., "Prevalence of Insulin Resistance in Metabolic Disorders," Diabetes, vol. 47, (Oct. 1998), pp. 1643-1649. cited by applicant . Bugianesi et al., "Insulin Resistance in Non-Diabetic Patients with Non-Alcoholic Fatty Liver Disease: Sites and Mechanisms," Diabetologia, vol. 48, (2005), pp. 634-642. cited by applicant . Geissler et al., "Analysis of Urine Organic Acids using Linear Retention Indices for the Determination of Metabolic Disorders," (Mar. 2, 2007), [online] [retrieved on Feb. 15, 2011]. Retrieved from http://license.icopyright.net/user/viewFreeUse.act?fuid=MTE3NYI2NDk%3D. cited by applicant . International Preliminary Report on Patentability, issued in commonly assigned PCT/US2010/029399, dated Oct. 13, 2011. cited by applicant . International Preliminary Report on Patentability, issued in PCT/US2008/008756, dated Aug. 31, 2010. cited by applicant . International Search Report, issued in commonly assigned PCT/US2010/029399, dated May 27, 2010. cited by applicant . International Search Report, issued in PCT/US2008/008756, dated Dec. 22, 2008. cited by applicant . Kassel et al., "Urinary Metabolites of L-Threonine in Type 1 Diabetes Determined by Combined Gas Chromatography/Chemical Ionization Mass Spectrometry," Biomedical and Environmental Mass Spectrometry, vol. 13, (1986), pp. 535-540. cited by applicant . Lawton et al., "Analysis of the Adult Human Plasma Metabolome," Pharmacogenomics, vol. 9, No. 4, (Apr. 2008), pp. 383-397. cited by applicant . Pitkanen, "Mannose, Mannitol, Fructose, and 1,5-anhydroglucitol Concentrations Measured by Gas Chromatography/Mass Sepectrometry in Blood Plasma of Diabetic Patients," Clinica Chimica Acta, vol. 251, (1996), pp. 91-103. cited by applicant . Ryals et al., "Metabolon, Inc.," Pharmacogenomics, vol. 8, No. 7, (Jul. 2007), pp. 863-866. cited by applicant . Sakul et al., "Familiality of Physical and Metabolic Characteristics that Predict the Development of Non-Insulin-Dependent Diabetes Mellitus in Pima Indians," Am. J. Hum. Genet., vol. 60, (1997), pp. 651-656. cited by applicant . Salek et al., "A Metabolomic Comparison of Urinary Changes in Type-2 Diabetes in Mouse, Rat and Human," Physiol Genomics, vol. 29, (2007), pp. 99-108. cited by applicant . Salek et al., "A Metabolomic Comparison of Urinary Changes in Type-2 Diabetes in Mouse, Rat and Human," Physiol Genomics, vol. 29, (2007), pp. 99-108--Supplementary Information, S1-S13. cited by applicant . Search Report, issued in commonly assigned Singapore Application No. 200908426-0, dated Mar. 1, 2011. cited by applicant . Shima et al., "Urinary Endogenous Concentrations of GHB and its Isomers in Healthy Humans and Diabetics," Forensic Science International, vol. 149, (2005), pp. 171-179. cited by applicant . Sidossis et al., "Glucose Plus Insulin Regulate Fat Oxidation by Controlling the Rate of Fatty Acid Entry into the Mitochondria," J. Clin. Invest., vol. 98, No. 10, (Nov. 1996), pp. 2244-2250. cited by applicant . Siebenand, "Ein Tropfen Blut bringt Sicherheit," Pharm. Ztg., vol. 151, (2006), pp. 34-38. cited by applicant . Wang et al., "Plasma Fatty Acid Composition and Incidence of Diabetes in Middle Aged Adults: The Atherosclerosis Risk in Communities (ARIC) Study," American J of Clinical Nutrition, vol. 78, No. 1, (Jul. 2003), pp. 91-98. cited by applicant . Yamanouchi et al., "Serum 1,5-anhydroglucitol (1,5 AG): New Clinical Marker for Glycemic Control," Diabetes Research and Clinical Practice, 24 Suppl, (1994), pp. S261-S268. cited by applicant . Yu et al., "Quantitative Analysis of Polar Lipids in the Nanoliter Level of Rat Serum by Liquid Chromatography/Mass Spectrometry/Mass Spectrometry," Exp Biol Med, vol. 234, (Feb. 2009), pp. 157-163. cited by applicant . Niwa T, Gas chromatographic mass spectrometric profile of organic acids in urine and serum of diabetic ketotic patients, Journal of Chromatography, (1981), vol. 225, No. 1, pp. 1-8. cited by applicant . Harano Y. Ketone bodies as markers for Type 1 (insulin-dependent) diabetes and their value in the monitoring of diabetic control, Diabetologia, (1984), vol. 26, No. 5, pp. 343-348. cited by applicant . Gall W, .alpha.-Hydroxybutyrate is an early biomarker of insulin resistance and glucose intolerance in a nondiabetic population, PloS One, May 28, 2010, vol. 5, No. 5, e10883--pp. 1-11. cited by applicant . Shigematsu Y, Urinary organic acids in natural early onset insulin-dependent diabetic dogs, Acta Paediatr Jpn, (1988), vol. 30, No. 3, pp. 285-293. cited by applicant . Search Report and translated Office Action, issued in commonly assigned Japanese Application No. 2015-236454, dated Oct. 20, 2016. cited by applicant . Office Action issued in commonly assigned application Canadian Application No. 2,690,541 dated Dec. 13, 2016. cited by applicant . Matsumoto et al., Gas chromatography-mas spectrometric studies of dihydrolipoyl dehydrogenase deficiency, International Journal of Mass Spectrometry and Ion Physics, (1983), vol. 48, pp. 229-231. cited by applicant . Miles et al., Determination of ketone body turnover in vivo with stable isotopes, utilizing gas chromatography/mass spectrometry, Analytical Biochemistry, (1984), vol. 141, No. 1, pp. 110-115. cited by applicant. |
Primary Examiner: Gitomer; Ralph J
Attorney, Agent or Firm: NK Patent Law
Parent Case Text
CROSS-REFERENCE TO RELATED APPLICATIONS
This application is a continuation of U.S. patent application Ser. No. 14/324,689, filed Jul. 7, 2014, now U.S. Pat. No. 9,250,225, which is a continuation of 13/966,475, filed Aug. 14, 2013, now U.S. Pat. No. 8,809,008, which is a divisional of U.S. patent application Ser. No. 13/457,620, filed Apr. 27, 2012, now U.S. Pat. No. 8,546,098, which is a divisional of U.S. patent application Ser. No. 12/218,980, filed Jul. 17, 2008, now U.S. Pat. No. 8,187,830, which claims the benefit of U.S. Provisional Application No. 60/950,286, filed Jul. 17, 2007, and U.S. Provisional Application No. 61/037,628, filed Mar. 18, 2008, the entireties of which are hereby incorporated by reference herein.
Claims
What is claimed is:
1. A method treating a cardiovascular disease in a subject, the method comprising: a) performing or having performed an assay using liquid chromatography-mass spectrometry to analyze a biological sample obtained from the subject to determine the levels of three or more biomarkers for a cardiovascular disease in the sample, wherein the three or more biomarkers are selected from the group consisting of sebacate, phenylalanine, histidine, 1,5-anhydroglucitol (1,5-AG), 2-hydroxybutyrate (AHB), oleate (18:1), and combinations thereof; b) determining the levels of the three or more biomarkers in the sample; c) performing analysis of the levels of the three or more biomarkers to determine whether the subject has or is predisposed to having a cardiovascular disease, wherein the analysis includes comparing the determined levels of the three or more biomarkers in the sample to cardiovascular disease-positive and/or cardiovascular disease-negative reference levels of the three or more biomarkers in order to determine if the subject has or is predisposed to having a cardiovascular disease; and d) administering an effective treatment to the subject if the subject is determined to have or to be predisposed to having a cardiovascular disease, wherein effective treatment comprises one or more of prescribing dietary restrictions, exercise, or early-stage drug treatment; administering an effective amount of a composition to the subject; or administering an effective amount of one or more biomarker(s) that are lowered in the subject diagnosed with cardiovascular disease as compared to a healthy subject not having cardiovascular disease.
2. The method of claim 1, wherein the method comprises analyzing the biological sample to determine the level of four or more biomarkers.
3. The method of claim 1, wherein the method comprises analyzing the biological sample to determine the level of five or more biomarkers.
4. The method of claim 1, wherein the cardiovascular disease is cardiomyopathy.
5. The method of claim 1, wherein the cardiovascular disease is atherosclerosis.
6. The method of claim 1, wherein the cardiovascular disease is atherosclerosis, and the method further comprises analyzing the biological sample to determine the level of one or more additional biomarkers selected from the group consisting of 3-methylhistidine, p-cresol sulfate, mannose, glucose, and gluconate.
7. The method of claim 1, wherein the method further comprises determining the subject's measurements of fasting plasma insulin, fasting plasma pro-insulin, fasting plasma glucose, fasting free fatty acids, HDL-cholesterol, LDL-cholesterol, C-peptide, adiponectin, peptide YY, hemoglobin A1C, waist circumference, body weight, or body mass index.
8. The method of claim 1, wherein the method further comprises analyzing the biological sample to determine the level of one or more additional biomarkers selected from the group consisting of arachidonate, cholesterol, creatinine, docosahexaenoate (DHA; 22:6n3), glucose, urate 3-methylhistidine, p-cresol sulfate, mannose, glucose, and gluconate.
Description
FIELD
The invention generally relates to biomarkers, methods for identifying biomarkers correlated to insulin resistance, cardiovascular disease, and metabolic-syndrome-related disorders and methods based on the same biomarkers.
BACKGROUND
Diabetes is classified as either type 1 (early onset) or type 2 (adult onset), with type 2 comprising 90-95% of the cases of diabetes. Diabetes is the final stage in a disease process that begins to affect individuals long before the diagnosis of diabetes is made. Type 2 diabetes develops over 10 to 20 years and results from an impaired ability to utilize glucose (glucose utilization) due to impaired sensitivity to insulin (insulin resistance).
In pre-diabetes, insulin becomes less effective at helping tissues metabolize glucose. Pre-diabetics may be detectable as early as 20 years before diabetic symptoms become evident. Studies have shown that although patients show very few symptoms, long-term physiological damage is already occurring at this stage. Up to 60% of these individuals will progress to type 2 diabetes within 10 years.
The American Diabetes Association (ADA) has recommended routine screening to detect patients with pre-diabetes. Current screening methods for prediabetes include the fasting plasma glucose (FPG) test, the oral glucose tolerance test (OGTT), the fasting insulin test and the hyperinsulinemic euglycemic clamp (HI clamp).
The first two tests are used clinically whereas the latter two tests are used extensively in research but rarely in the clinic. In addition, mathematical means (e.g., HOMA, QUICKI) that consider the fasting glucose and insulin levels together have been proposed. However, normal plasma insulin concentrations vary considerably between individuals as well as within an individual throughout the day. Further, these methods suffer from variability and methodological differences between laboratories and do not correlate rigorously with glucose clamp studies.
Worldwide, an estimated 194 million adults have type 2 diabetes and this number is expected to increase to 333 million by 2025, largely due to the epidemic of obesity in westernized societies. In the United States, it is estimated that over 54 million adults are pre-diabetic, depending on the level of insulin resistance. There are approximately 1.5 million new cases of type 2 diabetes a year in the United States. The annual US healthcare cost for diabetes is estimated at $174 billion. This figure has risen more than 32% since 2002. In industrialized countries such as the U.S., about 25% of medical expenditures treat glycemic control, 50% is associated with general medical care associated with diabetes, and the remaining 25% of the costs go to treat long-term complications, primarily cardiovascular disease. Considering the distribution of the healthcare costs and the fact that insulin resistance is a direct causal factor in cardiovascular disease and diabetes progression, it is no surprise that cardiovascular disease accounts for 70-80% of the mortality observed for diabetic patients. Detecting and preventing type 2 diabetes has become a major health care priority.
Diabetes may also lead to the development of other diseases or conditions, or is a risk factor in the development of conditions such as Metabolic Syndrome and cardiovascular diseases. Metabolic Syndrome is the clustering of a set of risk factors in an individual. According to the American Heart Association these risk factors include: abdominal obesity, decreased ability to properly process glucose (insulin resistance or glucose intolerance), dyslipidemia (high triglycerides, high LDL, low HDL cholesterol), hypertension, prothrombotic state (high fibrinogen or plasminogen activator inhibitor-1 in the blood) and proinflammatory state (elevated C-reactive protein in the blood). Metabolic Syndrome is also known as syndrome X, insulin resistance syndrome, obesity syndrome, dysmetabolic syndrome and Reaven's syndrome. Patients diagnosed with Metabolic Syndrome are at an increased risk of developing diabetes, cardiac and vascular disease. It is estimated that, in the United States, 20% of the adults (>50 million people) have metabolic syndrome. While it can affect anyone at any age, the incidence increases with increasing age and in individuals who are inactive, and significantly overweight, especially with excess abdominal fat.
Type 2 diabetes is the most common form of diabetes in the United States. According to the American Diabetes Foundation over 90% of the US diabetics suffer from Type 2 diabetes. Individuals with Type 2 diabetes have a combination of increased insulin resistance and decreased insulin secretion that combine to cause hyperglycemia. Most persons with Type 2 diabetes have Metabolic Syndrome.
The diagnosis for Metabolic Syndrome is based upon the clustering of three or more of the risk factors in an individual. There are no well-accepted criteria for diagnosing the metabolic syndrome. The criteria proposed by the National Cholesterol Education Program (NCEP) Adult Treatment Panel III (ATP III), with minor modifications, are currently recommended and widely used.
The American Heart Association and the National Heart, Lung, and Blood Institute recommend that the metabolic syndrome be identified as the presence of three or more of these components: increased waist circumference (Men--equal to or greater than 40 inches (102 cm), Women--equal to or greater than 35 inches (88 cm); elevated triglycerides (equal to or greater than 150 mg/dL); reduced HDL ("good") cholesterol (Men--less than 40 mg/dL, Women--less than 50 mg/dL); elevated blood pressure (equal to or greater than 130/85 mm Hg); elevated fasting glucose (equal to or greater than 100 mg/dL).
Type 2 diabetes develops slowly and often people first learn they have type 2 diabetes through blood tests done for another condition or as part of a routine exam. In some cases, type 2 diabetes may not be detected before damage to eyes, kidneys or other organs has occurred. A need exists for an objective, biochemical evaluation (e.g. lab test) that can be administered by a primary care provider to identify individuals that are at risk of developing Metabolic Syndrome or Type 2 diabetes.
Newer, more innovative molecular diagnostics that reflect the mechanisms of the patho-physiological progression to pre-diabetes and diabetes are needed because the prevalence of pre-diabetes and diabetes is increasing in global epidemic proportions. Mirroring the obesity epidemic, pre-diabetes and diabetes are largely preventable but are frequently undiagnosed or diagnosed too late due to the asymptomatic nature of the progression to clinical disease.
Therefore there is an unmet need for diagnostic biomarkers and tests that can identify pre-diabetics at risk of developing type 2 diabetes and to determine the risk of disease progression in subjects with insulin resistance. Insulin resistance biomarkers and diagnostic tests can better identify and determine the risk of diabetes development in a pre-diabetic subject, can monitor disease development and progression and/or regression, can allow new therapeutic treatments to be developed and can be used to test therapeutic agents for efficacy on reversing pre-diabetes and/or preventing diabetes. Further, a need exists for diagnostic biomarkers to more effectively assess the efficacy and safety of pre-diabetic and diabetic therapeutic candidates.
SUMMARY OF THE INVENTION
In one embodiment, the present disclosure provides a method of diagnosing insulin resistance in a subject, the method comprising analyzing a biological sample from a subject to determine the level(s) of one or more biomarkers for insulin resistance in the sample, where the one or more biomarkers are selected from one or more biomarkers listed in Tables 4, 5, 6, 7, 8, 9A, 9B, 27, 28, 29 and combinations thereof; and comparing the level(s) of the one or more biomarkers in the sample to insulin resistance-positive and/or insulin resistance-negative reference levels of the one or more biomarkers in order to diagnose whether the subject is insulin resistant.
In another embodiment, the present disclosure provides a method of predicting the glucose disposal rate in a subject, the method comprising, analyzing a biological sample from a subject to determine the level(s) of one or more biomarkers for insulin resistance in the sample, where the one or more biomarkers are selected from one or more biomarkers listed in Tables 4, 5, 6, 7, 8, 9A, 9B, and combinations thereof; and comparing the level(s) of the one or more biomarkers in the sample to glucose disposal reference levels of the one or more biomarkers in order to predict the glucosal disposal rate in the subject.
The disclosure also provides a method of classifying a subject according to glucose tolerance from normal glucose tolerance (NGT), impaired fasting glucose tolerance (IFG), or impaired glucose tolerance (IGT), to type-2 diabetes, the method comprising, analyzing a biological sample from a subject to determine the level(s) of one or more biomarkers for glucose tolerance in the sample, where the one or more biomarkers are selected from one or more biomarkers listed in Tables 4, 5, 6, 7, 8, 9A, 9B, and combinations thereof; and comparing the level(s) of the one or more biomarkers in the sample to glucose tolerance reference levels of the one or more biomarkers in order to classify the subject as having NGT, IFG, IGT, or diabetic.
Further provided is a method of determining susceptibility of a subject to developing type-2 diabetes, the method comprising, analyzing a biological sample from a subject to determine the level(s) of one or more biomarkers for pre-diabetes in the sample, where the one or more biomarkers are selected from one or more biomarkers listed in Tables 4, 5, 6, 7, 8, 9A, 9B, and combinations thereof; and comparing the level(s) of the one or more biomarkers in the sample to diabetes-positive and/or diabetes-negative reference levels of the one or more biomarkers in order to diagnose whether the subject is susceptible to developing type-2 diabetes.
The present disclosure also provides a method of determining an insulin resistance score in a subject, the method comprising, analyzing a biological sample from a subject to determine the level(s) of one or more biomarkers in the sample, where the one or more biomarkers are selected from one or more biomarkers listed in Tables 4, 5, 6, 7, 8, 9A, 9B, and combinations thereof; and comparing the level(s) of the one or more biomarkers in the sample to insulin resistance reference levels of the one or more biomarkers in order to determine an insulin resistance score for the subject.
In another embodiment, the present disclosure provides a method of monitoring the progression or regression of pre-diabetes in a subject, the method comprising, analyzing a biological sample from a subject to determine the level(s) of one or more biomarkers for pre-diabetes in the sample, where the one or more biomarkers are selected from one or more biomarkers listed in Tables 4, 5, 6, 7, 8, 9A, 9B, and combinations thereof; and comparing the level(s) of the one or more biomarkers in the sample to pre-diabetes progression and/or pre-diabetes-regression reference levels of the one or more biomarkers in order to monitor the progression or regression of pre-diabetes in a subject.
In yet another embodiment, the present disclosure provides a method of monitoring the efficacy of insulin resistance treatment, the method comprising: analyzing a first biological sample from a subject to determine the level(s) of one or more biomarkers for pre-diabetes, the first sample obtained from the subject at a first time point wherein the one or more biomarkers are selected from one or more biomarkers listed in Tables 4, 5, 6, 7, and 8, and combinations thereof; treating the subject for insulin resistance; analyzing a second biological sample from the subject to determine the level(s) of the one or more biomarkers, the second sample obtained from the subject at a second time point after treatment; comparing the level(s) of one or more biomarkers in the first sample to the level(s) of the one or more biomarkers in the second sample to assess the efficacy of the treatment for treating insulin resistance.
The present disclosure further provides a method of diagnosing whether a subject has metabolic syndrome, the method comprising, analyzing a biological sample from a subject to determine the level(s) of one or more biomarkers for metabolic syndrome in the sample, where the one or more biomarkers are selected from one or more biomarkers listed in Tables 12 and 13, analyzing the biological sample to determine the level(s) of one or more biomarkers for glucose disposal, obesity, and/or cardiovascular disease, wherein the one or more biomarkers for glucose disposal, obesity, and/or cardiovascular disease are selected from one or more biomarkers identified in Tables 4, 5, 6, 7, 8, 9A, 9B, 14, 15, 16, 17, 21, 22, 23, 25, 26, 27, 28, and combinations thereof; and comparing the level(s) of the one or more biomarkers in the sample to the respective disorder-positive and/or disorder-negative reference levels of the one or more biomarkers in order to diagnose whether the subject has the metabolic syndrome.
In another embodiment, the present disclosure provides a method of diagnosing a cardiovascular disease in a subject, the method comprising, analyzing a biological sample from a subject to determine the level(s) of one or more biomarkers for a cardiovascular disease in the sample, where the one or more biomarkers are selected from one or more biomarkers listed in Tables 14, 15, 16, 17, 21, 22, 23, 25, and combinations thereof; and comparing the level(s) of the one or more biomarkers in the sample to disease-positive and/or disease-negative reference levels of the one or more biomarkers in order to diagnose whether the subject has cardiomyopathy or atherosclerosis.
The disclosure further provides a method for determining whether a subject is predisposed to becoming obese, the method comprising: analyzing a biological sample from a subject to determine the level(s) of one or more biomarkers for obesity in the sample, where the one or more biomarkers are selected from one or more biomarkers listed in Table 26; and comparing the level(s) of the one or more biomarkers in the sample to obesity-positive and/or obesity-negative and/or lean-positive and/or lean-negative reference levels of the one or more biomarkers in order to determine whether the subject is susceptible to obesity.
In yet a further embodiment, the disclosure provides a method for determining whether a therapeutic agent is capable of inducing weight gain in a subject, the method comprising: analyzing a biological sample from a subject receiving a therapeutic agent to determine the level(s) of one or more biomarkers for obesity in the sample, where the one or more biomarkers are selected from one or more biomarkers listed in Table 26; and comparing the level(s) of the one or more biomarkers in the sample to obesity-positive and/or obesity-negative and/or lean-positive and/or lean-negative reference levels of the one or more biomarkers in order to determine whether the subject is susceptible to gaining weight.
The present disclosure also provides a method for predicting a subject's response to a course of treatment for pre-diabetes or diabetes, the method comprising: analyzing a biological sample from a subject to determine the level(s) of one or more biomarkers for pre-diabetes, where the one or more biomarkers are selected from one or more biomarkers listed in Table 27; comparing the level(s) of one or more biomarkers in the sample to treatment-positive and/or treatment-negative reference levels of the one or more biomarkers to predict whether the subject is likely to respond to a course of treatment.
The disclosure also provides a method for monitoring a subject's response to a treatment for pre-diabetes or diabetes, the method comprising: analyzing a first biological sample from a subject to determine the level(s) of one or more biomarkers for pre-diabetes, the first sample obtained from the subject at a first time point where the one or more biomarkers are selected from one or more biomarkers listed in Table 28; administering the composition to the subject; analyzing a second biological sample from the subject to determine the level(s) of the one or more biomarkers, the second sample obtained from the subject at a second time point after administration of the composition; comparing the level(s) of one or more biomarkers in the first sample to the level(s) of the one or more biomarkers in the second sample to assess the efficacy of the composition for treating pre-diabetes or diabetes.
BRIEF DESCRIPTION OF THE DRAWINGS
FIG. 1 provides a graph showing the mean R.sup.2 values of Rd correlation as a function of the number of metabolites. As the number of compounds increases (from right to left), the r-square value for Rd correlation (Y) increases until it reaches an optimal number (n<30), indicating that variable selection is more or less stable for the approximately first 30 variables.
FIG. 2 provides a graph showing the mean R.sup.2 values of Rd correlation as a function of the number of metabolites. As the number of compounds increases (from right to left), test error for Rd correlation (Y) decreases until it reach an optimal number (n<30), indicating that variable selection is more or less stable for the approximately first 30 variables.
FIG. 3 provides a graph showing the mean R-square values (Y-axis) of Rd correlation as a function of the number of metabolites (X-axis).
FIG. 4 provides a graph showing the mean test error values (Y-axis) of Rd correlation as a function of the number of metabolites (X-axis).
FIG. 5 provides a schematic example of a report describing prophetic results of an algorithm using insulin resistance biomarkers to determine a subject's level of insulin resistance that is reported as an "IR Score" and containing additional clinical information (e.g. BMI, demographic information).
FIG. 6 provides a schematic illustration comparing the use of biomarkers for patient stratification according to the level of insulin resistance and the use of biomarkers for patient risk stratification for the progression of insulin resistance.
FIG. 7 provides a Random Forest Analysis Importance plot of one embodiment of metabolites that are useful biomarkers for predicting glucose disposal.
FIG. 8 provides a Random Forest Analysis Importance Plot of one embodiment of serum metabolites that are useful biomarkers for predicting metabolic syndrome.
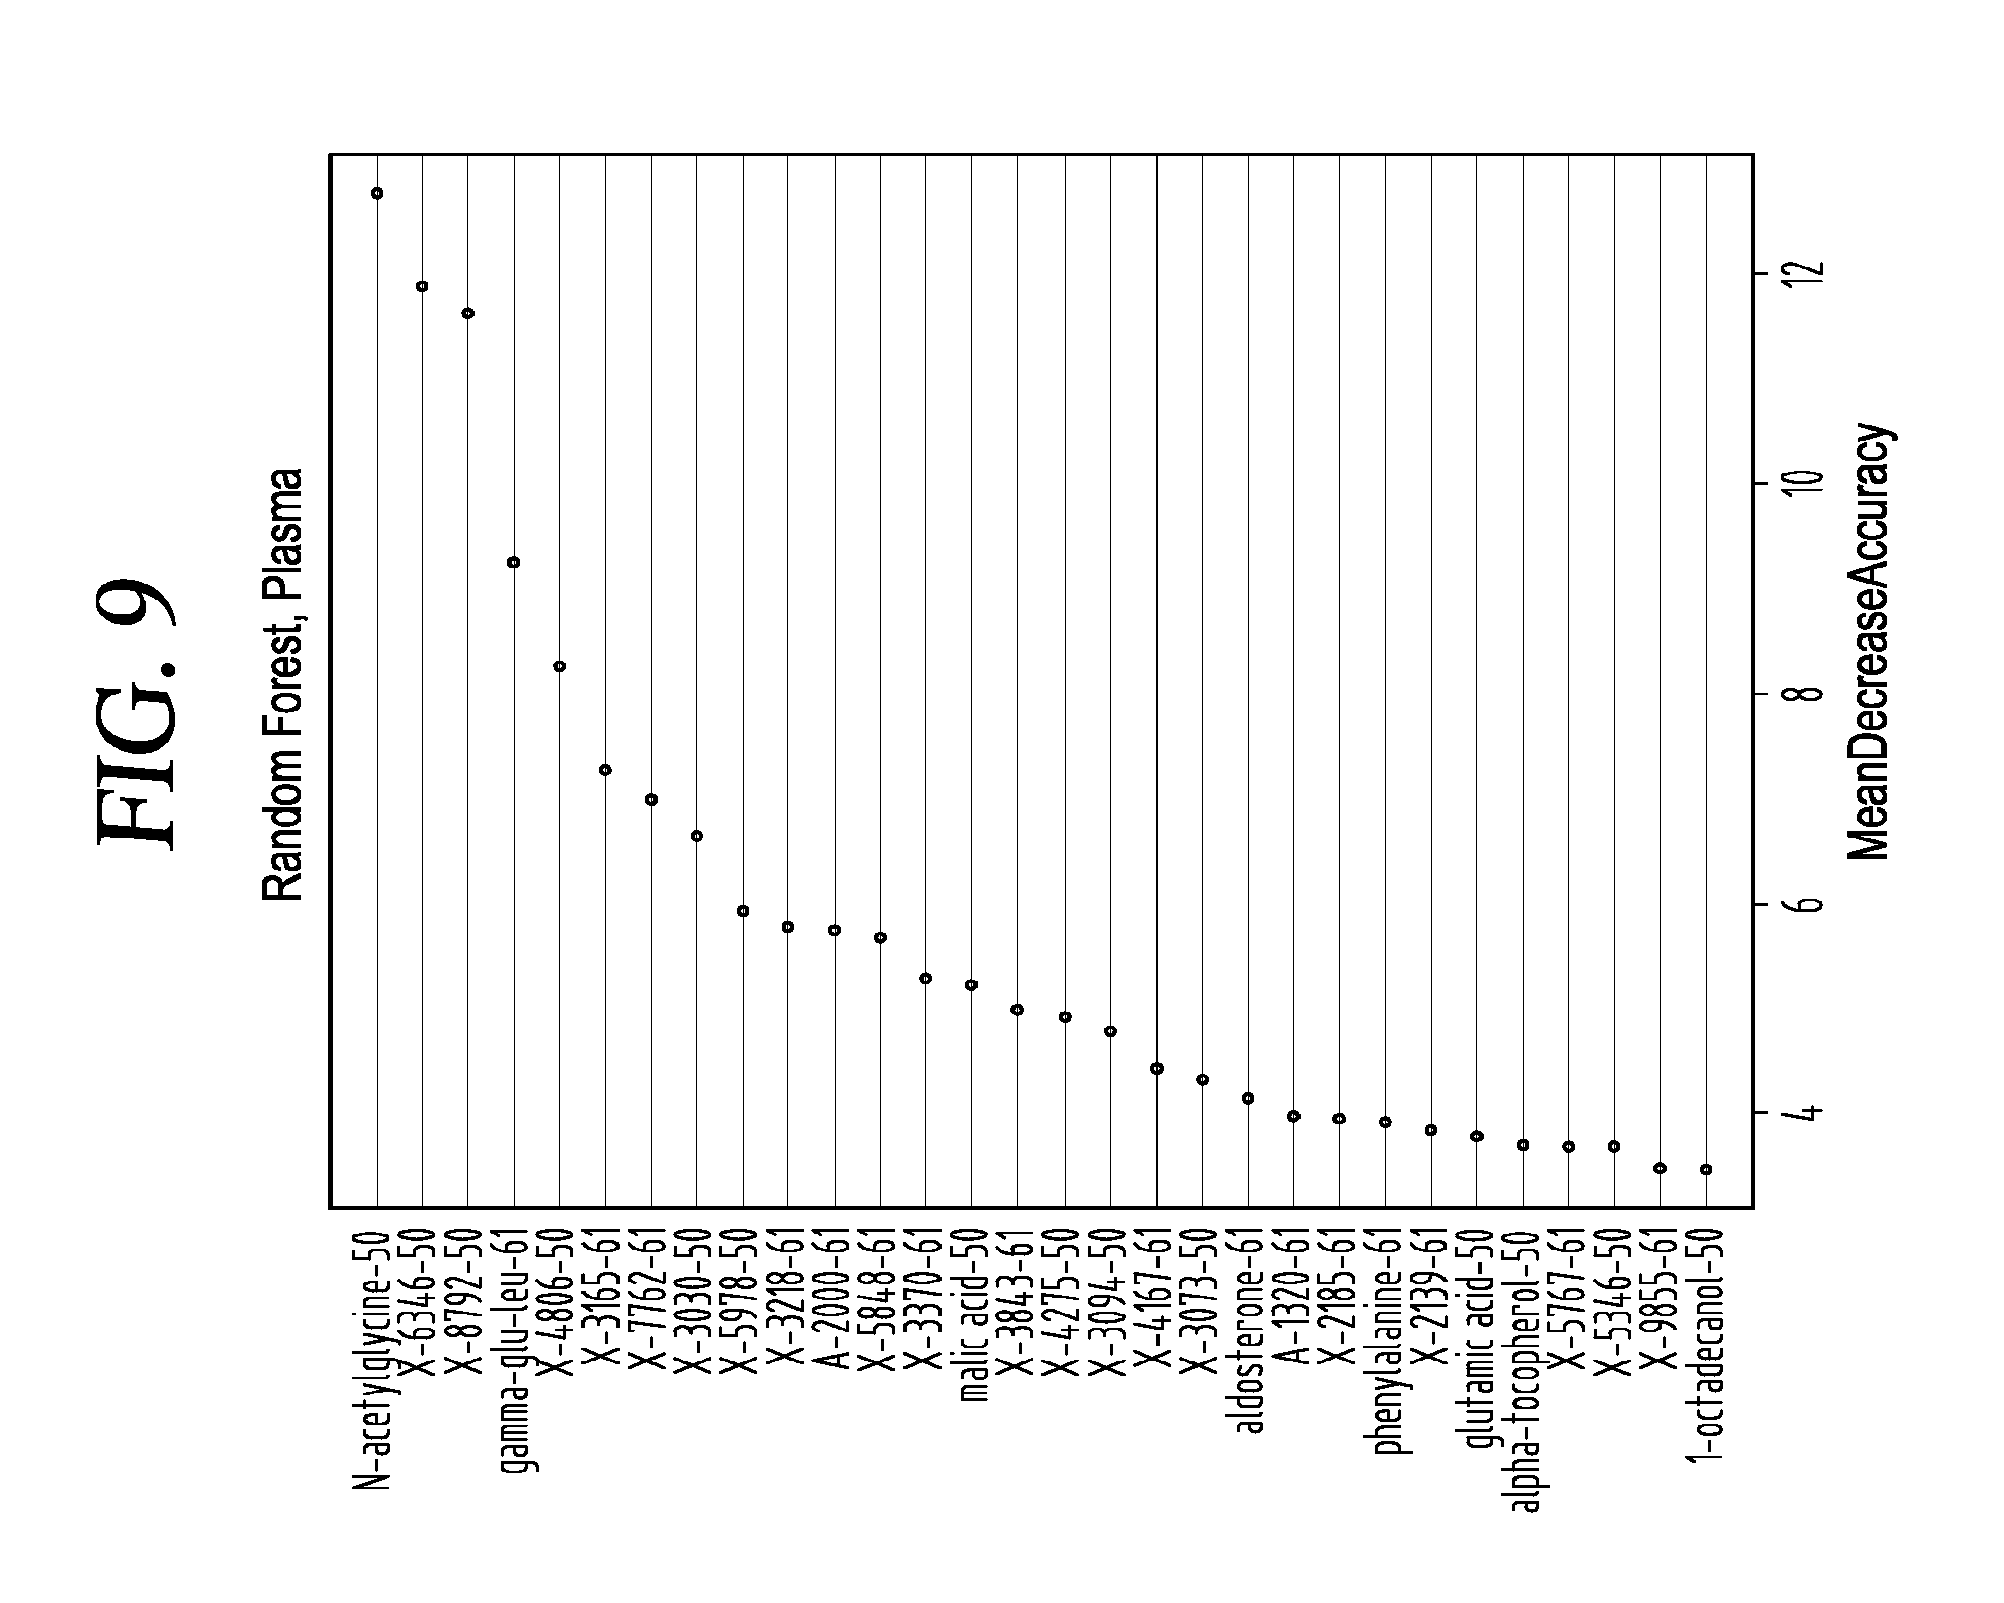
FIG. 9 provides a Random Forest Analysis Importance Plot of one embodiment of plasma metabolites that are useful biomarkers for predicting metabolic syndrome.
FIG. 10A provides a Random Forest Analysis Importance Plot of an embodiment of metabolites from plasma that are useful biomarkers for predicting atherosclerosis at an early (initiation) stage of the disease.
FIG. 10B provides a Random Forest Analysis Importance Plot of an embodiment of metabolites from plasma that are useful biomarkers for predicting atherosclerosis at a mid-stage of the disease.
FIG. 10C provides a Random Forest Analysis Importance Plot of an embodiment of metabolites from plasma that are useful biomarkers for predicting atherosclerosis at a late stage of the disease.
FIG. 10D provides a Random Forest Analysis Importance Plot of an embodiment of metabolites from plasma that are useful biomarkers for predicting atherosclerosis in subjects at all stages of the disease.
FIG. 11A provides a Random Forest Analysis Importance Plot of an embodiment of metabolites from aorta tissue that are useful biomarkers for predicting atherosclerosis at an early (initiation) stage of the disease.
FIG. 11B provides a Random Forest Analysis Importance Plot of an embodiment of metabolites from aorta tissue that are useful biomarkers for predicting atherosclerosis at a mid-stage of the disease.
FIG. 11C provides a Random Forest Analysis Importance Plot of an embodiment of metabolites from aorta tissue that are useful biomarkers for predicting atherosclerosis at a late stage of the disease.
FIG. 11D provides a Random Forest Analysis Importance Plot of an embodiment of metabolites produced from aorta tissue that are useful biomarkers for predicting atherosclerosis at all stages of the disease.
FIG. 12A provides a Random Forest Analysis Importance Plot of an embodiment of metabolites from liver tissue that are useful biomarkers for predicting atherosclerosis at an early (initiation) stage of the disease.
FIG. 12B provides a Random Forest Analysis Importance Plot of an embodiment of metabolites from liver tissue that are useful biomarkers for predicting atherosclerosis at a mid-stage of the disease.
FIG. 12C provides a Random Forest Analysis Importance Plot of an embodiment of metabolites from liver tissue that are useful biomarkers for predicting atherosclerosis at a late stage of the disease.
FIG. 12D provides a Random Forest Analysis Importance Plot of an embodiment of metabolites from liver tissue that are useful biomarkers for predicting atherosclerosis at all stages of the disease.
FIG. 13 provides an example of plasma levels of cholesterol in atherosclerosis subjects and control subjects at different ages.
FIG. 14 provides an example of plasma levels of docosahexaenoic acid in atherosclerosis subjects and control subjects at different ages.
FIG. 15 provides an example of plasma levels of Metabolite-7888 in atherosclerosis subjects and control subjects at different ages.
FIG. 16 provides an example of plasma levels of Metabolite-X8403 in atherosclerosis subjects and control subjects at different ages.
FIG. 17 provides an example of plasma levels of Metabolite-X1834 in atherosclerosis subjects and control subjects at different ages.
FIG. 18 provides an example of plasma levels of p-cresol-sulfate in atherosclerosis subjects and control subjects at different ages.
FIG. 19 provides an example of plasma levels of Metabolite-4887 in atherosclerosis subjects and control subjects at different ages.
FIG. 20 provides an example of recursive partitioning of DCM biomarker metabolites.
FIG. 21 provides an example of model validation using plasma from metabolic syndrome and healthy subjects.
FIG. 22 provides an example of a model validation using serum from metabolic syndrome and healthy subjects.
FIG. 23 provides an example of a regression analysis showing the predictive power of the ten models combined on the glucose disposal rate (Rd).
FIG. 24 provides and illustration of the inter-relationships of the various risk factors for metabolic syndrome.
DETAILED DESCRIPTION OF THE INVENTION
The present invention relates to biomarkers of pre-diabetes (e.g. impaired glucose tolerance, impaired fasting glucose tolerance, insulin resistance) and type-2 diabetes; methods for diagnosis of pre-diabetes and type 2 diabetes; methods of determining predisposition to pre-diabetes and type 2 diabetes; methods of monitoring progression/regression of pre-diabetes and type 2 diabetes; methods of assessing efficacy of compositions for treating pre-diabetes and type 2 diabetes; methods of screening compositions for activity in modulating biomarkers of pre-diabetes and type 2 diabetes; methods of treating pre-diabetes and type 2 diabetes; as well as other methods based on biomarkers of pre-diabetes and type 2 diabetes.
Current blood tests for insulin resistance perform poorly for early detection of insulin resistance or involve significant medical procedures.
Using metabolomic analysis, panels of metabolites that can be used in a simple blood test to predict insulin resistance as measured by the "gold standard" of hyperinsulinemic euglycemic clamps in at least two independent cohorts of subjects were discovered.
Independent studies were carried out to identify a set of biomarkers that when used with a polynomic algorithm will enable the early detection of changes in insulin resistance in a subject. The instant invention provides the subject with a score indicating the level of insulin resistance ("IR Score") of the subject. The score can be based upon clinically significant changed reference level for a biomarker and/or combination of biomarkers. The reference level can be derived from an algorithm or computed from indices for impaired glucose tolerance and can be presented in a report as shown in FIG. 5. The IR Score places the subject in the range of insulin resistance from normal to high. Disease progression or remission can be monitored by periodic determination and monitoring of the IR Score. Response to therapeutic intervention can be determined by monitoring the IR Score. The IR Score can also be used to evaluate drug efficacy.
The present invention also relates to biomarkers of metabolic syndrome and cardiovascular diseases, such as atherosclerosis and cardiomyopathy; methods for diagnosis of such diseases and syndromes; methods of determining predisposition to such diseases and syndromes; methods of monitoring progression/regression of such diseases and syndromes; methods of assessing efficacy of compositions for treating such diseases and syndromes; methods of screening compositions for activity in modulating biomarkers of such diseases and syndromes; methods of treating such diseases and syndromes; as well as other methods based on biomarkers of such diseases and syndromes.
Prior to describing this invention in further detail, however, the following terms will first be defined.
Definitions
"Biomarker" means a compound, preferably a metabolite, that is differentially present (i.e., increased or decreased) in a biological sample from a subject or a group of subjects having a first phenotype (e.g., having a disease) as compared to a biological sample from a subject or group of subjects having a second phenotype (e.g., not having the disease). A biomarker may be differentially present at any level, but is generally present at a level that is increased by at least 5%, by at least 10%, by at least 15%, by at least 20%, by at least 25%, by at least 30%, by at least 35%, by at least 40%, by at least 45%, by at least 50%, by at least 55%, by at least 60%, by at least 65%, by at least 70%, by at least 75%, by at least 80%, by at least 85%, by at least 90%, by at least 95%, by at least 100%, by at least 110%, by at least 120%, by at least 130%, by at least 140%, by at least 150%, or more; or is generally present at a level that is decreased by at least 5%, by at least 10%, by at least 15%, by at least 20%, by at least 25%, by at least 30%, by at least 35%, by at least 40%, by at least 45%, by at least 50%, by at least 55%, by at least 60%, by at least 65%, by at least 70%, by at least 75%, by at least 80%, by at least 85%, by at least 90%, by at least 95%, or by 100% (i.e., absent). A biomarker is preferably differentially present at a level that is statistically significant (e.g., a p-value less than 0.05 and/or a q-value of less than 0.10 as determined using either Welch's T-test or Wilcoxon's rank-sum Test). Alternatively, the biomarkers demonstrate a correlation with pre-diabetes, or particular levels of pre-diabetes. The range of possible correlations is between negative (-) 1 and positive (+) 1. A result of negative (-) 1 means a perfect negative correlation and a positive (+) 1 means a perfect positive correlation, and 0 means no correlation at all. A "substantial positive correlation" refers to a biomarker having a correlation from +0.25 to +1.0 with a disorder or with a clinical measurement (e.g., Rd), while a "substantial negative correlation" refers to a correlation from -0.25 to -1.0 with a given disorder or clinical measurement. A "significant positive correlation" refers to a biomarker having a correlation of from +0.5 to +1.0 with a given disorder or clinical measurement (e.g., Rd), while a "significant negative correlation" refers to a correlation to a disorder of from -0.5 to -1.0 with a given disorder or clinical measurement.
The "level" of one or more biomarkers means the absolute or relative amount or concentration of the biomarker in the sample.
"Sample" or "biological sample" or "specimen" means biological material isolated from a subject. The biological sample may contain any biological material suitable for detecting the desired biomarkers, and may comprise cellular and/or non-cellular material from the subject. The sample can be isolated from any suitable biological tissue or fluid such as, for example, adipose tissue, aortic tissue, liver tissue, blood, blood plasma, serum, or urine.
"Subject" means any animal, but is preferably a mammal, such as, for example, a human, monkey, non-human primate, rat, mouse, cow, dog, cat, pig, horse, or rabbit.
A "reference level" of a biomarker means a level of the biomarker that is indicative of a particular disease state, phenotype, or lack thereof, as well as combinations of disease states, phenotypes, or lack thereof. A "positive" reference level of a biomarker means a level that is indicative of a particular disease state or phenotype. A "negative" reference level of a biomarker means a level that is indicative of a lack of a particular disease state or phenotype. For example, a "pre-diabetes-positive reference level" of a biomarker means a level of a biomarker that is indicative of a positive diagnosis of pre-diabetes in a subject, and a "pre-diabetes-negative reference level" of a biomarker means a level of a biomarker that is indicative of a negative diagnosis of pre-diabetes in a subject. As another example, a "pre-diabetes-progression-positive reference level" of a biomarker means a level of a biomarker that is indicative of progression of the pre-diabetes in a subject, and a "pre-diabetes-regression-positive reference level" of a biomarker means a level of a biomarker that is indicative of regression of the pre-diabetes. A "reference level" of a biomarker may be an absolute or relative amount or concentration of the biomarker, a presence or absence of the biomarker, a range of amount or concentration of the biomarker, a minimum and/or maximum amount or concentration of the biomarker, a mean amount or concentration of the biomarker, and/or a median amount or concentration of the biomarker; and, in addition, "reference levels" of combinations of biomarkers may also be ratios of absolute or relative amounts or concentrations of two or more biomarkers with respect to each other. Appropriate positive and negative reference levels of biomarkers for a particular disease state, phenotype, or lack thereof may be determined by measuring levels of desired biomarkers in one or more appropriate subjects, and such reference levels may be tailored to specific populations of subjects (e.g., a reference level may be age-matched so that comparisons may be made between biomarker levels in samples from subjects of a certain age and reference levels for a particular disease state, phenotype, or lack thereof in a certain age group). Such reference levels may also be tailored to specific techniques that are used to measure levels of biomarkers in biological samples (e.g., LC-MS, GC-MS, etc.), where the levels of biomarkers may differ based on the specific technique that is used.
"Non-biomarker compound" means a compound that is not differentially present in a biological sample from a subject or a group of subjects having a first phenotype (e.g., having a first disease) as compared to a biological sample from a subject or group of subjects having a second phenotype (e.g., not having the first disease). Such non-biomarker compounds may, however, be biomarkers in a biological sample from a subject or a group of subjects having a third phenotype (e.g., having a second disease) as compared to the first phenotype (e.g., having the first disease) or the second phenotype (e.g., not having the first disease).
"Metabolite", or "small molecule", means organic and inorganic molecules which are present in a cell. The term does not include large macromolecules, such as large proteins (e.g., proteins with molecular weights over 2,000, 3,000, 4,000, 5,000, 6,000, 7,000, 8,000, 9,000, or 10,000), large nucleic acids (e.g., nucleic acids with molecular weights of over 2,000, 3,000, 4,000, 5,000, 6,000, 7,000, 8,000, 9,000, or 10,000), or large polysaccharides (e.g., polysaccharides with a molecular weights of over 2,000, 3,000, 4,000, 5,000, 6,000, 7,000, 8,000, 9,000, or 10,000). The small molecules of the cell are generally found free in solution in the cytoplasm or in other organelles, such as the mitochondria, where they form a pool of intermediates which can be metabolized further or used to generate large molecules, called macromolecules. The term "small molecules" includes signaling molecules and intermediates in the chemical reactions that transform energy derived from food into usable forms. Examples of small molecules include sugars, fatty acids, amino acids, nucleotides, intermediates formed during cellular processes, and other small molecules found within the cell.
"Metabolic profile", or "small molecule profile", means a complete or partial inventory of small molecules within a targeted cell, tissue, organ, organism, or fraction thereof (e.g., cellular compartment). The inventory may include the quantity and/or type of small molecules present. The "small molecule profile" may be determined using a single technique or multiple different techniques.
"Metabolome" means all of the small molecules present in a given organism.
"Metabolic disorder" refers to disorders or diseases that result in perturbation of the normal physiological state of homeostasis due to an alteration in metabolism (anabolism and/or catabolism). An alteration in metabolism can result from an inability to break down (catabolize) a substance that should be broken down (e.g. phenylalanine) and as a result the substance and/or an intermediate substance builds up to toxic levels, or from an inability to produce (anabolize) some essential substance (e.g. insulin).
"Metabolic syndrome" refers to the concept of a clustering of metabolic risk factors that come together in a single individual and lead to a high risk of developing diabetes and/or cardiovascular diseases. The main features of metabolic syndrome include insulin resistance, hypertension (high blood pressure), cholesterol abnormalities, dyslipidemia, triglyceride abnormalities, an increased risk for clotting and excess body weight, especially in the abdomen, or obesity. Metabolic syndrome is also known as syndrome X, insulin resistance syndrome, obesity syndrome, dysmetabolic syndrome and Reaven's syndrome. The inter-relationships of the various risk factors for metabolic syndrome are illustrated in FIG. 24. The presence of three or more of the risk factors in a single individual is indicative of metabolic syndrome. The American Heart Association suggests that metabolic syndrome be diagnosed by the presence of three or more of the following components: (1) an elevated waste circumference (men, equal to or greater than 40 inches (102 cm); women, equal to or greater than 35 inches (88 cm)); (2) elevated triglycerides (equal to or greater than 150 mg/dL); (3) reduced High Density Lipids or HDL (men, less than 40 mg/dL; women, less than 50 mg/dL); (4) elevated blood pressure (equal to or greater than 130/85 mm Hg); and (5) elevated fasting glucose (equal to or greater than 100 mg/dL).
"Metabolic syndrome-related metabolic disorder" as used herein refers to metabolic syndrome as well as obesity, insulin resistance, type-2 diabetes, atherosclerosis, and cardiomyopathy.
"Diabetes" refers to a group of metabolic diseases characterized by high blood sugar (glucose) levels which result from defects in insulin secretion or action, or both.
"Type 2 diabetes" refers to one of the two major types of diabetes, the type in which the beta cells of the pancreas produce insulin, at least in the early stages of the disease, but the body is unable to use it effectively because the cells of the body are resistant to the action of insulin. In later stages of the disease the beta cells may stop producing insulin. Type 2 diabetes is also known as insulin-resistant diabetes, non-insulin dependent diabetes and adult-onset diabetes.
"Pre-diabetes" refers to one or more early diabetic conditions including impaired glucose utilization, abnormal or impaired fasting glucose levels, impaired glucose tolerance, impaired insulin sensitivity and insulin resistance.
"Insulin resistance" refers to the condition when cells become resistant to the effects of insulin--a hormone that regulates the uptake of glucose into cells--or when the amount of insulin produced is insufficient to maintain a normal glucose level. Cells are diminished in the ability to respond to the action of insulin in promoting the transport of the sugar glucose from blood into muscles and other tissues(i.e. sensitivity to insulin decreases). Eventually, the pancreas produces far more insulin than normal and the cells continue to be resistant. As long as enough insulin is produced to overcome this resistance, blood glucose levels remain normal. Once the pancreas is no longer able to keep up, blood glucose starts to rise, resulting in diabetes. Insulin resistance ranges from normal (insulin sensitive) to insulin resistant (IR).
"Insulin sensitivity" refers to the ability of cells to respond to the effects of insulin to regulate the uptake and utilization of glucose. Insulin sensitivity ranges from normal to Insulin Resistant (IR).
The "IR Score" is a measure of insulin resistance based upon the insulin resistance biomarkers and algorithms of the instant invention that will allow the physician to place the patient on the spectrum of glucose tolerance, from normal to high.
"Glucose utilization" refers to the absorption of glucose from the blood by muscle and fat cells and utilization of the sugar for cellular metabolism. The uptake of glucose into cells is stimulated by insulin.
"Rd" refers to glucose disposal rate, a metric for glucose utilization. The rate at which glucose disappears from the blood (disposal rate) is an indication of the ability of the body to respond to insulin (i.e. insulin sensitivity). There are several methods to determine Rd and the hyperinsulinemic euglycemic clamp is regarded as the "gold standard" method. In this technique, while a fixed amount of insulin is infused, the blood glucose is "clamped" at a predetermined level by the titration of a variable rate of glucose infusion. The underlying principle is that upon reaching steady state, by definition, glucose disposal is equivalent to glucose appearance. During hyperinsulinemia, glucose disposal (Rd) is primarily accounted for by glucose uptake into skeletal muscle, and glucose appearance is equal to the sum of the exogenous glucose infusion rate plus the rate of hepatic glucose output (HGO). The rate of glucose infusion during the last 30 minutes of the test determines insulin sensitivity. If high levels (Rd=7.5 mg/min or higher) are required, the patient is insulin-sensitive. Very low levels (Rd=4.0 mg/min or lower) indicate that the body is resistant to insulin action. Levels between 4.0 and 7.5 min (Rd values between 4.0 mg/min and 7.5 mg/min) are not definitive and suggest "impaired glucose tolerance," an early sign of insulin resistance.
"Impaired fasting glucose (IFG)" and "impaired glucose tolerance (IGT)" are the two clinical definitions of "pre-diabetes". IFG is defined as a fasting blood glucose concentration of 100-125 mg/dL. IGT is defined as a postprandial (after eating) blood glucose concentration of 140-199 mg/dL. It is known that IFG and IGT do not always detect the same pre-diabetic populations. Between the two populations there is approximately a 60% overlap observed. Fasting plasma glucose levels are a more efficient means of inferring a patient's pancreatic function, or insulin secretion, whereas postprandial glucose levels are more frequently associated with inferring levels of insulin sensitivity or resistance. IGT is known to identify a greater percentage of the pre-diabetic population compared to IFG. The IFG condition is associated with lower insulin secretion, whereas the IGT condition is known to be strongly associated with insulin resistance. Numerous studies have been carried out that demonstrate that IGT individuals with normal FPG values are at increased risk for cardiovascular disease. Patients with normal FPG values may have abnormal postprandial glucose values and are often unaware of their risk for pre-diabetes, diabetes, and cardiovascular disease.
"Fasting plasma glucose (FPG) test" is a simple test measuring blood glucose levels after an 8 hour fast. According to the ADA, blood glucose concentration of 100-125 mg/dL is considered IFG and defines pre-diabetes whereas .gtoreq.126 mg/dL defines diabetes. As stated by the ADA, FPG is the preferred test to diagnose diabetes and pre-diabetes due to its ease of use, patient acceptability, lower cost, and relative reproducibility. The weakness in the FPG test is that patients are quite advanced toward Type 2 Diabetes before fasting glucose levels change.
"Oral glucose tolerance test (OGTT)", a dynamic measurement of glucose, is a postprandial measurement of a patient's blood glucose levels after oral ingestion of a 75 g glucose drink. Traditional measurements include a fasting blood sample at the beginning of the test, a one hour time point blood sample, and a 2 hour time point blood sample. A patient's blood glucose concentration at the 2 hour time point defines the level of glucose tolerance: Normal glucose tolerance (NGT).ltoreq.140 mg/dL blood glucose; Impaired glucose tolerance (IGT)=140-199 mg/dL blood glucose; Diabetes.gtoreq.200 mg/dL blood glucose. As stated by the ADA, even though the OGTT is known to be more sensitive and specific at diagnosing pre-diabetes and diabetes, it is not recommended for routine clinical use because of its poor reproducibility and difficulty to perform in practice.
"Fasting insulin test" measures the circulating mature form of insulin in plasma. The current definition of hyperinsulinemia is difficult due to lack of standardization of insulin immunoassays, cross-reactivity to proinsulin forms, and no consensus on analytical requirements for the assays. Within-assay CVs range from 3.7%-39% and among-assay CVs range from 12%-66%. Therefore, fasting insulin is not commonly measured in the clinical setting and is limited to the research setting.
The "hyperinsulinemic euglycemic clamp (HI clamp)" is considered worldwide as the "gold standard" for measuring insulin resistance in patients. It is performed in a research setting, requires insertion of two catheters into the patient and the patient must remain immobilized for up to six hours. The HI clamp involves creating steady-state hyperinsulinemia by insulin infusion, along with parallel glucose infusion in order to quantify the required amount of glucose to maintain euglycemia (normal concentration of glucose in the blood; also called normoglycemia). The result is a measure of the insulin-dependent glucose disposal rate (Rd), measuring the peripheral uptake of glucose by the muscle (primarily) and adipose tissues. This rate of glucose uptake is notated by M, whole body glucose metabolism by insulin action under steady state conditions. Therefore, a high M indicates high insulin sensitivity and a lower M value indicates reduced insulin sensitivity, i.e. insulin resistance. The HI clamp requires three trained professionals to carry out the procedure, including simultaneous infusions of insulin and glucose over 2-4 hours and frequent blood sampling every 5 minutes for analysis of insulin and glucose levels. Due to the high cost, complexity, and time required for the HI clamp, this procedure is strictly limited to the clinical research setting.
"Obesity" refers to a chronic condition defined by an excess amount body fat. The normal amount of body fat (expressed as percentage of body weight) is between 25-30% in women and 18-23% in men. Women with over 30% body fat and men with over 25% body fat are considered obese.
"Body Mass Index, (or BMI)" refers to a calculation that uses the height and weight of an individual to estimate the amount of the individual's body fat. Too much body fat (e.g. obesity) can lead to illnesses and other health problems. BMI is the measurement of choice for many physicians and researchers studying obesity. BMI is calculated using a mathematical formula that takes into account both height and weight of the individual. BMI equals a person's weight in kilograms divided by height in meters squared. (BMI=kg/m.sup.2). Subjects having a BMI less than 19 are considered to be underweight, while those with a BMI of between 19 and 25 are considered to be of normal weight, while a BMI of between 25 to 29 are generally considered overweight, while individuals with a BMI of 30 or more are typically considered obese. Morbid obesity refers to a subject having a BMI of 40 or greater.
"Cardiovascular disease" refers to any disease of the heart or blood vessels. Cardiovascular or heart disease includes but is not limited to, for example, angina, arrhythmia, coronary artery disease (CAD), coronary heart disease, cardiomyopathy (including dilated cardiomyopathy, restrictive cardiomyopathy, arrhythmogenic right ventricular cardiomyopathy, and diabetic cardiomyopathy) heart attack (myocardial infarction), heart failure, hypertrophic cardiomyopathy, mitral regurgitation, mitral valve prolapse, pulmonary stenosis, etc. Blood vessel disease includes but is not limited to, for example, peripheral vascular disease, artery disease, carotid artery disease, deep vein thrombosis, venous diseases, atherosclerosis, etc.
I. Biomarkers
The biomarkers described herein were discovered using metabolomic profiling techniques. Such metabolomic profiling techniques are described in more detail in the Examples set forth below as well as in U.S. Pat. Nos. 7,005,255 and 7,329,489 and U.S. patent application Ser. No. 11/357,732 (Publication No. 2007/0026389), Ser. No. 11/301,077 (Publication No. 2006/0134676), Ser. No. 11/301,078 (Publication No. 2006/0134677), Ser. No. 11/301,079 (Publication No. 2006/0134678), and Ser. No. 11/405,033 (Publication No. US 2007/0072203), the entire contents of which are hereby incorporated herein by reference.
Generally, metabolic profiles may be determined for biological samples from human subjects diagnosed with a condition such as pre-diabetes as well as from one or more other groups of human subjects (e.g., healthy control subjects with normal glucose tolerance, subjects with impaired glucose tolerance, subjects with insulin resistance). The metabolic profile for a pre-diabetes disorder may then be compared to the metabolic profile for biological samples from the one or more other groups of subjects. The comparisons may be conducted using models or algorithms, such as those described herein. Those molecules differentially present, including those molecules differentially present at a level that is statistically significant, in the metabolic profile of samples from subjects with a pre-diabetes disorder as compared to another group (e.g., healthy control subjects not pre-diabetic) may be identified as biomarkers to distinguish those groups.
Biomarkers for use in the methods disclosed herein may be obtained from any source of biomarkers related to pre-diabetes and/or type-2 diabetes. Biomarkers for use in methods disclosed herein relating to pre-diabetes include those listed in Tables 4, 5, 6, 7, 8, 9A, 9B, 27, 28, 29, and combinations and subsets thereof. In one embodiment, the biomarkers include those listed in Tables 4, 5, 6, 7, 8, 9A, 9B, 27, 28, and combinations thereof. Additional biomarkers include those disclosed in U.S. Application No. 60/950,286, the entirety of which is hereby incorporated by reference in its entirety. In one aspect, the biomarkers correlate to insulin resistance.
Biomarkers for use in methods disclosed herein relating to metabolic syndrome-related metabolic disorders include those listed in Tables 4, 5, 6, 7, 8, 9A, 9B, 12, 13, 14, 15, 16, 17, 21, 22, 23, 25, 26, 27, 28, 29, and combinations thereof. For example, biomarkers for use in distinguishing, or aiding in distinguishing, between subjects having metabolic syndrome and subjects not having metabolic syndrome include those biomarkers identified in Tables 4, 5, 6, 7, 8, 9A, 9B, 12, 13, 14, 15, 16, 17, 21, 22, 23, 25, 26, 27, 28, 29, and combinations thereof. In one aspect, biomarkers for use in methods relating to metabolic syndrome include one or more of those listed in Tables 12 and 13. In another aspect biomarkers for use in methods relating to metabolic syndrome using plasma samples obtained from a subject include one or more of those listed in Table 12. In a preferred aspect, the biomarkers for use in methods disclosed herein related to metabolic syndrome using plasma samples obtained from a subject include one or more of the biomarkers N-acetylglycine, metabolite-6346, metabolite-8792, gamma-glu-leu, metabolite-4806, metabolite-3165, metabolite-7762, metabolite-3030, metabolite-5978, metabolite-3218, metabolite-2000, metabolite-5848, metabolite-3370, malic acid, metabolite-3843, metabolite-4275, metabolite-3094, metabolite-4167, metabolite-3073, aldosterone, metabolite-1320, metabolite-2185, phenylalanine, metabolite-2139, glutamic acid, alpha-tocopherol, metabolite-5767, metabolite-5346, metabolite-9855, and 1-octadecanol, and combinations thereof. In yet another aspect, biomarkers for use in methods relating to metabolic syndrome using serum samples obtained from a subject include one or more of those listed in Table 13. In a preferred aspect, the biomarkers for use in metabolic syndrome methods disclosed herein using serum samples obtained from a subject include one or more of the biomarkers metabolite-8792, metabolite-5767, metabolite-2139, metabolite-8402, metabolite-3073, phenylalanine, metabolite-4929, metabolite-3370, nonanate, N-acetylglycine, metabolite-5848, metabolite-3077, monopalmitin, dioctyl-phthalate, octadecanoic acid, cholesterol, metabolite-2608, metabolite-6272, metabolite-3012, D-glucose, metabolite-2986, metabolite-4275, metabolite-6268, tyrosine, metabolite-10683, metabolite-2000, alpha-tocopherol, metabolite-2469, xanthine, and metabolite-2039, and combinations thereof.
In another aspect, biomarkers for use in methods disclosed herein relating to metabolic syndrome may include the use of one or more biomarkers listed in Tables 12 and/or 13 in combination with one or more biomarkers in one or more of Tables 4, 5, 6, 7, 8, 9A, 9B, 14, 15, 16, 17, 21, 22, 23, 25, 26, 27, 28, or combinations thereof. For example, biomarkers for use in methods relating to metabolic syndrome may include one or more biomarkers listed in Tables 12 and/or 13 in combination with one or more biomarkers associated with insulin resistance, such as those listed in Tables 4, 5, 6, 7, 8, 9A, 9B, 27, 28, or combinations thereof.
Biomarkers for use in methods disclosed herein relating to pre-diabetic or diabetic conditions, such as impaired insulin sensitivity, insulin resistance, or type-2 diabetes include one or more of those listed in Tables 4, 5, 6, 7, 8, 9A, 9B, 27, 28, and combinations thereof. Such biomarkers allow subjects to be classified as insulin resistant, insulin impaired, or insulin sensitive. In one aspect, biomarkers for use in distinguishing or aiding in distinguishing, between subjects having impaired insulin sensitivity from subjects not having impaired insulin sensitivity include one or more of those listed in Table 4, 5, 6, 7, 8, 9A, and/or 9B. In another aspect, biomarkers for use in diagnosing insulin resistance include one or more of those listed in Tables 4, 5, 6, 7, 8, 9A, and/or 9B. In another example, biomarkers for use in distinguishing subjects having insulin resistance from subject not having insulin resistance include one or more of those listed in Tables 4, 5, 6, 7, 8, 9A, and/or 9B. In another example, biomarkers for use in categorizing, or aiding in categorizing, a subject as having impaired fasting glucose levels or impaired glucose tolerance include one or more of those listed in Tables 4, 5, 6, 7, 8, 9A, and/or 9B.
Biomarkers for use in methods disclosed herein relating to atherosclerosis include one or more of those listed in Tables 14, 15, 16, and/or 17 and combinations thereof. For example, biomarkers for use in distinguishing, or aiding in distinguishing, atherosclerotic subjects from non-atherosclerotic subjects include one or more of those biomarkers listed in Tables 14, 15, 16, 17, 3-methylhistidine, p-cresol sulfate, mannose, glucose, and/or gluconate, and combinations thereof. In one aspect biomarkers for use in methods relating to atherosclerosis using plasma samples from a subject include one or more of 3-methylhistidine, p-cresol sulfate, mannose, glucose, gluconate, and those listed in Tables 14 and 17. In another aspect biomarkers for use in methods relating to atherosclerosis using aortic samples from a subject include one or more of those listed in Table 15. In yet another aspect, biomarkers for use in methods relating to atherosclerosis using liver samples from a subject include one or more of those listed in Table 16. In one aspect, preferred biomarkers for use in methods involving subjects in an early stage of atherosclerosis include the biomarkers identified in FIGS. 10A, 11A, and 12A. Preferred biomarkers for use in methods involving subjects in a mid-stage of atherosclerosis include the biomarkers identified in FIGS. 10B, 11B, and 12B. Preferred biomarkers for use in methods involving subjects in a later stage of atherosclerosis include the biomarkers identified in FIGS. 10C, 11C, and 12C. Preferred biomarkers for use in methods involving subjects in any stage of atherosclerosis include the biomarkers identified in FIGS. 10D, 11D, and 12D.
Biomarkers for use in methods disclosed herein relating to cardiomyopathy include one or more of those biomarkers listed in Tables 21, 22, 23, and/or 25. Such markers may be used, for example, to distinguish, or aiding in distinguishing, between subjects having cardiomyopathy from subjects not having cardiomyopathy. In one aspect, biomarkers for use in methods relating to cardiomyopathy using cardiac tissue samples from a subject include one or more of those listed in Table 21. In another aspect, biomarkers for use in methods relating to cardiomyopathy using plasma samples from a subject include one or more of those listed in Table 22 and/or 23.
Biomarkers for use in methods disclosed herein relating to obesity include one or more of those biomarkers listed in Table 26. Such markers may be used, for example, to distinguish obese subjects from lean subjects. Such markers may also be used in combination with biomarkers for pre-diabetes, metabolic syndrome, atherosclerosis, or cardiomyopathy. In another aspect, the markers may be used, for example, to determine susceptibility to obesity or weight gain. In another aspect, the markers may be used, for example, to determine if a therapeutic agent is likely to induce weight gain in a subject.
Any number of biomarkers may be used in the methods disclosed herein. That is, the disclosed methods may include the determination of the level(s) of one biomarker, two or more biomarkers, three or more biomarkers, four or more biomarkers, five or more biomarkers, six or more biomarkers, seven or more biomarkers, eight or more biomarkers, nine or more biomarkers, ten or more biomarkers, fifteen or more biomarkers, etc., including a combination of all of the biomarkers in each or all of Tables 4, 5, 6, 7, 8, 9A, 9B, 14, 15, 16, 17, 21, 22, 23, 25, 26, 27, 28, 29, or any fraction thereof. In another aspect, the number of biomarkers for use in the disclosed methods include the levels of about thirty or less biomarkers, twenty-five or less, twenty or less, fifteen or less, ten or less, nine or less, eight or less, seven or less, six or less, five or less biomarkers. In another aspect, the number of biomarkers for use in the disclosed methods include the levels of one, two, three, four, five, six, seven, eight, nine, ten, eleven, twelve, thirteen, fourteen, fifteen, twenty, twenty-five, or thirty biomarkers.
Although the identities of some of the biomarkers compounds are not known at this time, such identities are not necessary for the identification of the biomarkers in biological samples from subjects, as the "unnamed" compounds have been sufficiently characterized by analytical techniques to allow such identification. The analytical characterization of all such "unnamed" compounds is listed in the Examples. Such "unnamed" biomarkers are designated herein using the nomenclature "Metabolite" followed by a specific metabolite number.
In addition, the methods disclosed herein using the biomarkers listed in the tables may be used in combination with clinical diagnostic measures of the respective conditions. Combinations with clinical diagnostics may facilitate the disclosed methods, or confirm results of the disclosed methods (for example, facilitating or confirming diagnosis, monitoring progression or regression, and/or determining predisposition to pre-diabetes).
Finally, where the potential identity of a compound is proposed for an "unnamed" metabolite and such identity has not been confirmed, the nomenclature of "possible" (along with the potential compound identity) follows the "Metabolite" number. Such proposed identity should not be considered as limiting the analytical characterization of the otherwise "unnamed" compounds.
II. Diagnostic Methods
The biomarkers described herein may be used to diagnose, or to aid in diagnosing, whether a subject has a disease or condition, such as insulin resistance, pre-diabetes, type-2 diabetes, metabolic syndrome, atherosclerosis, or cardiomyopathy. For example, biomarkers for use in diagnosing, or aiding in diagnosing, whether a subject has a insulin resistance include one or more of those identified in Tables 4, 5, 6, 7, 8, 9A, 9B, 27, 28, 29, and combinations thereof. In one embodiment, the biomarkers include one or more of those identified in Tables 4, 5, 6, 7, 8, 9A, 9B, 27, 28, and combinations thereof. In another embodiment, combinations of biomarkers include those, such as 2-hydroxybutyrate in combination with one or more biomarkers identified in Tables 4, 5, 6, 7, 8, 9A, 9B, 27, 28, and/or 29.
Methods for diagnosing, or aiding in diagnosing, whether a subject has a disease or condition, such as pre-diabetes, metabolic syndrome, atherosclerosis, or cardiomyopathy, may be performed using one or more of the biomarkers identified in the respective tables provided herein. A method of diagnosing (or aiding in diagnosing) whether a subject has a disease or condition, such as pre-diabetes, metabolic syndrome, atherosclerosis, or cardiomyopathy, comprises (1) analyzing a biological sample from a subject to determine the level(s) of one or more biomarkers of the disease or condition in the sample and (2) comparing the level(s) of one or more biomarkers in the sample to disease- or condition-positive and/or disease- or condition-negative reference levels of the one or more biomarkers to diagnose (or aid in the diagnosis of) whether the subject has the disease or condition. For example, a method of diagnosing (or aiding in diagnosing) whether a subject is pre-diabetic comprises (1) analyzing a biological sample from a subject to determine the level(s) of one or more biomarkers of pre-diabetes in the sample and (2) comparing the level(s) of the one or more biomarkers in the sample to pre-diabetes-positive and/or pre-diabetes-negative reference levels of the one or more biomarkers in order to diagnose (or aid in the diagnosis of) whether the subject has pre-diabetes. The one or more biomarkers that are used are selected from Tables 4, 5, 6, 7, 8, 9A, 9B, and combinations thereof. When such a method is used in aiding in the diagnosis of a disease or condition, such as insulin resistance, pre-diabetes, metabolic syndrome, atherosclerosis, or cardiomyopathy, the results of the method may be used along with other methods (or the results thereof) useful in the clinical determination of whether a subject has a given disease or condition. Methods useful in the clinical determination of whether a subject has a disease or condition such as pre-diabetes, metabolic syndrome, atherosclerosis, or cardiomyopathy are known in the art. For example, methods useful in the clinical determination of whether a subject has pre-diabetes include, for example, glucose disposal rates (Rd), body weight measurements, waist circumference measurements, BMI determinations, Peptide YY measurements, Hemoglobin A1C measurements, adiponectin measurements, fasting plasma glucose measurements, free fatty acid measurements, fasting plasma insulin measurements, and the like. Methods useful for the clinical determination of atherosclerosis and/or cardiomyopathy in a subject include angiography, stress-testing, blood tests (e.g. to measure homocysteine, fibrinogen, lipoprotein (a), small LDL particles, and c-reactive protein levels), electrocardiography, echocardiography, computed tomography (CT) scans, ankle/brachial index, and intravascular ultrasounds.
In another example, the identification of biomarkers for diseases or conditions such as insulin resistance, pre-diabetes, metabolic syndrome, atherosclerosis, and cardiomyopathy, allows for the diagnosis of (or for aiding in the diagnosis of) such diseases or conditions in subjects presenting one or more symptoms of the disease or condition. For example, a method of diagnosing (or aiding in diagnosing) whether a subject has insulin resistance comprises (1) analyzing a biological sample from a subject to determine the level(s) of one or more biomarkers of insulin resistance in the sample and (2) comparing the level(s) of the one or more biomarkers in the sample to insulin resistance-positive and/or insulin resistance-negative reference levels of the one or more biomarkers in order to diagnose (or aid in the diagnosis of) whether the subject has insulin resistance. The one or more biomarkers that are used are selected from Tables 4, 5, 6, 7, 8, 9A, and/or 9B. The biomarkers for insulin resistance may also be used to classify subjects as being either insulin resistant, insulin sensitive, or having impaired insulin sensitivity. As described in Example 2, below, biomarkers are identified that may be used to classify subjects as being insulin resistant, insulin sensitive, or having impaired insulin sensitivity. The biomarkers in Tables 4, 5, 6, 7, 8, 9A, and/or 9B, may also be used to classify subjects as having impaired fasting glucose levels or impaired glucose tolerance or normal glucose tolerance. Thus, the biomarkers may indicate compounds that increase and decrease as the glucose disposal rate increases. By determining appropriate reference levels of the biomarkers for each group (insulin resistant, insulin impaired, insulin sensitive), subjects can be diagnosed appropriately. The results of this method may be combined with the results of clinical measurements to aid in the diagnosis of insulin resistance or for categorizing the subject as having NGT, IFG, or IGT.
Increased insulin resistance correlates with the glucose disposal rate (Rd) as measured by the HI clamp. As exemplified below, metabolomic analysis was carried out to identify biomarkers that correlate with the glucose disposal rate (Rd). These biomarkers can be used in a mathematical model to determine the glucose disposal rate of the subject. The insulin sensitivity of the individual can be determined using this model. Using metabolomic analysis, panels of metabolites that can be used in a simple blood test to predict insulin resistance as measured by the "gold standard" of hyperinsulinemic euglycemic clamps in at least two independent cohorts of subjects were discovered. In another example, biomarkers are identified that correlate with the results of oral glucose tolerance tests (OGTT) for use in categorizing subjects as having normal glucose tolerance (NGT), impaired fasting glucose levels (IFG), or impaired glucose tolerance (IGT).
Independent studies were carried out to identify a set of biomarkers that when used with a polynomic algorithm will enable the early detection of changes in insulin resistance in a subject. In one aspect, the instant invention provides the subject with a score indicating the level of insulin resistance ("IR Score") of the subject. The score is based upon clinically significant changed reference level for a biomarker and/or combination of biomarkers. The reference level can be derived from an algorithm or computed from indices for impaired glucose tolerance and can be presented in a report as shown in FIG. 5. The IR Score places the subject in the range of insulin resistance from normal (i.e. insulin sensitive) to high. Disease progression or remission can be monitored by periodic determination and monitoring of the IR Score. Response to therapeutic intervention can be determined by monitoring the IR Score. The IR Score can also be used to evaluate drug efficacy.
Methods for determining a subject's insulin resistance score (IR score) may be performed using one or more of the biomarkers identified in the respective Tables provided herein. For example, a method for determining the IR score of a subject comprises the steps of: (1) analyzing a biological sample from a subject to determine the level(s) of one or more insulin resistance biomarkers in the sample, and (2) comparing the level(s) of the one or more insulin resistance biomarkers in the sample to insulin resistance reference levels of the one or more biomarkers in order to determine the subject's insulin resistance score. The one or more biomarkers that are used may be selected from Tables 4, 5, 6, 7, 8, 9A, 9B, and combinations thereof. The method may employ any number of markers selected from Tables 4, 5, 6, 7, 8, 9A, and/or 9B, including 1, 2, 3, 4, 5, 6, 7, 8, 9, 10, or more markers. Multiple biomarkers may be correlated with a given condition, such as insulin resistance, by any method, including statistical methods such as regression analysis.
Also as exemplified below, metabolomic analysis was carried out to identify biomarkers that correlate with metabolic syndrome, atherosclerosis, cardiomyopathy, and other diseases or conditions. Such biomarkers may be used in the methods of the present invention to analyze biological samples to identify or measure the level of the biomarkers in the sample.
Any suitable method may be used to analyze the biological sample in order to determine the level(s) of the one or more biomarkers in the sample. Suitable methods include chromatography (e.g., HPLC, gas chromatography, liquid chromatography), mass spectrometry (e.g., MS, MS-MS), enzyme-linked immunosorbent assay (ELISA), antibody linkage, other immunochemical techniques, and combinations thereof. Further, the level(s) of the one or more biomarkers may be measured indirectly, for example, by using an assay that measures the level of a compound (or compounds) that correlates with the level of the biomarker(s) that are desired to be measured.
After the level(s) of the one or more biomarker(s) is determined, the level(s) may be compared to disease or condition reference level(s) of the one or more biomarker(s) to determine a rating for each of the one or more biomarker(s) in the sample. The rating(s) may be aggregated using any algorithm to create a score, for example, an insulin resistance (IR) score, for the subject. The algorithm may take into account any factors relating to the disease or condition, such as insulin resistance, including the number of biomarkers, the correlation of the biomarkers to the disease or condition, etc.
In one example, the subject's insulin resistance score may be correlated to any index indicative of a level insulin resistance, from normal glucose tolerance to insulin resistant. For example, a subject having an insulin resistance score of less than 25 may indicate that the subject has normal glucose tolerance; a score of between 26 and 50 may indicate that the subject has low impaired glucose tolerance; a score of between 51 and 75 may indicate that the subject has medium impaired glucose tolerance; a score of between 76 and 100 may indicate that the subject has high impaired glucose tolerance; and a score above 100 may indicate that the subject has type-2 diabetes.
III. Monitoring Disease or Condition Progression/Regression
The identification of biomarkers herein allows for monitoring progression/regression of the respective diseases or conditions (e.g. pre-diabetes, metabolic syndrome, atherosclerosis, cardiomyopathy, insulin resistance, etc.) in a subject. A method of monitoring the progression/regression of a disease or condition, such as pre-diabetes, type-2 diabetes, metabolic syndrome, atherosclerosis, and cardiomyopathy, in a subject comprises (1) analyzing a first biological sample from a subject to determine the level(s) of one or more biomarkers for the respective disease or condition selected from Tables 4, 5, 6, 7, 8, 9A, 9B, 14, 15, 16, 17, 21, 22, 23, 25, 26, 27, 28, and combinations thereof in the first sample obtained from the subject at a first time point, (2) analyzing a second biological sample from a subject to determine the level(s) of the one or more biomarkers, the second sample obtained from the subject at a second time point, and (3) comparing the level(s) of one or more biomarkers in the first sample to the level(s) of the one or more biomarkers in the second sample in order to monitor the progression/regression of the disease or condition in the subject. The results of the method are indicative of the course of the disease or condition (i.e., progression or regression, if any change) in the subject.
In one embodiment, the results of the method may be based on Insulin Resistance (IR) Score which is indicative of the insulin resistance in the subject and which can be monitored over time. By comparing the IR Score from a first time point sample to the IR Score from at least a second time point sample the progression or regression of IR can be determined. Such a method of monitoring the progression/regression of pre-diabetes and/or type-2 diabetes in a subject comprises (1) analyzing a first biological sample from a subject to determine an IR score for the first sample obtained from the subject at a first time point, (2) analyzing a second biological sample from a subject to determine a second IR score, the second sample obtained from the subject at a second time point, and (3) comparing the IR score in the first sample to the IR score in the second sample in order to monitor the progression/regression of pre-diabetes and/or type-2 diabetes in the subject.
Using the biomarkers and algorithm of the instant invention for progression monitoring may guide, or assist a physician's decision to implement preventative measures such as dietary restrictions, exercise, or early-stage drug treatment.
IV. Determining Predisposition to a Disease or Condition
The biomarkers identified herein may also be used in the determination of whether a subject not exhibiting any symptoms of a disease or condition, such as pre-diabetes, type-2 diabetes, metabolic syndrome, atherosclerosis, or cardiomyopathy is predisposed to developing the disease or condition. The biomarkers may be used, for example, to determine whether a subject is predisposed to developing, for example, insulin resistance. Such methods of determining whether a subject having no symptoms of a particular disease or condition such as pre-diabetes, type-2 diabetes, metabolic syndrome, atherosclerosis, or cardiomyopathy, is predisposed to developing a particular disease or condition comprise (1) analyzing a biological sample from a subject to determine the level(s) of one or more biomarkers listed in the respective tables (e.g. Tables 4, 5, 6, 7, 8, 9A, 9B, 14, 15, 16, 17, 21, 22, 23, 25, 26, and combinations thereof) in the sample and (2) comparing the level(s) of the one or more biomarkers in the sample to disease- or condition-positive and/or disease- or condition-negative reference levels of the one or more biomarkers in order to determine whether the subject is predisposed to developing the respective disease or condition. For example, the identification of biomarkers for insulin resistance allows for the determination of whether a subject having no symptoms of insulin resistance is predisposed to developing insulin resistance. A method of determining whether a subject having no symptoms of insulin resistance is predisposed to developing insulin resistance comprises (1) analyzing a biological sample from a subject to determine the level(s) of one or more biomarkers listed in Tables 4, 5, 6, 7, 8, 9A, and 9B, and combinations thereof in the sample and (2) comparing the level(s) of the one or more biomarkers in the sample to insulin resistance-positive and/or insulin resistance-negative reference levels of the one or more biomarkers in order to determine whether the subject is predisposed to developing insulin resistance. The results of the method may be used along with other methods (or the results thereof) useful in the clinical determination of whether a subject is predisposed to developing the disease or condition.
After the level(s) of the one or more biomarkers in the sample are determined, the level(s) are compared to disease- or condition-positive and/or disease- or condition-negative reference levels in order to predict whether the subject is predisposed to developing a disease or condition such as pre-diabetes, type-2 diabetes, metabolic syndrome, atherosclerosis, or cardiomyopathy. Levels of the one or more biomarkers in a sample corresponding to the disease- or condition-positive reference levels (e.g., levels that are the same as the reference levels, substantially the same as the reference levels, above and/or below the minimum and/or maximum of the reference levels, and/or within the range of the reference levels) are indicative of the subject being predisposed to developing the disease or condition. Levels of the one or more biomarkers in a sample corresponding to disease- or condition-negative reference levels (e.g., levels that are the same as the reference levels, substantially the same as the reference levels, above and/or below the minimum and/or maximum of the reference levels, and/or within the range of the reference levels) are indicative of the subject not being predisposed to developing the disease or condition. In addition, levels of the one or more biomarkers that are differentially present (especially at a level that is statistically significant) in the sample as compared to disease- or condition-negative reference levels may be indicative of the subject being predisposed to developing the disease or condition. Levels of the one or more biomarkers that are differentially present (especially at a level that is statistically significant) in the sample as compared to disease-condition-positive reference levels are indicative of the subject not being predisposed to developing the disease or condition.
By way of example, after the level(s) of the one or more biomarkers in the sample are determined, the level(s) are compared to insulin resistance-positive and/or insulin resistance-negative reference levels in order to predict whether the subject is predisposed to developing insulin resistance. Levels of the one or more biomarkers in a sample corresponding to the insulin resistance-positive reference levels (e.g., levels that are the same as the reference levels, substantially the same as the reference levels, above and/or below the minimum and/or maximum of the reference levels, and/or within the range of the reference levels) are indicative of the subject being predisposed to developing insulin resistance. Levels of the one or more biomarkers in a sample corresponding to the insulin resistance-negative reference levels (e.g., levels that are the same as the reference levels, substantially the same as the reference levels, above and/or below the minimum and/or maximum of the reference levels, and/or within the range of the reference levels) are indicative of the subject not being predisposed to developing insulin resistance. In addition, levels of the one or more biomarkers that are differentially present (especially at a level that is statistically significant) in the sample as compared to insulin resistance-negative reference levels are indicative of the subject being predisposed to developing insulin resistance. Levels of the one or more biomarkers that are differentially present (especially at a level that is statistically significant) in the sample as compared to insulin resistance-positive reference levels are indicative of the subject not being predisposed to developing insulin resistance. Although insulin resistance is discussed in this example, predisposition to the other diseases or conditions may also be determined in accordance with this method by using one or more of the respective biomarkers as set forth above.
Furthermore, it may also be possible to determine reference levels specific to assessing whether or not a subject that does not have a disease or condition such as insulin resistance, pre-diabetes, type-2 diabetes, metabolic syndrome, atherosclerosis, or cardiomyopathy, is predisposed to developing a disease or condition. For example, it may be possible to determine reference levels of the biomarkers for assessing different degrees of risk (e.g., low, medium, high) in a subject for developing a disease or condition. Such reference levels could be used for comparison to the levels of the one or more biomarkers in a biological sample from a subject.
V. Monitoring Therapeutic Efficacy:
The biomarkers provided also allow for the assessment of the efficacy of a composition for treating a disease or condition such as insulin resistance, pre-diabetes, type-2 diabetes, metabolic syndrome, atherosclerosis, or cardiomyopathy. For example, the identification of biomarkers for insulin resistance also allows for assessment of the efficacy of a composition for treating insulin resistance as well as the assessment of the relative efficacy of two or more compositions for treating insulin resistance. Such assessments may be used, for example, in efficacy studies as well as in lead selection of compositions for treating the disease or condition.
Thus, also provided are methods of assessing the efficacy of a composition for treating a disease or condition such as insulin resistance, pre-diabetes, type-2 diabetes, metabolic syndrome, atherosclerosis, or cardiomyopathy comprising (1) analyzing, from a subject (or group of subjects) having a disease or condition such as pre-diabetes, type-2 diabetes, metabolic syndrome, atherosclerosis, or cardiomyopathy and currently or previously being treated with a composition, a biological sample (or group of samples) to determine the level(s) of one or more biomarkers for the disorder selected from Tables 4, 5, 6, 7, 8, 9A, 9B, 14, 15, 16, 17, 21, 22, 23, 25, 26, 27, 28, and combinations thereof, and (2) comparing the level(s) of the one or more biomarkers in the sample to (a) level(s) of the one or more biomarkers in a previously-taken biological sample from the subject, wherein the previously-taken biological sample was obtained from the subject before being treated with the composition, (b) disease- or condition-positive reference levels of the one or more biomarkers, (c) disease- or condition-negative reference levels of the one or more biomarkers, (d) disease- or condition-progression-positive reference levels of the one or more biomarkers, and/or (e) disease- or condition-regression-positive reference levels of the one or more biomarkers. The results of the comparison are indicative of the efficacy of the composition for treating the respective disease or condition.
The change (if any) in the level(s) of the one or more biomarkers over time may be indicative of progression or regression of the disease or condition in the subject. To characterize the course of a given disease or condition in the subject, the level(s) of the one or more biomarkers in the first sample, the level(s) of the one or more biomarkers in the second sample, and/or the results of the comparison of the levels of the biomarkers in the first and second samples may be compared to the respective disease- or condition-positive and/or disease- or condition-negative reference levels of the one or more biomarkers. If the comparisons indicate that the level(s) of the one or more biomarkers are increasing or decreasing over time (e.g., in the second sample as compared to the first sample) to become more similar to the disease- or condition-positive reference levels (or less similar to the disease- or condition-negative reference levels), then the results are indicative of the disease's or condition's progression. If the comparisons indicate that the level(s) of the one or more biomarkers are increasing or decreasing over time to become more similar to the disease- or condition-negative reference levels (or less similar to the disease- or condition-positive reference levels), then the results are indicative of the disease's or condition's regression.
For example, in order to characterize the course of insulin resistance in the subject, the level(s) of the one or more biomarkers in the first sample, the level(s) of the one or more biomarkers in the second sample, and/or the results of the comparison of the levels of the biomarkers in the first and second samples may be compared to insulin resistance-positive and/or insulin resistance-negative reference levels of the one or more biomarkers. If the comparisons indicate that the level(s) of the one or more biomarkers are increasing or decreasing over time (e.g., in the second sample as compared to the first sample) to become more similar to the insulin resistance-positive reference levels (or less similar to the insulin resistance-negative reference levels), then the results are indicative of insulin resistance progression. If the comparisons indicate that the level(s) of the one or more biomarkers are increasing or decreasing over time to become more similar to the insulin resistance-negative reference levels (or less similar to the insulin resistance-positive reference levels), then the results are indicative of insulin resistance regression.
The second sample may be obtained from the subject any period of time after the first sample is obtained. In one aspect, the second sample is obtained 1, 2, 3, 4, 5, 6, or more days after the first sample or after the initiation of the administration of a composition. In another aspect, the second sample is obtained 1, 2, 3, 4, 5, 6, 7, 8, 9, 10, or more weeks after the first sample or after the initiation of the administration of a composition. In another aspect, the second sample may be obtained 1, 2, 3, 4, 5, 6, 7, 8, 9, 10, 11, 12, or more months after the first sample or after the initiation of the administration of a composition.
The course of a disease or condition such as insulin resistance, pre-diabetes, type-2 diabetes, metabolic syndrome, atherosclerosis, or cardiomyopathy in a subject may also be characterized by comparing the level(s) of the one or more biomarkers in the first sample, the level(s) of the one or more biomarkers in the second sample, and/or the results of the comparison of the levels of the biomarkers in the first and second samples to disease- or condition-progression-positive and/or disease- or condition-regression-positive reference levels. If the comparisons indicate that the level(s) of the one or more biomarkers are increasing or decreasing over time (e.g., in the second sample as compared to the first sample) to become more similar to the disease- or condition-progression-positive reference levels (or less similar to the disease- or condition-regression-positive reference levels), then the results are indicative of the disease or condition progression. If the comparisons indicate that the level(s) of the one or more biomarkers are increasing or decreasing over time to become more similar to the disease- or condition-regression-positive reference levels (or less similar to the disease- or condition-progression-positive reference levels), then the results are indicative of disease or condition regression.
As with the other methods described herein, the comparisons made in the methods of monitoring progression/regression of a disease or condition such as insulin resistance, pre-diabetes, type-2 diabetes, metabolic syndrome, atherosclerosis, or cardiomyopathy in a subject may be carried out using various techniques, including simple comparisons, one or more statistical analyses, and combinations thereof.
The results of the method may be used along with other methods (or the results thereof) useful in the clinical monitoring of progression/regression of the disease or condition in a subject.
As described above in connection with methods of diagnosing (or aiding in the diagnosis of) a disease or condition such as insulin resistance, pre-diabetes, type-2 diabetes, metabolic syndrome, atherosclerosis, or cardiomyopathy, any suitable method may be used to analyze the biological samples in order to determine the level(s) of the one or more biomarkers in the samples. In addition, the level(s) one or more biomarkers, including a combination of all of the biomarkers in Tables 4, 5, 6, 7, 8, 9A, 9B, 14, 15, 16, 17, 21, 22, 23, 25, 26, 27, and/or 28, or any fraction thereof, may be determined and used in methods of monitoring progression/regression of the respective disease or condition in a subject.
Such methods could be conducted to monitor the course of disease or condition development in subjects, for example the course of pre-diabetes to type-2 diabetes in a subject having pre-diabetes, or could be used in subjects not having a disease or condition (e.g., subjects suspected of being predisposed to developing the disease or condition) in order to monitor levels of predisposition to the disease or condition.
Clinical studies from around the world have been carried out to test whether anti-diabetic therapies, such as metformin or acarbose, can prevent diabetes progression in pre-diabetic patients. These studies have shown that such therapies can prevent diabetes onset. From the U.S. Diabetes Prevention Program (DPP), metformin reduced the rate of progression to diabetes by 38% and lifestyle and exercise intervention reduced the rate of progression to diabetes by 56%. Because of such successes, the ADA has revised its 2008 Standards of Medical Care in Diabetes to include the following statements in the section on Prevention/Delay of Type 2 Diabetes: "In addition to lifestyle counseling, metformin may be considered in those who are at very high risk (combined IFG and IGT plus other risk factors) and who are obese and under 60 years of age."
Pharmaceutical companies have carried out studies to assess whether certain classes of drugs, such as the PPAR.gamma. class of insulin sensitizers, can prevent diabetes progression. Similar to the DPP trial, some of these studies have shown great promise and success for preventing diabetes, whereas others have exposed a certain amount of risk associated with certain anti-diabetic pharmacologic treatments when given to the general pre-diabetic population as defined by current IR diagnostics. Pharmaceutical companies are in need of diagnostics that can identify and stratify high risk pre-diabetics so they can assess the efficacy of their pre-diabetic therapeutic candidates more effectively and safely.
Considering the infrequency of the oral glucose tolerance test (OGTT) procedures in the clinical setting, a new diagnostic test that directly measures insulin resistance in a fasted sample would enable a physician to identify and stratify patients who are moving toward the etiology of pre-diabetes and cardiovascular disease much earlier.
VI. Identification of Responders and Non-Responders to Therapeutic:
The biomarkers provided also allow for the identification of subjects in whom the composition for treating a disease or condition such as pre-diabetes, type-2 diabetes, metabolic syndrome, atherosclerosis, or cardiomyopathy is efficacious (i.e. patient responds to therapeutic). For example, the identification of biomarkers for insulin resistance also allows for assessment of the subject response to a composition for treating insulin resistance as well as the assessment of the relative patient response to two or more compositions for treating insulin resistance. Such assessments may be used, for example, in selection of compositions for treating the disease or condition for certain subjects.
Thus, also provided are methods of predicting the response of a patient to a composition for treating a disease or condition such as pre-diabetes, type-2 diabetes, metabolic syndrome, atherosclerosis, or cardiomyopathy comprising (1) analyzing, from a subject (or group of subjects) having a disease or condition such as pre-diabetes, type-2 diabetes, metabolic syndrome, atherosclerosis, or cardiomyopathy and currently or previously being treated with a composition, a biological sample (or group of samples) to determine the level(s) of one or more biomarkers for the disorder selected from Tables 4, 5, 6, 7, 8, 9A, 9B, 14, 15, 16, 17, 21, 22, 23, 25, 26, 27, and 28, and combinations thereof, and (2) comparing the level(s) of the one or more biomarkers in the sample to (a) level(s) of the one or more biomarkers in a previously-taken biological sample from the subject, wherein the previously-taken biological sample was obtained from the subject before being treated with the composition, (b) disease- or condition-positive reference levels of the one or more biomarkers, (c) disease- or condition-negative reference levels of the one or more biomarkers, (d) disease- or condition-progression-positive reference levels of the one or more biomarkers, and/or (e) disease- or condition-regression-positive reference levels of the one or more biomarkers. The results of the comparison are indicative of the response of the patient to the composition for treating the respective disease or condition.
The change (if any) in the level(s) of the one or more biomarkers over time may be indicative of response of the subject to the therapeutic. To characterize the course of a given therapeutic in the subject, the level(s) of the one or more biomarkers in the first sample, the level(s) of the one or more biomarkers in the second sample, and/or the results of the comparison of the levels of the biomarkers in the first and second samples may be compared to the respective disease- or condition-positive and/or disease- or condition-negative reference levels of the one or more biomarkers. If the comparisons indicate that the level(s) of the one or more biomarkers are increasing or decreasing over time (e.g., in the second sample as compared to the first sample) to become more similar to the disease- or condition-positive reference levels (or less similar to the disease- or condition-negative reference levels), then the results are indicative of the patient not responding to the therapeutic. If the comparisons indicate that the level(s) of the one or more biomarkers are increasing or decreasing over time to become more similar to the disease- or condition-negative reference levels (or less similar to the disease- or condition-positive reference levels), then the results are indicative of the patient responding to the therapeutic.
For example, in order to characterize the patient response to a therapeutic for insulin resistance, the level(s) of the one or more biomarkers in the first sample, the level(s) of the one or more biomarkers in the second sample, and/or the results of the comparison of the levels of the biomarkers in the first and second samples may be compared to insulin resistance-positive and/or insulin resistance-negative reference levels of the one or more biomarkers. If the comparisons indicate that the level(s) of the one or more biomarkers are increasing or decreasing over time (e.g., in the second sample as compared to the first sample) to become more similar to the insulin resistance-positive reference levels (or less similar to the insulin resistance-negative reference levels), then the results are indicative of non-response to the therapeutic. If the comparisons indicate that the level(s) of the one or more biomarkers are increasing or decreasing over time to become more similar to the insulin resistance-negative reference levels (or less similar to the insulin resistance-positive reference levels), then the results are indicative of response to the therapeutic.
The second sample may be obtained from the subject any period of time after the first sample is obtained. In one aspect, the second sample is obtained 1, 2, 3, 4, 5, 6, or more days after the first sample. In another aspect, the second sample is obtained 1, 2, 3, 4, 5, 6, 7, 8, 9, 10, or more weeks after the first sample or after the initiation of treatment with the composition. In another aspect, the second sample may be obtained 1, 2, 3, 4, 5, 6, 7, 8, 9, 10, 11, 12, or more months after the first sample or after the initiation of treatment with the composition.
As with the other methods described herein, the comparisons made in the methods of determining a patient response to a therapeutic for a disease or condition such as insulin resistance, pre-diabetes, type-2 diabetes, metabolic syndrome, atherosclerosis, or cardiomyopathy in a subject may be carried out using various techniques, including simple comparisons, one or more statistical analyses, and combinations thereof.
The results of the method may be used along with other methods (or the results thereof) useful in determining a patient response to a therapeutic for the disease or condition in a subject.
As described above in connection with methods of diagnosing (or aiding in the diagnosis of) a disease or condition such as pre-diabetes, type-2 diabetes, metabolic syndrome, atherosclerosis, or cardiomyopathy, any suitable method may be used to analyze the biological samples in order to determine the level(s) of the one or more biomarkers in the samples. In addition, the level(s) one or more biomarkers, including a combination of all of the biomarkers in Tables 4, 5, 6, 7, 8, 9A, 9B, 14, 15, 16, 17, 21, 22, 23, 25, 26, 27, and/or 28, or any fraction thereof, may be determined and used in methods of monitoring progression/regression of the respective disease or condition in a subject.
Such methods could be conducted to monitor the patient response to a therapeutic for a disease or condition development in subjects, for example the course of pre-diabetes to type-2 diabetes in a subject having pre-diabetes, or could be used in subjects not having a disease or condition (e.g., subjects suspected of being predisposed to developing the disease or condition) in order to monitor levels of predisposition to the disease or condition.
Pharmaceutical companies have carried out studies to assess whether certain classes of drugs, such as the PPAR.gamma. class of insulin sensitizers, can prevent diabetes progression. Some of these studies have shown great promise and success for preventing diabetes, whereas others have exposed a certain amount of risk associated with certain anti-diabetic pharmacologic treatments when given to the general pre-diabetic population as defined by current IR diagnostics. Pharmaceutical companies are in need of diagnostics that can identify responders and non-responders in order to stratify high risk pre-diabetics to assess the efficacy of their pre-diabetic therapeutic candidates more effectively and safely. A new diagnostic test that discriminates non-responding from responding patients to a therapeutic would enable pharmaceutical companies to identify and stratify patients that are likely to respond to the therapeutic agent and target specific therapeutics for certain cohorts that are likely to respond to the therapeutic.
VII. Methods of Screening a Composition for Activity in Modulating Biomarkers
The biomarkers provided herein also allow for the screening of compositions for activity in modulating biomarkers associated with a disease or condition, such as pre-diabetes, type-2 diabetes, metabolic syndrome, atherosclerosis, and cardiomyopathy, which may be useful in treating the disease or condition. Such methods comprise assaying test compounds for activity in modulating the levels of one or more biomarkers selected from the respective biomarkers listed in the respective tables. Such screening assays may be conducted in vitro and/or in vivo, and may be in any form known in the art useful for assaying modulation of such biomarkers in the presence of a test composition such as, for example, cell culture assays, organ culture assays, and in vivo assays (e.g., assays involving animal models). For example, the identification of biomarkers for insulin resistance also allows for the screening of compositions for activity in modulating biomarkers associated with insulin resistance, which may be useful in treating insulin resistance. Methods of screening compositions useful for treatment of insulin resistance comprise assaying test compositions for activity in modulating the levels of one or more biomarkers in Tables 4, 5, 6, 7, 8, 9A, 9B, 27, and/or 28. Although insulin resistance is discussed in this example, the other diseases and conditions such as pre-diabetes, type-2 diabetes, metabolic syndrome, atherosclerosis, and cardiomyopathy may also be diagnosed or aided to be diagnosed in accordance with this method by using one or more of the respective biomarkers as set forth above.
The methods for screening a composition for activity in modulating one or more biomarkers of a disease or condition such as insulin resistance, pre-diabetes, type-2 diabetes, metabolic syndrome, atherosclerosis, and cardiomyopathy comprise (1) contacting one or more cells with a composition, (2) analyzing at least a portion of the one or more cells or a biological sample associated with the cells to determine the level(s) of one or more biomarkers of a disease or condition selected from the biomarkers provided in Tables 4, 5, 6, 7, 8, 9A, 9B, 14, 15, 16, 17, 21, 22, 23, 25, and/or 26; and (3) comparing the level(s) of the one or more biomarkers with predetermined standard levels for the one or more biomarkers to determine whether the composition modulated the level(s) of the one or more biomarkers. In one embodiment, a method for screening a composition for activity in modulating one or more biomarkers of insulin resistance comprises (1) contacting one or more cells with a composition, (2) analyzing at least a portion of the one or more cells or a biological sample associated with the cells to determine the level(s) of one or more biomarkers of insulin resistance selected from Tables 4, 5, 6, 7, 8, 9A, and/or 9B; and (3) comparing the level(s) of the one or more biomarkers with predetermined standard levels for the one or more biomarkers to determine whether the composition modulated the level(s) of the one or more biomarkers. As discussed above, the cells may be contacted with the composition in vitro and/or in vivo. The predetermined standard levels for the one or more biomarkers may be the levels of the one or more biomarkers in the one or more cells in the absence of the composition. The predetermined standard levels for the one or more biomarkers may also be the level(s) of the one or more biomarkers in control cells not contacted with the composition.
In addition, the methods may further comprise analyzing at least a portion of the one or more cells or a biological sample associated with the cells to determine the level(s) of one or more non-biomarker compounds of a disease or condition, such as pre-diabetes, type-2 diabetes, metabolic syndrome, atherosclerosis, and cardiomyopathy. The levels of the non-biomarker compounds may then be compared to predetermined standard levels of the one or more non-biomarker compounds.
Any suitable method may be used to analyze at least a portion of the one or more cells or a biological sample associated with the cells in order to determine the level(s) of the one or more biomarkers (or levels of non-biomarker compounds). Suitable methods include chromatography (e.g., HPLC, gas chromatography, liquid chromatography), mass spectrometry (e.g., MS, MS-MS), ELISA, antibody linkage, other immunochemical techniques, biochemical or enzymatic reactions or assays, and combinations thereof. Further, the level(s) of the one or more biomarkers (or levels of non-biomarker compounds) may be measured indirectly, for example, by using an assay that measures the level of a compound (or compounds) that correlates with the level of the biomarker(s) (or non-biomarker compounds) that are desired to be measured.
VIII. Method of Identifying Potential Drug Targets
The disclosure also provides methods of identifying potential drug targets for diseases or conditions such as insulin resistance, pre-diabetes, type-2 diabetes, metabolic syndrome, atherosclerosis, and cardiomyopathy, using the biomarkers listed in Tables 4, 5, 6, 7, 8, 9A, 9B, 14, 15, 16, 17, 21, 22, 23, 25, 26, 27, and/or 28. A method for identifying a potential drug target for a disease or condition such as pre-diabetes, type-2 diabetes, metabolic syndrome, atherosclerosis and cardiomyopathy comprises (1) identifying one or more biochemical pathways associated with one or more biomarkers for a metabolic syndrome-related metabolic disorder selected from the respective tables (Tables 4, 5, 6, 7, 8, 9A, 9B, 14, 15, 16, 17, 21, 22, 23, 25, 26, 27, and/or 28); and (2) identifying a protein (e.g., an enzyme) affecting at least one of the one or more identified biochemical pathways, the protein being a potential drug target for the disease or condition. For example, the identification of biomarkers for insulin resistance also allows for the identification of potential drug targets for insulin resistance. A method for identifying a potential drug target for insulin resistance comprises (1) identifying one or more biochemical pathways associated with one or more biomarkers for insulin resistance selected from Tables 4, 5, 6, 7, 8, 9A, 9B, 27, and/or 28, and (2) identifying a protein (e.g., an enzyme) affecting at least one of the one or more identified biochemical pathways, the protein being a potential drug target for insulin resistance. Although insulin resistance is discussed in this example, the other diseases or conditions such as type-2 diabetes, metabolic syndrome, atherosclerosis and cardiomyopathy, may also be diagnosed or aided to be diagnosed in accordance with this method by using one or more of the respective biomarkers as set forth above.
Another method for identifying a potential drug target for a disease or condition such as pre-diabetes, type-2 diabetes, metabolic syndrome, atherosclerosis, and cardiomyopathy comprises (1) identifying one or more biochemical pathways associated with one or more biomarkers for a metabolic syndrome-related metabolic disorder selected from the respective table(s) (Tables 4, 5, 6, 7, 8, 9A, 9B, 14, 15, 16, 17, 21, 22, 23, 25, 26, 27, and/or 28) and one or more non-biomarker compounds of the disease or condition and (2) identifying a protein affecting at least one of the one or more identified biochemical pathways, the protein being a potential drug target for the disease or condition. For example, a method for identifying a potential drug target for insulin resistance comprises (1) identifying one or more biochemical pathways associated with one or more biomarkers for insulin resistance selected from Tables 4, 5, 6, 7, 8, 9A, 9B, 27, and/or 28, and one or more non-biomarker compounds of insulin resistance and (2) identifying a protein affecting at least one of the one or more identified biochemical pathways, the protein being a potential drug target for insulin resistance.
One or more biochemical pathways (e.g., biosynthetic and/or metabolic (catabolic) pathway) are identified that are associated with one or more biomarkers (or non-biomarker compounds). After the biochemical pathways are identified, one or more proteins affecting at least one of the pathways are identified. Preferably, those proteins affecting more than one of the pathways are identified.
A build-up of one metabolite (e.g., a pathway intermediate) may indicate the presence of a `block` downstream of the metabolite and the block may result in a low/absent level of a downstream metabolite (e.g. product of a biosynthetic pathway). In a similar manner, the absence of a metabolite could indicate the presence of a `block` in the pathway upstream of the metabolite resulting from inactive or non-functional enzyme(s) or from unavailability of biochemical intermediates that are required substrates to produce the product. Alternatively, an increase in the level of a metabolite could indicate a genetic mutation that produces an aberrant protein which results in the over-production and/or accumulation of a metabolite which then leads to an alteration of other related biochemical pathways and result in dysregulation of the normal flux through the pathway; further, the build-up of the biochemical intermediate metabolite may be toxic or may compromise the production of a necessary intermediate for a related pathway. It is possible that the relationship between pathways is currently unknown and this data could reveal such a relationship.
The proteins identified as potential drug targets may then be used to identify compositions that may be potential candidates for treating a particular disease or condition, such as insulin resistance, including compositions for gene therapy.
IX. Methods of Treatment
In another aspect, methods for treating a disease or condition such as pre-diabetes, type-2 diabetes, metabolic syndrome, atherosclerosis, and cardiomyopathy are provided. The methods generally involve treating a subject having a disease or condition such as pre-diabetes, type-2 diabetes, metabolic syndrome, atherosclerosis, and cardiomyopathy with an effective amount of one or more biomarker(s) that are lowered in a subject having the disease or condition as compared to a healthy subject not having the disease or condition. The biomarkers that may be administered may comprise one or more of the biomarkers in Tables 4, 5, 6, 7, 8, 9A, 9B, 14, 15, 16, 17, 21, 22, 23, 25, 26, 27, 28, and/or 29 that are decreased in a disease or condition state as compared to subjects not having that disease or condition. Such biomarkers could be isolated based on the identity of the biomarker compound (i.e. compound name). The biomarkers that are currently unnamed metabolites could be isolated based on the analytical characterizations for the biomarkers listed in the Examples below (e.g. Table 29). In some embodiments, the biomarkers that are administered are one or more biomarkers listed in Tables 4, 5, 6, 7, 8, 9A, 9B, 14, 15, 16, 17, 21, 22, 23, 25, 26, 27, 28, and/or 29 that are decreased in a metabolic syndrome-related metabolic disorder and that have a p-value less than 0.05 or a q-value less than 0.10, or both a p-value less than 0.05 and a q-value less than 0.10, as determined by using a Welch's T-test or a Wilcoxon's rank sum Test. In other embodiments, the biomarkers that are administered are one or biomarkers listed in Tables 4, 5, 6, 7, 8, 9A, 9B, 14, 15, 16, 17, 21, 22, 23, 25, 26, 27, 28, and/or 29 that are decreased in a disease or condition and that have either a positive or negative correlation with a disease or condition. In one embodiment, the biomarkers have a positive or negative correlation either .gtoreq.+0.5 or .ltoreq.-0.5, respectively, with a disease or condition. In other embodiments, the biomarkers that are administered are one or more biomarkers listed in Tables 4, 5, 6, 7, 8, 9A, 9B, 14, 15, 16, 17, 21, 22, 23, 25, 26, 27, 28, and/or 29 that are decreased in a disease or condition by at least 5%, by at least 10%, by at least 15%, by at least 20%, by at least 25%, by at least 30%, by at least 35%, by at least 40%, by at least 45%, by at least 50%, by at least 55%, by at least 60%, by at least 65%, by at least 70%, by at least 75%, by at least 80%, by at least 85%, by at least 90%, by at least 95%, or by 100% (i.e., absent). In one example, the identification of biomarkers for insulin resistance also allows for the treatment of insulin resistance. For example, in order to treat a subject having insulin resistance, an effective amount of one or more insulin resistance biomarkers that are lowered in subjects having insulin resistance as compared to a healthy subject not having insulin resistance may be administered to the subject. The biomarkers that may be administered may comprise one or more of the biomarkers in Tables 4, 5, 6, 7, 8, 9A, 9B, 27, 28, and/or 29 that are decreased in a subject having insulin resistance. Although insulin resistance is discussed in this example, the other diseases or conditions, such as type-2 diabetes, metabolic syndrome, atherosclerosis, and cardiomyopathy, may also be treated in accordance with this method by using one or more of the respective biomarkers as set forth above.
X. Methods of Using the Biomarkers for Other Diseases or Conditions
In another aspect, at least some of the biomarkers disclosed herein for a particular disease or condition may also be biomarkers for other diseases or conditions. For example, it is believed that at least some of the insulin resistance biomarkers may be used in the methods described herein for other diseases or conditions (e.g., metabolic syndrome). That is, the methods described herein with respect to insulin resistance may also be used for diagnosing (or aiding in the diagnosis of) a disease or condition such as type-2 diabetes, metabolic syndrome, atherosclerosis, or cardiomyopathy, methods of monitoring progression/regression of such a disease or condition, methods of assessing efficacy of compositions for treating such a disease or condition, methods of screening a composition for activity in modulating biomarkers associated with such a disease or condition, methods of identifying potential drug targets for such diseases and conditions, and methods of treating such diseases and conditions. Such methods could be conducted as described herein with respect to insulin resistance.
XI. Other Methods
Other methods of using the biomarkers discussed herein are also contemplated. For example, the methods described in U.S. Pat. No. 7,005,255 and U.S. patent application Ser. Nos. 11/357,732, 10/695,265 (Publication No. 2005/0014132), Ser. No. 11/301,077 (Publication No. 2006/0134676), Ser. No. 11/301,078 (Publication No. 2006/0134677), Ser. No. 11/301,079 (Publication No. 2006/0134678), and Ser. No. 11/405,033 may be conducted using a small molecule profile comprising one or more of the biomarkers disclosed herein.
In any of the methods listed herein, the biomarkers that are used may be selected from those biomarkers in Tables 4, 5, 6, 7, 8, 9A, 9B, 14, 15, 16, 17, 21, 22, 23, 25, 26, 27, 28, and/or 29 having p-values of less than 0.05 and/or those biomarkers in Tables 4, 5, 6, 7, 8, 9A, 9B, 14, 15, 16, 17, 21, 22, 23, 25, 26, 27, 28, and/or 29 having q-values less than 0.10, and/or having a positive or negative correlation either .gtoreq.+0.5 or .ltoreq.-0.5, respectively, with a disorder. The biomarkers that are used in any of the methods described herein may also be selected from those biomarkers in Tables 4, 5, 6, 7, 8, 9A, 9B, 14, 15, 16, 17, 21, 22, 23, 25, 26, 27, 28, and/or 29 that are decreased in a metabolic syndrome-related metabolic disorder (as compared to the control or remission) or that are decreased in remission (as compared to control or a particular disease or condition) by at least 5%, by at least 10%, by at least 15%, by at least 20%, by at least 25%, by at least 30%, by at least 35%, by at least 40%, by at least 45%, by at least 50%, by at least 55%, by at least 60%, by at least 65%, by at least 70%, by at least 75%, by at least 80%, by at least 85%, by at least 90%, by at least 95%, or by 100% (i.e., absent); and/or those biomarkers in Tables 4, 5, 6, 7, 8, 9A, 9B, 14, 15, 16, 17, 21, 22, 23, 25, 26, 27, 28, and/or 29 that are increased in a given disease or condition (as compared to the control or remission) or that are increased in remission (as compared to the control or a given disease or condition) by at least 5%, by at least 10%, by at least 15%, by at least 20%, by at least 25%, by at least 30%, by at least 35%, by at least 40%, by at least 45%, by at least 50%, by at least 55%, by at least 60%, by at least 65%, by at least 70%, by at least 75%, by at least 80%, by at least 85%, by at least 90%, by at least 95%, by at least 100%, by at least 110%, by at least 120%, by at least 130%, by at least 140%, by at least 150%, or more.
EXAMPLES
I. General Methods
A. Identification of Metabolic Profiles
Each sample was analyzed to determine the concentration of several hundred metabolites. Analytical techniques such as GC-MS (gas chromatography-mass spectrometry) and LC-MS (liquid chromatography-mass spectrometry) were used to analyze the metabolites. Multiple aliquots were simultaneously, and in parallel, analyzed, and, after appropriate quality control (QC), the information derived from each analysis was recombined. Every sample was characterized according to several thousand characteristics, which ultimately amount to several hundred chemical species. The techniques used were able to identify novel and chemically unnamed compounds.
B. Statistical Analysis:
The data was analyzed using several statistical methods to identify molecules (either known, named metabolites or unnamed metabolites) present at differential levels in a definable population or subpopulation (e.g., biomarkers for metabolic syndrome biological samples compared to control biological samples or compared to patients in remission from insulin resistance) useful for distinguishing between the definable populations (e.g., insulin resistance and control, insulin resistance and remission, remission and control). Other molecules (either known, named metabolites or unnamed metabolites) in the definable population or subpopulation were also identified.
Random forest analyses were used for classification of samples into groups (e.g. disease or healthy, insulin resistant or normal insulin sensitivity, atherosclerosis or normal, metabolic syndrome or obese but not metabolic syndrome). Random forests give an estimate of how well we can classify individuals in a new data set into each group, in contrast to a t-test, which tests whether the unknown means for two populations are different or not. Random forests create a set of classification trees based on continual sampling of the experimental units and compounds. Then each observation is classified based on the majority votes from all the classification trees.
Regression analysis was performed using the Random Forest Regression method and the Univariate Correlation/Linear Regression method to build models that are useful to identify the biomarker compounds that are associated with disease or disease indicators (e.g. atherosclerosis, metabolic syndrome, Rd) and then to identify biomarker compounds useful to classify individuals according to for example, the level of glucose utilization as normal, insulin impaired, or insulin resistant. Biomarker compounds that are useful to predict disease or measures of disease (e.g. atherosclerosis, metabolic syndrome, Rd) and that are positively or negatively correlated with disease or measures of disease (e.g. atherosclerosis, metabolic syndrome, Rd) were identified in these analyses. All of the biomarker compounds identified in these analyses were statistically significant (p<0.05, q<0.1).
Recursive partitioning relates a `dependent` variable (Y) to a collection of independent (`predictor`) variables (X) in order to uncover--or simply understand--the elusive relationship, Y=f(X). The analysis was performed with the JMP program (SAS) to generate a decision tree. The statistical significance of the "split" of the data can be placed on a more quantitative footing by computing p-values, which discern the quality of a split relative to a random event. The significance level of each "split" of data into the nodes or branches of the tree was computed as p-values, which discern the quality of the split relative to a random event. It was given as LogWorth, which is the negative log 10 of a raw p-value.
Statistical analyses were performed with the program "R" available on the worldwide web at the website cran.r-project.org and in JMP 6.0.2 (SAS.RTM. Institute, Cary, N.C.).
Example 2
Biomarkers of Pre-Diabetes
2A: Identification of Biomarkers that Correlate with Glucose Disposal
A combination of biomarkers were discovered that, when used in an algorithm, correlate with the glucose disposal rate (i.e. Rd). Further, the initial panel of biomarkers can be narrowed for the development of targeted assays comprised of 15-30 candidate metabolites. An algorithm to predict insulin resistance was developed.
Several studies were conducted to identify biomarkers that correlate with glucose disposal. In a first study, plasma samples were collected from 113 lean, obese or diabetic subjects that had received treatment with one of three different thiazolidinedione drugs (T=troglitazone, R=rosiglitazone, or P=pioglitazone) (Table 1). Base line samples obtained from the subjects prior to treatment (S=baseline) served as controls. One to three plasma samples were obtained from each subject, with samples collected at baseline (all subjects; A), and after 12 weeks (B) or 4 weeks (C) of drug treatment (Table 2). Glucose disposal rate was measured in every subject by the hyperinsulinemic euglycemic (HI) clamp following each blood draw. A total of 198 plasma samples were collected for analysis.
TABLE-US-00001 TABLE 1 Gender and treatments of the study 1 cohort. GROUP GENDER P R S T Total Lean F 1 0 1 1 3 M 7 0 12 8 27 Obese F 2 0 3 1 6 M 7 0 14 8 29 Diabetic F 0 7 3 1 11 M 8 13 7 9 37 Total 25 20 40 28 113
TABLE-US-00002 TABLE 2 Treatment and collection time of the study 1 cohort. GROUP TIME P R S T Total L A 8 0 13 9 30 B 8 0 0 8 16 O A 9 0 17 9 35 B 9 0 0 9 18 C 9 0 0 0 9 D A 8 19 10 9 46 B 8 20 0 10 38 C 6 0 0 0 6 Total 65 39 40 54 198
In a second study, plasma samples were collected from 402 subjects that were balanced for age and gender. The subjects underwent HI clamp to determine the glucose disposal rate (Rd) of each individual. Based upon an Oral Glucose Tolerance Test (OGTT) or a Fasting Plasma Glucose Test (FPGT) the glucose tolerance of the subjects was designated as Normal glucose tolerance (NGT), Impaired Fasting Glucose (IFG) or Impaired Glucose Tolerance (IGT). The cohort is described in Table 3.
TABLE-US-00003 TABLE 3 Cohort Description, Study 2 Age Rd Group Gender N Mean Std Dev Mean Std Dev NGT female 155 44.64 8.02 8.5 3.09 male 148 44.03 8.62 8.38 2.77 IFG female 5 46.8 6.53 6.13 3.32 male 12 45.25 9.63 4.67 2.57 IGT female 45 45.56 7.81 4.19 1.81 male 37 45.73 7.8 4.73 2.27 Abbreviations Rd: Glucose disposal rate NGT: Normal Glucose Tolerant (OGTT, <140 mg/dL or <7.8 mmol/L) IFG: Impaired Fasting Glucose (Fasting plasma glucose, 100-125 mg/dL or 5.6-6.9 mmol/L) IGT: Impaired Glucose Tolerant (OGTT, 140-199 mg/dL or 7.8-11.0 mmol/L)
All samples from both studies were analyzed by GC-MS and LC-MS to identify and quantify the small molecules present in the samples. Over 400 compounds were detected in the samples.
Statistical analyses were performed to determine the compounds that are useful as biomarkers. Linear regression was used to correlate the baseline levels of individual compounds with the glucose disposal rate (Rd) as measured by the euglycemic hyperinsulinemic clamp for each individual. This analysis was followed by Random Forest analysis to identify variables most useful for Rd modeling. Then, LASSO regression analysis was performed on the cross-validated variables from the Random Forest analysis to pick the combination of variables useful to predict Rd.
2B: Biomarkers of Glucose Utilization, Molecules Positively and Negatively Correlated with Glucose Disposal Rate (Rd)
Biomarkers were discovered by (1) analyzing blood samples drawn from different groups of human subjects to determine the levels of metabolites in the samples and then (2) statistically analyzing the results to determine those metabolites that were differentially present in the groups of subjects and the metabolites that correlate with the glucose disposal rate, an indicator of insulin sensitivity.
The plasma samples used for the analysis were from the cohorts described in Tables 1, 2 and 3; the subjects had various rates of glucose disposal (Rd). Based on the Rd value subjects were classified as insulin resistant (Rd.ltoreq.4), insulin impaired (4<Rd<7.5) or insulin sensitive (Rd>7.5). After the levels of metabolites were determined, the data was analyzed using Univariate Correlation/Linear Regression.
As listed below in Table 4, biomarkers were discovered that were correlated with the glucose disposal rate (Rd), an indicator of insulin sensitivity.
Table 4 includes, for each listed biomarker, the p-value determined in the statistical analysis of the data concerning the biomarkers, and the correlation (Corr) with Rd. A positive correlation indicates that the level of the biomarker increases as the glucose disposal rate increases. A negative correlation indicates that the level of the biomarker decreases as the glucose disposal rate increases. The range of possible correlations is between negative (-)1.0 and positive (+)1.0. A result of negative (-)1.0 means a perfect negative correlation, a positive (+)1.0 means a perfect positive correlation, and 0 means no correlation at all. The term "Isobar" as used in the table indicates the compounds that could not be distinguished from each other on the analytical platform used in the analysis (i.e., the compounds in an isobar elute at nearly the same time and have similar (and sometimes exactly the same) quant ions, and thus cannot be distinguished).
The results of this analysis showed the individual compounds that are correlated with Rd in both study 1 and study 2; these biomarkers are listed in Table 4. For each biomarker the study, compound name, database identifier, median importance are given. The Library ID (LIB_ID) indicates the analytical platform that was used to measure the biomarker compound. GC-MS is indicated by Library ID (Lib_ID) 50 whereas LC-MS is indicated by Library ID 61, 200, and 201. The biomarker compounds are ordered in the table by the statistical significance of the correlation (P-value). "RF_Rank" refers to the importance score obtained for the biomarker from Random Forest analysis. "Comp_ID" refers to the internal database identifier for that compound in our internal compound library.
TABLE-US-00004 TABLE 4 Biomarker correlation with Rd Study Comp_ID Compound Name Lib_ID RF_Rank Correlation R-square P-value 2 21044 2-hydroxybutyrate (AHB) 50 1 -4.47E-01 0.200 1.21E-14 1 20488 glucose 50 1 3.69E-01 0.136 1.21E-14 1 587 gluconate 50 2 -6.11E-01 0.373 8.73E-13 1 1336 palmitate (16:0) 201 5 -5.95E-01 0.355 4.37E-12 1 33416 Metabolite-12064 201 9 -5.94E-01 0.353 5.09E-12 1 20675 1,5-anhydroglucitol (1,5-AG) 201 13 5.93E-01 0.352 5.62E-12 1 12751 glutamate-2 50 3 -5.82E-01 0.339 1.66E-11 1 1121 margarate (17:0) 50 4 -5.52E-01 0.304 2.88E-10 1 584 mannose 50 6 -5.50E-01 0.303 3.28E-10 1 31535 Bradykinin, hydroxyproline 61 6 1.22E-08 0.295 7.09E-10 form 1 21044 2-hydroxybutyrate (AHB) 50 14 -5.40E-01 0.292 7.75E-10 1 27719 galactonic acid 50 1 -5.40E-01 0.291 8.28E-10 1 16235 Isobar.19 (1,5-AG etc) 61 31 1.96E-08 0.287 1.43E-09 1 33388 Metabolite-12037 201 19 -5.32E-01 0.283 1.58E-09 2 1359 oleate (18:1(n-9)) 201 3 -3.54E-01 0.125 2.15E-09 1 1358 stearate (18:0) 201 15 -5.22E-01 0.273 3.57E-09 1 27392 dipalmitin 50 8 -5.18E-01 0.268 4.97E-09 1 32569 Metabolite-11252 200 56 -5.10E-01 0.260 9.09E-09 1 33232 Metabolite-11887 201 41 -5.03E-01 0.253 1.60E-08 1 21047 3-methyl-2-oxobutyrate 201 42 -5.03E-01 0.253 1.64E-08 1 10737 Isobar.1 (mannose, glucose 61 36 1.72E-07 0.254 1.75E-08 etc) 1 22570 Metabolite-9033 50 62 -4.98E-01 0.248 2.24E-08 1 32566 Metabolite-11249 200 70 -4.95E-01 0.245 2.82E-08 1 18369 gamma-glutamylleucine 200 12 -4.95E-01 0.245 2.95E-08 1 25602 Metabolite-10432 50 39 -4.91E-01 0.241 3.79E-08 1 27722 erythrose 50 43 -4.91E-01 0.241 3.84E-08 1 32630 oleate (18:1(n-9)) 201 54 -4.86E-01 0.236 5.47E-08 1 27888 Metabolite-10609 50 10 -4.85E-01 0.235 5.87E-08 1 24077 Metabolite-9727 50 22 -4.85E-01 0.235 6.15E-08 1 32696 Metabolite-11379 201 37 -4.84E-01 0.234 6.50E-08 1 12666 Threonine 50 9 4.82E-07 0.235 7.02E-08 1 32551 Metabolite-11234 201 34 -4.83E-01 0.233 7.11E-08 1 30288 Metabolite-10750 50 25 -4.82E-01 0.232 7.39E-08 1 33413 Metabolite-12061 201 16 -4.80E-01 0.231 8.27E-08 1 60 leucine 200 58 -4.80E-01 0.230 8.52E-08 1 21127 palmitoylglycerol 50 60 -4.75E-01 0.225 1.23E-07 (monopalmitin) 1 32393 glutamylvaline 200 11 -4.74E-01 0.225 1.26E-07 1 19462 Metabolite-6446 50 30 -4.74E-01 0.225 1.28E-07 1 16120 Metabolite-4055 50 38 -4.73E-01 0.223 1.44E-07 1 32515 valine 200 71 -4.72E-01 0.223 1.49E-07 1 5628 Metabolite-1086 61 5 1.12E-06 0.221 1.96E-07 1 32704 Metabolite-11387 200 115 -4.68E-01 0.219 1.99E-07 1 32571 Metabolite-11254 200 97 -4.66E-01 0.217 2.25E-07 1 32501 dihomo-alpha-linolenate 201 26 -4.66E-01 0.217 2.31E-07 (20:3(n-3)) 1 17627 Metabolite-4986 50 24 -4.61E-01 0.213 3.05E-07 1 32402 gondoate (20:1(n-9)) 201 101 -4.48E-01 0.201 7.10E-07 1 32575 Metabolite-11258 200 241 -4.47E-01 0.200 7.75E-07 1 32970 Metabolite-11653 201 51 -4.45E-01 0.198 8.81E-07 1 16512 Metabolite-4275 50 54 3.95E-06 0.2 8.91E-07 1 12757 Metabolite-3078 50 52 4.44E-01 0.197 9.64E-07 1 27718 creatine 200 27 -4.41E-01 0.194 1.16E-06 1 30832 Metabolite-10814 50 47 -4.40E-01 0.193 1.23E-06 1 30290 Metabolite-10752 50 121 -4.38E-01 0.192 1.36E-06 1 32703 Metabolite-11386 200 94 -4.37E-01 0.191 1.47E-06 1 577 fructose 50 93 -4.36E-01 0.190 1.53E-06 1 22116 4-methyl-2-oxopentanoate 201 74 -4.35E-01 0.189 1.65E-06 1 33172 Metabolite-11827 201 61 4.35E-01 0.189 1.67E-06 1 22600 Metabolite-9043 50 90 -4.31E-01 0.186 2.05E-06 1 1125 isoleucine 200 137 -4.31E-01 0.185 2.14E-06 1 19490 Metabolite-6488 50 32 -4.28E-01 0.183 2.46E-06 1 16518 Metabolite-4276 50 18 -4.26E-01 0.182 2.78E-06 1 15122 glycerol 50 45 -4.25E-01 0.181 2.93E-06 1 12782 Metabolite-3100 50 17 -4.23E-01 0.179 3.39E-06 1 33242 Metabolite-11897 201 77 -4.21E-01 0.177 3.75E-06 1 17330 Metabolite-4769 50 35 4.21E-01 0.177 3.86E-06 1 32672 Metabolite-02546_200 200 67 4.14E-01 0.171 5.69E-06 1 33237 Metabolite-11892 201 124 -4.12E-01 0.170 6.48E-06 1 32673 linoleate (18:2(n-6)) 201 28 -4.07E-01 0.166 8.49E-06 1 32545 Metabolite-11228 201 64 -4.03E-01 0.163 1.05E-05 1 32751 Metabolite-11434 201 63 -4.03E-01 0.162 1.06E-05 1 22895 Metabolite-9299 50 72 -3.99E-01 0.159 1.34E-05 2 33488 5-alpha-Cholest-7-en-3- 50 11 -2.61E-01 0.068 1.40E-05 beta-ol 1 32517 Metabolite-11203 200 82 3.98E-01 0.158 1.42E-05 1 33415 Metabolite-12063 201 44 -3.97E-01 0.158 1.46E-05 1 32682 Metabolite-11365 201 29 -3.94E-01 0.155 1.72E-05 2 32761 Metabolite-11444 201 12 -2.58E-01 0.067 1.77E-05 2 32338 glycine 50 13 2.58E-01 0.066 1.83E-05 1 32749 Metabolite-11432 201 107 -3.91E-01 0.153 2.04E-05 1 1110 arachidonate (20:4(n-6)) 50 49 -3.90E-01 0.152 2.12E-05 1 33138 Metabolite-11793 200 96 -3.88E-01 0.150 2.39E-05 2 33447 palmitoleate (16:1(n-7)) 201 15 -2.53E-01 0.064 2.59E-05 1 32504 n-3 DPA (22:5(n-3)) 201 31 -3.83E-01 0.147 3.05E-05 1 18868 Metabolite-5847 50 80 -3.80E-01 0.144 3.56E-05 1 27738 threonate 50 53 3.75E-01 0.141 4.62E-05 1 32552 Metabolite-11235 201 73 -3.75E-01 0.140 4.68E-05 1 27279 Metabolite-10511 50 7 -3.69E-01 0.136 6.11E-05 1 32547 Metabolite-11230 201 163 -3.68E-01 0.135 6.55E-05 1 19377 Metabolite-6272 50 194 -3.66E-01 0.134 7.40E-05 1 32416 alpha-linolenate (18:3(n-3)) 201 65 -3.66E-01 0.134 7.41E-05 1 33080 Metabolite-11735 200 50 3.63E-01 0.132 8.27E-05 1 22320 Metabolite-8889 50 177 3.62E-01 0.131 8.90E-05 1 32945 Metabolite-11628 201 197 -3.60E-01 0.130 9.48E-05 2 599 pyruvate 50 18 -2.31E-01 0.053 1.00E-04 2 33453 alpha-ketoglutarate 50 17 -2.35E-01 0.055 1.00E-04 2 1105 linoleate (18:2(n-6)) 201 16 -2.44E-01 0.059 1.00E-04 1 527 lactate 50 76 -3.58E-01 0.128 1.06E-04 1 15676 3-methyl-2-oxovalerate 201 216 -3.53E-01 0.125 1.35E-04 1 32836 peptide-HWESASXX 200 33 -3.47E-01 0.121 1.76E-04 1 32637 Metabolite-11320 201 100 3.45E-01 0.119 1.91E-04 2 15749 hydrocinnamic acid 201 21 2.26E-01 0.051 2.00E-04 2 1648 serine 50 19 2.27E-01 0.052 2.00E-04 1 15500 carnitine 200 310 -3.38E-01 0.114 2.64E-04 1 16496 pyruvate 50 119 -3.35E-01 0.113 3.00E-04 1 32559 Metabolite-11242 201 87 -3.35E-01 0.112 3.11E-04 1 32632 Metabolite-11315 200 110 3.31E-01 0.110 3.61E-04 2 33587 Isobar-cis-9-cis-11-trans-11- 201 23 -2.16E-01 0.046 4.00E-04 eicosenoate 2 32401 trigonelline (N- 200 22 2.16E-01 0.047 4.00E-04 methylnicotinate) 1 21630 Metabolite-8402 50 36 -3.27E-01 0.107 4.40E-04 1 16666 Metabolite-4365 50 272 -3.25E-01 0.105 4.79E-04 1 16665 Metabolite-4364 50 105 3.24E-01 0.105 4.98E-04 1 19983 Metabolite-6955 50 122 -3.24E-01 0.105 4.99E-04 2 32405 3-indolepropionate 50 24 2.10E-01 0.044 5.00E-04 1 31509 Metabolite-10931 50 220 -3.21E-01 0.103 5.66E-04 1 27889 Metabolite-10610 50 95 -3.19E-01 0.102 6.12E-04 1 16650 Metabolite-4360 50 125 -3.18E-01 0.101 6.37E-04 1 32644 Metabolite-11327 200 111 -3.18E-01 0.101 6.39E-04 2 32445 3-methylxanthine 201 26 2.06E-01 0.042 7.00E-04 1 19370 Metabolite-6268 50 179 3.14E-01 0.099 7.47E-04 1 32702 Metabolite-11385 200 221 -3.13E-01 0.098 7.73E-04 1 19576 Metabolite-6627 50 135 -3.12E-01 0.098 7.97E-04 2 32757 Metabolite-11440 201 28 -2.03E-01 0.041 8.00E-04 1 12663 serine-2 50 20 3.11E-01 0.097 8.44E-04 1 19494 Metabolite-6506 50 236 -3.10E-01 0.096 8.82E-04 1 32628 palmitoleate (16:1(n-7)) 201 83 -3.10E-01 0.096 8.90E-04 1 59 histidine 201 355 -3.09E-01 0.096 9.00E-04 1 32516 Metabolite-11202 200 134 3.08E-01 0.095 9.69E-04 1 33087 peptide-RPPGFSPF 200 127 -3.04E-01 0.093 1.11E-03 2 31453 cysteine 50 29 -1.95E-01 0.038 1.30E-03 1 16138 Metabolite-4080 50 371 -3.00E-01 0.090 1.30E-03 2 24074 Metabolite-9706 50 30 1.94E-01 0.038 1.40E-03 1 32595 Metabolite-08993_200 200 48 -2.97E-01 0.088 1.46E-03 1 16509 Metabolite-4273 50 369 2.96E-01 0.088 1.50E-03 1 32735 Metabolite-01911_200 200 146 -2.96E-01 0.088 1.53E-03 1 30281 glycine-2 50 154 2.95E-01 0.087 1.58E-03 1 32519 Metabolite-11205 200 120 2.95E-01 0.087 1.59E-03 2 33531 Metabolite-12116 200 31 1.91E-01 0.036 1.60E-03 1 64 phenylalanine 200 21 -2.90E-01 0.084 1.89E-03 1 32548 Metabolite-11231 201 131 -2.90E-01 0.084 1.89E-03 1 22154 bradykinin 200 55 -2.89E-01 0.084 2.00E-03 1 32348 2-aminobutyrate 200 297 -2.86E-01 0.082 2.25E-03 1 31537 peptide-HWESASXXR 200 99 -2.84E-01 0.081 2.41E-03 1 32747 Metabolite-01142_201 201 148 -2.83E-01 0.080 2.48E-03 1 32550 Metabolite-02272_201 201 176 2.82E-01 0.080 2.59E-03 2 15753 hippurate 200 35 1.82E-01 0.033 2.70E-03 2 32198 acetylcarnitine 200 34 -1.82E-01 0.033 2.70E-03 1 21188 stearoylglycerol 50 196 -2.78E-01 0.077 2.97E-03 (monostearin) 1 12626 Metabolite-3003 50 198 2.77E-01 0.077 3.10E-03 1 32654 Metabolite-11337 200 84 -2.73E-01 0.075 3.53E-03 1 21421 Metabolite-8214 50 98 -2.73E-01 0.075 3.58E-03 2 32807 Metabolite-11490 201 38 -1.74E-01 0.030 4.10E-03 1 606 uridine 201 230 -2.69E-01 0.072 4.16E-03 1 19487 Metabolite-6486 50 78 -2.69E-01 0.072 4.18E-03 1 32412 butyrylcarnitine 200 389 -2.69E-01 0.072 4.20E-03 2 32616 Metabolite-11299 201 41 1.72E-01 0.030 4.60E-03 1 25459 Metabolite-10395 50 285 -2.62E-01 0.068 5.35E-03 1 33210 Metabolite-11865 201 171 2.61E-01 0.068 5.47E-03 1 27264 Metabolite-10503 50 181 2.59E-01 0.067 5.85E-03 1 32578 Metabolite-11261 200 223 -2.58E-01 0.067 5.93E-03 1 32609 Metabolite-01345_201 201 57 2.58E-01 0.067 5.94E-03 1 25609 Metabolite-10439 50 150 -2.57E-01 0.066 6.19E-03 1 12768 Metabolite-3088 50 91 2.56E-01 0.065 6.49E-03 1 18120 Metabolite-5348 50 108 -2.56E-01 0.065 6.53E-03 2 3147 xanthine 50 44 -1.65E-01 0.027 6.60E-03 2 15990 glycerophosphorylcholine 200 45 1.64E-01 0.027 6.90E-03 (GPC) 1 2730 gamma-glutamylglutamine 200 109 2.51E-01 0.063 7.60E-03 1 32701 urate 200 85 -2.50E-01 0.063 7.80E-03 1 33227 Metabolite-11882 201 23 -2.49E-01 0.062 8.01E-03 1 19934 inositol 50 227 -2.44E-01 0.059 9.62E-03 1 25402 Metabolite-10360 50 129 -2.44E-01 0.059 9.63E-03 1 32520 Metabolite-11206 200 218 -2.43E-01 0.059 9.91E-03 2 32877 Metabolite-11560 201 49 1.56E-01 0.024 1.02E-02 1 32753 Metabolite-09789_201 201 193 2.42E-01 0.058 1.03E-02 2 1494 5-oxoproline 200 50 1.56E-01 0.024 1.04E-02 1 12774 Metabolite-3094 50 199 -2.41E-01 0.058 1.05E-02 1 32635 Metabolite-11318 201 175 2.41E-01 0.058 1.05E-02 1 20950 Metabolite-7846 50 162 -2.40E-01 0.058 1.07E-02 1 32606 bilirubin 201 289 2.40E-01 0.058 1.08E-02 1 32752 Metabolite-11435 201 184 -2.38E-01 0.057 1.16E-02 1 32754 Metabolite-11437 201 186 2.34E-01 0.055 1.29E-02 1 12129 beta-hydroxyisovalerate 50 140 -2.34E-01 0.055 1.30E-02 1 17028 Metabolite-4611 50 130 -2.34E-01 0.055 1.31E-02 1 33132 Metabolite-11787 200 251 -2.34E-01 0.055 1.31E-02 1 12067 undecanoate 201 183 -2.33E-01 0.054 1.34E-02 1 542 3-hydroxybutyrate (BHBA) 50 206 -2.33E-01 0.054 1.35E-02 2 33323 Metabolite-11977 200 51 -1.49E-01 0.022 1.41E-02 1 512 asparagine 50 75 2.31E-01 0.053 1.44E-02 2 54 tryptophan 200 52 1.47E-01 0.022 1.53E-02 1 22032 Metabolite-8766 50 208 -2.28E-01 0.052 1.57E-02 2 32792 Metabolite-11475 201 53 -1.46E-01 0.021 1.64E-02 1 32625 Metabolite-11308 201 301 -2.26E-01 0.051 1.65E-02 1 32813 Metabolite-11496 201 116 -2.25E-01 0.051 1.69E-02 1 18477 glycodeoxycholate 201 192 -2.24E-01 0.050 1.76E-02 2 12795 Metabolite-3113 50 54 1.44E-01 0.021 1.78E-02 1 32553 Metabolite-03832_201 201 256 -2.23E-01 0.050 1.82E-02 2 33364 gamma-glutamylthreonine- 200 56 1.43E-01 0.020 1.88E-02 2 2342 serotonin (5HT) 200 57 1.40E-01 0.020 2.12E-02 1 32855 Metabolite-11538 201 46 2.17E-01 0.047 2.13E-02 1 32197 3-(4-hydroxyphenyl)lactate 201 190 -2.14E-01 0.046 2.38E-02 2 2132 citrulline 200 58 1.37E-01 0.019 2.41E-02 1 21049 1,6-anhydroglucose 50 136 2.13E-01 0.045 2.43E-02 1 33362 gamma- 200 173 -2.12E-01 0.045 2.49E-02 glutamylphenylalanine 1 32452 propionylcarnitine 200 252 -2.12E-01 0.045 2.51E-02 1 32656 Metabolite-11339 201 142 2.11E-01 0.045 2.55E-02 2 1365 myristate (14:0) 201 59 -1.36E-01 0.018 2.59E-02 1 25532 Metabolite-10413 50 226 -2.10E-01 0.044 2.63E-02 2 3141 betaine 200 60 1.35E-01 0.018 2.64E-02 1 32648 Metabolite-11331 201 132 2.10E-01 0.044 2.66E-02 1 25548 Metabolite-10419 50 128 2.08E-01 0.043 2.76E-02 1 32748 Metabolite-11431 201 178 -2.08E-01 0.043 2.79E-02 1 33135 Metabolite-11790 200 138 -2.07E-01 0.043 2.84E-02 1 31518 Metabolite-10933 50 152 -2.07E-01 0.043 2.85E-02 1 19478 Metabolite-6467 50 118 -2.06E-01 0.042 2.95E-02 2 33226 Metabolite-11881 201 65 1.32E-01 0.018 2.97E-02 1 32561 Metabolite-11244 201 243 -2.05E-01 0.042 2.98E-02 1 11438 phosphate 50 273 -2.05E-01 0.042 3.02E-02 2 1572 glycerate 50 66 1.31E-01 0.017 3.10E-02 2 33477 erythronate- 50 67 1.31E-01 0.017 3.13E-02 1 12781 Metabolite-3099 50 141 -2.03E-01 0.041 3.18E-02 1 32732 Metabolite-11415 201 155 2.03E-01 0.041 3.22E-02 1 1299 tyrosine 200 147 -2.02E-01 0.041 3.31E-02 2 27256 Metabolite-10500 50 69 -1.29E-01 0.017 3.37E-02 1 32346 glycochenodeoxycholate 201 202 -2.00E-01 0.040 3.45E-02 1 27710 N-acetylglycine 50 126 2.00E-01 0.040 3.47E-02 1 22842 cholate 201 165 -1.99E-01 0.040 3.56E-02 1 31373 Metabolite-10878 50 274 1.98E-01 0.039 3.59E-02 2 16511 Metabolite-4274 50 72 1.27E-01 0.016 3.71E-02 2 15996 aspartate 50 73 1.27E-01 0.016 3.72E-02 1 33228 Metabolite-11883 200 332 1.97E-01 0.039 3.72E-02 1 18929 Metabolite-5907 50 172 -1.96E-01 0.039 3.80E-02 2 569 caffeine 200 74 -1.26E-01 0.016 3.87E-02 2 32971 Metabolite-11654 200 76 -1.25E-01 0.016 3.98E-02 1 32795 Metabolite-11478 201 189 -1.94E-01 0.038 4.00E-02 1 32868 glycocholate 201 225 -1.93E-01 0.037 4.12E-02 2 18335 quinate 50 78 1.24E-01 0.015 4.24E-02 1 32587 Metabolite-02249_201 201 89 -1.91E-01 0.036 4.38E-02
1 22548 Metabolite-9026 50 337 -1.91E-01 0.036 4.39E-02 1 32829 Metabolite-03653_200 200 102 1.90E-01 0.036 4.48E-02 1 33185 Metabolite-11840 201 104 -1.90E-01 0.036 4.49E-02 1 20699 erythritol 50 133 -1.90E-01 0.036 4.50E-02 1 32588 Metabolite-01327_201 201 233 -1.90E-01 0.036 4.52E-02 1 32848 Metabolite-11531 201 245 -1.89E-01 0.036 4.54E-02 1 17389 Metabolite-4796 50 79 1.89E-01 0.036 4.57E-02 2 1493 ornithine 50 82 1.22E-01 0.015 4.60E-02 2 32418 myristoleate*14-1-n-5- 201 84 -1.21E-01 0.015 4.68E-02 2 15140 kynurenine 200 83 1.21E-01 0.015 4.68E-02 1 32596 Metabolite-02250_200 200 151 -1.88E-01 0.035 4.69E-02 1 33380 Metabolite-12029 201 68 1.87E-01 0.035 4.78E-02 1 27272 Metabolite-10505 50 393 1.86E-01 0.035 4.96E-02 1 63 cholesterol 50 212 -1.86E-01 0.035 4.96E-02 1 33198 Metabolite-11853 201 314 -1.84E-01 0.034 5.21E-02 2 15630 N-acetylornithine 200 87 1.17E-01 0.014 5.52E-02 2 19323 docosahexaenoate 201 90 -1.16E-01 0.013 5.66E-02 (DHA)22-6-n-3- 2 32760 Metabolite-11443 201 91 -1.16E-01 0.013 5.68E-02 2 18392 theobromine 200 92 1.16E-01 0.013 5.73E-02 1 32514 Metabolite-11200 200 201 1.79E-01 0.032 5.88E-02 2 16634 Metabolite-4357 50 96 -1.13E-01 0.013 6.37E-02 1 32518 Metabolite-11204 200 396 -1.75E-01 0.031 6.46E-02 1 33081 Metabolite-11736 200 276 -1.75E-01 0.031 6.47E-02 1 32850 Metabolite-11533 201 217 -1.73E-01 0.030 6.82E-02 1 32671 Metabolite-11354 200 139 1.73E-01 0.030 6.86E-02 2 32786 Metabolite-11469 200 98 1.11E-01 0.012 6.92E-02 2 25522 Metabolite-10407 50 99 -1.10E-01 0.012 7.11E-02 2 1649 valine 200 100 -1.10E-01 0.012 7.21E-02 1 32684 Metabolite-11367 201 224 -1.70E-01 0.029 7.23E-02 1 553 cotinine 200 266 1.70E-01 0.029 7.24E-02 1 33389 Metabolite-12038 201 214 -1.70E-01 0.029 7.24E-02 1 1563 chenodeoxycholate 201 370 -1.70E-01 0.029 7.39E-02 2 22481 Metabolite-8988 50 102 1.09E-01 0.012 7.48E-02 1 12593 Metabolite-2973 50 149 1.67E-01 0.028 7.76E-02 1 32793 Metabolite-11476 200 383 -1.67E-01 0.028 7.80E-02 1 32564 Metabolite-11247 201 249 1.67E-01 0.028 7.84E-02 2 1508 pantothenate 200 104 -1.07E-01 0.012 7.84E-02 2 16829 Metabolite-4503 50 105 1.07E-01 0.011 7.99E-02 1 32652 Metabolite-11335 200 388 1.66E-01 0.028 8.03E-02 1 15365 glycerol 3-phosphate (G3P) 50 348 -1.65E-01 0.027 8.15E-02 2 32875 Metabolite-11558 200 107 -1.06E-01 0.011 8.29E-02 2 15506 choline 200 108 1.06E-01 0.011 8.32E-02 2 32492 caprylate-8-0- 201 109 1.05E-01 0.011 8.51E-02 1 16287 Metabolite-2800 50 209 -1.63E-01 0.027 8.51E-02 1 1114 deoxycholate 201 106 -1.63E-01 0.027 8.63E-02 2 32619 Metabolite-11302 201 110 1.05E-01 0.011 8.64E-02 1 27275 Metabolite-10507 50 182 1.62E-01 0.026 8.74E-02 1 32718 Metabolite-01342_200 200 167 -1.61E-01 0.026 8.94E-02 2 33403 Metabolite-12051 200 112 -1.03E-01 0.011 8.96E-02 1 32769 Metabolite-11452 201 278 -1.59E-01 0.025 9.31E-02 2 32756 Metabolite-02276_201 201 116 1.01E-01 0.010 9.72E-02 2 33225 Metabolite-11880 201 118 -1.01E-01 0.010 9.88E-02 1 32839 Metabolite-11522 201 144 1.57E-01 0.025 9.89E-02
2C: Variable Selection with Random Forest for Rd Modeling
50 iterations of a random forest analysis with complete 5-fold cross-validation regressions (for Study 1 this analysis included only baseline data, n=111; while for Study 2 all samples were included, n=402) was carried out as follows:
80% of the data was used as the training set to run 1000 regression random forests, record the importance scores and rank the variables according to their importance scores;
Next, four variables at a time were deleted starting from the lowest ranked variables, then the random forest was run with the remaining variables on the training set to predict the remaining 20% of the data (i.e., test set). The error and R-square for each was recorded.
For each variable, the mean/median importance score and rank across all run was calculated.
Variable selection is more or less stable for the approximately first 30-60 variables.
2D: Estimate of the Number of Metabolites Considered Significant for Rd Correlation
The mean R-square values remain constantly high and the corresponding errors remain consistently low as the number of metabolites reaches approximately 30 or more (FIGS. 1 and 2), suggesting that a total of approximately 30 metabolites may be sufficient for construction of an algorithm to correlate with Rd, although it may also be possible to construct an algorithm to correlate with Rd based on a combination of less than seven metabolites. As a result, only the top 30 to 50 cross-validated compounds were selected for regression analyses.
Based on random forest variable selection procedures, the biomarker compounds that are considered reliably significant for construction of an algorithm for Rd correlation were identified. The RF score for each of the biomarker compounds is listed in the column headed "RF_Rank" in Table 4.
2E: Modeling of Rd Correlation with Top Compounds
Based on the modeling experiments, the mean R-square values remain constantly high and the corresponding errors remain consistently low as the number of metabolites reaches seven and above (FIGS. 3 and 4), suggesting that a combination of seven metabolites will be sufficient for construction of an algorithm to correlate with Rd, although it may also be possible to construct an algorithm to correlate with Rd based on a combination of less than seven metabolites.
2F: LASSO Regression
Only cross-validated variables from the random forest analyses above were used for LASSO regression to pick the best combination of variables to predict Rd. The most appropriate transformation of the cross-validated variables was also considered for the LASSO regression.
LASSO regression analysis based upon the cohort in study 1 provided one of the best models of Rd regression with three to nine variables and cross-validated r-square values for the correlation. The best r-square value approaches 0.68 with seven to eight metabolites using the non-transformed data (Table 5) and approaches 0.69-0.70 with the same number of metabolites with appropriate transformation of each variable (Table 6).
TABLE-US-00005 TABLE 5 LASSO regression with non-transformed data. Number of Variables 3 4 5 6 7 8 9 LASSO Maximum 0.355 0.422 0.600 0.643 0.670 0.720 0.779 R-square Cross-Validated 0.586 0.600 0.653 0.651 0.681 0.687 0.665 R-square 1,5-Anhydro-D- glucitol Bradykinin- hydroxyproline Palmitate Metabolite-9727 Glu-Val Threonine Dihydroimidazole- 4-acetate Mannose 2-Hydroxybutyrate Isobar-56** Serine Note: **Isobar 56 includes DL-pipecolic acid and 1-amino-1-cyclopentanecarboxylic acid that can be separated
TABLE-US-00006 TABLE 6 LASSO regression with transformed data. Number of Variables 3 4 5 6 7 8 9 LASSO Maximum 0.355 0.422 0.600 0.643 0.670 0.720 0.779 R-square Cross-Validated 0.592 0.603 0.662 0.657 0.692 0.702 0.684 R-square 1,5-Anhydro-D- glucitol Bradykinin- hydroxyproline form Log(Palmitate) Log(Metabolite-9727) Glu-Val Threonine Log(Dihydro- imidazole- 4-acetate) Log(Mannose) Log(2- Hydroxybutyrate) Isobar-56** Serine Note: **Isobar 56 includes DL-pipecolic acid and 1-amino-1-cyclopentanecarboxylic
The R-square for the correlation of Rd with 7-8 metabolites approaches 0.70 with cross-validation in an independent cohort.
LASSO analysis based on the cohort in study 1 provided the best models of Rd regression with 3-9 variables with cross-validated r-square values for the correlation of another set approaching 0.68 with 7-8 metabolites using the non-transformed data as shown in Table 7.
TABLE-US-00007 TABLE 7 LASSO regression with non-transformed data. Number of Variables 3 4 5 6 7 8 9 Cross-Validated R-square 0.617 0.636 0.650 0.656 0.678 0.681 0.685 1,5-Anhydro-D-glucitol Palmitate Glu-Val Serine Margarate X-9727 X-10511 Etio cholanolone sulfate (X-1345) Gamma tocopherol (X-4276) Creatine
2G: Models Predictive of Insulin Resistance.
In study 2, compounds identified as important in building models to predict Rd by Random Forest and Lasso Regression are listed in Table 4. The cross-validated compounds were then selected for regression analysis along with clinical measurements (e.g. fasting insulin, fasting pro-insulin, fasting free fatty acids (FFA), fasting C-peptide, HDL cholesterol, LDL cholesterol, fasting plasma glucose, adiponectin, BMI, PYY, etc.) Each regression method and the Univariate Correlation/Linear Regression method model was then used to predict Rd for each individual, which was in turn used to classify individuals according to the level of glucose utilization as normal, insulin impaired, or insulin resistant. Samples from ninety percent of the subjects were used to build the model and samples from the remaining ten percent of the subjects were used to test the predictive power of the model. Biomarker compounds that are useful to predict Rd and that are positively or negatively correlated with Rd were identified in these analyses. These markers are useful to predict insulin resistance. All of the biomarker compounds are statistically significant (p<0.05) in each of the regression models.
The models generated using this analytical approach are summarized in Table 8. The sensitivity, specificity and predictive power (positive, PPV and negative, NPV) of the models are shown in Table 8. The sensitivity of the models ranges from about 54% to about 63% and the specificity ranges from about 63% to greater than 95%. The PPV range is from about 78% to about 94% and the NPV from greater than about 79% to greater than about 83%.
TABLE-US-00008 TABLE 8 Metabolite Biomarkers and models that are predictive of Insulin Resistance as determined by glucose disposal rate (Rd). Model No. No. Variables R-square Sensitivity Specificity PPV NPV Variable 1 Variable 2 Variable 3 1 8 0.5486 59.84 95.51 87.36 82.11 BMI Fasting Insulin Fasting_Proinsulin 2 9 0.4937 55.12 95.51 86.42 80.41 Fasting Oleate BMI Insulin 3 7 0.5398 59.06 95.10 86.21 81.75 BMI Fasting Insulin Fasting Proinsulin 4 9 0.5137 56.69 95.10 85.71 80.90 BMI Fasting Insulin 2Hydroxybutyrate 5 9 0.5308 60.63 95.10 86.52 82.33 Fasting Fasting Glul.Val Insulin Proinsulin 6 7 0.5122 56.69 94.69 84.71 80.84 BMI Fasting Insulin Pyruvate 7 8 0.5179 56.69 94.69 84.71 80.84 BMI Fasting Insulin Pyruvate 8 9 0.5179 56.69 94.69 84.71 80.84 BMI Fasting Insulin Lactate 9 7 0.5380 62.20 94.69 85.87 82.86 BMI Fasting Insulin Fasting Proinsulin 10 7 0.5458 61.42 94.69 85.71 82.56 BMI Fasting Insulin Fasting Proinsulin 11 8 0.5531 60.63 94.69 85.56 82.27 BMI Fasting Insulin Fasting Proinsulin 12 8 0.5534 59.84 94.69 85.39 81.98 BMI Fasting Insulin Fasting Proinsulin 13 9 0.5596 62.99 94.69 86.02 83.15 BMI Fasting Insulin Fasting Proinsulin 14 9 0.5584 59.84 94.69 85.39 81.98 BMI Fasting Insulin Fasting Proinsulin 15 9 0.5580 59.84 94.69 85.39 81.98 BMI Fasting Insulin Fasting Proinsulin 16 9 0.5223 56.69 94.69 84.71 80.84 BMI Fasting Insulin 2Hydroxybutyrate 17 9 0.5317 60.63 94.69 85.56 82.27 Fasting Glul.Val BMI Insulin 18 9 0.5106 57.48 94.29 93.91 81.05 BMI Fasting Insulin 2Hydroxybutyrate 19 9 0.5167 55.91 94.29 83.53 80.49 BMI Fasting Insulin 2Hydroxybutyrate 20 9 0.5368 61.42 94.29 84.78 82.50 Fasting Fasting BMI Insulin Proinsulin 21 9 0.5253 59.84 94.29 84.44 81.91 Creatine Glycine Fasting Insulin 22 9 0.5260 58.27 94.29 84.09 81.34 Fasting Fasting Pyruvate Insulin Proinsulin 23 9 0.4943 56.69 94.29 83.72 80.77 Fasting BMI FPG Insulin 24 9 0.4864 55.12 94.29 83.33 80.21 Fasting BMI FPG Insulin 25 9 0.4958 54.33 94.29 83.13 79.93 Triglycerides Linolenate Fasting Insulin 26 7 0.5401 57.48 94.29 83.91 81.05 BMI Fasting Insulin Fasting FFA 27 8 0.5499 59.06 94.29 84.27 81.63 BMI Fasting Insulin Fasting Proinsulin 28 8 0.5492 59.06 94.29 84.27 81.63 BMI Fasting Insulin Fasting Proinsulin 29 9 0.5578 62.99 94.29 85.11 83.09 BMI Fasting Insulin Fasting Proinsulin 30 9 0.5576 62.99 94.29 85.11 83.09 BMI Fasting Insulin Fasting Proinsulin 31 9 0.5615 59.84 94.29 84.44 81.91 BMI Fasting Insulin Fasting Proinsulin 32 9 0.4972 60.63 93.88 83.70 82.14 BMI Fasting Insulin 2Hydroxybutyrate 33 9 0.5060 55.91 93.88 82.56 80.42 BMI Fasting Insulin 2Hydroxybutyrate 34 9 0.5635 62.99 93.88 84.21 83.03 Fasting Fasting Gamma.Glu. Insulin Proinsulin Leu 35 9 0.4996 55.12 93.88 82.35 80.14 Fasting Fasting_C_Peptide Lactate Insulin 36 9 0.4983 54.33 93.88 82.14 79.86 Fasting Lactate BMI Insulin 37 7 0.5136 55.12 93.88 82.35 80.14 BMI Fasting Insulin .Betaine 38 8 0.5177 55.91 93.88 82.56 80.42 BMI Fasting Insulin Pyruvate 39 8 0.5183 54.33 93.88 82.14 79.86 BMI Fasting Insulin .Betaine 40 9 0.5177 55.91 93.88 82.56 80.42 BMI Fasting Insulin .Galactonate 41 9 0.5183 54.33 93.88 82.14 79.86 BMI Fasting Insulin Pyruvate 42 7 0.5390 62.99 93.88 84.21 83.03 BMI Fasting Insulin Fasting Proinsulin 43 7 0.5382 62.20 93.88 84.04 82.73 BMI Fasting Insulin Fasting Proinsulin 44 8 0.5479 61.42 93.88 83.87 82.44 BMI Fasting Insulin Fasting Proinsulin 45 8 0.5513 59.84 93.88 83.52 81.85 BMI Fasting Insulin Fasting Proinsulin 46 9 0.5595 61.42 93.88 83.87 82.44 BMI Fasting Insulin Fasting Proinsulin 47 9 0.5575 59.06 93.88 83.33 81.56 BMI Fasting Insulin Fasting Proinsulin 48 9 0.4936 56.69 93.47 81.82 80.63 BMI Fasting Insulin 2Hydroxybutyrate 49 9 0.5198 55.91 93.47 81.61 80.35 BMI Fasting Insulin 2Hydroxybutyrate 50 9 0.5211 58.27 93.47 82.22 81.21 Fasting Glutamate BMI Insulin 51 9 0.5167 58.27 93.47 82.22 81.21 Fasting Oleoyl.LPC Pyruvate Insulin 52 7 0.5148 57.48 93.47 82.02 80.92 BMI Fasting Insulin .Gamma.Glu. Leu 53 7 0.5128 55.91 93.47 81.61 80.35 BMI Fasting Insulin .Glul.Val 54 7 0.5139 55.12 93.47 81.40 80.07 BMI Fasting Insulin .Gamma.Glu. Leu 55 8 0.5188 57.48 93.47 82.02 80.92 BMI Fasting Insulin .Betaine 56 8 0.5194 55.91 93.47 81.61 80.35 BMI Fasting Insulin .Gamma.Glu. Leu 57 8 0.5178 54.33 93.47 81.18 79.79 BMI Fasting Insulin .Betaine 58 9 0.5188 57.48 93.47 82.02 80.92 BMI Fasting Insulin .Betaine 59 9 0.5194 55.91 93.47 81.61 80.35 BMI Fasting Insulin .Betaine 60 9 0.5178 54.33 93.47 81.18 79.79 BMI Fasting Insulin Pyruvate 61 7 0.5396 62.99 93.47 83.33 82.97 BMI Fasting Insulin Fasting Proinsulin 62 8 0.5547 62.99 93.47 83.33 82.97 BMI Fasting Insulin Fasting Proinsulin 63 8 0.5493 62.20 93.47 83.16 82.67 BMI Fasting Insulin Fasting Proinsulin 64 8 0.5525 60.63 93.47 82.80 82.08 BMI Fasting Insulin Fasting Proinsulin 65 9 0.5615 62.20 93.47 83.16 82.67 BMI Fasting Insulin Fasting Proinsulin 66 9 0.5589 61.42 93.47 82.98 82.37 BMI Fasting Insulin Fasting Proinsulin 67 7 0.5127 55.12 93.06 80.46 80.00 BMI Fasting Insulin .Gamma.Glu. Leu 68 8 0.5179 55.91 93.06 80.68 80.28 BMI Fasting Insulin .Betaine 69 9 0.5179 55.91 93.06 80.68 80.28 BMI Fasting Insulin .Gamma.Glu. Leu 70 7 0.5388 57.48 93.06 81.11 80.85 BMI Fasting Insulin Fasting FFA 71 9 0.5081 59.06 93.06 81.52 81.43 Fasting Fasting_C_Peptide BMI Insulin 72 7 0.5157 56.69 92.65 80.00 80.50 BMI Fasting Insulin .Betaine 73 7 0.5124 56.69 92.65 80.00 80.50 BMI Fasting Insulin .Betaine 74 7 0.5131 55.91 92.65 79.78 80.21 BMI Fasting Insulin .Betaine 75 7 0.5121 55.91 92.65 79.78 80.21 BMI Fasting Insulin Pyruvate 76 8 0.5187 58.27 92.65 80.43 81.07 BMI Fasting Insulin .Betaine 77 8 0.5183 55.12 92.65 79.55 79.93 BMI Fasting Insulin Pyruvate 78 8 0.5176 55.12 92.65 79.55 79.93 BMI Fasting Insulin .Betaine 79 9 0.5187 58.27 92.65 80.43 81.07 BMI Fasting Insulin Pyruvate 80 9 0.5183 55.12 92.65 79.55 79.93 BMI Fasting Insulin .Gamma.Glu. Leu 81 9 0.5176 55.12 92.65 79.55 79.93 BMI Fasting Insulin .Betaine 82 7 0.5383 57.48 92.65 80.22 80.78 BMI Fasting Insulin Fasting FFA 83 9 0.5071 55.91 92.65 79.78 80.21 BMI Fasting Insulin 2Hydroxybutyrate 84 9 0.5137 58.27 92.65 80.43 81.07 Fasting Oleoyl.LPC BMI Insulin 85 9 0.5153 53.54 92.65 79.07 79.37 Fasting BMI Galactonate Insulin 86 9 0.4879 56.69 92.24 79.12 80.43 BMI Fasting Insulin 2Hydroxybutyrate 87 9 0.5032 55.91 91.84 78.02 80.07 Fasting Fasting_C_Peptide Lactate Insulin 88 9 0.4877 55.91 91.84 78.02 80.07 Fasting Lactate Oleate Insulin 89 7 0.5390 57.48 91.84 78.49 80.65 Fasting Fasting Insulin Fasting FFA Insulin 90 9 0.5122 52.87 62.63 86.05 81.47 Fasting Fasting Insulin 2Hydroxybutyrate Insulin Model No. Variable 4 Variable 5 Variable 6 Variable 7 Variable 8 Variable 9 1 Fasting FFA Adiponectin GlulVal Betaine 2Hydroxybutyrate 2 LDL_Cholesterol FPG Linoleate 2Hydroxybutyrate Linolenate HDL Cholesterol 3 Fasting FFA Adiponectin GlulVal 2Hydroxybutyrate 4 Glul.Val Creatine Pyruvate Gluconate Glycine Linolenate 5 BMI Betaine 2Hydroxybutyrate Oleate Adiponectin Gluconate 6 Betaine .Gamma.Glu. 2Hydroxybutyrate Gluconate Leu 7 .Gamma.Glu. 2Hydroxybutyrate .Linolyl.LPC Creatine Gluconate Leu 8 Pyruvate Betaine .Galactonate 2Hydroxybutyrate .Linolyl.LPC Gluconate 9 Fasting FFA HDL .Gamma.Glu. 2Hydroxybutyrate Cholesterol Leu 10 Fasting FFA Adiponectin .Gamma.Glu. 2Hydroxybutyrate Leu 11 Fasting FFA Adiponectin .Gamma.Glu. 2Hydroxybutyrate Creatine Leu 12 Fasting FFA Adiponectin .Betaine .Gamma.Glu. 2Hydroxybutyrate Leu 13 Fasting FFA Adiponectin .Betaine .Gamma.Glu. 2Hydroxybutyrate Gluconate- Leu 14 Fasting FFA Adiponectin Gamma.Glu. 2Hydroxybutyrate Creatine Gluconate Leu 15 .LDL_Cholesterol Fasting FFA Adiponectin .Gamma.Glu. .Linoleate 2Hydroxybutyrate Leu 16 Gamma.Glu. lin_Linolyl.LPC Betaine Pyruvate Gluconate X9033 Leu 17 Betaine Fasting 2Hydroxybutyrate Linolyl.LPC Adiponectin Gluconate Proinsulin 18 Pyruvate Oleoyl.LPC Gluconate Oleate Galactonate Linoleate 19 Betaine Glul.Val Creatine Gluconate lin_Glycine X9033 20 Betaine Gamma.Glu. 2Hydroxybutyrate Oleate Adiponectin Gluconate Leu 21 Fasting Glul.Val BMI 2Hydroxybutyrate Adiponectin Gluconate Proinsulin 22 BMI FPG 2Hydroxybutyrate Lactate Adiponectin Gluconate 23 Linoleate 2Hydroxybutyrate Linolenate HDL Hepadecenate Oleate Cholesterol 24 Galactonate 1.5.Anhydroglucitol 2Hydroxybutyrate Lactate Oleate HDL Cholesterol 25 Lactate BMI LDL_Cholesterol FPG 1.5.Anhydroglucitol 2Hydroxybutyrate 26 Adiponectin .Gamma.Glu. 2Hydroxybutyrate Creatine Leu 27 .FPG Fasting FFA Adiponectin .Gamma.Glu. 2Hydroxybutyrate Leu 28 .LDL_Cholesterol Fasting FFA Adiponectin .Gamma.Glu. 2Hydroxybutyrate Leu 29 Fasting FFA Adiponectin .Gamma.Glu. .Linoleate 2Hydroxybutyrate .Linole- nate Leu 30 .FPG Fasting FFA Adiponectin .Gamma.Glu. .Linoleate 2Hydroxybutyrate Leu 31 Fasting FFA Adiponectin .Gamma.Glu. .Linoleate 2Hydroxybutyrate Creatin- e Leu 32 Gluconate Glycine Lactate Galactonate Threonine X1.5.Anhydroglucitol 33 Glutamate Pyruvate Oleoyl.LPC Gluconate Glycine Galactonate 34 Linoleate BMI Fasting FFA 2Hydroxybutyrate Adiponectin Gluconate 35 BMI LDL_Cholesterol FPG Glycine Triglycerides 2Hydroxybutyrate 36 LDL_Cholesterol FPG Glycine Triglycerides 1.5.Anhydroglucitol 2Hydroxyb- utyrate 37 .Gamma.Glu. 2Hydroxybutyrate Creatine Gluconate Leu 38 .Betaine .Galactonate 2Hydroxybutyrate .Linolyl.LPC Gluconate 39 .Gamma.Glu. 2Hydroxybutyrate .Glycine Creatine Gluconate Leu 40 .Gamma.Glu. 2Hydroxybutyrate .Glycine .Linolyl.LPC Creatine Gluconate Leu 41 .Gamma.Glu. 2Hydroxybutyrate .Glycine .Linolyl.LPC Creatine Gluconate Leu 42 Fasting FFA .Gamma.Glu. 2Hydroxybutyrate Gluconate Leu 43 Fasting FFA .Betaine .Gamma.Glu. 2Hydroxybutyrate Leu 44 Fasting FFA Adiponectin .Glul.Val .Linoleate 2Hydroxybutyrate 45 Fasting FFA Adiponectin .Gamma.Glu. 2Hydroxybutyrate .Linolyl.LPC Leu 46 Fasting FFA Adiponectin .Betaine .Gamma.Glu. .Linoleate 2Hydroxybutyrat- e Leu 47 Fasting FFA Adiponectin .Betaine .Gamma.Glu. 2Hydroxybutyrate Hepadecen- ate Leu 48 Linolenate Oleate Hepadecenate Linoleate Serine Threonine 49 Linolyl.LPC Betaine Glul.Val Pyruvate Gluconate Galactonate 50 2Hydroxybutyrate Glycine Oleate Adiponectin Creatine Gluconate 51 BMI Galactonate 2Hydroxybutyrate Oleate Adiponectin Gluconate 52 2Hydroxybutyrate .Linolyl.LPC Creatine Gluconate 53 .Betaine 2Hydroxybutyrate .Linolyl.LPC Gluconate 54 2Hydroxybutyrate .Glycine Creatine Gluconate
55 .Gamma.Glu. 2Hydroxybutyrate .Linolyl.LPC Creatine Gluconate Leu 56 2Hydroxybutyrate .Glycine .Linolyl.LPC Creatine Gluconate 57 .Gamma.Glu. 2Hydroxybutyrate .Linolyl.LPC Gluconate Threonine Leu 58 .Gamma.Glu. 2Hydroxybutyrate .Linolyl.LPC .Oleate Gluconate Hepadecenat- e Leu 59 .Gamma.Glu. 2Hydroxybutyrate .Glycine .Linolyl.LPC Creatine Gluconate Leu 60 .Betaine .Gamma.Glu. 2Hydroxybutyrate .Linolyl.LPC Creatine Gluconate Leu 61 Fasting FFA .Gamma.Glu. .Linoleate 2Hydroxybutyrate Leu 62 Fasting FFA Adiponectin .Gamma.Glu. .Linoleate 2Hydroxybutyrate Leu 63 Fasting FFA Adiponectin .Gamma.Glu. 2Hydroxybutyrate Hepadecenate Leu 64 Fasting FFA Adiponectin .Gamma.Glu. 2Hydroxybutyrate Gluconate Leu 65 Fasting FFA Adiponectin .Gamma.Glu. .Linoleate 2Hydroxybutyrate Glucona- te Leu 66 Fasting FFA Adiponectin .Gamma.Glu. .Linoleate 2Hydroxybutyrate Linolyl- .LPC Leu 67 2Hydroxybutyrate .Glycine .Linolyl.LPC Creatine 68 .Gamma.Glu. 2Hydroxybutyrate .Glycine .Linolyl.LPC Gluconate Leu 69 2Hydroxybutyrate .Glycine .Linolenate .Linolyl.LPC Creatine Gluconate 70 Adiponectin .Betaine .Gamma.Glu. 2Hydroxybutyrate Leu 71 LDL Galactonate 2Hydroxybutyrate Oleate Adiponectin Gluconate Cholesterol 72 .Gamma.Glu. 2Hydroxybutyrate .Linolyl.LPC Gluconate Leu 73 .Galactonate .Gamma.Glu. 2Hydroxybutyrate Gluconate Leu 74 .Gamma.Glu. 2Hydroxybutyrate .Glycine Gluconate Leu 75 .Gamma.Glu. 2Hydroxybutyrate .Linolyl.LPC Gluconate Leu 76 .Galactonate .Gamma.Glu. 2Hydroxybutyrate .Linolyl.LPC Gluconate Leu 77 .Betaine .Gamma.Glu. 2Hydroxybutyrate .Linolyl.LPC Gluconate Leu 78 .Gamma.Glu. 2Hydroxybutyrate .Linolenate .Linolyl.LPC Gluconate Leu 79 .Betaine .Galactonate .Gamma.Glu. 2Hydroxybutyrate .Linolyl.LPC Glucona- te Leu 80 2Hydroxybutyrate .Glycine .Linolyl.LPC Creatine Gluconate Threonine 81 .Galactonate .Gamma.Glu. 2Hydroxybutyrate .Linolyl.LPC Creatine Glucona- te Leu 82 Adiponectin .Gamma.Glu. .Linoleate 2Hydroxybutyrate Leu 83 Oleoyl.LPC Gluconate Oleate Galactonate Hepadecenate Linoleate 84 Galactonate Linoleate 2Hydroxybutyrate Oleate Adiponectin Gluconate 85 Linoleate 2Hydroxybutyrate Glutamate Oleate Adiponectin Gluconate 86 Lactate Oleate Arginine Hepadecenate Serine Threonine 87 BMI LDL_Cholesterol Galactonate Triglycerides 2Hydroxybutyrate Gluconat- e 88 Serine BMI Arginine 2Hydroxybutyrate HDL Threonine Cholesterol 89 Adiponectin .Gamma.Glu. 2Hydroxybutyrate .Linolyl.LPC Leu 90 Creatine Glutamate Pyruvate Gluconate Glycine Galactonate Abbreviations: BMI, Body Mass Index; FFA, Free Fatty Acids; FPG, Fasting Plasma Glucose
2H: Correlated Biomarker Compounds:
Many biomarker compounds were correlated as shown in Tables 9A and 9B. Table 9A contains the pair-wise correlation analysis of biomarkers identified in Study 1 and Table 9B contains the pair-wise correlation analysis of biomarkers identified in Study 2. Correlated compounds are often mutually exclusive in regression models and thus can be used (i.e. substituted for a correlated compound) in different models that had similar prediction powers as those shown in Table 8 above. This aspect is useful when developing biochemical assays that are targeted to specific biomarkers since certain biomarkers may be more amenable to assay development than other biomarkers.
TABLE-US-00009 TABLE 9A Correlated Biomarkers in Study 1. Pairwise Correlation N Correlation P-value R-square 1,5-anhydroglucitol-1,5 (AG) *Metabolite-11234 112 -0.5242 2.99E-09 0.2748 1,5-anhydroglucitol-1,5 (AG) *Metabolite-11249 112 -0.5041 1.46E-08 0.2541 1,5-anhydroglucitol-1,5 (AG) *Metabolite-11252 112 -0.5114 8.32E-09 0.2615 1,5-anhydroglucitol-1,5 (AG) *Metabolite-12061 112 -0.5521 2.78E-10 0.3049 1,5-anhydroglucitol-1,5 (AG) *Metabolite-12064 112 -0.5046 1.40E-08 0.2546 2-hydroxybutyrate (AHB)*1,5-anhydroglucitol-1,5 (AG) 112 -0.5413 7.19E-10 0.2930 2-hydroxybutyrate (AHB)*2-aminobutyrate 112 0.7651 <0.000 0.5854 2-hydroxybutyrate (AHB)*3-hydroxybutyrate (BHBA) 112 0.6517 7.11E-15 0.4247 2-hydroxybutyrate (AHB)*3-methyl-2-oxobutyrate 112 0.6750 2.22E-16 0.4557 2-hydroxybutyrate (AHB)*3-methyl-2-oxovalerate 112 0.5970 3.71E-12 0.3565 2-hydroxybutyrate (AHB)*4-methyl-2-oxopentanoate 112 0.6599 2.44E-15 0.4355 2-hydroxybutyrate (AHB)*creatine 112 0.5123 7.75E-09 0.2624 2-hydroxybutyrate (AHB)*erythrose 112 0.5156 5.96E-09 0.2659 2-hydroxybutyrate (AHB)*galactonic acid 112 0.7137 <0.000 0.5094 2-hydroxybutyrate (AHB)*gluconate 112 0.5427 6.35E-10 0.2945 2-hydroxybutyrate (AHB)*gondoate-20-1-n-9- 112 0.5765 2.91E-11 0.3323 2-hydroxybutyrate (AHB)*isoleucine 112 0.6025 2.09E-12 0.3630 2-hydroxybutyrate (AHB)*leucine 112 0.6472 1.27E-14 0.4188 2-hydroxybutyrate (AHB)*mannose 112 0.7043 <0.000 0.4960 2-hydroxybutyrate (AHB)*margarate (17:0) 112 0.5270 2.38E-09 0.2777 2-hydroxybutyrate (AHB)*palmitate (16:0) 112 0.5191 4.54E-09 0.2694 2-hydroxybutyrate (AHB)*stearate (18:0) 112 0.5888 8.57E-12 0.3467 2-hydroxybutyrate (AHB)*uridine 112 0.5282 2.15E-09 0.2790 2-hydroxybutyrate (AHB)*valine* 112 0.6705 6.66E-16 0.4496 2-hydroxybutyrate (AHB)*Metabolite-10432 112 0.6826 2.22E-16 0.4660 2-hydroxybutyrate (AHB)*Metabolite-10752 112 0.5221 3.55E-09 0.2726 2-hydroxybutyrate (AHB)*Metabolite-11228 112 0.5810 1.87E-11 0.3376 2-hydroxybutyrate (AHB)*Metabolite-11887 112 0.5314 1.66E-09 0.2824 2-hydroxybutyrate (AHB)*Metabolite-11897 112 0.5037 1.51E-08 0.2537 2-hydroxybutyrate (AHB)*Metabolite-12037 112 0.5768 2.82E-11 0.3327 2-hydroxybutyrate (AHB)*Metabolite-12061 112 0.5053 1.33E-08 0.2553 2-hydroxybutyrate (AHB)*Metabolite-12064 112 0.8857 <0.000 0.7844 2-hydroxybutyrate (AHB)*glutamate 112 0.7745 <0.000 0.5998 2-hydroxybutyrate (AHB)*Metabolite-3100 112 0.5619 1.14E-10 0.3158 2-hydroxybutyrate (AHB)*Metabolite-4055 112 0.6836 <0.000 0.4672 2-hydroxybutyrate (AHB)*Metabolite-6488 112 0.5779 2.54E-11 0.3339 2-hydroxybutyrate (AHB)*Metabolite-6627 112 0.5193 4.44E-09 0.2697 2-hydroxybutyrate (AHB)*Metabolite-9033 112 0.5608 1.27E-10 0.3145 2-hydroxybutyrate (AHB)*Metabolite-9043 112 0.5879 9.46E-12 0.3456 2-hydroxybutyrate (AHB)*Metabolite-9727 112 0.7077 <0.000 0.5009 3-hydroxybutyrate (BHBA)*glutamate 112 0.5506 3.18E-10 0.3032 3-methyl-2-oxobutyrate*palmitate (16:0) 112 0.5683 6.31E-11 0.3230 4-methyl-2-oxopentanoate*palmitate (16:0) 112 0.5424 6.53E-10 0.2942 alpha linolenate (18:3(n-3))*dihomo-alpha-linolenate-20-3- 112 0.5295 1.94E-09 0.2804 n-3- alpha linolenate (18:3(n-3))*gonodoate-20-1-n-9- 112 0.7264 <0.000 0.5277 alpha linolenate (18:3(n-3))*linoleate (18:2(n-6)) 112 0.7877 <0.000 0.6204 alpha linolenate (18:3(n-3))*n-3-DPA-22-5-n-3- 112 0.5722 4.37E-11 0.3274 alpha linolenate (18:3(n-3))*oleate (18:1(n-9)) 112 0.7490 <0.000 0.5610 alpha linolenate (18:3(n-3))*palmitate (16:0) 112 0.7354 <0.000 0.5409 alpha linolenate (18:3(n-3))*palmitoleate (16:1(n-7)) 112 0.6224 2.36E-13 0.3874 alpha linolenate (18:3(n-3))*stearate (18:0) 112 0.6939 <0.000 0.4815 alpha linolenate (18:3(n-3))*Metabolite-11365 112 0.5054 1.32E-08 0.2555 alpha linolenate (18:3(n-3))*Metabolite-11379 112 0.7245 0 0.5249 alpha linolenate (18:3(n-3))*Metabolite-11653 112 0.5578 1.66E-10 0.3112 alpha linolenate (18:3(n-3))*Metabolite-11887 112 0.7730 0 0.5975 alpha linolenate (18:3(n-3))*Metabolite-12037 112 0.6665 1.11E-15 0.4443 BMI*gamma-glutamylleucine 112 0.5215 3.74E-09 0.2719 BMI*glutamylvaline 112 0.5425 6.47E-10 0.2943 bradykinin*bradykinin, hydroxyproline form- 112 0.5212 3.83E-09 0.2716 creatin*Metabolite-02546_200 112 -0.5849 1.27E-11 0.3421 dipalmitin*palmitate (16:0) 112 0.5630 1.04E-10 0.3170 erythrose*1,5-anhydroglucitol-1,5 (AG) 112 -0.5099 9.35E-09 0.2600 erythrose*galactonic acid 112 0.6691 6.66E-16 0.4476 erythrose*gluconate 112 0.6461 1.44E-14 0.4174 erythrose*glutamate 112 0.7334 0 0.5378 fructose*galactonic acid 112 0.6151 5.35E-13 0.3784 fructose*gluconate 112 0.7100 0 0.5042 fructose*glutamate 112 0.6623 1.78E-15 0.4387 galactonic acid*1,5-anhydroglucitol-1,5 (AG) 112 -0.6211 2.77E-13 0.3857 galactonic acid*2-aminobutyrate 112 0.5246 2.91E-09 0.2752 galactonic acid*3-methyl-2-oxobutyrate 112 0.5517 2.89E-10 0.3044 galactonic acid*4-methyl-2-oxopentanoate 112 0.5288 2.05E-09 0.2797 galactonic acid*gluconate 112 0.7653 0 0.5857 galactonic acid*gonodoate-20-1-n-9- 112 0.5981 3.33E-12 0.3577 galactonic acid*isoleucine 112 0.5461 4.74E-10 0.2982 galactonic acid*mannose 112 0.8354 0 0.6978 galactonic acid*margarate (17:0) 112 0.5473 4.26E-10 0.2995 galactonic acid*palmitate (16:0) 112 0.5279 2.21E-09 0.2787 galactonic acid*stearate (18:0) 112 0.5986 3.16E-12 0.3583 galactonic acid*Metabolite-10360 112 0.5113 8.39E-09 0.2614 galactonic acid*Metabolite-10432 112 0.6635 1.55E-15 0.4403 galactonic acid*Metabolite-10609 112 0.5803 2.01E-11 0.3367 galactonic acid*Metabolite-10750 112 0.6247 1.83E-13 0.3903 galactonic acid*Metabolite-10752 112 0.6833 0 0.4668 galactonic acid*Metabolite-11228 112 0.6299 9.99E-14 0.3968 galactonic acid*Metabolite-11230 112 0.5353 1.19E-09 0.2866 galactonic acid*Metabolite-11234 112 0.7072 0 0.5002 galactonic acid*Metabolite-11235 112 0.5168 5.43E-09 0.2671 galactonic acid*Metabolite-11242 112 0.5837 1.43E-11 0.3407 galactonic acid*Metabolite-11249 112 0.5771 2.72E-11 0.3331 galactonic acid*Metabolite-11252 112 0.6003 2.65E-12 0.3603 galactonic acid*Metabolite-11258 112 0.5045 1.42E-08 0.2545 galactonic acid*Metabolite-11387 112 0.5520 2.82E-10 0.3047 galactonic acid*Metabolite-11432 112 0.6147 5.64E-13 0.3778 galactonic acid*Metabolite-11434 112 0.6344 5.93E-14 0.4025 galactonic acid*Metabolite-11628 112 0.5803 2.01E-11 0.3367 galactonic acid*Metabolite-11887 112 0.5451 5.16E-10 0.2971 galactonic acid*Metabolite-11897 112 0.6229 2.25E-13 0.3880 galactonic acid*Metabolite-12037 112 0.5794 2.18E-11 0.3357 galactonic acid*Metabolite-12061 112 0.7387 0 0.5456 galactonic acid*Metabolite-12064 112 0.6051 1.59E-12 0.3662 galactonic acid*glutamate 112 0.9200 0 0.8464 galactonic acid*Metabolite-3100 112 0.5343 1.30E-09 0.2855 galactonic acid*Metabolite-4055 112 0.6292 1.09E-13 0.3958 galactonic acid*Metabolite-5847 112 0.6075 1.23E-12 0.3690 galactonic acid*Metabolite-6446 112 0.6367 4.53E-14 0.4053 galactonic acid*Metabolite-6488 112 0.5753 3.26E-11 0.3309 galactonic acid*Metabolite-6506 112 0.5094 9.72E-09 0.2595 galactonic acid*Metabolite-9033 112 0.7427 0 0.5517 galactonic acid*Metabolite-9043 112 0.5751 3.32E-11 0.3307 galactonic acid*Metabolite-9727 112 0.5195 4.37E-09 0.2699 gamma-glutamylleucine*glutamylvaline 112 0.9404 0 0.8844 gamma-glutamylleucine*peptide-HWESASXX 112 0.7379 0 0.5445 gamma-glutamylleucine*peptide-HWESASXXR 112 0.5766 2.87E-11 0.3325 gluconate*1,5-anhydroglucitol-1,5 (AG) 112 -0.6774 2.22E-16 0.4588 gluconate*mannose 112 0.7419 0 0.5504 gluconate*Metabolite-10432 112 0.6367 4.51E-14 0.4054 gluconate*Metabolite-10609 112 0.5759 3.08E-11 0.3316 gluconate*Metabolite-10610 112 0.5098 9.39E-09 0.2599 gluconate*Metabolite-10750 112 0.7024 0 0.4934 gluconate*Metabolite-10752 112 0.6996 0 0.4894 gluconate*Metabolite-11228 112 0.6652 1.33E-15 0.4425 gluconate*Metabolite-11230 112 0.5881 9.21E-12 0.3459 gluconate*Metabolite-11231 112 0.5374 1.00E-09 0.2888 gluconate*Metabolite-11234 112 0.7041 0 0.4958 gluconate*Metabolite-11235 112 0.5807 1.92E-11 0.3372 gluconate*Metabolite-11242 112 0.6321 7.75E-14 0.3996 gluconate*Metabolite-11249 112 0.5309 1.72E-09 0.2819 gluconate*Metabolite-11252 112 0.5145 6.51E-09 0.2647 gluconate*Metabolite-11387 112 0.5015 1.78E-08 0.2515 gluconate*Metabolite-11432 112 0.5697 5.56E-11 0.3245 gluconate*Metabolite-11434 112 0.6693 6.66E-16 0.4480 gluconate*Metabolite-11435 112 0.5294 1.96E-09 0.2802 gluconate*Metabolite-11628 112 0.5278 2.24E-09 0.2785 gluconate*Metabolite-11897 112 0.6460 1.47E-14 0.4173 gluconate*Metabolite-12061 112 0.7448 0 0.5548 gluconate*Metabolite-12064 112 0.5160 5.78E-09 0.2663 gluconate*glutamate 112 0.7895 0 0.6234 gluconate*Metabolite-3100 112 0.5649 8.70E-11 0.3191 gluconate*Metabolite-4055 112 0.5887 8.67E-12 0.3466 gluconate*Metabolite-4986 112 0.5742 3.63E-11 0.3297 gluconate*Metabolite-5847 112 0.5735 3.88E-11 0.3289 gluconate*Metabolite-6446 112 0.6913 0 0.4779 gluconate*Metabolite-6488 112 0.5778 2.55E-11 0.3339 gluconate*Metabolite-9033 112 0.7458 0 0.5562 gluconate*Metabolite-9043 112 0.5257 2.64E-09 0.2764 glutamylvaline*peptide-HWESASXX 112 0.7816 0 0.6109 glutamylvaline*peptide-HWESASXXR 112 0.5946 4.75E-12 0.3536 glycerate*threonate 112 0.6260 1.57E-13 0.3919 glycerol*alpha linolenate (18:3(n-3)) 112 0.6345 5.86E-14 0.4026 glycerol*linoleate (18:2(n-6)) 112 0.7008 0 0.4911 glycerol*oleate (18:1(n-9)) 112 0.7338 0 0.5385 glycerol*palmitate (16:0) 112 0.6943 0 0.4821 gondoate-20-1-n-9-*linolenate (18:2(n-6)) 112 0.7862 0 0.6181 gondoate-20-1-n-9-*oleate (18:1(n-9)) 112 0.8756 0 0.7666 gondoate-20-1-n-9-*palmitate (16:0) 112 0.8128 0 0.6607 lactate*pyruvate 112 0.7722 0 0.5963 lactate*Metabolite-4357 112 0.6960 0 0.4844 lactate*Metabolite-4360 112 0.8576 0 0.7355 lactate*Metabolite-4986 112 0.6386 3.60E-14 0.4078 lactate*Metabolite-5348 112 0.5750 3.35E-11 0.3306 linoleate (18:2(n-6))*n-3-DPA-22-5-n-3- 112 0.5966 3.86E-12 0.3560 linoleate (18:2(n-6))*oleate (18:1(n-9)) 112 0.8621 0 0.7433 linoleate (18:2(n-6))*palmitate (16:0) 112 0.8248 0 0.6803 linoleate (18:2(n-6))*palmitoleate (16:1(n-7)) 112 0.6826 2.22E-16 0.4659 linoleate (18:2(n-6))*stearate (18:0) 112 0.7065 0 0.4991 linoleate (18:2(n-6))*Metabolite-11379 112 0.7858 0 0.6175 linoleate (18:2(n-6))*Metabolite-11653 112 0.5638 9.63E-11 0.3179 linoleate (18:2(n-6))*Metabolite-11887 112 0.8301 0 0.6891 linoleate (18:2(n-6))*Metabolite-12037 112 0.7066 0 0.4992 mannose*1,5-anhydroglucitol-1,5 (AG) 112 -0.6115 8.00E-13 0.3739 mannose*margarate (17:0) 112 0.5273 2.33E-09 0.2780 mannose*glutamate 112 0.8909 0 0.7937 margarate (17:0)*creatine 112 0.5567 1.85E-10 0.3099 margarate (17:0)*stearate (18:0) 112 0.5258 2.63E-09 0.2765 margarate (17:0)*Metabolite-10750 112 0.5003 1.94E-08 0.2503 margarate (17:0)*Metabolite-12037 112 0.5123 7.75E-09 0.2624 margarate (17:0)*Metabolite-12064 112 0.5374 1.00E-09 0.2888 margarate (17:0)*glutamate 112 0.5499 3.38E-10 0.3024 margarate (17:0)*Metabolite-6446 112 0.5082 1.07E-08 0.2582 margarate (17:0)*Metabolite-9033 112 0.5051 1.35E-08 0.2551 myristate (14:0)*oleate (18:1(n-9)) 112 0.5118 8.05E-09 0.2619 myristate (14:0)*palmitate (16:0) 112 0.6230 2.22E-13 0.3881 n-3-DPA-22-5-n-3-*oleate (18:1(n-9)) 112 0.6538 5.55E-15 0.4275 n-3-DPA-22-5-n-3-*palmitate (16:0) 112 0.6285 1.18E-13 0.3950 oleate (18:1(n-9))*palmitate (16:0) 112 0.9032 0 0.8158 oleate (18:1(n-9))*palmitoleate (16:1(n-7)) 112 0.7218 0 0.5209 oleate (18:1(n-9))*stearate (18:0) 112 0.7798 0 0.6081 oleate (18:1(n-9))*Metabolite-11252 112 0.5052 1.34E-08 0.2552 oleate (18:1(n-9))*Metabolite-11379 112 0.8566 0 0.7337 oleate (18:1(n-9))*Metabolite-11653 112 0.6108 8.61E-13 0.3731 oleate (18:1(n-9))*Metabolite-11887 112 0.8989 0 0.8081 oleate (18:1(n-9))*Metabolite-12037 112 0.8335 0 0.6947 ornithine*EDTA* 112 0.6101 9.31E-13 0.3722 ornithine*Metabolite-10812 112 0.5121 7.86E-09 0.2623 ornithine*Metabolite-3091 112 0.5529 2.59E-10 0.3057 ornithine*Metabolite-3103 112 0.5739 3.73E-11 0.3293 ornithine*Metabolite-3108 112 0.5599 1.37E-10 0.3135 ornithine*Metabolite-4274 112 0.5198 4.29E-09 0.2702 palmitate (16:0)*palmitoleate (16:1(n-7)) 112 0.7277 0 0.5296 palmitate (16:0)*stearate (18:0) 112 0.8313 0 0.6911 palmitate (16:0)*Metabolite-11252 112 0.5102 9.13E-09 0.2603 palmitate (16:0)*Metabolite-11379 112 0.8594 0 0.7386 palmitate (16:0)*Metabolite-11653 112 0.6739 4.44E-16 0.4542 palmitate (16:0)*Metabolite-11887 112 0.8789 0 0.7724 palmitate (16:0)*Metabolite-12037 112 0.7972 0 0.6356 palmitate (16:0)*Metabolite-12064 112 0.5431 6.13E-10 0.2950 palmitoleate (16:1(n-7))*Metabolite-11379 112 0.8744 0 0.7646 stearate (18:0)*Metabolite-11249 112 0.5247 2.88E-09 0.2753 stearate (18:0)*Metabolite-11252 112 0.5606 1.30E-10 0.3142 stearate (18:0)*Metabolite-11258 112 0.5185 4.74E-09 0.2689 stearate (18:0)*Metabolite-11379 112 0.6025 2.10E-12 0.3630 stearate (18:0)*Metabolite-11653 112 0.5560 1.97E-10 0.3091 stearate (18:0)*Metabolite-11887 112 0.7628 0 0.5818 stearate (18:0)*Metabolite-12037 112 0.7230 0 0.5228 stearate (18:0)*Metabolite-12064 112 0.5859 1.15E-11 0.3433 Metabolite-10432*1,5-anhydroglucitol-1,5 (AG) 112 -0.5674 6.88E-11 0.3220 Metabolite-10432*glutamate 112 0.7402 0 0.5479 Metabolite-10609*glutamate 112 0.5732 3.99E-11 0.3285 glycine*Metabolite-3003 112 0.9861 0 0.9725 Metabolite-10750*1,5-anhydroglucitol-1,5 (AG) 112 -0.5347 1.26E-09 0.2859 Metabolite-10750*glutamate 112 0.6864 0 0.4711 Metabolite-10752*1,5-anhydroglucitol-1,5 (AG) 112 -0.5387 8.96E-10 0.2902 Metabolite-10752*glutamate 112 0.7503 0 0.5629 Metabolite-10814*glutamate 112 0.5121 7.85E-09 0.2623 serine*Metabolite-3078 112 0.6279 1.26E-13 0.3943 serine*Metabolite-3088 112 0.5175 5.15E-09 0.2678 serine*Metabolite-4364 112 0.5899 7.72E-12 0.3480 serine*Metabolite-4769 112 0.6668 1.11E-15 0.4447
glutamate*1,5-anhydroglucitol-1,5 (AG) 112 -0.6945 0 0.4823 glutamate*2-aminobutyrate 112 0.5296 1.92E-09 0.2805 glutamate*3-methyl-2-oxobutyrate 112 0.5857 1.18E-11 0.3430 glutamate*4-methyl-2-oxopentanoate 112 0.5366 1.07E-09 0.2879 glutamate*gondoate-20-1-n-9- 112 0.5823 1.65E-11 0.3390 glutamate*isoleucine 112 0.5442 5.59E-10 0.2961 glutamate*leucine 112 0.5311 1.70E-09 0.2820 glutamate*palmitate (16:0) 112 0.5134 7.08E-09 0.2636 glutamate*stearate (18:0) 112 0.5742 3.63E-11 0.3297 glutamate*valine* 112 0.5511 3.04E-10 0.3037 glutamate*Metabolite-11228 112 0.6659 1.11E-15 0.4435 glutamate*Metabolite-11230 112 0.5964 3.98E-12 0.3557 glutamate*Metabolite-11231 112 0.5182 4.85E-09 0.2686 glutamate*Metabolite-11234 112 0.7245 0 0.5249 glutamate*Metabolite-11235 112 0.5706 5.09E-11 0.3256 glutamate*Metabolite-11242 112 0.6197 3.21E-13 0.3841 glutamate*Metabolite-11249 112 0.6040 1.80E-12 0.3648 glutamate*Metabolite-11252 112 0.6137 6.24E-13 0.3767 glutamate*Metabolite-11258 112 0.5232 3.24E-09 0.2738 glutamate*Metabolite-11387 112 0.5860 1.14E-11 0.3434 glutamate*Metabolite-11432 112 0.6245 1.87E-13 0.3900 glutamate*Metabolite-11434 112 0.6707 6.66E-16 0.4498 glutamate*Metabolite-11435 112 0.5301 1.84E-09 0.2810 glutamate*Metabolite-11628 112 0.5606 1.30E-10 0.3142 glutamate*Metabolite-11887 112 0.5450 5.21E-10 0.2970 glutamate*Metabolite-11897 112 0.6695 6.66E-16 0.4482 glutamate*Metabolite-12037 112 0.5761 3.01E-11 0.3319 glutamate*Metabolite-12061 112 0.7919 0 0.6271 glutamate*Metabolite-12064 112 0.6742 4.44E-16 0.4545 glutamate*Metabolite-3078 112 -0.5143 6.62E-09 0.2645 glutamate*Metabolite-3100 112 0.6438 1.91E-14 0.4145 glutamate*Metabolite-4055 112 0.7284 0 0.5305 glutamate*Metabolite-4986 112 0.5229 3.34E-09 0.2734 glutamate*Metabolite-5847 112 0.6457 1.51E-14 0.4170 glutamate*Metabolite-6446 112 0.7149 0 0.5111 glutamate*Metabolite-6488 112 0.6599 2.44E-15 0.4355 glutamate*Metabolite-6627 112 0.5376 9.88E-10 0.2890 glutamate*Metabolite-9033 112 0.8164 0 0.6665 glutamate*Metabolite-9043 112 0.6741 4.44E-16 0.4544 glutamate*Metabolite-9299 112 0.5571 1.78E-10 0.3103 glutamate*Metabolite-9727 112 0.5597 1.41E-10 0.3132 Metabolite-3078*1,5-anhydroglucitol-1,5 (AG) 112 0.5166 5.54E-09 0.2668 Metabolite-3078*gamma-glutamylglutamine 112 0.5975 3.54E-12 0.3570 Metabolite-4055*1,5-anhydroglucitol-1,5 (AG) 112 -0.5505 3.20E-10 0.3031 pyruvate*Metabolite-4357 112 0.5054 1.32E-08 0.2554 pyruvate*Metabolite-4360 112 0.7299 0 0.5328 Metabolite-4769*gamma-glutamylglutamine 112 0.6458 1.49E-14 0.4171 Metabolite-5847*1,5-anhydroglucitol-1,5 (AG) 112 -0.5083 1.05E-08 0.2584 Metabolite-6446*1,5-anhydroglucitol-1,5 (AG) 112 -0.5887 8.71E-12 0.3465 Metabolite-9033*1,5-anhydroglucitol-1,5 (AG) 112 -0.5674 6.87E-11 0.3220 Metabolite-9033*Metabolite-11228 112 0.6119 7.64E-13 0.3744 Metabolite-9033*Metabolite-11230 112 0.6313 8.50E-14 0.3986 Metabolite-9033*Metabolite-11231 112 0.5342 1.31E-09 0.2854 Metabolite-9033*Metabolite-11234 112 0.6833 0 0.4669 Metabolite-9033*Metabolite-11235 112 0.5267 2.44E-09 0.2774 Metabolite-9033*Metabolite-11242 112 0.5712 4.84E-11 0.3262 Metabolite-9033*Metabolite-11249 112 0.5127 7.51E-09 0.2629 Metabolite-9033*Metabolite-11252 112 0.5285 2.10E-09 0.2794 Metabolite-9033*Metabolite-11387 112 0.5259 2.60E-09 0.2766 Metabolite-9033*Metabolite-11432 112 0.6192 3.42E-13 0.3834 Metabolite-9033*Metabolite-11434 112 0.6631 1.55E-15 0.4396 Metabolite-9033*Metabolite-11435 112 0.5165 5.56E-09 0.2668 Metabolite-9033*Metabolite-11628 112 0.5228 3.36E-09 0.2733 Metabolite-9033*Metabolite-11897 112 0.6761 2.22E-16 0.4572 Metabolite-9033*Metabolite-12061 112 0.7544 0 0.5691 Metabolite-9033*Metabolite-12064 112 0.5456 4.93E-10 0.2977 Metabolite-9033*Metabolite-9043 112 0.5697 5.53E-11 0.3246 Metabolite-9033*Metabolite-9045 112 0.5596 1.42E-10 0.3131 Metabolite-9033*Metabolite-9299 112 0.6908 0 0.4772
TABLE-US-00010 TABLE 9B Correlated Biomarkers in Study 2. Compounds N Correlation R-square p-values HDL_Cholesterol*Adiponectin 397 0.511148 0.261272 <0.001 Fat_Mass*BMI 402 0.843078 0.710781 <0.001 Weight*BMI 402 0.804681 0.647512 <0.001 Waist*BMI 398 0.800452 0.640724 <0.001 Hip*BMI 398 0.705318 0.497473 <0.001 Fat_Mass_.pcnt*BMI 402 0.602829 0.363403 <0.001 BMI*HOMA 388 0.590842 0.349094 <0.001 BMI*Fasting_Insulin 388 0.589749 0.347804 <0.001 BMI*QUICKI 388 -0.580267 0.336710 <0.001 RD*BMI 402 -0.551166 0.303784 <0.001 BMI*Fasting_C_Peptide 401 0.542661 0.294480 <0.001 Fasting_C_Peptide*HOMA 388 0.829625 0.688277 <0.001 Fasting_Insulin*Fasting_C_Peptide 388 0.828392 0.686233 <0.001 Fasting_C_Peptide*QUICKI 388 -0.768811 0.591070 <0.001 Fasting_Proinsulin*Fasting_C_Peptide 398 0.570761 0.325768 <0.001 Fat_Mass*Fasting_C_Peptide 401 0.519632 0.270017 <0.001 RD*Fasting_C_Peptide 401 -0.506727 0.256773 <0.001 Waist*Fasting_C_Peptide 397 0.501492 0.251495 <0.001 Fasting_Insulin*HOMA 388 0.979376 0.959178 <0.001 Fasting_Insulin*QUICKI 388 -0.880137 0.774641 <0.001 Fasting_Insulin*Fasting_Proinsulin 386 0.509757 0.259853 <0.001 Fat_Mass*Fasting_Insulin 388 0.576818 0.332719 <0.001 Waist*Fasting_Insulin 384 0.502325 0.252330 <0.001 Fasting_Proinsulin*HOMA 386 0.525130 0.275761 <0.001 Fasting_FFA*palmitate (16:0) 393 0.552703 0.305480 <0.001 Fasting_FFA*oleate (18:1(n-9)) 393 0.519978 0.270377 <0.001 Fasting_FFA*linoleate (18:2(n-6)) 393 0.504094 0.254111 <0.001 Fasting_FFA*Heptadecenate 393 0.503364 0.253375 <0.001 2-aminobutyrate*2-hydroxybutyrate (AHB) 270 0.526705 0.277419 <0.001 alpha linolenate (18:3(n-3))*Isobar-cis-9-cis- 270 0.634441 0.402516 <0.001 11-trans-11-eicosenoate alpha linolenate (18:3(n-3))*linoleate(18:1(n-9)) 270 0.561647 0.315447 <0.001 (18:2(n-6)) alpha linolenate (18:3(n-3))*myristate (14:0) 270 0.656699 0.431254 <0.001 alpha linolenate (18:3(n-3))*myristoleate 270 0.580375 0.336836 <0.001 (18:1(n-9))*14-1-n-5- alpha linolenate (18:3(n-3))*n-3-DPA-22-5-n- 270 0.730453 0.533562 <0.001 3- alpha linolenate (18:3(n-3))*oleate (18:1(n-9)) 270 0.576371 0.332204 <0.001 alpha linolenate (18:3(n-3))*palmitate (16:0) 270 0.656120 0.430494 <0.001 alpha linolenate (18:3(n-3))*palmitoleate 270 0.631278 0.398512 <0.001 (16:1(n-7)) alpha linolenate (18:3(n-3))*stearate (18:0) 270 0.592125 0.350612 <0.001 alpha linolenate (18:3(n-3))*Metabolite-11261 270 0.545276 0.297326 <0.001 alpha linolenate (18:3(n-3))*Heptadecenate 270 0.645969 0.417276 <0.001 alpha linolenate (18:3(n-3))*Metabolite-11521 270 0.536472 0.287803 <0.001 5-oxoproline*gamma-glutamylleucine 270 0.634304 0.402341 <0.001 aspartate*gamma-glutamylleucine 270 0.673200 0.453199 <0.001 erythronate-*gamma-glutamylleucine 270 0.645586 0.416781 <0.001 gamma-glutamylleucine*gamma- 270 0.624245 0.389682 <0.001 glutamylmethionine- gamma- 270 0.797356 0.635776 <0.001 glutamylleucine*gammaglutamylphenylalanine gamma-glutamylleucine*gamma- 270 0.590454 0.348635 <0.001 glutamylthreonine- gamma-glutamylleucine*gamma- 270 0.709135 0.502873 <0.001 glutamyltyrosine gamma-glutamylleucine*glutamine 270 -0.589607 0.347636 <0.001 gamma-glutamylleucine*glycerate 270 0.515968 0.266223 <0.001 gamma-glutamylleucine*Metabolite-10814 270 0.561643 0.315442 <0.001 gamma-glutamylleucine*Metabolite-11505 270 0.580041 0.336448 <0.001 gamma-glutamylleucine*Metabolite-11560 270 0.544984 0.297008 <0.001 gamma-glutamylleucine*Metabolite-12055 270 0.818261 0.669551 <0.001 gamma-glutamylleucine*Metabolite-3078 270 -0.544729 0.296730 <0.001 gamma-glutamylleucine*Metabolite-3114 270 0.610266 0.372424 <0.001 gamma-glutamylleucine*Glutamate 402 0.813405 0.661627 <0.001 gamma-glutamylleucine*glutamylvaline 270 0.980569 0.961516 <0.001 glucose*mannose 270 0.569026 0.323791 <0.001 glucose*galactonic acid 270 0.612109 0.374677 <0.001 5-oxoproline*gluconate 270 0.519968 0.270367 <0.001 5-oxoproline*Glutamate 270 0.598936 0.358724 <0.001 aspartate*Glutamate 270 0.647610 0.419399 <0.001 erythronate-*Glutamate 270 0.577551 0.333565 <0.001 gamma-glutamylleucine*Glutamate 270 0.702612 0.493664 <0.001 gamma-glutamylphenylalanine*Glutamate 270 0.683581 0.467283 <0.001 gamma-glutamylthreonine-*Glutamate 270 0.547683 0.299956 <0.001 gamma-glutamyltyrosine*Glutamate 270 0.656418 0.430885 <0.001 glutamine*Glutamate 270 -0.693796 0.481352 <0.001 glycerate*Glutamate 270 0.514091 0.264289 <0.001 Metabolite-10814*Glutamate 270 0.683648 0.467375 <0.001 Metabolite-11505*Glutamate 270 0.565409 0.319687 <0.001 Metabolite-11560*Glutamate 270 0.596566 0.355891 <0.001 Metabolite-12055*Glutamate 270 0.710157 0.504322 <0.001 Metabolite-3078*Glutamate 270 -0.573092 0.328434 <0.001 Metabolite-3114*Glutamate 270 0.717209 0.514389 <0.001 Glutamate*glutamylvaline 402 0.815543 0.665110 <0.001 5-oxoproline*glutamylvaline 270 0.567314 0.321845 <0.001 aspartate*glutamylvaline 270 0.650190 0.422746 <0.001 erythronate-*glutamylvaline 270 0.648632 0.420723 <0.001 gamma-glutamylmethionine-*glutamylvaline 270 0.682431 0.465712 <0.001 gammaglutamylphenylalanine*glutamylvaline 270 0.748588 0.560384 <0.001 gamma-glutamylthreonine-*glutamylvaline 270 0.613004 0.375774 <0.001 gamma-glutamyltyrosine*glutamylvaline 270 0.669454 0.448169 <0.001 glutamine*glutamylvaline 270 -0.586263 0.343704 <0.001 glycerate*glutamylvaline 270 0.500861 0.250862 <0.001 Metabolite-10814*glutamylvaline 270 0.544487 0.296466 <0.001 Metabolite-11505*glutamylvaline 270 0.571094 0.326149 <0.001 Metabolite-11560*glutamylvaline 270 0.520971 0.271411 <0.001 Metabolite-12055*glutamylvaline 270 0.818203 0.669456 <0.001 Metabolite-3078*glutamylvaline 270 -0.536866 0.288225 <0.001 Metabolite-3114*glutamylvaline 270 0.588849 0.346744 <0.001 Docosatetraenate*Heptadecenate 402 0.731992 0.535812 <0.001 Fasting_FFA*Heptadecenate 393 0.503364 0.253375 <0.001 Heptadecenate*palmitate (16:0) 402 0.902155 0.813884 <0.001 Heptadecenate*margarate (17:0) 402 0.827249 0.684341 <0.001 Heptadecenate*stearate (18:0) 402 0.719541 0.517740 <0.001 Heptadecenate*alpha linolenate (18:3(n-3)) 402 0.605486 0.366614 <0.001 Isobar-cis-9-cis-11-trans-11- 270 0.717041 0.514147 <0.001 eicosenoate*Heptadecenate linoleate (18:2(n-6))*Heptadecenate 270 0.696473 0.485075 <0.001 myristate (14:0)*Heptadecenate 270 0.815585 0.665178 <0.001 myristoleate (18:1(n-9))*14-1-n-5- 270 0.764373 0.584266 <0.001 *Heptadecenate n-3-DPA-22-5-n-3-*Heptadecenate 270 0.600981 0.361178 <0.001 oleate (18:1(n-9))*Heptadecenate 270 0.826866 0.683707 <0.001 palmitoleate (16:1(n-7))*Heptadecenate 270 0.891137 0.794126 <0.001 Heptadecenate*Metabolite-11909 270 0.500849 0.250850 <0.001 Linolyl.cndot.LPC*Oleoyl.cndot.LPC 270 0.503307 0.253318 <0.001 hypoxanthine*lactate 270 0.521393 0.271850 <0.001 dihomo-alpha-alpha linolenate (18:3(n-3))-20- 270 0.513066 0.263237 <0.001 3-n-3-*linoleate (18:2(n-6)) Isobar-cis-9-cis-11-trans-11- 270 0.614356 0.377433 <0.001 eicosenoate*linoleate (18:2(n-6)) linoleate (18:2(n-6))*myristate (14:0) 270 0.777196 0.604033 <0.001 linoleate (18:2(n-6))*oleate (18:1(n-9)) 270 0.764875 0.585034 <0.001 linoleate (18:2(n-6))*palmitate (16:0) 270 0.591405 0.349760 <0.001 linoleate (18:2(n-6))*palmitoleate (16:1(n-7)) 270 0.667721 0.445851 <0.001 linoleate (18:2(n-6))*stearate (18:0) 402 0.688839 0.474500 <0.001 Docosatetraenate*linoleate (18:2(n-6)) 402 0.718624 0.516421 <0.001 linoleate (18:2(n-6))*margarate (17:0) 402 0.658122 0.433124 <0.001 Docosatetraenate*oleate (18:1(n-9)) 402 0.764928 0.585115 <0.001 margarate (17:0)*oleate (18:1(n-9)) 270 0.510486 0.260596 <0.001 3-hydroxybutyrate (BHBA)*oleate (18:1(n-9)) 270 0.576371 0.332204 <0.001 alpha linolenate (18:3(n-3))*oleate (18:1(n-9)) 270 0.736518 0.542459 <0.001 Isobar-cis-9-cis-11-trans-11- 270 0.777196 0.604033 <0.001 eicosenoate*oleate (18:1(n-9)) linoleate (18:1(n-9)) (18:2(n-6))*oleate (18:1(n-9)) 270 0.709041 0.502739 <0.001 margarate (17:0)*oleate (18:1(n-9)) 270 0.668674 0.447124 <0.001 myristate (14:0)*oleate (18:1(n-9)) 270 0.587740 0.345438 <0.001 myristoleate (18:1(n-9))*14-1-n-5-*oleate 270 0.907290 0.823175 <0.001 (18:1(n-9)) oleate (18:1(n-9))*palmitate (16:0) 270 0.766301 0.587217 <0.001 oleate (18:1(n-9))*palmitoleate (16:1(n-7)) 270 0.765960 0.586695 <0.001 oleate (18:1(n-9))*stearate (18:0) 402 0.748928 0.560893 <0.001 pyruvate*Metabolite-4357 270 0.586698 0.344214 <0.001 asparagine*serine 270 0.638729 0.407974 <0.001 ornithine*serine 270 0.656649 0.431187 <0.001 serine*Metabolite-4274 270 0.578680 0.334870 <0.001 dihomo-alpha-alpha linolenate (18:3(n-3))-20- 270 0.516782 0.267063 <0.001 3-n-3-*palmitate (16:0) Isobar-cis-9-cis-11-trans-11- 270 0.703264 0.494580 <0.001 eicosenoate*palmitate (16:0) margarate (17:0)*palmitate (16:0) 270 0.752390 0.566091 <0.001 myristate (14:0)*palmitate (16:0) 270 0.807589 0.652199 <0.001 myristoleate (18:1(n-9))*14-1-n-5-*palmitate 270 0.658236 0.433274 <0.001 (16:0) n-3-DPA-22-5-n-3-*palmitate (16:0) 270 0.553025 0.305836 <0.001 palmitate (16:0)*palmitoleate (16:1(n-7)) 270 0.784704 0.615761 <0.001 palmitate (16:0)*stearate (18:0) 270 0.843751 0.711916 <0.001 palmitate (16:0)*Heptadecenate 270 0.851782 0.725532 <0.001 palmitate (16:0)*Docosatetraenate 270 0.533851 0.284997 <0.001 Metabolite-9033*Metabolite-10750 270 0.550669 0.303236 <0.001 bradykinin, hydroxyproline form-*peptide- 270 0.587635 0.345314 <0.001 HWESASXXR
2I: Predicting and Monitoring Insulin Resistance:
The biomarker panel and algorithm will measure insulin resistance (IR) which is a root cause of type 2 diabetes. The results will be presented as an "IR Score.TM." which represents the level of insulin resistance of the subject. IR Scores will range from Normal Glucose Tolerance (NGT) through increasing levels (Low, Medium, High) of Impaired Glucose Tolerance (IGT). The IR Score.TM. will allow the physician to place the patient on the spectrum of glucose tolerance, from normal to high. For example, an IR Score.TM. of 25 will put the patient in the Low IGT category while an IR Score.TM. of 80 will put the patient in the High IGT category.
By determining the IR Score on an annual or semi-annual basis, physicians can monitor a patient's progression toward diabetes. For example, an IR score of 25 was obtained at a first time point, an IR Score of 34 was obtained at a second time point, an IR Score of 40 was obtained at a third time point, an IR Score of 55 was obtained at a fourth time point, and an IR Score of 80 was obtained at a fourth time point indicating an increase in IR and progression of disease from normal to highly impaired glucose tolerance. Using the biomarkers and algorithm of the instant invention for progression monitoring will guide the physician's decision to implement preventative measures such as dietary restrictions, exercise, or early-stage drug treatment. An example of a report demonstrating the use of the IR Score to monitor IR status over time is shown in FIG. 5.
TABLE-US-00011 TABLE 10 IR Score IR Score 1 to 100 .ltoreq.25 NGT 26 to 50 Low IGT 51 to 75 Medium IGT 76 to 100 High IGT >100 Type 2 Diabetes
2J: Biomarkers that Correlate with Glucose Tolerance Tests
Another study will be carried out to test the biomarkers discovered in the instant invention with a new cohort and to discover additional biochemical biomarkers that correlate with insulin sensitivity (IS) and insulin resistance (IR) as measured by the hyperinsulinemic euglycemic (HI) clamp (Table 11). Using the following study design, baseline fasting EDTA-plasma samples collected from NGT, IGT, IFG IGT/IFG and diabetic subjects (total=250) will be analyzed.
TABLE-US-00012 TABLE 11 Summary of Study Subjects Condition Number of Subjects NGT 50 IGT 50 IFG 50 IGT/IFG 50 T2D 50 Abbreviations NGT: Normal Glucose Tolerant (OGTT, <140 mg/dL or <7.8 mmol/L) IGT: Impaired Glucose Tolerant (OGTT, 140-199 mg/dL or 7.8-11.0 mmol/L) IFG: Impaired Fasting Glucose (Fasting plasma glucose, 100-125 mg/dL or 5.6-6.9 mmol/L) IGT/IFG: IGT and/or IFG T2D: Type II Diabetes (OGTT, .gtoreq.200 mg/dL or .gtoreq.11.1 mmol/L)
Example 3
Biomarkers for Metabolic Syndrome Related Disorders
3A: Biomarkers of Metabolic Syndrome
Biomarkers were discovered by (1) analyzing plasma and serum samples drawn from different groups of subjects to determine the levels of metabolites in the samples and then (2) statistically analyzing the results to determine those metabolites that were differentially present in the two groups.
The samples used for the analysis were obtained from 19 Caucasian males aged 18-39, average age of 25.6, that had been diagnosed with metabolic syndrome and 19 healthy, age-matched, Caucasian males.
T-tests were used to determine differences in the mean levels of metabolites between the two populations (i.e., Metabolic syndrome vs. Healthy controls).
Biomarkers:
As listed below in Tables 12 and 13, biomarkers were discovered that were differentially present between samples from subjects with Metabolic Syndrome and Control (healthy) subjects.
Tables 12 and 13 include, for each listed biomarker, the p-value and q-value determined in the statistical analysis of the data concerning the biomarkers and an indication of the mean level in metabolic syndrome, the mean level in the control, and the percentage difference in the metabolic syndrome mean level as compared to the healthy mean level in plasma (Table 12) and serum (Table 13). The term "Isobar" as used in the tables indicates the compounds that could not be distinguished from each other on the analytical platform used in the analysis (i.e., the compounds in an isobar elute at nearly the same time and have similar (and sometimes exactly the same) quant ions, and thus cannot be distinguished). Comp_ID refers to the compound identification number used as a primary key for that compound in the in-house chemical database. Library indicates the chemical library that was used to identify the compounds. The number 50 refer to the GC library and the number 61 refers to the LC library.
TABLE-US-00013 TABLE 12 Metabolite biomarkers of Metabolic Syndrome in plasma % Change Met. Mean_Metabolic Syn. vs COMP_ID COMPOUND LIB_ID p-value q-value Syndrome Mean_Ctrl Control 22290 2-propylpentanoic acid 50 0.2189 0.329 14.75 0.89 1557% 10715 Metabolite-2395 61 0.3183 0.3868 6.94 0.83 736% 10327 Metabolite-2281 61 0.0788 0.2083 1.97 0.72 174% 10092 Metabolite-2250 61 0.3313 0.3919 1.84 0.74 149% 569 caffeine 61 0.0806 0.2083 1.92 0.78 146% 22054 Metabolite-8792 50 <0.0001 4.00E-04 1.71 0.76 125% 12796 Metabolite-3114 50 0.0559 0.1731 1.89 0.89 112% 10286 Metabolite-2272 61 0.0922 0.2131 2.09 1.01 107% 12751 Metabolite-3073 50 0.0055 0.0575 3.09 1.6 93% 10672 Metabolite-2390 61 0.0045 0.0575 1.85 0.97 91% 18369 gamma-glu-leu 61 0.2496 0.3473 2.82 1.49 89% 14715 Metabolite-3653 61 0.5859 0.5302 2.39 1.28 87% 11056 Metabolite-2568 61 0.3525 0.3951 3.38 1.84 84% 57 glutamic acid 50 0.0403 0.1575 2.6 1.46 78% 9130 Metabolite-2139 61 0.0027 0.0473 1.62 0.94 72% 1638 arginine 61 0.0795 0.2083 1.53 0.9 70% 24233 Metabolite-9855 61 0.327 0.3896 1.59 0.95 67% 22130 DL-3-phenyllactic acid 61 0.1899 0.3052 1.82 1.1 65% 17492 Metabolite-4906 61 0.1714 0.2843 1.62 0.98 65% 21630 Metabolite-8402 50 0.0044 0.0575 1.48 0.9 64% 17557 Metabolite-4929 61 0.0132 0.0946 1.25 0.77 62% 15253 Metabolite-3832 61 0.4313 0.4494 2.22 1.38 61% 20842 Metabolite-7765 61 0.2648 0.3613 2.17 1.35 61% 14837 Metabolite-3707 61 0.8263 0.605 3.14 1.97 59% 3147 xanthine 61 0.0204 0.1174 1.54 0.98 57% 21127 monopalmitin 50 0.0025 0.0473 1.5 0.96 56% 2734 gamma-L-glutamyl-L-tyrosine 61 0.1081 0.2168 1.93 1.24 56% 6413 Metabolite-1342-possible- 61 0.2081 0.3221 1.82 1.17 56% phenylacetylglutamine- 2132 citrulline 50 0.4298 0.4494 0.34 0.22 55% 20830 Metabolite-7762 61 0.0195 0.1168 1.43 0.93 54% 15996 aspartate 50 0.2785 0.3701 2.81 1.83 54% 18118 Metabolite-5346 50 0.016 0.1008 1.52 0.99 54% 15113 Metabolite-3783 61 0.0978 0.2144 0.85 0.56 52% 7171 Metabolite-1643 61 0.3158 0.3868 2.06 1.36 51% 19377 Metabolite-6272 50 0.0031 0.0497 1.16 0.77 51% 16337 Metabolite-4167 61 0.0333 0.1436 1.41 0.94 50% 12756 Metabolite-3077 50 4.00E-04 0.045 1.93 1.3 48% 17390 Metabolite-4806 50 0.0276 0.1362 1.23 0.83 48% 21418 Isobar-56-includes-DL- 61 0.1632 0.2797 1.78 1.21 47% pipecolic acid-1-amino-1- cyclopentanecarboxylic acid 1125 isoleucine 50 0.0994 0.2148 1.13 0.77 47% 6847 Metabolite-1496 61 0.0238 0.1264 1.45 0.99 46% 12658 Metabolite-3026 50 0.0062 0.0575 1.66 1.15 44% 18392 theobromine 61 0.4972 0.4818 1.41 0.98 44% 13775 Metabolite-3370 61 0.001 0.0473 1.52 1.06 43% 7933 Metabolite-1911 61 0.5673 0.5208 1.44 1.01 43% 22320 Metabolite-8889 50 0.0244 0.1264 0.72 0.51 41% 27278 Metabolite-10510 50 0.0213 0.1195 1.48 1.05 41% 11178 Metabolite-2608 61 0.0065 0.0575 1.24 0.88 41% 12656 Metabolite-3025 50 0.0025 0.0473 1.59 1.13 41% 18882 taurodeoxycholic acid 61 0.2208 0.3294 1.87 1.33 41% 27513 indole-3-acetic acid 61 0.0439 0.1617 1.36 0.97 40% 13214 Metabolite-3183-possible- 61 0.2025 0.3182 2.06 1.48 39% gamma-L-glutamyl-L- phenylalanine 1481 inositol-l-phosphate 50 0.0444 0.1617 1.72 1.24 39% 60 leucine 50 0.0726 0.2034 1.12 0.81 38% 12780 Metabolite-3098 50 0.0023 0.0473 1.67 1.21 38% 12774 Metabolite-3094 50 0.0057 0.0575 1.19 0.87 37% 1561 alpha-tocopherol 50 0.0599 0.1774 1.31 0.96 36% 12647 Metabolite-3019 50 0.0024 0.0473 1.5 1.1 36% 17068 Metabolite-4627 61 0.8349 0.6052 1.66 1.22 36% 12960 Metabolite-3134 61 0.0558 0.1731 1.25 0.92 36% 9491 Metabolite-2185 61 0.2076 0.3221 1.18 0.87 36% 9172 Metabolite-2000 61 0.0197 0.1168 1.15 0.85 35% 1898 proline 61 0.0309 0.1425 1.36 1.01 35% 1299 tyrosine 61 0.0027 0.0473 1.3 0.97 34% 18829 phenylalanine 61 0.0014 0.0473 1.51 1.13 34% 12767 Metabolite-3087 50 0.3192 0.3868 1.24 0.93 33% 9905 Metabolite-2231 61 0.0482 0.1629 1.45 1.09 33% 19372 Metabolite-6269 50 0.0255 0.1288 1.01 0.76 33% 19397 Metabolite-6326 50 0.016 0.1008 1.38 1.04 33% 1649 valine 50 0.1994 0.3156 1.1 0.83 33% 12222 Metabolite-2374 50 0.0068 0.0575 1.37 1.04 32% 15140 L-kynurenine 61 0.0123 0.0912 1.33 1.01 32% 5628 Metabolite-1086 61 0.8915 0.6155 1.95 1.49 31% 5687 Metabolite-1110 61 0.6883 0.573 1.54 1.18 31% 20699 meso-erythritol 50 0.0466 0.1629 1.29 0.99 30% 15990 L-alpha- 61 0.2682 0.3634 1.94 1.49 30% glycerophosphorylcholine 27718 creatine 61 0.0922 0.2131 1.47 1.13 30% 12609 Metabolite-2986 50 0.0331 0.1436 1.82 1.4 30% 18476 glycocholic acid 61 0.1687 0.283 1.91 1.47 30% 18010 Metabolite-5231 61 0.2164 0.329 1.52 1.17 30% 12876 Metabolite-3125 61 0.0652 0.1905 1.22 0.94 30% 19364 Metabolite-6246 50 0.0105 0.0809 1.32 1.02 29% 10245 Metabolite-2269- 61 0.84 0.6052 1.5 1.16 29% 6266 Metabolite-1286 61 0.092 0.2131 1.59 1.23 29% 15506 choline 61 0.1324 0.2451 1.71 1.33 29% 12639 Metabolite-3012 50 0.0024 0.0473 1.59 1.24 28% 16518 Metabolite-4276 50 0.1013 0.2164 1.14 0.89 28% 17512 Metabolite-4912 61 0.5453 0.5139 2.99 2.34 28% 29817 Metabolite-10683 50 0.0151 0.1008 1.57 1.23 28% 24076 Metabolite-9726 50 0.0364 0.1465 1.34 1.06 26% 584 mannose 50 0.1042 0.2168 1.39 1.1 26% 18524 6-hydroxydopamine 50 0.3352 0.3923 1.06 0.84 26% 1126 alanine 50 0.1098 0.2168 0.97 0.77 26% 10629 Metabolite-2386 61 0.5698 0.5208 1.2 0.96 25% 1301 lysine 50 0.3451 0.3929 1.01 0.81 25% 27256 Metabolite-10500 50 0.0367 0.1465 1.07 0.86 24% 9024 Metabolite-2111 61 0.0925 0.2131 0.98 0.79 24% 10746 Isobar-6-includes-valine- 61 0.1592 0.2751 1.47 1.19 24% betaine 12768 Metabolite-3088 50 0.1478 0.2642 1.85 1.5 23% 1572 glyceric acid 50 0.2335 0.3381 1.6 1.3 23% 12650 Metabolite-3022 50 0.0772 0.2083 1.45 1.18 23% 22337 Metabolite-8893 61 0.1269 0.2414 1.08 0.88 23% 10087 Metabolite-2249 61 0.3326 0.3919 1.36 1.11 23% 1670 urea 50 0.0445 0.1617 1.31 1.07 22% 527 lactate 50 0.2905 0.3718 1.54 1.26 22% 16496 Metabolite-4251 50 0.5501 0.5161 0.88 0.72 22% 8336 Metabolite-2005 61 0.2177 0.329 1.29 1.06 22% 1303 malic acid 50 0.754 0.5875 1.07 0.88 22% 15737 hydroxyacetic acid 50 0.0844 0.2083 1.08 0.89 21% 16819 Metabolite-4496 50 0.0589 0.177 1.2 0.99 21% 1358 octadecanoic acid 50 0.0073 0.0584 1.15 0.95 21% 17665 p-hydroxybenzaldehyde 61 0.0329 0.1436 1.84 1.52 21% 7081 Metabolite-1609 61 0.3512 0.3951 1.05 0.87 21% 10737 Isobar-l-includes-mannose- 61 0.0589 0.177 1.3 1.08 20% fructose-glucose-galactose- alpha-L-sorbopyranose- Inositol-D-allose-D--altrose- D-psicone-L--gulose-allo- inositol 13557 Metabolite-3323 61 0.5667 0.5208 1.26 1.05 20% 15122 glycerol 50 0.0822 0.2083 1.21 1.01 20% 16511 Metabolite-4274 50 0.4771 0.4733 1.15 0.96 20% 1121 heptadecanoic acid 50 0.0531 0.1724 1.23 1.03 19% 11053 Metabolite-2567 61 0.5088 0.4907 3.1 2.6 19% 22026 1-methylguanidine 50 0.0457 0.1629 1.19 1 19% 25609 Metabolite-10439 50 0.3468 0.3929 1.63 1.37 19% 12035 nonanate 50 0.0892 0.2131 1.47 1.24 19% 1110 arachidonic acid 50 0.1038 0.2168 1.11 0.94 18% 54 tryptophan 61 0.0487 0.1629 1.28 1.09 17% 15278 Metabolite-3843 61 0.4117 0.4378 1.15 0.98 17% 27570 Metabolite-10569 61 0.0063 0.0575 1.09 0.93 17% 30178 Metabolite-10705 61 0.7541 0.5875 1.64 1.4 17% 63 cholesterol 50 0.0343 0.1446 1.17 1 17% 10551 Metabolite-2347 61 0.6957 0.573 1.96 1.68 17% 21188 1-stearoyl-rac-glycerol 50 0.4701 0.4687 1.14 0.98 16% 1365 tetradecanoic acid 50 0.071 0.2016 1.15 0.99 16% 5426 Metabolite-1004 61 0.3901 0.4235 1.08 0.93 16% 19368 Metabolite-6267 50 0.2381 0.3381 1.59 1.37 16% 27273 Metabolite-10506 50 0.1692 0.283 1.38 1.19 16% 7029 Metabolite-1597 61 0.0558 0.1731 1.77 1.53 16% 10156 Metabolite-2259 61 0.7281 0.5856 1.04 0.9 16% 10700 Metabolite-2393 61 0.6334 0.5495 2.23 1.93 16% 13142 Metabolite-3165 61 0.0829 0.2083 1.34 1.16 16% 25602 Metabolite-10432 50 0.9349 0.6253 2.17 1.88 15% 1431 p-hydroxyphenyllactic acid 50 0.2345 0.3381 1.23 1.07 15% 27271 Metabolite-10504 50 0.2474 0.3466 1.08 0.94 15% 6398 Metabolite-1335 61 0.8947 0.6155 1.89 1.66 14% 1336 n-hexadecanoic acid 50 0.1174 0.2297 1.09 0.96 14% 27672 3-indoxyl-sulfate 61 0.4812 0.4752 1.3 1.15 13% 22895 Metabolite-9299 50 0.7239 0.5856 1.05 0.93 13% 12129 beta-hydroxyisovaleric acid 50 0.3035 0.3814 1.4 1.24 13% 19282 Metabolite-6126 61 0.8029 0.6047 1.14 1.01 13% 21069 dioctyl-phthalate 50 0.0953 0.2144 1.07 0.95 13% 17064 Metabolite-4624 50 0.0925 0.2131 1.25 1.11 13% 21128 1-octadecanol 50 0.0486 0.1629 1.08 0.96 13% 18232 Metabolite-5403 50 0.1348 0.2473 1.19 1.06 12% 15529 Metabolite-3951 61 0.1081 0.2168 1.29 1.15 12% 27675 4-nitrophenol 61 0.3162 0.3868 1.27 1.14 11% 9216 Metabolite-2168 61 0.0835 0.2083 1.2 1.08 11% 10750 Isobar-8-includes-anthranilic 61 0.2166 0.329 1.2 1.08 11% acid-salicylamide 7601 Metabolite-1819 61 0.5864 0.5302 1.2 1.08 11% 1604 uric acid 61 0.2964 0.3747 1.04 0.94 11% 513 creatinine 61 0.1885 0.3052 1.06 0.96 10% 1361 pentadecanoic acid 50 0.2362 0.3381 1.17 1.06 10% 1642 decanoic acid 50 0.3114 0.3866 1.39 1.26 10% 18147 Metabolite-5367 50 0.0753 0.2083 1.11 1.01 10% 22803 Isobar-66-includes- 61 0.41 0.4378 1.69 1.54 10% glycochenodeoxycholic acid- glycodeoxycholic acid 20267 Metabolite-7187 61 0.9304 0.6243 2.16 1.97 10% 5531 Metabolite-1095 61 0.5242 0.5009 0.69 0.63 10% 19363 Metabolite-6227 50 0.3417 0.3923 1.3 1.19 9% 1105 Linoleic acid 50 0.3425 0.3923 1.07 0.98 9% 17228 Metabolite-4727 61 0.7215 0.5856 1.56 1.43 9% 1643 fumaric acid 50 0.9687 0.6344 1.46 1.34 9% 16782 Metabolite-4470 61 0.9699 0.6344 1.12 1.03 9% 1302 methionine 61 0.2524 0.3489 1.27 1.17 9% 13545 Metabolite-3322 61 0.9964 0.6461 1.93 1.78 8% 12083 D-ribose 50 0.6963 0.573 1.31 1.21 8% 20950 Metabolite-7846 50 0.4339 0.4499 1.32 1.22 8% 5765 Metabolite-1142 61 0.6088 0.5395 1.21 1.12 8% 27719 galactonic acid 50 0.6632 0.5631 1.08 1 8% 27409 oleamide 50 0.5882 0.5302 0.95 0.88 8% 1507 palmitoleic acid 50 0.7754 0.5955 1.25 1.16 8% 24077 Metabolite-9727 50 0.5913 0.5308 1.28 1.19 8% 20489 D-glucose 50 0.0349 0.1446 1.14 1.06 8% 6422 Metabolite-1320 61 0.1095 0.2168 1.02 0.95 7% 19787 Metabolite-6746 61 0.2617 0.3594 1.17 1.09 7% 5632 Metabolite-1138 61 0.156 0.2741 1.03 0.96 7% 8098 Metabolite-1867 61 0.6653 0.5631 1.03 0.96 7% 30273 Metabolite-10736 50 0.6061 0.5394 1.18 1.1 7% 19934 inositol 50 0.6428 0.553 1.35 1.26 7% 15676 3-methyl-2-oxovaleric acid 61 0.5389 0.5102 1.21 1.13 7% 18349 DL-indole-3-lactic acid 61 0.8534 0.6083 1.22 1.14 7% 15765 ethylmalonic acid 61 0.7431 0.5875 0.99 0.93 6% 30282 Metabolite-10744 50 0.4613 0.4621 1.17 1.1 6% 16138 Metabolite-4080 50 0.8136 0.6047 2.4 2.27 6% 10544 Metabolite-2329 61 0.9173 0.6207 1.11 1.05 6% 15500 carnitine 61 0.6276 0.5468 0.94 0.89 6% 12645 Metabolite-3017 50 0.6906 0.573 1.32 1.25 6% 16665 Metabolite-4364 50 0.7407 0.5875 1.16 1.1 5% 17648 Metabolite-5007 61 0.886 0.6154 2.2 2.09 5% 15365 sn-Glycerol-3-phosphate 50 0.8826 0.6154 1.8 1.71 5% 10499 Metabolite-2073 61 0.5624 0.5208 1.02 0.97 5% 12638 Metabolite-3011 50 0.9472 0.6287 1.31 1.25 5% 12663 Metabolite-3030 50 0.7315 0.5856 1.55 1.48 5% 10065 Metabolite-2244 61 0.6638 0.5631 0.95 0.91 4% 1645 n-dodecanoate 50 0.451 0.4584 1.24 1.19 4% 6305 Metabolite-1254 61 0.7656 0.5901 0.82 0.79 4% 18665 Metabolite-5728 61 0.6202 0.5451 1.14 1.1 4% 13065 Metabolite-3146 61 0.6037 0.5394 1.21 1.17 3% 7127 Metabolite-1616 61 0.9018 0.6171 0.92 0.89 3% 12673 Metabolite-3040 50 0.638 0.5512 1.29 1.25 3% 59 histidine 50 0.8614 0.6083 1 0.97 3% 27275 Metabolite-10507 50 0.8966 0.6155 1.36 1.32 3% 12626 Metabolite-3003 50 0.7594 0.5875 1.1 1.07 3% 17627 Metabolite-4986 50 0.8711 0.6123 1.23 1.2 2% 13589 Metabolite-3327 61 0.919 0.6207 1.51 1.48 2% 12894 Metabolite-2456 61 0.9618 0.6331 1.05 1.03 2% 1648 serine 50 0.8095 0.6047 1.14 1.12 2% 20248 Metabolite-7177 61 0.7567 0.5875 1.23 1.21 2% 25607 Metabolite-10437 50 0.9076 0.6182 1.34 1.32 2% 1564 citric acid 50 0.4876 0.4779 0.04 0.04 0% 12726 Metabolite-3058 50 0.693 0.573 1.15 1.15 0% 12593 Metabolite-2973 50 0.7576 0.5875 0.43 0.43 0% 14988 Metabolite-3756 61 0.9471 0.6287 1.1 1.1 0% 10147 Metabolite-2036 61 0.9971 0.6461 1.26 1.27 -1% 16829 Metabolite-4503 50 0.8459 0.6069 1.19 1.2 -1% 27411 Metabolite-10547 61 0.9605 0.6331 1.04 1.05 -1% 1410 1-Hexadecanol 50 0.8407 0.6052 0.97 0.98 -1% 10655 Metabolite-2388 61 0.7806 0.5973 1.1 1.12 -2% 17327 Metabolite-4767 50 0.8114 0.6047 1.09 1.11 -2% 12666 Metabolite-3033-possible- 50 0.6852 0.573 1.23 1.26 -2%
threonine-deriv- 1366 trans-4-hydroxyproline 50 0.9284 0.6243 1.09 1.12 -3% 21047 3-methyl-2-oxobutyric- 61 0.6204 0.5451 0.99 1.02 -3% 10825 Metabolite-2546 61 0.7995 0.6047 0.98 1.01 -3% 16070 Metabolite-4019 50 0.7173 0.5856 1.19 1.23 -3% 22132 DL-alpha-hydroxyisocaproic 61 0.8586 0.6083 1.17 1.21 -3% acid 17786 aldosterone 61 0.8368 0.6052 1.1 1.14 -4% 30265 Metabolite-10732 50 0.6895 0.573 2.46 2.55 -4% 19097 Metabolite-5969 61 0.9094 0.6182 0.83 0.87 -5% 22145 acetyl-L-carnitine 61 0.7304 0.5856 1.14 1.2 -5% 1494 5-oxoproline 50 0.8287 0.605 1.33 1.4 -5% 22309 Metabolite-8887 61 0.8136 0.6047 1.89 1.99 -5% 6571 Metabolite-1397 61 0.7119 0.5834 0.93 0.98 -5% 16509 Metabolite-4273 50 0.4072 0.4378 1.3 1.37 -5% 19623 Metabolite-6671 50 0.563 0.5208 0.33 0.35 -6% 6517 Metabolite-1338 61 0.4487 0.4583 0.98 1.04 -6% 12162 Metabolite-2339 50 0.427 0.4494 0.62 0.66 -6% 5733 Metabolite-1127 61 0.4107 0.4378 1.2 1.28 -6% 27272 Metabolite-10505 50 0.2265 0.3355 1.38 1.48 -7% 58 glycine 50 0.4963 0.4818 0.96 1.03 -7% 12777 Metabolite-3097 50 0.5284 0.5025 3.1 3.33 -7% 17568 Metabolite-4931 61 0.7564 0.5875 1.05 1.13 -7% 13038 Metabolite-3143 61 0.2742 0.3667 1.29 1.39 -7% 20299 Metabolite-7266 50 0.341 0.3923 0.86 0.93 -8% 12720 Metabolite-3056 61 0.5179 0.4971 1.1 1.19 -8% 12782 Metabolite-3100 50 0.7853 0.5986 1.94 2.1 -8% 22609 Metabolite-9047 50 0.8612 0.6083 1.45 1.57 -8% 2761 thyroxine 61 0.3227 0.3868 1.2 1.3 -8% 1284 threonine 50 0.4887 0.4779 0.99 1.08 -8% 22548 Metabolite-9026 50 0.8228 0.605 1.01 1.11 -9% 6851 Metabolite-1497 61 0.7431 0.5875 0.69 0.76 -9% 7644 Metabolite-1831- 61 0.1522 0.2697 1.05 1.16 -9% 22880 Metabolite-9286 50 0.3811 0.4159 0.38 0.42 -10% 12533 Metabolite-2915 50 0.0688 0.1983 0.9 1 -10% 25402 Metabolite-10360 50 0.4214 0.4458 0.7 0.78 -10% 20676 maleic acid 61 0.3809 0.4159 0.62 0.7 -11% 6362 Metabolite-1323-possible-p- 61 0.8874 0.6154 1.22 1.38 -12% cresol-sulfate 22133 DL-hexanoyl-carnitine 61 0.289 0.3718 0.53 0.6 -12% 17304 Metabolite-4759 61 0.2874 0.3718 0.98 1.11 -12% 16468 Metabolite-4236 61 0.1187 0.23 0.87 0.99 -12% 5618 Metabolite-1085 61 0.3652 0.4028 0.97 1.11 -13% 30555 Metabolite-10781 61 0.8625 0.6083 1.28 1.47 -13% 6373 Metabolite-1304 61 0.2945 0.3747 1.18 1.36 -13% 22175 l-aspartyl-l-phenylalanine 61 0.8236 0.605 1.03 1.19 -13% 16071 Metabolite-4020 50 0.1303 0.2435 0.93 1.08 -14% 19402 Metabolite-6346 50 0.0066 0.0575 0.97 1.13 -14% 22600 Metabolite-9043 50 0.3407 0.3923 1.09 1.27 -14% 17330 Metabolite-4769 50 0.2308 0.3381 0.92 1.08 -15% 2342 serotonin 61 0.4557 0.4609 0.89 1.05 -15% 3127 hypoxanthine 61 0.2372 0.3381 1.54 1.82 -15% 15128 DL-homocysteine 61 0.0794 0.2083 0.81 0.96 -16% 16512 Metabolite-4275 50 0.2404 0.339 1.04 1.27 -18% 17494 Metabolite-4907 61 0.9491 0.6287 1.53 1.87 -18% 19370 Metabolite-6268 50 0.2874 0.3718 0.91 1.12 -19% 14672 Metabolite-3615 61 0.984 0.6416 0.88 1.09 -19% 577 fructose 50 0.2716 0.3657 0.96 1.19 -19% 11499 Metabolite-2753 61 0.459 0.4619 0.69 0.86 -20% 6374 Metabolite-1327 61 0.3602 0.4016 0.94 1.18 -20% 22053 3-hydroxydecanoic acid 61 0.3226 0.3868 1.04 1.31 -21% 27738 threonic acid 50 0.1963 0.3131 1.02 1.29 -21% 542 3-hydroxybutanoic acid 50 0.3099 0.3866 1.24 1.57 -21% 12757 Metabolite-3078 50 0.1683 0.283 1 1.27 -21% 12781 Metabolite-3099 50 0.2872 0.3718 2.88 3.67 -22% 24074 Metabolite-9706 50 0.2808 0.3708 0.85 1.1 -23% 53 glutamine 50 0.0982 0.2144 0.71 0.92 -23% 14239 Metabolite-3474 61 0.1845 0.3012 1.02 1.33 -23% 12625 Metabolite-3002 50 0.0973 0.2144 0.68 0.9 -24% 19110 Metabolite-5978 50 0.1078 0.2168 0.64 0.85 -25% 17540 Metabolite-4926 61 0.4366 0.4504 2.34 3.13 -25% 22570 Metabolite-9033 50 0.1374 0.2477 0.25 0.34 -26% 10961 Metabolite-2561 61 0.5701 0.5208 1.31 1.81 -28% 10604 Metabolite-2370 61 0.1251 0.2402 0.68 0.95 -28% 5657 Metabolite-1092 61 0.6524 0.5589 3.89 5.46 -29% 18705 Metabolite-5768 61 0.158 0.2751 1.03 1.48 -30% 16044 Metabolite-4005 50 0.0144 0.0992 0.55 0.81 -32% 17091 Metabolite-4641 61 0.1742 0.2866 0.76 1.12 -32% 10066 Metabolite-2029 61 0.4461 0.4579 1.19 1.77 -33% 22159 dehydroisoandrosterone-3- 61 0.0303 0.1425 0.93 1.4 -34% sulfate 22649 Metabolite-9108 50 0.0532 0.1724 0.66 1 -34% 17306 Metabolite-4760 61 0.098 0.2144 0.82 1.25 -34% 9165 Metabolite-2150 61 0.1062 0.2168 0.76 1.16 -34% 6239 Metabolite-1264 61 0.1367 0.2477 2.92 4.84 -40% 10781 Metabolite-2469 61 0.0231 0.126 0.89 1.51 -41% 10304 Metabolite-2276 61 0.8813 0.6154 1.28 2.19 -42% 5280 biliverdin 61 0.0289 0.1395 1.19 2.14 -44% 18871 Metabolite-5848 61 0.0069 0.0575 1.03 1.88 -45% 18702 Metabolite-5767 61 0.0017 0.0473 0.76 1.45 -48% 12478 Metabolite-2898 61 0.1285 0.2421 0.86 1.71 -50% 27710 N-acetylglycine 50 0.0049 0.0575 0.78 1.64 -52% 17495 Metabolite-4908 61 0.044 0.1617 0.94 1.99 -53% 10177 Metabolite-2039 61 0.0067 0.0575 0.83 1.86 -55% 12306 Metabolite-2869 61 0.627 0.5468 1.18 2.72 -57%
TABLE-US-00014 TABLE 13 Metabolite biomarkers of Metabolic Syndrome in serum. % Change Met. Mean_Metabolic Syn. vs COMP_ID COMPOUND LIB_ID p-value q-value Syndrome Mean_Control Control 19402 Metabolite-6346 50 0 9.00E-04 0.88 1.07 -18% 22054 Metabolite-8792 50 0 9.00E-04 1.29 0.56 130% 12663 Metabolite-3030 50 4.00E-04 0.0304 0.61 0.83 -27% 27710 N-acetylglycine 50 6.00E-04 0.0335 0.56 1.28 -56% 18829 phenylalanine 61 0.0015 0.0629 0.95 0.71 34% 13257 Metabolite-3218 61 0.0019 0.0675 0.94 0.57 65% 9172 Metabolite-2000 61 0.0023 0.0675 1.24 0.86 44% 17390 Metabolite-4806 50 0.0032 0.0827 1.2 0.69 74% 20830 Metabolite-7762 61 0.005 0.1061 1.21 0.69 75% 10672 Metabolite-2390 61 0.0051 0.1061 1.05 0.63 67% 13142 Metabolite-3165 61 0.0066 0.1177 0.99 0.78 27% 18147 Metabolite-5367 50 0.0068 0.1177 1.05 0.9 17% 19110 Metabolite-5978 50 0.0075 0.1206 1.08 1.66 -35% 16337 Metabolite-4167 61 0.0087 0.1269 1.33 0.8 66% 27570 Metabolite-10569 61 0.0095 0.1269 1.15 0.94 22% 6422 Metabolite-1320 61 0.0098 0.1269 1.07 0.97 10% 21630 Metabolite-8402 50 0.0104 0.1269 1.17 0.76 54% 1299 tyrosine 61 0.0113 0.1304 1.26 0.87 45% 9491 Metabolite-2185 61 0.0119 0.1304 1.14 0.77 48% 18702 Metabolite-5767 61 0.013 0.132 0.75 1.31 -43% 13775 Metabolite-3370 61 0.0138 0.132 0.93 0.68 37% 10177 Metabolite-2039 61 0.014 0.132 0.82 1.59 -48% 7081 Metabolite-1609 61 0.0171 0.1442 1.02 0.84 21% 18871 Metabolite-5848 61 0.0171 0.1442 0.86 1.32 -35% 12658 Metabolite-3026 50 0.0178 0.1442 0.98 0.79 24% 12647 Metabolite-3019 50 0.0191 0.1442 0.92 0.79 16% 12656 Metabolite-3025 50 0.0193 0.1442 0.88 0.75 17% 18118 Metabolite-5346 50 0.0194 0.1442 1.16 0.86 35% 17786 aldosterone 61 0.0209 0.1498 1.14 0.91 25% 27273 Metabolite-10506 50 0.0239 0.1655 0.77 0.91 -15% 17665 p- 61 0.0265 0.1775 0.7 0.53 32% hydroxybenzaldehyde 6374 Metabolite-1327 61 0.0277 0.1781 1.23 1.92 -36% 7029 Metabolite-1597 61 0.0305 0.1781 0.67 0.5 34% 21188 1-stearoyl-rac- 50 0.0308 0.1781 1.16 0.76 53% glycerol 16044 Metabolite-4005 50 0.0317 0.1781 1.01 1.55 -35% 5727 Metabolite-1126 61 0.0341 0.1781 1.19 0.96 24% 10737 Isobar-1-includes- 61 0.0343 0.1781 0.93 0.75 24% mannose-fructose- glucose-galactose- alpha-L- sorbopyranose- Inositol-D-allose-D-- altrose-D-psicone-L-- gulose-allo-inositol 1303 malic acid 50 0.0353 0.1781 1.05 1.23 -15% 57 glutamic acid 50 0.0361 0.1781 1.86 1 86% 14491 Metabolite-3530 61 0.0362 0.1781 0.66 1.02 -35% 12478 Metabolite-2898 61 0.0364 0.1781 0.64 1.64 -61% 6266 Metabolite-1286 61 0.0369 0.1781 1.01 0.79 28% 1638 arginine 61 0.0374 0.1781 1.49 0.81 84% 63 cholesterol 50 0.0378 0.1781 1.11 0.93 19% 15529 Metabolite-3951 61 0.0386 0.1781 0.98 0.84 17% 15278 Metabolite-3843 61 0.0403 0.181 1.17 0.8 46% 27275 Metabolite-10507 50 0.0417 0.181 0.6 0.78 -23% 22159 dehydroisoandrosterone- 61 0.0422 0.181 0.8 1.11 -28% 3-sulfate 19397 Metabolite-6326 50 0.0427 0.181 1.12 0.9 24% 12609 Metabolite-2986 50 0.044 0.1812 0.88 0.7 26% 10087 Metabolite-2249 61 0.0468 0.1812 1.21 0.84 44% 19377 Metabolite-6272 50 0.0472 0.1812 1.24 0.95 31% 1604 uric acid 61 0.0485 0.1812 1.12 0.96 17% 54 tryptophan 61 0.0501 0.1812 0.98 0.82 20% 15140 L-kynurenine 61 0.0507 0.1812 1.11 0.85 31% 12666 Metabolite-3033- 50 0.051 0.1812 0.82 0.95 -14% possible-threonine- deriv- 21127 monopalmitin 50 0.0517 0.1812 1.31 0.82 60% 10629 Metabolite-2386 61 0.0529 0.1812 1.08 0.82 32% 1125 isoleucine 50 0.0533 0.1812 1.57 1.05 50% 12035 nonanate 50 0.0542 0.1812 0.75 0.58 29% 60 leucine 50 0.0543 0.1812 1.36 1 36% 12751 Metabolite-3073 50 0.0549 0.1812 0.74 0.64 16% 12781 Metabolite-3099 50 0.0549 0.1812 0.52 0.75 -31% 12774 Metabolite-3094 50 0.0566 0.1828 1.11 0.89 25% 24076 Metabolite-9726 50 0.059 0.1828 1.09 0.9 21% 6571 Metabolite-1397 61 0.0593 0.1828 1.18 0.94 26% 10499 Metabolite-2073 61 0.0594 0.1828 1.22 0.96 27% 27278 Metabolite-10510 50 0.0598 0.1828 1.05 0.82 28% 513 creatinine 61 0.0623 0.1875 1.15 0.93 24% 18665 Metabolite-5728 61 0.0632 0.1878 0.97 0.85 14% 18369 gamma-glu-leu 61 0.0679 0.1978 1.96 1.02 92% 19370 Metabolite-6268 50 0.0685 0.1978 0.79 0.97 -19% 20699 meso-erythritol 50 0.0697 0.1986 1.15 0.89 29% 9130 Metabolite-2139 61 0.0709 0.1991 1.31 0.92 42% 18392 theobromine 61 0.0727 0.2015 1.24 0.69 80% 1649 valine 50 0.074 0.2015 1.5 1.08 39% 18882 taurodeoxycholic acid 61 0.0747 0.2015 2.13 1.13 88% 27718 creatine 61 0.0798 0.2098 1.28 0.94 36% 27513 indole-3-acetic acid 61 0.0815 0.2098 1.17 0.84 39% 9216 Metabolite-2168 61 0.0832 0.2098 1.02 0.84 21% 9905 Metabolite-2231 61 0.0833 0.2098 1.08 0.86 26% 19414 Metabolite-6350 50 0.0838 0.2098 1.33 1.08 23% 20092 Metabolite-7050 61 0.0844 0.2098 0.59 0.84 -30% 6435 Metabolite-1348 61 0.0848 0.2098 2.07 0.99 109% 1648 serine 50 0.09 0.22 0.91 1.09 -17% 13214 Metabolite-3183- 61 0.0918 0.2214 1.4 0.97 44% possible-gamma-L- glutamyl-L- phenylalanine 22649 Metabolite-9108 50 0.0927 0.2214 0.93 1.17 -21% 30689 Metabolite-10790 61 0.0939 0.2217 0.97 1.07 -9% 22548 Metabolite-9026 50 0.0989 0.2309 2.37 0.98 142% 1358 octadecanoic acid 50 0.1003 0.2317 1.04 0.89 17% 16512 Metabolite-4275 50 0.1067 0.2438 0.71 0.93 -24% 21069 dioctyl-phthalate 50 0.1079 0.2438 1.34 0.88 52% 12960 Metabolite-3134 61 0.1094 0.2446 1.27 1.05 21% 22609 Metabolite-9047 50 0.1248 0.272 0.89 0.42 112% 1898 proline 61 0.1257 0.272 1.12 0.88 27% 1642 decanoic acid 50 0.1266 0.272 0.85 0.74 15% 12726 Metabolite-3058 50 0.1269 0.272 0.81 0.97 -16% 11974 Metabolite-2827 61 0.1311 0.2779 1.03 1.24 -17% 20842 Metabolite-7765 61 0.1349 0.2833 1.61 0.97 66% 17304 Metabolite-4759 61 0.1386 0.2872 1.47 0.92 60% 15737 hydroxyacetic acid 50 0.1396 0.2872 2.37 0.81 193% 18010 Metabolite-5231 61 0.1433 0.2919 1.16 0.83 40% 59 histidine 50 0.1489 0.2956 0.87 1.03 -16% 16665 Metabolite-4364 50 0.1496 0.2956 0.78 0.93 -16% 12757 Metabolite-3078 50 0.15 0.2956 0.67 0.89 -25% 1640 ascorbic acid 50 0.1509 0.2956 1.02 1.65 -38% 21418 Isobar-56-includes- 61 0.1522 0.2956 1.17 0.74 58% DL-pipecolic acid-1- amino-1- cyclopentanecarboxylic acid 10327 Metabolite-2281 61 0.1573 0.3028 1.44 0.85 69% 10700 Metabolite-2393 61 0.1613 0.3032 1 0.8 25% 10961 Metabolite-2561 61 0.1674 0.3032 0.91 0.72 26% 2734 gamma-L-glutamyl- 61 0.1684 0.3032 1.26 0.85 48% L-tyrosine 27409 oleamide 50 0.169 0.3032 2.13 1.09 95% 6847 Metabolite-1496 61 0.169 0.3032 1.27 1 27% 18705 Metabolite-5768 61 0.1693 0.3032 0.68 0.97 -30% 27742 aconitate 61 0.1696 0.3032 1.92 1.06 81% 19368 Metabolite-6267 50 0.1697 0.3032 0.71 0.8 -11% 30265 Metabolite-10732 50 0.1716 0.3032 0.65 0.85 -24% 542 3-hydroxybutanoic 50 0.1728 0.3032 0.91 1.24 -27% acid 21128 1-octadecanol 50 0.174 0.3032 1.93 0.91 112% 1126 alanine 50 0.175 0.3032 1.28 1.11 15% 9165 Metabolite-2150 61 0.1811 0.3111 0.7 0.95 -26% 8098 Metabolite-1867 61 0.1854 0.3159 1.15 0.93 24% 20299 Metabolite-7266 50 0.1953 0.3285 0.92 1.04 -12% 12129 beta- 50 0.196 0.3285 0.75 0.67 12% hydroxyisovaleric acid 12626 Metabolite-3003 50 0.1999 0.3315 0.94 1.04 -10% 18476 glycocholic acid 61 0.201 0.3315 1.75 1.57 11% 12222 Metabolite-2374 50 0.2083 0.3378 1.04 0.91 14% 1361 pentadecanoic acid 50 0.2083 0.3378 2.3 0.96 140% 53 glutamine 50 0.2096 0.3378 1.02 1.23 -17% 22026 1-methylguanidine 50 0.2146 0.3408 1.01 0.92 10% 7127 Metabolite-1616 61 0.2149 0.3408 1.02 1.28 -20% 10746 Isobar-6-includes- 61 0.217 0.3408 0.88 0.49 80% valine-betaine 5426 Metabolite-1004 61 0.2181 0.3408 1.97 1.02 93% 1302 methionine 61 0.2235 0.3428 0.91 0.83 10% 1121 heptadecanoic acid 50 0.2248 0.3428 1.5 0.94 60% 6373 Metabolite-1304 61 0.2252 0.3428 0.77 1.32 -42% 25602 Metabolite-10432 50 0.226 0.3428 0.64 0.8 -20% 22145 acetyl-L-carnitine 61 0.2282 0.343 1.07 1.24 -14% 18232 Metabolite-5403 50 0.2307 0.343 1.02 0.93 10% 1365 tetradecanoic acid 50 0.231 0.343 1.31 0.86 52% 10750 Isobar-8-includes- 61 0.2353 0.346 0.93 0.81 15% anthranilic acid- salicylamide 24233 Metabolite-9855 61 0.238 0.346 1.27 0.75 69% 6305 Metabolite-1254 61 0.2381 0.346 2.42 1.05 130% 30555 Metabolite-10781 61 0.2409 0.3476 0.45 0.67 -33% 569 caffeine 61 0.2479 0.3553 1.57 0.79 99% 12162 Metabolite-2339 50 0.2496 0.3554 1.41 1.48 -5% 16829 Metabolite-4503 50 0.2514 0.3554 0.83 0.96 -14% 15113 Metabolite-3783 61 0.2569 0.3592 1.97 1.34 47% 13211 Metabolite-3182 61 0.2592 0.3592 1.63 1.05 55% 8336 Metabolite-2005 61 0.261 0.3592 1.07 0.89 20% 17330 Metabolite-4769 50 0.261 0.3592 0.79 0.91 -13% 12645 Metabolite-3017 50 0.2635 0.3603 0.81 0.91 -11% 21047 3-methyl-2- 61 0.2676 0.3635 1 0.86 16% oxobutyric- 5733 Metabolite-1127 61 0.2766 0.3705 0.84 0.92 -9% 1670 urea 50 0.2793 0.3705 0.99 0.89 11% 1572 glyceric acid 50 0.2799 0.3705 0.9 0.69 30% 1507 palmitoleic acid 50 0.2804 0.3705 0.86 1.07 -20% 1110 arachidonic acid 50 0.2843 0.3716 1.03 0.91 13% 1561 alpha-tocopherol 50 0.2874 0.3733 1.07 0.8 34% 19364 Metabolite-6246 50 0.2912 0.3759 0.91 0.79 15% 5765 Metabolite-1142 61 0.2932 0.3761 0.99 0.86 15% 6405 Metabolite-1338 61 0.3015 0.3844 2.63 0.96 174% 16071 Metabolite-4020 50 0.3073 0.3884 0.92 1 -8% 16496 Metabolite-4251 50 0.3085 0.3884 1.54 1.24 24% 12533 Metabolite-2915 50 0.3102 0.3884 1.1 1.01 9% 10286 Metabolite-2272 61 0.316 0.3933 1.45 1 45% 8469 Metabolite-2036- 61 0.3184 0.3939 0.88 0.55 60% possible-Heme 10065 Metabolite-2244 61 0.325 0.3991 1.02 0.95 7% 19623 Metabolite-6671 50 0.3265 0.3991 2.43 2.77 -12% 27411 Metabolite-10547 61 0.3324 0.4023 0.52 0.68 -24% 12777 Metabolite-3097 50 0.3329 0.4023 0.53 0.7 -24% 18394 theophylline 61 0.3355 0.4031 0.97 0.71 37% 2761 thyroxine 61 0.3418 0.4082 0.86 0.93 -8% 18254 paraxanthine 61 0.3437 0.4082 0.97 0.58 67% 7933 Metabolite-1911 61 0.3458 0.4083 1.13 0.77 47% 15996 aspartate 50 0.3567 0.417 0.63 0.49 29% 7601 Metabolite-1819 61 0.3571 0.417 0.77 0.72 7% 1336 n-hexadecanoic acid 50 0.3594 0.4174 1.07 0.92 16% 10147 Metabolite-2036 61 0.3626 0.4186 0.9 0.99 -9% 5618 Metabolite-1085 61 0.3702 0.4251 1.35 1.06 27% 15500 carnitine 61 0.377 0.429 1.07 0.97 10% 6413 Metabolite-1342- 61 0.3778 0.429 1.1 0.94 17% possible- phenylacetylglutamine- 27738 threonic acid 50 0.3822 0.4317 0.89 0.96 -7% 22132 DL-alpha- 61 0.3947 0.4428 1 0.88 14% hydroxyisocaproic acid 17306 Metabolite-4760 61 0.3968 0.4428 0.74 1.09 -32% 20267 Metabolite-7187 61 0.399 0.4428 2.07 1.37 51% 14368 Metabolite-3489 61 0.4005 0.4428 0.84 0.94 -11% 10825 Metabolite-2546 61 0.405 0.4454 1.13 1.02 11% 6546 Metabolite-1391 61 0.4074 0.4456 1.12 1.02 10% 27675 4-nitrophenol 61 0.4103 0.4465 0.96 0.88 9% 17064 Metabolite-4624 50 0.4189 0.4534 0.88 0.92 -4% 20489 D-glucose 50 0.4214 0.4538 0.93 0.95 -2% 20676 maleic acid 61 0.4265 0.4553 1.18 1.33 -11% 13557 Metabolite-3323 61 0.4306 0.4553 1.3 1.02 27% 10551 Metabolite-2347 61 0.4307 0.4553 1.97 1.41 40% 15990 L-alpha- 61 0.4316 0.4553 0.71 0.58 22% glycerophosphorylcholine 6517 Metabolite-1338 61 0.4377 0.4591 0.86 0.8 8% 19097 Metabolite-5969 61 0.4396 0.4591 0.98 1.08 -9% 22803 Isobar-66-includes- 61 0.442 0.4593 1.63 1.38 18% glycochenodeoxycholic acid- glycodeoxycholic acid 1410 1-Hexadecanol 50 0.4484 0.4635 2.68 1.01 165% 15765 ethylmalonic acid 61 0.4505 0.4635 0.95 0.81 17% 5280 biliverdin 61 0.4559 0.4663 0.86 1.01 -15% 1284 threonine 50 0.4577 0.4663 1.14 1.24 -8% 30273 Metabolite-10736 50 0.4611 0.4675 0.89 1 -11%
16518 Metabolite-4276 50 0.4687 0.4717 0.86 0.72 19% 12756 Metabolite-3077 50 0.4698 0.4717 0.73 0.68 7% 12639 Metabolite-3012 50 0.4752 0.4748 0.79 0.73 8% 12650 Metabolite-3022 50 0.4937 0.4894 0.84 0.77 9% 10544 Metabolite-2329 61 0.4945 0.4894 1.05 1.4 -25% 22337 Metabolite-8893 61 0.5005 0.493 1.07 1.14 -6% 18524 6-hydroxydopamine 50 0.5075 0.4953 1.13 1.2 -6% 13065 Metabolite-3146 61 0.5076 0.4953 1.01 0.97 4% 15506 choline 61 0.5148 0.5 1.02 0.75 36% 14988 Metabolite-3756 61 0.5198 0.5007 0.68 0.74 -8% 12894 Metabolite-2456 61 0.5228 0.5007 0.9 0.94 -4% 22880 Metabolite-9286 50 0.5255 0.5007 1.33 1.25 6% 7171 Metabolite-1643 61 0.5279 0.5007 2.54 2.05 24% 14715 Metabolite-3653 61 0.5332 0.5007 1.92 1.07 79% 15000 Metabolite-3758 61 0.5332 0.5007 0.96 0.91 5% 29817 Metabolite-10683 50 0.5335 0.5007 0.84 0.79 6% 19372 Metabolite-6269 50 0.535 0.5007 1.09 1.13 -4% 18091 Metabolite-5306 61 0.5372 0.5007 1.06 0.96 10% 15676 3-methyl-2- 61 0.554 0.5065 0.93 0.89 4% oxovaleric acid 16468 Metabolite-4236 61 0.5544 0.5065 1.1 0.98 12% 22053 3-hydroxydecanoic 61 0.5575 0.5065 0.92 1.07 -14% acid 10781 Metabolite-2469 61 0.5584 0.5065 0.8 1 -20% 17568 Metabolite-4931 61 0.5585 0.5065 0.89 1.05 -15% 12625 Metabolite-3002 50 0.5605 0.5065 1.74 1.78 -2% 1643 fumaric acid 50 0.5626 0.5065 0.88 0.96 -8% 27272 Metabolite-10505 50 0.5629 0.5065 0.72 0.74 -3% 19363 Metabolite-6227 50 0.5725 0.5111 0.83 0.79 5% 10655 Metabolite-2388 61 0.5733 0.5111 0.93 1 -7% 58 glycine 50 0.5779 0.5111 0.9 0.98 -8% 15128 DL-homocysteine 61 0.5816 0.5111 1.27 1.36 -7% 17068 Metabolite-4627 61 0.5821 0.5111 1.35 0.76 78% 1494 5-oxoproline 50 0.5828 0.5111 0.99 0.86 15% 6531 Metabolite-1385 61 0.5892 0.5145 1.09 1.14 -4% 19282 Metabolite-6126 61 0.605 0.5238 1.38 1.03 34% 22130 DL-3-phenyllactic 61 0.6056 0.5238 2.23 1.36 64% acid 1301 lysine 50 0.6074 0.5238 1.53 1.32 16% 6851 Metabolite-1497 61 0.616 0.5277 1.55 1.46 6% 6398 Metabolite-1335 61 0.6169 0.5277 1.34 1.56 -14% 27256 Metabolite-10500 50 0.6227 0.5304 1.1 1.05 5% 21841 Metabolite-8577 61 0.6366 0.54 1.08 0.99 9% 5687 Metabolite-1110 61 0.6394 0.5402 0.96 0.94 2% 12306 Metabolite-2869 61 0.6482 0.5455 2.58 1.89 37% 12767 Metabolite-3087 50 0.6549 0.5488 1.44 1.18 22% 12638 Metabolite-3011 50 0.6612 0.5519 0.91 0.99 -8% 5489 Metabolite-1057 61 0.6673 0.5547 1.03 1.05 -2% 19462 Metabolite-6446 50 0.6727 0.5556 1.08 1.04 4% 10604 Metabolite-2370 61 0.676 0.5556 0.86 0.88 -2% 15121 Metabolite-3786 61 0.6764 0.5556 0.86 0.89 -3% 10092 Metabolite-2250 61 0.6803 0.5561 1.63 0.76 114% 22320 Metabolite-8889 50 0.6822 0.5561 1.69 1.77 -5% 1645 n-dodecanoate 50 0.6858 0.5567 0.82 0.79 4% 527 lactate 50 0.6911 0.5589 0.99 0.91 9% 3127 hypoxanthine 61 0.7003 0.5629 0.54 0.51 6% 24077 Metabolite-9727 50 0.7015 0.5629 0.92 0.97 -5% 1366 trans-4- 50 0.7106 0.568 1.14 1.08 6% hydroxyproline 11499 Metabolite-2753 61 0.7138 0.5684 1.31 0.8 64% 18349 DL-indole-3-lactic 61 0.7229 0.5722 0.91 0.86 6% acid 7644 Metabolite-1831- 61 0.7346 0.5751 0.88 0.89 -1% 5531 Metabolite-1095 61 0.7348 0.5751 1.34 1.34 0% 12768 Metabolite-3088 50 0.736 0.5751 0.65 0.68 -4% 1431 p- 50 0.7405 0.5764 1.19 0.91 31% hydroxyphenyllactic acid 12673 Metabolite-3040 50 0.7654 0.5878 0.75 0.82 -9% 2132 citrulline 50 0.7659 0.5878 3.41 3.29 4% 22309 Metabolite-8887 61 0.7694 0.5878 0.58 0.54 7% 30282 Metabolite-10744 50 0.7699 0.5878 0.89 0.87 2% 14672 Metabolite-3615 61 0.7721 0.5878 0.82 0.89 -8% 25607 Metabolite-10437 50 0.7765 0.589 0.76 0.87 -13% 6820 Metabolite-1554 61 0.7865 0.5944 1.06 1 6% 14239 Metabolite-3474 61 0.7901 0.5949 1 0.9 11% 20248 Metabolite-7177 61 0.7984 0.5973 1.04 1.02 2% 27326 Metabolite-10527 50 0.799 0.5973 1.16 1.12 4% 25402 Metabolite-10360 50 0.8093 0.6029 1.29 1.3 -1% 19934 inositol 50 0.8135 0.6038 0.68 0.68 0% 12593 Metabolite-2973 50 0.8339 0.6152 1.66 1.66 0% 23462 Metabolite-9693 61 0.8348 0.6152 1.15 1.15 0% 16819 Metabolite-4496 50 0.8463 0.6215 0.88 0.85 4% 16138 Metabolite-4080 50 0.8667 0.6297 0.53 0.51 4% 25609 Metabolite-10439 50 0.8668 0.6297 0.72 0.66 9% 584 mannose 50 0.87 0.6297 0.93 0.84 11% 15122 glycerol 50 0.8737 0.6297 0.93 0.89 4% 22570 Metabolite-9033 50 0.875 0.6297 1.52 1.51 1% 20888 Metabolite-7806 61 0.8756 0.6297 0.97 0.99 -2% 13038 Metabolite-3143 61 0.8833 0.6316 1.32 1.14 16% 16509 Metabolite-4273 50 0.8851 0.6316 0.69 0.7 -1% 16511 Metabolite-4274 50 0.8873 0.6316 1.1 1.08 2% 13589 Metabolite-3327 61 0.8935 0.6338 1.19 1.06 12% 5628 Metabolite-1086 61 0.9002 0.6364 1.73 1.6 8% 10245 Metabolite-2269- 61 0.9081 0.6398 1.08 0.87 24% 6362 Metabolite-1323- 61 0.9178 0.6429 1.08 1.02 6% possible-p-cresol- sulfate 5632 Metabolite-1138 61 0.9201 0.6429 1.03 1.05 -2% 15365 sn-Glycerol-3- 50 0.9265 0.6429 0.82 0.82 0% phosphate 10304 Metabolite-2276 61 0.9274 0.6429 1.36 1.77 -23% 10156 Metabolite-2259 61 0.9281 0.6429 1.06 1.03 3% 27719 galactonic acid 50 0.9386 0.6449 1.13 1.1 3% 22895 Metabolite-9299 50 0.9394 0.6449 1.05 1.05 0% 15253 Metabolite-3832 61 0.9468 0.6449 1.48 1.41 5% 1105 Linoleic acid 50 0.9483 0.6449 0.95 0.94 1% 12780 Metabolite-3098 50 0.9494 0.6449 0.87 0.83 5% 10441 Metabolite-2308 61 0.9506 0.6449 0.92 0.88 5% 27672 3-indoxyl-sulfate 61 0.9527 0.6449 0.98 0.95 3% 22133 DL-hexanoyl- 61 0.9585 0.646 1.36 1.35 1% carnitine 16070 Metabolite-4019 50 0.9631 0.646 0.85 0.85 0% 12720 Metabolite-3056 61 0.9635 0.646 0.9 0.92 -2% 24074 Metabolite-9706 50 0.9711 0.6479 1.12 1.11 1% 13545 Metabolite-3322 61 0.9736 0.6479 1.49 1.34 11% 1564 citric acid 50 0.9794 0.6479 3.72 3.73 0% 17327 Metabolite-4767 50 0.9803 0.6479 1.32 1.03 28% 20950 Metabolite-7846 50 0.982 0.6479 0.93 0.97 -4% 14837 Metabolite-3707 61 0.99 0.6511 2.12 1.66 28%
Random forests were generated for plasma and serum biomarkers. The models for the serum biomarkers correctly classified 81.5% of the subjects as either being healthy or having metabolic syndrome; 83% of the healthy subjects were classified correctly and 77% of the subjects having metabolic syndrome were correctly classified. For the models based on the biomarkers from plasma, the 89% of the subjects were correctly classified as either being healthy or having metabolic syndrome; 100% of the healthy subjects were correctly classified and 77% of the metabolic syndrome subjects were correctly classified. The most important biomarkers are shown in the importance plot in FIG. 8 (Serum) and FIG. 9 (Plasma).
3B: Biomarkers of Atherosclerosis
Biomarkers were discovered by (1) analyzing plasma, aorta and liver samples drawn from subjects with atherosclerosis and healthy subjects to determine the levels of metabolites in the samples and then (2) statistically analyzing the results to determine those metabolites that were differentially present in the two groups.
The samples used for the analysis were from wild-type and transgenic mice, C57BL/6 and LDb, respectively. The transgenic LDb mice provide a model for atherosclerosis in human subjects. Previous studies have shown that LDb transgenic mice in a C57BL/6 background have about 5-fold higher plasma cholesterol and triglyceride levels than C57BL/6 wild-type mice and start to develop atherosclerotic lesions at about 3 months of age. Plasma, ascending and descending aorta tissues and liver tissue from each group of mice at 2, 5 or 8 months were subjected to metabolomic analysis. These collection time points represent early (initiation), mid and late stage for atherosclerosis in the transgenic model.
T-tests were used to determine differences in the mean levels of metabolites between the two populations (i.e., LDb vs. C57BL/6). Classification analysis was carried out using recursive partitioning and random forest analyses to uncover the biomarkers that can best differentiate the 2 groups of mice. Recursive partitioning relates a `dependent` variable (Y) to a collection of independent (`predictor`) variables (X) in order to uncover--or simply understand--the elusive relationship, Y=f(X). It was performed with the JMP program (SAS) to generate a decision tree. The statistical significance of the "split" of the data can be placed on a more quantitative footing by computing p-values, which discern the quality of a split relative to a random event. The significance level of each "split" of data into the nodes or branches of the tree was computed as p-values, which discern the quality of the split relative to a random event. It was given as LogWorth, which is the negative log 10 of a raw p-value. Statistical analyses were performed with the program "R" available on the worldwide web at the website cran.r-project.org.
Random forests give an estimate of how well individuals can be classified in a new data set into each group, in contrast to a t-test, which tests whether the unknown means for two populations are different or not. Random forests create a set of classification trees based on continual sampling of the experimental units and compounds. Then each observation is classified based on the majority votes from all the classification trees. Statistical analyses were performed with the program "R" available on the worldwide web at the website cran.r-project.org.
Biomarkers:
As listed below in Tables 14, 15 and 16, biomarkers were discovered that were differentially present between samples from LDb (atherosclerotic) subjects and C57BL/6 (healthy) subjects.
Tables 14, 15 and 16 include, for each listed biomarker, the p-value and q-value determined in the statistical analysis of the data concerning the biomarkers and an indication of the percentage difference in the atherosclerotic mean level as compared to the healthy mean level in plasma (Table 14), aorta (Table 15) and liver (Table 16). The term "Isobar" as used in the tables indicates the compounds that could not be distinguished from each other on the analytical platform used in the analysis (i.e., the compounds in an isobar elute at nearly the same time and have similar (and sometimes exactly the same) quant ions, and thus cannot be distinguished). Comp_ID refers to the compound identification number used as a primary key for that compound in the in-house chemical database. Library indicates the chemical library that was used to identify the compounds. The number 50 refer to the GC library and the number 61 refers to the LC library.
TABLE-US-00015 TABLE 14 Metabolite biomarkers of Atherosclerosis in plasma. % Change COMP_ID COMPOUND LIB_ID p-value q-value in LDb 21415 Metabolite - 8209 50 4.25E-07 2.40E-06 497% 21012 Metabolite - 7889 50 1.12E-22 6.95E-21 494% 21011 Metabolite - 7888 50 8.87E-24 8.25E-22 482% 25649 Metabolite - 10450 50 4.17E-15 7.76E-14 442% 18619 Metabolite - 5669 61 5.95E-06 2.84E-05 423% 27279 Metabolite - 10511 50 1.81E-19 6.74E-18 404% 63 cholesterol 50 1.56E-24 2.90E-22 400% 8469 Metabolite - 2036-possible- 61 1.00E-04 4.00E-04 371% Heme 27278 Metabolite - 10510 50 5.00E-19 1.33E-17 351% 22993 Metabolite - 9448 50 4.73E-15 8.00E-14 350% 25366 Metabolite - 10286 61 1.65E-05 1.00E-04 339% 21631 Metabolite - 8403 50 9.85E-21 4.58E-19 306% 27414 beta-sitosterol 50 1.11E-12 1.29E-11 302% 21013 Metabolite - 7890 50 6.00E-14 7.73E-13 237% 12785 Metabolite - 3103 50 0.0011 0.0026 236% 16831 Metabolite - 4504 50 2.00E-04 5.00E-04 234% 18155 Metabolite - 5386 61 2.55E-05 1.00E-04 223% 8159 Metabolite - 1971 61 0.0026 0.0054 213% 27256 Metabolite - 10500 50 2.49E-19 7.72E-18 209% 21127 monopalmitin 50 6.23E-14 7.73E-13 204% 21184 1-oleoyl-rac-glycerol 50 6.14E-08 4.17E-07 196% 6380 Metabolite - 1330 61 0.0963 0.0914 177% 21188 1-stearoyl-rac-glycerol 50 5.43E-12 5.94E-11 177% 22032 Metabolite - 8766 50 1.79E-14 2.78E-13 163% 1561 alpha-tocopherol 50 4.00E-04 0.001 161% 6266 Metabolite - 1286 61 6.00E-04 0.0015 130% 19323 Docosahexaenoic-Acid 50 2.43E-17 5.65E-16 126% 27890 Metabolite - 10611 50 2.81E-09 2.26E-08 126% 6130 Metabolite - 1208 61 1.04E-05 4.62E-05 124% 6362 p-cresol-sulfate 61 2.77E-05 1.00E-04 123% 9172 Metabolite - 2000 61 1.43E-15 2.96E-14 121% 15991 L-alpha- 61 0.0014 0.0032 117% glycerophosphorylcholine 9905 Metabolite - 2231 61 1.00E-04 2.00E-04 116% 15611 Metabolite - 3971 61 3.71E-06 1.82E-05 115% 24205 Metabolite - 9841 61 1.98E-06 1.02E-05 111% 12604 Metabolite - 2981 50 6.77E-09 5.04E-08 111% 27888 Metabolite - 10609 50 0.0116 0.0181 110% 27728 glycerol-2-phosphate 50 8.04E-06 3.65E-05 107% 12035 nonanate 50 3.95E-05 2.00E-04 104% 17251 Metabolite - 4732 61 0.0089 0.0147 103% 23079 Metabolite - 9647 61 1.18E-05 1.00E-04 101% 1110 arachidonic acid 50 0.0015 0.0032 100% 15753 hippuric acid 61 1.00E-04 2.00E-04 97% 17800 cortodoxone 61 1.00E-04 4.00E-04 92% 27773 Isobar-71.sup.[1] 61 0.0301 0.0379 92% 1359 oleic acid 50 0.0669 0.0711 90% 1358 octadecanoic acid 50 4.62E-14 6.61E-13 88% 12774 Metabolite - 3094 50 2.92E-09 2.26E-08 86% 12767 Metabolite - 3087 50 0.007 0.0124 85% 24330 Metabolite - 10126 61 1.00E-09 8.46E-09 84% 21150 sinapic acid 61 1.10E-10 9.75E-10 84% 20136 Metabolite - 7062 61 3.65E-05 1.00E-04 80% 10782 Metabolite - 2486 61 0.0854 0.0837 80% 6171 Metabolite - 1244 61 0.003 0.0059 78% 16138 Metabolite - 4080 50 3.02E-07 1.76E-06 77% 21418 Isobar-56.sup.[2] 61 6.28E-08 4.17E-07 77% 1105 linoleic acid 50 3.36E-11 3.29E-10 75% 1336 n-hexadecanoic acid 50 3.99E-11 3.71E-10 73% 12112 Metabolite - 2314 61 1.47E-06 7.82E-06 72% 57 glutamic acid 50 0.0083 0.0141 71% 22586 Metabolite - 9039 61 1.00E-04 3.00E-04 70% 21828 Metabolite - 8574 61 0.0027 0.0055 68% 26444 Metabolite - 10465 61 2.89E-11 2.99E-10 66% 5475 Metabolite - 1033 61 1.01E-07 6.06E-07 63% 10700 Metabolite - 2393 61 0.0101 0.0162 61% 22259 Isobar-59 .sup.[3] 61 0.0013 0.003 58% 16992 Metabolite - 4603 61 0.0237 0.031 57% 18691 Metabolite - 5749 61 0.0854 0.0837 57% 19934 inositol 50 0.0067 0.012 55% 12609 Metabolite - 2986 50 0.0013 0.0029 55% 15365 sn-Glycerol-3-phosphate 50 8.00E-04 0.0018 53% 11499 Metabolite - 2753 61 0.0071 0.0125 51% 16074 Metabolite - 2758 50 6.00E-04 0.0016 49% 15670 2-methylhippuric acid 61 6.00E-04 0.0016 49% 8210 Metabolite - 1981 61 0.017 0.0238 47% 1121 heptadecanoic acid 50 8.42E-09 6.03E-08 46% 17488 Metabolite - 4887 61 2.00E-04 6.00E-04 45% 1493 ornithine 50 0.0482 0.0557 42% 6851 Metabolite - 1497 61 0.0676 0.0711 42% 22895 Metabolite - 9299 50 0.0133 0.0195 39% 13038 Metabolite - 3143 61 0.0117 0.0181 39% 5699 Metabolite - 1157 61 0.0036 0.0068 37% 18015 Metabolite - 3113 61 1.00E-04 4.00E-04 36% 24076 Metabolite - 9726 50 3.00E-04 0.001 36% 20031 Metabolite - 7007 61 0.0011 0.0026 36% 20488 D-glucose 50 2.00E-04 7.00E-04 34% 10401 Metabolite - 2058 61 0.0015 0.0032 34% 1507 palmitoleic acid 50 0.0168 0.0236 34% 1670 urea 50 4.00E-04 0.001 34% 15948 S-adenosyl-l-homocysteine 61 0.023 0.0303 33% 5465 Metabolite - 1029 61 8.00E-04 0.002 33% 2849 guanosine-5- 61 0.0418 0.0499 33% monophosphate 1494 5-oxoproline 50 0.0039 0.0073 32% 11923 Metabolite - 2821 61 0.0089 0.0147 32% 18969 Metabolite - 5920 61 0.0033 0.0063 32% 20830 Metabolite - 7762 61 0.056 0.0621 31% 2832 adenosine-5- 61 0.0137 0.0199 30% monophosphate 17083 Metabolite - 4634 50 0.0718 0.0742 28% 15996 aspartate 50 0.1053 0.0995 27% 14639 Metabolite - 3603 61 0.0225 0.0302 26% 25514 Metabolite - 10404 61 0.0747 0.0768 26% 17747 D-sphingosine 50 0.0239 0.0311 26% 27137 Metabolite - 10498 50 0.0511 0.0576 26% 30128 Metabolite - 10687 61 1.00E-04 4.00E-04 25% 16244 Isobar-21 .sup.[4] 61 0.0038 0.0072 25% 15053 sorbitol 50 0.0718 0.0742 25% 15122 glycerol 50 0.0019 0.004 25% 14387 Metabolite - 3490 61 0.0754 0.0771 23% 1642 decanoic acid 50 0.0455 0.0536 23% 20675 1,5-anhydro-D-glucitol 50 0.1081 0.1016 22% 11438 phosphate 50 0.0022 0.0045 21% 584 mannose 50 0.0128 0.0191 19% 2129 L-5-Hydroxytryptophan 61 0.0809 0.0806 19% 9491 Metabolite - 2185 61 0.0162 0.023 18% 605 uracil 50 0.0468 0.0544 18% 10655 Metabolite - 2388 61 0.0112 0.0177 18% 17665 p-hydroxybenzaldehyde 61 0.0121 0.0186 18% 10746 Isobar-6 .sup.[5] 61 0.0564 0.0621 16% 19372 Metabolite - 6269 50 0.0117 0.0181 16% 9216 Metabolite - 2168 61 0.0464 0.0543 15% 15113 Metabolite - 3783 61 0.0126 0.019 14% 27718 creatine 61 0.0245 0.0312 14% 1113 isocitrate 61 0.0132 0.0195 14% 18232 Metabolite - 5403 50 0.0493 0.0562 14% 10737 Isobar-1 .sup.[6] 61 0.0229 0.0303 13% 7175 Metabolite - 1655 61 0.0099 0.016 13% 19402 Metabolite - 6346 50 0.0411 0.0496 10% 15677 3-methyl-L-histidine 61 0.0795 0.0799 -8% 9324 Metabolite - 2173 61 0.0842 0.0834 -9% 54 tryptophan 61 0.0808 0.0806 -11% 17007 Metabolite - 4609 61 0.0957 0.0914 -11% 1574 histamine 61 0.0574 0.0629 -12% 5765 Metabolite - 1142 61 0.0951 0.0913 -14% 27672 3-indoxyl-sulfate 61 0.0514 0.0576 -15% 10667 Metabolite - 2389 61 0.0939 0.0906 -15% 15765 ethylmalonic acid 61 0.0241 0.0311 -17% 16705 Metabolite - 4428 61 0.0153 0.0219 -17% 15529 Metabolite - 3951 61 0.0125 0.019 -18% 11053 Metabolite - 2567 61 0.0053 0.0098 -18% 24213 Metabolite - 9845 61 0.0189 0.0261 -19% 20950 Metabolite - 7846 50 0.0915 0.0887 -19% 13065 Metabolite - 3146 61 0.0021 0.0045 -20% 1643 fumaric acid 50 0.0485 0.0558 -20% 1512 picolinic acid 50 0.0322 0.0396 -21% 24197 Metabolite - 9838 61 0.0675 0.0711 -22% 12724 Metabolite - 3057 61 0.0174 0.0241 -22% 27130 Metabolite - 10493 61 0.0087 0.0146 -22% 15676 3-methyl-2-oxovaleric acid 61 0.0716 0.0742 -23% 18871 Metabolite - 5848 61 0.0385 0.0468 -24% 13328 Metabolite - 3238 61 0.0194 0.0266 -24% 6253 Metabolite - 1283 61 0.0595 0.0644 -25% 10347 Metabolite - 2285 61 0.0015 0.0032 -25% 16712 Metabolite - 4432 61 0.0081 0.0139 -26% 14786 Metabolite - 3697 61 0.0795 0.0799 -27% 15683 4-methyl-2-oxopentanoate 61 0.0128 0.0191 -28% 8644 Metabolite - 2051 61 0.0413 0.0496 -28% 7650 Metabolite - 1834 61 7.29E-08 4.52E-07 -28% 6398 Metabolite - 1335 61 0.0617 0.0664 -29% 1412 2'-deoxyuridine 61 4.00E-04 0.001 -30% 19405 Metabolite - 6347 50 0.0877 0.0855 -31% 22130 DL-3-phenyllactic acid 61 0.0441 0.0522 -34% 26449 Metabolite - 10467 61 0.0777 0.079 -34% 25584 Metabolite - 10425 50 0.0078 0.0136 -34% 18929 Metabolite - 5907 50 0.0253 0.032 -35% 28059 Metabolite - 10650 50 1.00E-04 5.00E-04 -36% 5466 Metabolite - 1030 61 0.0098 0.016 -37% 20169 Metabolite - 7092 61 0.0582 0.0633 -37% 25459 Metabolite - 10395 50 0.0542 0.0604 -38% 17091 Metabolite - 4641 61 8.22E-07 4.50E-06 -38% 19968 Metabolite - 6930 50 0.0318 0.0395 -39% 11299 Metabolite - 2706 61 6.83E-08 4.38E-07 -39% 25505 Metabolite - 10402 61 4.00E-04 0.0012 -39% 16653 Metabolite - 4361 50 0.0032 0.0063 -41% 18968 Metabolite - 5919 61 4.00E-04 0.0011 -41% 11292 Metabolite - 2703 61 0.0059 0.0107 -41% 13534 Metabolite - 3320 61 0.0055 0.01 -43% 6297 Metabolite - 1304 61 0.0334 0.0409 -43% 19367 Metabolite - 6266 50 0.0035 0.0068 -44% 16071 Metabolite - 4020 50 1.00E-04 4.00E-04 -45% 24206 Metabolite - 9842 61 0.0142 0.0204 -47% 25602 Metabolite - 10432 50 8.00E-04 0.0018 -52% 25598 Metabolite - 10428 50 0.0665 0.0711 -58% 25597 Metabolite - 10427 50 0.0028 0.0056 -58% 25599 Metabolite - 10429 50 0.0319 0.0395 -59% 22548 Metabolite - 9026 50 0.0202 0.0274 -61% 19362 Metabolite - 6226 50 0.0243 0.0312 -65% 16650 Metabolite - 4360 50 0.008 0.0138 -66% 25538 Metabolite - 10415 61 0.0495 0.0562 -66% 25546 Metabolite - 10418 61 0.0018 0.0038 -73% 25527 Metabolite - 10410 61 2.00E-04 5.00E-04 -78% 22566 Metabolite - 9029 61 2.00E-04 6.00E-04 -80% 25529 Metabolite - 10411 61 3.00E-04 0.001 -81% 25517 Metabolite - 10406 61 6.00E-04 0.0016 -83% 10148 Metabolite - 2257 61 1.00E-04 5.00E-04 -84% 21651 Metabolite - 8410 61 6.66E-06 3.10E-05 -87% 25541 Metabolite - 10417 61 2.84E-05 1.00E-04 -91% 25539 Metabolite - 10416 61 3.59E-06 1.81E-05 -93% .sup.[1]Isobar-71 includes conduritol-beta-epoxide-3-deoxyglucosone .sup.[2]Isobar-56 includes DL-pipecolic acid-1-amino-1-cyclopentanecarboxylic acid .sup.[3] Isobar-59 includes N-6-trimethyl-L-lysine-H-homoarg-OH .sup.[4] Isobar-21-includes gamma-aminobutyryl-L-histidine-L-anserine .sup.[5] Isobar-6 includes valine-betaine .sup.[6] Isobar-1 includes mannose, fructose, glucose, galactose, alpha-L-sorbopyranose, Inositol, D-allose, D-altrose, D-psicone, L-gulose, allo-inositol
TABLE-US-00016 TABLE 15 Metabolite biomarkers of Atherosclerosis in aorta. % Change COMP_ID COMPOUND LIB_ID p-value q-value in LDb 63 cholesterol 50 7.16E-07 8.78E-06 569% 22993 Metabolite-9448 50 1.06E-05 1.00E-04 565% 10655 Metabolite-2388 61 2.34E-07 4.83E-06 287% 25548 Metabolite-10419 50 1.00E-04 3.00E-04 277% 22320 Metabolite-8889 50 0.0015 0.0018 244% 15991 L-alpha- 61 0.0174 0.0135 227% glycerophosphorylcholine 27256 Metabolite-10500 50 6.36E-07 8.78E-06 190% 19383 Metabolite-6286 50 6.00E-04 0.001 125% 9137 Metabolite-2141 61 0.0026 0.0028 121% 16028 Metabolite-3998 50 0.0012 0.0015 110% 10739 Metabolite-2407 61 0.0057 0.0053 94% 17987 Metabolite-5228 50 0.0087 0.0078 92% 22675 Metabolite-9126 61 9.00E-04 0.0013 89% 1481 inositol-l-phosphate 50 0.0149 0.0117 78% 30173 Metabolite-10701 61 0.002 0.0022 70% 12774 Metabolite-3094 50 0.0252 0.0186 66% 21421 Metabolite-8214 50 0.0482 0.0321 63% 22032 Metabolite-8766 50 0.0017 0.0019 62% 12604 Metabolite-2981 50 0.0027 0.0028 54% 16002 Metabolite-3992 [1] 61 1.71E-05 1.00E-04 37% 20360 Metabolite-7326 61 0.0352 0.0243 -14% 7601 Metabolite-1819 61 0.0351 0.0243 -14% 18829 phenylalanine 61 0.0303 0.0216 -16% 1604 uric acid 50 0.0331 0.0234 -17% 13505 Metabolite-3313 61 0.0337 0.0237 -17% 19787 Metabolite-6746 61 0.0143 0.0115 -18% 16235 Isobar-19.sup.[2] 61 0.0433 0.0292 -18% 10743 Isobar-4.sup.[3] 61 0.0428 0.0292 -18% 54 tryptophan 61 0.0217 0.0164 -19% 3147 xanthine 61 0.0234 0.0175 -19% 27570 Metabolite-10569 61 0.0177 0.0135 -20% 15529 Metabolite-3951 61 0.0468 0.0313 -20% 1125 isoleucine 50 0.0109 0.0092 -22% 1648 serine 50 0.0071 0.0065 -23% 605 uracil 50 0.0416 0.0286 -23% 7029 Metabolite-1597 61 0.0045 0.0043 -24% 1299 tyrosine 61 0.008 0.0073 -24% 1592 N-acetylneuraminic acid 61 0.0087 0.0078 -24% 1508 pantothenic acid 61 0.0105 0.0089 -24% 13810 Metabolite-3379 61 0.0146 0.0116 -24% 24076 Metabolite-9726 50 1.00E-04 3.00E-04 -26% 8336 Metabolite-2005 61 0.0019 0.0021 -26% 22258 Isobar-58.sup.[4] 61 0.0292 0.0211 -26% 60 leucine 50 0.0045 0.0043 -28% 30128 Metabolite-10687 61 0.0114 0.0095 -28% 17048 Metabolite-4617 61 0.0014 0.0017 -29% 17960 Metabolite-5207 50 0.0015 0.0018 -29% 15677 3-methyl-L-histidine 61 5.00E-04 0.001 -30% 1431 (p-Hydroxyphenyl)lactic acid 50 0.001 0.0013 -30% 1649 valine 50 0.0039 0.004 -30% 1898 proline 50 0.0042 0.0042 -30% 1284 threonine 50 0.0047 0.0045 -31% 15948 S-adenosyl-l-homocysteine 61 0.0101 0.0088 -31% 26456 Metabolite-10470 61 0.0134 0.011 -31% 1302 methionine 61 0.0161 0.0125 -31% 22185 n-acetyl-l-aspartic acid 61 9.00E-04 0.0013 -32% 1414 3-phospho-d-glycerate 61 0.002 0.0022 -32% 1643 fumaric acid 50 0.0042 0.0042 -33% 10890 Metabolite-2554 61 0.0029 0.003 -34% 10746 Isobar-6.sup.[5] 61 0.0283 0.0208 -35% 15253 Metabolite-3832-possible- 61 0.0292 0.0211 -35% phenol-sulfate 5821 3-phospho-l-serine 61 7.00E-04 0.0012 -36% 12102 o-phosphoethanolamine 50 0.0014 0.0018 -36% 8404 Metabolite-2027 61 0.0019 0.0021 -36% 1123 inosine 61 2.00E-04 5.00E-04 -37% 3127 hypoxanthine 61 8.00E-04 0.0012 -37% 6771 Metabolite-1460 61 0.0015 0.0018 -37% 14311 Metabolite-3481 61 0.0198 0.015 -37% 16233 Isobar-13.sup.[6] 61 6.00E-04 0.001 -38% 11222 Metabolite-2688 61 5.00E-04 0.001 -38% 1638 arginine 61 8.00E-04 0.0012 -38% 15497 arginino-succinate 61 0.0012 0.0015 -38% 15506 choline 61 2.00E-04 5.00E-04 -39% 16705 Metabolite-4428 61 0.0012 0.0016 -39% 8991 Metabolite-2105 61 0.0096 0.0085 -39% 514 cytidine 61 5.00E-04 9.00E-04 -40% 13018 Metabolite-3138 61 5.00E-04 0.001 -40% 527 lactate 50 7.00E-04 0.0012 -40% 23051 Metabolite-9566 61 0.001 0.0014 -40% 28131 Metabolite-10670 61 4.00E-04 8.00E-04 -41% 1494 5-oxoproline 50 9.00E-04 0.0013 -41% 606 uridine 61 5.00E-04 0.001 -42% 18374 methionine-sulfoxide 61 1.00E-04 4.00E-04 -43% 57 glutamic acid 50 6.00E-04 0.001 -44% 15996 aspartate 50 8.00E-04 0.0012 -44% 20489 D-glucose 50 0.0051 0.0048 -44% 18348 3-hydroxy-3methylglutaryl- 61 0.01 0.0087 -44% coenzyme-A 27718 creatine 61 2.00E-04 5.00E-04 -45% 1303 malic acid 61 7.00E-04 0.0011 -45% 1412 2'-deoxyuridine 61 1.02E-06 1.09E-05 -46% 21430 Metabolite-8266 61 2.00E-04 6.00E-04 -47% 11544 Metabolite-2766 61 0.0013 0.0016 -47% 19372 Metabolite-6269 50 0.0027 0.0028 -47% 22145 acetyl-L-carnitine 61 2.00E-04 5.00E-04 -48% 10737 Isobar-1.sup.[7] 61 3.00E-04 6.00E-04 -48% 14247 Metabolite-3475 61 0.0146 0.0116 -48% 19110 Metabolite-5978 50 3.00E-04 7.00E-04 -49% 22730 Metabolite-9186 61 8.00E-04 0.0012 -49% 11777 glycine 50 5.00E-04 0.001 -50% 16228 Isobar-22.sup.[8] 61 1.00E-04 3.00E-04 -51% 16843 Metabolite-4510 50 1.00E-04 3.00E-04 -51% 53 glutamine 50 2.00E-04 6.00E-04 -51% 19708 Metabolite-6711 61 0.0124 0.0103 -51% 1416 GABA 50 1.38E-08 1.18E-06 -52% 15500 carnitine 61 5.00E-04 9.00E-04 -52% 2125 taurine 61 0.0017 0.002 -52% 22475 Metabolite-8986 61 0.0044 0.0043 -52% 28059 Metabolite-10650 50 1.87E-05 1.00E-04 -54% 20361 Metabolite-7327 61 3.32E-05 2.00E-04 -54% 17971 Metabolite-5210 50 1.00E-04 3.00E-04 -54% 22494 Metabolite-8994 50 4.00E-04 9.00E-04 -54% 7650 Metabolite-1834 61 2.06E-07 4.83E-06 -55% 27738 threonic acid 50 1.00E-04 3.00E-04 -55% 27678 Metabolite-10584 50 3.00E-04 7.00E-04 -55% 12459 Isobar-10.sup.[9] 61 3.43E-05 2.00E-04 -56% 15125 (2-Aminoethyl)phosphonate 61 1.00E-04 3.00E-04 -56% 19934 inositol 50 3.00E-04 7.00E-04 -56% 16860 Metabolite-4517 50 1.00E-04 3.00E-04 -57% 17064 Metabolite-4624 50 1.00E-04 4.00E-04 -57% 1107 allantoin 50 5.00E-04 0.001 -57% 1573 guanosine 61 4.00E-06 3.69E-05 -58% 1670 urea 50 1.00E-04 3.00E-04 -58% 27727 glutathione-oxidized 61 1.00E-04 4.00E-04 -61% 1519 sucrose 50 0.0104 0.0089 -62% 22702 Metabolite-9127 61 4.30E-06 3.69E-05 -63% 15336 tartaric acid 61 6.92E-08 2.97E-06 -66% 6172 Metabolite-1245 61 2.82E-07 4.83E-06 -70% 17975 Metabolite-5211 50 1.04E-05 1.00E-04 -70% 27773 Isobar-71.sup.[10] 61 3.00E-04 7.00E-04 -71% [1] Possibly Cl-adduct of Formate dimmer .sup.[2]Isobar-19 includes 1,5-anhydro-D-glucitol, 2'-deoxy-D-galactose, 2'-deoxy-D-glucose, L-fucose, L-rhamnose .sup.[3]Isobar-4 includes Gluconic acid, DL-arabinose, D-ribose, L-xylose, DL-lyxose, D-xylulose, galactonic acid .sup.[4]Isobar-58 includes bicine, 2-methylaminomethyl-tartronic acid .sup.[5]Isobar-6 includes valine-betaine .sup.[6]Isobar-13 includes 5-keto-D-gluconic acid, 2-keto-L-gulonic acid, D-glucuronic acid, D-galacturonic acid .sup.[7]Isobar-1 includes mannose, fructose, glucose, galactose, alpha-L-sorbopyranose, Inositol, D-allose, D-altrose, D-psicone, L-gulose, allo-inositol .sup.[8]Isobar-22-includes-glutamic acid-O-acetyl-L-serine .sup.[9]Isobar-10-includes-glutamine-H-beta-ala-gly-OH-1-methylguanine-H-G- ly-Sar-OH-lysine .sup.[10]Isobar-71includes conduritol-beta-epoxide-3-deoxyglucosone
TABLE-US-00017 TABLE 16 Metabolite biomarkers of Atherosclerosis in liver. % Change COMP_ID COMPOUND LIB_ID p-value q-value in LDb 19788 Metabolite-6747 61 6.49E-06 0.001 895% 1564 citric acid 50 0.0069 0.0454 399% 9117 Metabolite-2135 61 0.0173 0.0851 206% 25626 Metabolite-10443 61 0.021 0.0964 180% 19597 Metabolite-6648 50 0.0055 0.0452 162% 15685 5-hydroxylysine 61 0.0049 0.0452 159% 16655 Metabolite-4362 50 0.0064 0.0454 131% 21418 Isobar-56.sup.[1] 61 1.36E-05 0.0011 129% 22475 Metabolite-8986 61 0.0012 0.0191 129% 15803 maltose 50 0.0224 0.0992 128% 18344 D-xyulose 50 1.00E-04 0.0071 126% 27678 Metabolite-10584 50 0.0083 0.049 126% 22020 Metabolite-8749 50 6.00E-04 0.0168 124% 30204 Metabolite-10713 61 0.0138 0.0703 122% 30203 Metabolite-10712 61 9.00E-04 0.0186 113% 15053 sorbitol 50 0.0048 0.0452 105% 1640 ascorbic acid 50 0.0032 0.0375 104% 19753 Metabolite-6718 61 0.0073 0.046 97% 21650 Metabolite-8409 61 0.0185 0.0866 91% 1516 sarcosine 50 0.0124 0.0659 85% 22309 Metabolite-8887 61 0.001 0.0191 85% 27299 Metabolite-10520 61 4.00E-04 0.0136 83% 1118 eicosanoic acid 50 0.0015 0.0191 78% 25429 Metabolite-10369 50 0.0045 0.0452 72% 8669 Metabolite-2055 61 0.0087 0.0498 69% 8210 Metabolite-1981 61 0.023 0.0992 65% 20488 D-glucose 50 0.0073 0.046 55% 15606 Metabolite-3968 61 0.0069 0.0454 51% 11379 Metabolite-2725 61 0.0224 0.0992 50% 11484 Metabolite-2752 61 7.00E-04 0.0168 50% 11292 Metabolite-2703 61 0.0133 0.0694 49% 8457 Metabolite-2035 [2] 61 0.0066 0.0454 47% 16859 Metabolite-4516 50 0.0066 0.0454 44% 554 adenine 50 0.0076 0.0463 44% 7081 Metabolite-1609 61 0.0039 0.0412 41% 20795 Metabolite-7747 61 0.0033 0.0375 40% 16229 Isobar-24.sup.[3] 61 0.0055 0.0452 39% 18388 Metabolite-5491 50 0.0057 0.0452 39% 24360 Metabolite-10206 50 0.0178 0.086 38% 12080 D-ribose 50 0.0104 0.0575 37% 22993 Metabolite-9448 50 0.0156 0.0782 36% 10737 Isobar-1.sup.[4] 61 0.0084 0.049 36% 16060 Metabolite-4014 50 0.0181 0.0862 36% 24285 Metabolite-10026 61 0.0229 0.0992 23% 63 cholesterol 50 0.0104 0.0575 15% 22414 Metabolite-8933 61 0.0037 0.0406 -29% 1827 riboflavine 61 0.0052 0.0452 -29% 22320 Metabolite-8889 50 0.0056 0.0452 -29% 9002 Metabolite-2107 61 0.0012 0.0191 -31% 3138 pyridoxamine-phosphate 61 0.0054 0.0452 -34% 15964 D-arabitol 50 2.00E-04 0.0098 -34% 7432 Metabolite-1735 61 0.0014 0.0191 -35% 22185 n-acetyl-l-aspartic acid 61 0.0068 0.0454 -36% 23024 Metabolite-9458 61 0.0011 0.0191 -37% 21296 glucosamine-6-sulfate 61 0.0014 0.0191 -39% 7650 Metabolite-1834 61 7.40E-06 0.001 -41% 9468 Metabolite-2183 61 8.00E-04 0.0182 -46% 6530 Metabolite-1384 61 0.0115 0.0621 -57% 25561 Metabolite-10421 61 0.0069 0.0454 -58% 597 phosphoenolpyruvate 61 0.0014 0.0191 -59% 1414 3-phospho-d-glycerate 50 1.57E-05 0.0011 -60% 10148 Metabolite-2257 61 0.003 0.037 -68% 27794 Metabolite-10587 61 4.00E-04 0.0127 -69% 6146 alpha-amino-adipate 50 2.00E-04 0.0098 -73% .sup.[1]Isobar-56 includes DL-pipecolic acid-1-amino-1-cyclopentanecarboxylic acid [2] Possible 5-methyl-deoxycytidine-monophosphate .sup.[3]Isobar-24 includes L-arabitol, adonitol, xylitol .sup.[4]Isobar-1 includes mannose, fructose, glucose, galactose, alpha-L-sorbopyranose, Inositol, D-allose, D-altrose, D-psicone, L-gulose, allo-inositol
Identification of plasma biomarkers indicative of initiation and/or progression of atherosclerosis would help diagnosis and treatment of human patients with this disease. Recursive partitioning of plasma metabolites identified cholesterol as a biomarker that could differentiate the LDb and C57BL/6 mice perfectly, as expected. Three other metabolites were also identified by recursive partitioning to differentiate the LDb and C57BL/6 mice (Table 17). Plasma levels of these metabolites, like plasma cholesterol, were higher in LDb mice even at 2 months of age and remained consistently higher during the following 6 months, suggesting that earlier buildup of these metabolites is likely involved in the development of atherosclerosis and provide biomarkers for progression (FIGS. 13, 14, 15, and 16).
TABLE-US-00018 TABLE 17 Atherosclerosis biomarkers in plasma that differentiate Atherosclerosis subjects (LDb) and healthy control subjects (C57BL/6 mice) without error. Atherosclerosis Cmpd_ID Compound level Control level R-Square LogWorth 19323 Docosahexaenoic- .gtoreq.528666 <528666 1.000 21.11 Acid 21011 Metabolite-7888 .gtoreq.2523794 <2523794 1.000 21.11 21631 Metabolite-8403 .gtoreq.238349 <238349 1.000 21.11
Metabolite-1834 did not segregate LDb and C57BL/6 groups in 2-month-old mice, but started to segregate the 5-month-olds and segregated 8-month-old mice perfectly (FIG. 17). This metabolite is one of the biomarkers for atherosclerosis progression.
Several metabolites (p-cresol-sulfate, Metabolite-4887, Metabolite-5386) classified subjects as LDb or C57BL/6 very well in 2-month-old mice, but the power of differentiation diminished as the mice aged, with no segregation in 8-month-old mice (FIGS. 18 and 19). These metabolites are biomarkers for atherosclerosis initiation.
Random forest results show that the samples can be classified correctly with varying degrees of accuracy using the biomarkers. The confusion matrices demonstrate that LDb subjects can be distinguished from C57BL/6 subjects using plasma (Table 18), aorta (Table 19) and liver (Table 20) samples. The "Out-of-Bag" (OOB) Error rate gives an estimate of how accurately new observations can be predicted using the random forest model (e.g., whether a sample is from a subject having atherosclerosis or a control subject).
TABLE-US-00019 TABLE 18 Random Forest Confusion Matrices for Atherosclerosis in Plasma Plasma Control Atherosclerosis Error Age Collected: 2 months Control 10 0 0 Atherosclerosis 0 10 0 OOB Error 0 0% Age Collected: 5 months Control 10 0 0 Atherosclerosis 2 9 0 OOB Error 0 0% Age Collected: 8 months Control 8 0 0 Atherosclerosis 0 8 0 OOB Error 0 0% ALL Control 28 0 0 Atherosclerosis 0 27 0 OOB Error 0 0%
TABLE-US-00020 TABLE 19 Random Forest Confusion Matrices for Atherosclerosis in Aorta Tissues Aorta Tissue Control Atherosclerosis Error Age Collected: 2 months Control 6 1 0.14 Atherosclerosis 2 2 0.5 OOB Error 3/11 = 0.27 27% Age Collected: 5 months Control 7 0 0 Atherosclerosis 2 4 0.33 OOB Error 2/13 = 0.15 15% Age Collected: 8 months Control 6 0 0 Atherosclerosis 0 4 0 OOB Error 0/10 = 0.00 0% ALL Control 18 2 0.1 Atherosclerosis 3 11 0.21 OOB Error 5/34 = 0.15 15%
TABLE-US-00021 TABLE 20 Random Forest Confusion Matrices for Atherosclerosis in Liver Liver Control Atherosclerosis Error Age Collected: 2 months Control 7 1 0.13 Atherosclerosis 1 3 0.25 OOB Error 2/12 = 0.17 17% Age Collected: 5 months Control 3 1 0.25 Atherosclerosis 3 3 0.5 OOB Error 4/10 = 0.4 40% Age Collected: 8 months Control 5 0 0 Atherosclerosis 1 5 0.17 OOB Error 1/11 = 0.09 9% ALL Control 15 2 0.12 Atherosclerosis 3 13 0.19 OOB Error 5/33 = 0.15 15%
In addition, a study was carried out on human subjects suffering from atherosclerosis (n=15) or healthy subjects (n=14). The biomarkers 3-methylhistidine, p-cresol sulfate, mannose, glucose, and gluconate showed the same alterations in human plasma from disease vs. healthy subjects as seen in the mouse model. Thus, these compounds were identified as important biomarkers useful to distinguish individuals with atherosclerosis from healthy subjects.
3C: Biomarkers of Cardiomyopathy
Biomarkers were discovered by (1) analyzing cardiac tissue samples (Table 21) or plasma samples (Table 22) from different groups of mouse subjects to determine the levels of metabolites in the samples and then (2) statistically analyzing the results to determine those metabolites that were differentially present in the two groups. These subjects provide an animal (mouse) model for human DCM.
Two groups of subjects were used. One group consisted of eight subjects exhibiting cardiac dilatation and depressed left ventricular systolic function (ejection fraction of less than 0.40), as determined by echocardiography (cTnT-W141 transgenic mice). Thirteen age- and gender-matched subjects (non-transgenic (wild-type background strain) mice) served as controls. All mice were 7-19 months old and weighed 23-40 gm.
T-tests were used to determine differences in the mean levels of metabolites between the two populations (i.e., Dilated Cardiomyopathy, DCM vs. Healthy control). Classification analysis was carried out using recursive partitioning and random forest analyses to uncover the biomarkers that can best differentiate the two groups. Recursive partitioning relates a `dependent` variable (Y) to a collection of independent (`predictor`) variables (X) in order to uncover--or simply understand--the elusive relationship, Y=f(X). It was performed with the JMP program (SAS) to generate a decision tree. The statistical significance of the "split" of the data can be placed on a more quantitative footing by computing p-values, which discern the quality of a split relative to a random event. The significance level of each "split" of data into the nodes or branches of the tree was computed as p-values, which discern the quality of the split relative to a random event. It was given as LogWorth, which is the negative log 10 of a raw p-value.
Biomarkers:
As listed below in Tables 21 and 22, biomarkers were discovered that were differentially present between cardiac tissue and plasma samples, respectively, collected from dilated cardiomyopathy subjects and healthy subjects.
Tables 21 and 22 include, for each listed biomarker, the p-value and q-value determined in the statistical analysis of the data concerning the biomarkers and an indication of the percentage difference in the dilated cardiomyopathy mean level as compared to the healthy mean level in cardiac tissue (Table 21) or plasma (Table 22). The term "Isobar" as used in the tables indicates the compounds that could not be distinguished from each other on the analytical platform used in the analysis (i.e., the compounds in an isobar elute at nearly the same time and have similar (and sometimes exactly the same) quant ions, and thus cannot be distinguished). Comp_ID refers to the compound identification number used as a primary key for that compound in the in-house chemical database. Library indicates the chemical library that was used to identify the compounds. The number 50 refer to the GC library and the number 61 refers to the LC library.
TABLE-US-00022 TABLE 21 Metabolite biomarkers of dilated cardiomyopathy (DCM) in cardiac tissues. % Change COMP_ID COMPOUND LIB_ID p-value q-value in DCM 22185 n-acetyl-l-aspartic acid 61 0.0044 0.0144 100% 15996 aspartate 50 0.0002 0.0022 64% 1414 3-phospho-d-glycerate 50 0.0742 0.0888 52% 1898 proline 61 3.64E-05 0.0007 52% 1648 serine 50 0.0009 0.0057 49% 1299 tyrosine 61 3.36E-05 0.0007 39% 1284 threonine 50 0.0054 0.0173 28% 54 tryptophan 61 0.0383 0.0571 20% 1649 valine 50 0.0081 0.0227 19% 1125 isoleucine 50 0.0041 0.014 16% 11777 glycine 50 0.0109 0.0255 15% 13179 creatine 61 0.0011 0.0061 -17% 590 hypotaurine 61 0.0728 0.0879 -21% 5278 beta-nicotinamide adenine 61 0.0092 0.0239 -27% dinucleotide 15500 carnitine 61 0.0331 0.0509 -32% 2127 glutathione, reduced 61 0.0033 0.0125 -62% 12080 D-ribose 50 0.0033 0.0125 39% 15122 glycerol 50 0.0663 0.0819 -16% 19934 inositol 50 0.0225 0.0417 -22% 18882 taurodeoxycholic acid 61 0.0584 0.0754 72% 15365 sn-Glycerol 3-phosphate 50 0.0109 0.0255 41% 63 cholesterol 50 0.011 0.0255 14% 1121 heptadecanoic acid 50 0.0594 0.0761 -15% 21127 monopalmitin 50 0.0149 0.0324 -23% 1336 n-hexadecanoic acid 50 0.0014 0.0072 -24% 19323 docosahexaenoic acid 50 0.0009 0.0057 -24% 1600 o-phosphoethanolamine 50 0.0253 0.0435 -30% 1365 tetradecanoic acid 50 0.0516 0.0691 -31% 1570 oleic acid 50 0.0269 0.0446 -31% 1105 linoleic acid 50 0.0014 0.0072 -32% 1518 squalene 50 0.0013 0.0072 -43% 15504 phosphopantheine 61 0.0186 0.0367 -49% 1827 riboflavine 61 0.0037 0.0129 85% 594 niacinamide 50 0.0091 0.0239 -17% 3138 pyridoxamine phosphate 61 0.0047 0.0153 -19% 1508 pantothenic acid 61 0.0093 0.0239 -32% 3127 hypoxanthine 50 0.0112 0.0255 92% 606 uridine 61 0.0262 0.0445 56% 1107 allantoin 50 0.0207 0.0398 39% 514 cytidine 61 0.0034 0.0126 33% 1573 guanosine 61 0.0326 0.0507 32% 605 uracil 50 0.0291 0.0457 27% 21031 hydroxyurea 61 0.0069 0.0204 -47% 2856 uridine 5'-monophosphate 61 0.0005 0.004 -68% 18360 adenylosuccinic acid 61 9.02E-06 0.0004 -85% 555 adenosine 61 0.0007 0.0051 -87% 2832 adenosine 5'-monophosphate 61 4.53E-06 0.0004 -90% 2849 guanosine 5'-monophosphate 61 2.06E-05 0.0006 -94% 20701 malitol 50 0.0167 0.0343 -32% 8469 Metabolite-2036 61 0.0144 0.0319 525% 10781 Metabolite-2469 61 0.007 0.0204 355% 10604 Metabolite-2370 61 0.0089 0.0239 213% 10401 Metabolite-2058 61 0.0006 0.0048 203% 5597 Metabolite-1073 61 0.0178 0.0357 203% 14639 Metabolite-3603 61 5.89E-05 0.001 194% 16019 Metabolite-3995 61 0.0001 0.0017 156% 22480 Metabolite-8987 50 1.78E-05 0.0006 150% 6130 Metabolite-1208 61 0.0277 0.0454 144% 9137 Metabolite-2141 61 0.0174 0.0353 127% 21418 Isobar-56.sup.[1] 61 0.0015 0.0072 122% 18015 Metabolite-3113 61 0.0015 0.0072 122% 22414 Metabolite-8933 61 0.0003 0.0028 108% 6122 Metabolite-1206[2] 61 0.0414 0.058 104% 9024 Metabolite-2111 61 0.0241 0.0432 104% 18073 Metabolite-5270 61 0.0159 0.0337 92% 12711 Metabolite-3053 61 0.0574 0.0752 89% 13512 Metabolite-3315 61 0.028 0.0454 89% 16471 Metabolite-4238 61 0.046 0.0627 89% 5618 Metabolite-1085[3] 61 0.0371 0.0558 85% 7654 Metabolite-1836 61 0.002 0.0085 82% 16860 Metabolite-4517 50 0.0027 0.011 79% 14715 Metabolite-3653[4] 61 0.0037 0.0129 72% 21410 Isobar-52.sup.[5] 61 0.0018 0.008 69% 17885 Metabolite-5147 61 0.0155 0.0332 56% 22494 Metabolite-8994 50 0.0003 0.003 56% 10850 Metabolite-2548[6] 61 0.0668 0.0819 52% 15213 Metabolite-3808 61 5.92E-06 0.0004 52% 21415 Metabolite-8209 50 0.011 0.0255 52% 6266 Metabolite-1286 61 9.64E-05 0.0013 49% 7127 Metabolite-1616 61 0.0019 0.0084 49% 7272 Metabolite-1679 61 0.0562 0.0746 45% 8509 Metabolite-2041 61 0.0104 0.0255 45% 9313 Metabolite-2172 61 0.0246 0.0432 45% 9905 Metabolite-2231 61 0.0167 0.0343 43% 16071 Metabolite-4020 50 0.002 0.0085 41% 22441 Metabolite-8950 61 0.0798 0.0925 39% 19273 Metabolite-6108 61 0.0405 0.058 37% 16233 Isobar-13.sup.[7] 61 0.0126 0.0282 33% 9324 Metabolite-2173 61 0.0577 0.0752 33% 19787 Metabolite-6746 61 0.0244 0.0432 30% 20299 Metabolite-7266 50 0.0212 0.0402 30% 9122 Metabolite-2137 61 0.0836 0.0961 28% 21404 Isobar-48.sup.[8] 61 0.0487 0.0658 27% 21011 Metabolite-7888 50 0.0031 0.012 27% 13142 Metabolite-3165 61 0.0412 0.058 18% 19372 Metabolite-6269 50 0.0192 0.0374 16% 16285 Metabolite-2798 50 0.045 0.062 15% 13505 Metabolite-3313 61 0.0338 0.0514 11% 17064 Metabolite-4624 50 0.0619 0.0779 -15% 19599 Metabolite-6649 50 0.0287 0.0457 -18% 16074 Metabolite-2758 50 0.0417 0.058 -19% 20361 Metabolite-7327 61 0.0008 0.0056 -20% 7081 Metabolite-1609 61 0.0604 0.0767 -21% 17919 Metabolite-5187 61 0.0072 0.0208 -22% 17978 Metabolite-5213 50 0.0689 0.0838 -23% 18273 Metabolite-5420 50 0.0784 0.0916 -23% 16984 Metabolite-4599 50 0.0624 0.0779 -24% 11545 Metabolite-2767 61 0.0412 0.058 -25% 22509 Metabolite-9011 61 0.0063 0.0191 -29% 12856 Metabolite-3123 61 0.0768 0.0904 -32% 16060 Metabolite-4014 50 0.0253 0.0435 -32% 16843 Metabolite-4510 50 0.0289 0.0457 -34% 17960 Metabolite-5207 50 0.0003 0.003 -35% 16116 Metabolite-4051 50 0.0226 0.0417 -36% 14595 Metabolite-3576 61 0.0106 0.0255 -36% 8176 Metabolite-1974 61 0.0008 0.0056 -37% 15085 Metabolite-3776 61 0.0093 0.0239 -39% 16705 Metabolite-4428 61 0.0059 0.0182 -40% 19505 Metabolite-6547 61 0.0267 0.0446 -41% 11056 Metabolite-2568 61 0.075 0.0891 -43% 22507 Metabolite-9010 50 0.0396 0.0578 -46% 9130 Metabolite-2139 61 0.001 0.006 -48% 22381 Metabolite-8908 61 0.0389 0.0574 -50% 18702 Metabolite-5767 61 0.0234 0.0428 -56% 11379 Metabolite-2725 61 6.71E-05 0.001 -69% 22501 Metabolite-9007 61 0.0007 0.0052 -79% 22534 Metabolite-9016 61 2.36E-05 0.0006 -86% .sup.[1]Isobar-56 includes DL-pipecolic acid, 1-amino-1-cyclopentanecarboxylic acid. [2]Possible methyltestosterone and others. [3]Possible isolobinine or 4-aminoestra-1,3,5(10)-triene-3,17beta-diol. [4]Possible stachydrine. .sup.[5]Isobar-52 includes iminodiacetic acid, L-aspartic acid. [6]Possible Cl adduct of uric acid. .sup.[7]Isobar 13 includes 5-keto-D-gluconic acid, 2-keto-L-gulonic acid, D-glucuronic acid, D(+)-galacturonic acid. .sup.[8]Isobar 48 includes Serine-2,2-amino-2-methyl-1,3-propanediol, diethanolamine.
TABLE-US-00023 TABLE 22 Metabolite biomarkers of dilated cardiomyopathy (DCM) in plasma. % Change COMP_ID COMPOUND LIB_ID p-value q-value in DCM TG/NTG 17007 Metabolite-4609 61 0.0003 0.0895 83% 1.83 1299 tyrosine 61 0.0005 0.0895 83% 1.83 20161 Metabolite-7088 61 0.0008 0.0895 239% 3.39 19787 Metabolite-6746 61 0.0010 0.0895 62% 1.62 20699 meso-erythritol 50 0.0013 0.0895 46% 1.46 18968 Metabolite-5919 61 0.0014 0.0895 100% 2.00 1107 allantoin 50 0.0017 0.0901 54% 1.54 1431 (p-Hydroxyphenyl)lactic acid 61 0.0028 0.1283 114% 2.14 584 mannose 50 0.0034 0.1411 -41% 0.59 15632 Metabolite-3980 61 0.0054 0.1997 64% 1.64 396 glutarate 61 0.0069 0.2328 181% 2.81 11292 Metabolite-2703 61 0.0080 0.2473 124% 2.24 18829 phenylalanine 61 0.0098 0.2547 39% 1.39 15286 Metabolite-3848 61 0.0103 0.2547 92% 1.92 13575 Metabolite-3324 61 0.0112 0.2547 250% 3.50 14786 Metabolite-3697 61 0.0121 0.2547 52% 1.52 22597 Metabolite-9041 61 0.0130 0.2547 -70% 0.30 15611 Metabolite-3971 61 0.0132 0.2547 66% 1.66 11813 Metabolite-2809 61 0.0137 0.2547 -28% 0.72 6571 Metabolite-1397 61 0.0139 0.2547 75% 1.75 21418 Isobar 56 includes DL- 61 0.0151 0.2547 38% 1.38 pipecolic acid, 1-amino-1- cyclopentanecarboxylic acid 11299 Metabolite-2706 61 0.0159 0.2547 65% 1.65 6305 Metabolite-A-1254 61 0.0163 0.2547 64% 1.64 19857 Metabolite-6783 61 0.0165 0.2547 135% 2.35 21044 (s)-2-hydroxybutyric acid 50 0.0186 0.2722 105% 2.05 16016 Metabolite-3994 61 0.0209 0.2722 92% 1.92 5440 Metabolite-A-1014 61 0.0221 0.2722 41% 1.41 22555 Metabolite-9027 50 0.0223 0.2722 -53% 0.47 10737 Isobar 1 includes mannose, 61 0.0227 0.2722 -33% 0.67 fructose, glucose, galactose, alpha-L-sorbopyranose, Inositol, D-allose, D-(+)- altrose, D-psicone, L-(+)- gulose, allo-inositol 20830 Metabolite-7762 61 0.0231 0.2722 48% 1.48 14961 Metabolite-3752 61 0.0234 0.2722 -46% 0.54 15670 2-methylhippuric acid 61 0.0234 0.2722 53% 1.53 13142 Metabolite-3165 61 0.0285 0.3038 37% 1.37 605 uracil 50 0.0286 0.3038 217% 3.17 21011 Metabolite-7888 50 0.0298 0.3038 37% 1.37 8959 Metabolite-2100 61 0.0305 0.3038 -29% 0.71 20169 Metabolite-7092 61 0.0320 0.3038 88% 1.88 5776 Metabolite-A-1194 61 0.0322 0.3038 89% 1.89 6126 Metabolite-1207 61 0.0326 0.3038 52% 1.52 12459 Isobar 10 includes glutamine, 61 0.0327 0.3038 -31% 0.69 H-beta-ala-gly-OH, 1- methylguanine, H-Gly-Sar- OH lysine 3155 3-ureidopropionic acid 61 0.0351 0.3093 60% 1.60 15541 Metabolite-3957 61 0.0360 0.3093 43% 1.43 1303 malic acid 50 0.0388 0.3093 108% 2.08 15737 hydroxyacetic acid 50 0.0392 0.3093 38% 1.38 527 lactate 50 0.0399 0.3093 65% 1.65 1670 urea 50 0.0410 0.3093 23% 1.23 15949 2'-deoxycytidine 61 0.0413 0.3093 24% 1.24 7272 Metabolite-1679 61 0.0415 0.3093 251% 3.51 12011 Metabolite-2848 61 0.0425 0.3093 53% 1.53 1643 fumaric acid 50 0.0437 0.3093 70% 1.70 1574 histamine 61 0.0452 0.3093 74% 1.74 22566 Metabolite-9029 61 0.0458 0.3093 -63% 0.37 15140 L-kynurenine 61 0.0458 0.3093 49% 1.49 22026 1-methylguanidine 50 0.0462 0.3093 19% 1.19 hydrochloride 7127 Metabolite-1616 61 0.0473 0.3093 -38% 0.62 1604 uric acid 50 0.0478 0.3093 146% 2.46 7429 Metabolite-1733 61 0.0492 0.3093 37% 1.37 12626 Metabolite-3003 50 0.0500 0.3093 51% 1.51 2849 guanosine 5'-monophosphate 61 0.0509 0.3093 -58% 0.42 16327 Metabolite-4161 61 0.0514 0.3093 35% 1.35 14715 Metabolite-3653-Possible 61 0.0521 0.3093 29% 1.29 stachydrine 1507 palmitoleic acid 50 0.0522 0.3093 -54% 0.46 9491 Metabolite-2185 61 0.0525 0.3093 97% 1.97 2734 gamma-L-glutamyl-L- 61 0.0541 0.3112 34% 1.34 tyrosine 11235 Metabolite-2690 61 0.0548 0.3112 -34% 0.66 13775 Metabolite-3370 61 0.0561 0.3112 38% 1.38 17960 Metabolite-5207 50 0.0569 0.3112 -32% 0.68 1587 N-acetyl-L-leucine 61 0.0577 0.3112 75% 1.75 20798 Metabolite-7748 61 0.0581 0.3112 -41% 0.59 2832 adenosine 5'-monophosphate 61 0.0589 0.3112 -80% 0.20 19294 Metabolite-6134 61 0.0596 0.3112 31% 1.31 15278 Metabolite-3843 61 0.0603 0.3112 -31% 0.69 15255 Metabolite-3833 61 0.0614 0.3127 74% 1.74 16468 Metabolite-4236 61 0.0644 0.3224 -31% 0.69 10309 Metabolite-2277 61 0.0651 0.3224 35% 1.35 1302 methionine 61 0.0705 0.3425 21% 1.21 17885 Metabolite-5147 61 0.0710 0.3425 76% 1.76 13038 Metabolite-3143 61 0.0726 0.3440 53% 1.53 11411 Metabolite-2746 61 0.0732 0.3440 79% 1.79 6373 Metabolite-A-1304 61 0.0749 0.3454 -25% 0.75 22259 Isobar 59 includes N('6)- 61 0.0756 0.3454 -29% 0.71 trimethyl-L-lysine, H- homoarg-OH 7081 Metabolite-1609 61 0.0762 0.3454 67% 1.67 2856 uridine 5'-monophosphate 61 0.0807 0.3484 -54% 0.46 16983 Metabolite-4598 50 0.0813 0.3484 34% 1.34 20092 Metabolite-7050 61 0.0818 0.3484 -22% 0.78 14439 Metabolite-3498 61 0.0833 0.3484 26% 1.26 12682 Metabolite-3044 61 0.0841 0.3484 77% 1.77 18281 2-hydroxyhippuric acid 61 0.0843 0.3484 21% 1.21 12129 beta-hydroxyisovaleric acid 50 0.0864 0.3484 17% 1.17 14117 Metabolite-3441 61 0.0867 0.3484 -20% 0.80 20488 D-glucose 50 0.0874 0.3484 -25% 0.75 9216 Metabolite-2168 61 0.0884 0.3484 -21% 0.79 19596 Metabolite-6647 50 0.0885 0.3484 28% 1.28 16819 Metabolite-4496 50 0.0909 0.3484 19% 1.19 22584 Metabolite-9038 61 0.0910 0.3484 -55% 0.45 21650 Metabolite-8409 61 0.0910 0.3484 -38% 0.62 22598 Metabolite-9042 61 0.0920 0.3484 -65% 0.35 54 tryptophan 61 0.0927 0.3484 19% 1.19 16655 Metabolite-4362 50 0.0946 0.3484 -37% 0.63 19402 Metabolite-6346 50 0.0969 0.3484 -21% 0.79 11661 indole-3-pyruvic acid 61 0.0972 0.3484 60% 1.60 1561 alpha-tocopherol 50 0.0974 0.3484 38% 1.38 8180 Metabolite-1975 61 0.0982 0.3484 35% 1.35 16666 Metabolite-4365 50 0.0983 0.3484 -28% 0.72 2132 citrulline 50 0.0985 0.3484 51% 1.51 1508 pantothenic acid 61 0.1014 0.3489 37% 1.37 1572 glyceric acid 50 0.1017 0.3489 14% 1.14 21732 Metabolite-8475 61 0.1020 0.3489 -38% 0.62 9130 Metabolite-2139 61 0.1024 0.3489 105% 2.05 21654 Metabolite-8413 61 0.1043 0.3522 -25% 0.75 10461 Metabolite-2313 61 0.1057 0.3534 -27% 0.73 16511 Metabolite-4274 50 0.1072 0.3534 69% 1.69 1638 arginine 50 0.1075 0.3534 128% 2.28 13345 Metabolite-3244 61 0.1087 0.3543 24% 1.24 1493 ornithine 50 0.1183 0.3823 105% 2.05 5809 3-indoxyl sulfate 61 0.1251 0.3991 80% 1.80 1648 serine 50 0.1261 0.3991 73% 1.73 1826 folic acid 61 0.1268 0.3991 -66% 0.34 512 asparagine 50 0.1357 0.4181 64% 1.64 514 cytidine 61 0.1358 0.4181 69% 1.69 16244 Isobar 21 includes gamma- 61 0.1365 0.4181 -31% 0.69 aminobutyryl-L-histidine, L- anserine 1598 N-tigloylglycine 61 0.1373 0.4181 16% 1.16 17091 Metabolite-4641 61 0.1396 0.4217 40% 1.40 17665 p-hydroxybenzaldehyde 61 0.1424 0.4242 18% 1.18 1494 5-oxoproline 50 0.1430 0.4242 24% 1.24 8336 Metabolite-2005 61 0.1439 0.4242 82% 1.82 13214 Metabolite-3183-possible 61 0.1516 0.4351 28% 1.28 gamma-L-glutamyl-L- phenylalanine 1336 n-hexadecanoic acid 50 0.1518 0.4351 -14% 0.86 21701 Metabolite-8454 61 0.1537 0.4351 -34% 0.66 10141 Metabolite-A-2035 61 0.1540 0.4351 -15% 0.85 17028 Metabolite-4611 50 0.1542 0.4351 19% 1.19 1432 alphahydroxybenzeneacetic 61 0.1546 0.4351 -27% 0.73 acid 6771 Metabolite-1460 61 0.1581 0.4415 -25% 0.75 12774 Metabolite-3094 50 0.1632 0.4513 -13% 0.87 20084 Metabolite-7047 61 0.1656 0.4513 17% 1.17 1651 pyridoxal 61 0.1692 0.4513 24% 1.24 12924 Metabolite-3131 61 0.1702 0.4513 20% 1.20 8072 Metabolite-1958 61 0.1703 0.4513 17% 1.17 1126 alanine 50 0.1714 0.4513 61% 1.61 22567 Metabolite-9030 61 0.1721 0.4513 -51% 0.49 6413 Metabolite-1342-possible 61 0.1724 0.4513 29% 1.29 phenylacetylglutamine or formyl-N-acetyl-5- methoxylcynurenamine 9137 Metabolite-2141 61 0.1725 0.4513 23% 1.23 18232 Metabolite-5403 50 0.1746 0.4537 16% 1.16 19372 Metabolite-6269 50 0.1776 0.4565 19% 1.19 542 3-hydroxybutanoic acid 50 0.1785 0.4565 50% 1.50 11323 Metabolite-2711 61 0.1806 0.4565 72% 1.72 606 uridine 61 0.1806 0.4565 93% 1.93 21631 Metabolite-8403 50 0.1955 0.4908 24% 1.24 15118 Metabolite-3784 61 0.2010 0.4996 22% 1.22 22572 Metabolite-9034 50 0.2035 0.4996 28% 1.28 15121 Metabolite-3786 61 0.2050 0.4996 -53% 0.47 20950 Metabolite-7846 50 0.2054 0.4996 -19% 0.81 1649 valine 50 0.2076 0.4996 55% 1.55 1284 threonine 50 0.2098 0.4996 61% 1.61 16992 Metabolite-4603 61 0.2133 0.4996 38% 1.38 7650 Metabolite-1834 61 0.2138 0.4996 -19% 0.81 14753 Metabolite-3663 61 0.2148 0.4996 19% 1.19 17627 Metabolite-4986 50 0.2153 0.4996 41% 1.41 19919 Metabolite-6832 61 0.2160 0.4996 -34% 0.66 18969 Metabolite-5920 61 0.2161 0.4996 46% 1.46 22320 Metabolite-8889 50 0.2165 0.4996 38% 1.38 12907 cGMP 61 0.2214 0.5078 27% 1.27 14759 Metabolite-3667 61 0.2265 0.5163 10% 1.10 6379 Metabolite-1329 61 0.2343 0.5308 28% 1.28 15872 malonic acid 61 0.2395 0.5345 46% 1.46 10825 Metabolite-2546 61 0.2406 0.5345 -7% 0.93 14988 Metabolite-3756 61 0.2407 0.5345 -10% 0.90 15990 L-alpha- 61 0.2436 0.5345 -35% 0.65 glycerophosphorylcholine 12780 Metabolite-3098 50 0.2443 0.5345 72% 1.72 9002 Metabolite-2107 61 0.2446 0.5345 -33% 0.67 16044 Metabolite-4005 50 0.2553 0.5546 58% 1.58 60 leucine 50 0.2579 0.5570 47% 1.47 1827 riboflavine 61 0.2609 0.5573 44% 1.44 22032 Metabolite-8766 50 0.2610 0.5573 -13% 0.87 16070 Metabolite-4019 50 0.2653 0.5613 -15% 0.85 1301 lysine 50 0.2661 0.5613 72% 1.72 6253 Metabolite-1283 61 0.2689 0.5613 58% 1.58 14043 Metabolite-3428 61 0.2689 0.5613 -26% 0.74 19513 Metabolite-6552 61 0.2776 0.5731 -31% 0.69 1708 7,8-dihydrofolic acid 61 0.2791 0.5731 -32% 0.68 8649 Metabolite-2053 61 0.2796 0.5731 -15% 0.85 15753 hippuric acid 61 0.2839 0.5731 29% 1.29 16232 Isobar 17 includes arginine, 61 0.2839 0.5731 21% 1.21 N-alpha-acetyl-ornithine 1591 N-acetyl-L-valine 61 0.2857 0.5731 42% 1.42 19374 Metabolite-6270 50 0.2867 0.5731 -20% 0.80 15122 glycerol 50 0.2870 0.5731 26% 1.26 15412 Metabolite-3910 61 0.2889 0.5739 -34% 0.66 2342 serotonin 61 0.2920 0.5770 -54% 0.46 13512 Metabolite-3315 61 0.2938 0.5776 22% 1.22 22590 Metabolite-9040 61 0.2957 0.5782 -55% 0.45 12789 Metabolite-3107 50 0.3012 0.5859 39% 1.39 16138 Metabolite-4080 50 0.3045 0.5893 -18% 0.82 15681 4-Guanidinobutanoic acid 61 0.3070 0.5908 36% 1.36 1125 isoleucine 50 0.3094 0.5908 43% 1.43 14502 Metabolite-3539 61 0.3109 0.5908 46% 1.46 14406 Metabolite-3493 61 0.3119 0.5908 -16% 0.84 1898 proline 61 0.3133 0.5908 10% 1.10 2129 oxitryptan 61 0.3172 0.5952 -17% 0.83 15125 (2-Aminoethyl)phosphonate 61 0.3212 0.5961 -23% 0.77 16226 Isobar 28 includes L- 61 0.3213 0.5961 -15% 0.85 threonine, L-allothreonine, L- homoserine, (S)-(-)-4-amino 2-hydroxybutyric acid 6104 tryptamine 50 0.3225 0.5961 26% 1.26 12719 Metabolite-3055-possible 61 0.3251 0.5980 32% 1.32 NH3 adduct of hippuric acid 15113 Metabolite-3783 61 0.3303 0.6045 -17% 0.83 16821 Metabolite-4498 50 0.3358 0.6098 11% 1.11 15743 N,N-dimethylarginine 61 0.3377 0.6098 72% 1.72 12782 Metabolite-3100 50 0.3397 0.6098 57% 1.57 22570 Metabolite-9033 50 0.3430 0.6098 -24% 0.76 10147 Metabolite-A-2036 61 0.3459 0.6098 -12% 0.88 21046 digalacturonic acid 61 0.3472 0.6098 -25% 0.75 12773 Metabolite-3093 50 0.3483 0.6098 24% 1.24 18330 5-methyltetrahydrofolic acid 61 0.3499 0.6098 -21% 0.79 20035 Metabolite-7008 61 0.3521 0.6098 -13% 0.87 22154 bradykinin 61 0.3530 0.6098 -45% 0.55 22133 DL-hexanoyl-carnitine 61 0.3547 0.6098 50% 1.50
5628 Metabolite-1086 61 0.3567 0.6098 -33% 0.67 10743 Isobar 4 includes Gluconic 61 0.3597 0.6098 13% 1.13 acid, DL-arabinose, D-ribose, L-xylose, DL-lyxose, D- xylulose, galactonic acid 16985 Metabolite-4600 61 0.3606 0.6098 32% 1.32 1476 glucarate 50 0.3609 0.6098 18% 1.18 17860 Metabolite-5127 61 0.3632 0.6098 28% 1.28 5466 Metabolite-A-1030 61 0.3635 0.6098 23% 1.23 17845 Metabolite-5108 61 0.3684 0.6098 17% 1.17 20308 Metabolite-7270 61 0.3690 0.6098 19% 1.19 18761 Metabolite-5793 61 0.3694 0.6098 57% 1.57 10476 Metabolite-2316 61 0.3710 0.6098 -15% 0.85 15382 Metabolite-3898 61 0.3722 0.6098 17% 1.17 18467 cis-5,8,11,14,17- 61 0.3728 0.6098 32% 1.32 eicosapentaenoic acid 15529 Metabolite-3951 61 0.3733 0.6098 14% 1.14 15336 tartaric acid 61 0.3743 0.6098 16% 1.16 21012 Metabolite-7889 50 0.3786 0.6098 16% 1.16 12533 Metabolite-2915 50 0.3809 0.6098 -14% 0.86 10700 Metabolite-2393 61 0.3831 0.6098 26% 1.26 12753 Metabolite-3074 50 0.3842 0.6098 15% 1.15 10357 Metabolite-A-2055 61 0.3856 0.6098 -24% 0.76 21763 Metabolite-8507 61 0.3862 0.6098 -10% 0.90 15074 Metabolite-3774 61 0.3893 0.6098 18% 1.18 10286 Metabolite-2272 61 0.3909 0.6098 47% 1.47 14480 Metabolite-3521 61 0.3909 0.6098 -42% 0.58 13872 Metabolite-3393 61 0.3933 0.6098 52% 1.52 8300 Metabolite-1988 61 0.3934 0.6098 -13% 0.87 22586 Metabolite-9039 61 0.3939 0.6098 -48% 0.52 13920 Metabolite-3404 61 0.3967 0.6107 16% 1.16 12645 Metabolite-3017 50 0.3978 0.6107 24% 1.24 18369 gamma-glu-leu 61 0.3997 0.6111 11% 1.11 19368 Metabolite-6267 50 0.4016 0.6115 29% 1.29 19613 Metabolite-6670 61 0.4043 0.6131 -20% 0.80 12756 Metabolite-3077 50 0.4130 0.6237 25% 1.25 7644 Metabolite-1831 61 0.4185 0.6289 18% 1.18 12639 Metabolite-3012 50 0.4198 0.6289 46% 1.46 6130 Metabolite-1208 61 0.4239 0.6324 -41% 0.59 11053 Metabolite-2567 61 0.4256 0.6324 10% 1.10 17390 Metabolite-4806 50 0.4286 0.6335 -7% 0.93 14247 Metabolite-3475 61 0.4319 0.6335 14% 1.14 20234 Metabolite-7170 61 0.4326 0.6335 25% 1.25 17327 Metabolite-4767 50 0.4364 0.6335 13% 1.13 17359 Metabolite-4791 50 0.4383 0.6335 -21% 0.79 22163 EDTA 50 0.4387 0.6335 47% 1.47 8176 Metabolite-1974 61 0.4407 0.6335 -16% 0.84 1647 glutamine 50 0.4446 0.6335 44% 1.44 17614 Metabolite-4966 50 0.4467 0.6335 -29% 0.71 5430 Metabolite-A-1008 61 0.4497 0.6335 -5% 0.95 19462 Metabolite-6446 50 0.4509 0.6335 -9% 0.91 6398 Metabolite-1335 61 0.4510 0.6335 -19% 0.81 15639 Metabolite-3984 61 0.4520 0.6335 54% 1.54 12777 Metabolite-3097 50 0.4558 0.6335 25% 1.25 15805 maltose 50 0.4590 0.6335 25% 1.25 1366 trans-4-hydroxyproline 50 0.4603 0.6335 31% 1.31 4966 xylitol 50 0.4612 0.6335 10% 1.10 1419 5'-s-methyl-5'-thioadenosine 61 0.4617 0.6335 18% 1.18 11777 glycine 50 0.4623 0.6335 36% 1.36 22020 Metabolite-8749 50 0.4627 0.6335 9% 1.09 21047 3-methyl-2-oxobutyric 61 0.4640 0.6335 -12% 0.88 16290 Metabolite-4133 50 0.4655 0.6335 -7% 0.93 12803 Metabolite-A-2441 50 0.4671 0.6335 -12% 0.88 8527 Metabolite-A-1931 61 0.4700 0.6335 -3% 0.97 19013 Metabolite-5931 61 0.4701 0.6335 7% 1.07 22568 Metabolite-9031 61 0.4758 0.6335 -43% 0.57 12783 Metabolite-3101 50 0.4760 0.6335 27% 1.27 5533 Metabolite-A-1096 61 0.4762 0.6335 29% 1.29 16805 Metabolite-4488 61 0.4772 0.6335 21% 1.21 22132 DL-alpha-hydroxyisocaproic 61 0.4774 0.6335 15% 1.15 acid 16071 Metabolite-4020 50 0.4818 0.6360 7% 1.07 22439 Metabolite-8949 61 0.4839 0.6360 17% 1.17 5765 Metabolite-1142-possible 61 0.4877 0.6360 -13% 0.87 5-hydroxypentanoate or beta- hydroxyisovaleric acid 1481 inositol 1-phosphate 50 0.4879 0.6360 -13% 0.87 13217 Metabolite-3184 61 0.4913 0.6360 15% 1.15 5689 Metabolite-1111-possible 61 0.4925 0.6360 -19% 0.81 methylnitronitrosoguanidine or ethyl thiocarbamoylacetate 22166 glu-glu 61 0.4985 0.6360 29% 1.29 21127 monopalmitin 50 0.4987 0.6360 -10% 0.90 22601 Metabolite-9044 50 0.4990 0.6360 25% 1.25 18384 Metabolite-5487 50 0.5030 0.6360 -12% 0.88 18943 Metabolite-5912 61 0.5031 0.6360 -13% 0.87 22145 acetyl-L-carnitine 61 0.5078 0.6360 20% 1.20 17486 Metabolite-4886 61 0.5102 0.6360 -14% 0.86 14639 Metabolite-3603 61 0.5123 0.6360 16% 1.16 12785 Metabolite-3103 50 0.5144 0.6360 38% 1.38 9016 Metabolite-2109 61 0.5147 0.6360 -6% 0.94 10136 Metabolite-A-2034 61 0.5160 0.6360 4% 1.04 1417 kynurenic acid 61 0.5187 0.6360 12% 1.12 16893 Metabolite-4530 61 0.5188 0.6360 107% 2.07 1564 citric acid 50 0.5189 0.6360 12% 1.12 22001 3-hydroxyoctanoic acid 61 0.5214 0.6360 19% 1.19 18349 DL-indole-3-lactic acid 61 0.5214 0.6360 13% 1.13 16080 Metabolite-4026 61 0.5228 0.6360 -26% 0.74 15197 1-methylnicotinamide-1 61 0.5243 0.6360 24% 1.24 18172 Metabolite-5391 61 0.5247 0.6360 -13% 0.87 2240 homogentisate 61 0.5248 0.6360 -6% 0.94 15063 Metabolite-3772 61 0.5263 0.6360 17% 1.17 5618 Metabolite-1085-possible 61 0.5287 0.6360 -8% 0.92 isolobinine or 4-aminoestra- 1,3,5(10)-triene-3,17beta-diol 59 histidine 61 0.5290 0.6360 -8% 0.92 5478 Metabolite-A-1036 61 0.5339 0.6394 -7% 0.93 21013 Metabolite-7890 50 0.5363 0.6394 -15% 0.85 22262 Isobar 61 includes 4-methyl- 61 0.5381 0.6394 -10% 0.90 2-oxovaleric acid, 3-methyl- 2-oxovaleric acid 10850 Metabolite-2548-possible 61 0.5398 0.6394 21% 1.21 Cl adduct of uric acid 22360 Metabolite-8901 61 0.5414 0.6394 16% 1.16 5475 Metabolite-A-1033 61 0.5423 0.6394 12% 1.12 8509 Metabolite-2041 61 0.5445 0.6394 7% 1.07 20694 oxalic acid 61 0.5456 0.6394 -7% 0.93 18010 Metabolite-5231 61 0.5487 0.6411 33% 1.33 2183 thymidine 61 0.5516 0.6423 10% 1.10 2150 pyridoxamine 61 0.5544 0.6432 -4% 0.96 19708 Metabolite-6711 61 0.5558 0.6432 -9% 0.91 22130 DL-3-phenyllactic acid 61 0.5598 0.6457 -16% 0.84 16711 Metabolite-4431 61 0.5614 0.6457 -15% 0.85 20391 Metabolite-7334 61 0.5785 0.6615 -13% 0.87 16189 Metabolite-4097 61 0.5787 0.6615 9% 1.09 7177 Metabolite-1656 61 0.5817 0.6623 36% 1.36 10655 Metabolite-2388 61 0.5830 0.6623 11% 1.11 16506 Metabolite-4271 50 0.5872 0.6651 26% 1.26 18146 Metabolite-5366 50 0.5890 0.6651 -14% 0.86 19494 Metabolite-6506 50 0.6032 0.6752 -11% 0.89 18109 isocitrate 61 0.6041 0.6752 20% 1.20 1110 arachidonic acid 50 0.6062 0.6752 8% 1.08 17283 Metabolite-4750 61 0.6064 0.6752 -15% 0.85 13211 Metabolite-3182 61 0.6084 0.6752 -13% 0.87 12726 Metabolite-3058 50 0.6104 0.6752 25% 1.25 15996 aspartate 50 0.6134 0.6752 27% 1.27 16705 Metabolite-4428 61 0.6135 0.6752 13% 1.13 16865 Metabolite-4522 50 0.6143 0.6752 6% 1.06 12648 Metabolite-3020 50 0.6166 0.6755 -6% 0.94 6266 Metabolite-1286 61 0.6183 0.6755 6% 1.06 1105 Linoleic acid 50 0.6208 0.6755 -6% 0.94 15730 suberic acid 61 0.6219 0.6755 19% 1.19 12650 Metabolite-3022 50 0.6242 0.6761 24% 1.24 20031 Metabolite-7007 61 0.6307 0.6811 -10% 0.90 16860 Metabolite-4517 50 0.6346 0.6815 -9% 0.91 17064 Metabolite-4624 50 0.6349 0.6815 19% 1.19 19934 inositol 50 0.6365 0.6815 11% 1.11 12663 Metabolite-3030 50 0.6414 0.6836 29% 1.29 20866 Metabolite-7786 61 0.6422 0.6836 4% 1.04 22602 Metabolite-9045 50 0.6447 0.6843 -13% 0.87 12593 Metabolite-2973 50 0.6526 0.6907 3% 1.03 15500 carnitine 61 0.6619 0.6957 -5% 0.95 7595 Metabolite-1817 61 0.6633 0.6957 5% 1.05 19364 Metabolite-6246 50 0.6655 0.6957 13% 1.13 20248 Metabolite-7177 61 0.6667 0.6957 10% 1.10 14054 Metabolite-3430-possible 61 0.6670 0.6957 4% 1.04 gly-leu, acetyl-lys, ala-val 11438 phosphate 50 0.6686 0.6957 5% 1.05 19511 Metabolite-6551 61 0.6777 0.7032 6% 1.06 20192 Metabolite-7146 61 0.6833 0.7061 -9% 0.91 16949 Metabolite-4592 61 0.6842 0.7061 -7% 0.93 2137 biliverdin 61 0.6893 0.7093 -18% 0.82 19961 Metabolite-6913 50 0.6913 0.7093 2% 1.02 7107 Metabolite-A-1664 61 0.6945 0.7093 -22% 0.78 18756 Metabolite-5791 61 0.6950 0.7093 -8% 0.92 12768 Metabolite-3088 50 0.7007 0.7125 14% 1.14 19362 Metabolite-6226 50 0.7030 0.7125 -10% 0.90 12791 Metabolite-3109 50 0.7038 0.7125 18% 1.18 528 alpha-keto-glutarate 61 0.7155 0.7217 17% 1.17 10746 Isobar 6 includes valine, 61 0.7178 0.7217 10% 1.10 betaine 10304 Metabolite-2276 61 0.7191 0.7217 24% 1.24 19377 Metabolite-6272 50 0.7207 0.7217 9% 1.09 18929 Metabolite-5907 50 0.7249 0.7239 -9% 0.91 9060 Metabolite-A-1994 61 0.7284 0.7248 16% 1.16 22577 Metabolite-9035 50 0.7323 0.7248 17% 1.17 1121 heptadecanoic acid 50 0.7328 0.7248 4% 1.04 14840 Metabolite-3708 61 0.7359 0.7248 5% 1.05 16712 Metabolite-4432 61 0.7373 0.7248 -3% 0.97 16285 Metabolite-A-2798 50 0.7393 0.7248 -11% 0.89 1584 methyl indole-3-acetate 61 0.7401 0.7248 -13% 0.87 18868 Metabolite-5847 50 0.7421 0.7248 13% 1.13 16843 Metabolite-4510 50 0.7452 0.7248 15% 1.15 19800 Metabolite-6750 61 0.7544 0.7248 24% 1.24 12457 Metabolite-2892 61 0.7565 0.7248 -9% 0.91 15677 3-methyl-L-histidine 61 0.7568 0.7248 -4% 0.96 57 glutamic acid 50 0.7577 0.7248 18% 1.18 21762 Metabolite-8506 61 0.7591 0.7248 7% 1.07 12770 Metabolite-3090 50 0.7605 0.7248 7% 1.07 19367 Metabolite-6266 50 0.7620 0.7248 -6% 0.94 11770 Metabolite-2806 61 0.7646 0.7248 5% 1.05 10148 Metabolite-2257 61 0.7649 0.7248 13% 1.13 10570 Metabolite-2366 61 0.7663 0.7248 -6% 0.94 20267 Metabolite-7187 61 0.7675 0.7248 14% 1.14 577 fructose 50 0.7684 0.7248 -7% 0.93 16308 Metabolite-4147 50 0.7687 0.7248 7% 1.07 6362 Metabolite-1323-possible 61 0.7707 0.7249 22% 1.22 p-cresol sulfate 12112 Metabolite-A-2314 61 0.7740 0.7261 6% 1.06 12647 Metabolite-3019 50 0.7767 0.7268 18% 1.18 13104 Metabolite-3160 61 0.7839 0.7295 -5% 0.95 17060 Metabolite-4622 61 0.7853 0.7295 7% 1.07 1365 tetradecanoic acid 50 0.7859 0.7295 -5% 0.95 1512 picolinic acid 50 0.7875 0.7295 -5% 0.95 12673 Metabolite-3040 50 0.7915 0.7315 7% 1.07 12876 Metabolite-3125 61 0.7960 0.7338 -8% 0.92 18892 Metabolite-5866 61 0.8003 0.7360 -5% 0.95 12035 nonanate 50 0.8032 0.7368 5% 1.05 18678 Metabolite-5730 61 0.8065 0.7371 -7% 0.93 19955 Metabolite-6907 50 0.8075 0.7371 7% 1.07 19323 Docosahexaenoic Acid 50 0.8175 0.7428 3% 1.03 12656 Metabolite-3025 50 0.8225 0.7428 13% 1.13 12751 Metabolite-3073 50 0.8227 0.7428 -10% 0.90 18706 Metabolite-5769 61 0.8236 0.7428 -6% 0.94 15064 Metabolite-3773 61 0.8252 0.7428 10% 1.10 12666 Metabolite-3033-possible 50 0.8278 0.7428 10% 1.10 threonine deriv- 16829 Metabolite-4503 50 0.8286 0.7428 -3% 0.97 12771 Metabolite-3091 50 0.8298 0.7428 7% 1.07 21188 1-stearoyl-rac-glycerol 50 0.8452 0.7498 3% 1.03 16509 Metabolite-4273 50 0.8458 0.7498 -8% 0.92 10544 Metabolite-2329 61 0.8460 0.7498 -9% 0.91 15625 Metabolite-3976 61 0.8476 0.7498 3% 1.03 6461 Metabolite-A-1329 61 0.8499 0.7498 7% 1.07 17207 Metabolite-4707 61 0.8507 0.7498 4% 1.04 12008 Metabolite-2847 61 0.8532 0.7498 6% 1.06 17389 Metabolite-4796 50 0.8537 0.7498 -14% 0.86 597 phosphoenolpyruvate 61 0.8558 0.7499 -4% 0.96 10111 Metabolite-A-2033 61 0.8587 0.7506 -5% 0.95 8796 Metabolite-2074 61 0.8687 0.7575 5% 1.05 7029 Metabolite-1597 61 0.8755 0.7601 2% 1.02 15253 Metabolite-3832-possible 61 0.8757 0.7601 6% 1.06 phenol sulfate 20194 Metabolite-7147 61 0.8787 0.7607 -2% 0.98 15535 Metabolite-3955 61 0.8805 0.7607 6% 1.06 15129 D-alanyl-D-alanine 50 0.8826 0.7608 3% 1.03 12658 Metabolite-3026 50 0.8933 0.7650 8% 1.08 10604 Metabolite-2370 61 0.8961 0.7650 -4% 0.96 13179 creatine 61 0.8973 0.7650 -4% 0.96 10781 Metabolite-2469 61 0.8992 0.7650 5% 1.05 1358 octadecanoic acid 50 0.9002 0.7650 1% 1.01 15365 sn-Glycerol 3-phosphate 50 0.9018 0.7650 3% 1.03 9172 Metabolite-A-2000 61 0.9060 0.7650 -1% 0.99 15227 trans-aconitic acid-1 61 0.9063 0.7650 3% 1.03 5702 choline 61 0.9074 0.7650 -4% 0.96 12625 Metabolite-3002 50 0.9081 0.7650 2% 1.02 19860 Metabolite-6784 61 0.9194 0.7716 1% 1.01 12781 Metabolite-3099 50 0.9201 0.7716 4% 1.04 13273 Metabolite-3224 61 0.9344 0.7759 3% 1.03 21025 iminodiacetic acid 50 0.9345 0.7759 2% 1.02 12912 Metabolite-3129 61 0.9367 0.7759 -1% 0.99
6131 Metabolite-1209 61 0.9387 0.7759 -3% 0.97 6380 Metabolite-1330 61 0.9399 0.7759 -2% 0.98 2125 taurine 61 0.9400 0.7759 -3% 0.97 18118 Metabolite-5346 50 0.9423 0.7759 -3% 0.97 19291 Metabolite-6132 61 0.9430 0.7759 -2% 0.98 12667 Metabolite-3034 50 0.9440 0.7759 1% 1.01 20927 Metabolite-7815 61 0.9519 0.7796 -1% 0.99 16665 Metabolite-4364 50 0.9529 0.7796 -2% 0.98 20228 Metabolite-7169 61 0.9548 0.7796 -2% 0.98 15600 Metabolite-3964 61 0.9639 0.7799 -1% 0.99 9905 Metabolite-2231 61 0.9664 0.7799 0% 1.00 16496 Metabolite-4251 50 0.9670 0.7799 1% 1.01 513 creatinine 61 0.9687 0.7799 -1% 0.99 22581 Metabolite-9037 61 0.9712 0.7799 2% 1.02 18882 taurodeoxycholic acid 61 0.9715 0.7799 2% 1.02 12754 Metabolite-3075 50 0.9801 0.7799 1% 1.01 13018 Metabolite-3138 61 0.9829 0.7799 1% 1.01 8196 Metabolite-1979-Cl adduct 61 0.9833 0.7799 0% 1.00 of isobar 19 19397 Metabolite-6326 50 0.9846 0.7799 -1% 0.99 13288 Metabolite-3228 61 0.9860 0.7799 0% 1.00 19490 Metabolite-6488 50 0.9863 0.7799 1% 1.01 12757 Metabolite-3078 50 0.9867 0.7799 -1% 0.99 12790 Metabolite-3108 50 0.9880 0.7799 1% 1.01 16512 Metabolite-4275 50 0.9908 0.7799 0% 1.00 17330 Metabolite-4769 50 0.9910 0.7799 0% 1.00 19363 Metabolite-6227 50 0.9929 0.7799 0% 1.00 63 cholesterol 50 0.9929 0.7799 0% 1.00 10782 Metabolite-2486 61 0.9967 0.7812 0% 1.00 22548 Metabolite-9026 50 0.9988 0.7812 0% 1.00
Recursive partitioning statistical analysis of all the metabolites in cardiac tissue between normal and DCM subjects identified Metabolite-3808 (Metabolite-3808) as a compound that separated both groups of subjects perfectly (LogWorth=6.61). Specifically, all subjects with DCM phenotype had levels of Metabolite-3808 above the cutoff value of 629275 while all the subjects with a normal phenotype had Metabolite-3808 levels below the cutoff value (FIG. 20). The cutoff value in the graph in FIG. 20 is indicated by a broken line.
To evaluate the biomarkers discovered in the mouse model of DCM, analysis of human subjects was performed. Biomarkers were discovered by (1) analyzing plasma samples from different groups of human subjects to determine the levels of metabolites in the samples and then (2) statistically analyzing the results to determine those metabolites that were differentially present in the two groups.
Two groups of subjects were used. One group consisted of 39 subjects (18 male, 21 female) with dilated cardiomyopathy (DCM). The second group consisted of 31 healthy control subjects (14 male, 17 male). Subjects were balanced for age and gender; mean age of control females was 50.1+/-10.1 and DCM females was 50.0+/-11.3 while the mean age of control males was 42.7+/-11.3 and DCM males was 45.8+/-10.9.
T-tests (Table 23) were used to determine differences in the mean levels of metabolites between the two populations (i.e., Dilated Cardiomyopathy, DCM vs. Healthy control). Classification analysis was carried out using random forest analyses to uncover the biomarkers that can best differentiate the two groups. The results of the Random forest analysis are shown in Table 24 and the most important biomarkers useful to classify subjects as healthy or DCM are listed in Table 25.
Biomarkers:
As listed below in Table 23, biomarkers were discovered that were differentially present between plasma samples collected from dilated cardiomyopathy subjects and healthy subjects.
Table 23 includes, for each listed biomarker, the p-value and q-value determined in the statistical analysis of the data concerning the biomarkers and an indication of the percentage difference in the dilated cardiomyopathy mean level as compared to the healthy mean level in plasma. "ID" refers to the compound identification number used as a primary key for that compound in the in-house chemical database. "Library" indicates the chemical library that was used to identify the compounds. The number 50 refers to the GC library and the numbers 200 and 201 refer to the LC library. "Mouse" indicates the compounds that were also biomarkers discovered in the mouse model of DCM.
TABLE-US-00024 TABLE 23 Biomarkers for DCM % Change ID Library Compound p-value q-value in DCM Mouse 32873 201 Metabolite-11556 5.943E-07 0.0001 -10% 1558 200 4-acetamidobutanoate 6.339E-06 0.0005 7% 32709 200 Metabolite-03056 1.925E-05 0.001 73% 33510 200 Metabolite-12095 2.318E-05 0.001 -9% 33442 200 pseudouridine 3.734E-05 0.0012 1% 32425 201 dehydroisoandrosterone sulfate 0.0001 0.0012 4% (DHEA-S) 32519 200 Metabolite-11205 0.0001 0.0012 14% 32637 201 Metabolite-11320 0.0001 0.0012 6% 16866 50 Metabolite-04523 0.0001 0.0015 9% 1114 201 deoxycholate 0.0001 0.0017 11% 1284 200 threonine 0.0001 0.0017 1% Yes 32675 200 Metabolite-03951 0.0001 0.0017 12% 15506 200 choline 0.0002 0.002 29% Yes 32652 200 Metabolite-11335 0.0002 0.0029 -31% 32197 201 3-(4-hydroxyphenyl)lactate 0.0003 0.0035 -4% Yes 33515 200 Metabolite-12100 0.0003 0.0036 31% 18929 50 Metabolite-05907 0.0004 0.004 -3% 32405 200 3-indolepropionate 0.0004 0.004 -13% 19934 50 myo-inositol 0.0006 0.0051 17% Yes 33453 50 alpha-ketoglutarate 0.0006 0.0055 2% 1712 200 cortisol 0.0007 0.006 -53% 32807 201 Metabolite-11490 0.0012 0.0094 -12% 25607 50 Metabolite-10437 0.0013 0.0097 4% 25459 50 Metabolite-10395 0.0015 0.0104 -3% 33477 50 erythronate* 0.0016 0.0106 -25% 32635 201 Metabolite-11318 0.0018 0.0117 17% 57 50 glutamate 0.002 0.0126 -5% Yes 18254 200 paraxanthine 0.0021 0.0126 -3% 33973 201 epiandrosterone sulfate 0.0021 0.0126 51% 32560 201 Metabolite-07765 0.0025 0.0142 -4% 20699 50 erythritol 0.0026 0.0144 -19% Yes 32590 201 Metabolite-11273 0.003 0.0154 -18% 32619 201 Metabolite-11302 0.003 0.0154 -11% 22602 50 Metabolite-09045 0.0033 0.0161 -6% 32829 200 Metabolite-03653 0.0033 0.0161 -4% 32910 201 Metabolite-11593 0.0035 0.0168 -8% 32599 201 Metabolite-11282 0.0037 0.017 3% 16653 50 Metabolite-04361 0.004 0.0176 2% 18232 50 Metabolite-05403 0.004 0.0176 30% 15677 201 3-methylhistidine 0.0048 0.0206 120% Yes 12770 50 Metabolite-03090 0.0055 0.0225 13% 31591 201 androsterone sulfate 0.0055 0.0225 -78% 584 50 mannose 0.0063 0.0248 16% Yes 15140 200 kynurenine 0.0067 0.0258 22% Yes 33206 201 Metabolite-11861 0.0068 0.0258 -17% 33144 200 Metabolite-11799 0.007 0.026 -13% 33507 200 Metabolite-12092 0.0076 0.0278 -3% 32740 201 Metabolite-11423 0.0078 0.0278 -27% 33652 201 Metabolite-12230 0.008 0.0279 -3% 53 200 glutamine 0.0082 0.028 2% Yes 32808 201 Metabolite-11491 0.0087 0.0289 39% 33516 200 Metabolite-12101 0.0089 0.0289 80% 3147 50 xanthine 0.009 0.0289 20% 12753 50 Metabolite-03074 0.0099 0.0309 -5% 1303 50 malate 0.0101 0.0309 3% Yes 32762 201 Metabolite-11445 0.0101 0.0309 4% 2734 200 gamma-glutamyltyrosine 0.0115 0.0339 -4% Yes 32718 200 Metabolite-01342 0.0116 0.0339 26% 32644 200 Metabolite-11327 0.0117 0.0339 -25% 32654 200 Metabolite-11337 0.012 0.0341 9% 33937 201 alpha-hydroxyisovalerate 0.0127 0.0355 38% 12017 200 3-methoxytyrosine 0.0134 0.0369 7% 32753 201 Metabolite-09789 0.0154 0.0418 -9% 32587 201 Metabolite-02249 0.016 0.0427 44% 59 201 histidine 0.0179 0.047 -1% Yes 22548 50 Metabolite-09026 0.0188 0.0486 28% 16959 50 Metabolite-04595 0.0191 0.0488 21% 33422 200 gammaglutamylphenylalanine 0.0197 0.0494 30% 64 200 phenylalanine 0.0211 0.0522 -4% Yes 32110 50 Metabolite-11086 0.0227 0.055 8% 33132 200 Metabolite-11787 0.0229 0.055 132% 32859 200 Metabolite-11542 0.0236 0.0557 -19% 32672 200 Metabolite-02546 0.024 0.0557 -5% 21044 50 2-hydroxybutyrate (AHB) 0.0244 0.0557 3% Yes 1356 201 nonadecanoate (19:0) 0.025 0.0557 -1% 32198 200 acetylcarnitine 0.025 0.0557 -44% Yes 32830 200 Metabolite-11513 0.0251 0.0557 1% 599 50 pyruvate 0.0261 0.0571 -7% 1358 201 stearate (18:0) 0.0269 0.0576 -13% Yes 32701 200 urate* 0.027 0.0576 -2% Yes 32393 200 glutamylvaline 0.0276 0.0576 11% 24077 50 Metabolite-09727 0.0277 0.0576 -12% 24076 50 Metabolite-09726 0.0285 0.0586 -31% 1299 200 tyrosine 0.0288 0.0587 -3% Yes 27718 200 creatine 0.0294 0.059 -29% Yes 12757 50 Metabolite-03078 0.0299 0.0594 19% 1769 200 cortisone 0.0308 0.0604 33% 32836 200 HWESASXX* 0.0315 0.0612 11% 33028 200 Metabolite-01497 0.0325 0.0624 -8% 33961 200 1-stearoylglycerophosphocholine 0.0329 0.0624 4% 33157 200 Metabolite-11812 0.0334 0.0624 27% 32606 201 bilirubin* 0.0336 0.0624 2% 33939 201 N-acetylthreonine 0.0358 0.0659 7% 25609 50 Metabolite-10439 0.0363 0.066 75% 19368 50 Metabolite-06267 0.0367 0.066 -7% 12789 50 Metabolite-03107 0.0384 0.0683 17% Yes 33441 200 isobutyrylcarnitine 0.0391 0.0684 -13% 34035 201 linolenate [alpha or gamma; (18:3(n-3 0.0394 0.0684 -2% or 6))] 33363 200 gamma-glutamylmethionine* 0.0396 0.0684 -17% 30257 50 Metabolite-10729 0.0417 0.0712 3% 33821 200 Metabolite-12393 0.0431 0.0724 0% 33389 201 Metabolite-12038 0.0432 0.0724 3% 21047 201 3-methyl-2-oxobutyrate 0.0464 0.077 15% Yes 18349 200 indolelactate 0.0472 0.0775 -55% Yes 12110 200 isocitrate 0.0478 0.0775 11% 33405 200 Metabolite-12053 0.0481 0.0775 0% 32497 201 10c-undecenoate 0.0496 0.0792 17% 33738 201 Metabolite-12316 0.0502 0.0794 -14% 19402 50 Metabolite-06346 0.0518 0.0812 53% 33964 200 [H]HWESASLLR[OH] 0.0523 0.0813 26% 12795 50 Metabolite-03113 0.0535 0.0824 6% 32754 201 Metabolite-11437 0.0542 0.0827 -13% 18497 201 taurocholate 0.055 0.0831 -9% 1508 200 pantothenate 0.0565 0.0847 25% Yes 32625 201 Metabolite-11308 0.0609 0.0904 -50% 32729 200 Metabolite-11412 0.0621 0.0915 -26% 31555 201 pyridoxate 0.0648 0.0946 18% 33960 200 1-oleoylglycerophosphocholine 0.0664 0.0961 9% 1642 201 caprate (10:0) 0.068 0.0976 -5% 31454 50 cystine 0.0697 0.0985 -11% 18477 200 glycodeoxycholate 0.07 0.0985 -44% 32850 201 Metabolite-11533 0.0711 0.0985 155% 22895 50 Metabolite-09299 0.0717 0.0985 -15% 31618 50 Metabolite-10964 0.0718 0.0985 -25% 34007 50 Metabolite-12502 0.072 0.0985 -12% 1638 200 arginine 0.0748 0.1014 -14% Yes 33852 200 Metabolite-12424 0.0767 0.1031 -20% 33420 50 gamma-tocopherol* 0.0798 0.1058 -17% 32398 200 sebacate 0.0799 0.1058 -9% 33403 200 Metabolite-12051 0.082 0.1077 -10% 33957 200 1-heptadecanoylglycerophosphocholine 0.0838 0.1085 -1% 32518 200 Metabolite-11204 0.0849 0.1091 27% 1361 201 pentadecanoate (15:0) 0.0887 0.1131 69% 1645 201 laurate (12:0) 0.0906 0.1141 10% 32620 201 Metabolite-11303 0.0908 0.1141 3% 15990 200 glycerophosphorylcholine (GPC) 0.0928 0.1158 -9% Yes 27531 201 hyodeoxycholate 0.0956 0.1184 2% 1105 201 linoleate (18:2(n-6)) 0.0969 0.1184 66% Yes 33140 200 Metabolite-11795 0.097 0.1184 -1% 16308 50 Metabolite-04147 0.099 0.1193 38% 33927 200 Metabolite-12481 0.0994 0.1193 18% 19363 50 Metabolite-06227 0.0998 0.1193 16% 31509 50 Metabolite-10931 0.1008 0.1196 31% 32561 201 Metabolite-11244 0.1052 0.1239 -11% 32846 201 Metabolite-11529 0.1091 0.1257 253% 21630 50 Metabolite-08402 0.1098 0.1257 2% 32550 201 Metabolite-02272 0.1102 0.1257 21% 1107 50 allantoin 0.1104 0.1257 -13% Yes 32867 201 Metabolite-11550 0.1104 0.1257 5% 32549 201 Metabolite-02269 0.1157 0.1309 8% 32786 200 Metabolite-11469 0.1181 0.1321 8% 32501 201 dihomo-alpha-linolenate (20:3(n-3)) 0.1188 0.1321 24% 21128 50 octadecanol 0.1191 0.1321 11% 16819 50 Metabolite-04496 0.12 0.1323 -7% 33209 201 Metabolite-11864 0.121 0.1324 -21% 32778 200 Metabolite-11461 0.1216 0.1324 -6% 32839 201 Metabolite-11522 0.1284 0.1389 20% 32868 201 glycocholate* 0.1304 0.1401 -28% 33969 201 stearidonate (18:4(n-3)) 0.1388 0.146 89% 12783 50 Metabolite-03101 0.1405 0.146 21% 31453 50 cysteine 0.141 0.146 16% 33103 50 Metabolite-11758 0.1417 0.146 26% 32758 201 Metabolite-11441 0.1421 0.146 24% 33935 200 piperine 0.1422 0.146 -26% 33472 200 Metabolite-12085 0.1426 0.146 3% 32978 200 Metabolite-11656 0.1427 0.146 -26% 32504 201 n-3 DPA (22:5(n-3)) 0.1448 0.1463 -3% 32877 201 Metabolite-11560 0.1463 0.1463 47% 27273 50 Metabolite-10506 0.1465 0.1463 36% 19370 50 Metabolite-06268 0.149 0.1472 2% 1572 50 glycerate 0.1506 0.1472 1% Yes 32346 201 glycochenodeoxycholate 0.1506 0.1472 13% 32769 201 Metabolite-11452 0.1513 0.1472 -17% 11777 50 glycine 0.1564 0.1508 -3% Yes 32759 201 Metabolite-11442 0.1572 0.1508 79% 513 200 creatinine 0.161 0.1537 -2% Yes 32452 200 propionylcarnitine 0.163 0.1547 9% 20675 201 1,5-anhydroglucitol (1,5-AG) 0.1674 0.1573 5% 22600 50 Metabolite-09043 0.1677 0.1573 56% 33380 201 Metabolite-12029 0.1692 0.1573 -5% 25532 50 Metabolite-10413 0.1695 0.1573 -7% 15335 50 mannitol 0.173 0.1598 2% 32952 201 Metabolite-02277 0.1747 0.1605 -13% 27275 50 Metabolite-10507 0.1777 0.1617 -8% 25522 50 Metabolite-10407 0.178 0.1617 37% 18335 50 quinate 0.1831 0.1648 17% 1670 50 urea 0.1833 0.1648 -2% Yes 31266 50 fructose 0.1853 0.1652 11% 32401 200 trigonelline (N'-methylnicotinate) 0.1856 0.1652 30% 33228 200 Metabolite-11883 0.1941 0.1718 -4% 32776 200 Metabolite-11459 0.1997 0.1754 -13% 1121 201 margarate (17:0) 0.2008 0.1754 12% Yes 33955 200 1-palmitoylglycerophosphocholine 0.2012 0.1754 -25% 11438 50 phosphate 0.2028 0.1759 -7% Yes 32756 201 Metabolite-02276 0.205 0.1769 -23% 21127 50 1-palmitoylglycerol (1-monopalmitin) 0.212 0.182 -40% Yes 1359 201 oleate(18:1(n-9)) 0.2134 0.1823 -20% 16665 50 Metabolite-04364 0.2221 0.1888 63% 33662 200 Metabolite-12240 0.2242 0.1896 17% 32572 200 Metabolite-11255 0.2263 0.1899 12% 32814 201 Metabolite-11497 0.2274 0.1899 16% 12774 50 Metabolite-03094 0.2288 0.1899 -11% 33774 201 Metabolite-12349 0.2289 0.1899 33% 33386 50 Metabolite-12035 0.233 0.1905 10% 33415 201 Metabolite-12063 0.2331 0.1905 21% 33846 200 indoleacetate* 0.2365 0.1909 -16% 21049 50 1,6-anhydroglucose 0.2368 0.1909 -27% 16650 50 Metabolite-04360 0.2369 0.1909 -40% 15365 50 glycerol 3-phosphate (G3P) 0.2384 0.1913 12% Yes 22189 200 palmitoylcarnitine 0.2412 0.1926 22% 30821 50 Metabolite-10812 0.2425 0.1927 -47% 33620 200 Metabolite-12199 0.2445 0.1934 16% 12129 200 beta-hydroxyisovalerate 0.2499 0.1967 -3% Yes 33408 200 Metabolite-12056 0.2568 0.1992 7% 31373 50 Metabolite-10878 0.2571 0.1992 -10% 32792 201 Metabolite-11475 0.2573 0.1992 -17% 18392 200 theobromine 0.2577 0.1992 -10% 19323 201 docosahexaenoate (DHA; 22:6(n-3)) 0.2666 0.2052 -14% Yes 18394 201 theophylline 0.2846 0.218 -6% 32795 201 Metabolite-11478 0.2895 0.2208 -10% 32698 200 Metabolite-11381 0.2935 0.2219 -26% 32412 200 butyrylcarnitine 0.2945 0.2219 0% 32800 201 Metabolite-11483 0.296 0.2219 0% 33198 201 Metabolite-11853 0.2979 0.2219 -50% 33254 201 Metabolite-11909 0.2988 0.2219 -26% 22842 200 cholate 0.2993 0.2219 38% 33390 201 Metabolite-12039 0.3001 0.2219 -22% 12626 50 Metabolite-03003 0.3038 0.2237 13% 12261 201 taurodeoxycholic acid 0.3087 0.2264 -46% 32578 200 Metabolite-11261 0.3152 0.2301 -18% 18868 50 Metabolite-05847 0.3218 0.2328 -1% 32735 200 Metabolite-01911 0.3229 0.2328 -12% 27719 50 galactonic acid 0.3253 0.233 -14% 15122 50 glycerol 0.3269 0.233 16% Yes 33204 201 Metabolite-11859 0.3274 0.233 3% 32328 200 hexanoylcarnitine 0.3294 0.2334 -17% 1898 200 proline 0.3309 0.2334 -41% Yes 21421 50 Metabolite-08214 0.3322 0.2334 2% 32813 201 Metabolite-11496 0.335 0.2334 -4% 32697 200 Metabolite-11380 0.3352 0.2334 74% 22320 50 Metabolite-08889 0.3383 0.2334 48% 32634 201 Metabolite-11317 0.3387 0.2334 41%
33194 201 Metabolite-11849 0.3388 0.2334 -34% 527 50 lactate 0.3402 0.2335 95% Yes 33154 200 Metabolite-11809 0.3458 0.2356 -18% 32492 201 caprylate (8:0) 0.3467 0.2356 4% 32838 200 Metabolite-11521 0.3511 0.2371 -6% 32616 201 Metabolite-11299 0.3571 0.2402 -26% 22154 200 bradykinin 0.3614 0.2422 -4% Yes 32875 200 Metabolite-11558 0.3753 0.2495 -33% 32971 200 Metabolite-11654 0.3753 0.2495 -11% 16634 50 Metabolite-04357 0.3868 0.2551 2% 19576 50 Metabolite-06627 0.3898 0.2562 -1% 33570 200 Metabolite-12154 0.3919 0.2565 99% 2137 200 biliverdin 0.3952 0.2577 27% Yes 32854 200 Metabolite-11537 0.4062 0.2638 -3% 17747 200 sphingosine 0.4125 0.2669 -20% 1365 201 myristate (14:0) 0.4169 0.2683 66% Yes 32511 201 EDTA* 0.4192 0.2683 63% 32767 201 Metabolite-11450 0.4192 0.2683 7% 32847 201 Metabolite-11530 0.4303 0.2743 10% 17805 201 dihomolinolenate (20:2(n-6)) 0.4331 0.2743 15% 32793 200 Metabolite-11476 0.4346 0.2743 88% 12781 50 Metabolite-03099 0.4351 0.2743 64% 1648 50 serine 0.4384 0.2753 -10% Yes 32557 201 Metabolite-06126 0.4398 0.2753 -3% 1301 50 lysine 0.4438 0.2767 24% Yes 1126 50 alanine 0.4497 0.2786 2% Yes 569 200 caffeine 0.4501 0.2786 25% 32732 201 Metabolite-11415 0.4532 0.2788 -2% 33089 50 Metabolite-11744 0.4537 0.2788 64% 21184 200 oleoylglycerol (monoolein) 0.4564 0.2795 150% 22481 50 Metabolite-08988 0.4648 0.2828 -24% 18369 200 gamma-glutamylleucine 0.4651 0.2828 -9% Yes 20299 50 Metabolite-07266 0.4717 0.2858 14% 33882 201 Metabolite-12440 0.4802 0.2895 13% 1336 201 palmitate (16:0) 0.4822 0.2895 6% Yes 20489 50 glucose 0.4829 0.2895 46% 12764 50 Metabolite-03084 0.4883 0.2907 -66% 1493 200 ornithine 0.4906 0.2911 -6% Yes 32595 200 Metabolite-08893 0.4954 0.2929 40% 33968 201 5-dodecenoate (12:1(n-7)) 0.4994 0.2942 -1% 12761 50 Metabolite-03081 0.5076 0.298 20% 19374 50 Metabolite-06270 0.5136 0.2988 14% 22116 201 4-methyl-2-oxopentanoate 0.5162 0.2988 -52% 33447 201 palmitoleate (16:1(n-7)) 0.5171 0.2988 -12% 32656 201 Metabolite-11339 0.5186 0.2988 -3% 32669 200 Metabolite-11352 0.5188 0.2988 -11% 542 200 3-hydroxybutyrate (BHBA) 0.5194 0.2988 1% Yes 31401 50 Metabolite-10892 0.5325 0.3049 16% 32319 50 trans-4-hydroxyproline 0.5336 0.3049 137% 1302 200 methionine 0.5401 0.3068 142% Yes 32855 201 Metabolite-11538 0.543 0.3068 10% 12785 50 Metabolite-03103 0.5441 0.3068 18% 32553 201 Metabolite-03832 0.5469 0.3073 0% 32869 200 Metabolite-11552 0.5508 0.308 103% 12782 50 Metabolite-03100 0.553 0.308 38% 2730 200 gamma-glutamylglutamine 0.5534 0.308 71% 1564 50 citrate 0.5579 0.3089 18% Yes 32761 201 Metabolite-11444 0.5587 0.3089 15% 32632 200 Metabolite-11315 0.561 0.3092 37% 1605 201 ursodeoxycholate 0.5703 0.3124 2% 12593 50 Metabolite-02973 0.5707 0.3124 44% 32885 200 Metabolite-11568 0.5732 0.3124 -4% 32564 201 Metabolite-11247 0.5743 0.3124 -9% 3127 200 hypoxanthine 0.5759 0.3124 28% 1444 200 pipecolate 0.5811 0.3138 -7% 1644 201 heptanoate 0.5823 0.3138 -11% 33227 201 Metabolite-11882 0.5902 0.3171 13% 54 200 tryptophan 0.598 0.3203 -7% Yes 32418 201 myristoleate (14:1(n-5)) 0.6043 0.3215 95% 15753 201 hippurate 0.6049 0.3215 0% Yes 32774 200 Metabolite-11457 0.6122 0.3215 -49% 32648 201 Metabolite-11331 0.6136 0.3215 -4% 27710 50 N-acetylglycine 0.615 0.3215 -19% 606 201 uridine 0.6154 0.3215 -4% Yes 32797 201 Metabolite-11480 0.6159 0.3215 35% 31787 201 3-carboxy-4-methyl-5-propyl-2- 0.6206 0.3215 -60% furanpropanoate (CMPF) 32586 200 Metabolite-01327 0.6213 0.3215 -1% 32348 200 2-aminobutyrate 0.6217 0.3215 17% 31489 50 Metabolite-10914 0.6229 0.3215 8% 32748 201 Metabolite-11431 0.6286 0.3235 -21% 32815 201 Metabolite-11498 0.6324 0.3235 -9% 33138 200 Metabolite-11793 0.6362 0.3245 32% 12790 50 Metabolite-03108 0.6404 0.3249 -8% 12035 201 pelargonate (9:0) 0.6409 0.3249 28% Yes 27722 50 erythrose 0.6483 0.3277 -6% 33901 201 Metabolite-12456 0.6545 0.3298 -12% 15500 200 carnitine 0.6744 0.3389 136% Yes 33195 201 Metabolite-11850 0.6796 0.3405 -9% 594 201 nicotinamide 0.6834 0.3406 -26% 33638 201 Metabolite-12217 0.6867 0.3406 31% 32593 200 Metabolite-02036 0.6873 0.3406 -13% 16511 50 Metabolite-04274 0.6879 0.3406 -1% 17627 50 Metabolite-04986 0.6934 0.3409 -3% 12767 50 Metabolite-03087 0.696 0.3409 -5% 20694 50 oxalate (ethanedioate) 0.6974 0.3409 -8% Yes 27672 201 3-indoxyl sulfate 0.6979 0.3409 82% 15676 201 3-methyl-2-oxovalerate 0.6983 0.3409 -9% 1561 50 alpha-tocopherol 0.7092 0.3442 -6% Yes 32458 200 oleamide 0.7112 0.3442 8% 32342 200 adenosine 5'-monophosphate (AMP) 0.7171 0.3458 -12% 33131 200 Metabolite-11786 0.7186 0.3458 4% 33941 200 decanoylcarnitine 0.7205 0.3458 19% 27278 50 Metabolite-10510 0.7254 0.3472 3% 32970 201 Metabolite-11653 0.7333 0.35 -12% 32562 201 Metabolite-11245 0.736 0.3503 27% 21631 50 Metabolite-08403 0.7389 0.3507 -20% 33230 200 Metabolite-11885 0.7422 0.3513 -24% 587 50 gluconate 0.7493 0.3526 -38% 16508 50 Metabolite-04272 0.7548 0.3526 -8% 33587 201 eicosenoate [9 or 11, cis or trans] 0.7575 0.3526 1446% 24074 50 Metabolite-09706 0.7579 0.3526 45% 15737 50 glycolate (hydroxyacetate) 0.7599 0.3526 15% Yes 32489 201 caproate (6:0) 0.7624 0.3526 -24% 32636 201 Metabolite-11319 0.7652 0.3526 24% 33833 201 Metabolite-12405 0.7667 0.3526 52% 32863 201 Metabolite-11546 0.77 0.3526 55% 27738 50 threonate 0.7742 0.3526 23% 63 50 cholesterol 0.7753 0.3526 104% Yes 33402 200 Metabolite-12050 0.7784 0.3526 40% 32651 200 Metabolite-11334 0.7794 0.3526 37% 33265 200 Metabolite-11920 0.7797 0.3526 1% 32757 201 Metabolite-11440 0.78 0.3526 71% 512 50 asparagine 0.7878 0.3551 65% Yes 32857 200 Metabolite-11540 0.7901 0.3552 54% 31617 50 Metabolite-10963 0.7929 0.3555 61% 32738 200 Metabolite-11421 0.8008 0.3571 -28% 27256 50 Metabolite-10500 0.8059 0.3571 -4% 32558 201 p-cresol sulfate* 0.8079 0.3571 2% 27447 201 linoleoylglycerol (monolinolein) 0.808 0.3571 20% 1125 200 isoleucine 0.8081 0.3571 -11% Yes 16837 50 Metabolite-04507 0.8101 0.3571 -42% 60 200 leucine 0.8141 0.3572 -5% Yes 1494 200 5-oxoproline 0.8154 0.3572 31% Yes 33520 200 Metabolite-12105 0.819 0.3579 -2% 1110 201 arachidonate (20:4(n-6)) 0.8245 0.3594 -14% Yes 33972 201 10-nonadecenoate (19:1(n-9)) 0.8354 0.3613 17% 16666 50 Metabolite-04365 0.8692 0.3741 5% 33971 201 10-heptadecenoate (17:1(n-7)) 0.8763 0.3761 -16% 27264 50 Metabolite-10503 0.8865 0.3786 -14% 22570 50 Metabolite-09033 0.8891 0.3788 2% 12771 50 Metabolite-03091 0.8928 0.3794 74% 19490 50 Metabolite-06488 0.8965 0.3801 108% 32548 201 Metabolite-11231 0.9079 0.383 2% 21188 50 stearoylglycerol (monostearin) 0.909 0.383 49% Yes 33488 50 lathosterol 0.9118 0.383 24% 15630 200 N-acetylornithine 0.9125 0.383 -5% 21011 50 Metabolite-07888 0.9175 0.3837 -5% 32848 201 Metabolite-11531 0.9202 0.3837 -11% 33163 200 Metabolite-11818 0.9209 0.3837 -11% 15996 50 aspartate 0.9274 0.3855 -15% Yes 1649 200 valine 0.9428 0.391 61% Yes 2132 200 citrulline 0.9557 0.3939 31% Yes 25602 50 Metabolite-10432 0.9562 0.3939 -21% 32760 201 Metabolite-11443 0.9578 0.3939 9% 33936 200 octanoylcarnitine 0.9591 0.3939 -2% 33369 50 Metabolite-12023 0.9705 0.3976 -35% 3141 200 betaine 0.9845 0.4022 -18% 32520 200 Metabolite-11206 0.9863 0.4022 -21%
Pathway trend analysis showed strong differentiation of DCM patients in energy and lipid pathways, suggesting TCA cycle inhibition, glucogenic amino acid mobilization, and .beta.-oxidation increases. Adrenergic steroids (cortisol, cortisone) were increased, consistent with general stress, and androgen metabolites (DHEA-S) were strongly diminished in DCM patients, resulting in an apparent metabolic "feminization" of DCM males.
Comparison to the previous transgenic mouse DCM model plasma study showed that eight compounds, including urate, malate, tyrosine, phenylalanine, erythritol, and others exhibited similar responses and were strongly significant in both studies. Another 16 that were strongly significant in the human study trended in a similar manner in the mouse study. These included .alpha.-ketoglutarate, isocitrate, pantothenate, myo-inositol, and glutamate. The data confirm that metabolomic profiles of plasma reflect the disease state in human DCM patients, and that the transgenic mouse model shares many of the biomarker alterations associated with human disease.
T-tests are used to determine if the population means are different, but do not tell us about individual observations. Random Forest analysis is a multivariate technique for identifying compounds that distinguish the Groups. Random forests are used to classify individuals. Random forests are based on a consensus of a large number of decision trees; it is an extremely effective multivariate technique, being resistant to outliers, insensitive to method of normalization, and possesses highly predictive ability for new samples. Shown in Table 24 are results of using the biomarkers listed in Table 23 to classify the subjects as "Healthy" or "DCM". The subjects are correctly classified as Healthy (Control) 81% of the time and correctly classified as having DCM 72% of the time. Subjects are correctly classified with >75% accuracy overall.
TABLE-US-00025 TABLE 24 Random Forest Classification of DCM and Healthy subjects Control DCM error Control 25 6 19% DCM 11 28 28% OOB estimate of error rate: 24.29%
The biomarkers that are most important to correctly classify subjects are shown in Table 25.
TABLE-US-00026 TABLE 25 Important DCM biomarkers Metabolite-11556 4-acetamidobutanoate Metabolite-03951 Choline Metabolite-03056 Metabolite-11335 Metabolite-4523 erythronate Metabolite-11593 pseudouridine Metabolite-10395 Metabolite-12095 myo-inositol 3-indolepropionate deoxycholate Metabolite-11320 Metabolite-3090 Metabolite-5907 3-(4-hydroxyphenyl)lactate Metabolite-11490 paraxanthine Metabolite-11542 cortisol Metabolite-4361 creatine Metabolite-03653 Metabolite-11282 kynurenine
3D: Biomarkers of Obesity; Metabolites that are Differentially Present in Lean Compared to Obese Subjects
Biomarkers were discovered by (1) analyzing blood samples drawn from different groups of human subjects to determine the levels of metabolites in the samples and then (2) statistically analyzing the results to determine those metabolites that were differentially present in the two groups.
The plasma samples used for the analysis were from 40 lean subjects (BMI<25) and 40 obese subjects (BMI>30) that had been matched for age and gender. After the levels of metabolites were determined, the data was analyzed using univariate T-tests (i.e., Welch's T-test).
T-tests were used to determine differences in the mean levels of metabolites between the two populations (i.e., Obese vs. Lean).
Biomarkers:
As listed below in Table 26, biomarkers were discovered that were differentially present between samples from obese subjects and lean subjects.
Table 26 includes, for each listed biomarker, the p-value and q-value determined in the statistical analysis of the data concerning the biomarkers and an indication of the obese mean level, lean mean level, and the ratio of obese mean level to lean mean level (Table 26). The term "Isobar" as used in the table indicates the compounds that could not be distinguished from each other on the analytical platform used in the analysis (i.e., the compounds in an isobar elute at nearly the same time and have similar (and sometimes exactly the same) quant ions, and thus cannot be distinguished). Comp_ID refers to the compound identification number used as a primary key for that compound in the in-house chemical database. Library indicates the chemical library that was used to identify the compounds. The number 50 refers to the GC library and the number 61 refers to the LC library.
TABLE-US-00027 TABLE 26 Metabolite biomarkers that are differentially present in obese compared to lean subjects. Obese/ Mean Mean COMP_ID Library COMPOUND p-value q-value Lean LEAN OBESE 584 50 mannose <0.0001 <0.0001 1.873 0.71 1.33 20489 50 D-glucose <0.0001 <0.0001 1.500 0.78 1.17 18369 61 gamma-glu-leu <0.0001 <0.0001 1.407 0.86 1.21 20675 50 1-5-anhydro-D-glucitol <0.0001 <0.0001 0.629 1.24 0.78 1494 50 5-oxoproline <0.0001 <0.0001 0.433 1.57 0.68 15365 50 sn-glycerol-3-phosphate <0.0001 <0.0001 0.330 1.85 0.61 527 50 lactate <0.0001 <0.0001 0.263 1.86 0.49 22803 61 Isobar-66-includes- <0.0001 1.00E-04 0.207 3.92 0.81 3127 61 hypoxanthine <0.0001 1.00E-04 0.166 2.9 0.48 25402 50 Metabolite-10360 <0.0001 <0.0001 2.544 0.57 1.45 5652 61 Metabolite-1090 <0.0001 <0.0001 0.200 1.7 0.34 7650 61 Metabolite-1834 <0.0001 <0.0001 0.311 1.8 0.56 8959 61 Metabolite-2100 <0.0001 <0.0001 0.202 5.09 1.03 10087 61 Metabolite-2249 <0.0001 <0.0001 1.841 0.82 1.51 11053 61 Metabolite-2567 <0.0001 <0.0001 1.457 0.81 1.18 12667 50 Metabolite-3034 <0.0001 <0.0001 0.524 1.03 0.54 12969 61 Metabolite-3135 <0.0001 1.00E-04 0.197 4.01 0.79 15278 61 Metabolite-3843 <0.0001 <0.0001 1.547 0.75 1.16 16655 50 Metabolite-4362 <0.0001 <0.0001 2.185 0.65 1.42 16848 50 Metabolite-4511 <0.0001 <0.0001 0.460 1.13 0.52 17028 50 Metabolite-4611 <0.0001 <0.0001 0.782 1.1 0.86 18871 61 Metabolite-5848 <0.0001 <0.0001 0.380 2.21 0.84 21701 61 Metabolite-8454 <0.0001 <0.0001 5.638 0.47 2.65 21107 61 5-sulfosalicylate <0.0001 <0.0001 4.667 0.24 1.12 15686 50 beta-hydroxypyruvate <0.0001 <0.0001 1.506 0.77 1.16 541 61 4-hydroxyphenylacetate <0.0001 <0.0001 0.730 1.15 0.84 1303 50 malate <0.0001 <0.0001 0.407 1.94 0.79 8649 61 Metabolite-2053 <0.0001 <0.0001 1.407 0.81 1.14 10433 61 Metabolite-2293 <0.0001 <0.0001 10.000 0.13 1.3 11094 61 Metabolite-2589 <0.0001 <0.0001 8.727 0.11 0.96 15000 61 Metabolite-3758 <0.0001 <0.0001 14.091 0.11 1.55 16821 50 Metabolite-4498 <0.0001 <0.0001 0.613 0.93 0.57 17667 61 Metabolite-5026 <0.0001 <0.0001 259.000 0.01 2.59 18010 61 Metabolite-5231 <0.0001 <0.0001 0.425 1.53 0.65 19291 61 Metabolite-6132 <0.0001 <0.0001 3.920 0.25 0.98 19377 50 Metabolite-6272 <0.0001 <0.0001 0.532 1.26 0.67 19508 61 Metabolite-6549 <0.0001 <0.0001 4.781 0.32 1.53 19969 50 Metabolite-6931 <0.0001 <0.0001 1.605 0.76 1.22 21586 50 Metabolite-8359 <0.0001 <0.0001 2.200 0.5 1.1 21644 61 Metabolite-8406 <0.0001 <0.0001 12.917 0.12 1.55 21648 61 Metabolite-8407 <0.0001 <0.0001 11.636 0.11 1.28 21650 61 Metabolite-8409 <0.0001 <0.0001 10.500 0.12 1.26 21651 61 Metabolite-8410 <0.0001 <0.0001 22.600 0.05 1.13 21652 61 Metabolite-8411 <0.0001 <0.0001 50.400 0.05 2.52 21653 61 Metabolite-8412 <0.0001 <0.0001 249.000 0.02 4.98 21657 61 Metabolite-8416 <0.0001 <0.0001 15.000 0.09 1.35 21731 61 Metabolite-8474 <0.0001 1.00E-04 11.929 0.14 1.67 22880 50 Metabolite-9286 <0.0001 <0.0001 1.329 0.82 1.09 2150 61 pyridoxamine 1.00E-04 1.00E-04 1.274 0.84 1.07 24285 61 Metabolite-10026 1.00E-04 2.00E-04 1.333 0.87 1.16 5702 61 Metabolite-1114 1.00E-04 1.00E-04 0.466 1.16 0.54 21630 50 Metabolite-8402 1.00E-04 1.00E-04 1.422 0.83 1.18 22590 61 Metabolite-9040 1.00E-04 2.00E-04 3.783 0.69 2.61 25459 50 Metabolite-10395 1.00E-04 1.00E-04 0.671 1.4 0.94 10049 61 Metabolite-2238 1.00E-04 2.00E-04 6.308 0.39 2.46 12109 61 Metabolite-2853 1.00E-04 1.00E-04 0.475 1.62 0.77 14117 61 Metabolite-3441 1.00E-04 2.00E-04 0.364 2.64 0.96 16506 50 Metabolite-4271 1.00E-04 1.00E-04 0.382 1.57 0.6 17151 61 Metabolite-4656 1.00E-04 1.00E-04 5.833 0.24 1.4 21654 61 Metabolite-8413 1.00E-04 1.00E-04 >100 0.001 1.92 2832 61 adenosine-5-monophosphate 2.00E-04 2.00E-04 0.291 2.23 0.65 1670 50 urea 4.00E-04 5.00E-04 1.311 0.9 1.18 20769 61 maltotriitol 4.00E-04 4.00E-04 0.454 2.18 0.99 10299 61 Metabolite-2274 4.00E-04 4.00E-04 6.146 0.41 2.52 63 50 cholesterol 6.00E-04 5.00E-04 1.161 0.93 1.08 1110 50 arachidonic acid 6.00E-04 5.00E-04 0.685 1.27 0.87 19405 50 Metabolite-6347 6.00E-04 6.00E-04 1.679 0.81 1.36 9016 61 Metabolite-2109 7.00E-04 6.00E-04 1.695 0.95 1.61 1577 50 2-amino-butyrate 8.00E-04 8.00E-04 1.418 0.91 1.29 12625 50 Metabolite-3002 8.00E-04 8.00E-04 1.482 0.83 1.23 5800 61 Metabolite-1188 0.001 9.00E-04 0.271 2.47 0.67 19397 50 Metabolite-6326 0.001 9.00E-04 1.295 0.95 1.23 12726 50 Metabolite-3058 0.001 9.00E-04 0.752 1.21 0.91 6161 61 Phthalate-possible 0.0011 0.001 1.781 0.96 1.71 15683 50 4-methyl-2-oxopentanoate 0.0012 0.0011 1.283 0.92 1.18 18232 50 Metabolite-5403 0.0013 0.0011 1.250 0.92 1.15 18882 61 taurodeoxycholic acid 0.0018 0.0015 0.305 2.46 0.75 8509 61 Metabolite-2041 0.0018 0.0015 1.140 0.93 1.06 21188 50 1-stearoyl-rac-glycerol 0.0019 0.0016 1.753 0.77 1.35 19490 50 Metabolite-6488 0.0019 0.0016 2.033 0.6 1.22 12644 50 Metabolite-3016 0.002 0.0016 1.242 0.91 1.13 25548 50 Metabolite-10419 0.0021 0.0017 0.865 1.11 0.96 12459 61 Isobar-10-includes-glutamine- 0.0028 0.0022 1.168 0.95 1.11 H-beta-ala-gly-OH-1- methylguanine-H-Gly-Sar- OH-lysine 1413 61 3-hydroxyphenylacetate 0.003 0.0024 1.198 0.91 1.09 21047 61 3-methyl-2-oxobutyrate 0.0032 0.0025 1.519 0.81 1.23 16903 61 Metabolite-4547 0.0033 0.0025 1.505 0.97 1.46 22132 61 DL-alpha-hydroxyisocaproic 0.0037 0.0028 0.566 1.22 0.69 acid 21011 50 Metabolite-7888 0.0039 0.0029 1.508 0.65 0.98 10825 61 Metabolite-2546 0.0041 0.003 0.565 1.84 1.04 12912 61 Metabolite-3129 0.0046 0.0033 1.589 0.95 1.51 16893 61 Metabolite-4530 0.0046 0.0034 0.508 1.3 0.66 599 61 pyruvate 0.0052 0.0037 0.494 1.78 0.88 1604 61 uric acid 0.0054 0.0038 1.095 0.95 1.04 17068 61 Metabolite-4627 0.0056 0.0039 0.286 2.69 0.77 17614 50 Metabolite-4966 0.006 0.0042 1.454 0.97 1.41 19934 50 inositol 0.0062 0.0043 0.831 1.18 0.98 12673 50 Metabolite-3040 0.0063 0.0043 0.592 1.79 1.06 10551 61 Metabolite-2347 0.007 0.0048 0.235 3.27 0.77 22189 61 palmitoyl-carnitine 0.0076 0.0051 0.725 1.31 0.95 22020 50 Metabolite-8749 0.0077 0.0052 0.406 2.34 0.95 9491 61 Metabolite-2185 0.0081 0.0054 1.277 0.94 1.2 22602 50 Metabolite-9045 0.0097 0.0064 0.673 1.07 0.72 16071 50 Metabolite-4020 0.0103 0.0067 0.826 1.21 1 15677 61 3-methyl-L-histidine 0.0107 0.007 1.289 0.9 1.16 18476 61 glycocholic acid 0.0107 0.007 0.223 3.37 0.75 16496 50 Metabolite-4251 0.0122 0.0078 0.798 1.19 0.95 597 61 phosphoenolpyruvate 0.0127 0.008 0.735 1.02 0.75 6851 61 Metabolite-1497 0.0128 0.008 1.242 0.91 1.13 15650 61 1-methyladenosine 0.015 0.0093 1.117 0.94 1.05 22026 50 1-methylguanidine- 0.0151 0.0093 1.158 0.95 1.1 hydrochloride 12774 50 Metabolite-3094 0.0173 0.0106 0.842 1.14 0.96 7944 61 Metabolite-1915 0.0176 0.0107 2.514 1.38 3.47 14837 61 Metabolite-3707 0.0179 0.0108 1.911 1.12 2.14 13589 61 Metabolite-3327 0.0182 0.0109 0.374 2.97 1.11 9905 61 Metabolite-2231 0.0183 0.0109 1.195 0.87 1.04 12648 50 Metabolite-3020 0.0192 0.0115 0.745 1.41 1.05 10604 61 Metabolite-2370 0.0231 0.0136 0.719 1.35 0.97 17389 50 Metabolite-4796 0.0238 0.014 0.332 2.65 0.88 14715 61 Stachydrine-possible 0.0257 0.015 0.345 3.54 1.22 1574 61 histamine 0.0264 0.0152 0.841 1.07 0.9 15113 61 Metabolite-3783 0.0268 0.0153 1.268 0.97 1.23 19514 61 Metabolite-6553 0.0272 0.0155 1.620 0.5 0.81 20842 61 Metabolite-7765 0.0288 0.0162 0.513 2.32 1.19 20194 61 Metabolite-7147 0.0289 0.0162 0.887 1.06 0.94 5577 61 Metabolite-1065 0.0323 0.0179 2.106 1.41 2.97 15227 61 Metabolite-3816 0.0323 0.0179 0.767 1.29 0.99 15140 61 L-kynurenine 0.0329 0.0182 1.143 0.98 1.12 9748 61 Metabolite-2212 0.034 0.0187 0.723 1.41 1.02 5765 61 5-hydroxypentanoate-or-beta- 0.036 0.0197 0.562 2.01 1.13 hydroxyisovaleric acid- possible 19372 50 Metabolite-6269 0.038 0.0207 0.857 0.98 0.84 11111 61 Metabolite-2592 0.0404 0.0216 2.600 0.9 2.34 20166 61 Metabolite-7091 0.0415 0.0219 1.443 1.06 1.53 22133 61 DL-hexanoyl-carnitine 0.0429 0.0224 1.240 1 1.24 10629 61 Metabolite-2386 0.0467 0.0242 1.289 0.83 1.07 15122 50 glycerol 0.048 0.0248 1.175 0.97 1.14 1643 50 fumarate 0.051 0.0262 0.903 1.03 0.93 22337 61 Metabolite-8893 0.0518 0.0265 1.153 0.98 1.13 8469 61 Metabolite-2036 0.0521 0.0265 6.559 1.11 7.28 5687 61 Metabolite-1110 0.0547 0.0274 1.648 1.25 2.06 15500 61 carnitine 0.0591 0.0294 0.821 1.17 0.96 17048 61 Metabolite-4617 0.0614 0.0303 1.083 0.96 1.04 1105 50 Linoleic acid 0.0647 0.0316 0.882 1.1 0.97 20699 50 meso-erythritol 0.0703 0.0341 0.901 1.11 1 21763 61 Metabolite-8507 0.0712 0.0342 0.779 1.04 0.81 7941 61 Metabolite-1914 0.0724 0.0346 1.549 0.82 1.27 1336 50 n-hexadecanoic acid 0.0795 0.0379 0.885 1.13 1 9130 61 Metabolite-2139 0.0815 0.0386 1.212 0.99 1.2 12720 61 Metabolite-3056 0.0891 0.0421 0.847 1.18 1 17783 61 trans-2-3-4- 0.0906 0.0425 1.525 0.8 1.22 trimethoxycinnamic acid 16226 61 Isobar-28-includes-L- 0.0908 0.0425 0.871 1.16 1.01 threonine-L-allothreonine-L- homoserine-S-4-amino-2- hydroxybutyric acid 1358 50 octadecanoic acid 0.099 0.0461 0.916 1.07 0.98 542 50 3-hydroxybutanoic acid 0.1004 0.0466 0.624 1.97 1.23 6266 61 Metabolite-1286 0.1007 0.0466 1.052 0.97 1.02 18392 61 theobromine 0.1072 0.0494 1.629 1.05 1.71 20950 50 Metabolite-7846 0.1136 0.0521 0.579 2.35 1.36 18349 61 DL-indole-3-lactic acid 0.1144 0.0522 0.857 1.19 1.02 10245 61 Metabolite-2269- 0.1162 0.0522 1.487 1.13 1.68 17304 61 Metabolite-4759 0.1162 0.0522 1.233 0.9 1.11 18034 61 Metabolite-5234 0.1162 0.0522 1.295 1.12 1.45 22001 61 3-hydroxyoctanoate 0.1208 0.0541 0.773 1.32 1.02 1572 50 glyceric acid 0.126 0.0555 0.874 1.11 0.97 12856 61 Metabolite-3123 0.1261 0.0555 2.924 0.79 2.31 6497 61 Metabolite-1374 0.1277 0.056 1.402 1.02 1.43 16650 50 Metabolite-4360 0.1292 0.0565 0.713 1.29 0.92 10286 61 Metabolite-2272 0.1333 0.0578 0.625 1.68 1.05 18657 61 Metabolite-5726 0.1363 0.0588 0.816 1.14 0.93 15681 61 4-Guanidinobutanoic acid 0.1368 0.0588 0.896 1.06 0.95 8176 61 Metabolite-1974 0.1394 0.0595 1.260 0.96 1.21 21418 61 Isobar-56-includes-DL- 0.1529 0.0643 0.768 1.64 1.26 pipecolic acid-1-amino-1- cyclopentanecarboxylic acid 12710 61 Metabolite-3052 0.1538 0.0644 0.920 1 0.92 13545 61 Metabolite-3322 0.1626 0.0673 0.730 1.78 1.3 10715 61 Metabolite-2395 0.163 0.0673 1.527 1.29 1.97 17478 61 Metabolite-4873 0.1635 0.0673 1.481 0.81 1.2 19097 61 Metabolite-5969 0.1709 0.0698 1.174 0.92 1.08 18963 61 Metabolite-5918 0.1718 0.0699 2.337 1.01 2.36 24076 50 Metabolite-9726 0.1767 0.0714 1.110 1 1.11 17093 61 Metabolite-4642 0.1812 0.0729 1.146 0.96 1.1 10746 61 Isobar-6-includes-valine- 0.1889 0.0757 1.148 0.88 1.01 betaine 6362 61 p-cresol-sulfate 0.1896 0.0758 0.822 1.18 0.97 10092 61 Metabolite-2250 0.1908 0.0759 0.636 2.06 1.31 22261 61 Isobar-60-includes-s-2- 0.1987 0.0785 1.288 0.73 0.94 hydroxybutyrate-2- hydroxyisobutyrate 5733 61 Metabolite-1127 0.201 0.0792 0.884 1.12 0.99 20830 61 Metabolite-7762 0.2051 0.0802 1.357 0.98 1.33 10700 61 Metabolite-2393 0.2053 0.0802 0.928 1.11 1.03 22120 61 6-gamma-gamma- 0.2065 0.0802 0.951 1.03 0.98 dimethylallyl-amino-purine 16518 50 Metabolite-4276 0.2065 0.0802 1.154 0.91 1.05 18829 61 phenylalanine 0.2149 0.0832 0.952 1.05 1 14439 61 Metabolite-3498 0.2271 0.0876 1.072 0.97 1.04 8300 61 Metabolite-1988 0.2284 0.0878 1.165 1.03 1.2 6421 61 Metabolite-1345 0.2299 0.088 1.341 1.23 1.65 1508 61 pantothenic acid 0.2315 0.0884 1.167 1.02 1.19 15121 61 Metabolite-3786 0.2338 0.0889 0.763 1.18 0.9 18394 61 theophylline 0.2362 0.0893 1.420 1.19 1.69 12626 50 Metabolite-3003 0.2364 0.0893 0.901 1.01 0.91 6492 61 Metabolite-1371 0.2409 0.0907 1.369 1.11 1.52 6413 61 phenylacetylglutamine-or- 0.2441 0.0916 0.836 1.28 1.07 formyl-N-acetyl-5- methoxykynurenamine- possible 16662 61 Metabolite-4363 0.2586 0.0967 0.787 1.41 1.11 24077 50 Metabolite-9727 0.2726 0.1016 0.789 1.47 1.16 22259 61 Isobar-59-includes-N-6- 0.281 0.1041 1.106 0.94 1.04 trimethyl-L-lysine-H- homoarg-OH 15676 50 3-methyl-2-oxovaleric acid 0.283 0.1041 0.912 0.91 0.83 13208 61 Metabolite-3181 0.2918 0.107 0.904 1.04 0.94 10787 61 Metabolite-2507 0.2989 0.1092 1.308 1.04 1.36 18705 61 Metabolite-5768 0.3012 0.1097 0.822 1.35 1.11 16865 50 Metabolite-4522 0.314 0.1133 1.041 0.97 1.01 12756 50 Metabolite-3077 0.3211 0.1151 1.059 1.01 1.07 16909 61 Metabolite-4549 0.3323 0.1179 0.716 1.41 1.01 18702 61 Metabolite-5767 0.3381 0.1196 1.118 0.93 1.04 569 61 caffeine 0.3393 0.1196 0.683 3.82 2.61 1507 50 palmitoleic acid 0.34 0.1196 0.826 1.21 1 20248 61 Metabolite-7177 0.3483 0.1217 1.317 1.01 1.33 15253 61 Metabolite-3832-possible- 0.3576 0.1246 1.341 1.64 2.2 phenol-sulfate 1645 50 n-dodecanoate 0.3717 0.1291 0.922 1.16 1.07 22577 50 Metabolite-9035 0.384 0.1329 0.897 1.16 1.04 20267 61 Metabolite-7187 0.3923 0.1352 1.296 1.15 1.49 7933 61 Metabolite-1911 0.4027 0.1377 0.702 2.25 1.58 17066 61 Metabolite-4626 0.4028 0.1377 0.935 1.08 1.01 15529 61 Metabolite-3951 0.4084 0.1391 0.962 1.05 1.01 513 61 creatinine 0.413 0.1399 0.971 1.04 1.01 8072 61 Metabolite-1958 0.4193 0.1416 0.971 1.02 0.99 1564 50 citric acid 0.4489 0.1507 0.912 1.13 1.03
15737 50 hydroxyacetic acid 0.4522 0.1514 0.953 1.06 1.01 18015 61 Metabolite-A-3113 0.4749 0.1567 0.879 1.07 0.94 13142 61 Metabolite-3165 0.4763 0.1567 0.962 1.05 1.01 24233 61 Metabolite-9855 0.4766 0.1567 0.760 2.04 1.55 15663 61 2-3-dihydroxybenzoic acid 0.4858 0.1583 0.875 1.36 1.19 21421 50 Metabolite-8214 0.487 0.1583 1.040 1.01 1.05 16070 50 Metabolite-4019 0.487 0.1583 0.960 1.01 0.97 12478 61 Metabolite-2898 0.4959 0.16 1.384 1.51 2.09 17271 61 Metabolite-4746 0.4968 0.16 1.052 0.97 1.02 1417 61 Kynurenic acid 0.5074 0.162 1.066 1.06 1.13 11438 50 phosphate 0.5236 0.1667 0.980 1 0.98 14840 61 Metabolite-3708 0.5402 0.171 0.887 1.15 1.02 17665 61 p-hydroxybenzaldehyde 0.5451 0.1711 1.020 1 1.02 54 61 tryptophan 0.5459 0.1711 0.981 1.03 1.01 15017 61 Metabolite-3761 0.5464 0.1711 0.934 1.06 0.99 13179 61 Metabolite-3176-possible- 0.5563 0.1732 0.936 1.1 1.03 creatine 14961 61 Metabolite-3752 0.5662 0.1758 1.064 0.94 1 17298 61 Metabolite-4756 0.571 0.1768 1.071 0.98 1.05 22053 61 3-hydroxydecanoic acid 0.5741 0.1773 0.917 1.08 0.99 10317 61 Metabolite-2279 0.5777 0.1779 0.849 1.39 1.18 7029 61 Metabolite-1597 0.5816 0.1786 1.020 1 1.02 16244 61 Isobar-21-includes-gamma- 0.5964 0.1816 0.952 1.05 1 aminobutyryl-L-histidine-L- anserine 21044 50 Metabolite-s-2- 0.6118 0.1857 1.064 1.09 1.16 hydroxybutyric acid 10501 61 Metabolite-2321 0.6132 0.1857 1.099 1.21 1.33 19787 61 Metabolite-6746 0.62 0.187 0.981 1.05 1.03 1301 50 lysine 0.6207 0.187 0.922 1.29 1.19 16939 61 Metabolite-4586 0.6303 0.1889 1.032 0.93 0.96 19906 61 Metabolite-6827 0.6345 0.1896 1.071 1.12 1.2 10304 61 Metabolite-2276 0.6399 0.1897 1.164 1.34 1.56 22145 61 O-acetyl-L-carnitine- 0.6448 0.19 1.029 1.04 1.07 hydrochloride 5809 61 3-indoxyl-sulfate 0.646 0.19 0.936 1.1 1.03 18706 61 Metabolite-5769 0.6599 0.1935 0.963 1.08 1.04 12604 50 Metabolite-2981 0.6621 0.1936 1.020 0.99 1.01 17488 61 Metabolite-4887 0.6822 0.1975 0.966 0.89 0.86 1299 61 tyrosine 0.7135 0.2055 1.020 1.01 1.03 22154 61 bradykinin 0.7224 0.2069 0.925 1.46 1.35 606 61 uridine 0.7239 0.2069 1.020 1.01 1.03 12035 50 nonanate 0.7322 0.2087 0.990 0.99 0.98 6144 61 Metabolite-1215 0.7562 0.2145 0.861 3.88 3.34 21762 61 Metabolite-8506 0.785 0.222 0.939 1.65 1.55 1506 61 orotidine-5-phosphate 0.789 0.2226 0.971 1.03 1 13038 61 Metabolite-3143 0.7911 0.2227 0.943 1.23 1.16 2734 61 gamma-L-glutamyl-L- 0.8158 0.2262 1.021 0.97 0.99 tyrosine 12924 61 Metabolite-3131 0.8273 0.2288 1.033 1.22 1.26 1642 50 decanoic acid 0.8396 0.2305 1.022 0.93 0.95 22895 50 Metabolite-9299 0.8504 0.2323 1.023 0.86 0.88 16016 61 Metabolite-3994 0.8777 0.2388 1.024 0.84 0.86 15255 61 Metabolite-3833 0.8785 0.2388 1.040 1.24 1.29 13146 61 Metabolite-3166 0.8821 0.2392 0.970 0.99 0.96 17033 61 Metabolite-4613 0.8939 0.2412 1.021 0.95 0.97 15753 61 hippuric acid 0.9065 0.2441 1.022 1.38 1.41 15612 61 Metabolite-3972 0.9499 0.2546 1.000 0.97 0.97 18254 61 1-7-dimethylxanthine 0.9503 0.2546 1.026 1.94 1.99 594 61 niacinamide 0.9552 0.2548 1.024 0.83 0.85 15326 61 Metabolite-3879 0.9567 0.2548 0.985 1.31 1.29 15765 61 ethylmalonic acid 0.9909 0.2611 1.000 0.96 0.96 1570 50 oleic acid 0.9978 0.2623 1.000 1.03 1.03
3E: Algorithms (Models) for Diagnosing Metabolic Syndrome and Pre-Disposition to Metabolic Syndrome (Insulin Sensitivity).
Models were developed to test the ability to predict insulin sensitivity (Rd) and metabolic syndrome using the biomarker metabolites alone and/or in combination with clinical measures of metabolic syndrome (e.g. BMI, Rd). The plasma samples used for the analysis were from subjects with various rates of glucose disposal (Rd).
Algorithms for determining insulin sensitivity were developed by multiple iterations of regression analysis of glucose utilization rate (i.e. Rd) in combination with measurements of metabolite biomarkers. The samples were divided into two groups. The first group was used as a `training` set and the second group was used as a `test` set. Then a model was developed using the training set and the predictive power of the resulting model was determined using the test set. Several models were developed to identify the most important biomarker metabolites for predicting insulin sensitivity and thereby demonstrating the utility of this approach and these biomarker metabolites.
A model was developed to predict insulin sensitivity (i.e. Rd) using plasma samples collected from a cohort with varying levels of insulin sensitivity and BMI less than 27.9 and BMI greater than 27.9. For this model the training group included half of the plasma samples and was balanced for BMI and Rd. The model was then tested using a test group that included the other half of the samples and was also balanced for BMI and Rd. The results of this analysis showed that the best model for predicting insulin sensitivity includes: BMI and the biomarker metabolites glucose, 3-methyl-2-oxobutyric acid, 1,5-anhydroglucitol and metabolite-6268.
Another model was developed to predict insulin sensitivity (i.e. Rd) using plasma samples collected from a cohort with varying levels of insulin sensitivity and BMI less than 27.9. For this model the training group included half of the plasma samples and was balanced for insulin sensitivity (Rd). The model was then tested using a test group that included the other half of the plasma samples and was also balanced for Rd. The results of this analysis showed that the best model for predicting insulin sensitivity includes the biomarker metabolites: glucose, metabolite-2546, metabolite-2853, metabolite-2370 and metabolite-2386.
Yet another model was developed to predict insulin sensitivity (i.e. Rd) using plasma samples collected from a cohort with varying levels of insulin sensitivity and BMI greater than 27.9. For this model the training group included half of the plasma samples and was balanced for insulin sensitivity (Rd). The model was then tested using a test group that included the other half of the plasma samples and was also balanced for Rd. The results of this analysis showed that the best model for predicting insulin sensitivity includes the biomarker metabolites: 3-methyl-2-oxobutyric, metabolite-3097, metabolite-4020, metabolite-3056 and metabolite-1831.
The model: BMI and the biomarker metabolites glucose, 3-methyl-2-oxobutyric acid, 1,5-anhydroglucitol and metabolite-6268; was used on a new cohort to predict insulin sensitivity (Rd). The model was developed to predict insulin sensitivity (i.e. Rd) using plasma samples collected from a cohort with varying levels of insulin sensitivity and BMI less than 27.9 and BMI greater than 27.9, as described above. The samples used to test the model for this analysis were obtained from 19 Caucasian males aged 18-39, average age of 25.6, that had been diagnosed with metabolic syndrome and 19 healthy, age-matched, Caucasian males. Plasma samples and serum samples were evaluated. The results of this analysis show that the model could correctly predict insulin sensitivity in this new cohort using either plasma (FIG. 21) or serum (FIG. 22) samples.
Example 4
Treatment Response Biomarkers
Biomarkers that are predictive of response to treatment were identified through comparisons of subjects that were `non-responders` (i.e. those with little or no change (<15%) in Rd between baseline and 12 weeks post-treatment) and those subjects that were responsive to the treatment (i.e. `responders`). Biomarkers that were predictive of subjects as treatment responders or non-responders were based on compound levels at baseline only. The responders were defined either as those subjects with either a Rd change of 35% or higher or as those with a Rd change of 15% or higher. Data was analyzed by comparing Non-responders with both classes of Responders. Both analyses (i.e. Non-responder with Rd change under 15% vs Responder with Rd change over 35%, Non-responder with Rd change under 15% vs Responder with Rd change over 15%) were then combined and those biomarkers with a p value of <0.1 in EITHER of the 2 analyses were identified. The biomarkers are listed in Table 27. The biomarker measurements before treatment were predictive of thiazolidinedione (TZD) response, and thus can be used to select patients for treatment with TZD drugs. Experiments are planned to evaluate the biomarkers as predictive to other treatments for insulin sensitivity, pre-diabetes and diabetes control such as other therapeutic agents (e.g. metformin, etc.), weight loss, nutrition and other lifestyle modifications. This group of predictive biomarkers provide an extremely valuable tool for personalized medicine.
TABLE-US-00028 TABLE 27 Biomarkers to Classify Responders or Non-Responders of Treatment P value (Responder vs Non- COMPOUND LIB_ID COMP_ID Responder) Metabolite-11737 200 33082 0.0007 Metabolite-11849 201 33194 0.0013 inositol 50 19934 0.0041 glycerophosphorylcholine (GPC) 200 15990 0.0043 phenylalanine 200 64 0.0045 acetylcarnitine 200 32198 0.0049 linoleate (18:2(n-6)) 201 32673 0.0079 Metabolite-11845 201 33190 0.0098 tryptophan 200 54 0.0107 Metabolite-10407 50 25522 0.0113 Metabolite-11379 201 32696 0.0117 Metabolite-9727 50 24077 0.0136 Metabolite-11205 200 32519 0.0151 Metabolite-11883 200 33228 0.0168 Metabolite-10954_200 200 32734 0.0178 glycerol 50 15122 0.0182 gondoate-20-1-n-9- 201 32402 0.0182 Metabolite-03832_201 201 32553 0.0209 oleate (18:1(n-9)) 201 32630 0.0225 Metabolite-11793 200 33138 0.0225 gamma-glutamylphenylalanine- 200 33362 0.0231 Metabolite-11560 201 32877 0.0242 Metabolite-11247 201 32564 0.0273 Metabolite-11887 201 33232 0.0317 Metabolite-11206 200 32520 0.0317 tyrosine 200 1299 0.0317 Metabolite-12064 201 33416 0.0317 EDTA* 201 32511 0.0317 Metabolite-11790 200 33135 0.0338 3-hydroxybutyrate (BHBA) 50 542 0.0339 palmitoleate (16:1(n-7)) 201 32628 0.0412 lysine 50 1301 0.0468 Metabolite-11314 200 32631 0.0468 Metabolite-11204 200 32518 0.0468 Metabolite-11437 201 32754 0.0491 alpha linolenate (18:3(n-3)) 201 32416 0.0499 peptide- 200 31548 0.0531 DSGEGDFXAEGGGVR Metabolite-11874 201 33219 0.0531 palmitate (16:0) 201 1336 0.0547 methionine 201 1302 0.0566 glycerol 3-phosphate (G3P) 50 15365 0.0566 Metabolite-2800 50 16287 0.0593 Metabolite-11522 201 32839 0.0611 Metabolite-11421 200 32738 0.062 Metabolite-11881 201 33226 0.0637 4-methyl-2-oxopentanoate 201 22116 0.0637 quinate 50 18335 0.0649 pelargonate-9-0- 201 12035 0.0676 creatinine 200 513 0.0676 3-methyl-2-oxobutyrate 201 21047 0.0676 Metabolite-11235 201 32552 0.0692 Metabolite-6272 50 19377 0.071 Metabolite-10360 50 25402 0.0726 saccharin 201 21151 0.0734 Metabolite-11593 201 32910 0.0742 ornithine 50 1493 0.076 cholate 201 22842 0.0775 1,6-anhydroglucose 50 21049 0.0787 Metabolite-11435 201 32752 0.0829 Metabolite-11832 201 33177 0.0891 deoxycholate 201 1114 0.0902 Metabolite-11880 201 33225 0.0902 docosahexaenoate (DHA) 50 19323 0.0927 Metabolite-12056 200 33408 0.0981 Metabolite-3075 50 12754 0.0987
Recursive analysis was carried out on the subjects. Baseline levels (i.e. prior to treatment) of the biomarker compounds were determined in the Responders (subjects with a post-treatment increase in Rd.gtoreq.35%, N=28) and the Non-Responders (subjects with a post-treatment Rd increase of <15%, N=14). The results of this analysis showed that the subjects were classified with an AUC of 0.8214. The analysis further identified "Metabolite-11737" as a biomarker that is particularly important in the classification of responders and non-responders. Using the baseline level of only this biomarker, 22 of 28 Responders were correctly classified and 12 of 14 Non-Responders were correctly classified. This marker alone had a sensitivity of 78.6% and a specificity of 85.7%. The Positive Predictive Value (PPV) was 91.7% and the Negative Predictive Value (NPV) was 66.7%.
Biomarkers that are pharmacodynamic (PD) biomarkers of treatment effectiveness were identified through comparisons of non-responders (i.e. those with little or no change (<15%) in Rd between baseline and 12 weeks post-treatment) vs responders. The PD biomarkers were based on the difference between baseline and 12 weeks post-treatment. Biomarkers were identified that showed changes from baseline levels upon TZD treatment and tracked with the change in insulin sensitivity in those subjects. These biomarkers are listed in Table 28.
TABLE-US-00029 TABLE 28 Pharmacodynamic Biomarkers of Treatment Response P-Value (Responder vs Non- COMPOUND COMP_ID LIB_ID Responder) Metabolite-11737 33082 200 0.0007 Metabolite-11849 33194 201 0.0013 palmitoylglycerol 21127 50 0.0041 (monopalmitin) glutamate 12751 50 0.0041 glycerophosphorylcholine (GPC) 15990 200 0.0043 acetylcarnitine 32198 200 0.0049 gamma-glutamylphenylalanine 33362 200 0.0052 alpha-tocopherol 1561 50 0.0053 glucose 20488 50 0.0062 phenylalanine 64 200 0.0071 inositol 19934 50 0.0075 Metabolite-9727 24077 50 0.0079 Metabolite-11385 32702 200 0.0083 Metabolite-11845 33190 201 0.0098 tryptophan 54 200 0.0107 Metabolite-10407 25522 50 0.0113 erythritol 20699 50 0.0136 Metabolite-11205 32519 200 0.0151 Metabolite-11883 33228 200 0.0168 Metabolite-10954 32734 200 0.0178 methionine 1302 201 0.0196 Metabolite-03832 32553 201 0.0209 5-oxoproline 1494 200 0.0242 Metabolite-4611 17028 50 0.0242 linoleate (18:2(n-6)) 32673 201 0.0258 galactonic acid 27719 50 0.0259 Metabolite-11247 32564 201 0.0273 dipalmitin 27392 50 0.0297 tyrosine 1299 200 0.0317 Metabolite-11379 32696 201 0.035 Metabolite-11560 32877 201 0.0387 Metabolite-11437 32754 201 0.0491 Metabolite-11206 32520 200 0.0492 Metabolite-11475 32792 201 0.0564 Metabolite-11254 32571 200 0.0564 Metabolite-10610 27889 50 0.0564 glycerol 3-phosphate (G3P) 15365 50 0.0566 gondoate-20-1-n-9 32402 201 0.0566 Metabolite-2800 16287 50 0.0593 Metabolite-11386 32703 200 0.06 Metabolite-4055 16120 50 0.06 Metabolite-11421 32738 200 0.062 Metabolite-11244 32561 201 0.0637 Metabolite-6486 19487 50 0.0637 Metabolite-7846 20950 50 0.0637 quinate 18335 50 0.0649 Metabolite-11881 33226 201 0.0649 3-methyl-2-oxovalerate 15676 201 0.0676 Metabolite-9045 22602 50 0.0676 Metabolite-4360 16650 50 0.0676 Metabolite-11788 33133 200 0.0676 Metabolite-6272 19377 50 0.071 3-hydroxybutyrate (BHBA) 542 50 0.071 oleate (18:1(n-9)) 32630 201 0.071 Metabolite-10360 25402 50 0.0726 saccharin 21151 201 0.0734 Metabolite-11593 32910 201 0.0742 Metabolite-11790 33135 200 0.0749 kynurenine 15140 200 0.076 Metabolite-4357 16634 50 0.076 Metabolite-3100 12782 50 0.076 cholate 22842 201 0.0775 1,6-anhydroglucose 21049 50 0.0787 Metabolite-11887 33232 201 0.081 glycerol 15122 50 0.081 Metabolite-06126 32557 201 0.0829 Metabolite-4986 17627 50 0.0853 Metabolite-3099 12781 50 0.0902 Metabolite-11314 32631 200 0.0921 docosahexaenoate (DHA) 19323 50 0.0927 Metabolite-11522 32839 201 0.0954 Metabolite-01142 32747 201 0.0954 Metabolite-3075 12754 50 0.0987
Recursive analysis was carried out on the subjects. Baseline levels (i.e. prior to treatment) and post-treatment levels of the biomarker compounds were determined in the Responders (subjects with a post-treatment increase in Rd.gtoreq.35%, N=28) and the Non-Responders (subjects with a post-treatment Rd increase of <15%, N=14). The results of this analysis showed that the subjects were classified with an AUC of 0.7679. Additional experiments are planned to evaluate the biomarkers as PD biomarkers for other insulin sensitivity, pre-diabetes and diabetes therapeutic agents (e.g. metformin, etc.) as well as treatments involving modification to diet (e.g. weight loss, nutrition) and lifestyle (e.g. exercise).
Example 5
Analytical Characterization of Unnamed Biomarkers Compounds
Table 29 below includes analytical characteristics of each of the unnamed metabolites listed in the Tables above. The table includes, for each listed Metabolite, the retention time (RT), retention index (RI), mass, quant mass, and polarity obtained using the analytical methods described above. "Mass" refers to the mass of the C12 isotope of the parent ion used in quantification of the compound. "Polarity" indicates the polarity of the quantitative ion as being either positive (+) or negative (-).
TABLE-US-00030 TABLE 29 Analytical characteristics of biomarker metabolites. COMP_ID COMPOUND LIBRARY RT RI MASS POLARITY 25532 Metabolite-10413 50 12.53 2042.7 204.1 +L 25602 Metabolite-10432 50 12.29 2031.5 204 +L 27256 Metabolite-10500 50 5.3 1229.9 211 +L 27264 Metabolite-10503 50 7.28 1452.4 244 +L 27889 Metabolite-10610 50 11.93 1987 204 +L 30288 Metabolite-10750 50 5.51 1265 102.9 +L 30290 Metabolite-10752 50 6.07 1323.7 231 +L 30832 Metabolite-10814 50 12.84 2094 204.1 +L 31373 Metabolite-10878 50 8.22 1583 334.1 +L 31509 Metabolite-10931 50 12.02 1984 174.1 +L 31518 Metabolite-10933 50 11.99 1979 318.1 +L 12781 Metabolite-3099 50 11.77 2002.3 204 +L 12782 Metabolite-3100 50 11.85 2010.7 204 +L 12795 Metabolite-3113 50 12.73 2111.4 406.2 +L 16120 Metabolite-4055 50 12.04 2021.4 304.1 +L 16138 Metabolite-4080- 50 14.02 2266.9 299 +L retired for 1-palmitoyl- sn-glycero-3- phosphocholine 16509 Metabolite-4273 50 10.34 1844.2 457.2 +L 16511 Metabolite-4274 50 10.37 1854.7 158.1 +L 16512 Metabolite-4275- 50 10.68 1884.6 345.2 +L retired-part of X- 3078 16518 Metabolite-4276- 50 13.92 2261 223.1 +L retired for gamma- tocopherol* 16634 Metabolite-4357 50 8 1540.5 216 +L 16650 Metabolite-4360 50 9.15 1678.4 347.2 +L 16665 Metabolite-4364- 50 10.66 1852.1 232 +L retired for L- asparagine-3 16666 Metabolite-4365 50 11.05 1893.1 204 +L 16829 Metabolite-4503 50 8.39 1589.3 227.2 +L 17028 Metabolite-4611- 50 8.07 1546.9 292.1 +L retired for erythronic acid* 17330 Metabolite-4769 50 11.3 1916.6 156 +L retired for glutamine-2 17389 Metabolite-4796 50 3.53 1043.2 117 +L 17690 Metabolite-5207 50 7.41 1493.6 151 +L 18120 Metabolite-5348 50 9.25 1681.5 217.9 +L 19462 Metabolite-6446 50 3.49 1021.1 204.1 +L 19478 Metabolite-6467 50 11.09 1893.4 320.1 +L 19487 Metabolite-6486 50 11.6 1949.8 217 +L 19576 Metabolite-6627 50 11.96 1990.7 304.2 +L 19983 Metabolite-6955 50 11.82 1979.1 306.1 +L 12162 Metabolite-A-2339 50 3.86 1109.8 221.0 +L 12222 Metabolite-A-2374 50 7.35 1510.9 188.0 +L 12803 Metabolite-A-2441 50 13.94 2270.9 129.0 +L 16074 Metabolite-A-2758 50 8.22 1597.1 211.0 +L 16285 Metabolite-A-2798 50 3.44 1005.8 163.0 +L 16287 Metabolite-A2800 50 3.53 1015.5 191.1 +L 24360 Metabolite-10206 50 9.04 1639.0 243.0 +L 25402 Metabolite-10360 50 10.23 1780.0 204.0 +L 25429 Metabolite-10369 50 10.92 1859.0 333.0 +L 25459 Metabolite-10395 50 9.94 1768.9 156.0 +L 25522 Metabolite-10407 50 9.94 1748.0 217.1 +L 25548 Metabolite-10419 50 16.29 2527.0 311.3 +L 25584 Metabolite-10425 50 7.52 1488.8 123.9 +L 25597 Metabolite-10427 50 11.21 1911.1 183.0 +L 25598 Metabolite-10428 50 11.31 1922.0 156.0 +L 25599 Metabolite-10429 50 11.60 1953.5 265.0 +L 25607 Metabolite-10437 50 8.43 1596.0 331.1 +L 25609 Metabolite-10439 50 8.84 1643.3 331.1 +L 25649 Metabolite-10450 50 17.00 2643.0 371.3 +L 27137 Metabolite-10498 50 12.06 1991.8 299.1 +L 27271 Metabolite-10504 50 9.94 1763.0 348.2 +L 27272 Metabolite-10505 50 10.82 1862.0 457.3 +L 27273 Metabolite-10506 50 11.30 1914.0 218.1 +L 27275 Metabolite-10507 50 11.97 1988.0 370.2 +L 27278 Metabolite-10510 50 15.77 2470.0 297.2 +L 27279 Metabolite-10511 50 17.12 2645.0 309.3 +L 27288 Metabolite-10517 50 10.16 1775.0 419.2 +L 27326 Metabolite-10527 50 11.71 1950.0 221.1 +L 27678 Metabolite-10584- 50 10.15 1779.0 217.0 +L retired for glucose-3 27841 Metabolite-10595 50 4.14 1101.0 151.0 +L 27888 Metabolite-10609 50 11.70 1961.0 348.2 +L 27890 Metabolite-10611 50 12.03 1998.0 369.1 +L 28059 Metabolite-10650 50 10.26 1800.6 345.1 +L 29817 Metabolite-10683 50 5.12 1213.8 171.0 +L 30265 Metabolite-10732 50 12.22 2024.0 204.0 +L 30273 Metabolite-10736 50 10.03 1814.0 342.1 +L 30282 Metabolite-10744 50 15.75 2503.0 311.2 +L 12533 Metabolite-2915 50 3.77 1099.0 174.0 +L 12593 Metabolite-2973 50 4.74 1213.4 281.0 +L 12604 Metabolite-2981 50 5.21 1265.2 211.0 +L 12609 Metabolite-2986 50 5.56 1304.3 201.0 +L 12625 Metabolite-3002 50 6.74 1440.8 296.0 +L 12626 Metabolite-3003 50 6.79 1446.6 218.0 +L 12638 Metabolite-3011 50 7.08 1479.2 174.0 +L 12639 Metabolite-3012 50 7.17 1489.8 232.0 +L 12644 Metabolite-3016 50 7.58 1537.5 186.0 +L 12645 Metabolite-3017 50 7.61 1541.4 246.0 +L 12647 Metabolite-3019 50 7.74 1556.4 260.0 +L 12648 Metabolite-3020 50 7.81 1564.1 292.0 +L 12650 Metabolite-3022 50 7.98 1584.9 142.0 +L 12656 Metabolite-3025 50 8.11 1600.3 274.0 +L 12658 Metabolite-3026 50 8.17 1606.1 274.0 +L 12663 Metabolite-3030 50 8.62 1659.7 320.0 +L 12666 Metabolite-3033 50 8.88 1689.4 117.0 +L 12667 Metabolite-3034 50 8.92 1694.9 299.0 +L 12673 Metabolite-3040 50 9.27 1735.7 274.0 +L 12726 Metabolite-3058 50 9.70 1786.9 335.0 +L 12742 Metabolite-3067 50 10.02 1824.2 132.0 +L 12751 Metabolite-3073 50 10.17 1838.8 362.0 +L 12753 Metabolite-3074 50 10.22 1844.5 204.0 +L 12754 Metabolite-3075 50 10.36 1857.9 204.0 +L 12756 Metabolite-3077 50 10.44 1866.2 308.0 +L 12757 Metabolite-3078 50 10.65 1887.0 203.0 +L 12767 Metabolite-3087 50 11.19 1942.0 174.0 +L 12768 Metabolite-3088 50 11.23 1946.1 372.0 +L 12770 Metabolite-3090 50 11.31 1955.0 243.0 +L 12771 Metabolite-3091 50 11.41 1966.2 232.0 +L 12773 Metabolite-3093 50 11.50 1975.6 204.0 +L 12774 Metabolite-3094 50 11.55 1980.6 299.0 +L 12777 Metabolite-3097 50 11.64 1990.4 204.0 +L 12780 Metabolite-3098 50 11.75 2003.0 308.0 +L 12783 Metabolite-3101 50 11.93 2022.2 290.0 +L 12785 Metabolite-3103 50 12.09 2039.8 290.0 +L 12789 Metabolite-3107 50 12.21 2053.2 204.0 +L 12790 Metabolite-3108 50 12.24 2056.5 246.0 +L 12791 Metabolite-3109 50 12.56 2092.6 202.0 +L 12796 Metabolite-3114 50 12.79 2120.6 204.0 +L 16028 Metabolite-3998 50 5.22 1252.7 171.0 +L 16044 Metabolite-4005 50 6.53 1401.3 86.0 +L 16060 Metabolite-4014 50 7.17 1474.9 252.0 +L 16070 Metabolite-4019 50 7.68 1534.5 174.0 +L 16071 Metabolite-4020 50 7.91 1561.5 220.0 +L 16116 Metabolite-4051 50 11.56 1970.2 357.0 +L 16290 Metabolite-4133 50 4.35 1108.9 198.0 +L 16308 Metabolite-4147 50 10.07 1767.1 290.0 +L 16496 Metabolite-4251 50 4.09 1130.7 217.0 +L 16506 Metabolite-4271 50 9.69 1777.4 419.0 +L 16653 Metabolite-4361 50 9.40 1706.2 232.0 +L 16655 Metabolite-4362 50 10.02 1779.9 319.0 +L 16819 Metabolite-4496 50 6.76 1398.2 204.0 +L 16821 Metabolite-4498 50 7.06 1434.9 103.0 +L 16831 Metabolite-4504 50 8.46 1597.1 244.0 +L 16843 Metabolite-4510 50 9.70 1740.1 254.0 +L 16848 Metabolite-4511 50 10.09 1788.4 206.0 +L 16859 Metabolite-4516 50 11.00 1886.5 217.0 +L 16860 Metabolite-4517 50 11.06 1892.7 217.0 +L 16865 Metabolite-4522 50 12.26 2025.4 217.0 +L 16983 Metabolite-4598 50 6.69 1392.2 170.0 +L 16984 Metabolite-4599 50 7.42 1471.1 113.0 +L 17064 Metabolite-4624 50 10.01 1779.1 342.0 +L 17083 Metabolite-4634 50 11.00 1884.3 333.0 +L 17327 Metabolite-4767 50 8.77 1626.2 117.0 +L 17359 Metabolite-4791 50 10.29 1796.4 366.5 +L 17390 Metabolite-4806 50 4.20 1122.8 105.0 +L 17614 Metabolite-4966 50 9.66 1749.4 218.0 +L 17627 Metabolite-4986 50 11.56 1956.4 204.0 +L 17971 Metabolite-5210 50 8.47 1616.4 254.0 +L 17975 Metabolite-5211 50 8.77 1652.1 326.0 +L 17978 Metabolite-5213 50 8.97 1675.3 111.0 +L 17987 Metabolite-5228 50 6.97 1442.5 181.0 +L 18118 Metabolite-5346 50 8.33 1573.0 202.0 +L 18122 Metabolite-5349 50 10.10 1782.2 312.0 +L 18146 Metabolite-5366 50 12.49 2044.7 204.0 +L 18147 Metabolite-5367 50 12.77 2079.3 171.0 +L 18232 Metabolite-5403 50 5.92 1300.2 319.0 +L 18273 Metabolite-5420 50 9.09 1669.0 417.0 +L 18384 Metabolite-5487 50 7.01 1426.3 204.0 +L 18388 Metabolite-5491 50 8.30 1575.9 129.0 +L 18868 Metabolite-5847 50 12.35 2040.0 288.2 +L 18929 Metabolite-5907 50 8.69 1643.2 229.1 +L 19110 Metabolite-5978 50 7.52 1468.9 232.1 +L 19362 Metabolite-6226 50 4.38 1137.4 154.0 +L 19363 Metabolite-6227 50 5.00 1210.5 196.1 +L 19364 Metabolite-6246 50 6.94 1428.2 160.1 +L 19367 Metabolite-6266 50 9.15 1683.5 240.2 +L 19368 Metabolite-6267 50 9.32 1704.5 257.1 +L 19370 Metabolite-6268 50 9.91 1773.8 271.1 +L 19372 Metabolite-6269- 50 10.88 1880.9 217.1 +L retired for inositol-3 19374 Metabolite-6270 50 11.35 1929.6 320.2 +L 19377 Metabolite-6272 50 12.60 2069.6 131.0 +L 19383 Metabolite-6286 50 16.36 2553.7 311.3 +L 19397 Metabolite-6326 50 7.66 1510.9 144.1 +L 19402 Metabolite-6346 50 8.00 1550.8 263.2 +L 19405 Metabolite-6347 50 8.16 1568.7 244.1 +L 19414 Metabolite-6350 50 11.41 1937.2 169.0 +L 19490 Metabolite-6488 50 12.25 2021.7 204.1 +L 19494 Metabolite-6506 50 12.81 2084.7 204.1 +L 19596 Metabolite-6647 50 9.13 1696.7 197.1 +L 19597 Metabolite-6648 50 9.17 1702.1 313.2 +L 19599 Metabolite-6649 50 11.47 1955.4 299.2 +L 19623 Metabolite-6671 50 9.65 1738.4 229.0 +L 19955 Metabolite-6907 50 9.22 1686.9 337.1 +L 19961 Metabolite-6913 50 9.53 1726.0 171.0 +L 19968 Metabolite-6930 50 10.32 1809.4 331.2 +L 19969 Metabolite-6931 50 10.35 1819.6 267.1 +L 20299 Metabolite-7266 50 7.82 1517.6 115.0 +L 20950 Metabolite-7846 50 5.10 1208.1 145.1 +L 21011 Metabolite-7888 50 15.96 2513.3 311.3 +L 21012 Metabolite-7889 50 16.83 2629.4 311.3 +L 21013 Metabolite-7890 50 17.76 2752.2 129.0 +L 21415 Metabolite-8209 50 14.77 2338.0 456.5 +L 21421 Metabolite-8214 50 17.13 2646.6 311.2 +L 21586 Metabolite-8359 50 7.14 1457.8 253.0 +L 21630 Metabolite-8402 50 15.27 2424.0 283.1 +L 21631 Metabolite-8403 50 15.96 2516.6 309.2 +L 22020 Metabolite-8749- 50 9.74 1763.0 204.1 +L retired for fructose-4 22032 Metabolite-8766 50 12.22 2034.0 315.1 +L 22054 Metabolite-8792 50 17.61 2737.0 129.0 +L 22320 Metabolite-8889 50 8.62 1635.0 521.2 +L 22480 Metabolite-8987 50 7.02 1449.7 160.1 +L 22494 Metabolite-8994 50 10.76 1879.0 447.2 +L 22507 Metabolite-9010- 50 12.98 2126.2 217.1 +L retired for adenosine-1 22548 Metabolite-9026 50 8.45 1600.0 156.0 +L 22555 Metabolite-9027 50 8.50 1605.0 357.2 +L 22570 Metabolite-9033 50 9.61 1736.4 217.1 +L 22572 Metabolite-9034 50 9.63 1739.1 241.1 +L 22577 Metabolite-9035 50 9.82 1760.7 285.1 +L 22600 Metabolite-9043 50 11.75 1974.1 204.1 +L 22601 Metabolite-9044 50 13.38 2169.0 204.1 +L 22602 Metabolite-9045 50 13.91 2239.0 450.3 +L 22609 Metabolite-9047 50 8.06 1574.0 243.2 +L 22649 Metabolite-9108 50 11.20 1896.0 156.0 +L 22880 Metabolite-9286 50 8.77 1617.5 221.0 +L 22895 Metabolite-9299 50 10.54 1827.5 305.1 +L 22993 Metabolite-9448 50 14.86 2352.5 343.2 +L 24074 Metabolite-9706 50 4.39 1107.0 190.0 +L 24076 Metabolite-9726 50 4.91 1167.0 245.0 +L 24077 Metabolite-9727 50 5.24 1204.0 177.0 +L 10737 Isobar 01 61 1.45 1481.0 225.0 -i 10743 Isobar 04 61 1.52 1567.0 195.0 -i 10746 Isobar 06 61 2.13 2160.0 118.0 +i 10750 Isobar 08 61 10.04 10116.0 138.0 +i 12459 Isobar 10 61 1.40 1527.0 147.0 +i 16233 Isobar 13 61 1.40 1530.0 193.0 -i 16232 Isobar 17 61 1.49 1620.0 175.0 +i 16235 Isobar 19 61 1.55 1700 199 -i 16244 Isobar 21 61 1.59 1620.0 241.0 +i 16228 Isobar 22 61 1.55 1635.0 148.0 +i 16229 Isobar 24 61 1.43 1545.0 153.0 +i 16226 Isobar 28 61 1.46 1525.0 120.0 +i 18829 Isobar 45 61 8.38 8475.0 166.2 +i 18882 Isobar 47 61 15.51 15700.0 498.4 -i 21404 Isobar 48 61 1.50 1550.0 106.1 +i 21410 Isobar 52 61 1.55 1650.0 134.1 +i
21418 Isobar 56 61 2.45 2850.0 130.1 +i 22258 Isobar 58 61 1.38 1620.0 164.0 +i 22259 Isobar 59 61 1.82 1700.0 189.1 +i 22261 Isobar 60 61 4.26 4725.0 148.9 -i 22262 Isobar 61 61 9.30 9675.0 174.8 -i 22803 Isobar 66 61 15.06 15500.0 450.2 +i 27773 Isobar 71 61 1.57 1700.0 206.9 -i 32718 Metabolite- 200 2.8 2848 265.1 +i 01342_200 32735 Metabolite- 200 4.26 4275 464.1 +i 01911_200 32596 Metabolite- 200 5.14 5158 286.2 +i 02250_200-retired for piperine 32672 Metabolite- 200 0.75 764 129.2 +i 02546_200 32829 Metabolite- 200 0.82 826 144.2 +i 03653_200-retired for stachydrine 32595 Metabolite- 200 5.19 5200 431.9 +i 08893_200 32734 Metabolite- 200 4.14 4229 288.2 +i 10954_200-retired for (+/-) octanoyl carnitine 32514 Metabolite-11200- 200 5.62 5637 496.4 +i retired for 1-palmitoyl- sn-glycero-3- phosphocholine 32516 Metabolite-11202- 200 5.8 5823 524.4 +i retired for 1-stearoyl- sn-glycero-3- phosphocholine 32517 Metabolite-11203- 200 5.65 5665 522.4 +i retired for 1-Oleoyl- sn-glycero-3- phosphocholine 32518 Metabolite-11204 200 5.26 5263 229.2 +i 32519 Metabolite-11205- 200 5.55 5558 520.4 +i retired for 1-linoleoyl GPC 32520 Metabolite-11206 200 0.59 575 138.8 +i 32578 Metabolite-11261 200 3.69 3600 286.2 +i 32631 Metabolite-11314 200 0.64 634 243 +i 32632 Metabolite-11315 200 1.19 1210 130.2 +i 32644 Metabolite-11327 200 5.16 5176 269.2 +i 32652 Metabolite-11335 200 0.97 991 229.2 +i 32654 Metabolite-11337 200 1 1020 160.2 +i 32671 Metabolite-11354 200 0.76 770 146.2 +i 32738 Metabolite-11421 200 4.54 4575 314.2 +i 32786 Metabolite-11469 200 3.82 3874 239.1 +i 32793 Metabolite-11476 200 4.52 4525 189.1 +i 32875 Metabolite-11558 200 5.64 5606 420.2 +i 32971 Metabolite-11654- 200 2.53 2500 246.2 +i retired for isovaleryl- L-carnitine 33080 Metabolite-11735 200 2.51 2584 207.2 +i 33081 Metabolite-11736 200 2.58 2639 379.4 +i 33082 Metabolite-11737 200 2.7 2747 235.2 +i 33132 Metabolite-11787 200 1.13 1126 148.1 +i 33135 Metabolite-11790 200 3.4 3472 823.3 +i 33138 Metabolite-11793 200 3.57 3634 601.1 +i 33228 Metabolite-11883 200 5.54 5524 544.3 +i 33323 Metabolite-11977 200 3.21 3287 270.1 +i 33403 Metabolite-12051 200 5.83 5739 456.4 +i 33408 Metabolite-12056 200 1.12 1129 156.2 +i 33531 Metabolite-12116 200 1.6 1640 286.1 +i 33587 Isobar: cis-9, cis-11, 201 6.13 5955 309.4 -i trans-11 eicosenoate 32747 Metabolite- 201 1.19 1176 117.2 -i 01142_201-retired for 2-hydroxy-3- methylbutyric acid 32588 Metabolite- 201 4.25 4242 583.2 -i 01327_201 32609 Metabolite- 201 4.9 4887 369.2 -i 01345_201-retired for epiandrosterone sulfate 32587 Metabolite- 201 4.03 4025 267.2 -i 02249_201 32550 Metabolite- 201 1.97 1958 189 -i 02272_201 32756 Metabolite- 201 3.35 3339 199.1 -i 02276_201 32553 Metabolite- 201 2.2 2199 173.1 -i 03832_201 32557 Metabolite- 201 2.69 2684 203.1 -i 06126_201 32753 Metabolite- 201 2.62 2613 153.1 -i 09789_201 32548 Metabolite-11231 201 1.47 1471 330 -i 32561 Metabolite-11244 201 3.78 3771 224.2 -i 32564 Metabolite-11247 201 3.94 3932 213.1 -i 32616 Metabolite-11299 201 4.9 4893 507.2 -i 32619 Metabolite-11302 201 5.01 4998 397.3 -i 32625 Metabolite-11308 201 5.15 5133 365.3 -i 32635 Metabolite-11318 201 5.81 5699 476.3 -i 32637 Metabolite-11320- 201 5.85 5740 593.9 -i retired duplicate of X- 12528 32648 Metabolite-11331- 201 0.69 686 164.2 -i retired EDTA ions 32656 Metabolite-11339- 201 0.69 689 156.2 -i retired-EDTA ions 32682 Metabolite-11365- 201 5.61 5527 303.3 -i retired for arachidonic acid 32696 Metabolite-11379- 201 5.65 5566 267.3 -i retired for cis-10- heptadecenoic acid 32732 Metabolite-11415- 201 0.69 692 313.1 -i retired-EDTA ions 32748 Metabolite-11431 201 1.58 1575 330 -i 32754 Metabolite-11437 201 2.89 2888 231 -i 32757 Metabolite-11440 201 3.58 3571 246.3 -i 32760 Metabolite-11443 201 3.92 3910 225.3 -i 32761 Metabolite-11444 201 3.99 3983 541.2 -i 32769 Metabolite-11452 201 4.12 4109 352.1 -i 32792 Metabolite-11475 201 4.25 4240 383.2 -i 32795 Metabolite-11478 201 4.3 4286 165.2 -i 32807 Metabolite-11490 201 4.77 4762 279.8 -i 32813 Metabolite-11496 201 5.58 5508 271.3 -i 32839 Metabolite-11522 201 4.76 4754 313.2 -i 32848 Metabolite-11531 201 4.86 4850 391.3 -i 32850 Metabolite-11533 201 4.91 4904 243.2 -i 32855 Metabolite-11538 201 4.93 4920 311.3 -i 32877 Metabolite-11560 201 5.29 5245 295.3 -i 32910 Metabolite-11593 201 0.79 790 189.2 -i 32970 Metabolite-11653 201 5.82 5686 331.3 -i 33172 Metabolite-11827 201 1.56 1575 312.1 -i 33177 Metabolite-11832 201 1.95 1962 216.1 -i 33185 Metabolite-11840 201 2.56 2574 135.2 -i 33190 Metabolite-11845 201 2.87 2891 615 -i 33194 Metabolite-11849 201 3.2 3229 266.2 -i 33198 Metabolite-11853 201 3.59 3602 187.1 -i 33210 Metabolite-11865 201 5.04 5037 456.2 -i 33219 Metabolite-11874- 201 5.23 5199 197.3 -i retired for cis-5- Dodecenoic acid 33225 Metabolite-11880 201 5.44 5378 537.4 -i 33226 Metabolite-11881 201 5.48 5414 380.3 -i 33227 Metabolite-11882- 201 5.52 5445 301.3 -i retired for cis- 5,8,11,14,17- eicosapentaenoic acid 33232 Metabolite-11887- 201 5.85 5736 307.4 -i retired for cis-11,14- eicosadienoic acid 33237 Metabolite-11892 201 0.71 710 367.1 -i 33380 Metabolite-12029 201 0.68 683 329.1 -i 33388 Metabolite-12037- 201 5.88 5795 295.4 -i retired for cis-10- nonadecenoic acid 33389 Metabolite-12038 201 5.82 5736 245.3 -i 33415 Metabolite-12063 201 4.82 4822 427.2 -i 33416 Metabolite-12064 201 1 999 101.3 -i
While the invention has been described in detail and with reference to specific embodiments thereof, it will be apparent to one skilled in the art that various changes and modifications can be made without departing from the spirit and scope of the invention.
* * * * *
References
D00001
D00002
D00003
D00004
D00005
D00006
D00007
D00008
D00009
D00010
D00011
D00012
D00013

D00014

D00015

D00016

D00017

D00018

D00019

D00020

D00021

D00022

D00023

D00024

D00025

D00026

D00027

D00028

D00029

D00030

XML
uspto.report is an independent third-party trademark research tool that is not affiliated, endorsed, or sponsored by the United States Patent and Trademark Office (USPTO) or any other governmental organization. The information provided by uspto.report is based on publicly available data at the time of writing and is intended for informational purposes only.
While we strive to provide accurate and up-to-date information, we do not guarantee the accuracy, completeness, reliability, or suitability of the information displayed on this site. The use of this site is at your own risk. Any reliance you place on such information is therefore strictly at your own risk.
All official trademark data, including owner information, should be verified by visiting the official USPTO website at www.uspto.gov. This site is not intended to replace professional legal advice and should not be used as a substitute for consulting with a legal professional who is knowledgeable about trademark law.