Electrified compositions for determining the risk of developing adolescent idiopathic scoliosis through the use of GI protein receptor
Moreau , et al.
U.S. patent number 10,620,222 [Application Number 14/804,225] was granted by the patent office on 2020-04-14 for electrified compositions for determining the risk of developing adolescent idiopathic scoliosis through the use of gi protein receptor. This patent grant is currently assigned to CHU Sainte-Justine. The grantee listed for this patent is CHU Sainte-Justine. Invention is credited to Marie-Yvonne Akoume Ndong, Alain Moreau.


View All Diagrams
| United States Patent | 10,620,222 |
| Moreau , et al. | April 14, 2020 |
Electrified compositions for determining the risk of developing adolescent idiopathic scoliosis through the use of GI protein receptor
Abstract
Methods for diagnosing a predisposition to developing a scoliosis (e.g., adolescent idiopathic scoliosis (AIS)) and identifying compounds for treating scoliosis based on the modulation of Gi protein-coupled receptor activity are described. Specific embodiments of the methods involve measuring a change in impedance signals of cells expressing a receptor coupled to a Gi protein with a ligand. To identify compounds useful in treatment, the cell is contacted with a test compound and a ligand. A higher impedance in the presence relative to the absence of said test compound is indicative that the test compound is useful for treating scoliosis.
| Inventors: | Moreau; Alain (Montreal, CA), Akoume Ndong; Marie-Yvonne (Montreal, CA) | ||||||||||
|---|---|---|---|---|---|---|---|---|---|---|---|
| Applicant: |
|
||||||||||
| Assignee: | CHU Sainte-Justine (Montreal,
CA) |
||||||||||
| Family ID: | 42100175 | ||||||||||
| Appl. No.: | 14/804,225 | ||||||||||
| Filed: | July 20, 2015 |
Prior Publication Data
| Document Identifier | Publication Date | |
|---|---|---|
| US 20160146839 A1 | May 26, 2016 | |
Related U.S. Patent Documents
| Application Number | Filing Date | Patent Number | Issue Date | ||
|---|---|---|---|---|---|
| 13123146 | |||||
| PCT/CA2009/001453 | Oct 13, 2009 | ||||
| 61228769 | Jul 27, 2009 | ||||
| 61104442 | Oct 10, 2008 | ||||
| Current U.S. Class: | 1/1 |
| Current CPC Class: | G01N 33/74 (20130101); A61P 19/00 (20180101); G01N 33/5008 (20130101); G01N 33/566 (20130101); G01N 33/6872 (20130101); A61K 31/4045 (20130101); G01N 2800/10 (20130101); G01N 2333/4719 (20130101); G01N 2800/38 (20130101); G01N 2800/52 (20130101); A61K 31/415 (20130101); A61K 31/498 (20130101); G01N 2800/50 (20130101); A61K 31/4164 (20130101); A61K 2300/00 (20130101); G01N 2333/726 (20130101); G01N 33/554 (20130101) |
| Current International Class: | C12N 5/00 (20060101); C12N 5/07 (20100101); C12N 5/071 (20100101); C12N 5/078 (20100101); C12N 5/0786 (20100101); C12N 5/0781 (20100101); C12N 5/0783 (20100101); G01N 33/48 (20060101); G01N 33/00 (20060101); G01N 33/49 (20060101); G01N 33/50 (20060101); G01N 33/566 (20060101); G01N 33/567 (20060101); A61K 49/00 (20060101); G01N 33/74 (20060101); G01N 33/68 (20060101); A61K 31/4164 (20060101); A61K 31/4045 (20060101); A61K 31/498 (20060101); G01N 33/554 (20060101); A61K 31/415 (20060101) |
References Cited [Referenced By]
U.S. Patent Documents
| 7094593 | August 2006 | Pausch |
| 7504407 | March 2009 | Castelhano |
| 7989175 | August 2011 | Moreau |
| 8313898 | November 2012 | Fang |
| 8652791 | February 2014 | Moreau |
| 2004/0250299 | December 2004 | Verwaerde |
| 2005/0130250 | June 2005 | Moreau |
| 2008/0032317 | February 2008 | Pausch |
| 2008/0153124 | June 2008 | Pausch |
| 2008/0274913 | November 2008 | Lee |
| 2009/0093011 | April 2009 | Fang |
| 2009/0098645 | April 2009 | Fang |
| 2009/0111110 | April 2009 | Moreau |
| 2009/0148850 | June 2009 | Kargman |
| 2009/0226931 | September 2009 | Bunch |
| 2011/0256582 | October 2011 | Moreau |
| 2012/0009600 | January 2012 | Moreau |
| 2013/0115615 | May 2013 | Moreau |
| 2000-354500 | Dec 2000 | JP | |||
| WO 03/073102 | Apr 2003 | WO | |||
| WO 03/073102 | Sep 2003 | WO | |||
| WO03073102 | Sep 2003 | WO | |||
| WO2010/040234 | Apr 2011 | WO | |||
Other References
|
Nelson et al. Spine, 2010; 36:37-40. cited by examiner . Yaman et al. Turk Neurosurg. 2014; 24:646-657. cited by examiner . Letellier et al. J. Pineal Res. Oct. 9, 2008; https://doi.org/10.1111/j.1600-079X.2008.00603.x abstract. cited by examiner . Burgess et al. J of Cell Bio. 1990, 111:2129-2138. cited by examiner . Pawson et al. 2003, Science 300:445-452. cited by examiner . Alaoui-Ismaili et al., Cytokine Growth Factor Rev. 2009; 20:501-507. cited by examiner . Guo et al., PNAS 2004; 101:9205-9210. cited by examiner . Akoume et al., "Cell-based screening test for idiopathic scoliosis using cellular dielectric spectroscopy," Spine, 35(13): E601-E608, 2010. cited by applicant . Axenovich et al., "Segregation Analysis of Idiopathic Scoliosis: Demonstration of a Major Gene Effect," Am J Med Genet, 86(4): 389-394, 1999. cited by applicant . Blank et al., "A genomic approach to scoliosis pathogenesis," Lupus, 8(5): 356-360, 1999. cited by applicant . Giampietro PF et al., "Synteny-Defined Candidate Genes for Congenital and Idiopathic Scoliosis," Am J Med Genet, 83(3):164-177, 1999. cited by applicant . Goldberg et al., "The Ste-Justine Adolescent Idiopathic Scoliosis Cohort Study Part I: Description of the study," Spine 19:1551-1561, 1994. cited by applicant . Huang et al., "Cell-electronic sensing of particle-induced cellular responses," Analyst, 133(5): 643-648, 2008. cited by applicant . Hyatt et al., "Initiation of vertebrate left-right axis formation by maternal Vg1," Nature, 384(6604): 62-65, 1996. cited by applicant . Letellier et al., "Recents progres dans 1 'etiopathogenie de la scoliose idiopathique de 1 'adolescent et nouveaux concepts moleculaires," Medecine/Sciences, 23(11): 910-916, 2007. cited by applicant . Letellier et al., "Estrogen cross-talk with the melatonin signaling pathway in human osteoblasts derived from adolescent idiopathic scoliosis patients," J. Pineal Res., 45: 383-393, 2008. cited by applicant . Machida M., "Cause of Idiopathic Scoliosis," Spine, 24(24): 2576-2583, 1999. cited by applicant . Medhurst et al., "Pharmacological and immunohistochemical characterization of the APJ receptor and its endogenous ligand apelin," J Neurochem., 84(5):1162-1172, 2003. cited by applicant . Moreau et al., "Melatonin Signaling Dysfunction in Adolescent Idiopathic Scoliosis," Spine, 29:1772-1781, 2004. cited by applicant . Moreau et al., "Estrogen cross-talk with the melatonin signaling pathway in human osteoblasts derived from adolescent idiopathic scoliosis patients," J. Pineal Res., 45:383-393, 2008. cited by applicant . Moreau et al., "Molecular and genetic aspects of idiopathic scoliosis, Blood test for idiopathic scoliosis," Orthopade, 38(2):114-116, 2009. cited by applicant . Niswender et al., "A Novel Assay of Gi/o-Linked G Protein-Coupled Receptor Coupling to Potassium Channels Provides New Insights into the Pharmacology of the Group III Metabotropic Glutamate Receptors," Mol Pharmacol, 73(4):1213-1224, 2008. cited by applicant . Notice of Reasons for Rejection, Japanese Patent Application No. 2011/530342, dated Nov. 6, 2012, 4 pages. cited by applicant . Official Letter, Taiwanese Application No. 98134337, dated Jul. 15, 2013, 4 pages. cited by applicant . Patent Examination Report No. 1, Australian Patent Application No. 2009301605, dated Sep. 20, 2012, 3 pages. cited by applicant . Poitras et al., "The Ste-Justine Adolescent Idiopathic Scoliosis Cohort Study. Part IV: Surgical correction and back pain," Spine, 19:1582-1588, 1994. cited by applicant . Riobo et al., "Activation of heterotrimeric G proteins by Smoothened," Proc. Natl. Acad. Sci. USA, 103(33):12607-12612, 2006. cited by applicant . Roth et al., "Melatonin Promotes Osteoblast Differentiation and Bone Formation," J Biol Chem 274(31): 22041-22047, 1999. cited by applicant . Saugstad et al., "Metabotropic Glutamate Receptors Activate G-Protein-Coupled Inwardly Rectifying Potassium Channels in Xenopus Oocytes," J. Neurosci., 16(19):5979-5985, 1996. cited by applicant . Solly et al., "Application of Real-Time Cell Electronic Sensing (RT-CES) Technology to Cell-Based Assays," Assay Drug Dev. Technol., 2(4): 363-372, 2004. cited by applicant . Supplementary European Search Report, European Patent Application No. EP 09818732, dated Mar. 6, 2012; 9 pages. cited by applicant . Von Gall et al., "Transcription factor dynamics and neuroendocrine signalling in the mouse pineal gland: a comparative analysis of melatonin-deficient C57BL mice and melatonin-proficient C3H mice," Eur J Neurosci, 12(3):964-972, 2000. cited by applicant . Weinstein et al., "Adolescent idiopathic scoliosis," Lancet, 371:1527-1537, 2008. cited by applicant . Weiss et al., "Rate of complications in scoliosis surgery--a systematic review of the Pub Med literature," Scoliosis, 3:9, 2008. cited by applicant . Wise et al., "Localization of Susceptibility to Familial Idiopathic Scoliosis," Spine, 25(18): 2372-2380, 2000. cited by applicant . International Search Report and Written Opinion, PCT Application No. PCT/CA2009/001453 (dated Jan. 25, 2010). cited by applicant . International Preliminary Report on Patentability, PCT Application No. PCT/CA2009/001453 (dated Apr. 21, 2011). cited by applicant . Office Action from the Canadian Intellectual Property Office dated May 17, 2016, issued in corresponding Canadian Application No. 2,738,840 (4 pages). cited by applicant . Azeddine et al., "Molecular Determinants of Melatonin Signaling Dysfunction in Adolescent Idiopathic Scoliosis," Clin Orthop Relat Res 462:45-52, 2007. cited by applicant . Examination Report from corresponding Indian Application No. 1403/KOLNP/2011, dated Nov. 17, 2016 (9 pages). cited by applicant . Peters et al., "Evaluation of Cellular Dielectric Spectroscopy, a Whole-Cell, Label-Free Technology for Drug Discovery on G.sub.i-Coupled GPCRs," J Biomol Screen 12:312-319, 2007. cited by applicant . Office Action issued in Argentina Application No. 20090103920 dated Dec. 20, 2017, accompanied by an English-language summary letter (6 pages). cited by applicant. |
Primary Examiner: Wang; Chang-Yu
Attorney, Agent or Firm: Klarquist Sparkman, LLP
Parent Case Text
CROSS REFERENCE TO RELATED APPLICATIONS
This is a continuation of U.S. application Ser. No. 13/123,146, filed on Apr. 7, 2011, now abandoned, which is a National Entry Application of PCT application no. PCT/CA2009/001453 filed on Oct. 13, 2009 and published in English under PCT Article 21(2), which itself claims benefit of U.S. provisional application Ser. No. 61/104,442 filed on Oct. 10, 2008 and of U.S. provisional application Ser. No. 61/228,769, filed on Jul. 27, 2009. All documents above are incorporated herein in their entirety by reference.
Claims
The invention claimed is:
1. An electrified composition for determining the risk of developing adolescent idiopathic scoliosis (AIS) comprising: i) a primary cell expressing a native receptor coupled to an inhibitory guanine nucleotide-binding (G.sub.i) protein (GiPCR) obtained from a biological fluid sample from a human pediatric subject, wherein said subject is suffering from AIS or has a parent who suffers from AIS, wherein said primary cell is a peripheral blood mononuclear cell (PBMC), an osteoblast or a myoblast, and wherein said GiPCR is a serotonin 1A receptor (5-HT1A); ii) a ligand to said GiPCR, wherein said ligand is 1-[3-(3,4-Methylenedioxyphenoxy)propyl]-4-phenyl-piperazine maleate (BP554 maleate); and iii) an isotonic buffer comprising Hanks' balanced salt solution (HBSS) suitable for measuring cellular impedance by cellular dielectric spectroscopy (CDS); wherein said composition has been electrified by applying voltage at 24 frequencies from 1 KHz to 10 MHz across electrodes in contact with said composition.
2. The composition of claim 1, wherein said subject has a parent who suffers from adolescent idiopathic scoliosis.
3. The composition of claim 1, wherein said subject has been diagnosed with adolescent idiopathic scoliosis.
4. The composition of claim 1, wherein said primary cell is a peripheral blood mononuclear cell (PBMC).
5. The composition of claim 1, wherein said primary cell is an osteoblast or a myoblast.
6. The composition of claim 1, wherein said primary cell has previously been frozen.
7. The composition of claim 1, wherein said primary cell is a fresh cell, which has not been frozen.
8. An electrified composition for determining the risk of developing adolescent idiopathic scoliosis (AIS) comprising: i) a primary cell expressing a native receptor coupled to an inhibitory guanine nucleotide-binding (G.sub.i) protein (GiPCR) obtained from a biological fluid sample from a human pediatric subject, wherein said subject is suffering from AIS or has a parent who suffers from AIS, wherein said primary cell is a peripheral blood mononuclear cell (PBMC), an osteoblast or a myoblast, and wherein said GiPCR is a CB2 cannabinoid receptor (CB2); ii) a ligand to said GiPCR, wherein said ligand is N-Cyclohexyl-7-chloro-1-[2-(4-morpholinyl)ethyl]quinolin-4(1H)-one-3-carb- oxamide (CB65); and iii) an isotonic buffer comprising Hanks' balanced salt solution (HBSS) suitable for measuring cellular impedance by cellular dielectric spectroscopy (CDS); wherein said composition has been electrified by applying voltage at 24 frequencies from 1 KHz to 10 MHz across electrodes in contact with said composition.
9. The composition of claim 8, wherein said subject has a parent who suffers from adolescent idiopathic scoliosis.
10. The composition of claim 8, wherein said subject has been diagnosed with adolescent idiopathic scoliosis.
11. The composition of claim 8, wherein said primary cell is a peripheral blood mononuclear cell (PBMC).
12. The composition of claim 8, wherein said primary cell is an osteoblast or a myoblast.
13. The composition of claim 8, wherein said primary cell has previously been frozen.
14. The composition of claim 8, wherein said primary cell is a fresh cell, which has not been frozen.
15. An electrified composition for determining the risk of developing adolescent idiopathic scoliosis (AIS) comprising: i) a primary cell expressing a native receptor coupled to an inhibitory guanine nucleotide-binding (G.sub.i) protein (GiPCR) obtained from a biological fluid sample from a human pediatric subject, wherein said subject is suffering from AIS or has a parent who suffers from AIS, wherein said primary cell is a peripheral blood mononuclear cell (PBMC), an osteoblast or a myoblast, and wherein said GiPCR is an alpha-2 adrenergic receptor (.alpha.2-AD); ii) a ligand to said GiPCR, wherein said ligand is 5-bromo-N-(4,5-dihydro-1H-imidazol-2-yl)-6-quinoxalinamine (UK14304); and iii) an isotonic buffer comprising Hanks' balanced salt solution (HBSS) suitable for measuring cellular impedance by cellular dielectric spectroscopy (CDS); wherein said composition has been electrified by applying voltage at 24 frequencies from 1 KHz to 10 MHz across electrodes in contact with said composition.
16. The composition of claim 15, wherein said subject has a parent who suffers from adolescent idiopathic scoliosis.
17. The composition of claim 15, wherein said subject has been diagnosed with adolescent idiopathic scoliosis.
18. The composition of claim 15, wherein said primary cell is a peripheral blood mononuclear cell (PBMC).
19. The composition of claim 15, wherein said primary cell is an osteoblast or a myoblast.
20. The composition of claim 15, wherein said primary cell has previously been frozen.
21. The composition of claim 15, wherein said primary cell is a fresh cell, which has not been frozen.
22. An electrified composition for determining the risk of developing adolescent idiopathic scoliosis (AIS) comprising: i) a primary cell expressing a native receptor coupled to an inhibitory guanine nucleotide-binding (G.sub.i) protein (GiPCR) obtained from a biological fluid sample from a human pediatric subject, wherein said subject is suffering from AIS or has a parent who suffers from AIS, wherein said primary cell is a peripheral blood mononuclear cell (PBMC), an osteoblast or a myoblast, and wherein said GiPCR is an A3 adenosine receptor (A3); ii) a ligand to said GiPCR, wherein said ligand is 1-Deoxy-1-[6-[[(3-iodophenyl)methyl]amino]-9H-purin-9-yl]-N-methyl-.beta.- -D-ribofuranuronamide (IB-MECA); and iii) an isotonic buffer comprising Hanks' balanced salt solution (HBSS) suitable for measuring cellular impedance by cellular dielectric spectroscopy (CDS); wherein said composition has been electrified by applying voltage at 24 frequencies from 1 KHz to 10 MHz across electrodes in contact with said composition.
23. The composition of claim 22, wherein said subject has a parent who suffers from adolescent idiopathic scoliosis.
24. The composition of claim 22, wherein said subject has been diagnosed with adolescent idiopathic scoliosis.
25. The composition of claim 22, wherein said primary cell is a peripheral blood mononuclear cell (PBMC).
26. The composition of claim 22, wherein said primary cell is an osteoblast or a myoblast.
27. The composition of claim 22, wherein said primary cell has previously been frozen.
28. The composition of claim 22, wherein said primary cell is a fresh cell, which has not been frozen.
Description
STATEMENT REGARDING FEDERALLY SPONSORED RESEARCH OR DEVELOPMENT
N/A.
FIELD OF THE INVENTION
The present invention relates to the diagnosis of a predisposition to developing a scoliosis (e.g., adolescent idiopathic scoliosis (AIS)) and to screening assays for identifying compounds for treating scoliosis.
BACKGROUND OF THE INVENTION
Scoliosis is a medical condition in which a person's spine is curved from side to side, and may also be rotated. It is an abnormal lateral curvature of the spine. On an x-ray, the spine of an individual with a typical scoliosis may look more like an "S" or a "C" than a straight line.
Spinal deformities and scoliosis in particular represent the most prevalent type of orthopedic deformities in children and adolescents, while idiopathic scoliosis (AIS) represents the most common form of scoliosis. The etiology of adolescent idiopathic scoliosis (AIS) is unclear. AIS affects mainly girls in number and severity but in spite of several studies suggesting a genetic predisposition, the form of inheritance remains uncertain (Axenovich T I et al., Am J Med Genet 1999, 86(4): 389-394; Wise C A et al., Spine 2000, 25(18): 2372-2380; Blank R D et al., Lupus 1999, 8(5): 356-360; Giampietro P F et al., Am J Med Genet 1999, 83(3):164-177). Several divergent perspectives have been postulated to better define this etiology (Machida M., Spine 1999, 24(24): 2576-2583; Roth J A et al., J Biol Chem 1999, 274(31): 22041-22047; Hyatt B A et al., Nature 1996, 384(6604): 62-65; von Gall C et al., Eur J Neurosci 2000, 12(3): 964-972). Genetics, growth hormone secretion, connective tissue structure, muscle structure, vestibular dysfunction, melatonin secretion, and platelet microstructure are major areas of focus. The current opinion is that there is a defect of central control or processing by the central nervous system (CNS) that affects a growing spine and that the spine's susceptibility to deformation varies from one individual to another.
There is unfortunately no method approved by the FDA yet to identify children or adolescents at risk of developing IS to predict which affected individuals require treatment to prevent or stop progression of the disease (Weinstein S L, Dolan L A, Cheng J C et al. Adolescent idiopathic scoliosis. Lancet 2008; 371:1527-37). Consequently, the application of current treatments, such as bracing or surgical correction, is delayed until the detection of a significant deformity or a demonstration of clear progression, resulting in a delayed and less-than-optimal treatment. (Society SR. Morbidity & Mortality Committee annual Report 1997.). Among patients with IS requiring treatment, 80 to 90% will be treated by bracing and around 1% will need surgery to correct the deformity by spinal instrumentation and fusion of the thoracic and/or lumbar spine with the risk of having complications. (Weiss H R, Goodall D. Rate of complications in scoliosis surgery--a systematic review of the Pub Med literature. Scoliosis. 2008; 3:9). Today in the United States there are approximately one million children between ages 10 and 16 with some degree of IS. One out of every six children diagnosed with scoliosis will have a curve that progresses to a degree that requires active treatment. About 29,000 scoliosis surgeries are done every year in North America, resulting in significant psychological and physical morbidity. (Goldberg M S, Mayo N E, Poitras B et al. The Ste-Justine Adolescent Idiopathic Scoliosis Cohort Study. Part I: Description of the study. Spine 1994; 19:1551-61; Poitras B, Mayo N E, Goldberg M S et al. The Ste-Justine Adolescent Idiopathic Scoliosis Cohort Study. Part IV: Surgical correction and back pain. Spine 1994; 19:1582-8).
There is a need for methods for classifying subjects having diseases involving spinal deformities (e.g., scoliosis, such as AIS), for diagnosing a predisposition to scoliosis and for identifying compounds for preventing or treating these diseases.
The present description refers to a number of documents, the content of which is herein incorporated by reference in their entirety.
SUMMARY OF THE INVENTION
The present invention demonstrates for the first time that cells from scoliotic patients (idiopathic scoliosis patients) exhibit a broad impairment in G-protein coupled receptor (GPCR) signaling. This impairment was measured in several different GPCRs and in various cell types including bone-forming cells, muscle-forming cells as well as blood cells.
A variety of hormones, neurotransmitters and biologically active substances control, regulate, or adjust the functions of living bodies via specific receptors located in cell membranes. Many of these receptors mediate the transmission of intracellular signals by activating guanine nucleotide-binding proteins (G proteins) to which the receptor is coupled. Such receptors are generically referred to as G protein-coupled receptors ("GPCR"s). Binding of a specific signaling molecule to the GPCR can cause a conformational change in the receptor, resulting in a form that is able to bind and activate a G protein, thereby triggering a cascade of intracellular events that eventually leads to a biological response. Typically, GPCRs interact with G proteins to regulate the synthesis of intracellular second messengers such as cyclic AMP, inositol phosphates, diacylglycerol and calcium ions.
More specifically, in accordance with the present invention, there is provided a method (e.g., an in vitro method) for determining whether a test compound is useful for preventing or treating scoliosis (e.g., an idiopathic scoliosis (IS), such as Infantile Idiopathic Scoliosis, Juvenile Idiopathic Scoliosis, Adolescent Idiopathic Scoliosis (AIS) or adult scoliosis), said method comprising: (a) contacting a cell expressing a receptor (i.e. at least one receptor) coupled to an inhibitory guanine nucleotide-binding (G.sub.i) protein with a ligand to said receptor in the presence or absence of said test compound; (b) determining the magnitude of the signal induced by said ligand in said cell; wherein a higher signal in the presence relative to the absence of said test compound is indicative that said test compound is useful for preventing or treating a scoliosis (e.g., an Idiopathic Scoliosis, such as AIS).
This method can be used for screening for compounds able to modulate G.sub.i-protein-signaling impairment generally. It can however also be used to determine which compound is the most effective for modulating and in particular reducing or counteracting the G.sub.i-protein-signaling impairment in cells from a specific group of patient or for a specific patient. Indeed, the most effective compound for these purposes may vary from one patient to the next. The method of screening of the present invention may therefore be used to identify which compound is the most effective in counteracting the G.sub.i-protein-signaling impairment in a specific group of patients or in one patient in particular.
The present invention also provides a method (e.g., an in vitro method) for diagnosing a predisposition to developing a scoliosis (e.g., an Idiopathic Scoliosis such as Infantile Idiopathic Scoliosis, Juvenile Idiopathic Scoliosis or Adolescent Idiopathic Scoliosis (AIS)) in a subject comprising: (a) contacting a cell expressing a receptor coupled to an inhibitory guanine nucleotide-binding (G.sub.i) protein from said subject with a ligand to said receptor; (b) determining the magnitude of the signal induced by said ligand in said cell; (c) comparing said signal to a corresponding reference signal; (d) determining said predisposition based on said comparison.
As used herein the terms "predisposition to developing a scoliosis" refer to a genetic or metabolic predisposition of a subject to develop a scoliosis (i.e. spinal deformity) and/or a more severe scoliosis at a future time.
In another aspect, the present invention provides a method of classifying a human subject having an idiopathic scoliosis, such as Infantile Idiopathic Scoliosis, Juvenile Idiopathic Scoliosis or Adolescent Idiopathic Scoliosis (AIS) comprising: (a) contacting a cell expressing a receptor coupled to an inhibitory guanine nucleotide-binding (G.sub.i) protein from said subject with a ligand to said receptor; and (b) determining the magnitude of the signal induced by said ligand in said cell, whereby the results of the determining step enables the classification of the subject having idiopathic scoliosis (e.g., AIS) in one idiopathic scoliosis subgroup.
In an embodiment, the above-mentioned idiopathic scoliosis is AIS. In an embodiment, the AIS subject (i) is classified in subgroup 1 if the magnitude of the signal is about 34% or less relative to the magnitude of a corresponding signal measured in a cell from a control subject, (ii) is classified in subgroup 2 if the magnitude of the signal is between about 34% and about 57% relative to the magnitude of a corresponding signal measured in a cell from a control subject, and (iii) is classified in subgroup 3 if the magnitude of the signal is between about 57% to about 80% relative to the magnitude of a corresponding signal measured in a cell from a control subject.
As such, the method of the present invention may also be advantageously used to determine, for example, the type and/or severity of the disease or the nature of the defect underlying the disease (i.e., "classification" or "stratification" of the subjects). This is particularly interesting if the most effective drug for treating or preventing idiopathic scoliosis (e.g., AIS) varies between subjects affected by idiopathic scoliosis of different types and/or severities. The method for classifying of the present invention may therefore permit a better selection of the drug to be used for a particular patient. This method is also useful to classify/stratify already diagnosed scoliotic patients (e.g., adult scoliosis).
In an embodiment, the above-mentioned subject is a likely candidate for developing a scoliosis, such as idiopathic scoliosis (e.g., Infantile Idiopathic Scoliosis, Juvenile Idiopathic Scoliosis or Adolescent Idiopathic Scoliosis (AIS)). As used herein the terms "likely candidate for developing scoliosis" include subjects (e.g., children) of which at least one parent has a scoliosis (e.g., adolescent idiopathic scoliosis). Among other factors, age (adolescence), gender and other family antecedent are factors that are known to contribute to the risk of developing a scoliosis and are used to a certain degree to assess the risk of developing a scoliosis. In certain subjects, scoliosis develops rapidly over a short period of time to the point of requiring a corrective surgery (often when the deformity reaches a Cobb's angle .gtoreq.50.degree.). Current courses of action available from the moment a scoliosis such as AIS is diagnosed (when scoliosis is apparent) include observation (when Cobb's angle is around 10-25.degree.), orthopaedic devices (when Cobb's angle is around 25-30.degree.), and surgery (over 45.degree.). A more reliable determination of the risk of progression could enable to 1) select an appropriate diet to remove certain food products identified as contributors to scoliosis; 2) select the best therapeutic agent; and/or 3) select the least invasive available treatment such as postural exercises, orthopaedic device, or less invasive surgeries or surgeries without fusions (a surgery that does not fuse vertebra and preserves column mobility). The present invention encompasses selecting the most efficient and least invasive known preventive actions or treatments in view of the determined risk of developing scoliosis.
The methods of the invention may be performed using cell expressing one or more receptor(s) coupled to a G.sub.i protein (also known as G.sub.i alpha subunit). "Receptor" as used herein refers to wild-type receptors as well as to fragments and/or variants thereof that retains the activity (i.e. GPCR-mediated activity) of the wild-type receptors. GPCRs coupled to the G.sub.i protein (hereinafter referred to as G.sub.iPCRs) include, for example, CD47, serotonin receptors (5-HT), adenosine receptors, adrenergic receptors, cannabinoid receptors, histamine receptors, prostaglandin receptors and dopamine receptors. FIGS. 15A-15G present a non exhaustive list of GiPCRs suitable for use in the method of the present invention.
In an embodiment, the above-mentioned receptor coupled to a G.sub.i protein is a serotonin receptor, an .alpha.-adrenergic receptor, an adenosine receptor, a cannabinoid receptor or any combination thereof. In a further embodiment, the above-mentioned receptor is 5-HT1A, .alpha.2-AD, A3 or CB2. In another embodiment, the above-mentioned receptor is not a melatonin receptor (e.g., MT2).
In an embodiment, the above-mentioned method is performed on more than one receptor coupled to a G.sub.i protein. In another embodiment, the above-mentioned method is performed using more than one ligand specific for a receptor coupled to a G.sub.i protein. In another specific embodiment, each ligand is specific to a different receptor coupled to a G.sub.i protein (e.g., 2, 3, 4, 5 or 6 ligands). FIGS. 16A-16DDD present a non exhaustive list of GiPCRs ligands. In a specific embodiment, ligands for use in the present invention are not MT2 ligands.
Any sample (e.g., cells, tissues) in which one or more G.sub.i-coupled receptors and/or G.sub.i proteins may be expressed may be used in accordance with the methods of the present invention. The cells may naturally or recombinantly express one or more G.sub.i-coupled receptor(s), and/or a G.sub.i protein. For recombinant expression, a nucleic acid encoding a G.sub.iPCR and/or a nucleic acid encoding a G.sub.i protein is introduced into a suitable cell, and the cell is incubated under conditions that provide for expression of the protein(s). The cells used herein naturally express one or more receptors coupled to G.sub.i proteins and were selected in part for their accessibility for collection from subjects. Hence, cells such as osteoblasts, osteoclasts, peripheral blood mononuclear cell (PBMC) (inherently including principally lymphocytes but also monocytes) and myoblasts are advantageously accessible and may conveniently be used in the methods of the present invention. Blood cells (e.g., PBMCs, platelets (thrombocytes), etc.) in particular are particularly accessible and provide for a more rapid testing. Any blood cell can be used for the methods of the present invention so long as it possesses at least one GPCR receptor coupled to a Gi protein. In an embodiment, the cells are obtained or derived from a subject having an idiopathic scoliosis (e.g., Infantile Idiopathic Scoliosis, Juvenile Idiopathic Scoliosis or Adolescent Idiopathic Scoliosis (AIS)). For the present invention, PBMCs do not need to be established in cultures since methods described herein can be performed in cell suspension with fresh or frozen PBMCs.
Any ligand of a given G.sub.i-protein coupled receptor may be used in accordance with certain aspects of the present invention. Ligands (e.g., natural or synthetic) of G.sub.iPCRs are well known in the art, and several of these ligands are commercially available (from Tocris Bioscience, for example). FIGS. 16A-16DDD presents a non-exhaustive list of G.sub.iPCR ligands suitable for use in the method of the present invention either alone or in combination with other ligands. In a specific embodiment, the above-mentioned ligand is a known agonist of the receptor. In an embodiment, the above-mentioned ligand is (a) 1-[3-(3,4-Methylenedioxyphenoxy)propyl]-4-phenyl-piperazine maleate (known as BP554 maleate) for the 5-HT1A receptor, (b) 5-bromo-N-(4,5-dihydro-1H-imidazol-2-yl)-6-quinoxalinamine (known as UK14304) for the .alpha.2-AD receptor; (c) 1-Deoxy-1-[6-[[(3-iodophenyl)methyl]amino]-9H-purin-9-yl]-N-methyl-.beta.- -D-ribofuranuronamide (known as IB-MECA) for the A3 receptor; (d) N-Cyclohexyl-7-chloro-1-[2-(4-morpholinyl)ethyl]quinolin-4(1H)-one-3-carb- oxamide (known as CB65) for the CB2 receptor.
It should be understood that a variety of different test compounds may be screened by the above methods. Test compounds encompass numerous chemical classes, though typically they are organic molecules, preferably small organic compounds having a molecular weight of more than 50 and less than about 2,500 Daltons. Test compounds comprise functional groups necessary for structural interaction with proteins, particularly hydrogen bonding, and typically include at least an amine, carbonyl, hydroxyl or carboxyl group, preferably at least two of the functional chemical groups. The test compounds often comprise cyclical carbon or heterocyclic structures and/or aromatic or polyaromatic structures substituted with one or more of the above functional groups. Test compounds are also found among biomolecules including peptides (e.g., peptides targeting one or more defective protein(s) involved in the transduction of the signal through receptors coupled to G.sub.i proteins), nucleic acids (e.g., oligonucleotides such as antisense molecules targeting a defective gene involved in the transduction of the signal through receptors coupled to G.sub.i proteins), antibodies, saccharides, fatty acids, steroids, purines, pyrimidines, derivatives, structural analogs or combinations thereof. Test compounds may be obtained from a wide variety of sources including libraries of synthetic or natural compounds. For example, numerous means are available for random and directed synthesis of a wide variety of organic compounds and biomolecules, including expression of randomized oligonucleotides and oligopeptides. Alternatively, libraries of natural compounds in the form of bacterial, fungal, plant and animal extracts are available or readily produced. Additionally, natural or synthetically produced libraries and compounds are readily modified through conventional chemical, physical and biochemical means, and may be used to produce combinatorial libraries. Known pharmacological agents may be subjected to directed or random chemical modifications, such as acylation, alkylation, esterification, amidification, etc. to produce structural analogs.
In an embodiment, the reference signal is a signal obtained in a corresponding sample (e.g., a cell) obtained or derived from a control subject, such as a subject (e.g., age- and/or gender-matched) who has not developed a scoliosis (e.g., idiopathic scoliosis such as Infantile Idiopathic Scoliosis, Juvenile Idiopathic Scoliosis or Adolescent Idiopathic Scoliosis (AIS)), or who is not predisposed to developing a scoliosis. In that case, a lower signal in the cell from the subject relative to the corresponding reference signal is indicative that the subject has a predisposition to developing a scoliosis, whereas a higher or a substantially identical signal is indicative that the subject does not have a predisposition to developing a scoliosis.
In another embodiment, the above-mentioned reference signal is a signal obtained in a corresponding sample (e.g., a cell) obtained or derived from a subject (e.g., age- and/or gender-matched) who has developed a scoliosis (e.g., idiopathic scoliosis such as Infantile Idiopathic Scoliosis, Juvenile Idiopathic Scoliosis or Adolescent Idiopathic Scoliosis (AIS)), or who is known to be predisposed to developing a scoliosis. In that case, a lower or a substantially identical signal in the cell from the subject relative to the corresponding reference signal is indicative that the subject has a predisposition to developing a scoliosis, whereas a higher signal is indicative that the subject does not have a predisposition to developing a scoliosis.
In an embodiment, the corresponding sample is a cell of the same type (e.g., both the test sample and the reference sample(s) are lymphocytes) as that from the subject. In an embodiment, the assay will be assayed in plates (e.g., 96-wells, 384-wells, etc.) containing the test sample and a control sample. In another embodiment, the plates also contain reference samples from a healthy subject and from subjects of the groups 1, 2 and 3.
In an embodiment, a lower or higher signal refers to a difference of at least about 10%, in further embodiments at least about 15%, 20%, 25%, 30%, 35%, 40%, 45%, 50%, 55%, 60%, 65%, 70% 75%, 80%, 85%, 90%, 95% 100%, 150% or 200% between the signal obtained with the test sample (sample obtained from the subject being tested) relative to the reference signal. In an embodiment, a substantially identical signal refers to a signal that differs by less than 10%, in further embodiments by less than 9%, 8%, 7%, 6% or 5%, as compared to the reference signal.
The changes in the magnitude of the signal induced by the ligand (e.g. an agonist) may be detected using any methods. Methods for measuring the magnitude or intensity of the signal (e.g., intracellular response) mediated through GiPCRs are well known in the art. The magnitude of the signal may be determined, for example, by measuring the level of a molecule, such as a second messenger (e.g., cAMP, Ca.sup.2+) or a gene product (e.g., mRNA or protein) whose level is modulated following triggering of the receptor by a ligand. The magnitude of the signal may also be determined, for example, by measuring changes in protein-protein interactions (e.g., by fluorescence resonance energy transfer [FRET] or bioluminescence resonance energy transfer [BRET]) following triggering of the receptor by a ligand. Other methods to measure the magnitude or intensity of the signal mediated through GiPCRs include, for example, measurement of cAMP levels (Medhurst et al., 2003. In: J Neurochem., 84), measurement of thallium flux using GIRK-thallium Flux Assay (Niswender et al., 2008; In: Mol Pharmacol. 73(4)), Patch-clamp (Saugstad et al., 1996. In: J. Neurosci. 16), measurement of GTP.gamma.S binding using [.sup.35S]GTP.gamma.S labelling assay (Riobo et al., 2006. In: Proc Natl Acad Sci USA, 103), and measurement of the changes in impedance (Peters et al., 2007. In: J Biomol. Screen. 12: 312-9). In an embodiment, the magnitude of the signal is determined using the changes in impedance that occurs in the cell following receptor triggering (e.g., cellular dielectric spectroscopy [CDS]). Such measurement may be made, for example, using the real-time cell electronic sensing (RT-CES.TM.) technology (ACEA Biosciences Inc., San Diego, Calif., USA) (Huang et al., Analyst, 2008, 133(5): 643-648; Solly et al., Assay Drug Dev. Technol, 2004, 2(4): 363-372) or using the CELLKEY.TM. label-free cellular analysis technology (MDS Sciex, Concord, Ontario, Canada) according to the method described below.
In embodiment, the methods are performed in a format suitable for high throughput assays, e.g., 96- or 384-well format, and suitable robots, (e.g., pipetting robots), and instrumentation may be used.
Also provided by the present invention are kits for practicing the above-mentioned methods. The kits may include, for example, one or more reagent(s) to determine a G.sub.i protein-coupled receptor signal, as well as buffers, cells, control samples (e.g., sample from a healthy subject, reference samples of patients of the group 1, 2 and 3), containers, etc. for performing the subject assays. The various components of the kit may be present in separate containers or certain compatible components may be pre-combined into a single container, as desired.
In addition to above-mentioned components, the kits typically further include instructions for using the components of the kit to practice the methods. The instructions for practicing the subject methods are generally recorded on a suitable recording medium. For example, the instructions may be printed on a substrate, such as paper or plastic, etc. As such, the instructions may be present in the kits as a package insert, in the labeling of the container of the kit or components thereof (i.e., associated with the packaging or subpackaging) etc. In other embodiments, the instructions are present as an electronic storage data file present on a suitable computer readable storage medium, e.g. CD-ROM, diskette, etc. In yet other embodiments, the actual instructions are not present in the kit, but means for obtaining the instructions from a remote source, e.g., via the internet, are provided. An example of this embodiment is a kit that includes a web address where the instructions can be viewed and/or from which the instructions can be downloaded. As with the instructions, this means for obtaining the instructions is recorded on a suitable substrate.
In another aspect, the present invention provides a method for preventing and/or treating a scoliosis (e.g., idiopathic scoliosis such as Infantile Idiopathic Scoliosis, Juvenile Idiopathic Scoliosis or Adolescent Idiopathic Scoliosis (AIS)) comprising administering an effective amount of a compound (and/or a composition comprising a compound) identified by the above-described screening method to a subject.
Compositions (e.g., pharmaceutical compositions) are prepared by formulating the compounds (e.g., peptides, small molecules) identified by the above-described screening method, with any suitable pharmaceutical carrier/excipient or combination of pharmaceutical carriers/excipients. Preparations may be made for administration by any route, such as intravenous, intramuscular, subcutaneous, oral, rectal, vaginal, transdermal, transmucosal, sublingual and the like.
In an embodiment, the above-mentioned subject is a mammal, in a further embodiment, a human.
Other objects, advantages and features of the present invention will become more apparent upon reading of the following non-restrictive description of specific embodiments thereof, given by way of example only with reference to the accompanying drawings.
BRIEF DESCRIPTION OF THE DRAWINGS
In the appended drawings:
FIG. 1 presents the contribution of Gi proteins in melatonin signaling detected by CDS. Data in the graph were generated from maximum impedance responses and correspond to the mean.+-.SE of 3 independent experiments performed in triplicate;
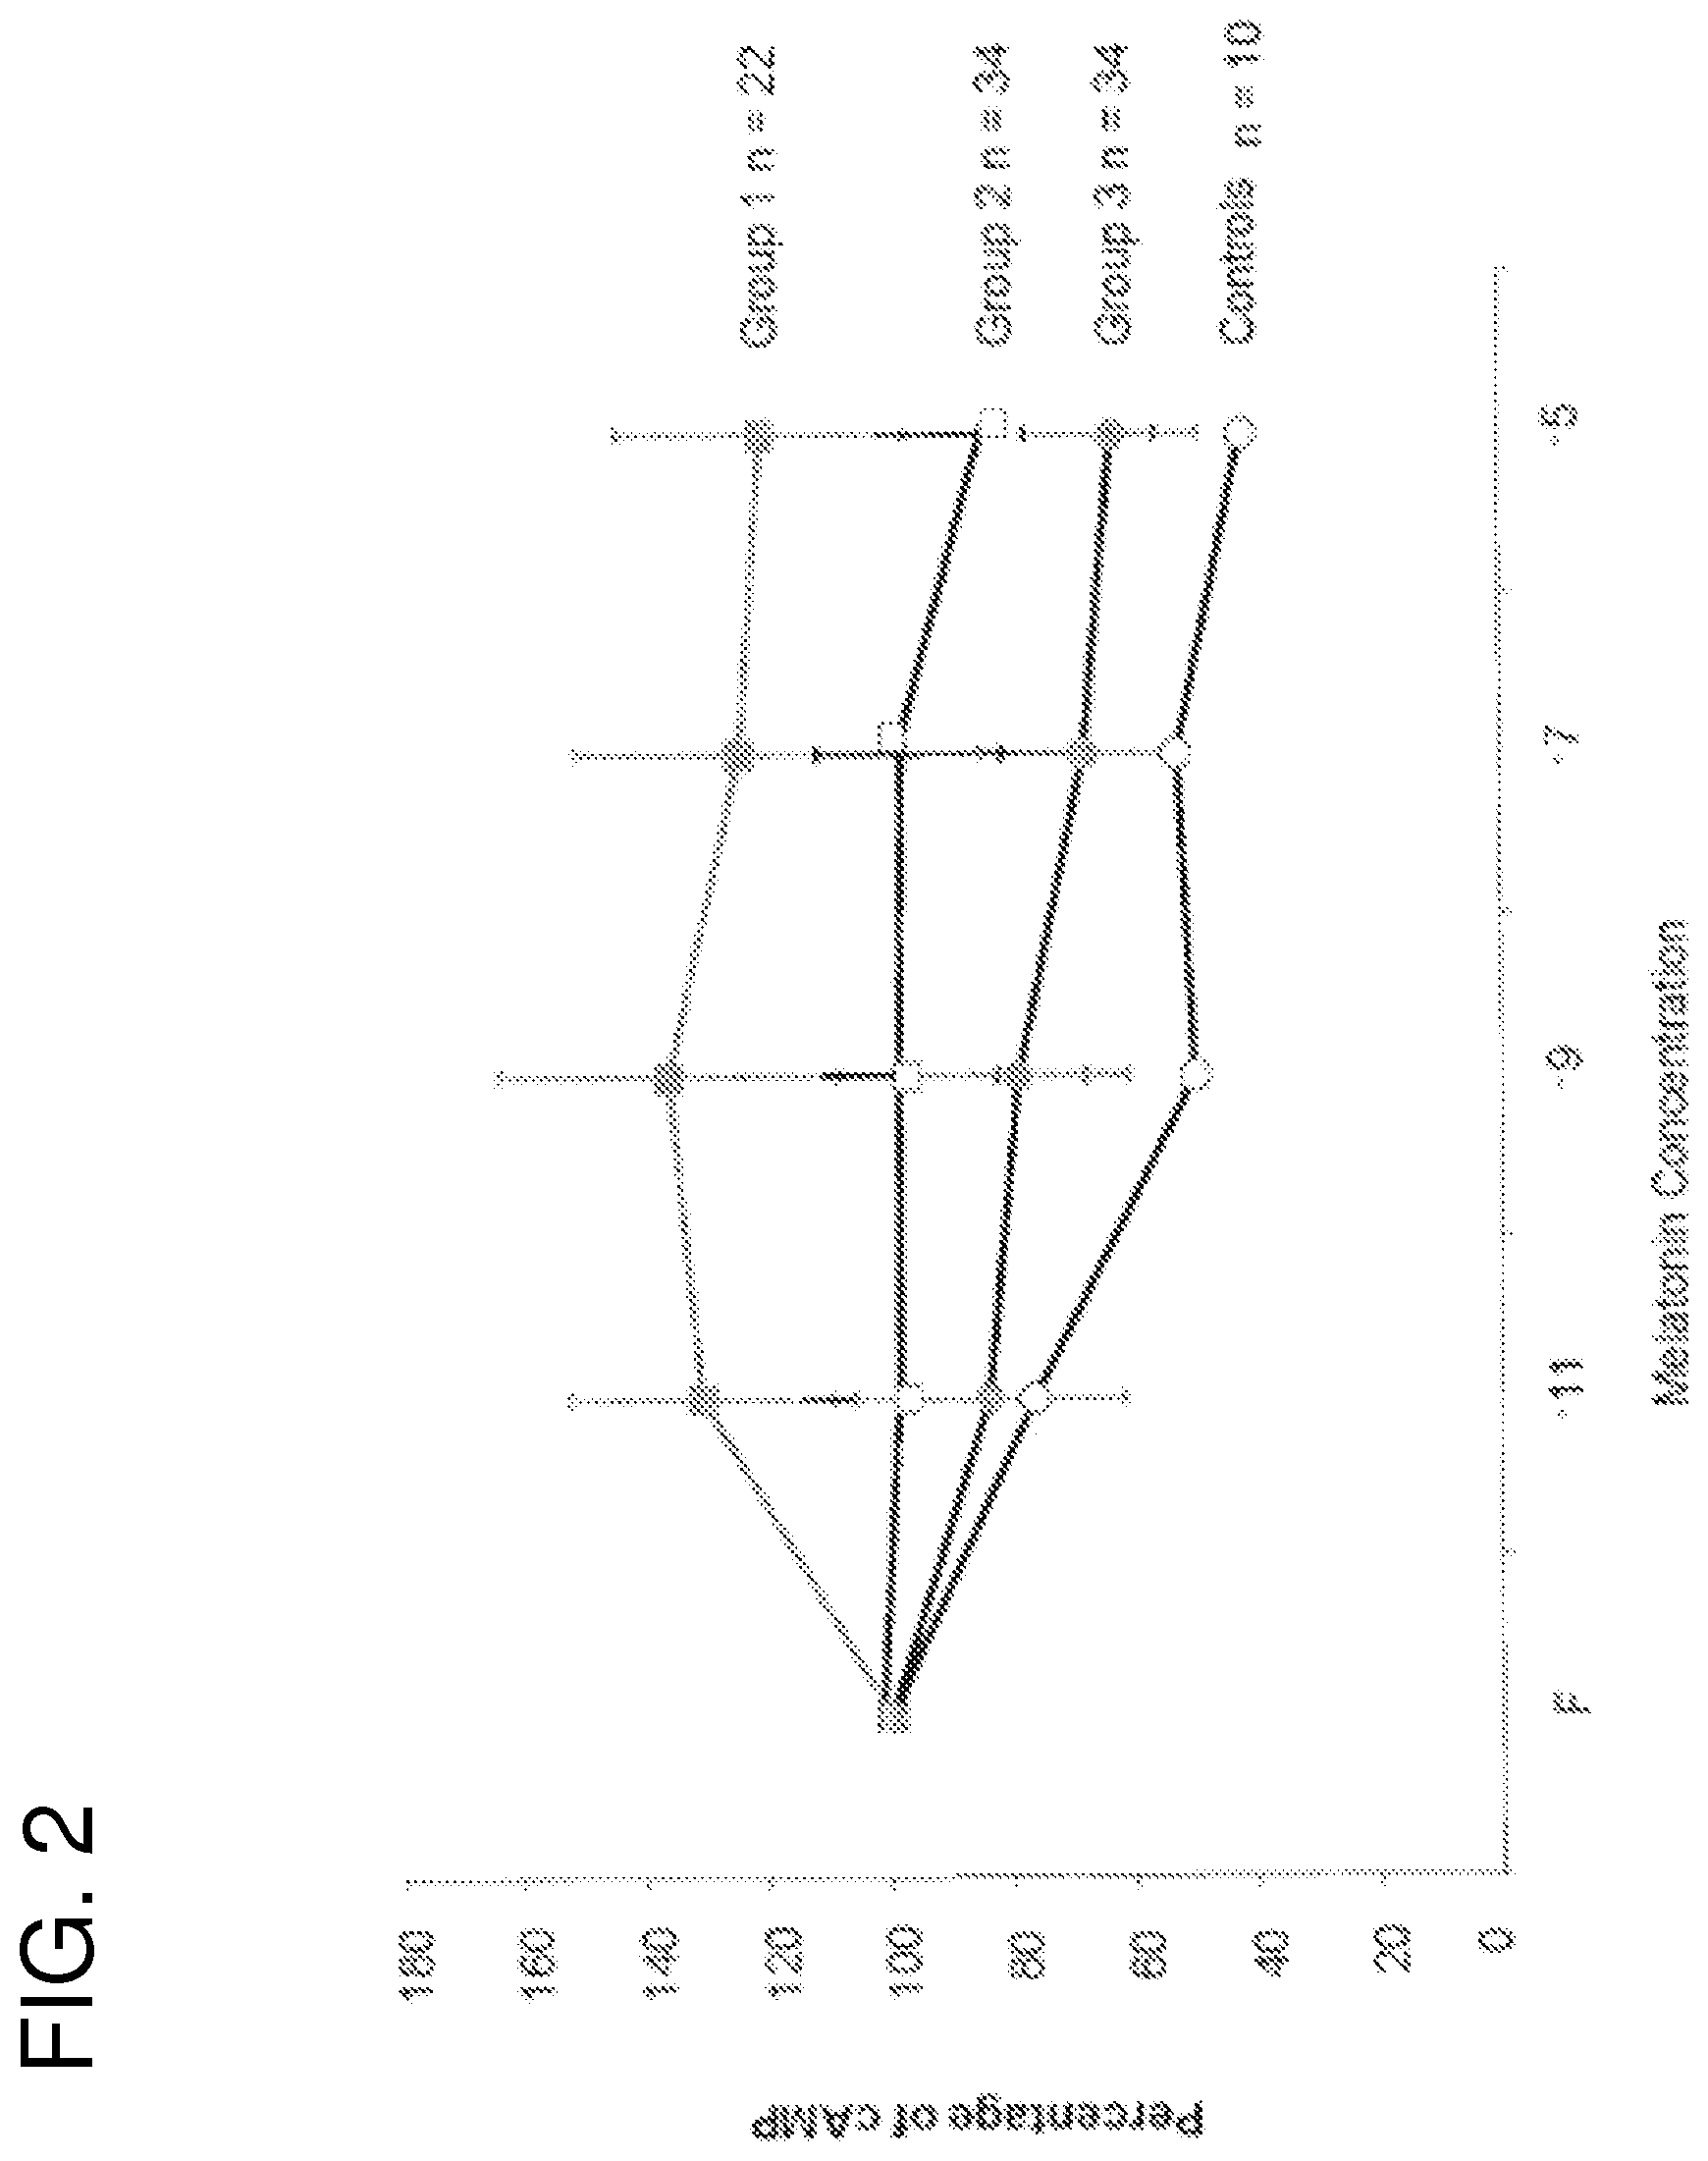
FIG. 2 shows osteoblasts from control subjects (non-IS) and patients with IS were pre-treated with forskolin to induce adenylate cyclase activity and subsequent cAMP production. Cells were then challenged with increasing concentration of melatonin and the functional status of melatonin signaling was estimated by the ability of melatonin to reduce cAMP levels. Data were normalized with cAMP production induced by forskolin in the absence of melatonin;
FIGS. 3A and 3B show the response of different receptors coupled to G.sub.i proteins expressed on osteoblasts obtained from AIS patients or control subjects following activation by a specific ligand, as measured by Cellular Dielectric Spectroscopy (CDS). Comparisons to control (*), Group 3 (.PSI.) or Group 2 (.OMEGA.) are indicated by: *, .PSI., .OMEGA., p<0.05; **, .PSI..PSI., .OMEGA..OMEGA., p<0.01; ***, .PSI..PSI..PSI., p<0.001;
FIGS. 4A-4C compare Gi coupled protein signaling dysfunction using different ligands presented as percentage of maximal response measured by Cellular Dielectric Spectroscopy (CDS). Increasing concentrations of melatonin, iodomelatonin, BP554, UK14304, IB-meca and CB65 were applied to osteoblasts from control subject (non-IS) and patients with IS (Groups 1, 2 and 3). The subsequent cellular response was measured by CDS in the CELLKEY.TM. label-free cellular analysis instrument. Curves were generated from maximum impedance magnitude. Data were normalized to maximal response in cells from control patients, and are expressed as mean.+-.SE of three independent experiments performed in duplicate;
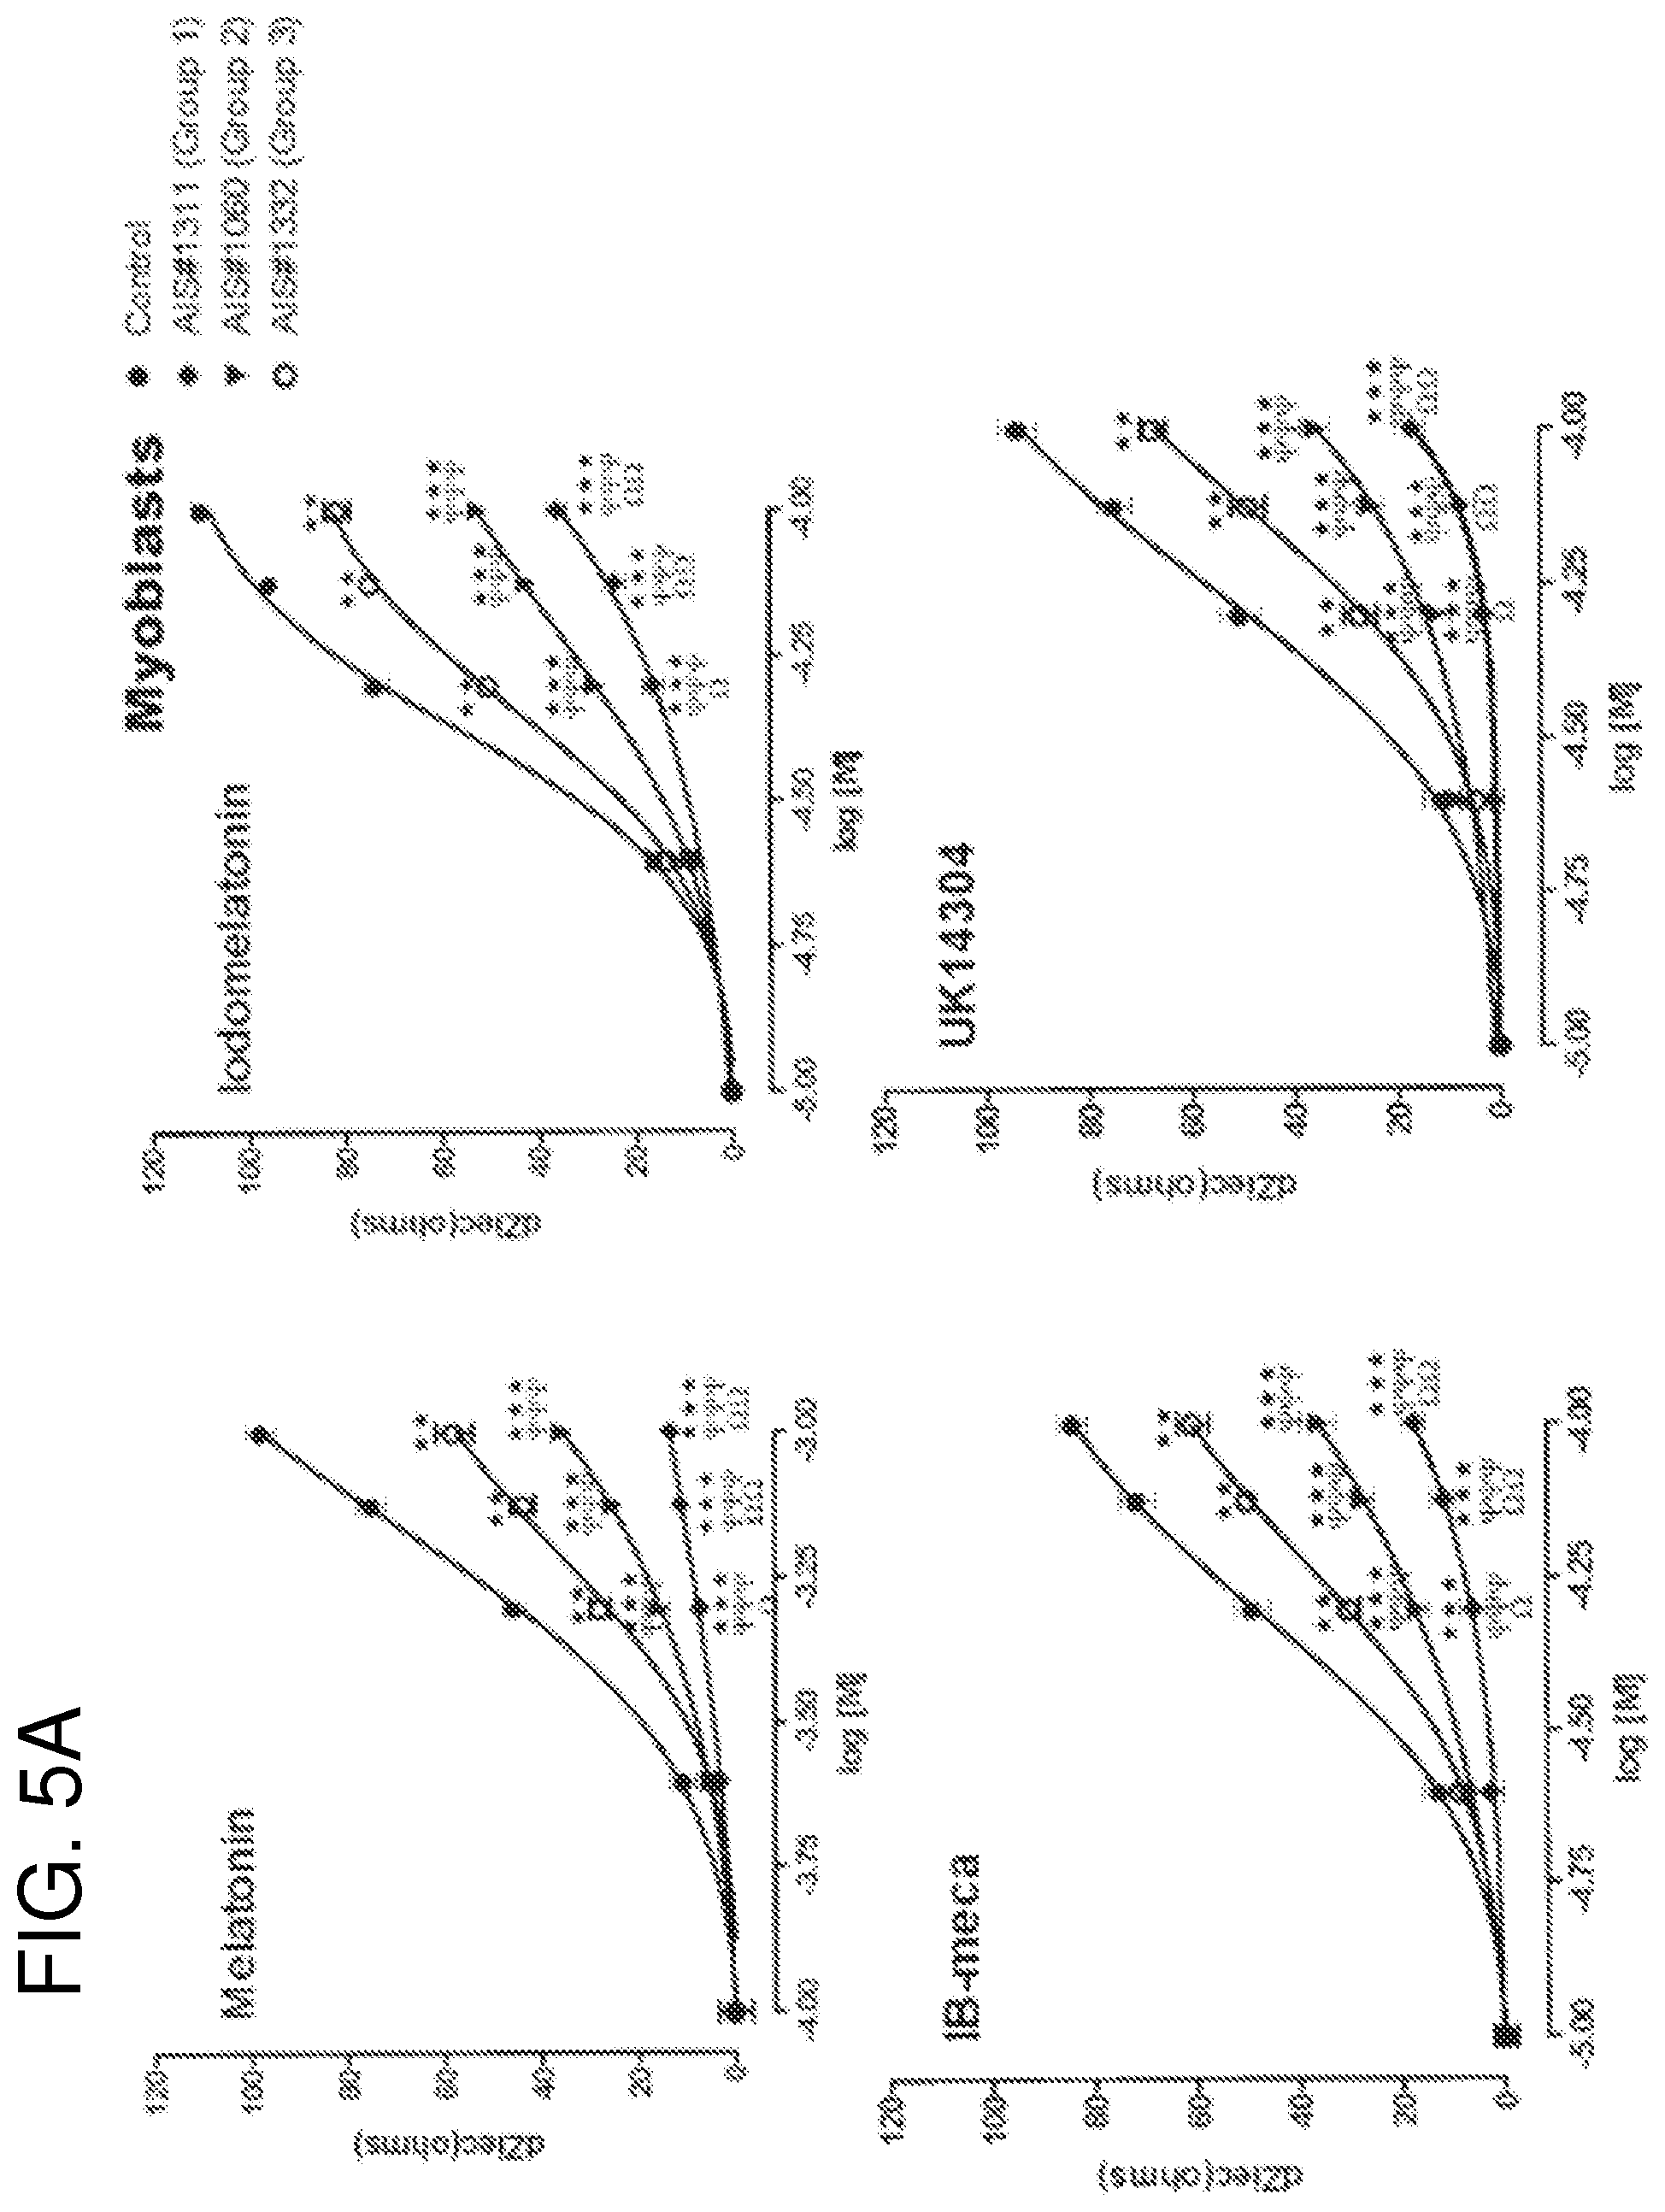
FIGS. 5A and 5B show the response of different receptors coupled to G.sub.i proteins expressed on myoblasts obtained from AIS patients or control subject following activation by a specific ligand, as measured by Cellular Dielectric Spectroscopy (CDS). Comparisons to control (*), Group 3 (.PSI.) or Group 2 (.OMEGA.) are indicated by: *, .PSI., .OMEGA., p<0.05; **, .PSI..PSI., .OMEGA..OMEGA., p<0.01; ***, .PSI..PSI..PSI., p<0.001;
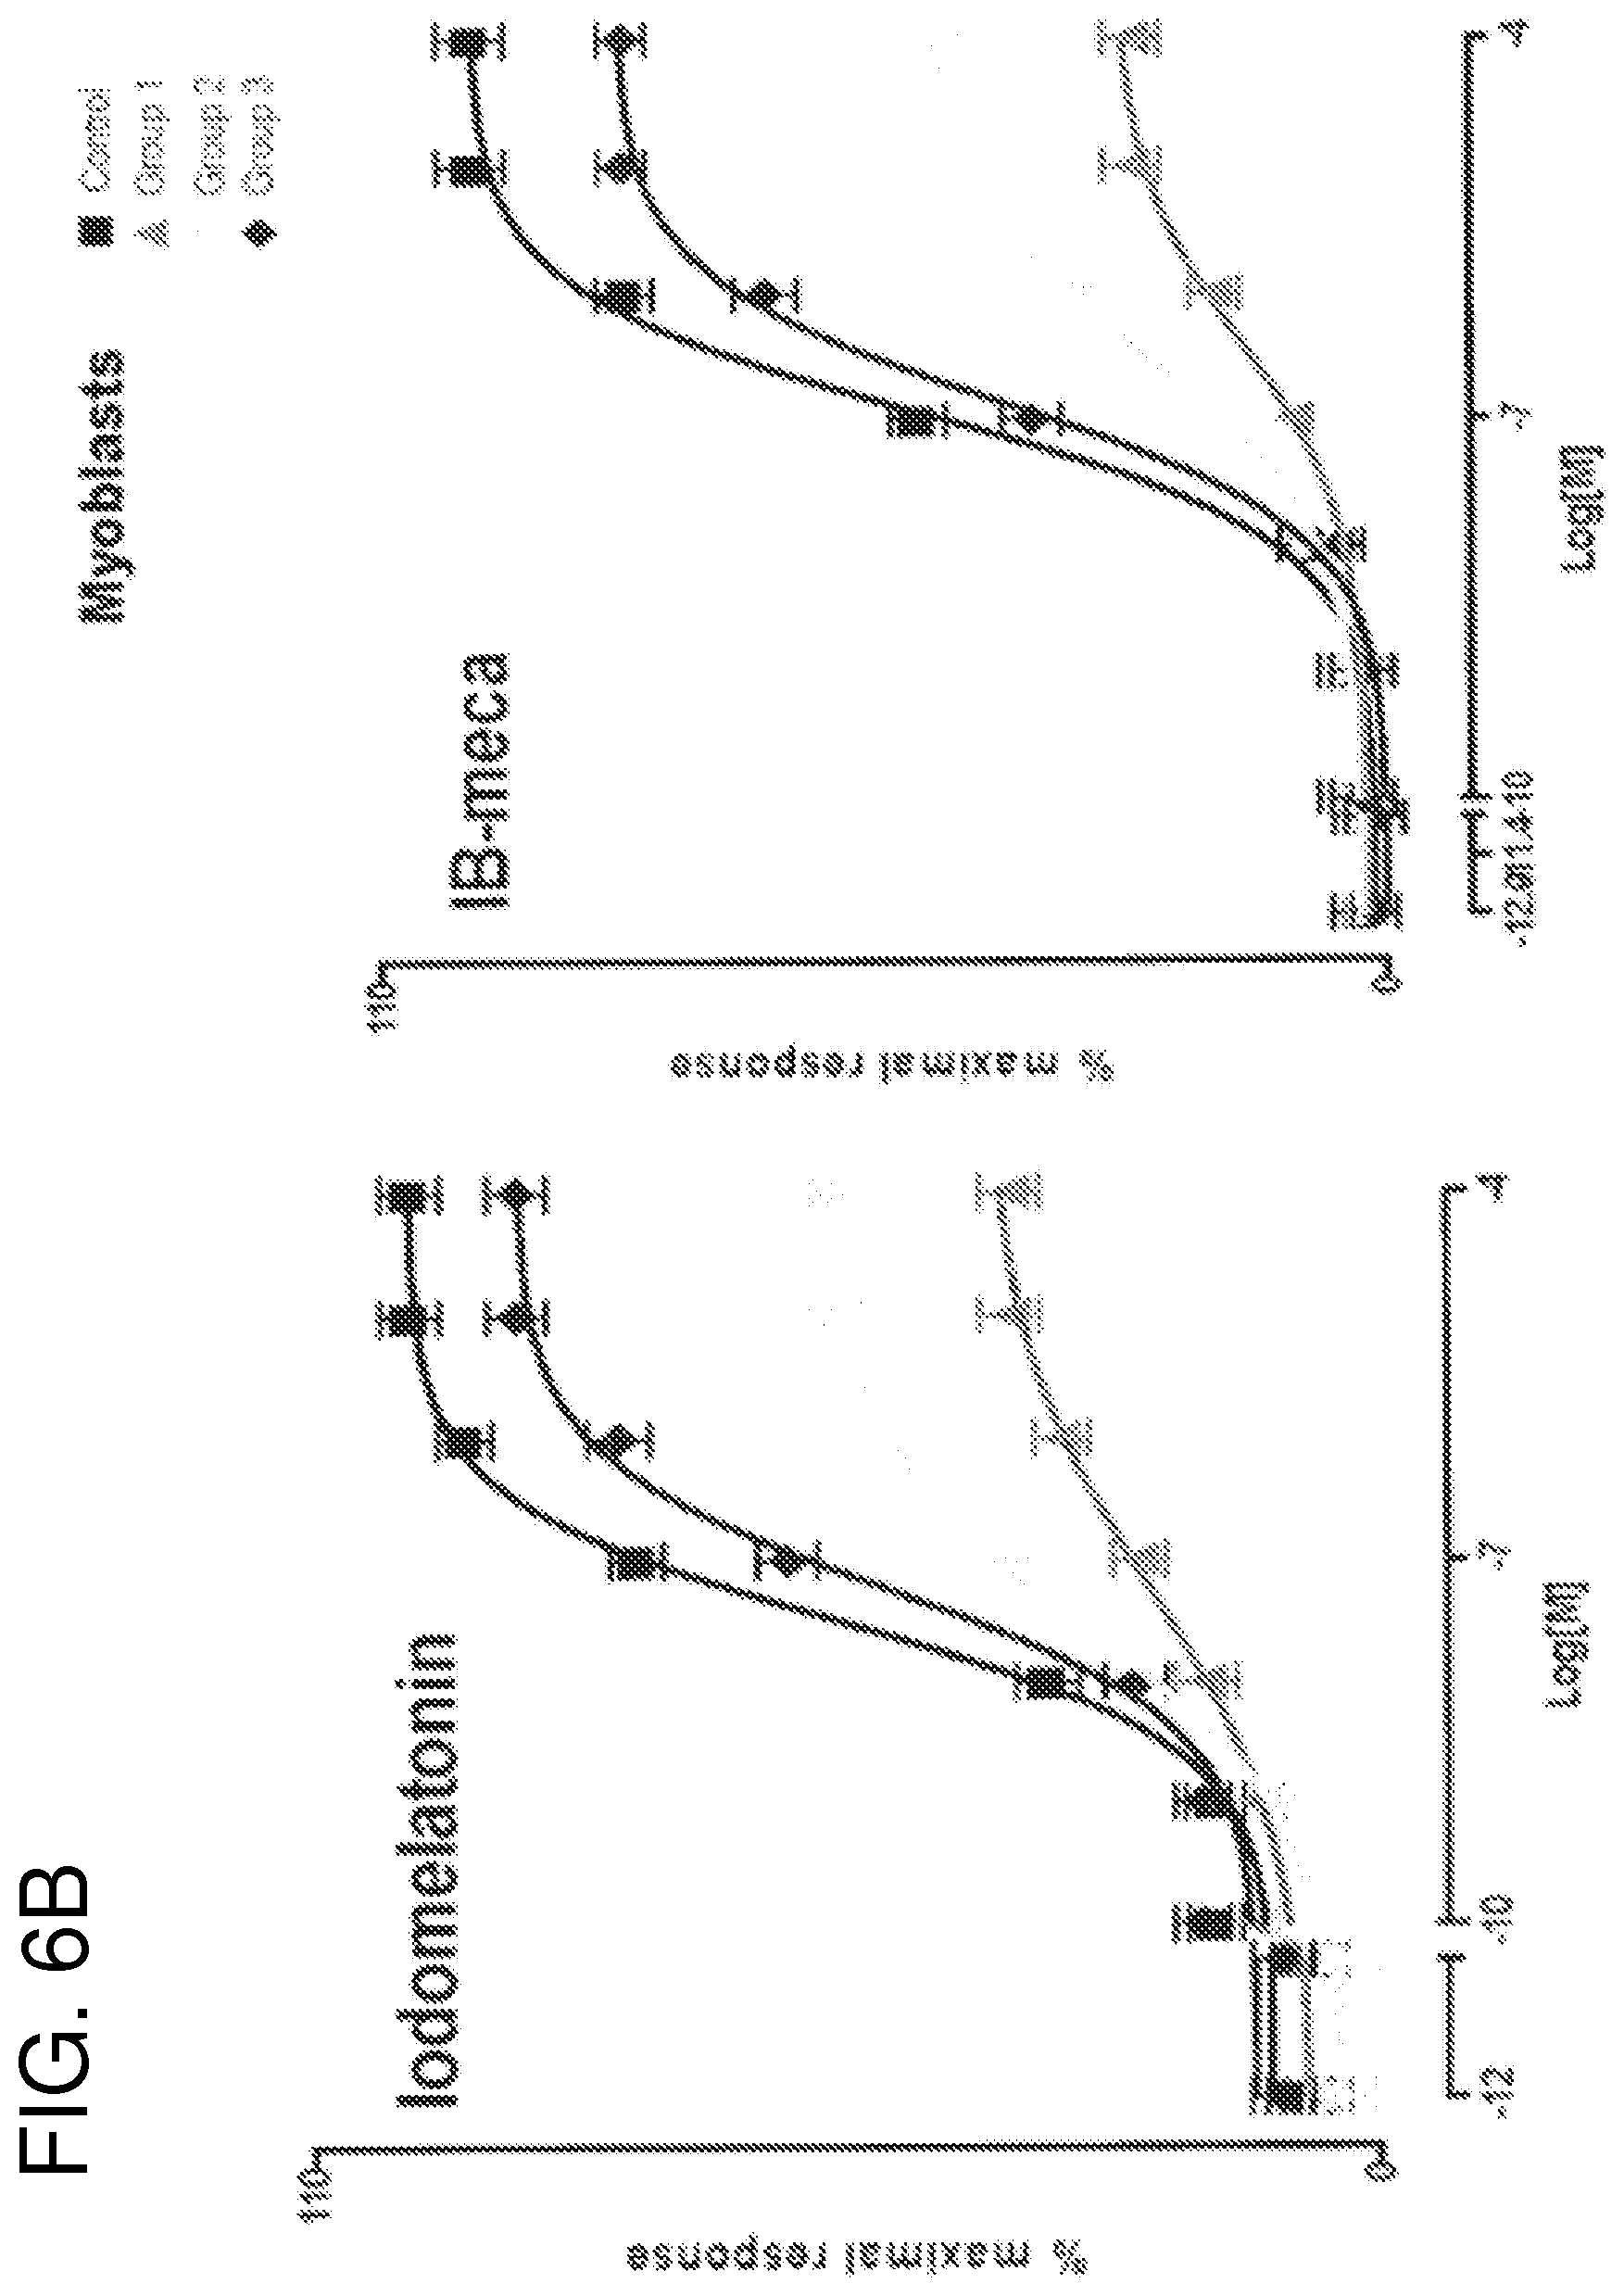
FIGS. 6A-6C compare Gi coupled protein signaling dysfunction using different ligands presented as percentage of maximal response measured by Cellular Dielectric Spectroscopy (CDS). Increasing concentrations of melatonin, iodomelatonin, BP554, UK14304, IB-meca and CB65 were applied to myoblasts from control subject (non-IS) and patients with IS (Groups 1, 2 and 3). The subsequent cellular response was measured by CDS in the CELLKEY.TM. label-free cellular analysis instrument. Curves were generated from maximum impedance magnitude. Data were normalized to maximal response in cells from control patients, and are expressed as mean.+-.SE of three independent experiments performed in duplicate;
FIGS. 7A and 7B show the response of different receptors coupled to G.sub.i proteins expressed on PBMCs obtained from AIS patients or control subjects following activation by a specific ligand, as measured by Cellular Dielectric Spectroscopy (CDS). Comparisons to control (*), Group 3 (Y) or Group 2 (0) are indicated by: *, .PSI., .OMEGA., p<0.05; **, .PSI..PSI., .OMEGA..OMEGA., p<0.01; ***, .PSI..PSI..PSI., p<0.001;
FIGS. 8A-8C compare Gi coupled protein signaling dysfunction using different ligands presented as percentage of maximal response measured by Cellular Dielectric Spectroscopy (CDS). Increasing concentrations of melatonin, iodomelatonin, BP554, UK14304, IB-meca and CB65 were applied to PBMCs (containing principally lymphocytes) from control subjects (non-IS) and patients with IS (Groups 1, 2 and 3). The subsequent cellular response was measured by CDS in the CELLKEY.TM. label-free cellular analysis instrument. Curves were generated from maximum impedance magnitude. Data were normalized to maximal response in cells from control patients, and are expressed as mean.+-.SE of three independent experiments performed in duplicate;
FIG. 9 shows that the altered response of Gi-coupled receptors to ligand stimulation is detected in PBMCs from family #24. The maximal impedance of all shown members of the family was measured by Cellular Dielectric Spectroscopy (CDS). *** means p<0.001;
FIGS. 10A and 10B show that the altered response of Gi-coupled receptors to ligand stimulation is detected in PBMCs from four families: 23, 24, 29 and 39. The maximal impedance of all shown members of the families were measured by Cellular Dielectric Spectroscopy (CDS). *** means p<0.001;
FIGS. 11A-11F show ranges of values obtained in osteoblasts from control subjects and AIS patients belonging to functional groups 1, 2 and 3 using (FIG. 11A) 300 .mu.M melatonin, (FIG. 11B) 300 .mu.M iodomelatonin, (FIG. 11C) 300 .mu.M BP554, (FIG. 11D) 300 .mu.M UK14304, (FIG. 11E) 300 .mu.M IB-meca and (FIG. 11F) 300 .mu.M CB65, as measured by Cellular Dielectric Spectroscopy (CDS);
FIGS. 12A and 12B show ranges of values obtained in PBMCs from control subjects and AIS patients (FIG. 12A) or asymptomatic at risk subjects (FIG. 12B), using 300 .mu.M of iodomelatonin as measured by Cellular Dielectric Spectroscopy (CDS). Each point represents the mean of three wells on individual subjects and the assay coefficient of variation found was typically less than 10%;
FIGS. 13A and 13B show the response of different receptors coupled to G.sub.i proteins expressed on PBMCs obtained from asymptomatic at risk patients, AIS subjects and control subjects and following activation by a specific ligand, as measured by Cellular Dielectric Spectroscopy (CDS) at time zero (To) and eighteen months later (T.sub.18). FIG. 13C provides on a single graph the response to the melatonin receptor on PBMCs (containing principally lymphocytes) obtained from asymptomatic at risk patients;
FIGS. 14A and 14B show GPRC signaling in osteoblasts of a control subject and of AIS subjects (Groups 1, 2 and 3) using different ligands Gs, Gi and Gq to determine whether the signaling is specific to Gi-coupled receptor;
FIGS. 15A-15G show a list of known Gi-protein coupled receptors; and
FIGS. 16A-16DDD show a list of known ligands to Gi-protein coupled receptors.
DESCRIPTION OF ILLUSTRATIVE EMBODIMENTS
The present invention is illustrated in further details by the following non-limiting examples.
Example 1
Clinical Characteristics of Subjects (Control, AIS and Asymptomatic)
The clinical characteristics of the examined healthy subjects (controls), AIS subject and asymptomatic subjects are presented in Tables I-III below, respectively.
TABLE-US-00001 TABLE I Clinical data of healthy control subjects. Case Number Gender Age 5 Female 10.6 11 Male 11.3 20 Female 10.0 21 Female 10.4 23 Male 10.3 33 Male 10.1 43 Female 14.9 60 Female 14.4 61 Female 16.3 68 Female 12.9 69 Female 14.5 86 Female 13.7 4110 Female 17.3 4112 Male 13.6 4115 Female 14.7 4121 Male 13.8 4124 Female 12.8 4126 Female 14.6 4131 Male 15.5 4135 Male 15.8 4137 Female 16.8 4138 Female 13.1 4140 Male 14.9 4142 Female 15.3 4143 Female 13.1 4148 Male 14.8 4149 Female 15.4 4150 Female 15.2 4159 Male 14.0 4161 Male 13.3 4174 Female 12.9 4179 Female 16.6 4181 Male 15.9 4182 Female 15.7 4190 Male 16.3 4191 Female 15.7 4193 Female 17.3 4195 Female 16.3 4200 Female 13.6 4205 Male 11.3 4206 Male 11.4 4209 Female 15.8 *All reported data is that from first collection date.
TABLE-US-00002 TABLE II Clinical data of AIS patients Case Number Group Gender Age Cobb Angle Curve Pattern 113 Female 9.7 10 Right Thoracic 3 151 Female 13.1 31 Right Thoracic 3 155 Female 15.4 20 Left Thoracolumbar 2 159 Female 8.3 7 Left Lumbar 3 165 Female 10.8 26 Right Thoracic 3 23 Left Lumbar 168 Female 14.2 16 Right Thoracic 3 18 Left Thoracolumbar 208 Female 9.8 26 Left Thoracolumbar 3 254 Female 15.2 28 Left Thoracolumbar 3 271 Female 12.4 23 Right Thoracic 3 275 Female 11.0 27 Right Thoracic 2 1 Left Lumbar 276 Female 13.1 19 Right Thoracic 3 19 Left Lumbar 281 Female 12.6 7 Left Thoracolumbar 3 282 Female 9.7 20 Left Lumbar 2 302 Female 14.4 14 Right Thoracic 3 12 Left Lumbar 306 Female 13.1 13 Right Thoracic 2 18 Left Lumbar 327 Female 16.4 21 Right Thoracic 1 336 Female 14.0 6 Right Thoracic 3 12 Left Lumbar 404 Female 14.6 25 Right Thoracic 3 425 Female 24.6 52 Left Thoracolumbar 3 475 Female 13.2 19 Left Thoracolumbar 541 Male 15.3 13 Right Thoracic 2 542 Female 15.6 21 Right Thoracic 2 26 Left Thoracolumbar 543 Female 10.9 10 Right Thoracic 2 8 Left Thoracolumbar 544 Female 15.1 8 Left Thoracic 2 2 Right Thoracolumbar 548 Female 15.6 16 Right Lumbar 3 1020 Female 19.9 59 Right Thoracic 3 55 Left Lumbar 1060 F 12.0 48 Right thoracic 3 38 Left lumbar 1198 Female 16.3 20 Right Thoracolumbar 3 1311 F 15.52 42 Right thoracic 2 1332 F 13.11 35 Right thoracic 3 1385 Female 27 Left Thoracic 2 16.1 42 Right Thoracic 23 Left Lumbar 1468 Male 15.5 69 Right Thoracolumbar 3 1474 Male 17.9 54 Right Thoracic 1 52 Left Lumbar 1488 Male 15.4 87 Right Thoracic 1 1513 Female 15.6 11 Right Thoracic 3 12 Left Lumbar 1520 Female 14.6 54 Right Thoracic 3 42 Left Thoracolumbar 1545 Female 13.5 57 Right Thoracic 3 1549 Female 14.8 24 Right Thoracic 1 55 Left Thoracolumbar 1550 Female 12.3 60 Right Thoracic 2 51 Left Lumbar 1552 Female 18.5 30 Left Thoracic 3 66 Right Thoracic 37 Left Lumbar 1554 Female 14.7 49 Right Thoracolumbar 3 1557 Female 12.1 83 Right Thoracic 2 54 Left Lumbar 1562 Female 19.1 51 Right Thoracic 3 41 Left Lumbar 1566 Female 12.2 53 Left Thoracic 3 74 Right Thoracic *All reported data is that from first collection date.
TABLE-US-00003 TABLE III Clinical data of asymptomatic at-risk subjects studied. Case Number Group Number Gender Age 3004 Female 8.6 2 3006 Male 5.8 3 3009 Female 3.0 2 3018 Female 11.3 3 3023 Female 9.5 3 3027 Female 14.1 2 3030 Male 10.7 3 3040 Male 9.7 3 3043 Female 4.7 3 3054 Female 8.2 1 3057 Female 15.3 3 3058 Female 8.0 3 3062 Male 14.5 3 3065 Female 12.2 3 3067 Female 12.0 3 3068 Male 12.0 3 3070 Female 8.5 2 3071 Male 5.5 3 3080 Female 10.0 3 3081 Male 16.2 3 3082 Female 7.6 3 3095 Male 10.7 3 3096 Female 8.5 3 3098 Male 12.5 3 3099 Female 10.4 3 3115 Male 10.6 3 3116 Female 9.5 3 3123 Female 10.8 3 3124 Male 15.0 3 3159 Female 5.1 3 *All reported data is that from first collection date.
Clinical Characteristics of Subjects from which Cells were Isolated for Examples 3-4 and 8-10.
The institutional review boards of The Sainte-Justine Hospital, The Montreal Children's Hospital, The Shriners Hospital for Children in Montreal and McGill University approved this study. Parents or legal guardians of all participants gave written informed consent, and minors gave their assent. All patients with IS were examined by one of the six orthopedic surgeons participating in this study. A person was deemed to be affected if history and physical examination were consistent with the diagnosis of IS and a minimum of a ten degree curvature in the coronal plane with vertebral rotation was found by radiograph. A summary of demographics and clinical characteristics of these subjects are shown in Table IV below. These subjects are also included in Table II above.
A number of young asymptomatic children born from one parent affected by IS were also enrolled in the study to evaluate the performance of the test in the asymptomatic population. Each subject was examined by the same orthopedic surgeon in a clinic for early detection of IS at Sainte-Justine University Hospital. These subjects are also included in Table III above.
Healthy children were recruited as controls in Montreal's elementary schools after an informed written consent was obtained from their parents or legal guardians; minors also gave their assent. This recruitment was approved by The Montreal English School Board, The Affluent School Board and all institutional review boards mentioned above. Each normal subject was also examined by the same orthopedic surgeon using Adam's forward bending-test with a scoliometer (Table IV) to rule out any hidden scoliosis before entering the study. These subjects are also included in Table I above.
TABLE-US-00004 TABLE IV Summary of clinical characteristics of the AIS subjects presented in Examples 3-4 and 8-10. Mean Double Scoliosis Cobb Mean Single Scoliosis Angle (.degree.) Mean Age Cobb Angle (.degree.) Thoracic + Subjects (Years) Thoracic Lumber Thoracolumbar Lumbar Heredity IS severely 14.8 .+-. 2.3 72 .+-. 21 -- 59 .+-. 14 48.6 .+-. 18.9 4/19 affected (N = 19) (thoracic angle) 48.9 .+-. 14.8 (lumbar angle) N = 11 N = 0 N = 2 N = 2 IS moderately 13.0 .+-. 2.2 18.8 .+-. 6.7 18.0 .+-. 15.7 .+-. 8.9 18.8 .+-. 9.4 8/25 affected (N = 25) 2.8 (thoracic angle) 17.6 .+-. 11.3 (lumbar angle) N = 7 N = 2 N = 7 N = 8 Healthy control 14.1 .+-. 2.1 -- -- -- -- 0 subjects (N = 42) At-risk control 10.2 .+-. 3.2 -- -- -- -- 30/30 subjects (N = 30)
Example 2
Material and Methods
The response of G.sub.i protein-coupled receptors was investigated in various cell types (osteoblasts, myoblasts and PBMCs (including principally lymphocytes)) obtained from patients with clinically well-defined AIS and compared with an age- and gender-matched control subjects (not affected by a scoliosis).
Three populations were investigated: patients with IS, healthy controls without any family history of scoliosis, and asymptomatic offspring, born from at least one scoliotic parent, who are considered at-risk of developing scoliosis. A group of 44 patients with IS (19 AIS patients with curvatures greater than 45.degree. and 25 AIS patients with curvatures between 10.degree. and 29.degree.) (Table II above), as well as 42 healthy control subjects (Table I above) and 30 asymptomatic children at-risk of developing scoliosis (Table III above) were recruited and examined every 6 months. All subjects were Caucasians.
Osteoblasts and Myoblasts
Bone specimens were obtained intraoperatively from vertebras (varying from T3 to L4 according to the surgical procedure performed), while with trauma cases used as non-scoliotic controls bone specimens were obtained from other anatomical sites (tibia or femur, and in one case from an iliac crest biopsy). Osteoblasts and myoblasts isolated as previously described (Moreau A, Wang D S, Forget S et al. Melatonin Signaling Dysfunction in Adolescent Idiopathic Scoliosis. Spine 2004; 29:1772-81; Azeddine et al., 2007 Molecular determinants of melatonin signaling dysfunction in adolescent idiopathic scoliosis. Clin Orthop Relat Res. 2007, 462:45-52), were cultured at 37.degree. C./5% CO.sub.2 in MEM supplemented with 10% fetal bovine serum (FBS) and 100 .mu.g/mL streptomycin. Prior to the experiment, cells were seeded into the CELLKEY.TM. label-free cellular analysis system standard 96-well plates at a density of 5.times.10.sup.4/well and grown for 24 h and incubated in standard conditions (37.degree. C./5% CO.sub.2). In some plates, Pertussis toxin (100 ng/mL, Sigma, Oakville, ON, Canada) treatment was performed 16 h before the CDS assay. Following overnight incubation, plates were placed onto the CELLKEY.TM. label-free cellular analysis system and growth medium was exchanged to assay buffer (Hanks, Balanced Salt Solution containing 20 mM HEPES and 0.1% BSA) before starting the experiment. Cells were then allowed to equilibrate at room temperature for 30 min. Pre-addition measurements were made for 5 min to obtain a baseline reading. Then, ligands (melatonin, 2-lodomelatonin, BP554 maleate, UK14304, IB-MECA and/or CB65) were added simultaneously to all 96 wells using an integrated fluidics system. Activation of endogenous receptors resulted in a change in impedance that started occurring immediately after fluid addition and mixing. The quick update rate (2 s.) of the CELLKEY.TM. label-free cellular analysis system allows detection of these immediate changes in impedance. Impedance measurements were collected for 10 min to 15 min at 28.degree. C. after ligand addition to monitor cellular responses to ligand interaction and to generate CELLKEY.TM. label-free cellular analysis system response profiles that are characteristic of the signaling mechanisms used.
PBMCs
Blood samples were obtained from patients and control groups and collected in blood collection tubes containing EDTA and then centrifuged on a Ficoll-Plaque (GE Healthcare, Mississauga, ON, Canada) solution to obtain PBMCs (containing principally lymphocytes). PBMC fractions were preserved frozen in FBS with 10% DMSO and kept in liquid nitrogen until thawed and assayed. PBMCs were harvested from stock tissue culture flask and washed three times with assay buffer. Cells were isolated from the heparinized peripheral by ficoll-Hypaque density gradient centrifugation, and cultured in RPMI 1640 medium supplemented with 10% FBS, 100 .mu.g/mL streptomycin and 1% of phytohemagglutinin. Following 48 h of incubation at 37.degree. C./CO.sub.2 cells were washed three times with assay buffer and seeded into the CELLKEY.TM. label-free cellular analysis system small 96-well plates. Typically, an average of 1.times.10.sup.5 cells to 1.5.times.10.sup.5 were added to each well and allowed to settle for 30 min at room temperature. This resulted in a single layer of cells on top of the electrodes. After the cells settled, the cell plate was placed on the instrument and experiments were initiated in the manner described below after the acquisition of 5 min of baseline measurements. All experiments were conducted at 28.degree. C.
Cellular Dielectric Spectroscopy (CDS)
The response induced by the various ligands to their receptors was measured by cellular dielectric spectroscopy (CDS) using the CELLKEY.TM. label-free cellular analysis technology. (MDS Sciex, San Francisco, Calif., USA). The CELLKEY.TM. label-free cellular analysis system integrates a proprietary impedance measurement system, custom 96-well microliter plate, onboard 96-well fluidics, and environment control and custom acquisition and analysis software in a full solution package (MDS Sciex) that is compatible with commercially available robotic platforms. Small voltage at 24 frequencies, from 1 KHz to 10 MHz, is applied to a monolayer of cells settled in a 96-well microplate containing electrodes at the bottom, and the resultant current is measured at an update rate of 2 s. The system is thermally regulated and experiments can be conducted between 28 and 37.degree. C., and for examples presented herein was typically 28.degree. C. Onboard fluid additions and exchanges are handled by 96-well head fluid delivery device with a range of 5-500 .mu.L. In addition to the cell plate location, the CELLKEY.TM. label-free cellular analysis system includes two additional stations for 96- or 384-well compound plates. All aspects of assay set up, execution, and data acquisition and analysis are controlled by CELLKEY.TM. label-free cellular analysis software.
Agonist and antagonist activity of natural or synthetic ligands may be accurately quantified under conditions of low receptor expression (when using primary and first passage cells derived from patients, for example) using the CELLKEY.TM. label-free cellular analysis technology.
cAMP Assay in Osteoblasts
Osteoblasts from patients with IS and control subjects were seeded in quadruplicate on 24-well plates (1.times.10.sup.5 cells per well) and tested as previously described (Moreau A, Wang D S, Forget S et al. Melatonin Signaling Dysfunction in Adolescent Idiopathic Scoliosis. Spine 2004; 29:1772-81). All assays were performed in duplicate.
Statistical Analysis
Three experiments in duplicate were carried out for each subject, and results are mean.+-.SE of these measurements. The assay coefficient of variation was found typically less than 10%. All concentration response curves were analyzed by non-linear regression using the GRAPHPAD.TM. software (San Diego, Calif.). For statistical analysis, multiple comparisons were performed with One-way analysis of variance (ANOVA) followed by a post-hoc test of Newman-Keuls. Probability values less than 0.05 were taken as significant.
Data are presented as mean.+-.SE. Multiple comparisons of means were performed with one-way analysis of variance (ANOVA) followed by a post-hoc test of Dunnett, using the GRAPHPAD.TM. Prism 4.0 software. Only P values <0.05 were considered significant.
Example 3
CDS Detecting Relative Part of Gi Protein-Mediated Pathway in Melatonin Signaling
The ability of CDS to detect the relative part of the Gi protein-mediated pathway in melatonin signaling was determined by blocking this pathway with pertussis toxin (PTX). This toxin ADP-ribosylates the a subunit of the heterotrimeric Gi protein and thereby prevents its activity. The MG63 osteoblast cell line was serum-starved for 16 h in the absence or presence of 100 ng/mL of PTX to inhibit the .alpha..sub.i subunit of Gi protein. Cells were then stimulated with 10 .mu.M of melatonin or iodomelatonin at 37.degree. C. for 5 min. Cellular responses were measured with CELLKEY.TM. label-free cellular analysis system as described in the Material and Methods section.
Results presented in FIG. 1 show that the PTX treatment dramatically inhibits the cellular response measured by CDS in MG63 osteoblast cell line following stimulation with either melatonin or iodomelatonin. The inhibition extent was about 75% for melatonin and 90% for iodomelatonin, indicating the major effects Gi protein have on melatonin signaling measured by CDS.
Example 4
Comparison of Melatonin Impairment Measured by cAMP and CDS
First osteoblasts derived from healthy controls and three severely affected IS patients (surgical cases exhibiting a Cobb's angle >45.degree.) were pre-treated with forskolin to induce adenylate cyclase activity and subsequent cAMP production. Cells were then challenged with increasing concentration of melatonin and the functional status of melatonin signaling was estimated by the ability of melatonin to reduce cAMP levels. Data were normalized with cAMP production induced by forskolin in the absence of melatonin. As expected, osteoblasts from IS patients exhibited high cAMP production in response to melatonin subsequently to forskolin stimulation when compared to those from healthy control subjects (FIG. 2). Furthermore, the extent of this production was different between the three IS patients. These data are consistent with previous findings, (Goldberg M S, Mayo N E, Poitras B et al. The Ste-Justine Adolescent Idiopathic Scoliosis Cohort Study. Part I: Description of the study. Spine 1994; 19:1551-61.) thus confirming the occurrence of a melatonin signaling dysfunction of different degrees in the osteoblasts of these patients.
The ability of a CDS assay to detect this defect was then assessed by studying the effect of various concentrations of melatonin and iodomelatonin on CDS response of these cells. Increasing concentrations of melatonin or iodomelatonin were applied to osteoblasts and PBMCs (including principally lymphocytes) from healthy control subjects (Control) and patients with IS (Groups 1, 2 and 3). The subsequent cellular response was measured by CDS in the CELLKEY.TM. label-free cellular analysis instrument. Curves were generated from maximum impedance magnitude. Data were normalized to maximal response in cells from control patients, and were expressed as mean.+-.SE of three independent experiments performed in duplicate. Results obtained showed that melatonin and iodomelatonin evoked similar responses in a concentration-dependent manner in osteoblasts from both control and IS patients. However, the magnitude of response was significantly lower in IS osteoblasts (FIGS. 4A-4C). On the other hand, a significant difference in the extent of CDS response was also observed between the three IS patients. These results indicate that the dysfunction of melatonin signaling in IS and the disparity of this defect among patients can be detected by CDS in IS patients.
Interestingly, the screening of PBMCs in response to melatonin or iodomelatonin, using CDS, revealed similar features than those obtained with osteoblasts (FIGS. 4A-4C and 8A-8C), demonstrating that melatonin signaling dysfunction also occurs in PBMCs.
Example 5
Comparison of the Response of Different Gi-Coupled Receptors in Various Cell Types Isolated from IS Vs. Control Subjects
As shown in FIGS. 3 to 8, osteoblasts, myoblasts and PBMCs isolated from AIS patients and stimulated with ligands specific for different Gi-protein coupled receptors (MT2, 5-HT1A, .alpha.2-AD, A3 or CB2) have an altered response (i.e. change in impedance following stimulation) as compared to that of cells from a normal, non-scoliotic subject, thus demonstrating that IS patients have a generalized impairment in Gi-protein-mediated signaling. As shown in Table V below, an impaired Gi-protein coupled receptor response was measured in cells from all IS subjects (phase I and phase II) tested. Also, cells from 12/31 asymptomatic at risk subjects (subjects having an IS parent) showed a defect in Gi-protein coupled receptor response. Interestingly, 4 out of the 12 subjects in which impaired Gi-protein coupled receptor response was detected later developed symptoms of scoliosis, as determined by X-rays analysis, demonstrating that the impaired/defective Gi-protein coupled receptor response may be used for the prognosis of IS (or of a predisposition to developing IS).
TABLE-US-00005 TABLE V Summary of data obtained with control, AIS and asymptomatic at risk subjects AIS AIS Healthy Asymptomatic Phase II Phase I Patients Control at risk (10.degree.-44.degree.) (.gtoreq.45.degree.) Total 42 31 25 14 number Unaffected 100% 62% (19/31) 0 0 Affected 0% 38% (12/31) 100% 100% Group 1 0% 3% (1/31) 4% (1/25) 21% (3/14) Group 2 0% 6% (2/31) 32% (8/25) 21% (3/14) Group 3 0% 29% (9/31) 64% (16/25) 58% (8/14)
Example 6
Measurement of Gi-Coupled Receptor Responses in Cells Obtained from Members of an AIS Family
FIGS. 9-10 show that an altered response of different Gi-coupled receptors is detected in PBMCs (including principally lymphocytes) isolated from both the IS affected mother and daughter, but not in cells from the unaffected father and son. Interestingly, the Gi-coupled receptor responses measured in cells obtained from the mother and daughter are very similar (Group 2, as defined below), suggesting that the defect has been genetically transmitted by the mother to the daughter. Also, the defect is maintained in the mother although she underwent surgery to reduce spine curvature. The clinical data for the daughter are as follows: Age 13.5, curve pattern: right thoracic, Cobb angle: 6.
Example 7
Stratification/Classification of AIS Subjects Based on Gi-Coupled Receptor Responses Measured in Osteoblasts
FIGS. 11A-11F show the range of mean values obtained for control (n=3) and IS subjects (n=9) using the different Gi-coupled receptor ligands as measured in osteoblasts. The minimal (min) and maximal (max) values represent the mean of three independent measurements performed in duplicate (six values in total) for a given patient/control subject. All AIS subject tested showed a lower Gi-coupled receptor response as compared to control subjects, but it was observed that AIS subjects typically show three types of response (as represented by the three different curves for AIS subjects in FIGS. 3 to 8), and thus may be classified into three groups. AIS subjects having the lowest values (low G.sub.i-coupled receptor response) were classified as subgroup 1, AIS subject having the highest values ("high" G.sub.i-coupled receptor response, but always lower than control subjects) were classified as subgroup 3, and AIS subjects having values between those of Groups 1 and 3 ("intermediate" G.sub.i-coupled receptor response) were classified as subgroup 2. The data (dZiec values and % of control) obtained using various ligands are summarized in Table VI below. Duplicates (n1 and n2) of three independent experiments are presented.
TABLE-US-00006 TABLE VI Stratification/classification of AIS subjects based on Gi-coupled receptor responses dZiec values/% of control Exper. 1 Exper. 2 Exper. 3 Subject n1 n2 n1 n2 n1 n2 Melatonin CTR#60 55.81/-- 53.31/-- 63.72/-- 67.72/-- 59.25/-- 61.03/-- AIS#1474 16.53/29.6% 13.03/24.4% 15.18/23.8% 15.18/22.4% 17.34/29.3% 16.12- /26.4% AIS#1550 28.28/50.7% 30.78/57.7% 29.43/46.2% 32.43/47.9% 29.34/49.5% 31.12- /51% AIS#1020 29.38/52.6% 31.88/59.8% 40.33/63.3% 39.33/58.1% 34.34/58% 36.12/5- 9.2% CTR#61 68.79/-- 66.29/-- 80.84/-- 84.84/-- 74.30/-- 76.08/-- AIS#1549 17.30/25.1% 16.80/25.3% 18.41/22.8% 20.41/24.1% 17.34/23.3% 19.12- /25.1% AIS#1468 44.92/65.3% 46.42/70% 54.79/67.8% 54.79/64.6% 49.34/66.4% 51.12/67.2% AIS#1513 38.90/56.5% 39.40/59.4% 50.81/62.9% 51.81/61.1% 44.34/59.7% 46.12- /60.6% CTR#69 76.12/-- 73.62/-- 89.58/-- 93.58/-- 82.34/-- 84.12/-- AIS#1488 9.79/12.9% 11.29/15.3% 10.91/12.2% 10.91/11.7% 12.34/15% 12.12/14.4% AIS#1198 23.94/39.3% 31.44/42.7% 31.91/35.6% 25.91/27.7% 27.41/33.3% 29.19- /34.7% AIS#1385 -- -- -- -- -- -- Iodomelatonin CTR#60 142.55/-- 139.55/-- 149.20/-- 161.20/-- 152.18/-- 142.58/-- AIS#1474 33.02/23.2% 32.02/23.0% 38.33/25.7% 32.33/20.1% 39.97/26.3% 36.37- /25.5% AIS#1550 55.99/39.3% 48.99/35.1% 60.90/40.8% 62.90/39.0% 62.74/41.2% 59.14- /41.5% AIS#1020 69.57/48.8% 66.57/47.7% 85.25/57.1% 97.25/60.3% 83.71/55.0% 74.11- /52.0% CTR#61 130.88/-- 127.88/-- 138.31/-- 150.31/-- 140.90/-- 131.30/-- AIS#1549 9.21/7.0% 6.21/4.9% 18.70/13.5% 20.70/13.8% 20.25/14.4% 20.65/15.- 7% AIS#1468 91.38/69.8% 88.38/69.1% 101.69/73.5% 113.69/75.6% 102.83/73.0% 93.23/71.0% AIS#1513 83.92/64.1% 80.92/63.3% 94.08/68.0% 106.08/70.6% 95.30/67.6% 85.70/65.3% CTR#69 150.99/-- 147.99/-- 161.10/-- 173.10/-- 162.34/-- 152.74/-- AIS#1488 25.43/16.8% 27.43/18.5% 30.31/18.8% 27.31/15.8% 19.17/11.8% 19.57- /12.8% AIS#1198 61.05/40.4% 61.05/41.3% 65.29/40.5% 70.29/40.6% 60.97/37.6% 57.37- /37.6% AIS#1385 66.51/44.1% 67.51/45.6% 79.93/49.6% 81.93/47.3% 79.02/48.7% 69.42- /45.4% IB-meca CTR#60 148.22/-- 160.22/-- 172.73/-- 180.73/-- 161.48/-- 169.48/-- AIS#1474 31.25/21.1% 30.25/18.9% 36.61/21.2% 37.61/20.8% 29.93/18.5% 37.93- /22.4% AIS#1550 65.47/44.2% 67.47/42.1% 81.23/47.0% 79.23/43.8% 69.35/42.9% 77.35- /45.6% AIS#1020 74.19/50.1% 76.19/47.6% 87.32/50.6% 85.32/47.2% 76.76/47.5% 84.76- /50.0% CTR#61 127.27/-- 139.27/-- 155.44/-- 163.44/-- 142.36/-- 150.36/-- AIS#1549 5.11/4.0% 17.11/12.3% 26.78/17.2% 34.78/21.3% 16.94/11.9% 24.94/1- 6.6% AIS#1468 98.77/77.6% 110.77/79.5% 121.90/78.4% 129.90/79.5% 111.34/78.2% 119.34/79.4% AIS#1513 78.36/61.6% 90.36/64.9% 104.12/67.0% 112.12/68.6% 92.24/64.8% 100.24/66.7% CTR#69 154.52/-- 166.52/-- 179.10/-- 187.10/-- 167.81/-- 175.81/-- AIS#1488 39.34/25.5% 41.34/24.8% 47.91/26.8% 45.91/24.5% 39.63/23.6% 47.63- /27.1% AIS#1198 63.58/41.1% 75.58/45.4% 85.63/47.8% 93.63/50.0% 75.61/45.1% 83.61- /47.6% AIS#1385 73.49/47.6% 75.49/45.3% 85.15/47.5% 83.15/44.4% 75.32/44.9% 83.32- /47.4% CB65 CTR#60 143.28/-- 155.28/-- 173.77/-- 181.77/-- 159.53/-- 167.53/-- AIS#1474 36.30/25.3% 38.30/24.7% 46.79/26.9% 44.79/24.6% 37.55/23.5% 45.55- /27.2% AIS#1550 55.13/38.5% 57.13/36.8% 66.49/38.3% 64.49/35.5% 56.81/35.6% 64.81- /38.7% AIS#1020 61.81/43.1% 73.81/47.5% 74.95/43.1% 82.95/45.6% 69.38/43.5% 77.38- /46.2% CTR#61 144.08/-- 156.08/-- 168.59/-- 176.59/-- 157.34/-- 165.34/-- AIS#1549 36.48/25.3% 28.48/18.2% 32.23/19.1% 40.23/22.8% 30.36/19.3% 38.36- /23.2% AIS#1468 82.16/57.0% 94.16/60.3% 107.91/64.0% 115.91/65.6% 96.04/61.0% 104.04/62.9% AIS#1513 107.73/74.8% 119.73/76.7% 129.10/76.6% 137.10/77.6% 119.41/75.9% 127.41/77.1% CTR#69 141.68/-- 153.68/-- 163.73/-- 171.73/-- 153.70/-- 161.70/-- AIS#1488 41.30/29.2% 43.30/28.2% 54.43/33.2% 52.43/30.5% 43.87/28.5% 51.87- /32.1% AIS#1198 72.90/51.5% 84.90/55.2% 94.57/57.8% 102.57/59.7% 84.73/55.1% 92.73/57.3% AIS#1385 66.15/46.7% 78.15/50.9% 84.86/51.8% 92.86/54.1% 76.50/49.8% 84.50- /52.3% BP554 CTR#60 140.49/-- 152.49/-- 162/-- 170/-- 152.25/-- 160.25/-- AIS#1474 39.94/28.4% 41.94/27.5% 51.45/31.8% 50.45/29.7% 43.7/28.7% 46.7/29.1% AIS#1550 74.64/53.1% 86.64/56.8% 91.46/56.5% 99.46/58.5% 84.05/55.2% 92.05- /57.4% AIS#1020 62.57/44.5% 64.57/42.3% 78.63/48.5% 76.63/45.1% 66.6/43.7% 74.6/46.6% CTR#61 132.45/-- 144.45/-- 154.6/-- 162.6/-- 144.53/-- 152.53/-- AIS#1549 16.43/12.4% 28.43/19.7% 38.57/24.9% 46.57/28.6% 28.5/19.7% 36.5/2- 3.9% AIS#1468 84.51/63.8% 96.51/66.8% 104.4/67.5% 112.4/69.1% 95.45/66.0% 103.4- 5/67.8% AIS#1513 91.15/68.8% 103.15/71.4% 113.38/73.3% 121.38/74.6% 103.27/71.5% 111.27/72.9% CTR#69 145.69/-- 157.69/-- 165.87/-- 173.87/-- 156.78/-- 164.78/-- AIS#1488 44.06/30.2% 46.06/29.2% 54.24/32.7% 52.24/30.0% 45.15/28.8% 53.15- /32.3% AIS#1198 59.83/41.1% 64.83/41.1% 74.63/45.0% 70.63/40.6% 63.73/40.6% 71.73- /43.5% AIS#1385 73.41/50.4% 68.41/43.4% 86.15/51.9% 85.15/49.0% 72.78/46.4% 73.78- /44.8% UK14304 CTR#60 100.78/-- 106.78/-- 125.27/-- 127.27/-- 111.02/-- 119.02/-- AIS#1474 20.6/20.4% 20.6/19.3% 23.35/18.6% 24.35/19.1% 19.48/17.5% 19.48/16.4% AIS#1550 53.62/53.2% 45.62/42.7% 56.75/45.3% 44.75/35.2% 46.19/41.6% 54.19- /45.5% AIS#1020 42.74/42.4% 39.74/37.2% 43.5/34.7% 51.5/40.5% 41.62/37.5% 49.62/41.7% CTR#61 90.39/-- 94.39/-- 102.1/-- 110.1/-- 92.75/-- 101.75/-- AIS#1549 27.08/30.0% 29.08/30.8% 34.45/33.7% 36.45/33.1% 32.76/35.3% 36.76- /36.1% AIS#1468 65.72/72.7% 67.72/71.7% 77.77/76.2% 75.77/68.8% 67.75/68.8% 75.75- /73.0% AIS#1513 58.45/64.7% 60.45/64.0% 71.58/70.1% 69.58/63.2% 61.02/65.8% 69.02- /67.8% CTR#69 103.67/-- 105.67/-- 98.38/-- 100.38/-- 94.02/-- 92.02/-- AIS#1488 26.24/25.3% 25.55/24.2% 25.92/26.3% 18.92/18.8% 26.55/28.2% 26.24- /28.5% AIS#1198 44.16/42.6% 46.16/43.7% 56.22/57.1% 54.22/54.0% 46.19/49.1% 54.19- /58.9% AIS#1385 -- -- -- -- -- --
TABLE-US-00007 TABLE VII Differences observed between minimal and maximal values for each group and minimal and maximal values from control subjects for various ligands in osteoblasts. Values were calculated from the data shown in FIGS. 11A-11F. % of control Absolute dZiec signal (min/max) Melatonin Group 1 min diff. 18/60 30% max diff. 11/83 13% Group 2 min diff. 37/60 62% max diff. 28/83 34% Group 3 min diff. 50/60 83% max diff. 45/83 54% Iodomelatonine Group 1 min diff. 35/120 29% max diff. 15/159 9% Group 2 min diff. 84/120 70% max diff. 57/159 36% Group 3 min diff. 101/120 84% max diff. 90/159 57% BP554 Group 1 min diff. 49/128 38% max diff. 32/166 19% Group 2 min diff. 88/128 69% max diff. 67/166 40% Group 3 min diff. 107/128 84% max diff. 99/166 60% UK14304 Group 1 min diff. 32/98 33% max diff. 21/115 18% Group 2 min diff. 50/98 51% max diff. 45/115 39% Group 3 min diff. 71/98 72% max diff. 60/115 52% IB-meca Group 1 min diff. 43/132 33% max diff. 20/172 12% Group 2 min diff. 80/132 61% max diff. 73/172 42% Group 3 min diff. 115/132 87% max diff. 98/172 55% CB65 Group 1 min diff. 47/138 34% max diff. 34/169 20% Group 2 min diff. 88/138 64% max diff. 60/169 36% Group 3 min diff. 123/138 89% max diff. 100/169 55%
Example 8
Stratification/Classification of IS Subjects Based on Gi-Coupled Receptor Responses Measured in PBMCs
A cohort of individuals with (n=45) (see Table II) or without AIS (n=42) (See Table I) was tested to determine the sensitivity and specificity of the cell-based assay with CDS by investigating the functional status of melatonin signaling in PBMCs (including principally lymphocytes) from each of these individuals.
PBMCs were isolated from control subjects, IS subjects as described in Example 2 above. The signaling effect of 300 .mu.M of iodomelatonin as measured by Cellular Dielectric Spectroscopy (CDS) was determined.
FIG. 12A shows that all patients with IS were less responsive to iodomelatonin when compared to healthy volunteers tested (control). Similar results were obtained with melatonin (data not shown), thereby indicating a high selectivity for this assay. The minimal magnitude measured in PBMCs from healthy volunteers in response to iodomelatonin was 124 ohms under experimental conditions. None of the AIS patients tested exhibited a CDS response reaching such magnitude. The maximal magnitude measured in IS patients was 110 ohms, while the minimum was 16 ohms. Melatonin signaling responses to iodomelatonin in normal/healthy subjects was thus greater than 120 ohms. A CDS response range between 10 and 40 ohms for IS patients was classified in group 1, 40 and 80 ohms in group 2, and finally between 80 and 120 ohms for IS patients in group 3. Of all AIS patients tested, 11% (5/44), 30% (13/44) and 59% (26/44) were diagnosed as belonging to the functional groups 1, 2 and 3, respectively. According to their CDS response, there was no ambiguity in classifying these patients. The mean of CDS response for group 1 was 27.86.+-.4.18 and 65.71.+-.3.42 for group 2, while it was 97.94.+-.1.36 for group 3 and 155.17.+-.3.91 for the control group. These differences were highly significant (P<0.001). These results demonstrate that the functional test based on the evaluation of melatonin signaling in PBMCs with the CDS assay effectively distinguishes patients with IS not only from healthy individuals but also from different functional groups. These results demonstrate the sensitivity, specificity and dynamic range of this functional test as a diagnostic tool. See also Table VII showing Differences observed between minimal and maximal values for each group and minimal and maximal values for control subjects for iodomelatonine in PBMCs.
TABLE-US-00008 TABLE VIII Differences observed between minimal and maximal values for each group and minimal and maximal values for control subjects for iodomelatonine in PBMCs. Values were calculated from the data shown in FIG. 12A. % of control Iodomelatonine Absolute dZiec signal (min/max) Group 1 min diff. 36/124 29% max diff. 16/225 7% Group 2 min diff. 75/124 60% max diff. 49/225 22% Group 3 min diff. 110/124 89% max diff. 86/1125 38%
Example 9
Predicting the Risk of Developing IS in PBMCs
Healthy controls (n=42) (Table I) or subjects considered at risk of developing this disease (n=30) (Table III) were tested to determine the ability of this assay to predict the risk of developing IS.
PBMCs were isolated asymptomatic at-risk subjects as described in Example 2 above. The signaling effect of 300 .mu.M of iodomelatonin as measured by Cellular Dielectric Spectroscopy (CDS) was determined in these cells and compared with that measured in the healthy controls described in Example 6 above.
The functional screening of PBMCs from asymptomatic children born from at least one scoliotic parent revealed that the melatonin signaling defect can be detected in this cohort (FIG. 12B). Of all asymptomatic children tested, 60% (19/31) exhibited a CDS response in the range of normal magnitudes (>120 ohms), whereas the CDS response was reduced in 40% (12/31). The latter group was considered more susceptible to developing scoliosis. Among these 12 children at high risk, 4 (33%) have developed a spinal deformity 24 months later, exhibiting a mean Cobb angle of 11.7.degree. as confirmed by radiography (data not shown). None of the 19 in the normal range has developed a scoliosis.
It is known that the prevalence of IS is increased in asymptomatic children born from at least one affected parent. Results presented above corroborate this fact and confirm that this category of children is more susceptible of developing IS. The risk of developing scoliosis was predicted in 40% of asymptomatic children tested (i.e. 12/31), and 33% of them developed a spinal deformity several months later. For instance the then asymptomatic patient #3116 in Table III (who was then 9 years old), at age 11 presented a curve pattern right thoracic and left lumbar with a Cobb angle of 9-14.degree..
The lack of spinal deformity manifestation in the remaining 67% of the suspected children is likely related to their age. Indeed, the deformity of the spine is recognized to occur in children between 10 and 16 years of age. However, the mean age of asymptomatic children enrolled in the present study was 10.2.+-.3.2 years, and they have been followed up for 24 months. Therefore, not all tested children would have reached the appropriate age for developing the spinal deformity during this period.
Among all tested children (including those of age 10 or older (scoliosis appears around in the age 10)), neither asymptomatic children exhibiting normal melatonin signaling nor control children without familial history of scoliosis have developed any spinal deformity during the study period.
Example 10
Measurement of Gi-Coupled Receptor Responses in Asymptomatic at Risk Subjects
FIGS. 13A and 13B show that the defect in G.sub.i-coupled receptors response may be detected over a period of 18 months in PBMCs (including principally lymphocytes) of asymptomatic at risk subjects (n=31) (subjects having a parent affected by AIS). Also, the amplitude of the defect is maintained over this period (i.e. subjects showed a very similar response curve at the first time point (t.sub.0) and 18 months later (t.sub.18)), suggesting that the defect does not evolve over time.
Example 11
Measurement of Gi-Coupled Receptor Responses in Osteoblasts
Osteoblasts were seeded into the CELLKEY.TM. label-free cellular analysis system standard 96-well microplate at a density of 5.times.10.sup.4/150 uL per well and incubated in standard conditions (37.degree. C./5% CO.sub.2). Following overnight incubation, the plate was placed onto the CELLKEY.TM. label-free cellular analysis system and growth medium was replaced by assay buffer (Hanks, Balanced Salt Solution containing 20 mM HEPES and 0.1% BSA) before starting the experiment. Cells were then allowed to equilibrate at room temperature for 30 min. At the end of this period, the plate was placed onto the system and pre-addition measurements were made for 5 min to obtain a baseline reading. Then, forskolin, isoproterenol, melatonin or bradykinin was added simultaneously to all 96 wells with an integrated fluidics system. The compound addition resulted in change in impedance that started occurring immediately after fluid addition and mixing. Impedance measurements were collected for 15 min at 28.degree. C. FIGS. 14A-14B show that GPCR signaling in AIS is specific to G.sub.i coupled receptor. The difference in response observed for G.sub.s-coupled GPCR in the presence of isoproterenol as well in the production of cAMP in the presence of forskolin between each groups is explained by the absence of functional G.sub.i. There is approximately 10 times more G.sub.i than Gs in the cells. Therefore, if some G.sub.i is non-functional, it cannot inhibit the production of cAMP in the presence of forskolin and thus, the G.sub.s-coupled response also appears affected.
Although the present invention has been described hereinabove by way of specific embodiments thereof, it can be modified, without departing from the spirit and nature of the subject invention as defined in the appended claims.
* * * * *
References
D00001
D00002
D00003
D00004
D00005
D00006
D00007
D00008
D00009
D00010
D00011
D00012
D00013

D00014

D00015

D00016

D00017

D00018

D00019

D00020

D00021

D00022

D00023

D00024

D00025

D00026

D00027

D00028

D00029

D00030

D00031
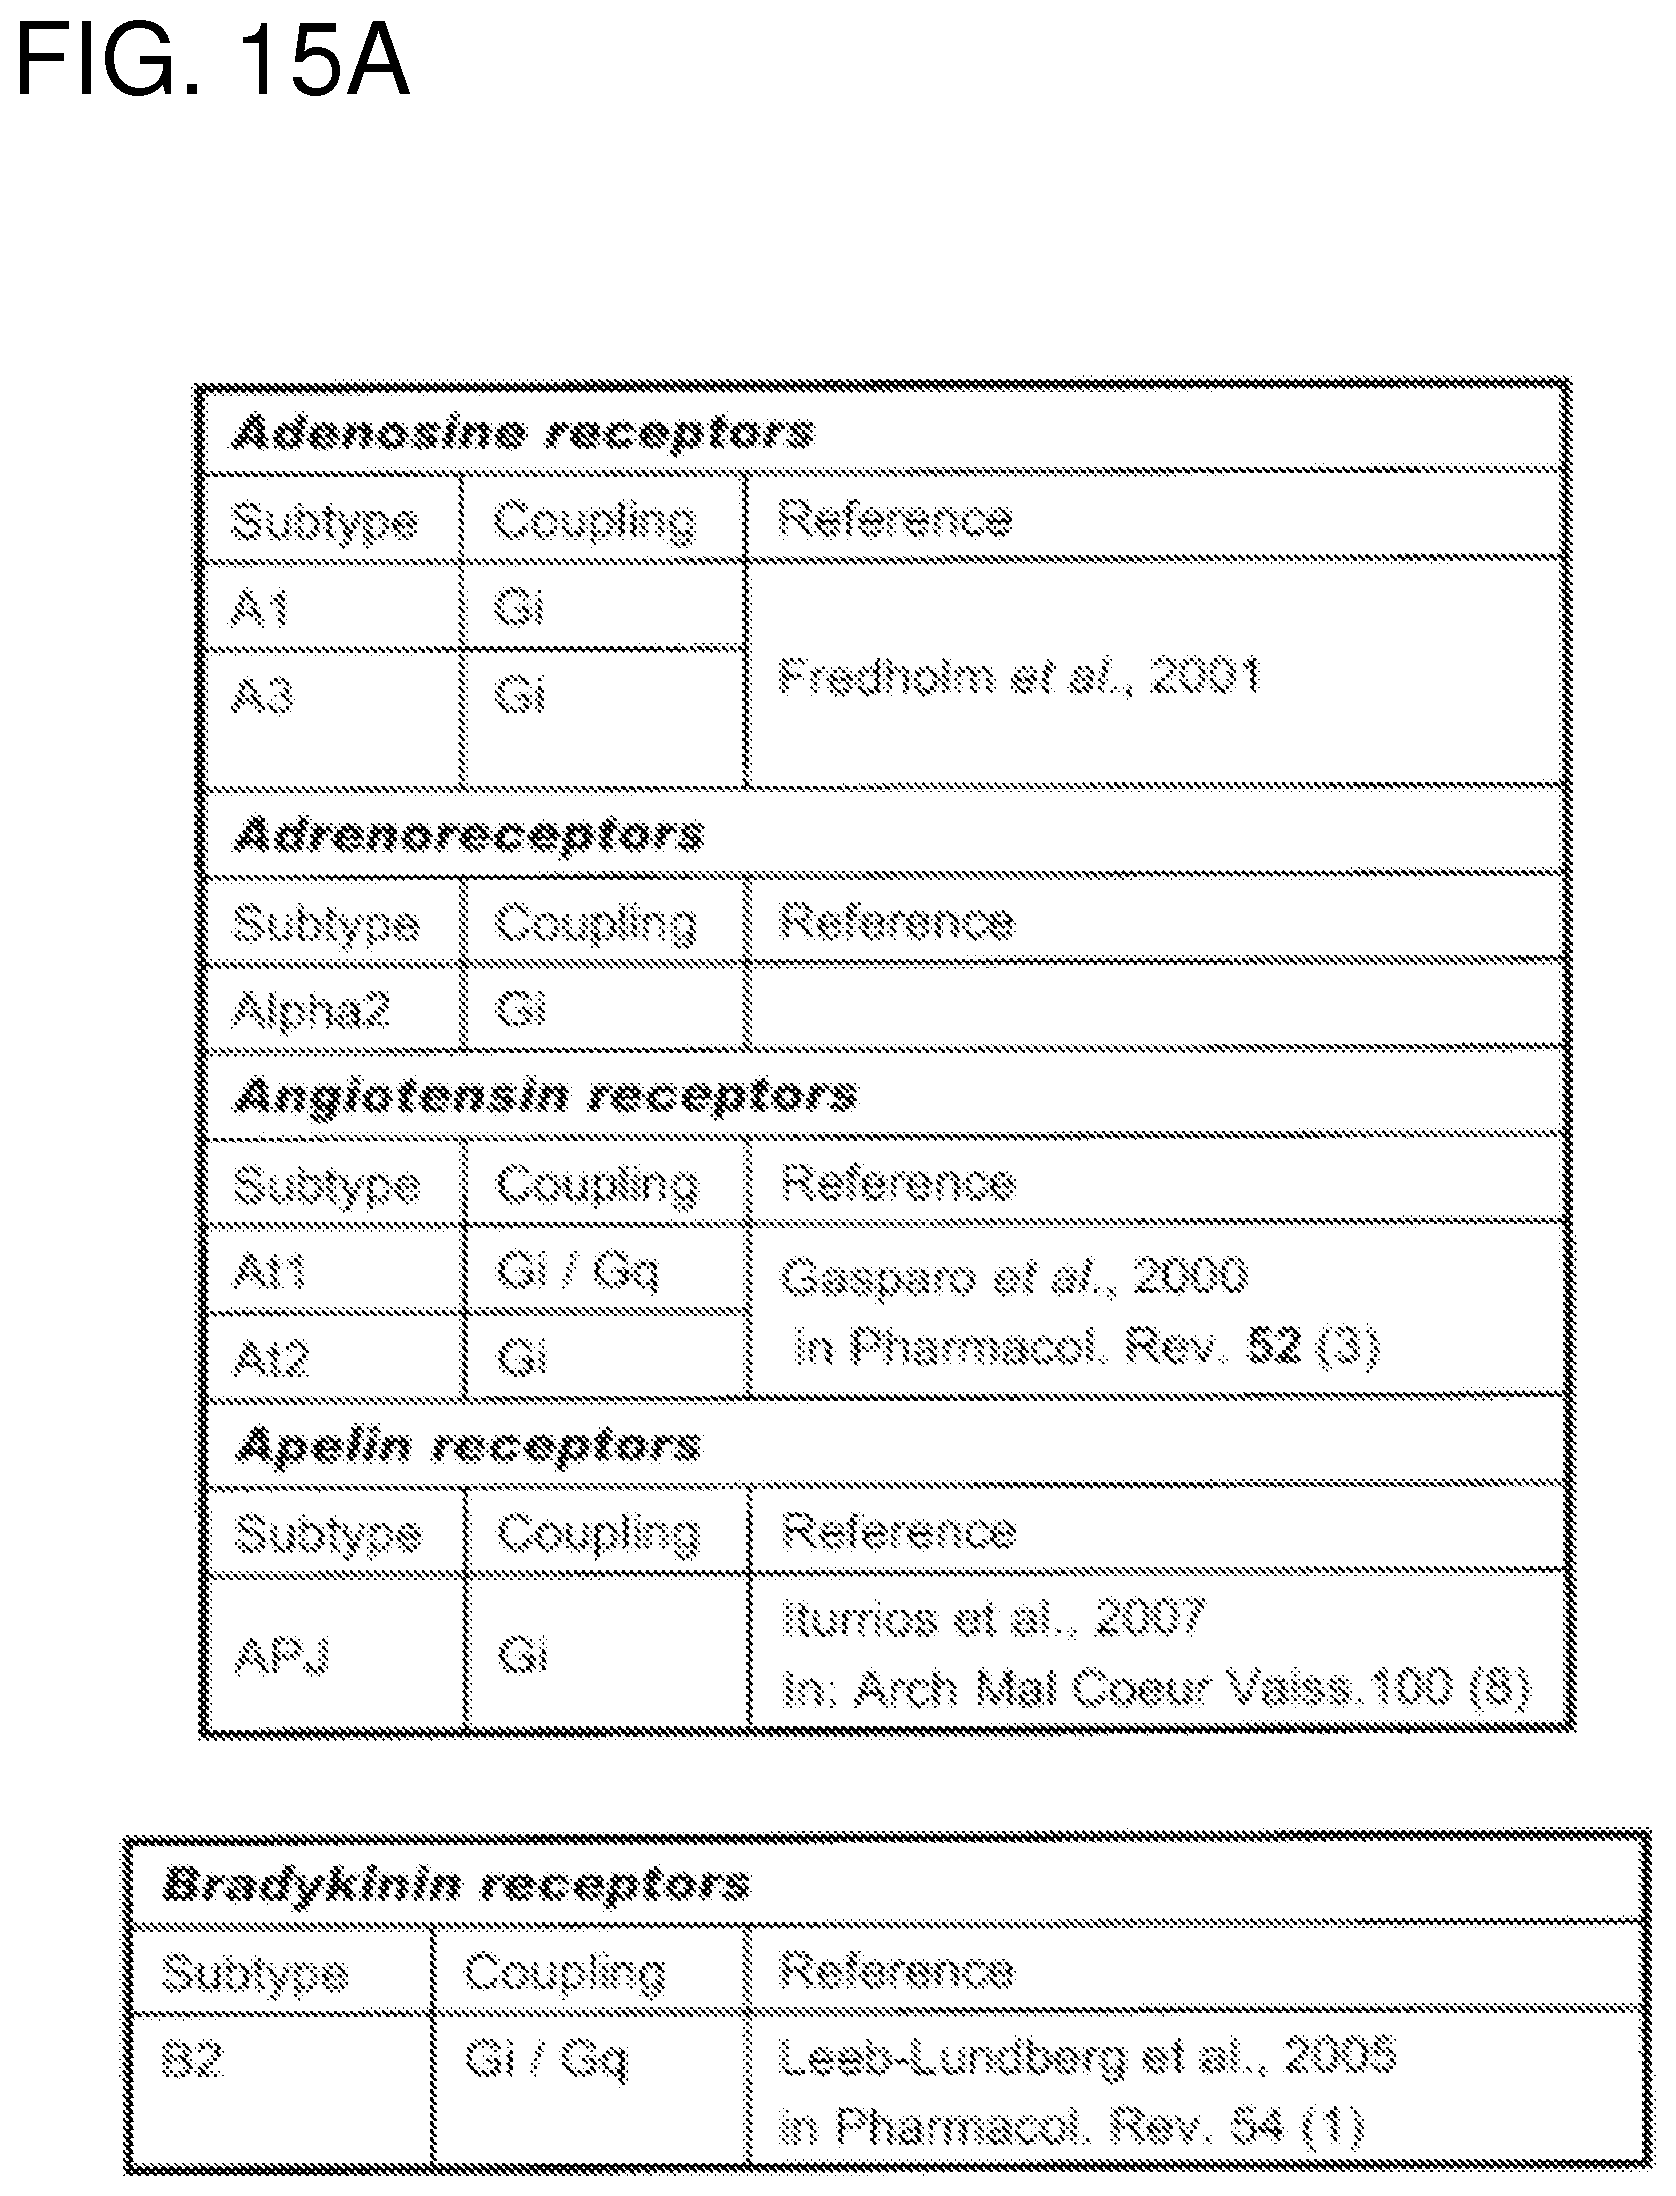
D00032

D00033

D00034

D00035
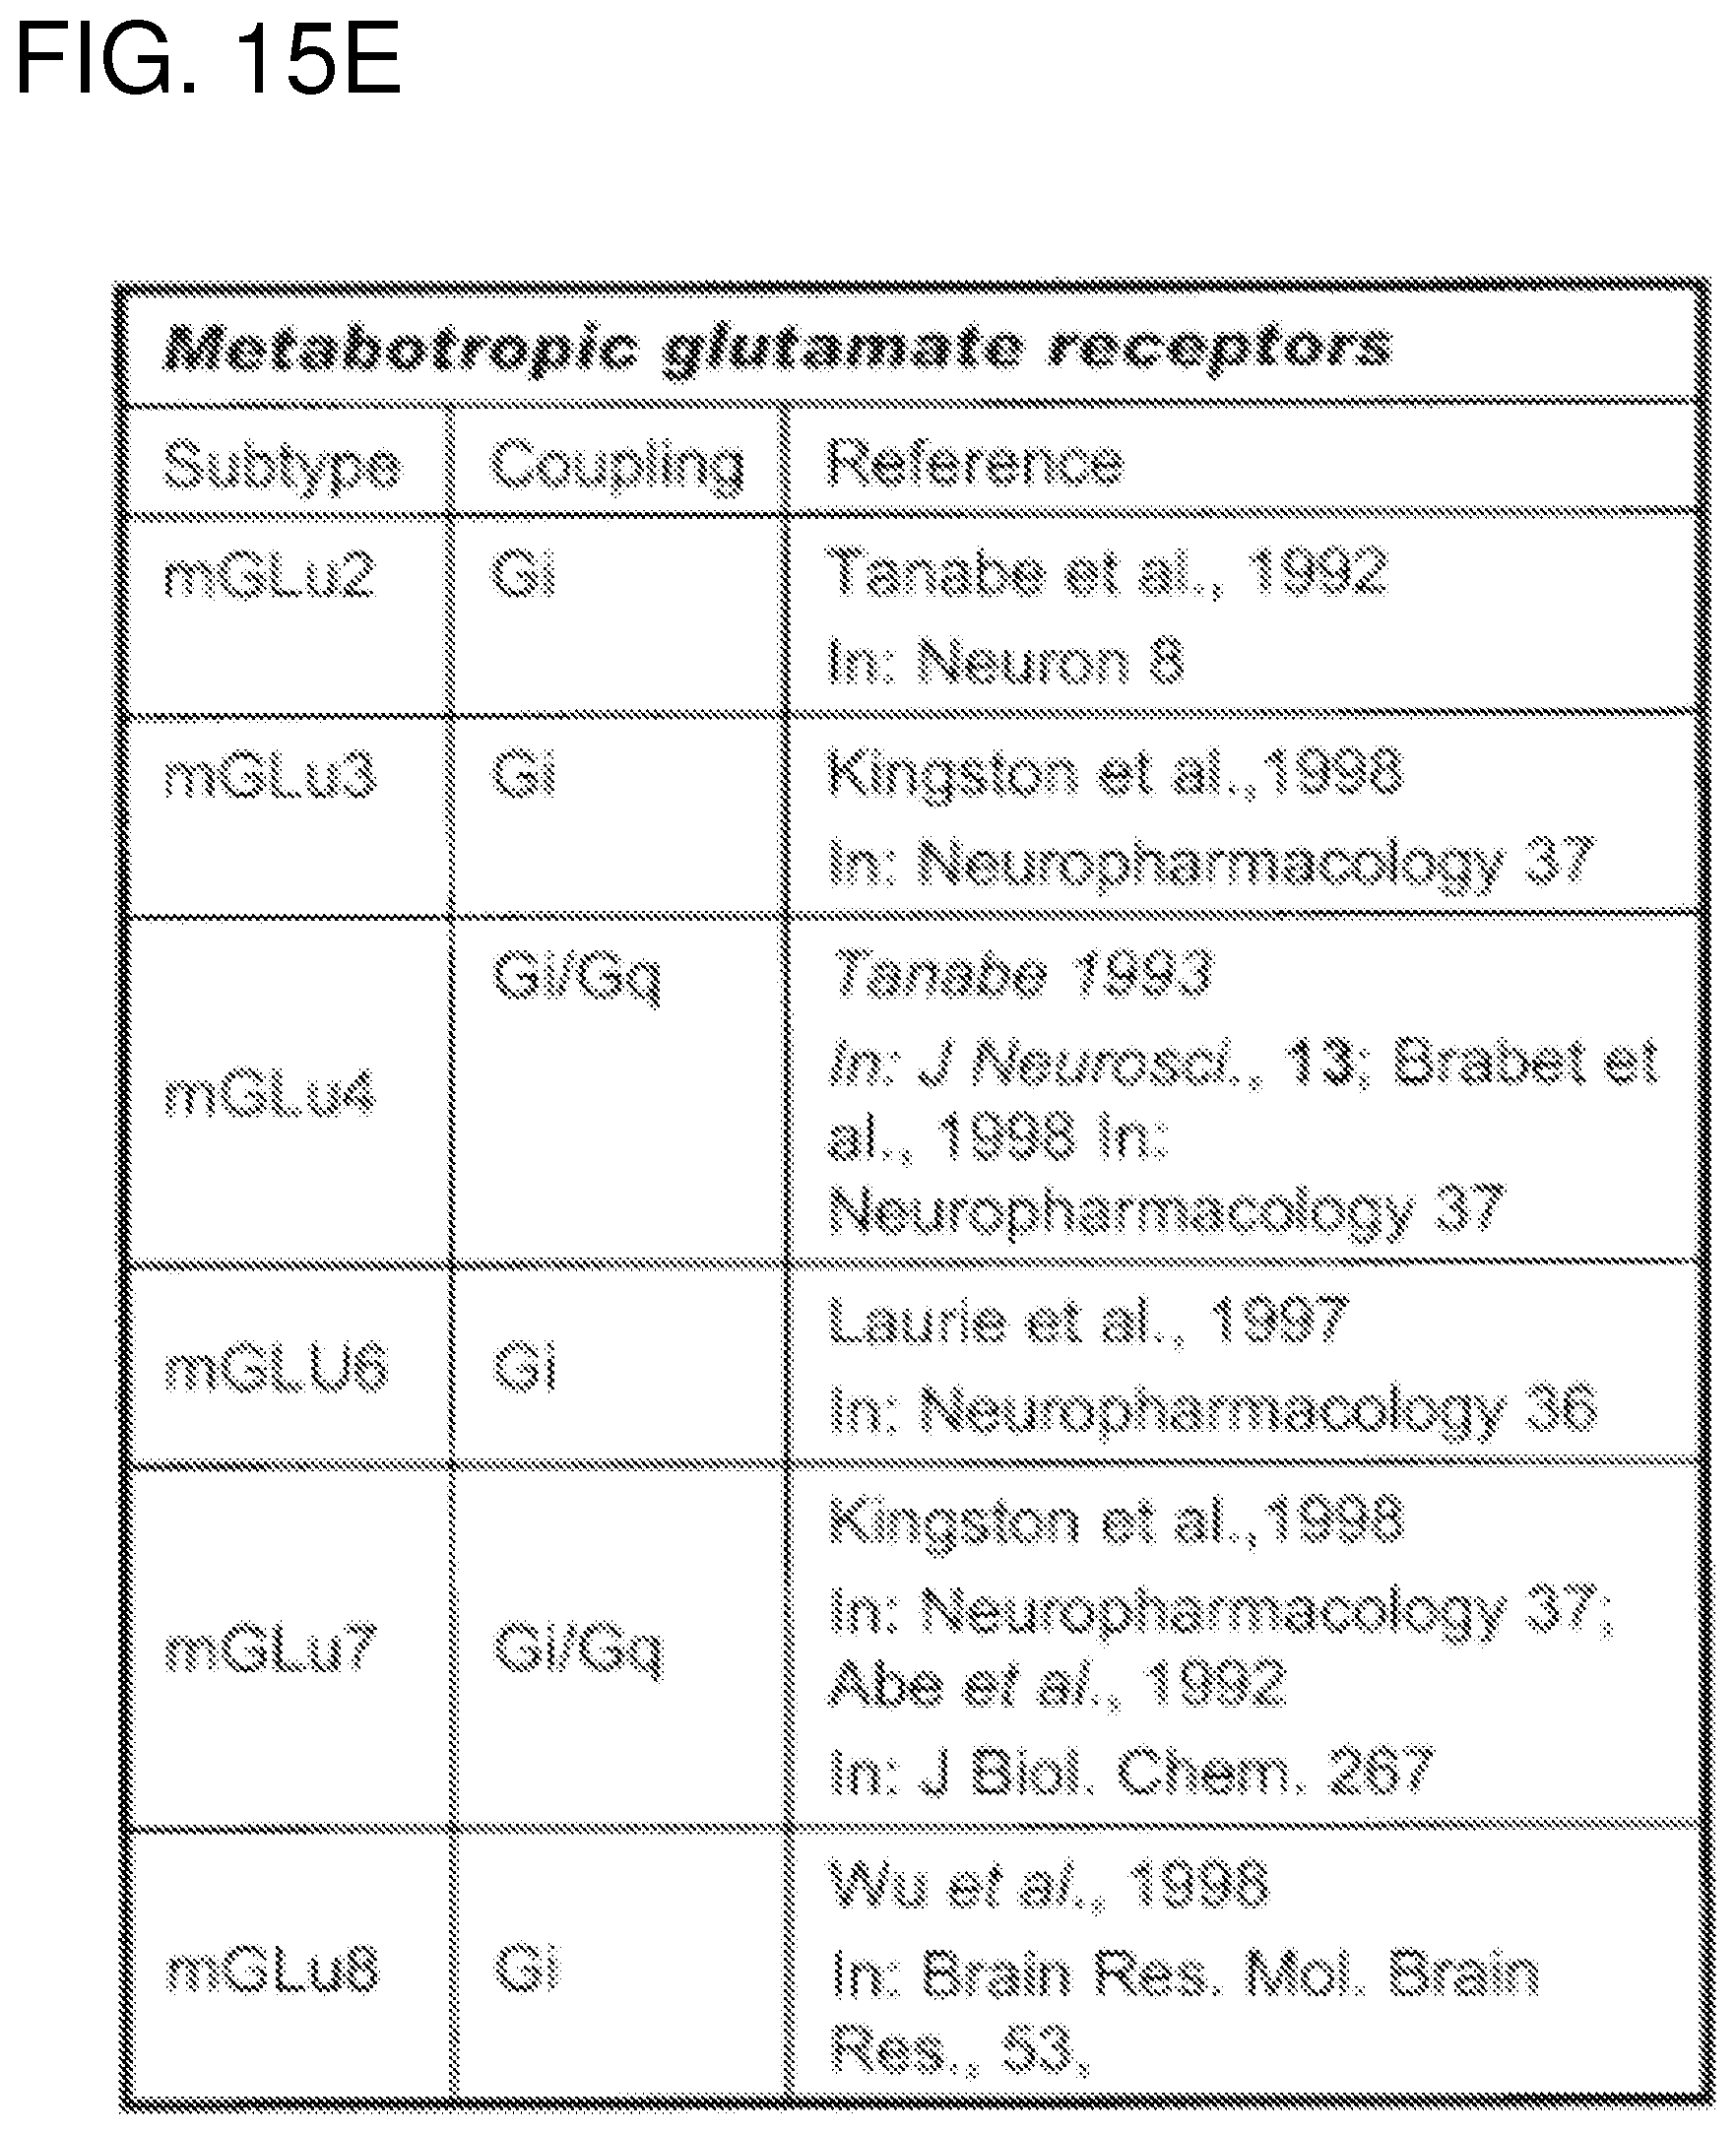
D00036

D00037

D00038

D00039

D00040

D00041

D00042
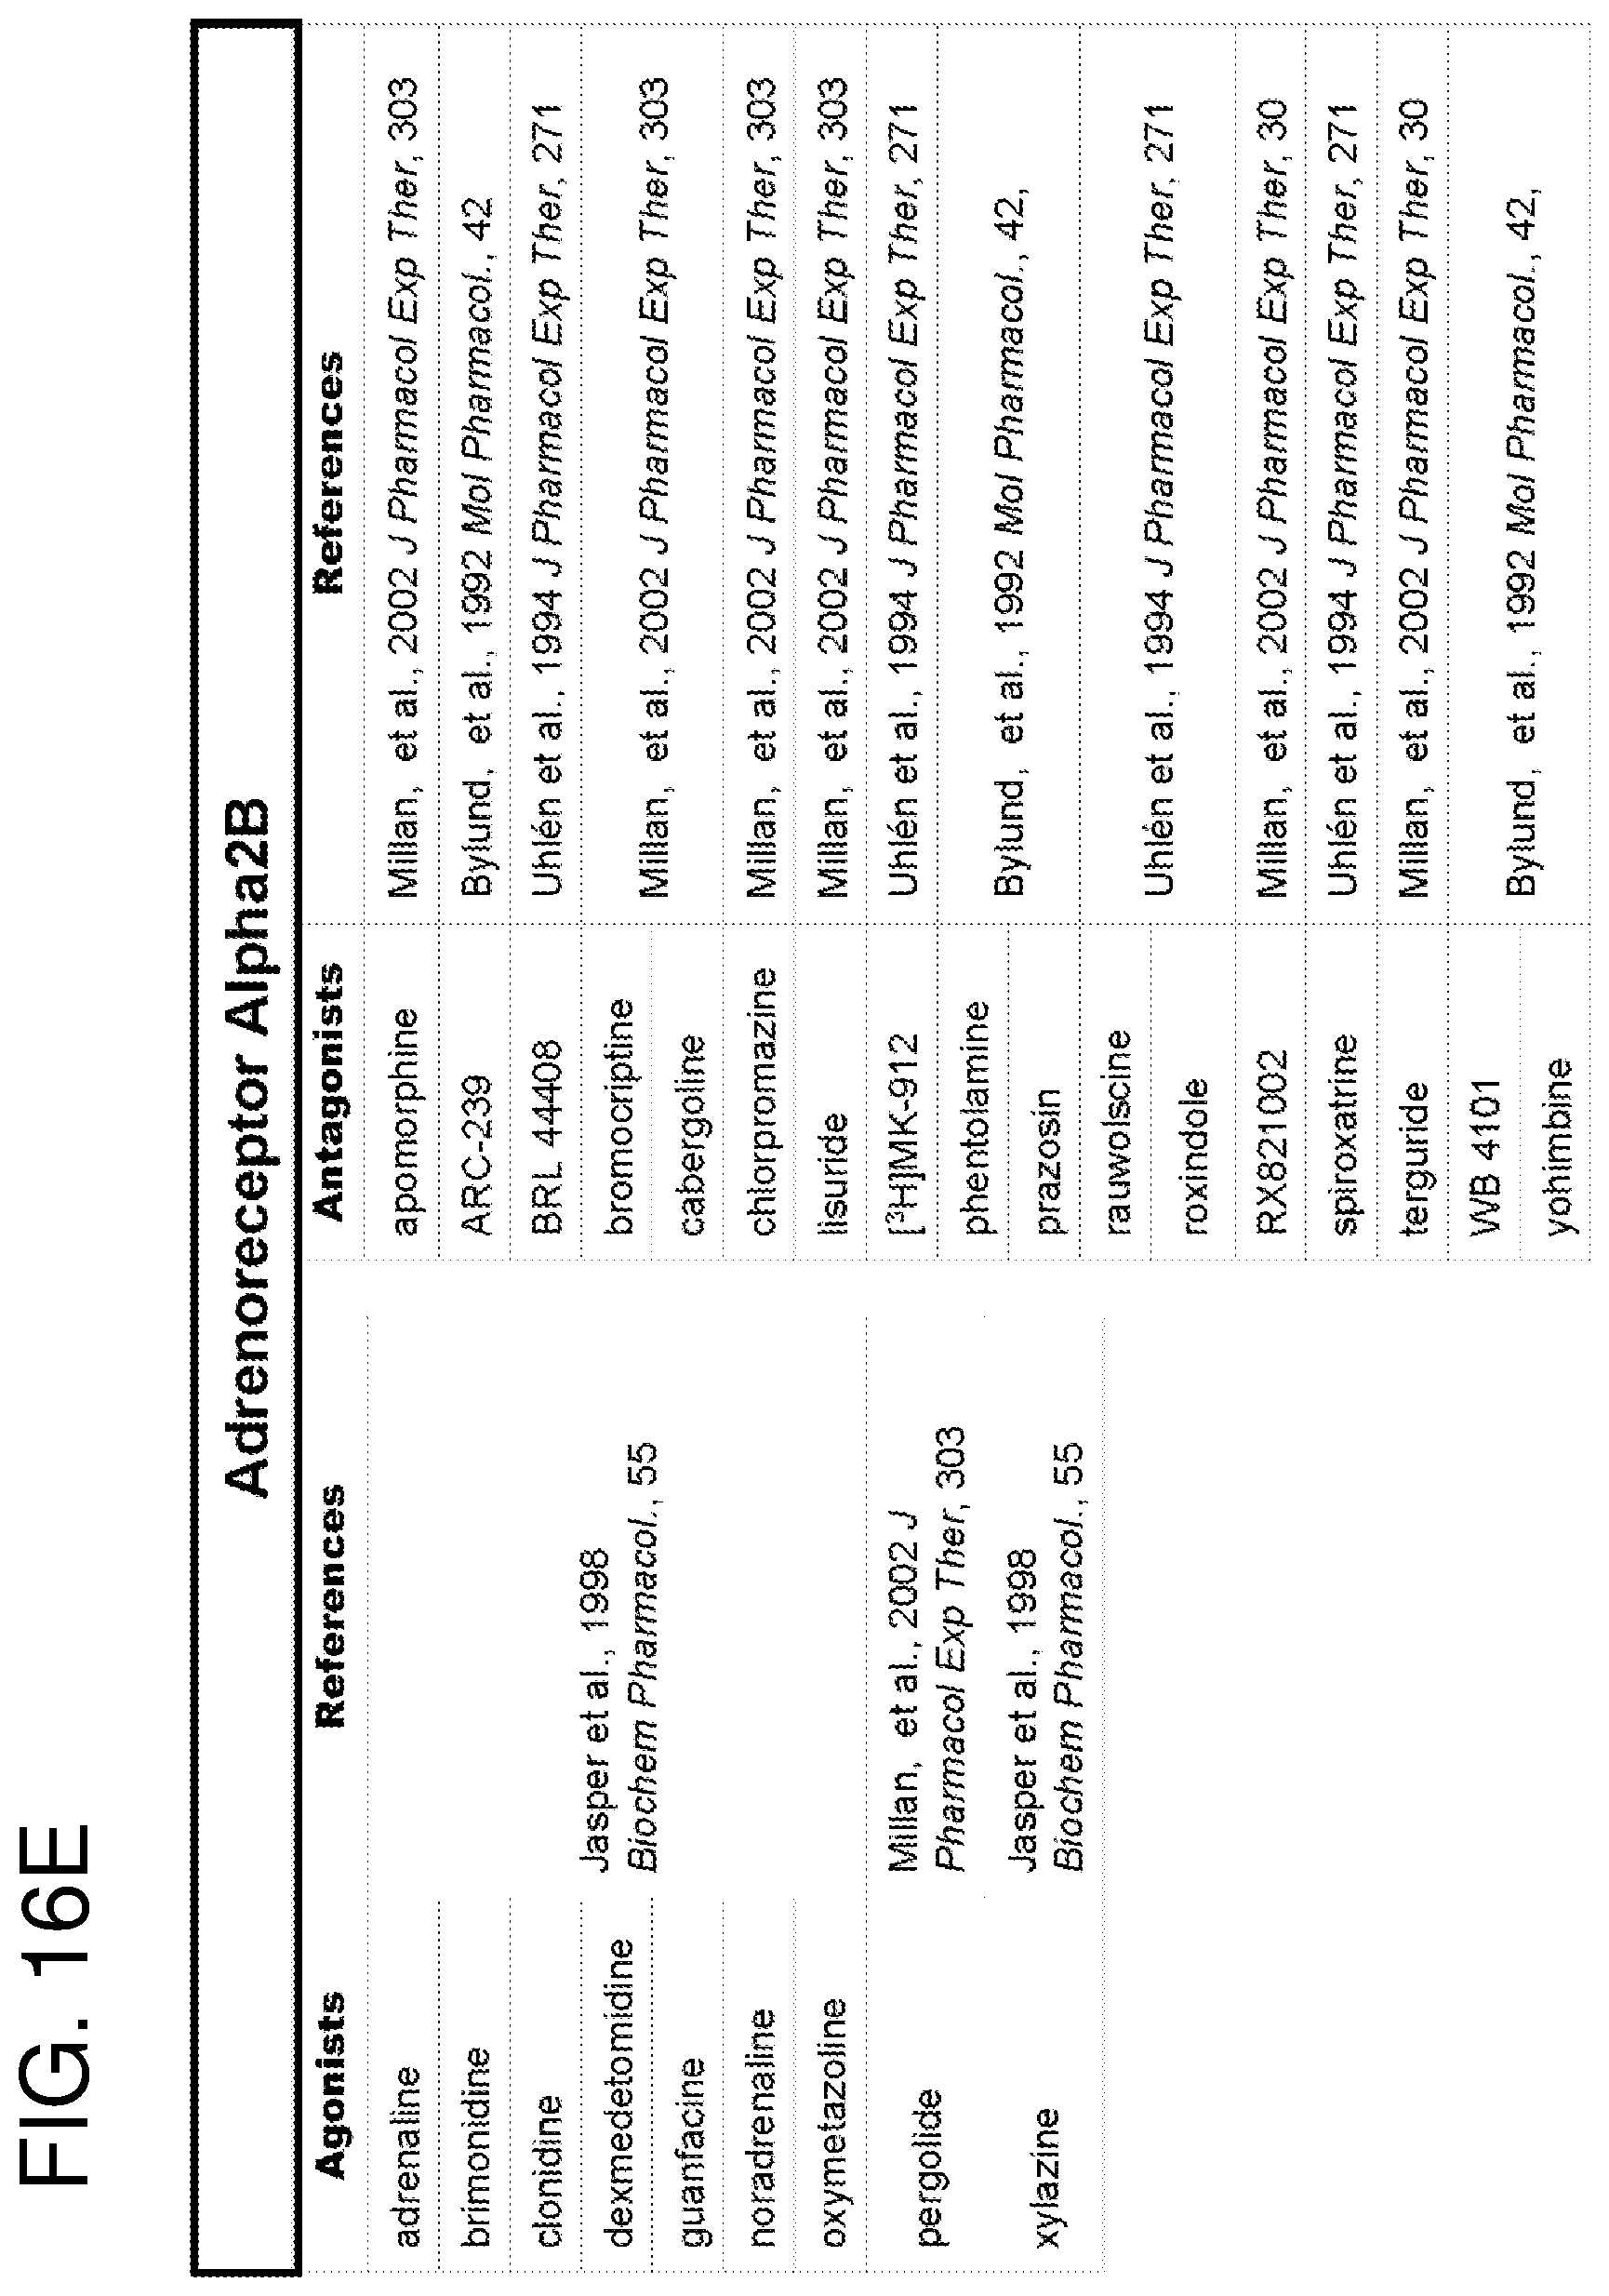
D00043

D00044
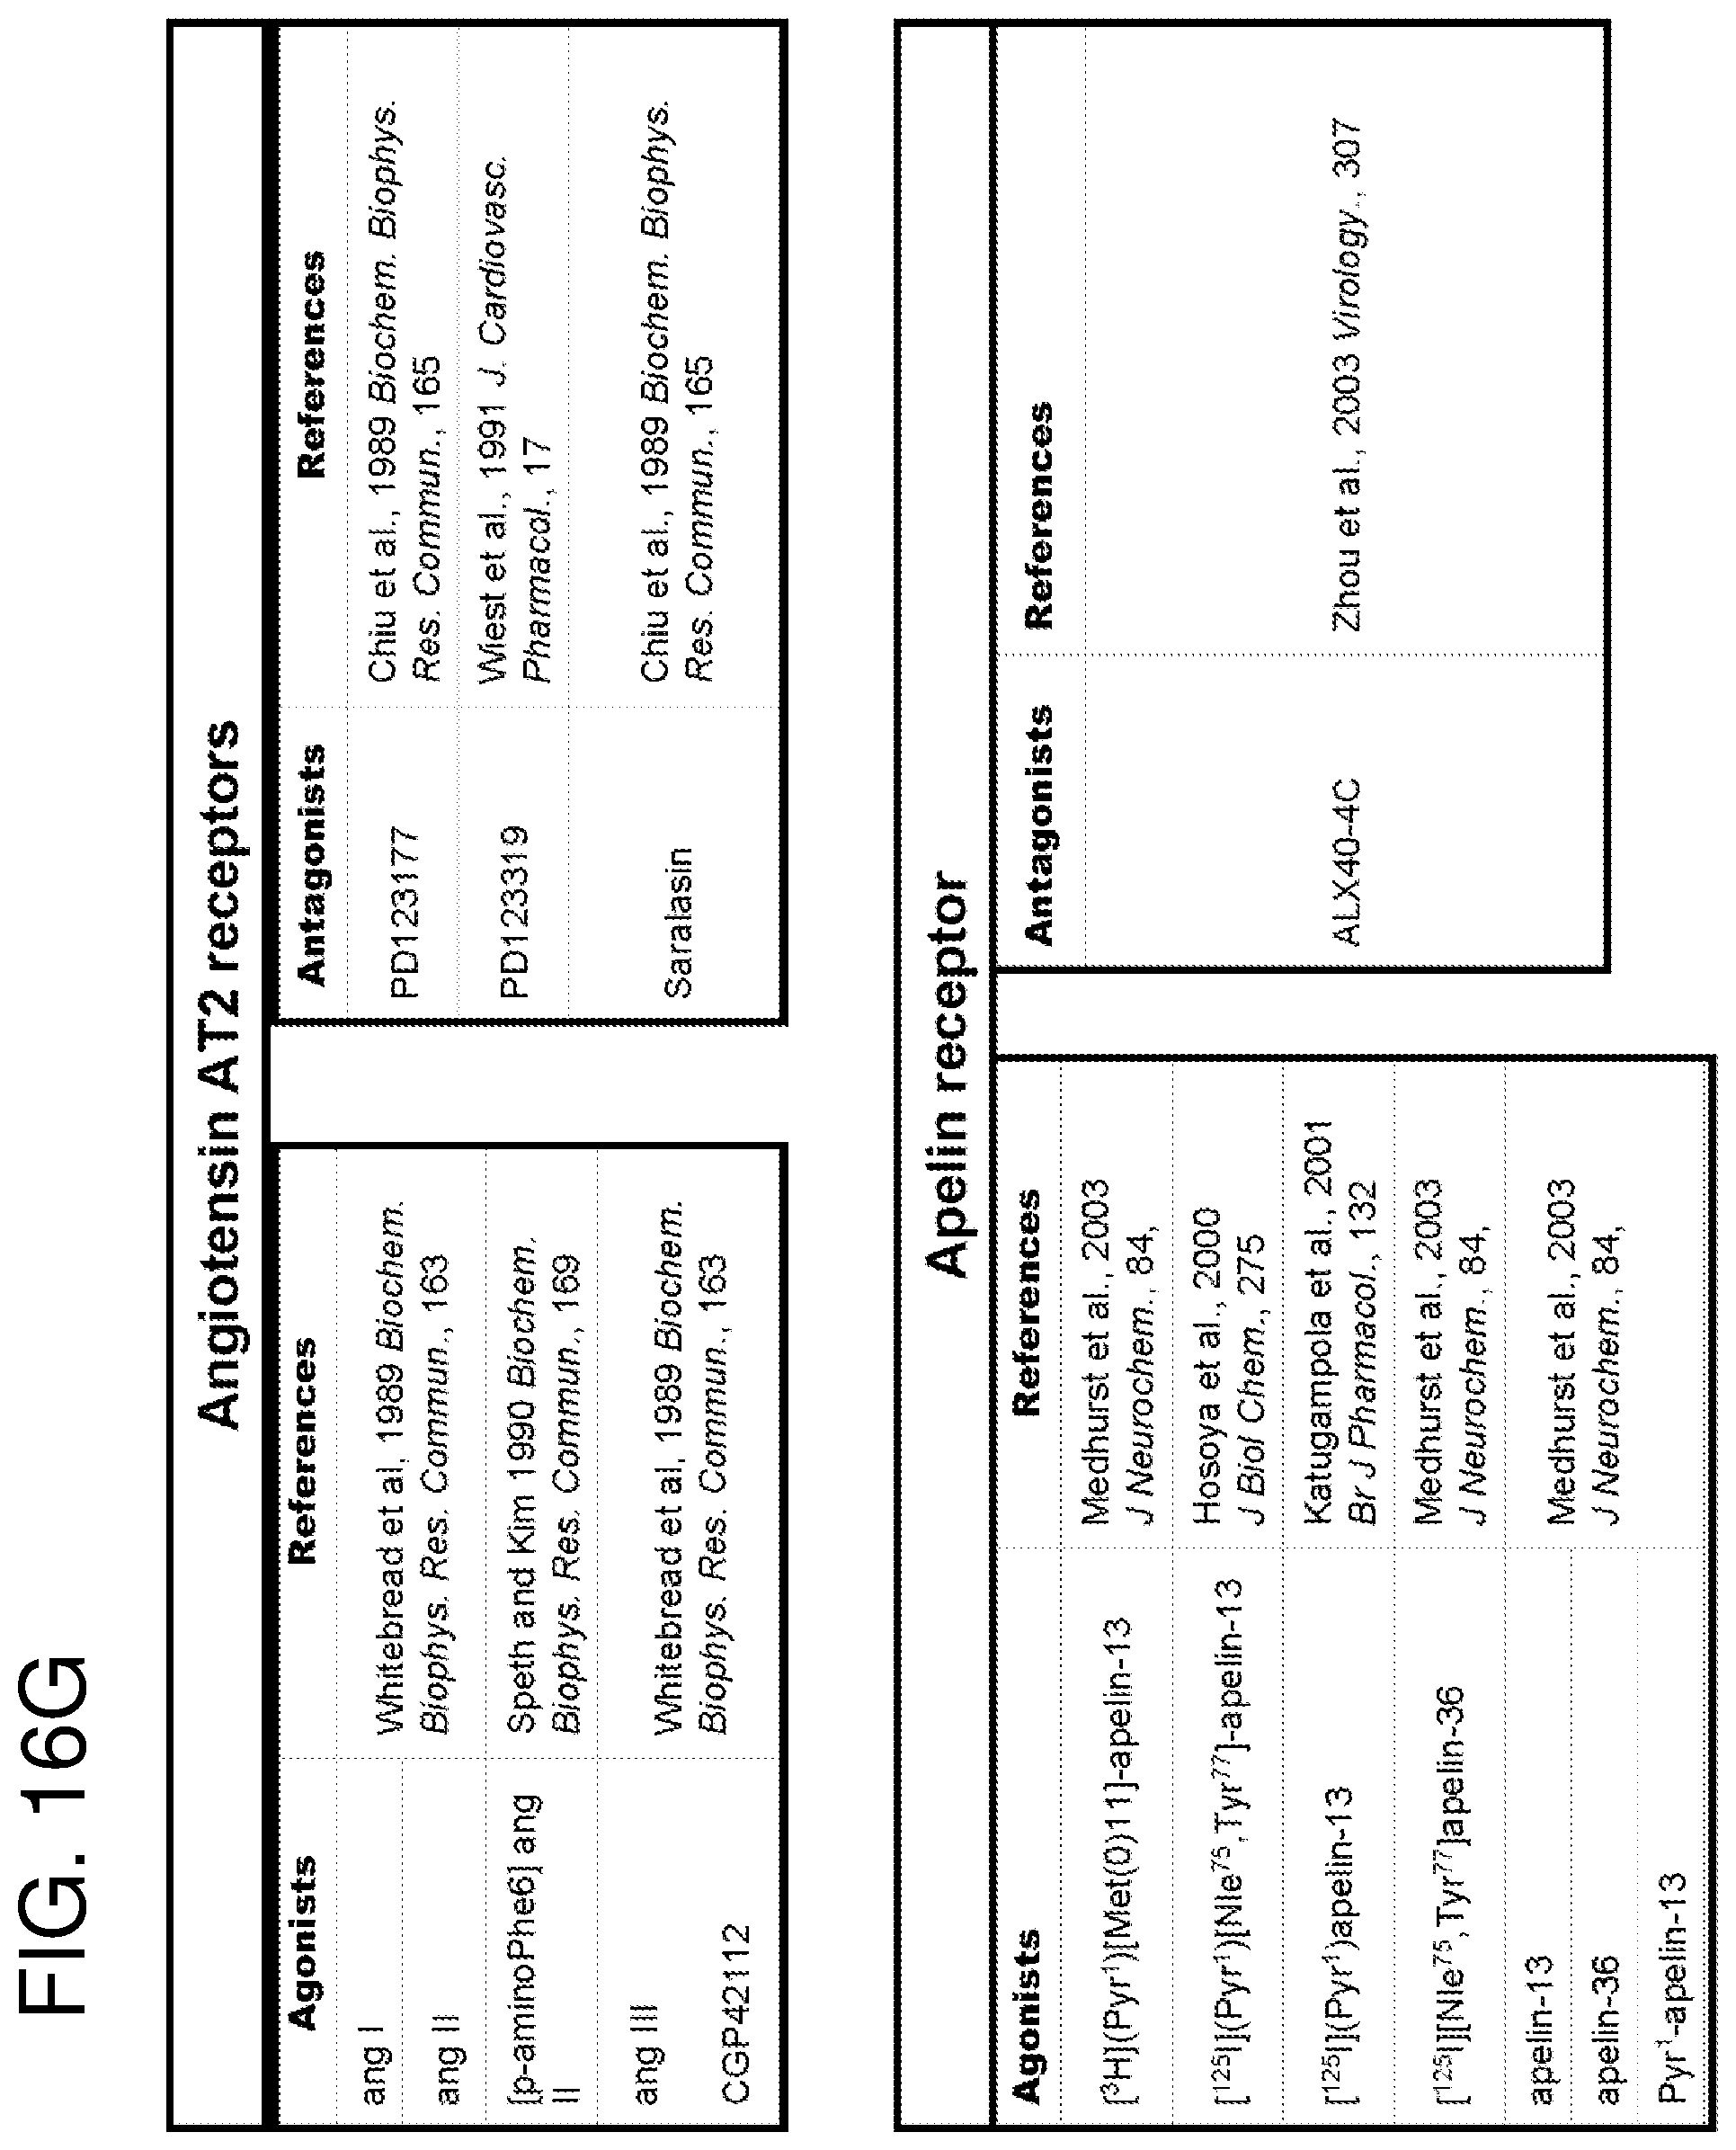
D00045

D00046

D00047

D00048

D00049

D00050

D00051

D00052

D00053

D00054

D00055

D00056

D00057

D00058

D00059

D00060

D00061

D00062

D00063

D00064

D00065

D00066

D00067

D00068

D00069

D00070

D00071

D00072

D00073

D00074
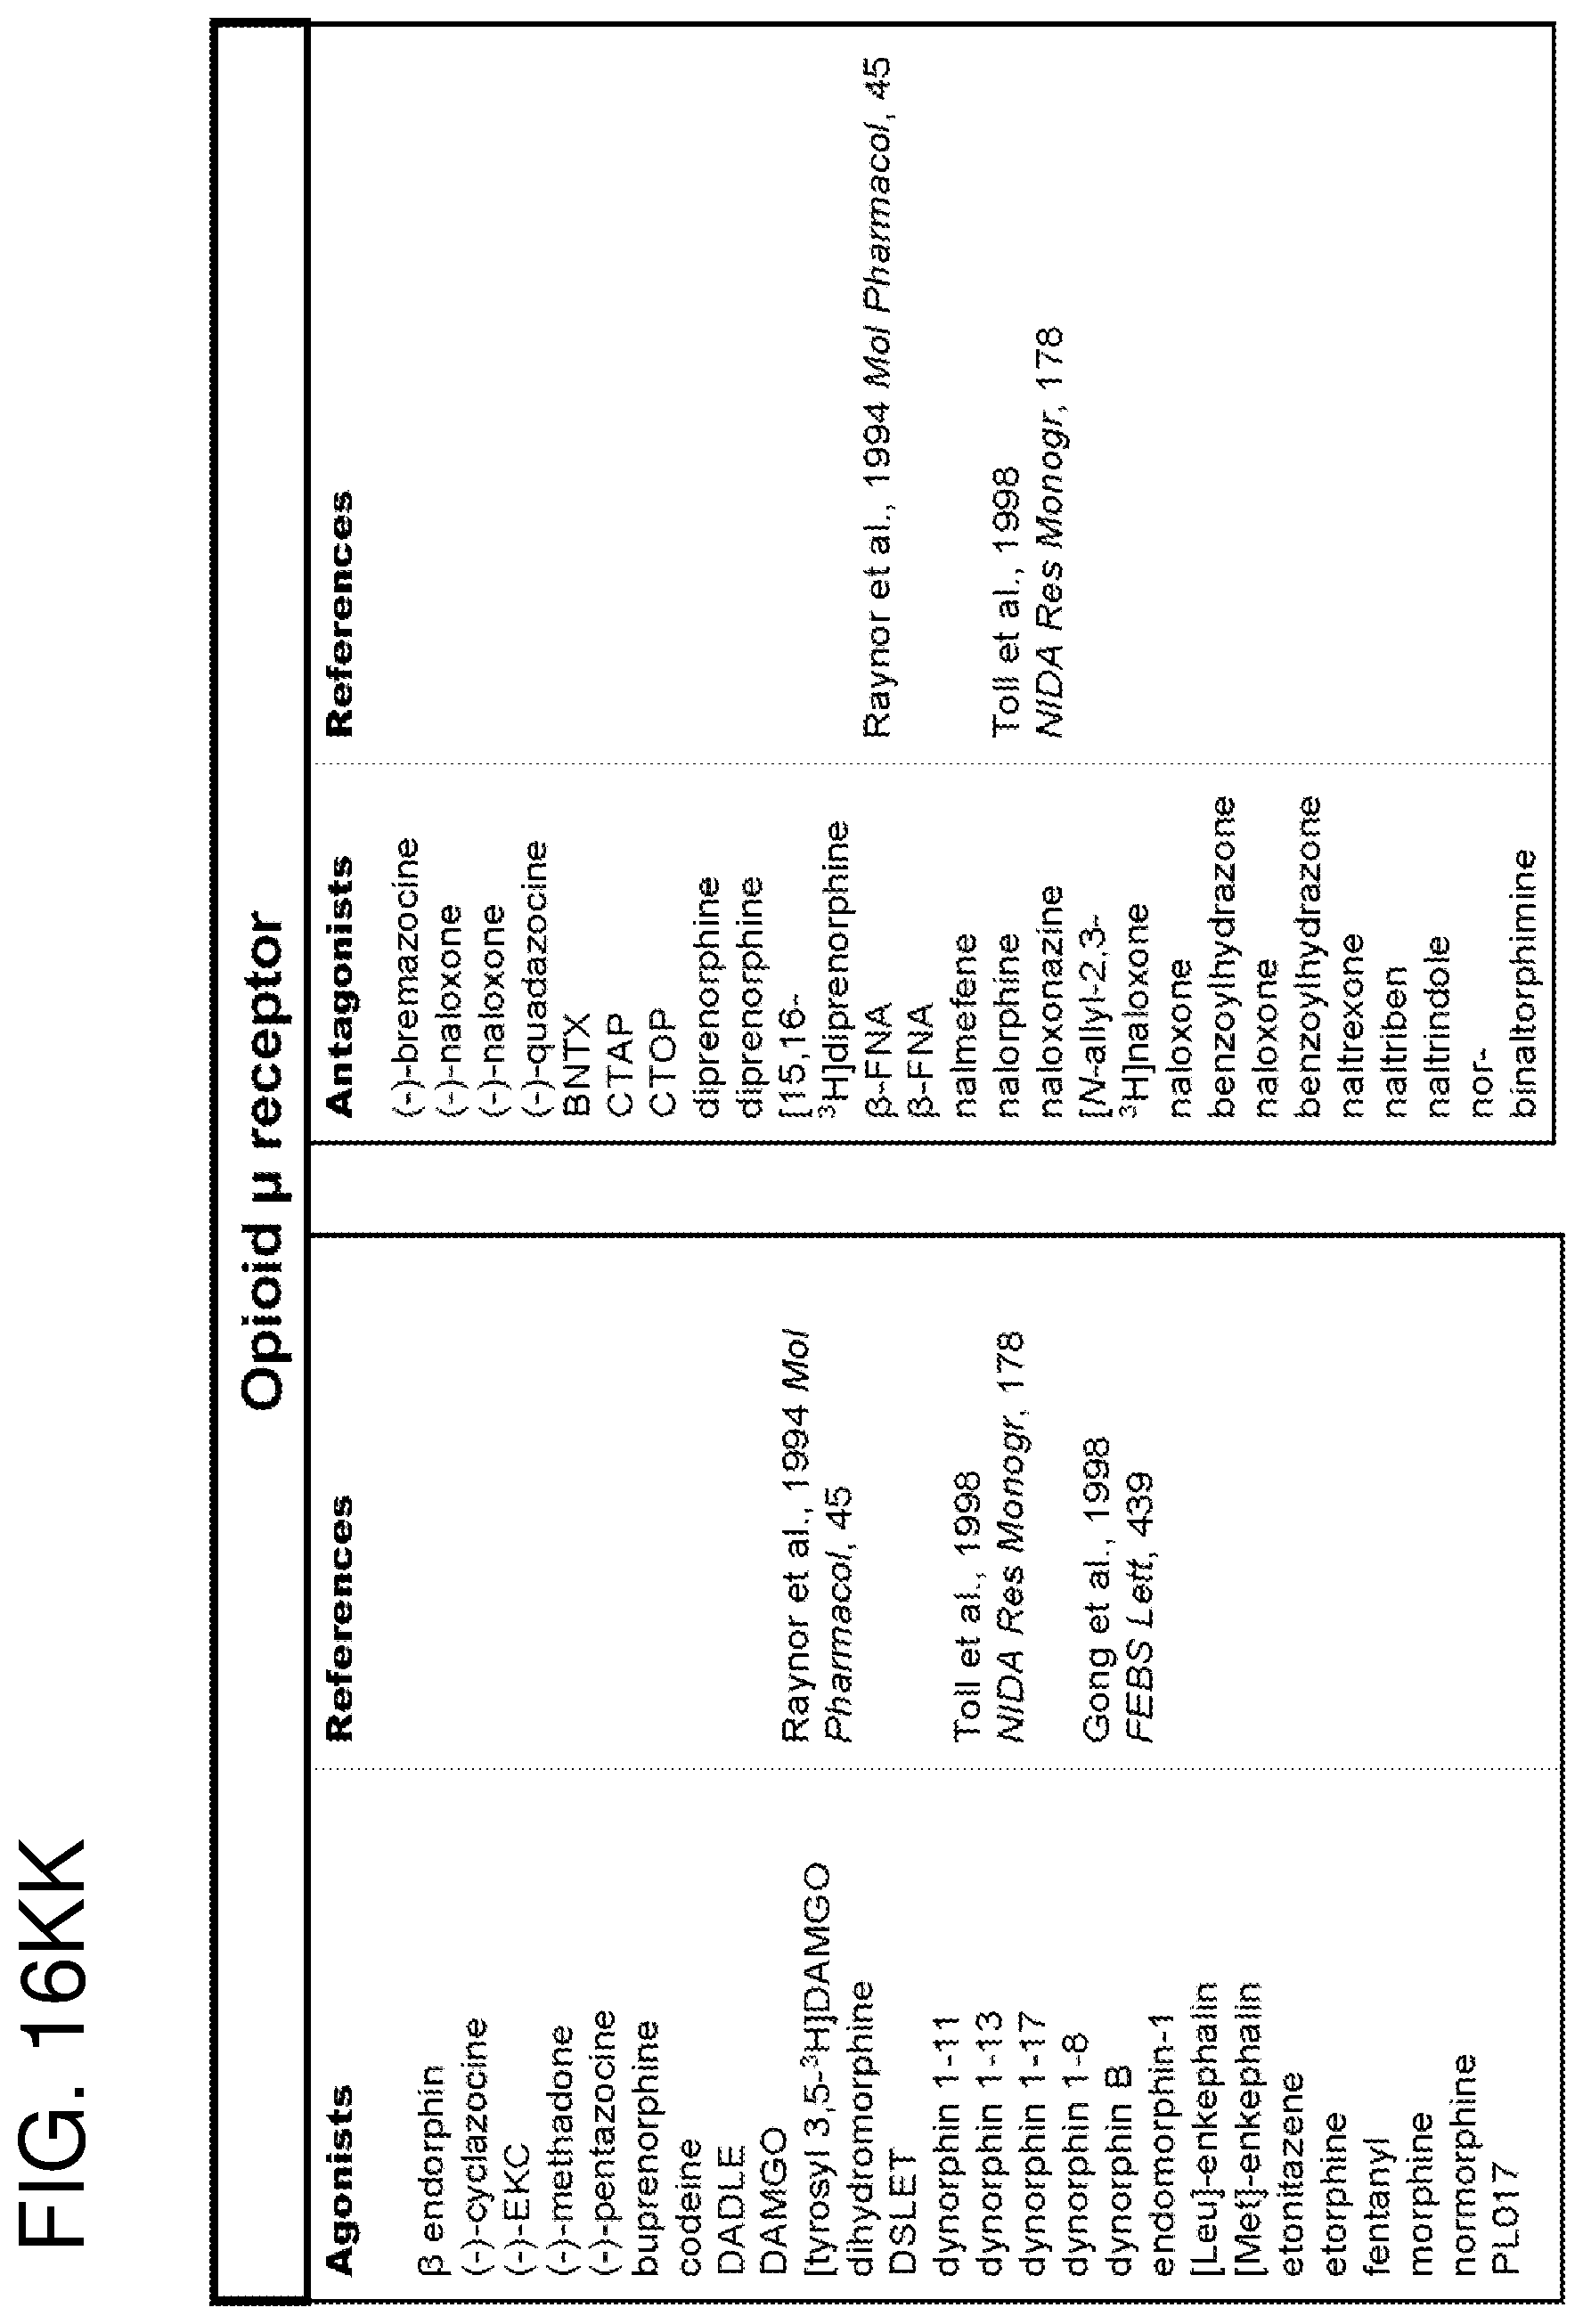
D00075

D00076

D00077

D00078

D00079

D00080

D00081

D00082

D00083

D00084

D00085

D00086

D00087

D00088

D00089

D00090
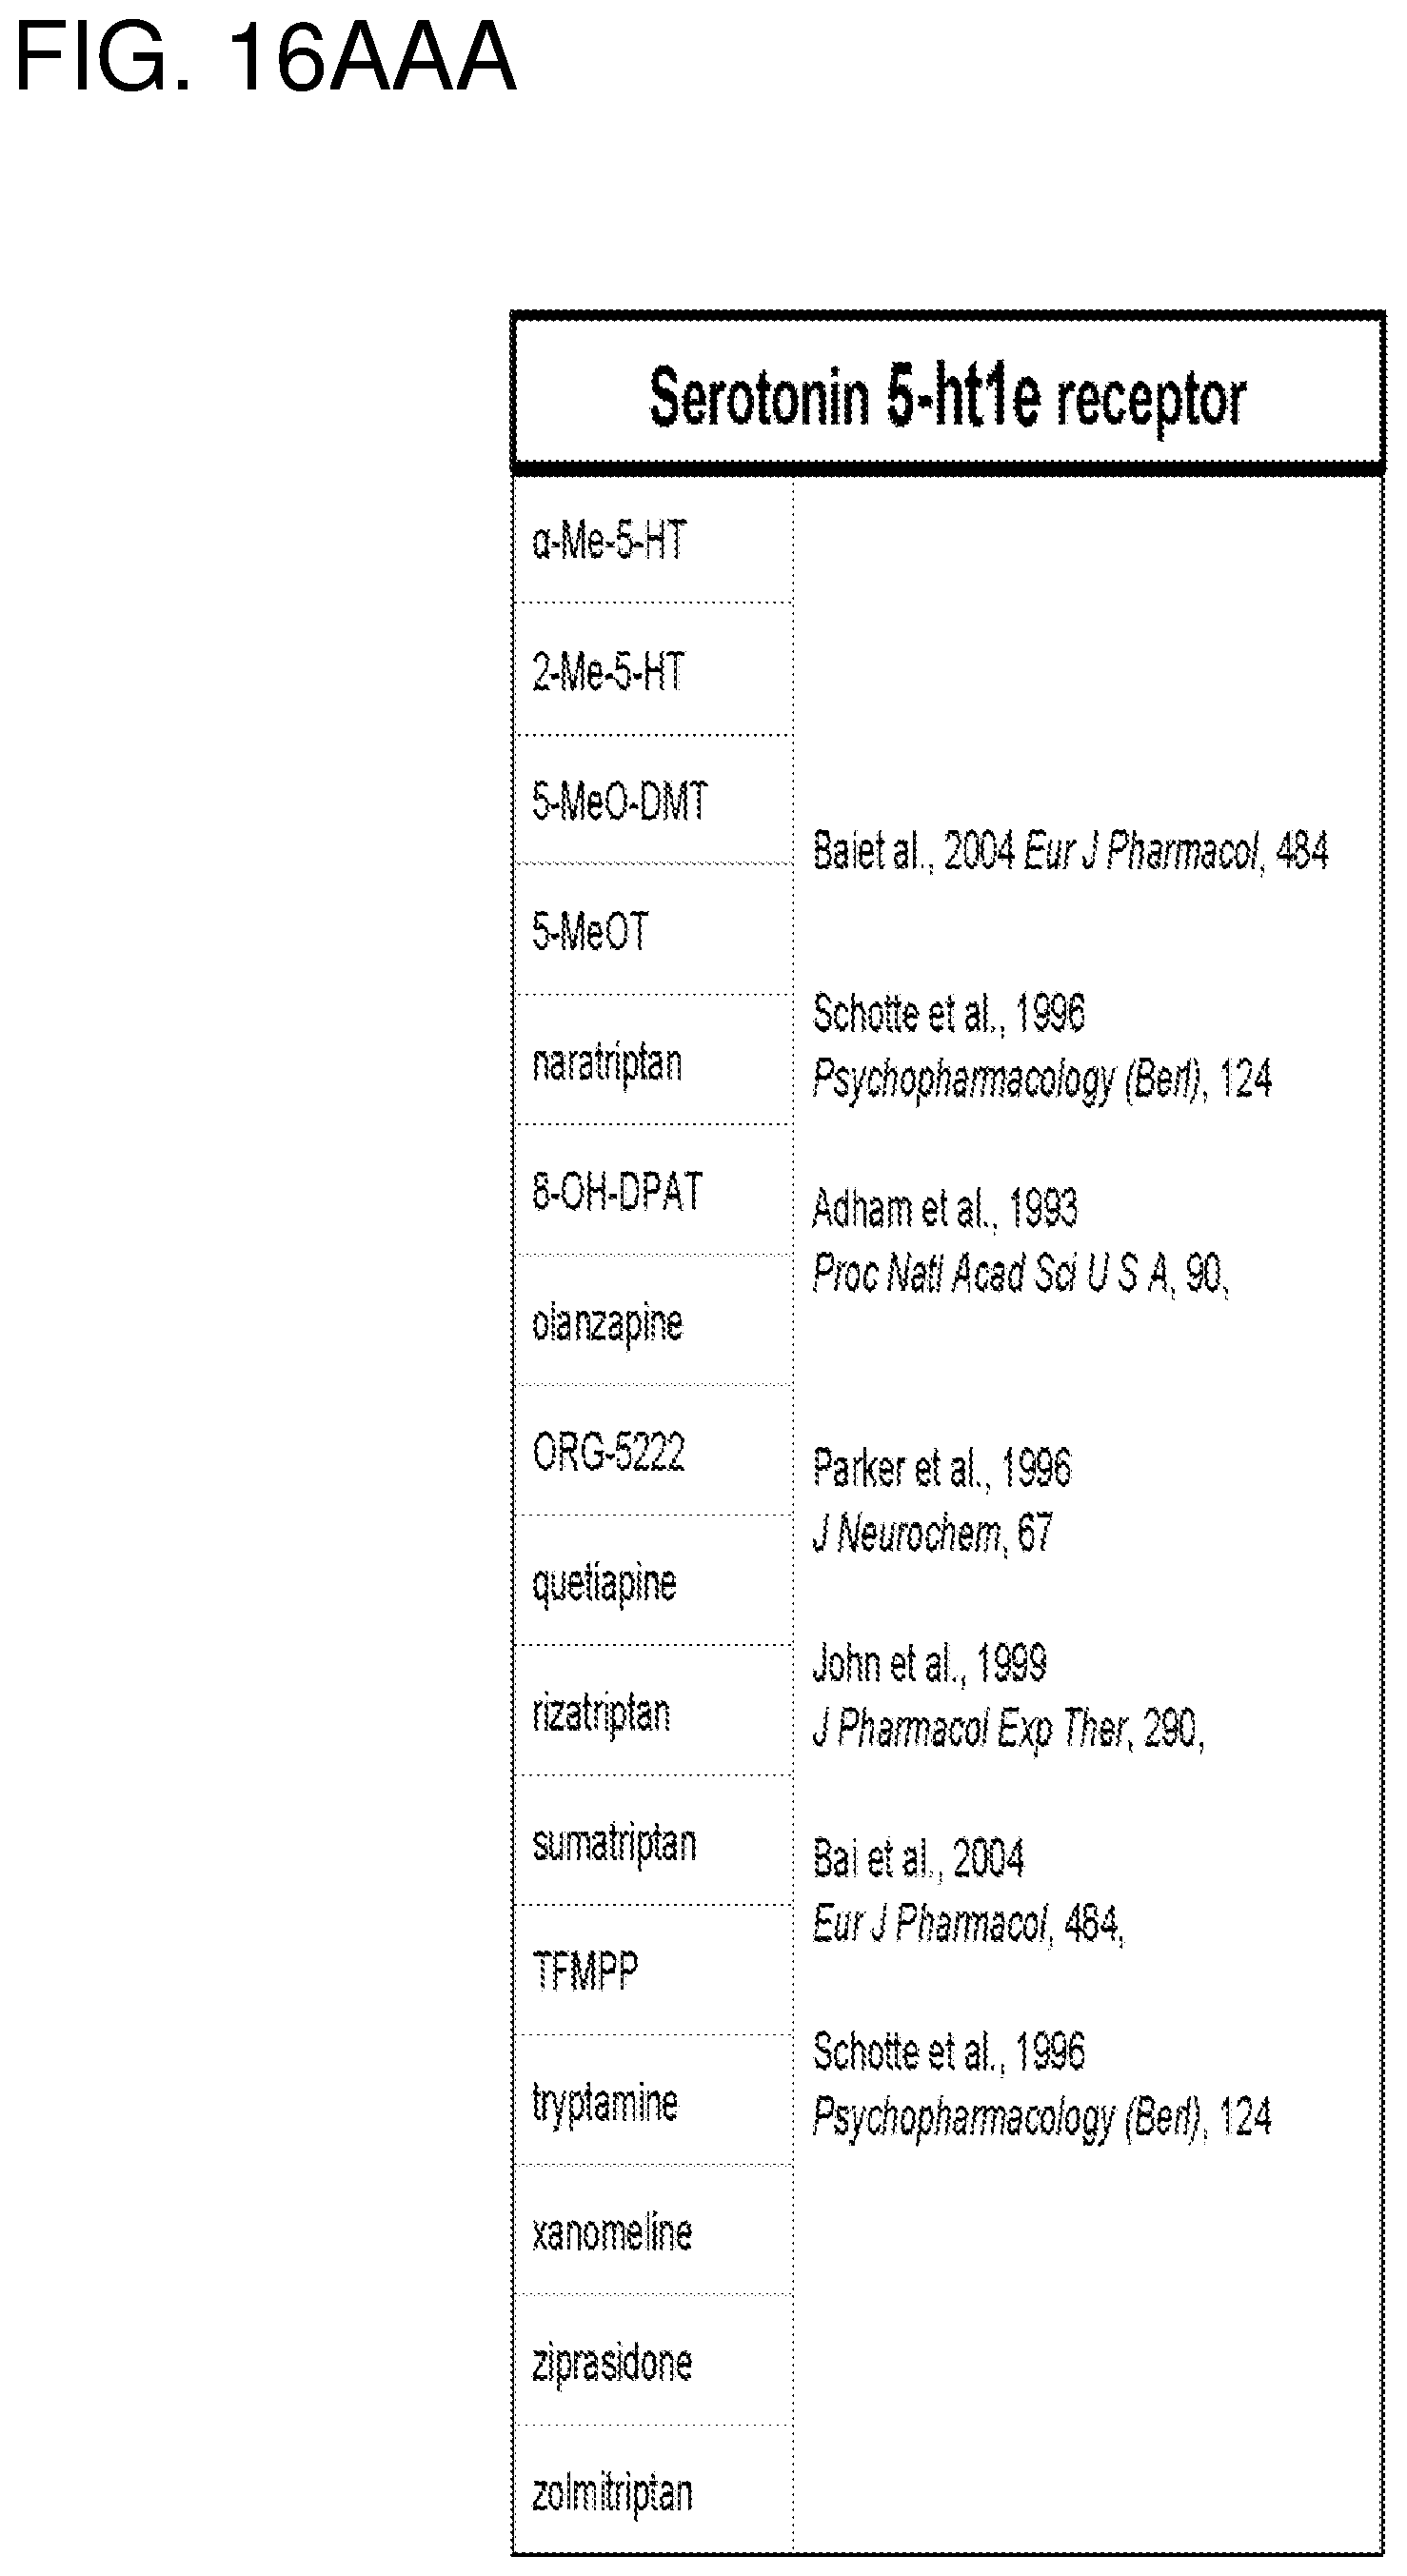
D00091

D00092

D00093

XML
uspto.report is an independent third-party trademark research tool that is not affiliated, endorsed, or sponsored by the United States Patent and Trademark Office (USPTO) or any other governmental organization. The information provided by uspto.report is based on publicly available data at the time of writing and is intended for informational purposes only.
While we strive to provide accurate and up-to-date information, we do not guarantee the accuracy, completeness, reliability, or suitability of the information displayed on this site. The use of this site is at your own risk. Any reliance you place on such information is therefore strictly at your own risk.
All official trademark data, including owner information, should be verified by visiting the official USPTO website at www.uspto.gov. This site is not intended to replace professional legal advice and should not be used as a substitute for consulting with a legal professional who is knowledgeable about trademark law.