Continuous diode laser stimulated Raman gain/loss vibrational microscope
Alfano , et al. O
U.S. patent number 10,433,731 [Application Number 15/243,207] was granted by the patent office on 2019-10-08 for continuous diode laser stimulated raman gain/loss vibrational microscope. The grantee listed for this patent is Robert R. Alfano. Invention is credited to Robert R. Alfano, Yury Budansky, Lingyan Shi.


| United States Patent | 10,433,731 |
| Alfano , et al. | October 8, 2019 |
Continuous diode laser stimulated Raman gain/loss vibrational microscope
Abstract
There is a need for a compact instrument and microscope that maps the vibration fingerprints of biomolecules and chemicals in a sample such as brain, breast, cervix, and arteries. One can use spontaneous Raman scattering to accomplish this; however, the problem is low scattering efficiency to 10.sup.-5. With the availability of continuous wave diode laser at numerous wavelengths from 375 nm-1800 nm for parametric nonlinear difference vibrational mixing to enhance Stimulated Raman process within materials. A seed beam at Raman frequency is used with pump laser beam. In this way one can map in 2D and 3D images of the vibrations associate with disease changes. Scanning a pair of laser beams can map the location of vibrations within cells, smears, membranes, arteries, and tissues of animal and human.
| Inventors: | Alfano; Robert R. (Bronx, NY), Shi; Lingyan (New York, NY), Budansky; Yury (Oakland, NJ) | ||||||||||
|---|---|---|---|---|---|---|---|---|---|---|---|
| Applicant: |
|
||||||||||
| Family ID: | 58667456 | ||||||||||
| Appl. No.: | 15/243,207 | ||||||||||
| Filed: | August 22, 2016 |
Prior Publication Data
| Document Identifier | Publication Date | |
|---|---|---|
| US 20170127947 A1 | May 11, 2017 | |
Related U.S. Patent Documents
| Application Number | Filing Date | Patent Number | Issue Date | ||
|---|---|---|---|---|---|
| 62283067 | Aug 20, 2015 | ||||
| Current U.S. Class: | 1/1 |
| Current CPC Class: | A61B 5/0075 (20130101); A61B 5/0068 (20130101); G01N 21/65 (20130101); G01N 2021/655 (20130101); G01N 2201/0612 (20130101) |
| Current International Class: | A61B 5/00 (20060101); G01N 21/65 (20060101) |
References Cited [Referenced By]
U.S. Patent Documents
| 6560478 | May 2003 | Alfano |
| 2010/0309465 | December 2010 | Liu |
| 2013/0162994 | June 2013 | Xie |
Other References
|
A Owyoung and E. Jones, Optics Letters 1, 152 (Nov. 1977) "Stimulated Raman spectroscopy using low-power cw lasers". cited by applicant . C-R Hu, Optics Letters 38, 1479 (May 2013) "Stimulated Raman scattering imaging by continuous-wave laser excitation". cited by applicant . B. Saar, Science, 330, 1368 (2010) "Video-rate molecular imaging in vivo with stimulated Raman scattering". cited by applicant . P. Nandakumar, Journal of Physics, 11, U 33026 (2009) "Vibrational imaging based on stimulated Raman scattering microscopy". cited by applicant . Marieke Pudles, J, Biophotonics 6,205 (2013) "Non-invasive identification of proteoglycans and chondrocyte differentiation state by Raman microspectroscopy". cited by applicant. |
Primary Examiner: Holmes; Rex R
Attorney, Agent or Firm: Myron Greenspan Lackenbach Siegel LLP
Claims
The invention claimed is:
1. A Raman gain/loss vibrational microscope comprises a continuous wave (cw) pump diode laser for emitting a signal at a pump frequency .OMEGA.; at least one generally co-linear probe continuous (cw) diode laser for emitting a Raman signal at a frequency W.sub.i, where i.gtoreq.1; and a chopper or modulator for modulating said pump frequency signal .OMEGA. at a frequency f.sub.c where f.sub.c is in the range of 1 KHz to 100 MHz for a lock-in amplifier to detect Raman signal at W.sub.i to generate a stimulated Raman signal by Raman Scattering with a vibrational frequency W.sub.Q=.OMEGA.-W.sub.i for loss at pump frequency .OMEGA. and gain at probe frequency W.sub.i.
2. A microscope as defined in claim 1, wherein said CW diode laser signals have an intensity of>1 mw.
3. A microscope as defined in claim 1, wherein said continuous wave (cw) diode lasers are used as a source for a Raman Vibrational Microscope.
4. A method of using a Ramen gain/loss vibrational microscope comprising the steps of generating two separate signal frequencies including a pump frequency .OMEGA. using a continuous wave (cw) pump diode laser at a pump frequency .OMEGA. and at least one probe frequency using a generally co-linear probe continuous wave (cw) probe diode laser for emitting a signal at a Raman frequency Wi, where i.gtoreq.1; and modulating said pump frequency signal .OMEGA. at a frequency f.sub.c where f.sub.c is in the range of 1 KHz to 100 MHz for a lock-in amplifier to detect Raman signal at W.sub.i to generate a stimulated Raman signal by Raman Scattering; and measuring the Raman signal at W.sub.i with both pump frequency .OMEGA. and probe frequency W.sub.i on a sample by a vibrational frequency W.sub.Q=.OMEGA.-W.sub.i for loss at pump frequency .OMEGA. and gain at probe frequency W.sub.i.
5. A method as defined in claim 4, wherein said two CW signals at said pump and probe frequencies .OMEGA. and W.sub.i are scanned about the sample with a mirror gyro scanner to map vibrational signal SRG post point by point to give 2D and 3D images.
6. A method as defined in claim 4, wherein a SRS signal is used at W.sub.i at Raman frequency for laser pump .OMEGA.=W.sub.i+W.sub.Q.
7. A method as defined in claim 4, wherein at least 2 diode laser pairs are used at pump and probe frequencies to obtain selected vibrations including: TABLE-US-00002 .OMEGA. nm W.sub.i (nm) W.sub.Q (cm.sup.-1) 532 nm 632 nm 2940 cm.sup.-1 FAT/protein 632 nm 690 nm 1440 cm.sup.-1 FAT 780 nm 880 1440 FAT 632 nm 690 1336 Glucose 632 nm 680 1126 Glucose.
8. A method as defined in claim 4, wherein a pair of laser diodes are used to detect cancer at W.sub.Q=1650 cm.sup.-1.
9. A method as defined in claim 4, wherein a pair of laser diodes are used to detect Alzheimer at W.sub.Q=2331 cm.sup.-1.
10. A method as defined in claim 4, wherein a pair of laser diodes is used to detect plaque at 1440 cm-1 and 2940 cm-1.
11. A method as defined in claim 4, wherein a pair of laser diodes is used to detect cholesterol, LDL, HDL.
12. A method as defined in claim 4, wherein a pair of laser diodes is used to detect proteins, lipids, proteoglycans and chondrocytes from extracellular membrane.
13. A microscope as defined in claim 1, wherein an assembled SRS dual bank of CW diode lasers uses 40.times., 20.times., 10.times. objective lenses to focus on a sample.
14. A microscope as defined in claim 1, further comprising optical fibers used to transport said CW laser signals at .OMEGA. and W.sub.i to sample and return a signal at W.sub.i.
15. A method as defined in claim 4, wherein the sample comprises at least one of the following animal or human tissues or cells: brain, cervix, colon, artery, oral, stomach and bladder.
16. A method as defined in claim 4, further comprising 2D and 3D vibration W.sub.i images of tissue by moving the sample and/or a galvanometer.
17. A method as defined in claim 4, wherein W.sub.Q corresponds to a vibration of one of blood chemical constituents analytes including glucose, cholesterol, lipids, fat, proteoglycans, chondrocytes, LDL and HDL molecules.
18. A method as defined in claim 1, wherein two generally co-linear probe continuous (cw) diode lasers are provided for emitting Raman signals.
19. A method as defined in claim 18, wherein said continuous wave (cw) pump diode laser is arranged to emit a signal at said pump frequency in a direction generally perpendicular to a direction corresponding to a direction of said generally co-linear Raman signal of said at least one probe laser; and beam direction modifying means for orienting all emitted beams in a substantially co-linear direction to direct said beams onto a sample to be analyzed.
Description
BACKGROUND OF THE INVENTION
1. Field of the Invention
The invention generally relates to Raman Microscopes and, more specifically, to continuous diode laser stimulated raman gain/loss vibrational microscopes.
2. Description of Prior Art
Raman scattering is used to measure the vibrational spectra in materials. The Raman process is weak. The Raman intensity is -10.sup.-6I.sub.L about 1 Raman photon is scattered for every 10.sup.6 laser incident photons. The intensity of Raman signal versus pump laser power is shown in FIG. 1 where spontaneous and stimulated Raman regions are indicated. Enhanced or stimulated Raman Scattering (SRS) can be used for most intensity peaks and narrowest Raman vibration lines. In SRS, the Raman beam from the noise is amplified by the pump beam to get gain. In the teaching here we teach the use of additional seed beam at Raman frequency: one pump photon (.OMEGA.) is annihilated (loss) and one strokes photon (Wi) is created (gain). One can achieve large conversion .gtoreq.1%. SRS has no background due to electronic .chi..sup.3 (1, 2) as does CARS--four wave mixing.
In the past SRS gain, one used ps and fs lasers in stimulated Raman setup. Combination of ps or fs lasers, cw Rhodamine dyes and He--Ne lasers were used to enhance vibrational modes.
SUMMARY OF THE INVENTION
We teach the use of pairs of continuous diodes for Raman Vibrational Microscope and to modulate diode laser for both the pump and probe beams at different frequencies. The pump laser diode is chopped or modulated and the probe laser diode is detected act as seed beam at modulate frequency. The frequency difference is at the vibrational frequency of the primary, combination mode or overtone modes in brain tissue and neurons, in arteries for plaque and in glucose in blood tree in tissue. In this invention, we teach a method continuous wave weak stimulated Raman gain and loss approach using low power diode lasers in milli-watt range for pumping and probing the key vibrations in materials to map and detect diseases of cancer, plaques, diabetes, heart, Alzheimer, Autism, brain disorder, glucose, eroded plaque and vulnerable plaque inside the body with optical fibers.
The key point of the invention is the use of various pairs of continuous wave modulated diode lasers for SRS microscope source, one as the pump and one as the probe. The difference in frequencies is equal vibrational frequency of molecule of interest. One can alternate the role where in one case SR gain is measured on Stokes and SR loss on AntiStokes role of the pair.
BRIEF DESCRIPTION OF DRAWINGS
The above and other aspects, features and advantages of the present invention will be more apparent from the following description when taken in conjunction with the accompanying drawings, in which:
FIG. 1 shows the relationship between the intensity of Raman signal versus the pump laser power.
FIG. 2a is a diagrammatic representation of 1D Stimulated Raman Microscope.
FIG. 2b is a diagrammatic representation of 2D/3D Imaging Stimulated Raman Microscope, where the sample is on a horizontal support.
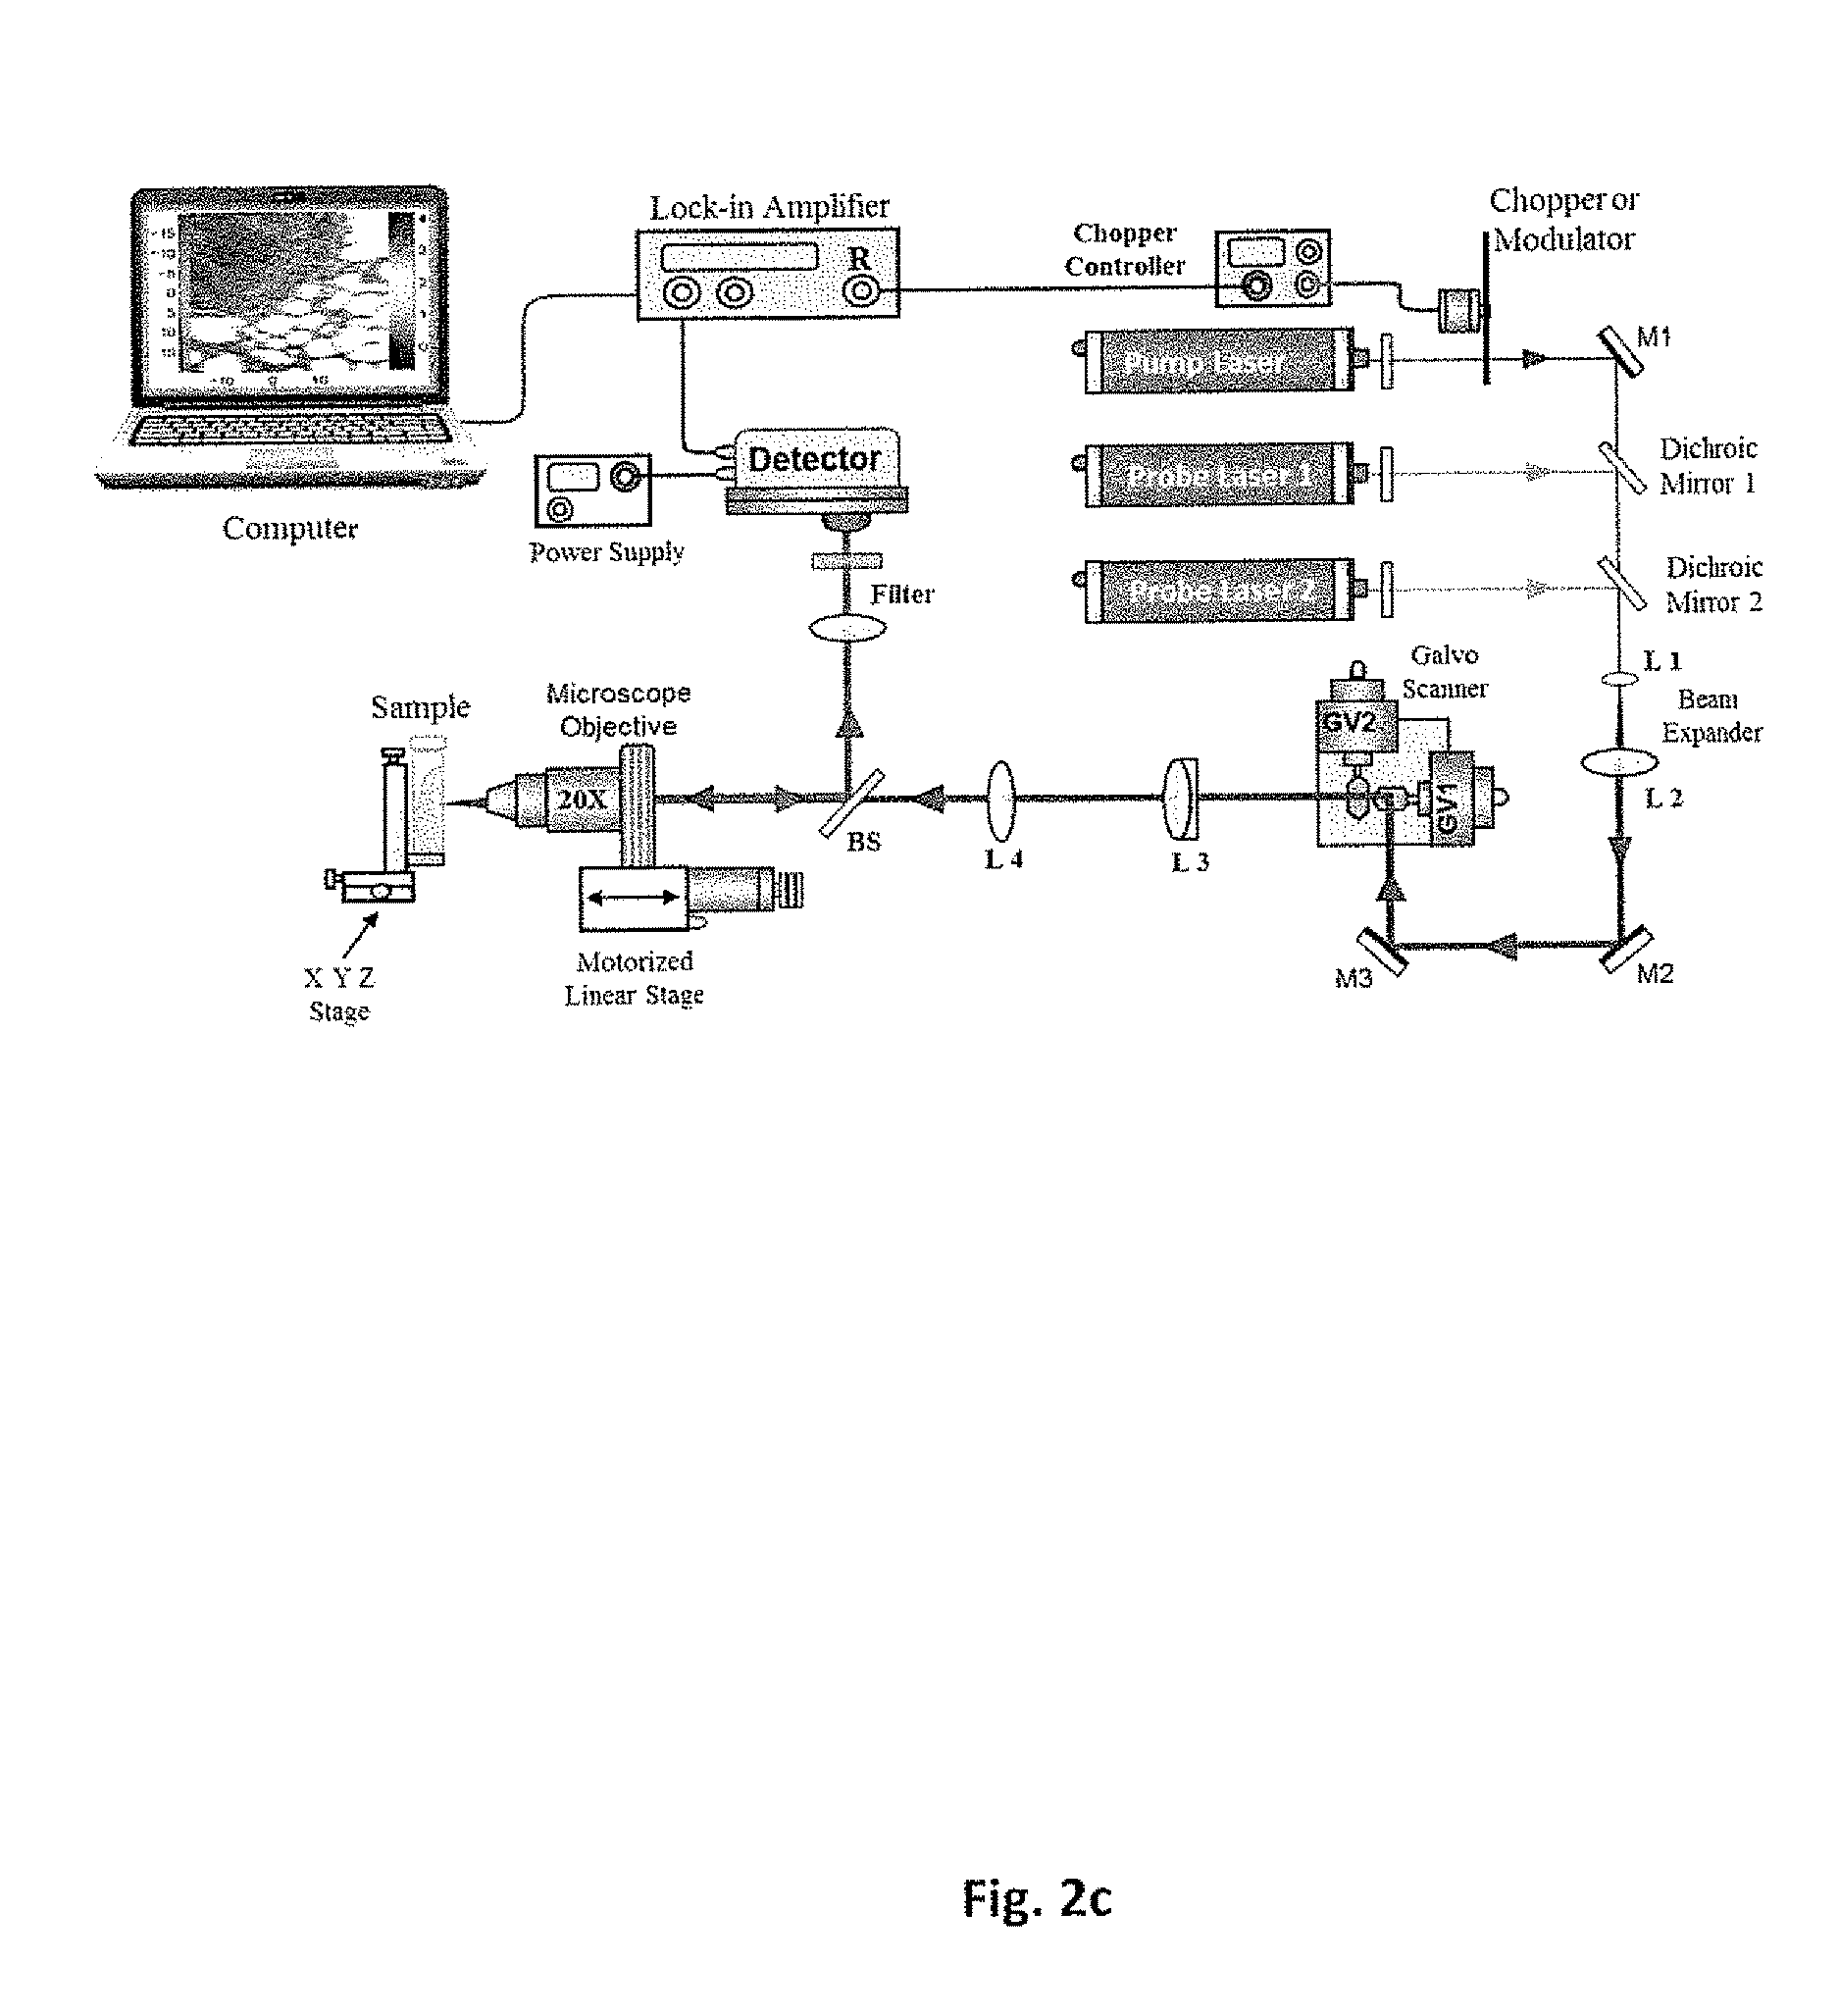
FIG. 2c is a diagrammatic representation of 2D/3D Imaging Stimulated Raman Microscope, where the sample is on a vertical support.
FIG. 3 is a photograph of Stimulated Raman Microscope System and sample with a microscope lens. CW Laser-532 nm 1, HeNe Laser-632 nm 2, Mirror 3, Chopper 4, Filter 5, Dichroic Mirror 6, Beam Splitter 7, Detector 8, Sample 9, Microscope Objective or Lens 10.
FIG. 4 (a) illustrates Raman signals from cholesterol. Areas 1 and 5--sample excited only at 532 nm, areas 2 and 4--sample excited at 532 nm and 633 nm simultaneously, area 3--sample excited only at 633 nm.
FIG. 4 (b) illustrates Raman signals from plaque in artery. Areas 1, 6, and 12--sample excited only at 532 nm, areas 2, 4, 7, 9, and 11--sample excited at 532 nm and 633 nm simultaneously, areas 3 and 8--sample excited only at 633 nm, areas 5 and 10--no excitation. Signal in areas 1, 2, 3, and 4 were measured in one location on the sample, other areas in different 3 locations.
FIG. 5 is a diagrammatic representation of Stimulated Raman CW Diode Laser System.
DETAILED DESCRIPTION OF THE INVENTION
We teach the use of continuous wave diode lasers for a SRS microscope for both pump (.OMEGA.) and probe-seed (W.sub.i) diode lasers to span many vibration lines W.sub.Q. The vibrations excited are: W.sub.Q=.OMEGA.-W.sub.i where W.sub.Q is vibration frequencies of bonds in biomolecule and chemicals in human and animal tissues from cells, cellular parts, nucleus, mitochondrion, ribosomes, DNA, proteins, lipids and extracellular matrix components. Diode lasers are now available for many selective vibration excitations covering wide range of frequencies. These diode lasers can be modulated from 1 Kz to 100 MHz 2D and 3D can be mapped and imaged on a computer by moving the focal spot about the sample say in Z direction (propagation z direction of the diode laser beams by objective lens and the use of pair of mirrors on scanning galvanometer for x and y directions to get 2D and 3D image of the vibrations in the sample. Various designs of SRS gain is shown in FIG. 2a, FIG. 2b and FIG. 2c for 1D, 2D, and 3D Raman plots.
The pump diode .OMEGA. and probe diode W.sub.i produce Raman signal due to stimulated driving of Vibrations. For example: cholesterol W.sub.Q frequency of CH bonds is 2891 cm.sup.-1 (2854 to 2935 cm.sup.-1) where pump wavelength is .OMEGA.=532 nm and probe wavelength W.sub.i=632 nm. The setup is shown in photos in FIG. 3 with a cholesterol sample.
Test results for cw lasers are shown in FIG. 4(a) for 532 nm 10 mw diode pump Nd:Yag SHG laser and FIG. 4(b) for 5 mw 633 nm He Ne laser for cholesterol. Experimental SRS setup is shown in FIG. 2 and an example is shown in the photo in FIG. 3. These diode lasers W.sub.i can drive the presence of cholesterol, fat, proteoglycans, chondrocytes, LDL, lipids, and HDL molecules(5).
A pair of diode lasers are needed for a vibration, one at .OMEGA. pump and one at W.sub.i probe where W.sub.Q=.OMEGA.-W.sub.i is a vibrational frequency selected to measure the molecules in the sample.
The pump diode laser is chopped or modulated at a frequency, f.sub.c, in range from f.sub.c=1 KHz to 100 MHz, say 3 KHz for lock-in detection for a tuned amplifier at f.sub.c. Many CW laser diodes are available from Thorlabs Company from 375 nm to 1950 nm with CW powers >20 mW, typically 100 mW.
Several laser diodes can be used in combination, say 532 nm laser diode pump to excite the vibration W.sub.Q to probe with W.sub.i at 632 nm to map these vibration W.sub.Q.
The teaching of the patent is shown in FIG. 4, where the signal produced by pump .OMEGA. diode lasers and probe diode lasers at W.sub.i is measured in backscatter geometry using a PMT, pin diode, avalanche diode to send signal to lock-in amplifier tuned at chopping frequency, f.sub.c. A pair of mirror galvanometer is used to move beam about the sample to obtain a 2D and 3 D image of the vibrations in the sample.
The stimulated Raman signal I.sub.SRG is produced from the diode laser pump I.sub.L at .OMEGA. and I.sub.R probe diode laser at W.sub.i is displayed in FIG. 5 computer's screen and stored for analysis. The pump and probe beam on and off and together show the signals for FIG. 4a Cholesterol and FIG. 4b shows the signals for arteries tissue with plaque.
We teach the use of two CW beams a pump at .OMEGA. and Raman probe R at W.sub.i causes the stimulated Raman process at W.sub.i are incident into sample. The stimulated Raman signal is produced in back scatter direction gain using a modified De-Beers law--like equation (3,4): I.sub.SRG(Wi)=(.sigma.I.sub.L+I.sub.R)Exp(GI.sub.L-.alpha.l) (2) for two laser diode beams. The seeds are spontaneous (first term) and laser probe beam (second term in the bracket) as pre-factor before Exponential. The first term in the bracket is spontaneous Raman (.sigma.I.sub.L) by diode laser .OMEGA. and the second term is probe I.sub.R at W.sub.i, G is the Raman gain coefficient, .sigma. is Raman cross section, .alpha. is absorption coefficient, and I is interaction distance.
Taking no absorption .alpha.=0, the stimulated Raman gain signal at W.sub.i is: I.sub.SRG(W.sub.i)=(.sigma.I.sub.L+I.sub.R)Exp(GI.sub.L), (3) where: .sigma.I.sub.L is the spontaneous Raman at W.sub.i for pump laser at .OMEGA., I.sub.R is the seed probe intensity at W.sub.i for CW diode laser at W.sub.i. I.sub.L is the intensity if diode pump laser at .OMEGA. for small signal gain. I.sub.SRG becomes: I.sub.SRG(Wi).ident.(.sigma.I.sub.L+I.sub.R)(1+GI.sub.L),.about..sigma.I.- sub.L+.sigma.GI.sub.LI.sub.L+I.sub.R+GI.sub.LI.sub.R. (4) For lock-in detection at chopping frequency fc for I.sub.L these Eq 4 reduces to: I.sub.SRG(fc)(Wi)=.sigma.I.sub.L+GI.sub.LI.sub.R. (5) Since I.sub.L is modulated only at fc. The change in stimulated Raman signal is given by: .DELTA.I.sub.SRG(Wi)=GI.sub.LI.sub.R. (6) One can set I.sub.L.about.I.sub.R, lower or higher I.sub.R.about. 1/10 I.sub.R for best S/N gain.
SRS example for cholesterol and artery are shown in FIG. 4 using cw 532 nm laser and HeNe 632 nm laser.
The total detected SRG signed at chopping fc for signal is: I.sub.SRG(W.sub.i).about..sigma.I.sub.L+GI.sub.LI.sub.R at f.sub.c. (7) Example for key vibrations are: CH3 and CH2 and amide types are: Cholesterol V.sub.i=2854 to 2935 cm.sup.-1, 1440 cm.sup.-1 Glucose V.sub.i=1001 cm.sup.-1 LDL, HDL, 2850-3000 cm.sup.-1 Cancer V.sub.i=1650 cm.sup.-1 Artery 2895 cm.sup.-1
TABLE-US-00001 TABLE 1 Pair CW Diode Lasers and Raman Shifts: .lamda..sub.L V.sub.L Raman Qi .OMEGA. 533 nm 18762 cm.sup.-1 W.sub.i 632 nm 15822 2940 cm.sup.-1 Cholesterol, VP .OMEGA. 632 nm W.sub.i 690 nm 1440 cm.sup.-1 Cholesterol, VP .OMEGA. 780 nm 12838 W.sub.i 880 nm 1440 cm.sup.-1 Cholesterol, VP .OMEGA. 632 nm 15822 W.sub.i 690 nm 1366 cm.sup.-1 Glucose .OMEGA. 632 nm W.sub.i 680 nm 1126 cm.sup.-1 Glucose CW Laser Diode Bank Array for SR gain: 532 nm Array of diode cw lasers 632 nm 680 nm 690 nm 780 nm 880 nm to excite SRS in various molecules in tissue in vivo and ex vivo.
While the invention has been shown and described with reference to certain embodiments thereof, it will be understood by those skilled in the art that various changes in form and detail may be made therein without departing from the spirit and scope of the invention as defined by the appended claims and their equivalents.
* * * * *
D00000
D00001
D00002
D00003
D00004
D00005
D00006
D00007
XML
uspto.report is an independent third-party trademark research tool that is not affiliated, endorsed, or sponsored by the United States Patent and Trademark Office (USPTO) or any other governmental organization. The information provided by uspto.report is based on publicly available data at the time of writing and is intended for informational purposes only.
While we strive to provide accurate and up-to-date information, we do not guarantee the accuracy, completeness, reliability, or suitability of the information displayed on this site. The use of this site is at your own risk. Any reliance you place on such information is therefore strictly at your own risk.
All official trademark data, including owner information, should be verified by visiting the official USPTO website at www.uspto.gov. This site is not intended to replace professional legal advice and should not be used as a substitute for consulting with a legal professional who is knowledgeable about trademark law.