Evaluating System Generated Historical Transaction Timeline Images
Ma; Yi-Hui ; et al.
U.S. patent application number 17/075797 was filed with the patent office on 2022-04-21 for evaluating system generated historical transaction timeline images. The applicant listed for this patent is International Business Machines Corporation. Invention is credited to Eugene Irving Kelton, Shuyan Lu, Yi-Hui Ma.
| Application Number | 20220121923 17/075797 |
| Document ID | / |
| Family ID | 1000005193606 |
| Filed Date | 2022-04-21 |


| United States Patent Application | 20220121923 |
| Kind Code | A1 |
| Ma; Yi-Hui ; et al. | April 21, 2022 |
EVALUATING SYSTEM GENERATED HISTORICAL TRANSACTION TIMELINE IMAGES
Abstract
In an approach for evaluating system generated historical transaction timeline images for a computer vision deep learning process, a processor provides one or more chart evaluation factors for evaluating historical timeline images for a deep learning of patterns based on the historical timeline images. A processor generates a quantitative metric based on the one or more chart evaluation factors using a quantitative technique. A processor determines a score for an input timeline image based on the quantitative metric. A processor filters input space based on the score. A processor, in response to receiving a feedback, adjusts a chart setting based on the one or more chart evaluation factors.
| Inventors: | Ma; Yi-Hui; (Mechanicsburg, PA) ; Kelton; Eugene Irving; (Wake Forest, NC) ; Lu; Shuyan; (Cary, NC) | ||||||||||
| Applicant: |
|
||||||||||
|---|---|---|---|---|---|---|---|---|---|---|---|
| Family ID: | 1000005193606 | ||||||||||
| Appl. No.: | 17/075797 | ||||||||||
| Filed: | October 21, 2020 |
| Current U.S. Class: | 1/1 |
| Current CPC Class: | G06F 16/2379 20190101; G06N 3/08 20130101 |
| International Class: | G06N 3/08 20060101 G06N003/08; G06F 16/23 20060101 G06F016/23 |
Claims
1. A computer-implemented method comprising: providing, by one or more processors, one or more chart evaluation factors for evaluating historical timeline images for a deep learning of patterns based on the historical timeline images; generating, by one or more processors, a quantitative metric based on the one or more chart evaluation factors using a quantitative technique; determining, by one or more processors, a score for an input timeline image based on the quantitative metric; filtering, by one or more processors, input space based on the score; and in response to receiving a feedback, adjusting, by one or more processors, a chart setting based on the one or more chart evaluation factors.
2. The computer-implemented method of claim 1, wherein the one or more chart evaluation factors include complexity, information richness and data texture.
3. The computer-implemented method of claim 2, wherein providing the one or more chart evaluation factors includes determining the one or more chart evaluation factors based on chart type, scaling, color, marker shape and data density.
4. The computer-implemented method of claim 1, wherein the quantitative metric is selected from a group consisting of: subjective metric and objective metric.
5. The computer-implemented method of claim 1, wherein the quantitative technique is selected from a group consisting of: analytic hierarchical process, fuzzy logic, and statistical distribution.
6. The computer-implemented method of claim 1, wherein determining the score includes aggregating scores in the quantitative metric associated with the one or more chart evaluation factors.
7. The computer-implemented method of claim 1, wherein filtering the input space based on the score includes selecting the input timeline image based on the score for the deep learning.
8. A computer program product comprising: one or more computer readable storage media, and program instructions collectively stored on the one or more computer readable storage media, the program instructions comprising: program instructions to provide one or more chart evaluation factors for evaluating historical timeline images for a deep learning of patterns based on the historical timeline images; program instructions to generate a quantitative metric based on the one or more chart evaluation factors using a quantitative technique; program instructions to determine a score for an input timeline image based on the quantitative metric; program instructions to filter input space based on the score; and program instructions to, in response to receiving a feedback, adjust a chart setting based on the one or more chart evaluation factors.
9. The computer program product of claim 8, wherein the one or more chart evaluation factors include complexity, information richness and data texture.
10. The computer program product of claim 8, wherein program instructions to provide the one or more chart evaluation factors include program instructions to determine the one or more chart evaluation factors based on chart type, scaling, color, marker shape and data density.
11. The computer program product of claim 8, wherein the quantitative metric is selected from a group consisting of: subjective metric and objective metric.
12. The computer program product of claim 8, wherein the quantitative technique is selected from a group consisting of: analytic hierarchical process, fuzzy logic, and statistical distribution.
13. The computer program product of claim 8, wherein program instructions to determine the score include program instructions to aggregate scores in the quantitative metric associated with the one or more chart evaluation factors.
14. The computer program product of claim 8, wherein program instructions to filter the input space based on the score include program instructions to select the input timeline image based on the score for the deep learning.
15. A computer system comprising: one or more computer processors, one or more computer readable storage media, and program instructions stored on the one or more computer readable storage media for execution by at least one of the one or more computer processors, the program instructions comprising: program instructions to provide one or more chart evaluation factors for evaluating historical timeline images for a deep learning of patterns based on the historical timeline images; program instructions to generate a quantitative metric based on the one or more chart evaluation factors using a quantitative technique; program instructions to determine a score for an input timeline image based on the quantitative metric; program instructions to filter input space based on the score; and program instructions to, in response to receiving a feedback, adjust a chart setting based on the one or more chart evaluation factors.
16. The computer system of claim 15, wherein the one or more chart evaluation factors include complexity, information richness and data texture.
17. The computer system of claim 15, wherein program instructions to provide the one or more chart evaluation factors include program instructions to determine the one or more chart evaluation factors based on chart type, scaling, color, marker shape and data density.
18. The computer system of claim 15, wherein the quantitative metric is selected from a group consisting of: subjective metric and objective metric.
19. The computer system of claim 15, wherein the quantitative technique is selected from a group consisting of: analytic hierarchical process, fuzzy logic, and statistical distribution.
20. The computer system of claim 15, wherein program instructions to determine the score include program instructions to aggregate scores in the quantitative metric associated with the one or more chart evaluation factors.
Description
BACKGROUND
[0001] The present disclosure relates generally to the field of detection of behavior patterns, and more particularly to evaluating system generated historical transaction timeline images for a computer vision deep learning process to predict labeled behavioral similarities.
[0002] Predicting human behavior can be extremely difficult, but it can also be very useful for a wide variety of purposes such as business, financial, and law enforcement. One example that spans these areas is fraud detection. Fraud detection has become a special form of technology. Fraud appears in many different forms and the detection of fraud relies on a system with the capability to recognize or discover these fraudulent activities/events. More advanced approaches to fraud detection involve cognitive technology. A cognitive system (sometimes referred to as deep learning, deep thought, or deep question answering) is a form of artificial intelligence that uses machine learning and problem solving. Cognitive systems often employ neural networks although alternative designs exist. A cognitive system is not limited to the use of a single approach, i.e., it can incorporate any number of these machine learning algorithms. These algorithms can produce a score or confidence value indicating the likelihood that a particular answer is correct.
SUMMARY
[0003] Aspects of an embodiment of the present disclosure disclose an approach for evaluating system generated historical transaction timeline images for a computer vision deep learning process. A processor provides one or more chart evaluation factors for evaluating historical timeline images for a deep learning of patterns based on the historical timeline images. A processor generates a quantitative metric based on the one or more chart evaluation factors using a quantitative technique. A processor determines a score for an input timeline image based on the quantitative metric. A processor filters input space based on the score. A processor, in response to receiving a feedback, adjusts a chart setting based on the one or more chart evaluation factors.
BRIEF DESCRIPTION OF THE DRAWINGS
[0004] FIG. 1 is a functional block diagram illustrating a chart information metric generation environment, in accordance with an embodiment of the present disclosure.
[0005] FIG. 2 is a flowchart depicting operational steps of a metric generation module within a computing device of FIG. 1, in accordance with an embodiment of the present disclosure.
[0006] FIG. 3 is an example framework of the metric generation module within the computing device of FIG. 1, in accordance with an embodiment of the present disclosure.
[0007] FIG. 4 is an example timeline image applied to the metric generation module within the computing device of FIG. 1, in accordance with an embodiment of the present disclosure.
[0008] FIG. 5 illustrates an example analytic hierarchical process for the metric generation module to use to generate a quantitative metric, in accordance with an embodiment of the present disclosure.
[0009] FIG. 6 illustrates an example fuzzy logic process for the metric generation module to use to generate the quantitative metric, in accordance with an embodiment of the present disclosure.
[0010] FIG. 7 illustrates an example statistical distribution for the metric generation module to use to generate the quantitative metric, in accordance with an embodiment of the present disclosure.
[0011] FIG. 8 is a block diagram of components of the computing device of FIG. 1, in accordance with an embodiment of the present disclosure.
DETAILED DESCRIPTION
[0012] The present disclosure is directed to systems and methods for evaluating system generated historical transaction timeline images for a computer vision deep learning process to predict labeled behavioral similarities.
[0013] Embodiments of the present disclosure recognize a need for a chart information metric framework to facilitate the deep learning process through selecting proper charting parameter sets, reducing input dimension, and presenting a better insights selection. Embodiments of the present disclosure disclose generating chart information metric for the historical timeline images as part of the component to improve pattern detection in the deep event learning process. Embodiments of the present disclosure disclose a chart information metric framework to systematically evaluate the setting for chart generation. Embodiments of the present disclosure disclose providing chart evaluation factors against generated historical timeline images. Embodiments of the present disclosure disclose generating quantitative metrics using both subjective and objective methodologies based on the chart evaluation factors. Embodiments of the present disclosure disclose creating an ensemble score for an overall chart evaluation score. Embodiments of the present disclosure disclose using the ensemble score to filter input space. Embodiments of the present disclosure disclose obtaining a feedback based on insight to adjust a chart setting.
[0014] The present disclosure will now be described in detail with reference to the Figures. FIG. 1 is a functional block diagram illustrating a chart information metric generation environment, generally designated 100, in accordance with an embodiment of the present disclosure.
[0015] In the depicted embodiment, chart information metric generation environment 100 includes computing device 102, timeline images 104, cognitive system 106 and network 108. In one or more embodiments, cognitive system 106 is configured to receive training data, e.g., including timeline images 104. In an example, cognitive system 106 is a deep learning model to predict behavior patterns. Once so trained, cognitive system 106 is able to predict behavior patterns. In an example, timeline images 104 may be chart images. Chart images may be tailored for the particular application in mind. For example, timeline images 104 may include chart type, scaling, color, marker shape, data density and other relative information for training cognitive system 106.
[0016] In various embodiments of the present disclosure, computing device 102 can be a laptop computer, a tablet computer, a netbook computer, a personal computer (PC), a desktop computer, a mobile phone, a smartphone, a smart watch, a wearable computing device, a personal digital assistant (PDA), or a server. In another embodiment, computing device 102 represents a computing system utilizing clustered computers and components to act as a single pool of seamless resources. In other embodiments, computing device 102 may represent a server computing system utilizing multiple computers as a server system, such as in a cloud computing environment. In general, computing device 102 can be any computing device or a combination of devices with access to metric generation module 110 and network 108 and is capable of processing program instructions and executing metric generation module 110, in accordance with an embodiment of the present disclosure. Computing device 102 may include internal and external hardware components, as depicted and described in further detail with respect to FIG. 8.
[0017] Further, in the depicted embodiment, computing device 102 includes metric generation module 110. In the depicted embodiment, metric generation module 110 is located on computing device 102. However, in other embodiments, metric generation module 110 may be located externally and accessed through a communication network such as network 108. The communication network can be, for example, a local area network (LAN), a wide area network (WAN) such as the Internet, or a combination of the two, and may include wired, wireless, fiber optic or any other connection known in the art. In general, the communication network can be any combination of connections and protocols that will support communications between computing device 102 and metric generation module 110, in accordance with a desired embodiment of the disclosure.
[0018] In one or more embodiments, metric generation module 110 is configured to provide chart evaluation factors 112 for evaluating timeline images 104 for a deep learning of patterns. Metric generation module 110 may provide chart evaluation factors 112 against generated historical timeline images. Timeline images 104 may be historical timeline images for training cognitive system 106. In an example, timeline images 104 may be chart images. Chart images may include chart type, scaling, color, marker shape, data density and other relative information for training cognitive system 106. Chart evaluation factors 112 may include complexity, information richness and data texture based on evaluating timeline images 104.
[0019] In one or more embodiments, metric generation module 110 is configured to generate quantitative metric 114 based on chart evaluation factors 112 using a quantitative technique. Quantitative metric 114 may be a set of figures or statistics that measure results. Metric generation module 110 may quantify timeline images 104 through different factors, e.g., chart evaluation factors 112, into quantitative metric 114. Metric generation module 110 may generate quantitative metric 114 using both subjective and or objective methodology. For example, metric generation module 110 may apply an analytic hierarchical process to generate quantitative metric 114. The analytic hierarchical process may be a structured technique for organizing and analyzing complex decisions, based on mathematics and psychology. An example analytic hierarchical process is illustrated in FIG. 5. In another example, metric generation module 110 may apply fuzzification (fuzzy logic) to generate quantitative metric 114. Fuzzy logic is a form of many-valued logic in which the truth values of variables may be any real number between 0 and 1 both inclusive. Fuzzification may be the process of assigning the numerical input of a system to fuzzy sets with some degree of membership. This degree of membership may be anywhere within the interval [0,1]. If it is 0 then the value does not belong to the given fuzzy set, and if it is 1 then the value completely belongs within the fuzzy set. Any value between 0 and 1 represents the degree of uncertainty that the value belongs in the set. An example fuzzy logic is illustrated in FIG. 6. In yet another example, metric generation module 110 may apply a statistical distribution to generate quantitative metric 114. An example statistical distribution is illustrated in FIG. 7. Metric generation module 110 may apply other suitable quantitative techniques to generate quantitative metric 114. Metric generation module 110 may apply combination of analytic hierarchical process, fuzzy logic, and statistical distribution to generate quantitative metric 114. Metric generation module 110 may generate quantitative metric 114 in a subjective metric. Metric generation module 110 may generate quantitative metric 114 in an objective metric. Metric generation module 110 may generate quantitative metric 114 in a metric between a subjective and objective metric.
[0020] In one or more embodiments, metric generation module 110 is configured to determine an ensemble score for an input timeline image based on quantitative metric 114. Metric generation module 110 may determine the ensemble score for overall chart evaluation score. Metric generation module 110 may determine the ensemble score by aggregating scores in quantitative metric 114 associated with chart evaluation factors 112. Metric generation module 110 may determine the ensemble score by using the highest score in quantitative metric 114 associated with chart evaluation factors 112. Metric generation module 110 may determine the ensemble score in any other suitable methods.
[0021] In one or more embodiments, metric generation module 110 is configured to filter input space based on the ensemble score. Metric generation module 110 may evaluate an input timeline image using the ensemble score. Metric generation module 110 may systematically evaluate the setting for charts generation. Metric generation module 110 may select input timeline image based on the ensemble score for training cognitive system 106.
[0022] In one or more embodiments, metric generation module 110 is configured to adjust a chart setting including chart evaluation factors 112 according to a feedback based on insights from a user. Metric generation module 110 may add chart information, e.g., quantitative metric 114 for timeline images 104 as part of the component to improve pattern detection in the deep event learning process. Metric generation module 110 may facilitate the deep learning process through selecting proper charting parameter sets, reducing input dimension and presenting better insights selection.
[0023] In the depicted embodiment, metric generation module 110 includes evaluation module 116. In one or more embodiments, evaluation module 116 is configured to determine an ensemble score for an input timeline image based on quantitative metric 114. Evaluation module 116 may determine the ensemble score by aggregating scores in quantitative metric 114 associated with chart evaluation factors 112. Evaluation module 116 may determine the ensemble score by using the highest score in quantitative metric 114 associated with chart evaluation factors 112. Evaluation module 116 may determine the ensemble score in any other suitable methods. Evaluation module 116 may evaluate an input timeline image using the ensemble score. Evaluation module 116 may filter input space based on the ensemble score. Evaluation module 116 may select input timeline image based on the ensemble score for training cognitive system 106. Evaluation module 116 may adjust a chart setting including the chart evaluation factors 112 according to a feedback based on insights from a user.
[0024] FIG. 2 is a flowchart 200 depicting operational steps of metric generation module 110 in accordance with an embodiment of the present disclosure.
[0025] Metric generation module 110 operates to provide chart evaluation factors 112 for evaluating timeline images 104 for a deep learning of patterns. Metric generation module 110 also operates to generate quantitative metric 114 based on chart evaluation factors 112 using a quantitative technique. Metric generation module 110 operates to determine an ensemble score for an input timeline image based on quantitative metric. Metric generation module 110 operates to filter input space based on the ensemble score. Metric generation module 110 operates to adjust a chart setting including chart evaluation factors 112 according to a feedback based on insights from a user.
[0026] In step 202, metric generation module 110 provides chart evaluation factors 112 for evaluating timeline images 104 for a deep learning of patterns. Metric generation module 110 may provide chart evaluation factors 112 against generated historical timeline images. Timeline images 104 may be historical timeline images for training cognitive system 106. In an example, timeline images 104 may be chart images. Chart images may include chart type, scaling, color, marker shape, data density and other relative information for training cognitive system 106. Chart evaluation factors 112 may include complexity, information richness and data texture based on evaluating timeline images 104.
[0027] In step 204, metric generation module 110 generates quantitative metric 114 based on chart evaluation factors 112 using a quantitative technique. Quantitative metric 114 may be a set of figures or statistics that measure results. Metric generation module 110 may quantify timeline images 104 through different factors, e.g., chart evaluation factors 112, into quantitative metric 114. Metric generation module 110 may generate quantitative metric 114 using both subjective and or objective methodology. For example, metric generation module 110 may apply an analytic hierarchical process to generate quantitative metric 114. The analytic hierarchical process is a structured technique for organizing and analyzing complex decisions, based on mathematics and psychology. An example analytic hierarchical process is illustrated in FIG. 5. In another example, metric generation module 110 may apply fuzzification (fuzzy logic) to generate quantitative metric 114. Fuzzy logic is a form of many-valued logic in which the truth values of variables may be any real number between 0 and 1 both inclusive. Fuzzification may be the process of assigning the numerical input of a system to fuzzy sets with some degree of membership. This degree of membership may be anywhere within the interval [0,1]. If it is 0 then the value does not belong to the given fuzzy set, and if it is 1 then the value completely belongs within the fuzzy set. Any value between 0 and 1 represents the degree of uncertainty that the value belongs in the set. An example fuzzy logic is illustrated in FIG. 6. In yet another example, metric generation module 110 may apply a statistical distribution to generate quantitative metric 114. An example statistical distribution is illustrated in FIG. 7. Metric generation module 110 may apply other suitable quantitative techniques to generate quantitative metric 114. Metric generation module 110 may apply combination of analytic hierarchical process, fuzzy logic, and statistical distribution to generate quantitative metric 114. Metric generation module 110 may generate quantitative metric 114 in a subjective metric. Metric generation module 110 may generate quantitative metric 114 in an objective metric. Metric generation module 110 may generate quantitative metric 114 in a metric between a subjective and objective metric.
[0028] In step 206, metric generation module 110 determines an ensemble score for an input timeline image based on quantitative metric 114. Metric generation module 110 may determine the ensemble score for overall chart evaluation score. Metric generation module 110 may determine the ensemble score by aggregating scores in quantitative metric 114 associated with chart evaluation factors 112. Metric generation module 110 may determine the ensemble score by using the highest score in quantitative metric 114 associated with chart evaluation factors 112. Metric generation module 110 may determine the ensemble score in any other suitable methods.
[0029] In step 208, metric generation module 110 filters input space based on the ensemble score. Metric generation module 110 may evaluate an input timeline image using the ensemble score. Metric generation module 110 may systematically evaluate the setting for charts generation. Metric generation module 110 may select an input timeline image based on the ensemble score for training cognitive system 106.
[0030] In step 210, metric generation module 110 adjusts a chart setting based on chart evaluation factors 112 according to a feedback based on insights from a user. Metric generation module 110 may add chart information, e.g., quantitative metric 114 for timeline images 104 as part of the component to improve pattern detection in the deep event learning process. Metric generation module 110 may facilitate the deep learning process through selecting proper charting parameter sets, reducing input dimension and presenting better insights selection.
[0031] FIG. 3 is an example framework of metric generation module 110, in accordance with one or more embodiments of the present disclosure.
[0032] In the example of FIG. 3, metric generation module 110 may provide chart evaluation factors 112 against generated historical timeline images. Chart evaluation factors 112 may include complexity 302, information richness 304 and data texture 306 based on evaluating timeline images 104. In an example, generated historical timeline images may be chart images. Example chart images may include chart type 308, scaling 310, color 312, marker shape 314, data density 316 and other relative example information associated with chart evaluation factors 112. Metric generation module 110 may generate quantitative metric 114 based on chart evaluation factors 112 using a quantitative technique. Metric generation module 110 may generate quantitative metric 114 using both subjective 324 and or objective 326 methodology. Metric generation module 110 may generate quantitative metric 114 using analytic hierarchical process 318, fuzzy logic 320, statistical distribution 322, and or other suitable technique or methodology. Metric generation module 110 includes evaluation module 116. Evaluation module 116 may determine ensemble score 328 for an input timeline image based on quantitative metric 114. Evaluation module 116 may determine ensemble score 328 by aggregating scores in quantitative metric 114 associated with chart evaluation factors 112. Evaluation module 116 may determine ensemble score 328 by using the highest score in quantitative metric 114 associated with chart evaluation factors 112. Evaluation module 116 may adjust or update a chart setting including chart evaluation factors 112 according to a feedback 330 based on insights from a user. In block 332, evaluation module 116 may combine all quantitative metric 114 to get ensemble score 328. In block 334, evaluation module 116 may filter input space based on ensemble score 328. In block 336, evaluation module 116 may get feedback from insights from a user and update the chart setting through feedback 330.
[0033] FIG. 4 is an example timeline image 104 applied to metric generation module 110, in accordance with one or more embodiments of the present disclosure.
[0034] In the example of FIG. 4, timeline image 104 (e.g., generated historical chart image) includes chart type 308, scaling 310, color 312, marker 314 and data density 316 associated with chart evaluation factors 112 for metric generation module 110. In the example, chart type 308 is line chart 402. Scaling 310 for the top chart is [0, 4] 404. Scaling 310 for the bottom chart is [0,1] 406. Color 312 for the top chart is red 408 and green 410. Color 312 for the bottom chart is blue 412. Marker 314 for the top chart is [X, O] 414. Marker 314 for the bottom chart is [O] 416. Data density 316 for the top chart is high 418. Data density 316 for the bottom chart is low 420.
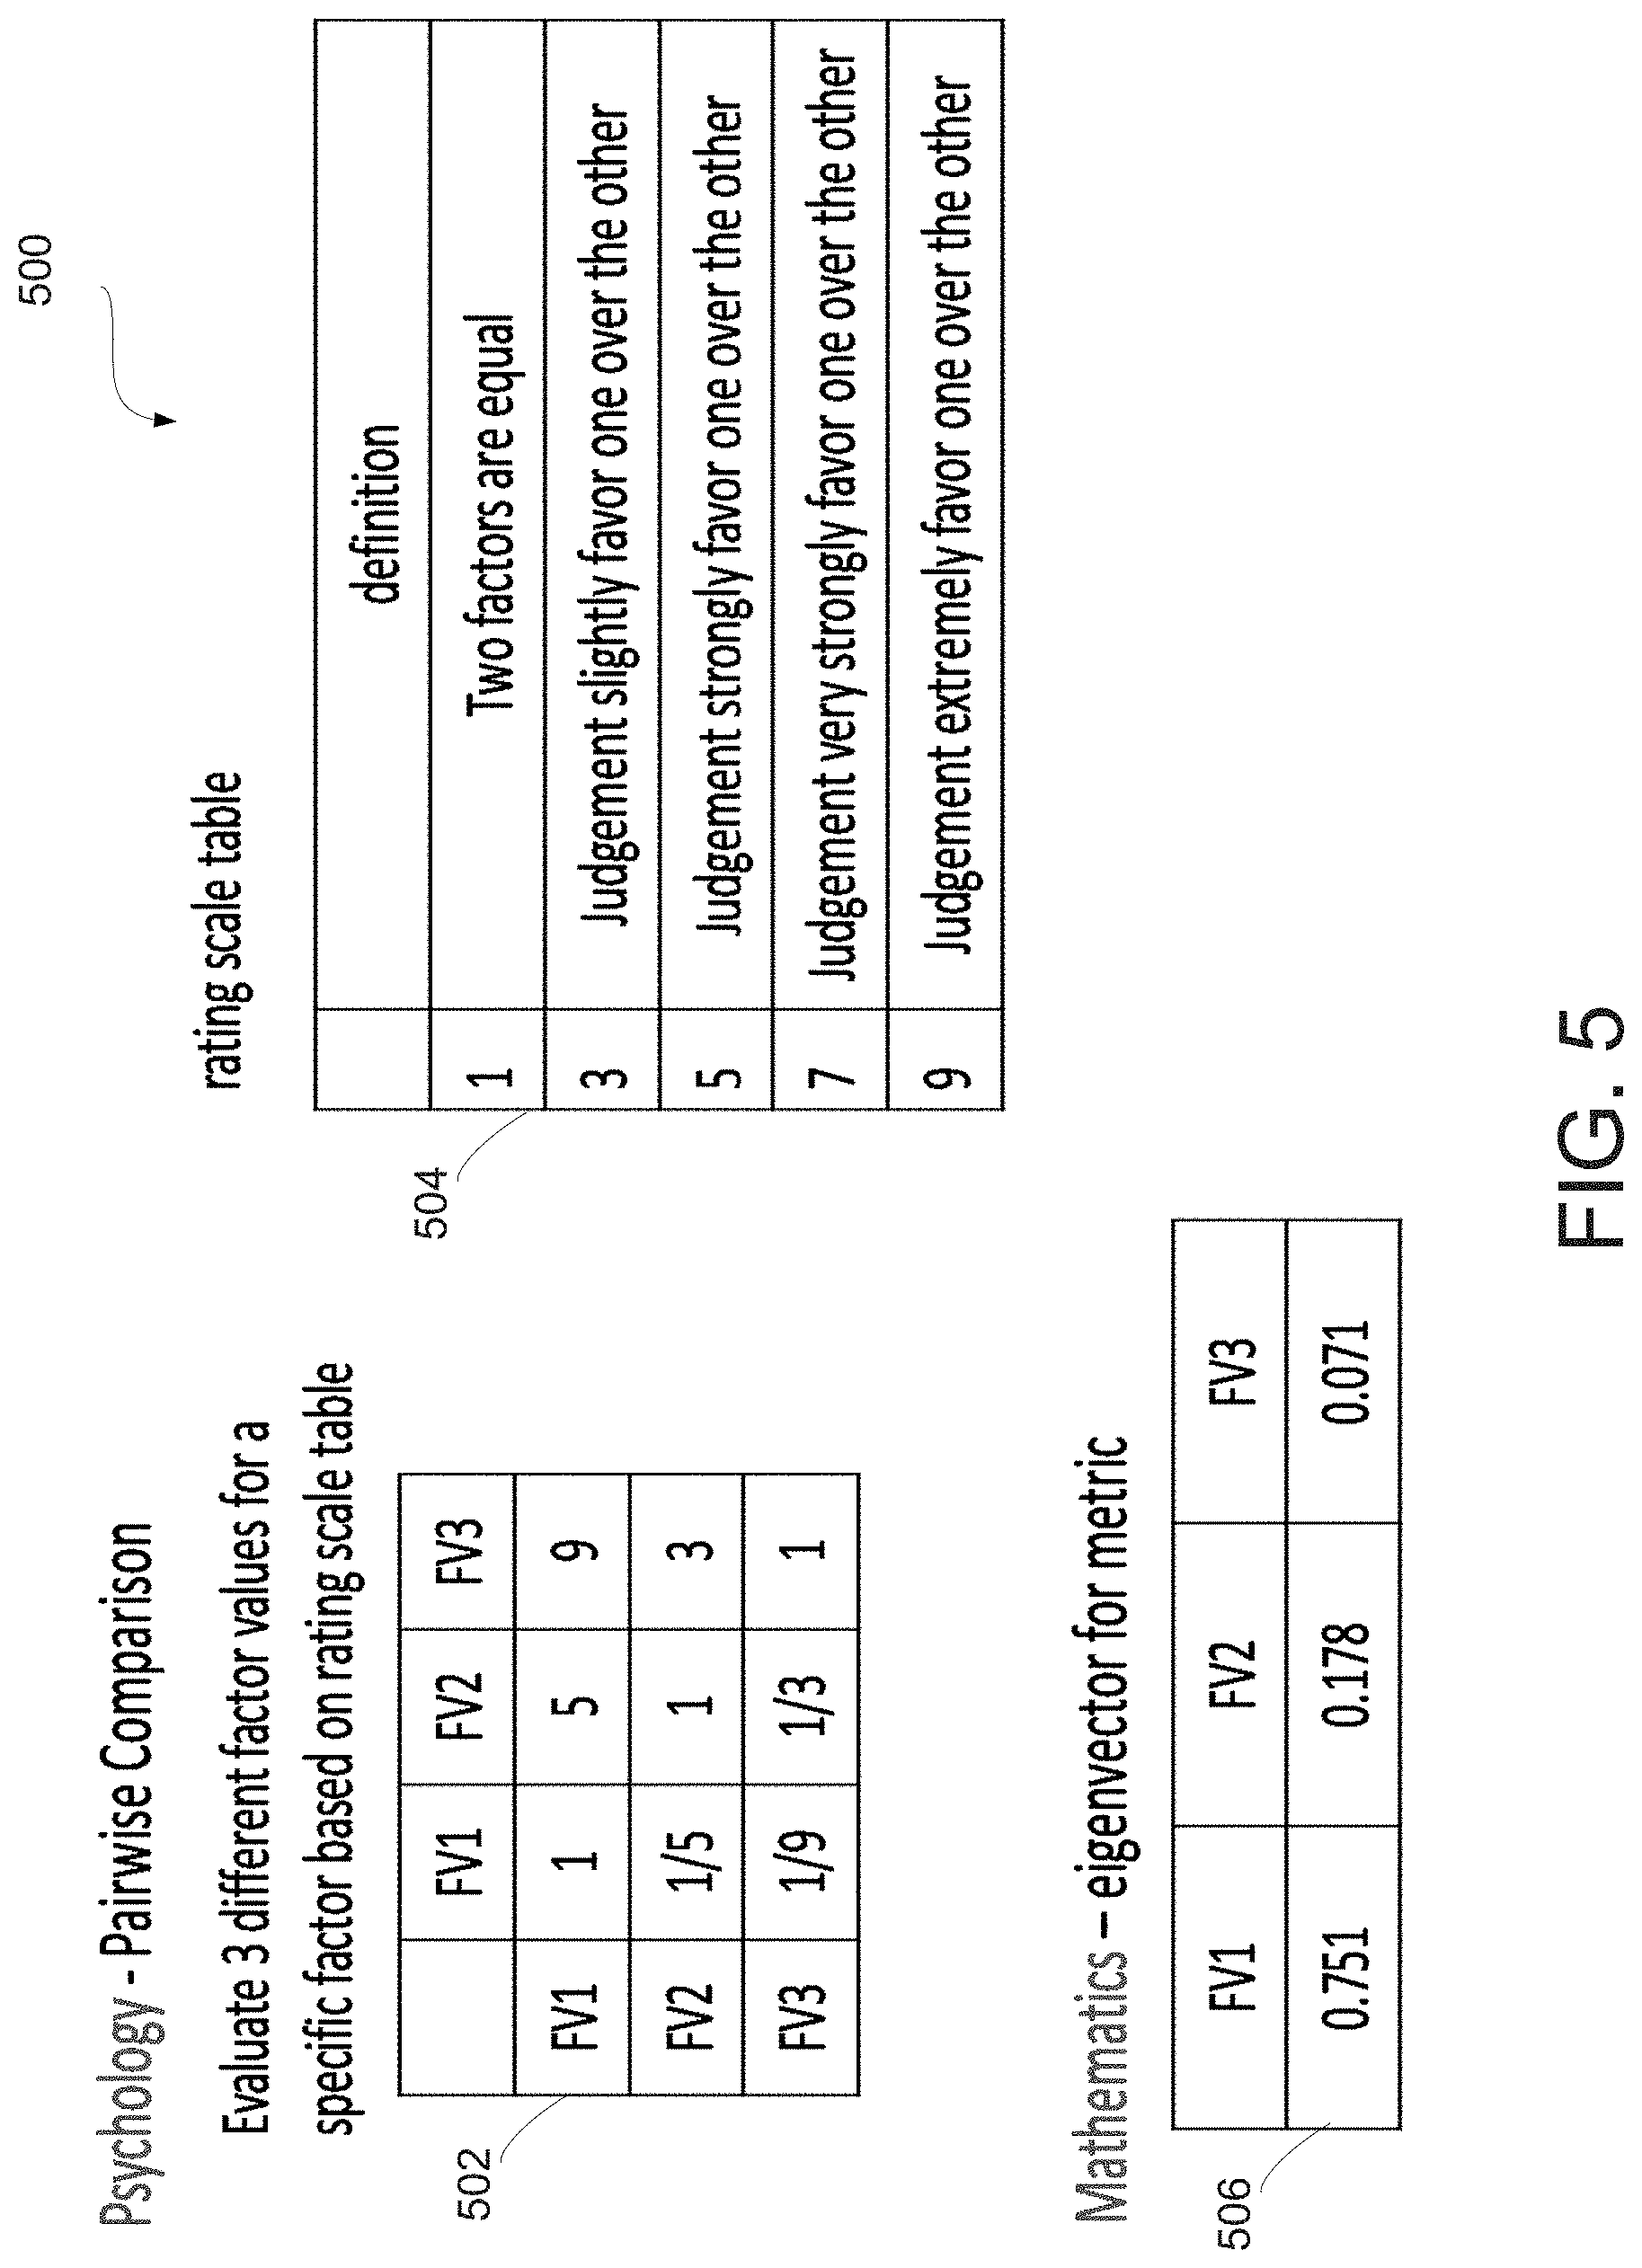
[0035] FIG. 5 is an example analytic hierarchical process 500 for metric generation module 110 to use to generate quantitative metric 114, in accordance with one or more embodiments of the present disclosure.
[0036] Metric generation module 110 may apply example analytic hierarchical process 500 to generate quantitative metric 114. Example analytic hierarchical process 500 may be a structured technique for organizing and analyzing complex decisions, based on mathematics and psychology. Example analytic hierarchical process 500 may evaluate different factor values 502 for a specific factor (e.g., chart evaluation factors 112) based on rating scale table 504. For example, the factor being evaluated may be chart type where three factor values could be scatter plot, bar chart, or line chart. Example analytic hierarchical process 500 may generate eigenvector for metric 506.
[0037] FIG. 6 is an example fuzzy logic process 600 for metric generation module 110 to use to generate quantitative metric 114, in accordance with one or more embodiments of the present disclosure.
[0038] Fuzzy logic may be a form of many-valued logic in which the truth values of variables may be any real number between 0 and 1 both inclusive. Fuzzy logic may be based on the observation that people make decisions based on imprecise and non-numerical information. In the example of FIG. 6, fuzzy logic process 600 may evaluate two factors together when the two factors might be related (or dependent). For example, factor A 602 may be number of colors and factor B 604 may be number of markers. Metric generation module 110 may apply fuzzy logic in steps 606 which will provide an evaluation metric (e.g., quantitative metric 114) based on factor value 608 of A 602 and B 604.
[0039] FIG. 7 is an example statistical distribution 700 for metric generation module 110 to use to generate quantitative metric 114, in accordance with one or more embodiments of the present disclosure.
[0040] In the example of FIG. 7, each factor 702 has one scoring curve 704. For each factor value 706, metric generation module 110 may obtain quantitative metric 114 based on the corresponding factor curve 704.
[0041] FIG. 8 depicts a block diagram 800 of components of computing device 102 in accordance with an illustrative embodiment of the present disclosure. It should be appreciated that FIG. 8 provides only an illustration of one implementation and does not imply any limitations with regard to the environments in which different embodiments may be implemented. Many modifications to the depicted environment may be made.
[0042] Computing device 102 may include communications fabric 802, which provides communications between cache 816, memory 806, persistent storage 808, communications unit 810, and input/output (I/O) interface(s) 812. Communications fabric 802 can be implemented with any architecture designed for passing data and/or control information between processors (such as microprocessors, communications and network processors, etc.), system memory, peripheral devices, and any other hardware components within a system. For example, communications fabric 802 can be implemented with one or more buses or a crossbar switch.
[0043] Memory 806 and persistent storage 808 are computer readable storage media. In this embodiment, memory 806 includes random access memory (RAM). In general, memory 806 can include any suitable volatile or non-volatile computer readable storage media. Cache 816 is a fast memory that enhances the performance of computer processor(s) 804 by holding recently accessed data, and data near accessed data, from memory 806.
[0044] Metric generation module 110 may be stored in persistent storage 808 and in memory 806 for execution by one or more of the respective computer processors 804 via cache 816. In an embodiment, persistent storage 808 includes a magnetic hard disk drive. Alternatively, or in addition to a magnetic hard disk drive, persistent storage 808 can include a solid state hard drive, a semiconductor storage device, read-only memory (ROM), erasable programmable read-only memory (EPROM), flash memory, or any other computer readable storage media that is capable of storing program instructions or digital information.
[0045] The media used by persistent storage 808 may also be removable. For example, a removable hard drive may be used for persistent storage 808. Other examples include optical and magnetic disks, thumb drives, and smart cards that are inserted into a drive for transfer onto another computer readable storage medium that is also part of persistent storage 808.
[0046] Communications unit 810, in these examples, provides for communications with other data processing systems or devices. In these examples, communications unit 810 includes one or more network interface cards. Communications unit 810 may provide communications through the use of either or both physical and wireless communications links. Metric generation module 110 may be downloaded to persistent storage 808 through communications unit 810.
[0047] I/O interface(s) 812 allows for input and output of data with other devices that may be connected to computing device 102. For example, I/O interface 812 may provide a connection to external devices 818 such as a keyboard, keypad, a touch screen, and/or some other suitable input device. External devices 818 can also include portable computer readable storage media such as, for example, thumb drives, portable optical or magnetic disks, and memory cards. Software and data used to practice embodiments of the present invention, e.g., metric generation module 110 can be stored on such portable computer readable storage media and can be loaded onto persistent storage 808 via I/O interface(s) 812. I/O interface(s) 812 also connect to display 820.
[0048] Display 820 provides a mechanism to display data to a user and may be, for example, a computer monitor.
[0049] The programs described herein are identified based upon the application for which they are implemented in a specific embodiment of the invention. However, it should be appreciated that any particular program nomenclature herein is used merely for convenience, and thus the invention should not be limited to use solely in any specific application identified and/or implied by such nomenclature.
[0050] The present invention may be a system, a method, and/or a computer program product at any possible technical detail level of integration. The computer program product may include a computer readable storage medium (or media) having computer readable program instructions thereon for causing a processor to carry out aspects of the present invention.
[0051] The computer readable storage medium can be a tangible device that can retain and store instructions for use by an instruction execution device. The computer readable storage medium may be, for example, but is not limited to, an electronic storage device, a magnetic storage device, an optical storage device, an electromagnetic storage device, a semiconductor storage device, or any suitable combination of the foregoing. A non-exhaustive list of more specific examples of the computer readable storage medium includes the following: a portable computer diskette, a hard disk, a random access memory (RAM), a read-only memory (ROM), an erasable programmable read-only memory (EPROM or Flash memory), a static random access memory (SRAM), a portable compact disc read-only memory (CD-ROM), a digital versatile disk (DVD), a memory stick, a floppy disk, a mechanically encoded device such as punch-cards or raised structures in a groove having instructions recorded thereon, and any suitable combination of the foregoing. A computer readable storage medium, as used herein, is not to be construed as being transitory signals per se, such as radio waves or other freely propagating electromagnetic waves, electromagnetic waves propagating through a waveguide or other transmission media (e.g., light pulses passing through a fiber-optic cable), or electrical signals transmitted through a wire.
[0052] Computer readable program instructions described herein can be downloaded to respective computing/processing devices from a computer readable storage medium or to an external computer or external storage device via a network, for example, the Internet, a local area network, a wide area network and/or a wireless network. The network may comprise copper transmission cables, optical transmission fibers, wireless transmission, routers, firewalls, switches, gateway computers and/or edge servers. A network adapter card or network interface in each computing/processing device receives computer readable program instructions from the network and forwards the computer readable program instructions for storage in a computer readable storage medium within the respective computing/processing device.
[0053] Computer readable program instructions for carrying out operations of the present invention may be assembler instructions, instruction-set-architecture (ISA) instructions, machine instructions, machine dependent instructions, microcode, firmware instructions, state-setting data, configuration data for integrated circuitry, or either source code or object code written in any combination of one or more programming languages, including an object oriented programming language such as Python, C++, or the like, and procedural programming languages, such as the "C" programming language or similar programming languages. The computer readable program instructions may execute entirely on the user's computer, partly on the user's computer, as a stand-alone software package, partly on the user's computer and partly on a remote computer or entirely on the remote computer or server. In the latter scenario, the remote computer may be connected to the user's computer through any type of network, including a local area network (LAN) or a wide area network (WAN), or the connection may be made to an external computer (for example, through the Internet using an Internet Service Provider). In some embodiments, electronic circuitry including, for example, programmable logic circuitry, field-programmable gate arrays (FPGA), or programmable logic arrays (PLA) may execute the computer readable program instructions by utilizing state information of the computer readable program instructions to personalize the electronic circuitry, in order to perform aspects of the present invention.
[0054] Aspects of the present invention are described herein with reference to flowchart illustrations and/or block diagrams of methods, apparatus (systems), and computer program products according to embodiments of the invention. It will be understood that each block of the flowchart illustrations and/or block diagrams, and combinations of blocks in the flowchart illustrations and/or block diagrams, can be implemented by computer readable program instructions.
[0055] These computer readable program instructions may be provided to a processor of a computer, or other programmable data processing apparatus to produce a machine, such that the instructions, which execute via the processor of the computer or other programmable data processing apparatus, create means for implementing the functions/acts specified in the flowchart and/or block diagram block or blocks. These computer readable program instructions may also be stored in a computer readable storage medium that can direct a computer, a programmable data processing apparatus, and/or other devices to function in a particular manner, such that the computer readable storage medium having instructions stored therein comprises an article of manufacture including instructions which implement aspects of the function/act specified in the flowchart and/or block diagram block or blocks.
[0056] The computer readable program instructions may also be loaded onto a computer, other programmable data processing apparatus, or other device to cause a series of operational steps to be performed on the computer, other programmable apparatus or other device to produce a computer implemented process, such that the instructions which execute on the computer, other programmable apparatus, or other device implement the functions/acts specified in the flowchart and/or block diagram block or blocks.
[0057] The flowchart and block diagrams in the Figures illustrate the architecture, functionality, and operation of possible implementations of systems, methods, and computer program products according to various embodiments of the present invention. In this regard, each block in the flowchart or block diagrams may represent a module, segment, or portion of instructions, which comprises one or more executable instructions for implementing the specified logical function(s). In some alternative implementations, the functions noted in the blocks may occur out of the order noted in the Figures. For example, two blocks shown in succession may, in fact, be accomplished as one step, executed concurrently, substantially concurrently, in a partially or wholly temporally overlapping manner, or the blocks may sometimes be executed in the reverse order, depending upon the functionality involved. It will also be noted that each block of the block diagrams and/or flowchart illustration, and combinations of blocks in the block diagrams and/or flowchart illustration, can be implemented by special purpose hardware-based systems that perform the specified functions or acts or carry out combinations of special purpose hardware and computer instructions.
[0058] The descriptions of the various embodiments of the present invention have been presented for purposes of illustration, but are not intended to be exhaustive or limited to the embodiments disclosed. Many modifications and variations will be apparent to those of ordinary skill in the art without departing from the scope and spirit of the invention. The terminology used herein was chosen to best explain the principles of the embodiment, the practical application or technical improvement over technologies found in the marketplace, or to enable others of ordinary skill in the art to understand the embodiments disclosed herein.
[0059] Although specific embodiments of the present invention have been described, it will be understood by those of skill in the art that there are other embodiments that are equivalent to the described embodiments. Accordingly, it is to be understood that the invention is not to be limited by the specific illustrated embodiments, but only by the scope of the appended claims.
* * * * *
D00000
D00001
D00002
D00003
D00004
D00005
D00006
D00007
D00008
XML
uspto.report is an independent third-party trademark research tool that is not affiliated, endorsed, or sponsored by the United States Patent and Trademark Office (USPTO) or any other governmental organization. The information provided by uspto.report is based on publicly available data at the time of writing and is intended for informational purposes only.
While we strive to provide accurate and up-to-date information, we do not guarantee the accuracy, completeness, reliability, or suitability of the information displayed on this site. The use of this site is at your own risk. Any reliance you place on such information is therefore strictly at your own risk.
All official trademark data, including owner information, should be verified by visiting the official USPTO website at www.uspto.gov. This site is not intended to replace professional legal advice and should not be used as a substitute for consulting with a legal professional who is knowledgeable about trademark law.