Methods For The Stimulation Of Dendritic Cell (dc) Precursor Population "pre-dc" And Their Uses Thereof
GINHOUX; Florent ; et al.
U.S. patent application number 16/610461 was filed with the patent office on 2021-04-08 for methods for the stimulation of dendritic cell (dc) precursor population "pre-dc" and their uses thereof. The applicant listed for this patent is AGENCY FOR SCIENCE, TECHNOLOGY AND RESEARCH. Invention is credited to Florent GINHOUX, Chi Ee Peter SEE.
| Application Number | 20210100897 16/610461 |
| Document ID | / |
| Family ID | 1000005312526 |
| Filed Date | 2021-04-08 |


View All Diagrams
| United States Patent Application | 20210100897 |
| Kind Code | A1 |
| GINHOUX; Florent ; et al. | April 8, 2021 |
METHODS FOR THE STIMULATION OF DENDRITIC CELL (DC) PRECURSOR POPULATION "PRE-DC" AND THEIR USES THEREOF
Abstract
The present invention relates to a method of treating or preventing an infection, a neoplastic disease or an immune-related disease in a subject in need thereof, the method comprising contacting a therapeutically effective or immuno-effective amount of an TLR9 agonist, specifically CpG oligodeoxynucleotide 2216 (CpG ODN), with a precursor dendritic cell (pre-DC), wherein the TLR9 agonist stimulates the pre-DC to secrete one or more cytokines such as TNF-alpha and IL-12p40, to thereby activate or increase the subject's immune response for treating or preventing the infection, the neoplastic disease or the immune-related disease. The present invention also relates to immunogenic or adjuvant compositions comprising the TLR9 agonist. A method of diagnosing a deficient immune system in a subject, comprising contacting a sample comprising pre-DC from the subject with one or more TLR 9 agonists and kits thereof are also disclosed.
| Inventors: | GINHOUX; Florent; (Singapore, SG) ; SEE; Chi Ee Peter; (Singapore, SG) | ||||||||||
| Applicant: |
|
||||||||||
|---|---|---|---|---|---|---|---|---|---|---|---|
| Family ID: | 1000005312526 | ||||||||||
| Appl. No.: | 16/610461 | ||||||||||
| Filed: | May 3, 2018 | ||||||||||
| PCT Filed: | May 3, 2018 | ||||||||||
| PCT NO: | PCT/SG2018/050219 | ||||||||||
| 371 Date: | November 1, 2019 |
| Current U.S. Class: | 1/1 |
| Current CPC Class: | A61K 35/15 20130101; A61K 39/39 20130101; A61K 2039/55561 20130101; C12N 5/0639 20130101; A61K 2039/5154 20130101; A61K 39/0005 20130101 |
| International Class: | A61K 39/39 20060101 A61K039/39; A61K 39/00 20060101 A61K039/00; A61K 35/15 20060101 A61K035/15; C12N 5/0784 20060101 C12N005/0784 |
Foreign Application Data
| Date | Code | Application Number |
|---|---|---|
| May 3, 2017 | SG | 10201703628W |
Claims
1.-43. (canceled)
44. A method of treating or preventing an infection, a neoplastic disease or an immune-related disease in a subject in need thereof, the method comprising contacting a therapeutically effective or immuno-effective amount of an TLR9 agonist with a precursor dendritic cell (pre-DC), wherein the TLR9 agonist stimulates the pre-DC to secrete one or more cytokines, to thereby activate or increase the subject's immune response for treating or preventing the infection, the neoplastic disease or the immune-related disease.
45. The method of claim 44, wherein the contacting is one or more of the following: (a) a contacting carried out in vitro, in vivo or ex vivo; and (b) a contacting including administering by a route selected from the group consisting of intramuscular, intradermal, subcutaneous, intravenous, oral, topical and intranasal administration.
46. The method of claim 44, wherein the pre-DC is one or more of the following: (a) a pre-DC that presents an antigen (or a fragment thereof) associated with the infection, the neoplastic disease or the immune related disease; (b) a pre-DC selected from the group consisting of early pre-DC, pre-conventional dendritic cells 1 (pre-cDC1), and pre-conventional dendritic cells 2 (pre-cDC2); and (c) a pre-DC comprising one or more markers selected from the group consisting of CD123, CD303, CD304, CD327, CD45RA, CD85j, CD5 and BTLA.
47. The method of claim 44, wherein the method comprises one or more of the following: (a) a method wherein the infection is selected from the group consisting of a bacterial infection and a viral infection; (b) a method wherein the immune-related disease is an inflammatory disease or an autoimmune disease; and (c) a method wherein the autoimmune disease is selected from the group consisting of systemic lupus erythematosus (SLE) and Sjogren's syndrome.
48. The method of claim 44, wherein the one or more TLR9 agonists is one or more of the following: (a) an oligodeoxynucleotide; (b) an oligodeoxynucleotide selected from the group consisting of CpG oligodeoxynucleotide (ODN) Class A, CpG ODN Class B and CpG ODN Class C; (c) a CpG ODN Class A which is CpG ODN 2216; and (d) a vaccine.
49. The method of claim 44, wherein the method comprises one or more of the following: (a) a method further comprising using an antigen delivery system that specifically targets pre-DC and committed pre-DC; (b) a method wherein the antigen delivery system comprises an antibody that specifically targets pre-DC and committed pre-DC; (c) a method wherein the one or more cytokine is selected from the group consisting of interferons, tumor necrosis factors, interleukins, and chemokines; (d) a method wherein the interferon is IFN-.alpha.; the tumor necrosis factor is TNF-.alpha.; and the interleukin is IL-12p40; and (e) a method wherein the subject is a human.
50. An immunogenic composition comprising one or more TLR9 agonists capable of stimulating pre-DC to secrete one or more cytokines.
51. The immunogenic composition of claim 50, further comprising one or more of the following: (a) an antigen (or a fragment thereof) associated with an infection, a neoplastic disease or an immune-related disease; (b) an antigen delivery system that specifically targets pre-DC and committed pre-DC; and (c) an adjuvant, a preservative, a stabilizer, an encapsulating agent (e.g. lipid membranes, chitosan particles, biocompatible polymers) and/or a pharmaceutically acceptable carrier.
52. The immunogenic composition of claim 51, wherein the antigen delivery system comprises an antibody that specifically targets pre-DC and committed pre-DC.
53. An adjuvant composition comprising a TLR9 agonist that is capable of stimulating pre-DC to secrete one or more cytokines for activating or increasing a subject's immune response to treat or prevent an infection, a neoplastic disease or an immune-related disease.
54. The adjuvant composition of claim 53, further comprising one or more of the following: (a) an antigen (or a fragment thereof) associated with an infection, a neoplastic disease or an immune-related disease; and (b) an antigen delivery system that specifically targets pre-DC and committed pre-DC.
55. The adjuvant composition of claim 54, wherein the antigen delivery system comprises an antibody that specifically targets pre-DC and committed pre-DC.
Description
TECHNICAL FIELD
[0001] The present invention generally relates to methods for stimulating pre-DC to increase the immune response for treating or preventing certain diseases in a subject in need thereof. The present invention also relates to molecules that are capable of effectively stimulating pre-DC to increase a subject's immune response, and molecules that are capable of being effective indicators of pre-DC stimulation and activation. The present invention further relates to an immunogenic composition for treating or preventing diseases or improving immunization by targeting pre-DC for an increased immune response.
BACKGROUND
[0002] Dendritic cells (DC) are professional pathogen-sensing and antigen-presenting cells that are central to the initiation and regulation of immune responses. The DC population is classified into two lineages: plasmacytoid DC (pDC), and conventional DC (cDC), the latter comprising cDC1 and cDC2 sub-populations.
[0003] Both pDC and cDC arise from DC restricted bone-marrow (BM) progenitors known as common DC progenitors (CDP). Along the differentiation pathway of CDP giving rise to cDC, from BM to peripheral blood, it is believed that there is an intermediate population of cells called the precursor of cDC (pre-DC). The pre-DC compartment contains distinct lineage committed sub-populations including one early uncommitted CD123.sup.high pre-DC subset and two CD45RA.sup.+CD123.sup.low lineage-committed subsets called pre-cDC1 and pre-cDC2, which exhibit functional differences. Pre-cDC1 and pre-cDC2 eventually differentiate into cDC1 and cDC2, respectively.
[0004] The heterogeneous DC population is capable of processing and presenting antigens to naive T cells to initiate antigen-specific immune responses. In many cases, increasing immune response to combat certain diseases is necessary to achieve desirable therapeutic effects. The conventional way of manipulating DC to increase immune responses in a subject includes stimulating various receptors expressed on the surface of DC. However, conventionally-defined pDC population is heterogeneous, incorporating an independent pre-DC sub-population. This makes it difficult to target specific populations of cells within the heterogeneous population to treat specific diseases. In addition, there is limited understanding of the pre-DC sub-population functions, especially the role of pre-DC in eliciting and increasing immune responses. Also, there has been no development of pre-DC specific therapeutic interventions, for example, in vaccines or treatment of diseases.
[0005] There is a need to provide means for stimulating pre-DC to increase the immune response for treating or preventing certain diseases in a subject in need thereof, that overcomes, or at least ameliorates, one or more of the disadvantages described above.
[0006] There is also a need to provide molecules which are capable of effectively stimulating pre-DC to activate or increase a subject's immune response, and molecules which are capable of being effective indicators of pre-DC stimulation and activation.
[0007] There is further a need to provide an immunogenic composition for treating or preventing diseases or improving immunization by targeting pre-DC for an increased immune response.
SUMMARY
[0008] According to a first aspect, there is provided a method of treating or preventing an infection, a neoplastic disease or an immune-related disease in a subject in need thereof, the method comprising contacting a therapeutically effective or immuno-effective amount of an TLR9 agonist with a precursor dendritic cell (pre-DC), wherein the TLR9 agonist stimulates the pre-DC to secrete one or more cytokines, to thereby activate or increase the subject's immune response for treating or preventing the infection, the neoplastic disease or the immune-related disease.
[0009] According to a second aspect, there is provided use of one or more TLR9 agonists in the manufacture of a medicament for treating or preventing an infection, a neoplastic disease or an immune-related disease in a subject in need thereof, wherein the TLR9 agonist stimulates pre-DC to secrete one or more cytokines to thereby activate or increase the subject's immune response for treating or preventing the infection, the neoplastic disease or the immune-related disease.
[0010] According to a third aspect, there is provided an immunogenic composition comprising one or more TLR9 agonists capable of stimulating pre-DC to secrete one or more cytokines.
[0011] According to a fourth aspect, there is provided an adjuvant composition comprising a TLR9 agonist that is capable of stimulating pre-DC to secrete one or more cytokines for increasing a subject's immune response to treat or prevent an infection, a neoplastic disease or an immune-related disease.
[0012] According to a fifth aspect, there is provided a method of diagnosing a deficient immune system in a subject, said method comprising:
(a) obtaining a sample comprising pre-DC from the subject; (b) contacting the sample with one or more TLR9 agonists; (c) detecting the presence or absence of one or more cytokines in the sample; and (d) diagnosing the subject as one having a deficient immune system when the one or more cytokines in the sample is absent (or not detected) or is present in a lower level when compared to a control sample.
[0013] According to a sixth aspect, there is provided a method of eliciting an immune response against an infection, a neoplastic disease or an immune-related disease in a subject in need thereof, the method comprising contacting an immuno-effective amount of an TLR9 agonist with pre-DC, wherein the TLR9 agonist stimulates the pre-DC to secrete one or more cytokines, to thereby elicit an immune response against the infection, the neoplastic disease or the immune-related disease.
[0014] According to a seventh aspect, there is provided a kit for diagnosing a deficient immune system in a subject according to the method as described herein.
Definition of Terms
[0015] The following words and terms used herein shall have the meaning indicated:
[0016] The term "marker" refers to any biological compound, such as a protein and a fragment thereof, a peptide, a polypeptide, or other biological material whose presence, absence, level or activity is correlative of or predictive of a characteristic such as a cell type. Such specific markers may be detectable by using methods known in the art, such as but are not limited to, flow cytometry, fluorescent microscopy, immunoblotting, RNA sequencing, gene arrays, mass spectrometry, mass cytometry (Cy TOF) and PCR methods. A marker may be recognized, for example, by an antibody (or an antigen-binding fragment thereof) or other specific binding protein(s). Reference to a marker may also include its isoforms, preforms, mature forms, variants, degraded forms thereof (such as fragments thereof), and metabolites thereof.
[0017] The term "treatment" and variations of that term includes any and all uses which remedy a disease state or symptoms, prevent the establishment of disease, or otherwise prevent, hinder, retard, or reverse the progression of disease or other undesirable symptoms in any way whatsoever. Hence, "treatment" includes prophylactic and therapeutic treatment.
[0018] The term "preventing" a disease refers to inhibiting completely or in part the development or progression of a disease (such as an immune-related disease) or an infection (such as an infection by a virus or bacteria). Vaccination is a common medical approach to prevent diseases where upon vaccination, immunization is initiated such that the body's own immune system is stimulated to protect the subject from infection or disease, or from subsequent infection or disease. Immunization may, for example, enable a continuing high level of antibody and/or cellular response in which T-lymphocytes can kill or suppress the pathogen in the immunized subject. The pathogen may be one which the subject has been previously exposed to.
[0019] The term "subject" refers to patients of human or other mammals, and includes any individual it is desired to be treated using the immunogenic compositions and methods of the disclosure. However, it will be understood that "subject" does not imply that symptoms are present. Suitable mammals that fall within the scope of the disclosure include, but are not restricted to, primates, livestock animals (e.g. sheep, cows, horses, donkeys, pigs), laboratory test animals (e.g. rabbits, mice, rats, guinea pigs, hamsters), companion animals (e.g. cats, dogs) and captive wild animals (e.g. foxes, deer, dingoes).
[0020] The term "contacting" and variations of that term including "contact", refers to incubating or otherwise exposing a compound or composition of the disclosure to cells (such as the pre-DC cells) of an organism (such as a subject as described herein). The contacting may occur in vitro, in vivo or ex vivo. The term "contacting" may also refer to administration of a compound or composition of the disclosure to an organism (such as a subject as described herein) by any appropriate means as described below.
[0021] The term "in vitro" as used herein refers to conducting a process or procedure outside a living organism, such as in a test tube, a culture vessel or a plate, or elsewhere outside the living organism.
[0022] The term "in vivo" as used herein refers to a process or procedure which is being performed in a subject.
[0023] The term "ex vivo" as used herein refers to a process or procedure conducted on live isolated cells outside a subject, and then returned to the living subject. For example, pre-DC may be extracted from a subject, contacted with a TLR9 agonist (for example, in a test tube, a culture vessel or a plate), and then returned to the subject to induce an immune response.
[0024] The term "administering" and variations of that term including "administer" and "administration", includes contacting, applying, delivering or providing a compound or composition of the disclosure to an organism (such as a subject as described herein), or a surface by any appropriate means.
[0025] The term "immunogenic composition" as used herein refers to a composition which is capable of stimulating the immune system of a subject to produce an immune response. An immunogenic composition may comprise, for example, a specific type of antigen against which an immune response is desired to be elicited.
[0026] "Immune response" refers to conditions associated with, or caused by, inflammation, trauma, immune disorders, or infectious or genetic disease, and can be characterized by expression of various factors, e.g., cytokines, chemokines, and other signaling molecules, which may affect cellular and systemic defense systems.
[0027] The term "agonist", when used in reference to TLR9, refers to a molecule which intensifies or mimics the biological activity of TLR9. Agonists may include proteins, nucleic acids, carbohydrates, small molecules, or any other compounds or compositions which modulate the activity of TLR9, either by directly interacting with TLR9 or by acting as components of the biological pathways in which TLR9 participates.
[0028] The term "antigen" refers to a molecule or a portion (such as a fragment) of a molecule capable of being recognized by antigen-binding molecules of the immune system, and inducing an immune response in the subject. Sources of antigen may be, but are not limited to, toxins, pollen, bacteria (or parts thereof), viruses (or parts thereof) or other microorganisms (or parts thereof). Parts of bacteria, viruses or other microorganisms which may act as antigens may be, but are not limited to, coats, capsules, cell walls, flagella, and fimbriae. If an antigen causes a specific disease (such as a disease caused by the host bacteria, virus or other microorganism which is the source of the antigen), then the antigen may be said to be associated with the disease.
[0029] Unless specified otherwise, the terms "comprising" and "comprise", and grammatical variants thereof, are intended to represent "open" or "inclusive" language such that they include recited elements but also permit inclusion of additional, unrecited elements.
[0030] Throughout this disclosure, certain examples may be disclosed in a range format. It should be understood that the description in range format is merely for convenience and brevity and should not be construed as an inflexible limitation on the scope of the disclosed ranges. Accordingly, the description of a range should be considered to have specifically disclosed all the possible sub-ranges as well as individual numerical values within that range. For example, description of a range such as from 1 to 6 should be considered to have specifically disclosed sub-ranges such as from 1 to 3, from 1 to 4, from 1 to 5, from 2 to 4, from 2 to 6, from 3 to 6 etc., as well as individual numbers within that range, for example, 1, 2, 3, 4, 5, and 6. This applies regardless of the breadth of the range.
[0031] Certain examples may also be described broadly and generically herein. Each of the narrower species and subgeneric groupings falling within the generic disclosure also form part of the disclosure. This includes the generic description of the examples with a proviso or negative limitation removing any subject matter from the genus, regardless of whether or not the excised material is specifically recited herein.
DETAILED DISCLOSURE OF THE EMBODIMENT
[0032] According to a first aspect, there is provided a method of treating or preventing an infection, a neoplastic disease or an immune-related disease in a subject in need thereof, the method comprising contacting a therapeutically effective or immuno-effective amount of an TLR9 agonist with a precursor dendritic cell (pre-DC), wherein the TLR9 agonist stimulates the pre-DC to secrete one or more cytokines, to thereby activate or increase the subject's immune response for treating or preventing the infection, the neoplastic disease or the immune-related disease. In one example, the pre-DC presents an antigen (or a fragment thereof) associated with the infection, the neoplastic disease or the immune-related disease in the subject. In another example, the pre-DC does not present any antigen. In one example, pre-DC were found to produce significantly more of the cytokines TNF-.alpha. and IL-12p40 when exposed to CpG ODN 2216 (also referred to as CpG, a TLR9 agonist), than either LPS (a TLR4 agonist) or polyI:C (TLR3 agonist)(see FIG. 5C). Cytokines such as TNF-.alpha. are known to exert a variety of effects on the immune response of a host such as in controlling infection and to modulate macrophage activity to control disease pathology. TNF-.alpha. has also been previously shown to exert a variety of effects in controlling infection. IL-12p40, another cytokine, is known to have protective function during infections. Thus, the contacting of TLR9 agonist with pre-DC enables a subject's immune response to be stimulated through the release of TNF-.alpha. and IL-12p40 cytokines to a therapeutically effective or immune-effective level for treating and preventing infections, neoplastic diseases or immune-related diseases.
[0033] Dendritic cells, such as pre-DC, are involved in the initiation of immune response to bacterial and viral infections. Upon infection by a pathogenic bacteria or virus, dendritic cells, such as pre-DC, will take up the bacterial or viral antigens in the peripheral tissues, process the antigens into proteolytic peptides, and load these peptides onto major histocompatibility complex (MHC) class I and II molecules. The dendritic cells, such as pre-DC, then become competent to present antigens to T lymphocytes, thus initiating antigen-specific immune responses. During this immune response, the TLR-9 agonist functions to specifically stimulate pre-DC to release cytokines to activate and/or enhance the immune response against the antigens.
[0034] Exemplary diseases in which the method as disclosed herein may be useful include but are not limited to bacterial infections, and viral infections, or the like. Examples of viruses which may cause viral infections are DNA viruses, and RNA viruses. Examples of DNA viruses are herpes simplex virus (HSV-1), cytomegalovirus (CMV), adenovirus, poxvirus, hepatitis B virus (HBV), or the like. Examples of RNA viruses are human immunodeficiency virus (HIV), hepatitis A virus (HAV), hepatitis C virus (HCV), respiratory syncytial virus (RSV), influenza, Zika virus, or the like.
[0035] In one example, the immune-related disease is an inflammatory disease. In another example, the immune-related disease is an autoimmune disease. Immune-related diseases may be caused by dysfunction or abnormality in the immune response. The dysfunction or abnormality in the immune response may be caused by genetic mutations, reaction to a drug, radiation therapy, or other chronic and/or serious disorders (such as cancer or diabetes).
[0036] In one example, the autoimmune disease is selected from the group consisting of systemic lupus erythematosus (SLE) and Sjogren's syndrome.
[0037] Exemplary TLR9 agonists which may be useful for stimulating the pre-DC cells include but is not limited to an oligodeoxynucleotides (ODN), or a biological or functional variant thereof.
[0038] Exemplary CpG oligodeoxynucleotides include CpG ODN Class A, CpG ODN Class B and CpG ODN Class C. In one example, the CpG oligodeoxynucleotide is CpG ODN 2216, or a biological or a functional variant thereof.
[0039] The biological variant of a CpG ODN is expected to display substantially the same biological activity as the CpG ODN 2216 of which it is a variant. For example, the biological variant of CpG ODN 2216 is expected to display substantially the same biological activity as CpG ODN 2216 as an agonist of TLR9. Alternatively, the TLR9 agonist may be a functional variant of a CpG ODN. A functional variant typically has substantial or significant sequence identity or similarity to the CpG ODN of which it is a variant, such as at least 80% (e.g. 80%, 85%, 90%, 91%, 92%, 93%, 94%, 95%, 96%, 97%, 98%, or 99%) identity to the CpG ODN sequence of which it is a variant, and retains the same activity as the CpG ODN.
[0040] The TLR9 agonist (or a composition thereof) may be contacted with a pre-DC or administered in a therapeutically effective amount or an immune-effective amount. A therapeutically effective amount includes a sufficient but non-toxic amount of a TLR9 agonist (or a composition thereof) to provide the desired therapeutic effect. An immune-effective amount includes a sufficient but non-toxic amount of a TLR9 agonist (or a composition thereof) to provide the desired immunoprotective effect. The exact amount required will vary from subject to subject depending on factors such as the species being treated, the age and general condition of the subject, the severity of the condition being treated, the particular agent or composition being contacted or administered, the mode of contact or administration, and so forth. Thus, it is not possible to specify an exact "effective amount". However, for any given case, an appropriate "effective amount" may be determined by one of ordinary skill in the art using only routine experimentation. For example, an effective amount to result in therapeutic or immunoprotective amount may be an amount sufficient to result in the improvement of the pathological symptoms of a target disease or an amount sufficient to result in protection against a target infectious disease. Generally, an effective dosage may be in the range of about 100 ng/kg to about 100 mg/kg, about 100 ng/kg to about 90 mg/kg, about 100 ng/kg to about 80 mg/kg, about 100 ng/kg to about 70 mg/kg, about 100 ng/kg to about 60 mg/kg, about 100 ng/kg to about 50 mg/kg, about 100 ng/kg to about 40 mg/kg, about 100 ng/kg to about 30 mg/kg, about 100 ng/kg to about 20 mg/kg, about 100 ng/kg to about 10 mg/kg, about 90 ng/kg to about 100 mg/kg, about 80 ng/kg to about 100 mg/kg, about 70 ng/kg to about 100 mg/kg, about 60 ng/kg to about 100 mg/kg, about 50 ng/kg to about 100 mg/kg, about 40 ng/kg to about 100 mg/kg, about 30 ng/kg to about 100 mg/kg, or about 20 ng/kg to about 100 mg/kg, and includes any subranges therein, as well as individual numbers within the ranges and subranges.
[0041] Exemplary cytokines which may be produced by pre-DC upon stimulation with a TLR9 agonist include but are not limited to tumor necrosis factors, interleukins, interferons, and chemokines, or the like.
[0042] In one example, the tumor necrosis factor that is produced by pre-DC upon stimulation with a TLR9 agonist is TNF-.alpha.. In one example, CpG ODN 2216 was shown to stimulate pre-DC to produce high levels of cytokine, specifically TNF-.alpha. (see FIG. 5C).
[0043] In another example, the interleukin that is produced by pre-DC upon stimulation with a TLR9 agonist is IL-12p40. In one example, IL-12p40 was shown to be readily secreted by pre-DC when stimulated with TLR9 agonists (see FIG. 2G).
[0044] In yet another example, the interferon that is produced by pre-DC upon stimulation with a TLR9 agonist is IFN-.alpha..
[0045] Pre-DC is a subset of CD33.sup.+CD45RA.sup.+CD123.sup.+ cell which gives rise to cDC subsets (FIG. 2A, and FIG. 10A). Pre-DC cells also express CX3CR1, CD2, CD303 and CD304, with low CD11c expression (FIGS. 2, A and B, and FIGS. 10, B and C). The pre-DC may be identified based on the expression of pre-DC-specific marker genes such as those listed in FIG. 27 and FIG. 28. For example, the pre-DC may be isolated based on the specific marker genes through conventional gating strategy such as, but not limited to those, described in FIGS. 10A, 11, 12A-C, 14, 15, 18 and 19.
[0046] In another example, the pre-DC comprises one or more markers selected from the group consisting of CD123, CD303, CD304, CD327, CD45RA, CD85j, CD5 and BTLA. The expression of the markers may be determined based on the gene expression or protein expression levels using methods known in the art, such as but are not limited to, flow cytometry, fluorescent microscopy, immunoblotting, RNA sequencing, gene arrays, mass spectrometry, mass cytometry (Cy TOF) and PCR methods.
[0047] Early pre-DC can differentiate to both cDC subsets, and committed pre-DCs such as pre-conventional dendritic cells 1 (pre-cDC1) and pre-conventional dendritic cells 2 (pre-cDC2) differentiate exclusively into cDC1 and cDC2 subsets, respectively (FIG. 3H, FIG. 18D, and FIG. 19).
[0048] Therefore, in one example, the pre-DC is selected from the group consisting of early pre-DC, pre-conventional dendritic cells 1 (pre-cDC1), and pre-conventional dendritic cells 2 (pre-cDC2).
[0049] In one example, the subject is a human. The subject may be one suffering from any of the diseases disclosed herein and is in need of treatment. The subject may also be a human at risk of any of the bacterial or viral infections disclosed herein, such as subjects living in (or in close proximity to areas) with a bacterial or viral outbreak who may require vaccination against these infections. The human subjects can be either adults or children. In another example, the subject is a human suffering from any of the immune-related disease disclosed herein. In yet another example, the subject is a human with a deficient immune system. The methods of the disclosure can also be used on other subjects at risk of any of the bacterial or viral infections disclosed herein or suffering from any of the diseases disclosed herein such as, but not limited to, non-human primates, livestock animals (eg. sheep, cows, horses, donkeys, pigs), laboratory test animals (eg. rabbits, mice, rats, guinea pigs, hamsters), companion animals (eg. cats, dogs) and captive wild animals (eg. foxes, deer, dingoes).
[0050] The TLR9 agonist may be administered to the subject by any route suitable for administration of such compounds, such as, intramuscular, intradermal, subcutaneous, intravenous, oral, and intranasal administration. Thus, the TLR9 agonist of the disclosure may be in a formulation suitable for parenteral administration (that is, subcutaneous, intramuscular or intravenous injection), in the form of a formulation suitable for oral ingestion (such as capsules, tablets, caplets, elixirs, for example), or in an aerosol form suitable for administration by inhalation (such as by intranasal inhalation or oral inhalation).
[0051] For administration as an injectable solution or suspension, non-toxic parenterally acceptable diluents or carriers can include Ringer's solution, isotonic saline, phosphate buffered saline, ethanol and 1,2 propylene glycol.
[0052] For oral administration, suitable carriers, diluents, excipients and adjuvants include peanut oil, liquid paraffin, sodium carboxymethylcellulose, methylcellulose, sodium alginate, gum acacia, gum tragacanth, dextrose, sucrose, sorbitol, mannitol, gelatine and lecithin. In addition these oral formulations may contain suitable flavouring and colourings agents. When used in capsule form the capsules may be coated with compounds such as glyceryl monostearate or glyceryl distearate which delay disintegration.
[0053] Solid forms for oral administration may contain binders acceptable in human and veterinary pharmaceutical practice, sweeteners, disintegrating agents, diluents, flavourings, coating agents, preservatives, lubricants and/or time delay agents. Suitable binders include gum acacia, gelatine, corn starch, gum tragacanth, sodium alginate, carboxymethylcellulose or polyethylene glycol. Suitable sweeteners include sucrose, lactose, glucose, aspartame or saccharine. Suitable disintegrating agents include corn starch, methylcellulose, polyvinylpyrrolidone, guar gum, xanthan gum, bentonite, alginic acid or agar. Suitable diluents include lactose, sorbitol, mannitol, dextrose, kaolin, cellulose, calcium carbonate, calcium silicate or dicalcium phosphate. Suitable flavouring agents include peppermint oil, oil of wintergreen, cherry, orange or raspberry flavouring. Suitable coating agents include polymers or copolymers of acrylic acid and/or methacrylic acid and/or their esters, waxes, fatty alcohols, zein, shellac or gluten. Suitable preservatives include sodium benzoate, vitamin E, alpha-tocopherol, ascorbic acid, methyl paraben, propyl paraben or sodium bisulphite. Suitable lubricants include magnesium stearate, stearic acid, sodium oleate, sodium chloride or talc. Suitable time delay agents include glyceryl monostearate or glyceryl distearate.
[0054] Liquid forms for oral administration may contain, in addition to the above agents, a liquid carrier. Suitable liquid carriers include water, oils such as olive oil, peanut oil, sesame oil, sunflower oil, safflower oil, arachis oil, coconut oil, liquid paraffin, ethylene glycol, propylene glycol, polyethylene glycol, ethanol, propanol, isopropanol, glycerol, fatty alcohols, triglycerides or mixtures thereof.
[0055] Suspensions for oral administration may further comprise dispersing agents and/or suspending agents. Suitable suspending agents include sodium carboxymethylcellulose, methylcellulose, hydroxypropylmethyl-cellulose, poly-vinyl-pyrrolidone, sodium alginate or acetyl alcohol. Suitable dispersing agents include lecithin, polyoxyethylene esters of fatty acids such as stearic acid, polyoxyethylene sorbitol mono- or di-oleate, -stearate or -laurate, polyoxyethylene sorbitan mono- or di-oleate, -stearate or -laurate and the like.
[0056] The emulsions for oral administration may further comprise one or more emulsifying agents. Suitable emulsifying agents include dispersing agents as exemplified above or natural gums such as guar gum, gum acacia or gum tragacanth.
[0057] Drops for oral administration according to the present disclosure may comprise sterile aqueous or oily solutions or suspensions. These may be prepared by dissolving the immunogenic agent in an aqueous solution of a bactericidal and/or fungicidal agent and/or any other suitable preservative, and optionally including a surface active agent. The resulting solution may then be clarified by filtration, transferred to a suitable container and sterilised. Sterilisation may be achieved by: autoclaving or maintaining at 90.degree. C.-100.degree. C. for half an hour, or by filtration, followed by transfer to a container by an aseptic technique. Examples of bactericidal and fungicidal agents suitable for inclusion in the drops are phenylmercuric nitrate or acetate (0.002%), benzalkonium chloride (0.01%) and chlorhexidine acetate (0.01%). Suitable solvents for the preparation of an oily solution include glycerol, diluted alcohol and propylene glycol.
[0058] Upon contact with the TLR9 agonist (or a composition comprising the TLR9 agonists described above) with pre-DC, the subject's immune response may be stimulated through the release of cytokines (such as, but not limited to, TNF-.alpha. and IL-12p40) to a therapeutically effective or immune-effective level for treating and preventing infections, neoplastic diseases or immune-related diseases.
[0059] According to a second aspect, there is provided use of one or more TLR9 agonists in the manufacture of a medicament for treating or preventing an infection, a neoplastic disease or an immune-related disease in a subject in need thereof, wherein the TLR9 agonist stimulates pre-DC that present an antigen (or a fragment thereof) associated with the infection or immune-related disease in the subject to secrete one or more cytokines to thereby increase the subject's immune response for treating or preventing the infection, the neoplastic disease or the immune-related disease.
[0060] In one example, the medicament is a vaccine for preventing an infection, a neoplastic disease or an immune-related disease in a subject in need thereof.
[0061] According to a third aspect, there is provided an immunogenic composition comprising: (a) an antigen (or a fragment thereof) associated with an infection, a neoplastic disease or an immune-related disease, and (b) one or more TLR9 agonists capable of stimulating pre-DC that present the antigen (or a fragment thereof) to secrete one or more cytokines.
[0062] As described herein, an immunogenic composition is a composition which is capable of stimulating the immune system of a subject to produce an immune response against an antigen. Sources of antigen may be, but are not limited to, toxins, pollen, bacteria (or parts thereof), viruses (or parts thereof) or other microorganisms (or parts thereof). Parts of bacteria, viruses or other microorganisms which may act as antigens may be, but are not limited to, coats, capsules, cell walls, flagella, and fimbriae.
[0063] In one example, the immunogenic composition is a vaccine.
[0064] In general, suitable immunogenic compositions may be prepared according to methods which are known to those of ordinary skill in the art and accordingly may include a pharmaceutically acceptable carrier, diluent and/or adjuvant. The carriers, diluents and adjuvants must be "acceptable" in terms of being compatible with the other ingredients of the composition, and not deleterious to the recipient thereof.
[0065] One skilled in the art would be able, by routine experimentation, to determine an effective and safe amount of the immunogenic composition for contact or administration to achieve the desired immunogenic response.
[0066] Generally, an effective dosage to achieve the desired immunogenic response is expected to be in the range of about 0.0001 mg to about 1000 mg per kg body weight per 24 hours; typically, about 0.001 mg to about 750 mg per kg body weight per 24 hours; about 0.0 1 mg to about 500 mg per kg body weight per 24 hours; about 0.1 mg to about 500 mg per kg body weight per 24 hours; about 0.1 mg to about 250 mg per kg body weight per 24 hours; about 1.0 mg to about 250 mg per kg body weight per 24 hours. More typically, an effective dose range is expected to be in the range about 1.0 mg to about 200 mg per kg body weight per 24 hours; about 1.0 mg to about 100 mg per kg body weight per 24 hours; about 1.0 mg to about 50 mg per kg body weight per 24 hours; about 1.0 mg to about 25 mg per kg body weight per 24 hours; about 5.0 mg to about 50 mg per kg body weight per 24 hours; about 5.0 mg to about 20 mg per kg body weight per 24 hours; about 5.0 mg to about 15 mg per kg body weight per 24 hours.
[0067] Alternatively, an effective dosage to achieve the desired immunogenic response may be up to about 500 mg/m.sup.2. Generally, an effective dosage is expected to be in the range of about 25 to about 500 mg/m.sup.2, preferably about 25 to about 350 mg/m.sup.2, more preferably about 25 to about 300 mg/m.sup.2, still more preferably about 25 to about 250 mg/m.sup.2, even more preferably about 50 to about 250 mg/m.sup.2, and still even more preferably about 75 to about 150 mg/m.sup.2.
[0068] According to a fourth aspect, there is provided an adjuvant composition comprising a TLR9 agonist that is capable of stimulating pre-DC that present an antigen (or a fragment thereof) associated with an infection, a neoplastic disease or an immune-related disease in a subject to secrete one or more cytokines for increasing the subject's immune response to treat or prevent the infection, the neoplastic disease or the immune-related disease.
[0069] As an adjuvant composition, the adjuvant composition comprising a TLR9 agonist is capable of increasing the effectiveness of a composition for stimulating immune response, for example through stimulation of cytokines release from pre-DC.
[0070] As described herein, in one example, the subject who may benefit from the methods or compositions of the disclosure is one who has a deficient immune system. A subject with deficient immune system may be one who is unable to activate the immune response, or one whose immune system is partially activated (for example, activated to only a certain extent, such as in the range of about 10% to about 90%, about 10% to about 80%, about 10% to about 70%, about 10% to about 60%, about 10% to about 50%, about 10% to about 40%, about 10% to about 30%, about 10% to about 20%, and includes any subranges therein, as well as individual numbers within the ranges and subranges, compared to a subject without a deficient immune system). Such a condition may be due to abnormal pre-DC cells which are unable to produce cytokines, resulting in a deficient level of cytokines required for activation of the immune response. For example, while a normal pre-DC is able to secrete cytokines, such as TNF-.alpha. and IL-12p40, when stimulated, a subject with abnormal pre-DC may secrete lower levels of cytokines (or no cytokines) compared to a healthy subject.
[0071] Therefore, according to a fifth aspect, there is provided a method of diagnosing a deficient immune system in a subject, said method comprising:
(a) obtaining a sample comprising pre-DC from the subject; (b) contacting the sample with one or more TLR9 agonists; (c) detecting the presence or absence of one or more cytokines in the sample; and (d) diagnosing the subject as one having a deficient immune system when the one or more cytokines in the sample is absent (or not detected) or is present in a lower level when compared to a control sample.
[0072] Samples suitable for use in the methods described herein include tissue culture, blood, apheresis residue, tissue (from various organs, such as spleen, kidney, etc.), peripheral blood mononuclear cells or bone marrow. The samples may be obtained by methods, such as but not limited to, surgery, aspiration or phlebotomy. The samples may be untreated, treated, diluted or concentrated from the subject.
[0073] The contacting of the samples with one or more TLR9 may be conducted in vitro, in vivo or ex vivo.
[0074] The cytokines may be detected using methods known in the art, such as but are not limited to, labelling with cytokine-specific antibodies followed by flow cytometry analysis, ELISA, or other commercially available cytokine detection assay kits (such as the Luminex assay kits).
[0075] In the context of detecting cytokine, such as a TNF-.alpha. and IL-12p40, the term "absence" (or grammatical variants thereof) can refer to when cytokine cannot be detected using a particular detection methodology. For example, cytokine may be considered to be absent in a sample if the sample is free of cytokine, such as, 95% free, 96% free, 97% free, 98% free, 99% free, 99.9% free, or 100% free of cytokine, or is undetectable as measured by the detection methodology used. Alternatively, if the level of cytokine (such as TNF-.alpha. and IL-12p40) is below a previously determined cut-off level, the cytokine may also be considered to be "absent" from the sample.
[0076] In the context of detecting cytokine, such as a TNF-.alpha. and IL-12p40, the term "presence" can refer to when a cytokine can be detected using a particular detection methodology. For example, if the level of cytokine (such as TNF-.alpha. and IL-12p40) is above a previously determined threshold level, the cytokine may be considered to be "present" in the sample.
[0077] A control sample that may be used in the methods disclosed herein includes, but is not limited to, a sample which is not contacted with one or more TLR9 agonist or a sample from a healthy subject (for example, a subject whose immune system is not deficient) which has been contacted with one or more TLR9 agonist.
[0078] In one example, the method further comprises treating the subject diagnosed with a deficient immune system by administering a composition described herein, to thereby increase the subject's immune response.
[0079] According to a sixth aspect, there is provided a method of eliciting an immune response against an infection, a neoplastic disease or an immune-related disease in a subject in need thereof, the method comprising contacting an immuno-effective amount of an TLR9 agonist with a pre-DC, wherein the TLR9 agonist stimulates precursor dendritic cells (pre-DC) that present an antigen (or a fragment thereof) associated with the infection, the neoplastic disease or the immune-related disease in the subject to secrete one or more cytokines, to thereby elicit an immune response against the infection, the neoplastic disease or the immune-related disease.
[0080] The immune response may be considered "elicited" when the humoral and/or cell-mediated immune responses are triggered, resulting in protection of the subject from subsequent infections, removal of pathogenic bacteria, virus or microorganisms, and/or inhibition of the development or progression of a disease or infection by a virus or bacteria.
[0081] According to a seventh aspect, there is provided a kit for diagnosing a deficient immune system in a subject according to the method as described herein. Other components of a kit may include, but are not limited to, one or more of the TLR9 agonist described above, one or more cytokine-specific antibodies, one or more buffers, and one or more diluents.
BRIEF DESCRIPTION OF THE DRAWINGS
[0082] The invention will be better understood with reference to the detailed description when considered in conjunction with the non-limiting examples and the accompanying drawings, in which:
[0083] FIG. 1. MARS-seq and CyTOF identify rare CD123.sup.+CD33.sup.+ putative DC precursors (pre-DC). (A-E) Lin(CD3/CD14/CD16/CD20/CD34).sup.-HLA-DR.sup.+CD135.sup.+ sorted PBMC were subjected to MARS-seq. (A) shows a t-stochastic neighbor embedding (tSNE) plot of 710 cells fulfilling all quality criteria, displayed by clusters identified by tSNE plus Seurat clustering, or by the relative signature score for pDC, cDC1 and cDC2. (B) illustrates a connectivity MAP (cMAP) analysis showing the degree of enrichment for pDC or cDC signature genes in the tSNE/Seurat clusters. (C) shows Mpath analysis applied to the tSNE/Seurat clusters defining their developmental relationship. Representations of the 710 cells by (D) Monocle, (E) Principal component analysis (PCA) and (F) Diffusion Map, highlighting the tSNE/Seurat clusters identified in (A). (G) shows violin plots of tSNE/Seurat pDC clusters, cluster #4 and cDC clusters showing the expression of pDC and cDC signature genes with differential expression between cluster #4 and pDC clusters. Adjusted P-values were calculated by Kruskal-Wallis test followed by Dunn's multiple comparisons procedure. (H, I) provide tSNE plots of CyTOF data from CD45.sup.+Lin(CD7/CD14/CD15/CD16/CD19/CD34).sup.-HLA-DR.sup.+PBMC, showing in (H) gates defining the CD123.sup.+CD33.sup.+ cells and DC subsets, and in (I) relative expression of selected markers. In (J), subsets defined in (H) were overlaid onto 2D-contour plots for phenotypic comparison. The gating strategy prior to MARS-seq is shown in FIG. 7A.
[0084] FIG. 2. Characterization of human pre-DC. (A) shows flow cytometric identification of pre-DC and pDC within PBMC and spleen cell suspensions. (B) shows expression of CD303/CD304/CD123/CD11c by blood pre-DC and DC subsets. (C) shows % pre-DC within spleen (n=3) and PBMC (n=6) CD45.sup.+ populations. (D) shows Wright-Giemsa staining of sorted blood pre-DC and DC subsets. (E) shows electron micrographs of pre-DC and pDC (RER (arrowheads), centriole (C) and microtubules (small arrows), near RER cisterna are indicated). (F) shows DC subsets or pre-DC co-cultured for 5 days with MS-5 feeder-cells, FLT3L, GM-CSF and SCF. Their capacity to differentiate into cDC1 or cDC2 was measured by flow cytometry. (n=3) (G) shows intracellular detection of cytokines in DC subsets and pre-DC post-TLR stimulation. IFN-.alpha. and IL-12p40 production by pDC and pre-DC, alongside mean % cytokine-positive pre-DC and DC subsets exposed to LPS, LPS+IFN.gamma. (L+I), polyI:C (pI:C), CL097 (CL) or CpG-ODN2216 (CpG) (n=4) are shown. (H) shows the proliferation of naive CD4.sup.+ T cells cultured for 6 days with allogeneic pDC, total CD123.sup.+HLA-DR.sup.+ cells or pre-DC (n=2). (I) shows frequency of pDC and pre-DC from control subjects (Ctrl, n=11) and Pitt-Hopkins Syndrome (PHS) patients (n=4). P-values were calculated by Mann-Whitney test. Error bars represent mean+/-SEM.
[0085] FIG. 3. Identification of committed human pre-DC subsets. (A-B) shows single-cell mRNA sequencing (scmRNAseq) of 92 Lin(CD3/14/16/19/20).sup.-HLA-DR.sup.+CD33.sup.+CD123.sup.+ cells (sort gating strategy shown in FIG. 14A). (A) shows the connectivity MAP (cMAP) enrichment score of cells (cDC1- vs cDC2-specific signatures). (B) shows the Mpath analysis showing the developmental relationship between "unprimed", cDC1-primed or cDC2-primed cells defined in (A). (C) shows Lin.sup.-HLA-DR.sup.+CD33.sup.+PBMC analyzed by flow cytometry and visualized as 3D-PCA of three cell clusters (pre-DC, cDC1 and cDC2) and the relative expression of CADM1, CD1c and CD123. (D) shows relative expression of CD45RA, BTLA, CD327, CD141 and CD5 in the same 3D-PCA plot. The dashed black circles indicate the intermediate CD45RA.sup.+ population. (E) shows CD45RA/CD123 dot plots showing overlaid cell subsets defined in the 3D-PCA plot (left panel) with the relative expression of BTLA, CD327, CD141 and CD5. (F) shows overlay of the Wanderlust dimension (progression from early (dark) to late (clear) events is shown) onto the 3D-PCA and CD45RA/CD123 dot plots. (G) illustrates the gating strategy starting from live CD45.sup.+Lin(CD3/14/16/19/20).sup.-CD34.sup.-HLA-DR.sup.+PBMC to define pre-DC subsets among CD33.sup.+CD45RA.sup.+cDC. (H) shows pre-DC subsets co-cultured for 5 days with MS-5 feeder-cells, FLT3L, GM-CSF and SCF (n=3). Their capacity to differentiate into Clec9A.sup.+CADM1.sup.+cDC1 (middle panel), or CD1c.sup.+CD11c.sup.+cDC2 (right panel) was analyzed by flow cytometry. (I) shows scanning electron microscopy of pre-DC and DC subsets (scale bar: 1 .mu.m).
[0086] FIG. 4. DC and pre-DC subset gene expression analysis. (A) shows microarray data from sorted DC and pre-DC subsets (shown in FIG. 3) were analyzed by 3D PCA using differentially-expressed genes (DEG). For each PCA dimension (principal component, PC), the variance explained by each component is indicated. (B-D) show heat maps of DEG between (B) early pre-DC/pDC, (C) early pre-DC/pre-cDC1/cDC1 and (D) early pre-DC/pre-cDC2/cDC2. (E) shows expression profiles of 62 common genes identified from DEG analysis comparisons along the lineage progression from early pre-DC to mature cDC, for cDC1 and cDC2 respectively. The profiles were plotted with the log 2 fold-change values (versus early pre-DC). (F) shows expression level of CD327 (SIGLEC6), CD22 and AXL proteins by DC and pre-DC subsets evaluated by flow cytometry. The mean fluorescence intensities are indicated. (G) shows expression profiles of selected transcription factors.
[0087] FIG. 5. Functional analysis of DC and pre-DC subsets. (A) shows frequency of cytokine production by pre-DC and DC subsets upon TLR stimulation measured by intracellular flow cytometry. Dot plots (left panel) show IFN.alpha., IL-12p40 and TNF-.alpha. production by pDC, early pre-DC, pre-cDC2, cDC2, pre-cDC1 and cDC1. Bar charts (right panel) show the mean relative numbers of pre-DC and DC subset cells producing IFN-.alpha., IL-12p40 or TNF-.alpha. in response to LPS, LPS+IFN.gamma. (L+I), CL097 (CL) or CpG ODN2216 (CpG) (n=4). (B) shows expression level (represented as mean fluorescence intensity (MHO) of costimulatory molecules (CD40, CD80, CD83, CD86) by blood pre-DC and DC subsets (n=4). (C) shows proliferation of naive CD4.sup.+ T cells after 6 days of culture with allogenic pre-DC and DC subsets (n=3). P-values were calculated by Mann-Whitney test. Error bars represent mean+1/-SEM.
[0088] FIG. 6. Unsupervised mapping of DC ontogeny using CyTOF. CyTOF data from bone marrow (BM) and PBMC were analyzed using isoMAP dimensionality reduction to compare overall phenotypic relatedness of cell populations, and were automatically subdivided into clusters using the phenograph algorithm. (A, B) show IsoMAP1-2 plots showing the expression level of common DC progenitor (CDP), pDC, pre-DC and cDC specific markers within (A) BM and (B) blood Lin(CD3/CD7/CD14/CD15/CD19/CD34).sup.- HLA-DR.sup.+CD123.sup.+ cells. (C) shows phenotypic association between Lin-HLA-DR.sup.+CD123.sup.hi BM and CD123.sup.+PBMC, showing progression from CDP towards pDC or pre-DC in the BM, and the clear separation of pDC and pre-DC in the blood. Cells within the pre-DC phenograph clusters (clusters #1 and #2 in the BM, and #6 in the blood) and cells within the pDC phenograph clusters (clusters #3 and #4 in the BM, and #7 in the blood) were further analyzed by isoMAP to define pre-DC subsets (left panels, and FIGS. 26, C and D) and heterogeneity among pDC (right panels, and FIGS. 26, D and E).
[0089] FIG. 7. (A) shows gating strategy for FACS of single cells from total Lin.sup.-HLA-DR.sup.+CD135.sup.+ cells. (B) shows the workflow of the MARS-seq single cell data analysis. (C) shows the association between molecule counts and cells. Cell IDs were sorted from highest to lowest number of unique molecular identifier (UMI) or molecule counts. The data are presented on a log.sub.10 axis. The three horizontal lines correspond to molecule counts of 650 (bottom), 1,050 (middle) and 1,700 (top) per cell. The shaded area indicates the range of molecule counts from 400 to 1,200 UMIs per cell. Cells with <1,050 molecules were removed from the analysis (n=1,786 cells). A total of 710 high-quality cells were used for further downstream analyses. (D) shows a density plot (top panel) representing the distribution of cells with a certain number of molecules, and the first (middle panel) and second derivative (bottom panel) of the density function. The three lines correspond to molecule counts of 650 (left), 1,050 (middle) and 1,700 (right) per cell. (E) shows principal component analysis (PCA) after simulation at different normalization thresholds. Points were colored according to the different runs. (F) shows a correlation plot of average expression of genes in run2 (y-axis) versus average expression of genes in run1 (x-axis). The data are presented on a log.sub.10 axis. The Pearson correlation coefficient was 0.99. (G) shows t-distributed stochastic neighbor embedding (tSNE) analysis of the 710 single cells, colored by run association (run 1: dark, run 2: light), showed an even distribution of the cells within the tSNE plot. Lines represent a linear fit of the points. The distributions of the points along the tSNE component 1 and component 2 were represented as density plots on the top or right panel, respectively. (H) shows frequency of cells in the five determined clusters for run1 and run2. (I) shows that the mean-variability plot showed average expression and dispersion for each gene. This analysis was used to determine highly variable gene expression (labeled by gene symbol). The 36 highly variable genes were used to perform a dimensionality reduction of the single-cell data by PCA. In (J), the highest gene loadings in the first and second principal component (PC1 and PC2) from the PCA of 710 high quality cells are shown.
[0090] FIG. 8. (A) shows the relative expression of signature genes of pDC (TCF4), cDC1 (CADM1) and cDC2 (CD1D) in Mpath clusters defined in FIG. 1C. (B) shows the weighted neighborhood network of the Mpath analysis shown in FIG. 1C. (C) shows the analysis of MARS-seq data using the Wishbone algorithm. In the 2D-t-distributed stochastic neighbor embedding (tSNE) plot (upper panels) and in the 3D-Diffusion Map (lower panels) (See FIGS. 1, A and F, respectively), cells were displayed according to the values of the Wishbone trajectory (left panels) or the values of the Wishbone branches (right panels). Line chart (top right panel) shows the expression of signature genes along Wishbone trajectory. X-axis represents pseudo-time of Wishbone trajectory. Solid line represents backbone trajectory, dotted lines represent separate trajectories along the two branches. Heat maps (bottom right panels) show the expression of signature genes along Wishbone trajectory on the two branches.
[0091] FIG. 9. (A) shows the gating strategy of CD45.sup.+Lin(CD7/CD14/CD15/CD16/CD19/CD34).sup.-HLA-DR.sup.+ blood mononuclear cells from CyTOF analysis for downstream t-distributed stochastic neighbor embedding (tSNE) as shown in FIG. 1, E to G. The name of the excluded population(s) is indicated in each corresponding 2D-plot. (B) shows tSNE plots of the CyTOF data from FIG. 1, H to J showing the expression level of cDC2-, cDC1- and pDC-specific markers. (C) shows that unsupervised phenograph clustering identified 10 clusters that were overlaid onto the tSNE1/2 plot of the CyTOF data from FIGS. 1, H and I.
[0092] FIG. 10. (A) shows the gating of flow cytometry data to identify the Lin.sup.-HLA-DR.sup.+ cell population displayed in FIG. 2A (blood data displayed). (B) shows classical contour plots of CyTOF data from FIG. 1 showing the same gating strategy as applied in the flow cytometry analyses shown in FIG. 2A. (C) shows flow cytometry data of the relative expression of CD33, CX3CR1, CD2, CD141, CD11c, CD135, CD1c and CADM1 by pre-DC, pDC, cDC1 and cDC2 defined in FIG. 2A in the blood (upper panels) and spleen (lower panels). (D) shows a ring graphical representation of the proportion of pre-DC, cDC1 and cDC2 among total Lin.sup.-CD34.sup.-HLA-DR.sup.+CD33.sup.+cDC defined in FIG. 2A in the spleen (left) and blood (right). (E) shows representative electron micrographs showing morphological characteristics of a pre-DC. (F) shows histograms of the mean relative numbers of CD123.sup.+CD172.alpha..sup.-cells, Clec9A.sup.+CADM1.sup.+cDC1 or CD172.alpha..sup.+CD1c.sup.+cDC2 from the in vitro differentiation assays as described in FIG. 2F (n=4). Error bars represent mean.+-.SEM.
[0093] FIG. 11. Gating strategy for the fluorescence-activated cell sorting of DC subsets and pre-DC used in the in vitro differentiation assays (FIG. 2F). (A) shows pre-sorted data and (B-E) show post-sorted re-analysis of (B) pre-DC, (C) cDC1, (D) cDC2, and (E) pDC.
[0094] FIG. 12. (A)-(C) show comparison of (A) the gating strategy from Breton et al. (32) (Pre-DC are shown in the two plots on the top right.) and (B) the gating strategy used in FIG. 2A and FIG. 10A (pre-DC displayed in purple) to define pre-DC. The relative numbers of pre-DC defined using the two gating strategies among live CD45.sup.+ peripheral blood mononuclear cells are indicated in the dot plots. (C) shows graphical representation of the median relative numbers of pre-DC defined using the two gating strategies among live CD45.sup.+ blood mononuclear cells (n=4). The median percentages of CD45.sup.+ values are indicated. P-values were calculated using the Mann-Whitney test. (D) illustrates a histogram showing the expression of CD117 by DC subsets and pre-DC determined by flow cytometry. (E)-(F) show identification of pre-DC, cDC1 and cDC2 among Lin.sup.-HLA-DR.sup.+ (E) ILT3.sup.+ILT1.sup.- cells (33) or ILT3.sup.+ILT1.sup.+ (cDC), and (F) CD4.sup.+CD11c.sup.- cells (34) or CD4.sup.intCD11c.sup.+cDC.
[0095] FIG. 13. shows pDC, pre-DC, cDC1 and cDC2 isolated by fluorescence-activated cell sorting were stimulated in vitro with LPS, LPS+IFN.gamma. (L+I), Flagellin (Flag), polyI:C (pI:C), CL097 (CL) or CpG ODN2216 (CpG), and the soluble mediators (as indicated above each histogram) in the culture supernatants were quantified by Luminex Multiplex Assay (n=2).
[0096] FIG. 14. shows identification of CD33.sup.+CX3CR1.sup.+ pre-DC among Lin.sup.-HLA-DR.sup.+CD303.sup.+CD2.sup.+ cells (36).
[0097] FIG. 15. shows the gating strategy for the fluorescence-activated cell sorting analysis of peripheral blood mononuclear cells from control subjects (Ctrl, n=11) and patients with Pitt-Hopkins Syndrome (PHS; n=4). pDC (circled in blue) and pre-DC (circled in purple) were defined among Lin-HLA-DR.sup.+CD45RA.sup.+CD123.sup.+ cells.
[0098] FIG. 16. (A) shows the gating strategy for FACS of Lin.sup.-HLA-DR.sup.+CD33.sup.+CD45RA.sup.+CD1c.sup.lo/-CD2.sup.+CADM1.su- p.lo/-CD123.sup.+ pre-DC analyzed by C1 single cell mRNA sequencing (scmRNAseq). (B) shows quality control (removing low-quality cells and minimally-expressed genes below the limits of accurate detection; low-quality cells that were identified using SINGuLAR toolbox; minimally-expressed genes with transcripts per million (TPM) values .gtoreq.1 in <95% of the cells) and (C) shows the work flow of the C1 scmRNAseq analyses shown in FIG. 3A-B. Error bars represent the maximum, third quartile, median, first quartile and minimum.
[0099] FIG. 17. shows the relative expression levels of signature genes of cDC1 (BTLA, THBD and, LY75) and cDC2 (CD2, SIRPA and ITGAX) in Mpath clusters defined in FIG. 3B.
[0100] FIG. 18. (A) shows the expression level of markers in the 3D-Principal Component Analysis (PCA) plots from FIGS. 3, C and D. (B) shows the sequential gating strategy of flow cytometry data starting from Live CD45.sup.+Lin(CD3/14/16/19/20).sup.-CD34.sup.-HLA-DR.sup.+ peripheral blood mononuclear cells defining CD33.sup.-CD123.sup.+CD303.sup.+ pDC, CD33.sup.+CD45RA.sup.-differentiated cDC (CADM1.sup.+cDC1, CD1c.sup.+cDC2), and CD33.sup.+CD45RA.sup.+ cells (comprising CD123.sup.+CD45RA.sup.+ pre-DC and CD123.sup.loCD45RA.sup.+ intermediate cells). (C) shows the proportion of CD45.sup.+ mononuclear cells in spleen (n=3) (left) and peripheral blood (n=6) (right) of the above-mentioned pre-DC subsets. (D) shows histograms of the mean proportion of CD303.sup.+CD172.alpha..sup.-cells, Clec9A.sup.+CADM1.sup.+cDC1 or CD1c.sup.+CD11c.sup.+cDC2 obtained in the in vitro differentiation assays as described in FIG. 3H (n=3). Error bars represent mean.+-.SEM.
[0101] FIG. 19. shows the gating strategy for sorting of pre-DC subsets used in the in vitro differentiation assays (FIG. 3G). (A) shows pre-sorted data and (B-D) show the post-sorted re-analysis of (B) early pre-DC, (C) pre-cDC1, and (D) pre-cDC2.
[0102] FIG. 20. (A) shows expression level in terms of mean fluorescence intensity (MFI) of the side scatter area (SSC-A) indicating cellular granularity of blood pre-DC and DC subsets from five individual human donors (n=5). Error bars represent mean.+-.SEM. (B-C) show the flow cytometry data of the relative expression of (B) CD45RA, CD169, CD11c, CD123, CD33, Fc.epsilon.RI, CD2, Clec9A, CD319, CD141, BTLA, CD327, CD26, CD1c, CD304 or of (C) IRF4 and IRF8 by pDC, early pre-DC, pre-cDC2, cDC2, pre-cDC1 and cDC1 defined in FIG. 3G and in FIG. 18B.
[0103] FIG. 21. shows 2D-plots showing combinations of Principal Component Analysis components 1, 2 or 3 (PC1-3) using differentially-expressed genes from the microarray analysis of FIG. 4.
[0104] FIG. 22. shows heat maps of relative expression levels of all differentially-expressed genes, with magnifications of the specific genes in early pre-DC (region within the first magnified box, middle panel) and pre-cDC1 (region within the second magnified box, middle panel) from the microarray analysis of FIG. 4.
[0105] FIG. 23. shows a Venn diagram showing genes common between the lists of cDC1 DEGs (the union of DEGs from comparing pre-cDC1 vs early pre-DC and cDC1 vs pre-cDC1) and cDC2 DEGs (the union of DEGs from comparing pre-cDC2 vs early pre-DC and cDC2 vs pre-cDC2). These 62 genes were then plotted in FIG. 4E with the log.sub.e fold-change values (versus early pre-DC).
[0106] FIG. 24. (A-B) show the ingenuity Pathway analysis (IPA) based on genes that were differentially-expressed between (A) cDC and early pre-DC or (B) pDC and early pre-DC. Only the DC biology-related pathways were shown, and all displayed pathways were significantly enriched (P<0.05, right-tailed Fischer's Exact Test). The heights of the bars correspond to the activation z-scores of the pathways. Enriched pathways predicted to be more activated in early pre-DC pathways and enriched pathways predicted to be more activated in cDC or pDC are shown. IPA predicts pathway activation/inhibition based on the correlation between what is known about the pathways in the literature (the Ingenuity Knowledge Base) and the directional expression observed in the user's data. IPA Upstream Regulator Analysis Whitepaper (56) and IPA Downstream Effectors Analysis Whitepaper (57) provide full description of the activation z-score calculation. (C) shows gene Ontology (GO) enrichment analysis of differentially-expressed genes (DEGs) in early pre-DC and pDC indicating biological processes that were significantly enriched (Benjamini-Hochberg adjusted p value <0.05) with genes expressed more abundantly in early pre-DC as compared to pDC. No biological process was significantly enriched with genes expressed more abundantly in pDC as compared to early pre-DC.
[0107] FIG. 25. (A) shows normalized abundance of all R mRNA in DC and pre-DC subsets obtained from the microarray analysis of FIG. 4. (B) shows polarization of naive CD4.sup.+ T cells into IFN.gamma..sup.+IL-17A.sup.- Th1 cells, IL-4.sup.+ Th2 cells, IL17A.sup.+IFN.gamma..sup.- Th17 cells and IL-22.sup.+IFN.gamma..sup.-IL-17A.sup.- Th22 cells after 6 days of culture in a mixed lymphocyte reaction with allogenic pre-DC and DC subsets (n=3). Error bars represent SEM.
[0108] FIG. 26. (A) shows the isoMAP1-2 plot of bone marrow (BM) Lin(CD3/CD7/CD14/CD15/CD19/CD34).sup.-CD123.sup.hi cells (upper panel) and graphics of the binned median expression of defining markers along the phenotypic progression of cells defined by the isoMAP1 dimension (lower panels). (B) shows the expression level of selected markers in the isoMAP1-2-3 3D-plots (FIG. 6C, lower left panel) corresponding to cells within the pre-DC phenograph clusters (#1 and #2) of the blood Lin.sup.-CD123.sup.+ cells isoMAP analysis. (C) shows the expression level of selected markers in the isoMAP1-2 plots (FIG. 6C, upper left panel) corresponding to cells within the pre-DC phenograph clusters (#3 and #4) of the BM Lin.sup.-CD123.sup.hi cells isoMAP analysis. (D) shows pDC defined in BM Lin.sup.-CD123.sup.hi (phenograph clusters #3 and #4) or blood Lin.sup.-CD123.sup.+ (phenograph cluster #7) cells of FIGS. 6A and 6B, respectively, which were exported and analyzed using the isoMAP method and subdivided into clusters using the phenograph algorithm. BM and blood concatenated and overlaid BM and blood isoMAP1/3 plots are shown (left panels). Expression level of CD2 in BM (left) and blood (right) pDC is shown in the isoMAP1/3 plot. (E) Expression level of selected markers is shown in the BM and blood concatenated isoMAP1/3 plot of FIG. 6C (right panels).
[0109] FIG. 27. is a schematic representation of the expression of major pre-DC, cDC1 and cDC2 markers as pre-DC differentiate towards cDC.
[0110] FIG. 28. is a schematic representation of the expression of major pre-DC, cDC1 and cDC2 markers as pre-DC differentiate towards cDC.
TABLES
TABLE-US-00001 [0111] TABLE 1 Number of detected genes per cell in the total DC MARS-seq experiment. Cell Count SCB_105 787 SCB_106 785 SCB_107 744 SCB_108 774 SCB_109 779 SCB_110 755 SCB_111 770 SCB_112 740 SCB_113 766 SCB_114 751 SCB_115 749 SCB_116 780 SCB_117 764 SCB_118 734 SCB_119 742 SCB_120 787 SCB_121 766 SCB_122 766 SCB_123 755 SCB_124 758 SCB_125 762 SCB_126 767 SCB_127 758 SCB_128 756 SCB_129 783 SCB_130 744 SCB_131 766 SCB_132 729 SCB_133 717 SCB_134 781 SCB_135 794 SCB_136 775 SCB_137 745 SCB_138 784 SCB_139 745 SCB_140 748 SCB_141 771 SCB_142 767 SCB_143 768 SCB_144 670 SCB_145 701 SCB_146 752 SCB_147 746 SCB_148 726 SCB_149 750 SCB_150 781 SCB_151 738 SCB_152 775 SCB_153 750 SCB_154 788 SCB_155 781 SCB_156 773 SCB_157 770 SCB_158 762 SCB_159 766 SCB_160 768 SCB_161 752 SCB_162 767 SCB_163 719 SCB_164 748 SCB_165 774 SCB_166 769 SCB_167 792 SCB_168 772 SCB_169 721 SCB_170 752 SCB_171 745 SCB_172 749 SCB_173 774 SCB_174 745 SCB_175 780 SCB_176 763 SCB_177 770 SCB_178 777 SCB_179 755 SCB_180 719 SCB_181 756 SCB_182 759 SCB_183 720 SCB_184 730 SCB_185 741 SCB_186 741 SCB_187 760 SCB_188 783 SCB_189 760 SCB_190 757 SCB_191 786 SCB_192 753 SCB_193 786 SCB_194 761 SCB_195 749 SCB_196 737 SCB_197 720 SCB_198 781 SCB_199 749 SCB_200 780 SCB_201 793 SCB_202 747 SCB_203 771 SCB_204 719 SCB_205 754 SCB_206 779 SCB_207 742 SCB_208 750 SCB_209 751 SCB_210 756 SCB_211 732 SCB_212 760 SCB_213 734 SCB_214 740 SCB_215 714 SCB_216 727 SCB_217 748 SCB_218 772 SCB_219 772 SCB_220 743 SCB_221 686 SCB_222 758 SCB_223 771 SCB_224 766 SCB_225 755 SCB_226 709 SCB_227 733 SCB_228 758 SCB_229 756 SCB_230 709 SCB_231 756 SCB_232 748 SCB_233 782 SCB_234 688 SCB_235 626 SCB_236 730 SCB_237 757 SCB_238 726 SCB_239 734 SCB_240 757 SCB_241 773 SCB_242 745 SCB_243 750 SCB_244 725 SCB_245 725 SCB_246 711 SCB_247 729 SCB_248 722 SCB_249 734 SCB_250 722 SCB_251 729 SCB_252 725 SCB_253 763 SCB_254 778 SCB_255 768 SCB_256 748 SCB_257 787 SCB_258 736 SCB_259 730 SCB_260 782 SCB_261 753 SCB_262 758 SCB_263 690 SCB_264 735 SCB_265 735 SCB_266 739 SCB_267 682 SCB_268 788 SCB_269 729 SCB_270 729 SCB_271 764 SCB_272 746 SCB_273 774 SCB_274 759 SCB_275 749 SCB_276 773 SCB_277 777 SCB_278 755 SCB_279 748 SCB_280 755 SCB_281 752 SCB_282 762 SCB_283 723 SCB_284 742 SCB_285 776 SCB_286 726 SCB_287 786 SCB_1 721 SCB_2 768 SCB_3 746 SCB_4 791 SCB_5 734 SCB_6 754 SCB_7 760 SCB_8 757 SCB_9 763 SCB_10 706 SCB_11 713 SCB_12 776 SCB_13 749 SCB_14 765 SCB_15 762 SCB_16 772 SCB_17 767 SCB_18 705 SCB_19 721 SCB_20 740 SCB_21 765 SCB_22 774 SCB_23 766 SCB_24 765 SCB_25 682 SCB_26 772 SCB_27 730 SCB_28 763 SCB_29 735 SCB_30 754 SCB_31 737 SCB_32 787 SCB_33 758 SCB_34 768 SCB_35 713 SCB_36 722 SCB_37 765 SCB_38 741 SCB_39 757 SCB_40 759 SCB_41 750 SCB_42 776 SCB_43 713 SCB_44 675 SCB_45 775 SCB_46 757 SCB_47 760 SCB_48 764 SCB_49 730 SCB_50 755 SCB_51 751 SCB_52 774 SCB_53 743 SCB_54 714 SCB_55 739 SCB_56 750 SCB_57 758 SCB_58 755 SCB_59 776 SCB_60 759 SCB_61 697
SCB_62 721 SCB_63 741 SCB_64 682 SCB_65 756 SCB_66 766 SCB_67 725 SCB_68 774 SCB_69 733 SCB_70 710 SCB_71 758 SCB_72 743 SCB_73 758 SCB_74 740 SCB_75 725 SCB_76 713 SCB_77 735 SCB_78 768 SCB_79 715 SCB_80 713 SCB_81 751 SCB_82 745 SCB_83 742 SCB_84 782 SCB_85 783 SCB_86 753 SCB_87 744 SCB_88 743 SCB_89 741 SCB_90 736 SCB_91 691 SCB_92 772 SCB_93 764 SCB_94 748 SCB_95 770 SCB_96 744 SCB_97 732 SCB_98 749 SCB_99 763 SCB_100 718 SCB_101 781 SCB_102 711 SCB_103 753 SCB_104 781 SCB_360 761 SCB_361 754 SCB_362 775 SCB_363 762 SCB_364 779 SCB_365 782 SCB_366 763 SCB_367 779 SCB_368 786 SCB_369 748 SCB_370 779 SCB_371 764 SCB_372 745 SCB_373 754 SCB_374 778 SCB_375 802 SCB_376 788 SCB_377 732 SCB_378 718 SCB_379 698 SCB_380 761 SCB_381 747 SCB_382 812 SCB_383 784 SCB_384 781 SCB_385 715 SCB_386 717 SCB_387 773 SCB_388 699 SCB_389 703 SCB_390 768 SCB_391 712 SCB_392 759 SCB_393 747 SCB_394 747 SCB_395 776 SCB_396 794 SCB_397 788 SCB_398 770 SCB_399 734 SCB_400 719 SCB_401 752 SCB_402 774 SCB_403 768 SCB_404 754 SCB_405 764 SCB_406 729 SCB_407 750 SCB_408 731 SCB_409 784 SCB_410 785 SCB_411 738 SCB_412 775 SCB_413 722 SCB_414 803 SCB_415 782 SCB_416 778 SCB_417 768 SCB_418 749 SCB_419 770 SCB_420 731 SCB_421 785 SCB_422 747 SCB_423 733 SCB_424 732 SCB_425 732 SCB_426 759 SCB_427 740 SCB_428 741 SCB_429 769 SCB_430 713 SCB_431 720 SCB_432 773 SCB_433 753 SCB_434 742 SCB_435 721 SCB_436 798 SCB_437 756 SCB_438 767 SCB_439 790 SCB_440 768 SCB_441 771 SCB_442 738 SCB_443 760 SCB_444 765 SCB_445 770 SCB_446 752 SCB_447 799 SCB_448 749 SCB_449 712 SCB_450 777 SCB_451 700 SCB_452 748 SCB_453 795 SCB_454 738 SCB_455 782 SCB_456 742 SCB_457 763 SCB_458 762 SCB_459 665 SCB_460 707 SCB_511 787 SCB_512 779 SCB_513 753 SCB_514 766 SCB_515 775 SCB_516 771 SCB_517 777 SCB_518 774 SCB_519 757 SCB_520 756 SCB_521 750 SCB_522 758 SCB_523 719 SCB_524 731 SCB_525 736 SCB_526 744 SCB_527 765 SCB_528 755 SCB_529 737 SCB_530 768 SCB_531 769 SCB_532 796 SCB_533 757 SCB_534 726 SCB_535 741 SCB_536 731 SCB_537 802 SCB_538 731 SCB_539 715 SCB_540 785 SCB_541 758 SCB_542 779 SCB_543 800 SCB_544 741 SCB_545 779 SCB_546 729 SCB_547 737 SCB_548 773 SCB_549 787 SCB_550 771 SCB_551 750 SCB_552 746 SCB_553 742 SCB_554 767 SCB_555 743 SCB_556 750 SCB_557 744 SCB_558 756 SCB_559 765 SCB_560 759 SCB_561 741 SCB_562 730 SCB_563 762 SCB_564 737 SCB_565 770 SCB_566 774 SCB_567 720 SCB_568 763 SCB_569 725 SCB_570 735 SCB_571 713 SCB_572 747 SCB_573 750 SCB_574 763 SCB_575 768 SCB_576 800 SCB_577 788 SCB_578 726 SCB_579 761 SCB_580 764 SCB_581 735 SCB_582 729 SCB_583 812 SCB_584 718 SCB_585 745 SCB_586 742 SCB_587 728 SCB_588 752 SCB_589 758 SCB_590 769 SCB_591 742 SCB_592 752 SCB_593 777 SCB_594 718 SCB_595 777 SCB_596 776 SCB_597 706 SCB_598 750 SCB_599 777 SCB_600 761 SCB_601 731 SCB_602 729 SCB_603 776 SCB_604 717 SCB_605 747 SCB_606 757 SCB_607 737 SCB_608 760 SCB_609 804 SCB_610 758 SCB_611 771 SCB_612 767 SCB_613 762 SCB_614 747 SCB_615 764 SCB_616 761 SCB_617 746
SCB_618 782 SCB_619 777 SCB_620 700 SCB_621 757 SCB_622 747 SCB_623 770 SCB_624 772 SCB_625 792 SCB_626 733 SCB_627 776 SCB_699 769 SCB_700 805 SCB_701 799 SCB_702 712 SCB_703 672 SCB_704 788 SCB_705 672 SCB_706 755 SCB_707 708 SCB_708 709 SCB_709 752 SCB_710 718 SCB_288 716 SCB_289 767 SCB_290 770 SCB_291 720 SCB_292 704 SCB_293 787 SCB_294 732 SCB_295 728 SCB_296 746 SCB_297 782 SCB_298 682 SCB_299 760 SCB_300 687 SCB_301 745 SCB_302 777 SCB_303 701 SCB_304 773 SCB_305 748 SCB_306 772 SCB_307 795 SCB_308 753 SCB_309 753 SCB_310 714 SCB_311 758 SCB_312 695 SCB_313 748 SCB_314 747 SCB_315 750 SCB_316 746 SCB_317 774 SCB_318 723 SCB_319 753 SCB_320 741 SCB_321 718 SCB_322 744 SCB_323 750 SCB_324 711 SCB_325 731 SCB_326 764 SCB_327 699 SCB_328 755 SCB_329 716 SCB_330 783 SCB_331 739 SCB_332 747 SCB_333 752 SCB_334 766 SCB_335 715 SCB_336 765 SCB_337 745 SCB_338 698 SCB_339 770 SCB_340 730 SCB_341 767 SCB_342 786 SCB_343 709 SCB_344 767 SCB_345 778 SCB_346 745 SCB_347 778 SCB_348 759 SCB_349 755 SCB_350 733 SCB_351 759 SCB_352 708 SCB_353 721 SCB_354 792 SCB_355 761 SCB_356 686 SCB_357 733 SCB_358 765 SCB_359 756 SCB_628 763 SCB_629 715 SCB_630 719 SCB_631 774 SCB_632 691 SCB_633 691 SCB_634 687 SCB_635 706 SCB_636 708 SCB_637 702 SCB_638 743 SCB_639 752 SCB_640 772 SCB_641 739 SCB_642 733 SCB_643 767 SCB_644 735 SCB_645 756 SCB_646 775 SCB_647 728 SCB_648 750 SCB_649 768 SCB_461 723 SCB_462 804 SCB_463 713 SCB_464 699 SCB_465 766 SCB_466 768 SCB_467 759 SCB_468 765 SCB_469 784 SCB_470 702 SCB_471 703 SCB_472 775 SCB_473 753 SCB_474 764 SCB_475 680 SCB_476 768 SCB_477 709 SCB_478 761 SCB_479 777 SCB_480 719 SCB_481 761 SCB_482 784 SCB_483 718 SCB_484 771 SCB_485 766 SCB_486 733 SCB_487 767 SCB_488 793 SCB_489 758 SCB_490 768 SCB_491 764 SCB_492 811 SCB_493 779 SCB_494 691 SCB_495 694 SCB_496 766 SCB_497 756 SCB_498 780 SCB_499 770 SCB_500 757 SCB_501 776 SCB_502 806 SCB_503 737 SCB_504 769 SCB_505 754 SCB_506 736 SCB_507 773 SCB_508 726 SCB_509 773 SCB_510 756 SCB_677 690 SCB_678 728 SCB_679 725 SCB_680 749 SCB_681 759 SCB_682 746 SCB_683 740 SCB_684 689 SCB_685 698 SCB_686 737 SCB_687 741 SCB_688 729 SCB_689 808 SCB_690 701 SCB_691 789 SCB_692 775 SCB_693 811 SCB_694 727 SCB_695 778 SCB_696 718 SCB_697 724 SCB_698 690 SCB_650 797 SCB_651 736 SCB_652 773 SCB_653 703 SCB_654 772 SCB_655 769 SCB_656 797 SCB_657 765 SCB_658 764 SCB_659 741 SCB_660 732 SCB_661 768 SCB_662 758 SCB_663 773 SCB_664 753 SCB_665 745 SCB_666 709 SCB_667 705 SCB_668 662 SCB_669 729 SCB_670 784 SCB_671 726 SCB_672 691 SCB_673 782 SCB_674 651 SCB_675 760 SCB_676 705
TABLE-US-00002 TABLE 2 DC subsets signature genes derived from Gene Expression Omnibus data series GSE35457 and used for MARS-seq and C1 data analyses. cDC2 signature pDC signature genes cDC1 signature genes genes ABCA7 MTMR2 ABCB4 STX11 ABCG1 ABCB6 MUPCDH ABI3 STX6 ACP5 ABHD15 MX1 ABR SVIL ACP6 ABTB2 MYB ACER3 SWAP70 ACSL1 ACACB MYBPH ACOT11 SYN1 ACSL5 ACN9 MYH3 ACPP SYT11 ACSS2 ACSBG1 MYL6B ACTA2 SYTL3 ACTB ACSM3 N4BP2L1 ACVRL1 TBL1X ACTR3 ADA N6AMT1 ADAM15 TBXAS1 ADAD2 ADAM19 NADK ADAM8 TESC ADAM28 ADARB1 NAT8L ADAMTSL4 TICAM2 ADORA2B ADAT3 NCF1C ADAP1 TIMP1 ADORA3 ADC NCLN AGTPBP1 TIPARP AGPAT1 ADI1 NCRNA00153 ALDH3B1 TKT AGPS AEBP1 NDST2 ALOX5 TLE4 AIG1 AHI1 NEK8 AMICA1 TLR2 AIM2 AJAPI NFATC2IP AMOT TLR5 ALDH1A1 AKR1C3 NFX1 ANG TLR8 ALDH3A2 ALDH5A1 NGLY1 ANXA1 TM6SF1 AMY1A ALOX5AP NHEDC1 ANXA2 TMC6 ANPEP ANKRD33 NIN ANXA2P1 TMEM154 ANXA6 APOBEC3D NIPA1 ANXA5 TMEM173 AP3M2 APP NLRP2 AOAH TMEM2 APOL1 ARHGAP25 NLRP7 APAF1 TMEM71 APOL2 ARHGAP27 NOP56 APLP2 TNFAIP2 APOL3 ARHGAP9 NOTCH3 ARAP3 TNFRSF10D ASAP1 ARHGEF10 NOTCH4 ARHGAP10 TNFRSF1A ASB2 ARHGEF4 NPAL3 ARL4A TNFRSF1B ATG3 ARID3A NPCI ARRDC2 TNFSF10 ATL1 ARMC5 NPC2 ASCL2 TNFSF12 ATP1A1 ARMET NR5Al ASGR1 TNFSF13B AZI1 ARRDC5 NRP1 ASGR2 TOB1 B4GALT5 ASIP NTAN1 ATP1B1 TPPP3 BAG3 ATP10A NUCB2 ATP6V1B2 TREM1 BATF3 ATP13A2 NUMA1 BACH2 TRIB1 BCAR3 ATP2A3 OAS1 BATF TRIB2 BCL6 ATP8B2 ODC1 BLVRA TSC22D3 BEND5 AUTS2 OFD1 BTBD11 TSPAN32 BIK AVEN OGT C10orf11 TSPAN4 BIVM B4GALT1 OPN3 C10orf54 TSPO BTLA BAIAP2L1 OPTN C15orf39 TTYH3 C10orf105 BCAS4 OR3A3 C16orf7 UBAC1 C10orf64 BCL11A P2RX1 C17orf44 UPP1 Cl3orf15 BEND6 P4HB C2CD2 USP3 C13orf31 BLK PACAP C3orf59 VCAN C15orf38 BLNK PACSIN1 C4orf18 VENTX C17orf58 BSPRY PAFAH2 C9orf72 VIPR1 C1orf115 BTAF1 PAG1 CA2 VPS37C C1orf162 BTG1 PANX2 CACNA2D3 VSIG4 C1orf165 C10orf141 PAPLN CALHM2 XAF1 C1orf186 C10orf47 PARP10 CAPN2 XYLT1 Clorf21 C10orf58 PARVB CARD16 YIF1B C1orf24 C11orf24 PBX3 CARD9 ZAK Clorf51 C11orf67 PCNT CASP1 ZBP1 C1orf54 Cl1orf80 PCNX CASP4 ZEB2 C20orf27 C12orf23 PCSK4 CAST ZFAND5 C21orf63 C12orf44 PDCD4 CCL5 ZFP36 C5orf30 C12orf57 PDIA4 CCND2 ZNF562 C8orf47 C13orf18 PDXP CCR6 ZYG11B CADM1 C14orf4 PFKFB2 CD14 CAMK2D Cl4orf45 PFKP CD151 CAMP C16orf33 PGD CD163 CBL C16orf58 PGM2L1 CD1A CCDC6 Cl6orf93 PHACTR1 CD1B CCDC62 C18orf25 PHEX CD1C CCDC90A C18orf8 PHF16 CD1D CCND1 C1orf109 PI4KAP2 CD1E CCR9 C20orf100 PIK3AP1 CD2 CD226 C20orf103 PIK3CD CD209 CD38 C20orf132 PIK4CA CD244 CD48 C21orf2 PLAC8 CD300A CD59 C2orf55 PLAU CD300C CDCA7 C3orf21 PLD6 CD300LF CDH2 C4BPB PLEKHG4 CD33 CDK2AP1 C5orf62 PLP2 CD5 CDK6 C6orf170 PLS3 CD52 CHD7 C7orf41 PMEPA1 CD69 CHST2 C7orf54 PNOC CDC42EP4 CLEC1A C8orf13 POLB CDCP1 CLEC9A C9orf127 POLE CDH23 CLNK C9orf128 POMGNT1 CDS1 CLSTN2 C9orf142 POU4F1 CEBPA CNTLN C9orf37 PPM1J CEBPB CPNE3 C9orf45 PPP1R14A CEBPD CREG1 C9orf91 PPP1R14B CENPN CSRP1 C9orf95 PPP1R16B CENTA1 CST3 CA8 PPP2R1B CENTG3 CTPS2 CADM4 PPP2R5C CES1 CXCL16 CARD11 PRAGMIN CFD CXCL9 CASZ1 PRIM1 CFP CYB5R3 CBLB PRKCB CHD1 CYP2E1 CBX4 PRKCB1 CHST13 DBN1 CBX6 PRKD1 CIDEB DCLRE1A CCDC102A PROC CLEC10A DCTPP1 CCDC50 PSCD4 CLEC12A DFNA5 CCDC69 PSD4 CLEC4A DHCR24 CCR2 PTCRA CLEC4F DHRS3 CCR3 PTGDS CMTM1 DLG3 CCR7 PTGR1 COL9A2 DOCK7 CCS PTK7 COQ10A DPP4 CD164 PTPRCAP CPNE8 DSE CD247 PTPRM CPPED1 DYSF CD2AP PVRL1 CREB5 EGLN3 CD320 QDPR CRTAP EHD4 CD36 RAB15 CRYL1 ELOVL5 CD4 RAB38 CRYZL1 ENOX1 CD68 RAB40B CSF1R ENPP1 CD7 RAB9P1 CSF3R ENPP3 CD99 RABGAP1L CST7 ENPP4 CDC14A RALGPS1 CSTA ERAP2 CDCA7L RASD1 CTSH ERMP1 CDH1 RBM38 CX3CR1 ERO1L CDK2 RECQL5 CXCR7 EV12A CDK5R1 RELN CYBRD1 EVL CDKN2D REX02 CYFIP1 FAH CDR2 RGS1 DAGLB FAM102A CDYL RGS7 DDX60L FAM125B CENPV RHBDF2 DEM1 FAM129A CETP RIMS3 DENND3 FAM149A CHST12 RLTPR DEPDC6 FAMI60A2 CHST15 RNASE6 DHRS9 FAM20C C1B2 RNASEL DOK2 FAM57A CIRBP RNF11 DPEP2 FAR2 CLDN23 RNF121 DPYD FARS2 CLEC4C RNF165 DTD1 FBXL20 CLIC3 RPA1 DTNA FKBP1B CLN8 RPP25 ECGF1 FLJ10916 CMTM3 RPPH1 EFNB1 FLJ22795 CNTNAP1 RPS6KA2 EMP1 FLT3 COBL RPS6KA4 EMR2 FMNL2 COBLL1 RRBP1 EMR3 FNBP1 COL24A1 RSPH1 ENHO FN1P2 CORO1C RTKN ENTPD1 FUCA1 CPLX1 RUNX2 EPB41L2 FUT8 CREB3L2 RWDD2A EPB41L3 GCET2 CRTC3 SAP130 EPSTI1 GFOD1 CRYM SBDS ERMAP GINS2 CTNS SBF1 ETS2 GLTP CTSB SCAMPS FI3A1 GNAZ CTSC SCARA5 FAM102B GPER CTSL2 SCARB1 FAM104B GPR126 CUEDC1 SCARB2 FAM109A GPRIN3 CUTL1 SCN9A FAM1I10A GPSM1 CUX2 SCYL3 FAM111A GPT2 CXCR3 SDC1 FAM129B GSTP1 CXorf12 SDK2 FAM38A GYPC CXorf57 SEC11C FAM46A H2AFY2 CXXC5 SEC61A1 FBLN2 HCP5 CYBASC3 SEC61A2 FBN2 HLA-DOB CYBB SEC61B FCGBP HLA-DPA1 CYFIP2 SEL1L3 FCGR2A HLA-DPB1 CYP2J2 SELL FCGR2B HLA-DQB1 CYP46A1 SELS FCN1 HLA-DRB1 CYSLTR1 SEMA4D FCRLB HLA-DRB3 CYTH4 SEMA5A FGD4 HLA-DRB4 CYYR1 SEPHS1 FILIP1L HMOX1 DAAM1 SERPINF1 FLVCR2 HN1 DAB2 SERPING1 FOSB HOXA9 DACH1 SETBP1 FOXO1 HPS5 DAPK2 SH2D3C FPR1 HSD17B8 DBNDDI SH3D 19 FPR3 HSDL2 DCK SH3PXD2A FRAT2 HYAL3 DCPS SHD FXYD5 ICA1 DDB1 SIDT1 FYB ICAM3 DDIT4 SIK1 GABBR1 ID2 DEDD2 SIRPB1 GADD45B IDO1 DERL3 SIVA GALM IDO2 DEXI SIVA1 GAPDH IFNGR2 DHRS7 SLA2 GBP1 IFT20 DHTKDI SLA2MF6 GBP2 IL15 DIP2A SLC15A4 GBP3 INADL DKFZP58611420 SLC20A1 GBP4 INDO DKFZp761P0423 SLC23A1 GBP5 IRAK2 DNASE2 SLC25A4 GHRL ITGB7 DPPA4 SLC29A1 GIMAP1 ITPR3 DRD4 SLC2A1 GIMAP2 KATNA1 DSG2 SLC2A6 GIMAP4 KIAA1598 DSN1 SLC2A8 GIMAP6 KIAA1688 DTX2 SLC35A3 GIMAP7 KIFI6B DUSP28 SLC35C2 GIMAP8 KIF20B DUSP5 SLC35F3 GK KIT DYRK4 SLC37A1 GLIPR2 KLHL22 E2F2 SLC39A6 GPBARI KLHL5 E2F5 SLC3A2 GPRI62 KLRG1 EBI2 SLC43A3 GPR44 LAT EIF4A3 SLC44A2 GRK5 LFNG EIF4ENIF1 SLC47A1 HBEGF LIMAl ELMO2 SLC7A5 HDAC4 LMNA EMID2 SLC7A6 HK1 LOC100133583 ENOSFI SLC9A3R1 HK2 LOC100133866 ENPP2 SLFN11 HK3 LOC150223 EPDR1 SLITRK5 HNMT LOC25845 EPHB1 SMARCAL1 HSPA1A LOC439949 ERCC1 SMC6 HSPA6 LOC642073 ERN1 SMPD3 HSPA7 LOC642590 ESR2 SNAP91 ICAM2 LOC645638 ETS1 SNCA IER5 LOC649143 FAM107B SNRP25 IFI30 LOC653344 FAM108C1 SNRPN IFI6 L00730101 FAM113B SORL1 IFIH1 LONRF1 FAM129C SPCS1 IFIT1 LPAR5 FAM167A SPHK1 IFIT3 LPCAT2 FAM43A SPIB IFITM1 LRBA FAM65A SPNS3 IFITM2 LRRC1 FAM81A SPOCK2 IFITM3 LRRCC1 FAM82A2 SRPR IFT57 LRRK2 FANCD2 SRPX IGLL1 LYRM4 1413X018 SSR4 IGSF6 MARCKSL1 FCHSD2 ST3GAL2 IL13RA1 MATK FCRLA ST3GAL4 IL17RA MCM4 FEZ2 ST6GALNAC4 IL1B MESP1 FGFR3 ST6GALNAC6 IL1R1 MFNG FHL1 STAG3L2 IL1R2 MGC4677 FLJ21986 STAG3L3 IL1RN MIST FLJ42627 STAMBPL1 INPP1 MMP25 FMNL3 STAT4 IRAK3 MND1 FYCO1 STK11IP IRF1I MPP3 FZD3 STK32B ISG15 MYC GAL3ST4 STMN1 ITGA5 MYLK GARNL4 STOX1 ITGAM MYO1D GAS6 STT3A ITSNI NAAA GF11 SUGT1 JDP2 NAALADL1 GGA2 SUPT3H JHDM1D NAP1L1 GGH SUPT5H JUN NAV1 GINS3 SUSD1 JUP NBEAL2 GLCE SYCP2L KCNK13 NCALD GLDN SYS1 KCNQ1 NCKAP5 GLS SYTL2 KIAA0922 NET1 GLT25D1 TACC1 KIAA1683 NET02 GLT8D1 TARBP1 KLF11 NLRX1 GNG7 TATDN3 KLF2 NMNAT3 GPM6B TAX1BP3 KLF4 OSBPL3 GPR114 TBCID14 KLF9 OSBPL9 GPR183 TBC1D16 LACTB P2RY10 GPRC5C TBC1D4 LAMP3 PAM GPX7 TBX19 LAYN PAPSS1 GRAMD1B TCF3 LDLR PARM1 GR14 TCF4 LGALS1 PARP3 GRIN1 TCL1A LILRA2 PDE8B GSDMB TCL1B LILRA3 PDLIM7 GZMB TEX2 LILRA6 PFKFB3 GZMH TFTP11 LILRB3 PIGZ HCST TGFBR2 LIMCH1 PIK3CB
HERC5 TLCD1 LIMS1 PITPNC1 HERPUD1 TLR7 LMO2 PITPNM1 HHAT TLR9 LOC100129550 PKP2 HIGD1A TM7SF2 LOC100130520 PKP4 HIST1H213D TM9SF2 LOC100170939 PLCD1 HIST1H2BK TMEM109 LOC143941 PLEKHA5 HOXB2 TMEM141 LOC153561 PLEKHA6 HPS4 TMEM149 LOC338758 PLEKHO2 HRASLS T EM17013 LOC391075 PLXNA1 HSP90B1 TMEM175 L00644237 PLXNB1 ITVCNI TMEM187 L00645626 PMM1 IDH3A TMEM194A L00648984 PNLDC1 1F144 TMEM194B L00653778 PNMA1 IF144L TMEM44 LOC654103 POLA2 1F1T2 TMEM53 LOC728093 PPA1 IFNAR1 TMEM63A LOC728519 PPAP2A IFNAR2 TMEM91 LOC728666 PPM1H IGF2R TMEM98 LOC728855 PPM1M IGFBP3 TNFRSF17 LOC729708 PPT1 IGJ TNFRSF21 LOC730994 PPY LI8RAP TNNI2 LOC731486 PRKCZ IL28RA TOM1 LOC88523 PSEN2 IL3RA TOX2 LRRC25 PSMB9 INSM1 TP53113 LRRC33 PTGER2 INTS12 TPM2 LST1 PTK2 IRF4 TPRG1L LYL1 PTPLB IRF7 TPST2 LYST QPRT ISCU TRAF3 MAFB RAB11FIP4 ITCH TRO MAP3K6 RAB30 ITGAE TRPM2 MARCO RAB32 ITM2C TSEN54 MBOAT7 RAB33A KANK1 TSPAN13 MEFV RAB3IP KATNAL1 TSPAN3 MEGF9 RAB7B KCNA5 TSPYL2 MLKL RAB7L1 KCNH8 TUBB6 MMD RAB8B KCNK1 TUBG1 MOV10 RALB KCNK10 TUBG2 MPZL2 RASGRP3 KCNK17 TULP4 MS4A14 RGS10 KCTD5 TXN MS4A7 RGS12 KIAA0226 TXNDC3 MSLN RUSC1 KIAA0513 TXNDC5 MSN RYK KIAA1147 UBE2E3 MT1A S100A10 KIAA1274 UBE2J1 MTMR11 Septin 3 KIAAI370 UBQLNL MYBPC3 SERP1NB6 KIAA1545 UGCG MYO1A SERPINF2 KIAAI641 ULK1 MYO1F SH3RF2 KIAA1984 UNC93B1 MYO5C SHE KIF13B USF2 MYPOP SIGLEC10 KIF26B USP11 NACC2 SIGLECP3 KLHLI3 USP24 NCH SLA KLHL3 USP36 NFE2 SLAMF7 KMO VASH2 NINJ2 SLAMF8 KRT5 VEGFB NLRP12 SLC1A3 L3MBTL3 VEZF1 NLRP3 SLC24A4 LA1R1 VIPR2 NOD2 SLC25A25 LAMCI WDR19 NR1H3 SLC39A8 LAMP1 WDR51A NR4A2 SLC44A1 LAMP2 WNT10A OAF SLC46A3 LAPTM4B XBP1 OAS3 SLC9A9 LASS6 YPEL1 OLFM1 SLCO3A1 LBH ZC3H5 OSCAR SMO LDOCI ZCCHC11 P2RY13 SNORA57 LEPREL1 ZCWPW1 P2RY2 SNX22 LGMN ZDHHC14 P2RY5 SNX3 LRFPL2 ZDHHC17 PAPSS2 SNX30 LILRA4 ZDHHC23 PARP14 SP140 LILRB4 ZDHHC4 PARP9 SPATS2L LIME1 ZDHHC8 PCCA SPI1 LMNB2 ZDHHC9 PCK2 SPIN3 LOC100128410 ZFYVE26 PCSK5 SPNS1 LOC100129466 ZHX2 PEAI5 SPRY2 LOC100129673 ZKSCAN4 PFKFB4 ST3GAL5 LOC100130633 ZMYM6 PHCA ST5 LOC100131289 ZMYND11 PID1 ST6GALNAC2 LOC100132299 ZNF175 PILRA ST7 LOC100132740 ZNF185 PION STK39 LOC100134134 ZNF2I9 PIP3-E STOM LOC100190939 ZNF521 PIP4K2A STX3 LOC132241 ZNF556 NUB SUOX LOC201175 ZNF589 PLA2G7 SUSD3 LOC221442 ZNF706 PLSCR3 TACSTD2 LOC283874 ZNF767 PLXDC2 TANC2 LOC285296 ZNF789 PNPLA6 TAP1 LOC285359 ZSCAN16 PPEF1 TAP2 LOC347544 PPFIA4 TCEA3 LOC387841 PPFIBP2 TCEAL3 LOC387882 PPM1F TGM2 LOC389442 PQLC3 THBD LOC389816 PRAM1 THEM4 LOC399804 PRDM1 TJP2 LOC400027 PRIC2S TLR10 LOC400657 PRKCD TL23 LOC442535 PSRC1 TMEM106C LOC550112 PSTPIP2 TMEM14A LOC641298 PTAFR TMEM97 LOC642031 PTGER4 TOX LOC642299 PTGS1 TPMT LOC642755 PTGS2 TRAF3IP2 LOC643384 PTK6 TRAF5 LOC644879 PTPN12 TRIB3 LOC646576 PYGL TSHZ3 LOC647000 RAB24 TSPAN2 LOC647886 RAB27A TSPAN33 LOC650114 RARA TSPYL3 LOC651957 RARRES3 TTF2 LOC652128 RASSF4 TUBA4A LOC653158 RCBTB2 VAC14 LOC728308 RGL1 VAV3 LOC728661 RHOU VCAM1 LOC728715 RIN2 VPS37D LOC728743 RIPK5 WARS LOC729148 RNASE2 WDFY4 LOC729406 RPGRIP1 WDR41 LOC729764 RTN1 WDR91 LOC9143I RXRA YEATS2 LOXL4 S100Al2 ZBTB46 LPXN S100A4 ZDHHC18 LRP5 S100A8 ZFP36L1 LRP8 S100A9 ZMYND15 LRRC26 SAMD9L ZNF232 LRRC36 SAP30 ZNF366 LSS SCO2 ZNF532 LTB SCPEP1 ZNF627 LTK SDHALP1 ZNF662 LY9 SERPINA1 ZNF788 MAG SGK MAGED1 SGK1 MAP1A SGSH MAP4K4 SIDT2 MAPKAPK2 SIGIRR MAST3 SIGLEC14 MCM6 SIGLEC16 MCOLN2 SIGLEC9 MDC1 SIPA1L2 MEF2D SIRPA MEX3B SLC11A1 MGAT4A SLC16A5 MGC29506 SLC22A16 MGC33556 SLC22A11 MGC39900 SLC27A3 MGC42367 SLC2A3 MIB2 SLC31A2 MIR155HG SLC40A1 MKNK1 SLC46A2 MLL4 SLC7A7 MME SLITRK4 MMP11 SMAGP MMP23B SMAP2 MMRN1 SMARCD3 MNAT1 SNRK MOXD1 SNTB1 MPEG1 SRBD1 MRPL36 SRGAP3 MS4A4A ST3GAL6 MSRB3 STEAP3
TABLE-US-00003 TABLE 3 List of anti-human antibodies used for mass cytometry (CyTOF). Metal Name Clone Company Cell expression 89 CD45 HI30 Fluidigm all leukocytes 112/ CD14 TUK4 Invitrogen monocytes 114 115 CD15 HI98 Biolegend PMN, monocytes 141 CD7 6B7 Biolegend T cells, NK cells 142 CD26 BA26 Biolegentd cDC1 143 CD62L DREG-56 Biolegentd Lymphocytes, monocytes, granulocytes. 144 CD48 BL40 Biolegend Lymphocytes, DCs 145 CD68 KP1 eBiosciene pDC, mono/macro 146 CD5 UCHT2 Biolegend cDC2 147 CD86 IT2.2 BD Biosciences DC 148 CD85j 292319 R&D B cells, DCs, monocytes, NK and T cells 149 HLA-DR L243 BD Biosciences APC 150 CD80 L307.4 BD Biosciences DC 151 CADM1 3E1 MBL cDC1 152 CD1c L161 Biolegend cDC2 153 FceR1 AER-37 eBioscience cDC2 154 CD327 767329 R&D pDC 155 CDI23 6H6 BD Biosciences pDC 156 CD163 GHI Biolegend cDC2, mono 157 CXCR3 1C6 BD Biosciences cDC1 158 CD56 NCAM16.2 BD Biosciences NK cells, DC subsets 159 CD33 WM53 BD Biosciences myeloid cells 160 Clec9a 683409 R&D Systems cDC1 161 CD38 HIT2 Biolegend HSCs, plasma cells, NK cells T and B cells 162 CD10 HI10a Biolegend B cell precursors, T cell precursors, PMN 163 BTLA MIH26 Fluidigm cDC1, cDC2 subset 164 CD141 1A4 BD Biosciences cDC1 165 CD303 201A Biolegend pDC 166 CD16 3G8 Biolegend mono, NK cells 167 CX3CR1 KO124E1 Biolegend cDC2, mono 168 CCR2 KO36C2 Biolegend cDC, mono 169 CD116 4H11 Biolegend DC 170 CD19 HIB19 Biolegend B cells 171 CD34 581 Biolegend HSC 172 CD2 RPA-2.10 Biolegend cDC2 173 CD13 WM15 Biolegend cDC1 174 CD45RA HI100 Biolegend pDC 175 CD11c B-Ly6 BD Biosciences cDc 176 CD11b ICRF44 Biolegend cDC2 subset, mono
TABLE-US-00004 TABLE 4 Number of expressed genes detected per cell in the pre-DC C1 scmRNAseq experiment. Number of Number detected of detected Cell ID genes Cell ID genes RMS641 4997 RMS687 4667 RMS642 5935 RMS688 5199 RMS643 4873 RMS689 5320 RMS644 5000 RMS690 3683 RMS645 3193 RMS691 3816 RMS646 3255 RMS692 4366 RMS647 2653 RMS693 5400 RMS648 5217 RMS694 5018 RMS649 5191 RMS695 3457 RMS650 5235 RMS696 3660 RMS651 4836 RMS697 4845 RMS652 5715 RMS698 3945 RMS653 5224 RMS699 3801 RMS654 4681 RMS700 5533 RMS655 4014 RMS701 5089 RMS656 4134 RMS702 4365 RMS657 4895 RMS703 4462 RMS658 5094 RMS704 3770 RMS659 5405 RMS705 4897 RMS660 3701 RMS706 5048 RMS661 4432 RMS707 5435 RMS662 3298 RMS708 4930 RMS663 3843 RMS709 5308 RMS664 4417 RMS710 5067 RMS665 5162 RMS711 5536 RMS666 4042 RMS712 3275 RMS667 5172 RMS713 4810 RMS668 5129 RMS714 4878 RMS669 3613 RMS715 5270 RMS670 3571 RMS716 4324 RMS671 5016 RMS717 4130 RMS672 5170 RMS718 3840 RMS673 4996 RMS719 4134 RMS674 5462 RMS720 3592 RMS675 4190 RMS722 4461 RMS676 5206 RMS723 4804 RMS677 5590 RMS724 3950 RMS678 3177 RMS725 4062 RMS679 3938 RMS726 2551 RMS680 1802 RMS727 3749 RMS681 3377 RMS728 3574 RMS682 4166 RMS729 4247 RMS683 3863 RMS730 5363 RMS684 4279 RMS731 5072 RMS685 5128 RMS732 4992 RMS686 4884 RMS733 5301
TABLE-US-00005 TABLE 5 Lists of genes identified from the microarray DEG analysis comparisons along the lineage progression from early pre-DC to mature cDC, for cDC1 and cDC2 respectively, and the list of the 62 common genes. Profile Genes Profile Genes 62 common cDC1 cDC2 elements ABCA1 ABHD8 ACTN1 ABCB9 ACAD8 ADAM33 ABLIM1 ACTN1 ADAMTSL2 ACAA1 ADAM19 ARHGAP22 ACP5 ADAM33 AXL ACP6 ADAMTSL2 BATF3 ACSS1 AGPAT9 CARD11 ACTN1 AIF1 CCDC50 AGY3 ANXA2P1 CCND3 ADAM33 AOAH CD22 ADAMTSL2 AP4M1 CD52 ADAP1 APLP2 CLEC4C AIM1 ARHGAP1 CTSG ALG5 ARHGAP22 CYP2S1 ALOX5 ARHGAP23 CYP2S1 ALOX5AP AXL EXT1 AMICA1 BACH2 FCN1 ANG BATF3 GPRC5C ANPEP BTBD11 GPX7 ANXA2 C10ORF11 GRINA APOBEC3H C10ORF84 HAMP APOL2 C15ORF48 HRASLS3 APOL3 C16ORF33 HSPA12B ARHGAP22 C20ORF27 ID2 ARMET C2ORF89 IL3RA ASB16 C3ORF60 IRAK3 ASCL2 CARD11 KCNK10 ATN1 CCDC50 LGALS3 ATP2A1 CCL3L1 LILRA4 AXL CCND3 LIME1 B9D1 CD1C LIMS2 BAIAP3 CD1D LOC387841 BATF3 CD1E LOC387882 B LK CD207 LOC392382 BTLA CD22 LOC401720 BUB3 CD52 LTK C10ORF105 CD81 MARCKS C11ORF80 CD86 MUPCDH C15ORF39 CEBPB MYBPHL C17ORF61 CHST7 NCLN C19ORF10 CLEC4C OSBPL3 C1ORF21 CLIC3 PLAC8 C1ORF54 COQ10A PLP2 C1RL CREB5 PPP1R14A C20ORF100 CSTA RARRES3 C9ORF91 CTSG RHOC CACNA2D3 CXCR3 RPP21 CADM1 CYBASC3 RTN1 CALR CYP2S1 S100A9 CAMK1G DAB2 SERPING1 CAPN12 DEF8 SHD CAPZB DEK SIGLEC6 CARD11 DEPDC6 SLC15A2 CASP1 DFFB SLC20A1 CCDC123 E2F7 SLC44A2 CCDC50 ECE1 STARD7 CCNB2 ELMO1 STMN2 CCND1 ELOVL1 TBC1D19 CCND3 EML4 TCF4 CD22 EXT1 TP53I11 CD27 FAM105A ZBP1 CD300LB FAM1298 ZFP36L1 CD300LF FAM179A CD38 FAM26F CD5 FBXL6 CD52 FCGBP CD68 FCGR2A CD7 FCNI CD79A FCRLA CD79B FLJ22662 CDC20 GADD45B CDC25B GBP1 CDC45L GPRC5C CDH1 GPX7 CDH2 GRINA CDKN1A HAMP CDS1 HAPLN3 CECR1 HK2 CENPM HLA-DPB1 CLEC10A HLA-DQB1 CLEC4C HRASLS3 CLEC9A HSPAI2B CLNK HSPA7 CMTM3 HTR3A COL18A1 ID2 COMMD4 IL13RA1 CPNE3 IL3RA CPNE5 IRAK3 CPVL IRF8 CRKRS ITGAL CSF1R JDP2 CSRP1 KCNK10 CTSG LAT2 CXCL16 LCNL1 CYP2E1 LGALS3 CYP2S1 LHFPL2 DAB2 LILRA4 DAPK1 LIME1 DBN1 LIME2 DEX1 LIPT1 DIAPH3 LOC100134361 DUS3L LOC339352 DUSP3 LOC387841 DYSF LOC387882 EAF2 LOC389816 EEF1A2 LOC392382 ENO1 LOC401720 ENPP1 LOC440280 EPPB9 LOC642299 EXT1 LOC642367 FAIM3 LOC644879 FAM160A2 LOC728069 FAM30A LOC729406 FAR2 LOXL3 FBLN2 LRP1 FCER1A LRP5 FCER1G LRRC26 FCN1 LTK FER1L4 MADD FERMT3 MARCKS FIS1 MBNL1 FKBP11 MEFV FKBP1B MIIP FLJ40504 MUPCDH FNDC3B MYB GANC MYBPHL GAS6 MYL6B GDPD5 NCKAP1L GEMIN6 NCLN GGTL3 NOXA1 GLDC NRP1 GMPPB NTAN1 GPER OGFRL1 GPR162 OLFM1 GPRC5C OSBPL3 GPRC5D PACSIN1 GPS2 PAK1 GPX7 PARP10 GRINA PCBP1 GZMK PCP4L1 H2AFY2 PCSK4 HAMP PHYHD1 HCST PILRA HEXIM1 PLAC8 HK3 PLOD3 HLA-DOB PLP2 HN1 POLR2I HOPX PPM1J HRASLS2 PPP1R14A HRASLS3 PPP1R14B HSH2D PROC HSPA12B PTGS2 HSPA8 PTGS2 HVCN1 RAB20 ID2 RAB7L1 IDH2 RARRES3 IDO1 RASSF4 IGJ RHOC IGLL1 RILPL2 IGLL3 RPP21 IL3RA RS1 IL7R RTN1 INDO S100A8 IRAK2 S100A9 IRAK3 SCMH1 IRF2BP2 SCN9A IRF4 SERPINA1 ISCU SERPINF1 ISG20 SERPING1 ITM2C SGK ITPR3 SGK1 JARID2 SHANK3 KCNK10 SHD KCNK12 SIGLEC6 KIAA0101 SLAMF7 KIAA0114 SLC15A2 KIAA1191 SLC20A1 KIAA1545 SLC2A8 KIT SLC35C2 KLF6 SLC44A2 KRTI8P13 SMARCD3 L2HGDH SOX4 LAMP1 SP140 LGALS3 SPOCK2 LGALS8 SSR1 LILRA2 STARD7 LILRA4 STARD8 LILRB2 STMN2 LILRB4 TBC1D19 LIME1 TCF4 LIMS2 TCL1A LMNA TMEM14C LOC100130171 TMEM2 LOC100130367 TP53I11 LOC100130856 TREM1 LOC100131727 TRIB2 LOC100132444 TSPAN13 LOC144383 TXNIP LOC286076 USP24 LOC387841 VASN LOC387882 VCAN LOC392382 VEGFB LOC399988 VENTX LOC401720 VSIG4 LOC642113 ZAK LOC642755 ZBP1 LOC645381 ZFP36L1 LOC647506 ZNF469 LOC648366 ZNF503 LOC649210 LOC649923 LOC652493 LOC652694 LOC653468 LOC653566 LOC654191 LOC728014 LOC728093 LOC728557 LOC729086 LPXN LST1 LTK LYN MARCKS MBOAT2 MBOAT7 MCM4 MED12L MED27 MEI1 MGC13057 MGC29506 MGC33556 MIF MIR939 MIST MLKL MS4A6A MUPCDH
MYBPHL MYO1D MYO5C NADK NAV1 NCF4 NCLN NDRG1 NDRG2 NFATC2IP NGFRAP1 NLRC3 NRM NRSN2 NT5DC2 NUBP1 NUCB2 OSBPL10 OSBPL3 PARM1 PARP3 PCNA PDE9A PDIA4 PEPD PIK3CD PLAC8 PLCD1 PLD3 PLEKHG2 PLP2 PLXNB2 PMS2L4 POP5 POU2AF1 PPM1H PPP1R14A PRDM1 PRDX4 PRKCZ PRKD2 PRR5 PRSSL1 PSEN2 PSMB8 PSORS1C1 PTGER2 PTTG1 PTTG3P RAB30 RAB32 RAB43 RARRES3 RASGRP2 RASSF2 RHBDF2 RHOC RNF130 RNU6-15 RPP21 RPSI9BP1 RPS27L RTN1 RUFY1 S100A4 S100A9 SAMD3 SCPEP1 SDF2L1 SEC11C SEMA4C SEPT3 SERPINF2 SERPING1 SH2D3A SHD SHE SHMT2 SIAH1 SIGLEC6 SLC15A2 SLC15A3 SLC20A1 SLC25A4 SLC35A5 SLC41A2 SLC44A1 SLC44A2 SLC9A3R1 SLCO3A1 SMO SNCA SNN SNX22 SNX29 SNX3 SPATS2 SSR4 ST6GALNAC2 STARD5 STARD7 STMN2 SULF2 SUSD3 TACSTD2 TBC1D19 TCF4 TDRD1 TFPI TGM2 TLR3 TMEM109 TMEM167B TMEM216 TMEM97 TNFRSF13B TNFRSFI7 TNFRSF21 TNFSF12 TNNI2 TOP2A TOX2 TP53I11 TP53INP1 TRIB1 TRPM2 TSEN34 TSEN54 TSPAN33 TSPYL1 TUFT1 TXNDC5 TYMS TYROBP UBE2C UBXN11 UGCGL2 UNC119 UNG VAC14 VISA VPS37B VPS37D WDFY4 WDR34 WFS1 WWC3 XBP1 ZBP1 ZBTB32 ZFP36L1 ZNF662 ZNF821
TABLE-US-00006 TABLE 6 List of anti-human antibodies used for flow cytometry. Name Clone Fluorophore Source CADM1 3E1 Purified MBL CD116 4H1 Biotion Biolegend CD117 104D2 BV421 Biolegend CD11c B-ly6 V450 BD Biosciences CD11c 3.9 BV605 Biolegend CD123 7G3 BUV395 BD Biosciences CD123 6H6 PercP/Cy5.5 BD Biosciences CD135 4G8 PE BD Pharmigen CD135 4G8 BV711 BD Biosciences CD14 RMO52 ECD Beckman Coulter CD14 M5E2 BV711 Biolegend CD14 M5E2 BV650 BD Biosciences CD141 AD5-14H12 PE/Vio770 Miltenyi Biotec CD16 3G8 APC/Cy7 Biolegend CD16 3G8 BV650 BD Biosciences CD169 7-239 PE BD Biosciences CD172.alpha. SE5a5 PECy7 Biolegend CD183 1C6/CXCR3 APC BD Biosciences CD19 SJ25C1 BV650 BD Biosciences CD1c L161 PercP/Cy5.5 Biolegond CD1c L161 PE/Cy7 Biolegend CD1c L16I APC/Cy7 Biolegend CD2 RPA-2.10 BV421 BD Biosciences CD20 2H7 BV650 BD Biosciences CD22 HIB22 BV421 BD Biosciences CD26 BA5b PE/Cy7 Biolegend CD272 MIH26 PE Biolegend CD283 40C1285.6 PE Abcam CD289 J15A7 PE BD Biosciences CD3 SP34-2 BV650 BD Biosciences CD303 AC144 Biotin Miltenyi Biotec CD319 162.1 PE Biolegend CD327 767329 APC R&D Systems CD33 WM53 PE-CF594 BD Biosciences CD33 AC104.3E3 VioBlue Miltenyi Biotec CD33 P67.6 PercP/Cy5.5 BD Biosciences CD335 9E2 PerCP5.5 Biolegend CD34 581 Alexa Fluor 700 BD Biosciences CD40 5C3 PercP/Cy5.5 Biolegend CD45 HI30 V500 BD Biosciences CD45RA 5H9 FITC BD Biosciences CD45RA L48 PE/Cy7 BD Biosciences CD5 UCHT2 BB515 BD Biosciences CD66b G10F5 PerCP5.5 Biolegend CD7 124-1D1 PE eBioscience CD80 ASL24 PE Biolegend CD80 2D10 BV421 Biolegend CD83 HB15e PE Biolegend CD86 2331 (FUN-1) Biotin BD Biosciences CD88 S5/1 PE/Cy7 Biolegend Clec9a 8F9 APC Biolegend Clec9A 3A4/C1ec9A PE BD Biosciences CX3CR1 2A9-1 PE Biolegend CX3CR1 K0124E1 PE Biolegend CXCR3 G025H7 PE Biolegend Fc.epsilon.RI.alpha. AER-37 PerCP Biolegend Fc.epsilon.RI.alpha. AER-37 PE Biolegend HLA-DR L243 BV605 Biolegend HLA-DR L243 BV785 Biolegend IFN.alpha. LT27:295 FITC Miltenyi Biotec IL-12p40 C8.6 BV421 BD Biosciences ILT1 REA219 Biotin Miltenyi Biotec ILT3 ZM4.1 PE Biolegend IRF4 3E4 PE eBioscience IRF8 V3GYWCH PercP/eFluor710 eBioscience TLR7 A94B10 PE BD Biosciences TNF.alpha. Mab11 Alexa Flour 700 BD Biosciences secondary reagents: Live/Dead blue equ DAPI Life Technologies Streptavidin BUV737 BD Biosciences Chicken IgY Alexa Fluor 647 Jackson Immunoresearch
DETAILED DESCRIPTION OF THE DRAWINGS
Examples
[0112] Non-limiting examples of the invention will be further described in greater detail by reference to specific Examples, which should not be construed as in any way limiting the scope of the invention.
Example 1--Methods
[0113] Blood, Bone Marrow and Spleen Samples
[0114] Human samples were obtained in accordance with a favorable ethical opinion from Singapore SingHealth and National Health Care Group Research Ethics Committees. Written informed consent was obtained from all donors according to the procedures approved by the National University of Singapore Institutional Review Board and SingHealth Centralised Institutional Review Board. Peripheral blood mononuclear cells (PBMC) were isolated by Ficoll-Paque (GE Healthcare) density gradient centrifugation of apheresis residue samples obtained from volunteer donors through the Health Sciences Authorities (HSA, Singapore). Blood samples were obtained from 4 patients with molecularly confirmed Pitt-Hopkins syndrome (PHS), who all showed the classical phenotype (1). Spleen tissue was obtained from patients with tumors in the pancreas who underwent distal pancreatomy (Singapore General Hospital, Singapore). Spleen tissue was processed as previously described (2). Bone marrow mononuclear cells were purchased from Lonza.
[0115] Generation of Single Cell Transcriptomes Using MARS-Seq
[0116] MARS-Seq using the Biomek FXP system (Beckman Coulter) as previously described (3) was performed for scmRNAseq of the DC compartment of the human peripheral blood. In brief, Lineage marker (Lin)(CD3/14/16/19/20/34).sup.-CD45.sup.+CD135.sup.+HLA-DR.sup.+CD123.sup- .+CD33.sup.+ single cells were sorted into individual wells of 384-well plates filled with 2 .mu.l lysis buffer (Triton 0.2% (Sigma Aldrich) in molecular biology grade H.sub.2O (Sigma Aldrich), supplemented with 0.4 U/.mu.1 protein-based RNase inhibitor (Takara Bio Inc.), and barcoded using 400 nM IDT. Details regarding the barcoding procedure with poly-T primers were previously described (3). Samples were pre-incubated for 3 min at 80.degree. C. and reverse transcriptase mix consisting of 10 mM DTT (Invitrogen), 4 mM dNTPs (NEB), 2.5 U/.mu.l SuperScript III Reverse Transcriptase (Invitrogen) in 50 mM Tris-HCl (pH 8.3; Sigma), 75 mM KCl (Sigma), 3 mM MgCl.sub.2 (Sigma), ERCC RNA Spike-In mix (Life Technologies), at a dilution of 1:80*10.sup.7 per cell was added to each well. The mRNA was reverse-transcribed to cDNA with one cycle of 2 min at 42.degree. C., 50 min at 50.degree. C., and 5 min at 85.degree. C. Excess primers were digested with ExoI (NEB) at 37.degree. C. for 30 min then 10 min at 80.degree. C., followed by cleanup using SPRIselect beads at a 1.2.times. ratio (Beckman Coulter). Samples were pooled and second strands were synthesized using a Second Strand Synthesis kit (NEB) for 2.5 h at 16.degree. C., followed by a cleanup using SPRIselect beads at a 1.4.times. ratio (Beckman Coulter). Samples were linearly amplified by T7-promoter guided in vitro transcription using the T7 High Yield RNA polymerase IVT kit (NEB) at 37.degree. C. for 12 h. DNA templates were digested with Turbo DNase I (Ambion) for 15 min at 37.degree. C., followed by a cleanup with SPRIselect beads at a 1.2.times. ratio (Beckman Coulter). The RNA was then fragmented in Zn.sup.2+ RNA Fragmentation Solution (Ambion) for 1.5 min at 70.degree. C., followed by cleanup with SPRIselect beads at a 2.0 ratio (Beckman Coulter). Barcoded ssDNA adapters (IDT; details of barcode see (3)) were then ligated to the fragmented RNAs in 9.5% DMSO (Sigma Aldrich), 1 mM ATP, 20% PEG8000 and 1 U/.mu.l T4 RNA ligase I (NEB) solution in 50 mM Tris HCl pH7.5 (Sigma Aldrich), 10 mM MgCl.sub.2 and 1 mM DTT for 2 h at 22.degree. C. A second reverse transcription reaction was then performed using Affinity Script Reverse Transcription buffer, 10 mM DTT, 4 mM dNTP, 2.5 U/.mu.l Affinity Script Reverse Transcriptase (Agilent) for one cycle of 2 min at 42.degree. C., 45 min at 50.degree. C., and 5 min at 85.degree. C., followed by a cleanup on SPRIselect beads at a 1.5.times. ratio (Beckman Coulter). The final libraries were generated by subsequent nested PCR reactions using 0.5 .mu.M of each Illumina primer (IDT; details of primers see (3)) and KAPA HiFi HotStart Ready Mix (Kapa Biosystems) for 15 cycles according to manufacturer's protocol, followed by a final cleanup with SPRIselect beads at a 0.7.times. ratio (Beckman Coulter). The quality and quantity of the resulting libraries was assessed using an Agilent 2200 TapeStation instrument (Agilent), and libraries were subjected to next generation sequencing using an Illumina HiSeq1500 instrument (PE no index; read1: 61 reads (3 reads random nucleotides, 4 reads pool barcode, 53 reads sequence), read2: 13 reads (6 reads cell barcode, 6 reads unique molecular identifier)).
[0117] Pre-Processing, Quality Assessment and Control of MARS-Seq Single Cell Transcriptome Data
[0118] Cell specific tags and Unique Molecular Identifiers (UMIs) were extracted (2,496 cells sequenced) from sequenced data-pool barcodes. Sequencing reads with ambiguous plate and/or cell-specific tags, UMI sequences of low quality (Phred <27), or reads that mapped to E. coli were eliminated using Bowtie 1 sequence analysis software (4), with parameters "-M 1 -t --best --chunkmbs 64 -strata". Fastq files were demultiplexed using the fastx_barcode_splitter from fastx_toolkit, and R1 reads (with trimming of pooled barcode sequences) were mapped to the human hg38+ERCC pseudo genome assembly using Bowtie "-m 1 -t --best --chunkmbs 64 -strata". Valid reads were then counted using UMIs if they mapped to the exon-based gene model derived from the BiomaRt HG38 data mining tool provided by Ensembl (46). A gene expression matrix was then generated containing the number of UMIs for every cell and gene. Additionally, UMIs and cell barcode errors were corrected and filtered as previously described (3).
[0119] Normalization and Filtering of MARS-Seq Single Cell Transcriptome Data
[0120] In order to account for differences in total molecule counts per cell, a down-sampling normalization was performed as suggested by several studies (3, 5). Here, every cell was randomly down-sampled to a molecule count of 1,050 unique molecules per cell (threshold details discussed below). Cells with molecule counts <1,050 were excluded from the analysis (Table 1: number of detected genes per cell). Additionally, cells with a ratio of mitochondrial versus endogenous genes exceeding 0.2, and cells with <90 unique genes, were removed from the analysis. Prior to Seurat analysis (4), expression tables were filtered to exclude mitochondrial and ribosomal genes to remove noise.
[0121] Analysis of MARS-Seq Single Cell Transcriptome Data
[0122] Analysis of the normalized and filtered single-cell gene expression data (8,657 genes across 710 single cell transcriptomes used in the final expression table) was achieved using Mpath (6), PCA, tSNE, connectivity MAP (cMAP) (7) and several functions of the Seurat single cell analysis package. cMAP analysis was performed using DEGs between pDC and cDC derived from the gene expression omnibu data series GSE35457 (2). For individual cells, cMAP generated enrichment scores that quantified the degree of enrichment (or "closeness") to the given gene signatures. The enrichment scores were scaled and assigned positive or negative values to indicate enrichment for pDC or cDC signature genes, respectively. A permutation test (n=1,000) between gene signatures was performed on each enrichment score to determine statistical significance. For the tSNE/Seurat analysis, a Seurat filter was used to include genes that were detected in at least one cell (molecule count=1), and excluded cells with <90 unique genes. To infer the structure of the single-cell gene expression data, a PCA was performed on the highly variable genes determined as genes exceeding the dispersion threshold of 0.75. The first two principle components were used to perform a tSNE that was combined with a DBSCAN clustering algorithm (8) to identify cells with similar expression profiles. DBSCAN was performed by setting 10 as the minimum number of reachable points and 4.1 as the reachable epsilon neighbourhood parameter; the latter was determined using a KNN plot integrated in the DBSCAN R package (9) (https://cran.r-project.org/web/packages/dbscan/). The clustering did not change when using the default minimal number of reachable points.
[0123] To annotate the clusters, the gene signatures of blood pDC, cDC1 and cDC2 were derived from the Gene Expression Omnibus data series GSE35457 (2) (Table 2: lists of signature genes, data processing described below) to calculate the signature gene expression scores of cell type-specific gene signatures, and then these signature scores were overlaid onto the tSNE plots. Raw expression data of CD141.sup.+ (cDC1), CD1c.sup.+ (cDC2) DCs and pDC samples from blood of up to four donors (I, II, V and VI) was imported into Partek.RTM. Genomics Suite.RTM. software, version 6.6 Copyright.COPYRGT.; 2017 (PGS), where they were further processed. Data were quantile-normalized and log 2-transformed, and a batch-correction was performed for the donor using PGS. Differential probe expression was calculated from the normalized data (ANOVA, Fold-Change .gtoreq.2 and FDR-adj. p-value <0.05) for the three comparisons of every cell type against the remaining cell types. The three lists of differentially-expressed (DE) probes were intersected and only exclusively-expressed probes were used for the cell-type specific gene signatures. The probes were then reduced to single genes, by keeping the probe for a corresponding gene with the highest mean expression across the dataset. Resulting gene signatures for blood pDCs, CD1c.sup.+ and CD141.sup.+ DCs contained 725, 457 and 368 genes, respectively. The signature gene expression score was calculated as the mean expression of all signature genes in a cluster. In order to avoid bias due to outliers, the trimmed mean (trim=0.08) was calculated.
[0124] Monocle analysis was performed using the latest pre-published version of Monocle v.2.1.0 (10). The data were loaded into a monocle object and then log-transformed. Ordering of the genes was determined by dispersion analysis if they had an average expression of .gtoreq.0.5 and at least a dispersion of two times the dispersion fit. The dimensionality reduction was performed using the reduceDimension command with parameters max_components=2, reduction_method="DDRTree" and norm_method="log". The trajectory was then built using the plot_cell_trajectory command with standard parameters.
[0125] Wishbone analysis (11) was performed using the Python toolkit downloaded from https://github.com/ManuSetty/wishbone. MARS-seq data were loaded using the wishbone.wb.SCData.from_csv function with the parameters data_type='sc-seq' and normalize=True. Wishbone was then performed using wb.run_wishbone function with parameter start_cell="run1_CATG_AAGACA", components_list=[1, 2, 3, 4], num_waypoints=150, branch=True. Start_cell was randomly selected from the central cluster #4. Diffusion map analysis was performed using the scdata.run_diffusion_map function with default parameters (12). Wishbone revealed three trajectories giving rise to pDC, cDC1 and cDC2 respectively. Along each trajectory, the respective signature gene shows increasing expression (FIG. 8C). Although Wishbone results might be interpreted to suggest that cDC2 are early cells and differentiate into pDC and cDC1 on two separate branches, this is simply because Wishbone allows a maximum of two branches and assumes all cells fall on continuous trajectories. Nevertheless, it is able to delineate the three trajectories that are in concordance with Mpath, monocle, and diffusion map analysis.
[0126] C1 Single Cell mRNA Sequencing
[0127] Lin(CD3/14/16/19/20).sup.-HLA-DR.sup.+CD33.sup.+CD123.sup.+ cells at 300 cells/.mu.l were loaded onto two 5-10 .mu.m C1 Single-Cell Auto Prep integrated fluidic circuits (Fluidigm) and cell capture was performed according to the manufacturer's instructions. Individual capture sites were inspected under a light microscope to confirm the presence of single, live cells. Empty capture wells and wells containing multiple cells or cell debris were discarded for quality control. A SMARTer Ultra Low RNA kit (Clontech) and Advantage 2 PCR Kit (Clontech) was used for cDNA generation. An ArrayControl.TM. RNA Spots and Spikes kit (with spike numbers 1, 4 and 7) (Ambion) was used to monitor technical variability, and the dilutions used were as recommended by the manufacturer. The concentration of cDNA for each single cell was determined by Quant-iT.TM. PicoGreen.RTM. dsDNA Reagent, and the correct size and profile was confirmed using DNA High Sensitivity Reagent Kit and DNA Extended Range LabChip (Perkin Elmer). Multiplex sequencing libraries were generated using the Nextera XT DNA Library Preparation Kit and the Nextera XT Index Kit (Illumina). Libraries were pooled and subjected to an indexed PE sequencing run of 2.times.51 cycles on an Illumina HiSeq 2000 (Illumina) at an average depth of 2.5-million row reads/cell.
[0128] C1 Single Cell Analysis
[0129] Raw reads were aligned to the human reference genome GRCh38 from GENCODE (13) using RSEM program version 1.2.19 with default parameters (14). Gene expression values in transcripts per million were calculated using the RSEM program and the human GENCODE annotation version 22. Quality control and outlier cell detection was performed using the SINGuLAR (Fluidigm) analysis toolset. cMAP analysis was performed using cDC1 versus cDC2 DEGs identified from Gene Expression Omnibus data series GSE35457 (2), and the enrichment scores were obtained. Similar to the gene set enrichment analyses, cMAP was used to identify associations of transcriptomic profiles with cell-type characteristic gene signatures.
[0130] Mpath Analysis of MARS- or C1 Single Cell mRNA Sequencing Data
[0131] Developmental trajectories were defined using the Mpath algorithm (6), which constructs multi-branching cell lineages and re-orders individual cells along the branches. In the analysis of the MARS-seq single cell transcriptomic data, the Seurat R package was first used to identify five clusters: for each cluster, Mpath calculated the centroid and used it as a landmark to represent a canonical cellular state; subsequently, for each single cell, Mpath calculated its Euclidean distance to all the landmarks, and identified the two nearest landmarks. Each individual cell was thus assigned to the neighborhood of its two nearest landmarks. For every pair of landmarks, Mpath then counted the number of cells that were assigned to the neighborhood, and used the determined cell counts to estimate the possibility of the transition between landmarks to be true. A high cell count implied a high possibility that the transition was valid. Mpath then constructed a weighted neighborhood network whereby nodes represented landmarks, edges represented a putative transition between landmarks, and numbers allocated to the edges represented the cell-count support for the transition. Given that single cell transcriptomic data tend to be noisy, edges with low cell-count support were considered likely artifacts. Mpath therefore removed the edges with a low cell support by using (0-n) (n-n represents cell count) to quantify the distance between nodes followed by applying a minimum spanning tree algorithm to find the shortest path that could connect all nodes with the minimum sum of distance. Consequently, the resulting trimmed network is the one that connects all landmarks with the minimum number of edges and the maximum total number of cells on the edges. Mpath was then used to project the individual cells onto the edge connecting its two nearest landmarks, and assigned a pseudo-time ordering to the cells according to the location of their projection points on the edge. In the analysis of the C1 single cell transcriptome data, the cMAP analysis was first used to identify cDC1-primed, un-primed, and cDC2-primed clusters, and then Mpath was used to construct the lineage between these three clusters. The Mpath analysis was carried out in an un-supervised manner without prior knowledge of the starting cells or number of branches. This method can be used for situations of non-branching networks, bifurcations, and multi-branching networks with three or more branches.
[0132] Mass Cytometry Staining, Barcoding, Acquisition and Data Analysis
[0133] For mass cytometry, pre-conjugated or purified antibodies were obtained from Invitrogen, Fluidigm (pre-conjugated antibodies), Biolegend, eBioscience, Becton Dickinson or R&D Systems as listed in Table 3. For some markers, fluorophore- or biotin-conjugated antibodies were used as primary antibodies, followed by secondary labeling with anti-fluorophore metal-conjugated antibodies (such as the anti-FITC clone FIT-22) or metal-conjugated streptavidin, produced as previously described (15). Briefly, 3.times.10.sup.6 cells/well in a U-bottom 96 well plate (BD Falcon, Cat #3077) were washed once with 200 .mu.L FACS buffer (4% FBS, 2 mM EDTA, 0.05% Azide in 1.times.PBS), then stained with 100 .mu.L 200 .mu.M cisplatin (Sigma-Aldrich, Cat #479306-1G) for 5 min on ice to exclude dead cells. Cells were then incubated with anti-CADM1-biotin and anti-CD19-FITC primary antibodies in a 50 .mu.L reaction for 30 min on ice. Cells were washed twice with FACS buffer and incubated with 50 .mu.L heavy-metal isotope-conjugated secondary mAb cocktail for 30 min on ice. Cells were then washed twice with FACS buffer and once with PBS before fixation with 200 .mu.L 2% paraformaldehyde (PFA; Electron Microscopy Sciences, Cat #15710) in PBS overnight or longer. Following fixation, the cells were pelleted and resuspended in 200 uL 1.times. permeabilization buffer (Biolegend, Cat #421002) for 5 mins at room temperature to enable intracellular labeling. Cells were then incubated with metal-conjugated anti-CD68 in a 50 .mu.L reaction for 30 min on ice. Finally, the cells were washed once with permeabilization buffer and then with PBS before barcoding.
[0134] Bromoacetamidobenzyl-EDTA (BABE)-linked metal barcodes were prepared by dissolving BABE (Dojindo, Cat #B437) in 100 mM HEPES buffer (Gibco, Cat #15630) to a final concentration of 2 mM. Isotopically-purified PdCl2 (Trace Sciences Inc.) was then added to the 2 mM BABE solution to a final concentration of 0.5 mM. Similarly, DOTA-maleimide (DM)-linked metal barcodes were prepared by dissolving DM (Macrocyclics, Cat #B-272) in L buffer (MAXPAR, Cat #PN00008) to a final concentration of 1 mM. RhCl.sub.3 (Sigma) and isotopically-purified LnCl.sub.3 was then added to the DM solution at 0.5 mM final concentration. Six metal barcodes were used: BABE-Pd-102, BABE-Pd-104, BABE-Pd-106, BABE-Pd-108, BABE-Pd-110 and DM-Ln-113.
[0135] All BABE and DM-metal solution mixtures were immediately snap-frozen in liquid nitrogen and stored at -80.degree. C. A unique dual combination of barcodes was chosen to stain each tissue sample. Barcode Pd-102 was used at 1:4000 dilution, Pd-104 at 1:2000, Pd-106 and Pd-108 at 1:1000, Pd-110 and Ln-113 at 1:500. Cells were incubated with 100 .mu.L barcode in PBS for 30 min on ice, washed in permeabilization buffer and then incubated in FACS buffer for 10 min on ice. Cells were then pelleted and resuspended in 100 .mu.L nucleic acid Ir-Intercalator (MAXPAR, Cat #201192B) in 2% PFA/PBS (1:2000), at room temperature. After 20 min, cells were washed twice with FACS buffer and twice with water before a final resuspension in water. In each set, the cells were pooled from all tissue types, counted, and diluted to 0.5.times.10.sup.6 cells/mL. EQ Four Element Calibration Beads (DVS Science, Fluidigm) were added at a 1% concentration prior to acquisition. Cell data were acquired and analyzed using a CyTOF Mass cytometer (Fluidigm).
[0136] The CyTOF data were exported in a conventional flow-cytometry file (.fcs) format and normalized using previously-described software (16). Events with zero values were randomly assigned a value between 0 and -1 using a custom R script employed in a previous version of mass cytometry software (17). Cells for each barcode were deconvolved using the Boolean gating algorithm within FlowJo. The CD45.sup.+Lin (CD7/CD14/CD15/CD16/CD19/CD34).sup.-HLA-DR.sup.+ population of PBMC were gated using FlowJo and exported as a .fcs file. Marker expression values were transformed using the logicle transformation function (18). Random sub-sampling without replacement was performed to select 20,000 cell events. The transformed values of sub-sampled cell events were then subjected to t-distributed Stochastic Neighbor Embedding (tSNE) dimension reduction (19) using the markers listed in Table 3, and the Rtsne function in the Rtsne R package with default parameters. Similarly, isometric feature mapping (isoMAP) (20) dimension reduction was performed using vegdist, spantree and isomap functions in the vegan R package (21).
[0137] The vegdist function was run with method="euclidean". The spantree function was run with default parameters. The isoMAP function was run with ndim equal to the number of original dimensions of input data, and k=5. Phenograph clustering (22) was performed using the markers listed in Table 3 before dimension reduction, and with the number of nearest neighbors equal to 30. The results obtained from the tSNE, isoMAP and Phenograph analyses were incorporated as additional parameters in the .fcs files, which were then loaded into FlowJo to generate heat plots of marker expression on the reduced dimensions. The above analyses were performed using the cytofkit R package which provides a wrapper of existing state-of-the-art methods for cytometry data analysis (23).
[0138] Human Cell Flow Cytometry: Labeling, Staining, Analysis and Cell Sorting
[0139] All antibodies used for fluorescence-activated cell sorting (FACS) and flow cytometry were mouse anti-human monoclonal antibodies (mAbs), except for chicken anti-human CADM1 IgY primary mAb. The mAbs and secondary reagents used for flow cytometry are listed in Table 6. Briefly, 5.times.10.sup.6 cells/tube were washed and incubated with Live/Dead blue dye (Invitrogen) for 30 min at 4.degree. C. in phosphate buffered saline (PBS) and then incubated in 5% heat-inactivated fetal calf serum (FCS) for 15 min at 4.degree. C. (Sigma Aldrich). The appropriate antibodies diluted in PBS with 2% fetal calf serum (FCS) and 2 mM EDTA were added to the cells and incubated for 30 min at 4.degree. C., and then washed and detected with the secondary reagents. For intra-cytoplasmic or intra-nuclear labeling or staining, cells were fixed and permeabilized with BD Cytofix/Cytoperm (BD Biosciences) or with eBioscience FoxP3/Transcription Factor Staining Buffer Set (eBioscience/Affimetrix), respectively according to the manufacturer's instructions. Flow cytometry was performed using a BD LSRII or a BD FACSFortessa (BD Biosciences) and the data analyzed using BD FACSDiva 6.0 (BD Biosciences) or FlowJo v.10 (Tree Star Inc.). For isolation of precursor dendritic cells (pre-DC), PBMC were first depleted of T cells, monocytes and B cells with anti-CD3, anti-CD14 and anti-CD20 microbeads (Miltenyi Biotec) using an AutoMACS Pro Separator (Miltenyi Biotec) according to the manufacturer's instructions. FACS was performed using a BD FACSAriaII or BD FACSAriaIII (BD Biosciences). Wanderlust analysis (33) of flow cytometry data was performed using the CYT tool downloaded from https://www.c2b2.columbia.edu/danapeerlab/html/cyt-download.html. As Wanderlust requires users to specify a starting cell, one cell was selected at random from the CD45RA.sup.+CD123.sup.+ population.
[0140] Cytospin and Scanning Electron Microscopy
[0141] Cytospins were prepared from purified cells and stained with the Hema 3 system according to the manufacturer's protocol (Fisher Diagnostics). Images were analyzed at 100.times. magnification with an Olympus BX43 upright microscope (Olympus). Scanning electron microscopy was performed as previously described (2).
[0142] Dendritic Cell (DC) Differentiation Co-Culture Assay on MS-5 Stromal Cells
[0143] MS-5 stromal cells were maintained and passaged as previously described (24). MS-5 cells were seeded in 96-well round-bottom plates (Corning) at 3,000 cells per well in complete alpha-Minimum Essential Media (.alpha.-MEM) (Life Technologies) supplemented with 10% fetal bovine serum (FBS) (Serana) and 1% penicillin/streptomycin (Nacalai Tesque). A total of 5,000 sorted purified cells were added 18-24 h later, in medium containing 200 ng/mL Flt3L (Miltenyi Biotec), 20 ng/mL SCF (Miltenyi Biotec), and 20 ng/mL GM-CSF (Miltenyi Biotec), and cultured for up to 5 days. The cells were then resuspended in their wells by physical dissociation and filtered through a cell strainer into a polystyrene FACS tube.
[0144] Intracellular Cytokine Detection Following Stimulation with TLR Ligands
[0145] A total of 5.times.10.sup.6 PBMC were cultured in Roswell Park Memorial Institute (RPMI)-1640 Glutmax media (Life Technologies) supplemented with 10% FBS, 1% penicillin/streptomycin and stimulated with either lipopolysaccharide (LPS, 100 ng/mL; InvivoGen), LPS (100 ng/mL)+interferon gamma (IFN.gamma., 1,000 U/mL; R&D Systems), Flagellin (100 ng/mL, Invivogen), polyI:C (10 .mu.g/mL; InvivoGen), Imidazoquinoline (CL097; Invivogen) or CpG oligodeoxynucleotides 2216 (ODN, 5 .mu.M; InvivoGen) for 2 h, after which 10 .mu.g/ml Brefeldin A solution (eBioscience) was added and the cells were again stimulated for an additional 4 h. After the 6 h stimulation, the cells were labeled with cytokine-specific antibodies and analyzed by flow cytometry, as described above.
[0146] Mixed Lymphocyte Reaction
[0147] Naive T cells were isolated from PBMC using Naive Pan T-Cell Isolation Kit (Miltenyi Biotec) according to the manufacturer's instructions, and labeled with 0.2 .mu.M carboxyfluorescein succinimidyl ester (CFSE) (Life Technologies) for 5 min at 37.degree. C. A total of 5,000 cells from sorted DC subsets were co-cultured with 100,000 CFSE-labeled naive T cells for 7 days in Iscove's Modified Dulbecco's Medium (IMDM; Life Technologies) supplemented with 10% KnockOut.TM. Serum Replacement (Life Technologies). On day 7, the T cells were stimulated with 10 .mu.g/ml phorbol myristate acetate (InvivoGen) and 500 .mu.g/ml ionomycin (Sigma Aldrich) for 1 h at 37.degree. C. 10 .mu.g/ml Brefeldin A solution was added for 4 h, after which the cells were labeled with cytokine-specific antibodies and analyzed by flow cytometry, as described above.
[0148] Electron Microscopy
[0149] Sorted cells were seeded on poly-lysine-coated coverslips for 1 h at 37.degree. C. The cells were then fixed in 2% glutaraldehyde in 0.1 M cacoldylate buffer, pH 7.4 for 1 h, post fixed for 1 h with 2% buffered osmium tetroxide, then dehydrated in a graded series of ethanol solutions, before embedding in epoxy resin. Images were acquired with a Quemesa (SIS) digital camera mounted on a Tecnai 12 transmission electron microscope (FEI Company) operated at 80 kV.
[0150] Microarray Analysis
[0151] Total RNA was isolated from FACS-sorted blood pre-DC and DC subsets using a RNeasy.RTM. Micro kit (Qiagen). Total RNA integrity was assessed using an Agilent Bioanalyzer (Agilent) and the RNA Integrity Number (RIN) was calculated. All RNA samples had a RIN .gtoreq.7.1. Biotinylated cRNA was prepared using an Epicentre TargetAmp.TM. 2-Round Biotin-aRNA Amplification Kit 3.0 according to the manufacturer's instructions, using 500 pg of total RNA starting material. Hybridization of the cRNA was performed on an Illumina Human-HT12 Version 4 chip set (Illumina). Microrarray data were exported from GenomeStudio (Illumina) without background subtraction. Probes with detection P-values >0.05 were considered as not being detected in the sample, and were filtered out. Expression values for the remaining probes were log.sub.e transformed and quantile normalized. For differentially-expressed gene (DEG) analysis, comparison of one cell subset with another was carried out using the limma R software package (25) with samples paired by donor identifiers. DEGs were selected with Benjamini-Hochberg multiple testing (26) corrected P-value <0.05. In this way, limma was used to select up and down-regulated signature genes for each of the cell subsets in the pre-DC data by comparing one subset with all other subsets pooled as a group. Expression profiles shown in FIG. 4E were from 62 common genes identified from the union of DEGs from comparing pre-cDC1 versus early pre-DC and cDC1 versus pre-cDC1, and the union of DEGs from comparing pre-cDC2 versus early pre-DC and cDC2 versus pre-cDC2 (see Table 5 for the lists of DEGs for cDC1 lineage and cDC2 lineage, and the lists of the 62 common genes; FIG. 23 for Venn diagram comparison of the two lists of DEGs and identification of the 62 common genes).
[0152] Luminex.RTM. Drop Array.TM. Assay on Sorted and Stimulated Pre-DC and DC Populations
[0153] A total of 2,000 cells/well of sorted pre-DC and DC subsets were seeded in V-bottom 96 well plates and then incubated for 18 h in 50 .mu.L complete RPMI-1640 Glutmax media (Life Technologies) supplemented with 10% FBS and 1% penicillin/streptomycin, and stimulated with either LPS, LPS+IFN.gamma., Flagellin, polyI:C, Imidazoquinoline or CpG oligodeoxynucleotides (ODN) 2216. Cells were then pelleted and 30 .mu.L supernatant was collected. A Luminex.RTM. Drop Array.TM. was performed using 5 .mu.L of the supernatant. Human G-CSF, GM-CSF, IFN-.alpha.2, IL-10, IL-12p40, IL-12p70, IL-15, IL-1RA, IL-1a, IL-1b, IL-6, IL-7, IL-8, MIP-1b, TNF-.alpha., TNF-.beta. were tested by multiplexing (EMD Millipore) with DropArray-bead plates (Curiox) according to the manufacturer's instructions. Acquisition was performed using xPONENT 4.0 (Luminex) acquisition software, and data analysis was performed using Bio-Plex Manager 6.1.1 (Bio-Rad).
[0154] Statistical Analyses
[0155] The Mann-Whitney test was used to compare data derived from patients with Pitt-Hopkins Syndrome and controls and the intracellular detection of IL-12p40 and TNF-.alpha. in pre-DC stimulated with LPS or poly I:C versus CpG ODN 2216. The Kruskal-Wallis test, followed by the Dunn's multiple comparison test, was used to compare the expression level of individual genes in single cells in the MARS-seq single cell RNAseq dataset. Differences were defined as statistically significant when adjusted P<0.05. All statistical tests were performed using GraphPad Prism 6.00 for Windows (GraphPad Software). Correlation coefficients were calculated as Pearson's correlation coefficient.
Example 2--Results
[0156] Unbiased Identification of DC Precursors by Unsupervised Single-Cell RNAseq and CyTOF
[0157] Using PBMC isolated from human blood, massively-parallel single-cell mRNA sequencing (MARS-seq) (3) was performed to assess the transcriptional profile of 710 individual cells within the lineage marker (Lin)(CD3/CD14/CD16/CD20/CD34).sup.-, HLA-DR.sup.+CD135.sup.+ population (FIG. 1, A to G, and FIG. 7A: sorting strategy, FIG. 7, B to J: workflow and quality control, Table 1: number of detected genes). The MARS-seq data were processed using non-linear dimensionality reduction via t-stochastic neighbor embedding (tSNE), which enables unbiased visualization of high-dimensional similarities between cells in the form of a two-dimensional map (15, 27, 19). Density-based spatial clustering of applications with noise (DBSCAN) (8) on the tSNE dimensions identified five distinct clusters of transcriptionally-related cells within the selected PBMC population (FIG. 1A, and FIG. 7G). To define the nature of these clusters, gene signature scores were calculated for pDC, cDC1 and cDC2 (as described in (2), Table 2: lists of signature genes), and the expression of the signatures attributed to each cell was overlaid onto the tSNE visualization. Clusters #1 and #2 (containing 308 and 72 cells, respectively) were identified as pDC, cluster #3 (containing 160 cells) was identified as cDC1, and cluster #5 (containing 120 cells) was identified as cDC2. Cluster #4 (containing 50 cells) laid in between the cDC1 (#3) and cDC2 (#5) clusters and possessed a weak, mixed pDC/cDC signature (FIG. 1A). A connectivity MAP (cMAP) analysis (7) was employed to calculate the degree of enrichment of pDC or cDC signature gene transcripts in each individual cell. This approach confirmed the signatures of pDC (#1 and #2) and cDC (#3 and #5) clusters, and showed that most cells in cluster #4 expressed a cDC signature (FIG. 1B).
[0158] The Mpath algorithm (6) was then applied to the five clusters to identify hypothetical developmental relationships based on these transcriptional similarities between cells (FIG. 1C, and FIGS. 8, A and B). Mpath revealed that the five clusters were grouped into three distinct branches with one central cluster (cluster #4) at the intersection of the three branches (FIG. 1C, and FIG. 8A). The Mpath edges connecting cluster #4 to cDC1 cluster #3 and cDC2 cluster #5 have a high cell count (159 and 137 cells, respectively), suggesting that the transition from cluster #4 to clusters #3 and #5 is likely valid, and indicates that cluster #4 could contain putative cDC precursors (FIG. 1C). In contrast, the edge connecting cluster #4 and pDC cluster #2 has a cell count of only 7 (FIG. 1C, and FIG. 8B), which suggests that this connection is very weak. The edge connecting cluster #4 and #2 was retained when Mpath trimmed the weighted neighborhood network (FIG. 8B), simply due to the feature of the Mpath algorithm that requires all clusters to be connected (6). Monocle (10), principal component analyses (PCA), Wishbone (11) and Diffusion Map algorithms (12) were used to confirm these findings. Monocle and PCA resolved the cells into the same three branches as the original Mpath analysis, with the cells from the tSNE cluster #4 again falling at the intersection (FIGS. 1, D and E). Diffusion Map and Wishbone analyses indicated that there was a continuum between clusters #3 (cDC1), #4 and #5 (cDC2): cells from cluster #4 were predominantly found in the DiffMap_dim2.sup.low region, and cells from clusters #3 and #5 were progressively drifting away from the DiffMap_dim2.sup.low region towards the left and right, respectively. The pDC clusters (#1 and #2) were clearly separated from all other clusters (FIG. 1F, and FIG. 8C). In support of this observation, cells from these pDC clusters had a higher expression of pDC-specific markers and transcription factors (TF) than the cDC clusters (#3 and #5) and central cluster #4. Conversely, cells in cluster #4 expressed higher levels of markers and TF associated with all cDC lineage than the pDC clusters (FIG. 1G). This points to the possibility that cluster #4 represented a population of putative uncommitted cDC precursors.
[0159] Next, CyTOF, which simultaneously measures the intensity of expression of up to 38 different molecules at the single cell level, was employed to further understand the composition of the delineated sub-populations. A panel of 38 labeled antibodies were designed to recognize DC lineage and/or progenitor-associated surface molecules (Table 3, FIG. 1, H to J, and FIG. 9), and the molecules identified in cluster #4 by MARS-seq, such as CD2, CX3CR1, CD11c and HLA-DR (FIG. 1I). Using the tSNE algorithm, the CD45.sup.+Lin(CD7/CD14/CD15/CD16/CD19/CD34).sup.-HLA-DR.sup.+PBMC fraction (FIG. 9A) resolved into three distinct clusters representing cDC1, cDC2 and pDC (FIG. 1H). An intermediate cluster at the intersection of the cDC and pDC clusters that expressed both cDC-associated markers (CD11c/CX3CR1/CD2/CD33/CD141/BTLA) and pDC-associated markers (CD45RA/CD123/CD303) (FIG. 1, I to J, and FIG. 9B) corresponded to the MARS-seq cluster #4. The delineation of these clusters was confirmed when applying the phenograph unsupervised clustering algorithm (22) (FIG. 9C). The position of the intermediate CD123.sup.+CD33.sup.+ cell cluster was distinct, and the cells exhibited high expression of CD5, CD327, CD85j, together with high levels of HLA-DR and the cDC-associated molecule CD86 (FIG. 1, I to J). Taken together, these characteristics raise the question of whether CD123.sup.+CD33.sup.+ cells might represent circulating human pre-DC.
[0160] Pre-DC Exist within the pDC Fraction and Give Rise to cDC
[0161] The CD123.sup.+CD33.sup.+ cell cluster within the Lin.sup.-HLA-DR.sup.+ fraction of the PBMC was analyzed by flow cytometry. Here, CD123.sup.+CD33.sup.- pDC, CD45RA.sup.+/-CD123.sup.-cDC1 and cDC2, and CD33.sup.+CD45RA.sup.+CD123.sup.+ putative pre-DC were identified (FIG. 2A, and FIG. 10A). The putative pre-DC expressed CX3CR1, CD2, CD303 and CD304, with low CD11c expression, whereas CD123.sup.+CD33.sup.- pDC exhibited variable CD2 expression (FIGS. 2, A and B, and FIGS. 10, B and C).
[0162] The analysis was extended to immune cells from the spleen and a similar putative pre-DC population was identified, which was more abundant than in blood and expressed higher levels of CD11c (FIGS. 2, A and C, and FIG. 10D).
[0163] Both putative pre-DC populations in the blood and spleen expressed CD135 and intermediate levels of CD141 (FIG. 10C). Wright-Giemsa staining of putative pre-DC sorted from the blood revealed an indented nuclear pattern reminiscent of classical cDC, a region of perinuclear clearing, and a basophilic cytoplasm reminiscent of pDC (FIG. 2D).
[0164] At the ultra-structural level, putative pre-DC and pDC exhibited distinct features, despite their morphological similarities (FIG. 2E, and FIG. 10E): putative pre-DC possessed a thinner cytoplasm, homogeneously-distributed mitochondria (m), less rough endoplasmic reticulum (RER), an indented nuclear pattern, a large nucleus and limited cytosol, compared to pDC; pDC contained a smaller nucleus, abundant cytosol, packed mitochondria, well-developed and polarized cortical RER organized in parallel cisterna alongside numerous stacks of rough ER membranes, suggesting a developed secretory apparatus, in agreement with previously-published data (28).
[0165] The differentiation capacity of pre-DC to that of cDC and pDC, through stromal culture in the presence of FLT3L, GMCSF and SCF was compared, as previously described (24). After 5 days, the pDC, cDC1 and cDC2 populations remained predominantly in their initial states, whereas the putative pre-DC population had differentiated into cDC1 and cDC2 in the known proportions found in vivo (29, 2, 30, 31) (FIG. 2F, FIG. 10F, and FIG. 11). Altogether, these data suggest that CD123.sup.+CD33.sup.+CD45RA.sup.+CX3CR1.sup.+CD2.sup.+ cells are circulating pre-DC with cDC differentiation potential.
[0166] Breton and colleagues (32) recently reported a minor population of human pre-DC (highlighted in FIG. 12A), which shares a similar phenotype with the Lin.sup.- CD123.sup.+CD33.sup.+CD45RA.sup.+ pre-DC defined here (FIGS. 12, A and B). The present results reveal that the pre-DC population in blood and spleen is markedly larger than the one identified within the minor CD303.sup.-CD141.sup.-CD117.sup.+ fraction considered previously (FIGS. 12, C and D).
[0167] Pre-DC are Functionally Distinct from pDC
[0168] IFN.alpha.-secreting pDC can differentiate into cells resembling cDC when cultured with IL-3 and CD40L (33, 34), and have been considered DC precursors (34). However, when traditional ILT3.sup.+ILT1.sup.- (33) or CD4.sup.+CD11c.sup.- (34) pDC gating strategies were used, a "contaminating" CD123.sup.+CD33.sup.+CD45RA.sup.+ pre-DC sub-population in both groups was detected (FIGS. 12, E and F). This "contaminating" sub-population result raises the question on whether other properties of traditionally-classified "pDC populations" might be attributed to pre-DC. TLR7/8 (CL097) or TLR9 (CpG ODN 2216) stimulation of pure pDC cultures resulted in abundant secretion of IFN.alpha., but not IL-12p40, whereas pre-DC readily secreted IL-12p40 but not IFN-.alpha. (FIG. 2G, and FIG. 13). Furthermore, while pDC were previously thought to induce proliferation of naive CD4.sup.+ T cells (32, 35), here only the pre-DC sub-population was found to exhibit this attribute (FIG. 2H). Reports of potent allostimulatory capacity and IL-12p40 production by CD2.sup.+ pDC (35) might then be explained by CD2.sup.+ pre-DC "contamination" (36) (FIG. 14).
[0169] Pitt-Hopkins Syndrome (PHS) is characterized by abnormal craniofacial and neural development, severe mental retardation, and motor dysfunction, and is caused by haplo-insufficiency of TCF4, which encodes the E2-2 transcription factor--a central regulator of pDC development (37). Patients with PHS had a marked reduction in their blood pDC numbers compared to healthy individuals, but retained a population of pre-DC (FIG. 2I, and FIG. 15), which likely accounts for the unexpected CD45RA.sup.+CD123.sup.+CD303.sup.lo cell population reported in these patients (57). Taken together, the present data indicate that, while pre-DC and pDC share some phenotypic features, they can be separated by their differential expression of several markers, including CD33, CX3CR1, CD2, CD5 and CD327. pDC are bona fide IFN.alpha.-producing cells, but the reported IL-12 production and CD4.sup.+ T-cell allostimulatory capacity of pDC can likely be attributed to "contaminating" pre-DC, which can give rise to both cDC1 and cDC2.
[0170] Identification and Characterization of Committed Pre-DC Subsets
[0171] The murine pre-DC population contains both uncommitted and committed pre-cDC1 and pre-cDC2 precursors (38). Thus, microfluidic scmRNAseq was used to determine whether the same was true for human blood pre-DC, (FIG. 16A: sorting strategy, FIGS. 16, B and C: workflow and quality control, Table 4: number of expressed genes). The additional single cell gene expression data relative to the MARS-seq strategy used for FIG. 1, A to G (2.5 million reads/cell and an average of 4,742 genes detected per cell vs 60,000 reads/cell and an average of 749 genes detected per cell, respectively) was subjected to cMAP analysis, which calculated the degree of enrichment for cDC1 or cDC2 signature gene transcripts (2) for each single cell (FIG. 3A). Among the 92 analyzed pre-DC, 25 cells exhibited enrichment for cDC1 gene expression signatures, 12 cells for cDC2 gene expression signatures, and 55 cells showed no transcriptional similarity to either cDC subset. Further Mpath analysis showed that these 55 "unprimed" pre-DC were developmentally related to cDC1-primed and cDC2-primed pre-DC, and thus their patterns of gene expression fell between the cDC1 and cDC2 signature scores by cMAP (FIG. 3B, and FIG. 17). These data suggest that the human pre-DC population contains cells exhibiting transcriptomic priming towards cDC1 and cDC2 lineages, as observed in mice (38).
[0172] This heterogeneity within the pre-DC population by flow cytometry were further subjected to identification using either pre-DC-specific markers (CD45RA, CD327, CD5) or markers expressed more intensely by pre-DC compared to cDC2 (BTLA, CD141). 3D-PCA analysis of the Lin.sup.-HLA-DR.sup.+CD33.sup.+ population (containing both differentiated cDC and pre-DC) identified three major cell clusters: CADM1.sup.+cDC1, CD1c.sup.+cDC2 and CD123.sup.+ pre-DC (FIG. 3C, and FIG. 18A). Interestingly, while cells located at the intersection of these three clusters (FIG. 3D) expressed lower levels of CD123 than pre-DC, but higher levels than differentiated cDC (FIG. 3C), they also expressed high levels of pre-DC markers (FIG. 3D, and FIG. 18A). It is possible that these CD45RA.sup.+CD123.sup.lo cells might be committed pre-DC that are differentiating into either cDC1 or cDC2 (FIG. 3E). The Wanderlust algorithm (39), which orders cells into a constructed trajectory according to their maturity, confirmed the developmental relationship between pre-DC (early events), CD45RA.sup.+CD123.sup.lo cells (intermediate events) and mature cDC (late events) (FIG. 3F). Flow cytometry of PBMC identified CD123.sup.+CADM1.sup.-CD1c.sup.- putative uncommitted pre-DC, alongside putative CADM1.sup.+CD1c.sup.- pre-cDC1 and CADM1.sup.-CD1c.sup.+ pre-cDC2 within the remaining CD45RA.sup.+ cells (FIG. 3G, and FIG. 18B). These three populations were also present, and more abundant, in the spleen (FIG. 18C). Importantly, in vitro culture of pre-DC subsets sorted from PBMC did not give rise to any CD303.sup.+ cells (which would be either undifferentiated pre-DC or differentiated pDC), whereas early pre-DC gave rise to both cDC subsets, and pre-cDC1 and pre-cDC2 differentiated exclusively into cDC1 and cDC2 subsets, respectively (FIG. 3H, FIG. 18D, and FIG. 19).
[0173] Scanning electron microscopy confirmed that early pre-DC are larger and rougher in appearance than pDC, and that committed pre-DC subsets closely resemble their mature cDC counterparts (FIG. 3I, and FIG. 20A). Phenotyping of blood pre-DC by flow cytometry (FIG. 24B) identified patterns of transitional marker expression throughout the development of early pre-DC towards pre-cDC1/2 and differentiated cDC1/2. Specifically, CD45RO and CD33 were acquired in parallel with the loss of CD45RA; CD5, CD123, CD304 and CD327 were expressed abundantly by early pre-DC, intermediately by pre-cDC1 and pre-cDC2, and rarely if at all by mature cDC and pDC; FccRI and CD1c were acquired as early pre-DC commit towards the cDC2 lineage, concurrent with the loss of BTLA and CD319 expression; early pre-DC had an intermediate expression of CD141 that dropped along cDC2 differentiation but was increasingly expressed during commitment towards cDC1, with a few pre-cDC1 already starting to express Clec9A; and IRF8 and IRF4--transcription factors regulating cDC lineage development (40, 41)--were expressed by early pre-DC and pre-cDC1, while pre-cDC2 maintained only IRF4 expression (FIG. 20C).
[0174] Pre-DC and DC subsets were next sorted from blood and microarray analyses were performed to define their entire transcriptome. 3D-PCA analysis of the microarray data showed that pDC were clearly separated from other pre-DC and DC subsets along the horizontal PC1 axis (FIG. 4A, and FIG. 21). The combination of the PC2 and PC3 axes indicated that pre-cDC1 occupied a position between early pre-DC and cDC1 and, although cDC2 and pre-cDC2 exhibited similar transcriptomes, pre-cDC2 were positioned between cDC2 and early pre-DC along the PC3 axis (FIG. 4A). Hierarchical clustering of differentially-expressed genes (DEG) confirmed the similarities between committed pre-DC and their corresponding mature subset (FIG. 22). The greatest number of DEG was between early pre-DC and pDC (1249 genes) among which CD86, CD2, CD22, CD5, ITGAX (CD11c), CD33, CLEC10A, SIGLEC6 (CD327), THBD, CLEC12A, KLF4 and ZBTB46 were more highly expressed by early pre-DC, while pDC showed higher expression of CD68, CLEC4C, TCF4, PACSIN1, IRF7 and TLR7 (FIG. 4B). An evolution in the gene expression pattern was evident from early pre-DC, to pre-cDC1 and then cDC1 (FIG. 4C), whereas pre-cDC2 were similar to cDC2 (FIG. 4D, and FIG. 22). The union of DEGs comparing pre-cDC1 versus early pre-DC and cDC1 versus pre-cDC1 has 62 genes in common with the union of DEGs from comparing pre-cDC2 versus early pre-DC and cDC2 versus pre-cDC2. These 62 common genes include the transcription factors BATF3, ID2 and TCF4 (E2-2), and the pre-DC markers CLEC4C (CD303), SIGLEC6 (CD327), and IL3RA (CD123) (FIG. 4E, FIG. 23 and Table 5). The progressive reduction in transcript abundance of SIGLEC6 (CD327), CD22 and AXL during early pre-DC to cDC differentiation was also mirrored at the protein level (FIG. 4F). Key transcription factors involved in the differentiation and/or maturation of DC subsets showed a progressive change in their expression along the differentiation path from pre-DC to mature cDC (FIG. 4G). Finally, pathway analyses revealed that pre-DC exhibited an enrichment of cDC functions relative to pDC, and were maintained in a relatively immature state compared to mature cDC (FIG. 24).
[0175] Committed Pre-DC Subsets are Functional
[0176] The present invention then investigated to what extent the functional specializations of DC (42, 43) were acquired at the precursor level by stimulating PBMC with TLR agonists and measuring their cytokine production (FIG. 5A). Pre-DC produced significantly more TNF-.alpha. and IL-12p40 when exposed to CpG ODN 2216 (TLR9 agonist), than to either LPS (TLR4 agonist) or polyI:C (TLR3 agonist) (p=0.03, Mann-Witney test). It was confirmed that pDC were uniquely capable of robust IFN-.alpha. production in response to CL097 and CpG ODN 2216. CpG ODN 2216 stimulation also triggered IL-12p40 and TNF-.alpha. production by early pre-DC, pre-cDC1, and to a lesser extent pre-cDC2. Although TLR9 transcripts were detected only in early pre-DC (FIG. 25A), these data indicate that, contrary to differentiated cDC1 and cDC2, pre-cDC1 and pre-cDC2 do express functional TLR9 and hence can be activated using TLR9 agonists. Interestingly, while pre-cDC2 resembled cDC2 at the gene expression level, their responsiveness to TLR ligands was intermediate between that of early pre-DC and cDC2. Pre-DC subsets also expressed T-cell co-stimulatory molecules (FIG. 5B) and induced proliferation and polarization of naive CD4.sup.+ T cells to a similar level as did mature cDC (FIG. 5C, and FIG. 25B).
[0177] Unsupervised Mapping of DC Ontogeny
[0178] To understand the relatedness of the cell subsets, an unsupervised isoMAP analysis (20) was performed of human BM cells, obtained from CyTOF analysis, for non-linear dimensionality reduction (FIG. 6A, and FIG. 26A). This analysis focused on the Lin.sup.-CD123.sup.hi fraction and identified CD123.sup.hiCD34.sup.+CDP (phenograph cluster #5), from which branched CD34.sup.-CD123.sup.+CD327.sup.+CD33.sup.+ pre-DC (clusters #1 and #2) and CD34.sup.-D123.sup.+CD303.sup.+CD68.sup.+ pDC (clusters #3 and #4) which both progressively acquired their respective phenotypes. Cells in the pre-DC branch increasingly expressed CD2, CD11c, CD116 and, at a later stage, CD1c. IsoMAP analysis of Lin.sup.-CD123.sup.+ cells in the peripheral blood identified two parallel lineages, corresponding to pre-DC and pDC, in which a CDP population was not detected (FIG. 6B). IsoMAP and phenograph analysis of pre-DC extracted from the isoMAP analysis of FIG. 6A (BM, clusters #1 and #2) and FIG. 6B (blood, cluster #6) revealed the three distinct pre-DC subsets (FIG. 6C) as defined by their unique marker expression patterns (FIGS. 26, B and C).
[0179] In summary, the developmental stages of DC from the BM to the peripheral blood through CyTOF were traced, which shows that the CDP population in the BM bifurcates into two pathways, developing into either pre-DC or pDC in the blood (FIG. 6, A to C). This pre-DC population is heterogeneous and exists as distinct subsets detectable in both the blood and BM (FIG. 6C, and FIGS. 26, B and C). Furthermore, an intriguing heterogeneity in blood and BM pDC was uncovered, which warrants further investigation (FIG. 6C, and FIGS. 26, D and E).
[0180] Validation of Down Sampling Threshold for Normalization of MARS-Seq Single Cell Transcriptome Data
[0181] High variance in terms of quality of single-cell transcriptomes is expected in a single-cell RNA sequencing experiment due to the low quantity of RNA input material. This caveat necessitates stringent quality control in order to avoid a bias introduced by low quality single-cell transcriptomes. In single-cell transcriptomics it is, therefore, common practice to remove low quality transcriptomes to ensure an unbiased and biologically meaningful analysis (44, 45). Different strategies have been used to filter out low quality cells, including an empirically determined cutoff for cell filtering (45), a down sampling strategy to normalize and filter low quality cells (3), and various filtering cutoffs from 600 UMIs/cell or 400 UMIs/cells (3), <500 molecule counts per cell (46) and <200 UMIs/cell (47). A mathematically determined cut-off was not reported in any of these studies. As these previous studies were performed on murine cells, and quality filters in single-cell data have to be established within the respective dataset, the present approach had adapted the filtering strategy to human cells. To determine the quality threshold for the present dataset, several diagnostics were used to estimate the optimal cutoff for down sampling of molecule counts. Firstly, the cumulative distribution of molecule counts were visualized, where cells on the x-axis were ordered by decreasing UMI count (FIG. 7C). Here, in a certain region there was a period of strong decline in the number of molecule counts per cell. This region corresponded to a range of molecule counts between 400 and 1200 UMIs per cell. The next metric used to judge an objective threshold (FIG. 7D) was the molecule count distribution of all cells. Many of the cell barcodes had <650 molecule counts--these cell barcodes most likely represented the background signal of the present MARS-seq data set. The number of cell barcodes with a certain number of molecules decreases with increasing molecule count per cell; through this visualization, natural breakpoints in the distribution that could be used as an objective threshold for filtering and normalization were identified, as these breakpoints mark a change in the data structure and quality, and indicate the transition from background to signal, or from low-quality transcriptomes to high-quality transcriptomes. Here, three notable points were identified (FIG. 7D), which corresponded to molecule counts of 650 (left), 1,050 (middle) and 1,700 (right) per cell. To objectively determine which of these points represented a shift in data quality from low to high quality transcriptomes, a turning point needed to be identified (FIG. 7D). In the density plot (FIG. 7D, top panel), the three lines (left, middle, right) are the breakpoints where the slope of the density function (1st derivative of density, FIG. 7D, middle panel) has a sudden change. On the left line, the downward slope (1st derivative) changes from being very steep to less steep, so that the 2nd derivative is the highest at this point. Similarly, on the middle line, the downward slope changes from less steep to more steep, so the 2nd derivative is the lowest. Based on these observations, the three turning points were identified by the 2nd derivative (FIG. 7D, bottom panel). When a cutoff of 650 was applied, the number of molecule counts per cell was too low and the three DC populations--plasmacytoid DC (pDC) and conventional DC (cDC) subsets cDC1 and cDC2, could not be distinguished by principal component analysis (PCA; FIG. 7E). When a cutoff of 1,700 was applied, the number of cells retained was too low. Therefore, the 1,050 cutoff was an optimal tradeoff between the number of cells analyzed (cells retained after filtering by down sampling normalization) and the number of molecule counts in a cell (gene expression information that remains after discarding molecule counts by down sampling).
[0182] To ensure data reproducibility, stability and independence of the chosen molecule cutoff, the initial analyses were stimulated using cutoffs of 650, 1,050, 1,700 and 2,350 molecule counts (FIG. 7E). All four chosen simulation values exhibited the same general data topology if the data were dimensionally-reduced using PCA, thus proving that the biological data structure was robust and independent of filtering thresholds. In addition, the influence of the filtering threshold on the gene loadings within the first two principal components were correlated. Principal component 1 (PC1) of the dataset down-sampled to 1,050 molecule counts was highly correlated with PC1 of the datasets down-sampled to either 650 or 1,700 molecule counts (Pearson=0.996 and 0.999, respectively). The same was true for PC2 (Pearson=0.960 and 0.925, respectively). These results indicated that the chosen filtering cutoff of 1,050 was representative and objectively-derived.
[0183] The MARS-seq data obtained in this disclosure were generated by two independent experiments (run1 and run2), which were combined for further data analysis. After normalization, the correlation between the average molecule count of all genes in run1 vs run2 was assessed (FIG. 7F, which shows the high correlation between the average molecular counts in both runs (r=0.994)). When assessing for a batch effect, it is important to ensure that runs do not determine the clustering itself. The t-distributed stochastic neighbor embedding (tSNE) values were plotted (FIG. 7G) (cells of run1 and run2 in equal proportions) together with their density estimates. This analysis showed that the general distribution and, therefore, the clustering was not governed by the run, which is in line with the observation that the present clustering identified biologically reasonable groups that clearly corresponded to the three DC populations (pDC, cDC1 and cDC2) (FIG. 1A). Consequently, the observed clusters were not explained by the variance between the runs, but by biology.
[0184] The frequencies of cell types were compared, as determined by the clustering, within the two runs (FIG. 7H). This showed that the ratio between the cells in different clusters was comparable between the two runs. Of note, the ratio does not need to be identical in both runs (46). In addition, this analysis showed that no cluster dominated a single run. Due to the fact that we are taking relatively small samples from a large total population, the frequencies of cell types are expected to show natural variation between runs, which could explain slight shifts in cellular frequencies.
DISCUSSION
[0185] Using unsupervised scmRNAseq and CyTOF analyses, the complexity of the human DC lineage at the single cell level was unraveled, revealing a continuous process of differentiation that starts in the BM with CDP, and diverges at the point of emergence of pre-DC and pDC potentials, culminating in maturation of both lineages in the blood. A previous study using traditional surface marker-based approaches had suggested the presence of a minor pre-DC population in PBMC (32), but the combination of high-dimensional techniques and unbiased analyses employed here shows that this minor population had been markedly underestimated: as the present results reveal a population of pre-DC that overlaps with that observed by Breton and colleagues (32) within the CD117.sup.+CD303.sup.-CD141.sup.- fraction of PBMC, but accounts for >10 fold the number of cells in peripheral blood than was originally estimated, and is considerably more diverse (FIG. 12C).
[0186] Recent work in mice found uncommitted and subset-committed pre-DC subsets in the BM (38, 43). Here, similarly, three functionally- and phenotypically-distinct pre-DC populations in human PBMC, spleen and BM were identified which are: uncommitted pre-DC and two populations of subset-committed pre-DC (FIG. 27 and FIG. 28). In line with the concept of continuous differentiation from the BM to the periphery, the proportion of uncommitted cells was higher in the pre-DC population in the BM than in the blood. Altogether, these findings support a two-step model of DC development whereby a central transcriptomic subset-specific program is imprinted on DC precursors from the CDP stage onwards, conferring a core subset identity irrespective of the final tissue destination; in the second step of the process, peripheral tissue-dependent programming occurs to ensure site-specific functionality and adaptation (38, 43). Future studies will be required to reveal the molecular events underlying DC subset lineage priming and the tissue-specific cues that regulate their peripheral programming, and to design strategies that specifically target DC subsets at the precursor level. In addition, how the proportions of uncommitted pre-DC versus committed pre-DC are modified in acute and chronic inflammatory settings warrants further investigation.
[0187] An important aspect of unbiased analyses is that cells are not excluded from consideration on the basis of preconceptions concerning their surface phenotype. Pre-DC was found to express most of the markers that classically defined pDC, such as CD123, CD303 and CD304. Thus, any strategy relying on these markers to identify and isolate pDC will have inadvertently included CD123.sup.+CD33.sup.+ pre-DC as well. While this calls for reconsideration of some aspects of pDC population biology, it may also explain earlier findings including that: pDC cultures possess cDC potential and acquire cDC-like morphology (33, 34), as recently observed in murine BM pDC (48); pDC mediate Th1 immunity through production of IFN-.alpha. and IL-12 (33, 49-53); pDC exhibit naive T-cell allostimulatory capacity (35, 51); and pDC express co-stimulatory molecules and exhibit antigen-presentation/cross-presentation capabilities at the expense of IFN-.alpha. secretion (49, 1). These observations could be attributed to the undetected pre-DC in the pDC populations described by these studies, and indeed it has been speculated that the IL-12 production observed in these early studies might be due to the presence of contaminating CD11c.sup.+cDC (53). The present disclosure addressed this possibility by separating CX3CR1.sup.+CD33.sup.+CD123.sup.+CD303.sup.+CD304.sup.+ pre-DC from CX3CR1.sup.- CD33.sup.-CD123.sup.+CD303.sup.+CD304.sup.+"pure" pDC and showing that pDC could not polarize or induce proliferation of naive CD4 T cells, whereas pre-DC had this capacity; and that pDC were unable to produce IL-12, unlike pre-DC, but were the only cells capable of strongly producing IFN-.alpha. in response to TRL7/8/9 agonists, as initially described (54). Thus, it is of paramount importance that pre-DC be excluded from pDC populations in future studies, particularly when using commercial pDC isolation kits. Finally, if pDC are stripped of all their cDC properties, it raises the question as to whether they truly belong to the DC lineage, or rather are a distinct type of innate IFN-I-producing lymphoid cell. It also remains to be shown whether the BM CD34.sup.+CD123.sup.hi CDP population is also a mixture of independent bona fide cDC progenitors and pDC progenitors.
[0188] Despite their classification as precursors, human pre-DC appear functional in their own right, being equipped with some T-cell co-stimulatory molecules, and with a strong capacity for naive T-cell allostimulation and cytokine secretion in response to TLR stimulation (FIG. 2, FIG. 5, FIG. 13, and FIG. 15). Pre-DC produced low levels of IFN-.alpha. in response to CpG ODN 2216 exposure, and secreted IL-12 and TNF-.alpha. in response to various TLR ligands. Hence, it is reasonable to propose that pre-DC have the potential to contribute to both homeostasis and various pathological processes, particularly inflammatory and autoimmune diseases where dysregulation of their differentiation continuum or their arrested development could render them a potent source of inflammatory DC ready for rapid recruitment and mobilization.
[0189] Beyond the identification of pre-DC, the present data revealed previously-unappreciated transcriptional and phenotypic heterogeneity within the circulating mature DC populations. This was particularly clear in the case of cDC2 and pDC, which were grouped into multiple Mpath clusters in the single-cell RNAseq analysis, and showed marked dispersion in the tSNE analysis of the CyTOF data with phenotypic heterogeneity. IsoMAP analysis of the CyTOF data also revealed another level of pDC heterogeneity by illustrating the progressive phenotypic transition from CDP into CD2.sup.+ pDC in the BM, involving intermediate cells that could be pre-pDC. Whether a circulating pre-pDC population exists remains to be concluded. Finally, defining the mechanisms that direct the differentiation of uncommitted pre-DC into cDC1 or cDC2, or that maintain these cells in their initial uncommitted state in health and disease could lead to the development of new therapeutic strategies to modulate this differentiation process.
[0190] In summary, the present invention revealed the complexity of human DC lineage at the single cell level. DC in the bone marrow start as common CDP and diverge at the point of emergence into pre-DC and pDC potentials, culminating in maturation of both lineages in the blood. Furthermore, three functionally and phenotypically distinct pre-DC populations were identified in the human PBMC, spleen and bone marrow: uncommitted pre-DC and two populations of subset-committed pre-DC (pre-cDC1 and pre-cDC2). Importantly, the present invention revealed a novel activation pathway of pre-DC that unlike mature DC subsets, committed pre-DC subsets respond to TLR9 stimulation. PBMC was stimulated with TLR agonists and their cytokine production was measured. Pre-DC produced significantly more TNF-.alpha. and IL-12p40 when exposed to CpG ODN 2216 (TLR9 agonist), than to either LPS (TLR4 agonist) or polyI:C (TLR3 agonist) (p=0.03, Mann-Witney test) (FIG. 5). CpG ODN 2216 stimulation also triggered IL-12p40 and TNF-.alpha. production by early pre-DC, pre-cDC1, and to a lesser extent pre-cDC2. The application of the TLR9 stimulation of pre-DC may include using a combination of one or more TLR9 agonists (such as CpG) and an antigen delivery system that specifically targets pre-DC and committed pre-DC (for example, by inclusion of an antibody that specifically targets pre-DC and committed pre-DC) to (i) mobilize and activate pre-DC, (ii) deliver the antigen to pre-DC for presentation of antigenic peptides to T cells, and (iii) activate antigen specific T cells. The design strategy could be used in immunotherapy for cancer and other diseases.
REFERENCES
[0191] 1. G. Hoeffel et al., Antigen crosspresentation by human plasmacytoid dendritic cells. Immunity. 27, 481-492 (2007). [0192] 2. M. Haniffa et al., Human tissues contain CD141hi cross-presenting dendritic cells with functional homology to mouse CD103+ nonlymphoid dendritic cells. Immunity. 37, 60-73 (2012). [0193] 3. D. A. Jaitin et al., Massively parallel single-cell RNA-seq for marker-free decomposition of tissues into cell types. Science. 343, 776-779 (2014). [0194] 4. B. Langmead, C. Trapnell, M. Pop, S. L. Salzberg, Ultrafast and memory-efficient alignment of short DNA sequences to the human genome. Genome Biol. 10, R25 (2009). [0195] 5. D. Grun et al., Single-cell messenger RNA sequencing reveals rare intestinal cell types. Nature. 525, 251-255 (2015). [0196] 6. J. Chen, A. Schlitzer, S. Chakarov, F. Ginhoux, M. Poidinger, Mpath maps multi-branching single-cell trajectories revealing progenitor cell progression during development. Nat Commun. 7,11988 (2016). [0197] 7. J. Lamb, The Connectivity Map: Using Gene-Expression Signatures to Connect Small Molecules, Genes, and Disease. Science. 313, 1929-1935 (2006). [0198] 8. M. Ester, H. P. Kriegel, J. Sander, X. Xu, A density-based algorithm for discovering clusters in large spatial databases with noise. Kdd (1996). [0199] 9. M. Hahsler, M. Piekenbrock, dbscan: Density Based Clustering of Applications with Noise (DBSCAN) and Related Algorithms. R package version 1.0-0. https://CRAN.R-project.org/package=dbscan (2017). [0200] 10. C. Trapnell et al., The dynamics and regulators of cell fate decisions are revealed by pseudotemporal ordering of single cells. Nat. Biotechnol. 32, 381-386 (2014). [0201] 11. M. Setty et al., Wishbone identifies bifurcating developmental trajectories from single-cell data. Nat. Biotechnol. 34, 637-645 (2016). [0202] 12. R. R. Coifman et al., Geometric diffusions as a tool for harmonic analysis and structure definition of data: multiscale methods. Proceedings of the National Academy of Sciences. 102, 7432-7437 (2005). [0203] 13. J. Harrow et al., GENCODE: the reference human genome annotation for The ENCODE Project. Genome Res. 22, 1760-1774 (2012). [0204] 14. B. Li, C. N. Dewey, RSEM: accurate transcript quantification from RNA-Seq data with or without a reference genome. BMC Bioinformatics. 12, 323 (2011). [0205] 15. B. Becher et al., High-dimensional analysis of the murine myeloid cell system. Nat. Immunol. 15, 1181-1189 (2014). [0206] 16. R. Finck et al., Normalization of mass cytometry data with bead standards. Cytometry A. 83, 483-494 (2013). [0207] 17. E. W. Newell, N. Sigal, S. C. Bendall, G. P. Nolan, M. M. Davis, Cytometry by time-of-flight shows combinatorial cytokine expression and virus-specific cell niches within a continuum of CD8+ T cell phenotypes. Immunity. 36, 142-152 (2012). [0208] 18. D. R. Parks, M. Roederer, W. A. Moore, A new "Logicle" display method avoids deceptive effects of logarithmic scaling for low signals and compensated data. Cytometry A. 69, 541-551 (2006). [0209] 19. L. Van der Maaten, Visualizing data using t-SNE. Journal of Machine Learning Research. 9, 2579-2625 (2008). [0210] 20. J. B. Tenenbaum, V. de Silva, J. C. Langford, A global geometric framework for nonlinear dimensionality reduction. Science. 290, 2319-2323 (2000). [0211] 21. J. Oksanen et al., vegan: Community Ecology Package. R package version 2.4-2. https://CRAN.R-project.org/package=vegan (2017). [0212] 22. J. H. Levine et al., Data-Driven Phenotypic Dissection of AML Reveals Progenitor-like Cells that Correlate with Prognosis. Cell. 162, 184-197 (2015). [0213] 23. H. Chen et al., Cytofkit: A Bioconductor Package for an Integrated Mass Cytometry Data Analysis Pipeline. PLoS Comput Biol. 12, e1005112 (2016). [0214] 24. J. Lee et al., Restricted dendritic cell and monocyte progenitors in human cord blood and bone marrow. J. Exp. Med. 212, 385-399 (2015). [0215] 25. G. K. Smyth, Linear models and empirical bayes methods for assessing differential expression in microarray experiments. Stat Appl Genet Mol Biol. 3, Article 3 (2004). [0216] 26. Y. Benjamini, Y. Hochberg, Controlling the false discovery rate: a practical and powerful approach to multiple testing. Journal of the royal statistical society Series B (Methodological) 57, 289-300 (1995). [0217] 27. E.-A. D. Amir et al., viSNE enables visualization of high dimensional single-cell data and reveals phenotypic heterogeneity of leukemia. Nat. Biotechnol. 31, 545-552 (2013). [0218] 28. C. Sadaka, M.-A. Marloie-Provost, V. Soumelis, P. Benaroch, Developmental regulation of MHC II expression and transport in human plasmacytoid-derived dendritic cells. Blood. 113, 2127-2135 (2009). [0219] 29. A. Dzionek et al., BDCA-2, BDCA-3, and BDCA-4: Three Markers for Distinct Subsets of Dendritic Cells in Human Peripheral Blood. The Journal of Immunology. 165, 6037-6046 (2000). [0220] 30. S. L. Jongbloed et al., Human CD141+(BDCA-3)+ dendritic cells (DCs) represent a unique myeloid DC subset that cross-presents necrotic cell antigens. J. Exp. Med. 207, 1247-1260 (2010). [0221] 31. K. P. A. MacDonald et al., Characterization of human blood dendritic cell subsets. Blood. 100, 4512-4520 (2002). [0222] 32. G. Breton et al., Circulating precursors of human CD1c+ and CD141+ dendritic cells. J. Exp. Med. 212, 401-413 (2015). [0223] 33. M. Cella et al., Plasmacytoid monocytes migrate to inflamed lymph nodes and produce large amounts of type I interferon. Nat. Med. 5, 919-923 (1999). [0224] 34. G. Grouard et al., The enigmatic plasmacytoid T cells develop into dendritic cells with interleukin (IL)-3 and CD40-ligand. J. Exp. Med. 185, 1101-1111 (1997). [0225] 35. T. Matsui et al., CD2 distinguishes two subsets of human plasmacytoid dendritic cells with distinct phenotype and functions. J. Immunol. 182, 6815-6823 (2009). [0226] 36. H. Yu et al., Human BDCA2(+)CD123 (+)CD56 (+) dendritic cells (DCs) related to blastic plasmacytoid dendritic cell neoplasm represent a unique myeloid DC subset. Protein Cell. 6, 297-306 (2015). [0227] 37. B. Reizis, A. Bunin, H. S. Ghosh, K. L. Lewis, V. Sisirak, Plasmacytoid dendritic cells: recent progress and open questions. Annu. Rev. Immunol. 29, 163-183 (2011). [0228] 38. A. Schlitzer et al., Identification of cDC1- and cDC2-committed DC progenitors reveals early lineage priming at the common DC progenitor stage in the bone marrow. Nat. Immunol. 16, 718-728 (2015). [0229] 39. S. C. Bendall et al., Single-cell trajectory detection uncovers progression and regulatory coordination in human B cell development. Cell. 157, 714-725 (2014). [0230] 40. M. Merad, P. Sathe, J. Helft, J. Miller, A. Mortha, The dendritic cell lineage: ontogeny and function of dendritic cells and their subsets in the steady state and the inflamed setting. Annu. Rev. Immunol. 31, 563-604 (2013). [0231] 41. M. Guilliams et al., Dendritic cells, monocytes and macrophages: a unified nomenclature based on ontogeny. Nat. Rev. Immunol. 14, 571-578 (2014). [0232] 42. A. Schlitzer, N. McGovern, F. Ginhoux, Dendritic cells and monocyte-derived cells: Two complementary and integrated functional systems. Semin. Cell Dev. Biol. 41, 9-22 (2015). [0233] 43. M. Swiecki, M. Colonna, The multifaceted biology of plasmacytoid dendritic cells. Nat. Rev. Immunol. 15, 471-485 (2015). [0234] 44. E. Mass et al., Specification of tissue-resident macrophages during organogenesis. Science. 353 (2016), doi:10.1126/science.aaf4238. [0235] 45. G. X. Y. Zheng et al., Massively parallel digital transcriptional profiling of single cells. Nat Commun. 8, 14049 (2017). [0236] 46. F. Paul et al., Transcriptional Heterogeneity and Lineage Commitment in Myeloid Progenitors. Cell. 163, 1663-1677 (2015). [0237] 47. O. Matcovitch-Natan et al., Microglia development follows a stepwise program to regulate brain homeostasis. Science. 353, aad8670 (2016). [0238] 48. A. Schlitzer et al., Identification of CCR9-murine plasmacytoid DC precursors with plasticity to differentiate into conventional DCs. Blood. 117, 6562-6570 (2011). [0239] 49. A. Krug et al., Toll-like receptor expression reveals CpG DNA as a unique microbial stimulus for plasmacytoid dendritic cells which synergizes with CD40 ligand to induce high amounts of IL-12. Eur. J. Immunol. 31, 3026-3037 (2001). [0240] 50. A. Dzionek et al., Plasmacytoid dendritic cells: from specific surface markers to specific cellular functions. Hum. Immunol. 63, 1133-1148 (2002). [0241] 51. M. Cella, F. Facchetti, A. Lanzavecchia, M. Colonna, Plasmacytoid dendritic cells activated by influenza virus and CD40L drive a potent TH1 polarization. Nat. Immunol. 1, 305-310 (2000). [0242] 52. T. Ito et al., Plasmacytoid dendritic cells prime IL-10-producing T regulatory cells by inducible costimulator ligand. J. Exp. Med. 204, 105-115 (2007). [0243] 53. J.-F. Fonteneau et al., Activation of influenza virus-specific CD4+ and CD8+ T cells: a new role for plasmacytoid dendritic cells in adaptive immunity. Blood. 101, 3520-3526 (2003). [0244] 54. F. P. Siegal et al., The Nature of the Principal Type 1 Interferon-Producing Cells in Human Blood. Science. 284, 1835-1837 (1999). [0245] 55. IPA's Upstream Regulator Analysis Validation Whitepaper: A Novel Approach to Predicting Upstream Regulators. http://pages.ingenuity.com/IPAUpstreamRegulatorAnalysisValidationWP.html. [0246] 56. Ingenuity Downstream Effects Analysis in IPA Whitepaper: Identify Biological Functions That Are Expected To Be Increased Or Decreased Given The Observed Gene Expression with IPA. http://pages.ingenuity.com/IngenuityDownstreamEffectsAnalysisinIPAWhitepa- per.html [0247] 57. B. Cisse et al., Transcription factor E2-2 is an essential and specific regulator of plasmacytoid dendritic cell development. Cell. 135, 37-48 (2008).
* * * * *
References
-
cran.r-project.org/web/packages/dbscan
-
github.com/ManuSetty/wishbone
-
c2b2.columbia.edu/danapeerlab/html/cyt-download.html
-
CRAN.R-project.org/package=dbscan
-
-
pages.ingenuity.com/IPAUpstreamRegulatorAnalysisValidationWP.html
-
D00000
D00001
D00002
D00003
D00004
D00005
D00006
D00007
D00008
D00009
D00010
D00011
D00012

D00013

D00014

D00015

D00016

D00017

D00018

D00019

D00020

D00021

D00022

D00023

D00024

D00025

D00026

D00027

D00028

D00029

D00030

D00031

D00032

D00033

D00034

D00035

D00036

D00037

D00038

D00039

D00040

D00041

D00042

D00043

D00044

D00045

D00046

D00047

D00048

D00049

D00050

D00051

D00052

D00053

D00054

D00055

D00056

D00057
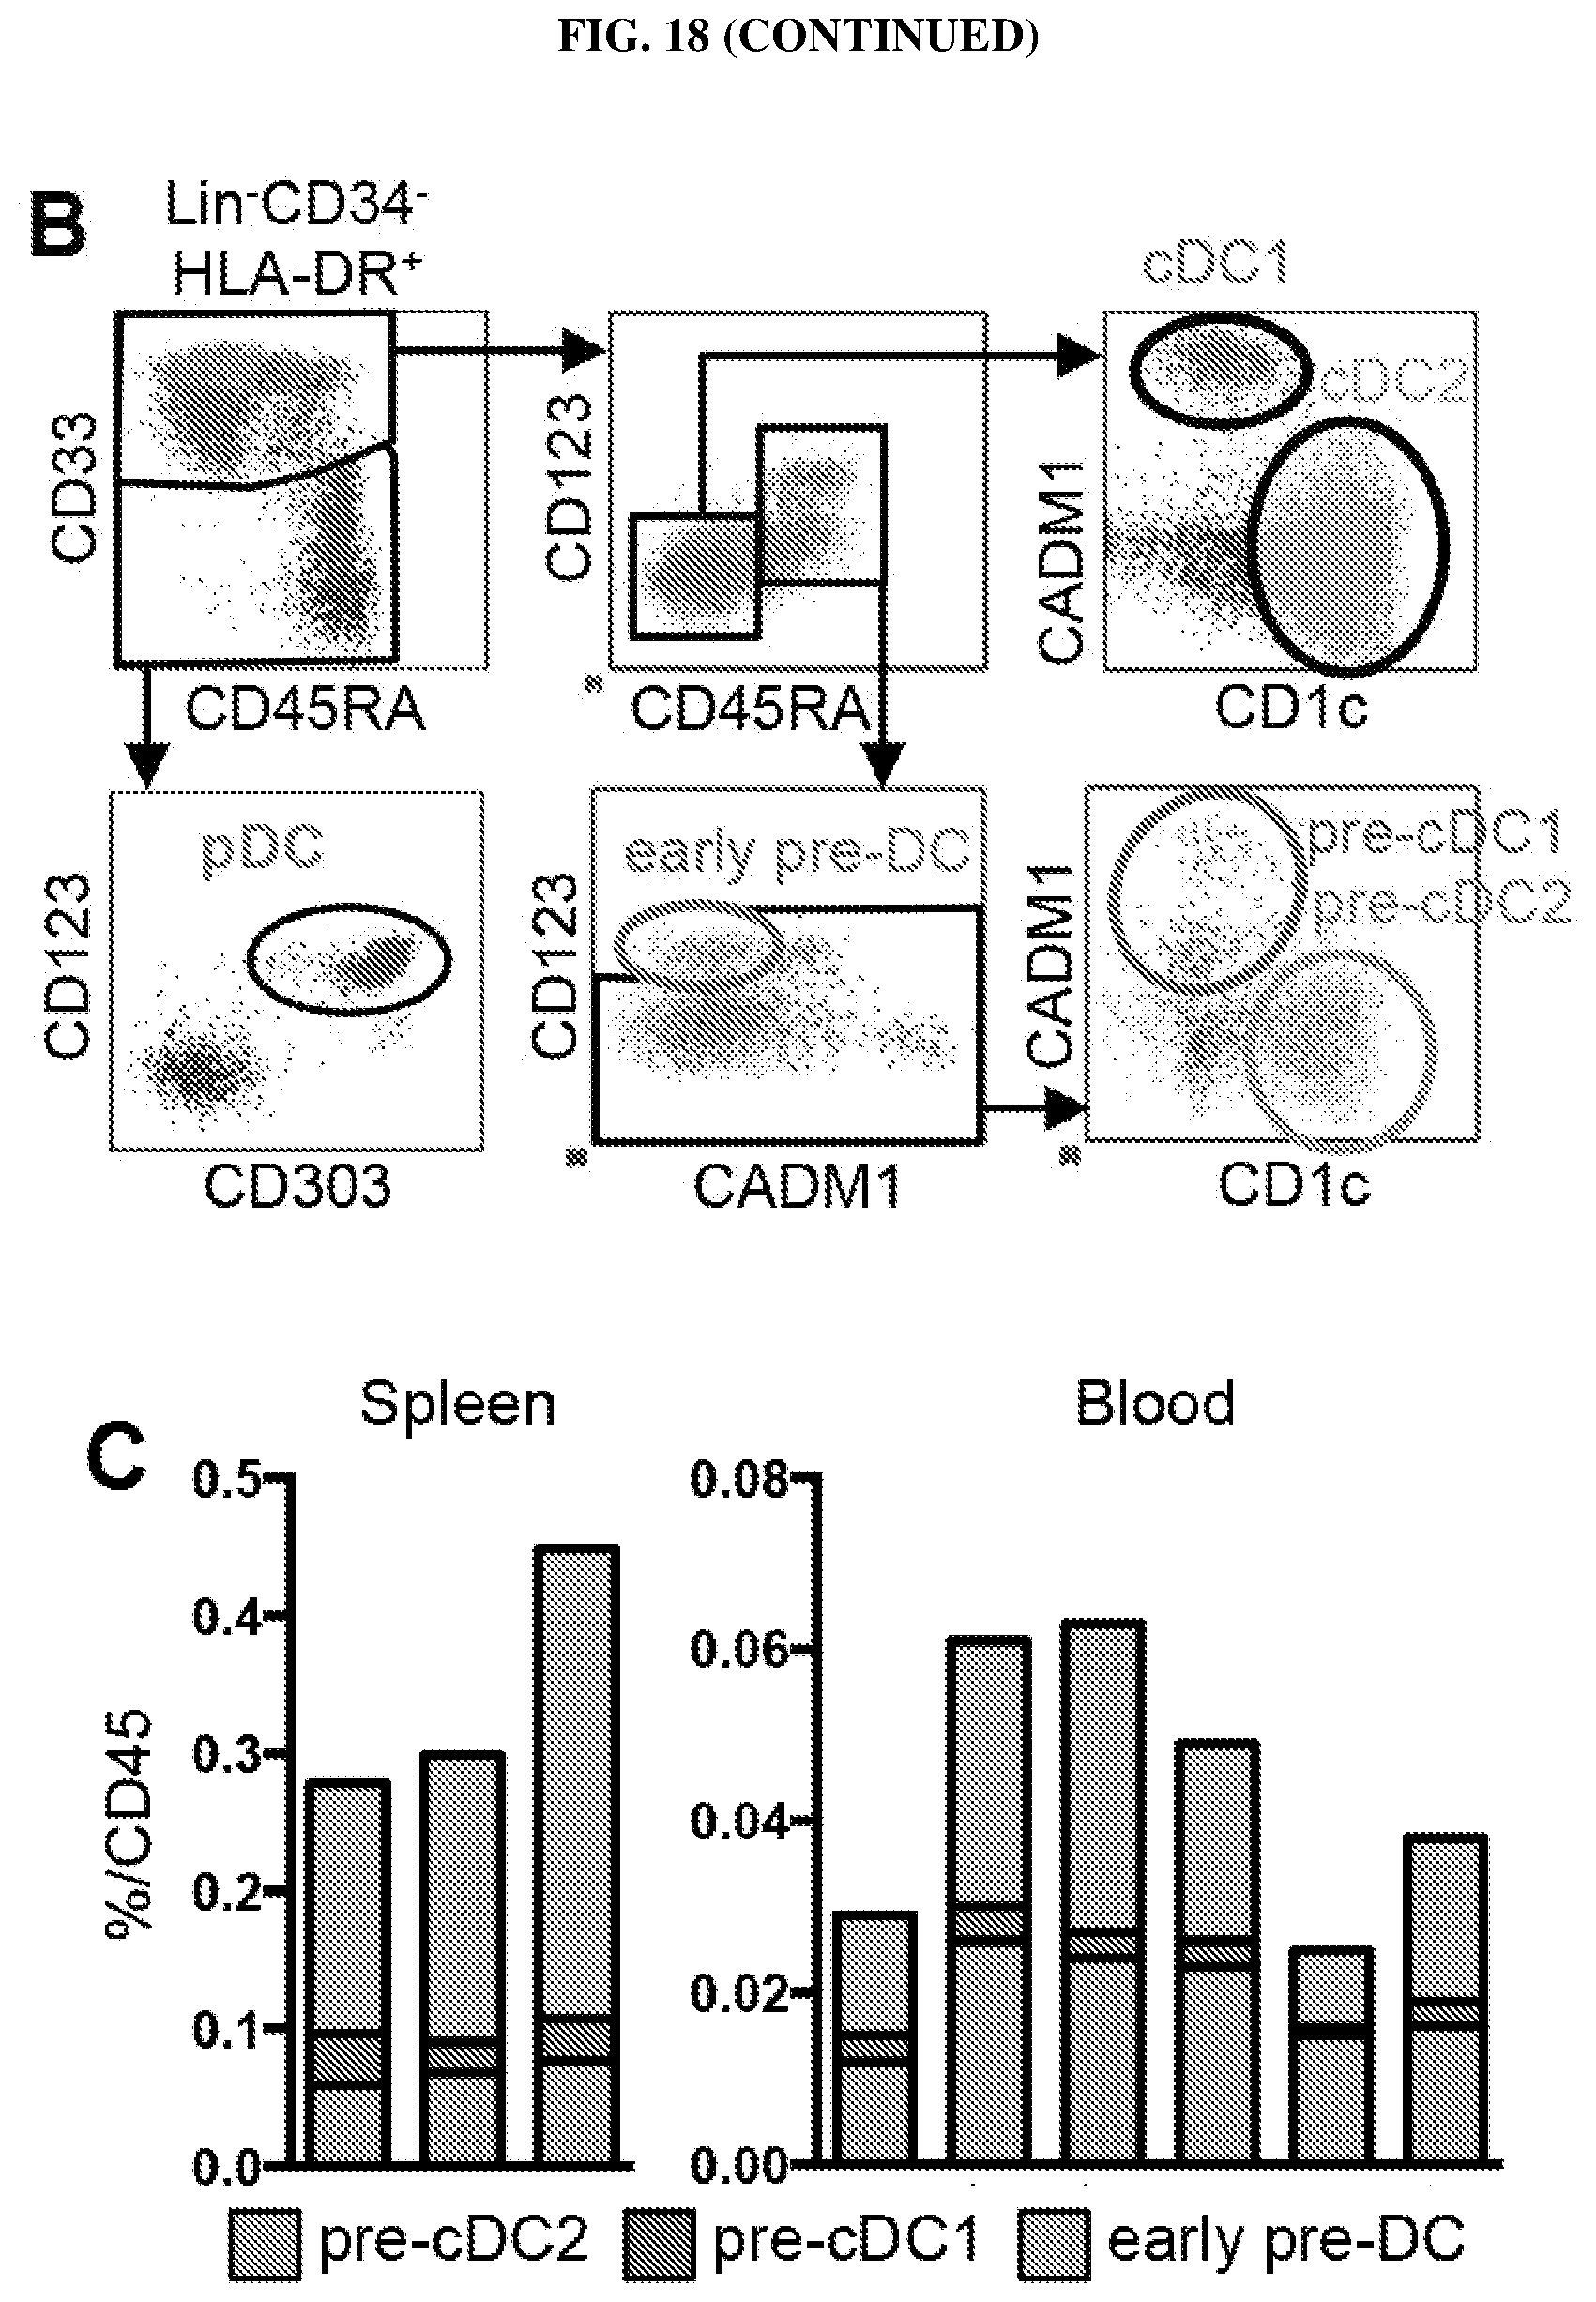
D00058

D00059

D00060

D00061

D00062

D00063

D00064

D00065

D00066

D00067

D00068

D00069

D00070

D00071

D00072

D00073

D00074

D00075

D00076

D00077

XML
uspto.report is an independent third-party trademark research tool that is not affiliated, endorsed, or sponsored by the United States Patent and Trademark Office (USPTO) or any other governmental organization. The information provided by uspto.report is based on publicly available data at the time of writing and is intended for informational purposes only.
While we strive to provide accurate and up-to-date information, we do not guarantee the accuracy, completeness, reliability, or suitability of the information displayed on this site. The use of this site is at your own risk. Any reliance you place on such information is therefore strictly at your own risk.
All official trademark data, including owner information, should be verified by visiting the official USPTO website at www.uspto.gov. This site is not intended to replace professional legal advice and should not be used as a substitute for consulting with a legal professional who is knowledgeable about trademark law.