Methods And Materials For Assessing And Treating Obesity
Acosta; Andres J. ; et al.
U.S. patent application number 16/765273 was filed with the patent office on 2021-03-11 for methods and materials for assessing and treating obesity. This patent application is currently assigned to Mayo Foundation for Medical Education and Research. The applicant listed for this patent is Mayo Foundation for Medical Education and Research. Invention is credited to Andres J. Acosta, Michael L. Camilleri.
| Application Number | 20210072259 16/765273 |
| Document ID | / |
| Family ID | 1000005253204 |
| Filed Date | 2021-03-11 |


View All Diagrams
| United States Patent Application | 20210072259 |
| Kind Code | A1 |
| Acosta; Andres J. ; et al. | March 11, 2021 |
METHODS AND MATERIALS FOR ASSESSING AND TREATING OBESITY
Abstract
This document relates to methods and materials for assessing and/or treating obese mammals (e.g., obese humans). For example, methods and materials for using one or more interventions (e.g., one or more pharmacological interventions) to treat obesity and/or obesity-related comorbidities in a mammal (e.g., a human) identified as being likely to respond to a particular intervention (e.g., a pharmacological intervention) are provided.
| Inventors: | Acosta; Andres J.; (Rochester, MN) ; Camilleri; Michael L.; (Rochester, MN) | ||||||||||
| Applicant: |
|
||||||||||
|---|---|---|---|---|---|---|---|---|---|---|---|
| Assignee: | Mayo Foundation for Medical
Education and Research Rochester MN |
||||||||||
| Family ID: | 1000005253204 | ||||||||||
| Appl. No.: | 16/765273 | ||||||||||
| Filed: | November 21, 2018 | ||||||||||
| PCT Filed: | November 21, 2018 | ||||||||||
| PCT NO: | PCT/US2018/062217 | ||||||||||
| 371 Date: | May 19, 2020 |
Related U.S. Patent Documents
| Application Number | Filing Date | Patent Number | ||
|---|---|---|---|---|
| 62589915 | Nov 22, 2017 | |||
| Current U.S. Class: | 1/1 |
| Current CPC Class: | A61K 31/137 20130101; C12Q 2600/156 20130101; A61K 38/26 20130101; G01N 33/6893 20130101; G01N 2800/044 20130101; A61K 31/485 20130101; C12Q 1/6883 20130101; A61P 3/04 20180101; C12Q 2600/106 20130101; A61K 31/138 20130101 |
| International Class: | G01N 33/68 20060101 G01N033/68; A61P 3/04 20060101 A61P003/04; C12Q 1/6883 20060101 C12Q001/6883; A61K 31/138 20060101 A61K031/138; A61K 31/485 20060101 A61K031/485; A61K 31/137 20060101 A61K031/137; A61K 38/26 20060101 A61K038/26 |
Goverment Interests
STATEMENT REGARDING FEDERAL FUNDING
[0002] This invention was made with government support under DK067071 and DK084567 awarded by the National Institutes of Health. The government has certain rights in the invention.
Claims
1. A method for treating obesity in a mammal, wherein said method comprises: (a) identifying said mammal as having an intervention responsive obesity analyte signature in a sample obtained from said mammal; and (b) administering an intervention to said mammal.
2. The method of claim 1, wherein said sample is selected from the group consisting of a blood sample, a saliva sample, a urine sample, a breath sample, and a stool sample.
3. The method of claim 2, wherein said sample is a breath sample.
4. The method of claim 2, wherein said sample is a stool sample.
5. A method for treating obesity in a mammal, wherein said method comprises administering an intervention to a mammal identified as having an intervention responsive obesity analyte signature.
6. The method of claim 1, wherein said mammal is a human.
7. The method of claim 1, wherein said intervention is effective to reduce the total body weight of said mammal by at least 4%.
8. The method of claim 1, wherein said intervention is effective to reduce the total body weight of said mammal by from about 3 kg to about 100 kg.
9. The method of claim 1, wherein said intervention is effective to reduce the waist circumference of said mammal by from about 1 inches to about 10 inches.
10. The method of claim 1, wherein said obesity analyte signature comprises 1-methylhistine, serotonin, glutamine, gamma-amino-n-butyric-acid, isocaproic, allo-isoleucine, hydroxyproline, beta-aminoisobutyric-acid, alanine, hexanoic, tyrosine, phenylalanine, ghrelin, and peptide tyrosine tyrosine (PYY).
11. The method of claim 1, wherein said identifying further comprises obtaining results from a Hospital Anxiety and Depression Scale (HADS) questionnaire.
12. The method of claim 11, wherein said obesity analyte signature comprises a presence of serotonin, glutamine, isocaproic, allo-isoleucine, hydroxyproline, beta-aminoisobutyric-acid, alanine, hexanoic, tyrosine, and PYY, and an absence of 1-methylhistine, gamma-amino-n-butyric-acid, phenylalanine, ghrelin; wherein said HADS questionnaire result does not indicate an anxiety subscale; and wherein said mammal is responsive to intervention with phentermine-topiramate pharmacotherapy and/or lorcaserin pharmacotherapy.
13. The method of claim 11, wherein said obesity analyte signature comprises a presence of 1-methylhistine, allo-isoleucine, hydroxyproline, beta-aminoisobutyric-acid, alanine, and phenylalanine, and an absence of serotonin, glutamine, gamma-amino-n-butyric-acid, isocaproic, hexanoic, tyrosine, ghrelin, and PYY; wherein said HADS questionnaire result not indicate an anxiety sub scale; and wherein said mammal is responsive to intervention with a GLP-1 receptor agonist.
14. The method of claim 11, wherein said obesity analyte signature comprises a presence of serotonin, and an absence of 1-methylhistine, glutamine, gamma-amino-n-butyric-acid, isocaproic, allo-isoleucine, hydroxyproline, beta-aminoisobutyric-acid, alanine, hexanoic, tyrosine, phenylalanine, ghrelin, and PYY; wherein said HADS questionnaire result indicates an anxiety subscale; and wherein said mammal is responsive to intervention with naltrexone-bupropion pharmacotherapy.
15. The method of claim 11, wherein said obesity analyte signature comprises a presence of 1-methylhistine, glutamine, gamma-amino-n-butyric-acid, isocaproic, allo-isoleucine, beta-aminoisobutyric-acid, alanine, hexanoic, tyrosine, phenylalanine, PYY, and an absence of serotonin, hydroxyproline, and ghrelin; wherein said HADS questionnaire result indicates an anxiety subscale; and wherein said mammal is responsive to intervention with naltrexone-bupropion pharmacotherapy.
16. The method of claim 11, wherein said obesity analyte signature comprises a presence of 1-methylhistine, serotonin, glutamine, gamma-amino-n-butyric-acid, isocaproic, allo-isoleucine, alanine, tyrosine, ghrelin, PYY, and an absence of hydroxyproline, beta-aminoisobutyric-acid, hexanoic, and phenylalanine; wherein said HADS questionnaire result indicates an anxiety subscale; and wherein said mammal is responsive to intervention with phentermine pharmacotherapy.
17-54. (canceled)
55. The method of claim 13, wherein said GLP-1 receptor agonist comprises liraglutide.
Description
CROSS-REFERENCE TO RELATED APPLICATIONS
[0001] This application claims the benefit of U.S. Patent Application Ser. No. 62/589,915, filed on Nov. 22, 2017. The disclosure of the prior application is considered part of (and is incorporated by reference in) the disclosure of this application.
BACKGROUND
1. Technical Field
[0003] This document relates to methods and materials for assessing and/or treating obesity in mammals (e.g., humans). For example, this document provides methods and materials for determining an obesity analyte signature of a mammal. For example, this document provides methods and materials for determining an obesity phenotype of a mammal. For example, this document provides methods and materials for using one or more interventions (e.g., one or more pharmacological interventions) to treat obesity and/or obesity-related comorbidities in a mammal (e.g., a human) identified as being likely to respond to a particular intervention (e.g., a pharmacological intervention).
2. Background Information
[0004] Obesity prevalence continues to increase worldwide (Ng et al., 2014 Lancet 384:766-81) and, in the United States, 69% of adults are overweight or obese (Flegal et al., 2012 JAMA 307:491-497). Estimated costs to the healthcare system are more than $550 billion annually. Increased severity of obesity correlates with a higher prevalence of the associated co-morbidities. Likewise, obesity increases the risk of premature mortality (Hensrud et al., 2006 Mayo Clinic Proceedings 81(10 Suppl):S5-10). Obesity affects almost every organ system in the body and increases the risk of numerous diseases including type 2 diabetes mellitus, hypertension, dyslipidemia, cardiovascular disease, and cancer. It is estimated that a man in his twenties with a BMI over 45 will have a 22% reduction (13 years) in life expectancy.
SUMMARY
[0005] Despite advances in understanding aspects of obesity pathophysiology, weight loss with current treatments including diet, exercise, medications, endoscopy, and surgery is highly variable (Acosta et al., 2014 Gut 63:687-95). For example, some obese patients specifically respond to particular medications, and can lose as much weight and with fewer side effects than bariatric surgery. There is a need to be able to identify which intervention(s) an obese patient is likely to respond to in order to be able to select the right intervention for the right patient based on his/her pathophysiology.
[0006] This document provides methods and materials for assessing and/or treating obesity in mammals (e.g., humans). In some cases, this document provides methods and materials for identifying an obese mammal as being responsive to a pharmacological intervention (e.g., by identifying the mammal as having a pharmacotherapy responsive obesity analyte signature), and administering one or more interventions (e.g., pharmacological interventions) to treat the mammal. For example, a sample obtained from an obese mammal can be assessed to determine if the obese mammal is likely to be responsive to pharmacological intervention based, at least in part, on an obesity phenotype, which is based, at least in part, on an obesity analyte signature in the sample. As demonstrated herein, a distinct obesity analyte signature is present in each of six main obesity phenotype groups: 1) low satiation, 2) low satiety (e.g., rapid return to hunger), 3) behavioral eating (identified by questionnaire), 4) large fasting gastric volume, 5) mixed, and 6) low resting energy expenditure group; and each obesity phenotype is likely to be responsive to one or more particular interventions (e.g., pharmacological intervention, surgical intervention, weight loss device, diet intervention, behavior intervention, and/or microbiome intervention).
[0007] Having the ability to identify which intervention(s) an obese patient is likely to respond to provides a unique and unrealized opportunity to provide an individualized approach in selecting obesity treatments.
[0008] In general, one aspect of this document features a method for treating obesity in a mammal. The method includes, or consists essentially of, identifying the mammal as having an intervention responsive obesity analyte signature in a sample obtained from the mammal; and administering an intervention to the mammal. The sample can be a blood sample, a saliva sample, a urine sample, a breath sample, or a stool sample. For example, the sample can be a breath sample. For example, the method sample can be a stool sample. The mammal can be a human. In some cases, the obesity analyte signature can include 1-methylhistine, serotonin, glutamine, gamma-amino-n-butyric-acid, isocaproic, allo-isoleucine, hydroxyproline, beta-aminoisobutyric-acid, alanine, hexanoic, tyrosine, phenylalanine, ghrelin, and peptide tyrosine tyrosine (PYY). The intervention can be effective to reduce the total body weight of said mammal by at least 4%. The intervention can be effective to reduce the total body weight of said mammal by from about 3 kg to about 100 kg. The intervention can be effective to reduce the waist circumference of said mammal by from about 1 inches to about 10 inches. The identifying step also can include obtaining results from a Hospital Anxiety and Depression Scale (HADS) questionnaire and/or a Three Factor Eating questionnaire (TFEQ). In some cases, the obesity analyte signature can include a presence of serotonin, glutamine, isocaproic, allo-isoleucine, hydroxyproline, beta-aminoisobutyric-acid, alanine, hexanoic, tyrosine, and PYY, and an absence of (e.g., lacks the presence of) 1-methylhistine, gamma-amino-n-butyric-acid, phenylalanine, ghrelin; the HADS questionnaire result does not indicate an anxiety subscale; and the mammal can be responsive to intervention with phentermine-topiramate pharmacotherapy and/or lorcaserin pharmacotherapy. In some cases, the obesity analyte signature can include a presence of 1-methylhistine, allo-isoleucine, hydroxyproline, beta-aminoisobutyric-acid, alanine, and phenylalanine, and an absence of serotonin, glutamine, gamma-amino-n-butyric-acid, isocaproic, hexanoic, tyrosine, ghrelin, and PYY; the HADS questionnaire result not indicate an anxiety subscale; and the mammal can be responsive to intervention with liraglutide pharmacotherapy. In some cases, the obesity analyte signature can include a presence of serotonin, and an absence of 1-methylhistine, glutamine, gamma-amino-n-butyric-acid, isocaproic, allo-isoleucine, hydroxyproline, beta-aminoisobutyric-acid, alanine, hexanoic, tyrosine, phenylalanine, ghrelin, and PYY; the HADS questionnaire result indicates an anxiety subscale; and the mammal can be responsive to intervention with naltrexone-bupropion pharmacotherapy. In some cases, the obesity analyte signature can include a presence of 1-methylhistine, glutamine, gamma-amino-n-butyric-acid, isocaproic, allo-isoleucine, beta-aminoisobutyric-acid, alanine, hexanoic, tyrosine, phenylalanine, PYY, and an absence of serotonin, hydroxyproline, and ghrelin; the HADS questionnaire result indicates an anxiety subscale; and the mammal can be responsive to intervention with naltrexone-bupropion pharmacotherapy. In some cases, the obesity analyte signature can include a presence of 1-methylhistine, serotonin, glutamine, gamma-amino-n-butyric-acid, isocaproic, allo-isoleucine, alanine, tyrosine, ghrelin, PYY, and an absence of hydroxyproline, beta-aminoisobutyric-acid, hexanoic, and phenylalanine; the HADS questionnaire result indicates an anxiety subscale; and the mammal can be responsive to intervention with phentermine pharmacotherapy. In some cases, the obesity analyte signature can include HTR2C, GNB3, FTO, iso-caproic acid, beta-aminoisobutyricacid, butyric, allo-isoleucine, tryptophan, and glutamine. The identifying step also can include obtaining results from a HADS questionnaire. In some cases, the obesity analyte signature can include the presence of a single nucleotide polymorphism (SNP) in HTR2C, POMC, NPY, AGRP, MC4R, GNB3, SERT, and/or BDNF; the HADS questionnaire result does not indicate an anxiety subscale; and the mammal can be responsive to intervention with phentermine-topiramate pharmacotherapy and/or lorcaserin pharmacotherapy. The SNP can be rs1414334. In some cases, the obesity analyte signature can include the presence of a SNP in PYY, GLP-1, MC4R, GPBAR1, TCF7L2, ADRA2A,PCSK, and/or TMEM18; the HADS questionnaire result not indicate an anxiety subscale; and the mammal can be responsive to intervention with liraglutide pharmacotherapy. The SNP can be rs7903146. In some cases, the obesity analyte signature can include presence of a SNP in SLC6A4/SERT, and/or DRD2; the HADS questionnaire result indicates an anxiety subscale; and the mammal can be responsive to intervention with naltrexone-bupropion pharmacotherapy. The SNP can be rs4795541. In some cases, the obesity analyte signature can include the presence of a SNP in TCF7L2, UCP3, and/or ADRA2A; the HADS questionnaire result indicates an anxiety subscale; and the mammal can be responsive to intervention with naltrexone-bupropion pharmacotherapy. The SNP can be rs1626521. In some cases, the obesity analyte signature can include the presence of a SNP in FTO, LEP, LEPR, UCP1, UCP2, UCP3, ADRA2, KLF14, NPC1, LYPLAL1, ADRB2, ADRB3, and/or BBS1; the HADS questionnaire result indicates an anxiety subscale; and the mammal can be responsive to intervention with phentermine pharmacotherapy. The SNP can be rs2075577.
[0009] In another aspect, this document features a method for treating obesity in a mammal. The method includes, or consists essentially of, administering an intervention to a mammal that was identified as having an intervention responsive obesity analyte signature. The mammal can be a human. The obesity analyte signature can include 1-methylhistine, serotonin, glutamine, gamma-amino-n-butyric-acid, isocaproic, allo-isoleucine, hydroxyproline, beta-aminoisobutyric-acid, alanine, hexanoic, tyrosine, phenylalanine, ghrelin, and peptide tyrosine tyrosine (PYY). The intervention can be effective to reduce the total body weight of said mammal by at least 4%. The intervention can be effective to reduce the total body weight of said mammal by from about 3 kg to about 100 kg. The intervention can be effective to reduce the waist circumference of said mammal by from about 1 inches to about 10 inches. The identifying step also can include obtaining results from a Hospital Anxiety and Depression Scale (HADS) questionnaire. In some cases, the obesity analyte signature can include a presence of serotonin, glutamine, isocaproic, allo-isoleucine, hydroxyproline, beta-aminoisobutyric-acid, alanine, hexanoic, tyrosine, and PYY, and an absence of (e.g., lacks the presence of) 1-methylhistine, gamma-amino-n-butyric-acid, phenylalanine, ghrelin; the HADS questionnaire result does not indicate an anxiety subscale; and the mammal can be responsive to intervention with phentermine-topiramate pharmacotherapy and/or lorcaserin pharmacotherapy. In some cases, the obesity analyte signature can include a presence of 1-methylhistine, allo-isoleucine, hydroxyproline, beta-aminoisobutyric-acid, alanine, and phenylalanine, and an absence of serotonin, glutamine, gamma-amino-n-butyric-acid, isocaproic, hexanoic, tyrosine, ghrelin, and PYY; the HADS questionnaire result not indicate an anxiety subscale; and the mammal can be responsive to intervention with liraglutide pharmacotherapy. In some cases, the obesity analyte signature can include a presence of serotonin, and an absence of 1-methylhistine, glutamine, gamma-amino-n-butyric-acid, isocaproic, allo-isoleucine, hydroxyproline, beta-aminoisobutyric-acid, alanine, hexanoic, tyrosine, phenylalanine, ghrelin, and PYY; the HADS questionnaire result indicates an anxiety subscale; and the mammal can be responsive to intervention with naltrexone-bupropion pharmacotherapy. In some cases, the obesity analyte signature can include a presence of 1-methylhistine, glutamine, gamma-amino-n-butyric-acid, isocaproic, allo-isoleucine, beta-aminoisobutyric-acid, alanine, hexanoic, tyrosine, phenylalanine, PYY, and an absence of serotonin, hydroxyproline, and ghrelin; the HADS questionnaire result indicates an anxiety subscale; and the mammal can be responsive to intervention with naltrexone-bupropion pharmacotherapy. In some cases, the obesity analyte signature can include a presence of 1-methylhistine, serotonin, glutamine, gamma-amino-n-butyric-acid, isocaproic, allo-isoleucine, alanine, tyrosine, ghrelin, PYY, and an absence of hydroxyproline, beta-aminoisobutyric-acid, hexanoic, and phenylalanine; the HADS questionnaire result indicates an anxiety subscale; and the mammal can be responsive to intervention with phentermine pharmacotherapy.
[0010] In another aspect, this document features a method for identifying an obese mammal as being responsive to treatment with an intervention. The method includes, or consists essentially of, determining an obesity analyte signature in a sample obtained from a mammal, where the obesity analyte signature can include 1-methylhistine, serotonin, glutamine, gamma-amino-n-butyric-acid, isocaproic, allo-isoleucine, hydroxyproline, beta-aminoisobutyric-acid, alanine, hexanoic, tyrosine, phenylalanine, ghrelin, and PYY; and classifying the mammal as having an intervention responsive obesity analyte signature based upon the presence and absence of analytes in the obesity analyte signature. The mammal can be a human. The sample can be a blood sample, a saliva sample, a urine sample, a breath sample, or a stool sample. For example, the sample can be a breath sample. For example, the method sample can be a stool sample. The method also can include obtaining results from a HADS questionnaire. In some cases, the obesity analyte signature can include a presence of serotonin, glutamine, isocaproic, allo-isoleucine, hydroxyproline, beta-aminoisobutyric-acid, alanine, hexanoic, tyrosine, and PYY, and an absence of (e.g., lacks the presence of) 1-methylhistine, gamma-amino-n-butyric-acid, phenylalanine, ghrelin; the HADS questionnaire result does not indicate an anxiety subscale; and the mammal can be responsive to intervention with phentermine-topiramate pharmacotherapy and/or lorcaserin pharmacotherapy. In some cases, the obesity analyte signature can include a presence of 1-methylhistine, allo-isoleucine, hydroxyproline, beta-aminoisobutyric-acid, alanine, and phenylalanine, and an absence of serotonin, glutamine, gamma-amino-n-butyric-acid, isocaproic, hexanoic, tyrosine, ghrelin, and PYY; the HADS questionnaire result not indicate an anxiety subscale; and the mammal can be responsive to intervention with liraglutide pharmacotherapy. In some cases, the obesity analyte signature can include a presence of serotonin, and an absence of 1-methylhistine, glutamine, gamma-amino-n-butyric-acid, isocaproic, allo-isoleucine, hydroxyproline, beta-aminoisobutyric-acid, alanine, hexanoic, tyrosine, phenylalanine, ghrelin, and PYY; the HADS questionnaire result indicates an anxiety subscale; and the mammal can be responsive to intervention with naltrexone-bupropion pharmacotherapy. In some cases, the obesity analyte signature can include a presence of 1-methylhistine, glutamine, gamma-amino-n-butyric-acid, isocaproic, allo-isoleucine, beta-aminoisobutyric-acid, alanine, hexanoic, tyrosine, phenylalanine, PYY, and an absence of serotonin, hydroxyproline, and ghrelin; the HADS questionnaire result indicates an anxiety subscale; and the mammal can be responsive to intervention with naltrexone-bupropion pharmacotherapy. In some cases, the obesity analyte signature can include a presence of 1-methylhistine, serotonin, glutamine, gamma-amino-n-butyric-acid, isocaproic, allo-isoleucine, alanine, tyrosine, ghrelin, PYY, and an absence of hydroxyproline, beta-aminoisobutyric-acid, hexanoic, and phenylalanine; the HADS questionnaire result indicates an anxiety subscale; and the mammal can be responsive to intervention with phentermine pharmacotherapy.
[0011] In another aspect, this document features a identifying an obese mammal as being responsive to treatment with an intervention. The method includes, or consists essentially of, determining an obesity analyte signature in a sample obtained from an obese mammal mammal, where the obesity analyte signature includes HTR2C, GNB3, FTO, iso-caproic acid, beta-aminoisobutyricacid, butyric, allo-isoleucine, tryptophan, and glutamine; obtaining results from a HADS questionnaire; and classifying the mammal as having a intervention responsive obesity analyte signature based upon the presence and absence of analytes in the obesity analyte signature. The mammal can be a human. The sample can be a blood sample, a saliva sample, a urine sample, a breath sample, or a stool sample. In some cases, the sample can be a breath sample. In some cases, the sample can be a stool sample. In some cases, the obesity analyte signature can include the presence of a SNP in HTR2C, POMC, NPY, AGRP, MC4R, GNB3, SERT, and/or BDNF; the HADS questionnaire result can not indicate an anxiety subscale; and the mammal can be classified as being responsive to intervention with phentermine-topiramate pharmacotherapy and/or lorcaserin pharmacotherapy. The SNP can be rs1414334. In some cases, the obesity analyte signature can include the presence of a SNP in PYY, GLP-1, MC4R, GPBAR1, TCF7L2, ADRA2A,PCSK, and/or TMEM18; the HADS questionnaire result can not indicate an anxiety subscale; and the mammal can be classified as being responsive to intervention with liraglutide pharmacotherapy. The SNP can be rs7903146. In some cases, the obesity analyte signature can include the presence of a SNP in SLC6A4/SERT, and/or DRD2; the HADS questionnaire result can indicate an anxiety subscale; and the mammal can be classified as being responsive to intervention with naltrexone-bupropion pharmacotherapy. The SNP can be rs4795541. In some cases, the obesity analyte signature can include the presence of a SNP in TCF7L2, UCP3, and/or ADRA2A; the HADS questionnaire result can indicate an anxiety subscale; and the mammal can be classified as being responsive to intervention with naltrexone-bupropion pharmacotherapy. The SNP can be rs1626521. In some cases, the obesity analyte signature can include the presence of a SNP in FTO, LEP, LEPR, UCP1, UCP2, UCP3, ADRA2, KLF14, NPC1, LYPLAL1, ADRB2, ADRB3, and/or BBS1; the HADS questionnaire result can indicate an anxiety subscale; and the mammal can be classified as being responsive to intervention with phentermine pharmacotherapy. The SNP can be rs2075577.
[0012] Unless otherwise defined, all technical and scientific terms used herein have the same meaning as commonly understood by one of ordinary skill in the art to which this invention pertains. Although methods and materials similar or equivalent to those described herein can be used to practice the invention, suitable methods and materials are described below. All publications, patent applications, patents, and other references mentioned herein are incorporated by reference in their entirety. In case of conflict, the present specification, including definitions, will control. In addition, the materials, methods, and examples are illustrative only and not intended to be limiting.
[0013] The details of one or more embodiments of the invention are set forth in the accompanying drawings and the description below. Other features, objects, and advantages of the invention will be apparent from the description and drawings, and from the claims.
DESCRIPTION OF THE DRAWINGS
[0014] FIGS. 1A-1E shows classifications of obesity. A) 180 Caucasian participants with obesity (BMI>30 kgm2) were sub classified into a) abnormal satiation (16%), abnormal satiety (16%), abnormal hedonic/behavior (19%), slow metabolism (32%) and mixed group (17%). The subgroups have unique characteristics as shown for food intake until reaching fullness tested in a nutrient drink test (B), gastric emptying rate, surrogate of satiety (C) and anxiety levels, surrogate of hedonic (D), and slow metabolism (E) based on the subgroups and gender (blue=females, red=males).
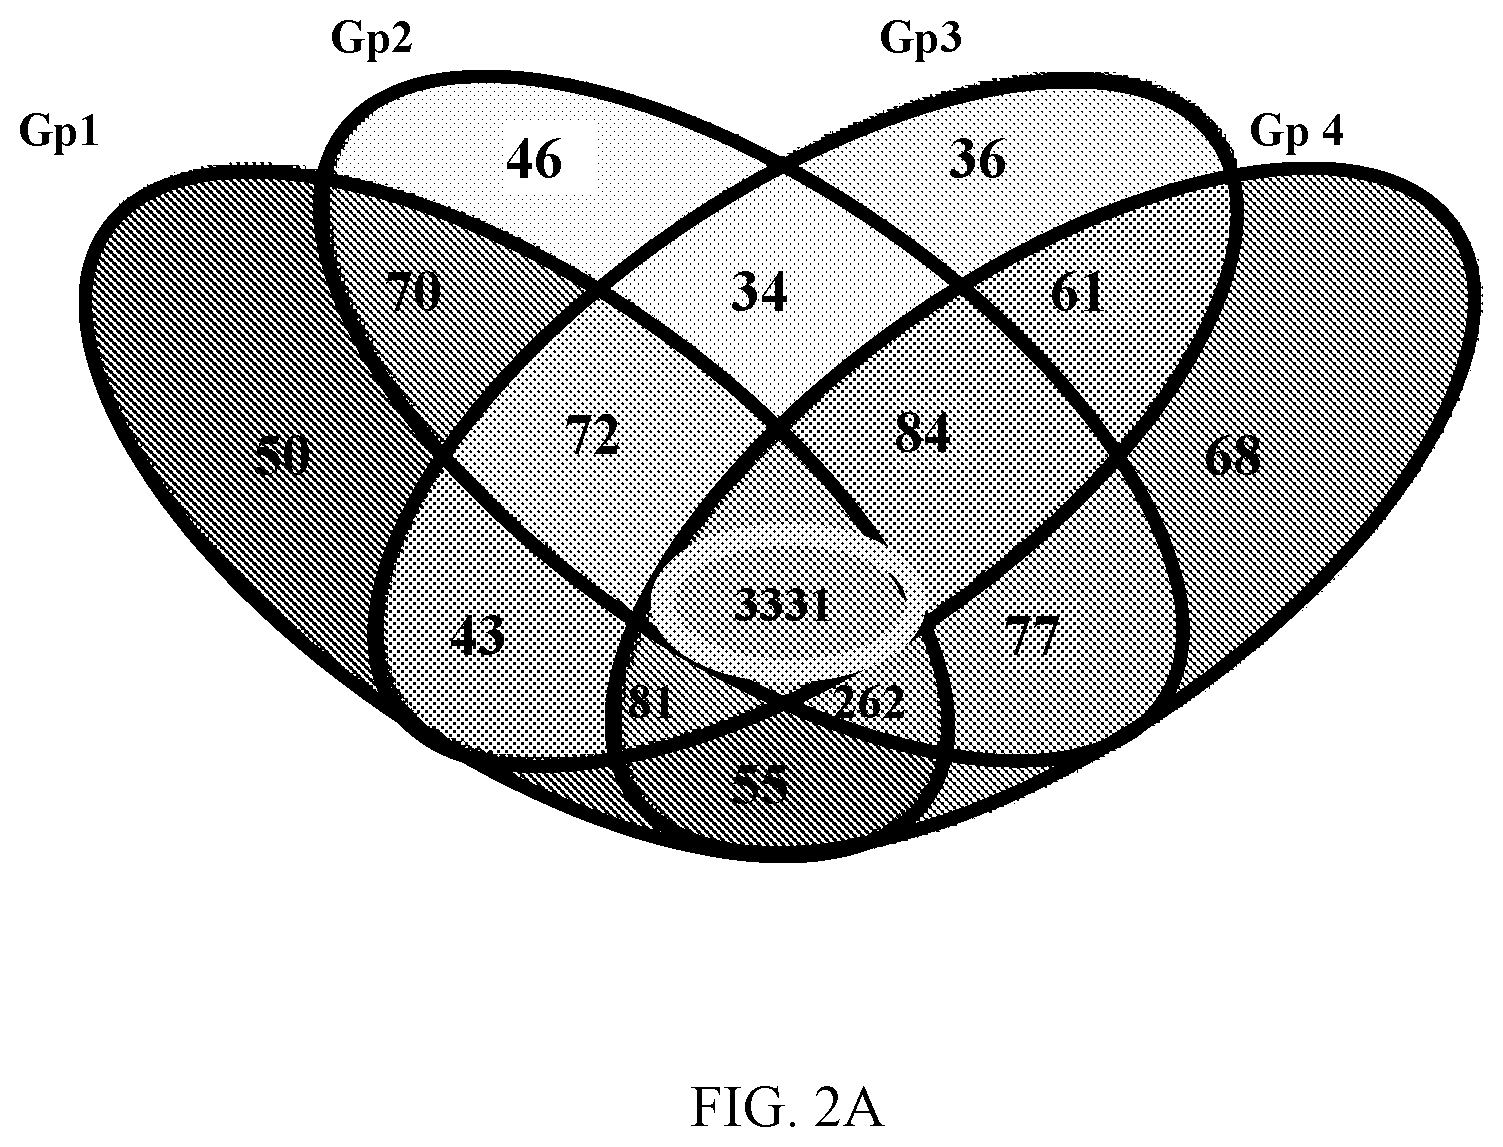
[0015] FIGS. 2A and 2B show biomarker discovery. A) Venn Diagrams of unique metabolites per obesity phenotype identified using positive-HILIC untargeted metabolomics. GP1--satiation; GP2--satiety (rapid return to hunger); Gp3--hedonic; and Gp4--energy expenditure. B) A score plot of a principal component analysis (PCA) of obesity phenotypes showing that obesity phenotype groups can be separated based on metabolic differences.
[0016] FIG. 3 is a receiver operating characteristic (ROC) curve showing the sensitivity and specificity of determining an obesity phenotype based on metabolic signature.
[0017] FIG. 4 is a ROC curve using Bayesian covariate predictors for low satiation, behavioral eating, and low resting energy expenditure.
[0018] FIG. 5 is a ROC curve showing the sensitivity and specificity of determining an obesity phenotype based on metabolic signature.
[0019] FIG. 6 shows food intake meal paradigms measuring `maximal` fullness (MTV), `usual` fullness (VTF) in a nutrient drink test and `usual` fullness to mixed meal (solids) in an ad libitum buffet meal.
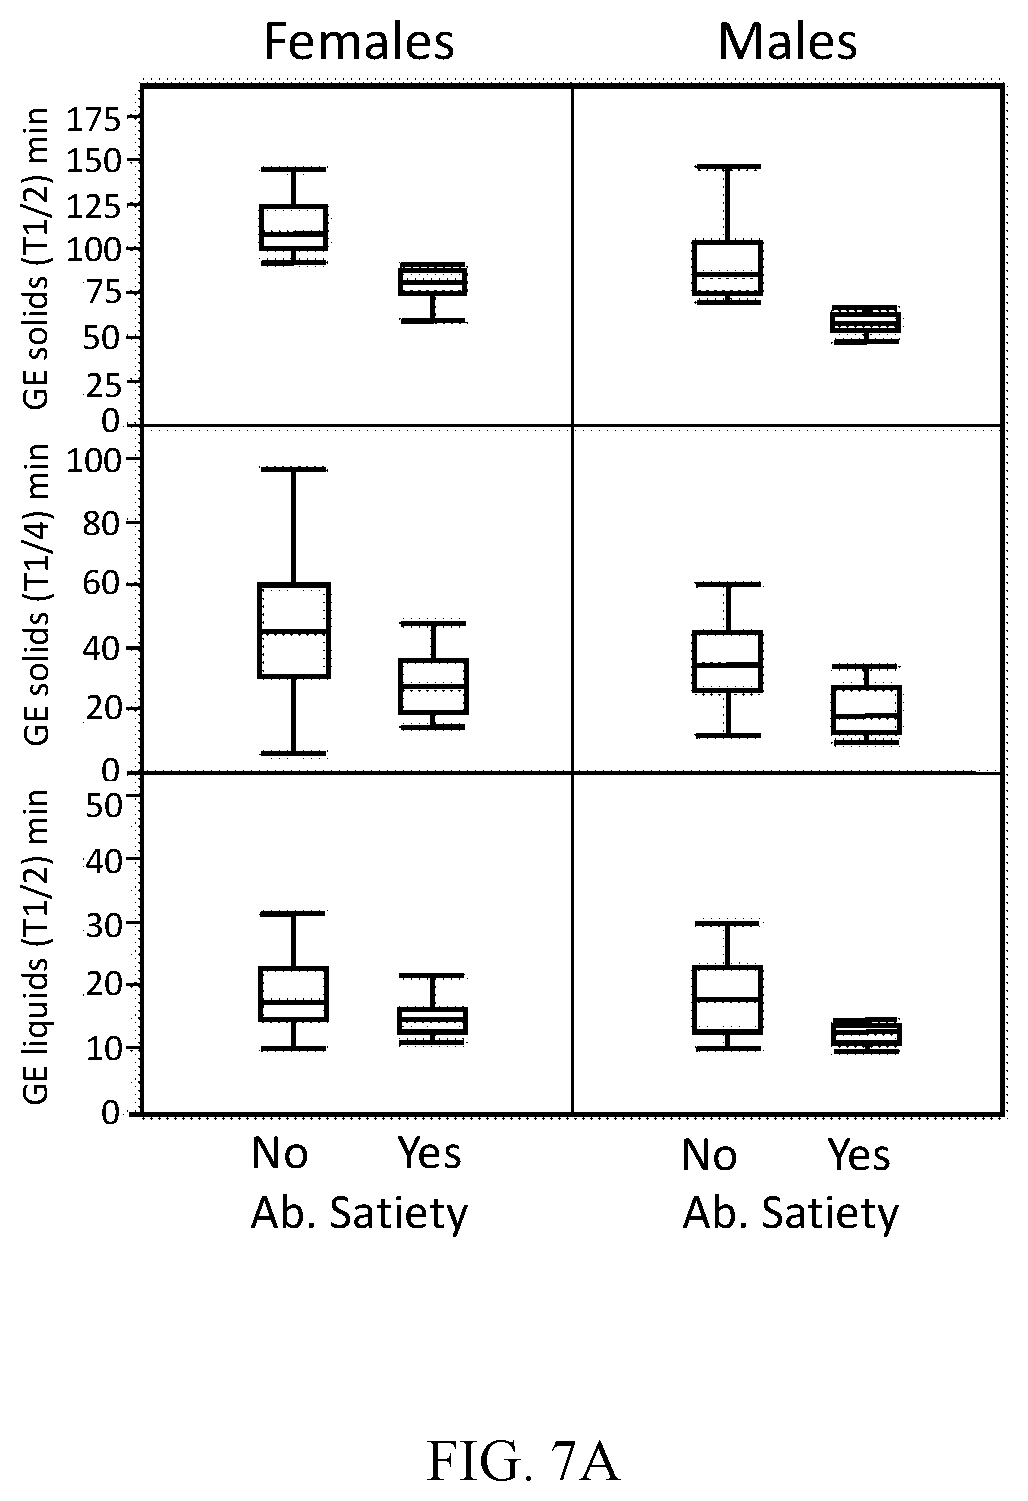
[0020] FIGS. 7A-7D shows abnormal satiety deeper phenotypes. A) Gastric emptying (GE) of solid T1/2 and T1/4, GE of liquids T1/5 for females and males. B) Fasting and postprandial gastric volume for females and males. C) Postprandial PYY3-36 and GLP-1 at 90 minutes. D) correlation of Postprandial PYY3-36 at 90 minutes and food intake by a nutrient drink test.
[0021] FIGS. 8A-8B show hedonic group deeper phenotypes. A) Anxiety, depression and self-esteem levels and B) fasting serum tryptophan levels in patients with hedonic obesity compared to normal.
[0022] FIGS. 9A-9D show slow metabolism deeper phenotypes. A) Predicted resting energy expenditure in patients with normal metabolism (other) compared to slow metabolism by gender (data in percentage). B) Resting energy expenditure in patients with normal metabolism (other) compared to slow metabolism (data in kcal/day). C) Body composition in different obesity-related phenotypes measured by DEXA. Top row is calculated BMI, med-row is total body fat and lower row is total lean mass. D) Levels of metabolites in patients with slow metabolism compared to normal metabolism (other or rest). Metabolites describes are Alanine, isocaproic acid, phosphoetahnolamine, phenylalanine, tyrosine, alpha-amino-N-butyric acid, sarcasine, and 1-methylhistidine.
[0023] FIG. 10 is a bar graph showing body weight change in response to treatment with placebo or a combination of phentermine and topiramate (PhenTop) and kcal intake at prior ad-libitum meal (satiation test).
[0024] FIG. 11 is a bar graph showing body weight change in response to treatment with placebo or exenatide in patients with a particular obesity phenotype.
[0025] FIGS. 12A-12C are a flow charts showing exemplary treatment interventions for obesity groups identified based, at least in part, on a patient's obesity analyte signature.
[0026] FIG. 13 is a bar graph showing total body weight loss (TBWL) in response to individualized intervention based on pre-selecting the specific individual patient's obesity analyte signature.
[0027] FIG. 14 is a line graph showing TBWL in response to individualized intervention over time.
DETAILED DESCRIPTION
[0028] This document provides methods and materials for assessing and/or treating obesity in mammals (e.g., humans). In some cases, this document provides methods and materials for identifying an obese mammal as being responsive to a pharmacological intervention, and administering one or more pharmacological interventions to treat the mammal. For example, a sample obtained from an obese mammal can be assessed to determine if the obese mammal is likely to be responsive to intervention (e.g., pharmacological intervention, surgical intervention, weight loss device, diet intervention, behavior intervention, and/or microbiome intervention) based, at least in part, on an obesity phenotype, which is based, at least in part, on an obesity analyte signature in the sample. An obesity analyte signature can include the presence, absence, or level (e.g., concentration) of two or more (e.g., three, four, five, six, seven, eight, nine, 10, 11, 12, 13, 14, 15, 16, 17, 18, 19, 20, or more) obesity analytes (e.g., biomarkers associated with obesity). In some cases, an obesity analyte signature can include 14 obesity analytes. For example, a pharmacotherapy responsive obesity analyte signature can be based, at least in part, on the presence, absence, or level of 14 obesity analytes. In some cases, an obesity analyte signature can include 9 obesity analytes. For example, a pharmacotherapy responsive obesity analyte signature can be based, at least in part, on the presence, absence, or level of 9 obesity analytes. In some cases, the methods and materials described herein can be used to predict further weight loss response (e.g., during the course of an obesity treatment). In some cases, the methods and materials described herein can be used to prevent plateaus (e.g., during the course of an obesity treatment). In some cases, the methods and materials described herein can be used to enhance weight loss maintenance (e.g., during the course of an obesity treatment). In some cases, the methods and materials described herein can be used to treat patients unable to lose and maintain weight with diet and exercise alone.
[0029] As described herein, a distinct obesity analyte signature can be present in each of six main obesity phenotypes: Group 1) low satiation, Group 2) low satiety (e.g., rapid return to hunger), Group 3) behavioral eating (e.g., as identified by questionnaire), Group 4) large fasting gastric volume, Group 5) mixed, and Group 6) low resting energy expenditure group. Also described herein, the obesity analyte signature in sample obtained from an obese mammal (and thus the obesity phenotype) can be used to predict intervention responsiveness. In some cases, obesity phenotype groups can be simplified as: 1) high energy intake, 2) behavioral/emotional eating, and 3) low energy expenditure; or can be simplified as 1) low satiation (fullness), 2) low satiety (return to hunger), 3) behavioral/emotional eating, 4) low energy expenditure, 5) mixed, and 6) other.
[0030] When treating obesity in a mammal (e.g., a human) as described herein, the mammal can also have one or more obesity-related (e.g., weight-related) co-morbidities. Examples of weight-related co-morbidities include, without limitation, hypertension, type 2 diabetes, dyslipidemia, obstructive sleep apnea, gastroesophageal reflux disease, weight baring joint arthritis, cancer, non-alcoholic fatty liver disease, nonalcoholic steatohepatitis, depression, anxiety, and atherosclerosis (coronary artery disease and/or cerebrovascular disease). In some cases, the methods and materials described herein can be used to treat one or more obesity-related co-morbidities.
[0031] When treating obesity in a mammal (e.g., a human) as described herein, the treatment can be effective to reduce the weight, reduce the waist circumference, slow or prevent weight gain of the mammal, improve the hemoglobin A1c, and/or improve the fasting glucose. For example, treatment described herein can be effective to reduce the weight (e.g., the total body weight) of an obese mammal by at least 3% (e.g., at least 5%, at least 8%, at least 10%, at least 12%, at least 15%, at least 18%, at least 20%, at least 22%, at least 25%, at least 28%, at least 30%, at least 33%, at least 36%, at least 39%, or at least 40%). For example, treatment described herein can be effective to reduce the weight (e.g., the total body weight) of an obese mammal by from about 3% to about 40% (e.g., from about 3% to about 35%, from about 3% to about 30%, from about 3% to about 25%, from about 3% to about 20%, from about 3% to about 15%, from about 3% to about 10%, from about 3% to about 5%, from about 5% to about 40%, from about 10% to about 40%, from about 15% to about 40%, from about 20% to about 40%, from about 25% to about 40%, from about 35% to about 40%, from about 5% to about 35%, from about 10% to about 30%, from about 15% to about 25%, or from about 18% to about 22%). For example, treatment described herein can be effective to reduce the weight (e.g., the total body weight) of an obese mammal by from about 3 kg to about 100 kg (e.g., about 5 kg to about 100 kg, about 8 kg to about 100 kg, about 10 kg to about 100 kg, about 15 kg to about 100 kg, about 20 kg to about 100 kg, about 30 kg to about 100 kg, about 40 kg to about 100 kg, about 50 kg to about 100 kg, about 60 kg to about 100 kg, about 70 kg to about 100 kg, about 80 kg to about 100 kg, about 90 kg to about 100 kg, about 3 kg to about 90 kg, about 3 kg to about 80 kg, about 3 kg to about 70 kg, about 3 kg to about 60 kg, about 3 kg to about 50 kg, about 3 kg to about 40 kg, about 3 kg to about 30 kg, about 3 kg to about 20 kg, about 3 kg to about 10 kg, about 5 kg to about 90 kg, about 10 kg to about 75 kg, about 15 kg to about 50 kg, about 20 kg to about 40 kg, or about 25 kg to about 30 kg). For example, treatment described herein can be effective to reduce the waist circumference of an obese mammal by from about 1 inches to about 10 inches (e.g., about 1 inches to about 9 inches, about 1 inches to about 8 inches, about 1 inches to about 7 inches, about 1 inches to about 6 inches, about 1 inches to about 5 inches, about 1 inches to about 4 inches, about 1 inches to about 3 inches, about 1 inches to about 2 inches, about 2 inches to about 10 inches, about 3 inches to about 10 inches, about 4 inches to about 10 inches, about 5 inches to about 10 inches, about 6 inches to about 10 inches, about 7 inches to about 10 inches, about 8 inches to about 10 inches, about 9 inches to about 10 inches, about 2 inches to about 9 inches, about 3 inches to about 8 inches, about 4 inches to about 7 inches, or about 5 inches to about 7 inches). In some cases, the methods and materials described herein can be used to improve (e.g., increase or decrease) the hemoglobin A1c of an obese mammal (e.g., an obese mammal having type 2 diabetes mellitus) to from about 0.4% to about 3% (e.g., from about 0.5% to about 3%, from about 1% to about 3%, from about 1.5% to about 3%, from about 2% to about 3%, from about 2.5% to about 3%, from about 0.4% to about 2.5%, from about 0.4% to about 2%, from about 0.4% to about 1.5%, from about 0.4% to about 1%, from about 0.5% to about 2.5%, or from about 1% to about 2%) hemoglobin A1c. In some cases, the methods and materials described herein can be used to improve (e.g., increase or decrease) the fasting glucose of an obese mammal (e.g., an obese mammal having type 2 diabetes mellitus) to from about 10 mg/dl to about 200 mg/dl (e.g., from about 15 mg/dl to about 200 mg/dl, from about 25 mg/dl to about 200 mg/dl, from about 50 mg/dl to about 200 mg/dl, from about 75 mg/dl to about 200 mg/dl, from about 100 mg/dl to about 200 mg/dl, from about 125 mg/dl to about 200 mg/dl, from about 150 mg/dl to about 200 mg/dl, from about 175 mg/dl to about 200 mg/dl, from about 190 mg/dl to about 200 mg/dl, from about 10 mg/dl to about 175 mg/dl, from about 10 mg/dl to about 150 mg/dl, from about 10 mg/dl to about 125 mg/dl, from about 10 mg/dl to about 100 mg/dl, from about 10 mg/dl to about 75 mg/dl, from about 10 mg/dl to about 50 mg/dl, from about 10 mg/dl to about 25 mg/dl, or from about 10 mg/dl to about 20 mg/dl) glucose.
[0032] Any type of mammal can be assessed and/or treated as described herein. Examples of mammals that can be assessed and/or treated as described herein include, without limitation, primates (e.g., humans and monkeys), dogs, cats, horses, cows, pigs, sheep, rabbits, mice, and rats. In some cases, the mammal can a human. In some cases, a mammal can be an obese mammal. For example, obese humans can be assessed for intervention (e.g., a pharmacological intervention) responsiveness, and treated with one or more interventions as described herein. In cases where mammal is a human, the human can be of any race. For example, a human can be Caucasian or Asian.
[0033] Any appropriate method can be used to identify a mammal as being overweight (e.g., as being obese). In some cases, calculating body mass index (BMI), measuring waist and/or hip circumference, health history (e.g., weight history, weight-loss efforts, exercise habits, eating patterns, other medical conditions, medications, stress levels, and/or family health history), physical examination (e.g., measuring your height, checking vital signs such as heart rate blood pressure, listening to your heart and lungs, and examining your abdomen), percentage of body fat and distribution, percentage of visceral and organs fat, metabolic syndrome, and/or obesity related comorbidities can be used to identify mammals (e.g., humans) as being obese. For example, a BMI of greater than about 30 kg/m.sup.2 can be used to identify mammals (e.g., Caucasian humans) as being obese. For example, a BMI of greater than about 27 kg/m.sup.2 with a co-morbidity can be used to identify mammals (e.g., Asian humans) as being obese.
[0034] Once identified as being obese, a mammal can be assessed to determine whether or not it is likely to respond to one or more interventions (e.g., pharmacological intervention, surgical intervention, weight loss device, diet intervention, behavior intervention, and/or microbiome intervention). For example, a sample obtained from the mammal can be assessed for pharmacological intervention responsiveness. As described herein, a panel of obesity analytes in a sample obtained from an obese mammal can be used to determine an obesity analyte signature of the mammal, and can be used in to determine an obesity phenotype of the mammal.
[0035] Any appropriate sample from a mammal (e.g., a human) having obesity can be assessed as described herein. In some cases, a sample can be a biological sample. In some cases, a sample can contain obesity analytes (e.g., DNA, RNA, proteins, peptides, metabolites, hormones, and/or exogenous compounds (e.g. medications)). Examples of samples that can be assessed as described herein include, without limitation, fluid samples (e.g., blood, serum, plasma, urine, saliva, sweat, or tears), breath samples, cellular samples (e.g., buccal samples), tissue samples (e.g., adipose samples), stool samples, gastro samples, and intestinal mucosa samples. In some cases, a sample (e.g., a blood sample) can be collected while the mammal is fasting (e.g., a fasting sample such as a fasting blood sample). In some cases, a sample can be processed (e.g., to extract and/or isolate obesity analytes). For example, a serum sample can be obtained from an obese mammal and can be assessed to determine if the obese mammal is likely to be responsive to one or more interventions (e.g., pharmacological intervention, surgical intervention, weight loss device, diet intervention, behavior intervention, and/or microbiome intervention) based, at least in part, on an obesity phenotype, which is based, at least in part, on an obesity analyte signature in the sample. For example, a urine sample can be obtained from an obese mammal and can be assessed to determine if the obese mammal is likely to be responsive to pharmacological intervention based, at least in part, on an obesity phenotype, which is based, at least in part, on an obesity analyte signature in the sample.
[0036] An obesity analyte signature can include any appropriate analyte. Examples of analytes that can be included in an obesity analyte signature described herein include, without limitation, DNA, RNA, proteins, peptides, metabolites, hormones, and exogenous compounds (e.g. medications). An obesity analyte signature can be evaluated using any appropriate methods. For example, metabolomics, genomics, microbiome, proteomic, peptidomics, and behavioral questionnaires can be used to evaluate and/or identify an obesity analyte signature described herein.
[0037] Any appropriate method can be used to identify an obesity phenotype as described herein. In some cases, the obesity phenotype can be identified as described in the Examples. For example, the obesity phenotype can be identified by determining the obesity analyte signature in a sample (e.g., in a sample obtained from an obese mammal). In some cases, the obesity analyte signature can be obtained by detecting the presence, absence, or level of one or more metabolites, detecting the presence, r absence, or level one or more peptides (e.g., gastrointestinal peptides), and/or detecting the presence, absence, or level of one or more single nucleotide polymorphisms (SNPs).
[0038] A metabolite can be any metabolite that is associated with obesity. In some cases, a metabolite can be an amino-compound. In some cases, a metabolite can be a neurotransmitter. In some cases, a metabolite can be a fatty acid (e.g., a short chain fatty acid). In some cases, a metabolite can be an amino compound. In some cases, a metabolite can be a bile acid. In some cases, a metabolite can be a compound shown in Table 2. Examples of metabolites that can be used to determine the obesity analyte signature in a sample (e.g., in a sample obtained from an obese mammal) include, without limitation, 1-methylhistine, serotonin, glutamine, gamma-amino-n-butyric-acid, isocaproic, allo-isoleucine, hydroxyproline, beta-aminoisobutyric-acid, alanine, hexanoic, tyrosine, phenylalanine .gamma.-aminobutyric acid, acetic, histidine, LCA, ghrelin, ADRA2A, cholesterol, glucose, acetylcholine, propionic, CDCA, PYY, ADRA2C, insulin, adenosine, isobutyric, 1-methylhistidine, DCA, CCK, GNB3, glucagon, aspartate, butyric, 3-methylhistidine, UDCA, GLP-1, FTO, leptin, dopamine, valeric, asparagine, HDCA, GLP-2, MC4R, adiponectin, D-serine, isovaleric, phosphoethanolamine, CA, glucagon, TCF7L2, glutamate, hexanoic, arginine, GLCA, oxyntomodulin, 5-HTTLPR, glycine, octanoic, carnosine, GCDCA, neurotensin, HTR2C, myristic, taurine, GDCA, FGF, UCP2, norepinephrine, palmitic, anserine, GUDCA, GIP, UCP3, serotonin, palmitoleic, serine, GHDCA, OXM, GPBAR1, taurine, palmitelaidic, glutamine, GCA, FGF19, NR1H4, stearic, ethanolamine, TLCA, FGF21, FGFR4, oleic, glycine, TCDCA, LDL, elaidic, aspartic acid, TDCA, insulin, GLP-1, linoleic, sarcosine, TUDCA, glucagon, CCK, a-linolenic, proline, THDCA, amylin, arachidonic, alpha-aminoadipic-acid, TCA, pancreatic polypeptide, eicosapentaenoic, DHCA, neurotensin, docosahexaenoic, alpha-amino-N-butyric-acid, THCA, ornithine, GLP-1 receptor, triglycerides, cystathionine 1, GOAT, cystine, DPP4, lysine, methionine, valine, isoleucine, leucine, homocystine, tryptophan, citrulline, glutamic acid, beta-alanine, threonine, hydroxylysine 1, acetone, and acetoacetic acid. In some cases, an obesity analyte signature can include 1-methylhistine, serotonin, glutamine, gamma-amino-n-butyric-acid, isocaproic, allo-isoleucine, hydroxyproline, beta-aminoisobutyric-acid, alanine, hexanoic, tyrosine, and phenylalanine.
[0039] A gastrointestinal peptide can be any gastrointestinal peptide that is associated with obesity. In some cases, a gastrointestinal peptide can be a peptide hormone. In some cases, a gastrointestinal peptide can be released from gastrointestinal cells in response to feeding. In some cases, a gastrointestinal peptide can be a peptide shown in Table 2. Examples of gastrointestinal peptides that can be used to determine the obesity analyte signature in a sample (e.g., in a sample obtained from an obese mammal) include, without limitation, ghrelin, peptide tyrosine tyrosine (PYY), cholecystokinin (CCK), glucagon-like peptide-1 (GLP-1), GLP-2, glucagon, oxyntomodulin, neurotensin, fibroblast growth factor (FGF), GIP, OXM, FGF19, FGF19, and pancreatic polypeptide.
[0040] A SNP can be any SNP that is associate with obesity. A SNP can be in a coding sequence (e.g., in a gene) or a non-coding sequence. For example, in cases where a SNP is in a coding sequence, the coding sequence can be any appropriate coding sequence. In some cases, a coding sequence that can include a SNP associated with obesity can be a gene shown in Table 2. Examples of coding sequences that a SNP associated with obesity can be in or near include, without limitation, ADRA2A, ADRA2C, GNB3, FTO, MC4R, TCF7L2, 5-HTTLPR, HTR2C, UCP2, UCP3, GPBAR1, NR1H4, FGFR4, PYY, GLP-1, CCK, leptin, adiponectin, neurotensin, ghrelin, GLP-1 receptor, GOAT, DPP4, POMC, NPY, AGRP, SERT, BDNF, SLC6A4, DRD2, LEP, LEPR, UCP1, KLF14, NPC1, LYPLAL1, ADRB2, ADRB3, BBS1, ACSL6, ADARB2, ADCY8, ADH1B, AJAP1, ATP2C2, ATP6V0D2, C21orf7, CAMKMT, CAP2, CASC4, CD48, CDC42SE2, CDYL, CES5AP1, CLMN, CNPY4, COL19A1, COL27A1, COL4A3, CORO1C, CPZ, CTIF, DAAM2, DCHS2, DOCKS, EGFLAM, FAM125B, FAM71E2, FRMD3, GALNTL4, GLT1D1, HHAT, KRT23, LHPP, LINC00578, LINC00620, LIPC, LOC100128714, LOC100287160, LOC100289473, LOC100293612|LINC00620, LOC100506869, LOC100507053, LOC100507053|ADH1A, LOC100507053|ADH, LOC100507443, LOC100996571|CYYR1, LOC152225, LOC255130, LPAR1, LUZP2, MCM7, MICAL3, MMS19, MYBPC1, NR2F2-AS1, NSMCE2, NTN1, O3FAR1, OAZ2, OSBP2, P4HA2, PADI1, PARD3B, PARK2, PCDH15, PIEZO2, PKIB, PRH1-PRR4, PTPRD, RALGPS1|ANGPTL2, RPS24P10, RTN4RL1, RYR2, SCN2A, SEMA3C, SEMA5A, SFMBT2, SGCG, SLC22A15, SLC2A2, SLCO1B1, SMOC2 ,SNCAIP, SNX18, SRRM4, SUSD1, TBC1D16, TCERG1L, TENM3, TJP3, TLL1, TMEM9B, TPM1, VTI1A, VWF, WWOX, WWTR1, ZFYVE28, ZNF3, ZNF609, and ZSCAN21. In some cases, a SNP can be a SNP shown in Table 3. Examples of SNPS that can be used to determine the obesity analyte signature in a sample (e.g., in a sample obtained from an obese mammal) include, without limitation, rs657452, rs11583200, rs2820292, rs11126666, rs11688816, rs1528435, rs7599312, rs6804842, rs2365389, rs3849570, rs16851483, rs17001654, rs11727676, rs2033529, rs9400239, rs13191362, rs1167827, rs2245368, rs2033732, rs4740619, rs6477694, rs1928295, rs10733682, rs7899106, rs17094222, rs11191560, rs7903146, rs2176598, rs12286929, rs11057405, rs10132280, rs12885454, rs3736485, rs758747, rs2650492, rs9925964, rs1000940, rs1808579, rs7243357, rs17724992, rs977747, rs1460676, rs17203016, rs13201877, rs1441264, rs7164727, rs2080454, rs9914578, rs2836754, rs492400, rs16907751, rs9374842, rs9641123, rs9540493, rs4787491, rs6465468, rs7239883, rs3101336, rs12566985, rs12401738, rs11165643, rs17024393, rs543874, rs13021737, rs10182181, rs1016287, rs2121279, rs13078960, rs1516725, rs10938397, rs13107325, rs2112347, rs205262, rs2207139, rs17405819, rs10968576, rs4256980, rs11030104, rs3817334, rs7138803, rs12016871, rs12429545, rs11847697, rs7141420, rs16951275, rs12446632, rs3888190, rs1558902, rs12940622, rs6567160, rs29941, rs2075650, rs2287019, rs3810291, rs7715256, rs2176040, rs6091540, rs1800544, Ins-Del-322 , rs5443, rs1129649, rs1047776, rs9939609, rs17782313, rs7903146, rs4795541, rs3813929, rs518147, rs1414334, rs659366 , -3474, rs2075577, rs15763, rs1626521, rs11554825, rs4764980, rs434434, rs351855, and rs2234888.
[0041] An obesity analyte signature described herein can include any appropriate combination of analytes. For example, when an obesity analyte signature includes 14 analytes, the analytes can include 1-methylhistine, serotonin, glutamine, gamma-amino-n-butyric-acid, isocaproic, allo-isoleucine, hydroxyproline, beta-aminoisobutyric-acid, alanine, hexanoic, tyrosine, phenylalanine, ghrelin, and PYY. For example, when an obesity analyte signature includes 9 analytes, the analytes can include HTR2C, GNB3, FTO, isocaproic, beta-aminoisobutyric-acid, butyric, allo-isoleucine, tryptophan, and glutamine.
[0042] Any appropriate method can be used to detect the presence, absence, or level of an obesity analyte within a sample. For example, mass spectrometry (e.g., triple-stage quadrupole mass spectrometry coupled with ultra-performance liquid chromatography (UPLC)), radioimmuno assays, and enzyme-linked immunosorbent assays can be used to determine the presence, absence, or level of one or more analyte in a sample.
[0043] In some cases, identifying the obesity phenotype can include obtaining results from all or part of one or more questionnaires. A questionnaire can be associated with obesity. In some cases, a questionnaire can be answered the time of the assessment. In some cases, a questionnaire can be answered prior to the time of assessment. For example, when a questionnaire is answered prior to the time of the assessment, the questionnaire results can be obtained by reviewing a patient history (e.g., a medical chart). A questionnaire can be a behavioral questionnaire (e.g., psychological welfare questionnaires, alcohol use questionnaires, eating behavior questionnaires, body image questionnaires, physical activity level questionnaire, and weight management questionnaires. Examples of questionnaires that can be used to determine the obesity phenotype of a mammal (e.g., an obese mammal) include, without limitation, The Hospital Anxiety and Depression Scale (HADS) questionnaire, The Hospital Anxiety and Depression Inventory questionnaire, The Questionnaire on Eating and Weight Patterns, The Weight Efficacy Life-Style (WEL) Questionnaire, The Multidimensional Body-Self Relations Questionnaire, The Questionnaire on Eating and Weight Patterns-Revised, The Weight Efficacy Life-Style, Physical Activity Level-item Physical Activity Stages of Change Questionnaire, The Exercise Regulations Questionnaire (BREQ-3), Barriers to Being Active Quiz, and The Three Factor Eating Questionnaire (TFEQ). For example, a questionnaire can be a HADS questionnaire. For example, a questionnaire can be a TFEQ.
[0044] In some cases, an obesity analyte signature can include the presence of serotonin, glutamine, isocaproic, allo-isoleucine, hydroxyproline, beta-aminoisobutyric-acid, alanine, hexanoic, tyrosine, and PYY. For example, an obesity phenotype Group 1 can have an obesity analyte signature that includes the presence of serotonin, glutamine, isocaproic, allo-isoleucine, hydroxyproline, beta-aminoisobutyric-acid, alanine, hexanoic, tyrosine, and PYY. For example, an obesity phenotype Group 1 can have an obesity analyte signature that has an absence of (e.g., lacks the presence of) 1-methylhistine, gamma-amino-n-butyric-acid, phenylalanine, ghrelin, and includes a HADS questionnaire result that does not indicate an anxiety subscale (HADS-A; e.g., includes a HADS-A questionnaire result).
[0045] In some cases, an obesity analyte signature can include the presence of 1-methylhistine, allo-isoleucine, hydroxyproline, beta-aminoisobutyric-acid, alanine, and phenylalanine. For example, an obesity phenotype Group 2 can have an obesity analyte signature that includes the presence of -methylhistine, allo-isoleucine, hydroxyproline, beta-aminoisobutyric-acid, alanine, and phenylalanine. For example, an obesity phenotype Group 2 can have an obesity analyte signature that has an absence of (e.g., lacks the presence of) serotonin, glutamine, gamma-amino-n-butyric-acid, isocaproic, hexanoic, tyrosine, ghrelin, PYY, and does not include a HADS questionnaire result that indicates an anxiety subscale (e.g., does not include a HADS-A questionnaire result)
[0046] In some cases, an obesity analyte signature can include the presence of serotonin, and can include a HADS-A questionnaire. For example, an obesity phenotype Group 3 can have an obesity analyte signature that includes serotonin and includes a HADS-A questionnaire result. For example, an obesity phenotype Group 3 can have an obesity analyte signature that has an absence of (e.g., lacks the presence of) 1-methylhistine, glutamine, gamma-amino-n-butyric-acid, isocaproic, allo-isoleucine, hydroxyproline, beta-aminoisobutyric-acid, alanine, hexanoic, tyrosine, phenylalanine, ghrelin, and PYY.
[0047] In some cases, an obesity analyte signature can include the presence of 1-methylhistine, glutamine, gamma-amino-n-butyric-acid, isocaproic, allo-isoleucine, beta-aminoisobutyric-acid, alanine, hexanoic, tyrosine, phenylalanine, PYY, and includes a HADS-A questionnaire result. For example, an obesity phenotype Group 4 can have an obesity analyte signature that includes 1-methylhistine, glutamine, gamma-amino-n-butyric-acid, isocaproic, allo-isoleucine, beta-aminoisobutyric-acid, alanine, hexanoic, tyrosine, phenylalanine, PYY, and includes a HADS-A questionnaire result. For example, an obesity phenotype Group 4 can have an obesity analyte signature that has an absence of (e.g., lacks the presence of) serotonin, hydroxyproline, and ghrelin.
[0048] In some cases, an obesity analyte signature can include the presence of serotonin, beta-aminoisobutyric-acid, alanine, hexanoic, phenylalanine, and includes a HADS-A questionnaire. For example, an obesity phenotype Group 5 can have an obesity analyte signature that includes the presence of serotonin, beta-aminoisobutyric-acid, alanine, hexanoic, phenylalanine, and includes a HADS-A questionnaire result. For example, an obesity phenotype Group 5 can have an obesity analyte signature that has an absence of (e.g., lacks the presence of) 1-methylhistine, glutamine, gamma-amino-n-butyric-acid, isocaproic, allo-isoleucine, and hydroxyproline.
[0049] In some cases, an obesity analyte signature can include the presence of 1-methylhistine, serotonin, glutamine, gamma-amino-n-butyric-acid, isocaproic, allo-isoleucine, alanine, tyrosine, ghrelin, PYY, and includes a HADS-A questionnaire result. For example, an obesity phenotype Group 6 can have an obesity analyte signature that includes the presence of 1-methylhistine, serotonin, glutamine, gamma-amino-n-butyric-acid, isocaproic, allo-isoleucine, alanine, tyrosine, ghrelin, PYY, and includes a HADS-A questionnaire result. For example, an obesity phenotype Group 6 can have an obesity analyte signature that has an absence of (e.g., lacks the presence of) hydroxyproline, beta-aminoisobutyric-acid, hexanoic, and phenylalanine.
[0050] In some cases, identifying the obesity phenotype also can include identifying one or more additional variables and/or one or more additional assessments. For example, identifying the obesity phenotype also can include assessing the microbiome of a mammal (e.g., an obese mammal). For example, identifying the obesity phenotype also can include assessing leptin levels. For example, identifying the obesity phenotype also can include assessing the metabolome of a mammal (e.g., an obese mammal). For example, identifying the obesity phenotype also can include assessing the genome of a mammal (e.g., an obese mammal). For example, identifying the obesity phenotype also can include assessing the proteome of a mammal (e.g., an obese mammal). For example, identifying the obesity phenotype also can include assessing the peptidome of a mammal (e.g., an obese mammal).
[0051] Once the obesity phenotype of the mammal has been identified, the mammal can be assessed to determine intervention (e.g., pharmacological intervention, surgical intervention, weight loss device, diet intervention, behavior intervention, and/or microbiome intervention) responsiveness, and a treatment option for the mammal can be selected. In some cases, the obesity phenotype of a mammal can be used to select a treatment options as shown in FIG. 12, and as set forth in Table 1.
TABLE-US-00001 TABLE 1 Treatment options. Obesity Phenotype Group Pharmacotherapy Exemplary Intervention Pharmacotherapy Intervention: FDA approved medications 1: low satiation appetite suppressant in combination phentermine-topiramate with an anticonvuslant appetite suppressant lorcaserin, desvenlafaxine 2: low satiety GLP-1 analog, GLP-1 receptor liraglutide, exenatide, metformin, agonist, amylin analogs pramlitide 3: behavioral eating antidepressant in combination with naltrexone-bupropion an opioid antagonist 4: large fasting gastric antidepressant in combination with naltrexone-bupropion volume an opioid antagonist 5: mixed combination based on the combination of phenotypes 6: low resting energy appetite suppressant in combination with phentermine + increased physical expenditure physical activity activity Pharmacotherapy Intervention: medications not-FDA approved 1: low satiation melanocortin receptor MK-0493 RM-493 appetite suppressants CCK analogs 2: low satiety GLP-1 analog - GLP-1 semaglutide, receptor agonists - GLP-1/glucagon coagonists PYY analogs - Y receptors velnerperit (s-2367) agonists/antagonists obinepitide Oxyntomodulin analogs Ghrelin antagonists TGR5 agonists Conjugated bile acids FGF-19/21 analogs FXR agonists GRP-119 GRP-120 Combinations of these meds 3: behavioral eating antidepressant bupropion + zonisamide opioid antagonist Tesofensine anti-anxiety Buspirone cannabionids antagonists rimonabant 4: large fasting gastric ghrelin antagonist volume 5: mixed combination based on the combination of phenotypes 6: low resting leptin modulators metroleptin energy expenditure MetAP2 inhibitors ZGN-1061, beloranib B3 agonists mirabegron Weight Loss Devices Obesity Phenotype Group Surgical procedure and devices Exemplary Intervention 1: low satiation vagal stimulant V-bloc mouth occupying devices Retrograde gastric pacing intra-gastric space occupying Smartbyte .TM. devices gastric balloon sleeve gastroplasty 2: low satiety duodenal bypass or mucosal Endobarrier resurfacing (example: ablation) intra-gastric space occupying gastric balloon devices malabsorptive procedures transpyloric shuttle 3: behavioral eating gastric emptying devices Aspire assist 4: large fasting gastric gastric emptying devices Aspire assist volume intra-gastric space occupying gastric balloon devices sleeve gastroplasty 5: mixed combination based on the combination of phenotypes 6: low resting energy phentermine + increased physical expenditure activity 1: low satiation Gastric occupying space Transoral endoscopic restrictive implant system Brain stimulant deep transcranial magnetic stimulation 2: low satiety Duodenal bypass or mucosal Fractyl - duodenal ablation resurfacing (example: ablation) Intra-gastric space occupying Intragastric balloons - adjustable devices Malabsorptive procedures Magnet therapy (Incision-less Anastomosis System) 3: behavioral eating 4: large fasting gastric Intra-gastric space occupying Intragastric balloons - adjustable volume devices Gastric plications POSE 5: mixed combination based on the combination of phenotypes 6: low resting energy Muscle stimulants Pulse muscle stimulator expenditure Energy trackers Cold inducers (stimulates BAT) Cold vests Diet Intervention Obesity Phenotype Group Diet Exemplary Intervention 1: low satiation Slow eating volumetric diet Legumes, fruits, beans, whole grains high fat - high protein - low carb Atkins diet Keto diet 2: low satiety High protein - low carb- average Paleo-diet fat Mediterranean diet 3: behavioral eating Schedule 2-3 meals daily. No snacks Crash diet 4: large fasting gastric High soluble fiber Fiber supplements, volume 5: mixed 6: low resting energy Low fat - Average protein, average 13-day Metabolism diet expenditure carbs Surgical Intervention Obesity Phenotype Group Surgical procedure Exemplary Intervention 1: low satiation Restrictive procedures Sleeve RYGB Lap-band 2: low satiety Malabsorptive procedures RYGB - Sleeve plus duodenal switch 3: behavioral eating 4: large fasting gastric Restrictive procedures Sleeve volume RYGB 5: mixed 6: low resting energy Malabsorptive procedures RYGB - duodenal switch expenditure Microbiome Intervention Obesity Phenotype Group Microbiome status Exemplary Intervention 1: low satiation Microbiota inflammatory inducing Reduce microbiome LPS induction 2: low satiety Low microbiome richness Increase richness of microbiota (probiotic mix) to increase SCFA in GI lumen 3: behavioral eating Serotonin producing bacteria Reduced serotonin producing bacteria: restore Bacteroides spp 4: large fasting gastric Low microbiome richness Increase primary BA microbiota volume 5: mixed 6: low resting energy Low fatty acids producing bacteria Increase fatty acid metabolism expenditure producing bacteria
[0052] Individualized pharmacological interventions for the treatment of obesity (e.g., based on the obesity phenotypes as described herein) can include any one or more (e.g., 1, 2, 3, 4, 5, 6, or more) pharmacotherapies (e.g., individualized pharmacotherapies). A pharmacotherapy can include any appropriate pharmacotherapy. In some cases, a pharmacotherapy can be an obesity pharmacotherapy. In some cases, a pharmacotherapy can be an appetite suppressant. In some cases, a pharmacotherapy can be an anticonvulsant. In some cases, a pharmacotherapy can be a GLP-1 agonist. In some cases, a pharmacotherapy can be an antidepressant. In some cases, a pharmacotherapy can be an opioid antagonist. In some cases, a pharmacotherapy can be a controlled release pharmacotherapy. For example, a controlled release pharmacotherapy can be an extended release (ER) and/or a slow release (SR) pharmacotherapy. In some cases, a pharmacotherapy can be a lipase inhibitor. In some cases, a pharmacotherapy can be a DPP4 inhibitor. In some cases, a pharmacotherapy can be a SGLT2 inhibitor. In some cases, a pharmacotherapy can be a dietary supplement. Examples of pharmacotherapies that can be used in an individualized pharmacological intervention as described herein include, without limitation, orlistat, phentermine, topiramate, lorcaserin, naltrexone, bupropion, liraglutide, exenatide, metformin, pramlitide, Januvia, canagliflozin, dexamphetamines, prebiotics, probiotics, Ginkgo biloba, and combinations thereof. For example, combination pharmacological interventions for the treatment of obesity (e.g., based on the obesity phenotypes as described herein) can include phentermine-topiramate ER, naltrexone-bupropion SR, phentermine-lorcaserin, lorcaserin-liraglutide, and lorcarserin-januvia. A pharmacotherapy can be administered using any appropriate methods. In some cases, pharmacotherapy can be administered by continuous pump, slow release implant, intra-nasal administered, intra-oral administered, and/or topical administered. In some cases, a pharmacotherapy can be administered as described elsewhere (see, e.g., Sjostrom et al., 1998 Lancet 352:167-72; Hollander et al., 1998 Diabetes Care 21:1288-94; Davidson et al., 1999 JAMA 281:235-42; Gadde et al., 2011 Lancet 377:1341-52; Smith et al., 2010 New Engl. J Med. 363:245-256; Apovian et al., 2013 Obesity 21:935-43; Pi-Sunyer et al., 2015 New Engl. J Med. 373:11-22; and Acosta et al., 2015 Clin Gastroenterol Hepatol. 13:2312-9).
[0053] Once a mammal is identified as being responsive to one or more interventions (e.g., pharmacological intervention, surgical intervention, weight loss device, diet intervention, behavior intervention, and/or microbiome intervention) based, at least in part, on an obesity phenotype, which is based, at least in part, on an obesity analyte signature in the sample, the mammal can be administered or instructed to self-administer one or more individualized pharmacotherapies.
[0054] When a mammal is identified as having an obesity phenotype that is responsive to treatment with one or more pharmacotherapies, the mammal can be administered or instructed to self-administer one or more pharmacotherapies. For example, when a mammal is identified as having a low satiation (Group 1) phenotype, based, at least in part, on an obesity analyte signature, the mammal can be administered or instructed to self-administer phentermine-topiramate (e.g., phentermine-topiramate ER) to treat the obesity. For example, when a mammal is identified as having a low satiation (Group 1) phenotype, based, at least in part, on an obesity analyte signature, the mammal can be administered or instructed to self-administer lorcaserin to treat the obesity. For example, when a mammal is identified as having a low satiety (Group 2) phenotype, based, at least in part, on an obesity analyte signature, the mammal can be administered or instructed to self-administer liraglutide to treat the obesity. For example, when a mammal is identified as having a behavioral eating (Group 3) phenotype, based, at least in part, on an obesity analyte signature, the mammal can be administered or instructed to self-administer naltrexone-bupropion (e.g., naltrexone-bupropion SR) to treat the obesity. For example, when a mammal is identified as having a large fasting gastric volume (Group 4) phenotype, based, at least in part, on an obesity analyte signature, the mammal can be administered or instructed to self-administer naltrexone-bupropion (e.g., naltrexone-bupropion SR) to treat the obesity. For example, when a mammal is identified as having a low resting energy expenditure (Group 6) phenotype, based, at least in part, on an obesity analyte signature, the mammal can be administered or instructed to self-administer phentermine, and can be instructed to increase physical activity to treat the obesity.
[0055] In some cases, one or more pharmacotherapies described herein can be administered to an obese mammal as a combination therapy with one or more additional agents/therapies used to treat obesity. For example, a combination therapy used to treat an obese mammal (e.g., an obese human) can include administering to the mammal one or more pharmacotherapies described herein and one or more obesity treatments such as weight-loss surgeries (e.g., gastric bypass surgery, laparoscopic adjustable gastric banding (LAGB), biliopancreatic diversion with duodenal switch, and a gastric sleeve), vagal nerve blockade, endoscopic devices (e.g. intragastric balloons or endoliners, magnets), endoscopic sleeve gastroplasty, and/or gastric or duodenal ablations. For example, a combination therapy used to treat an obese mammal (e.g., an obese human) can include administering to the mammal one or more pharmacotherapies described herein and one or more obesity therapies such as exercise modifications (e.g., increased physical activity), dietary modifications (e.g., reduced-calorie diet), behavioral modifications, commercial weight loss programs, wellness programs, and/or wellness devices (e.g. dietary tracking devices and/or physical activity tracking devices). In cases where one or more pharmacotherapies described herein are used in combination with one or more additional agents/therapies used to treat obesity, the one or more additional agents/therapies used to treat obesity can be administered/performed at the same time or independently. For example, the one or more pharmacotherapies described herein can be administered first, and the one or more additional agents/therapies used to treat obesity can be administered/performed second, or vice versa.
[0056] This document provides methods and materials for identifying one or more analytes associated with obesity. In some cases, analytes associated with obesity can be used in an obesity analyte signature as described herein. For example, one or more analytes associated with obesity can be identified by using a combined logit regression model. In some cases, a combined logit regression model can include stepwise variable selection (e.g., to identify variables significantly associated with a specific obesity phenotype). For example, one or more analytes associated with obesity can be identified as described in, for example, the Examples section provided herein.
[0057] The invention will be further described in the following examples, which do not limit the scope of the invention described in the claims.
EXAMPLES
Example 1
Identification of Obesity Biomarkers
[0058] Obesity phenotypes were associated with higher BMI, distinguish obesity phenotypes, and can be used to predict responsiveness to obesity pharmacotherapy and endoscopic devices (see, e.g., Acosta et al., 2015 Gastroenterology 148:537-546). In this study, biomarkers specific to each obesity phenotype were identified using metabolomics.
[0059] The overall cohort demographics [median (IQR)] were age 36 (28-46) years, BMI 35 (32-38) kg/m2, 75% females, 100% Caucasians. The groups based on phenotype > or <75% ile were not statistically different for body weight, waist circumference, hip circumference, fasting glucose. The group distribution in this cohort was: abnormal satiation (16%), abnormal satiety (16%), abnormal hedonic/psych (19%), slow metabolism/energy expenditure (32%), and mixed group (17%) (FIG. 1A). FIGS. 1B-E illustrate summarize characteristics of the quantitative changes in the subgroups: the satiation group consumed 591 (60%) more calories prior to reaching fullness; the satiety group emptied half of the solid 300 kcal meal 34 min (30%) faster; the hedonic group reported 2.8 times higher levels of anxiety; the slow metabolism group has 10% decreased predicted resting energy expenditure than other groups. These average differences were in comparison to the other groups, but excluding the group with participants with a mixed or overlapping phenotype.
Gastrointestinal Traits (Phenotypes) Associated with Obesity
[0060] Gastrointestinal functions, satiation, and satiety were characterized in 509 participants across the normal weight to obesity spectrum. Obesity was associated with decreased satiation (higher caloric intake before feeling full, measure by volume to fullness [VTF] p=0.038), large fasting gastric volume (GV, p=0.03), accelerated gastric emptying (GE) T.sub.1/2 (solids: p<0.001; liquids: p=0.011), and lower postprandial peak plasma levels of PYY (p=0.003). In addition, principal components (PC) analysis identified latent dimensions (LDs) accounting for .about.81% of OW-OB variation and sub-classifies obesity in satiation (21%), gastric capacity (15%), behavioral (13%), gastric sensorimotor (11%) factors, GLP-1 levels (9%), and others (31%) (Acosta et al., 2015 Gastroenterology 148:537-546).
Identification of Biomarkers
[0061] An analysis of 102 patients with obesity, matched for gender, age and BMI was done. These individuals were non-diabetic and were in not medications for weight loss. Based on the profile of each patient we were able to validate the main groups in obesity in 1) low satiation, 2) rapid return to hunger, 3) behavioral eating (identified by questionnaire), 4) large fasting gastric volume, 5) mixed, and 6) low resting energy expenditure group.
[0062] A combined logit regression model using stepwise variable selection was created to identify variables that are significantly associated with each of the phenotypic classes. Untargeted metabolomics identified unique metabolites in each group (FIG. 2A). Each of these metabolites is independent from the other groups (FIG. 2B). From these metabolites, a "VIP" (variable of importance) was identified for each group. Then, a targeted metabolomics was done with the VIP as well as neurotransmitters, amino compounds, fatty acids, and short chain fatty acids. Examples variables are as shown in Tables 2-5. For example, targeted metabolites, peptides, and SNPS analyzed are as shown in Table 2, other obesity related gene variants are as shown in in Table 3, targeted peptides are as shown in in Table 4, and targeted genes are as shown in in Table 5.
TABLE-US-00002 TABLE 2 Analytes Examined using SNPs, Hormones, Peptides and Targeted Metabolomics. SNP- Neuro Fatty acids containing transmitters and Lipid Amino Compounds Bile acids Peptides Genes Hormones carbohydrates .gamma.-aminobutyric acetic Histidine LCA ghrelin ADRA2A cholesterol glucose acid Acetylcholine propionic Hydroxyproline CDCA PYY ADRA2C insulin Adenosine isobutyric 1-Methylhistidine DCA CCK GNB3 glucagon aspartate butyric 3-Methylhistidine UDCA GLP-1 FTO leptin Dopamine valeric Asparagine HDCA GLP-2 MC4R adiponectin D-serine isovaleric Phosphoethanolamine CA glucagon TCF7L2 Glutamate hexanoic Arginine GLCA oxyntomodulin 5-HTTLPR Glycine octanoic Carnosine GCDCA neurotensin HTR2C Histidine myristic Taurine GDCA FGF UCP2 Norepinephrine palmitic Anserine GUDCA GIP UCP3 Serotonin palmitoleic Serine GHDCA OXM GPBAR1 Taurine palmitelaidic Glutamine GCA FGF19 NR1H4 stearic Ethanolamine TLCA FGF21 FGFR4 oleic Glycine TCDCA LDL PYY elaidic Aspartic Acid TDCA insulin GLP-1 linoleic Sarcosine TUDCA glucagon CCK a-linolenic Proline THDCA amylin Leptin arachidonic alpha- TCA pancreatic Adiponectin Aminoadipic- polypeptide acid eicosapentaenoic beta- DHCA leptin Neurotensin Aminoisobutyric- acid docosahexaenoic alpha-Amino- THCA adiponectin Ghrelin N-butyric-acid LDL Ornithine GLP-1 receptor triglycerides Cystathionine 1 GOAT Cystine DPP4 Lysine Tyrosine Methionine Valine Isoleucine Leucine Homocystine Phenylalanine Tryptophan Citrulline Glutamic Acid beta-Alanine Threonine Alanine Hydroxylysine 1 Acetone Acetoacetic Acid
TABLE-US-00003 TABLE 3 SNPs associated with obesity [Is this title accurate?] SNP Chr. Position (bp) Nearest Gene rs657452 1 49,362,434 AGBL4 rs11583200 1 50,332,407 ELAVL4 rs2820292 1 200,050,910 NAV1 rs11126666 2 26,782,315 KCNK3 rs11688816 2 62,906,552 EHBP1 rs1528435 2 181,259,207 UBE2E3 rs7599312 2 213,121,476 ERBB4 rs6804842 3 25,081,441 RARB rs2365389 3 61,211,502 FHIT rs3849570 3 81,874,802 GBE1 rs16851483 3 142,758,126 RASA2 rs17001654 4 77,348,592 SCARB2 rs11727676 4 145,878,514 HHIP rs2033529 6 40,456,631 TDRG1 rs9400239 6 109,084,356 FOXO3 rs13191362 6 162,953,340 PARK2 rs1167827 7 75,001,105 HIP1 rs2245368 7 76,446,079 DTX2P1 rs2033732 8 85,242,264 RALYL rs4740619 9 15,624,326 C9orf93 rs6477694 9 110,972,163 EPB41L4B rs1928295 9 119,418,304 TLR4 rs10733682 9 128,500,735 LMX1B rs7899106 10 87,400,884 GRID1 rs17094222 10 102,385,430 HIF1AN rs11191560 10 104,859,028 NT5C2 rs7903146 10 114,748,339 TCF7L2 rs2176598 11 43,820,854 HSD17B12 rs12286929 11 114,527,614 CADM1 rs11057405 12 121,347,850 CLIP1 rs10132280 14 24,998,019 STXBP6 rs12885454 14 28,806,589 PRKD1 rs3736485 15 49,535,902 DMXL2 rs758747 16 3,567,359 NLRC3 rs2650492 16 28,240,912 SBK1 rs9925964 16 31,037,396 KAT8 rs1000940 17 5,223,976 RABEP1 rs1808579 18 19,358,886 C18orf8 rs7243357 18 55,034,299 GRP rs17724992 19 18,315,825 PGPEP1 rs977747 1 47,457,264 TAL1 rs1460676 2 164,275,935 FIGN rs17203016 2 207,963,763 CREB1 rs13201877 6 137,717,234 IFNGR1 rs1441264 13 78,478,920 MIR548A2 rs7164727 15 70,881,044 LOC100287559 rs2080454 16 47,620,091 CBLN1 rs9914578 17 1,951,886 SMG6 rs2836754 21 39,213,610 ETS2 rs492400 2 219,057,996 USP37 rs16907751 8 81,538,012 ZBTB10 rs9374842 6 120,227,364 LOC285762 rs9641123 7 93,035,668 CALCR rs9540493 13 65,103,705 MIR548X2 rs4787491 16 29,922,838 INO80E rs6465468 7 95,007,450 ASB4 rs7239883 18 38,401,669 LOC284260 rs3101336 1 72,523,773 NEGR1 rs12566985 1 74,774,781 FPGT rs12401738 1 78,219,349 FUBP1 rs11165643 1 96,696,685 PTBP2 rs17024393 1 109,956,211 GNAT2 rs543874 1 176,156,103 SEC16B rs13021737 2 622,348 TMEM18 rs10182181 2 25,003,800 ADCY3 rs1016287 2 59,159,129 LINC01122 rs2121279 2 142,759,755 LRP1B rs13078960 3 85,890,280 CADM2 rs1516725 3 187,306,698 ETV5 rs10938397 4 44,877,284 GNPDA2 rs13107325 4 103,407,732 SLC39A8 rs2112347 5 75,050,998 POC5 rs205262 6 34,671,142 C6orf106 rs2207139 6 50,953,449 TFAP2B rs17405819 8 76,969,139 HNF4G rs10968576 9 28,404,339 LINGO2 rs4256980 11 8,630,515 TRIM66 rs11030104 11 27,641,093 BDNF rs3817334 11 47,607,569 MTCH2 rs7138803 12 48,533,735 BCDIN3D rs12016871 13 26,915,782 MTIF3 rs12429545 13 53,000,207 OLFM4 rs11847697 14 29,584,863 PRKD1 rs7141420 14 78,969,207 NRXN3 rs16951275 15 65,864,222 MAP2K5 rs12446632 16 19,842,890 GPRC5B rs3888190 16 28,796,987 ATP2A1 rs1558902 16 52,361,075 FTO rs12940622 17 76,230,166 RPTOR rs6567160 18 55,980,115 MC4R rs29941 19 39,001,372 KCTD15 rs2075650 19 50,087,459 TOMM40 rs2287019 19 50,894,012 QPCTL rs3810291 19 52,260,843 ZC3H4 rs7715256 5 153,518,086 GALNT10 rs2176040 2 226,801,046 LOC646736 rs6091540 20 50,521,269 ZFP64 SNP Chr. Position (bp) Genes rs1800544 ADRA2A Ins-Del-322 ADRA2C rs5443 GNB3 rs1129649 GNB3 rs1047776 GNB3 rs9939609 FTO rs17782313 MC4R rs7903146 TCF7L2 rs4795541 5-HTTLPR rs3813929 HTR2C rs518147 HTR2C rs1414334 HTR2C rs659366 UCP2 -3474, UCP2 rs2075577 UCP3 rs15763 UCP3 rs1626521 UCP3 rs11554825 GPBAR1 rs4764980 NR1H4 rs434434 FGFR4 rs351855 FGFR4 RSID Gene_Symbol exm2261885 . exm2264702 . kgp10003923 . kgp10360658 . kgp10374580 . kgp1093561 . kgp11089754 . kgp11154375 . kgp11564777 . kgp11808957 . kgp11836456 . kgp11902597 . SNP Chr. Position (bp) Nearest Genes kgp12031075 . kgp12088423 . kgp1283935 . kgp1287405 . kgp129784 . kgp1371036 . kgp1419661 . kgp1612367 . kgp16387096 . kgp16914214 . kgp2241756 . kgp2251945 . kgp238191 . kgp2727759 . kgp2735253 . kgp2925720 . kgp3186084 . kgp3371090 . kgp3712407 . kgp3846165 . kgp3847753 . kgp429141 . kgp4433253 . kgp447667 . kgp4725781 . kgp5201059 . kgp5201171 . kgp5269120 . kgp5471252 . kgp5829795 . kgp599811 . kgp6037240 . kgp6508014 . kgp6615769 . kgp6816777 . kgp7069937 . kgp7157564 . kgp7328604 . kgp7496475 . kgp7707096 . kgp7798504 . kgp8018963 . kgp8206543 . kgp8818851 . kgp8860587 . kgp9190754 . kgp9456377 . kgp9526272 . kgp9629679 . rs10489944 . rs10504589 . rs10808295 . rs11060968 . rs11225943 . rs11720464 . rs12354667 . rs12427263 . rs13130205 . rs1372851 . rs1493716 . rs1541616 . rs1674070 . rs1873367 . rs1889757 . rs2470000 . rs2470029 . rs2647979 . rs2720400 . rs2851820 . rs2851836 . rs288756 . rs348337 . rs4707490 . rs6005420 . rs6008618 . rs6472339 . rs6776731 . rs6828992 . rs6888630 . rs6957234 . rs7082638 . rs7297442 . rs7658020 . rs7803317 . rs8141901 . rs849309 . rs9511655 . rs9810198 . rs9860734 . exm2264762 . exm2271737 . exm2272553 . kgp10285805 . kgp10360658 . kgp10548537 . kgp10901790 . kgp11044637 . kgp11343144 . kgp11430653 . kgp11530429 . kgp11836456 . kgp11960081 . kgp11974172 . kgp12031075 .
kgp12088423 . kgp12289889 . kgp127695 . kgp1278486 . kgp1586406 . kgp16387096 . kgp1727603 . kgp1887803 . kgp1939387 . kgp2241672 . kgp22776953 . kgp227938 . kgp2369570 . kgp3371090 . kgp3406296 . kgp3660486 . kgp3662728 . kgp3712407 . kgp374568 . kgp3846165 . kgp4074864 . kgp429141 . kgp447667 . kgp4534617 . kgp4799975 . kgp4944907 . kgp5201171 . kgp5329941 . kgp5471252 . kgp563498 . kgp5671927 . kgp5780899 . kgp5829795 . kgp6037240 . kgp6688816 . kgp6827318 . kgp7048855 . kgp7069937 . kgp7235499 . kgp7945681 . kgp8628976 . kgp8860587 . kgp9190754 . kgp9231149 . kgp9578092 . kgp965777 . rs10150519 . rs10161070 . rs10451103 . rs10742039 . rs10877143 . rs11720464 . rs12506204 . rs12593784 . rs12937299 . rs13338004 . rs1372851 . rs1493716 . rs1512840 . rs1541616 . rs16822391 . rs17076260 . rs17453871 . rs1873367 . rs201607 . rs202558 . rs2169564 . rs2647979 . rs2720400 . rs2761413 . rs2957787 . rs3762535 . rs4313958 . rs4461665 . rs4543516 . rs4707490 . rs4964150 . rs6008618 . rs6448182 . rs6585563 . rs6828992 . rs6957234 . rs7297442 . rs7658020 . rs768969 . rs7846145 . rs7981554 . rs8002390 . rs8141901 . rs935201 . rs9378848 . rs9810198 . rs9860734 . rs9864846 . kgp2297621 ACSL6 rs440970 ACSL6 kgp10461170 ADARB2 kgp7332119 ADARB2 rs12415114 ADARB2 kgp9064589 ADCY8 rs13133908 ADH1B kgp12414761 ADH1B rs13133908 ADH1B rs2075633 ADH1B rs7518469 AJAP1 rs429790 ATP2C2 kgp3288649 ATP6V0D2 rs2832231 C21orf7 kgp10136381 CAMKMT kgp3161157 CAMKMT kgp3203202 CAMKMT kgp3968222 CAMKMT kgp4140267 CAMKMT rs13406580 CAMKMT rs1551882 CAMKMT rs17032193 CAMKMT rs7593926 CAMKMT kgp4005992 CAP2 kgp7298922 CASC4 kgp1789974 CD48 kgp5511006 CD48 kgp1789974 CD48 kgp5511006 CD48 kgp7256435 CDC42SE2 rs4706020 CDC42SE2 rs3812178 CDYL rs3812179 CDYL kgp3731792 CES5AP1 kgp6395031 CLMN kgp6395031 CLMN kgp4873414 CNPY4 rs3806043 COL19A1 kgp3071123 COL27A1 kgp6064462 COL27A1 kgp6796371 COL27A1 rs1249745 COL27A1 kgp5314602 COL4A3 kgp11506369 COROIC kgp6473219 COROIC kgp10992142 CPZ rs8087866 CTIF kgp7710562 DAAM2 exm430196 DCHS2 exm430197 DCHS2 kgp49288 DCHS2 kgp766527 DCHS2 rs4696584 DCHS2 kgp3890072 DOCK8 rs1980876 DOCK8 exm451231 EGFLAM rs6897179 EGFLAM kgp10622968 FAM125B kgp5732367 FAM71E2 kgp10294313 FRMD3 kgp2344514 FRMD3 kgp7900743 FRMD3 kgp3392580 GALNTL4 kgp4456104 GLT1D1 kgp5287249 HHAT exm1319778 KRT23 rs8037 KRT23 rs9257 KRT23 kgp10012744 LHPP kgp1057196 LINC00578 kgp8853148 LINC00578 rs6799682 LINC00578 rs7632844 LINC00578 kgp11567842 LINC00620 rs12495328 LINC00620 kgp4159029 LIPC kgp1640513 LOC100128714 kgp4598936 LOC100128714 kgp5262759 LOC100128714 rs11635697 LOC100128714 rs12593847 LOC100128714 rs8023270 LOC100128714 kgp1743339 LOC100287160 kgp7667092 LOC100289473 rs6135960 LOC100289473 rs6135960 LOC100289473 kgp5351206 LOC100293612|LINC00620 kgp10995216 LOC100506869 kgp22804264 LOC100506869 rs4760137 LOC100506869 rs1566141 LOC100507053 kgp10134243 LOC100507053 rs10008281 LOC100507053 rs1229966 LOC100507053 rs1566141 LOC100507053 rs2051428 LOC100507053 rs3819197 LOC100507053|ADH1A rs3819197 LOC100507053|ADH1A rs9995799 LOC100507053|ADH6 kgp1289034 LOC100507443 rs9981988 LOC100996571|CYYR1 kgp258053 LOC152225 kgp6272649 LOC152225 kgp2759189 LOC255130 kgp2759189 LOC255130 rs10980642 LPAR1 kgp5423754 LUZP2 kgp8988372 LUZP2 kgp9462081 MCM7 rs2261360 MCM7 kgp8065051 MICAL3 kgp4439669 MMS19 kgp18459 MYBPC1 kgp1800707 NR2F2-AS1 rs7831515 NSMCE2 rs16958048 NTN1 kgp7166603 OAZ2 kgp7077044 O3FAR1 kgp2414524 OSBP2 kgp2580452 OSBP2 kgp7020841 OSBP2 rs4820897 OSBP2 kgp7020841 OSBP2 kgp7082195 P4HA2 rs6667138 PADI1 rs6667138 PADI1 kgp7908292 PARD3B rs7558785 PARD3B kgp11077304 PARK2 exm-rs2795918 PCDH15 kgp1058322 PCDH15 kgp11029138 PCDH15 kgp11410092 PCDH15 kgp2961930 PCDH15 kgp5544438 PCDH15 kgp9631691 PCDH15 rs4082042 PCDH15 kgp9916431 PKIB rs13218313 PKIB kgp4769029 PRH1-PRR4 kgp9716281 PTPRD rs7045790 RALGPS1|ANGPTL2 rs17081778 RPS24P10 kgp10074267 RTN4RL1 kgp11049623 RYR2 kgp8225782 SCN2A rs2075703 SCN2A rs6744911 SCN2A rs12706974 SEMA3C rs1358340 SEMA3C kgp7788385 SEMA5A rs3822799 SEMA5A kgp3608544 SFMBT2 rs1887757 SGCG rs9580573 SGCG kgp390881 SLC22A15 kgp2776219 SLC2A2
exm988933 SLCO1B1 rs2306283 SLCO1B1 rs4149040 SLCO1B1 exm988933 SLCO1B1 rs2306283 SLCO1B1 rs4149040 SLCO1B1 kgp8338369 SMOC2 kgp12080543 SNCAIP kgp4607090 SNCAIP rs4895350 SNCAIP kgp1043980 SNX18 kgp2071353 SRRM4 kgp7567091 SUSD1 kgp7567091 SUSD1 kgp12526521 TBC1D16 kgp5557307 TCERG1L rs13340295 TENM3 kgp3414710 TJP3 kgp10345778 TLL1 rs4690833 TLL1 rs2568085 TMEM9B rs1071646 TPM1 rs6738 TPM1 rs1071646 TPM1 rs6738 TPM1 rs1408817 VTI1A rs216905 VWF kgp2039705 WWOX rs6804325 WWTR1 exm382632 ZFYVE28 rs12532238 ZNF3 rs6592 ZNF3 kgp6175568 ZNF609 rs11558476 ZSCAN21
TABLE-US-00004 TABLE 4 Gastrointestinal peptides associated with obesity. Hormone Source Normal function Cholecystokinin (CCK) Duodenum Increase satiation Ghrelin Gastric fundus Stimulate appetite Glucagon-like Distal small Increase satiety peptide 1 (GLP-1) intestine and colon Peptide YY (PYY) Distal small Increase satiety intestine and colon * Low calorie diet can alter peptide concentrations.
TABLE-US-00005 TABLE 5 Genes associated with obesity. Genotype potentially affecting organ or Primary mechanisms associated Endpoints Quantitative Trait with trait Satiety Postprandial GLP-1 TCF7L2, GNB3, MC4R and PYY Satiation VTF, MTV (kcal) MC4R, GNB3, HTR2C, UCP3 Gastric GE (solids) TCF7L2, ADRA2A, UCP3 Emptying Appetite Fasting Ghrelin MC4R, FTO, GNB3 * Gene variants were selected based on association with BMI and mechanism of action.
[0063] Table 6 summarizes the variables that were significantly associated with each of the phenotypic groups vs the rest of the groups.
TABLE-US-00006 TABLE 6 SNPs present in each obesity group Obesity Exemplary Phenotype Group Gene SNP 1: low satiation HTR2C, POMC, NPY, rs1414334 AGRP, MC4R, GNB3, SERT, BDNF 2: low satiety PYY, GLP-1, MC4R, rs7903146 GPBAR1, TCF7L2, ADRA2A, PCSK, TMEM18 3: behavioral eating SLC6A4/SERT, DRD2 rs4795541 4: large fasting gastric volume TCF7L2, UCP3, rs1626521 ADRA2A, 5: mixed 6: low resting energy expenditure FTO, LEP, LEPR, rs2075577 UCP1, UCP2, UCP3, ADRA2, KLF14, NPC1, LYPLAL1, ADRB2, ADRB3, BBS1
[0064] Combinations of compounds (amino-compounds, neurotransmitters fatty acids, metabolic peptides, and metabolic gene) were identified as significantly associated with each of the obesity phenotypic groups. The variables that were significantly associated with each of the phenotypic groups included the following:
[0065] Questionnaire results: [0066] hospital anxiety and depression scale-anxiety subscale (HADS-A),
[0067] Metabolites: [0068] 1-methylhistine [0069] seratonin [0070] glutamine [0071] gamma-amino-n-butyric-acid [0072] isocaproic [0073] allo-isoleucine [0074] hydroxyproline [0075] beta-aminoisobutyric-acid [0076] alanine [0077] hexanoic [0078] tyrosine [0079] phenylalanine
[0080] Gastrointestinal Peptides: [0081] fasting ghrelin [0082] fasting PYY
Algorithm
[0083] The following formulas were used to identify the obesity phenotype of a patient based upon the signature of the 14 compounds identified as being significantly associated with each of the obesity phenotypic groups. The formulas predicted the phenotypes with a r2 of 0.90 and a probability Chi-square of less than 0.0001.
Lin[1]
[0084] (-1552.38148595936) [0085] +40.797700201235 *:Name("HADS-A") [0086] +1.32549623006262 *:Glutamine [0087] +-0.111622239757052 *:Alanine [0088] +-616.954862561479 *:Name("gamma-Amino-N-butyric-acid") [0089] +-89.402967640225 *:Name("beta-Aminoisobutyric-acid") [0090] +-1.73891527871898 *:Tyrosine [0091] +6.24138513457712 *:Phenylalanine [0092] +2148.66822848398 *:isocaproic [0093] +-20.6187102527618 *:hexanoic [0094] +56.3110714341266 *:Name("Log(Hydroxyproline)") [0095] +82.3818646650792 *:Name("Log(1-Methylhistine)") [0096] +-26.8826686365131 *:Name("Log(seratonin)") [0097] +0.245926705626903 *:Name("PYY_-15") [0098] +1.89180999803712 *:Name("Ghrelin_-15") [0099] +75.8755521857061 *:Name("allo-Isoleucine")
Lin [2]
[0099] [0100] (-2031.26556804871) [0101] +56.9736558824775 *:Name("HADS-A") [0102] +-0.0118072070103887 *:Glutamine [0103] +-0.0995668418558728 *:Alanine [0104] +1609.83650774629 *:Name("gamma-Amino-N-butyric-acid") [0105] +123.106026249695 *:Name("beta-Aminoisobutyric-acid") [0106] +13.0377088181536 *:Tyrosine [0107] +-2.42979784589652 *:Phenylalanine [0108] +3057.74326808551 *:isocaproic [0109] +63.6119366218627 *:hexanoic [0110] +99.2853520251878 *:Name("Log(Hydroxyproline)") [0111] +0.166314503531418 *:Name("Log(1-Methylhistine)") [0112] +6.21451740476229 *:Name("Log(seratonin)") [0113] +-0.696742681406157 *:Name("PYY_-15") [0114] +2.30188885859994 *:Name("Ghrelin_-15") [0115] +220.083419205279 *:Name("allo-Isoleucine")
Lin [3]
[0115] [0116] (-735.067323742327) [0117] +84.6709055694921 *:Name("HADS-A") [0118] +0.739638607406857 *:Glutamine [0119] +0.0161670919675227 *:Alanine [0120] +1.70702352345921 *:Name("gamma-Amino-N-butyric-acid") [0121] +4.08385430756663 *:Name("beta-Aminoisobutyric-acid") [0122] +4.83658065569896 *:Tyrosine [0123] +-7.4973831454893 *:Phenylalanine [0124] +1467.49860590747 *:isocaproic [0125] +51.4109043756237 *:hexanoic [0126] +-56.3364437814115 *:Name("Log(Hydroxyproline)") [0127] +45.3693267895892 *:Name("Log(1-Methylhistine)") [0128] +24.1167481430051 *:Name("Log(seratonin)") [0129] +-1.56458536889981 *:Name("PYY_-15") [0130] +2.15880622406247 *:Name("Ghrelin_-15") [0131] +72.4632042822316 *:Name("allo-Isoleucine")
Lin[4]
[0131] [0132] (-38.8679541168302) [0133] +1.54112014174663 *:Name("HADS-A") [0134] +0.00119976598048842 *:Glutamine [0135] +0.056518755537321 *:Alanine [0136] +34.9734228686154 *:Name("gamma-Amino-N-butyric-acid") [0137] +2.64367056830481 *:Name("beta-Aminoisobutyric-acid") [0138] +0.0996495148185086 *:Tyrosine [0139] +-0.14869421223421 *:Phenylalanine [0140] +8.69300091428836 *:isocaproic [0141] +1.77363291550863 *:hexanoic [0142] +-1.58953123143685 *:Name("Log(Hydroxyproline)") [0143] +0.127307799711255 *:Name("Log(1-Methylhistine)") [0144] +-3.33170879355105 *:Name("Log(seratonin)") [0145] +0.0387731073018872 *:Name("PYY_-15") [0146] +0.0662851699121999 *:Name("Ghrelin_-15") [0147] +-1.4086102207227 *:Name("allo-Isoleucine")
[0147] 1/(1+Exp(-("Lin[1]"))+Exp(("Lin[2]")-("Lin[1]"))+Exp(("Lin[3]")-(- "Lin[1]"))+Exp(("Lin[4]")-("Lin[1]"))) Prob[1]
1/(1+Exp(("Lin[1]")-("Lin[2]"))+Exp(-("Lin[2]"))+Exp(("Lin[3]")-("Lin[2]- "))+Exp(("Lin[4]")-("Lin[2]"))) Prob[2]
1/(1+Exp(("Lin[1]")-("Lin[3]"))+Exp(("Lin[2]")-("Lin[3]"))+Exp(-("Lin[3]- "))+Exp(("Lin[4]")-("Lin[3]"))) Prob[3]
1/(1+Exp(("Lin[1]")-("Lin[4]"))+Exp(("Lin[2]")-("Lin[4]"))+Exp(("Lin[3]"- )-("Lin[4]"))+Exp(-("Lin[4]"))) Prob[4]
1/(1+Exp(("Lin[1]"))+Exp(("Lin[2]"))+Exp(("Lin[3]"))+Exp(("Lin[4]"))) Prob[6]
Table 7 summarizes variables (14 analytes and a questionnaire) that were significantly associated with each of the phenotypic groups with the ROC of the group vs the rest of the groups.
TABLE-US-00007 TABLE 7 Compounds present in each obesity group Source Group 1 Group 2 Group 3 Group 4 Group 5 Group 6 1-Methylhistine + + + seratonin + + + + Glutamine + + + gamma-Amino- + + N-butyric-acid isocaproic + + + allo-Isoleucine + + + + Hydroxyproline + + beta-Amino- + + + + isobutyric-acid Alanine + + + + + hexanoic + + + Tyrosine + + + Phenylalanine + + + Ghrelin + PYY + + + HADS-A + + + + p value of 0.006 <0.001 <0.001 <0.001 0.01 <0.001 whole model test ROC value 0.90 0.86 0.91 0.89 0.86 0.96 (group vs rest)
[0148] One multinomial logistic model contained 14 compounds and one questionnaire, and the obesity phenotypes were predicted with more than 97% sensitivity and specificity (group 1=1, group 2=1, group 3=1, group 4=0.97 and group 6=0.96). When a mixed group is added to the equation, the obesity phenotypes can be predicted with more than 91% sensitivity and specificity (group 1=0.95, group 2=0.92, group 3=1, group 4=0.96, group 5=0.96 and group 6=0.97). When group 4 and mixed are removed from the equation, the obesity phenotypes can be predicted with 100% sensitivity and specificity.
[0149] Another multinomial logistic model contained 1 behavioral assessment, 3 germline variants, and 6 fasting targeted metabolomics. The variables can be as shown in Table 8 plus questionnaire(s) (e.g., HADS and/or TEFQ21).
TABLE-US-00008 TABLE 8 Variables (9 analytes and a questionnaire) that were significantly associated with each of the phenotypic groups with the ROC of the group vs the rest of the groups. SNP Gene Name Panel Peptide rs9939609.n FTO cystathionine1 amino compound fasting pyy rs1626521.n UCP3 glycine amino compound fasting ghrelin rs3813929.n 5-HT2CR valine amino compound rs5443.n GNB3 serotonin neurotransmitter rs1800544.n ADRA2a glutamic acid amino compound rs2234888.n ADRA2c tryptophan amino compound rs17782313 MC4R histidine amino compound methylhistidine1 amino compound methionine amino compound isocaproic amino compound hydroxylysine2 amino compound ethanolamine amino compound hydroxyproline amino compound gamma-amino- neurotransmitter n-butyric acid threonine amino compound alpha- amino compound aminoadipic acid sarcosine amino compound arginine amino compound histidine neurotransmitter proline amino compound
Obesity Phenotypes Biomarker
[0150] Simple-blood test biomarkers were identified that can classify obese patients into their related phenotypes. To achieve this, 25 individuals with unique obesity phenotypes were selected from the cohort of 180 participants and an untargeted metabolomics study was performed using their fasting blood samples. Thus, average of 3331 unique metabolites that are associated with each obesity-related phenotype were observed and this is illustrated through the VennDiagrams of Unique Metabolites per group using Positive-HILIC Untargeted Metabolomics (FIG. 2A). These data supported the application of a targeted metabolomics approach, hypothesis-driven, to identify and quantify associated metabolites. A two-stage design was used to develop the composition of the blood test; the training and validation cohorts consisted of 102 and 78 obese patients, respectively. Based on the profile of each patient, we were able to validate the main groups in obesity cohorts, that is 1) abnormal satiation, 2) rapid return to hunger, 3) behavioral eating; 4) abnormal energy expenditure; 5) a "mixed" group. Using a multinomial logistic regression was used to develop a classification model using elastic net shrinkage for variable selection. Discrimination was evaluated using concordance index (c-index). Receiving operating characteristic curves (ROC) for the models were constructed and area under the curve (AUC) estimated. The variables were applied to a prediction model or algorithm diagnostic (patent submitted) to identify the phenotypes. The model predicted the phenotypes with an ROC of 0.91 (AUC) for the training cohort and 0.71 for the validation cohort (FIG. 3 and FIG. 5). The accuracy of the model was 86% in the whole cohort. When the model was applied to the two previously completed placebo-controlled, randomized trials, the weight loss after 2 weeks of phentermine-topiramate ER was 58% higher in the predicted group (n=3, 2.4.+-.0.4 kg) compared to the other groups (n=9, 1.4.+-.0.2 kg), and after 4 weeks of exenatide, weight loss was 65% higher in the predicted group (n=6, 1.5.+-.0.6 kg) compared to the other groups (n=4, 0.9.+-.0.7 kg).
[0151] In summary, using this actionable classification decreases obesity heterogeneity, and facilitate our understanding of human obesity. Furthermore, we have developed and validated a novel, first-of-its-kind, simple, fasting, blood-based biomarker for obesity phenotypes.
Sensitivity and Specificity of Biomarkers
[0152] To confirm the sensitivity and specificity of the biomarkers significantly associated with each of the obesity phenotypic groups, a receiver operating characteristic (ROC) analysis was done.
[0153] FIG. 3 shows the sub-classification prediction accuracy of this combined model and an ROC analysis showed that this model has >0.90 area under the curve (AUC) for all six classes.
[0154] Next, binary classification models were derived that can predict whether a patient belongs to one group over the others. Bayesian covariate predictors were derived for low satiation, behavioral eating, and low resting energy expenditure. These models yielded an ROC AUC of 1 (FIG. 4). These data suggested that the serum metabolite levels hold all the information needed to predict obesity subclasses.
Validation of Biomarkers
[0155] To further validate the ability to phenotype obesity based on variables significantly associated with each of the phenotypic groups, the formula was applied to 60 new participants with obesity, and a ROC analysis was done.
[0156] FIG. 5 shows that the formula predicted the sub-groups with over 90% sensitivity and specificity.
Summary
[0157] These results demonstrate that serum biomarkers can be used to classify obesity patients into obesity phenotype groups.
Example 2
Obesity Phenotypes and Intervention Responsiveness
[0158] Obesity is a chronic, relapsing, multifactorial, heterogeneous disease. The heterogeneity within obesity is most evident when assessing treatment response to obesity interventions, which are generally selected based on BMI. These standard approaches fail to address the heterogeneity of obesity. As described in Example 1, obesity phenotypes were associated with higher BMI, distinguish obesity phenotypes. This Example shows that obesity phenotypes respond differently to specific interventions (e.g., pharmacological interventions). Obesity-related phenotypes were evaluated to facilitate the understanding of obesity pathophysiology, and identify sub-groups within the complex and heterogeneous obese population. A novel classification based on identifying actionable traits in the brain-gut axis in humans (see, e.g., Acosta et al., 2015 Gastroenterology 148:537-546 e534; and Camilleri et al., 2016 Gastrointest Endosc. 83:48-56) was applied to understand, in a more homogenous, phenotype-defined population, the unique or specific characteristics within each sub-group of obesity.
[0159] The specific characteristics of 180 participants with obesity (defined as BMI>30 kg/m.sup.2) were grouped based on their predominant obesity-related phenotype, based on a multiple step process (in addition to gender) to generate a homogeneous populations based on the 75.sup.th percentile within the obese group for each well-validated variable: a) satiation [studied by nutrient drink test (maximal tolerated volume, 1 kcal/ml)], b) satiety [studied by gastric emptying (T.sub.1/2, min)], c) hedonic (hospital anxiety and depression score [HADS] questionnaire), d) other (none of the above) and e) mixed (two or more criteria met).
[0160] The overall cohort demographics were as described in Example 1. Then, with the intention to validate further the applicability of the obesity phenotypes, the fact that each sub-group may have unique abnormalities compared to the other groups when tested with previously validated or reported findings in common obesity was interrogated.
Abnormal Satiation Group
[0161] Individuals with obesity typically consume more calories prior to reach `usual` fullness--for every 5 kg/m.sup.2 of BMI increase, participants consumed 50 calories more (see, e.g., Acosta et al., 2015 Gastroenterology 148:537-546). Here, participants with obesity and abnormal satiation were compared to the other groups with the same validated two food intake (meal) paradigms test to measure satiation (FIG. 6A). During a nutrient drink test, females with abnormal satiation consumed 235 calories more prior to reach `usual` fullness (p<0.001) and 600 calories more prior to reach `maximal` fullness (p<0.001); males with abnormal satiation consumed 514 calories more prior to reach `usual` fullness (p<0.001) and 752 calories more prior to reach `maximal` fullness (p<0.001) compared to individuals with obesity and normal satiation. During the ad libitum buffet meal, females with abnormal satiation consumed 287 calories more prior to reach fullness (p<0.001) and males consumed 159 calories more prior to reach fullness (p=0.03) compared to individuals with obesity and normal satiation. Within obesity the sub-group with abnormal--or lack of--satiation consumed significant more calories in one meal, suggesting a deficiency in the stop signals and a hungry brain phenotype.
Abnormal Satiety Group
[0162] Accelerated gastric emptying was chosen as a surrogate for abnormal satiety based on the main fact that is an objective, reproducible test, whiles other tests, such as visual analog scores are subjective sensations of satiety. In female participants with obesity and abnormal satiety, their gastric emptying (GE) was 40% GE solids T.sup.1/4 (p<0.001), 30% GE solids T.sup.1/2 (p<0.001) and 22% GE liquids T.sup.1/5 (p=0.01) faster compared to normal satiety. In male participants with obesity and abnormal satiety, their gastric emptying was 44% GE solids T.sup.1/4(p=0.005), 38% GE solids T.sup.1/2 (p<0.001) and 33% GE liquids T.sup.1/2 (p=0.05) faster compared to normal satiety (FIG. 7A). The gastric volume fasting and postprandial is smaller in participants with abnormal satiety compared to those with normal satiety when measured by SPECT (FIG. 7B). Additionally, individuals with abnormal satiety have lower levels of gastrointestinal satiety hormones, GLP-1 (p=0.005) and PYY3-36 (p=0.01) at 90 minutes after a meal. Individuals with abnormal satiation have gastrointestinal satiety hormones similar to historical controls with normal weight (see, e.g., Acosta et al., 2015 Gastroenterology 148:537-546); and individuals in the `other` group also have very low levels of these hormones, despite of having normal gastric emptying. However, the correlation of food intake when reach `usual` fullness in the nutrient drink test to the secretion of PYY3-36 is linear (r=0.42, p<0.001) and significant in individuals with normal satiety and this correlation disappear in individuals with normal satiety, suggesting an inadequate response of the PYY3-36 secreting enteroendocrine (EE) cells to the meal challenge. Enteroendocrine (EE) cells are real-time nutrient, bile and microbiota sensors that regulate food intake, brain-gut communication, gastrointestinal motility, and glucose metabolism. EE cell function can be studied indirectly by measuring plasma levels of hormones such as GLP-1 or PYY, and less frequently EE cells are studied as part of whole intestinal tissue. These results suggested a hungry gut phenotype.
Hedonic Group
[0163] There is a sub-group within participants with obesity which have a very strong psychological component that may predispose them to obesity, labeled here as a `hedonic` sub-group. Likely this group is acquiring most of their calories from emotional eating, cravings and reward-seeking behaviors while having appropriate sensations of satiation and satiety. Individuals in the hedonic group have higher levels of anxiety (p<0.001) and depression (p<0.001); and lower levels of self-esteem (p=0.002) when compared to other individuals with obesity. The hedonic group has a lower level of serum fasting tryptophan compared to the other groups (p=0.004, FIG. 8). Tryptophan is a precursor of serotonin and melatonin, which has been associated with depression, cravings and obesity.
Slow Metabolism Group
[0164] A sub-cohort of our population who completed indirect calorimetry testing was studied and individuals in the slow metabolism group have significant lower resting energy expenditure (90% of predicted) compared to the other groups of obesity (100% of predicted, p=0.032) were identified (FIG. 9A). The slow metabolism group have significant lower measured resting energy expenditure (kcal/day) that other groups (p<0.05) (FIG. 9B). Individuals with slow metabolism have lower systolic blood pressure (p=0.019), higher heart rate (p=0.05) higher self-steem (p=0.004). When body composition was measured using a dexa scan, there was not difference in calculated BMI or measured total fat mass among the obesity groups, however, individuals with slow metabolism had lower muscle (lean) mass compared to the other obesity groups (ANOVA p<0.05), FIG. 9C). Metabolites in patients with slow metabolism compared to normal metabolism (other or rest) were significant different (p<0.05): higher than other groups: alanine, isocaproic acid, phosphoetahnolamine, phenylalanine, tyrosine, alpha-amino-N-butyric acid, sarcasine, and lower than other groups: 1-methylhistidine (FIG. 9D) .
Obesity Phenotypes Biomarker
[0165] The applicability of obesity-related phenotypes as actionable biomarkers was tested in three pilot, proof of concept studies (see, e.g., Acosta et al., 2015 Gastroenterology 148:537-546; Acosta et al., 2015 Physiol Rep 3; and Halawi et al., 2017 Lancet Gastroenterol Hepatol 2:890-899). First, in a single-center, randomized, parallel-group, double-blind, placebo-controlled, 14-day study, the effects of Phentermine-topiramate-ER (PhenTop) (7.5/46 mg, orally, daily) on gastric emptying (GE) and volume, satiation, satiety, and fasting and postprandial GI hormones was evaluated in 24 obese adults. Patients with an abnormal baseline satiation test had greater mean weight loss to PhenTop ER compared to those with normal satiation (p=0.03). In a second placebo-controlled trial, the effect of exenatide was studied, 5 .mu.g SQ, twice daily for 30 days, on GE, satiety, satiation and weight loss in 20 obese participants with obesity and abnormal satiety. The average weight loss was 1.3 kg for exenatide and 0.5 kg for the placebo group (p=0.06), suggesting that patients with abnormal satiety may be good candidates for weight loss with a GLP-1 receptor agonist). Subsequently, in a prospective, NIH-funded, randomized, placebo controlled clinical trial to study the effects of liraglutide 3 mg, SQ, over 16 weeks on obesity phenotypes and weight in 40 obese patients. Compared to placebo, liraglutide delayed GE of solids at 5 (p<0.0001) and 16 (p=0.025) weeks, caused significant weight loss and increased satiation. At 5 and 16 weeks, GE T.sub.1/2 correlated with change in weight loss on liraglutide (all p<0.02). These results demonstrate that obesity-related phenotypes can predict response to obesity pharmacotherapy.
Phentermine-Topiramate and Obesity Phenotypes
[0166] The effects of phentermine-topiramate-ER (PhenTop) (7.5/46 mg, orally, daily) was evaluated on GE, GV, satiation, satiety, and fasting and postprandial gut hormones as described elsewhere (see, e.g., Acosta et al., 2015 Gastroenterology 148:537-546). PhenTop was associated with reduced food intake at buffet meal (mean .DELTA.260 kcal, p=0.032) and delayed GE solids (mean .DELTA.GE4h 6%, p=0.03; and .DELTA.GE T1/2 19 min, p=0.057). There were no significant differences in GV, satiation, GE of liquids and GI hormones. Patients on PhenTop had greater mean weight loss of 1.4 kg than placebo (p=0.03). Weight loss on PhenTop was significantly associated with kcal intake at a prior satiety test. These results demonstrate that PhenTop reduces food intake and delays GE of solids, indicating that patients having an obesity phenotype of Group 1 (low satiation), are likely responsive to treatment with PhenTop.
Exenatide and Obesity Phenotypes
[0167] The effects of exenatide (5 .mu.g, SQ, twice daily for 30 days) was evaluated on GE, satiety, and weight loss as described elsewhere (see, e.g., Acosta et al., 2015 Physiological Rep. 3(11)). Exenatide, a glucagon-like peptide-1 (GLP-1) agonist, had a very significant effect on GE of solids (p<0.001) and reduced calorie intake at a buffet meal by an average 130 kcal compared to placebo. The average weight loss was 1.3 kg for exenatide and 0.5 kg for the placebo group (FIG. 11). These results demonstrate that exenatide reduces food intake and delays GE of solids, indicating that a prior accelerated gastric emptying test predicts weight loss with exenatide; see, also, Acosta et al., 2015 Physiological Rep. 3(11)).
Surgery and Obesity Phenotypes
[0168] The best responders to the intragastric balloon therapy were identified as described elsewhere (see, e.g., Abu Dayyeh et al., "Baseline Gastric Emptying and its Change in Response to Diverse Endoscopic Bariatric TherapiesGastric Emptying Predict Weight Change Response to Endoscopic Bariatric Therapies in a Large Cohort," IFSO annual meeting, 2015) as individuals with an accelerated gastric emptying (p<0.001) and the greater delay in gastric emptying after intragastric balloon placement (p<0.001).
Liraglutide and Obesity Phenotypes
[0169] A prospective, randomized clinical trial with liraglutide, a long-acting GLP-1 receptor agonist, was completed. The effects of liraglutide and placebo were compared over 16 weeks on gastric motor functions, satiation, satiety and weight in obese patients. The study was a randomized, double-blind, placebo-controlled trial of subcutaneous liraglutide, 3 mg, with standardized nutritional and behavioral counseling. Forty adult, otherwise healthy local residents with BMI.gtoreq.30 kg/m.sup.2 were randomized. Liraglutide or placebo was escalated by 0.6 mg/day each week for 5 weeks and continued until week 16. At baseline and after 16 weeks' treatment, weight, gastric emptying of solids (GES, primary endpoint), large fasting gastric volumes, satiation, and satiety were measured. GES was also measured at 5 weeks. Statistical analysis compared treatment effects using ANCOVA (with baseline measurement as covariate). Effect of liraglutide on GES T.sub.1/2 at 5 and 16 weeks in the liraglutide group was analyzed by paired t-test. Seventeen participants were analyzed in the liraglutide group (n=19 randomized) and 18 in the placebo group (n=21 randomized).
[0170] Compared to placebo, liraglutide retarded GES at 5 (p<0.0001) and 16 (p=0.025) weeks, caused significant weight loss and increased satiation. In 16 weeks, the total body weight loss for the liraglutide group was 6.1.+-.2.8 kg (SD) compared to 2.2.+-.5 kg control group (p=0.0096). There was tachyphylaxis to GES effects of liraglutide from 5 to 16 weeks' treatment. At 5 and 16 weeks, GES T.sub.1/2 correlated with .DELTA. weight loss on liraglutide (all p<0.02). Nausea was the most common adverse event in the liraglutide group (63.2%) compared to placebo (9.5%). Liraglutide, 3.0 mg, significantly delays GES after 5 and 16 weeks' treatment; effects on weight loss are associated with absolute value of GES T.sub.1/2 on liraglutide.
[0171] These results demonstrate that liraglutide significant weight loss and increased satiation, indicating that a prior low satiety test predicts weight loss with liraglutide.
Individualized Therapy
[0172] The identification of obesity-related phenotypes based on an `actionable` classification and potential applicability for management of obesity could have a significant impact on the obesity epidemic.
[0173] FIG. 12 shows exemplary individualized obesity interventions based upon obesity phenotypes.
[0174] The algorithm described in Example 1 was applied to 29 new patients with obesity (Table 9). Data from (intervention) pharmacotherapy and controls were acquired retrospectively. Groups were matched for age, gender and BMI. Results were compared the outcome to 66 patients previously treated by obesity experts.
TABLE-US-00009 TABLE 9 Obesity Patient Characteristics. Historical P Demographics Cases Controls value N 55 175 Age 46 .+-. 1.8 50 .+-. 1 0.03 Gender (F) 67% 73% Race (W) 93% 89% Weight (kg) 115 .+-. 3 116 .+-. 1.8 BMI 39.8 .+-. 1 41.6 .+-. 0.6 Co-morbidities % 47/41/45/49/36 43/33/35/36/30 (DM/HTN/DJD/OSA/HLD)* MEDS % 24 22 Phentermine 25 23 Phen-Top ER 6 10 Lorcaserin 19 25 Liraglutide 3 mg 12 4 Bupropion-Naltrexone SR 4 6 Other Ns: not statistical significant difference
[0175] The algorithm predicted the obesity group and intervention responsiveness of the new participants with over 90% sensitivity and specificity (FIG. 13, FIG. 14, and Table 10). The controls were seen in the weight management clinic by a physician expert of obesity and offered standard of care for obesity management and pharmacotherapy. The current standard of care suggests that pharmacotherapy needs to be selected based on patient-physician preference, mainly driven by side effects and other comorbidities. The cases were seen in the weight management clinic by a physician expert of obesity and offered obesity-phenotype guided pharmacotherapy for obesity management. The phenotypes seen were abnormal satiation (25%), abnormal satiety (20%), abnormal behavior (20%) and other (35%).
TABLE-US-00010 TABLE 10 Total body weight in response to individualized intervention. Total Body Weight Loss, % Controls Cases P value 3 months (# patients) 2.7 .+-. 0.5 (66) 6.1 .+-. 0.8 (29) 0.0008 6 months (# patients) 4.7 .+-. 0.7 (57) 10.7 .+-. 1.2 (22) 0.0001 9-12 months (# patients) 5.7 .+-. 1.2 (36) 12.9 .+-. 1.9 (15) 0.0025
[0176] The intervention group had 74% responders (defined as those who loss more than 3% in the first month) compared to 33% in the control group. The control group number of responders was similar to the published in the current obesity literature. The significant improvement of responders resulted in a total body weight loss of 12.9 kg in the intervention group compared to 5.8 kg in the control group at 9 months.
[0177] The algorithm was also applied to 12 patients with obesity, who saw their weight loss plateau during the treatment for obesity with an intragastric balloon. These individuals saw weight loss plateau during month 3 and 6 of treatment with the balloon. At month 6, the algorithm was applied to the intervention group compared to the controls.
Summary
[0178] It was found that obesity can be sub-grouped in: abnormal satiation (16%), abnormal satiety (16%), hedonic (19%), slow metabolism (32%) and mixed group (17%). Deeper characterization within each subgroup identifies specific disturbances of function. Thus, in the group with abnormal satiation measured by two different feeding paradigms (ad libitum buffet meal and nutrient drink test), compared to lean controls and other groups of obesity; this is summarized as "hungry brain phenotype". In the group with abnormal satiety, there is a suboptimal response of the gut to food intake, manifested as accelerated gastric emptying and decrease in peak postprandial levels of satiety hormones suggesting a "hungry gut phenotype". In the hedonic group, there are increased levels of anxiety, depression, and cravings with low levels of serum tryptophan compared to the other groups. The slow metabolism group has decreased resting energy expenditure compared to other groups. Since identifying the obesity subgroups by deep phenotyping is limited to few academic centers, a fasting blood multi-omic test was developed and validated that predict the obesity subgroups (ROC>90% AUC). This blood test provides segmentation of diverse sub-phenotypes of obesity, has the potential to select patients for individualized treatment from the sea of obesity heterogeneity, facilitates our understanding of human obesity, and may lead to future treatment based on actionable biomarkers.
[0179] These results demonstrate that obesity phenotype groups can be used to predict treatment response, and can be used to guide individualized treatment strategies (e.g., pharmacotherapy and/or bariatric endoscopy). The obesity phenotype guided intervention doubled the weight loss in patients with obesity.
Example 3
Obesity Phenotypes and Patient Sub Populations
[0180] To validate further the applicability of the obesity phenotypes, the fact that each sub-group may have unique abnormalities compared to the other groups when tested with previously validated or reported findings in common obesity was interrogated.
[0181] The model described above was run independently for female and male sub-populations of patients. Characteristics of a complete population is as denoted in Table 11.
TABLE-US-00011 TABLE 11 Whole Cohort (181 patients). #pts w/ #pts w/ Trait Mean + SD >2 SD # pts Median >90% trait % pts >75% trait % pts HADS-A 3.4 + 2.5 9 17 3 7 29 16% 6 46 25% HADS-D 1.54 + 1.74 5 20 1 4 25 14% 3 24 13% VTF 706 + 296 1337 9 630 1080 21 12% 900 44 24% MTV 1286 + 417 2142 13 1272 1896 24 13% 1539 46 25% VAS - Full 70 + 14 -40 2 72 48 18 10% 61 44 24% SGE T1/2 99.5 + 25.8 -47 5 98 70.8 17 9% 81 43 24% Buffett 917 + 295 1604 16 916 1357 23 13% 1184 44 24%
[0182] Unique analytes were identified when this cohort was separated into female and male sub-populations as shown in Table 12 and Table 13.
TABLE-US-00012 TABLE 12 Female sub-population (134 patients). #pts w/ #pts w/ Trait Mean + SD >2 SD # pts Median >90% trait % pts >75% trait % pts HADS-A 4 9 3 7 20 15% 6 34 25% HADS-D 2 5 1 4 13 10% 2 30 22% VTF 632 1123 600 990 14 10% 750 40 30% MTV 1174 1879 1185 1618 13 10% 1422 35 26% VAS - Full 70 39 72 49 14 10% 61 34 25% SGE T1/2 105 56 102 77 14 10% 90 32 24% Buffett 896 1394 848 1279 13 10% 1028 34 25%
TABLE-US-00013 TABLE 13 Male sub-population (47 patients). #pts w/ #pts w/ Trait Mean + SD >2 SD # pts Median >90% trait % pts >75% trait % pts HADS-A 4 9 4 7 8 17% 6 12 26% HADS-D 2 7 2 5 6 13% 3 17 36% VTF 959 1659 900 1524 4 9% 1125 11 23% MTV 1626 2517 1659 2180 4 9% 1951 11 23% VAS - Full 69 41 72 47 4 9% 63 11 23% SGE T1/2 83 34 78 56 6 13% 68 11 23% Buffett 1248 1893 1222 1693 4 9% 1469 11 23%
[0183] When analytes were identified in female and male sub-populations, the concentration of metabolites differed. See the concentrations as shown in Table 14.
TABLE-US-00014 TABLE 14 Concentrations of analytes in targeted metabolites. highest lower limit of Coefficient standard quantification of variation analyte concentration (LOQ) (CV) Histidine 930 0.155 1.2% Hydroxyproline 930 0.155 1.5% 1-Methylhistidine 930 0.155 0.5% 3-Methylhistidine 930 0.155 0.8% Asparagine 1000 0.167 0.7% Phosphoethanolamine 1000 0.167 0.4% Arginine 930 0.155 0.5% Carnosine 930 0.155 2.0% Taurine 930 0.155 1.5% Anserine 930 0.155 2.2% Serine 930 0.155 0.7% Glutamine 4000 0.667 0.2% Ethanolamine 930 0.155 2.0% Glycine 930 0.155 1.6% Aspartic Acid 930 0.155 0.7% Sarcosine 930 0.155 0.4% Citrulline 930 0.155 1.6% Glutamic Acid 930 0.155 0.6% beta-Alanine 930 0.155 0.5% Threonine 930 0.155 1.0% Alanine 930 0.155 0.5% gamma-Amino- 930 0.155 1.3% N-butyric-acid alpha-Aminoadipic- 930 0.155 0.0% acid beta-Aminoisobutyric- 930 0.155 0.4% acid Proline 930 0.155 1.0% Hydroxylysine 1 930 0.155 0.6% Hydroxylysine 2 930 0.155 0.3% alpha-Amino- 930 0.155 0.0% N-butyric-acid Ornithine 930 0.155 0.9% Cystathionine 1 930 0.155 1.0% Cystathionine 2 930 0.155 0.6% Lysine 930 0.155 0.2% Cystine 930 0.155 1.7% Tyrosine 930 0.155 0.4% Methionine 930 0.155 1.2% Valine 930 0.155 1.7% Isoleucine 930 0.155 2.3% allo-Isoleucine 930 0.155 0.9% Homocystine 930 0.155 1.0% Leucine 930 0.155 0.5% Phenylalanine 930 0.155 1.6% Tryptophan 930 0.155 1.1% Acetylcholine 1600 0.10 5.6% Adenosine 1600 0.10 0.5% Norepinephrine 1600 0.10 1.0% Dopamine 1600 0.10 0.7% Serotonin 1600 0.10 1.0% acetic acid 6651 5.5 25% propionic acid 4955 1.03 .sup. 7% isobutyric acid 4792 1.00 .sup. 2% butyric acid 5379 1.12 .sup. 4% isovaleric acid 4030 0.84 15% valeric acid 5393 1.12 .sup. 5% isocaproic acid 3532 0.74 12% caproic acid 2901 0.60 .sup. 8%
[0184] Unique targets identified in a sub-population can serve to find a unique treatment: for example TCF7L/2 genetic variant can be used to identify a group with abnormal satiety; or a simple test such as gastric emptying can be used to define abnormal satiety.
[0185] The model described above is also run independently for additional sub-populations of patients. For example, the model can be run on patients of specific ages (e.g., youth such as people from birth to about 18, adults such as people 18 or older), and specific life stages (e.g., perimenopausal women, menopausal women, post-menopausal women, and andropausal men).
[0186] Sub-populations of patients demonstrated analyte differences between obesity groups that were not seen in a full population of patients.
Example 4
Selecting Treatment(s) for Obesity Therapy
[0187] When an individual is treated with any weight loss intervention, his/her phenotype can assist in selecting a treatment.
Study Design
[0188] In a 12 week, randomized, double-blinded, active controlled trial, with 9 month open-label extension of 200 participants with obesity; the weight loss response rate to obesity-phenotype-guided pharmacotherapy (intervention) vs. non-phenotype guided (randomly selected) pharmacotherapy (control) in patients with obesity is compared. All 200 participants are phenotyped and the medication selection is randomly and double blinded (to physician, study team, and participant) to the FDA-approved medicine suggested by the phenotype or to another FDA-approved medicine not suggested by the phenotype.
[0189] All participants receive a standard intense lifestyle intervention, which consists of 2 visits with registered dietitian. The phenotypic studies include (all performed in same day in the following order): fasting blood collection, resting energy expenditure, gastric emptying with meal for breakfast, behavioral questionnaires, and buffet meal test for lunch. Blood is collected for assessment of metabolomic biomarkers, gastrointestinal hormones, DNA (blood and buccal swab), and pharmacogenomics. Stool samples are collected for microbiome and bile acid. Participants return to the CRTU to pick up medication based on the randomization and discuss the pharmacogenomics results. All participants are contacted at 4 and seen at 12 weeks (current standard in practice). A stool sample and a fasting blood sample are collected at the 12-week visit. At the 12-week visit, participants will be unblinded to their "obesity-related phenotype" and they could contact their physician to continue a FDA-approved medication as part of clinical care. Study team will prospectively follow the patients' weight, waist circumference and use of obesity medications every 3 months for 1 year.
Randomization and Allocation
[0190] A computer generated randomization is based on guiding pharmacotherapy based on the phenotype or randomly as current standard of care. Allocations are concealed.
Participants
[0191] A study cohort includes 200 patients with obesity (BMI>30 kg/m.sup.2). Participants that agree to pharmacotherapy treatment are invited to participate in the phenotypic assessment of their obesity that will guide (or not) the pharmacotherapy.
Inclusion Criteria
[0192] a) Adults with obesity (BMI>30 Kg/m.sup.2); these are otherwise healthy individuals with no unstable psychiatric disease and controlled comorbidities or other diseases. [0193] b) Age: 18-75 years. [0194] c) Gender: Men or women. Women of childbearing potential have negative pregnancy tests within 48 hours of enrolment and before each radiation exposure.
Exclusion Criteria
[0194] [0195] a) Abdominal bariatric surgery [0196] b) Positive history of chronic gastrointestinal diseases, or systemic disease that could affect gastrointestinal motility, or use of medications that may alter gastrointestinal motility, appetite or absorption, e.g., orlistat, within the last 6 months. [0197] c) Significant untreated psychiatric dysfunction based upon screening with the Hospital Anxiety and Depression Inventory (HAD), and the Questionnaire on Eating and Weight Patterns (binge eating disorders and bulimia). If such a dysfunction is identified by an anxiety or depression score>11 or difficulties with substance or eating disorders, the participant will be excluded and given a referral letter to his/her primary care doctor for further appraisal and follow-up. [0198] d) Hypersensitivity to any of the study medications. [0199] e) No contraindications to all FDA-approved medications
Anthropometrics and Phenotype Studies
[0200] Anthropometrics Measurements: are taken of hip-waist ratio, height, weight, blood pressure, pulse at baseline, randomization day and week 12.
[0201] Phenotype studies at baseline: After an 8-hour fasting period, and the following validated quantitative traits (phenotypes) are measured at baseline: [0202] a) The DEXA scan (dual energy x-ray absorptiometry) measures body composition. [0203] b) Resting energy expenditure: is assessed by indirect calorimetry with a ventilated hood. [0204] c) Gastric emptying (GE) of solids by scintigraphy: The primary endpoint is gastric half-emptying time (GE t.sub.1/2) as described elsewhere (see, e.g., Acosta et al., 2015 Gastroenterology 148:537-546; Vazquez et al., 2006 Gastroenterology 131:1717-24; and Camilleri et al., 2012 Neurogastroenterology and Motility 24:1076). [0205] d) Appetite (hunger level) by visual analog score fasting and after standard meal for GE and prior to the Satiation test as described elsewhere (see, e.g., Acosta et al., 2015 Gastroenterology 148:537-546). [0206] e) Satiation is measured by ad-libitum buffet meal to measure total caloric intake and macronutrient distribution in the chosen food. Satiation is reported in calories consumed at fullness (satiation) as described elsewhere (see, e.g., Acosta et al., 2015 Gastroenterology 148:537-546). [0207] f) Satiety by visual analog score postprandial after standard meal for GE and after to the Ad-libitum meal test for every 30 minutes for 2 hours as described elsewhere (see, e.g., Acosta et al., 2015 Gastroenterology 148:537-546). Satiety is measured in length of time of fullness. [0208] g) Self-administered questionnaires assessing affect, physical activity levels, attitudes, body image, and eating behavior; details of each questionnaire are provided below. [0209] h) Sample collection, handling and storage: Samples are collected after an overnight fast (of at least 8 hours) in the morning. Plasma was preserved following standard guidelines and protein degradation inhibitors, kalikrein and DPP-IV inhibitors are added to preserve the samples. Samples are stored at -80.degree. C. [0210] a. Plasma gastrointestinal hormones (Total and active Ghrelin, GLP-1, CCK, PYY and bile acids) by radioimmunoassay, measured fasting, and 15, 45, and 90 minutes postprandial, with the primary endpoint being the peak postprandial level (test should be done simultaneously to GE). [0211] b. Targeted Metabolomics: Targeted metabolomics of salient classes of compounds in plasma samples are performed using mass spectrometry. Amino acids plus amino metabolites are quantified in plasma by derivatizing with 6-aminoquinolyl-N-hydroxysuccinimidyl carbamate according to Waters MassTrak kit. A 10-point calibration standard curve is used for quantification of unknowns using a triple-stage quadrupole mass spectrometer (Thermo Scientific TSQ Quantum Ultra) coupled with an ultra-performance liquid chromatography (UPLC) system (Waters Acquity UPLC). Data acquisition is performed using multiple-reaction monitoring (MRM). Concentrations of 42 analytes in each sample are calculated against their respective calibration curves with a measurement precision of <5%. Essential nonesterified fatty acid (NEFA) concentrations, such as myristic, palmitic, palmetoleic palmitoelaidic, stearic, oleic, elaidic, linoleic, linolenic and arachidonic, are measured against a six-point standard curve by LC/MS/MS, underivatized after extraction from plasma via negative electrospray ionization (ESI) and multiple reaction monitoring conditions. This technique was developed to replace the GC/MS method where NEFAs required methylation before analysis. This technique reduces the uncertainty as to whether the methylation step increases FFA concentrations by inadvertently hydrolyzing other lipid classes. Intra CV is <3% for all analytes. [0212] c. Blood DNA. [0213] d. Buccal Swab DNA for OneOme pharmacogenomics testing. [0214] i. Pharmacogenomics: Patients who have met the inclusion and exclusion criteria provide a one-time buccal scraping. 72 variants in 22 pharmacogenes, with seven cytochrome P450 enzymes (CYP1A2, CYP2B6, CYP2C9, CYP2C19, CYP2D6, CYP3A4, and CYP3A5) covering approximately 90 percent of human drug oxidation and nearly 50 percent of commonly used medications, and 15 genes related to drug action or metabolism (COMT, DPYD, DRD2, F2, F5, GRIK4, HTR2A, HTR2C, IL28B, NUDT15, OPRM1, SLCO1B1, TPMT, UGT1A1, and VKORC1) are assessed. Results for the patient are placed into the patient EHR to be utilized for clinical treatment decisions. Through chart review, including the patient's current medication list as stated in the EHR, previously reported medication inefficacy and intolerance is documented. This data is entered into a database. [0215] i) Stool is collected and stored to study microbiome, short chain fatty acids, and bile acids.
[0216] Studies at 12-Week Visit: [0217] j) Stool and fasting blood sample are collected and stored. Stool is used to measure microbiome, short chain fatty acids and bile acids (as above). Fasting blood will be used to GI hormones and metabolomics (as above).
[0218] Questionnaires to Assess GI Symptoms and Behavioral Disorders
[0219] Participants complete a series of questionnaires: Weight management Questionnaire (Mayo Clinic.RTM.), the and the Hospital Anxiety and Depression Inventory [HAD (see, e.g., Zigmond et al., 1983 Acta Psychiatrica Scandinavica 67:361-70)] to appraise the contribution of affective disorder.
[0220] Behavioural Questionnaires
[0221] a. AUDIT-C Alcoholism Screening Test--This score is used in screening by the study physician/nurse coordinator.
[0222] b. Eating Disorders Questionnaire--The Questionnaire on Eating and Weight Patterns-Revised, is a valid measure of screening for eating disorders which has been used in several national multi-site field trials. Respondents are classified as binge eating disorder, purging bulimia nervosa, non-purging bulimia nervosa, or anorexia nervosa.
[0223] c. Body Image Satisfaction--The Multidimensional Body-Self Relations Questionnaire provides a standardized attitudinal assessment of body image, normed from a national body-image survey. Items are rated on a 5-point scale, ranging from 1=Definitely Disagree to 5=Definitely Agree. A sub-scale, the Body Areas Satisfaction Scale, is used to measure feelings of satisfaction with discrete aspects of physical appearance (e.g., face, weight, hair). Cronbach's a values range from 0.70 to 0.89.
[0224] d. Eating Behaviors--The Weight Efficacy Life-Style Questionnaire [WEL] is a 20-item eating self-efficacy scale consisting of a total score and five situational factors: negative emotions, availability, social pressure, physical discomfort, and positive activities. Subjects are asked to rate their confidence about being able to successfully resist the urge to eat using a 10-point scale ranging from 0=not confident to 9=very confident.
[0225] e. Physical Activity Level--The four-item Physical Activity Stages of Change Questionnaire will be utilized to assess the physical activity level of participants.
[0226] Standard of Care:
[0227] All participants receive standard of care which consists of 1) Intense lifestyle intervention, behavioral evaluation and treatment, and a medication as part of the regular clinic management for obesity.
Intense Lifestyle Intervention and Behavioral Treatment
[0228] All the participants will meet the multidisciplinary team which consists of an Obesity Expert physician a registered dietitian nutritionist as standard of care in our clinical practice. These appointments will be schedule in the clinic and will not be covered by the current protocol. All participants are guided to 1) Nutrition: Reduce dietary intake below that required for energy balance by consuming 1200-1500 calories per day for women and 1500-1800 calories per day for men; 2) Physical Activity: reach the goal of 10,000 steps or more per day; 3) Exercise: reach the goal of 150 minutes or more of cardiovascular exercise/week; 4) Limit consumption of liquid calories (i.e. sodas, juices, alcohol, etc.).
Pharmacotherapy for Obesity
[0229] Pharmacotherapy for the treatment of obesity can be considered if a patient has a body mass index (BMI).gtoreq.30 kg/m.sup.2 or BMI>27 kg/m.sup.2 with a comorbidity such as hypertension, type 2 diabetes, dyslipidemia and obstructive sleep apnea. Medical therapy should be initiated with dose escalation based on efficacy and tolerability to the recommended dose. An assessment of efficacy and safety at 4 weeks is done. In both groups, medications are assessed for drug interactions and potential side effects as standard of care.
[0230] Medication selection: Once the phenotype tests are completed the results are filled in an algorithm to assist on the decision of the medication selection as described elsewhere (see, e.g., Acosta et al., 2015 Gastroenterology 148:537-546; Camilleri et al., 2016 Gastrointest. Endosc. 83:48-56; and Acosta et al., 2015 Physiological Rep. 3(11)). An example is below:
TABLE-US-00015 TEST Abnormal result Example 1 Example 2 Example 3 Example 4 Satiation >1139 kcal 1400 kcal 1000 kcal 1100 kcal 1050 kcal (Ad libitum Buffet Meal) Satiety SGE T.sup.1/2 <85 102 min 80 min 105 min 110 min (Gastric emptying) min or GE 1 hr >35% Behavioral Traits HADS A&D >6 points 5 4 9 3 (Questionnaires) Energy Expenditure <85% predicted 92% 93% 95% 82% (Resting EE) Phenotype -- Ab Satiation Ab Satiety Ab Psych Ab E.E.
[0231] Once the decision is made on the "phenotype-guided" medication, pharmacy will assess whether patient is randomized to "intervention" or "control". Based on the randomization, patient picks up the prescription for 3 months. During the 3-month visit, participants are offered a prescription to continue the medication (if randomized to the intervention group) or to switch to the phenotype guided medication (if randomized to the control group). Patients who continue obesity pharmacotherapy are contact every three months for one year to monitor their weight and comorbidities.
Control Group: Pharmacotherapy for Obesity
[0232] Standard of care pharmacotherapy for obesity recommends the following doses and regimen for weight loss: [0233] Phentermine: 15-37.5 mg oral daily [0234] Phentermine-Topiramate Extended Release (Qsymia.RTM.) at dose of 7.5/46 mg oral daily [0235] Oral naltrexone extended-release/bupropion extended-release (NBSR; Contrave.RTM.) at dose of 32/360 mg oral daily (divided in 2 tables in morning and 2 tablets in evening) [0236] Liraglutide (Saxenda.RTM.) at dose of 3 mg subcutaneous daily
Intervention Group: By Obesity Phenotype Guided Pharmacotherapy
[0237] Participants in the intervention group will have 4 tests to assess 1) satiation, 2) satiety/return to hunger, 3) behavioral, or 4) energy expenditure. As described in FIG. 12 pharmacotherapy will by guide based on the phenotype. In case of a mixed pattern or multiple abnormal phenotypes, the most prominent phenotype is tackled.
[0238] Algorithm diagnostic: [0239] 1. satiation: Phentermine-Topiramate Extended Release (Qsymia.RTM.) at dose of 7.5/46 mg oral daily [0240] 2. Satiety/return to hunger: Liraglutide 3 mg SQ daily [0241] 3. Behavioral/Psychological: Oral naltrexone extended-release/bupropion extended-release (NBSR; Contrave.RTM.) at dose of 32/360 mg oral daily (divided in 2 tables in morning and 2 tablets in evening); or [0242] 4. Energy expenditure: Phentermine 15 mg daily plus increase physical activity.
Statistical Analyses
[0243] Primary endpoint: Total Body Weight Loss, kg (defined as weight changed from baseline to 12 weeks) in the obesity phenotype-guided pharmacotherapy (intervention) vs. the randomly assigned pharmacotherapy (control) group.
[0244] The secondary end points will be percentage of responders (defined as number of participants who loss 5% or more of total body weight) compared to baseline in the obesity phenotype guided pharmacotherapy (intervention) group vs. standard of care at 4 and 12 weeks; percentage of responders with at least 10 and 15% at 12 weeks, and 10% at 6 months and 12 months; percentage of responders at 5%, 10% and 15%; percentage of responders within each obesity-phenotype group at 4 and 12 weeks; and side effects of medications. In the open-label extension, the total body weight loss is assessed at 24 and 52 weeks in both groups.
[0245] Statistical Analyses: A randomized, double-blinded, active controlled trial of 200 participants with obesity to compare effects of intervention compared to controls in weight loss. The analysis involves an ANCOVA models, with the response being actual weight change; the covariates to be considered include gender, and BMI (at baseline) at baseline.
[0246] Sample size assessment and power calculation: The detectable effect size in weight loss between groups of interest (intervention vs. control) is given in Table 15. Using a SD for the overall weight change (pre-post) of 2.8 kg, the differences between groups that could be detected with approximately 80% power (2-sided a level of 0.05) for main effects are estimated. Thus, the sample size needed is 87 participants per group. In order to account for dropout, 100 participants per group are randomized.
TABLE-US-00016 TABLE 15 Mean difference (.DELTA.) of total body Intervention Control weight loss in controls group (mean (# of (# of average 6.1 kg) vs. intervention group. participants) participants) Mean difference of 10% [6.7 vs. 6.1 kg) 343 343 Mean difference of 20% [7.3 vs. 6.1 kg) 87 87 Mean difference of 30% [7.9 vs. 6.1 kg) 39 39
[0247] As each 50 patients complete the 12-week treatment phase, an interim analysis is conducted by the study statistician for the purpose of ensuring (based on the observed coefficient of variation in the primary responses such as the proportion of weight difference of 20%) that the study still has sufficient power based on the sample size proposed in the study.
Other Embodiments
[0248] It is to be understood that while the invention has been described in conjunction with the detailed description thereof, the foregoing description is intended to illustrate and not limit the scope of the invention, which is defined by the scope of the appended claims. Other aspects, advantages, and modifications are within the scope of the following claims.
* * * * *
D00000
D00001
D00002
D00003
D00004
D00005
D00006
D00007
D00008
D00009
D00010
D00011
D00012
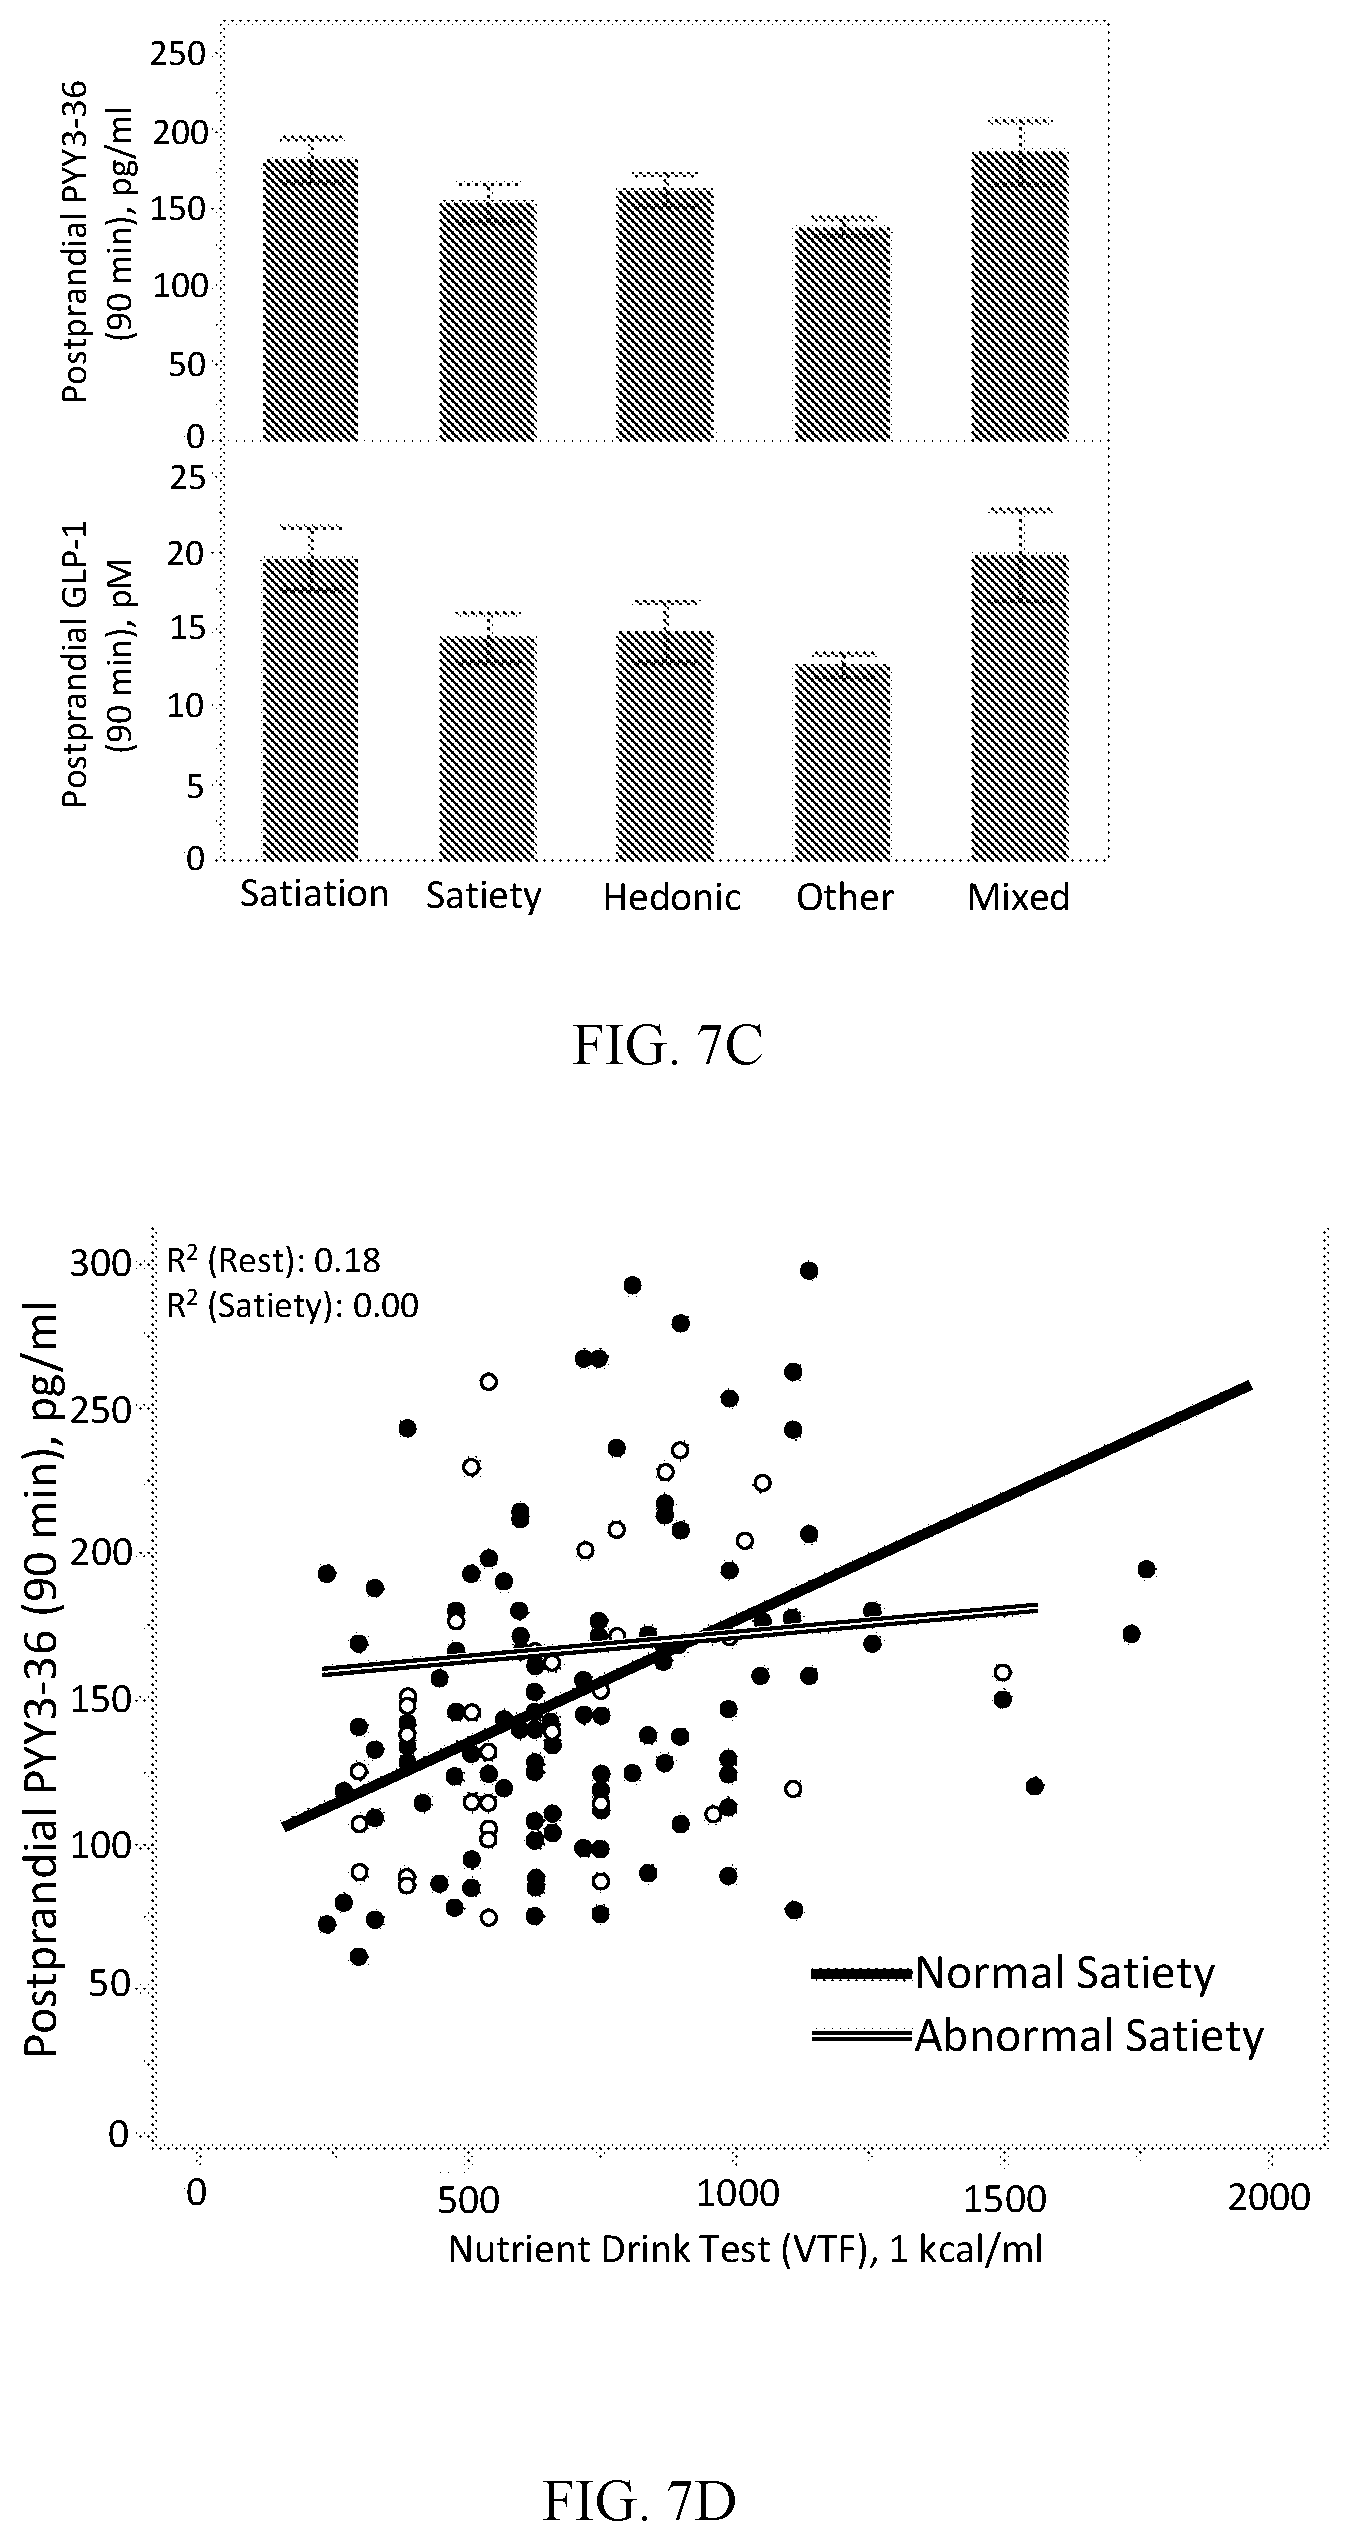
D00013
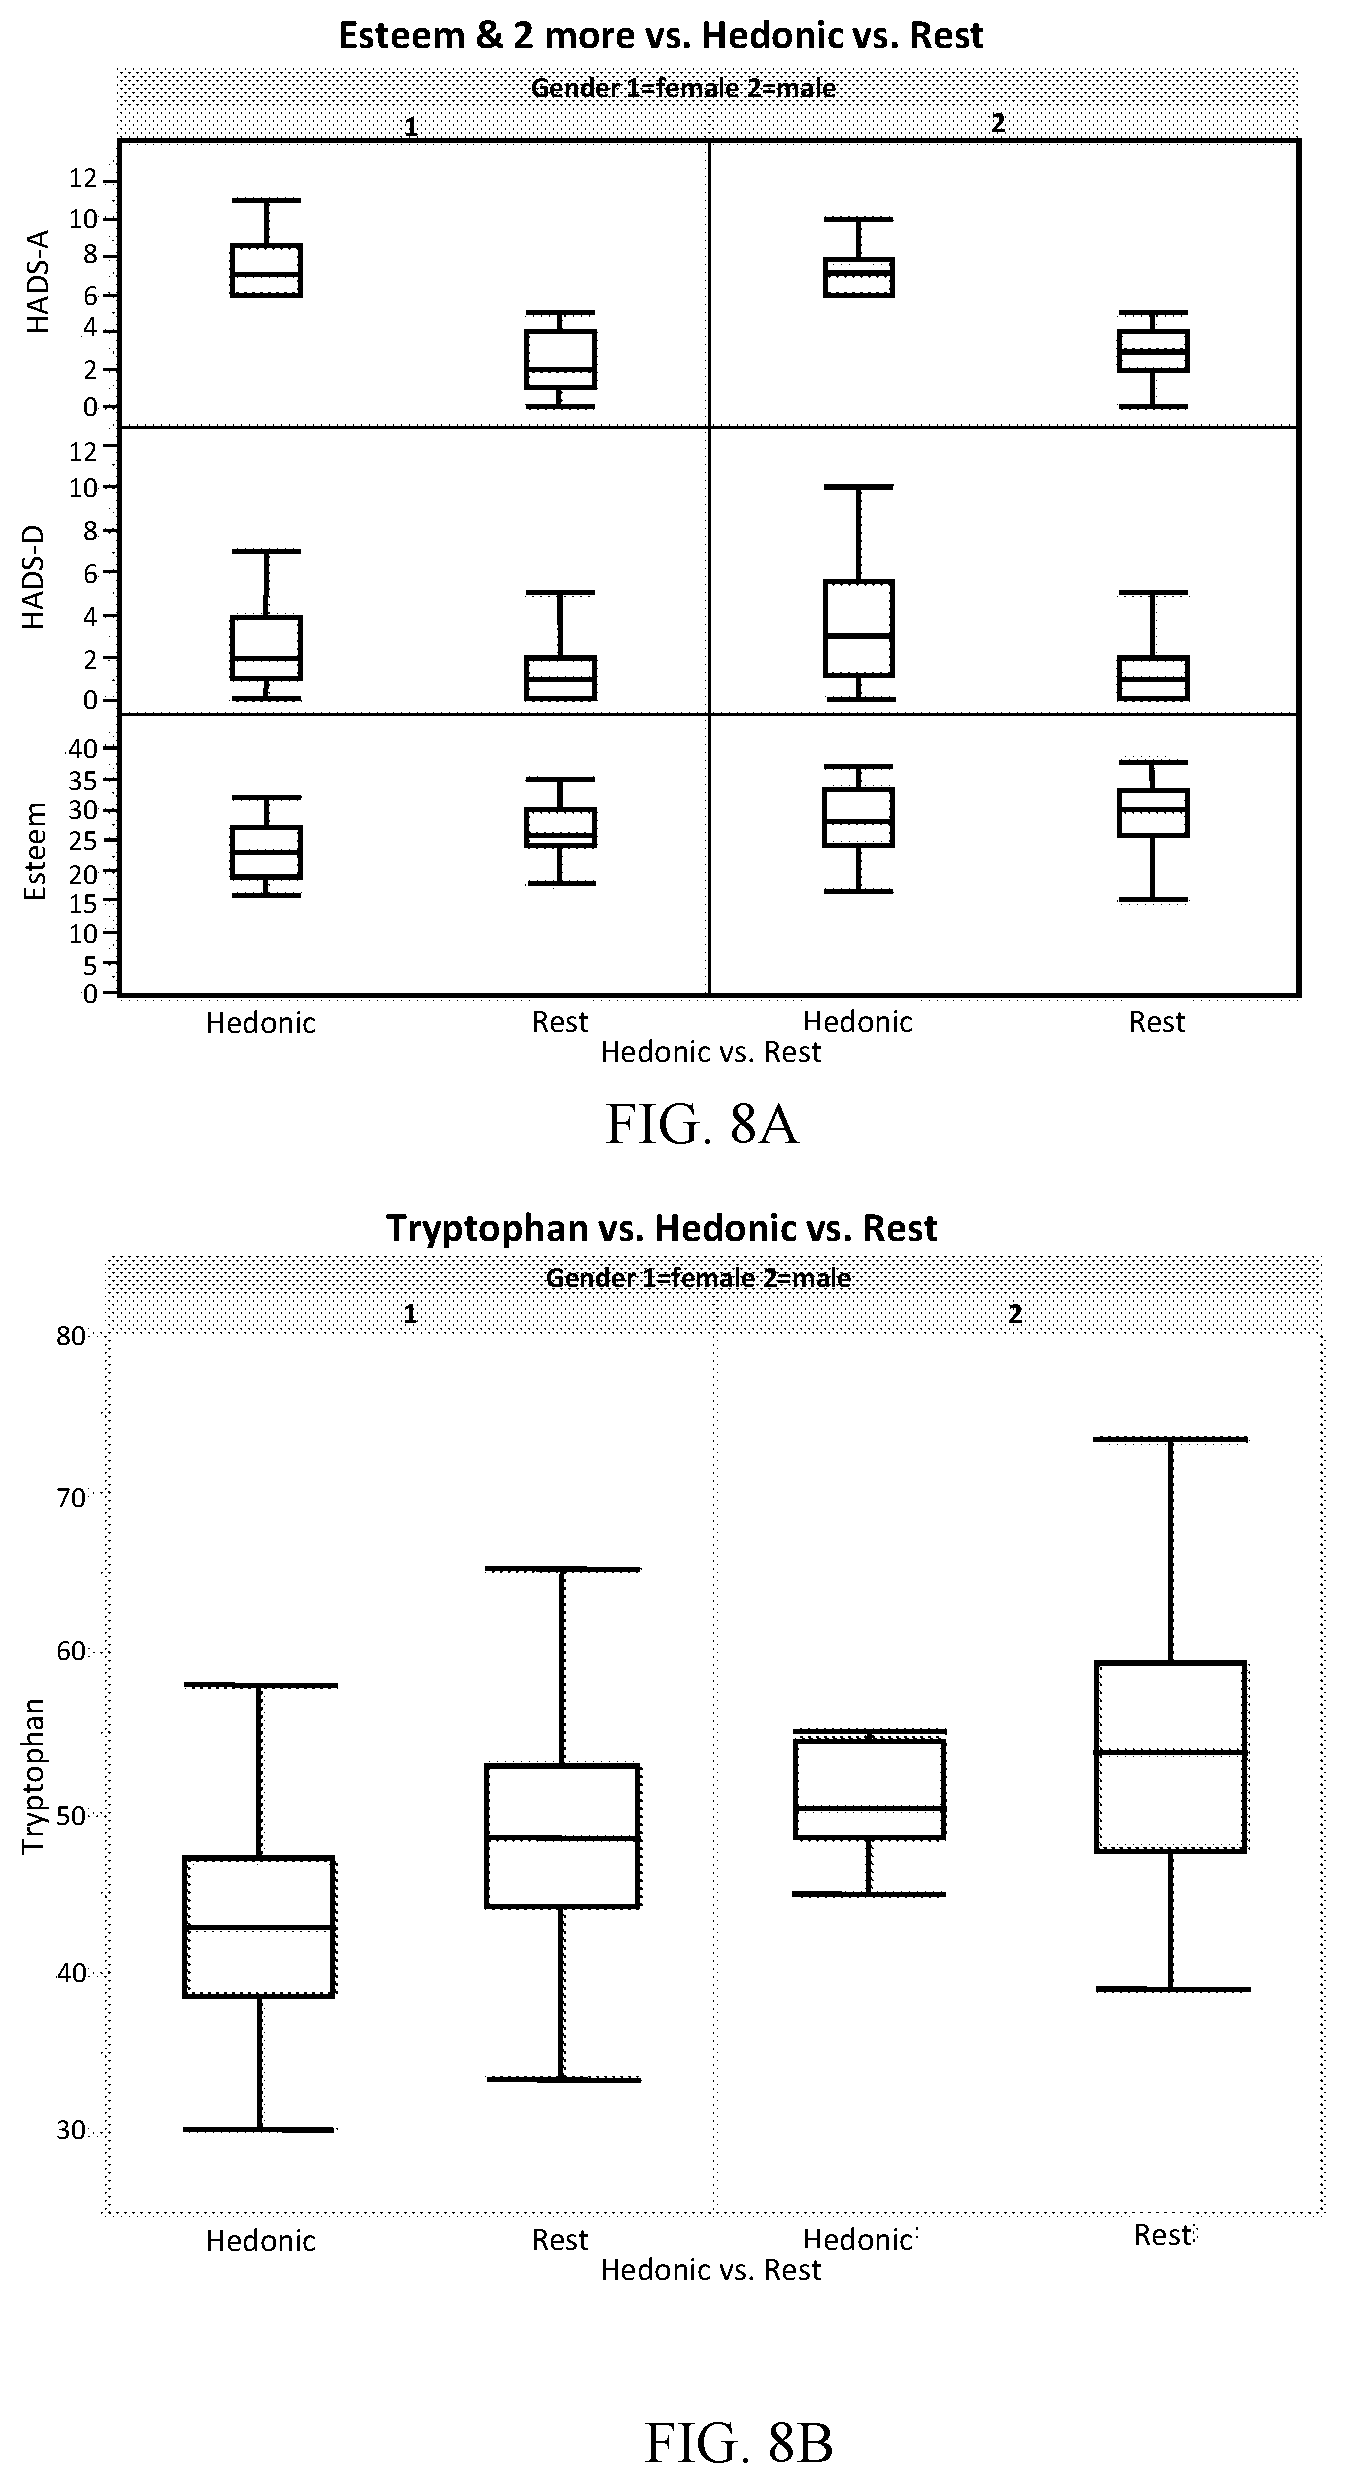
D00014

D00015

D00016

D00017

D00018
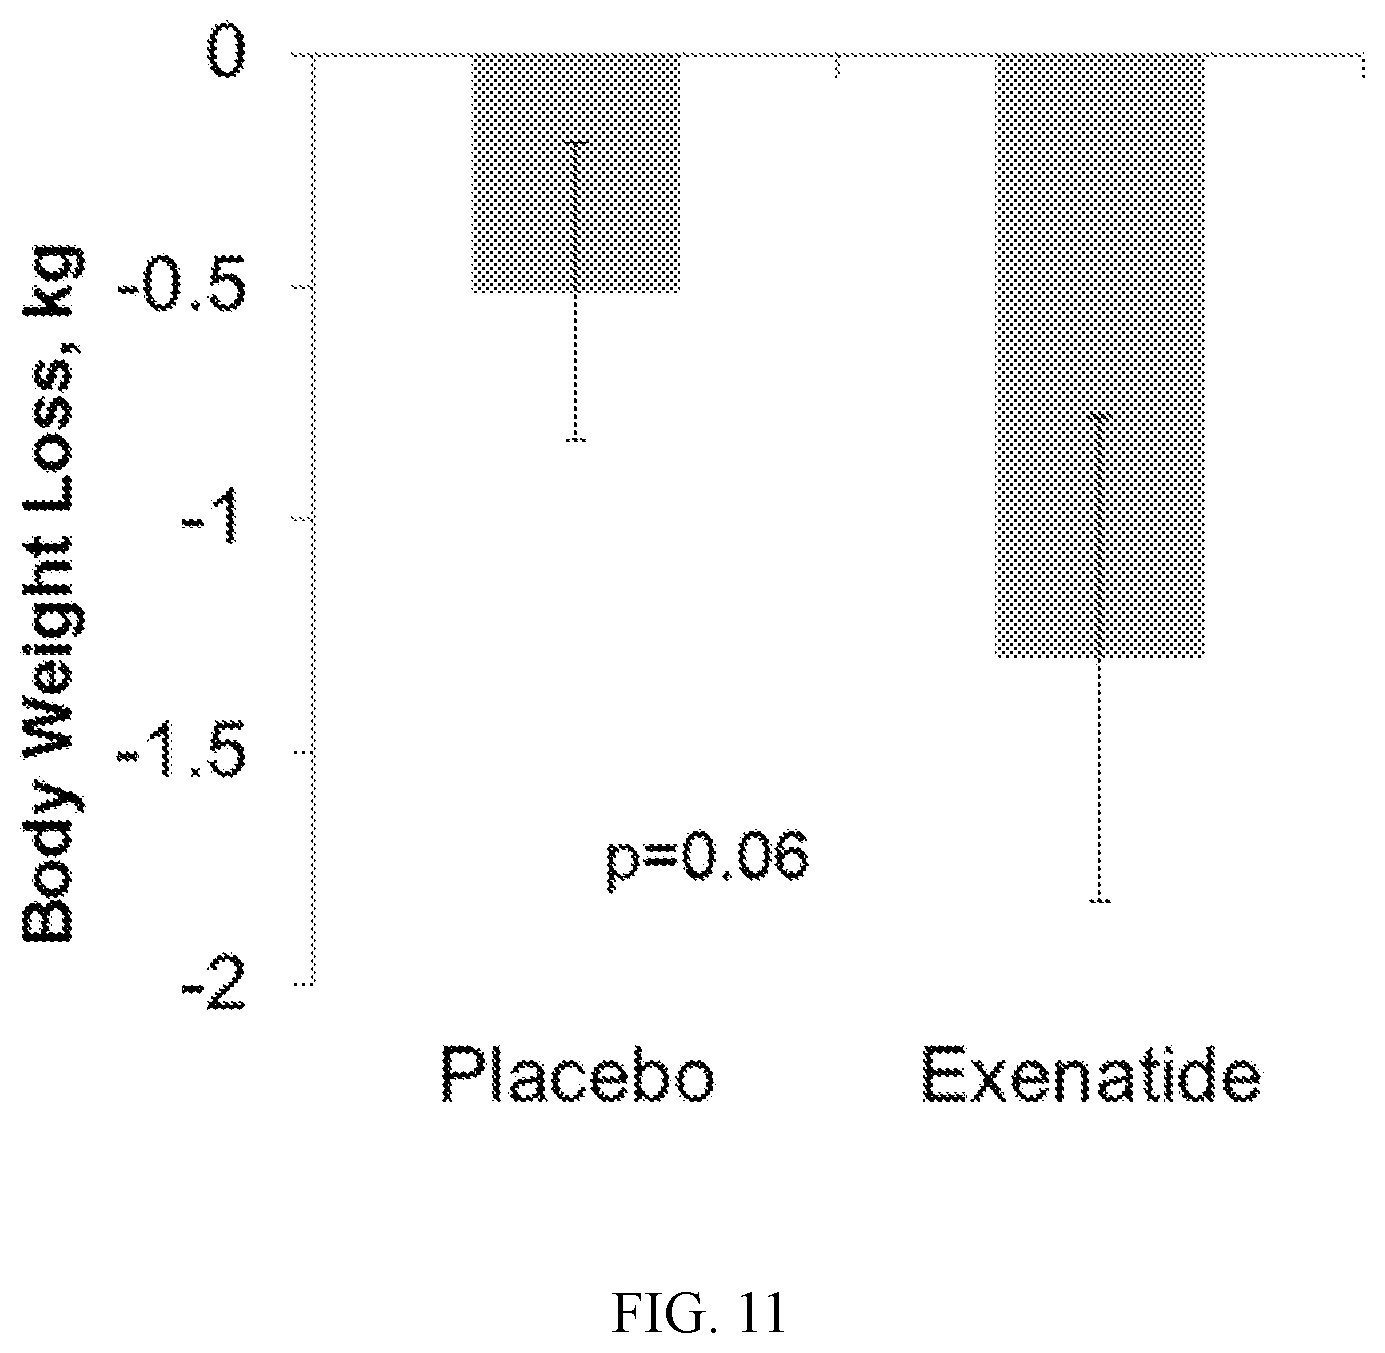
D00019

D00020

D00021

D00022
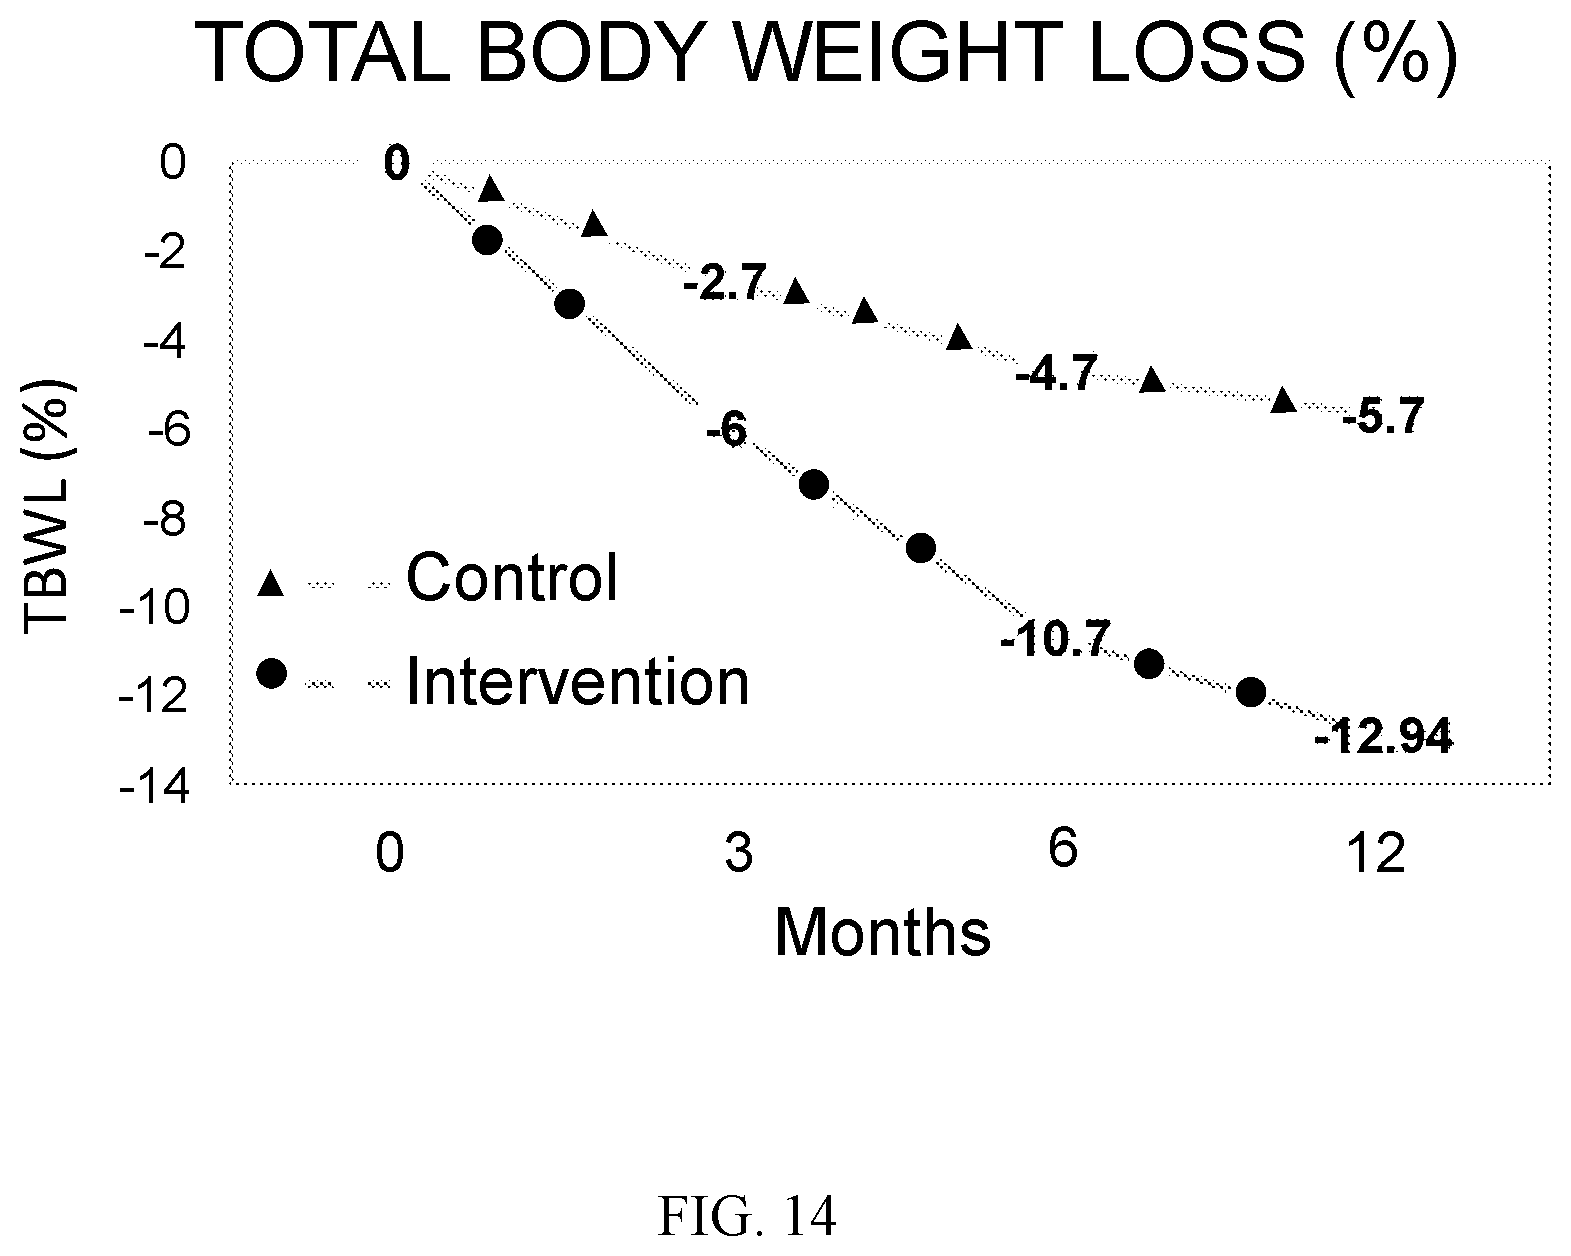
XML
uspto.report is an independent third-party trademark research tool that is not affiliated, endorsed, or sponsored by the United States Patent and Trademark Office (USPTO) or any other governmental organization. The information provided by uspto.report is based on publicly available data at the time of writing and is intended for informational purposes only.
While we strive to provide accurate and up-to-date information, we do not guarantee the accuracy, completeness, reliability, or suitability of the information displayed on this site. The use of this site is at your own risk. Any reliance you place on such information is therefore strictly at your own risk.
All official trademark data, including owner information, should be verified by visiting the official USPTO website at www.uspto.gov. This site is not intended to replace professional legal advice and should not be used as a substitute for consulting with a legal professional who is knowledgeable about trademark law.