Fluorescent Turn-on Chemosensors For Detection Of Aluminum Ion And Azide
Abebe; Fasil
U.S. patent application number 16/987688 was filed with the patent office on 2021-02-11 for fluorescent turn-on chemosensors for detection of aluminum ion and azide. The applicant listed for this patent is Morgan State University. Invention is credited to Fasil Abebe.
| Application Number | 20210041423 16/987688 |
| Document ID | / |
| Family ID | 1000005050831 |
| Filed Date | 2021-02-11 |


View All Diagrams
| United States Patent Application | 20210041423 |
| Kind Code | A1 |
| Abebe; Fasil | February 11, 2021 |
FLUORESCENT TURN-ON CHEMOSENSORS FOR DETECTION OF ALUMINUM ION AND AZIDE
Abstract
Two rhodamine derivatives, L.sub.1 and L.sub.2, bearing 2-methoxy-1-naphthaldehyde and 5-bromo-3-methoxy salicylaldehyde units were synthesized using microwave-assisted organic synthesis and used for reversible sequential fluorescence detection of aluminum ion (Al.sup.3+) and azide (N.sub.3.sup.-) in aqueous acetonitrile solution.
| Inventors: | Abebe; Fasil; (Elkrdige, MD) | ||||||||||
| Applicant: |
|
||||||||||
|---|---|---|---|---|---|---|---|---|---|---|---|
| Family ID: | 1000005050831 | ||||||||||
| Appl. No.: | 16/987688 | ||||||||||
| Filed: | August 7, 2020 |
Related U.S. Patent Documents
| Application Number | Filing Date | Patent Number | ||
|---|---|---|---|---|
| 62883785 | Aug 7, 2019 | |||
| Current U.S. Class: | 1/1 |
| Current CPC Class: | C07D 491/107 20130101; G01N 33/52 20130101; C07D 311/88 20130101; G01N 21/78 20130101; C07F 5/069 20130101 |
| International Class: | G01N 33/52 20060101 G01N033/52; G01N 21/78 20060101 G01N021/78; C07D 491/107 20060101 C07D491/107; C07D 311/88 20060101 C07D311/88; C07F 5/06 20060101 C07F005/06 |
Claims
1. A compound having the formula: ##STR00006##
2. A compound having the formula: ##STR00007##
3. A method for synthesizing the compound L.sub.1 of claim 1, comprising mixing a compound having the formula ##STR00008## with 2-methoxy-1-naphthaldehyde and ethanol, stirring a resulting mixture until homogenous, and irradiating the resulting mixture in a microwave reactor.
4. A method for synthesizing the compound L.sub.2 of claim 1, comprising mixing a compound having the formula ##STR00009## with 5-bromo-3methoxy salicylaldehyde and ethanol, stirring a resulting mixture until homogenous, and irradiating the resulting mixture in a microwave reactor.
5. A method for determining a presence of Al.sup.3+ in a sample, comprising: contacting the sample with a colorless solution comprising a compound according to claim 1 and observing whether the colorless solution turns pink in color, where a change in color of the solution to pink indicates the presence of Al.sup.3+ in the sample.
6. A method for determining a presence of N.sub.3.sup.- in a sample, comprising: contacting the sample with a pink solution comprising a compound according to claim 2 and observing whether the pink solution turns colorless, where a change in color of the solution from pink to colorless indicates the presence of N.sub.3.sup.- in the sample.
7. A method according to claim 5 wherein the colorless solution shows no absorption above 450 nm in UV-vis absorption spectra, and wherein an absorption peak above 525 nm indicates the presence of Al.sup.3+ in the sample.
8. A method according to claim 6 wherein the pink solution shows an absorption peak above 525 nm in UV-vis absorption spectra, and wherein no absorption above 450 nm indicates the presence of N.sub.3.sup.- in the sample.
Description
BACKGROUND OF THE INVENTION
Field of the Invention
[0001] The present invention relates to rhodamine Schiff base compounds for the detection of micromolar levels of Al.sup.3+ ions and azide (N.sub.3.sup.-).
Description of the Background
[0002] Several approaches discuss detection of aluminum but not in conjunction with azide. U.S. Pat. No. 9,891,237 relies on a Schiff base for metal cation detection, but its sensor relies on a form of benzazole. U.S. Pat. 7,615,377 also uses ligands for detection of metal ions, and it also is based on fluorescence, but it does not apply the specific formula towards the same specific ligands. U.S. Pat. No. 7,906,320 covers a fluorescence-based biosensor that can specifically detect metals and also discusses quenchers that emit at specific wavelength ranges. U.S. Pat. No. 7,018,840 refers to fluorescent metal sensors, with rhodamine complexed with metal ions through ligand binding but does not list aluminum as one of the exemplary metal ions. U.S. Pat. No. 5,567,619 detects for aluminum, among other elements/compounds and does mention some other similar attributes, such as chelation and certain color indications, but it is overall more primitive in nature.
SUMMARY OF THE INVENTION
[0003] The present invention relates to sensor compounds ("sensors") that are developed from rhodamine derivatives that may be used for detecting the presence of Al.sup.3+ and other metals.
[0004] Widespread use of aluminum in pharmaceuticals, cooking utensils, aluminum foil, vessels, and trays can result in the moderate increase in Al.sup.3+ concentration in food, and potentially damage the central nervous system in humans.
[0005] Novel and unobvious rhodamine Schiff base sensors L.sub.1 and L.sub.2 are described herein that are able to detect micromolar levels of Al.sup.3+ ions by the chelation-enhanced fluorescence (CHEF) process. Also of note, Al.sup.3+ complexes L.sub.1-Al.sup.3+ and L.sub.2-Al.sup.3+ behave as highly selective chemosensors for N.sub.3.sup.- ions by quenching of the fluorescence in acetonitrile/water (CH.sub.3CN/H.sub.2O) medium at 25.degree. C.
[0006] The rhodamine derivative sensors L.sub.1 and L.sub.2 bearing 2-methoxy-1-naphthaldehyde and 5-bromo-3-methoxy salicylaldehyde units were designed and synthesized from the parent rhodamine B and aromatic aldehydes in a two-step Schiff base condensation, using microwave-assisted organic synthesis (MAOS) and utilized towards sequential fluorescence detection of aluminum ion (Al.sup.3+) and azide (N.sub.3.sup.-) in aqueous acetonitrile solution. Aluminum ion (Al.sup.3+) triggers the formation of highly fluorescent ring-open spirolactam.
[0007] A mixture of ethanol with compound 2 and 2-methoxy-1-naphthaldehyde or with compound 2 and 5-bromo-3-methoxy salicylaldehyde was placed in a reaction vial and then stirred before being placed in a biotage microwave reactor. The closed reaction vessel in both cases was run under pressure and irradiated for 10 minutes. After cooling to room temperature, the resulting solid was filtered and washed three times with cold ethanol. After drying, the resulting sensor yield was measured--the L.sub.1 sensor yielded 92%, while the L.sub.2 sensor yielded 88%.
[0008] Absorption spectra studies showed that on incremental addition of Al.sup.3+ ions, the absorption intensity at 315 nm increased gradually and a new absorption peak at 565 nm with a shoulder at 525 nm was generated by ring opening with a visual color change from colorless to pink. The well-defined isosbestic points at 340 and 375 nm clearly indicates the formation of a new complex species between L.sub.1 and Al.sup.3+. Absorption spectra of sensors recorded with the continuous addition of Al.sup.3+ showed a continuous increase in the absorption at 565 nm and that was employed to calculate binding constants for L.sub.1 and L.sub.2 with Al.sup.3+ using the Benesi-Hildebrand method.
[0009] The plot of absorbance of L.sub.1 at 565 nm as a function of mole fraction of added Al.sup.3+ metal ion reveals that these probes bind to the metal ion in 1:1 stoichiometry. The fluorescence spectrum of sensors L.sub.1 and L.sub.2 showed a peak at 585 nm upon the addition of Al.sup.3+ corresponding to the delocalization in the xanthenes moiety of rhodamine.
[0010] The fluorescence and colorimetric response of the L.sub.1-Al.sup.3+ and L.sub.2-Al.sup.3+ complexes were quenched by the addition of N.sub.3.sup.-, which extracted the Al.sup.3+ from the complexes and turned off the sensors, confirming that the recognition process is reversible. The recognition ability of the sensors was confirmed by fluorescence titration, Job's plot, 1H-NMR spectroscopy and density functional theory (DFT) calculations.
[0011] When L.sub.1-Al.sup.3+ is used as the sensor for N.sub.3.sup.-, high concentration of CN-interference must be eliminated by using mesoporous carbon based adsorbent. The addition of N.sub.3.sup.- to the L.sub.1-Al.sup.3+ solution led to a change in color of the solutions from pink to colorless, which was observed with the naked eye. The addition of N.sub.3.sup.- to the solution containing L.sub.1-Al.sup.3+ complex resulted in the reversal of the Al.sup.3+ induced changes in the emission band at 585 nm in the fluorescence emission spectra.
[0012] Gradual addition of N.sub.3.sup.- results in continuous decrease in the emission intensity at 585 nm. Based on fluorescence data, the detection limit of L.sub.1-Al.sup.3+ or N.sub.3.sup.- was calculated as 12 .mu.M. A similar finding was observed for complex L.sub.2-Al.sup.3+ towards N.sub.3.sup.- ions. The L.sub.2-Al.sup.3+ system revealed remarkably selective fluorescence "off" behavior exclusively with N.sub.3.sup.-. The limit of detection value for N.sub.3.sup.- ions was found at 18 .mu.M. These results show that L.sub.1-Al.sup.3+ and L.sub.2-Al.sup.3+ binds N.sub.3.sup.- ions with higher selectivity and the process is reversible.
[0013] Accordingly, there is provided according to an embodiment of the invention, a compound having the formula:
##STR00001##
[0014] There is further provided according to the invention a compound having the formula:
##STR00002##
[0015] There is further provided according to the invention a method for synthesizing the compound L.sub.1, comprising
mixing a compound having the formula
##STR00003##
with 2-methoxy-1-naphthaldehyde and ethanol, stirring a resulting mixture until homogenous, and irradiating the resulting mixture in a microwave reactor.
[0016] There is further provided according to the invention a method for synthesizing the compound method for synthesizing the compound L.sub.2, comprising mixing a compound having the formula
##STR00004##
with 5-bromo-3methoxy salicylaldehyde and ethanol, stirring a resulting mixture until homogenous, and irradiating the resulting mixture in a microwave reactor.
[0017] There is further provided according to the invention a method for determining a presence of Al.sup.3+ in a sample, comprising: contacting the sample with a colorless solution comprising compound L.sub.1 or L.sub.2 and observing whether the colorless solution turns pink in color, where a change in color of the solution to pink indicates the presence of Al.sup.3+ in the sample. According to a further embodiment of the invention, the colorless solution shows no absorption above 450 nm in UV-vis absorption spectra, and an absorption peak above 525 nm indicates the presence of Al.sup.3+ in the sample.
[0018] There is further provided according to the invention a method for determining a presence of N.sub.3.sup.- in a sample, comprising: contacting the sample with a pink solution comprising a compound having the formula
##STR00005##
and observing whether the pink solution turns colorless, where a change in color of the solution from pink to colorless indicates the presence of N.sub.3.sup.- in the sample. According to a further embodiment of the invention, the pink solution shows an absorption peak above 525 nm in UV-vis absorption spectra, and no absorption above 450 nm indicates the presence of N.sub.3.sup.- in the sample.
BRIEF DESCRIPTION OF THE DRAWINGS
[0019] FIG. 1 shows the chemical structures and synthetic routes of L.sub.1 and L.sub.2.
[0020] FIG. 2 shows UV-vis spectra of L.sub.1 (10 .mu.M) with Al.sup.3+ (0-23 .mu.M) in CH.sub.3CN/H.sub.2O (7:3 v/v) solution.
[0021] FIG. 3 shows an Absorbance Job's plot for determination of L.sub.1-Al.sup.3+ complex (10 .mu.M) in CH.sub.3CN/H.sub.2O (7:3 v/v) solution.
[0022] FIG. 4a is a fluorescence spectra of L.sub.1 (10 .mu.M) in CH.sub.3CN/H.sub.2O (7:3 v/v) solution (.lamda..sub.ex=510 nm).
[0023] FIG. 4b is a fluorescence spectra of L.sub.2 (10 .mu.M) with metal ions (10 .mu.M) in CH.sub.3CN/H.sub.2O (7:3 v/v) solution (.lamda..sub.ex=510 nm).
[0024] FIG. 5 is a fluorescence spectral titration of L.sub.1 (10 .mu.M) on the incremental addition of Al(NO.sub.3).sub.3 (23 equivalents) (.lamda..sub.ex=510 nm).
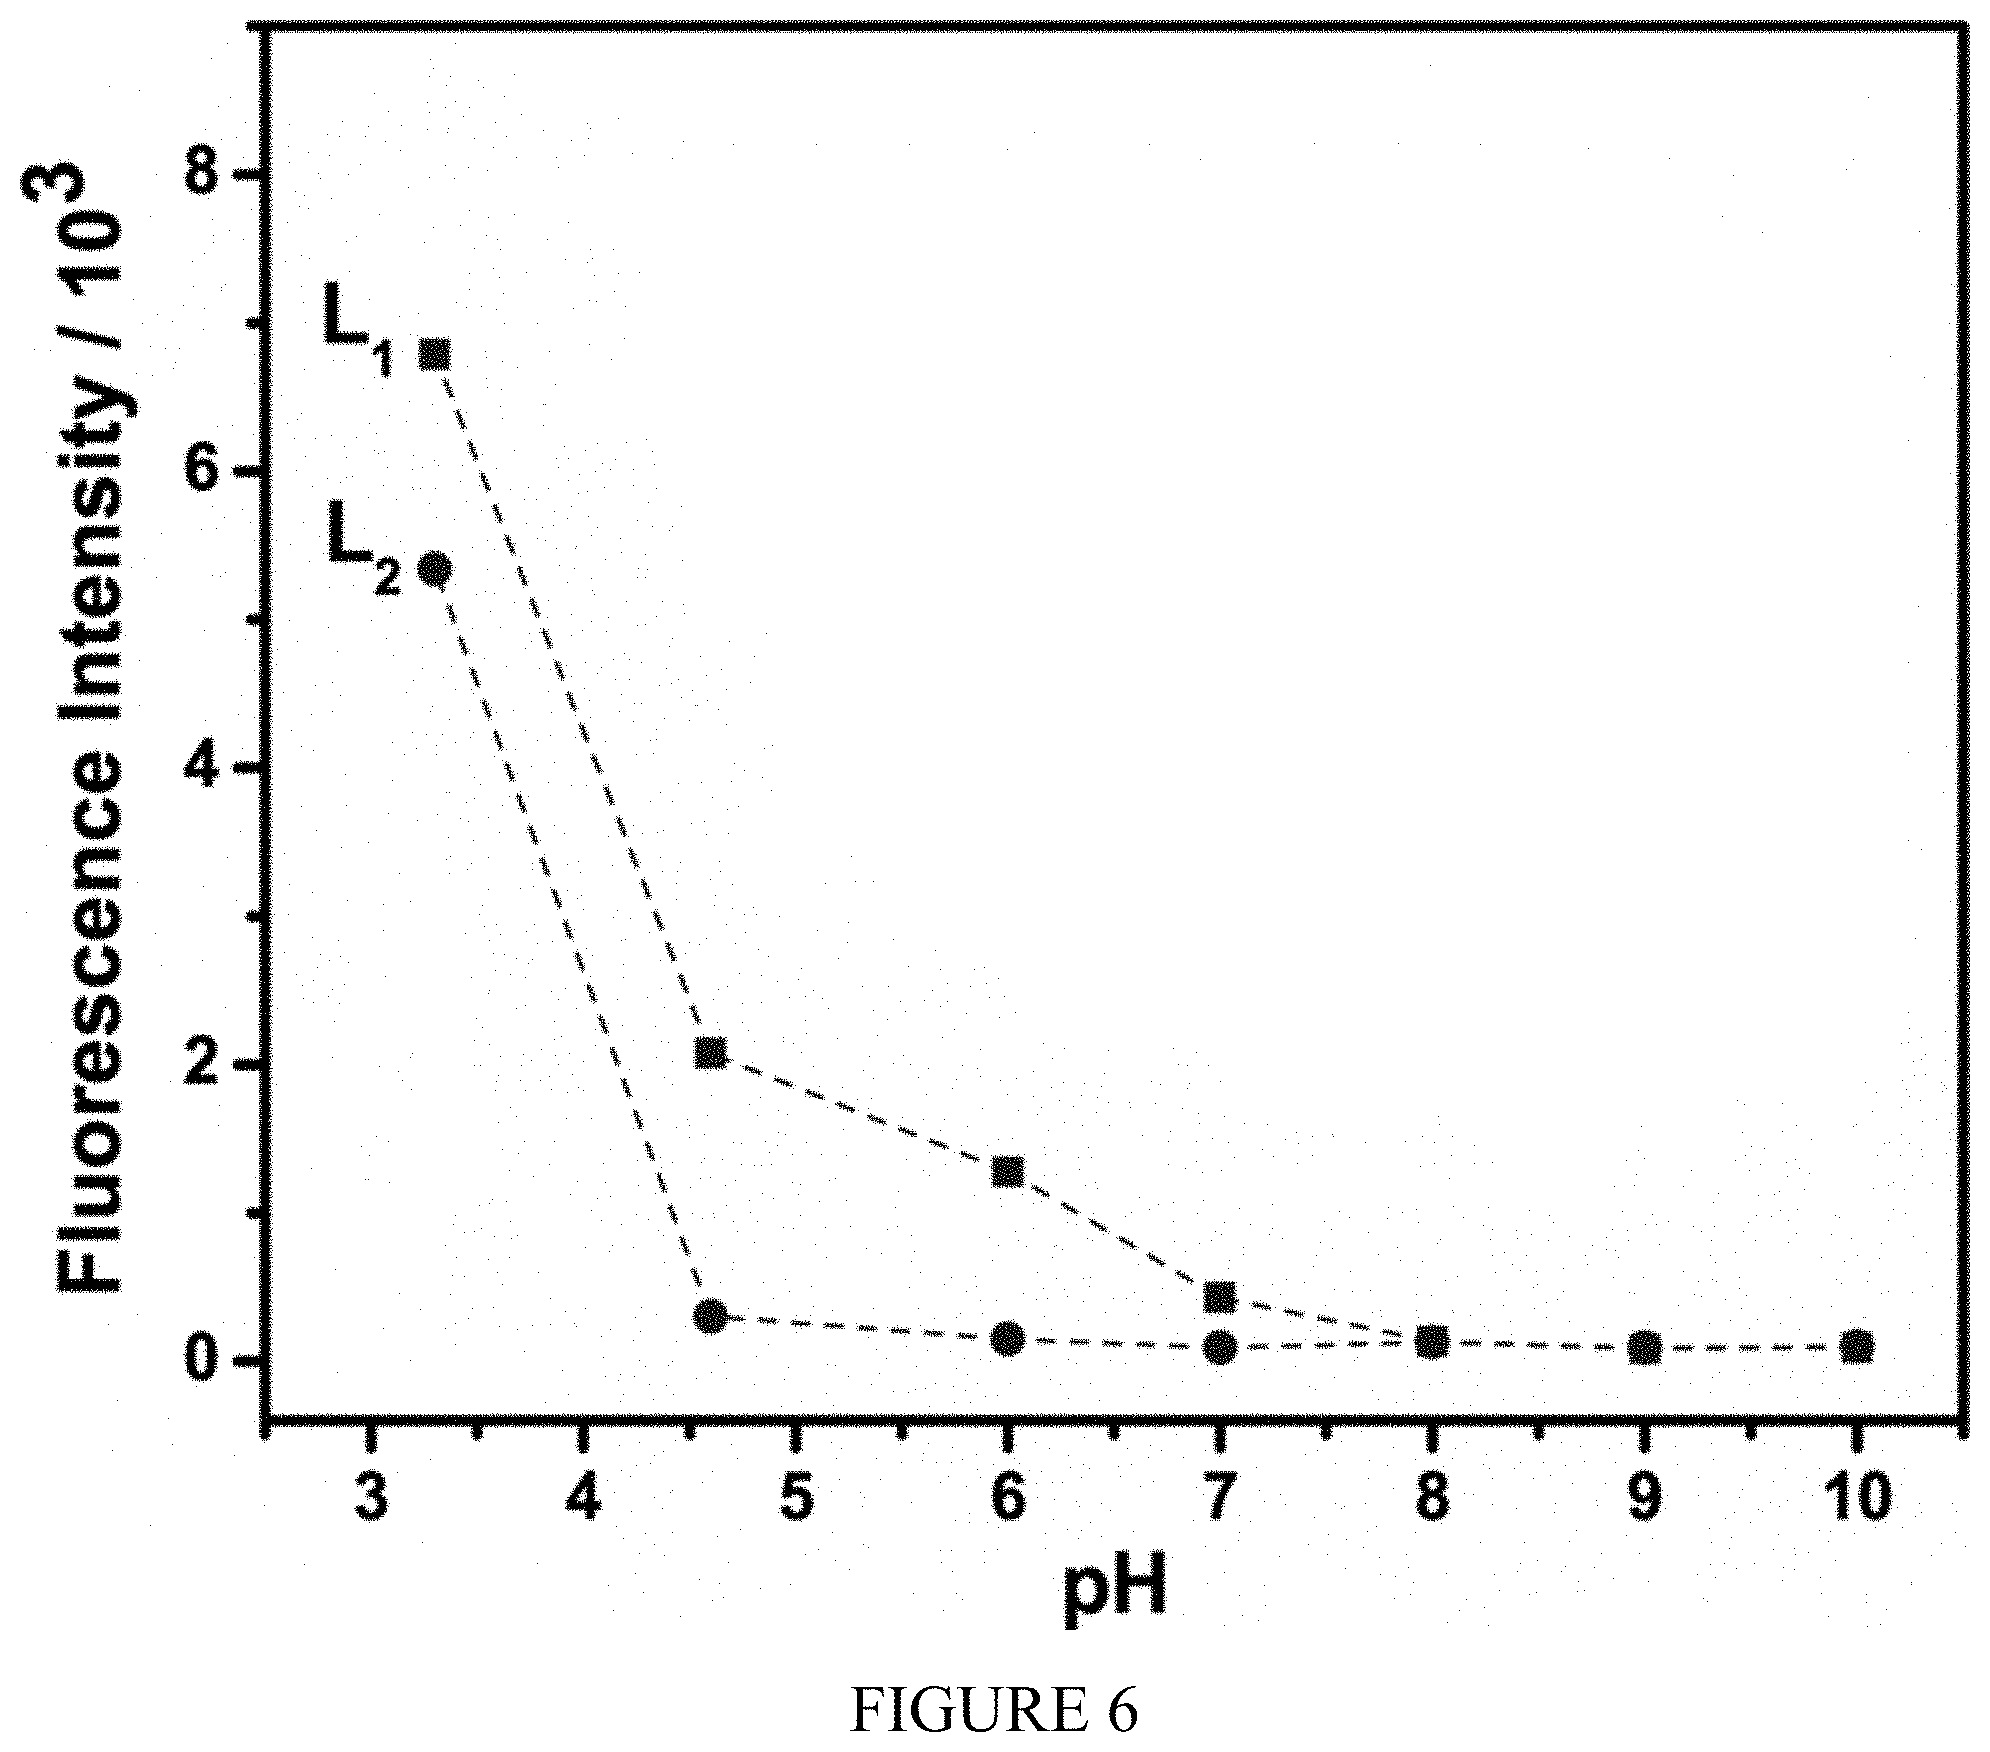
[0025] FIG. 6 shows the effect of pH on fluorescence intensity of sensors L.sub.1 and L.sub.2 (10 .mu.M).
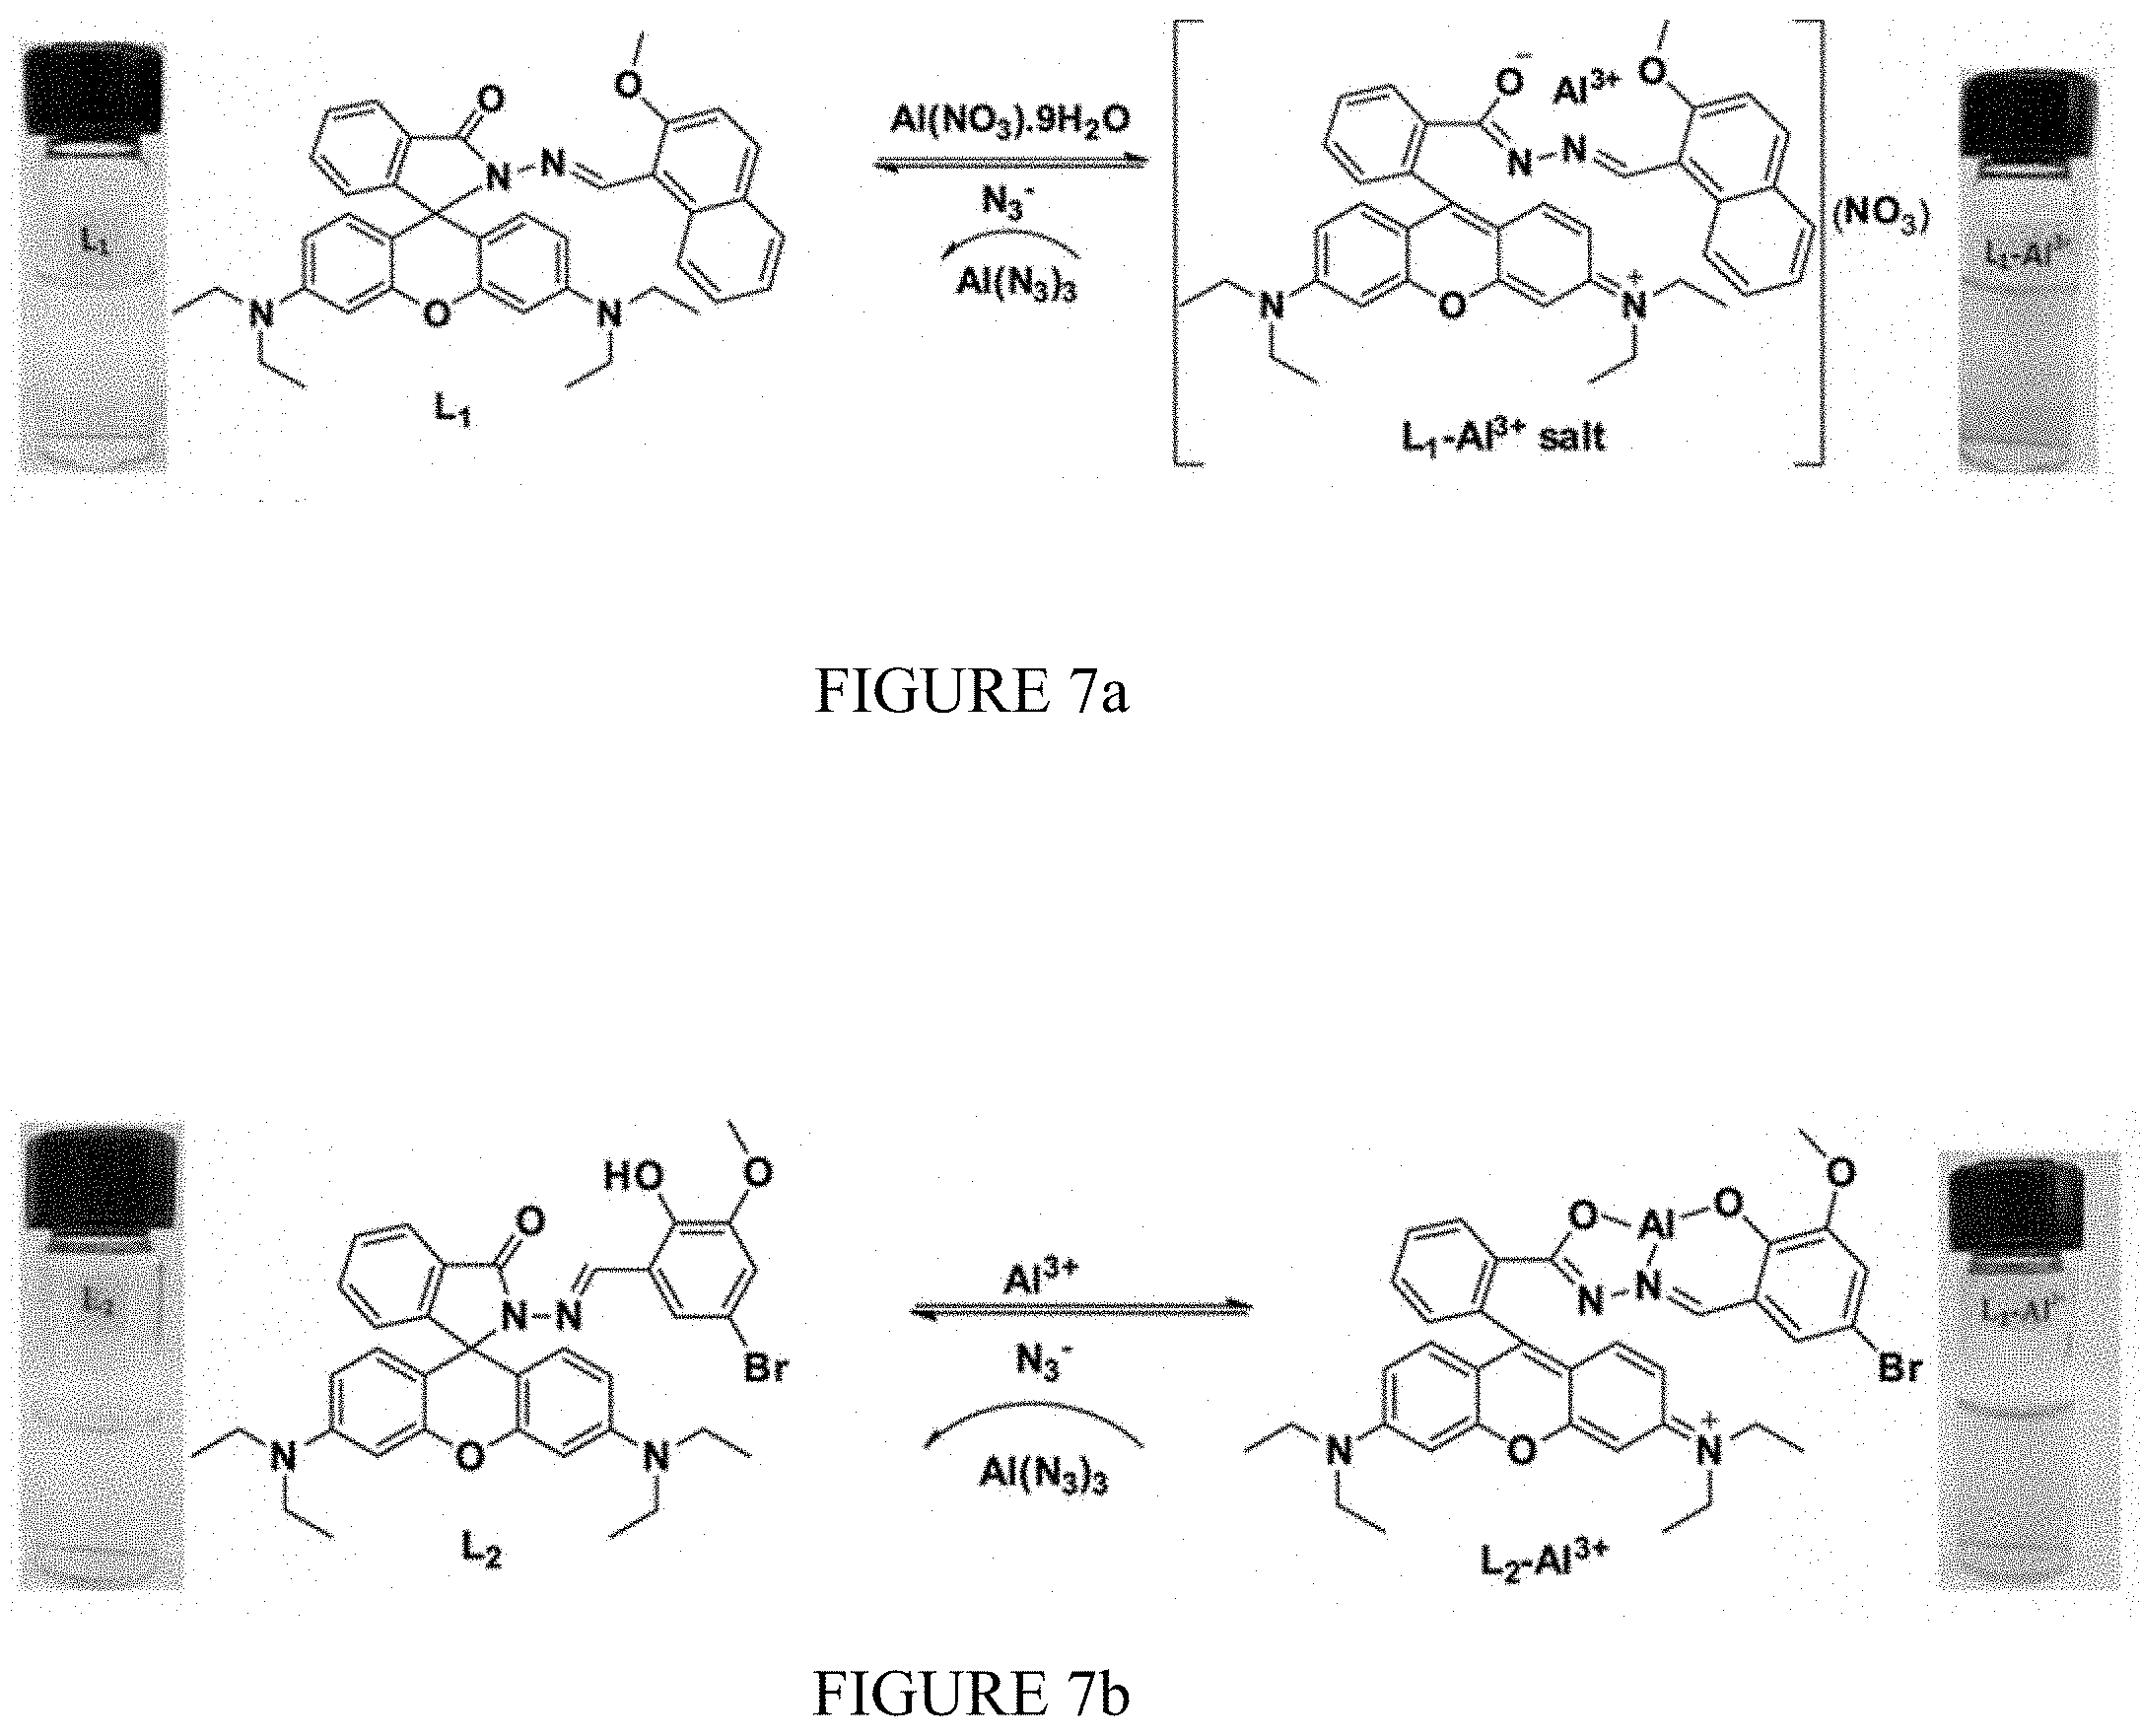
[0026] FIG. 7a shows a proposed binding mechanism of sensor L.sub.1 towards Al.sup.3+ in the presence and absence of azide (N.sub.3.sup.-).
[0027] FIG. 7b shows a proposed binding mechanism of sensor L.sub.2 towards Al.sup.3+ in the presence and absence of azide (N.sub.3.sup.-).
[0028] FIG. 8a shows the fluorescence spectra of L.sub.1-Al.sup.3+ (1:1) with anions (10 .mu.M) (.lamda..sub.ex=510 nm).
[0029] FIG. 8b shows a fluorescence spectral titration of L.sub.1-Al.sup.3+ (23 equivalents of Al.sup.3+) on the incremental addition of N.sub.3.sup.- (up to 35 equivalents) (.lamda..sub.ex=510 nm).
[0030] FIG. 9 shows .sup.1H-NMR spectral changes of L.sub.2 (8 mM) in DMSO-d.sub.6 and titrated with 0-1.0 equivalents of Al.sup.3+ in deuterated water.
[0031] FIG. 10a shows optimized structures and energy correlation of the HOMO-LUMO gap between L.sub.1 and L.sub.1-Al.sup.3+ salt.
[0032] FIG. 10b shows optimized structures and energy correlation of the HOMO-LUMO gap between L.sub.2 and L.sub.2-Al.sup.3+ complex.
DETAILED DESCRIPTION
[0033] Chemicals and Instruments
[0034] All reagents and solvents were purchased as analytical-grade and used without further purification unless otherwise stated. Stock solutions of metal ions were prepared from their nitrate and chloride salts and anion species from their tetrabutylammonium salts. Distilled deionized water was used throughout the experiments. .sup.1H-NMR and .sup.13C-NMR spectra were recorded using an Avance 400 MHz spectrometer (Bruker Billerica, Karlsruhe, Germany) with tetramethylsilane (TMS) as internal standard and deuterated chloroform (CDCl.sub.3) as solvent. NMR spectra were analyzed using MestReNova software (version 10, Mestrela Research, Feliciano Barrera-Bajo, Spain). The IR spectrum was obtained using FT-IR spectrometer (Shimadzu, IRAffinity-1S, Columbia, Md., USA). High resolution electrospray ionization mass spectrometry (ESI-MS) was acquired with a Bruker Apex-Qe instrument. All UV-vis spectroscopy experiments were recorded using a Cary UV/vis spectrophotometer 5000 (Varian, Walnut Creek, Calif., USA). Fluorescence emission spectra experiments were measured using a Cary 60 series spectrometer (Agilent, Walnut Creek, Calif., USA), with excitation and emission slit widths of 5 nm and excitation wavelength at 510 nm. MAOS reactions were carried out in a single mode Biotage Initiator 2.0 (Biotage, Uppsala, Sweden).
[0035] Microwave-Assisted Synthesis and Characterization of L.sub.1 and L.sub.2
[0036] Sensors L.sub.1 and L.sub.2 were synthesized from the parent rhodamine B and aromatic aldehydes (2-methoxy-1-naphthaldehyde and 5-bromo-3-methoxy salicylaldehyde) in a two-step Schiff base condensation using MAOS heating protocols, as shown in FIG. 1. Compound 2 was synthesized according to procedure reported in Xiang Y, Tong A, Jin P, Ju Y, Org. Lett 2006, 8, 2863.
[0037] Synthesis of Sensor L.sub.1
[0038] Using microwave heating protocol: A mixture of compound 2 (105 mg, 0.230 mmol), 2-methoxy-1-naphthaldehyde (41 mg, 0.220 mmol) and ethanol (2 ml) was placed in a 10 ml reaction vial. The resulting mixture was stirred to make it homogeneous and it was placed in the cavity of a biotage microwave reactor. The closed reaction vessel was run under pressure and irradiated for 10 min at 100.degree. C. After cooling to room temperature, the resulting solid was filtered and washed three times with cold ethanol. After drying, the sensor L.sub.1 was isolated to give in 92% yield. Melting point: 244-246.degree. C.; .sup.1H-NMR (CDC1.sub.3), .delta. (ppm): 9.63 (1H, s, N.dbd.C--H); 8.77 0 (1H, t, J=7.4 Hz, H--Ar), 7.74 (1H, d, J=8.4 Hz, H--Ar), 7.71 (1H, d, J=8.0 Hz, H--Ar), 7.63 (1H, d, J=7.7 Hz, H--Ar), 7.48-7.51 (2H, m, H--Ar), 7.15-7.27 (2H, m, H--Ar),7.12 (1H, d, J=8.4 Hz), 7.09 (1H, d, J=4.9 Hz), 6.63 (2H, d, J=8.8 Hz), 6.44 (2H, d, J=2.2 Hz), 6.28 (2H, dd, J=8.8 Hz, 2.6 Hz), 3.82 (3H, s, OCH.sub.3), 3.31 (8H, q, J=6.9 Hz, NCH.sub.2CH.sub.3), 1.14 (12H, t, J=6.9 Hz, NCH.sub.2CH.sub.3). 13C-NMR (CDCl.sub.3), .delta. (ppm): 164.6, 157.8, 153.4, 151.7, 148.8, 147.6 (N.dbd.C--H), 137.6, 133.1, 131.9, 130.3, 129.2, 128.1, 127.0, 126.7, 124.0, 123.2, 116.8, 112.9, 108.1, 107.9, 106.5, 104.6, 79.9, 66.3 (spiro carbon), 56.7, 44.3 (NCH.sub.2CH.sub.3), 12.7(NCH.sub.2CH.sub.3); HRMS (ESI): m/z calcd for C.sub.40H.sub.40N.sub.4O.sub.3: 625.3173; Found: 625.3176 [M+H]+.
[0039] Synthesis of Sensor L.sub.2
[0040] Using microwave heating protocol: A mixture of compound 2 (100 mg, 0.220 mmol), 5-bromo-3-methoxy salicylaldehyde (51 mg, 0.221 mmol) and ethanol (2 ml) was placed in a 10 ml reaction vial. The resulting mixture was stirred to make it homogeneous and it was placed in the cavity of a biotage microwave reactor. The closed reaction vessel was run under pressure and irradiated for 10 min at 100.degree. C. After cooling to room temperature, the resulting solid was filtered and washed three times with cold ethanol. After drying, the sensor L.sub.2 was isolated to give in 88% yield. .sup.1H-NMIR (CDCl.sub.3), .delta. (ppm):11.11 (1H, s, --OH), 8.94 (1H, s, --CH.dbd.N 7.96 (1H, t, J=6.6 Hz, --Ar), 7.49 (2H, m, --Ar), 6.86 (1H, d, J=6.6 Hz, --Ar), 7.50 (2H, s, --Ar), 6.51-6.43 (4H, m, --Ar), 6.25 (2H, d, J=7.5 Hz, --Ar), 3.82 (3H, s, --OCH.sub.3), 3.31 (8H, q, NCH.sub.2CH.sub.3), 1.16 (12H, t, J=6.6 Hz, NCH.sub.2CH.sub.3) 13C-NMR (CDCl.sub.3), .delta. (ppm): 163.6, 152.7, 148.5, 146.6 (--CH.dbd.N), 138.5, 138.1, 137.7, 134.0, 128.9, 128.5, 127.5, 123.1, 121.8, 121.3, 108.1, 108.0, 106.5, 104.8, 97.3, 80.9, 65.5 (spiro carbon), 56.1, 43.6 (NCH.sub.2CH.sub.3), 12.4 (NCH.sub.2CH.sub.3). HRMS (ESI): m/z calcd for C.sub.36H.sub.37BrN.sub.4O.sub.4: 669.2071; Found: 669.2076[M+H]+.
[0041] General Procedure for the Spectroscopic Studies
[0042] All spectroscopic measurements were carried out in aqueous CH.sub.3CN medium at room temperature. Stock solutions of sensors L.sub.1 and L.sub.2 (1.times.10.sup.-3 M), selected salts of cations (1.times.10.sup.-3 M) and anions (1.times.10.sup.-4 M) were prepared in CH.sub.3CN/H.sub.2O. Thus, L.sub.1-Al.sup.3+ and L.sub.2-Al.sup.3+ solutions for N.sub.3.sup.- detection were prepared by addition of 1.0 equivalent of Al.sup.3+ to the solution of both L.sub.1 and L.sub.2 (20 .mu.M) in Tris-HCl (10 mM, pH=7.2) buffer containing CH.sub.3CN/H.sub.2O (7:3, v/v) solution. The resulting solution was shaken well before recording the spectra. Each fluorescence titration was repeated at least thrice until consistent values were obtained. Jobs continuous variation method was used for determining the binding stoichiometry of the complexation reaction. The association constant (K) was calculated from absorbance studies by the linear Benesi-Hildebrand equation. Color changes in solution phase were observed visually under normal light and under a hand-held UV lamp upon addition of various metal ions at room temperature.
[0043] Synthesis of Sensors L.sub.1 and L.sub.2
[0044] The synthesis of L.sub.1 and L.sub.2 were prepared in two steps with 92% and 88% overall yields respectively (FIG. 1). The results obtained indicate that, unlike classical heating, MAOS results in higher yields, shorter reaction time, mild reaction condition, simple work-up procedure and better purity offer privilege over other methods where complex chromatographic techniques are required for purification of the target compounds. The structure of sensors was fully characterized by .sup.1H-NMR, .sup.13C-NMR, FT-IR and HRMS spectroscopy and all data are in accordance with the proposed structure.
[0045] Absorption Spectra Studies
[0046] The metal ion sensing of L.sub.1 and L.sub.2 were first investigated by UV-vis absorption spectra. The colorless solutions were very weakly fluorescent and showed no absorption above 450 nm, properties which are characteristic of the predominant ring-closed spirolactam. The predominant spirolactam form was further confirmed by observation of the characteristic carbon resonance near 66 ppm for each of the sensors. The UV-vis spectra of sensors were recorded in buffer at 25.degree. C. and showed an absorption maximum at .lamda.=315 nm, which may be attributed to the intramolecular .pi.-.pi.* charge transfer transition. On incremental addition of Al.sup.3+ ions, the absorption intensity at 315 nm increased gradually and a new absorption peak at 565 nm with a shoulder at 525 nm was generated by ring opening with a visual color change from colorless to pink. The well-defined isosbestic points at 340 and 375 nm clearly indicates the formation of a new complex species between L.sub.1 and Al.sup.3+ ion (FIG. 2). The absorption enhancement is high compared to other metal ions. Selectivity of L.sub.1 was checked in the presence of other metal ions. No significant change in the UV-vis spectrum was observed upon the addition of a 10 equivalent excess of other metal ions of interest: Na.sup.+, K.sup.+, Mg.sup.2+, Ca.sup.2+, Ni.sup.2+, Zn.sup.2+, Co.sup.2+, Hg.sup.2+, Pb.sup.2+, Fe2+, Fe.sup.3+, Cr.sup.2+ and Cu.sup.2+. Absorption spectra of sensors recorded with the continuous addition of Al.sup.3+ showed a continuous increase in the absorption at 565 nm and that was employed to calculate binding constants for L.sub.1 and L.sub.2 with Al.sup.3+ using the Benesi-Hildebrand method. The plot of absorbance of L.sub.1 at 565 nm as a function of mole fraction of added Al.sup.3+ metal ion reveals that these probes bind to the metal ion in 1:1 stoichiometry (FIG. 3). The complex association constant (K) calculated through the Benesi-Hildebrand equation for Al.sup.3+ with L.sub.1 and L.sub.2 were found to be 3.82.times.104 M.sup.-1 and 2.41.times.104 M.sup.-1, respectively.
[0047] Fluorescence Spectral Response of Sensors
[0048] To further explore the sensing behavior of L.sub.1 for Al.sup.3+ ion, the fluorescence spectra of L.sub.1 in CH.sub.3CN with various metal ions were examined. The fluorescence spectra were obtained by excitation at 510 nm, and both the excitation and emission slit were 5 nm. The fluorescence intensity of L.sub.1 upon the additions of metal ions in CH.sub.3CN showed a remarkable sensitivity and selectivity towards Al.sup.3+, even though there were relatively small effects with Cu.sup.2+ and Cr.sup.3+ (FIG. 4a). There was a significant emission intensity enhancement with 1.0 equivalent of Al.sup.3+ which indicates sensor L.sub.1 is an excellent turn-on sensor for Al.sup.3+. This very high fluorescence enhancement is attributed to the formation of ring-open spirolactum in the presence of Al.sup.+. This selectivity for Al.sup.3+ ions over all other ions is due to selective chelate formation with L.sub.1 to afford an L.sub.1-Al.sup.3+ complex (See FIG. 7a). When illuminated with a hand-held UV lamp, the addition of Al.sup.3+ ions to sensor solution resulted in orange fluorescence emission from L.sub.1 solution (FIG. 5). The fluorescence profile of L.sub.2 were very similar to those for sensor L.sub.1: again Al.sup.3+ registered the highest fluorescence enhancement while other metal ions showed no significant enhancement (FIG. 4b). The fluorescence spectrum of sensors L.sub.1 and L.sub.2 showed a peak at 585 nm upon the addition of Al.sup.3+ corresponding to the delocalization in the xanthenes moiety of rhodamine. It is assumed that the spirolactam form was opened upon the addition of Al.sup.3+ to sensors and makes a highly delocalized .pi.-conjugated stable complexes with Al.sup.3+ through their active donor sites (e.g., N and O atoms) of receptor part, though other ions failed which basically indicates that the coordinate moiety of L.sub.1 and L.sub.2 matches perfectly with Al.sup.3+ ions instead of the other ions. The detection limits of L.sub.1 and L.sub.2 for Al.sup.3+ ions were estimated based on the fluorescence titration experiment as 32 .mu.M and 47 .mu.M respectively. Furthermore, the effect of pH values on the fluorescence of L.sub.1 and L.sub.2 were also investigated in a pH range from 3 to 10. FIG. 6 shows that for free L.sub.1 and L.sub.2 at pH<5, due to protonation of the open-ring of spirolactam, an obvious color change and fluorescence turn-on appeared. Thus, all the optical measurements were performed in buffer solution with a pH of 7 to keep the sensors in their ring closed form.
[0049] Detection of azide (N.sub.3.sup.-)
[0050] Investigation of the reversible binding nature of the sensors is shown in FIG. 8 and FIGS. 7a and 7b. Due to the high stability of AlN.sub.3, the L.sub.1-Al.sup.3+ and L.sub.2-Al.sup.3+ complexes serve as a means to detect N.sub.3.sup.-. FIG. 8a shows the addition of 20 .mu.M of anions N.sub.3.sup.-, CN.sup.-, ClO.sub.4, CH.sub.3COO.sup.-, HSO.sub.4.sup.-, H.sub.2SO.sub.4.sup.2-, SCN.sup.-, Cl.sup.-, I.sup.-, F.sup.-, and OH.sup.- to L.sub.1-Al.sup.3+ (1:1) of which N.sub.3.sup.- alone quenches the fluorescence, with a slight effect for CN.sup.-, indicating high selectivity for N.sub.3.sup.-. High concentration of CN.sup.- contamination is likely to mislead the fluorescent selectivity of N.sub.3.sup.-. So, when L.sub.1-Al.sup.3+ is used as the sensor for N.sub.3.sup.-, high concentration of CN.sup.- interference must be eliminated by using mesoporous carbon based adsorbent. The addition of N.sub.3.sup.- to the L.sub.1-Al.sup.3+ solution led to a change in color of the solutions from pink to colorless, which was observed with the naked eye. The addition of N.sub.3.sup.- to the solution containing L.sub.1-Al.sup.3+ complex resulted in the reversal of the Al.sup.3+ induced changes in the emission band at 585 nm in the fluorescence emission spectra. Gradual addition of N.sub.3.sup.- results in continuous decrease in the emission intensity at 585 nm (FIG. 8b). Based on fluorescence data, the detection limit of L.sub.1-Al.sup.3+ for N.sub.3.sup.- was calculated as 12 .mu.M. A similar finding was observed for complex L.sub.2-Al.sup.3+ towards N.sub.3.sup.- ions. The L.sub.2-Al.sup.3+ system revealed remarkably selective fluorescence "off" behavior exclusively with N.sub.3.sup.-. The limit of detection value for N.sub.31.sup.- ions was found at 18 .mu.M. These results show that L.sub.1-Al.sup.+ and L.sub.2-Al.sup.3+ bind N.sub.3.sup.- ions with higher selectivity and that the process is reversible. The expected binding mechanism of sensors with Al.sup.3+ in the presence and absence of azide (N.sub.3.sup.-) is shown in FIGS. 7a and 7b.
[0051] FT-IR and .sup.1H-NMR Study for Elucidation of Coordination Mechanism Between Sensors and Al.sup.3+
[0052] To elucidate the coordination mechanism of L.sub.1-Al.sup.3+ and L.sub.2-Al.sup.3+ complexes, the FT-IR spectrum of L.sub.1 and L.sub.2 were conducted in the absence and presence of Al.sup.3+ ion. The characteristic peak of the amide carbonyl .gamma..sub.(C.dbd.O) shifted from 1680 cm.sup.-1 to 1614 cm.sup.-1 in the presence of Al.sup.3+, indicating that carbonyl O atoms of the L.sub.1 and L.sub.2 are involved in the coordination of Al.sup.3+. .sup.1H-NMR was also performed by adding Al.sup.3+ to deuterated dimethyl sulfoxide (DMSO-d.sub.6) solution of L.sub.2 as shown in FIG. 9. The L.sub.2-Al.sup.3+ complexes were prepared by the additions of 0.25, 0.5 and 1.0 equivalent AlC.sub.36H.sub.2O to the DMSO solution of L.sub.2. The peaks observed at .delta. 10.10 and .delta. 9.07 are attributable to the phenolic OH and the imine proton (--CH.dbd.N--) in L.sub.2. Addition of 1 equivalent of Al.sup.3+ resulted in the disappearance of the hydroxyl proton indicating the binding of Al.sup.3+ ion through the phenoxide interaction. Further, small unfilled-shifts from 9.07 to 9.00 ppm and shortening of imine protons were observed because of the complex formation between nitrogen atoms and Al.sup.3+. The formation of the L.sub.2-Al.sup.3+ complex through normal ring opening was confirmed by performing the .sup.13C-NMR experiment with L.sub.2 in the absence and presence of Al.sup.3+ ions, from which it was observed that the signal at .delta.=66 ppm attributable to the tertiary carbon of the spirolactam ring in L.sub.2 was absent from the spectrum of L.sub.2-Al.sup.3+ complex. Therefore, it is understood that the O atom of phenolic OH, N atom of imine and O atom of spiro ring coordinate to Al.sup.3+ as shown in FIGS. 7a and 7b.
[0053] Geometry Optimization
[0054] To better understand the nature of the coordination of Al.sup.3+ with sensors, theoretical calculations on structures L.sub.1, L.sub.2, L.sub.1-Al.sup.3+ and L.sub.2-Al.sup.3+ were carried out using Spartan'16 software. Density functional theory (DFT), employing the B3LYP functional and the 6-31G* basis set was used to obtain gas phase, optimized geometries of these structures. The optimized structures of L.sub.1, L.sub.2 and their respective Al-complexes are depicted in FIGS. 10a and 10b. L.sub.1 and L.sub.2 can undergo rotation of approximately 180.degree. about the N--N bond, producing two prominent cis and trans conformations. For both L.sub.1 and L.sub.2, the trans conformation is more energetically stable than the respective cis one by approximately 11.3 kJ mol.sup.-1, owing to anti-arrangement of the methoxy (--OMe) group and the xanthene moiety in trans L.sub.1 and to the anti-arrangement of the hydroxyl (--OH) group and the xanthene moiety in trans L.sub.2. Additionally, in trans L.sub.1 the energy gap between the highest occupied molecular orbital (HOMO) (-4.81 eV) and the lowest unoccupied molecular orbital (LUMO) (-1.34 eV) is 3.47 eV, and in cis L.sub.1 the gap, HOMO (-5.03 eV) and LUMO (-1.35 eV), is3.68 eV. In trans L.sub.2, the energy gap, HOMO (-4.86 eV) and LUMO (-1.29 eV) is 3.57 eV, and in cis L.sub.2 the energy gap, HOMO (-5.05 eV) and LUMO (-1.22 eV) is 3.83 eV, suggesting that trans L.sub.1 and trans L.sub.2 are the major equilibrium conformations available stereochemically for direct Al.sup.3+ coordination. Also, in trans L.sub.1, the electron density is delocalized over the entire xanthene moiety with some found on the spirolactam ring as well as on the imine and the ortho-methoxy naphthalene moieties (FIG. 10a). In cis L.sub.1, the electron density is mainly localized on half of the xanthene moiety. In both trans L.sub.2 and cis L.sub.2, the electron density is mainly located over the entire xanthene moiety with some found on the lactam ring nitrogen of both. Moreover, some electron density is also found on the carbonyl oxygen in trans L.sub.2 but not on the carbonyl oxygen in cis L.sub.2 (FIG. 10b).
[0055] Density functional calculations of molecular interactions of trans-L.sub.1 and trans-L.sub.2 with aqueous aluminum (Al.sup.3+) nitrate solution revealed that both sensors are energetically stabilized on binding with Al.sup.3+ ions. For instance, upon formation of L.sub.1-Al.sup.3+ salt complex, the HOMO-LUMO energy gap in trans-L.sub.1 (.DELTA.E=3.47 eV) decreased to .DELTA.E=2.40 eV, and upon formation of L.sub.2-Al.sup.3+ complex, the HOMO-LUMO energy gap in trans-L.sub.2 (.DELTA.E=3.57 eV) decreased to 2.22 eV. In L.sub.1-Al.sup.3+ salt complex, formulated as [Al (L.sub.1) NO.sub.3).sub.2(H.sub.2).sub.2] [NO.sub.3], HOMO is primarily delocalized over the methoxy naphthalene moiety, while LUMO is primarily delocalized over the xanthene moiety. In L.sub.2-Al.sup.3+ complex, formulated as Al (L.sub.2) (NO.sub.3).sub.2(H.sub.2O), HOMO is found over the tricyclic structure about Al.sup.3+ while LUMO is delocalized over the xanthene moiety (FIGS. 10a and 10b).
[0056] Vertical electronic excitations of optimized B3LYP/6-31G* trans-L.sub.1, trans-L.sub.2 and their respective complexes were computed using time-dependent-density functional theory (TD-DFT) Spartan'16 software calculations, formalized in water and using a conductor-like polarizable continuum model (CPCM). In the TD-DFT UV-vis spectrum of trans-L.sub.1, an absorption band at .lamda.=379.24 nm with a vertical excitation energy of 3.2693 eV and corresponding to HOMO-2.fwdarw.LUMO excitation (oscillator strength=0.4632) dominates. While in the TD-DFT UV-vis spectrum of trans-L.sub.1-Al.sup.3+ salt complex, an absorption band at .lamda.=422.57 nm dominates, corresponding to HOMO.fwdarw.LUMO excitation (vertical excitation energy=2.9341 eV and oscillator strength=1.0951). In the case of trans-L.sub.2, an absorption band at .lamda.=344.32 nm dominates, corresponding to HOMO-2.fwdarw.LUMO excitation with a vertical excitation energy of 3.6008 eV and an oscillator strength=0.3152. For trans-L.sub.2-Al.sup.3+ complex, an absorption band at .lamda.=456.19 nm dominates, corresponding to HOMO-1.fwdarw.LUMO and HOMO.fwdarw.LUMO excitations with a vertical excitation energy of 2.7178 eV and an oscillator strength=0.7824.
[0057] Conclusion
[0058] We have developed reversible fluorescent sensors L.sub.1 and L.sub.2 for the selective and sensitive sequential detections of Al.sup.3+ and N.sub.3.sup.- via the fluorescence spectral changes. Upon binding to Al.sup.3+, obvious detectable change in fluorescence was observed due to the CHEF effect. The in situ prepared L.sub.1-Al.sup.3+ and L.sub.2-Al.sup.3+ complexes were used to detect N.sub.3.sup.- via the metal-displacement approach which displayed an excellent selectivity and sensitivity towards N.sub.3.sup.-. Thus, upon the addition of N.sub.3.sup.- to complexes, the intensity of the 585 nm band decreases, indicating release of L.sub.1 and L.sub.2 from the aluminum complexes. Stoichiometry and binding mechanisms for both sensors are well characterized and established by the respective spectroscopic techniques. These results clearly demonstrate that L.sub.1 and L.sub.2 sensors described herein will be useful for the analysis of Al.sup.3+ and N.sub.3.sup.- in environmental samples and biological studies.
* * * * *
D00000
D00001
D00002
D00003

D00004

D00005
D00006
D00007

D00008

D00009

D00010

XML
uspto.report is an independent third-party trademark research tool that is not affiliated, endorsed, or sponsored by the United States Patent and Trademark Office (USPTO) or any other governmental organization. The information provided by uspto.report is based on publicly available data at the time of writing and is intended for informational purposes only.
While we strive to provide accurate and up-to-date information, we do not guarantee the accuracy, completeness, reliability, or suitability of the information displayed on this site. The use of this site is at your own risk. Any reliance you place on such information is therefore strictly at your own risk.
All official trademark data, including owner information, should be verified by visiting the official USPTO website at www.uspto.gov. This site is not intended to replace professional legal advice and should not be used as a substitute for consulting with a legal professional who is knowledgeable about trademark law.