Using Brine Resistant Silicon Dioxide Nanoparticle Dispersions To Improve Oil Recovery
Holcomb; David L. ; et al.
U.S. patent application number 17/081154 was filed with the patent office on 2021-02-11 for using brine resistant silicon dioxide nanoparticle dispersions to improve oil recovery. The applicant listed for this patent is Nissan Chemical America Corporation. Invention is credited to Yusra Khan Ahmad, David L. Holcomb, John Edmond Southwell.
| Application Number | 20210040381 17/081154 |
| Document ID | / |
| Family ID | 1000005178302 |
| Filed Date | 2021-02-11 |


View All Diagrams
| United States Patent Application | 20210040381 |
| Kind Code | A1 |
| Holcomb; David L. ; et al. | February 11, 2021 |
USING BRINE RESISTANT SILICON DIOXIDE NANOPARTICLE DISPERSIONS TO IMPROVE OIL RECOVERY
Abstract
This invention describes and claims the stimulation of several Wolfcamp and Bone Springs targeted wells in the northern Delaware Basin using fracturing treatments and a new method employing relatively small pre-pad pill volumes of Brine Resistant Silicon Dioxide Nanoparticle Dispersions ahead of each stage of treatment have been successfully performed. The invention includes a method of extending an oil and gas system ESRV comprising the steps of adding a Brine Resistant Silicon Dioxide Nanoparticle Dispersion ("BRINE RESISTANT SDND") to conventional oil well treatment fluids. The invention also includes a method of increasing initial production rates of an oil well by over 20.0% as compared to wells either not treated with the BRINE RESISTANT SDND technology or treated by conventional nano-emulsion surfactants. The Method focuses on the steps of adding a Brine Resistant Silicon Dioxide Nanoparticle Dispersion to conventional oil well treatment fluids.
| Inventors: | Holcomb; David L.; (Florence, AZ) ; Ahmad; Yusra Khan; (Friendswood, TX) ; Southwell; John Edmond; (Glen Ellyn, IL) | ||||||||||
| Applicant: |
|
||||||||||
|---|---|---|---|---|---|---|---|---|---|---|---|
| Family ID: | 1000005178302 | ||||||||||
| Appl. No.: | 17/081154 | ||||||||||
| Filed: | October 27, 2020 |
Related U.S. Patent Documents
| Application Number | Filing Date | Patent Number | ||
|---|---|---|---|---|
| 16179676 | Nov 2, 2018 | 10870794 | ||
| 17081154 | ||||
| 62581331 | Nov 3, 2017 | |||
| Current U.S. Class: | 1/1 |
| Current CPC Class: | E21B 43/26 20130101; C09K 8/665 20130101; C09K 8/032 20130101; C09K 8/845 20130101; C09K 8/72 20130101; C09K 2208/10 20130101; C09K 8/80 20130101; C09K 8/601 20130101 |
| International Class: | C09K 8/84 20060101 C09K008/84; C09K 8/80 20060101 C09K008/80; C09K 8/03 20060101 C09K008/03; C09K 8/72 20060101 C09K008/72; C09K 8/60 20060101 C09K008/60; E21B 43/26 20060101 E21B043/26; C09K 8/66 20060101 C09K008/66 |
Claims
1. A method of treatment of an oil and gas system, the method comprising adding an aqueous brine resistant silicon dioxide nanoparticle dispersion into the oil and gas system as a pre-pad pill, wherein the aqueous brine resistant silicon dioxide nanoparticle dispersion comprises silica nanoparticles surface modified with trimethoxy[3-(oxiranylmethoxy)propyl] silane in combination with an organosilane selected from 3-(triethoxysilyl)propyl succinic anhydride, 3-(trimethoxysilyl)propyl methacrylate, hexamethyl disiloxane, hexamethyl disilazane, trimethoxy methyl silane, trimethoxy phenyl silane, vinyl trimethoxysilane, 3-(N,N-dimethylaminopropyl)-trimethoxysilane, 3-(diethylamino)propyl trimethoxysilane, trimethoxy(octadecyl)silane, isobutyl trimethoxysilane, hexyltrimethoxysilane, decyltrimethoxysilane, isooctyltrimethoxysilane, hexadecyltrimethoxysilane, propyltrimethoxysilane, and octyltriethoxysilane, and wherein the aqueous brine resistant silicon dioxide nanoparticle dispersion is characterized by having a change in turbidity of less than about 100 NTU after API brine exposure according to an API brine resistance test by use of a turbidimeter.
2. The method of claim 1, further comprising adding a frac stage fluid into the oil and gas system after the pre-pad pill, wherein the volume of the aqueous brine resistant silicon dioxide nanoparticle dispersion pre-pad pill is from about 500 to about 1,000 U.S. gallons per about 3,000 to about 6,000 U.S. barrels of the frac stage fluid.
3. The method of claim 1, wherein the silica nanoparticles have an average diameter of between about 1 nm and about 100 nm.
4. The method of claim 1, wherein the silica nanoparticles have an average diameter of between about 12 nm and about 20 nm.
5. The method of claim 2, wherein the silica nanoparticles have an average diameter of between about 12 nm and about 20 nm.
6. The method of claim 1, comprising the following steps of adding oil well treatment fluids to a well of the oil and gas system in the order given to the well: a) adding an acid; b) adding a fresh water spacer; c) adding the aqueous brine resistant silicon dioxide nanoparticle dispersion pre-pad pill; d) adding a fresh water spacer; and e) inserting a pad of a frac treatment.
7. The method of claim 6, wherein the volume of the aqueous brine resistant silicon dioxide nanoparticle dispersion pre-pad pill is from about 500 to about 1,000 U.S. gallons per about 3,000 to about 6,000 U.S. barrels of the pad of the frac treatment.
8. The method of claim 6, wherein the silica nanoparticles have an average diameter of between about 1 nm and about 100 nm.
9. The method of claim 6, wherein the silica nanoparticles have an average diameter of between about 12 nm and about 20 nm.
10. The method of claim 7, wherein the silica nanoparticles have an average diameter of between about 12 nm and about 20 nm.
11. A method of increasing initial production rates of an oil well, the method comprising adding an aqueous brine resistant silicon dioxide nanoparticle dispersion into the oil well as a pre-pad pill, wherein the aqueous brine resistant silicon dioxide nanoparticle dispersion comprises silica nanoparticles surface modified with trimethoxy[3-(oxiranylmethoxy)propyl] silane in combination with an organosilane selected from 3-(triethoxysilyl)propyl succinic anhydride, 3-(trimethoxysilyl)propyl methacrylate, hexamethyl disiloxane, hexamethyl disilazane, trimethoxy methyl silane, trimethoxy phenyl silane, vinyl trimethoxysilane, 3-(N,N-dimethylaminopropyl)-trimethoxysilane, 3-(diethylamino)propyl trimethoxysilane, trimethoxy(octadecyl)silane, isobutyl trimethoxysilane, hexyltrimethoxysilane, decyltrimethoxysilane, isooctyltrimethoxysilane, hexadecyltrimethoxysilane, propyltrimethoxysilane, and octyltriethoxysilane, and wherein the aqueous brine resistant silicon dioxide nanoparticle dispersion is characterized by having a change in turbidity of less than about 100 NTU after API brine exposure according to an API brine resistance test by use of a turbidimeter.
12. The method of claim 11, further comprising adding a frac stage fluid into the oil well after the pre-pad pill, wherein the volume of the aqueous brine resistant silicon dioxide nanoparticle dispersion pre-pad pill is from about 500 to about 1,000 U.S. gallons per about 3,000 to about 6,000 U.S. barrels of the frac stage fluid.
13. The method of claim 11, wherein the silica nanoparticles have an average diameter of between about 1 nm and about 100 nm.
14. The method of claim 11, wherein the silica nanoparticles have an average diameter of between about 12 nm and about 20 nm.
15. The method of claim 12, wherein the silica nanoparticles have an average diameter of between about 12 nm and about 20 nm.
16. The method of claim 11, comprising the steps of adding oil well treatment fluids to the oil well in the order given to the oil well: a) adding an acid; b) adding a fresh water spacer; c) adding the aqueous brine resistant silicon dioxide nanoparticle dispersion pre-pad pill; d) adding a fresh water spacer; and e) inserting a pad of a frac treatment.
17. The method of claim 16, wherein the volume of the aqueous brine resistant silicon dioxide nanoparticle dispersion pre-pad pill is from about 500 to about 1,000 U.S. gallons per about 3,000 to about 6,000 U.S. barrels of the pad of the frac treatment.
18. The method of claim 16, wherein the silica nanoparticles have an average diameter of between about 1 nm and about 100 nm.
19. The method of claim 16, wherein the silica nanoparticles have an average diameter of between about 12 nm and about 20 nm.
20. The method of claim 17, wherein the silica nanoparticles have an average diameter of between about 12 nm and about 20 nm.
Description
CROSS-REFERENCE TO RELATED PATENT APPLICATIONS
[0001] This patent application is a continuation of U.S. patent application Ser. No. 16/179,676, filed Nov. 2, 2018, which claims priority to U.S. Provisional Patent Application No. 62/581,331, filed Nov. 3, 2017, the content of each of which is incorporated herein by reference in its entirety.
FIELD OF THE INVENTION
[0002] This invention is in the field of enhanced oil recovery using specialized fluids with additives.
BACKGROUND OF THE INVENTION
[0003] It is known to use Colloidal Silica Gels to improve oil reservoir fluid-flow control. See: "Oilfield Applications of Colloidal Silica Gel", by Jurinak and Summers, SPE Production Engineering, November 1991, ppgs 406-412. "Colloidal Silica" refers to stable aqueous dispersion of discrete nonporous particles of amorphous silicon dioxide (SiO.sub.2). Concentrated commercial sols are stable at moderate pH and at high silicon dioxide/alkali ratios because of silica particle repulsion resultion from surface ionization in alkaline solution. Particle collision, bonding, and aggregation into long-chain networks are believed to cause colloidal silica to gel. Gelation occurs when particle aggregation ultimately forms a uniform 3D network of long, bead-like strings of silica particles. (page 406 of Jurinak and Summers). Gelled colloidal silica has been used in oil fields to plug pathways that the operator of the field wanted to shut off. Thus, it is known to created colloidal silica that will gel and remain gelled and use that in oil fields to block areas so that fluids cannot flow through those areas.
[0004] Since introducing nano-technology to the industry in the form of improved surfactant chemistry (see P. McElfresh, D. Holcomb, D. Ector; "Application of Nanofluid Technology to Improve Recovery in Oil and Gas Wells," SPE 154827, (2012).), technology has continued to advance, usually in the form of nano-emulsion surfactants for use in hydraulic fracturing operations.
[0005] It would be desirable to have a new nano-particle technology for the petroleum industry to showcase an economical method for improving initial producing rate, ultimate recovery, and overall project economics.
[0006] What is needed is a way to create and use colloidal silica sols that can enhance the flow of oil and gas through a hydrocarbon field.
SUMMARY OF THE INVENTION
[0007] The first aspect of the instant claimed invention is a method of extending an oil and gas system effective stimulated reservoir volume comprising the steps of adding a Brine Resistant Silicon Dioxide Nanoparticle Dispersion to conventional oil well treatment fluids.
[0008] The second aspect of the instant claimed invention is a method of increasing initial production rates of an oil well by over 20.0% as compared to wells either not treated with the Brine Resistant Silicon Dioxide Nanoparticle Dispersion technology or treated by conventional nano-emulsion surfactants comprising the steps of adding a Brine Resistant Silicon Dioxide Nanoparticle Dispersion to conventional oil well treatment fluids.
[0009] The third aspect of the instant claimed invention is the method of the first aspect of the instant claimed invention in which the pill volume is typically from about 500 to about 1,000 U.S. gallons of Brine Resistant Silicon Dioxide Nanoparticle Dispersion per about 3,000 to about 6,000 barrels (U.S.) of frac stage fluid.
[0010] The fourth aspect of the instant claimed invention is the method of the second aspect of the instant claimed invention in which the pill volume is typically from about 500 to about 1,000 U.S. gallons of Brine Resistant Silicon Dioxide Nanoparticle Dispersion per about 3,000 to about 6,000 barrels (US) of frac stage fluid.
[0011] The fifth aspect of the instant claimed invention is the method of the first aspect of the instant claimed invention, in which the order of addition of oil well treatment fluids to the well is as follows:
a) Adding the acid; b) Adding the fresh water spacer; c) Adding a BRINE RESISTANT SDND pill; d) Adding a fresh water spacer and e) Inserting the pad of the frac treatment.
[0012] The sixth aspect of the instant claimed invention is the method of the second aspect of the instant claimed invention in which the order of addition of oil well treatment fluids to the well is as follows:
a) Adding the acid; b) Adding the fresh water spacer; c) Adding a BRINE RESISTANT SDND pill; d) Adding a fresh water spacer and e) Inserting the pad of the frac treatment.
[0013] The BRINE RESISTANT SDND technology described and claimed in this patent application is revolutionary in the fact that it is not surfactant based but rather a Brine Resistant Silicon Dioxide Nanoparticle Dispersion ("BRINE RESISTANT SDND") based. However, due to the advanced physical processes associated with this technology, such as Brownian motion driven diffusion and disjoining pressure, the BRINE RESISTANT SDND results in many reservoir flow dynamics usually associated with the nano-emulsion surfactants, such as increased flowback of the fracture stimulation fluid. The BRINE RESISTANT SDND has been pumped in many different formations and basins across the U.S., including the Permian Basin (Midland and Delaware sub-basins), the DJ Basin, the Codell-Niobrara Shale, and the Bakken in the Williston Basin. Production data from all treated basins continue to show improved initial production rates verifying the chemistry as independent of lithology.
BRIEF DESCRIPTION OF THE FIGURES
[0014] FIG. 1 illustrates the BRINE RESISTANT SDND Mechanism for Improved Hydrocarbon Recovery
[0015] FIG. 2 illustrates BRINE RESISTANT SDND Fracture Network Extension
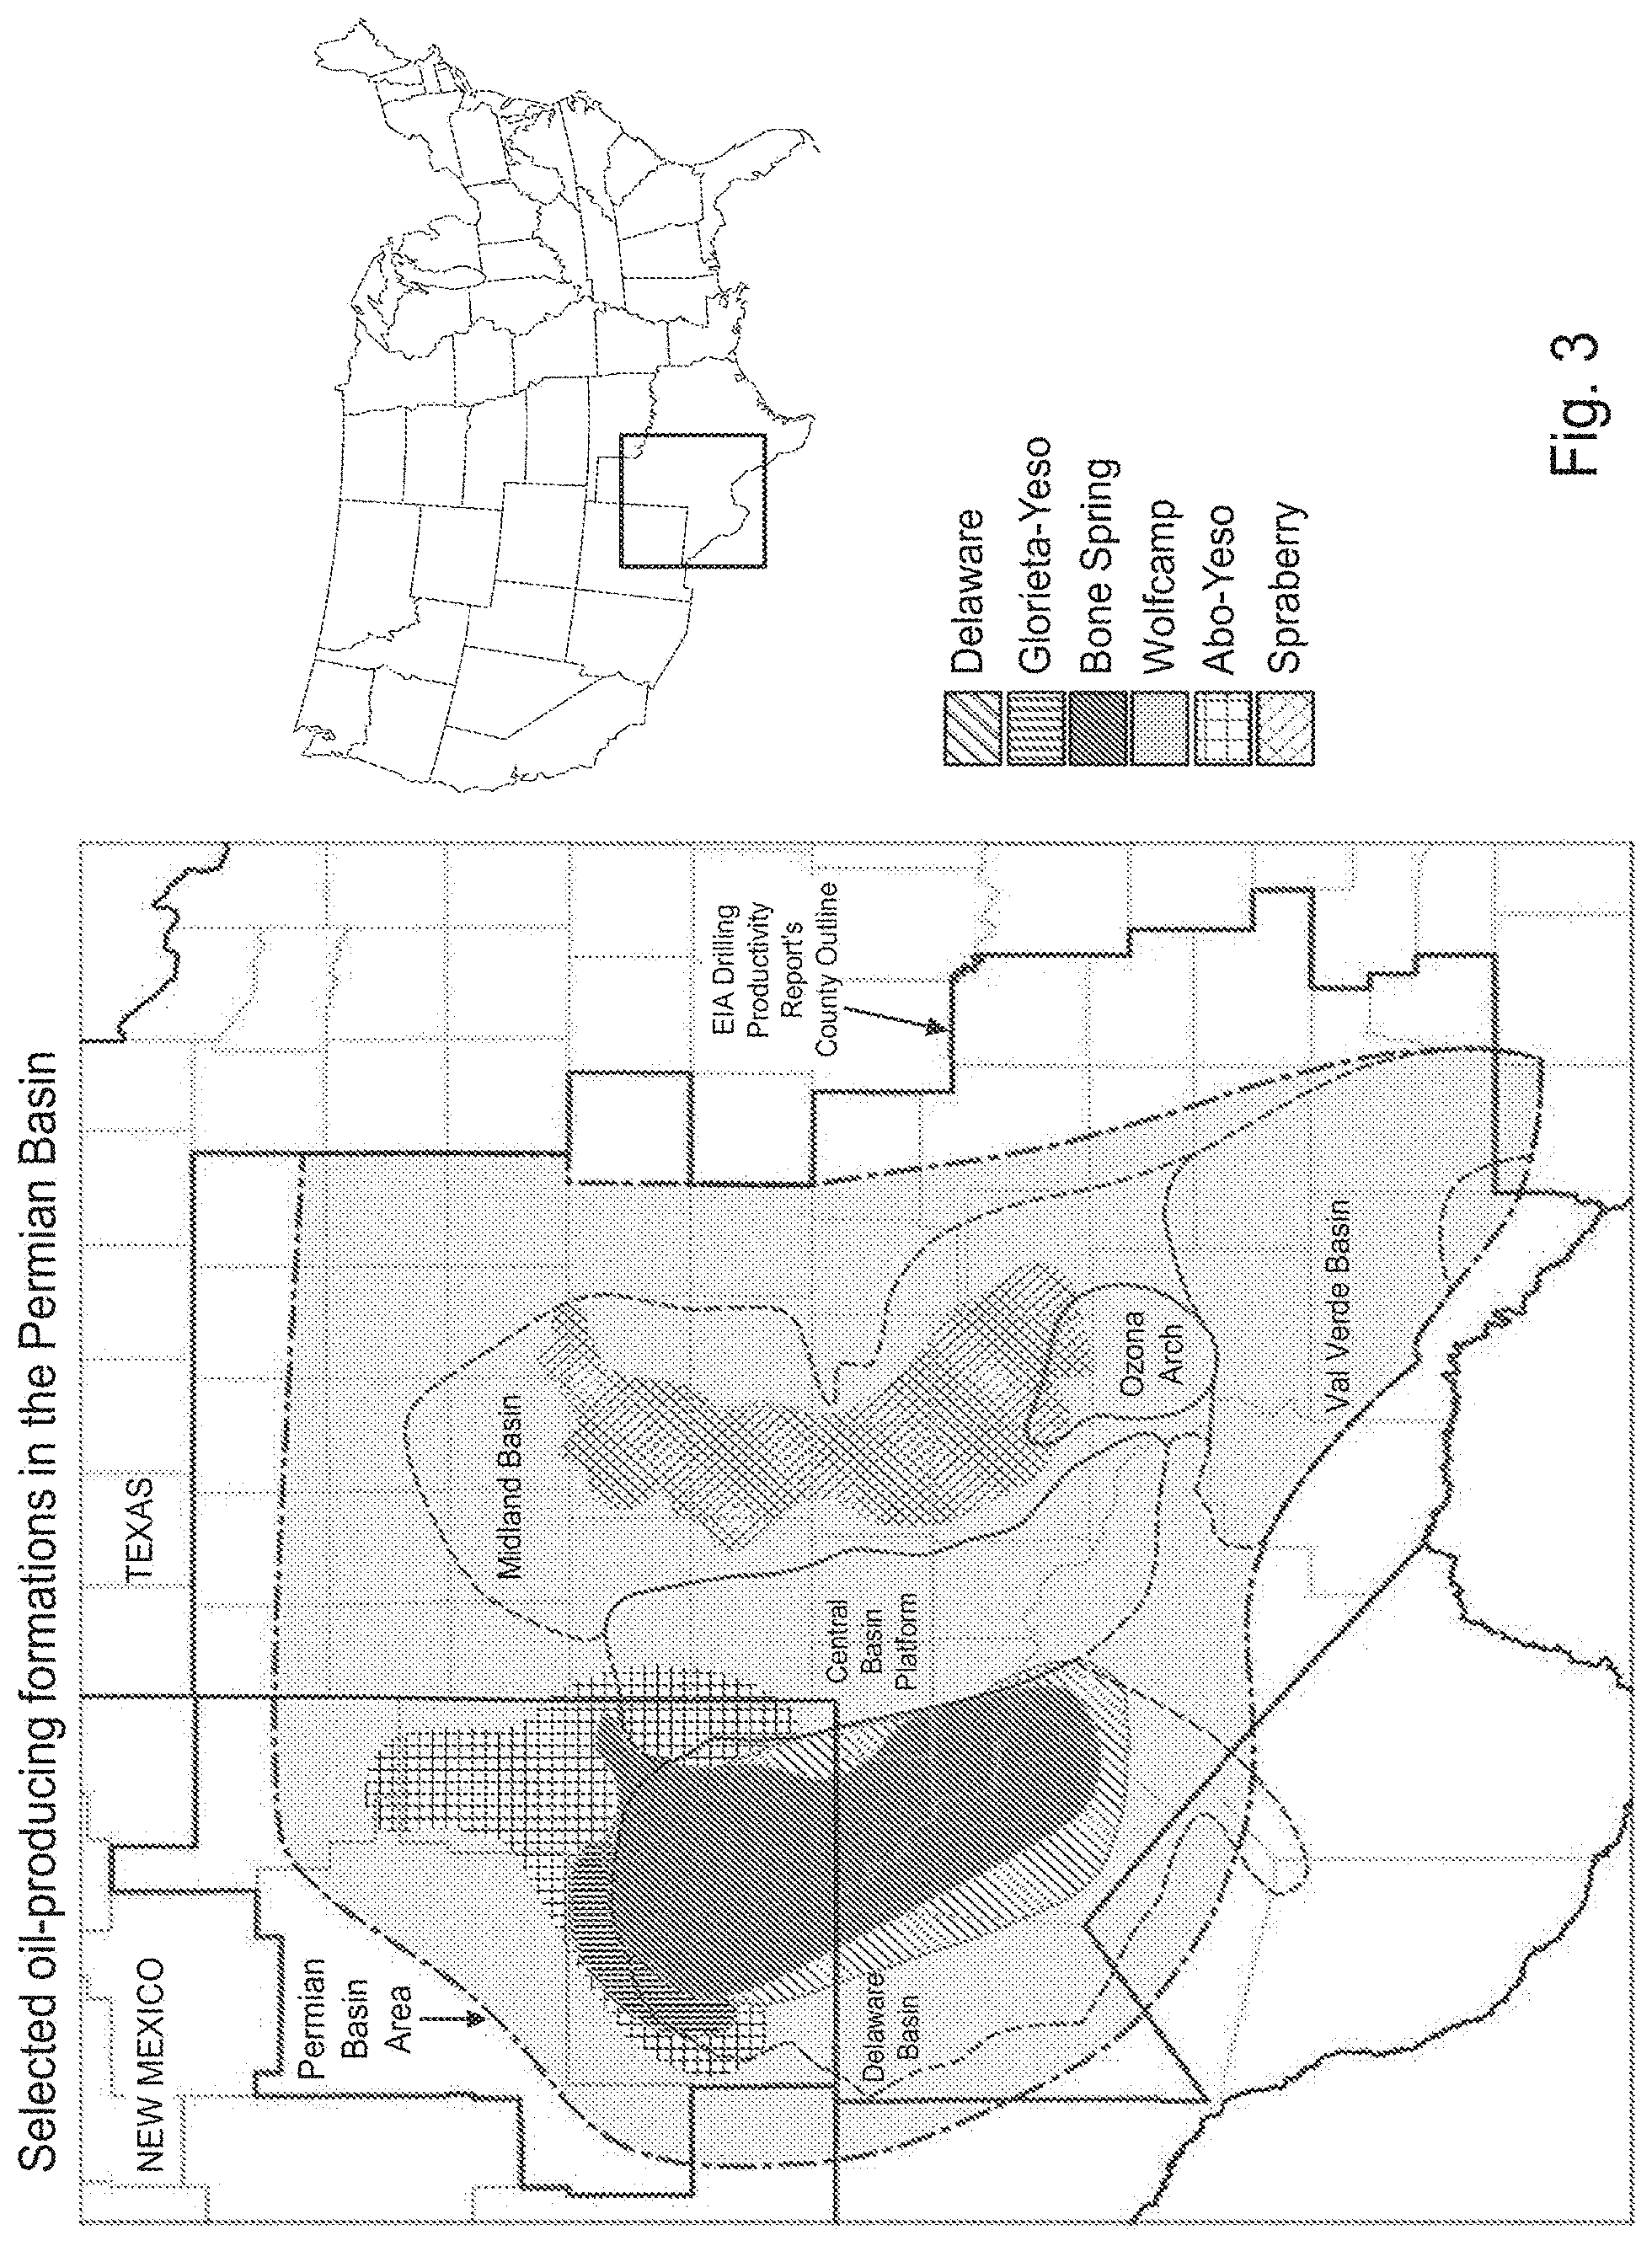
[0016] FIG. 3 illustrates a Map showing the Location of the Greater Permian Basin and Major Producing Formations
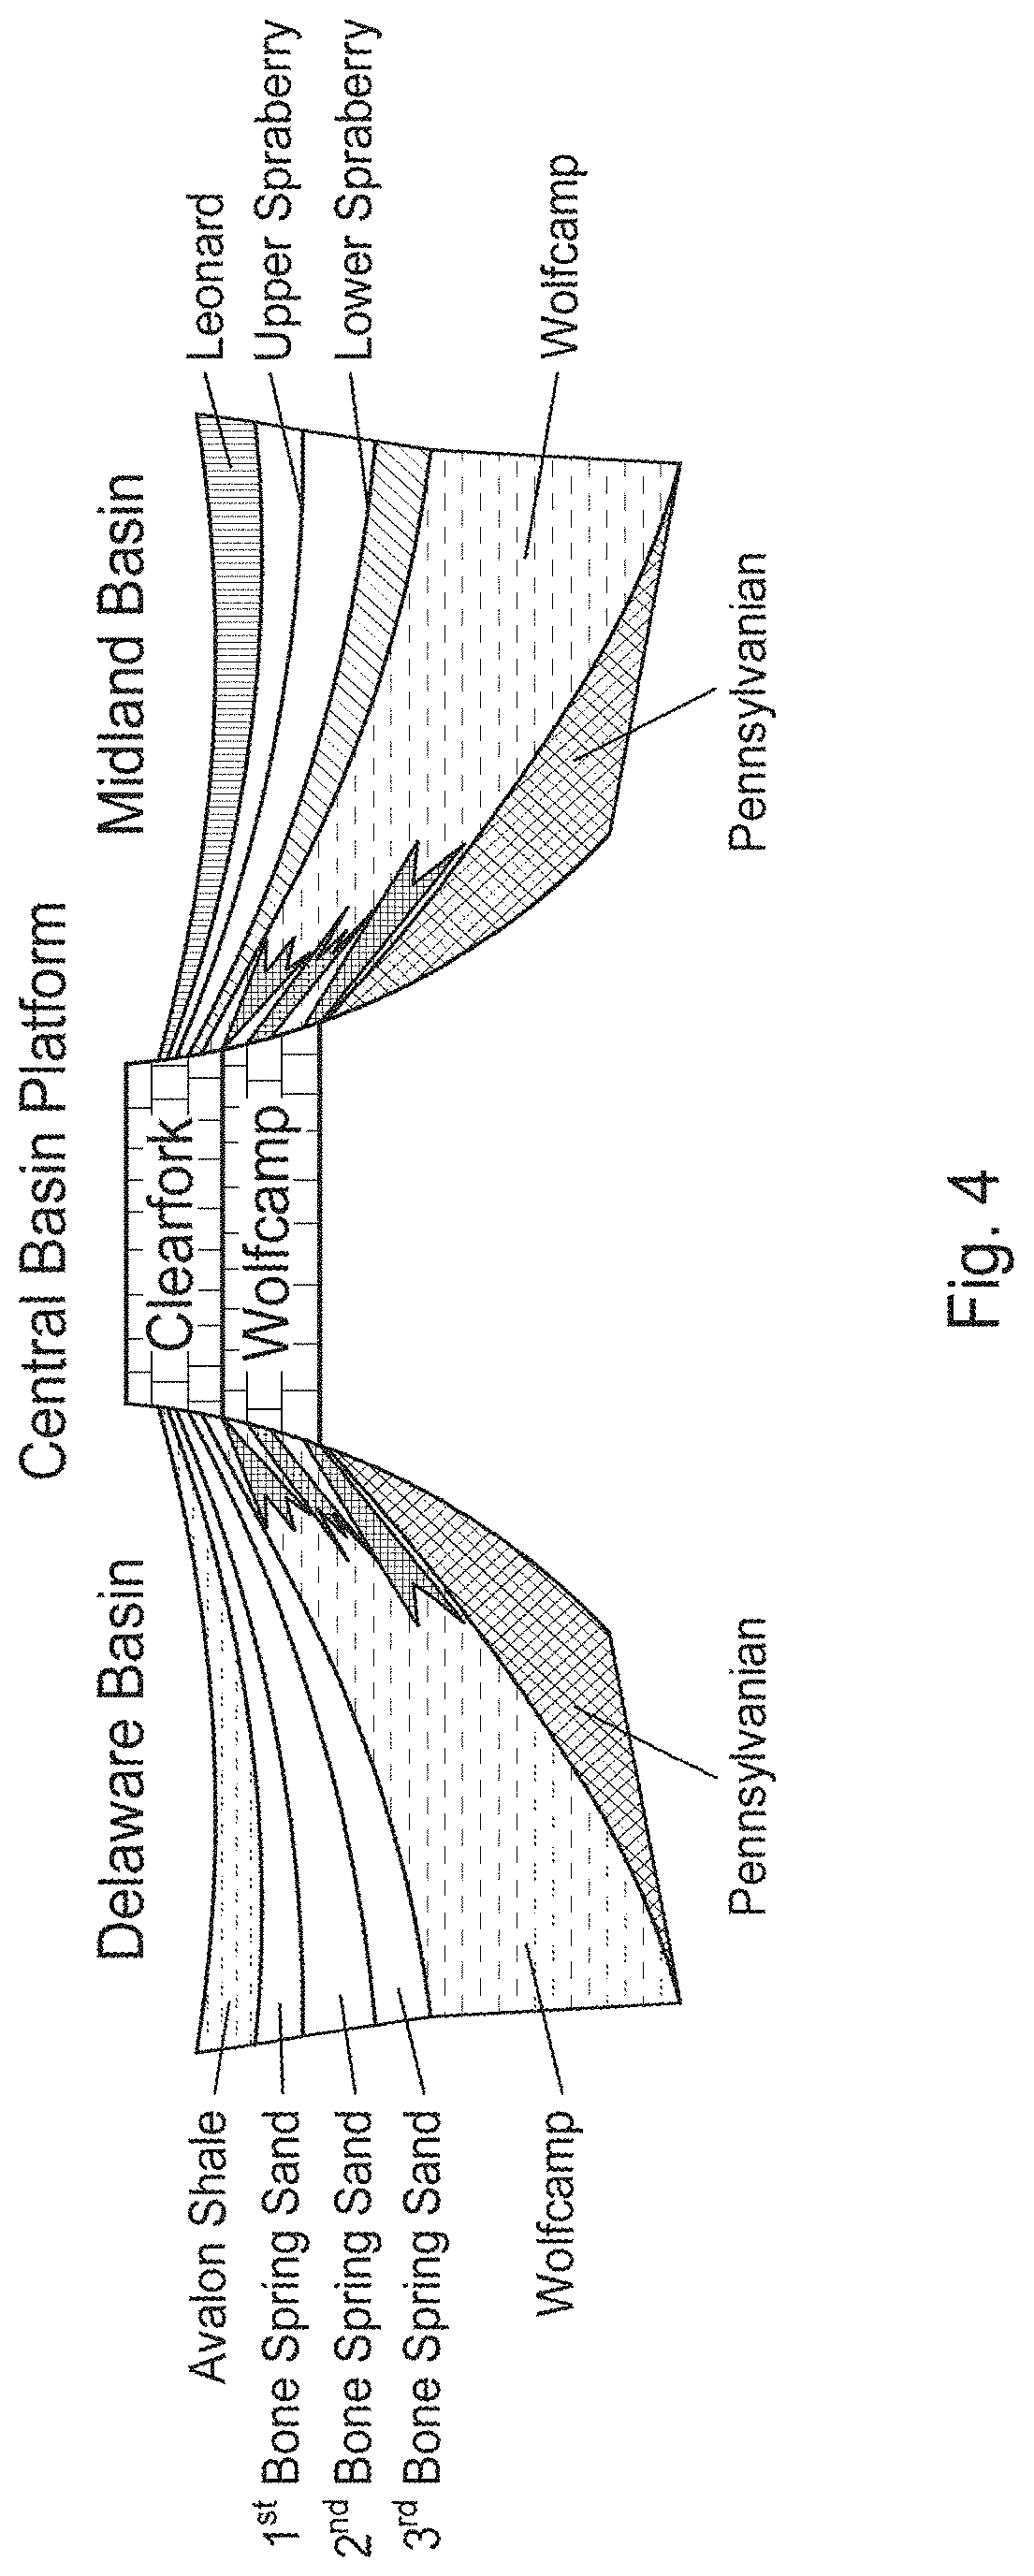
[0017] FIG. 4 illustrates a Permian Basin Geologic Cross-Section
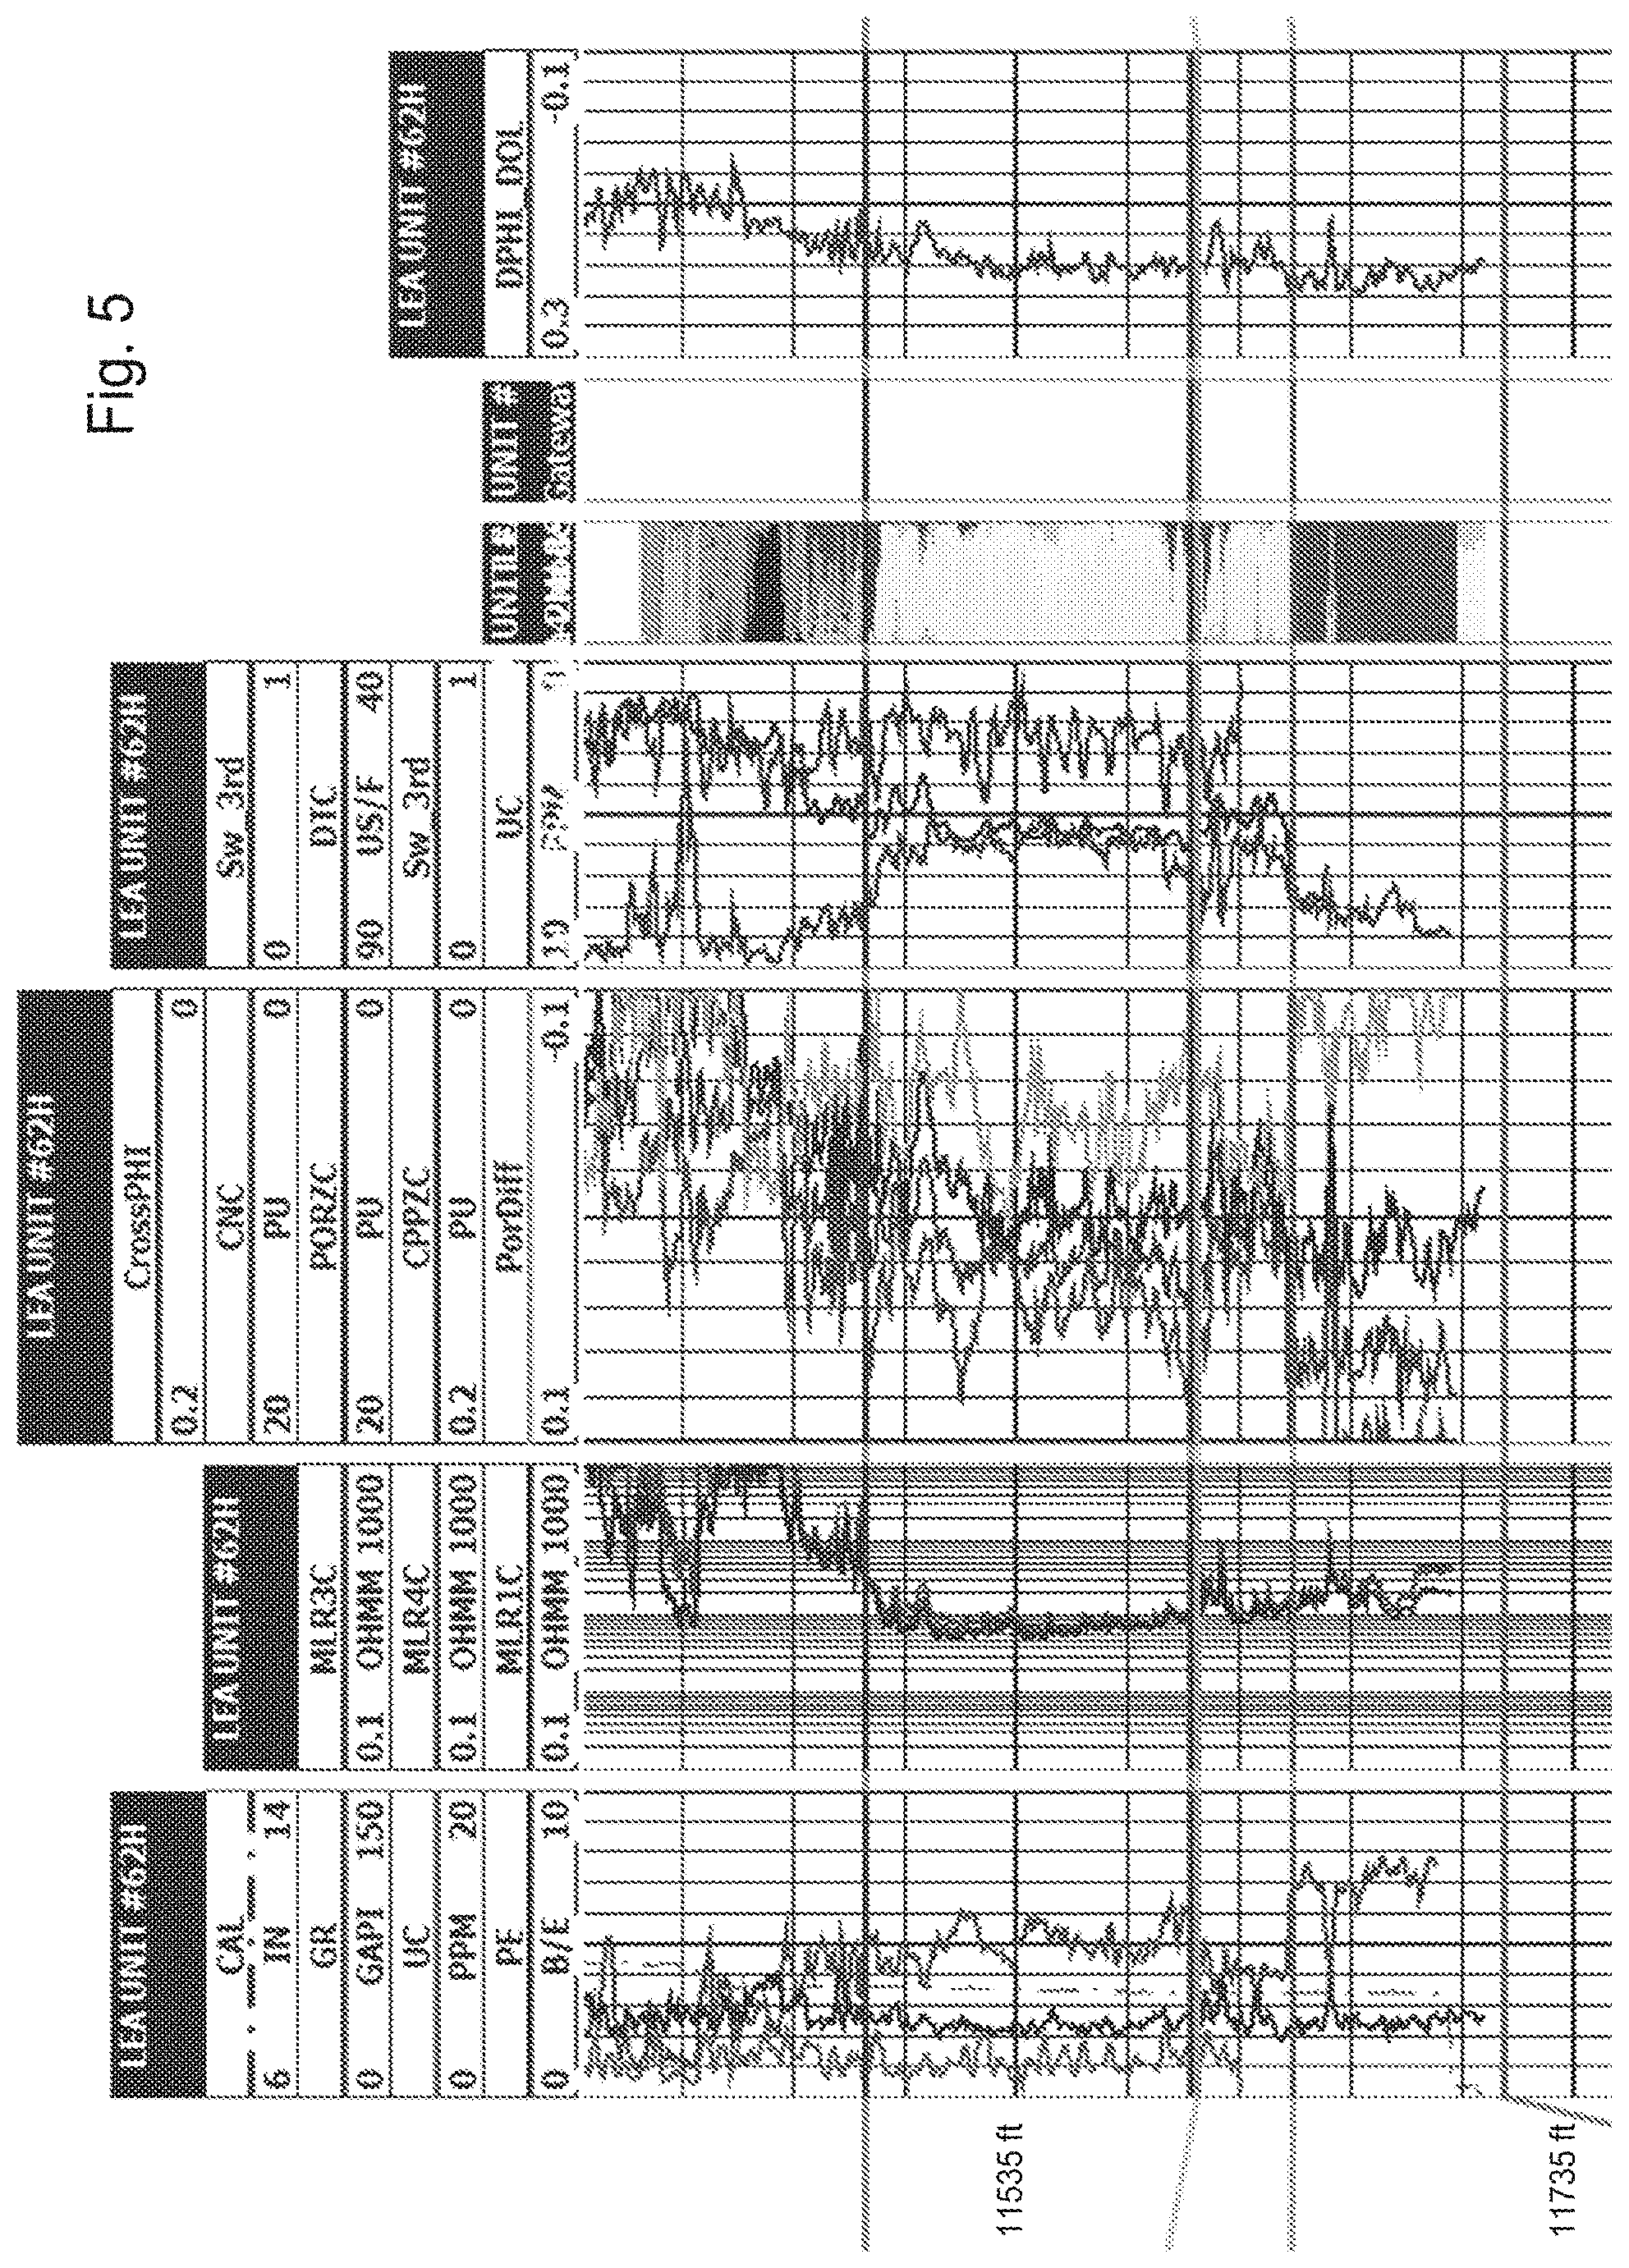
[0018] FIG. 5 shows a Cross-Section of the 3.sup.rd Bone Spring, Lea County, N. Mex.
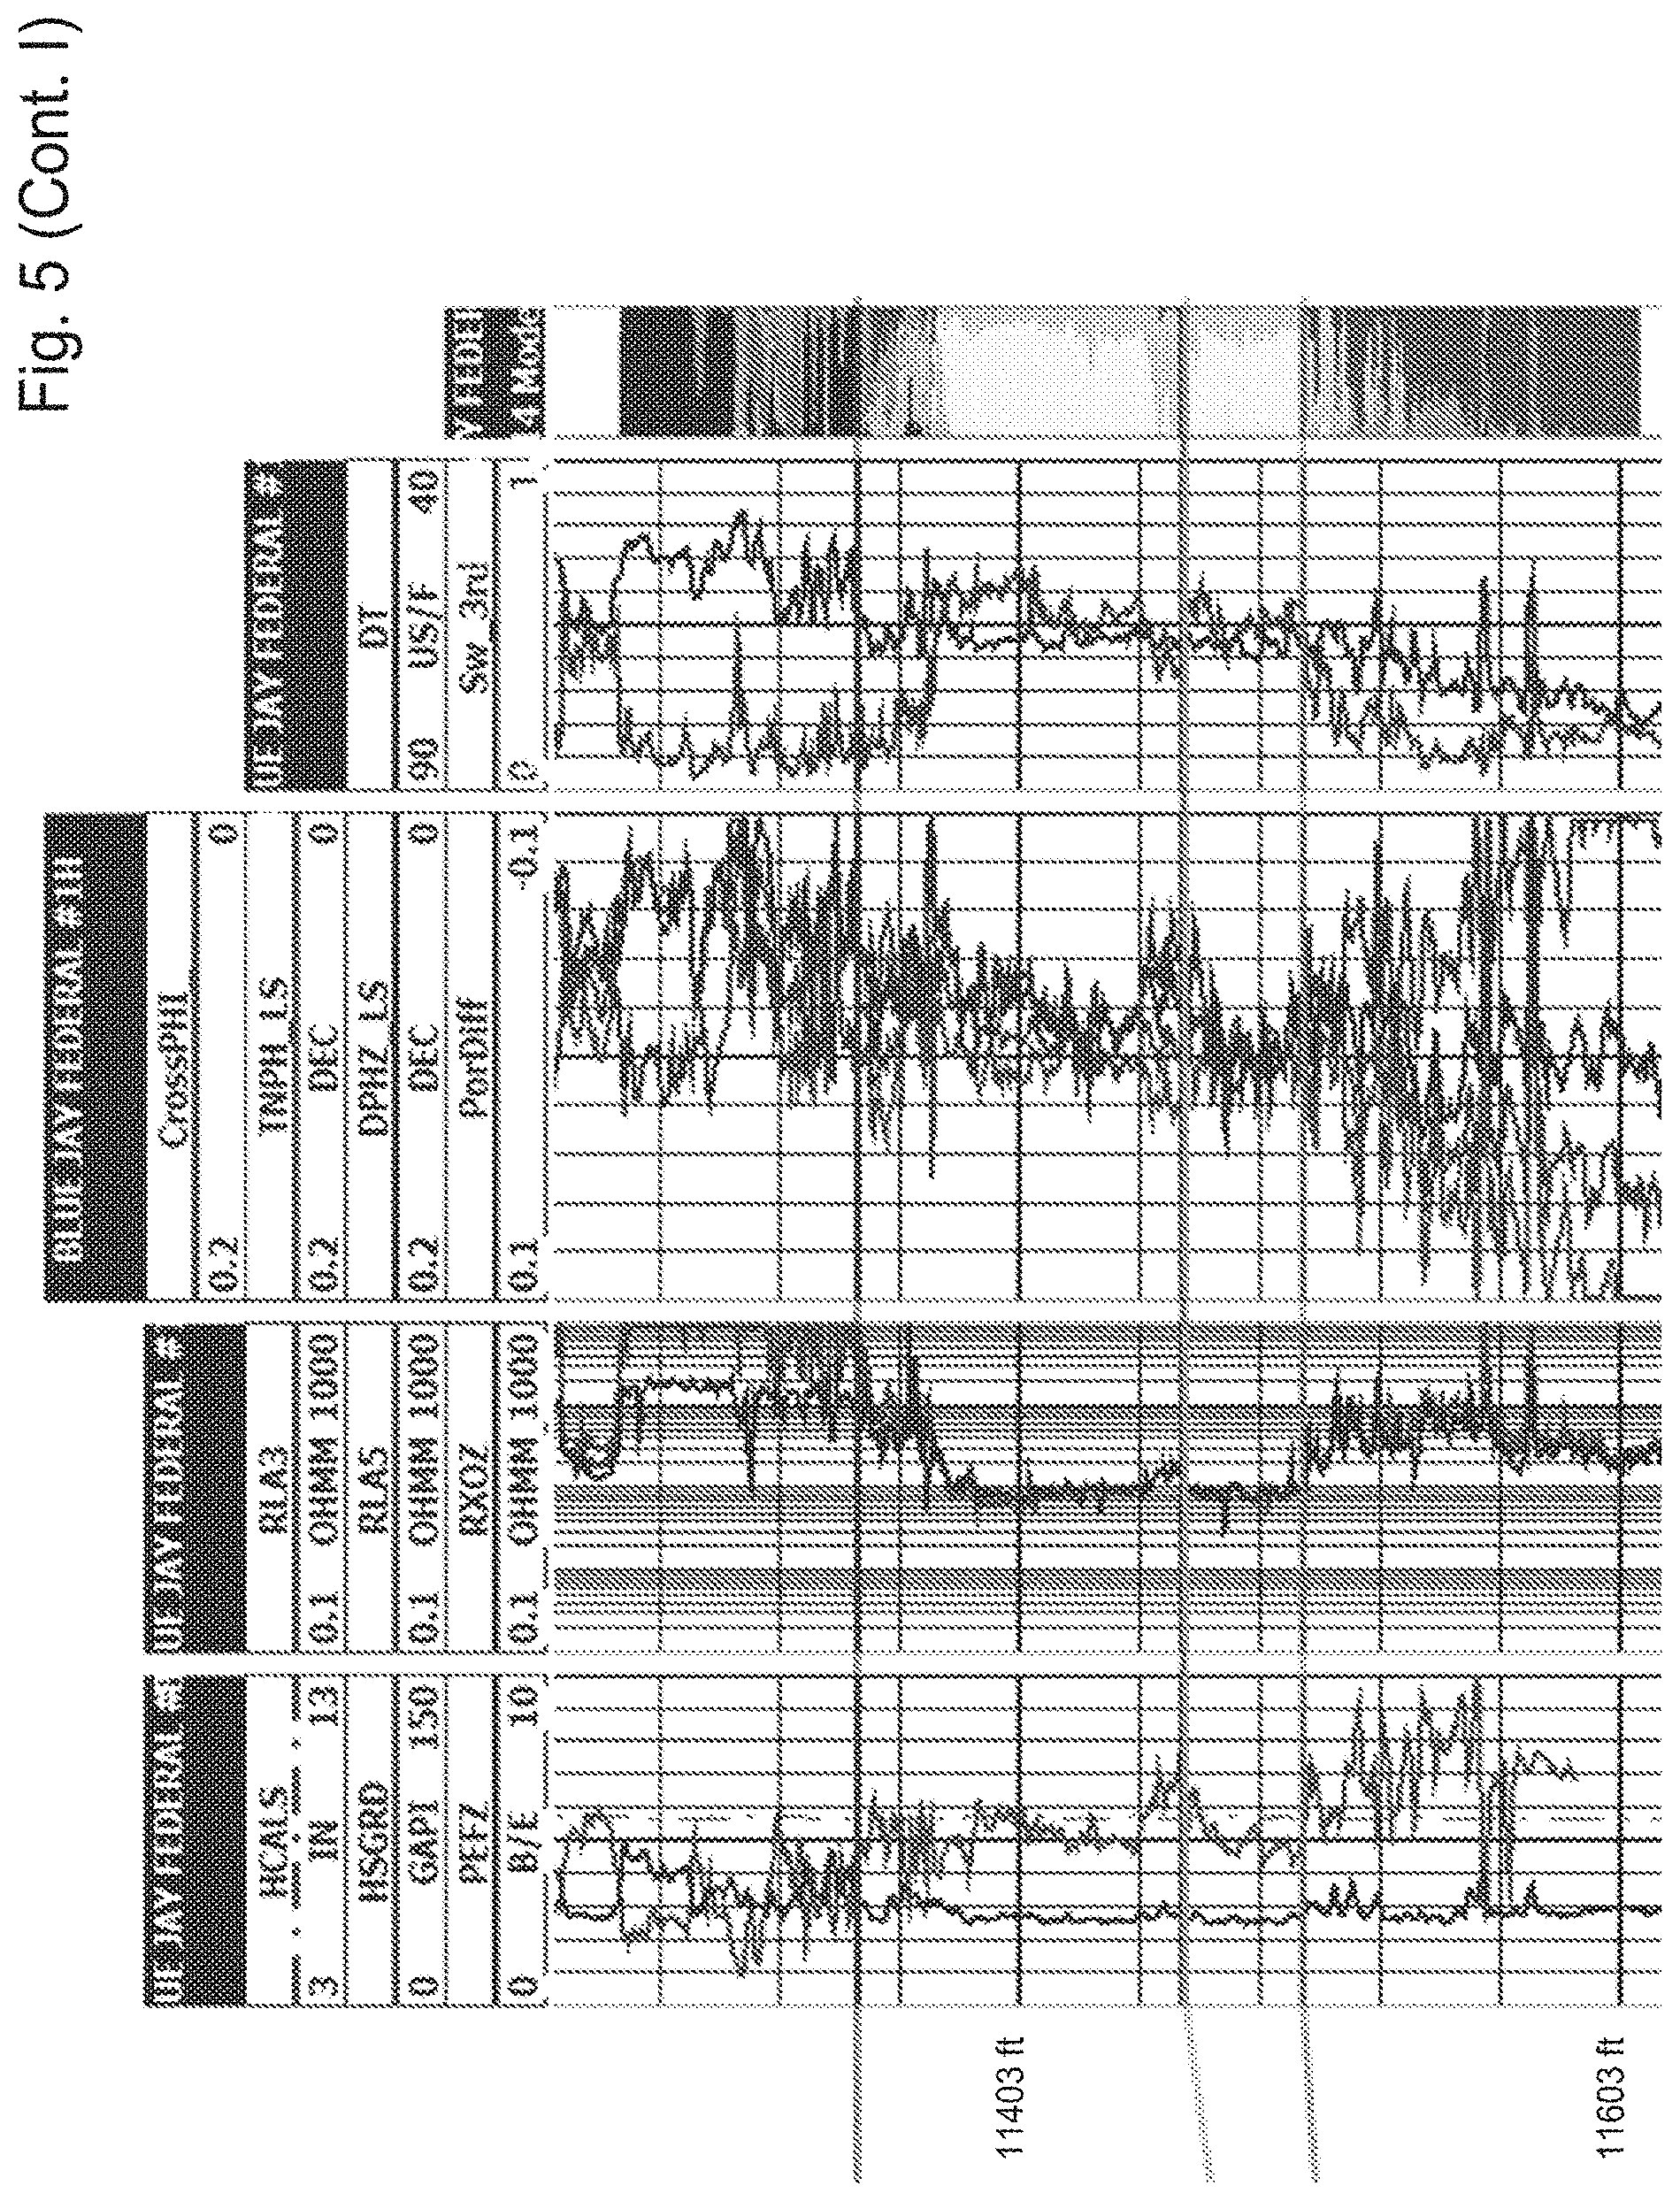
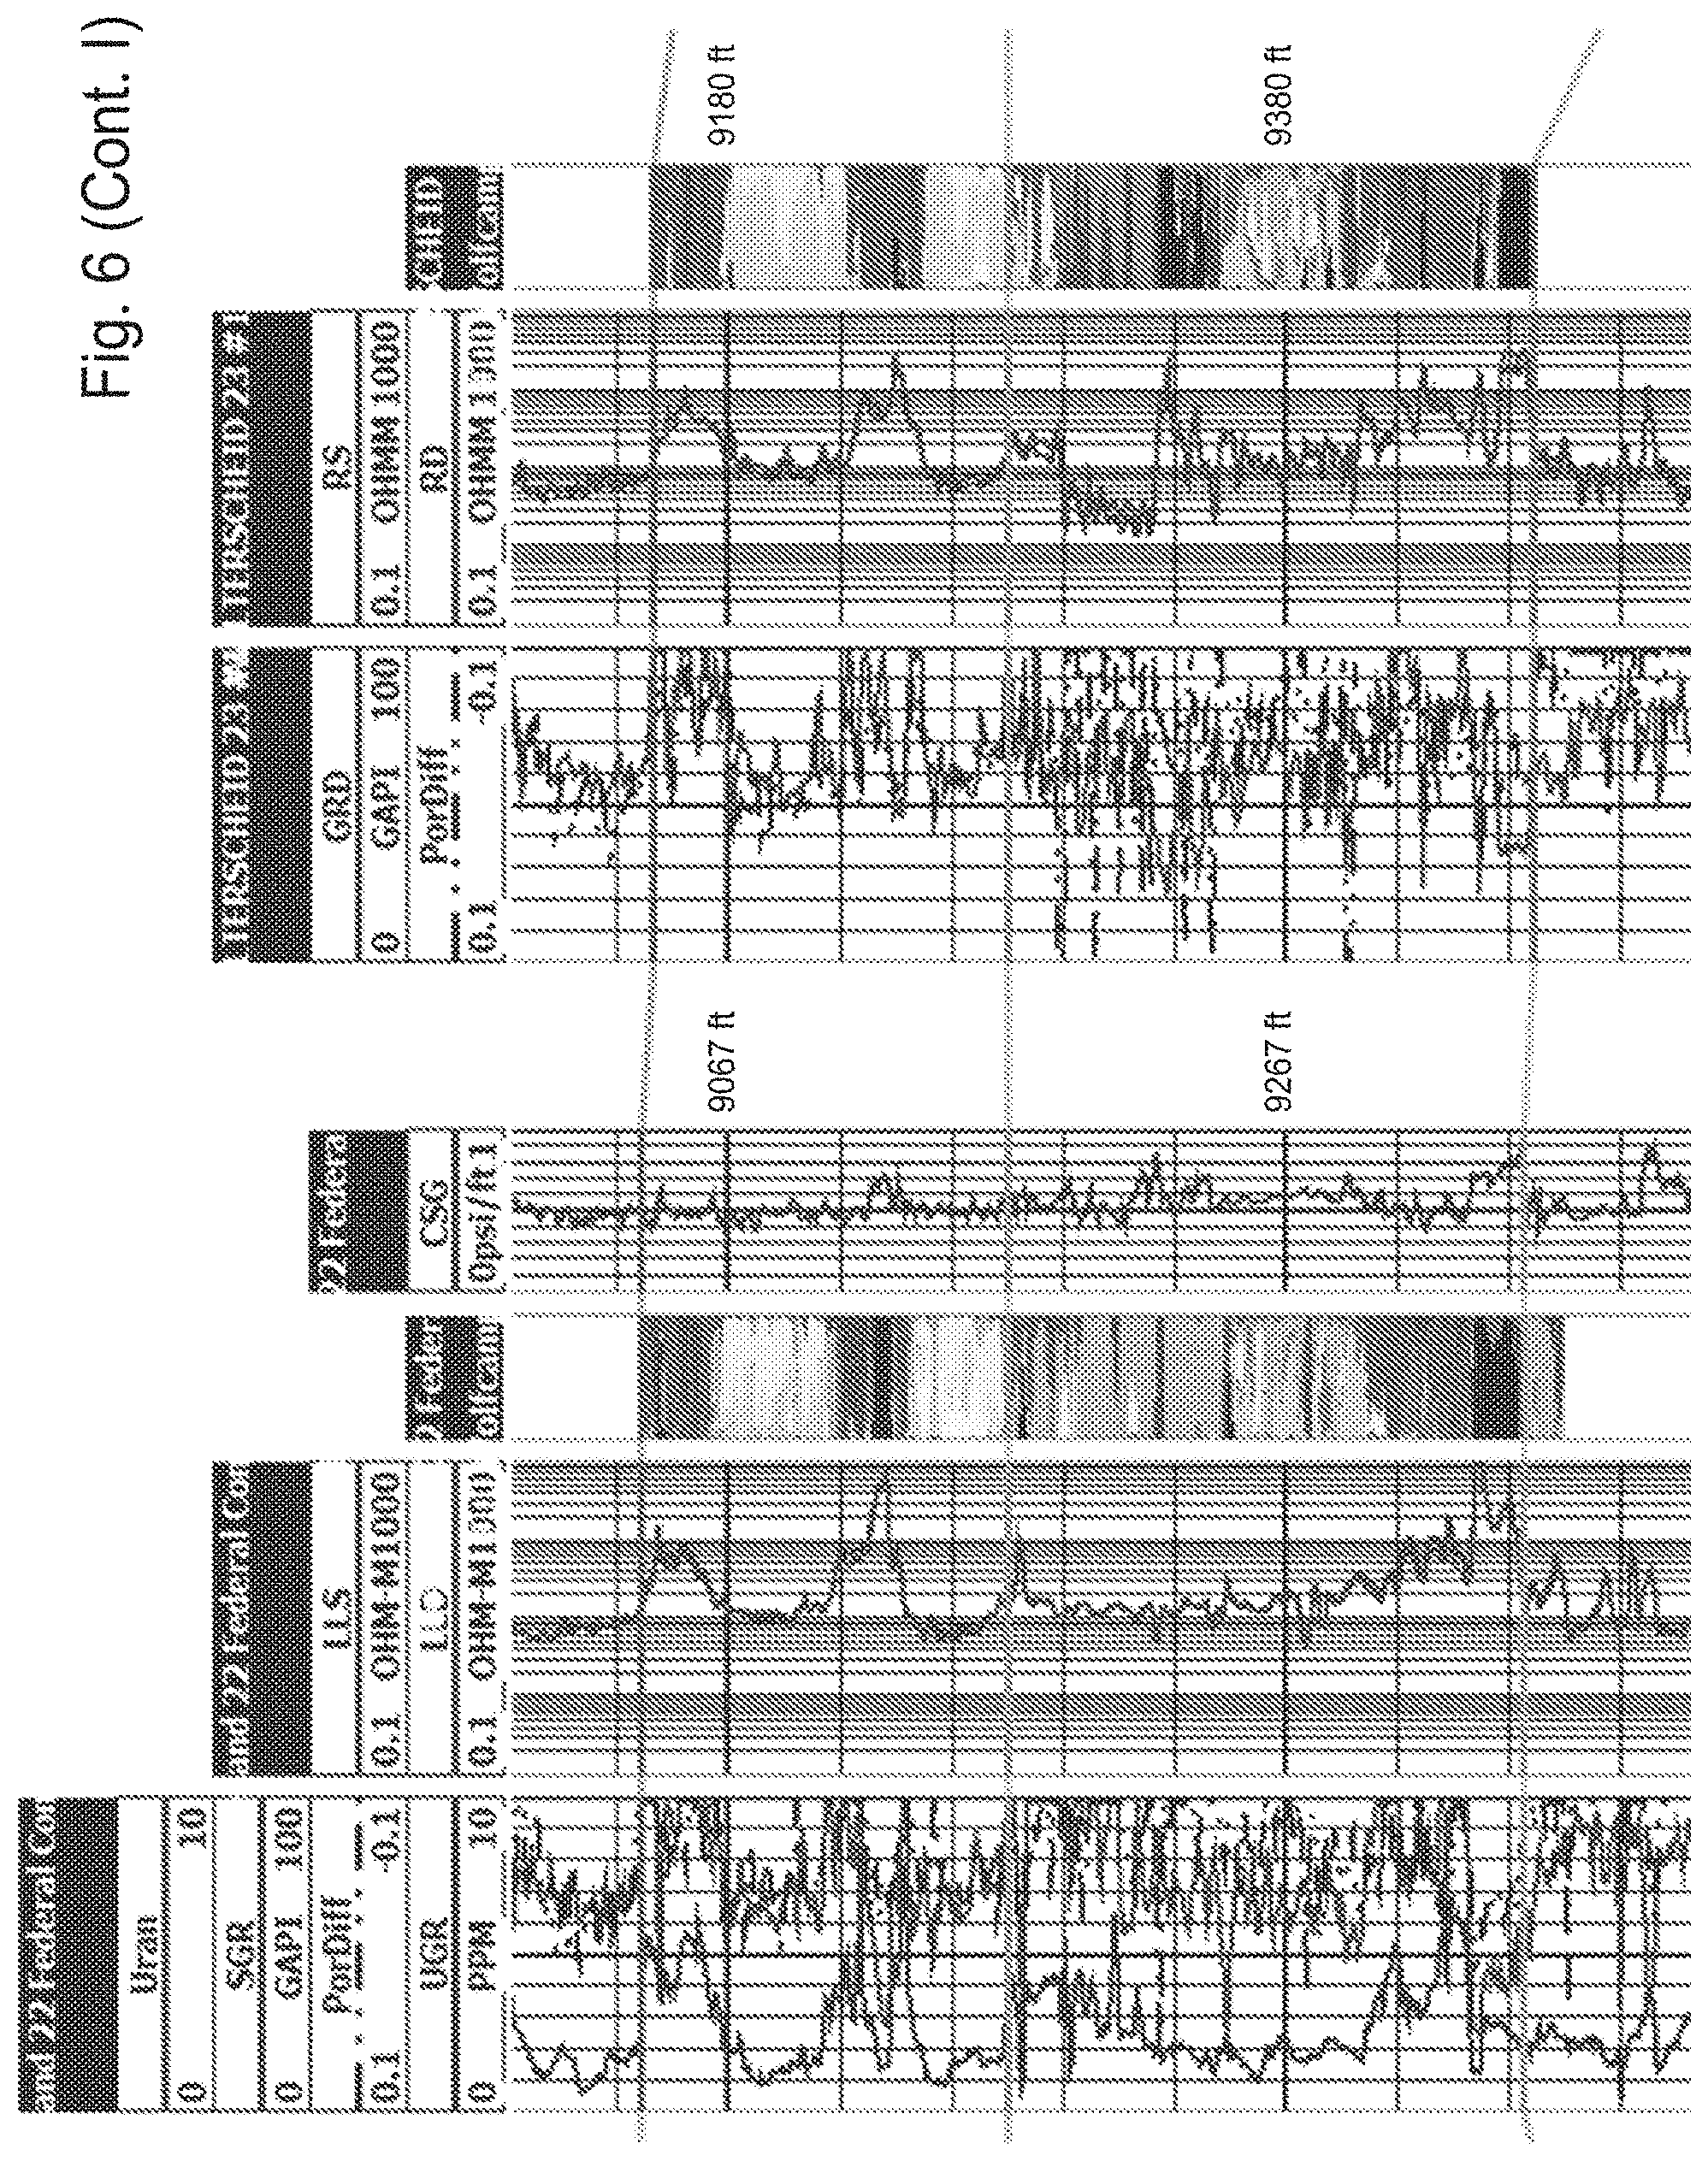
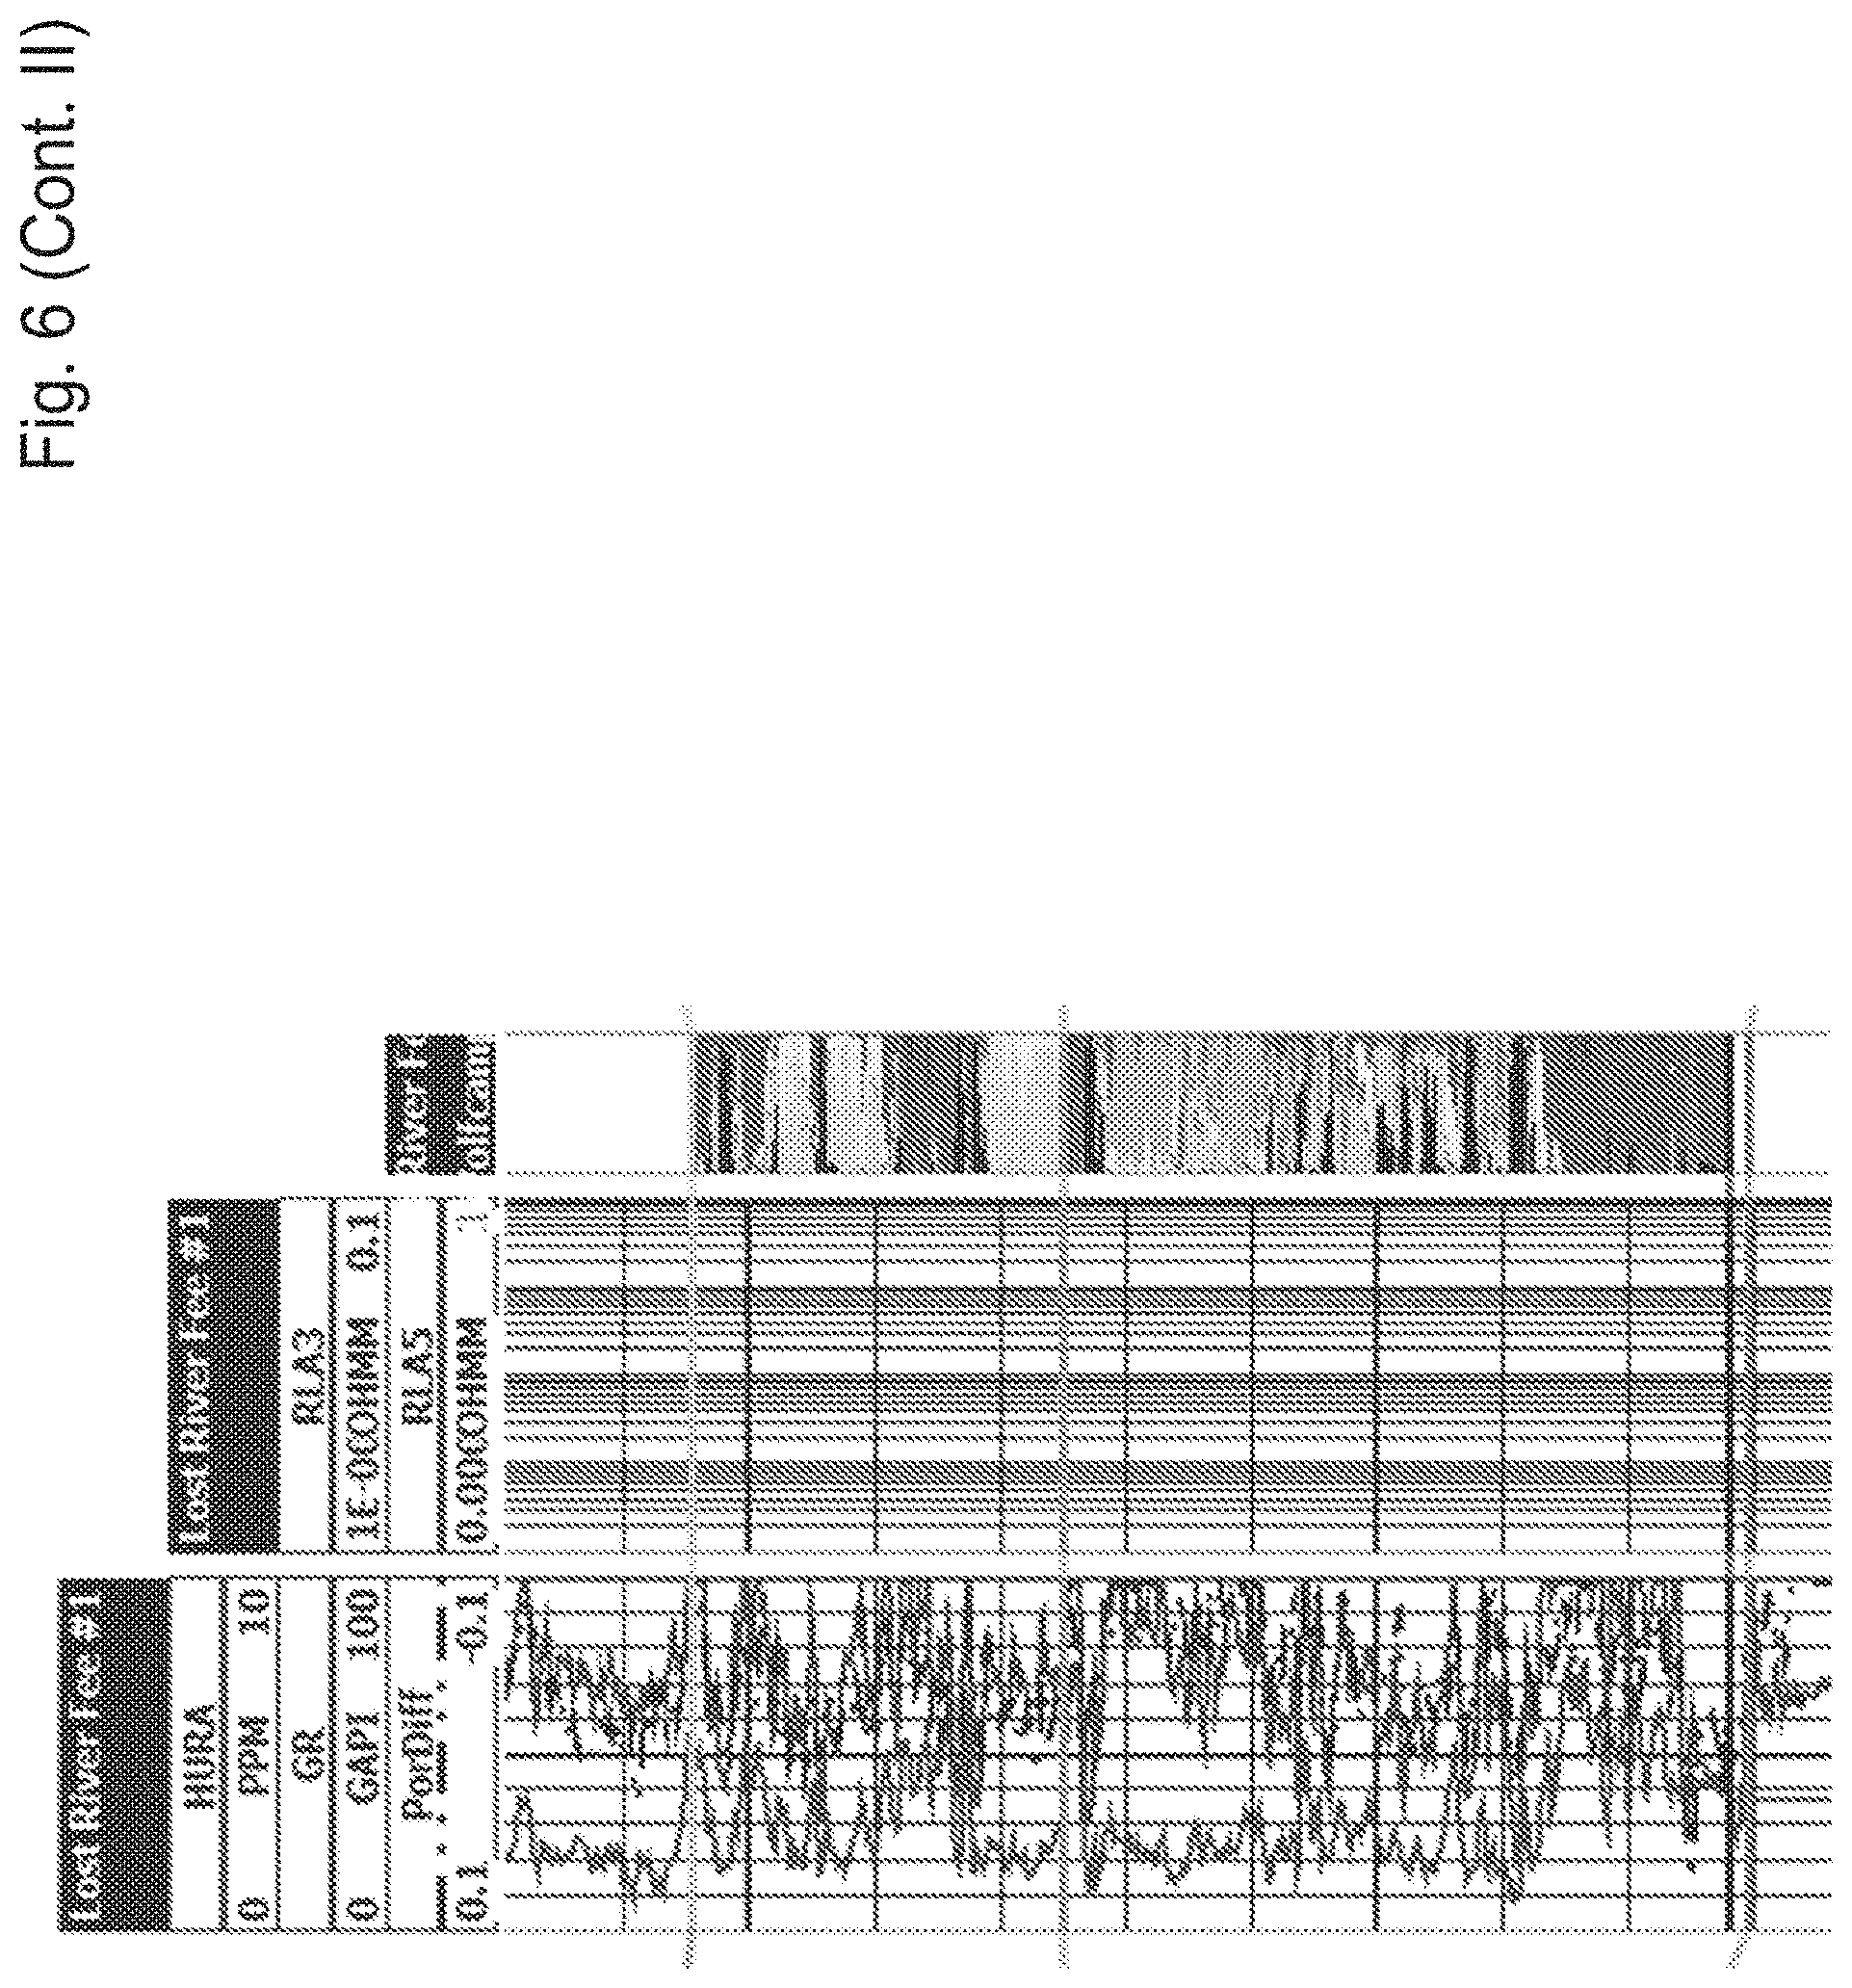
[0019] FIG. 6 shows a Cross-Section of the Top of Wolfcamp Formation, Eddy County, N. Mex.
[0020] FIG. 7 shows a Cross-Section of the Top of Wolfcamp X-Y Formation, Eddy County, N. Mex.
[0021] FIG. 8 shows a Cross-Section of the Top of Wolfcamp B Formation, Eddy Country, N. Mex.
[0022] FIG. 9 shows Well A-1: Actual Daily Oil and Gas Production
[0023] FIG. 10 Well A-1: Wolfcamp B Type Curve Production (120 Months)
[0024] FIG. 11 Well A-1: Actual Production Versus Type Curve
[0025] FIG. 12 Well A-2: Actual Daily Oil and Gas Production
[0026] FIG. 13 Well A-2 & Well A-3: Wolfcamp X-Y Type Curve Production (120 Months)
[0027] FIG. 14 Well A-2: Actual Production Versus Type Curve
[0028] FIG. 15 Well A-3: Actual Daily Oil and Gas Production
[0029] FIG. 16 Well A-2: Actual Production Versus Type Curve
[0030] FIG. 17 Well B-1: Actual Daily Oil and Gas Production
[0031] FIG. 18 Well B-1: 3.sup.rd Bone Spring Type Curve Production (120 months)
[0032] FIG. 19 Well B-1: Actual Production Versus Type Curve
[0033] FIG. 20 Well B-2: Actual Daily Oil and Gas Production
[0034] FIG. 21 Well B-2: 2.sup.nd Bone Spring Type Curve Production (120 months)
[0035] FIG. 22 Well B-2: Actual Production Versus Type Curve
DETAILED DESCRIPTION OF THE INVENTION
[0036] Throughout this patent application the following abbreviations have the indicated meanings.
[0037] BOE Barrels of Oil, Equivalent, wherein one barrel of oil equivalent is the energy released through the burning of one barrel of oil. Because it can be used to express amounts of both oil and gas, the barrel of oil equivalent is commonly used in financial statements by fuel companies.
[0038] BPM Barrels per Minute, wherein an oil barrel is defined as 42 US gallons which is about 35 imperial gallons. In Canada, oil companies measure oil in cubic metres but convert to barrels on export, since most of Canada's oil production is exported to the U.S.
[0039] ESRV effective stimulated reservoir volume
[0040] IRR Internal Rate of Return, %
[0041] Mgal Gallons, Thousands
[0042] Mlbs Pounds, Thousands
[0043] Mscf Thousand Standard Cubic Feet
[0044] MMscf Million Standard Cubic Feet
[0045] MSTB Stock Tank Barrels, Thousands
[0046] NPV Net Present Value
[0047] ppg Pounds per Gallon BRINE RESISTANT SDND Brine Resistant Silicon Dioxide Nanoparticle Dispersion
[0048] STB Stock Tank Barrel
[0049] SPUD Make the Initial Drilling for an Oil Well
[0050] TVD True Vertical Depth, ft
[0051] Colloidal Silica Nanoparticle dispersions provide a unique enabling mechanism to improve the efficiency of fluids and additives in the performance of their intended actions during several reservoir intervention applications. A wide range of applications for nanotechnology utilizing the mechanism of disjoining pressure have been investigated. The mechanism improves the removal of discontinuous phases such as oil, gas, damaging material like paraffin, polymer, biofilm, or scale from the rock substrate to improve production through nano- and micro-darcy fractures. Fluid systems can be specifically designed for each of these applications by selecting various particles, with or without surface modifications, or with alterations to the ionic nature of the carrier fluid.
[0052] This patent application is intended not only to introduce and explain a new nano-particle technology to the petroleum industry but to showcase an economical method for improving initial producing rate, ultimate recovery, and overall project economics.
[0053] The key component of the new nano-particle technology is "brine-resistant colloidal silica".
[0054] Colloidal silica is known to be electrostatically stabilized by surface charge, where like charges at the silica particle surface repel the like charges of other particles leading to a stable dispersion--this is part of the definition of a colloidal dispersion. In briny water, where the water/dispersant contains dissolved salt ions, colloidal particles experience a disruption or shielding of particle surface charge leading to a reduction in particle-to-particle repulsion and reduced colloidal stability.
[0055] It is known to surface-treat colloidal silica to try to avoid the loss of stability caused when the colloid encounters disruptive conditions, such as brine. However, it is known that some surface treated silica is more brine resistant than others.
[0056] With regards to brine resistance of colloidal silica, it is believed without being bound thereby, that the hydrophilicity/hydrophobicity of the surface treatment is important as well as the amount of surface treatment relative to the available silica surface area.
[0057] Organic surface treatment can improve colloidal silica stability in brine/high salinity water by addition of steric repulsion properties to supplement electrostatic repulsion between particles. Hydrophilic organic surface treatment is somewhat effective at adding this steric repulsion property for improved brine resistance. A combination of Hydrophilic and Hydrophobic surface treatment in the correct proportion can also form highly brine resistant surface treatment systems for colloidal silica--this is a necessity for the success of the described invention.
[0058] Adding some Hydrophobic character to colloidal silica is known in Organic solvent systems. However, this is difficult to achieve in Aqueous systems. This is because, hydrophobic character by definition is water-hating and not prone to solubility or stability in water. It is desirable in this work to add organic surface treatment to colloidal silica having a combination of Hydrophilic and Hydrophobic character--where the silica has both excellent brine stability and the ability to perform well in removing oil from rock surfaces. Combining Hydrophilic and Hydrophobic character is well known in surfactant science but is not well known in organic surface treatment for colloidal silica.
[0059] Some surface-treated colloidal silica for use downhole is not suitable in this invention. A repeated example from U.S. Pat. No. 7,033,975 assigned to 3M Innovative Properties Ltd., using the described surface treatment material and method, was not stable in water due to what is believed to be excessive Hydrophobic character. In the 3M patent continued stability of the colloidal silica sol was not a desired property. The silicasol in the described 3M example was dried after synthesis and the resulting powder was used as an additive to make a foam. Brine stability and colloidal silica stability were not a targeted property of the described example. In recreating the example it was found that the colloidal silica was not even stable in water after surface treatment due to excessive Hydrophobic character of the surface treatment and thus would be even less stable in brine than pure water. Our invention requires both stability after synthesis and also stability in contact with brine.
[0060] Recently, the stimulation of several Wolfcamp and Bone Springs targeted wells in the northern Delaware Basin using fracturing treatments and a new method employing relatively small pre-pad pill volumes of colloidal silica nanoparticle dispersions ahead of each stage of treatment have been successfully performed. The liquid colloidal silica nanoparticle dispersion pre-pad pills used in each stage consist of highly surface modified, neutral wet colloidal silica nanoparticles dispersed in small water volumes which penetrate the reservoir's natural fracture and secondary induced fracture network via accelerated diffusion into the reservoir beyond the primary induced fracture network, producing a Brownian motion activated, mechanical advantage process known as disjoining pressure.
[0061] These neutral wet, solid colloidal silica nanoparticles aid in delivering improved efficacy in the recovery of hydrocarbons via counter-current imbibition by fragmenting the disjoined oil into smaller oil droplets, enabling a more efficient backflow to the propped fracture network and back to the wellbore. The colloidal silica nanoparticle dispersion pre-pad pills are used to introduce the colloidal silica nanoparticle dispersion farther into the reservoirs naturally fractured/permeable matrix network and employ the mechanisms described above to enhance and sustain the mobility of hydrocarbons (overcome confining capillary pressures) back to the propped facture network and subsequently to the wellbore.
[0062] Advantages of this method and mechanical process are the ability to access the reservoir beyond where proppants can be placed thereby improving the effective stimulated reservoir volume. The evaluation of results in these zones has shown that utilizing the colloidal silica nanoparticle pre-pad pills has resulted in significantly improved performance, 20-30 percent higher than the best available technology, as compared to over 15 offset wells when normalized with respect to stimulation and production techniques and procedures. The results include significantly higher oil cuts for a longer sustained time periods as well as providing earlier oil to surface after treatment flowback and continued flowing production before requiring artificial lift implementation. While the number of offset wells is greater than nanoparticle dispersion treated wells, the results clearly demonstrate that there is a positive impact as well as persistent improvement factor (EUR) from using the pre-pad colloidal silica nanoparticle dispersion pills ahead of each stage.
[0063] Colloidal silica nanoparticle dispersions provide a unique enabling mechanism to improve the efficiency of fluids and additives in the performance of their intended actions during several reservoir intervention applications. A wide range of applications for colloidal silica nanotechnology utilizing the mechanism of disjoining pressure have been investigated. The mechanism improves the removal of discontinuous phases such as oil, gas, damaging material like paraffin, polymer, biofilm, or scale from the rock substrate to improve production through nano- and micro-darcy fractures. Fluid systems can be specifically designed for each of these applications by selecting various particles, with or without surface modifications, or with alterations to the ionic nature of the carrier fluid..sup.1
[0064] Brine Resistant SDND Technology Synopsis
[0065] The key to this new technology consists of aqueous BRINE RESISTANT SDND treatments during the fracture stimulation treatments. The technology is applied using pre-pad pills, consisting of 500-1,000 US gallons of BRINE RESISTANT SDND per 3,000-4,000 barrels (US) of stimulation fluid.
[0066] The BRINE RESISTANT SDND consists of highly surface modified, neutral wet colloidal silica nano-particles dispersed in small water volumes which penetrate via accelerated diffusion into the reservoir beyond the induced fracture network. This process produces a Brownian motion activated, mechanical process known as disjoining pressure. These neutral wet, solid colloidal silica nanoparticles aid in delivering improved efficacy in the recovery of hydrocarbons via counter-current imbibition from the reservoir, by fragmenting the disjoined oil into smaller oil droplets, enabling a more efficient backflow to the propped and/or the induced secondary fracture network. This is especially beneficial when dealing with nano- and micro-darcy permeability fractures. The process of fragmentation follows diffusion and disjoining pressure. After diffusing into more of the natural and secondary fracture network, then disjoining hydrocarbons from surfaces, BRINE RESISTANT SDND creates and surrounds small droplets of hydrocarbon thus enabling more efficient countercurrent flow through and from porous media and natural fractures into propped fractures and/or directly to the wellbore. These three mechanisms subsequently contribute to improve hydrocarbon recovery due to significantly enhanced hydrocarbon flow from greater stimulated reservoir volume..sup.5
[0067] Nanoparticles in an aqueous dispersion (BRINE RESISTANT SDND) will assemble themselves into structural arrays at a discontinuous phase such as oil, gas, paraffin, or polymer (see D. T. Wasan, A. D. Nikolov; "Spreading of Nanofluids on Solids," (2003), Nature, Vol. 423: 156-159.). The particles that are present in this three-phase contact region tend to form a wedge-like structure and force themselves between the discontinuous phase and the substrate as depicted in FIG. 1. Particles present in the bulk fluid exert pressure forcing the particles in the confined region, imparting the disjoining pressure force. The energies that drive this mechanism are Brownian motion, and electrostatic repulsion between the particles. The force imparted by a single particle is extremely weak, but when large amounts of small particles are present, referred to as the particle volume fraction, the force can be upwards of 50,000 Pa (7.25 psi) at the 3-phase contact angle/vertex. While the pressure appears to be quite low, it is extremely high relative to the particle volume fraction.
[0068] Particle size and the associated particle charge density as wells as particle volume fraction, also affect the strength of this force. The smaller the particle size, the higher the charge density, and the larger the electrostatic repulsion between those particles. When this force is confined to the vertex of the discontinuous phases, displacement occurs in an attempt to regain equilibrium. As with any colloid system, particle size, temperature, salinity of the carrier fluid, and the surface characteristics of the substrate also affect the magnitude of the disjoining force. BRINE RESISTANT SDND accounts for these phenomena.
[0069] It is proposed that the BRINE RESISTANT SDND pre-pad/pills are introduced farther into the naturally fractured/permeable matrix network of the reservoir and uses the mechanisms described above to enhance and sustain the mobility of hydrocarbons back to the propped fracture network and subsequently to the wellbore. BRINE RESISTANT SDND particles penetrate the natural fracture network on a nanoscopic scale as shown in FIG. 2. The extension into the natural fracture network is possible due to the abundance and more importantly, the size of the individual particles, which average less than 20 nanometers in diameter. Advantages of this method and mechanical process are the ability to access the reservoir beyond where proppants can be placed thereby improving the effective stimulated reservoir volume (ESRV).
[0070] The BRINE RESISTANT SDND is pumped as a pre-pad pill, eliminating the need to include the chemistry on a continuous basis throughout stimulation treatment. The volume of BRINE RESISTANT SDND required for each formation, well type, and stage is engineered depending upon relevant formation fluid and rock parameters, such as net pay, water saturation and chemistry, oil and gas gravity, paraffin content, gas-oil ratio, natural fracture density, reservoir pressure and temperature. The BRINE RESISTANT SDND appears to be very cost competitive compared to many high-end micellar or nano-type surfactant and solvent systems currently in use. The design of each treatment is explained in further detail later in this patent application.
EXAMPLES
[0071] A trial program consisting of initially 5 wells was implemented with a Permian Basin operator to test the feasibility of increasing initial production and ultimate recovery of three different ultra-low permeability reservoirs. All five wells are in Eddy and Lea Counties, N. Mex. which is within the Delaware sub-basin. The Case Study wells included the Wolfcamp B, Wolfcamp X-Y Sand, and 2.sup.nd and 3.sup.rd Bone Spring formations. In all cases, the operator observed increases in the initial actual production rates versus the predicted type curve performance. In addition, the percent oil cuts on each well increased with water production rates falling after fracture cleanup, which further enhanced the project economics.
[0072] The Permian Basin, shown in FIG. 3, is a sedimentary basin largely contained in the western part of Texas (surrounding the Midland/Odessa area) and the southeastern part of New Mexico (mainly in Lea and Eddy Counties). It is so named because it has one of the world's thickest deposits of formation strata from the Permian geologic period. The greater Permian Basin is made up of several component basins including the Midland Basin (which is the largest), the Delaware Basin (which is the second largest), and the Marfa Basin (which is the smallest). FIG. 4 is a schematic of the Permian Basin showing the main formations associated with the Delaware Basin, the Central Platform, and the Midland Basin. The Permian Basin extends beneath an area approximately 250 miles (400 km) wide and 300 miles (480 km) long.
[0073] Delaware Basin
[0074] The Delaware Basin is the largest lobe of the two major lobes of the Permian Basin within the foreland of the Quachita-Marathon thrust belt separated by the Central Basin Platform. The basin contains sediment from the Pennsylvanian, Wolfcampian, Leonardian, and early Guadalupian times. The Geologic Periodic Table showing the Delaware Basin Stratigraphic Formations within their associated period and epochs is shown in Table 1.
TABLE-US-00001 TABLE 1 Delaware Basin Stratigraphic Formations Period Epoch Series Formation Permian Guadalupian Delaware Lamar Bell Canyon Group Cherry Canyon Brushy Canyon Leonardian Upper Avalon Shale Lower Avalon Shale 1.sup.st Bone Spring 2.sup.nd Bone Spring 3.sup.rd Bone Spring Wolfcampian Wolfcamp Pennsylvanian Pennsylvanian
[0075] The eastward dipping Delaware basin is subdivided into several formations and contains approximately 25,000 feet (7,600 m) of laminated siltstone, sandstone, and shale. Aside from clastic sediment, the Delaware basin also contains non-clastic carbonate deposits originating from the Guadalupian times when the Hovey Channel allowed access from the sea into the basin..sup.7
[0076] The Delaware Basin stratigraphy, especially Leonardian aged strata, is different from the Midland Basin. Where the Midland has the Spraberry and Dean formation, the Delaware has the Bone Spring and Avalon formations. Similarly, both sub-basins have common Wolfcamp formations that are very analogous. Just like the Midland, these two stratigraphic plays have been combined to be dubbed the "Wolfbone". The deeper Delaware Basin is also a multi-stacked play area similar to the Midland Basin.
[0077] Bone Spring Formation
[0078] The Bone Spring formation is Leonardian in age and is divided into the 1st, 2nd, and 3rd Bone Spring, each containing a package of carbonate followed by a package of sand. This cyclic sedimentation is due to the change in sea level as mentioned above, where the carbonate is formed when sea level was at a high and sands when the sea level was at a low. Above the 1st Bone Spring carbonate, there are the upper and lower Avalon shales as well as the Avalon carbonate that splits the two shales. The sand intervals of the Bone Spring are composed of dark, thinly bedded, calcareous shales and siltstones. The entire Bone Spring and Avalon formations (often just called the Bone Spring) average in thickness from 2,500 feet to 3,500 feet. The thickest region of the formation occurs in the eastern portion of the Delaware Basin before it quickly disappears into the Central Basin Platform. A cross section of the 3.sup.rd Bone Spring formation is shown in FIG. 5, located near the case study area in Lea County, N. Mex.
[0079] Wolfcamp Formation
[0080] The Wolfcamp formation in the Delaware Basin is an ideal heterogenetic resource of hydrocarbons. While the lithology of the Delaware Wolfcamp is analogous to the Midland Wolfcamp, characterized by interbedded shale and limestone, some differences do occur. In fact, the same Wolfcamp formation in the northwestern section of the Delaware basin is different from the rest of the basin's Wolfcamp. In the northwestern portion of the basin, the Wolfcamp's carbonates are light colored dolostones. In contrast, the rest of the basin's Wolfcampian strata are dark colored lime packstones, wackestones, siltstones, and mudstones. The depths and thickness of the Delaware Wolfcamp also differ from the Midland Wolfcamp. It has an average thickness of 2,000 feet but can locally exceed 6,000 feet in the western portion of the basin. The top of the Wolfcamp in the Delaware Basin lies on an average depth ranging from 10,000 to 12,000 feet.
[0081] FIGS. 6, 7, and 8 depict cross-sections of the top of the Wolfcamp formation, the Wolfcamp X-Y formation, and the Wolfcamp B formations, respectively. All three cross sections are in the Case Study area in Eddy County, N. Mex.
[0082] The amount and concentration of the BRINE RESISTANT SDND pill needed for each well stimulation is engineered for each well and stimulation treatment, dependent on many factors. Treatment fluid volume and reservoir fluid chemistry, along with the amount and type of proppant being pumped are primary factors when considering the economics of the treatment. Basic characteristics of the formation and reservoir fluids also need to be evaluated such as net pay, water saturation and chemistry, oil and gas gravity, paraffin and asphaltene content, gas-oil ratio, natural fracture density, pressure and temperature.
[0083] The key to the technology surrounds the importance of delivering sufficient amounts of nanoparticles while staying within an economic environment with respect to well costs. Based on dozens of jobs performed at the time of filing this patent application, the BRINE RESISTANT SDND technology is usually very cost competitive when compared to many high-end micro or nano-type surfactant systems currently in use. The colloidal silica nanoparticles, due to their size (12-20 nanometers in diameter), overwhelm the contacted reservoir surface area (matrix porosity and natural fracture network). The physics associated with the BRINE RESISTANT SDND technology then displace hydrocarbons and water via counter-current imbibition.
[0084] The pill volume, in most naturally-fractured unconventional formations, is typically 500-1,000 U.S. gallons of BRINE RESISTANT SDND per 3,000-6,000 barrels (U.S.) of frac stage fluid. Lighter density (higher API gravity) hydrocarbons will need lower concentrations and volumes of BRINE RESISTANT SDND pills to effectively fragment and remove oil from the reservoir whereas higher density (low API gravity) hydrocarbons will need higher concentrations and volumes of BRINE RESISTANT SDND pills. Natural gas is more easily removed by BRINE RESISTANT SDND's however water can be a primary inhibitor in the movement of natural gas to the propped fracture. BRINE RESISTANT SDND avoids mobilizing water allowing natural gas to move more readily. The BRINE RESISTANT SDND works in order of specific gravity therefore will counter-currently imbibe and flow in the order of natural gas, light oils, heavy oils, paraffin then water.
[0085] Chemical composition of the reservoir fluids may make it desirable and/or necessary to pump a standard non-emulsifier as part of the fracture fluid chemistry. However, it may no longer be necessary to pump other state of the art surfactant-based additives.
[0086] The placement of a BRINE RESISTANT SDND pill in a new well fracture stimulation is typically behind the acid stage (if present) and ahead of the pad of the frac treatment. It is recommended the BRINE RESISTANT SDND be accompanied by fresh water spacers run ahead and behind the BRINE RESISTANT SDND pill volume, which are typically 1,000-2,000 gallons. The fresh water spacers are to be pumped without chemical additives to effectively deliver the highest volume of nanoparticles into the formation by eliminating competition with other chemical additives. The spacers also limit the reaction of the BRINE RESISTANT SDND with competing chemistries to provide the most nanoparticles to contact the formation surfaces within the matrix porosity and fracture networks.
[0087] By placing the pill ahead of the main body of the fracture treatment, the main frac treatment acts as a "hydraulic ram" pushing the BRINE RESISTANT SDND deep into the formation's matrix and natural fracture network. During this process, the BRINE RESISTANT SDND is affecting the contacted rock surfaces while also counter-currently imbibing or back-filling, into the fracture treatment. Table 2 illustrates the typical fluid sequence for placing of a BRINE RESISTANT SDND pill in a fracture treatment. Injection begins then acid is placed to etch and breakdown the cement sheath between the casing and formation. The acid can be flushed through the perforations or a spacer can be placed between the acid and BRINE RESISTANT SDND pill. An adequate volume of spacer should be pumped to ensure the acid is spent. This volume of initial spacer will depend on the formation solubility and strength of acid used. It is also recommended the spacers and BRINE RESISTANT SDND pill be pumped independent of the frac pumping equipment. This will improve the effectiveness of the BRINE RESISTANT SDND pill by keeping it concentrated and reduce contamination. A BRINE RESISTANT SDND pill along with spacers can also be pumped in the middle of a treatment or after a diverter should treatment volumes be larger than 8,000 barrels.
[0088] Brine Stability Testing
[0089] After creation, a colloidal silica is tested to see if it is brine stable because brine stability is a requirement for use in an oil and gas field. These are the test methods followed when testing colloidal silica to determine whether it is brine resistant:
[0090] API Brine by Visual Observation:
[0091] A 10 wt % API Brine solution is prepared by dissolving 8 wt % NaCl (SigmaAldrich) and 2 wt % CaCl.sub.2) (Sigma Aldrich) in distilled water. Testing for Brine resistance is done by placing 1 gram of example silica sol into 10 grams of API Brine Solution. Stability observations are performed at standard brine exposure periods of 10 minutes and 24 hours. These observations include the clarity and transparency of the silica sol. The results of these observations are recorded at these times. Silica sol solutions that are stable to Brine exposure will remain clear and transparent/opalescent while unstable examples become visibly hazy and opaque after brine exposure.
[0092] Artificial Seawater by Visual Observation
[0093] Artificial seawater is prepared by dissolving Fritz Pro Aquatics RPM Reef Pro Mix (Fritz Industries, Inc.) at 6 wt % in distilled water. Testing for Brine resistance is done by placing 1 gram of example silica sol into 10 grams of Artificial Seawater. Stability observations are performed at standard brine exposure periods of 10 minutes and 24 hours. These observations include the clarity and transparency of the silica sol. The results of these observations are recorded at these times. Silica sol solutions that are stable to Brine exposure will remain clear and transparent/opalescent while unstable examples become visibly hazy and opaque after brine exposure.
[0094] API Brine Resistance Test by Use of a Turbidimeter [0095] Reference: US EPA 180.1 Determination of Turbidity by Nephelometry [0096] A difference between this test and the US EPA 101.1 test is that in this test, step 11.2 is not followed: [0097] Step 11.2 reads as follows: Turbidities exceeding 40 units: Dilute the sample with one or more volumes of turbidity-free water until the turbidity falls below 40 units. The turbidity of the original sample is then computed from the turbidity of the diluted sample and the dilution factor. [0098] For example, if 5 volumes of turbidity-free water were added to 1 volume of sample, and the diluted sample showed a turbidity of 30 units, then the turbidity of the original sample was 180 units. [0099] For this work, the actual ("raw") value of turbidity is recorded, whether it is above, below or equal to 40. [0100] Test solutions/surface treated silicasols are tested for Brine resistance by Turbidimetry. [0101] A calibrated Hach 2100AN Turbidimeter is used to measure Turbidity in units of NTU (Nephelometric Turbidity Units). [0102] Test solution amounts of 3.0 g are placed into standard turbidity test tubes of approximately 30 ml.
[0103] Twenty-seven grams (27 g) of 10% API brine (8 wt % NaCl, 2 wt % CaCl.sub.2)) are added to the test tube and the mixture inverted three times to mix test solution and brine. Test solution concentrations are therefore 10 wt % in API Brine. [0104] Sample test tubes are inserted into the Turbidimeter and an initial measurement of turbidity is taken immediately, followed by a turbidity measurement after 24 hours. [0105] A change in turbidity of more than 100 NTU leads to the conclusion that the silica sol is not brine stable. Conversely a change in turbidity of less than 100 NTU after API brine exposure leads to the conclusion that the silica sol is brine stable
Examples of Brine Resistant Colloidal Silica Sols
[0106] In the following potential examples, each ingredient that is used to create a surface treated colloidal silica, is listed as Parts of Ingredient, per 100 parts of surface treated colloidal silica.
[0107] ST-O25 and ST-32C are commercially available colloidal silicas from Nissan Chemical America Corporation, located at 10333 Richmond Avenue, Suite 1100 Houston, Tex. 77042 or from Nissan Chemical Corporation, located at 5-1, Nihonbashi 2-Chome, Chuo-ku, Tokyo 103-6119, Japan.
TABLE-US-00002 Examples Ingredients 1 2 3 4 5 6 ST-O25 76 76 76 76 76 76 Deionized water 11.1 11.1 11.1 11.1 11.1 11.1 Propylene Glycol 10 10 10 10 10 10 3-(Triethoxysilyl)propyl Succinic 2.9 1.9 1.9 Anhydride N-(Triethoxysilylpropyl)-O- 2.9 Polyethyleneoxide Urethane Silane, trimethoxy[3-(oxiranyl 2.9 methoxy)propyl] 3-Ureidopropyl Triethoxysilane 2.9 2-(3,4 epoxycyclohexyl)- 1 ethyltrimethoxysilane 3-(Trimethoxysilyl)propyl 1 Methacrylate Total 100.00 100.00 100.00 100.00 100.00 100.00
TABLE-US-00003 Examples Ingredient 7 8 9 10 11 12 13 ST-O25 76 76 76 76 76 76 76 Deionized water 11.1 11.1 11.1 11.1 11.1 11.1 11.1 Propylene Glycol 10 10 10 10 10 10 10 3-(Triethoxysilyl)propyl 1.9 1.9 1.9 1.9 1.9 1.9 1.9 Succinic Anhydride Hexamethyl Disiloxane 1 Hexamethyl Disilazane 1 Trimethoxy Methyl Silane 1 Trimethoxy Phenyl Silane 1 Vinyl Trimethoxysilane 1 3-(N,N-Dimethyl- 1 aminopropyl)- Trimethoxysilane 3-(Diethylamino)propyl 1 trimethoxysilane Total 100 100 100 100 100 100 100
TABLE-US-00004 Examples Ingredient 14 15 16 17 18 19 20 21 ST-O25 76 76 76 76 76 76 76 76 Deionized water 11.1 11.1 11.1 11.1 11.1 11.1 11.1 11.1 Propylene Glycol 10 10 10 10 10 10 10 10 3-(Triethoxy-silyl)propyl 1.9 1.9 1.9 1.9 1.9 1.9 1.9 1.9 Succinic Anhydride Trimethoxy(octadecyl)silane 1 Isobutyl Trimethoxysilane 1 Hexyltrimethoxysilane 1 Decyltrimethoxysilane 1 Isooctyltrimethoxysilane 1 Hexadecyltrimethoxysilane 1 Propyltrimethoxysilane 1 Octyltriethoxysilane 1 Total 100 100 100 100 100 100 100 100
TABLE-US-00005 Examples Ingredient 22 23 24 25 26 27 28 29 30 ST-O25 70 80 75 72 76 76 76 76 76 Deionized water 14.1 19.1 11.1 13.1 11.1 11.1 11.1 11.1 11 Propylene Glycol 13 8 10 12 10 10 10 10 10 3-(Triethoxysilyl)propyl 2.9 Succinic Anhydride N-(Triethoxysilylpropyl)-O- 2.9 1.9 1.9 1.9 1.9 1.9 Polyethyleneoxide Urethane Silane, trimethoxy[3- 3.9 (oxiranyl methoxy)propyl] 3-Ureidopropyl 2.9 Triethoxysilane 2-(3,4 epoxycyclohexyl)- 1 ethyltrimethoxysilane 3-(Trimethoxysilyl)propyl 1 Methacrylate Hexamethyl Disiloxane 1 Hexamethyl Disilazane 1 Trimethoxy Methyl Silane 1 Total 100 100 100 100 100 100 100 100 100
TABLE-US-00006 Examples Ingredient 31 32 33 34 35 36 37 ST-O25 76 76 76 76 76 76 76 Deionized water 11.1 11.1 11.1 11.1 11.1 11.1 11.1 Propylene Glycol 10 10 10 10 10 10 10 N-(Triethoxysilylpropyl)-O- 1.9 1.9 1.9 1.9 1.9 1.9 1.9 Polyethyleneoxide Urethane Trimethoxy Phenyl Silane 1 Vinyl Trimethoxysilane 1 3-(N,N- 1 Dimethylaminopropyl)- Trimethoxysilane 3-(Diethylamino)propyl 1 trimethoxysilane Trimethoxy- 1 (octadecyl)silane Isobutyl Trimethoxysilane 1 Hexyl-trimethoxysilane 1 Total 100 100 100 100 100 100 100
TABLE-US-00007 Examples Ingredients 38 39 40 41 42 ST-O25 76 76 76 76 76 Deionized water 11.1 11.1 11.1 11.1 11.1 Propylene Glycol 10 10 10 10 10 N-(Triethoxysilylpropyl)- 1.9 1.9 1.9 1.9 1.9 O-Polyethyleneoxide Urethane Decyl-trimethoxysilane 1 Isooctyl-trimethoxysilane 1 Hexadecyl- 1 trimethoxysilane Propyl-trimethoxysilane 1 Octyl-triethoxysilane 1 Total 100.00 100.00 100.00 100.00 100.00
TABLE-US-00008 Examples Ingredient 43 44 45 46 47 48 49 50 51 ST-O25 76 76 70 80 76 76 76 76 76 Deionized water 10 9 16.1 11.1 11.1 11.1 11.1 11.1 11 Propylene Glycol 11.1 12.1 11 6 10 10 10 10 10 3-(Triethoxysilyl)propyl 2.9 Succinic Anhydride N-(Triethoxysilylpropyl)-O- 2.9 Polyethyleneoxide Urethane Silane, trimethoxy[3- 2.9 1.9 1.9 1.9 1.9 1.9 (oxiranyl methoxy)propyl] 3-Ureidopropyl 2.9 Triethoxysilane 2-(3,4 epoxycyclohexyl)- 1 ethyltrimethoxysilane 3-(Trimethoxysilyl)propyl 1 Methacrylate Hexamethyl Disiloxane 1 Hexamethyl Disilazane 1 Trimethoxy Methyl Silane 1 Total 100 100 100 100 100 100 100 100 100
TABLE-US-00009 Examples Ingredients 52 53 54 55 56 57 58 ST-O25 76 76 76 76 76 76 76 Deionized water 11.1 11.1 11.1 11.1 11.1 11.1 11.1 Propylene Glycol 10 10 10 10 10 10 10 Silane, trimethoxy[3-(oxiranyl 1.9 1.9 1.9 1.9 1.9 1.9 1.9 methoxy)propyl] Trimethoxy Phenyl Silane 1 Vinyl Trimethoxysilane 1 3-(N,N-Dimethylaminopropyl)- 1 Trimethoxysilane 3-(Diethylamino)propyl 1 trimethoxysilane Trimethoxy(octadecyl)silane 1 Isobutyl Trimethoxysilane 1 Hexyltrimethoxysilane 1 Total 100.00 100.00 100.00 100.00 100.00 100.00 100.00
TABLE-US-00010 Examples Ingredients 59 60 61 62 63 ST-O25 76 76 76 76 76 Deionized water 11.1 11.1 11.1 11.1 11.1 Propylene Glycol 10 10 10 10 10 Silane, trimethoxy[3- 1.9 1.9 1.9 1.9 1.9 (oxiranyl methoxy)propyl] Decyltrimethoxysilane 1 Isooctyltrimethoxysilane 1 Hexadecyltrimethoxysilane 1 Propyltrimethoxysilane 1 Octyltriethoxysilane 1 Total 100.00 100.00 100.00 100.00 100.00
TABLE-US-00011 Examples Ingredients 64 65 66 67 68 69 70 71 72 73 ST-O25 76 76 76 76 76 76 76 76 76 76 Deionized water 11.1 11.1 11.1 11.1 11.1 11.1 11.1 11.1 11 11.1 Propylene Glycol 10 10 10 10 10 10 10 10 10 10 3-(Triethoxysilyl)propyl 1.45 Succinic Anhydride N-(Triethoxysilylpropyl)-O- 1.45 2.9 Polyethyleneoxide Urethane Silane, trimethoxy[3- 2.9 (oxiranyl methoxy)propyl] 3-Ureidopropyl 2.9 1.9 1.9 1.9 1.9 1.9 1.9 Triethoxysilane 2-(3,4 epoxycyclohexyl)- 1 ethyltrimethoxysilane 3-(Trimethoxysilyl)propyl 1 Methacrylate Hexamethyl Disiloxane 1 Hexamethyl Disilazane 1 Trimethoxy Methyl Silane 1 Trimethoxy Phenyl Silane 1 Total 100 100 100 100 100 100 100 100 100 100
TABLE-US-00012 Examples Ingredients 74 75 76 77 78 79 80 81 ST-O25 76 76 76 76 76 76 76 76 Deionized water 11.1 11.1 11.1 11.1 11.1 11.1 11.1 11.1 Propylene Glycol 10 10 10 10 10 10 10 10 3-Ureidopropyl Triethoxysilane 1.9 1.9 1.9 1.9 1.9 1.9 1.9 1.9 Vinyl Trimethoxysilane 1 3-(N,N- 1 Dimethylaminopropyl)- Trimethoxysilane 3-(Diethylamino)propyl 1 trimethoxysilane Trimethoxy(octadecyl)silane 1 Isobutyl Trimethoxysilane 1 Hexyltrimethoxysilane 1 Decyltrimethoxysilane 1 Isooctyltrimethoxysilane 1 Hexadecyltrimethoxysilane Propyltrimethoxysilane Octyltriethoxysilane Total 100.00 100.00 100.00 100.00 100.00 100.00 100.00 100.00
TABLE-US-00013 Examples Ingredients 82 83 84 ST-O25 76 76 76 Deionized water 11.1 11.1 11.1 Propylene Glycol 10 10 10 3-Ureidopropyl 1.9 1.9 1.9 Triethoxysilane Hexadecyltrimethoxysilane 1 Propyltrimethoxysilane 1 Octyltriethoxysilane 1 Total 100.00 100.00 100.00
TABLE-US-00014 Examples Ingredients 85 86 87 88 89 ST-O25 76 76 76 76 76 Deionized water 11.1 11.1 11.1 11.1 11.1 Ethylene Glycol 10 10 10 10 10 3-(Triethoxysilyl)propyl 2.9 1.9 Succinic Anhydride N-(Triethoxysilylpropyl)- 2.9 O-Polyethyleneoxide Urethane Silane, trimethoxy[3- 2.9 (oxiranyl methoxy)propyl] 3-Ureidopropyl 2.9 Triethoxysilane 2-(3,4 epoxycyclohexyl)- 1 ethyltrimethoxysilane 3-(Trimethoxysilyl)propyl Methacrylate Hexamethyl Disiloxane Hexamethyl Disilazane Total 100.00 100.00 100.00 100.00 100.00
TABLE-US-00015 Examples Ingredients 90 91 92 ST-O25 76 76 76 Deionized water 11.1 11.1 11.1 Ethylene Glycol 10 10 10 3-(Triethoxysilyl)propyl 1.9 1.9 1.9 Succinic Anhydride 3-(Trimethoxysilyl)propyl 1 Methacrylate Hexamethyl Disiloxane 1 Hexamethyl Disilazane 1 Total 100.00 100.00 100.00
TABLE-US-00016 Examples Ingredients 93 94 95 96 97 98 99 ST-O25 76 76 76 76 76 76 76 Deionized water 11.1 11.1 11.1 11.1 11.1 11.1 11.1 Ethylene Glycol 10 10 10 10 10 10 10 3- 1.9 1.9 1.9 1.9 1.9 1.9 1.9 (Triethoxysilyl)propyl Succinic Anhydride Trimethoxy Methyl 1 Silane Trimethoxy Phenyl 1 Silane Vinyl 1 Trimethoxysilane Total 100.00 100.00 100.00 100.00 100.00 100.00 100.00
TABLE-US-00017 Examples Ingredients 100 101 102 103 104 105 ST-O25 76 76 76 76 76 76 Deionized water 11.1 11.1 11.1 11.1 11.1 11.1 Ethylene Glycol 10 10 10 10 10 10 3-(Triethoxysilyl)propyl 1.9 1.9 1.9 1.9 1.9 1.9 Succinic Anhydride Hexyltrimethoxysilane 1 Decyltrimethoxysilane 1 Isooctyltrimethoxysilane 1 Hexadecyltrimethoxysilane 1 Propyltrimethoxysilane 1 Octyltriethoxysilane 1 Total 100.00 100.00 100.00 100.00 100.00 100.00
TABLE-US-00018 Examples Ingredients 106 107 108 109 110 111 112 ST-O25 78 74 76 76 76 76 76 Deionized water 11.1 11.1 11.1 11.1 11.1 11.1 11.1 Ethylene Glycol 8 12 10 10 10 10 10 3-(Triethoxysilyl)propyl 1.45 Succinic Anhydride N-(Triethoxysilylpropyl)-O- 1.45 1.45 1.9 1.9 1.9 Polyethyleneoxide Urethane Silane, trimethoxy[3- 1.45 1.45 (oxiranyl methoxy)propyl] 3-Ureidopropyl 1.45 1.45 Triethoxysilane 2-(3,4 epoxycyclohexyl)- 1.45 1 ethyltrimethoxysilane 3-(Trimethoxysilyl)propyl 1 Methacrylate Hexamethyl Disiloxane 1 Total 100.00 100.00 100.00 100.00 100.00 100.00 100.00
TABLE-US-00019 Examples Ingredients 113 114 115 116 117 118 ST-O25 76 76 76 76 76 76 Deionized water 11.1 11.1 11.1 11.1 11.1 11.1 Ethylene Glycol 10 10 10 10 10 10 N-(Triethoxysilylpropyl)- 1.9 1.9 1.9 1.9 1.9 1.9 O-Polyethyleneoxide Urethane Hexamethyl Disilazane 1 Trimethoxy Methyl Silane 1 Trimethoxy Phenyl Silane 1 Vinyl Trimethoxysilane 1 3-(N,N- 1 Dimethylaminopropyl)- Trimethoxysilane 3-(Diethylamino)propyl 1 trimethoxysilane Total 100.00 100.00 100.00 100.00 100.00 100.00
TABLE-US-00020 Examples Ingredients 119 120 121 122 123 124 125 126 ST-O25 76 76 76 76 76 76 76 76 Deionized water 11.1 11.1 11.1 11.1 11.1 11.1 11.1 11.1 Ethylene Glycol 10 10 10 10 10 10 10 10 N-(Triethoxysilylpropyl)- 1.9 1.9 1.9 1.9 1.9 1.9 1.9 1.9 O-Polyethyleneoxide Urethane Trimethoxy(octadecyl)silane 1 Isobutyl 1 Trimethoxysilane Hexyltrimethoxysilane 1 Decyltrimethoxysilane 1 Isooctyltrimethoxysilane 1 Hexadecyltrimethoxysilane 1 Propyltrimethoxysilane 1 Octyltriethoxysilane 1 Total 100.00 100.00 100.00 100.00 100.00 100.00 100.00 100.00
TABLE-US-00021 Examples Ingredients 127 128 129 130 131 132 133 134 ST-O25 76 76 78 74 76 76 76 76 Deionized water 11.1 9.1 9.1 12.1 11.1 11.1 11.1 11.1 Ethylene Glycol 10 12 10 10 10 10 10 10 3- 1.45 (Triethoxysilyl)propyl Succinic Anhydride N- 1.45 (Triethoxysilylpropyl)- O-Polyethyleneoxide Urethane Silane, trimethoxy[3- 1.45 1.45 1.9 1.9 1.9 1.9 (oxiranyl methoxy)propyl] 3-Ureidopropyl 1.45 1.45 Triethoxysilane 2-(3,4 1.45 1 Epoxycyclohexyl)- ethyltrimethoxysilane 3- 1.45 (Trimethoxysilyl)propyl Methacrylate 1 Hexamethyl Disiloxane 1 Hexamethyl Disilazane 1 Total 100.00 100.00 100.00 100.00 100.00 100.00 100.00 100.00
TABLE-US-00022 Examples Ingredients 135 136 137 138 139 140 141 ST-O25 76 76 76 76 76 76 76 Deionized water 11.1 11.1 11.1 11.1 11.1 11.1 11.1 Ethylene Glycol 10 10 10 10 10 10 10 Silane, trimethoxy[3- 1.9 1.9 1.9 1.9 1.9 1.9 1.9 (oxiranyl methoxy)propyl] Trimethoxy Methyl Silane 1 Trimethoxy Phenyl Silane 1 Vinyl Trimethoxysilane 1 3-(N,N- 1 Dimethylaminopropyl)- Trimethoxysilane 3-(Diethylamino)propyl 1 trimethoxysilane Trimethoxy(octadecyl)silane 1 Isobutyl Trimethoxysilane 1 Total 100.00 100.00 100.00 100.00 100.00 100.00 100.00
TABLE-US-00023 Examples Ingredients 142 143 144 145 146 147 ST-O25 76 76 76 76 76 76 Deionized water 11.1 11.1 11.1 11.1 11.1 11.1 Ethylene Glycol 10 10 10 10 10 10 Silane, trimethoxy[3- 1.9 1.9 1.9 1.9 1.9 1.9 (oxiranyl methoxy)propyl] Hexyltrimethoxysilane 1 Decyltrimethoxysilane 1 Isooctyltrimethoxysilane 1 Hexadecyltrimethoxysilane 1 Propyltrimethoxysilane 1 Octyltriethoxysilane 1 Total 100.00 100.00 100.00 100.00 100.00 100.00
TABLE-US-00024 Examples Ingredients 148 149 150 151 152 153 154 ST-O25 76 76 76 76 76 76 76 Deionized water 6.1 7.1 8.1 9.1 11.1 11.1 11.1 Ethylene Glycol 15 14 13 12 10 10 10 3- 2.9 (Triethoxysilyl)propyl Succinic Anhydride N- 2.9 (Triethoxysilylpropyl)- O-Polyethyleneoxide Urethane Silane, trimethoxy[3- 2.9 (oxiranyl methoxy)propyl] 3-Ureidopropyl 2.9 1.9 1.9 1.9 Triethoxysilane 2-(3,4 1 epoxycyclohexyl)- ethyltrimethoxysilane 3- 1 (Trimethoxysilyl)propyl Methacrylate Hexamethyl Disiloxane 1 Total 100.00 100.00 100.00 100.00 100.00 100.00 100.00
TABLE-US-00025 Examples Ingredients 155 156 157 158 159 160 161 ST-O25 76 76 76 76 76 76 76 Deionized water 11.1 11.1 11.1 11.1 11.1 11.1 11.1 Ethylene Glycol 10 10 10 10 10 10 10 3-Ureidopropyl 1.9 1.9 1.9 1.9 1.9 1.9 1.9 Triethoxysilane Hexamethyl Disilazane 1 Trimethoxy Methyl Silane 1 Trimethoxy Phenyl Silane 1 Vinyl Trimethoxysilane 1 3-(N,N- 1 Dimethylaminopropyl)- Trimethoxysilane 3-(Diethylamino)propyl 1 trimethoxysilane Trimethoxy(octadecyl)silane 1 Total 100.00 100.00 100.00 100.00 100.00 100.00 100.00
TABLE-US-00026 Examples Ingredients 162 163 164 165 166 167 168 ST-O25 76 76 76 76 76 76 76 Deionized water 11.1 11.1 11.1 11.1 11.1 11.1 11.1 Ethylene Glycol 10 10 10 10 10 10 10 3-Ureidopropyl 1.9 1.9 1.9 1.9 1.9 1.9 1.9 Triethoxysilane Isobutyl Trimethoxysilane 1 Hexyltrimethoxysilane 1 Decyltrimethoxysilane 1 Isooctyltrimethoxysilane 1 Hexadecyltrimethoxysilane 1 Propyltrimethoxysilane 1 Octyltriethoxysilane 1 Total 100.00 100.00 100.00 100.00 100.00 100.00 100.00
TABLE-US-00027 Examples Description Ingredients 169 170 171 172 173 174 175 Colloidal silica 25 wt % ST-O-25 52.68 50 51 25 silica solids available from Nissan Chemical America Alkaline Colloidal ST-32C 59.28 48 45 25 Silica from Nissan Chemical Company, Japan Deionized water 36.05 27.97 40 41.5 38.5 43 35 Propylene Glycol 8 7.5 8.5 Ethylene Glycol 8.06 9.85 7.5 10 Silane, 3.21 2.9 2.5 2.5 3 3.5 5 trimethoxy[3- (oxiranyl methoxy)propyl] Total (g) 100 100 100 100 100 100 100
[0108] Brine resistant silica sols and hydrocarbon recovery fluids comprising surface functionalized nanoparticles, where the surface functionalized nanoparticles are brine resistant silica sols, can be found in U.S. patent application Ser. No. 15/946,252; filed Apr. 5, 2018, entitled "Brine Resistant Silica Sols"; U.S. patent application Ser. No. 15/946,338, filed Apr. 5, 2018, entitled "Hydrocarbon Formation Treatment Micellar Solutions"; U.S. patent application Ser. No. 16/129,688; filed: Sep. 12, 2018, entitled "Crude Oil Recovery Chemical Fluids", which application claims priority to Japanese Patent Application No. JP 2017-175511; and U.S. patent application Ser. No. 16/129,705; filed: Sep. 12, 2018, entitled "Crude Oil Recovery Chemical Fluid", which application claims priority to Japanese Patent Application No. JP 2017-175511; wherein all US patents and patent Applications disclosed anywhere in this disclosure are herein incorporated by reference, in their entirety.
Comparative (Failed) Examples of Non-Brine Resistant Colloidal Silica Sols
Comparative (Failed) Example 1
[0109] Applicant performed a series of experiments to reproduce the product referred to by BARAN in U.S. Pat. No. 7,033,975, Column 9, lines 32-48. Applicant reproduced the surface-modified nanoparticles using the procedure as outlined in BARAN The silica sols obtained were all visibly quite gelatinous, indicating a lack of stability, which renders them unusable for use in treatment of underperforming oil and gas wells. Due to their lack of stability, no brine resistant testing was done.
[0110] The repeated example from the 3M/Baran patent (Particles A) made in our laboratories using the described surface treatment material and method was not stable in water due to excessive Hydrophobic character. In the Baran patent continued colloidal stability was not a desired property. The silicasol in the described 3M example was dried after synthesis and the resulting powder was used as an additive to make a foam. Brine stability was not a targeted property of this colloidal silica. The colloidal silica was not even stable in water after surface treatment due to excessive Hydrophobic character of the surface treatment & would be even less stable in brine than pure water. Our invention requires both stability after synthesis and also stability in contact with brine.
Comparative (Failed) Example 2
[0111] From Japanese Unexamined Patent Application Publication H3-31380, [0112] "Coating Composition" assigned to [0113] Daihachi Chem. Inc. Co., Ltd. {Japanese Patent Application No. H1-164505.} [0114] Date of Application is 27 Jun. 1989. [0115] Inventors are Noriaki Tokuyasu and Hiroshi Yamanaka. [0116] Embodiments 1, 2, 3, 4 and 5 as well as Ref. Examples 1 and 2 are duplicated. [0117] All examples gelled immediately upon mixing with brine, therefore, no 24-hour test data is recorded.
TABLE-US-00028 [0117] Turbidity Turbidity Initial 10 min Embodiment (NTU) (NTU) 1 998 1011 2 270 231 3 1463 1284 4 825 567 5 4666 4225 Ref Ex 1 1539 1051 Ref Ex 2 3078 2800
[0118] The disclosure in this patent application and all the examples within are meant for Sol-Gel coatings and are therefore substantially non-aqueous. As is to be expected, upon exposure to 10% API brine all these examples gelled/polymerized the silica immediately. Low turbidity numbers are from examples where the silica agglomerated and sedimented out of solution before the Turbidimeter was able to read a high NTU number.
[0119] It is believed, without intending to be bound thereby, that the Daihichi patent application examples all failed because they were too hydrophobic and essentially meant to be used in non-aqueous environments such as sol-gel coatings. In practice, there is no mixing of hydrophilic and hydrophobic silanes. The examples from this published Japanese Patent Application are designed to be good silica sols for Sol-Gel coatings only.
[0120] The following Table, Table 2 summarizes an Example of BRINE RESISTANT SDND Treatment Sequence Using One of the Brine Resistant Colloidal Silica Sols previously described.
TABLE-US-00029 Clean Stage Conc. Vol. Prop. Description (ppg) (Mgal) (Mlbs) Fluid Proppant Acid 0 3 BRINE 0 2 RESISTANT SDND Spacer BRINE 0 1.2 RESISTANT SDND BRINE 0 1 RESISTANT SDND Spacer Pad 0 20 Slurry 0.25 12 3 Slickwater 100 Mesh Slurry 0.5 12 6 Slickwater 100 Mesh Slurry 0.75 16 12 Slickwater 100 Mesh Slurry 1 16 16 Slickwater 100 Mesh Slurry 0.75 8 6 Slickwater 40/70 NW Slurry 1 8 8 Slickwater 40/70 NW Slurry 1.25 8 10 Slickwater 40/70 NW Slurry 1.5 8 12 Slickwater 40/70 NW Slurry 1.75 10 17.5 Linear Gel 40/70 NW Slurry 2 10 20 Linear Gel 40/70 NW Slurry 2.25 12 27 Linear Gel 40/70 NW Slurry 2.5 12 30 Linear Gel 40/70 NW Slurry 3 16 48 Linear Gel 40/70 NW Slurry 3 12 36 Linear Gel 40/70 RCP Flush 0 14.6 0 Slickwater Total 180 251.5 (Pad & Prop. Laden)
[0121] The following Case Studies have been performed on 5 wells located in Eddy and Lea Counties, N. Mex. All 5 wells were treated with the BRINE RESISTANT SDND on each stage of the fracture stimulation. Each well's completion summary and production analysis will be discussed in further detail in the following paragraphs of this paper.
[0122] It is well documented in the Petroleum Literature (Lee, Holditch, and others) that decline curve analysis associated with low permeability formations in both vertical and horizontal wells, can be very erroneous with limited production data. These erroneous predictions are mainly due to constant changes in the effective decline rates and slightly varying hyperbolic exponents (b-factor) during the wells early production life. The effective declines and hyperbolic exponents are varying over time, up to several years in some cases, due to the combination of zones with varying permeabilities, degrees of stimulation, and production rates, prior to the well achieving boundary dominated, pseudo-radial flow conditions. For this reason, the authors have chosen to analyze production enhancements using production rates and cumulative production plots compared to formulated type curves for the wells treated with the BRINE RESISTANT SDND.
[0123] For each well included in the Case Study, a type curve for each formation was plotted against the actual daily production recorded from the well. The type curves were constructed by the operator of the subject wells from actual production curves from previously drilled wells which directly offset the subject wells. In each case, the wells used to construct the type curves were treated with a nano-emulsion surfactant during the fracture stimulations. The type curves were verified using results obtained from reservoir simulation models.
[0124] Apart from Well A-1, which was pumped at an average rate of 38.5 BPM and completed with 43 stages, the stimulation designs for each study area were similar with respect to average proppant volumes, stages completed, and injection rates to help ensure an accurate comparison. Tables depicting the average stage stimulation results are discussed for each well included in the Case Study.
[0125] For purposes of the analyses in this patent application, the monthly type curve and actual daily and monthly production volumes were converted to Barrels of Oil Equivalent (BOE) volumes. The operator used a simple conversion equal to 6.0 Mscf/day per BOE, which was then added to the daily oil volumes. The cumulative BOE type curve estimates for each well and its associated productive formation are summarized in Table 3. The actual production volumes and comparisons are discussed in detail
TABLE-US-00030 TABLE 2 10-Year Predicted Type Curve Summaries, BOE Well Name Well A-1 Well A-2 Well A-3 Well B-1 Well B-2 (Cum. (Cum. (Cum. (Cum. (Cum. Time BOE) BOE) BOE) BOE) BOE) 30 Days 20,834 24,632 24,632 17,405 17,456 60 Days 38,685 46,047 46,047 31,794 32,535 90 Days 54,432 65,205 65,205 44,210 45,928 6 Months 93,441 113,341 113,341 74,248 79,471 12 Months 151,047 186,099 186,099 117,691 129,957 2 Years 230,000 289,010 289,010 177,101 201,197 3 Years 286,665 365,397 365,397 220,400 254,026 4 Years 331,634 427,696 427,696 255,422 297,100 5 Years 369,249 481,024 481,024 285,260 333,966 10 Years 503,142 677,727 677,727 395,331 474,847
[0126] It is well documented in the petroleum literature that unconventional reservoirs are sensitive to the Extended Stimulated Reservoir Volume (ESRV). By extending the ESRV it is possible to alter and improve initial production rate and the initial effective decline, resulting in increased recovery. Conventional proppants, even 100 Mesh or smaller, are too large to penetrate micro-darcy fractures necessary to extend the drainage area.
[0127] One interesting observation on all five subject wells, was that in each case the percent oil-cut was notably higher and the monthly water production figures were lower than expected.
[0128] Case Study Area "A"--Eddy County, N. Mex.
[0129] There are three wells selected for study in the Eddy County, N. Mex. area. Details for each of the treatments and the corresponding production increases associated with the BRINE RESISTANT SDND are discussed in the following paragraphs associated with Case Study Area "A". (The actual well names have been changed.) All three wells, county location, and associated producing formations are shown in Table 4.
[0130] Case Study Wells and Formations, Eddy County, N. Mex.
TABLE-US-00031 Well Name County Formation Well A-1 Eddy County Wolfcamp B Well A-2 Eddy County Wolfcamp X-Y Well A-3 Eddy County Wolfcamp X-Y
[0131] Well A-1: Wolfcamp B
[0132] Well A-1 was spud in March and was drilled to a total depth (TD) of 14,640 ft (9,887 ft TVD) with an 81/2'' borehole. Upon reaching measured TD, 51/2'', 20.0 lb/ft, P-110 casing was run to 14,639 ft and cemented with 1,420 sacks of cement. The well was fracture stimulated with 43 stages along the horizontal lateral using an average of 268,880 lbs of 30/50 Northern White (NW) proppant per stage. A summary of the average stimulation treatment values over all 43 stages is shown in Table 5.
TABLE-US-00032 TABLE 3 Well A-1: Average Per Stage Stimulation Data (43 Stages) Description Value Number of Stages 43 Average Injection Rate, BPM 38.5 Maximum Injection Rate, BPM 39.9 Final Fracture Gradient, psi/ft 0.89 Proppant Type 30/50 NW Total Avg. Proppant per Stage, lbs 269,000 15% HCl per Stage, gal 700 Slickwater per Stage, gal 76,500 Linear Gel per Stage, gal 136,500 XL Gel per Stage, gal 24,500 BRINE RESISTANT SDND per Stage, gal 500
[0133] The actual daily production for the first 150 days and the type curve (TC) anticipated production (120-month forecast) for the Wolfcamp B formation is plotted in FIGS. 9 and 10, respectively. The production response attributed to the BRINE RESISTANT SDND is forecast in FIG. 11. As shown in FIG. 11 and tabulated in Table 6, the actual production in BOE for the first 150 days (5 months) of production for Well A-1 exceeded the type curve prediction by 53,864 BOE, which equates to a 66.1% increase over predicted production.
[0134] Due to the possible errors in forecasted volumes using decline curve forecasts, both positive and negative, the cumulative production plots normalize the actual data making the predicted decline curves irrelevant. While the base economics for each case are not presented as part of this analysis, it is evident that the significant increase in production will present tremendous improvement in the NPV and IRR associated with the project.
[0135] The disjoining pressure and fragmentation of the hydrocarbons in the Wolfcamp B reservoir, associated with the BRINE RESISTANT SDND, are repeatedly resulting in significant increases in initial production rates and early cumulative production volumes not only in the Delaware Basin, but have been noted in the DJ Basin, the Bakken, the Wolfcamp in the Midland Basin, and the Austin Chalk, Buda and Frio formations in central Texas). The BRINE RESISTANT SDND has not yet been used in the Eagle Ford Shale formation.
TABLE-US-00033 TABLE 6 Well A-1: Actual Versus Type Curve Production @ 5 Months Cum. Cum. Actual Prod. TC Prod. Percent Month (MBOE) (MBOE) Increase 1 25.2 20.6 24.2 2 58.4 38.7 50.9 3 87.5 54.4 50.8 4 112.6 68.6 64.1 5 135.4 81.5 66.1
[0136] Well A-2: Wolfcamp X-Y Sand
[0137] Well A-2 was spud in February and was drilled to a TD of 14,032 ft (9,222 ft TVD) with an 83/4'' borehole. Upon reaching measured TD, 51/2'', 20.0 lb/ft, P-110 casing was run to 14,032 ft and cemented with 2,100 sacks of cement. The well was fracture stimulated with 32 stages along the horizontal lateral using an average of 293,500 lbs of NW and Resin Coated Proppant (RCP) per stage. A summary of the average stimulation treatment values over all 32 stages is shown in Table 7.
TABLE-US-00034 TABLE 4 Well A-2: Average Per Stage Stimulation Data (32 Stages) Description Value Number of Stages 32 Average Injection Rate, BPM 75.1 Maximum Injection Rate, BPM 77.2 Final Fracture Gradient, psi/ft 0.79 Avg. 40/70 NW per Stage, lbs 34,000 Avg. 20/40 NW per Stage, lbs 222,500 Avg. 20/40 RCP per Stage, lbs 34,000 Total Avg. Proppant per Stage, lbs 284,500 15% HCl per Stage, gal 750 Slickwater per Stage, gal 21,000 Linear Gel per Stage, gal 55,000 XL Gel per Stage, gal 140,000 BRINE RESISTANT SDND per 750 Stage, gal
[0138] The actual daily production for the first 150 days and the TC anticipated production (120-month forecast) for the Wolfcamp X-Y Sand is plotted in FIGS. 12 and 13, respectively. The production response attributed to the BRINE RESISTANT SDND is forecast in FIG. 14. As shown in FIG. 14 and tabulated in Table 8, the actual production in BOE for the first 150 days (5 months) of production for Well A-2 exceeded the type curve prediction by 31,776 BOE, which equates to a 32.3% increase over predicted production.
TABLE-US-00035 TABLE 5 Well A-2: Actual Versus Type Curve Production @ 5 Months Cum. Actual Prod. Cum. TC Prod. Percent Month (MBOE) (MBOE) Incr./Decr. 1 21.3 24.6 -13.4 2 55.5 46.1 20.6 3 85.4 65.2 31.0 4 107.7 82.6 30.4 5 130.3 98.5 32.3
[0139] The decreased actual amount of production compared to the predicted TC volume of 24.6 MBOE, was due to a partial month production. In month two (2), the cumulative production not only caught up to the predicted volume, but surpassed the predicted type curve volumes by amount by 20.6%. As time has increased, the actual cumulative production has continued to increase over that predicted by the Wolfcamp X-Y Sand TC.
[0140] Well A-3: Wolfcamp X-Y Sand
[0141] Well A-3 was spud in November and was drilled to a TD of 13,882 ft (9,314 ft TVD) with an 83/4'' borehole. Upon reaching measured TD, 51/2'', 20.0 lb/ft, P-110 casing was run to 13,882 ft and cemented with 2,545 sacks of cement. The well was fracture stimulated with 32 stages along the horizontal lateral using an average of 283,000 lbs of NW and Resin Coated Proppant (RCP) per stage. A summary of the average stimulation treatment values over all 32 stages is shown in Table 9.
TABLE-US-00036 TABLE 6 Well A-3: Average Per Stage Stimulation Data (32 Stages) Description Value Number of Stages 32 Average Injection Rate, BPM 72.7 Maximum Injection Rate, BPM 77.0 Final Fracture Gradient, psi/ft 0.81 Avg. 40/70 NW per Stage, lbs 30,000 Avg. 20/40 NW per Stage, lbs 222,500 Avg. 20/40 RCP per Stage, lbs 30,500 Total Avg. Proppant per Stage, lbs 283,000 15% HCl per Stage, gal 1,750 Slickwater per Stage, gal 23,000 Linear Gel per Stage, gal 50,000 XL Gel per Stage, gal 140,500 BRINE RESISTANT SDND per 500 Stage, gal
[0142] The actual daily production for the first 240 days is plotted in FIG. 15. The TC for Well A-3 is identical to Well A-2 since they are producing in the same reservoir and is previously shown in FIG. 13. The production response attributed to the BRINE RESISTANT SDND is forecast in FIG. 16. As shown in FIG. 16 and tabulated in Table 10, the actual production in BOE for the first 240 days (8 months) of production for Well A-3 exceeded the type curve prediction by 14,651 BOE, which equates to a 10.5% increase over predicted production.
[0143] Starting 68 days into the well's early production an offset well to Well A-3 fraced into the A-3 lateral, and dramatically reduced the daily oil and gas volumes for a period of a few weeks. It is noteworthy here that in addition to the BRINE RESISTANT SDND's chemistry to be independent of formation lithology, it also appears to remain at residual levels within the rock matrix and fracture networks to continue to improve flow mechanics over time. The residual presence within the fracture network was observed in core studies performed by an operator in the DJ Basin using Niobrara core. As shown in Table 10, the production figures after the offset well fracture breakthrough continued to improve compared to the predicted type curve values.
TABLE-US-00037 TABLE 7 Well A-2: Actual Versus Type Curve Production @ 8 Months Cum. Actual Cum. TC Prod. Prod. Percent Month (MBOE) (MBOE) Incr./Decr. 1 31.3 24.6 25.7 2 58.8 46.1 27.5 3 69.0 65.2 5.8 4 83.8 82.6 1.5 5 106.2 98.5 7.8 6 124.5 113.3 9.9 7 140.5 127.2 10.5 8 154.9 140.2 10.5
[0144] Case Study Area "B"--Lea County, N. Mex.
[0145] There are two (2) wells selected for study in the Lea County, N. Mex. area. Details for each of the treatments and the corresponding production increases associated with the BRINE RESISTANT SDND are discussed in the following paragraphs associated with Case Study Area "B". The actual well names have been changed. All both wells, county location, and associated producing formations are shown in Table 11.
TABLE-US-00038 TABLE 8 Case Study Wells and Formations, Lea County, NM Well Name County Formation Well B-1 Lea County 3.sup.rd Bone Spring Well B-2 Lea County 2.sup.nd Bone Spring
[0146] Well B-1: 3.sup.rd Bone Spring
[0147] Well B-1 was spud in August and was drilled to a TD of 16,082 ft (11,620 ft TVD) with an 83/4'' borehole. Upon reaching measured TD, 51/2'', 20.0 lb/ft, P-110 casing was run to 16,082 ft and cemented with 1,655 sacks of cement. The well was fracture stimulated with 28 stages along the horizontal lateral using an average of 284,500 lbs of 40/70 NW, 40/70 Light-Weight Ceramic (LWC) Proppant and 20/40 LWC Proppant per stage. A summary of the average stimulation treatment values over all 28 stages is shown in Table 12.
TABLE-US-00039 TABLE 9 Well B-1: Average Per Stage Stimulation Data (28 Stages) Description Value Number of Stages 28 Average Injection Rate, BPM 69.9 Maximum Injection Rate, BPM 75.0 Final Fracture Gradient, psi/ft 0.83 Avg. 40/70 NW per Stage, lbs 12,500 Avg. 40/70 LW Ceramic per Stage, lbs 139,500 Avg. 20/40 LW Ceramic per Stage, lbs 96,000 Total Avg. Proppant per Stage, lbs 248,000 15% HCl per Stage, gal 3,000 Slickwater per Stage, gal 48,000 XL Gel per Stage, gal 121,500 BRINE RESISTANT SDND per Stage, gal 1,500
[0148] The actual daily oil and gas production for the first 300 days and the 3.sup.rd Bone Spring TC is plotted in FIGS. 17 and 18, respectively. The production response attributed to the BRINE RESISTANT SDND is forecast in FIG. 19. As shown in FIG. 19 and tabulated in Table 13, the actual oil and gas production in BOE for the first 300 days (10 months) of production for Well B-1 exceeded the type curve prediction by 20,215 BOE, which equates to a 19.8% increase over predicted production.
[0149] After 159 days into the well's early production an offset well to the B-1 fraced into the B-1 lateral, and dramatically reduced the daily oil and gas volumes for a period of about 8 days. Similar to the response seen in the A-3 in Eddy County, the production from the B-1 recovered over several weeks' time and continued to increase compared to the 3.sup.rd Bone Spring type curves.
TABLE-US-00040 TABLE 10 Well B-1: Actual Versus Type Curve Production @ 10 Months Cum. Actual Prod. Cum. TC Prod. Percent Month (MBOE) (MBOE) Incr./Decr. 1 20.0 17.4 14.9 2 37.4 31.8 17.6 3 52.3 44.2 18.3 4 63.1 55.2 14.3 5 76.1 65.2 16.7 6 83.6 74.2 12.7 7 90.5 82.7 9.4 8 102.0 90.5 12.7 9 114.0 97.4 17.0 10 125.0 104.3 19.8
[0150] Well B-2: 2.sup.nd Bone Spring
[0151] Well B-2 was spud in September and was drilled to a TD of 15,441 ft (10,808 ft TVD) with an 83/4'' borehole. Upon reaching measured TD, 51/2'', 20.0 lb/ft, P-110 casing was run to 15,441 ft and cemented with 1,585 sacks of cement. The well was fracture stimulated with 29 stages along the horizontal lateral using an average of 218,500 lbs of 40/70 NW, 40/70 Light-Weight Ceramic (LWC) Proppant and 20/40 LWC Proppant per stage. A summary of the average stimulation treatment values over all 29 stages is shown in Table 14.
[0152] The actual daily oil and gas production for the first 300 days and the 3.sup.rd Bone Spring TC is plotted in FIGS. 20 and 21, respectively. The production response attributed to the BRINE RESISTANT SDND is forecast in FIG. 22. As shown in FIG. 22 and tabulated in Table 15, the actual oil and gas production in BOE for the first two (2) months of production for Well B-2 exceeded the type curve prediction by 8,843 BOE, which equates to a 27.4% increase over predicted production. There are two significant production anomalies which need to be further explained, which become evident in FIG. 22 and drastically affect the cumulative production which was recorded for 327 days at the time of filing of this patent application.
[0153] After 113 days into the well's early production, the operator shut-in the B-2 was to avoid possible completion damage during fracture stimulation operations on another well directly offsetting the horizontal lateral. The well remained SI until the decision was made to continue, at which time it was returned to production by gas lift. Shortly thereafter, the well began experiencing severe gas supply problems which again affected the production over an extended period. The gas supply problems continued to plague the well's production which is seen in FIG. 20 at approximately 260 days of cumulative time. At that point, the well was worked over and artificial lift using a rod pump was installed on the well. The final several days of production in FIG. 20 shows a definitive slope change with respect to production rates. Information received from the operator has verified that the production has increased to the point that if present slopes continue, will again surpass the predicted TC volumes within the next 1-2 months.
TABLE-US-00041 TABLE 11 Well B-2: Average Per Stage Stimulation Data (29 Stages) Description Value Number of Stages 29 Average Injection Rate, BPM 63.7 Maximum Injection Rate, BPM 72.0 Final Fracture Gradient, psi/ft 0.75 Avg. 40/70 NW per Stage, lbs (1.sup.st Stg.) 80,000 Avg. 40/70 LW Ceramic per Stage, lbs 31,000 Avg. 20/40 LW Ceramic per Stage, lbs 187,500 Total Avg. Proppant per Stage, lbs 218,500 15% HCl per Stage, gal 3,000 Slickwater per Stage, gal 15,000 Linear Gel per Stage, gal (where run) 10,000 XL Gel per Stage, gal 98,000 BRINE RESISTANT SDND per Stage, gal 1,000
[0154] It is recommended that the application of pre-pad BRINE RESISTANT SDND pills be implemented in all types of reservoir flow systems to achieve enhanced project economics. In certain cases, the cost of the BRINE RESISTANT SDND may increase the overall completion cost, but early indications are that the incremental economics resulting from the increased revenues render the chemical cost increase negligible when compared to project NPV.
TABLE-US-00042 TABLE 12 Well B-2: Actual Versus Type Curve Production @ 10 Months Cum. Actual Cum. TC Prod. Prod. Percent Month (MBOE) (MBOE) Incr./Decr. 1 22.2 17.5 26.9 2 41.4 32.5 27.4 3 56.5 45.9 23.1 4 68.1 58.1 17.2 5 74.9 69.2 8.2 6 84.0 79.5 5.7 7 92.3 89.1 3.6 8 99.0 98.1 0.9 9 103.7 106.7 -2.8 10 108.9 114.8 -5.1 10.9 113.4 121.8 -6.9
[0155] In summary, the stimulation of several Wolfcamp and Bone Springs targeted wells in the northern Delaware Basin using fracturing treatments and a new method employing relatively small pre-pad pill volumes of nanoparticle dispersions ahead of each stage of treatment have been successfully performed. The liquid nanoparticle dispersion pre-pad pills used in each stage consist of highly surface modified, neutral wet nanoparticles dispersed in small water volumes which penetrate the reservoir's natural fracture and secondary induced fracture network via accelerated diffusion into the reservoir beyond the primary induced fracture network, producing a Brownian motion activated, mechanical advantage process known as disjoining pressure. These neutral wet, solid nanoparticles aid in delivering improved efficacy in the recovery of hydrocarbons via counter-current imbibition by fragmenting the disjoined oil into smaller oil droplets, enabling a more efficient backflow to the propped fracture network and back to the wellbore. The nanoparticle dispersion pre-pad pills are used to introduce the nanoparticle dispersion farther into the reservoirs naturally fractured/permeable matrix network and employ the mechanisms described above to enhance and sustain the mobility of hydrocarbons (overcome confining capillary pressures) back to the propped facture network and subsequently to the wellbore.
[0156] Advantages of this method and mechanical process are the ability to access the reservoir beyond where proppants can be placed thereby improving the effective stimulated reservoir volume. The evaluation of results in these zones has shown that utilizing the nanoparticle pre-pad pills has resulted in significantly improved performance (20-30 percent higher than the best available technology) compared to over 15 offset wells when normalized with respect to stimulation and production techniques and procedures. The results include significantly higher oil cuts for a longer sustained time periods as well as providing earlier oil to surface after treatment flowback and continued flowing production before requiring artificial lift implementation. While the number of offset wells is greater than nanoparticle dispersion treated wells, the results clearly demonstrate that there is a positive impact as well as persistent improvement factor (EUR) from using the pre-pad nanoparticle dispersion pills ahead of each stage. The liquid nanoparticle dispersion pre-pad pills used in each stage consist of highly surface modified, neutral wet nanoparticles dispersed in small water volumes which penetrates via accelerated.
[0157] The BRINE RESISTANT SDND composition may eliminate the necessity of pumping other state-of-the-art surfactant additives.
[0158] Pre-pad pills are effective methods to place materials deeper into the reservoir system allowing recovery of incremental oil (counter-current imbibition).
[0159] Conventional Darcy's Law reservoir flow mechanics are enhanced due to the Brownian Motion diffusion driven effects from BRINE RESISTANT SDND treatments by overcoming Fick's Law of Diffusion.
[0160] BRINE RESISTANT SDND treatments can increase initial production rates exceeding 20.0% compared to wells either not treated with the BRINE RESISTANT SDND technology or treated by conventional nano-emulsion surfactants.
[0161] Increased incremental recovery and initial rate, by definition, will increase the projected NPV and Rate of Return.
[0162] In the claims, as well as in the specification above, all transitional phrases such as "comprising," "including," "carrying," "having," "containing," "involving," "holding," and the like are to be understood to be open-ended, i.e. to mean including but not limited to. Only the transitional phrases "consisting of" and "consisting essentially of" shall be closed or semi-closed transitional phrases, respectively.
[0163] While several embodiments of the present invention have been described and illustrated herein, those of ordinary skill in the art will readily envision a variety of other means and/or structures for performing the functions and/or obtaining the results and/or one or more of the advantages described herein, and each of such variations and/or modifications is deemed to be within the scope of the present invention. More generally, those skilled in the art will readily appreciate that all parameters, dimensions, materials, and configurations described herein are meant to be exemplary and that the actual parameters, dimensions, materials, and/or configurations will depend upon the specific application or applications for which the teachings of the present invention is/are used. Those skilled in the art will recognize, or be able to ascertain using no more than routine experimentation, many equivalents to the specific embodiments of the invention described herein. It is, therefore, to be understood that the foregoing embodiments are presented by way of example only and that, within the scope of the appended claims and equivalents thereto, the invention may be practiced otherwise than as specifically described and claimed. The present invention is directed to each individual feature, system, article, material, kit, and/or method described herein. In addition, any combination of two or more such features, systems, articles, materials, kits, and/or methods, if such features, systems, articles, materials, kits, and/or methods are not mutually inconsistent, is included within the scope of the present invention.
* * * * *
D00000
D00001
D00002
D00003
D00004
D00005
D00006
D00007
D00008
D00009
D00010
D00011
D00012

D00013

D00014

D00015

D00016

D00017
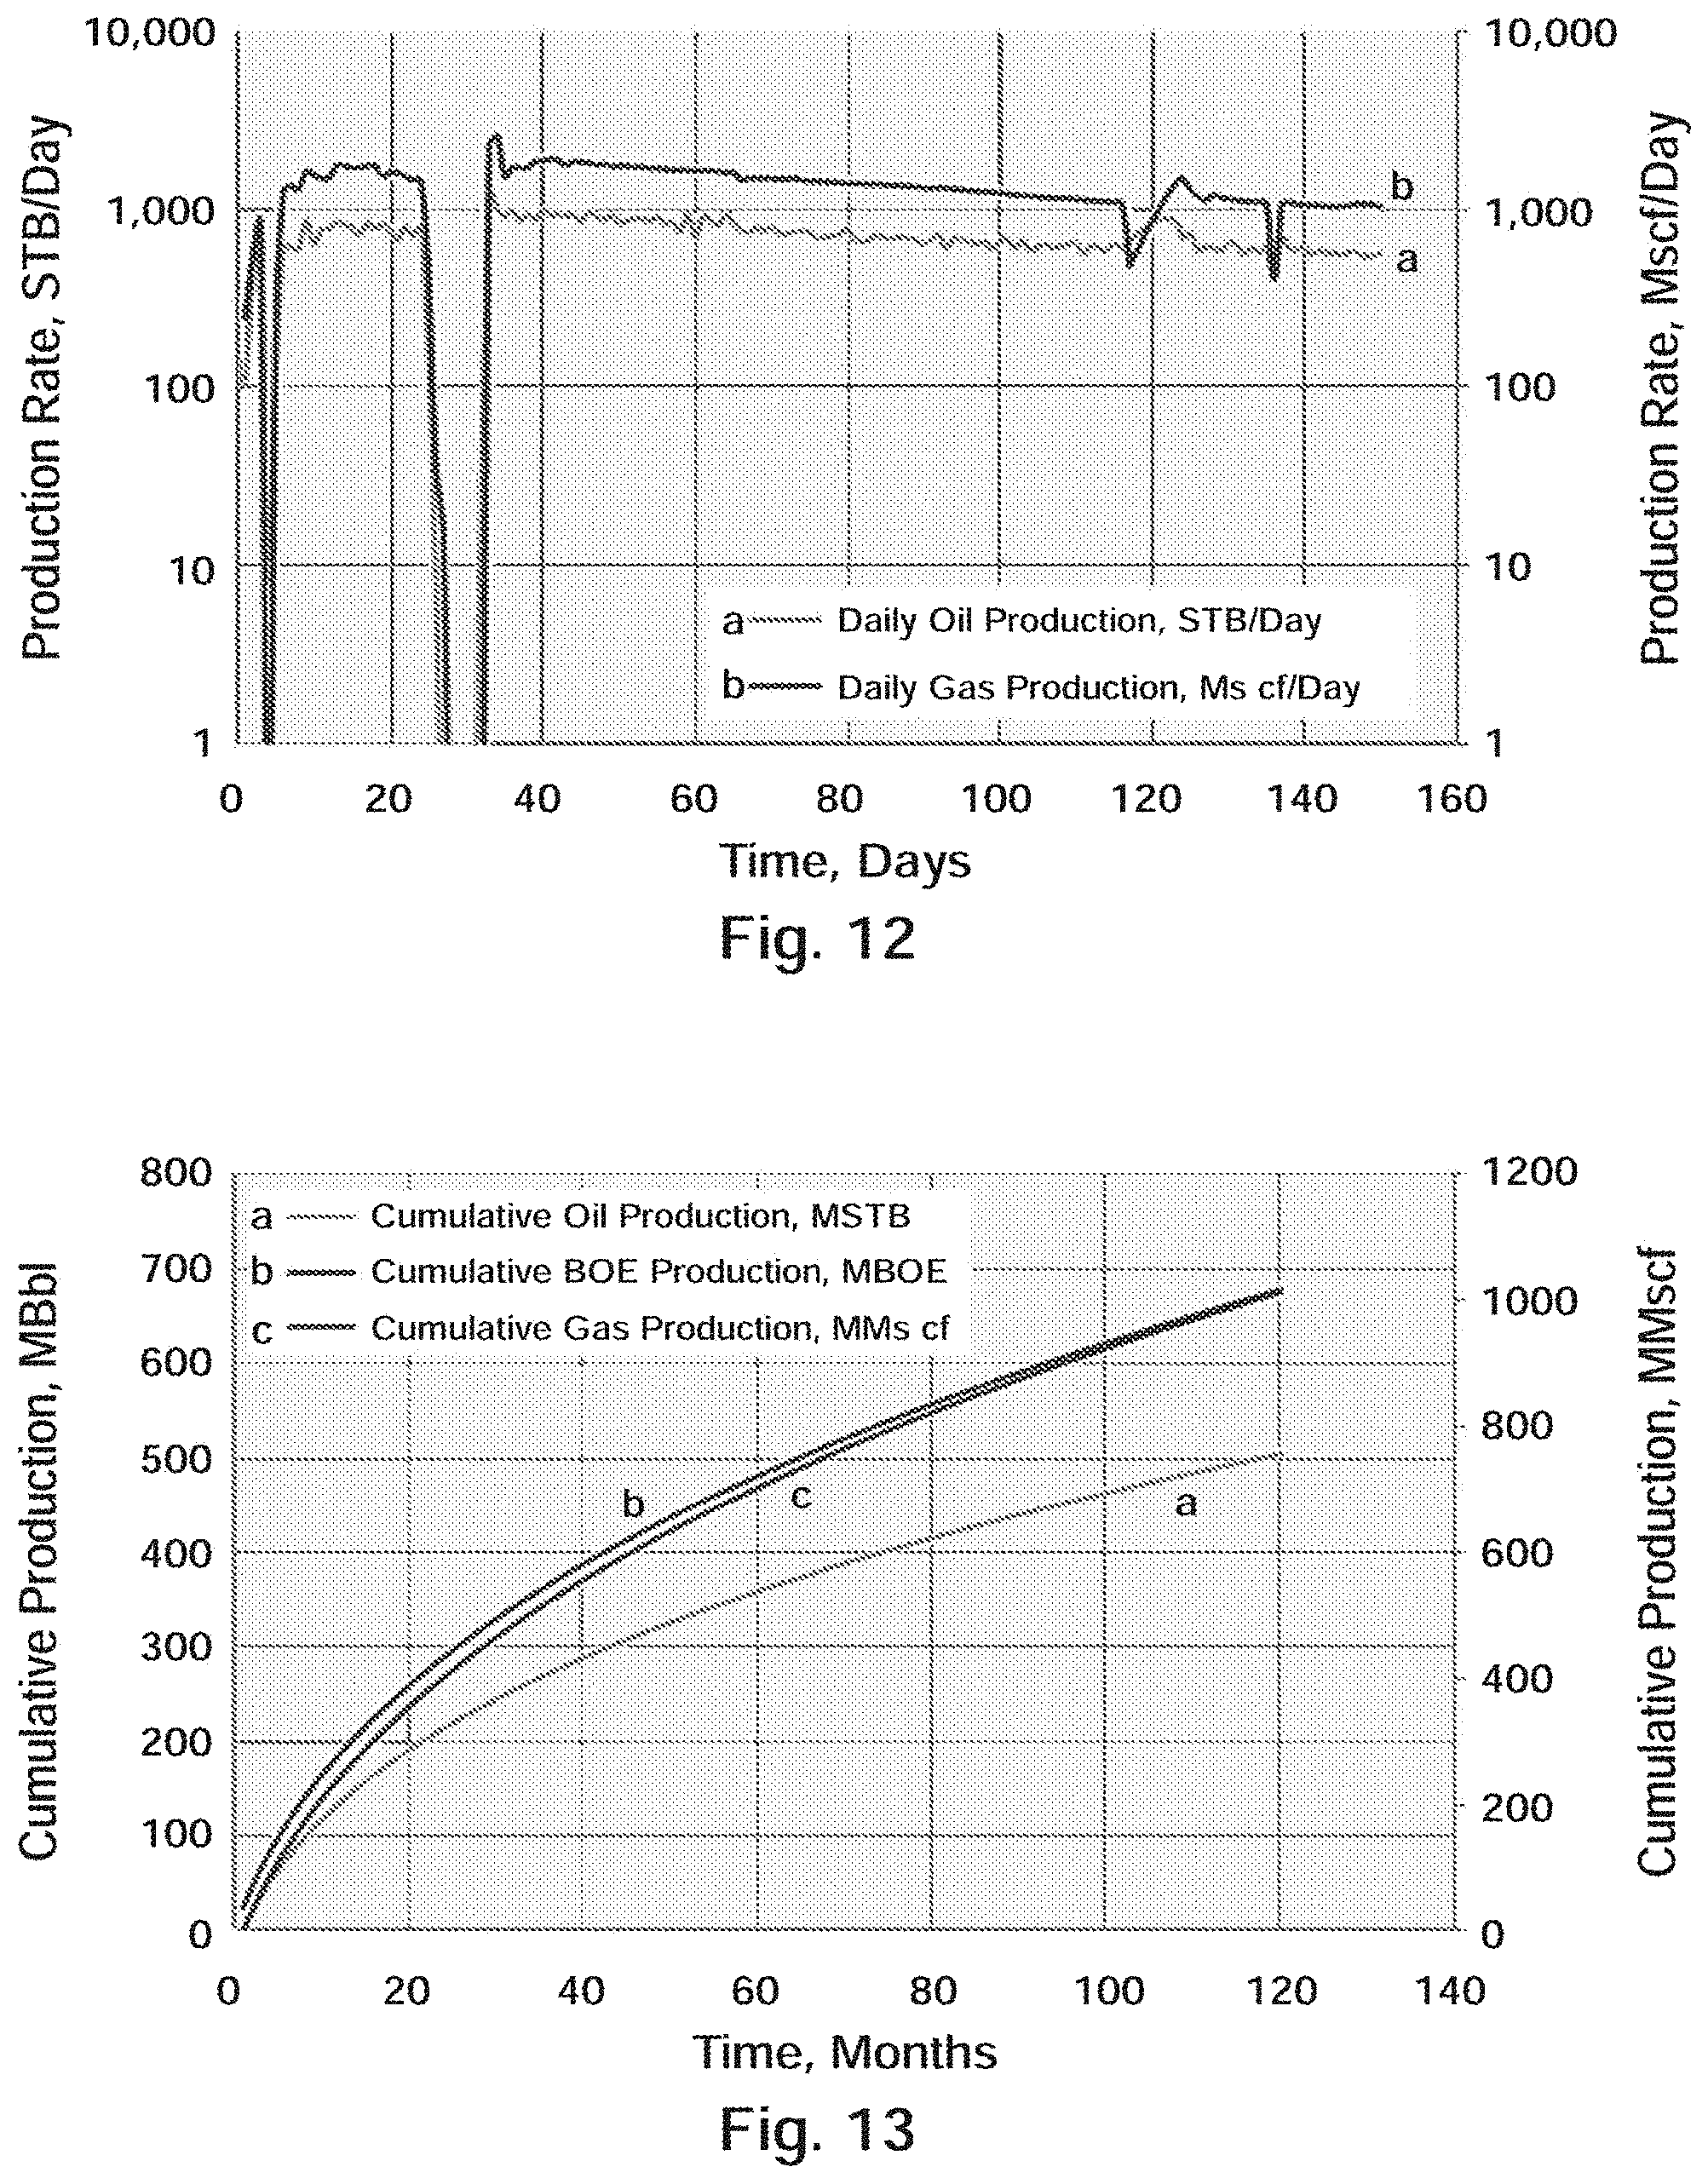
D00018
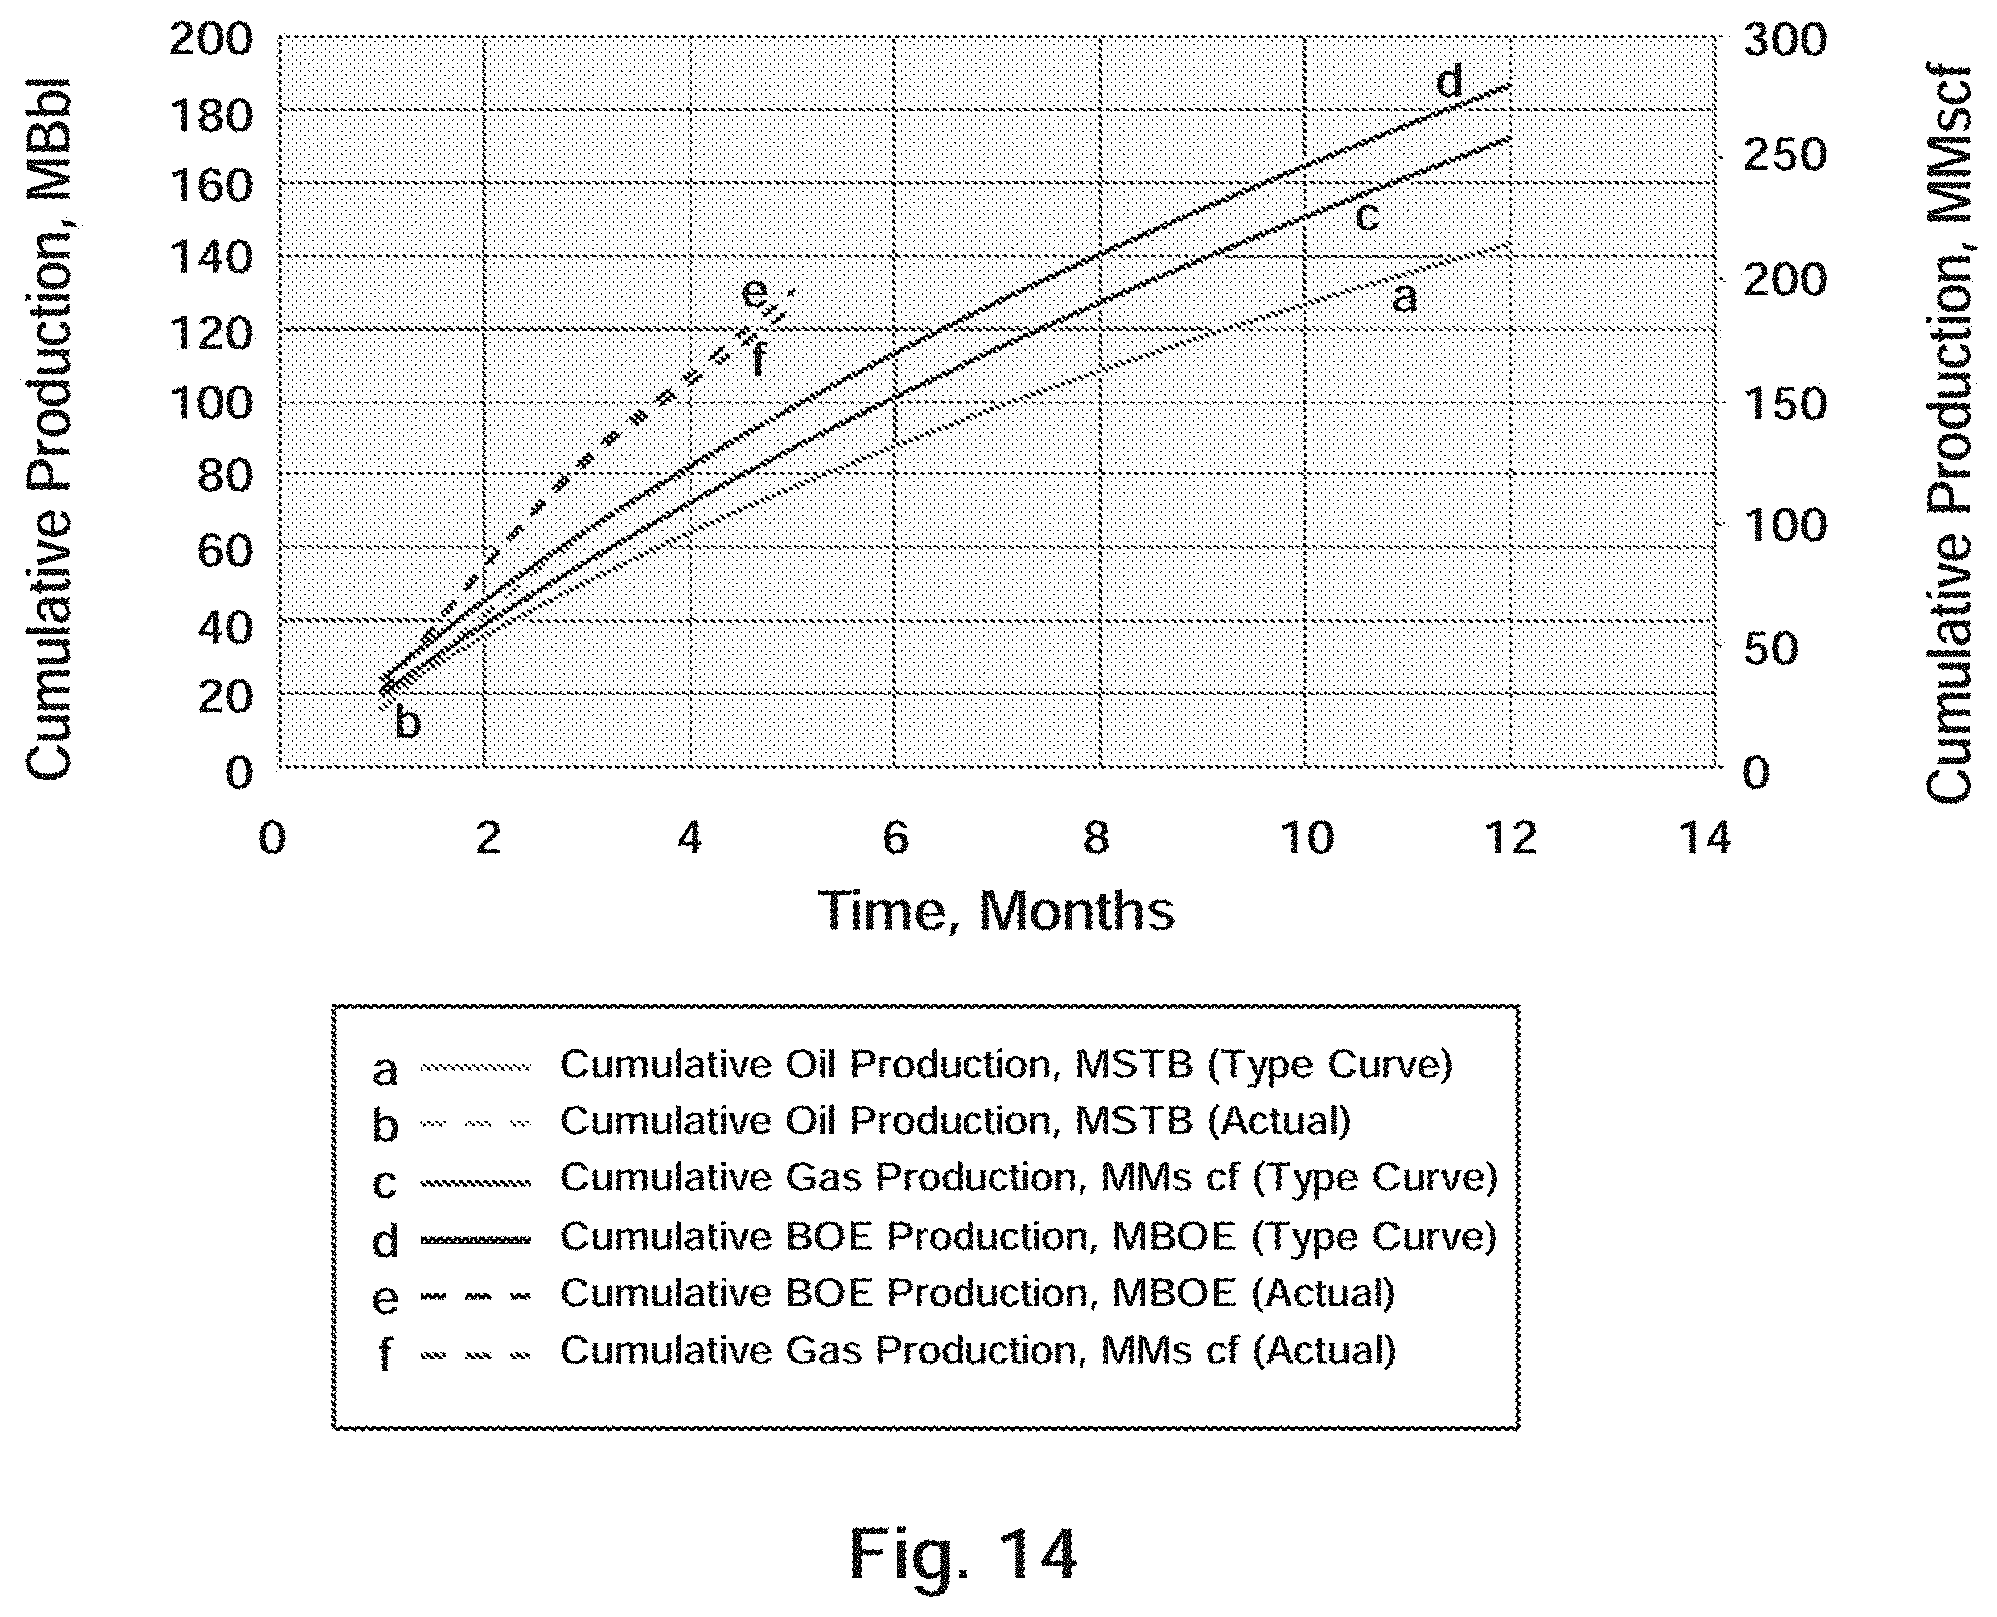
D00019
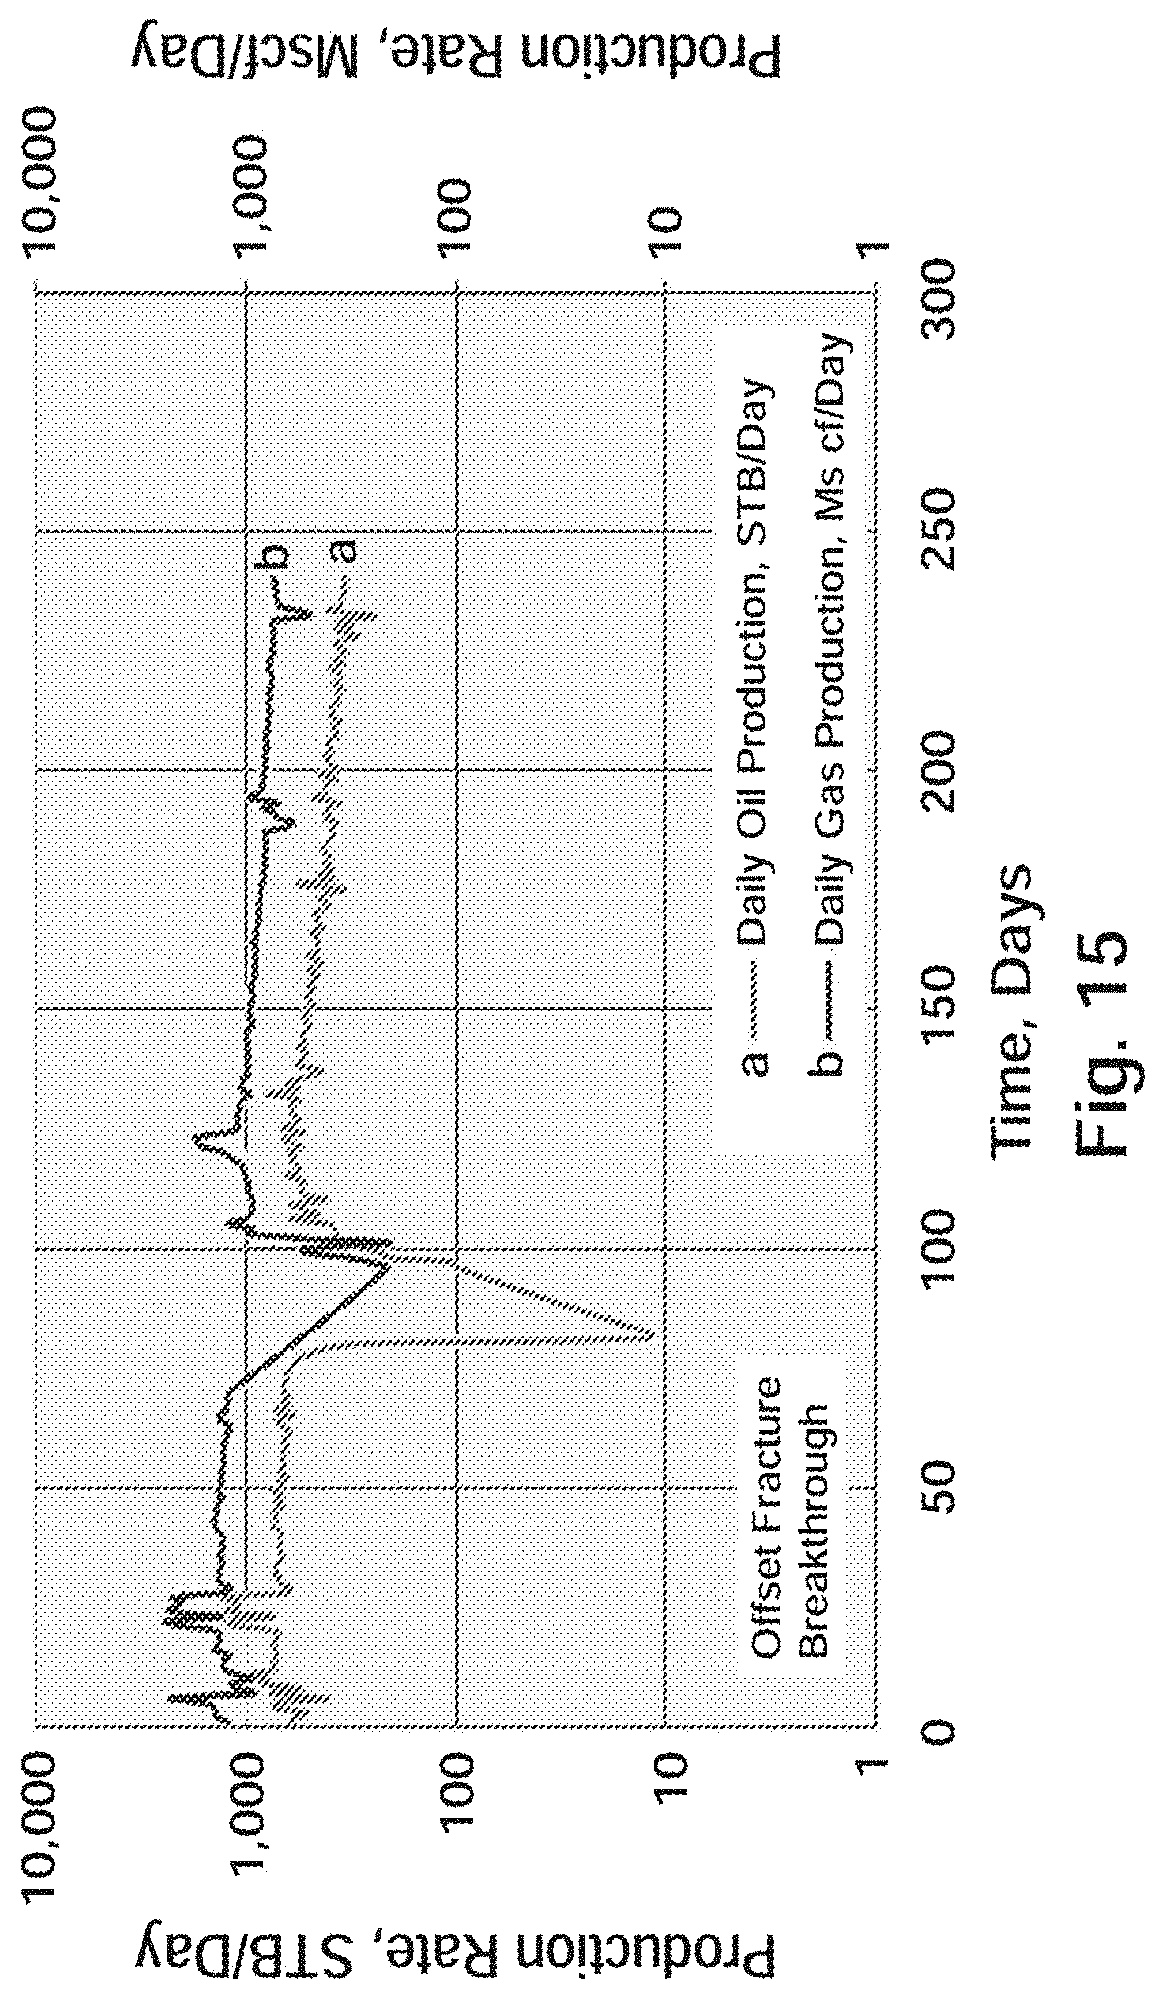
D00020
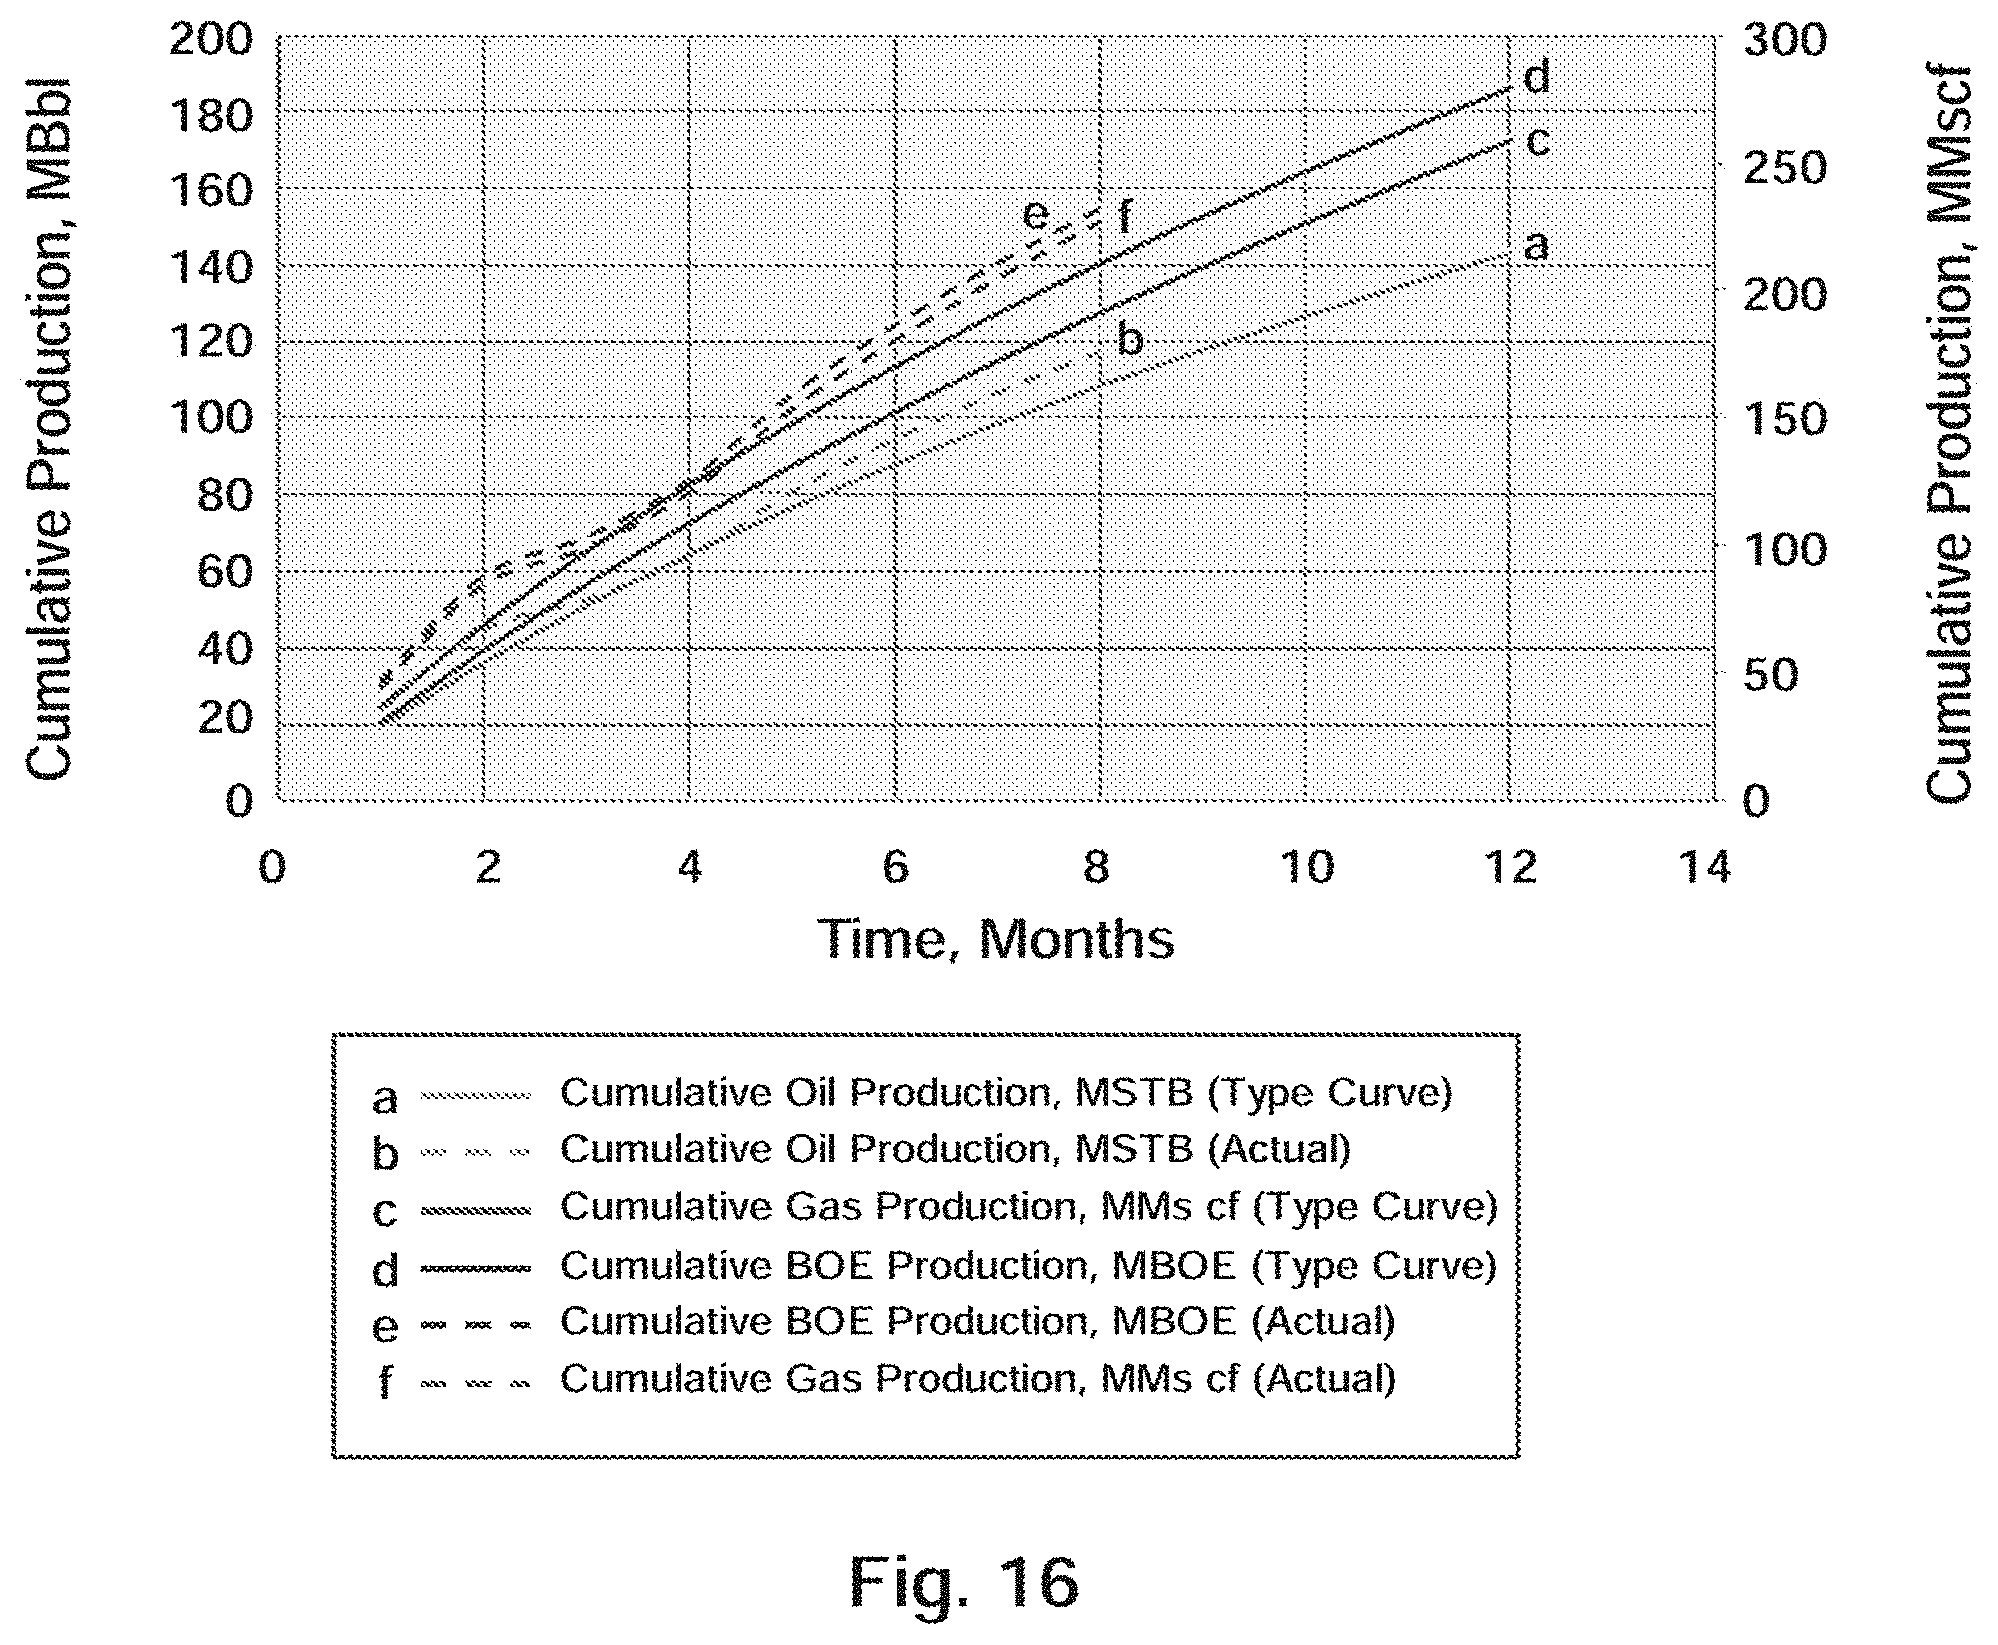
D00021

D00022
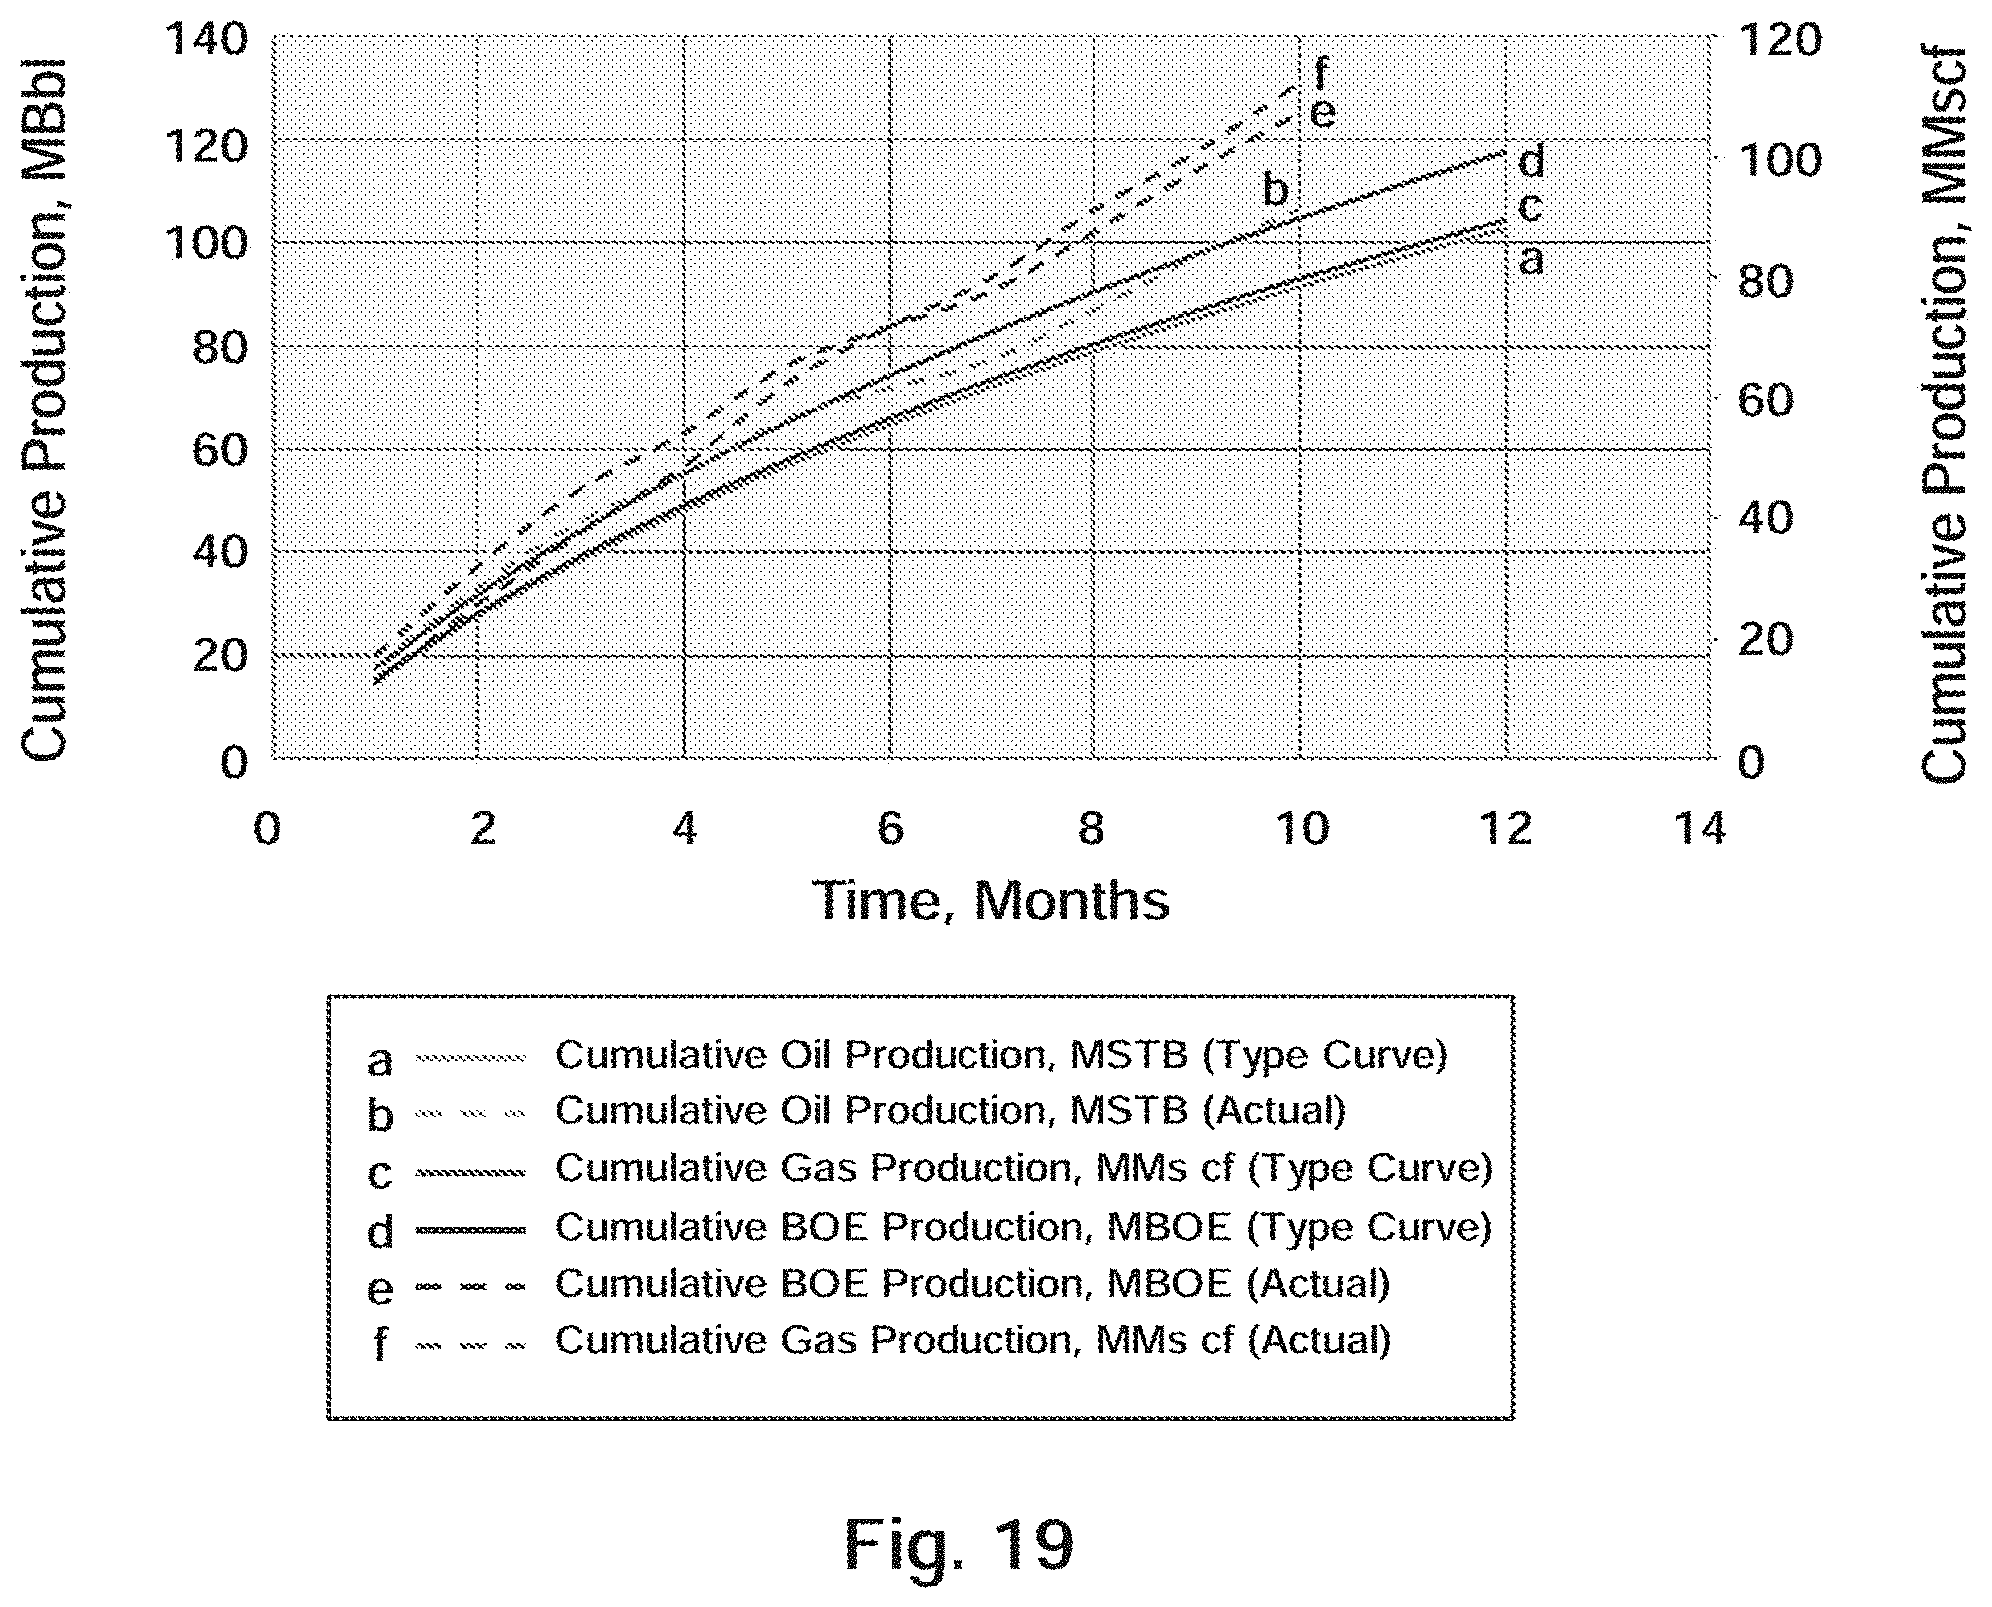
D00023
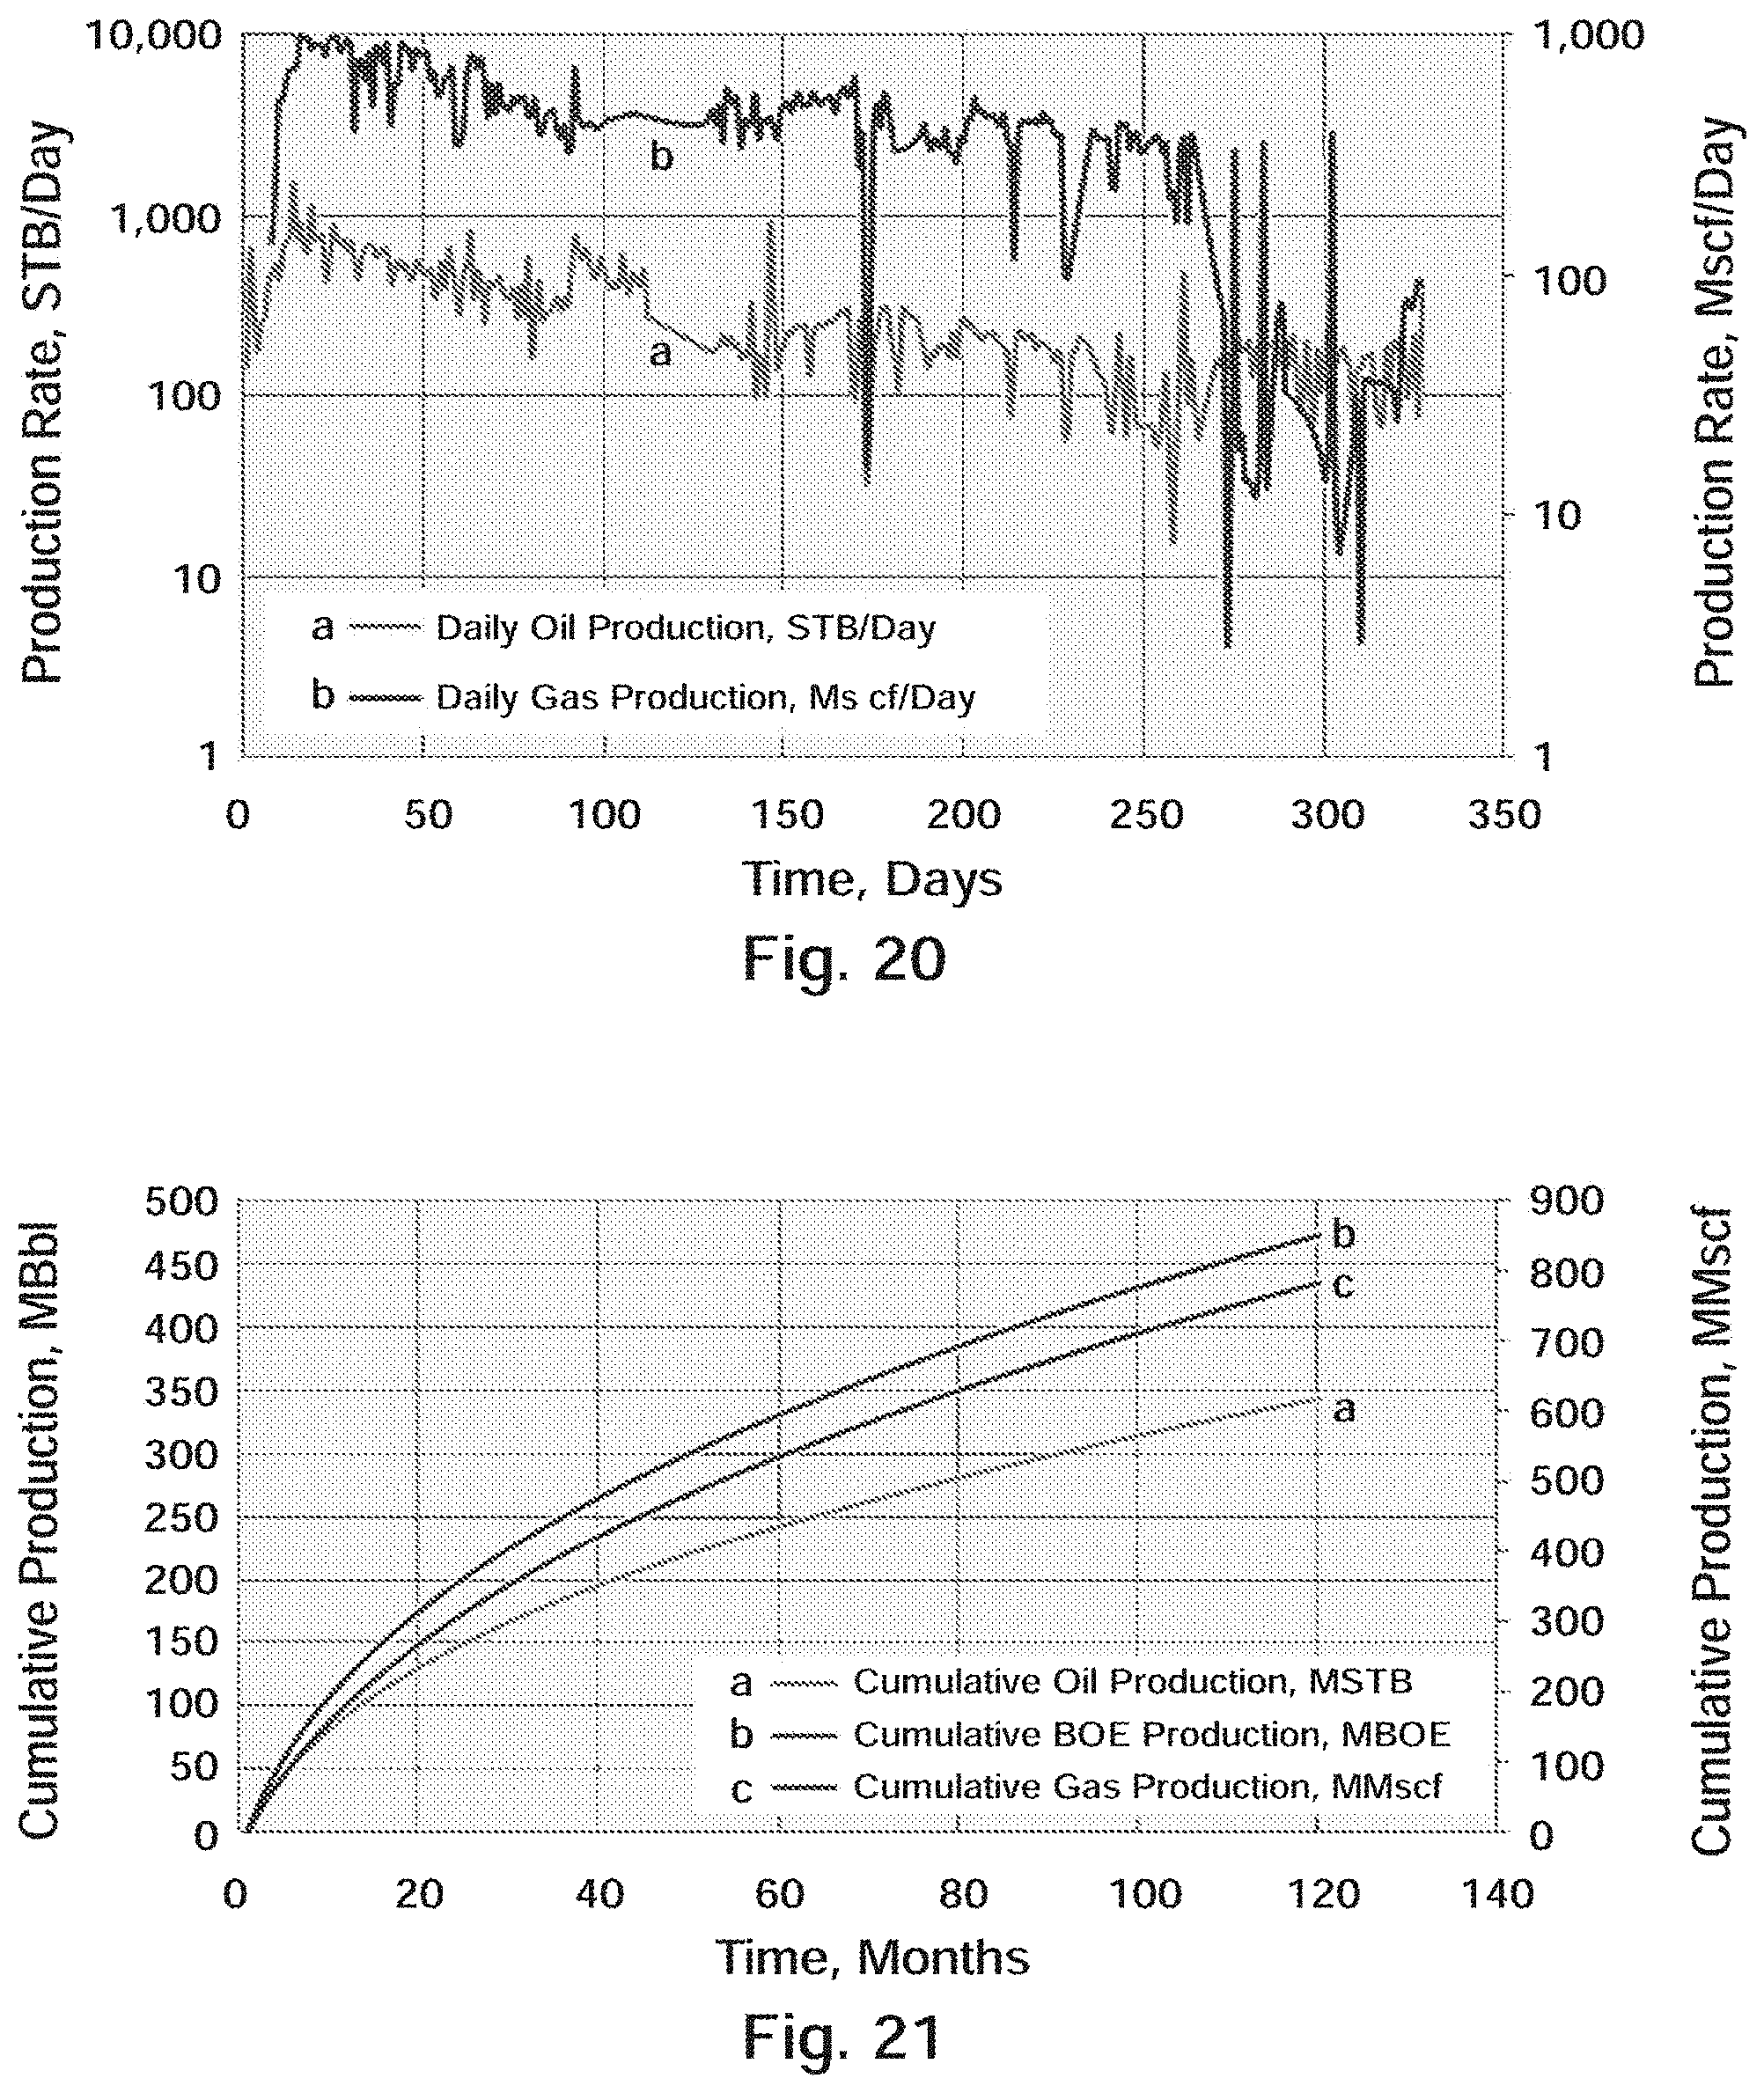
D00024
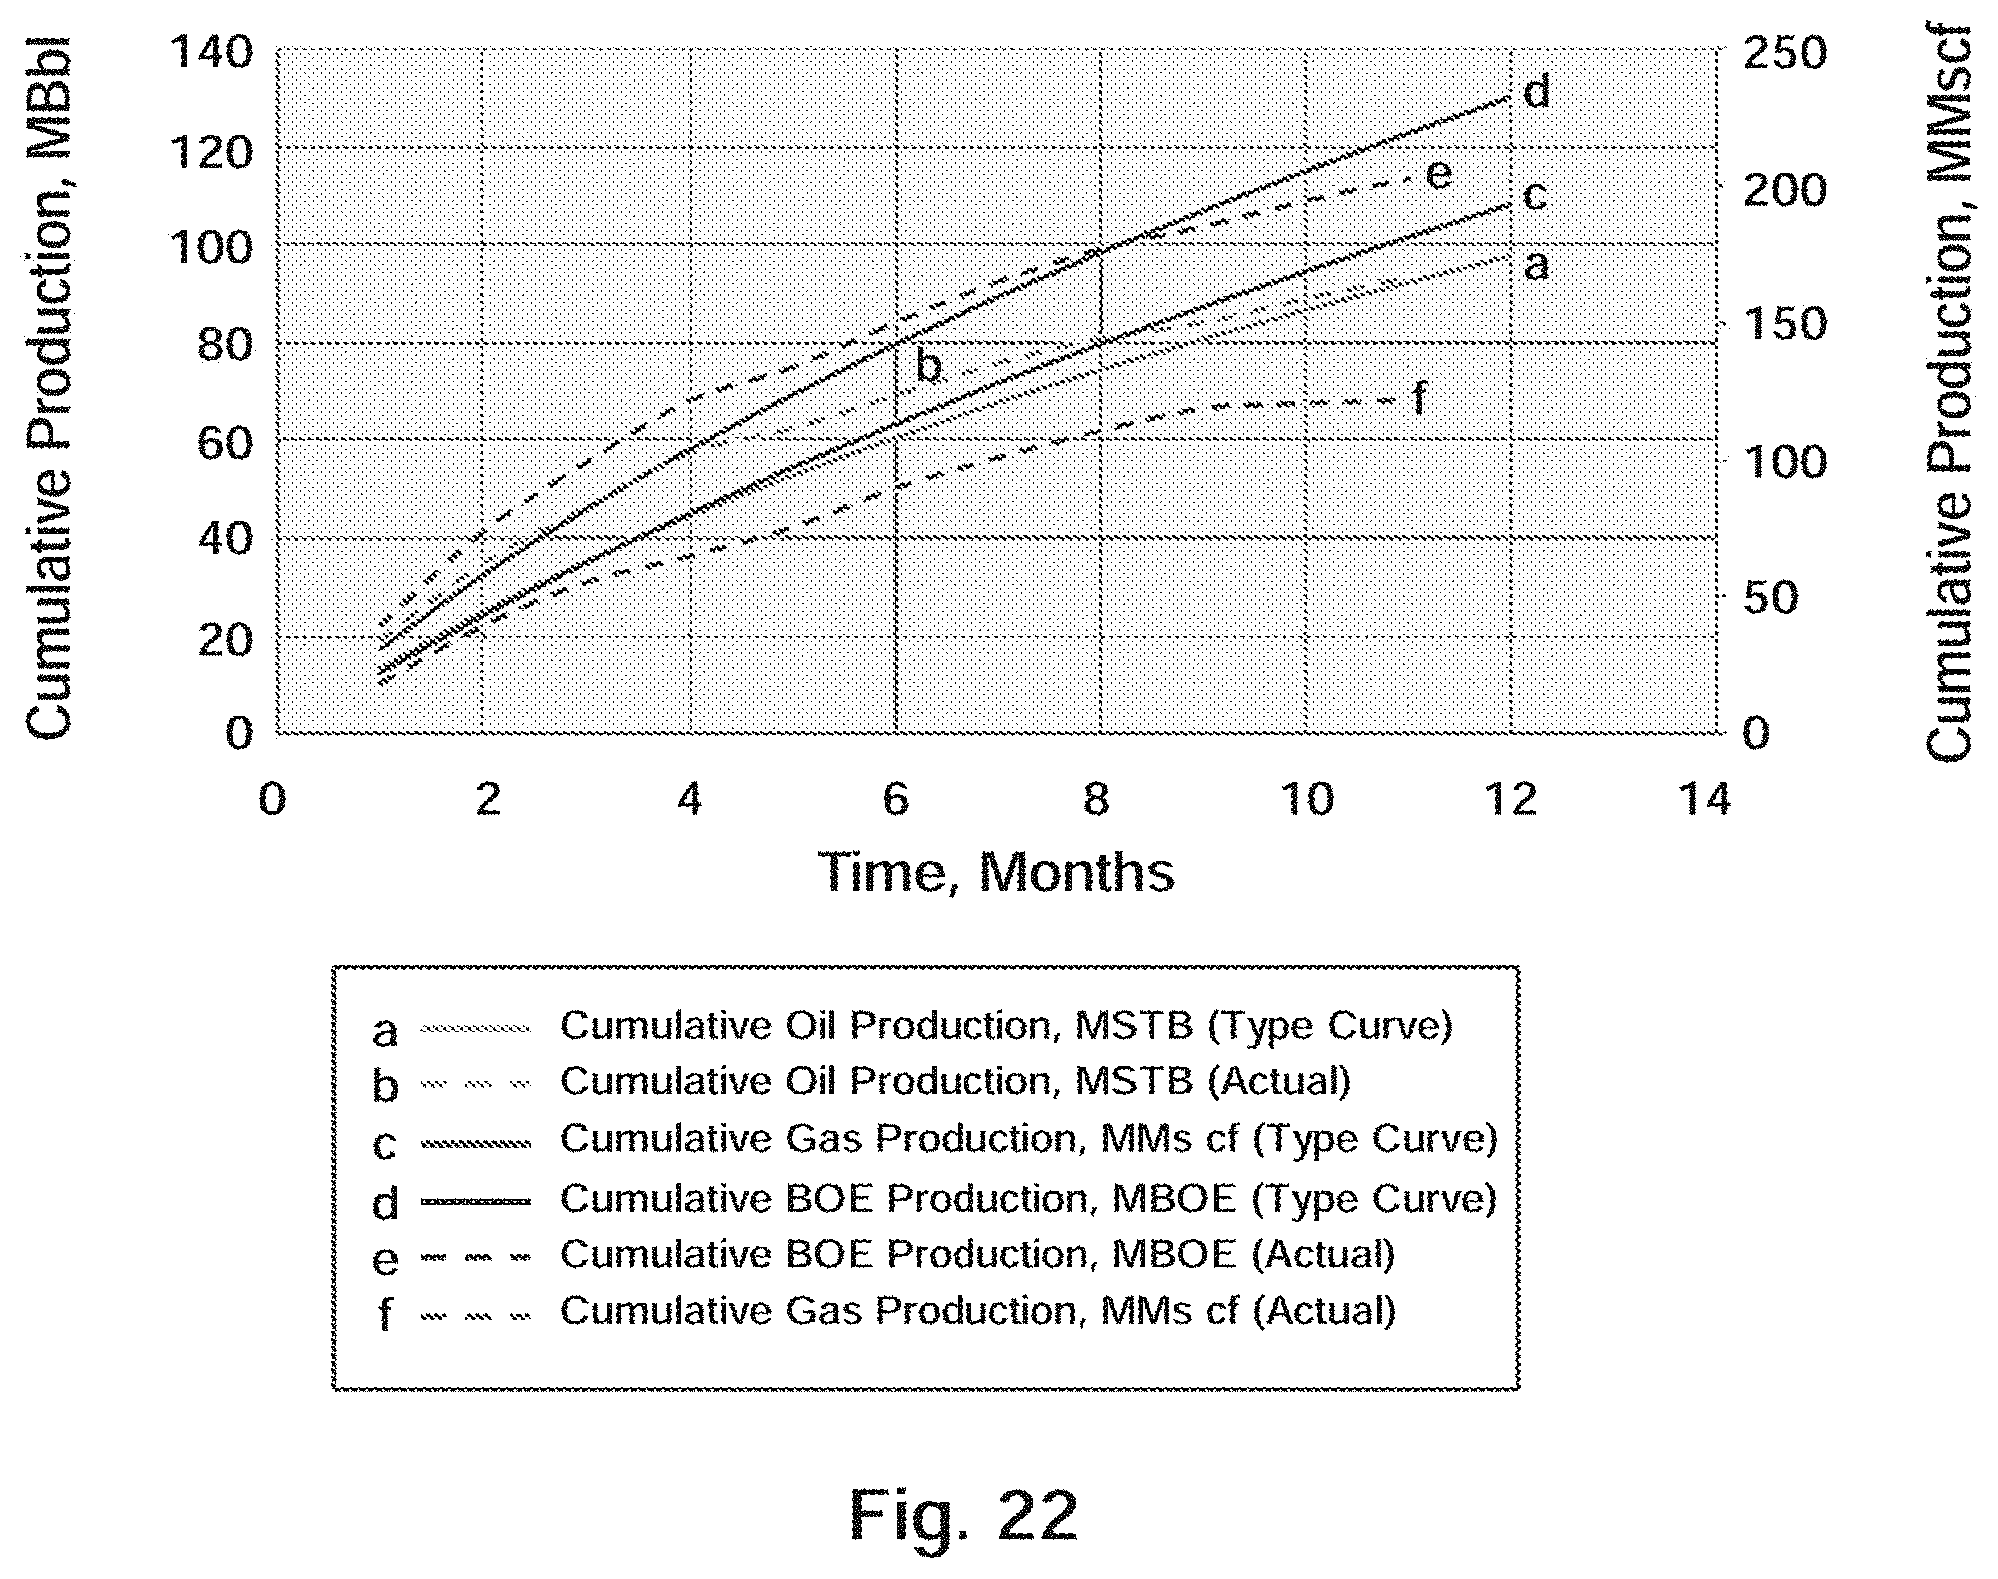
XML
uspto.report is an independent third-party trademark research tool that is not affiliated, endorsed, or sponsored by the United States Patent and Trademark Office (USPTO) or any other governmental organization. The information provided by uspto.report is based on publicly available data at the time of writing and is intended for informational purposes only.
While we strive to provide accurate and up-to-date information, we do not guarantee the accuracy, completeness, reliability, or suitability of the information displayed on this site. The use of this site is at your own risk. Any reliance you place on such information is therefore strictly at your own risk.
All official trademark data, including owner information, should be verified by visiting the official USPTO website at www.uspto.gov. This site is not intended to replace professional legal advice and should not be used as a substitute for consulting with a legal professional who is knowledgeable about trademark law.