MicroRNA-based methods and assays for osteocarcinoma
Ochiya; Takahiro ; et al.
U.S. patent application number 16/501468 was filed with the patent office on 2021-01-21 for microrna-based methods and assays for osteocarcinoma. The applicant listed for this patent is 3-D Matrix, Ltd., National Cancer Center. Invention is credited to Tomohiro Fujiwara, Takahiro Ochiya.
| Application Number | 20210015843 16/501468 |
| Document ID | / |
| Family ID | 1000005313070 |
| Filed Date | 2021-01-21 |


View All Diagrams
| United States Patent Application | 20210015843 |
| Kind Code | A9 |
| Ochiya; Takahiro ; et al. | January 21, 2021 |
MicroRNA-based methods and assays for osteocarcinoma
Abstract
Provided are methods and compositions useful in the diagnosis, treatment, and monitoring of osteosarcoma. Antisense to certain microRNA (miRNA) found to be associated with cancer stem cells (CSCs) or tumor-initiating cells (TICs) of osteosarcoma are useful to suppress tumor growth and metastasis, and prolong survival. Antisense oligonucleotides to miR-133a are synergistic in combination with standard chemotherapy such as cisplatin in the treatment of osteosarcoma.
| Inventors: | Ochiya; Takahiro; (Tokyo, JP) ; Fujiwara; Tomohiro; (Tokyo, JP) | ||||||||||
| Applicant: |
|
||||||||||
|---|---|---|---|---|---|---|---|---|---|---|---|
| Prior Publication: |
|
||||||||||
| Family ID: | 1000005313070 | ||||||||||
| Appl. No.: | 16/501468 | ||||||||||
| Filed: | April 4, 2019 |
Related U.S. Patent Documents
| Application Number | Filing Date | Patent Number | ||
|---|---|---|---|---|
| 16375056 | Apr 4, 2019 | |||
| 16501468 | ||||
| 15096480 | Apr 12, 2016 | |||
| 16375056 | ||||
| 14240178 | Apr 9, 2014 | 9322016 | ||
| PCT/IB2012/002626 | Sep 7, 2012 | |||
| 15096480 | ||||
| 61696981 | Sep 5, 2012 | |||
| 61531942 | Sep 7, 2011 | |||
| Current U.S. Class: | 1/1 |
| Current CPC Class: | A61K 31/7115 20130101; A61K 45/06 20130101; A61K 31/7105 20130101; A61K 31/282 20130101; A61P 35/00 20180101 |
| International Class: | A61K 31/7105 20060101 A61K031/7105; A61K 31/282 20060101 A61K031/282; A61P 35/00 20060101 A61P035/00; A61K 31/7115 20060101 A61K031/7115 |
Claims
1-27. (canceled)
1. A method of treating osteosarcoma, comprising administering to a subject in need thereof an effective amount of an antisense molecule specific for microRNA (miRNA) chosen from miR-1 and miR-10b, thereby treating the osteosarcoma.
2. The method of claim 28, wherein the antisense molecule is stabilized RNA.
3. The method of claim 29, wherein the stabilized RNA is a locked nucleic acid (LNA). oligonucleotide.
41. The method of claim 28, wherein the antisense molecule is DNA.
42. The method of claim 28, wherein the antisense molecule is 20-30 nucleotides long and comprises a nucleotide sequence at least 90 percent identical to any one of the nucleic acid sequences consisting of a group SEQ ID NO:4; SEQ ID NO:7; and SEQ ID NO:10 (all antisense to miR-1).
43. The method of claim 42, wherein the antisense molecule is 20-30 nucleotides long and comprises a nucleotide sequence at least 90 percent identical SEQ ID NO:4.
44. The method of claim 42, wherein the antisense molecule is 20-30 nucleotides long and comprises a nucleotide sequence at least 90 percent identical SEQ ID NO:7.
45. The method of claim 42, wherein the antisense molecule is 20-30 nucleotides long and comprises a nucleotide sequence at least 90 percent identical SEQ ID NO:10.
46. The method of claim 42, wherein the sequence of the antisense molecule comprises any one of the nucleotide sequences SEO ID NO:4; SEQ ID NO:7; and SEQ ID NO:10.
47. The method of claim 28, wherein the antisense molecule is 20-30 nucleotides long and comprises a nucleotide sequence at least 90 percent identical to any one of the nucleic acid sequences consisting of a group SEQ ID NO:5; SEQ ID NO:8; and SEQ ID NO:11 (all antisense to miR-10b).
48. The method of claim 47, wherein the antisense molecule is 20-30 nucleotides long and comprises a nucleotide sequence at least 90 percent identical to SEQ ID NO:5.
49. The method of claim 47, wherein the antisense molecule is 20-30 nucleotides long and comprises a nucleotide sequence at least 90 percent identical to SEQ ID NO:8.
50. The method of claim 47, wherein the antisense molecule is 20-30 nucleotides long and comprises a nucleotide sequence at least 90 percent identical to SEQ ID NO:11.
51. The method of claim 47, wherein the sequence of the antisense molecule comprises any one of the nucleotide sequences SED ID NO:5; SEQ ID NO:8; and SEQ ID NO:11.
52. The method of claim 28, wherein the antisense molecule is associated with a nucleic acid delivery vehicle.
Description
RELATED APPLICATIONS
[0001] This application claims benefit of priority to U.S. Provisional Patent Application No. 61/531,942, filed Sep. 7, 2011, and U.S. Provisional Patent Application No. 61/696,981, filed Sep. 5, 2012.
BACKGROUND OF THE INVENTION
[0002] There is growing evidence that tumors contain a subset of cells with stern cell-like properties. These cells, often referred to either as "cancer stem cells" (CSCs) or as "tumor-initiating cells" (TICs), are responsible for forming the bulk of tumor. These CSCs possess both self-renewal and differentiation capabilities, and are believed to give rise to tumor heterogeneity. Furthermore, they have been shown to be associated with the most lethal characteristics of tumors--drug resistance and metastasis. The first evidence of the existence of CSCs came from studies of hematological malignancies in 1994. More recently, CSCs have been identified in a number of solid tumors, including breast, brain, skin, lung, colon, pancreatic, liver, head and neck, prostate, ovarian, and gastric cancers.
[0003] Osteosarcoma is the most common primary bone malignancy and accounts for 60% of all malignant childhood bone tumors. Before multi-agent chemotherapy, amputation provided a long-term survival rate of only .about.20%. Since the 1970s, combination chemotherapy along with limb-sparing surgery has been the main treatment for osteosarcoma. Currently, the 5-year survival for patients with osteosarcoma has been reported to be 50% to 80%. However, this survival rate has not improved over the last 10 years, and fully 40% of osteosarcoma patients die of their disease.
[0004] Targeting molecules important in tumorigenesis, known as "targeted therapy", has been an exciting development in cancer treatment in the past ten years. However, no targeted therapy is currently available for osteosarcoma. Therefore, there is a great need for developing new osteosarcoma treatments.
[0005] CD133, also known as AC133 and Prominin 1 (PROM1), is a five-transmembrane glycoprotein of unknown function. It was the first identified member of the prominin family of five-transmembrane glycoproteins. In 1997, Yin et al. produced a novel monoclonal antibody that recognized the AC133 antigen, a glycosylation-dependent epitope of CD133, and they detected expression of AC133 in CD34-positive progenitor cells from adult blood. CD133 cDNA encodes a 5-transmembrane domain molecule with an extracellular N-terminus, a cytoplasmic C-terminus, and two large extracellular loops with eight consensus sites for N-linked glycosylation. A characteristic feature of CD133 is its rapid downregulation during cell differentiation. This feature makes CD133 a unique cell surface marker for the identification and isolation of stem cells and progenitor cells in several tissues. According to the CSC theory, CSCs express some of the stem cell markers of normal stem cells. Therefore, tumor cells expressing CD133 independently or in combination with other stem cell or progenitor cell markers are thought to represent CSCs. To date, however, the molecular mechanisms underlying the phenotype of CSCs expressing CD133 cell surface marker have remained obscure.
[0006] MicroRNAs (miRNAs), first discovered in 1993 as a small non-protein-coding RNA, are small regulatory RNA molecules that modulate the expression of their target genes and play important roles in a variety of physiological and pathological processes, such as development, differentiation, cell proliferation, apoptosis, and stress responses. miRNA biogenesis requires several post-transcriptional processing steps to yield the functional mature miRNA. Over the past several years, many miRNAs have been investigated in various human cancers. The deregulation of the expression of miRNAs has been shown to contribute to cancer development through various kinds of mechanisms, including deletions, amplifications, or mutations involving miRNA loci, epigenetic silencing, the dysregulation of transcription factors that target specific miRNAs, or the inhibition of processing. miRNA expression profiling is of increasing importance as a useful diagnostic and prognostic tool, and many studies have indicated that miRNAs act either as oncogenes or as tumor suppressors.
[0007] The human miRNAs miR-1 and miR-133a are located on the same chromosomal region, in a so-called cluster. Enriched in muscle, they are miRNAs that inhibit proliferation of progenitor cells and promote myogenesis by targeting histone deacetylase 4 (HDAC4) and SCRIM response factor (SRF), respectively. miR-1 has been reported to be overexpressed in individuals with coronary artery disease, while both of these miRNAs have been reported to be expressed at low levels in cardiac hypertrophy. Despite a number of studies, their importance in muscle physiology and disease still remains unclear. Recently, miR-133a (the name of which bears no relationship to the name CD133) has been considered to be dispensable for the normal development and function of skeletal muscle. However, the relationship between these miRNAs and CSCs has, until now, been unknown.
[0008] The human miRNA miR-10b has been found to be positively associated with high-grade malignancy. This association held true for various types of cancer. miR-10b is one of the most significantly upregulated miRNAs in human pancreatic adenocarcinomas and glioblastomas, two types of highly metastatic and/or invasive cancers. This miRNA is highly expressed in metastatic cancer cells propagated as cell lines, as well as in metastatic breast tumors from patients, and is also upregulated in metastatic hepatocellular carcinomas relative to those that are not metastatic. The importance of miR-10b in sarcoma development has not previously been reported.
SUMMARY OF THE INVENTION
[0009] An aspect of the invention is a method of treating osteosarcoma. The method includes the step of administering to a subject in need thereof an effective amount of an antisense molecule specific for a microRNA (miRNA) selected from miR-1, miR-10b, and miR-33a.
[0010] In one embodiment, the antisense molecule is stabilized RNA.
[0011] In one embodiment, the stabilized RNA is a locked nucleic acid (LNA) oligonucleotide.
[0012] In one embodiment, the antisense molecule is DNA.
[0013] In one embodiment, the antisense molecule is 20-30 nucleotides long and comprises a nucleotide sequence at least 90 percent identical to 5'-ACATACTTCTTTACATTCCA-3' (SEQ ID NO:4), 5'-ACAAATTCGGTTCTACAGGGT-3' (SEQ ID NO:5), or 5'-CAGCTGGTTGAAGGGGACCAA-3' (SEQ ID NO:6).
[0014] In one embodiment, the antisense molecule is 21-30 nucleotides long and comprises a nucleotide sequence at least 95 percent identical to 5'-ACATACTTCTTTACATTCCA-3' (SEQ ID NO:4), 5'-ACAAATTCGGTTCTACAGGGT-3' (SEQ NO:5), or 5'-CAGCTGGTTGAAGGGGACCAA-3' (SEQ ID NO:6).
[0015] In one embodiment, the sequence of the antisense molecule is
TABLE-US-00001 (SEQ ID NO: 4) 5'-ACATACTTCTTTACATTCCA-3', (SEQ ID NO: 5) 5'-ACAAATTCGGTTCTACAGGGT-3', or (SEQ ID NO: 6) 5'-CAGCTGGTTGAAGGGGACCAA-3'.
[0016] In one embodiment, the antisense molecule is 20-30 nucleotides long and comprises a nucleotide sequence at least 90 percent identical to
TABLE-US-00002 (SEQ ID NO: 7) 5-AUACAUACUUCUUUACAUUCCA-3', (SEQ ID NO: 8) 5'-CACAAAUUCGGUUCUACAGGGUA-3', (SEQ ID NO: 9) 5'-CAGCUGGUUGAAGGGGACCAAA-3', (SEQ ID NO: 10) 5'-ATACATACTTCTTTACATTCCA-3', (SEQ ID NO: 11) 5'-CACAAATTCGGTTCTACAGGGTA-3', or (SEQ ID NO: 12) 5'-CAGCTGGTTGAAGGGGACCAAA-3'.
[0017] In one embodiment, the antisense molecule is 21-30 nucleotides long and comprises a nucleotide sequence at least 95 percent identical to
TABLE-US-00003 (SEQ ID NO: 7) 5-AUACAUACUUCUUUACAUUCCA-3', (SEQ ID NO: 8) 5'-CACAAAUUCGGUUCUACAGGGUA-3', (SEQ ID NO: 9) 5'-CAGCUGGUUGAAGGGGACCAAA-3', (SEQ ID NO: 10) 5'-ATACATACTTCTTTACATTCCA-3', (SEQ ID NO: 11) 5'-CACAAATTCGGTTCTACAGGGTA-3', or (SEQ ID NO: 12) 5'-CAGCTGGTTGAAGGGGACCAAA-3'.
[0018] In one embodiment, the sequence of the antisense molecule is
TABLE-US-00004 (SEQ ID NO: 7) 5-AUACAUACUUCUUUACAUUCCA-3', (SEQ ID NO: 8) 5'-CACAAAUUCGGUUCUACAGGGUA-3', (SEQ ID NO: 9) 5'-CAGCUGGUUGAAGGGGACCAAA-3', (SEQ ID NO: 10) 5'-ATACATACTTCTTTACATTCCA-3', (SEQ ID NO: 11) 5'-CACAAATTCGGTTCTACAGGGTA-3', or (SEQ ID NO: 12) 5'-CAGCTGGTTGAAGGGGACCAAA-3'.
[0019] In one embodiment, the antisense molecule is associated with a nucleic acid delivery vehicle.
[0020] In one embodiment, the osteosarcoma is metastatic osteosarcoma.
[0021] An aspect of the invention is an isolated nucleic acid molecule 20-30 nucleotides long comprising a nucleotide sequence at least 90 percent identical to
TABLE-US-00005 (SEQ ID NO: 4) 5'-ACATACTTCTTTACATTCCA-3', (SEQ ID NO: 5) 5'-ACAAATTCGGTTCTACAGGGT-3', or (SEQ ID NO: 6) 5'-CAGCTGGTTGAAGGGGACCAA-3'.
[0022] In one embodiment, the isolated nucleic acid molecule is 21-30 nucleotides long and comprises a nucleotide sequence at least 95 percent identical to
TABLE-US-00006 (SEQ ID NO: 4) 5'-ACATACTTCTTTACATTCCA-3', (SEQ ID NO: 5) 5'-ACAAATTCGGTTCTACAGGGT-3', or (SEQ ID NO: 6) 5'-CAGCTGGTTGAAGGGGACCAA-3'.
[0023] In one embodiment , the sequence of the isolate ucleic acid molecule is
TABLE-US-00007 (SEQ ID NO: 4) 5'-ACATACTTCTTTACATTCCA-3', (SEQ ID NO: 5) 5'-ACAAATTCGGTTCTACAGGGT-3', or (SEQ ID NO: 6) 5'-CAGCTGGTTGAAGGGGACCAA-3'.
[0024] An aspect of the invention is an isolated nucleic acid molecule 20-30 nucleotides long comprising a nucleotide sequence at least 90 percent identical to
TABLE-US-00008 (SEQ ID NO: 7) 5-AUACAUACUUCUUUACAUUCCA-3', (SEQ ID NO: 8) 5'-CACAAAUUCGGUUCUACAGGGUA-3', (SEQ ID NO: 9) 5'-CAGCUGGUUGAAGGGGACCAAA-3', (SEQ ID NO: 10) 5'-ATACATACTTCTTTACATTCCA-3', (SEQ ID NO: 11) 5'-CACAAATTCGGTTCTACAGGGTA-3', or (SEQ ID NO: 12) 5'-CAGCTGGTTGAAGGGGACCAAA-3'.
[0025] In one embodiment, the isolated nucleic acid molecule is 21-30 nucleotides long and comprises a nucleotide sequence at least 95 percent identical to
TABLE-US-00009 (SEQ ID NO: 7) 5-AUACAUACUUCUUUACAUUCCA-3', (SEQ ID NO: 8) 5'-CACAAAUUCGGUUCUACAGGGUA-3', (SEQ ID NO: 9) 5'-CAGCUGGUUGAAGGGGACCAAA-3', (SEQ ID NO: 10) 5'-ATACATACTTCTTTACATTCCA-3', (SEQ ID NO: 11) 5'-CACAAATTCGGTTCTACAGGGTA-3', or (SEQ ID NO: 12) 5'-CAGCTGGTTGAAGGGGACCAAA-3'.
[0026] In one embodiment, the sequence of the isolated nucleic acid molecule is
TABLE-US-00010 (SEQ ID NO: 7) 5-AUACAUACUUCUUUACAUUCCA-3', (SEQ ID NO: 8) 5'-CACAAAUUCGGUUCUACAGGGUA-3', (SEQ ID NO: 9) 5'-CAGCUGGUUGAAGGGGACCAAA-3', (SEQ ID NO: 10) 5'-ATACATACTTCTTTACATTCCA-3', (SEQ ID NO: 11) 5'-CACAAATTCGGTTCTACAGGGTA-3', or (SEQ ID NO: 12) 5'-CAGCTGGTTGAAGGGGACCAAA-3'.
[0027] In one embodiment, the nucleic acid molecule is associated with a nucleic acid delivery vehicle.
[0028] An aspect of the invention is a method of assessing resistance of osteosarcoma to an anti-cancer therapy. The method includes the steps of:
[0029] obtaining a tissue sample comprising osteosarcoma cells;
[0030] isolating from the sample cells expressing CD133;
[0031] measuring a first level of expression by the CD133-expressing cells of at least one microRNA (miRNA) selected from the group consisting of miR-1, miR-10b, and miR-133a;
[0032] contacting the CD133-expressing cells with an anti-cancer therapy; and
[0033] measuring a second level of expression by the CD133-expressing cells of the at least one miRNA, wherein a second level of expression greater than the first level of expression indicates the osteosarcoma is resistant to the anti-cancer therapy.
[0034] In one embodiment, the anti-cancer therapy is selected from the group consisting of cisplatin, doxorubicin, methotrexate, and any combination thereof.
[0035] An aspect of the invention is a method of screening for osteosarcoma. The method includes the step of performing on a tissue sample from a subject an assay specifically capable of detecting at least one microRNA (miRNA) selected from the group consisting of miR-1, miR-10b, and miR-133a, wherein detection by the assay of the presence in the sample of the at least one miRNA indicates the subject is at risk of having osteosarcoma.
[0036] In one embodiment, the tissue is blood.
[0037] In one embodiment, the tissue is serum.
[0038] An aspect of the invention is a method of monitoring osteosarcoma. The method includes the steps of:
[0039] (a) performing, on a tissue sample obtained from a subject having osteosarcoma or having been treated for osteosarcoma, an assay specifically capable of quantifying the level of expression of at least one microRNA (miRNA) selected from the group consisting of miR-1, miR-10b, and miR-133a; and
[0040] (b) repeating step (a) on a later-obtained tissue sample from the subject, wherein a level of expression of the at least one miRNA in the later-obtained sample greater than the level of expression of the at least one miRNA in the earlier-obtained sample indicates the osteosarcoma is progressive, and a level of expression of the at least one miRNA in the later-obtained sample lesser than the level of expression of the at least one miRNA in the earlier-obtained sample indicates the osteosarcoma is regressive.
[0041] In one embodiment, the tissue is blood.
[0042] In one embodiment, the tissue is serum.
BRIEF DESCRIPTION OF THE DRAWINGS
[0043] FIG. 1 is a group of seven representative: FACS analyses of various indicated human osteosarcoma cell lines based on their expression of CD 133 (X-axis) and CD44 (Y-axis).
[0044] FIG. 2 is a collage comprising a FACS analysis depicting selection of CD133.sup.high and CD133.sup.low SaOS2 cells (top panel); four photomicrographs depicting asymmetric cell division in the CD133.sup.high population at day 1 and day 8 (middle panel); and two FACS analyses by PKH staining for each population at day 14 (bottom panel). Scale bars, 50 mm.
[0045] FIG. 3 is a group of four photomicrographs and a bar graph depicting sphere-formation assays in freshly isolated CD133.sup.high and CD133.sup.low HOS-GFP cells. Photos were taken on day 5 and the numbers of spheres in each well were counted (n=3 per group, **P<0.01). Scale bar, 200 .mu.m.
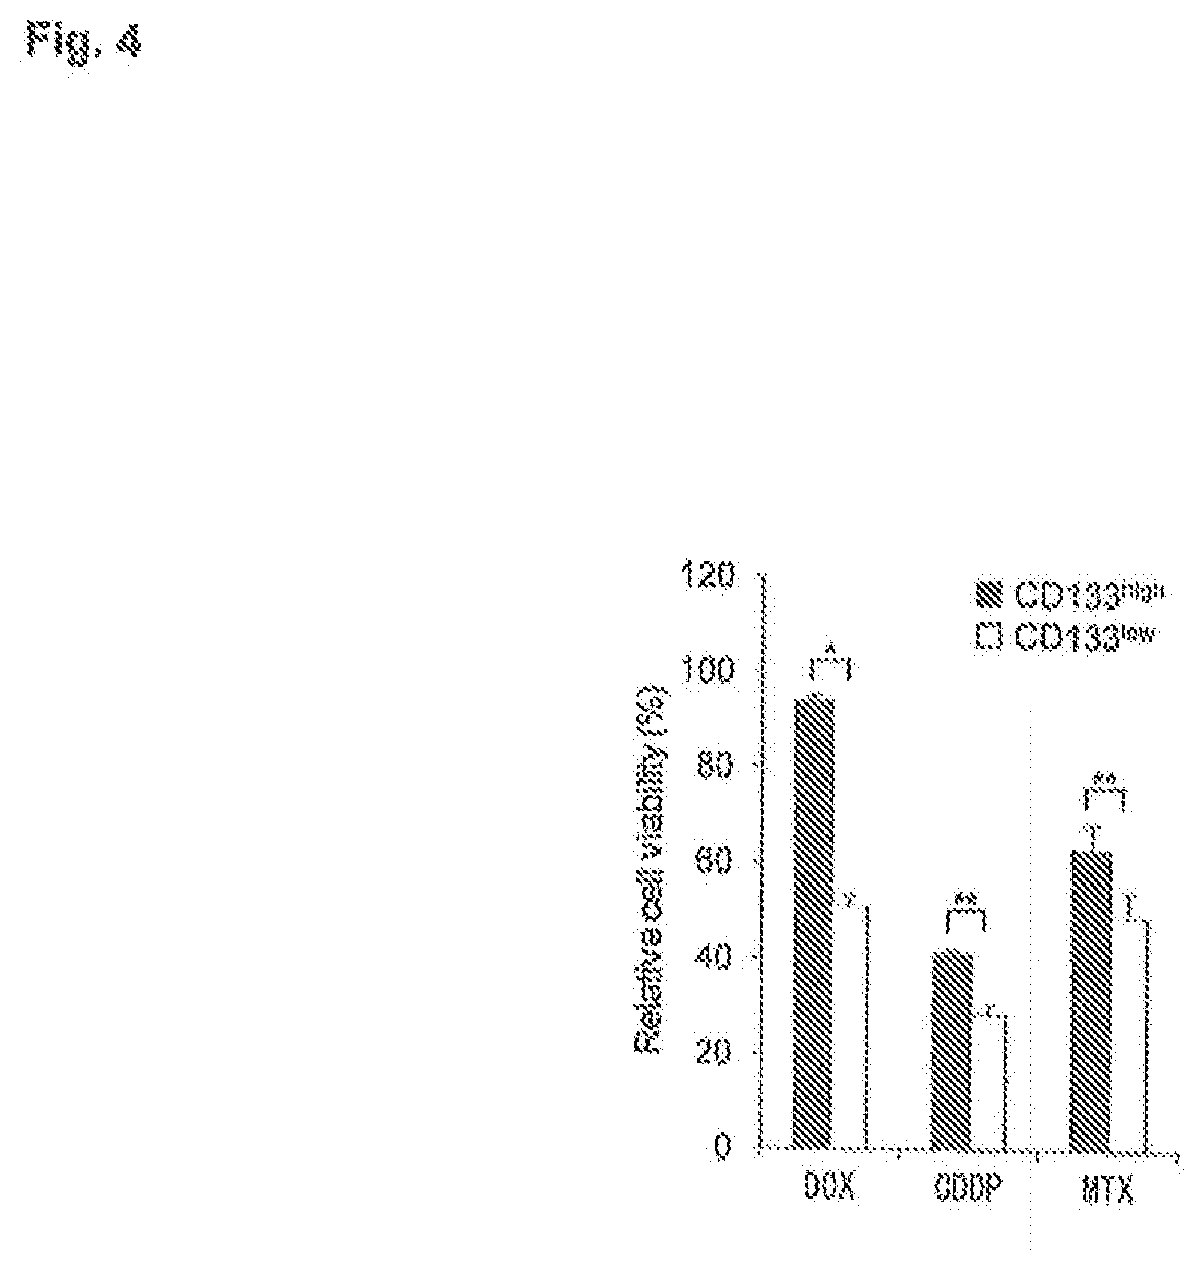
[0046] FIG. 4 is a bar graph depicting drug sensitivity of CD133.sup.high and CD133.sup.low SaOS2 cell populations. Relative viable cells to doxorubicin (DOX, 0.03 .mu.M), cisplatin (CDDP, 2.5 .mu.M), and methotrexate (MTX, 0.32 .mu.M) were analyzed (n=3 per group, *P<0.05, **P<0.01).
[0047] FIG. 5 is a pair of photomicrographs and a bar graph depicting invasion assays in CD133.sup.high and CD133.sup.low SaOS2 cell populations (n=3 per group, **P<0.01). Scale bar, 200 .mu.m.
[0048] FIG. 6 is a graph depicting quantitative polymerase chain reaction (qPCR) analysis of stem cell-associated, multiple drug-resistant transporters and metastasis-associated genes of CD133.sup.high and CD133.sup.low SaOS2 cell populations. .beta.-actin was used as an internal control.
[0049] FIG. 7 is a group of eight photographic images depicting tumorigenicity of CD133.sup.high and CD133.sup.low HOS-luc cell populations in mice. Luminescence of the tumors xenografted with CD133.sup.high (animals' right thighs) and CD133.sup.low (animals' left thighs) HOS-luc cells are identified by in vivo imaging system (IVIS). CD133.sup.high population formed tumors with as few as 100 cells (n=5 per group).
[0050] FIG. 8 is a pair of FACS analyses depicting CD133.sup.high cell populations in clinical osteosarcoma specimens.
[0051] FIG. 9 is a graph depicting metastasis-free survival for osteosarcoma patients based on CD133 expression. Patients with high expression of CD133 had a median metastasis-free survival of less than 60 months (n=35, log-rank test, P=0.0262).
[0052] FIG. 10 is a Venn diagram depicting upregulated and downregulated miRNAs in CD133.sup.high and CD133.sup.low cells of SaOS2 and HOS.
[0053] FIG. 11 is a bar graph depicting upregulated miR-1, miR-10b, and miR-133a in CD133.sup.high populations of SaO2 and HOS cells compared to CD133.sup.low population (*P<0.05, **P<0.01, ***P<0.001).
[0054] FIG. 12 is a graph depicting the expression of miR-1, miR-10b, and miR-133a in CD133.sup.low SaOS2 cells transfected with miRNA oligonucleotides compared to CD133.sup.low SaOS2 cells transfected with miR-NC (negative control) oligonucleotides (log scale, n=3 per group, *P<0,05, **P<0.01, ***P<0.001),
[0055] FIG. 13 is a graph depicting invasion assays in purified CD133.sup.low cells transfected with miR-1, miR-10b, and miR-133a or NC oligonucleotides (*P<0.05, **P<0.01, ***P<0.001).
[0056] FIG. 14 is a graph depicting drug resistance in CD133.sup.low cells transfected with miR-1, miR-10b, miR-133a, or miR-NC oligonucleotides (MTX, methotrexate at (1.22 mM; *P<0.05, **P<0.01).
[0057] FIG. 15 is a schematic representation of plasmid vectors utilized for stable overexpression of miR-133a in CD133.sup.low cells. NruI, NotI, XbaI: restriction endonuclease sites; P.sub.CMV, cytomegalovirus promoter; MCS, multiple cloning site; IVS, intervening sequence; IRES, internal ribosome entry site; Hyg.sup.r, hygromycin resistance gene; SV40 poly A, SV40 polyA tail.
[0058] FIG. 16 comprises four pairs of photographic images depicting tumorigenicity of CD133.sup.low HOS-luc cells stably expressing miR-133a (right legs) compared to control CD133.sup.low HOS-luc cells (left legs). Each site was injected with the indicated number of cells (10.sup.2-10.sup.5); luminescent evaluation was performed 90 days post injection.
[0059] FIG. 17 is a graph depicting expression of CD133 messenger RNA (mRNA) in CD133.sup.low SaOS2 cells transfected with miR-1, miR-10b, and miR-133a oligonucleotides. Alteration of these miRNAs did not alter CD133 expression levels. Comparison is also made to CD133.sup.high cells transfected with miR-NC (negative control) oligonucleotide (n=3 per group).
[0060] FIG. 18 is a graph depicting expression of miR-133a in CD133.sup.high populations of freshly resected patient biopsies.
[0061] FIG. 19 is a series of photomicrographs and a related bar graph depicting the effects of individual miRNAs, and various combinations of the miRNAs, on invasiveness of CD133.sup.low SaOS2 cells transfected with the indicated miRNAs. For the purposes of comparison data is also presented for CD133.sup.high SaOS2 cells. NC, negative control.
[0062] FIG. 20 is a series of photomicrographs and related bar graph depicting the effects of individual miRNAs, and various combinations of the miRNAs, on invasiveness of CD133.sup.low MNNG/HOS cells transfected with the indicated miRNAs. NC, negative control.
[0063] FIG. 21 is a bar graph depicting proliferation of non-transfected CD133.sup.high SaOS2 cells and CD133.sup.low SaOS2 cells transfected with the indicated miRNAs. NC, negative control. Cells were maintained in culture for 4 d prior to counting.
[0064] FIG. 22 comprises three graphs depicting (left) induction of mRNA for CD133 by doxorubicin (DOX) and cisplatin (CDDP) in 143B cells; (middle) induction of miR-1, miR-10b, and miR-133a by DOX in 143B cells; and (right) induction of miR-1, miR-10b, and miR-133a by CDDP in 143B cells (*P<0.05, **P<0.01, ***P<0.001).
[0065] FIG. 23 is a pair of juxtaposed photographic images depicting tumorigenicity of cisplatin (CDDP)-treated CD133.sup.low HOS-luc cells in mice. Luminescence of the tumors xenografted with CDDP-treated cells (animals' right tibias) and saline-treated control cells (animals' left tibias) are identified by in vivo imaging system (IVIS). CDDP-treated CD133.sup.low cells formed tumors with as few as 100 cells (n=5 per group).
[0066] FIG. 24 is a graph depicting knock-down of miR-1, miR-10b, and miR-133 expression in CD133.sup.high SaOS2 cells transfected with locked nucleic acid (LNA)-1 LNA-10b, LNA-133a, and LNA-NC oligonucleotides.
[0067] FIG. 25 is a graph depicting cell proliferation on day 4 after transfection of LNA-133a and LNA-NC (negative control) oligonucleotides in CD133.sup.high and CD133.sup.low cells (n=3 per group; ***P<0.001).
[0068] FIG. 26 is pair of graphs depicting (left) cell viability of indicated cell types grown in the presence of doxorubicin (DOX, 0.4 .mu.M, 48 h) or cisplatin (CDDP, 5 .mu.M, 48 h) measured 24 h after transfection with LNA-133a or LN A-NC; and (right) percentage of apoptotic cells in indicated cell types grown in the presence (+) or absence (-) of cisplatin (CDDP, 5 .mu.M, 48 h) measured 24 h after transfection with LNA-133a or LNA-NC.
[0069] FIG. 27 is a graph depicting invasion assays in indicated LNA-treated SaOS2 CD133.sup.high and CD133.sup.low populations (n=3 per group; **P<0.01).
[0070] FIG. 28 is a graph depicting quantitative polymerase chain reaction (qPCR) analysis of genes associated with stemness, drug resistance, and metastasis of osteosarcoma in CD133.sup.high cells transfected with LNA-133a and LNA-NC oligonucleotides. .beta.-actin was used as an internal control.
[0071] FIG. 29 is a schematic depicting LNA-133a (LNA) and cisplatin (CDDP) administration schedule for 143B-luc-bearing mice. IVIS, in vivo imaging system.
[0072] FIG. 30 is a graph depicting expression of miR-133a in 143B-luc tumors according to the dose of LNA-133a (n=3 per group).
[0073] FIG. 31 is a graph depicting relative expression of miR-133a in mice bearing 143B-luc tumors and treated with saline alone, LNA-133a alone, cisplatin (CDDP) alone, or LNA-133 plus CDDP (*P<0.05, ***P<0.001).
[0074] FIG. 32 is a group of four photographic images depicting macroscopic appearance, on day 36, of mice bearing 143B-luc tumors and treated with saline alone, LNA-133a alone, cisplatin (CDDP) alone, or LNA-133 plus CDDP. Scale bar, 10 mm.
[0075] FIG. 33 is a graph depicting weight of 143B-luc tumors, on day 36, from each indicated treatment group (**P<0.01).
[0076] FIG. 34 is a graph depicting survival of mice bearing 143B-luc tumors and treated with saline alone, LNA-133a alone, cisplatin (CDDP) alone, or LNA-133 plus CDDP. Kaplan-Meier analysis and log-rank test (n=5 per group, P=0.0013).
[0077] FIG. 35 is a schematic depicting a strategy used to identify target genes of miR-133a. Anti-Ago2 IP, anti-Ago2 antibody immunoprecipitation.
[0078] FIG. 36 is a Venn diagram depicting candidate target messenger RNAs (mRNAs) of miR-133a according to complementary DNA (cDNA) microarray and in silico database analysis.
[0079] FIG. 37 is a graph depicting inhibition of cell growth by 10 siRNAs on cell transfection arrays in the presence of cisplatin 72 h after transfection (n=3 per group; NC, negative control; **P<0.01, ***P<0.001).
[0080] FIG. 38 is a graph depicting invasion assay by 10 siRNAs on cell transfection arrays 72 h after transfection (n=3 per group; NC, negative control; *P<0.05, **P<0.01, ***P<0.001).
[0081] FIG. 39 is a graph depicting luciferase activity in SaOS2 cells co-transfected with miR-133a oligonucleotides and luciferase reporters for the indicated putative miR-133a target genes.
[0082] FIG. 40 is a graph depicting inverse correlation between expression of CD133 (CD133.sup.high versus CD133.sup.low) and messenger RNA (snRNA) for indicated targets of miR-133a, as measured by quantitative reverse transcriptase-polymerase chain reaction (qRT-PCR).
[0083] FIG. 41 is a graph depicting decreased expression of messenger RNA (mRNA) for the indicated miR-133a target genes in CS133.sup.low SaOS2 cells 48 h after transfection of miR-133a oligonucleotides compared to miR-NC (negative control) oligonucleotides, as measured by quantitative reverse transcriptase-polymerase chain reaction (qRT-PCR).
[0084] FIG. 42 is a graph depicting increased expression of messenger RNA (mRNA) for SGMS2. in 143B-luc tumors from mice treated with LNA-133a (**P<0.01).
[0085] FIG. 43 is a series of six graphs depicting metastasis-free survival of osteosarcoma patients sensored for miR-133a target genes SGMS2, UBA2, SNX30, DUSP11, MAST4, and ANXA2, respectively. The low expression of the direct targets of miR-133a (except for DUSP11) were significantly correlated with a poor prognosis (Kaplan-Meier analysis and log-rank test; P values as shown).
DETAILED DESCRIPTION OF THE INVENTION
[0086] Since the proposal of the cancer stem cell (CSC) hypothesis, several studies have been performed to identify cancer stem cells of osteosarcoma. These cells have been detected in spherical clones under anchorage-independent, serum-starved culture conditions, as side population (SP) cells based on efflux of Hoechst 33342 dye or as CD117 and stro-1 cells sorted using cell surface marker. In view of these models, the inventors identified Prominin-1, the mouse homolog of human CD133, to be highly expressed in a small fraction of osteosarcoma cells, Cells from this CD133.sup.high fraction formed cluster spheres in an anchorage-independent environment, exhibited a potential for self-renewal and differentiation, expressed stem cell-associated markers, and showed more invasive potential compared to the CD133.sup.low fraction.
[0087] Following the characterization of the phenotype of osteosarcoma CSCs, the inventors profiled expression of several miRNAs, which distinguish cells of the CD133.sup.high fraction from their more differentiated progeny. Among these miRNAs, miR-1, miR-10b, miR-133a were found to be upregulated in the CD133.sup.high fraction compared to the CD133.sup.low fraction of osteosarcoma cells. Remarkably, the inventors have discovered these miRNAs promote chemoresistance and invasiveness of osteosarcoma cells. These observations suggest that miR-1, miR-10b, and miR-133a are regulators of cancer stem cells of osteosarcoma. Particularly in combination with a tailored drug delivery system, new therapeutic agents (e.g., antisense nucleotides) targeting the miRNAs show great promise against osteosarcoma, adding to conventional chemotherapeutic agents, such as methotrexate, cisplatin, and doxorubicin.
[0088] Although miRNAs are not presently used as cancer therapeutics or as validated targets for cancer therapeutics, successful in vivo studies support the notion that they could be used as innovative therapeutics to address unmet needs. Systemic delivery of anti-miR-10b in an orthotopic mouse model of breast cancer showed a significant reduction in the number and size of lung metastases, with no obvious effect on primary tumors. Ma et al, (2010) Nat Biotechnal 28:341-7. Moreover, the recent discovery of miRNAs as novel biomarkers in serum or plasma represents a new approach for diagnostic screening in blood. Brase et al. (2010) Mol Cancer 9:306. The miRNAs identified in accordance with the instant invention also have potential as biomarkers which can be used for prompt assessment of sensitivity to chemotherapeutics, early detection of local recurrence, or distant metastasis, all of which are factors that affect the prognosis for patients with osteosarcoma.
[0089] An aspect of the invention is a method of treating osteosarcoma. The method includes the step of administering to a subject in need thereof an effective amount of an antisense molecule specific for a microRNA (miRNA) selected from miR-1, miR-10b, and miR-133a. Alternatively or in addition, the method can include the step of administering to the subject any agent that knocks down the expression of the miRNA.
[0090] As used herein, the terms "treating" and "to treat" refers to ameliorating or curing a disease or undesirable condition. For example, treating osteosarcoma refers to reducing or eliminating the burden of osteosarcoma cells in a subject having osteosarcoma.
[0091] A "subject" as used herein refers to a mammal. In one embodiment, a subject is a human.
[0092] An effective amount of an antisense molecule specific for a microRNA is administered to the subject in need of treatment. As used herein, an "effective amount" refers to an amount that is sufficient to achieve a desired biological outcome. For example, an effective amount to treat an osteosarcoma is an amount sufficient to reduce or eliminate the population of osteosarcoma cells in a subject having osteosarcoma. An effective amount may vary depending on such factors as the size of the tumor, the size of the subject, the overall condition of the subject, the route of administration, the identity of the active agent, the composition or formulation of the active agent, and other factors well known in the medical and pharmaceutical arts.
[0093] Without meaning to be bound to any particular dosage, an effective amount can, in general, vary from 0.01 microgram (.mu.g)/kg body weight to 1000 mg/kg body weight of active agent per day when administered by a parenteral route of administration. For oral or enteral administration, an effective amount can, in general, vary from 0.1 .mu.g/kg body weight to 10,000 mg/kg body weight of active agent per day. An effective amount can be determined, for example, based on in vitro studies and in vivo animal studies, as well as clinical studies.
[0094] MicroRNAs (miRNAs) are short (20-24 nt) non-coding RNAs that are involved in post-transcriptional regulation of gene expression in multicellular organisms by affecting both the stability and translation of mRNAs. miRNAs are transcribed by RNA polymerase II as part of capped and polyadenylated primary transcripts (pri-miRNAs) that can be either protein-coding or non-coding. The primary transcript is cleaved by the Drosha ribonuclease III enzyme to produce an approximately 70-nt stem-loop precursor miRNA (pre-miRNA), which is further cleaved by the cytoplasmic Dicer ribonuclease to generate the mature miRNA and antisense miRNA star (miRNA*) products. The mature miRNA is incorporated into an RNA-induced silencing complex (RISC), which recognizes target messenger RNAs (mRNAs) through imperfect base pairing with the miRNA and most commonly results in translational inhibition or destabilization of the target mRNA.
[0095] The miRNA can be selected from miR-1, miR-10b, and miR-133a, In one embodiment, the miRNA is miR-1. In one embodiment, the miRNA is miR-10b. In one embodiment, the miRNA is miR-133a. While these miRNAs have been described in the art, prior to the instant invention there was no recognition or expectation that these particular miRNAs are or might he associated with osteosarcoma, including, in particular, drug-resistant and/or aggressively invasive or metastatic phenotypes of osteosarcoma.
[0096] miR-1 has been described as a 22-nucleotide long miRNA having the sequence
TABLE-US-00011 (SEQ ID NO: 1) 5'-UGGAAUGUAAAGAAGUAUGUAU-3'.
[0097] miR-10b has been described as a 23-nucleotide long miRNA having the sequence
TABLE-US-00012 (SEQ ID NO: 2) 5'-UACCCUGUAGAACCGAAUUUGUG-3'.
[0098] miR-133a has been described as a 22-nucleotide long miRNA having the sequence
TABLE-US-00013 (SEQ ID NO: 3) 5'-UUUGGUCCCCUUCAACCAGCUG-3'.
[0099] Antisense is well described in the literature. In general, antisense agents are nucleic acid-based molecules having a nucleotide sequence that is complementary to the sequence of a target nucleic acid molecule, whereby association between the antisense molecule and its target sequence molecule results in a reduced amount of expression of the target nucleic acid molecule.
[0100] In one embodiment the antisense molecule (anti-miRNA) is a stabilized RNA, i.e., an RNA that, compared to naturally occurring RNA, is relatively resistant to nuclease-mediated degradation in vitro or in viva. Numerous forms of stabilized nucleic acids, including RNA, are known. Some stabilized RNAs include polyA 3'-terminal ends. Chemically modified forms of nucleic acids, including, for example and without limitation, locked nucleic acids (LNAs), phosphorothioate backbone-modified nucleic acids, and 2'-O-methyl (2'-OMe) nucleic acids have been well described and require no further description here. Krutzfeldt et al. (2005) Nature 438:685-9; Ma et al. (2010) Nat Biotechnol 28:341-7.
[0101] In one embodiment, the antisense molecule is a locked nucleic acid (LNA) oligonucleotide. A locked nucleic acid nucleotide is a modified ribonucleotide. The ribose moiety of an LNA nucleotide is modified with an extra bridge connecting the 2' oxygen and 4' carbon. The bridge "locks" the ribose in the 3'-endo conformation. LNA nucleotides were first developed by Imanishi and colleagues and Wengel and colleagues. Obika et al. (1997) Tetrahedron Lett. 38:8735-8; Koshkin et al. (1998) Tetrahedron 54:3607-30.
[0102] A locked nucleic acid (LNA) oligonucleotide is a polymer of nucleotides, at least one of which is an LNA nucleotide. Any non-LNA nucleotide in an LNA oligonucleotide can be a naturally occurring or modified ribonucleotide or deoxyribonucleotide, or an analog thereof, provided that the LNA oligonucleotide is functional as an antisense molecule with respect to its intended target. In one embodiment, any non-LNA nucleotide in an LNA oligonucleotide is a deoxyribonucleotide, and at least the 3'-terminal nucleotide is an LNA nucleotide. In one embodiment, any non-LNA nucleotide in an LNA oligonucleotide is a naturally occurring deoxyribonucleotide, and at least the two 3'-terminal nucleotides are LNA nucleotides. In one embodiment, an LNA oligonucleotide is composed exclusively of LNA nucleotides.
[0103] In one embodiment, the antisense molecule is DNA.
[0104] In one embodiment, an antisense molecule specific for miR-1 comprises a sequence
TABLE-US-00014 (SEQ ID NO: 4) 5'-ACATACTTCTTTACATTCCA-3'.
[0105] In one embodiment, the sequence of an antisense molecule specific for miR-1 is
TABLE-US-00015 (SEQ ID NO: 4) 5'-ACATACTTCTTTACATTCCA-3'.
[0106] In one embodiment, an antisense molecule specific for miR-10b comprises a sequence 5'-ACAAATTCGGTTCTACAGGGT-3' (SEQ ID NO:5).
[0107] In one embodiment, the sequence of an antisense molecule specific for miR-10b is
TABLE-US-00016 (SEQ ID NO: 5) 5'-ACAAATTCGGTTCTACAGGGT-3'.
[0108] In one embodiment, an antisense molecule specific for miR-133a comprises a sequence 5'-CAGCTGGTTGAAGGGGACCAA-3' (SEQ ID NO:6).
[0109] In one embodiment, the sequence of an antisense molecule specific for miR-133a is
TABLE-US-00017 (SEQ ID NO: 6) 5'-CAGCTGGTTGAAGGGGACCAA-3'.
[0110] in one embodiment, an antisense molecule specific fur raiR-1 comprises a sequence
TABLE-US-00018 (SEQ ID NO: 7) 5'-AUACAUACUUCUUUACAUUCCA-3'.
[0111] In one embodiment, the sequence of an antisense molecule specific for miR-1 is
TABLE-US-00019 (SEQ ID NO: 7) 5'-AUACAUACUUCUUUACAUUCCA-3'.
[0112] In one embodiment, an antisense molecule specific for miR-10b comprises a sequence 5'-CACAAAUUCGGUUCUACAGGGUA-3' (SEQ ID NO:8).
[0113] In one embodiment, the sequence of an antisense molecule specific for MR-10b is
TABLE-US-00020 (SEQ ID NO: 8) 5'-CACAAAUUCGGUUCUACAGGGUA-3'.
[0114] In one embodiment, an antisense molecule specific for miR-133a comprises a sequence 5'-CAGCUGGUUGAAGGGGACCAAA-3' (SEQ ID NO:9).
[0115] In one embodiment, the sequence of an antisense molecule specific for miR-133a is
TABLE-US-00021 (SEQ ID NO: 9) 5'-CAGCUGGUUGAAGGGGACCAAA-3'.
[0116] In one embodiment, an antisense molecule specific for miR-1 comprises a sequence
TABLE-US-00022 (SEQ ID NO: 10) 5'-ATACATACTTCTTTACATTCCA-3'.
[0117] In one embodiment, the sequence of an antisense molecule specific for miR-1 is
TABLE-US-00023 (SEQ ID NO: 10) 5'-ATACATACTTCTTTACATTCCA-3'.
[0118] In one embodiment, an antisense molecule specific for miR-10b comprises a sequence 5'-CACAAATTCGGTTCTACAGGGTA-3' (SEQ ID NO:11).
[0119] In one embodiment, the sequence of an antisense molecule specific for miR-10b is
TABLE-US-00024 (SEQ ID NO: 11) 5'-CACAAATTCGGTTCTACAGGGTA-3'.
[0120] In one embodiment, an antisense molecule specific for miR-133a comprises a sequence 5'-CAGCTGGTTGAAGGGGACCAAA-3' (SEQ ID NO:12).
[0121] In one embodiment, the sequence of an antisense molecule specific for miR-133a is
TABLE-US-00025 (SEQ ID NO: 12) 5'-CAGCTGGTTGAAGGGGACCAAA-3'.
[0122] The invention further embraces antisense molecules 20 to 30 nucleotides long comprising a contiguous sequence that is at least 90 percent identical to any one of the foregoing antisense molecule sequences. It is to be understood that such antisense molecules are capable of specifically hybridizing with or knocking down expression of the miRNAs to which they are targeted.
[0123] The invention further embraces antisense molecules 21 to 30 nucleotides long comprising a contiguous sequence that is at least 95 percent identical to any one of the foregoing antisense molecule sequences. It is to be understood that such antisense molecules are capable of specifically hybridizing with or knocking down expression of the miRNAs to which they are targeted.
[0124] In each of the foregoing embodiments, in one embodiment the antisense molecule includes one or more locked nucleic acid (LNA) nucleotides. Furthermore, in one embodiment the antisense molecule is composed exclusively of locked nucleic acid (LNA) nucleotides.
[0125] In one embodiment, the, antisense molecule specific for a particular microRNA is associated with a nucleic acid delivery vehicle. As used herein, a "nucleic acid delivery vehicle" refers to a biologically compatible vector useful for delivering a nucleic acid molecule to the cytoplasm of a cell. The antisense molecule can be conjugated to the nucleic acid delivery vehicle. Alternatively or in addition, the antisense molecule can be encapsulated by the nucleic acid delivery vehicle. Examples of suitable nucleic acid delivery vehicles include liposomes, lipids, cholesterol, hormones, and other targeting molecules. In respect of liposomes, the antisense molecule can be associated with the outer surface of the liposome, the interior of the liposome, or both the exterior and the interior of the liposome.
[0126] In one embodiment, the osteosarcoma is localized osteosarco osteosarcoma that is confined to one limb or one bone.
[0127] In one embodiment, the osteosarcoma is metastatic osteosarcoma.
[0128] An aspect of the invention is a method of assessing resistance of osteosarcoma to an anti-cancer therapy. The method includes the steps of
[0129] obtaining a tissue sample comprising osteosarcoma cells;
[0130] isolating from the sample cells expressing CD133;
[0131] measuring a first level of expression by the CD133-expressing cells of at least one microRNA (miRNA) selected from the group consisting of miR-1, miR-10b, and miR-133a;
[0132] contacting the CD133-expressing cells with an anti-cancer therapy; and
[0133] measuring a second level of expression by the CD133-expressing cells of the at least one miRNA, wherein a second level of expression greater than the first level of expression indicates the osteosarcoma is resistant to the anti-cancer therapy.
[0134] CD133-expressing cells can be isolated from a tissue sample using any suitable means. For example, a cell suspension can be prepared from the tissue and then the cells can be subjected to immunochromatography with, for example, magnetic beads loaded with anti-CD133 antibody, or by fluorescence-activated cell sorting (FACS) using an appropriately labeled anti-CD133 antibody. Monoclonal anti-human CD133 antibodies are commercially available from a number of suppliers.
[0135] A level of expression of a miRNA can be performed using any suitable method. For example, the expression level can be determined using reverse-transcriptase polymerase chain reaction (RT-PCR) using appropriately selected oligonucleotide primers.
[0136] Alternatively or in addition, the expression level can be determined using Northern blotting with appropriately selected and labeled hybridization probe.
[0137] As used herein, an "anti-cancer therapy" refers to any modality of treatment useful to treat a cancer. Such modalities include, in general, chemotherapy, external beam radiation therapy, immunotherapy, hormone therapy, and combinations thereof.
[0138] Chemotherapeutic agents are small molecules (molecular weight less than about 1 kDa) are well known in the medical arts. Commonly used chemotherapeutic agents used for osteosarcoma include cisplatin (cis-diamtninedichloroplatinum (II), also known as CDDP, and cisplatirium, commercially available as Platinol and Platinol-AQ), doxorubicin (also known as hydroxydaunorubicin, commercially available as Adriamycin), and methotrexate (also known as amethopterin). In one embodiment, the anti-cancer therapy is selected from cisplatin, doxorubicin, methotrexate, and any combination thereof. Any two or more of these agents may be used in combination, either concurrently or sequentially. In addition, any one or combination of such anti-cancer therapies can be used in combination with another anti-cancer modality, for example, external beam radiation therapy.
[0139] In various embodiments, the osteosarcoma is identified as being resistant to the anti-cancer therapy when the second level of expression of at least one of miR-1, miR-10b, and miR-133a is objectively greater than the first level of expression. In various embodiments, the osteosarcoma is identified as being resistant to the anti-cancer therapy when the second level of expression of at least one of miR-1, miR-10b, and miR-133a is at least 10 percent, at least 20 percent, at least 30 percent, at least 40 percent, at least 50 percent, at least 60 percent, at least 70 percent, at least 80 percent, at least 90 percent, or at least 100 percent greater than the first level of expression.
[0140] In one embodiment, the method further comprises the step of adjusting the dose of or changing the anti-cancer therapy when the osteosarcoma is found to be resistant to the anti-cancer therapy. For example, when the osteosarcoma is found to be resistant to the anti-cancer therapy, the anti-cancer therapy can be supplemented with or changed to another suitable anti-cancer therapy.
[0141] An aspect of the invention is a method of screening for osteosarcoma. The method includes the step of performing on a tissue sample obtained from a subject an assay specifically capable of detecting at least one microRNA (miRNA) selected from the group consisting of miR-1, miR-10b, and miR-133a, wherein detection by the assay of the presence in the sample of the at least one miRNA indicates the subject is at risk of having osteosarcoma. In one embodiment, the miRNA is miR-1. In one embodiment, the miRNA is miR-10b. In one embodiment, the miRNA is miR-133a. In one embodiment, the at least one mi-RNA is any combination of miR-1, miR-10b, and miR-133a.
[0142] An assay specifically capable of detecting at least one microRNA (miRNA) selected from the group consisting of miR-1, miR-10b, and miR-133a can be, for example, RT-PCR. using appropriately selected oligonucleotide primers. Alternatively or in addition, the assay can be Northern blotting with an appropriately selected and labeled hybridization probe.
[0143] In one embodiment, the tissue is blood. In one embodiment, the tissue is serum. In one embodiment, the tissue is plasma.
[0144] In one embodiment, the method further includes the step of verifying the presence of osteosarcoma, using any suitable method, when the subject is determined to be at risk of having osteosarcoma. For example, verifying the presence of osteosarcoma can include performing a skeletal survey or specific bone imaging analysis using X-rays or other suitable bone imaging technique, magnetic resonance imaging (MRI), computed tomography (CT), biopsy, and any combination thereof.
[0145] In one embodiment, the method further includes the step of treating the subject for osteosarcoma.
[0146] An aspect of the invention is a method of monitoring osteosarcoma. The method includes the steps of
[0147] (a) performing, on a tissue sample obtained from a subject having osteosarcoma or having been treated for osteosarcoma, an assay specifically capable of quantifying the level of expression of at least one microRNA (miRNA) selected from the group consisting of miR-1, miR-10b, and miR-133a; and
[0148] (b) repeating step (a) on a later-obtained tissue sample from the subject, wherein a level of expression of the at least one miRNA in the later-obtained sample greater than the level of expression of the at least one miRNA in the earlier-obtained sample indicates the osteosarcoma is progressive, and a level of expression of the at least one miRNA in the later-obtained sample lesser than the level of expression of the at least one miRNA in the earlier-obtained sample indicates the osteosarcoma is regressive.
[0149] An assay specifically capable of quantifying the level of expression of at least one microRNA (miRNA) selected from the group consisting of miR-1, miR-10b, and miR-133a can be, for example, RT-PCR using appropriately selected oligonucleotide primers.
[0150] In one embodiment, the tissue is blood. In one embodiment, the tissue is serum. In one embodiment, the tissue is plasma.
[0151] In one embodiment, the method further includes the step of adjusting the dose of or changing anti-cancer therapy when the osteosarcoma is found to be progressive. For example, when the osteosarcoma is found to be progressive, the anti-cancer therapy can be supplemented with or changed to another suitable anti-cancer therapy.
[0152] In one embodiment, the method further includes the step of adjusting the dose of or changing anti-cancer therapy when the osteosarcoma is found to be regressive. For example, when the osteosarcoma is found to be regressive, the anti-cancer therapy can be reduced or even suspended, or the anti-cancer therapy can be changed to another suitable anti-cancer therapy.
[0153] The invention, now having been generally disclosed, is further illustrated by the following non-limiting examples.
EXAMPLES
General Methods
[0154] Osteosarcoma cell purification from fresh clinical samples. Fresh human osteosarcoma samples were obtained in accordance with the ethical standards of the institutional committee on human experimentation from two patients undergoing diagnostic incisional biopsy from primary sites of osteosarcoma before neoadjuvant chemotherapy at the National Cancer Center Hospital of Japan between October 2010 and June 2011. The diagnosis of osteosarcoma and histologic subtypes were determined by certified pathologists. Surgical specimens were obtained at the time of resection and received in the laboratory within 10 minutes, immediately mechanically disaggregated and digested with collagenase and (Nitta-gelatin) and washed in phosphate-buffered saline (PBS) twice. Single-cell suspensions were obtained by filtration through a 70 .mu.m filter (BD Biosciences). Cells were cultured in Dulbecco's modified Eagle's medium (DMEM) (Invitrogen) containing 10% heat-inactivated fetal bovine serum (FBS) (Gibco BRL) and penicillin (100 U/mL) and streptomycin (100 .mu.g/mL) under 5% CO.sub.2 in a in a humidified incubator at 37.degree. C.
[0155] Cells and cell culture. The human osteosarcoma. HuO9 cell line was previously established in the applicant's laboratory. The human osteosarcoma cell lines SaOS2, U2OS, MG63, HOS, MNNG/HOS, and 143B were purchased from the American Type Culture Collection (ATCC). The transformed embryonic kidney cell line 293 was also obtained from the ATCC. SaOS2 and HuO9 cells were cultured in RPMI 1640 medium (Gibco BRL). U2OS, MG63, HOS, MNNG/HOS, 143B, and 293 cells were cultured in DMEM (Invitrogen). All media were supplemented with 10% heat-inactivated FBS (Gihco BRL) and penicillin (100 U/mL) and streptomycin (100 .mu.g/mL). The cells were maintained under 5% CO.sub.2 in a humidified incubator at 37.degree. C.
[0156] Cell sorting and flow cytometry. Cell sorting by flow cytometry was performed on osteosarcoma cell lines and clinical samples using phycoerythrin (PE)-conjugated monoclonal mouse anti-human CD133/2 (293C3, Miltenyi Biotec) and allophycocyanin (APC)-conjugated monoclonal mouse anti-human CD44 (eBioscience). Isotype control mouse IgG1.kappa.-PE (eBioscience) served as a control. Samples were analyzed and sorted on the JSAN cell sorter (Baybioscience) and the BD FACS AriaII (BD Biosciences). Viability was assessed using trypan blue exclusion. Results were analyzed with FlowJo software (Tree Star).
[0157] Cell proliferation and cytotoxity assay. Cell proliferation rates and cell viability as an indicator for the relative sensitivity of the cells to doxorubicin, cisplatin, and methotrexate were determined using TetraColor ONE Cell proliferation Assay System (Seikagaku) according to the manufacturer's instructions. Cells growing in the logarithmic phase were seeded in 96-well plates (5.times.10.sup.3/well), allowed to attach overnight, and then were treated with varying doses of doxorubicin (Sigma), cisplatin (Alexis), and methotrexate (Sigma) for 72 h. Triplicate wells were used for each treatment group. Absorbance was measured at 450 nm with a reference wavelength at 650 nm on EnVision (Wallac). The relative number of viable cells was expressed as the percent of cell viability.
[0158] Sphere formation. Osteosarcoma cells were plated at 5,000-10,000 cells/well in 300 .mu.L of serum-free DMEM/F12 medium (Invitrogen), supplemented with 20 ng/mL human recombinant epidermal growth factor (EGF) (Sigma-Aldrich), 10 ng/mL human recombinant basic fibroblast growth factor (bFGF) (Invitrogen), 4 .mu.g/mL insulin (Sigma-Aldrich), B-27.RTM. (1:50; Invitrogen), 500 units/mL penicillin (Invitrogen), and 500 .mu.g/mL streptomycin (Invitrogen). Cells were cultured in suspension in 24-well ultra-low attachment plates (Corning). Cells were replenished with 30 .mu.L of supplemented medium every second day. Spheres were counted on day 5 in triplicate wells. Cell culture was carried out at 37.degree. C. in a 5% CO.sub.2 humidified incubator.
[0159] Invasion assay. Invasion assays were performed by using 24-well BD BioCoat Invasion Chambers with Matrigel (Becton-Dickinson). 1.times.10.sup.5 cells, suspended in 500 .mu.L DMEM or RPMI 1640 medium without FBS, were added to the upper chamber, and DMEM or RPMI 1640 medium with 10% FBS was added to the lower chamber. After incubation for 24 h or 36 h, the cells on the upper surface of the filter were completely removed by wiping them with cotton swabs. The filters were fixed in methanol and stained with 1% toluidine blue in 1% sodium tetraborate (Sysmex). Filters were then mounted onto slides, and cells on lower surfaces were counted. Each assay was performed in triplicate.
[0160] miRNA profiling. miRNA expression profiling was performed using miRNA microarrays manufactured by Agilent Technologies (Santa Clara, Calif.), each containing 866 human miRNAs (Agilent Technologies [http://www.chem.agilent.com/scripts/PHome,asp]). Three independently extracted RNA samples of CD133.sup.high and CD133.sup.low cells just after isolation were used for array analyses in each cell line. Labeling and hybridization of total RNA samples were performed according to the manufacturer's protocol. Microarray results were extracted using Agilent Feature Extraction software (v10.7.3.1) and analyzed using GeneSpring GX 11.0.2 software (Agilent Technologies).
[0161] Clinical samples for survival correlation studies of CD133, miR-133a, and targets of miR-133a. Osteosarcoma tissue samples were obtained by diagnostic incisional biopsy from primary sites of osteosarcoma before neoadjuvant chemotherapy at the National Cancer Center Hospital of Japan between June 1997 and September 2010. Patients older than 40 y and having primary tumors located outside the extremities were excluded. Each fresh tumor sample was cut into two pieces, one of which was immediately cryopreserved in liquid nitrogen, and the other fixed with formalin. The diagnosis of osteosarcoma and histologic subtypes were determined by certified pathologists. Only osteosarcoma samples with the osteoblastic, chondroblastic, fibroblastic, and telangiectatic histologic subtypes were included. The response to chemotherapy was classified as good if the extent of tumor necrosis was 90% or greater. For the survival correlation studies of CD133 and the targets of miR-133a, available 35 cDNA samples from cDNA library were used, while RNA from available 48 formalin-fixed, paraffin-embedded (FFPE) samples were used for the correlation study of miR-133a. The clinical information of the patients is included in Tables 7 and 10 (below). All patients provided written informed consent authorizing the collection and use of their samples for research purposes. The study protocol for obtaining clinical information and collecting samples was approved by the Institutional Review Board of the National Cancer Center of Japan.
[0162] RNA isolation and quantitative real-time RT-PCR of mRNAs and miRNAs. Total RNA was purified from cells and tumor tissues with an RNeasy Mini Kit and RNase-Free DNase Set (QIAGEN). For quantitative polymerase chain reaction (qPCR) of mRNAs, cDNA was synthesized using High-Capacity cDNA Reverse Transcription Kit (Applied Biosystems). For each qPCR reaction, equal amounts of cDNA were mixed with Platinum SYBER Green qPCR SuperMix (Invitrogen) and specific primers (Table 1). Gene expression levels were normalized by beta actin (ACTB) or glyceraldehyde 3-phosphate dehydrogenase (GAPDH). For qPCR of miRNAs, miRNA was converted to cDNA using the TaqMan MicroRNA Reverse Transcription Kit (Applied Biosystems). RNU6B small nuclear RNA was amplified as an internal control. qPCR was performed using each miRNA-specific probe included with the TaqMan MicroRNA Assay on a Real-Time PCR System 7300 and SDS software (Applied Biosystems).
TABLE-US-00026 TABLE 1 Sequences of primers for real-time RT-PCR analysis. For/ Sequence SEQ Gene Rev (5'-Sequence-3') ID NO: CD133 For GGACCCATTGGCATTCTC 13 Rev CAGGACACAGCATAGAATAA 14 TC Oct3/4 For AGTGAGAGGCAACCTGGAGA 15 Rev ACACTCGGACCACATCCTTC 16 Nanog For CAGTCTGGACACTGGCTGAA 17 Rev CTCGCTGATTAGGCTCCAAC 18 Sox2 For TGGTACGGTAGGAGCTTTGC 19 Rev TTTTTCGTCGCTTGGAGACT 20 ABCB1 For CATGCTCCCAGGCTGTTTAT 21 Rev GTAACTTGGCAGTTTCAGTG 22 AGCG2 For TGCAACATGTACTGGCGAAG 23 A Rev TCTTCCACAAGCCCCAGG 24 ABCC2 For ACAGAGGCTGGTGGCAACC 25 Rev ACCATTACCTTGTCACTGTC 26 CATGA ezrin For CGGGACAAGTACAAGGCACT 27 GCGGCAGATCCGG Rev CCGGATCTGCCGCAGTGCCT 28 TGTACTTCCG .beta.4- For TGACGATCTGGACAACCTCA 29 integrin AGCA Rev ATCCAATGGTGTAGTCGCTG 30 GTGA MMP13 For GATACGTTCTTACAGAAGGC 31 Rev ACCCATCTGGCAAAATAAAC 32 CXCR4 For GGAGGGGATCAGTATATACA 33 Rev GAAGATGATGGAGTAGATGG 34 SGMS2 For CAATTCCTTGCTGCTTCTCC 35 Rev GCCTTTGTTTTGCTCCTCAG 36 UBA2 For AAAAAGGGTGTGACCGAGTG 37 Rev GCATCTTCTTCCCCAAACAA 38 SNX30 For CCTGAACGCCTACAAGAAGC 39 Rev ATGGTTCCCAGTTTGAGTGC 40 DOLPP1 For GAGAGGAGTGAGGCAACAGG 41 Rev ACCCCAGACACAGGTTTGAG 42 DUSP11 For GAGACGCGACTTTTCAGGAC 43 Rev GATCCAAAGGGGAAAAGCAT 44 CUL4B For GTTCTGGCGAAAAATCCAAA 45 Rev TCGAACAATTGCAGCATCA 46 ROD1 For CATTCCTGGGGCTAGTGGTA 47 Rev CCATCTGAACCAAGGCATTT 48 ZNF701 For ATCCCGTGGAGTGAAGGTC 49 Rev TCTCCAGCATCACGTCTCTG 50 MAST4 For AGCCCATTTTTCATTTGCAC 51 Rev TCGTCTGGTGTTGGTTGGTA 52 ANXA2 For CCTGAGCGTCCAGAAATGG 53 Rev GGACTGTTATTCGCAAGCTG 54 GTT ACTB For CATGAAGTGTGACGTGGACA 55 Rev CACGGAGTACTTGCGCTCAG 56 GAPDH For GACTTCAACAGCGACACCC 57 Rev GCCAAATTCGTTGTCATACC 58 A
[0163] Transfection with synthetic miRNAs, LNAs, and siRNAs. Synthetic hsa-miRs (Pre-miR-hsa-miR-1, -10b, -133a, and negative control (NC; Applied Biosystems, Table 2) and locked nucleic acids (LNAs) (LNA-1, -10b, -133a, and negative control, Exiqon, Table 3) were transfected into each type of cells at 30 nM each (final concentration) using DharmaFECT 1(GE Healthcare). Synthetic siRNAs (Bonac corporation, Table 4) were transfected into each type of cells at 100 nM each (final concentration) using DharmaFECT 1 (GE Healthcare). After 24 hours of incubation, cells were treated with chemotherapeutic agents for cytotoxicity assay or reseeded into invasion chambers for invasion assay.
TABLE-US-00027 TABLE 2 Sequences of miRNA products Sense/ Sequence SEQ miRNA Antisense (5'-Sequence-3') ID NO: hsa-miR- Sense UGGAAUGUAAAGAAGUAUUGUAU 1 1-2 Antisense UACAUACUUCUUAUGUACCC 59 hsa-miR- Sense UACCCUGUAGAACCGAAUUUGUG 2 10b Antisense ACAGAUUCGAUUCUAGGGGAAU 60 hsa-miR- Sense UUUGGUCCCCUUCAACCAGCUG 3 133a-1 Antisense AGCUGGUAAAAUGGAACCAAAU 61
TABLE-US-00028 TABLE 3 Sequences of LNA products Sequence SEQ miRNA (5'-Sequence-3') ID NO: hsa-miR-1-2 ACATACTTCTTTACATTCCA 10 hsa-miR-10b ACAAATTCGGTTCTACAGGGT 11 hsa-miR-133a-1 CAGCTGGTTGAAGGGGACCAA 12
TABLE-US-00029 TABLE 4 Sequences of siRNAs Sense/ Sequence SEQ Gene Antisense (5'-Sequence-3') ID NO: SGMS2 Sense CCACUAGAGUGGUGGAAAAdTdT 62 Antisense UUUUCCACCACUCUAGUGGdTdT 63 UBA2 Sense GGACUGGGCUGAAGUACAAdTdT 64 Antisense UUGUACUUCAGCCCAGUCCdTdT 65 SNX30 Sense CCGAGAAGUUUGUGGUAAAdTdT 66 Antisense UUUACCACAAACUUCUCGGdTdT 67 DOLPP Sense CUUCCUAAUCCGAGACACAdTdT 68 Antisense UGUGUCUCGGAUUAGGAAGdTdT 69 DUSP11 Sense CCAGAGGAUUUGCCAGAAAdTdT 70 Antisense UGUGUCUCGGAUUAGGAAGdTdT 71 CUL4B Sense GGUGAACACUUAACAGCAAdTdT 72 Antisense UUGCUGUUAAGUGUUCACCdTdT 73 ROD1 Sense GGGAAUGACAGCAAGAAAUdTdT 74 Antisense AUUUCUUGCUGUCAUUCCCdTdT 75 ZNF701 Sense CCAUAAUGAAGGAGGUCUUdTdT 76 Antisense AAGACCUCCUUCAUUAUGGdTdT 77 ANXA2 Sense UGACCAAGAUGCUCGGGAUdTdT 78 Antisense AUCCCGAGCAUCUUGGUCAdTdT 79 MAST4 Sense GGAGGUACCUUCUUCCAAAdTdT 80 Antisense UAUCAAACUUCCUCUUCUGdTdT 81
[0164] Establishment of miR-133a stably expressing cell line. miR-133a vectors were constructed by inserting cloning sequences including the full-length of the mature microRNA sequences into the pIRES-hyg vector (Clontech). The microRNA and control vectors were transfected into freshly isolated osteosarcoma CD133.sup.low HOS cells by calcium phosphate co-precipitation. The transfectants were split and grown in selective medium with 200 .mu.g/mL of hygromycin. Hygromycin-resistant colonies were chosen and expanded in medium containing 200 .mu.g/mL of hygromycin. The sequences of miR-133a constructs were confirmed by DNA sequencing (ABI 3130 sequencer, Applied Biosystems), and microRNA overexpression was confirmed by qRT-PCR. RNU6B served as the endogenous control.
[0165] Tumor transplantation experiments. Animal experiments were performed in compliance with the guidelines of the Institute for Laboratory Animal Research, National Cancer Center Research Institute. Athymic nude mice or NOD/SCID mice (CLEA Japan) were purchased at 4 weeks of age and given at least 1 week to adapt to their new environment prior to tumor transplantation. On day 0, mice were anesthetized with 3% isoflurane and the right leg disinfected with 70% ethanol. Cells were aspirated into a 1 mL tuberculin syringe fitted with a 27-G needle. The needle was inserted through the cortex of the anterior tuberosity of the tibia with a rotating movement to avoid cortical fracture. Once the bone was traversed, the needle was inserted further to fracture the posterior cortex of the tibia. A 100 .mu.L volume of solution containing freshly isolated CD133.sup.high and CD133.sup.low HOS-Luc (10.sup.2, 10.sup.3, 10.sup.4, 10.sup.5 cells per site) or 143B-Luc (1.5.times.10.sup.6) was injected while slowly moving back the needle.
[0166] Monitoring tumor growth, lung metastasis, and toxicity with/without LAN-anti-miR-133a. For the assessment of tumorigenicity between CD133.sup.high and CD133.sup.low HOS-Luc cells, NOD/SCID mice were injected with D-luciferin (150 mg/kg, Promega) by intraperitoneal injection. Ten minutes later, photons from firefly luciferase were counted using the IVIS imaging system (Xenogen Corp.) according to the manufacturer's instructions. Each experimental condition included 5 animals per group and monitoring once a week. For the evaluation of LNA-anti-miR-133a administration into spontaneous lung metastasis of osteosarcoma model mice, individual mice were injected with 10 mg/kg of LNA-anti-miR-133a or saline via the tail vain. LNA were injected on following days 4, 11, 18, 25, 32 postinoculation of 143B-Luc cells. Each experimental condition included 10 animals per group. The development of subsequent lung metastasis was monitored once a week in vivo by the bioluminescent imaging described above for 5 weeks. All data were analyzed using LivingImage software (version 2.50, Xenogen). On day 36, the primary tumor and lung in 5 mice of each group were resected at necropsy for their weight, bioluminescent, and histological analyses. The blood examination, weight of whole body as well as heart, liver, and skeletal muscle, and histopathological examination were performed for the assessment of toxicity. The remaining mice were observed for their survival period.
[0167] Comprehensive collection and identification of miR-133a target mRNAs. To collect comprehensive downstream targets of miR-133a, cDNA microarray profiling from two experimental approaches were performed. First, candidate genes were collected from cDNA microarray analysis performed from collected total RNA of SaOS2 CD133.sup.low cells transduced with miR-133a or negative control (NC). Second, cDNA microarray analysis was performed from collected total RNA from anti-Ago2 antibody immunoprecipitation (Ago2-IP) in CD133.sup.low cells transduced with miR-133a or NC. Downregulated genes in the former method with 1.5 fold decrease and upregulated genes in the latter method with 2.0 fold increase were defined as candidates by reference to in silico databases TargetScanHuman 6.0 (http://www.targetscan.org/).
[0168] Luciferase reporter assays. Each fragment of 3'UTR of SGMS2 (nt 1656-1879 (binding site) of NM_152621), UBA2 (nt 2527-2654 (binding site) of NM_005499), DUSP11 (nt 1180-1572 (binding site) of NM_003584), MAST4 (nt 8017-8096 (binding site) of NM_001164664), SNX30 (nt 6659-7611 (binding site) of NA_001012944) and CDS of ANXA2 (nt 244-743 (binding site) of NM_001002857) were amplified and cloned into the XhoI and NotI sites of firefly and renilla luciferase reporter genes of a psiCHECK-2 vector (Promega). All PCR products cloned into the plasmid were verified by DNA sequencing to ensure that they were free of mutations and in the correct cloning direction. Primer sequences are listed in Table 5. For the luciferase reporter assay, HOS cells were co-transfected with 100 ng of luciferase constructs and 100 nM synthetic miR-133a molecules or control (non-targeting siRNA oligonucleotide, Qiagen). Firefly and renilla luciferase activities were measured using the Dual-Luciferase Reporter Assay (Promega) 48 h after transfection. Results were expressed as relative renilla luciferase activity (renilla luciferase/firefly luciferase).
TABLE-US-00030 TABLE 5 Sequences of primers for luciferase reporter assays For/ Sequence SEQ Gene Rev (5'-Sequence-3') ID NO: SGMS2-UTR For GCTCGAGTAAAGCAAAAC 82 AAAGGCATCAGC Rev GCGGCCGCAAGGCTTGTC 83 ACCAATGAATGA SGMS2mu-UTR For AAATGTCAACCATTTTGT 84 GTAAACGATTA Rev AAATGGTTGACATTTCTT 85 CATTTACCAG UBA2-UTR For GCTCGAGTAATACCGCCT 86 GGTATGTCTGTG Rev GCGGCCGCAATGCAGATG 87 CCATTTATTTGGT UBA2mu-UTR For TTATGTCAACCATAAATG 88 GCATCTGCATT Rev TTATGGTTGACATAAGTA 89 TAGTCGTTAT SNX30-1-UTR For GCTCGAGTAACCCTGTTG 90 GACAGGATTGAT Rev GCGGCCGCAATTTTTAAA 91 GAAAGCATCTTTTATGG SNX30mu-1-UTR For TCTTATCAACCCACTTCA 92 GTCAGAAATGT Rev AGTGGGTTGATAAGACTG 93 CGAACAATCA DUSP11-UTR For GCTCGAGTAAAAACCTGT 94 CCTGGAATTCTACC Rev GCGGCCGCAAGATGGCCT 95 TTGGGTCAATAA DUSP11mu-UTR For CTGGATCAACGAGCTGGC 96 CTGAAAATTAC Rev GCTCGTTGATCCAGGTAG 97 AATTCCAGGA MAST4-UTR For GCTCGAGTAACTCCCCCA 98 GCTAGGAAACAG Rev GCGGCCGCAAAGAGATGG 99 GGCGGTCAGT MAST4mu-UTR For GACGTTCAACCGCCATCC 100 CCAGCCCCAAA Rev TGGCGGTTGAACGTCTCT 101 GCCCACGTTC ANXA2-UTR For GCTCGAGTAAGCGGGATG 102 CTTTGAACATT Rev GCGGCCGCAACTCCAGCG 103 TCATAGAGATCC ANXA2mu-UTR For ATCAATCAACCAGGTGTG 104 GATGAGGTCAC Rev ACCTGGTTGATTGATGGC 105 TGTTTCAATG
[0169] Immunohistochemistry. For the staining of CD133 and targets of miR-133a, slides of osteosarcoma clinical samples and xenografted tumors were prepared. Endogenous peroxidase was inhibited with 1% H.sub.2O.sub.2 (30 min). Slides were heated for antigen retrieval in 10 mM sodium citrate (pH 6.0). Subsequently, the slides were incubated with monoclonal mouse anti-human CD133/2 (1:10 dilution, Miltenyi Biotec), monoclonal mouse anti-human SGMS2 (1:50 dilution, Abeam), or isotype-matched control antibodies overnight at 4.degree. C. Immunodetection was performed using ImmPRESS peroxidase polymer detection reagents (Vector Laboratories) and Metal Enhanced DAB Substrate Kit (Thermo Fisher Scientific) according to the manufacturer's instructions. Staining was revealed by counter-staining with hematoxylin.
[0170] Statistical analysis. All statistical analyses were performed using SPSS software (SPSS, Inc.; Chicago, Ill.), with the exception of the significance in bar graphs, in which case analyses were performed by applying the Student's 1-test. Differences in the CD133 expression among different clinicopathological data were analyzed by Chi-square (.chi..sup.2) test. Cases with .DELTA.Ct lower than the mean value were classified as having high CD133 expression, while cases with .DELTA.Ct higher than the mean value were classified as having low CD133 expression. The Kaplan-Meier method and the log-rank test were used to compare the survival of patients with CD133.sup.high and CD133.sup.low primary tumors. Survival period was defined as the time from diagnosis until death whereas living patients were censored at the time of their last follow-up. For the calculation of differences in the expressions of miR-133a and its targets, the same procedure was applied. In all these analyses, a P value of 0.05 or less was considered to be a significant difference.
EXAMPLE 1
A Small Subset of Cells of Osteosarcoma Cell LineExpresses CD 133
[0171] Osteosarcoma cell lines SaOS2, HOS, U2OS, MNNG/HOS, MG63, 143B, and HuO9 were screened for markers of mesenchymal stem cells or neural stem cells that have been considered as the origin of sarcoma. Basu-Roy, U et al. (2011) Oncogene 31:2270-82; Kuhn, N Z et al, (2010) J. Cell. Physiol. 222:268-77, As a result, CD133, the structural homolog of prominin-1, was found in all cell lines at a small population ranging from 0.04% to 8.47%, whereas CD44 was found in a large population (FIG. 1). SaOS2, MNNG/HOS, and HOS were found to be particularly strong in their expression of CD133 (8.47, 8.13, and 7.69 percent, respectively).
[0172] Single-cell proliferation of freshly isolated cell population was observed using PKH dye, which is a fluorescent dye that binds to cell membranes and segregates in daughter cells after each cell division. Normally, PKH concentration decreases with each cell division, so that quiescent cells remain PKH.sup.high and dividing cells become progressively PKH.sup.low. Moreover, normally PKH67 dye is distributed equally between daughter cells, whereas rapidly dividing cells, e.g., cancer cells, exhibit asymmetric division.
[0173] The CD133.sup.high cell population generated both CD133.sup.high and CD133.sup.low populations with different proliferative fates: one that is quiescent (PKH.sup.high) and another that divides actively (PKH.sup.low). A single PKH26.sup.high cell of CD133.sup.high fraction showed asymmetric division; a small number of PKH26.sup.high cells, presenting as dormant cells, were observed surrounded by PKH26.sup.low cells on day 8, which were identified as a fraction with both CD133.sup.high and CD133.sup.low cells on FACS analysis. On the other hand, a single PKH67.sup.high cell of CD133.sup.low SaOS2 fraction showed symmetric division; a colony with PKH67.sup.low cells was observed, which was identified as a CD133.sup.low fraction in FACS analysis two weeks after isolation (FIG. 2). No difference in cell division according to the expression of CD44 was observed.
[0174] Further examinations were performed to identify other phenotypes of CD133.sup.high and CD133.sup.low population. A total of 5.times.10.sup.3 CD133.sup.high and CD133.sup.low cells were sorted and cultured immediately under conditions of serum-free, growth factor-supplemented anchorage-independent environment. Within two weeks of culture, more osteosarcoma spheres were observed from CD133.sup.high cells than CD133.sup.lowcells (FIG. 3).
EXAMPLE 2
CD133.sup.high Cells Exhibit Increased Drug Resistance, Invasiveness, and Tumorigenesis
[0175] Since drug resistance is one of the important properties of TICs, populations of CD133.sup.high and CD133.sup.low cells were observed in the treatment condition with doxorubicin (DOX), cisplatin (CDDP), and methotrexate (MTX), which are standard chemotherapeutics against osteosarcoma, CD133.sup.high cells were more resistant to these chemotherapeutics than CD133.sup.low cells (FIG. 4). Furthermore, CD133.sup.high cells exhibited higher capability of invasion than CD133.sup.low cells (FIG. 5). qRT-PCR of mRNA from freshly isolated CD133.sup.high and CD133.sup.low cells revealed that CD133.sup.high SaOS2 cells expressed enhanced levels of Oct3/4, Nanog, and Sox-2, which are transcription factors that play a critical role in maintenance of self-renewal and pluripotency of embryonic stem cells as well as CSCs or TICs (Livings, P P et al. (2009) Cancer Res. 69:5648-55; Basu-Roy U et al. (2011) Oncogene 31:2270-82); multidrug resistance transporter genes ABCB1, ABCC2, ABCG2; and metastasis-associated genes .beta.4-integrin, ezrin, MMP-13 , and CXCR4 (Tang, N et al. (2008) Clin. Orthop. Relat. Res. 466:2114-30; Osaki, M et al. (2011) Mol. Ther. 19:1123-30) (FIG. 6). Most importantly, the CD133.sup.high HOS fraction showed stronger tumorigenicity in vivo than the CD133.sup.low HOS fraction; CD133.sup.high cells could form tumors from as few as 100 cells, whereas CD133.sup.low cells could not (FIG. 7). Results are also shown in Table 6.
TABLE-US-00031 TABLE 6 Tumor development in vivo using osteosarcoma CD133.sup.high and CD133.sup.low populations alone Cell Type Tumor Incidence Cell Number CD133.sup.high 5/5 100,000 5/5 10,000 5/5 1,000 4/5 100 CD133.sup.low 4/5 100,000 1/5 10,000 1/5 1,000 1/5 100
EXAMPLE 3
High-Level Expression of CD133 Messenger RNA is a Marker for Poor Survival Rates of Osteosarcoma Patients
[0176] To evaluate the clinical importance of CD133, cell lines established from fresh human osteosarcoma biopsies were analyzed by flow cytometer and found to contain CD133.sup.high population at a rare frequency <10% (FIG. 8). Furthermore, a clinical study of 35 osteosarcoma patients revealed that high expression levels of CD133 messenger RNA (mRNA) correlated with significantly worse overall survival rates of osteosarcoma patients (log-rank lest, P=0.0262). Results are shown in FIG. 9 and Table 7.
TABLE-US-00032 TABLE 7 Uni- and multivariate analyses and the relationship between clinicopathologic variables and CD133 expression in 35 cases Number Correlation of CD133 CD133 (CD133) .chi..sup.2 Variable cases Low High (P value) Age (years) 0.120 0-10 7 6 1 11-20 25 11 14 21+ 3 1 2 Gender 0.164 Male 23 14 9 Female 12 4 8 Site 0.319 Femur 21 12 9 Tibia 9 5 4 Humerus 2 1 1 Other 3 0 3 Histology 0.394 Osteoblastic 16 9 7 Chandroblastic 6 4 2 Fibroblastic 2 0 2 Other, NA* 11 5 6 Metastasis at diagnosis 0.045 Present 4 0 4 Absent 31 18 13 Neoadjuvant chemotherapy 0.425 MTX + DOX/CDDP 21 10 11 IFO + DOX/CDDP 13 8 5 Other 1 0 1 Response to neoadjuvant 0.088 chemotherapy Good (necrosis > 90%) 11 6 5 Poor (necrosis < 90%) 20 12 8 NA* 4 0 4 CD133 mRNA expression High 17 0 17 Low 18 18 0
EXAMPLE 4
miR-1, miR-10b, and miR-133a are Upregulated in CD133.sup.high Cells Compared to CD133.sup.low Cells
[0177] miRNA expression profiling has been reported to be a useful diagnostic and prognostic tool, and many studies have indicated that certain miRNAs act as either an oncogene or a tumor suppressor. Croce. C M (2009) Nat. Rev. Genet, 10:704-10. in order further to characterize the molecular mechanism underlying the CD133.sup.high and CD133.sup.low phenotypes, miRNA profiling of isolated CD133.sup.high and CD133.sup.low osteosarcoma SaOS2 and HOS cells was performed using microarray analysis containing 866 sequence-validated human miRNAs. Results, shown in FIG. 10 and Table 8, revealed that 3 miRNAs were upregulated at >2-fold changes in CD133.sup.high cells compared to CD133.sup.low cells. A second round of qPCR validation study revealed miR-1, miR-10b, and miR-133a were consistent with the microarray data (FIG. 11).
TABLE-US-00033 TABLE 8 microRNA expression profile of CD133.sup.high versus CD133.sup.low osteosarcoma cells Fold change Fold change (SaOS2 (HOS CD133.sup.high Regu- CD133.sup.high Regu- miRNA vs CD133.sup.low) lation vs CD133.sup.low) lation Commonly upregulated miRNAs in SaOS2 and HOS with >2 fold change in CD133.sup.high cells compared to CD133.sup.low cells hsa-miR-1 7.23 up 3.81 up hsa-miR-500* 5.39 up 3.99 up hsa-miR-660 2.09 up 2.05 up Upregulated miRNAs in SaOS2 with >2 fold change in CD133.sup.high cells compared to CD133.sup.low cells hsa-miR-551b 9.49 up hsa-miR-30e 9.19 up hsa-miR-148b 8.26 up hsa-miR-193a-3p 7.77 up hsa-miR-1 7.23 up hsa-miR-221* 6.76 up hsa-miR-24-1* 6.36 up hsa-miR-1825 5.78 up hsa-miR-500* 5.39 up hsa-miR-92a-2* 4.36 up hsa-miR-1202 3.39 up hsa-miR-424 3.23 up hsa-miR-19b-2* 2.87 up hsa-miR-29c 2.42 up hsa-miR-494 2.37 up hsa-miR-10b 2.16 up hsa-miR-374a 2.11 up hsa-miR-660 2.09 up hsa-miR-30e* 2.03 up Downregulated miRNAs in SaOS2 with <2 fold change in CD133.sup.high cells compared to CD133.sup.low cells hsa-miR-1281 9.45 down hsa-miR-195 6.56 down hsa-miR-129-5p 5.74 down hsa-miR-129-3p 4.98 down hsa-miR-183 4.89 down hsa-miR-1305 4.76 down hsa-miR-1275 4.65 down hsa-miR-484 4.55 down hsa-miR-1268 4.51 down hsa-miR-186 4.51 down hsa-miR-181a* 4.46 down hsa-miR-744* 2.72 down hsa-miR-96 2.65 down hsa-miR-142-3p 2.35 down hcmv-miR-US25-2-5p 2.31 down Upregulated miRNAs in HOS with >2 fold change in CD133.sup.high cells compared to CD133.sup.low cells hsa-miR-1181 12.78 up hsa-miR-133b 7.22 up hsa-miR-532-5p 7.10 up hsa-miR-338-3p 6.30 up hsa-miR-9 5.95 up hsa-miR-34c-5p 5.37 up hsa-miR-378* 5.26 up hsa-miR-181a* 5.04 up hsa-miR-145* 4.97 up hsa-miR-1271 4.97 up hsa-miR-362-3p 4.67 up hsa-miR-152 4.63 up hsa-miR-663 4.46 up hsa-miR-9* 4.15 up hsa-miR-340 4.10 up hsa-miR-744 4.07 up hsa-miR-500* 3.99 up hsa-miR-1 3.81 up hsa-miR-1305 3.33 up hsa-miR-744* 3.11 up hsa-miR-629 2.88 up hsa-miR-629* 2.71 up hsa-miR-145 2.55 up hsa-miR-1246 2.47 up hsa-miR-21* 2.39 up hsa-miR-450a 2.35 up hsa-miR-425* 2.31 up hsa-miR-148a 2.30 up hsa-let-7f-1* 2.26 up hsa-miR-301b 2.21 up hsa-miR-1826 2.15 up hsa-miR-128 2.15 up hsa-miR-378 2.14 up hsa-miR-126 2.13 up hsa-miR-598 2.06 up hsa-miR-1915 7.05 up hsa-miR-660 2.05 up hsa-miR-933 2.02 up Downregulated miRNAs in HOS with <2 fold change in CD133.sup.high cells compared to CD133.sup.low cells hsv1-miR-H6 4.60 down hsa-miR-1539 4.02 down hsa-miR-483-3p 3.76 down hsa-miR-328 3.72 down hsa-miR-132* 3.67 down hsa-miR-129* 3.66 down hsa-miR-548c-5p 3.13 down hsa-miR-1825 2.05 down
hsa, Homo sapiens.
[0178] miRNA and miRNA* are the two strands of the double-stranded RNA product of dicer processing of the stern loop precursor miRNA. miRNA is the "guide" strand that eventually enters RISC, and miRNA* is the other "passenger" strand. The level of miRNA* present in the cell is low (.ltoreq.15% relative to the corresponding miRNA). In cases where there is a higher proportion of passenger strand present in the cell, the nomenclature miRNA-3p/miRNA-5p is used instead of miRNA/miRNA*. miRNA-3p is the miRNA derived from the 3' arm of the precursor miRNA, and miRNA-5p is the miRNA derived from the 5' arm of the precursor miRNA.
EXAMPLE 5
Transfection of CD133.sup.low Cells with miR-133 Confers Properties Associated with CD133.sup.high Cells, and High Expression of miR-133a is Correlated with Poor Clinical Prognosis
[0179] To determine whether these miRNAs can inhibit these phenotypes of osteosarcoma tumor-initiating cells, expression levels of miR-1, miR-10b, and miR-133a were manipulated in CD133.sup.low cells (FIG. 12). These miRNAs, especially miR-133a, enhanced the invasiveness of CD133.sup.low cells compared to miR-NC (negative control) oligonucleotides (FIG. 13). Interestingly, transfection of all these miRNAs dramatically enhanced the invasion of CD133.sup.low cells (FIG. 13). Cell proliferation and drug resistance were slightly enhanced in CD133.sup.low cells by miR-133 transfection (FIG. 14). Stable overexpressing miR-133a HOS CD133.sup.low cells (FIG. 15) showed stronger (>2-fold) ability to form spheres than control CD133.sup.low cells under anchorage serum-free environment and could develop tumors with as few as 100 cells in vivo whereas control CD133.sup.low cells could not (FIG. 16 and Table 9).
TABLE-US-00034 TABLE 9 Tumor development in vivo using osteosarcoma CD133.sup.low populations stably overexpressing miR-133a Cell Type Tumor Incidence Cell Number CD133.sup.low miR-133a 5/5 100,000 4/4 10,000 5/5 1,000 2/5 100 CD133.sup.low EV.sup.1 5/5 100,000 1/4 10,000 0/5 1,000 0/5 100 CD133.sup.low CDDP.sup.2 5/5 100 CD133.sup.low Saline.sup.3 0/5 100 .sup.1EV, empty vector. .sup.2CDDP, cells treated with CDDP. .sup.3Saline, cells treated with saline.
[0180] Transfection of miR-133a also increased messenger RNA (mRNA) levels of the molecules that were upregulated in CD133.sup.high cells (see FIG. 6) but not CD133 mRNA, suggesting that miR-133a does not affect the expression of the molecules on the upstream pathway of CD133 (FIG. 17). These results revealed that miR-133a is a candidate miRNA that can regulate the phenotypes of osteosarcoma TICs. Indeed, the expression of miR-133a was also high in the CD133.sup.high fraction of osteosarcoma biopsies (FIG. 18), and high expression of miR-133a was significantly correlated with poor prognosis of patients (Table 10).
TABLE-US-00035 TABLE 10 Uni- and multivariate analyses and the relationship between clinicopathologic variables and miR-133a expression in 48 cases Number Correlation of miR-133a miR-133a (CD133).chi..sup.2 Variable cases Low High (P value) Age (years) 0.228 0-10 9 9 0 11-20 30 23 7 21+ 9 8 1 Gender 1.000 Male 31 26 5 Female 17 14 3 Site 0.566 Femur 26 22 4 Tibia 16 14 2 Humerus 2 1 1 Other 4 3 1 Histology 0.142 Osteoblastic 25 23 2 Chondroblastic 7 6 1 Fibroblastic 2 2 0 Other, NA* 14 9 5 Metastasis at diagnosis 0.330 Present 7 5 2 Absent 41 35 6 Neoadjuvant chemotherapy 0.902 MTX + DOX/CDDP 29 24 5 IFO + DOX/CDDP 18 15 3 Other 1 1 0 Response to neoadjuvant 0.173 chemotherapy Good (necrosis > 90%) 17 16 1 Poor (necrosis < 90%) 26 21 5 NA* 5 3 2 miR-133a expression High 8 0 8 Low 40 40 0
EXAMPLE 6
Transfection of CD133.sup.low SaOS2 Cells with miRNAs Results in Increased Proliferation
[0181] CD133.sup.low SaOS2 cells were isolated by cell sorting and then transfected with negative control (NC) RNA, miR-1 alone, miR-10b alone, miR-133a alone, miR-1 plus mirR-10b, mirR-10b plus miR-133a, miR-1 plus miR-133a, or miR-1 plus miR-10b plus miR-133a. CD133.sup.high cells also were isolated by cell sorting and then transfected with negative control (NC) RNA. Each population of cells was separately maintained in tissue culture for 3-7 days and then studied with a light microscope to assess cell proliferation. Results are shown in FIG. 19. As is evident from FIG. 19, CD133.sup.low SaOS2 cells transfected with miR-1 alone, miR-10b alone, miR-133a alone, miR-1 plus mirR-10b, mirR-10b plus miR-133a, miR-1 plus miR-133a, or miR-1 plus miR-10b plus miR-133a proliferated to a greater extent than did CD133.sup.low SaOS2 cells transfected with negative control RNA. CD133.sup.low SaOS2 cells transfected with miR-1 plus miR-10b plus miR-133a proliferated to nearly the same extent as CD133.sup.high cells transfected with negative control RNA. The effects of the combinations were at least additive.
[0182] Similar results were obtained in an experiment with MNNG/HOS cells in place of SaOS2 cells (FIG. 20).
EXAMPLE 7
Transfection of CD133.sup.low SaOS2 Cells with miRNAs Results in Drug Resistance
[0183] CD133.sup.low SaOS2 cells were isolated by cell sorting and then transfected with negative control (NC) RNA, miR-1 alone, miR-10b alone, miR-133a alone, or miR-1 plus miR-10b plus miR-133a, similar to Example 1. Each population of transfected cells was then separately maintained in tissue culture for four days in the presence of 30 nM doxorubicin, 2.5 .mu.M cisplatin, or 320 nM methotrexate, and then cells were counted. Results are shown in FIG. 21. As is evident from FIG. 21, CD133.sup.low SaOS2 cells transfected with miR-133a alone or with miR-1 plus miR-10b plus miR-133a proliferated to a greater extent than negative control in the presence of cisplatin and in the presence of methotrexate. The addition of miR-133a thus was associated with increased resistance to cisplatin and methotrexate.
EXAMPLE 8
miR-1, miR-10b, and miR-133a are Induced by Cisplatin Treatment
[0184] The expressions of miR-1, miR-10b, and miR-133a, as well as CD133, were induced by cisplatin treatment. qRT-PCR analysis showed that DOX-treated or CDDP-treated (3 days) 143B cells expressed an increased level of miR-1, miR-10b, and miR-133a relative to untreated 143B cells (FIG. 22). In addition, the expression of miR-133a was enhanced by cisplatin in CD133.sup.low HOS cells. Furthermore, exposure to CDDP increased in vivo tumorigenicity of CD133.sup.low HOS population. CDDP-treated CD133.sup.low HOS cells could form tumors with as few as 100 cells per injection, whereas the untreated CD133.sup.low HOS cells could not (FIG. 23 and Table 9). These data indicate that the TIC phenotypes, as well as the expression of CD133 mRNA and miR-133a, might be enhanced by chemotherapeutics. Therefore, we reasoned that silencing of miR-133a before or during chemotherapy would prevent the increase of the expression of miR-133a, which enhanced TIC phenotypes and was induced by chemotherapeutics.
EXAMPLE 9
Antisense to miR-133a Reduces Proliferation of CD133.sup.high Cells
[0185] To evaluate whether silencing of miR-133a can suppress malignant phenotypes of osteosarcoma, experiments opposite those of Example 8 were performed by introducing locked nucleic acid (LNA) anti-miR-133a. LNA is a class of nucleic acid analogs possessing very high affinity and excellent specificity toward complementary DNA and RNA, and LNA oligonucleotides have been applied as antisense molecules both in vitro and in vivo. Elmen, J et al. (2008) Nature 452:896-9; Obad, S et al. (2011) Nat. Genet. 43:371-8. CD133.sup.high population of SaOS2 and HOS cells was isolated by cell sorting and transfected with LNA-anti-miR-133a (LNA-133a) and LNA-negative control (LNA-NC). As a control, the isolated CD133.sup.low SaOS2 and HOS cells were also transfected with LNA-NC. The efficacy of LNA-133a for the silencing of miR-133a was confirmed by real-time RT-PCR analysis (FIG. 24). CD133.sup.high SaOS2 and HOS cells transfected with LNA-133a were suppressed in proliferation rate to the same level of CD133.sup.low cells transfected with LNA-NC (FIG. 25).
EXAMPLE 10
LNA-133a-Transduced CD133.sup.high Cells Exhibit Enhanced Drug Sensitivity and Decreased Invasiveness
[0186] LNA-133a-transduced CD133.sup.high cells exhibited enhanced sensitivity to DOX and CDDP at the level of LNA-NC-transduced CD133.sup.low cells. These results were validated by counting Hoechst-stained cells showing apoptotic nuclear condensation and fragmentation in CD133.sup.high cells. There was a significantly higher apoptotic cell death rate in LNA-133a-transduced CD133.sup.high cells compared to control CD133.sup.high cells (FIG. 26). Furthermore, LNA-133a decreased the invasiveness of CD133.sup.high SaOS2 and HOS populations (FIG. 27) and the expression of the molecules associated with CD133.sup.high phenotypes (FIG. 28). Collectively, these observations suggest that silencing of miR-133a in CD133.sup.high cells can reduce the malignant phenotype of osteosarcoma TICs, including drug resistance and invasion.
EXAMPLE 11
Silencing miR-133a In Vivo is Effective for the Treatment of Osteosarcoma and Exhibits Synergistic Efficacy in Combination with CDDP
[0187] To extend the in vitro findings and to determine whether silencing of miR-133a could be an effective therapeutic option for osteosarcoma treatment, the effect of LNA-133a on a spontaneous lung metastasis model of osteosarcoma was examined. Experimentally, 1.5.times.10.sup.6 cells of 143B transfected with firefly luciferase gene (143B-luc) were implanted orthotopically into the right proximal tibia of athymic nude mice. The implanted tumor growth and the presence of distant metastases were analyzed weekly for luciferase bioluminescence using an in vivo imaging system (IVIS). A new treatment protocol was made of LNA-133a intravenous (i.v.) administration (10 mg kg.sup.-1) 24 h before intraperitoneal (i.p.) injection of CDDP (2.5 mg kg.sup.-1) (FIG. 29) in order to decrease drug resistance and to prevent the induction of TIC phenotypes by chemotherapy, which were observed in in vitro experiments. Before the animal study of this protocol, we confirmed reduced miR-133a levels in osteosarcoma tissues from LNA-133a-treated mice compared with those from saline-treated mice (FIG. 30). To assess the efficacy of the new treatment protocol, results were compared with three control groups (n=10 each): a saline control group, an LNA group, and a CDDP group. At 5 weeks, half the mice in each group were euthanized for further analysis; the remaining mice were monitored for survival.
[0188] Results. The expression of miR-133a of tumors was decreased in the presence of LNA-133a (FIG. 31). Mice that had been administered LNA-133a (10 mg kg.sup.-1 i.v.) and CDDP (2 mg kg.sup.-1 i.p.) showed a significantly smaller tumor growth compared to the other groups (FIGS. 32 and 33). No significant differences in tumor growth were observed in the presence or in the absence of CDDP alone (FIGS. 32 and 33). Furthermore, lung metastasis was observed in 10/10 (100%) of the saline group, 7/10 (70%) of the LNA group, 8/10 (80%) of CDDP group, and only 3/10 (30%) of combination group (LNA-133a+CDDP) on day 35 (Table 11).
TABLE-US-00036 TABLE 11 Outcome of LNA treatment in osteosarcoma-bearing mice Tumor weight Lung Luminescence Group (mean) (g) metastasis of lung (mean) ctrl. 3.928 10/10 5047 LNA 3.143 7/10 1744 CDDP 3.957 8/10 2855 LNA + CDDP 1.901 3/10 582
[0189] The average luminescence at chest region was significantly decreased in mice treated with the combination of LNA-133a and CDDP. Both the number and size of lung metastasis at every lobe were validated in the luciferase assay and histopathological examination.
[0190] Notably, the effect of the combination therapy (LNA-133a+CDDP) was found to exhibit synergistic inhibition of lung metastasis.
[0191] Furthermore, the combination therapy (LNA-133a+CDDP) significantly extended the survival period of tumor-bearing mice (log-rank test, P=0.0084, FIG. 34). Despite the highly conserved sequence of mature human miR-133a and murine miR-133a (e.g., GenBank Accession No. NR_029676; 5'-UUUGGUCCCCUUCAACCAGCUG-3'; SEQ ID NO:3), all mice showed minimal toxic effects on various tissue including heart, liver, and skeletal muscle during the observation period. Thus, systemic administration of LNA-133a is effective for suppression of tumor growth and lung metastasis in the xenograft model for highly metastatic osteosarcoma in the presence of cisplatin.
EXAMPLE 12
Identification of Gene Targets for miR-133a
[0192] The examples above establish that miR-133a regulates the malignancy of CD133.sup.high osteosarcoma TICs, and inhibition of miR-133a expression in osteosarcoma cells inhibits the tumor development. In order to understand the mechanisms regulated by miR-133a in CD133.sup.high osteosarcoma TICs, candidate mRNA expression profiling was performed by two different microarray analyses together with in silico predictions (FIG. 35). We detected 1812 downregulated genes with at least a 1.2-fold decrease in the first microarray analysis of total RNA collected from SaOS2 CD133.sup.low cells transduced miR-133a or NC, whereas 4976 upregulated genes were detected with at least a 2.0-fold increase in the second microarray analysis of mRNA expression in RNA collected from anti-Ago2 antibody immunoprecipitation in CD133.sup.low cells transduced with miR-133a or NC (FIG. 36). Subsequently, 226 genes were collected by both methods (Table 12), and 20 genes were identified in TargetScanHuman 6.0, one of the publicly available in silky databases (FIG. 36).
TABLE-US-00037 TABLE 12 Predicted gene targets for miR-133a by two analyses of cDNA microarray and in silico prediction Fold increase, Fold decrease, GenBank miR-133a- miR-133a Gene Symbol Accession Gene Name Ago2 complex transfection PGAP1 NM_024989 post-GPI attachment to proteins 1 7.60 -0.42 C1orf118 XR_041258 chromosome 1 open reading frame 118 7.19 -0.28 DYNLT3 NM_006520 dynein, light chain, Tetex-type 3 7.17 -0.42 AGFG1 NM_001135187 ArfGAP with FG repeats 1 6.69 -0.28 WDR44 NM_019045 WD repeat domain 44 6.36 -0.43 FLYWCH1 NM_020912 FLYWCH-type zinc finger 1 5.62 -0.32 CARKD NM_018210 carbohydrate kinase domain containing 5.50 -0.66 CUL4B NM_003588 cullin 4B 5.30 -0.40 ETS1 NM_005238 v-ets erythroblastosis virus E26 5.29 -0.74 oncogene homolog 1 (avian) HDAC6 NM_006044 histone deacetylase 6 5.20 -0.36 C19orf10 NM_019107 chromosome 19 open reading frame 10 5.17 -0.36 RASA2 NM_006506 RAS p21 protein activator 2 5.15 -0.44 KIAA1958 NM_133465 KIAA1958 5.14 -0.28 LOC645851 NR_024395 hypothetical LOC645851 5.09 -0.37 TBPL1 NM_004865 TBP-like 1 4.86 -0.33 SNX26 NM_052948 sorting nexin 26 4.73 -0.27 SCRN1 NM_001145513 secemin 1 4.72 -0.55 LOC100132672 XR_038504 similar to glycosyltransferase 8 domain 4.61 -0.36 containing 3 AP4S1 NM_001128126 adaptor-related protein complex 4, 4.39 -0.59 sigma 1 subunit SF3B3 NM_012426 splicing factor 3b, subunit 3, 130 kDa 4.34 -0.27 LMBR1 NM_022458 limb region 1 homolog (mouse) 4.31 -0.40 HERC4 NM_022079 hect domain and RLD 4 4.26 -0.69 ADAMTS1 NM_006988 ADAM metallopeptidase with 4.17 -0.47 thrombospondin type 1 motif, 1 CYB5R4 NM_016230 cytochrome b5 reductase 4 4.14 -0.29 LHFPL2 NM_005779 lipoma HMGIC fusion partner-like 2 4.11 -0.30 FAM13AOS NR_002806 FAM13A opposite strand (non-protein 4.04 -0.28 coding) RALGAPA1 NM_194301 Ral GTPase activating protein, alpha 4.00 -0.53 subunit 1 (catalytic) TNFRSF13C NM_052945 tumor necrosis factor receptor 3.99 -0.44 superfamily, member 13C LOC100131829 AK124002 hypothetical protein LOC100131829 3.95 -0.43 C1orf58 NM_144695 chromosome 1 open reading frame 58 3.92 -0.54 TNFRSF10D NM_003840 tumor necrosis factor receptor 3.75 -0.45 superfamily, member 10d, decoy with truncated death domain ZDHHC17 NM_015336 zinc finger, DHHC-type containing 17 1.68 -0.36 LOC729603 NR_003288 calcium binding protein P22 3.62 -0.34 pseudogene SNX30 NM_001012994 sorting nexin family member 30 3.55 -0.41 TSTD2 NM_139246 thiosulfate sulfurtransferase 3.52 -0.38 (rhodanese)-like domain containing 2 SPRYD4 NM_207344 SPRY domain containing 4 3.51 -0.35 PTPMT1 NM_175732 protein tyrosine phosphatase, 3.50 -0.38 mitochondrial 1 KLHDC4 NM_017566 kelch domain containing 4 343 -0.43 SLC30A7 NM_133496 solute carrier family 30 (zinc 3.38 -0.48 transporter), member 7 TCEA3 NM_003196 transcription elongation factor A (SII), 3 3.32 -0.39 GORASP1 NM_031899 golgi reassembly stacking protein 1, 3.17 -0.51 65 kDa RBM15B NM_013286 RNA binding motif protein 15B 3.13 -0.80 PDGFRB NM_002609 platelet-derived growth factor receptor, 3.13 -0.37 beta potypeptide ITPRIPL2 NM_001034841 inositol 1,4,5-triphosphate receptor 3.09 -0.34 interacting protein-like 2 FBXO3 NM_033406 F-box protein 3 3.01 -0.35 FAM122B NM_001166600 family with sequence similarity 122B 3.00 -0.30 MINPP1 NM_004897 multiple inositol polyphosphate 2.98 -0.28 histidine phosphatase, 1 SPOPL NM_001001664 speckle-type POZ protein-like 2.94 -0.47 FAM86B1 NM_001083537 family with sequence similarity 86, 2.85 -0.44 member B1 LOC100128071 XM_001724939 similar to hCG41624 2.83 -0.31 CCNT1 NM_001240 cyclin T1 2.82 -0.53 AP2M1 NM_004068 adaptor-related protein complex 2, mu 1 2.80 -0.44 subunit AKIRIN1 NM_024595 akirin 1 2.73 -0.27 CHMP5 NM_016410 chromatin modifying protein 5 2.69 -0.61 PPM1K NM_152542 protein phosphatase 1K (PP2C domain 2.67 -0.53 containing) MICALL2 NM_182924 MICAL-like 2 2.66 -0.29 DGKZ AK123378 diacylglycerol kinase, zeta 104 kDa 2.65 -0.39 SCARNA16 NR_003013 small Cajal body-specific RNA 16 2.65 -0.50 SERPINE1 NM_000602 serpin peptidase inhibitor, clade E 2.65 -0.61 (nexin, plasminogen activator inhibitor type 1), member 1 STARD13 NM_178006 StAR-related lipid transfer (START) 2.58 -0.28 domain containing 13 ROD1 NM_005156 ROD1 regulator of differentiation 1 (S. 2.55 -0.36 pombe) VEGFC NM_005429 vascular endothelial growth factor C 2.45 -0.35 MYH9 NM_002473 myosin, heavy chain 9, non-muscle 2.43 -0.39 CCNJ NM_019084 cyclin J 2.41 -0.26 WDR66 NM_144668 WD repeat domain 66 238 -0.32 CSRNP1 NM_033027 cysteine-serine-rich nuclear protein 1 2.34 -0.28 MYBL1 NM_001144755 v-myb myeloblastosis viral oncogene 2.32 -0.29 homolog (avian)-like 1 EME2 BC041011 essential meiotic endonuclease 1 2.31 -0.44 homolog 2 (S. pombe) MGC27382 AK091757 hypothetical MGC27382 2.27 -0.33 MMP14 NM_004995 matrix metallopeptidase 14 (membrane- 2.27 -0.42 inserted) WASH1 NM_182905 WAS protein family homolog 1 2.26 -0.32 RIMS2 NM_014677 regulating synaptic membrane 2.25 -0.45 exocytosis 2 HSPG2 NM_005529 heparan sulfate proteoglycan 2 2.25 -0.45 HDAC8 NM_018486 historic deacetylase 8 2.21 -0.34 AK2 NM_013411 adenylate kinase 2 2.20 -0.30 SRRM2 NM_016333 serine/arginine repetitive matrix 2 2.19 -0.28 LOC731419 XM_001132610 hypothetical protein LOC731419 2.19 -0.32 SYNGR3 NM_004209 synaptogyrin 3 2.11 -0.33 PRUNE2 NM_015225 prune homolog 2 (Drosophila) 2.11 -0.38 MLKL NM_152649 mixed lineage kinase domain-like 2.10 -0.30 DST NM_001723 dystonin 2.10 -0.44 PBXIP1 NM_020524 pre-B-cell leukemia homeobox 2.03 -0.78 interacting protein 1 ANTXR2 NM_058172 anthrax toxin receptor 2 1.98 -0.61 NSF NM_006178 N-ethylmaleimide-sensitive factor 1.98 -0.32 APH1A NM_001077628 anterior pharynx defective 1 homolog A 1.98 -0.34 (C. elegans) RASA1 NM_002890 RAS p21 protein activator (GTPase 1.95 -0.46 activating protein) 1 BAIAP2 NM_017451 BAH-associated protein 2 1.91 -0.29 GARNL3 NM_032293 GTPase activating Rap/RanGAP 1.90 -0.49 domain-Like 3 CKLF NM_016951 chemokine-like factor 1.89 -0.38 SNORD17 NR_003045 small nucleolar RNA, C/D box 17 1.88 -0.27 TRIT1 NM_017646 tRNA isopentenyltransferase 1 1.88 -0.43 FILIP1L NM_182909 filamin A interacting protein 1-like 1.88 -0.36 VAMP2 NM_014232 vesicle-associated membrane protein 2 1.87 -0.31 (synaptobrevin 2) TBL1X NM_005647 transducin (beta)-like 1X-linked 1.87 -0.30 LOC729314 XR_037423 similar to POM121-like protein 1 1.85 -0.63 RHD NM_016124 Rh blood group, D antigen 1.84 -0.28 HERC2 NM_004667 hect domain and RLD 2 1.81 -0.36 KIAA1967 NM_021174 KIAA1967 1.78 -0.32 YIPF2 NM_024029 Yip1 domain family, member 2 1.71 -0.48 MLL5 NM_182931 myeloid/lymphoid or mixed-lineage 1.71 -0.41 leukemia 5 (trithorax homolog, Drosophila) DUSP11 NM_003584 dual specificity phosphatase 11 1.70 -0.28 (RNA/RNP complex 1-interacting) ABL2 NM_001100108 v-abl Abelson murine leukemia viral 1.68 -0.30 oncogene homolog 2 (arg, Abelson- related gene) RBMX2 NM_016024 RNA binding motif protein, X-linked 2 1.65 -0.37 ALS2CR8 NM_024744 amyotrophic lateral sclerosis 2 1.65 -0.30 (juvenile) chromosome region, candidate 8 IDH1 NM_005896 isocitrate dehydrogenase 1 (NADP+), 1.65 -0.31 soluble NT5C3L NM_052935 5+40-nucleotidase, cytosolic III-like 1.63 -0.40 ERMP1 NM_024896 endoplasmic reticulum metallopeptidase 1 1.59 -0.86 GPSM1 NM_015597 G-protein signaling modulator 1 1.53 -0.47 (AGS3-like, C. elegans) ARHGEF10L NM_018125 Rho guanine nucleotide exchange factor 1.52 -0.32 (GEF) 10-like MFN2 NM_014874 mitofusin 2 1.52 -0.32 CG030 NR_026928 hypothetical CG030 1.49 -0.30 UBXN7 NM_015562 UBX domain protein 7 1.49 -0.35 CCDC45 NM_138363 coiled-coil domain containing 45 1.47 -0.39 ZNF701 NM_018260 zinc finger protein 701 1.46 -0.68 LOC642406 AK024257 similar to contactin associated protein- 1.46 -1.34 like 3B PHF8 NM_015107 PHD finger protein 8 1.44 -0.28 MED23 NM_015979 mediator complex subunit 23 1.42 -0.29 ARHGAP11B NM_001039841 Rho GTPase activating protein 11B 1.42 -0.29 MYST4 NM_012330 MYST histone acetyltransferase 1.41 -0.31 (monocytic leukemia) 4 SYT17 NM_016524 synaptotagmin XVII 1.40 -0.39 DPM2 NM_003863 dolichyl-phosphate mannosyltransferase 1.30 -0.35 polypeptide 2, regulatory subunit TUB NM_003320 tubby homolog (mouse) 1.30 -0.7.7 TBPL1 NM_004865 TBP-like 1 1.30 -0.28 FAM40B NM_020704 family with sequence similarity 40, 1.30 -0.62 member B DOLPP1 NM_020438 dolichyl pyrophosphate phosphatase 1 1.29 -0.34 HIST1H2BM NM_003521 histone cluster 1, H2bm 1.29 -0.35 ZBTB7A NM_015898 zinc linger and BTB domain containing 7A 1.28 -0.28 SLC30A7 NM_133496 solute carrier family 30 (zinc 1.25 -0.36 transporter), member 7 HCRTR1 NM_001525 hypocretin (orexin) receptor 1 1.22 -0.27 DNAJB6 NM_005494 DnaJ (Hsp40) homolog, subfamily B, 1.22 -0.56 member 6 QPRT NM_014298 quinolinate phosphoribosyltransferase 1.20 -0.32 CCDC75 NM_174931 coiled-coil domain containing 75 1.20 -0.29 NPTXR NM_014293 neuronal pentraxin receptor 1.19 -0.63 RHOB NM_004040 ras homolog gene family, member B 1.19 -0.48 CDH7 NM_004361 cadherin 7, type 2 1.17 -0.34 COL5A1 AK057231 collagen, type V, alpha 1 1.17 -0.50 SGMS2 NM_152621 sphingomyelin synthase 2 1.16 -0.32 LOC643802 XM_001716860 similar to M-phase phosphoprotein 10 1.15 -0.53 (U3 small nucleolar ribonucleoprotein) BCL11A NM_018014 B-cell CLL/lymphoma 11 A (zinc finger 1.14 -0.28 protein) GEN1 NM_182625 Gen homolog 1, endonuclease 1.14 -0.28 (Drosophila) ZP1 NM_207341 zona pellucida glycoprotein 1 (sperm 1.12 -0.30 receptor) EFTUD1 NM_024580 elongation factor Tu GTP binding 1.12 -0.47 domain containing 1 REEP6 NM_138393 receptor accessory protein 6 1.10 -0.58 UBA2 NM_005499 ubiquitin-like modifier activating 1.08 -0.38 enzyme 2 BRIP1 NM_032043 BRCA1 interacting protein C-terminal 1.06 -0.27 helicase 1 KPTN NM_007059 kaptin (actin binding protein) 1.06 -0.57 DZIP1 NM_014934 DAZ interacting protein 1 1.04 -0.35 MGC16275 NR_026914 hypothetical protein MGC16275 1.04 -0.29 APTX NM_017692 aprataxin 1.03 -0.29 P2RX4 NM_002560 purinergic receptor P2X, ligand-gated 1.02 -0.79 ion channel, 4 PCDH24 NM_017675 protocadherin 24 1.00 -0.37
[0193] Overall, ten putative candidates for miR-133a target genes were selected with these data combined. Next, the expression of these molecules was reduced using siRNA-induced gene knockdown system to investigate whether these candidates are functionally important targets of miR-133a in osteosarcoma cells. As a result, knockdown of four candidates (ANXA2, DUSP11, MAST4, and ROD1) in CD133.sup.low SaOS2 cells enhanced drug resistance (FIG. 37), and knockdown of five candidates (ANXA2, DUSP 11, SGMS2, SNX30, and UBA2) enhanced invasiveness of CD133.sup.low SaOS2 cells (FIG. 38).
[0194] Of course, the effect of knockdown of these putative target genes would be similar to the effect exerted by miR-133a on these same genes, resulting in enhanced drug resistance and enhanced invasiveness of CD133.sup.low SaOS2 cells. Conversely, silencing of miR-133a in CD133.sup.low SaOS2 cells would be expected to be permissive for expression of the putative target genes, thereby reducing drug resistance and reducing invasiveness of CD133.sup.low SaOS2 cells.
[0195] To validate whether these molecules are regulated by miR-133a, the 3'UTR (untranslated region) fragment containing putative miR-133a binding sites was cloned downstream of a luciferase coding sequence, and the luciferase reporter and miR-133a oligonucleotides were co-transfected into SaOS2 cells. As a control, the luciferase reporter and NC oligonucleotides were co-transfected into SaOS2 cells. Luciferase activities were reduced by approximately 39-73% in the cells co-transfected with miR-133a compared with the cells co-transfected with the NC oligonucleotides (FIG. 39). From results of this assay, ANXA2, DUSP 11, MAST4, SGMS2, SNX30, and UBA2 were found to function as direct targets of miR-133a.
[0196] Indeed, these target genes or their family genes were previously suggested to function as tumor suppressors in certain other cancers. Gostissa, M et al. (1999) EMBO J. 18:6462-71; Caprara, G et al. (2009) J. Cell. Mol. Med. 13:2158-70; Nguyen, L N et al. (2006) Clin. Cancer Res. 12:6952-9. ANXA2 has been reported to be associated with tumor-suppressive function in osteosarcoma (Gillette, J M (2004) J. Cell Biochem. 92:820-32), whereas MAST4 has been unknown in tumor biology (Garland, P (2008) Brain Res. 21:12-19).
[0197] Indeed, as disclosed by the present invention, the expression of all these targets was increased by silencing of miR-133a in CD133.sup.high cells (FIG. 40) and decreased by miR-133a upregulation in CD133.sup.low cells (FIG. 41), consistent with observed inverse correlations with the expression of CD133 and miR-133a in both xenografted tumors (FIG. 42) and clinical samples (results not shown). The increased expression of the targets by silencing of miR-133a was confirmed by qRT-PCR (results not shown) and immunohistochemistry of LNA-treated tumors (results not shown). Finally, in investigating the relationships between the expression of these targets and osteosarcoma patient prognosis, a strikingly close correlation was found between the mRNA expression of the miR-133a targets and patient prognosis (FIG. 43). Patients with higher expression levels of these targets survived much longer than patients with lower expression, indicating that these targets could function as novel tumor-suppressors in osteosarcoma.
Sequence CWU 1
1
105122RNAArtificial sequenceSynthetic oligonucleotide 1uggaauguaa
agaaguaugu au 22223RNAArtificial sequenceSynthetic oligonucleotide
2uacccuguag aaccgaauuu gug 23322RNAArtificial sequenceSynthetic
oligonucleotide 3uuuggucccc uucaaccagc ug 22420DNAArtificial
sequenceSynthetic oligonucleotide 4acatacttct ttacattcca
20521DNAArtificial sequenceSynthetic oligonucleotide 5acaaattcgg
ttctacaggg t 21621DNAArtificial sequenceSynthetic oligonucleotide
6cagctggttg aaggggacca a 21722RNAArtificial sequenceSynthetic
oligonucleotide 7auacauacuu cuuuacauuc ca 22823RNAArtificial
sequenceSynthetic oligonucleotide 8cacaaauucg guucuacagg gua
23922RNAArtificial sequenceSynthetic oligonucleotide 9cagcugguug
aaggggacca aa 221022DNAArtificial sequenceSynthetic oligonucleotide
10atacatactt ctttacattc ca 221123DNAArtificial sequenceSynthetic
oligonucleotide 11cacaaattcg gttctacagg gta 231222DNAArtificial
sequenceSynthetic oligonucleotide 12cagctggttg aaggggacca aa
221318DNAArtificial sequenceSynthetic oligonucleotide 13ggacccattg
gcattctc 181422DNAArtificial sequenceSynthetic oligonucleotide
14caggacacag catagaataa tc 221520DNAArtificial sequenceSynthetic
oligonucleotide 15agtgagaggc aacctggaga 201620DNAArtificial
sequenceSynthetic oligonucleotide 16acactcggac cacatccttc
201720DNAArtificial sequenceSynthetic oligonucleotide 17cagtctggac
actggctgaa 201820DNAArtificial sequenceSynthetic oligonucleotide
18ctcgctgatt aggctccaac 201920DNAArtificial sequenceSynthetic
oligonucleotide 19tggtacggta ggagctttgc 202020DNAArtificial
sequenceSynthetic oligonucleotide 20tttttcgtcg cttggagact
202120DNAArtificial sequenceSynthetic oligonucleotide 21catgctccca
ggctgtttat 202220DNAArtificial sequenceSynthetic oligonucleotide
22gtaacttggc agtttcagtg 202321DNAArtificial sequenceSynthetic
oligonucleotide 23tgcaacatgt actggcgaag a 212418DNAArtificial
sequenceSynthetic oligonucleotide 24tcttccacaa gccccagg
182519DNAArtificial sequenceSynthetic oligonucleotide 25acagaggctg
gtggcaacc 192625DNAArtificial sequenceSynthetic oligonucleotide
26accattacct tgtcactgtc catga 252733DNAArtificial sequenceSynthetic
oligonucleotide 27cgggacaagt acaaggcact gcggcagatc cgg
332830DNAArtificial sequenceSynthetic oligonucleotide 28ccggatctgc
cgcagtgcct tgtacttccg 302924DNAArtificial sequenceSynthetic
oligonucleotide 29tgacgatctg gacaacctca agca 243024DNAArtificial
sequenceSynthetic oligonucleotide 30atccaatggt gtagtcgctg gtga
243120DNAArtificial sequenceSynthetic oligonucleotide 31gatacgttct
tacagaaggc 203220DNAArtificial sequenceSynthetic oligonucleotide
32acccatctgg caaaataaac 203320DNAArtificial sequenceSynthetic
oligonucleotide 33ggaggggatc agtatataca 203420DNAArtificial
sequenceSynthetic oligonucleotide 34gaagatgatg gagtagatgg
203520DNAArtificial sequenceSynthetic oligonucleotide 35caattccttg
ctgcttctcc 203620DNAArtificial sequenceSynthetic oligonucleotide
36gcctttgttt tgctcctcag 203720DNAArtificial sequenceSynthetic
oligonucleotide 37aaaaagggtg tgaccgagtg 203820DNAArtificial
sequenceSynthetic oligonucleotide 38gcatcttctt ccccaaacaa
203920DNAArtificial sequenceSynthetic oligonucleotide 39cctgaacgcc
tacaagaagc 204020DNAArtificial sequenceSynthetic oligonucleotide
40atggttccca gtttgagtgc 204120DNAArtificial sequenceSynthetic
oligonucleotide 41gagaggagtg aggcaacagg 204220DNAArtificial
sequenceSynthetic oligonucleotide 42accccagaca caggtttgag
204320DNAArtificial sequenceSynthetic oligonucleotide 43gagacgcgac
ttttcaggac 204420DNAArtificial sequenceSynthetic oligonucleotide
44gatccaaagg ggaaaagcat 204520DNAArtificial sequenceSynthetic
oligonucleotide 45gttctggcga aaaatccaaa 204619DNAArtificial
sequenceSynthetic oligonucleotide 46tcgaacaatt gcagcatca
194720DNAArtificial sequenceSynthetic oligonucleotide 47cattcctggg
gctagtggta 204820DNAArtificial sequenceSynthetic oligonucleotide
48ccatctgaac caaggcattt 204919DNAArtificial sequenceSynthetic
oligonucleotide 49atcccgtgga gtgaaggtc 195020DNAArtificial
sequenceSynthetic oligonucleotide 50tctccagcat cacgtctctg
205120DNAArtificial sequenceSynthetic oligonucleotide 51agcccatttt
tcatttgcac 205220DNAArtificial sequenceSynthetic oligonucleotide
52tcgtctggtg ttggttggta 205319DNAArtificial sequenceSynthetic
oligonucleotide 53cctgagcgtc cagaaatgg 195423DNAArtificial
sequenceSynthetic oligonucleotide 54ggactgttat tcgcaagctg gtt
235520DNAArtificial sequenceSynthetic oligonucleotide 55catgaagtgt
gacgtggaca 205620DNAArtificial sequenceSynthetic oligonucleotide
56cacggagtac ttgcgctcag 205719DNAArtificial sequenceSynthetic
oligonucleotide 57gacttcaaca gcgacaccc 195821DNAArtificial
sequenceSynthetic oligonucleotide 58gccaaattcg ttgtcatacc a
215920RNAArtificial sequenceSynthetic oligonucleotide 59uacauacuuc
uuauguaccc 206022RNAArtificial sequenceSynthetic oligonucleotide
60acagauucga uucuagggga au 226122RNAArtificial sequenceSynthetic
oligonucleotide 61agcugguaaa auggaaccaa au 226221DNAArtificial
sequenceSynthetic oligonucleotidemisc_feature(1)..(19)RNA
62ccacuagagu gguggaaaat t 216321DNAArtificial sequenceSynthetic
oligonucleotidemisc_feature(1)..(19)RNA 63uuuuccacca cucuaguggt t
216421DNAArtificial sequenceSynthetic
oligonucleotidemisc_feature(1)..(19)RNA 64ggacugggcu gaaguacaat t
216521DNAArtificial sequenceSynthetic
oligonucleotidemisc_feature(1)..(19)RNA 65uuguacuuca gcccagucct t
216621DNAArtificial sequenceSynthetic
oligonucleotidemisc_feature(1)..(19)RNA 66ccgagaaguu ugugguaaat t
216721DNAArtificial sequenceSynthetic
oligonucleotidemisc_feature(1)..(19)RNA 67uuuaccacaa acuucucggt t
216821DNAArtificial sequenceSynthetic
oligonucleotidemisc_feature(1)..(19)RNA 68cuuccuaauc cgagacacat t
216921DNAArtificial sequenceSynthetic
oligonucleotidemisc_feature(1)..(19)RNA 69ugugucucgg auuaggaagt t
217021DNAArtificial sequenceSynthetic
oligonucleotidemisc_feature(1)..(19)RNA 70ccagaggauu ugccagaaat t
217121DNAArtificial sequenceSynthetic
oligonucleotidemisc_feature(1)..(19)RNA 71ugugucucgg auuaggaagt t
217221DNAArtificial sequenceSynthetic
oligonucleotidemisc_feature(1)..(19)RNA 72ggugaacacu uaacagcaat t
217321DNAArtificial sequenceSynthetic
oligonucleotidemisc_feature(1)..(19)RNA 73uugcuguuaa guguucacct t
217421DNAArtificial sequenceSynthetic
oligonucleotidemisc_feature(1)..(19)RNA 74gggaaugaca gcaagaaaut t
217521DNAArtificial sequenceSynthetic
oligonucleotidemisc_feature(1)..(19)RNA 75auuucuugcu gucauuccct t
217621DNAArtificial sequenceSynthetic
oligonucleotidemisc_feature(1)..(19)RNA 76ccauaaugaa ggaggucuut t
217721DNAArtificial sequenceSynthetic
oligonucleotidemisc_feature(1)..(19)RNA 77aagaccuccu ucauuauggt t
217821DNAArtificial sequenceSynthetic
oligonucleotidemisc_feature(1)..(19)RNA 78ugaccaagau gcucgggaut t
217921DNAArtificial sequenceSynthetic
oligonucleotidemisc_feature(1)..(19)RNA 79aucccgagca ucuuggucat t
218021DNAArtificial sequenceSynthetic
oligonucleotidemisc_feature(1)..(19)RNA 80ggagguaccu ucuuccaaat t
218121DNAArtificial sequenceSynthetic
oligonucleotidemisc_feature(1)..(19)RNA 81uaucaaacuu ccucuucugt t
218230DNAArtificial sequenceSynthetic oligonucleotide 82gctcgagtaa
agcaaaacaa aggcatcagc 308330DNAArtificial sequenceSynthetic
oligonucleotide 83gcggccgcaa ggcttgtcac caatgaatga
308429DNAArtificial sequenceSynthetic oligonucleotide 84aaatgtcaac
cattttgtgt aaacgatta 298528DNAArtificial sequenceSynthetic
oligonucleotide 85aaatggttga catttcttca tttaccag
288630DNAArtificial sequenceSynthetic oligonucleotide 86gctcgagtaa
taccgcctgg tatgtctgtg 308731DNAArtificial sequenceSynthetic
oligonucleotide 87gcggccgcaa tgcagatgcc atttatttgg t
318829DNAArtificial sequenceSynthetic oligonucleotide 88ttatgtcaac
cataaatggc atctgcatt 298928DNAArtificial sequenceSynthetic
oligonucleotide 89ttatggttga cataagtata gtcgttat
289030DNAArtificial sequenceSynthetic oligonucleotide 90gctcgagtaa
ccctgttgga caggattgat 309135DNAArtificial sequenceSynthetic
oligonucleotide 91gcggccgcaa tttttaaaga aagcatcttt tatgg
359229DNAArtificial sequenceSynthetic oligonucleotide 92tcttatcaac
ccacttcagt cagaaatgt 299328DNAArtificial sequenceSynthetic
oligonucleotide 93agtgggttga taagactgcg aacaatca
289432DNAArtificial sequenceSynthetic oligonucleotide 94gctcgagtaa
aaacctgtcc tggaattcta cc 329530DNAArtificial sequenceSynthetic
oligonucleotide 95gcggccgcaa gatggccttt gggtcaataa
309629DNAArtificial sequenceSynthetic oligonucleotide 96ctggatcaac
gagctggcct gaaaattac 299728DNAArtificial sequenceSynthetic
oligonucleotide 97gctcgttgat ccaggtagaa ttccagga
289830DNAArtificial sequenceSynthetic oligonucleotide 98gctcgagtaa
ctcccccagc taggaaacag 309928DNAArtificial sequenceSynthetic
oligonucleotide 99gcggccgcaa agagatgggg cggtcagt
2810029DNAArtificial sequenceSynthetic oligonucleotide
100gacgttcaac cgccatcccc agccccaaa 2910128DNAArtificial
sequenceSynthetic oligonucleotide 101tggcggttga acgtctctgc ccacgttc
2810229DNAArtificial sequenceSynthetic oligonucleotide
102gctcgagtaa gcgggatgct ttgaacatt 2910330DNAArtificial
sequenceSynthetic oligonucleotide 103gcggccgcaa ctccagcgtc
atagagatcc 3010429DNAArtificial sequenceSynthetic oligonucleotide
104atcaatcaac caggtgtgga tgaggtcac 2910528DNAArtificial
sequenceSynthetic oligonucleotide 105acctggttga ttgatggctg tttcaatg
28
References
D00000
D00001
D00002
D00003
D00004
D00005
D00006
D00007
D00008
D00009
D00010
D00011
D00012

D00013

D00014

D00015

D00016

D00017

D00018

D00019
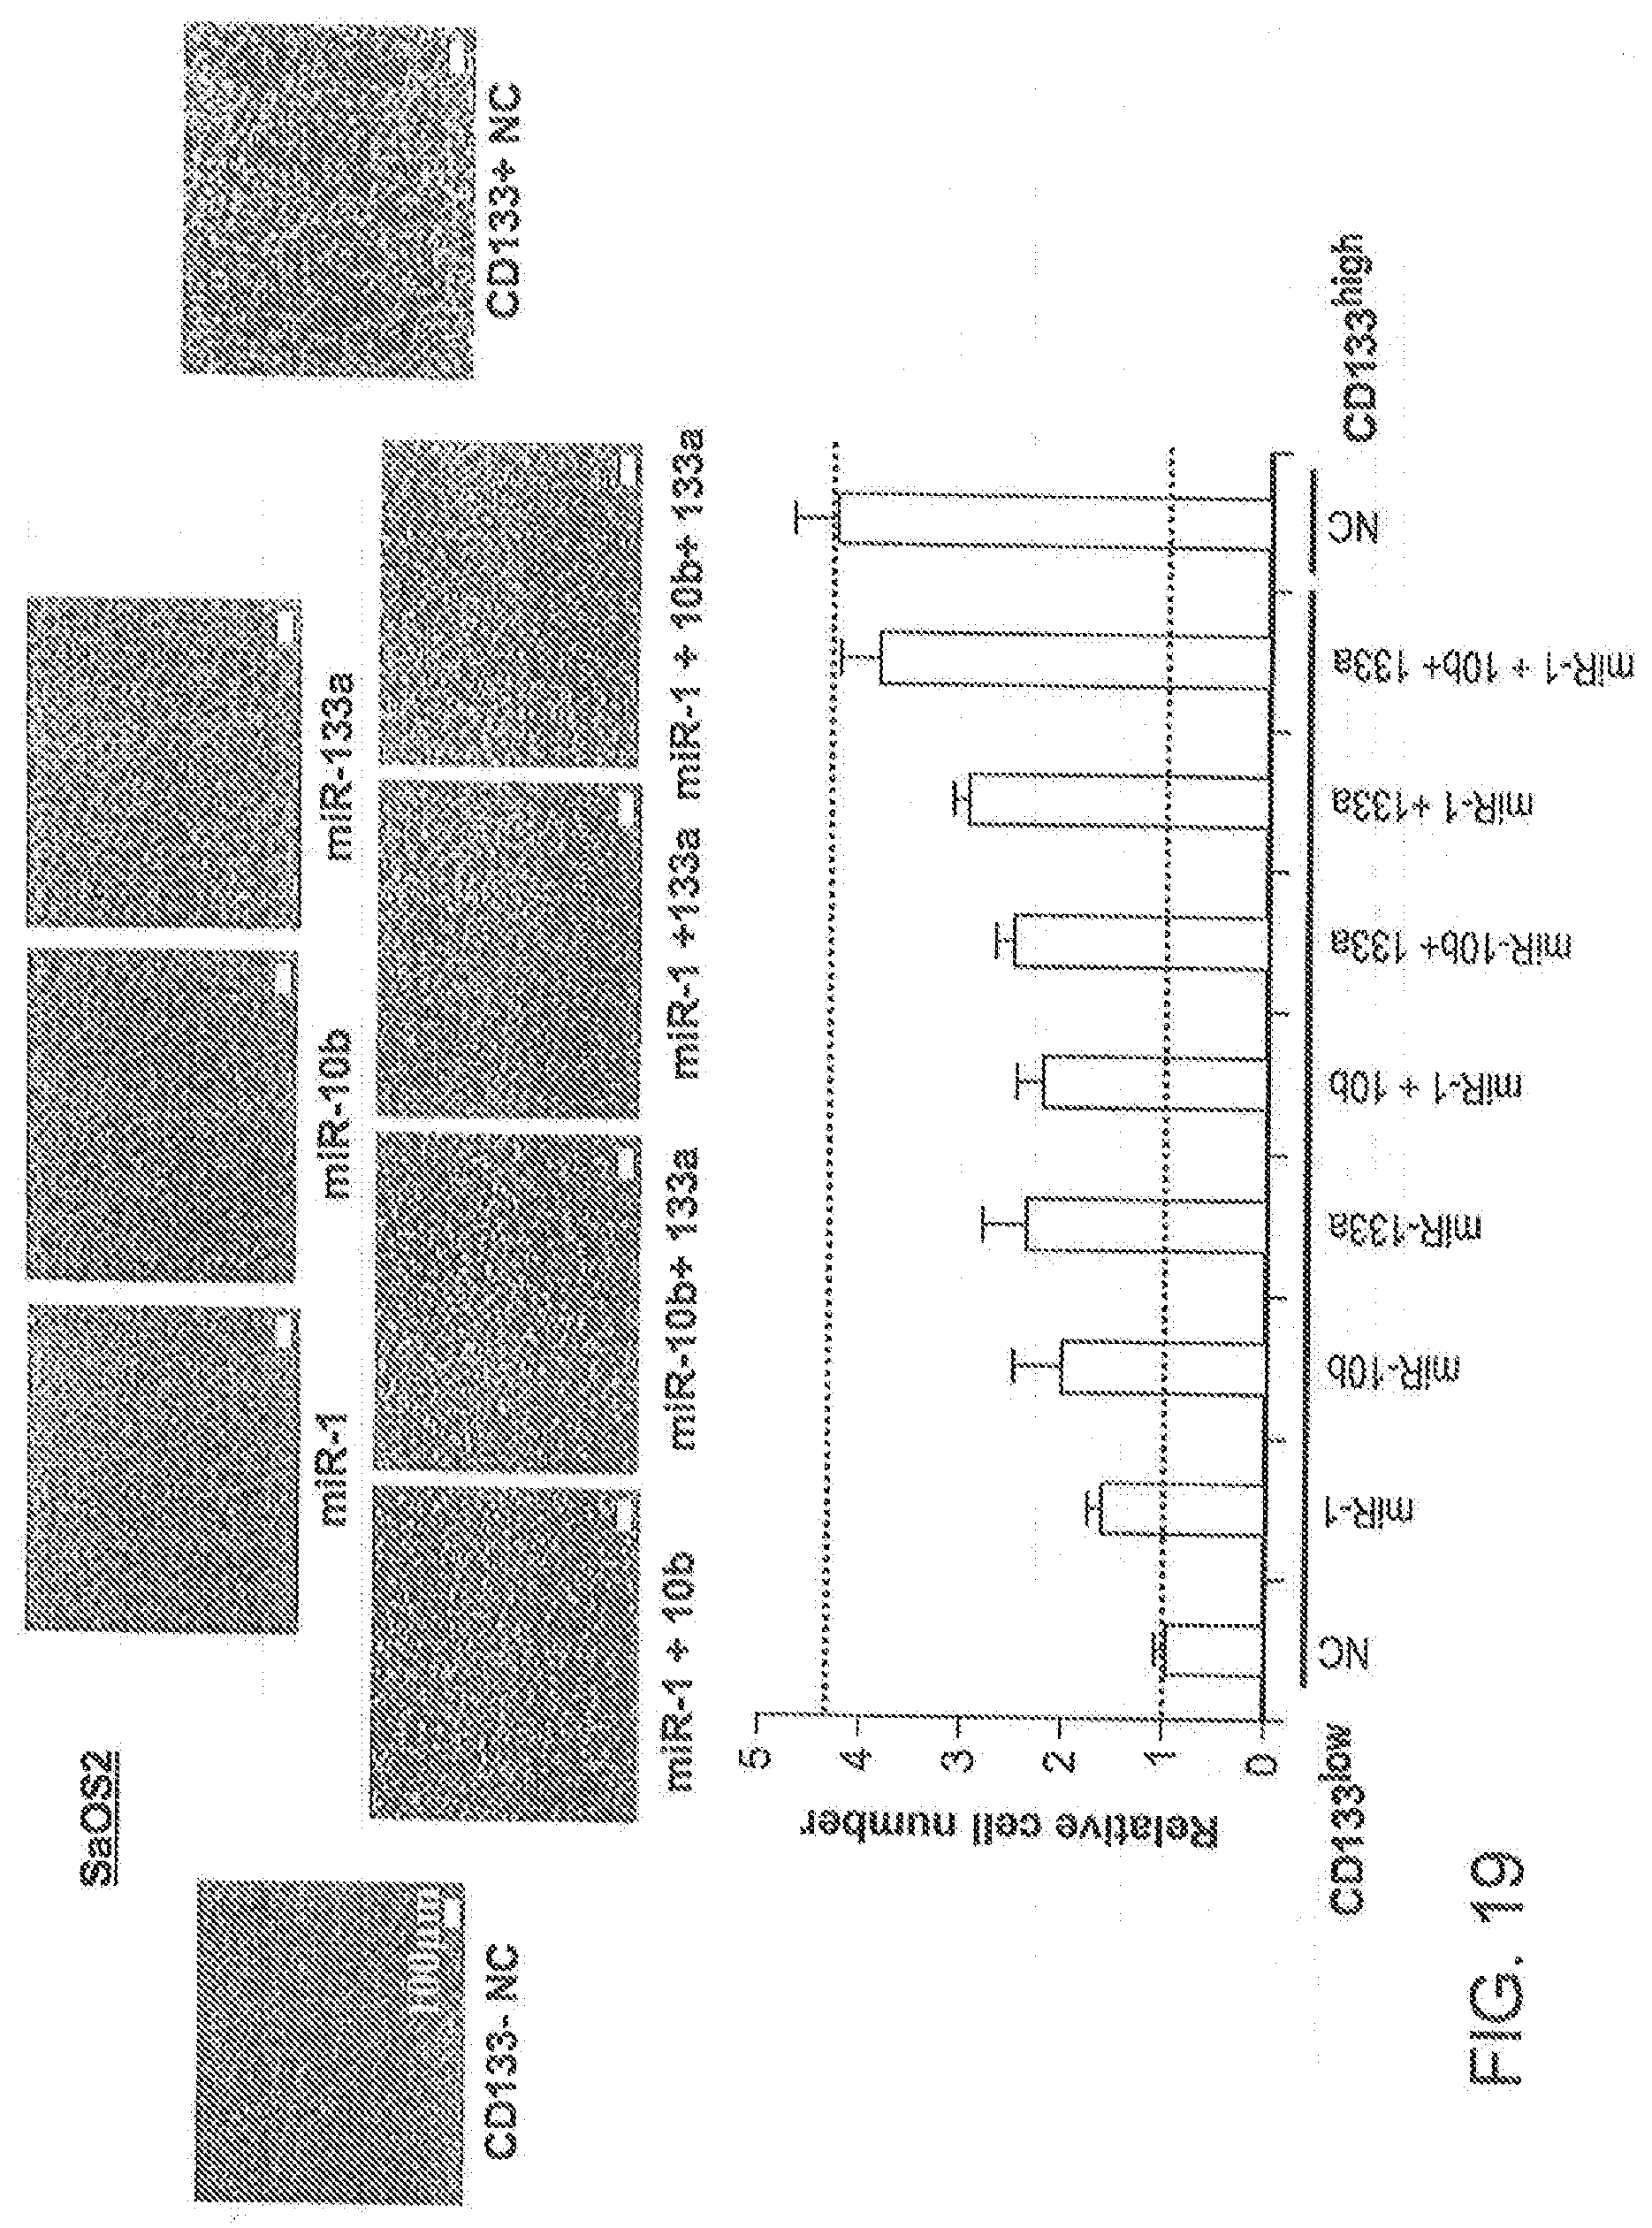
D00020

D00021
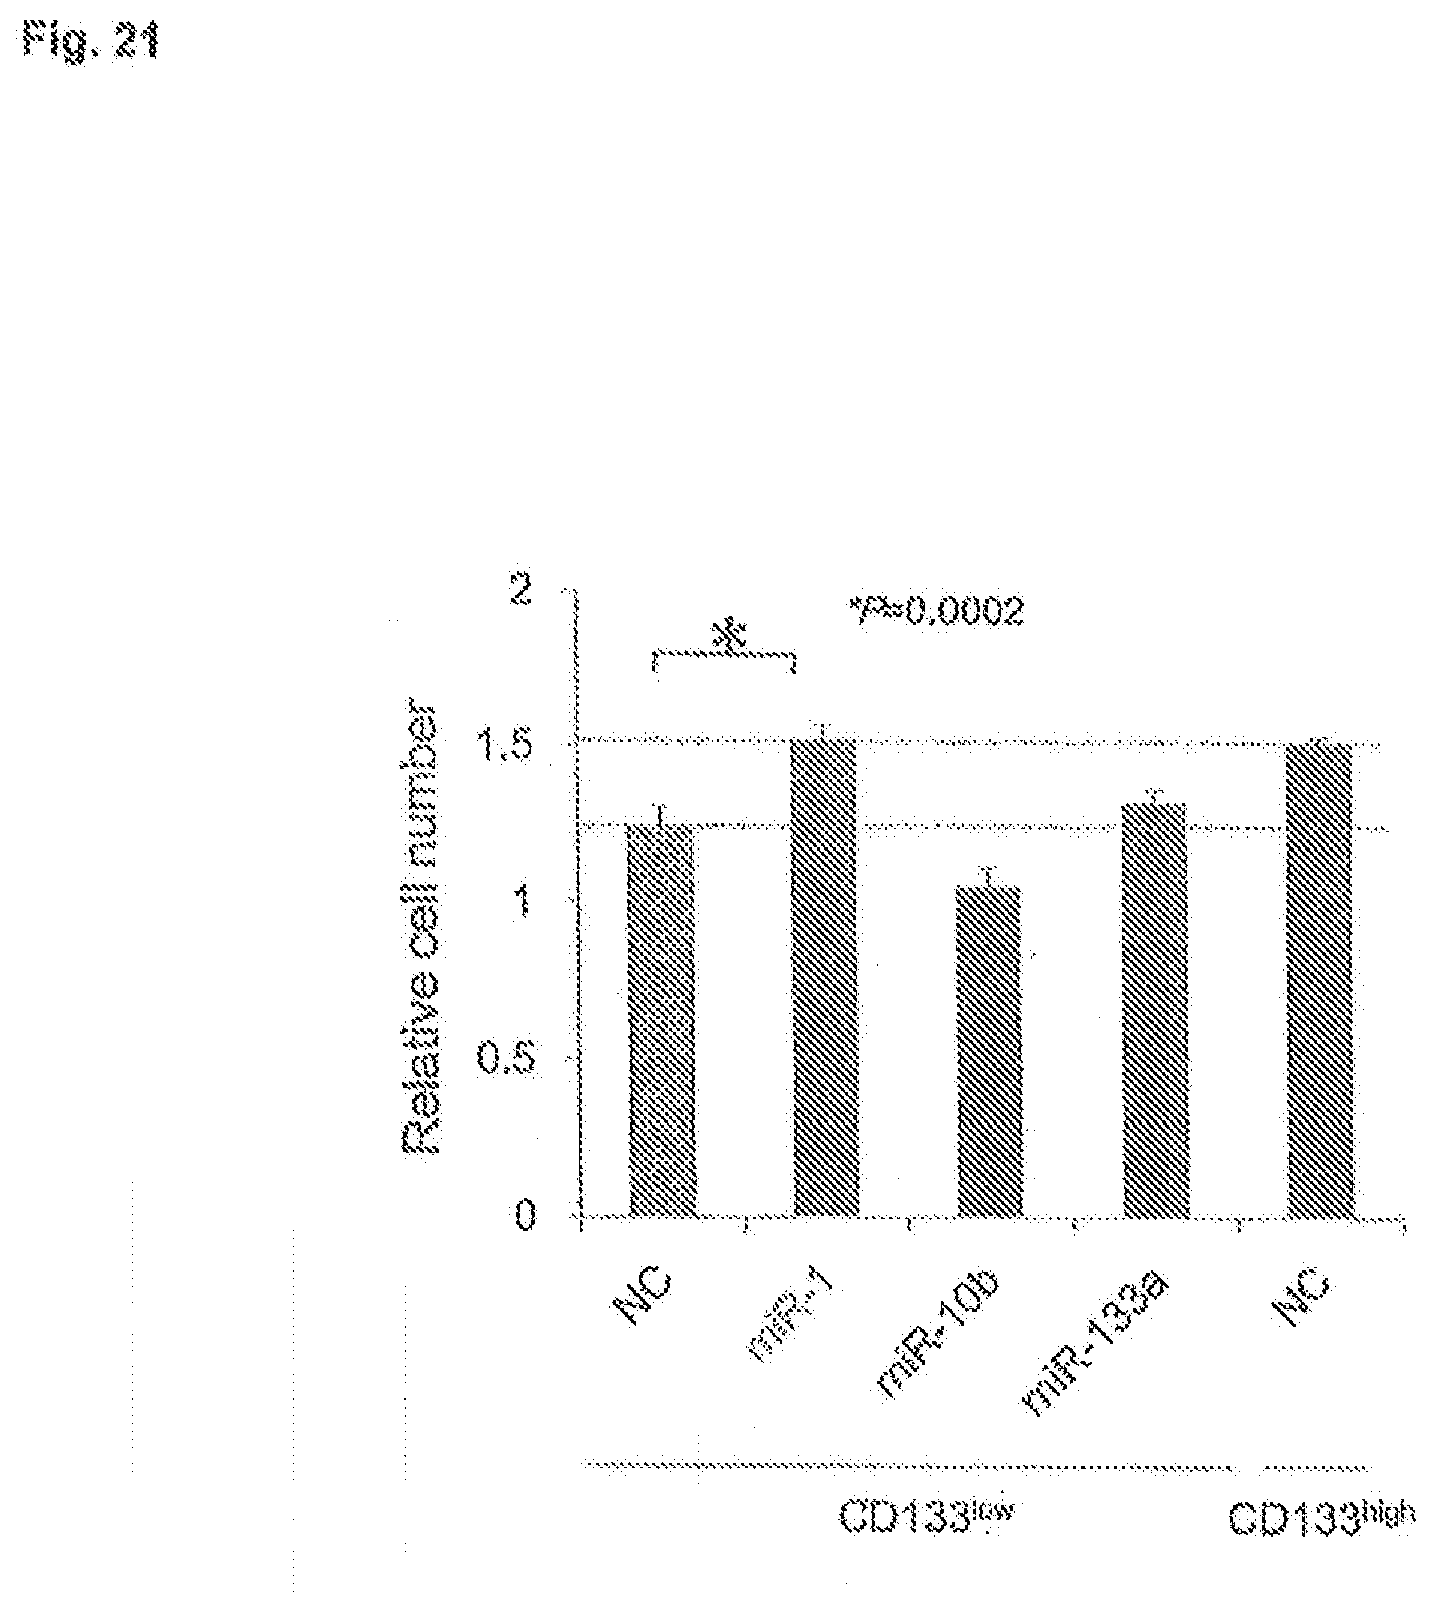
D00022

D00023

D00024

D00025

D00026

D00027
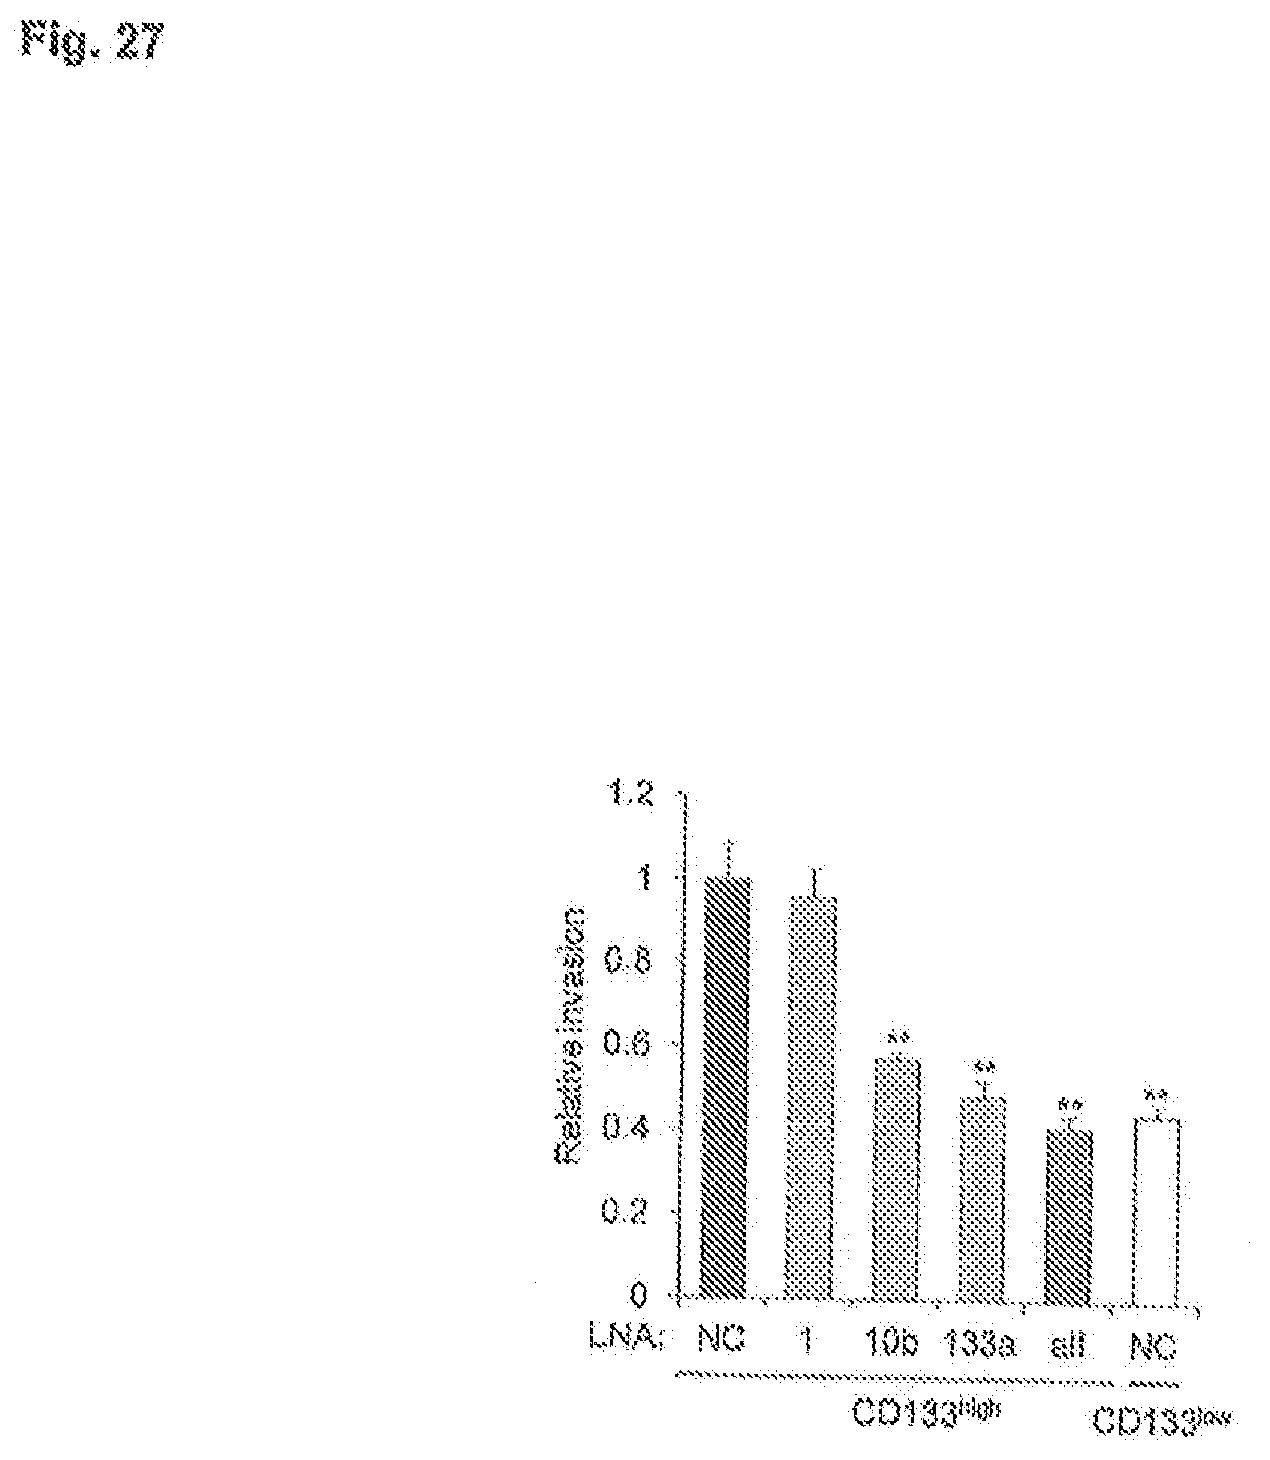
D00028

D00029

D00030

D00031

D00032

D00033

D00034

D00035

D00036

D00037

D00038

D00039

D00040
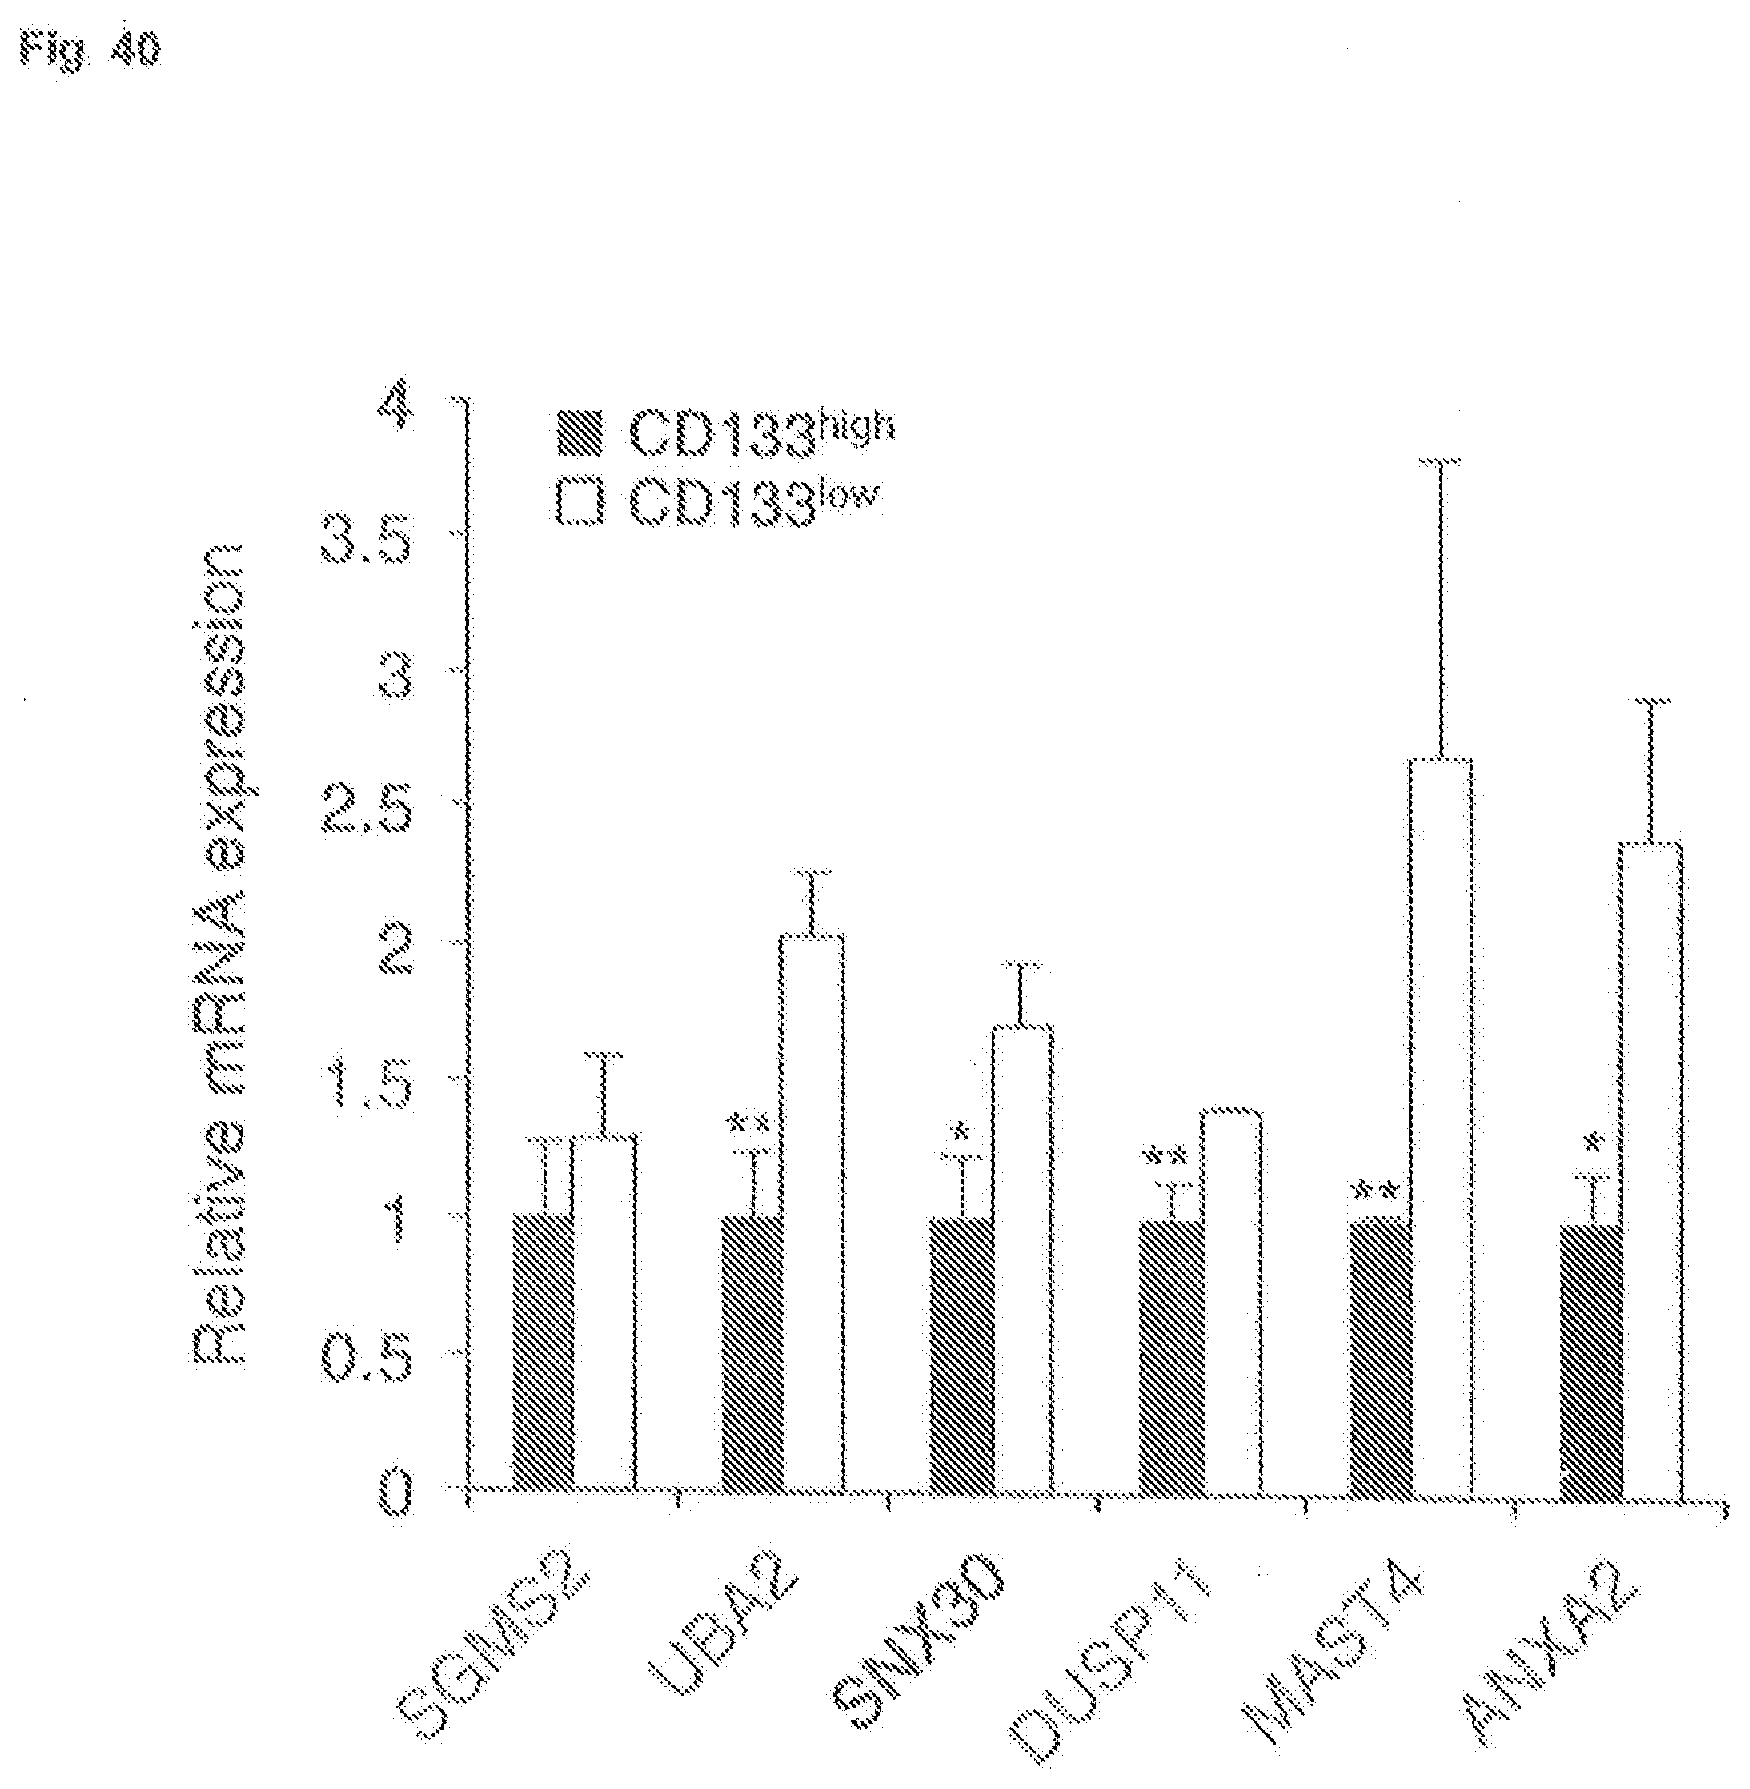
D00041

D00042

D00043

S00001
XML
uspto.report is an independent third-party trademark research tool that is not affiliated, endorsed, or sponsored by the United States Patent and Trademark Office (USPTO) or any other governmental organization. The information provided by uspto.report is based on publicly available data at the time of writing and is intended for informational purposes only.
While we strive to provide accurate and up-to-date information, we do not guarantee the accuracy, completeness, reliability, or suitability of the information displayed on this site. The use of this site is at your own risk. Any reliance you place on such information is therefore strictly at your own risk.
All official trademark data, including owner information, should be verified by visiting the official USPTO website at www.uspto.gov. This site is not intended to replace professional legal advice and should not be used as a substitute for consulting with a legal professional who is knowledgeable about trademark law.