Systems And Methods For Characterizing Surfactant Protein D (sp-d) Oligomers
Rosenbaum; Jan Susan ; et al.
U.S. patent application number 17/041682 was filed with the patent office on 2021-01-14 for systems and methods for characterizing surfactant protein d (sp-d) oligomers. The applicant listed for this patent is Airway Therapeutics, Inc.. Invention is credited to Mark Cornell Manning, Ryan R. Manning, Jan Susan Rosenbaum.
| Application Number | 20210010988 17/041682 |
| Document ID | / |
| Family ID | 1000005151943 |
| Filed Date | 2021-01-14 |


| United States Patent Application | 20210010988 |
| Kind Code | A1 |
| Rosenbaum; Jan Susan ; et al. | January 14, 2021 |
SYSTEMS AND METHODS FOR CHARACTERIZING SURFACTANT PROTEIN D (SP-D) OLIGOMERS
Abstract
Some embodiments of the methods and compositions provided herein include identifying and/or quantifying oligomeric species of surfactant protein-D (SP-D). Some embodiments include performing an asymmetric flow field-flow fractionation with multi-angle laser light scattering (AF4-MALLS) analysis on the SP-D.
| Inventors: | Rosenbaum; Jan Susan; (Cincinnati, OH) ; Manning; Mark Cornell; (Johnstown, CO) ; Manning; Ryan R.; (Charlotte, MI) | ||||||||||
| Applicant: |
|
||||||||||
|---|---|---|---|---|---|---|---|---|---|---|---|
| Family ID: | 1000005151943 | ||||||||||
| Appl. No.: | 17/041682 | ||||||||||
| Filed: | March 27, 2019 | ||||||||||
| PCT Filed: | March 27, 2019 | ||||||||||
| PCT NO: | PCT/US2019/024320 | ||||||||||
| 371 Date: | September 25, 2020 |
Related U.S. Patent Documents
| Application Number | Filing Date | Patent Number | ||
|---|---|---|---|---|
| 62650138 | Mar 29, 2018 | |||
| Current U.S. Class: | 1/1 |
| Current CPC Class: | G01N 2500/10 20130101; G01N 33/15 20130101; G01N 33/94 20130101; G01N 33/5041 20130101; C12Q 1/025 20130101 |
| International Class: | G01N 33/15 20060101 G01N033/15; G01N 33/94 20060101 G01N033/94; G01N 33/50 20060101 G01N033/50; C12Q 1/02 20060101 C12Q001/02 |
Claims
1. A method to determine the activity of a pharmaceutical composition comprising surfactant protein-D (SP-D), the method comprising: measuring the relative proportion of oligomeric species of SP-D in the pharmaceutical composition; and calculating the relative proportion of SP-D dodecamers in the pharmaceutical composition, thereby determining the activity of the pharmaceutical composition.
2.-59. (canceled)
Description
CROSS-REFERENCE TO RELATED APPLICATIONS
[0001] This application claims priority to U.S. Prov. App. No. 62/650,138 filed Mar. 29, 2018 entitled "METHODS FOR CHARACTERIZING SURFACTANT PROTEIN D (SP-D) OLIGOMERS" which is incorporated by reference herein in its entirety.
REFERENCE TO SEQUENCE LISTING
[0002] The present application is being filed along with a Sequence Listing in electronic format. The Sequence Listing is provided as a file entitled AIRWY013WOSEQLIST, created Mar. 20, 2019, which is approximately 7 Kb in size. The information in the electronic format of the Sequence Listing is incorporated herein by reference in its entirety.
FIELD OF THE INVENTION
[0003] Some embodiments of the methods and compositions provided herein include identifying and/or quantifying oligomeric species of surfactant protein-D (SP-D). Some embodiments include performing an asymmetric flow field-flow fractionation with multi-angle laser light scattering (AF4-MALLS) analysis on the SP-D.
BACKGROUND OF THE INVENTION
[0004] Mammalian pulmonary surfactant is a mixture of proteins (10%) and lipids (90%) including the major lipid component dipalmitoylphosphatidylcholine (Zuo Y Y, et al., Biochim Biophys Acta (2008) 1778:1947-77). The main function of the pulmonary surfactant is to ensure minimal surface tension within the lung to avoid collapse during respiration. Furthermore, by interacting with inhaled pathogens, the pulmonary surfactant also participates in host defense (Clements J A. Am Rev Respir Dis (1977) 115:67-71). Pulmonary surfactant deficiency is, therefore, associated with pulmonary diseases such as asthma, bronchiolitis, respiratory distress syndrome (RDS), cystic fibrosis, and pneumonia (Griese M. Eur Respir J (1999) 13:1455-76). Surfactant formulations are indicated for the treatment of RDS, which affects .about.1.5 million premature babies globally every year. Respiratory distress syndrome is a major pulmonary surfactant deficiency disease caused by the structural immaturity of the lungs in premature infants, which makes it difficult to breathe, inhibits gas exchange, and promotes alveolar collapse (Notter R H. 2000 Lung Surfactants. Basic Science and Clinical Applications. New York, N.Y.: Marcel Dekker Inc.). However, treatment becomes more difficult if the lungs are infected or if there are inflammatory or oxidative complications, because current surfactant preparations lack surfactant protein D (SP-D). The successful treatment of complex pulmonary diseases, therefore, requires the production of surfactant formulations whose composition matches natural pulmonary surfactant as closely as possible (Robertson B, et al., Biochim Biophys Acta (1998) 1408:346-61).
[0005] SP-D has a role in the pulmonary innate immune system by providing anti-inflammatory and antimicrobial activities that address chronic pulmonary diseases such as asthma, cystic fibrosis, and smoking-induced emphysema (Clark H, et al., Immunobiology (2002) 205:619-31). Data based on premature newborn lambs suggest that the administration of .about.2-3 mg/kg of recombinant human SP-D in combination with 100 mg/kg Survanta.RTM. (a natural surfactant available in USA) is more effective than Survanta.RTM. alone for the prevention of endotoxin shock and the reduction of lung inflammation caused by ventilation (Ikegami M, et al., Am J Respir Crit Care Med (2006) 173:1342-7; Sato A, et al., Am J Respir Crit Care Med (2010) 181:1098-105).
[0006] Traditionally, SP-D has been isolated from the supernatant of bronchoalveolar lavage or amniotic fluid, but most SP-D is lost during purification, in part due to the hydrophilic properties of SP-D (Dodagatta-Marri E, et al., Methods Mol Biol (2014) 100:273-90). The use of recombinant human surfactant protein D (rhSP-D) to supplement pulmonary surfactant formulations can ensure therapeutic efficacy because current pulmonary surfactant formulations lack the ability to effectively modulate the host immune response in the absence of the hydrophilic surfactant proteins. A characteristic of native SP-D that must be maintained in any pharmaceutical composition is the appropriate oligomerization state because the higher-order multimerization in the endogenous surfactant protein increases the number of SP-D-binding sites to carbohydrate ligands on the surface of pathogens, achieving potent bacterial and viral agglutination effects (White M, et al., J Immunol (2008) 181:7936-43). The appropriate oligomerization state is also required for receptor recognition and receptor-mediated signal transduction for modulation of the host immune response (Yamoze M et al., J Biol Chem (2008) 283:35878-35888) as well as for maintenance of surfactant homeostasis (Zhang L et al., J Biol Chem (2001) 276:19214-19219). The low SP-D yields and variable oligomerization states make it difficult to use natural sources for the production of pharmaceutical SP-D (Strong P, et al., J Immunol Methods (1998) 220:139-49). To overcome some of these limitations, recombinant SP-D can be produced in microbes or mammalian cell lines, potentially offering a large-scale platform for the production of homogeneous recombinant SP-D formulations. However, recombinant SP-D can have variable oligomerization states and/or inactive aggregate forms, therefore reducing the potential efficacy of such preparations. Therefore, there is a need for methods that can be used to discriminate active oligomeric forms from the inactive aggregate forms, and to quantitate the oligomeric forms to ensure reproducible quality from the manufacturing process.
SUMMARY OF THE INVENTION
[0007] Some embodiments of the methods and compositions provided herein include methods to determine the activity of a pharmaceutical composition comprising surfactant protein-D (SP-D). Some such embodiments include a method comprising: measuring the relative proportion of oligomeric species of SP-D in the pharmaceutical composition; and calculating the relative proportion of SP-D dodecamers in the pharmaceutical composition, thereby determining the activity of the pharmaceutical composition. Some embodiments also include calculating the relative proportion of SP-D aggregate having an average radius greater than 70 nm or root mean square (RMS) radius greater than 70 nm in the pharmaceutical composition. In some embodiments, the measuring comprises performing an asymmetric flow field-flow fractionation with multi-angle laser light scattering (AF4-MALLS) analysis. In some embodiments, calculating comprises providing a model of the oligomeric species of SP-D comprising rod-like geometries and spherical-like geometries. In some embodiments, the model comprises a Zimm model and a second order Debye model of the oligomeric species of SP-D. Some embodiments also include measuring the relative proportion of at least one SP-D oligomeric species in the SP-D sample, wherein the SP-D oligomeric species is selected from the group consisting of a SP-D trimer, a SP-D hexamer, a SP-D dodecamer, a SP-D star-like oligomer having an average radius of 70 nm or RMS radius of 70 nm, and SP-D aggregate having an average radius greater than 70 nm or RMS radius greater than 70 nm.
[0008] Some embodiments of the methods and compositions provided herein include to determine the relative proportion of oligomeric species of surfactant protein-D (SP-D) in a sample, comprising: performing an asymmetric flow field-flow fractionation with multi-angle laser light scattering (AF4-MALLS) analysis on the SP-D sample; and determining the relative proportion of an oligomeric species of SP-D from the results of the AF4-MALLS analysis, wherein the SP-D oligomeric species is selected from the group consisting of a SP-D trimer, a SP-D hexamer, a SP-D dodecamer, a SP-D star-like oligomer having an average radius of 70 nm or RMS radius of 70 nm, and SP-D aggregate having an average radius greater than 70 nm or RMS radius greater than 70 nm. Some embodiments also include measuring the relative proportion of SP-D dodecamers in the sample. Some embodiments also include measuring the relative proportion of SP-D aggregate having an average radius greater than 70 nm or RMS radius greater than 70 nm in the sample.
[0009] Some embodiments of the methods and compositions provided herein include a method to determine the relative proportion of active oligomeric species of surfactant protein-D (SP-D) in a sample, comprising: performing an asymmetric flow field-flow fractionation with multi-angle laser light scattering (AF4-MALLS) analysis on the SP-D sample; measuring the relative proportion of SP-D dodecamers in the SP-D sample; measuring the relative proportion of at least one SP-D oligomeric species in the SP-D sample selected from the group consisting of a SP-D trimer, a SP-D hexamer, a SP-D star-like oligomer having an average radius of 70 nm or RMS radius of 70 nm; and SP-D aggregate having an average radius greater than 70 nm or RMS radius greater than 70 nm; and calculating a ratio between each of the measured relative proportions. In some embodiments, the at least one SP-D oligomeric species comprises an SP-D aggregate having an average radius greater than 70 nm or RMS radius greater than 70 nm. Some embodiments also include integrating a fractogram from the AF4-MALLS analysis into peaks. Some embodiments also include measuring a relative peak area (RPA) of the fractogram for at least one peak indicative of a SP-D oligomeric species selected from the group consisting of a SP-D trimer, a SP-D hexamer, a SP-D dodecamer, a SP-D star-like oligomer having an average radius of 70 nm or RMS radius of 70 nm, and SP-D aggregate having an average radius greater than 70 nm or RMS radius greater than 70 nm. In some embodiments, the SP-D star-like oligomer has a molar mass less than or equal to about 6 MDa. In some embodiments, the SP-D aggregate has a molar mass greater than 6 MDa.
[0010] Some embodiments also include measuring the relative proportion of SP-D star-like oligomeric species in the sample having an average radius of 70 nm or RMS radius of 70 nm in the sample. Some embodiments also include measuring the relative proportion of SP-D aggregates having an average radius greater than 70 nm or RMS radius greater than 70 nm in the sample.
[0011] In some embodiments, the SP-D sample is predicted to have activity in a lipopolysaccharide-Toll-like receptor 4 (LPS-TLR4) assay, or in a bacterial aggregation assay. In some embodiments, the SP-D sample having a relative proportion of SP-D dodecamers greater than or equal to 35% of the SP-D oligomeric species in the sample is indicative of the SP-D sample having activity. In some embodiments, the SP-D sample having a relative proportion of SP-D aggregates having an average radius greater than 70 nm or RMS radius greater than 70 nm less than 5% of the total SP-D oligomeric species in the sample is indicative of the SP-D sample having activity.
[0012] In some embodiments, the AF4-MALLS is performed in the absence of a chelating agent selected from the group consisting of EDTA and EGTA.
[0013] In some embodiments, the SP-D is a recombinant human SP-D (rhSP-D). In some embodiments, the rhSP-D is derived from a human myeloid leukemia cell line expressing the rhSP-D from a transgene. In some embodiments, the rhSP-D comprises the amino acid sequence of SEQ ID NO:02. In some embodiments, the rhSP-D comprises a residue at a polymorphic position corresponding to a residue selected from the group consisting of Met11, Thr160, Ser 270, and Ala 286.
[0014] In some embodiments, the relative proportion the oligomeric species is with respect to mass. In some embodiments, the relative proportion the oligomeric species of SP-D is with respect to number of molecules. In some embodiments, the relative proportion the oligomeric species is with respect to a relative peak area (RPA) or an adjusted RPA in an AF4-MALLS analysis. In some embodiments, the SP-D dodecamer has a molecular weight of about 520 kDa.
[0015] Some embodiments of the methods and compositions provided herein include electronic systems for determining the activity of a pharmaceutical composition comprising surfactant protein-D (SP-D). Some such embodiments can include a system comprising a processor having instructions configured to execute the following steps: measuring the relative proportion of oligomeric species of SP-D in the pharmaceutical composition; calculating the relative proportion of SP-D dodecamers in the pharmaceutical composition; and determining the activity of the pharmaceutical composition based on the relative proportion of SP-D dodecamers, wherein a higher relative proportion of SP-D dodecamers is indicative of the composition having a higher level of activity compared to the activity of a composition having a lower relative proportion of SP-D dodecamers. In some embodiments, the activity comprises activity in a toll-like receptor 4 (TLR4) assay, or in a bacterial aggregation assay. Some embodiments also include calculating the relative proportion of SP-D aggregate having an average radius greater than 70 nm or RMS radius greater than 70 nm in the pharmaceutical composition. In some embodiments, the measuring comprises performing an asymmetric flow field-flow fractionation with multi-angle laser light scattering (AF4-MALLS) analysis. In some embodiments, the calculating comprises providing a model of the oligomeric species of SP-D comprising rod-like geometries and spherical-like geometries. In some embodiments, the model comprises a Zimm model and a second order Debye model of the oligomeric species of SP-D. Some embodiments also include measuring the relative proportion of at least one SP-D oligomeric species in the SP-D sample, wherein the SP-D oligomeric species is selected from the group consisting of a SP-D trimer, a SP-D hexamer, a SP-D dodecamer, a SP-D star-like oligomer having an average radius of 70 nm or RMS radius of 70 nm, and SP-D aggregate having an average radius greater than 70 nm or RMS radius greater than 70 nm.
[0016] Some embodiments of the methods and compositions provided herein include electronic systems for determining the relative proportion of oligomeric species of surfactant protein-D (SP-D) in a sample. Some such embodiments can include a system comprising a processor having instructions configured to execute the following steps: performing an asymmetric flow field-flow fractionation with multi-angle laser light scattering (AF4-MALLS) analysis on the SP-D sample; and determining the relative proportion of an oligomeric species of SP-D from the results of the AF4-MALLS analysis, wherein the SP-D oligomeric species is selected from the group consisting of a SP-D trimer, a SP-D hexamer, a SP-D dodecamer, a SP-D star-like oligomer having an average radius of 70 nm or RMS radius of 70 nm, and SP-D aggregate having an average radius greater than 70 nm or RMS radius greater than 70 nm. Some embodiments also include measuring the relative proportion of SP-D dodecamers in the sample. Some embodiments also include measuring the relative proportion of SP-D aggregate having an average radius greater than 70 nm or RMS radius greater than 70 nm in the sample.
[0017] Some embodiments of the methods and compositions provided herein include electronic systems for determining the relative proportion of active oligomeric species of surfactant protein-D (SP-D) in a sample. Some such embodiments include a system comprising a processor having instructions configured to execute the following steps: performing an asymmetric flow field-flow fractionation with multi-angle laser light scattering (AF4-MALLS) analysis on the SP-D sample; measuring the relative proportion of SP-D dodecamers in the SP-D sample; measuring the relative proportion of at least one SP-D oligomeric species in the SP-D sample selected from the group consisting of a SP-D trimer, a SP-D hexamer, a SP-D star-like oligomer having an average radius of 70 nm or RMS radius of 70 nm; and SP-D aggregate having an average radius greater than 70 nm or RMS radius greater than 70 nm; and calculating a ratio between each of the measured relative proportions. In some embodiments, the at least one SP-D oligomeric species comprises SP-D aggregate having an average radius greater than 70 nm or RMS radius greater than 70 nm. Some embodiments also include integrating a fractogram from the AF4-MALLS analysis into peaks. Some embodiments also include measuring a relative peak area (RPA) of the fractogram for at least one peak indicative of a SP-D oligomeric species selected from the group consisting of a SP-D trimer, a SP-D hexamer, a SP-D dodecamer, a SP-D star-like oligomer having an average radius of 70 nm or RMS radius of 70 nm, and SP-D aggregate having an average radius greater than 70 nm or RMS radius greater than 70 nm. In some embodiments, the SP-D star-like oligomer has a molar mass less than or equal to about 6 MDa. In some embodiments, the SP-D aggregate has a molar mass greater than 6 MDa. Some embodiments also include measuring the relative proportion of SP-D star-like oligomeric species in the sample having an average radius of 70 nm or RMS radius of 70 nm in the sample. Some embodiments also include measuring the relative proportion of SP-D aggregates having an average radius greater than 70 nm or RMS radius greater than 70 nm in the sample.
[0018] In some embodiments, the SP-D sample is predicted to have activity in a lipopolysaccharide--Toll-like receptor 4 (LPS-TLR4) assay, or in a bacterial aggregation assay.
[0019] In some embodiments, the SP-D sample having a relative proportion of SP-D dodecamers greater than or equal to 35% of the SP-D oligomeric species in the sample is indicative of the SP-D sample having activity.
[0020] In some embodiments, the SP-D sample having a relative proportion of SP-D aggregates having an average radius greater than 70 nm or RMS radius greater than 70 nm less than 5% of the total SP-D oligomeric species in the sample is indicative of the SP-D sample having activity.
[0021] In some embodiments, the AF4-MALLS is performed in the absence of a chelating agent selected from the group consisting of EDTA and EGTA.
[0022] In some embodiments, the SP-D is a recombinant human SP-D (rhSP-D). In some embodiments, the rhSP-D is derived from a human myeloid leukemia cell line expressing the rhSP-D from a transgene. In some embodiments, the rhSP-D comprises the amino acid sequence of SEQ ID NO:02. In some embodiments, the rhSP-D comprises a residue at a polymorphic position corresponding to a residue selected from the group consisting of Met11, Thr160, Ser 270, and Ala 286.
[0023] In some embodiments, the relative proportion the oligomeric species is with respect to mass. In some embodiments, the relative proportion the oligomeric species is with respect to a relative peak area (RPA) or an adjusted RPA in an AF4-MALLS analysis. In some embodiments, the SP-D dodecamer has a molecular weight of about 520 kDa.
BRIEF DESCRIPTION OF THE DRAWINGS
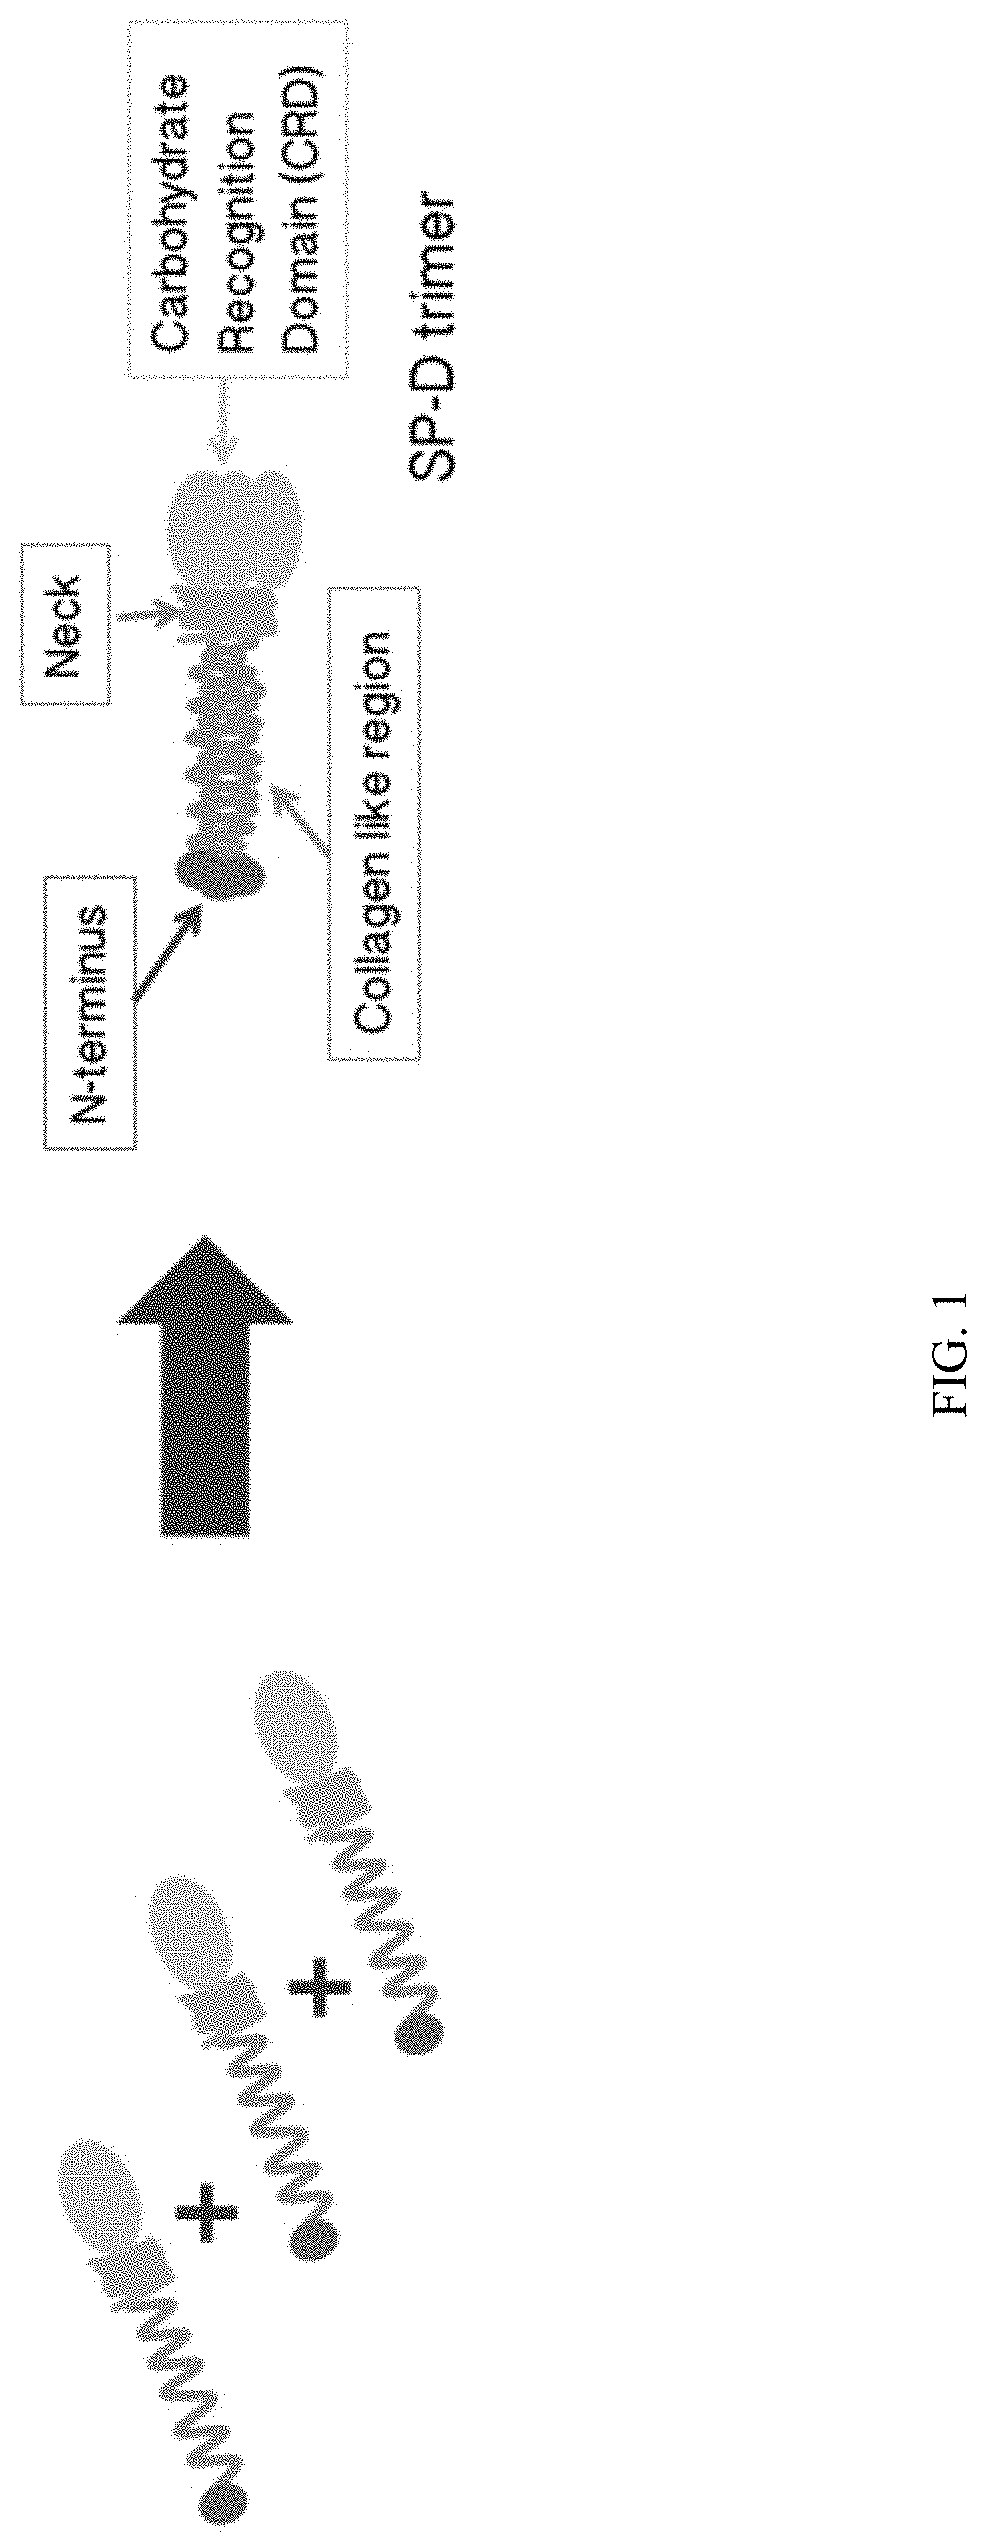
[0024] FIG. 1 is a schematic which depicts the formation of an SP-D trimer, and structural features of the SP-D trimer.
DETAILED DESCRIPTION
[0025] Surfactant protein D (SP-D) is a C-type (Ca-dependent) lectin that comprises four domains: a cysteine-linked N-terminal region required for the formation of intermolecular disulfide bonds, a triple-helical collagen region, an .alpha.-helical-coiled-coil trimerizing neck peptide, and a C-terminal calcium-dependent carbohydrate-recognition domain (CRD) (Crouch E. et al. (1994) J Biol Chem, 269:17311-9). Monomers form trimers through folding of the collagenous region into triple helices and the assembly of a coiled-coil bundle of .alpha.-helices in the neck region (FIG. 1). These trimers are stabilized by two disulfide bonds in the cysteine-rich N-terminal domain. The SP-D trimer has a total molecular weight of 129 kDa which comprises three identical 43-kDa polypeptide chains. SP-D trimers can form higher oligomerization states which vary by size and conformation. Higher oligomerization states may be important for SP-D function (Hakansson K, et al., Protein Sci (2000) 9:1607-17; Crouch E. Respir Res (2000) 1:93-108; Crouch E. et al. (2006) J Biol Chem, 281:18008-14). The association of SP-D trimers into higher oligomerization states is sensitive to environmental factors and conditions during purification and storage. The pathway and type of interactions involved in the formation of large oligomers of SP-D have not been previously elucidated.
[0026] Some embodiments include a system and method of resolving oligomeric species of SP-D using a variation of the asymmetrical flow field-flow fractionation (AF4) technique. Some such embodiments were developed to resolve lower order SP-D species (hexamers and smaller) from the higher order SP-D species (dodecamer and larger). These embodiments allow the dodecamer form of SP-D to be clearly delineated within a complex fractogram envelope using multi-angle laser light scattering (MALLS). Using this variation of the AF4 technique, incorporating MALLS, allowed the molar mass of the dodecamer to be consistently determined at 521.8.+-.3.6 kD over the analysis of numerous (n=102) samples. As used herein, the term "AF4-MALLS" means a method of performing asymmetrical flow field-flow fractionation followed by the use of multi-angle laser light scattering to identify the oligomeric species in the mixture being analyzed. The precision of the AF4-MALLS method was calculated to be .about.5%. Fractograms of SP-D also displayed peaks associated with species larger than a dodecamer, which appeared as star-like species arising from dodecamer and/or hexamer assembly by atomic force microcopy (AFM) as well as aggregates that were larger than 70 nm in radius. Thus, embodiments that use the AF4-MALLS technique were found to provide a detailed profile of the various higher order oligomeric association states of SP-D, which were found to be determined with precision and accuracy.
Identification of Oligomeric Species of SP-D
[0027] A sample of SP-D can include several oligomeric species of the SP-D proteins, including: trimers, hexamers, dodecamers, and higher order oligomers such as star-like oligomeric species having an average root mean square (RMS) radius of about 70 nm, and aggregates which may have a radius greater than 70 nm. As described herein, certain oligomeric species of SP-D have been associated with certain useful activities. For example, SP-D dodecamers have been associated with antagonist activity in a Toll-like receptor 4 (TLR4) assay. A TLR4 assay can measure the activity of rhSP-D to inhibit lipopolysaccharide (LPS)-induced inflammatory cell responses by preventing LPS from binding/activating a TLR4 complex. Activity of the SP-D in an assay, such as a TLR4 assay can be a useful indicator for the predicted efficacy of the SP-D in certain methods of treatment. In addition, different samples of SP-D can contain different relative distributions of SP-D oligomeric species.
[0028] The distribution of oligomeric forms of recombinant human SP-D (rhSP-D) in a sample can be determined by a variety of techniques. Some embodiments can include identifying oligomeric species of rhSP-D by performing AFM. Some embodiments can include identifying oligomeric species of rhSP-D by performing a size exclusion chromatography such as high-performance liquid chromatography (HPLC). Some embodiments can include identifying oligomeric species of rhSP-D by performing polyacrylamide gel electrophoresis. In some such methods, a sample of rhSP-D can be contacted with an anionic detergent, such as of SDS, followed by contacting the sample with a crosslinking reagent, such as 1% glutardialdehyde. The crosslinked proteins can then be resolved by size using techniques such as polyacrylamide gel electrophoresis. Some methods can also include identifying the different oligomeric species of rhSP-D, such as performing a Western blot.
[0029] Some embodiments include performing an AF4-MALLS analysis on a SP-D sample. AF4 is a type of asymmetric field flow fractionation which is capable of rapid fractionation and high-resolution characterization of various particles including bio-molecules. See e.g., Giddings, J. C. et al., Science 193:1244-1245 (1976); Giddings, J. C. et al., Anal. Chem. 48:1126-1132 (1976); and Wagner et al., (2014) Anal Chem 86:5201-5210 which are each incorporated by reference in its entirety. AF4 can separate particles ranging from a few nanometers to a few micrometers. Field flow fractionation separation occurs in a thin flow channel which is comparable to a chromatographic separation column. An aqueous or organic solvent carries the sample through this channel. The flow through the channel is laminar due to the low channel height, and is the first force exerted on the sample. A second force is generated perpendicular to the channel flow. In AF4, one side of the flow channel is a membrane and the second force is fluid flow across the channel through the membrane. Particle separation occurs in this system because of these two forces. First, the velocity gradient due to the laminar flow within the channel causes particles in the center of the channel to move more quickly along the channel and be separated from those closer to the sides of the channel. Second, the second force forces the sample toward the membrane. Size separation occurs because the smaller molecules diffuse back toward the center of the channel more quickly than larger particles and hence are separated from the larger particles due to the quicker solvent flow toward the center of the channel. In some embodiments, the AF4-MALLS is performed in the absence of a chelating agent, such as EDTA and EGTA.
[0030] Some embodiments include determining the relative proportion of active oligomeric species in the SP-D sample, wherein the SP-D oligomeric species is selected from the group consisting of a SP-D trimer, a SP-D dodecamer, a SP-D star-like oligomer having an average radius of 70 nm or RMS radius of 70 nm, and a SP-D aggregate having an average radius or RMS radius greater than 70 nm. In some embodiments, the SP-D star-like oligomer can have a molar mass less than or equal to about 6 MDa. In some embodiments, the SP-D aggregate has a molar mass greater than 6 MDa.
[0031] Some embodiments also include integrating a fractogram from an AF4-MALLS analysis into peaks. A first peak in a fractogram (Peak 1) can include SP-D trimers and hexamers. A second peak in the fractogram (Peak 2) can include SP-D dodecamers. A third peak in the fractogram (Peak 3) can include intermediate species between SP-D dodecamers to SP-D star-like oligomers. A fourth peak in the fractogram (Peak 4) can include a heterogeneous mass of rhSP-D oligomers with constant RMS radius of about 70 nm consistent with what has been observed by AFM measurements for the star-like oligomeric species, and larger SP-D aggregate species having a radius greater than 70 nm.
[0032] Some embodiments also include determining, or measuring, a relative peak area (RPA) for a peak as a percentage of the total peak area of measured peaks, such as the four peaks identified above. Some such embodiments include measuring a relative peak area (RPA) of the fractogram for at least one peak indicative of a SP-D oligomeric species, such as a SP-D trimer, a SP-D dodecamer, a SP-D star-like oligomer having an average radius of 70 nm or RMS radius of 70 nm, and SP-D aggregate having an average radius greater than 70 nm or RMS radius greater than 70 nm.
[0033] In some embodiments, an SP-D sample having a relative proportion of SP-D dodecamers greater than or equal to a certain percentage of the SP-D oligomeric species in the sample is indicative of the SP-D sample having activity, the percentage can be 20%, 25%, 30%, 35%, 40%, 45%, 50%, 55%, 60%, 65%, 70%, 75%, 80%, 85%, 90%, 95%, and any percentage between any two of the foregoing percentages.
[0034] In some embodiments, an SP-D sample having a relative proportion of SP-D aggregates less than a certain percentage of the SP-D oligomeric species in the sample is indicative of the SP-D sample having activity, the percentage can be 40%, 35%, 30%, 25%, 20%, 15%, 10%, 5%, 3%, 2%, 1% and any percentage between any two of the foregoing percentages.
[0035] In some embodiments, the relative proportion the SP-D oligomeric species can be with regard to mass, number of molecules/aggregates in a population of SP-D different oligomeric species, or relative peak area (RPA) in an AF4-MALLS analysis.
[0036] In some embodiments, the SP-D comprises a wild-type human SP-D polypeptide. In some embodiments, the SP-D includes a polymorphism of the human SP-D polypeptide. Example SP-D polypeptide sequences are provided in TABLE 1. Polymorphisms in the human SP-D polypeptide can include: residue 11, ATG (Met)->ACG (Thr); residue 25, AGT (Ser)->AGC (Ser); residue 160, ACA (Thr)->GCA (Ala); residue 270, TCT (Ser)->ACT (Thr); and residue 286, GCT (Ala)->GCC (Ala) in which the positions relate to a position in a mature SP-D polypeptide, such as the example polypeptide of SEQ ID NO:02. In some embodiments, the rhSP-D comprises a certain residue at a polymorphic position in which the residue selected from Met11/31, Thr160/180, Ser 270/290, and Ala 286/306 in which residue positions relate to a position in the mature SP-D polypeptide, such as example SEQ ID NO:02, and a position in the SP-D polypeptide with its leader polypeptide, such as example SEQ ID NO:01. In some embodiments, the SP-D comprises Met11/31. In some embodiments, the rhSP-D comprises Met11/31, Thr160/180, Ser 270/290, and Ala 286/306. In some embodiments, the SP-D polypeptide has an identity with a polypeptide of SEQ ID NO:02 over the entire length of the polynucleotide of at least 80%, 90%, 95%, 99% and 100%, or any percentage in a range between any of the foregoing percentages.
TABLE-US-00001 TABLE 1 SEQ ID NO. Sequence SEQ ID NO: 01 MLLFLLSALVLLTQPLLGYLEAEMKTYSHRTMPSACTLV SP-D polypeptide MCSSVESGLPGRDGRDGREGPRGEKGDPGLPGAAGQAGM including a leader PGQAGPVGPKGDNGSVGEPGPKGDTGPSGPPGPPGVPGP sequence (underlined) AGREGPLGKQGNIGPQGKPGPKGEAGPKGEVGAPGMQGS and polymorphisms AGARGLAGPKGERGVPGERGVPGNTGAAGSAGAMGPQGS (underlined) at: Met PGARGPPGLKGDKGIPGDKGAKGESGLPDVASLRQQVEA 31, Thr 180, Ser 290, LQGQVQHLQAAFSQYKKVELFPNGQSVGEKIFKTAGFVK Ala 306 PFTEAQLLCTQAGGQLASPRSAAENAALQQLVVAKNEAA FLSMTDSKTEGKFTYPTGESLVYSNWAPGEPNDDGGS EDCVEIFTNGKWNDRACGEKRLVVCEF SEQ ID NO: 02 AEMKTYSHRTMPSACTLVMCSSVESGLPGRDGRDGREGP SP-D polypeptide of RGEKGDPGLPGAAGQAGMPGQAGPVGPKGDNGSVGEPGP SEQ ID NO: 01, without KGDTGPSGPPGPPGVPGPAGREGPLGKQGNIGPQGKPGP leader sequence, and KGEAGPKGEVGAPGMQGSAGARGLAGPKGERGVPGERGV polymorphisms PGNTGAAGSAGAMGPQGSPGARGPPGLKGDKGIPGDKGA (underlined) at: Met KGESGLPDVASLRQQVEALQGQVQHLQAAFSQYKKVELF 11, Thr 160, Ser 270, PNGQSVGEKIFKTAGFVKPFTEAQLLCTQAGGQLASPRS Ala 286. AAENAALQQLVVAKNEAAFLSMTDSKTEGKFTYPTGESL VYSNWAPGEPNDDGGSEDCVEIFTNGKWNDRACGEKRLV VCEF
[0037] In some embodiments, the SP-D is a recombinant human SP-D (rhSP-D). In some embodiments, the rhSP-D is derived from a human myeloid leukemia cell line expressing the rhSP-D from an integrated transgene. Example expression vectors, rhSP-D polypeptides, cell-lines, and methods of purifying rhSP-D from such cells, are provided in U.S. 2019/0071693; and U.S. 2019/0071694 each of which is expressly incorporated by reference herein in its entirety.
Certain Systems
[0038] Some embodiments of the methods and compositions provided herein include electronic systems for determining the activity of a pharmaceutical composition comprising surfactant protein-D (SP-D). Some such embodiments can include a system comprising a processor having instructions configured to execute the following steps: measuring the relative proportion of oligomeric species of SP-D in the pharmaceutical composition; calculating the relative proportion of SP-D dodecamers in the pharmaceutical composition; and determining the activity of the pharmaceutical composition based on the relative proportion of SP-D dodecamers, wherein a higher relative proportion of SP-D dodecamers is indicative of the composition having a higher level of activity compared to the activity of a composition having a lower relative proportion of SP-D dodecamers. In some embodiments, the activity comprises antagonist activity in a toll-like receptor 4 (TLR4) assay. Some embodiments also include calculating the relative proportion of SP-D aggregate having an average radius greater than 70 nm or RMS radius greater than 70 nm in the pharmaceutical composition. In some embodiments, the measuring comprises performing an asymmetric flow field-flow fractionation with multi-angle laser light scattering (AF4-MALLS) analysis. In some embodiments, the calculating comprises providing a model of the oligomeric species of SP-D comprising rod-like geometries and spherical-like geometries. In some embodiments, the model comprises a Zimm model and a second order Debye model of the oligomeric species of SP-D. Some embodiments also include measuring the relative proportion of at least one SP-D oligomeric species in the SP-D sample, wherein the SP-D oligomeric species is selected from the group consisting of a SP-D trimer, a SP-D hexamer, a SP-D dodecamer, a SP-D star-like oligomer having an average radius of 70 nm or RMS radius of 70 nm, and SP-D aggregate having an average radius greater than 70 nm or RMS radius greater than 70 nm.
[0039] Some embodiments of the methods and compositions provided herein include electronic systems for determining the relative proportion of oligomeric species of surfactant protein-D (SP-D) in a sample. Some such embodiments can include a system comprising a processor having instructions configured to execute the following steps: performing an asymmetric flow field-flow fractionation with multi-angle laser light scattering (AF4-MALLS) analysis on the SP-D sample; and determining the relative proportion of an oligomeric species of SP-D from the results of the AF4-MALLS analysis, wherein the SP-D oligomeric species is selected from the group consisting of a SP-D trimer, a SP-D hexamer, a SP-D dodecamer, a SP-D star-like oligomer having an average radius of 70 nm or RMS radius of 70 nm, and SP-D aggregate having an average radius greater than 70 nm or RMS radius greater than 70 nm. Some embodiments also include measuring the relative proportion of SP-D dodecamers in the sample. Some embodiments also include measuring the relative proportion of SP-D aggregate having an average radius greater than 70 nm or RMS radius greater than 70 nm in the sample.
[0040] Some embodiments of the methods and compositions provided herein include electronic systems for determining the relative proportion of active oligomeric species of surfactant protein-D (SP-D) in a sample. Some such embodiments include a system comprising a processor having instructions configured to execute the following steps: performing an asymmetric flow field-flow fractionation with multi-angle laser light scattering (AF4-MALLS) analysis on the SP-D sample; measuring the relative proportion of SP-D dodecamers in the SP-D sample; measuring the relative proportion of at least one SP-D oligomeric species in the SP-D sample selected from the group consisting of a SP-D trimer, a SP-D hexamer, a SP-D star-like oligomer having an average radius of 70 nm or RMS radius of 70 nm; and SP-D aggregate having an average radius greater than 70 nm or RMS radius greater than 70 nm; and calculating a ratio between each of the measured relative proportions. In some embodiments, the at least one SP-D oligomeric species comprises SP-D aggregate having an average radius greater than 70 nm or RMS radius greater than 70 nm. Some embodiments also include integrating a fractogram from the AF4-MALLS analysis into peaks. Some embodiments also include measuring a relative peak area (RPA) of the fractogram for at least one peak indicative of a SP-D oligomeric species selected from the group consisting of a SP-D trimer, a SP-D hexamer, a SP-D dodecamer, a SP-D star-like oligomer having an average radius of 70 nm or RMS radius of 70 nm, and SP-D aggregate having an average radius greater than 70 nm or RMS radius greater than 70 nm. In some embodiments, the SP-D star-like oligomer has a molar mass less than or equal to about 6 MDa. In some embodiments, the SP-D aggregate has a molar mass greater than 6 MDa. Some embodiments also include measuring the relative proportion of SP-D star-like oligomeric species in the sample having an average radius of 70 nm or RMS radius of 70 nm in the sample. Some embodiments also include measuring the relative proportion of SP-D aggregates having an average radius greater than 70 nm or RMS radius greater than 70 nm in the sample.
[0041] In some embodiments, the SP-D sample is predicted to have antagonist activity in a lipopolysaccharide--Toll-like receptor 4 (LPS-TLR4) assay.
[0042] In some embodiments, the SP-D sample having a relative proportion of SP-D dodecamers greater than or equal to 35% of the SP-D oligomeric species in the sample is indicative of the SP-D sample having activity. In some embodiments, an SP-D sample having a relative proportion of SP-D dodecamers greater than or equal to a certain percentage of the SP-D oligomeric species in the sample is indicative of the SP-D sample having activity, the percentage can be 20%, 25%, 30%, 35%, 40%, 45%, 50%, 55%, 60%, 65%, 70%, 75%, 80%, 85%, 90%, 95%, and any percentage between any two of the foregoing percentages.
[0043] In some embodiments, the SP-D sample having a relative proportion of SP-D aggregates having an average radius greater than 70 nm or RMS radius greater than 70 nm less than 5% of the total SP-D oligomeric species in the sample is indicative of the SP-D sample having activity. In some embodiments, an SP-D sample having a relative proportion of SP-D aggregates less than a certain percentage of the SP-D oligomeric species in the sample is indicative of the SP-D sample having activity, the percentage can be 40%, 35%, 30%, 25%, 20%, 15%, 10%, 5%, 3%, 2%, 1% and any percentage between any two of the foregoing percentages.
[0044] In some embodiments, the AF4-MALLS is performed in the absence of a chelating agent selected from the group consisting of EDTA and EGTA.
[0045] In some embodiments, the SP-D is a recombinant human SP-D (rhSP-D). In some embodiments, the rhSP-D is derived from a human myeloid leukemia cell line expressing the rhSP-D from a transgene. In some embodiments, the rhSP-D comprises the amino acid sequence of SEQ ID NO:02. In some embodiments, the rhSP-D comprises a residue at a polymorphic position corresponding to a residue selected from the group consisting of Met11, Thr160, Ser 270, and Ala 286.
[0046] In some embodiments, the relative proportion the oligomeric species is with respect to mass. In some embodiments, the relative proportion the oligomeric species is with respect to a relative peak area (RPA) or an adjusted RPA in an AF4-MALLS analysis.
EXAMPLES
[0047] Example 1--Atomic Force Microscope Analysis of rhSP-D
[0048] Oligomeric species of a recombinant human SP-D (rhSP-D) were characterized by atomic force microscope (AFM). See e.g., Arroyo R, et al. (2017) Biophysical Journal 112 (3): 503a, which is incorporated by reference in its entirety. A solution comprising 0.85 ng/.mu.L rhSP-D in dilution buffer (200 mM NaCl, 20 mM Tris (pH 7.4), 1 mM EDTA) was placed on freshly cleaved mica substrate. Samples were imaged with an atomic force microscope from Nanotec (Nanotec Electrionica, Madrid, Spain) and PointProbePlus tips, type PPP-NCH (Nanosensors, Neuchatel, Switzerland). The image size for quantitative studies was 1 .mu.m.times.1 .mu.m with 512 pixels, and was obtained at a rate of 1 line/second. Raw images were subjected to general plane subtraction, flattening with background subtraction, and artifact lines removal.
[0049] Oligomeric species identified in the obtained images included trimers, hexamers, dodecamers and star-like oligomers. Trimers had a rod-like appearance, and some trimers were measured to have an average length of about 65 nm (.+-.8.6 nm). Dodecamers had an X-shaped appearance, and some dodecamers were measured to have a tip to opposite tip length of about 136 nm (.+-.8.1 nm). The star-like species included members that had a star-shaped appearance composed of 6-20 trimers, each trimer joined to a particular member of this species through a central hub. Some star-like species were measured to have a diameter of about 140 nm, similar to the diameter of the measured dodecamers. TABLE 2 summarizes the distribution and frequency of observed oligomeric species.
TABLE-US-00002 TABLE 2 Oligomeric No % species molecules molecules Trimer 244 37 Hexamer 100 15 Dodecamer 273 41 Star-like 45 7 Total 660 100
Example 2--AF4-MALLS Analysis of rhSP-D
[0050] The distribution of different oligomeric species of rhSP-D was determined by an AF4-MALLS analysis. For the AF4-MALLS analysis, rhSP-D samples were separated by an AF4 system (Eclipse Dual Tec, Wyatt Technology Corp., Santa Barbara, Calif.) followed by UV (Ultimate 3000 variable wavelength detector, Dionex Corporation, Sunnyvale, Calif.) and MALS analysis (Dawn Heleos II detector, Wyatt Technology Corp., Santa Barbara, Calif.). A Dionex Ultimate 3000 HPLC system (Dionex Corporation, Sunnyvale, Calif.) was used to inject the samples and deliver the mobile phase to the AF4 system. The AF4 configuration used a short channel with a 350 .mu.m thick spacer (Wyatt Technology Corp., Santa Barbara, Calif.). Analysis of the data and calculations were performed using Chromeleon (Dionex Corporation, Sunnyvale, Calif.) and ASTRA (Wyatt Technology Corp., Santa Barbara, Calif.) software. Results from the AF4-MALLS analysis included a fractogram with several peaks.
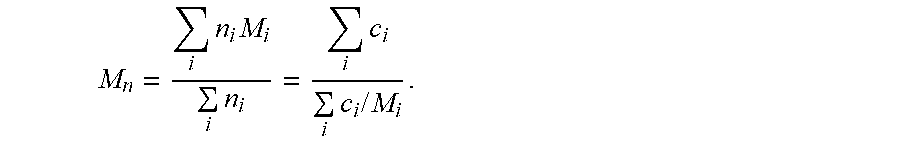
[0051] The ASTRA software (version 6.1.1.17) calculated the following: molar mass and root means square (RMS) radius moments for each selected peak. Moments were referenced to averages over the entire sample, which can include many peaks. Equation (1) relates to the number-average molar mass:
M n = i n i M i i n i = i c i i c i / M i . ##EQU00001##
[0052] An ASTRA measurement typically required an independent concentration determination. Since the relation between concentration (mg/mL) and number density (number/ml) was nM=c, the results from the equation (2) could be determined. Equation (2) relates to weight-average molar mass:
M w = i n i M i 2 i n i M i = i c i M i i c i . ##EQU00002##
[0053] The polydispersity index value was: .rho.=M.sub.w/M.sub.n. Typically, a value larger than 1.2 was considered polydisperse, while values less than 1.1 were designated as having low polydispersity.
[0054] In order to determine molar mass, mixed mathematical models were selected to calculate the size and MW of the molecule in an analysis of rhSP-D using light scattering data. As indicated herein, AFM images demonstrated that rhSP-D oligomeric species included monomers, dimers, trimers, hexamers, dodecamers, and higher order oligomeric structures. AFM images demonstrated structures that were rod-shaped, X-shaped and star-like. The star-like structures were measured by AFM and calculated to have a radius of about 70 nm, which were best characterized by a second order Debye model (P. Debye, "Molecular-weight determination by light scattering," J. Phys. Coll. Chem., vol. 51, pp. 18-32 (1947) which is incorporated by reference in its entirety). The Debye model uses the R.theta./K*c formalism and provided better results over a wider range of molar mass, including very large masses (greater than .about.10.sup.6 Daltons or .about.100 nm RMS radius). The Debye model was applied to the analysis of peak 4 as described herein. The rod-shaped structures were measured by AFM and calculated to have a length of about 65 nm. The X-shaped structures were measured by AFM and calculated to a length of about 135 nm. Both the rod-shaped and X-shaped structures were best characterized by a rod-model. The Zimm equation was fitted to R.sub..theta./K*cvssin(.theta./2). B. H. Zimm, J. Chem. Phys., vol. 16, pp. 1093-1099 (1948) which is incorporated by reference in its entirety. The theoretical form factor P(.theta.) for the desired model has been derived for spheres, coated spheres, and rods and are covered in the text by van de Hulst (H. C. van de Hulst, Light Scattering by Small Particles, Wiley, New York (1957), which is incorporated by reference in its entirety). The sphere and coated sphere models yielded geometric radii, while the rod model produced a length. The rod-model was applied to the analysis of peaks 1, 2 and 3 as described herein. The resultant rod-model is described by the equation below:
P ( .theta. ) = ( 1 u ) .intg. 0 2 u sin t t dt - sin 2 u u 2 ##EQU00003## where u = [ ( 2 .pi. n O / .lamda. O ) L sin ( .theta. / 2 ) ] , and L is the rod length , which is assumed to be much greater than its negligible diameter . ##EQU00003.2##
[0055] The diversity of SP-D structures could not be accommodated by a single model. Typically, the Zimm model can be sufficiently flexible to accommodate multiple geometries, but in the case of SP-D, a mixed modal analysis that combined the use of the second-order Debye model the rod model was used. The second order Debye model was applied to SP-D oligomeric species including aggregates having a radius greater than 70 nm (Peak 4). The rod model was applied to rod-like SP-D structures that included monomer, dimer, trimer, hexamer, and dodecamer (Peaks 1 and 2). There was a transition between dodecamer and the formation of star-like structures (Peak 3) for which the rod-model was applied for best characterization of MW. The mixed model better fit the AF4-MALLS data and was consistent with geometric measurements obtained by AFM.
[0056] Samples were integrated into four peak sections, Peaks 1-4, using a combination of analysis of the UV signal and an analysis of the molar mass as determined by light scattering. All relative areas were calculated using a drop-down integration at selected points. Peak 2 corresponded to a rhSP-D dodecamer peak, whose limits were determined by analyzing the molar mass and the polydispersity index. A center point, usually the highest point of the UV trace, and boundaries were set equidistant from that point. The polydispersity of that section is measured by Mw/Mn, as described herein. Typically, a value larger than 1.2 was considered polydisperse, while values less than 1.1 were designated as having low polydispersity. Boundaries were moved until the polydispersity index was about 1.05. Indices varied between 1.008 and 1.090. It was observed that slight movements of the peak boundaries could cause changes in the index. Peak 3 boundaries were set from the later boundary of Peak 2 until the dip in the UV trace found at 36.5 minutes. The outer boundary of peak 4 was set at 45 minutes. At 45 minutes the cross-flow had been turned off. Any material remaining in the channel began to elute at that time and there was effectively no separation taking place. Peak 1 included all species lower than a rhSP-D dodecamer. In some cases, lower molecular weight species were resolved, and separate integrations were performed. It was possible to superimpose the MW trace over the UV trace and integration points were found for hexamers (258 kDa), trimers (129 kDa), dimers (86 kDa) and monomers (42 kDa). The peaks were quite narrow and could be reliably determined.
[0057] In an initial series of studies, the cross-flow parameters were investigated using the original mobile phase composition (20 mM Tris buffer, pH 7.4, 200 mM NaCl, 1 mM EDTA). Once the cross-flow program was established, a series of experiments investigated the effects of the mobile phase composition, resulting in the removal of EDTA from the mobile phase comprised of 20 mM Tris, 200 mM NaCl, pH 7.4. Final adjustments were made to the focus steps, resulting in a final method that has a run time of 59.2 minutes. TABLE 3 lists parameters used for the AF4.
TABLE-US-00003 TABLE 3 Start End X flow X flow time time Duration start end Step (min) (min) (min) Mode (ml/min) (ml/min) 1 0 1 1 Elution 2 1 2 1 Focus 3 2 3 1 Focus + inject 4 3 6 3 Focus 5 6 6.2 0.2 Elution 0.5 3 6 6.2 9.2 3 Elution 3 3 7 9.2 19.2 10 Elution 3 0.18 8 19.2 29.2 10 Elution 0.18 0.18 9 29.2 44.2 15 Elution 0.18 0 10 44.2 54.2 10 Elution 0 0 11 54.2 59.2 5 Elution + 0 0 Inject Detector Flow: 0.5 ml/min Inject Flow: 0.2 ml/min Focus Flow: 0.5 ml/min Injection Amount: 5 .mu.g UV detection: 214 nm Mobile phase: 20 mM Tris, 200 mM NaCl, pH 7.4 Channel: short (145 mm) Spacer: 350 .mu.M Membrane: 10 kD PES
[0058] In another series of studies, 102 lyophilized formulations of rhSP-D obtained from 17 different cell-lines expressing the rhSP-D from an integrated transgene were analyzed. These includes cell-lines: S888, S990, S991, S1010, S2099, and twelve cell-lines numbered 2428 through 2439. The reproducibility of the AF4 method was gauged using four different metrics: (i) total area under the fractogram, indicating precision, (ii) relative area of the dodecamer, (iii) calculated molar mass of the dodecamer from the MALLS data, and (iv) the polydispersity of the molar mass within the dodecamer peak envelope. The relative standard deviation (rsd) was calculated for each metric across all samples. On average, the total area under the fractogram, indicative of precision, displayed rsd values that ranged from 4.3% to 5.3%. In other words, the total area for these complex fractograms was reproducible within about 5% from run to run for a given sample. However, the relative area of the rhSP-D dodecamer in these samples varied widely, from about 25% to 65%, and these relative amounts were reproducible, with the rsd values ranging from about 5% to 6.5%. The average rsd for the molar mass calculated from the MALLS data was very low at 0.86%. Finally, the polydispersity index (PDI) values calculated from the MALLS data exhibited average rsd values of about 1.5%.
[0059] Data using AF4-MALLS was analyzed to determine absolute molar mass and size of rhSP-D at a certain time during elution. The size to mass ratio was indicative of the shape of the rhSP-D. From the size to mass ratio, it was determined that in the early stages of an elution (0-34 minutes) the rhSP-D molecule had a linear or rod-shape. For rod model calculations, the software assumed that the thickness of a rod-shaped particle was insignificant (0.0 nm) compared to its length. Rod lengths were determined to be consistent with AFM measurements of 136.+-.8.1 nm (N=50 individual molecules). The later stages of the elution (34-45 minutes) for rhSP-D indicated that a more compact structure was being observed. A second order Debye model was employed for analysis of these stages of the elution. The second order Debye model provided better results over a wider range of molar masses, including the very large (greater than .about.10.sup.6 Daltons or .about.50 nm RMS radius). For dodecamers of rhSP-D, molecular weight was determined to be 520.09+/-4.61 kDa (N=72 determinations).
[0060] A first peak in the fractogram (Peak 1) contained rhSP-D trimers and hexamers based on mass calculations according to the rod model. A second peak in the fractogram (Peak 2) contained rhSP-D dodecamers. A third peak in the fractogram (Peak 3) contained intermediate species between rhSP-D dodecamers to rhSP-D star-like oligomers based on the intermediate molecular weight as determined by the rod model. A fourth peak in the fractogram (Peak 4) contained a heterogeneous mass of rhSP-D oligomers with constant RMS radius of about 70 nm consistent with what has been observed by AFM measurements for the star-like oligomeric species, and larger species having a radius greater than 70 nm. Beyond 36 minutes in the fractogram, the RMS radius increased further, indicative of further aggregate species. The relative peak area (RPA) for each peak was determined as a percentage of the total peak area of the four peaks.
[0061] To determine the distribution of oligomeric species in solution using an AF4-MALLS analysis with a greater resolution, the species of Peak 4 were analyzed further. The maximal molecular weight for star-like rhSP-D oligomer was assumed to be about 6 MDa based on images from the AFM analysis. The maximal molecular weight was used as a nominal cut-off for distinguishing star-like rhSP-D oligomers from larger aggregates. However, rhSP-D oligomeric species associated with Peak 3 were included in the aggregate determination when the 6 MDa was used as a cutoff in the analysis. This was inconsistent with the clear onset of elution of a new peak near 34 minutes. A size-based cutoff of 70 nm was used in the analysis. The 70 nm cutoff almost exactly coincided with the beginning of Peak 4, as seen either by the UV trace or by the overall LS trace. Therefore, using the 70 nm cutoff was a more accurate measure to distinguish the presence of rhSP-D oligomeric aggregate.
[0062] An adjusted RPA was determined for each of Peaks 3 and 4. Specifically, aspects of the RPA of Peak 4 that corresponded to star-like oligomeric species having a constant RMS radius of about 70 nm were determined, and these aspects were removed from the RPA of Peak 4 and added to the RPA of Peak 3 to provide an adjusted RPA for Peak 4 and Peak 3. Thus, the RPA of Peak 1, RPA of Peak 2, adjusted RPA of Peak 3, and adjusted RPA of Peak 4 corresponded to the relative distributions of rhSP-D oligomeric species in the AF4-MALLS analysis for (1) trimers and hexamers; (2) dodecamers; (3) star-like oligomeric species having an RMS radius of about 70 nm; and (4) aggregates having an RMS radius greater than 70 nm, respectively.
[0063] An AF4-MALLS analysis was performed on three rhSP-D samples obtained from different human myeloid leukemia cell lines expressing rhSP-D from an integrated transgene. TABLE 4 summarizes the results.
TABLE-US-00004 TABLE 4 AF4-MALLS Relative peak area (%) [Average molar mass] rhSP-D Adjusted Adjusted sample Peak 1 Peak 2 Peak 3 Peak 3 Peak 4 Peak 4 7H8 0.79 .+-. 0.05 34.12 .+-. 0.23 59.75 .+-. 0.55 61.30 .+-. 0.74 5.34 .+-. 0.33 3.79 .+-. 0.23 [75.1 .+-. 56.9] [523.6 .+-. 3.1] [2164 .+-. 72] [47190 .+-. 960] 1C4 11.85 .+-. 0.33 30.75 .+-. 0.13 51.95 .+-. 0.46 54.39 .+-. 0.56 5.45 .+-. 0.21 3.01 .+-. 0.13 [142.9 .+-. 14.9] [520.2 .+-. 2.7] [3048 .+-. 71] [31650 .+-. 3025] 8B11 7.29 .+-. 0.34 44.37 .+-. 0.60 45.61 .+-. 0.78 47.29 .+-. 0.90 2.72 .+-. 0.16 1.04 .+-. 0.04 [76.4 .+-. 6.6] [522.8 .+-. 4.6] [2520 .+-. 33] [2313 .+-. 412] Averages .+-. standard deviations of triplicate determinations
[0064] As shown in TABLE 4, the rhSP-D sample 8B11 had an RPA for Peak 2 of 44.37% which was indicative of this sample having the highest relative amount of dodecamer of the three tested samples. The rhSP-D sample 8B11 had an adjusted RPA for Peak 4 of 1.04% which was indicative of this sample having the lowest relative amount of aggregates having an RMS radius greater than 70 nm, of the three tested samples.
Example-3 Activity of rhSP-D in a TLR4 Assay
[0065] The Toll-like receptors (TLRs) have a role in both the innate immune system and the adaptive immune system, and SP-D has activity to modulate signaling through TLRs, such as Toll-like receptor 2 (TLR2) and Toll-like receptor 4 (TLR4). See e.g., Haagsman H P et al., (2008) Neonatology 93:288-294; Yamazoe M. et al., (2008) J. Biol Chem. 283:35878-35888; and Vieira F. et al., (2017) Ann Anat 211:184-201 which are each incorporated by reference in its entirety. TLR4 activity may also modulate the severity of conditions, such as bronchopulmonary dysplasia (BPD) (Malash A H et al., (2016) Gene 592:23-28 which is incorporated by reference in its entirety). Thus, the activity of rhSP-D to modulate TLR4 activity was measured as an indication of the effect of rhSP-D on a host immune response. The activity of reconstituted formulations containing rhSP-D was tested in an LPS-TLR4 assay. In an LPS-TLR4 assay, reconstituted rhSP-D can inhibit lipopolysaccharide (LPS)-induced inflammatory cell responses by preventing LPS from binding/activating the Toll-like receptor 4 (TLR4). See e.g., Yamazoe M. et al., (2008) J. Biol Chem. 283:35878-35888.
[0066] The activity of reconstituted rhSP-D in an LPS-TLR4 assay was tested in a method substantially similar to the following method. HEK-Bue.TM. hTLR4 cells (InvivoGen, San Diego, Calif., U.S.A.) were plated at a density .about.20000 cells/well in 384-well plates and incubated with various concentrations of SP-D for 2 hours at 37.degree. C., 5% CO2. LPS (E. coli 026:B6, L5543 Sigma Aldrich) at an EC.sub.80 concentration was added to each well, and the cells incubated for another 22 hours at 37.degree. C., 5% CO2. TLR4 activity was measured by detaching the cells from the wells, washing the suspended cells, resuspending the cells in PBS and removing any clumps by gentle pipetting. Washed cells were transferred to a 384-well plate at a density of 20e10.sup.3 cells/well containing HEK blue detection medium (InvivoGen, San Diego, Calif., U.S.A.) that had been made up in endotoxin-free water containing 5 mM CaCl.sub.2) and 1% (v/v) BSA. Cells were incubated at 37.degree. C. in 5% CO2 for 24 hours, and activity of TLR4 was determined by measuring the activity of a secreted embryonic alkaline phosphatase (SEAP) reporter gene using a spectrophotometer at 655 nm. An IC.sub.50 value for the SP-D was determined using nonlinear regression analysis by fitting the data to the four-parameter logistics equation. Because only the logarithm of the IC.sub.50 values were normally distributed, for the purposes of averaging numbers from a series of experiments, the pIC.sub.50 values were used, defined as the -Log.sub.10 (IC.sub.50). A curve span was determined from the difference between the fitted maximal response (E.sub.max) and the fitted minimal response (E.sub.min) and corresponds to the amplitude of the dose-response curve, or efficacy of the response. The results of an LPS-TLR4 assay with rhSP-D samples are summarized in TABLE 5.
TABLE-US-00005 TABLE 5 Avg pIC.sub.50 .+-. IC.sub.50 Avg curve rhSP-D Sample SD (mg/ml) (mg/ml) span .+-. SD N 7H8 Not active Not active Not active 5 1C4 Not active Not active Not active 3 8B11 3.00 .+-. 0.09 1.00E-03 37.64 .+-. 14.05 3 888 (+control) 1.96 .+-. 0.14 1.10E-02 40.44 .+-. 13.64 4
[0067] As shown in TABLE 5, the rhSP-D sample 8B11 was the only tested cell clone sample that had activity in the TLR4 assay. Notably, the rhSP-D sample 8B11 was the only tested sample that had an RPA for Peak 2 greater than 35%.
Example 4--Activity of rhSP-D in a Bacterial Aggregation Assay
[0068] The activity of rhSP-D samples was tested in a bacterial aggregation assay. In a bacterial aggregation assay, active rhSP-D aggregates bacterial cells and reduces absorbance/increases transmission through the bacterial suspension. The bacterial aggregation assay was performed by a method substantially similar to the following method. Briefly, an exponential E. coli (ATCC: Y1088) culture was prepared, an aliquot was taken re-suspended in 1 mL buffer, (150 mM HEPES, 20 mM NaCl pH 7.4). Absorbance of the bacterial suspension was measured in a spectrometer at 700 nm, and the bacterial suspension was adjusted to obtain an Absorbance in the range of 1.0000 to 1.1000. 1M CaCl.sub.2) was added to the suspension to obtain a final concentration of 5 mM CaCl.sub.2). rhSP-D samples in placebo buffer (15 .mu.l total volume for each dilution) were created at the following concentrations: 5, 1, 0.5, 0.25, 0.1, 0 .mu.g/ml and added to cuvettes each containing 20 .mu.L of the Hepes-NaCl buffer. 600 .mu.L bacterial suspension were then added to cuvettes, and absorbance was measured every 2.5 minutes for each cuvette at 700 nm, for a total of 120 minutes. Tested concentrations of rhSP-D included 0 .mu.g/ml, 0.1 .mu.g/ml, 0.25 .mu.g/ml, 0.5 .mu.g/ml, 1.0 .mu.g/ml, and 5.0 .mu.g/ml. A percentage average aggregation at 60 minutes was calculated from the absorbance value at 60 minutes at each tested concentration, according to the following formula:
(1-abs)*100=% Aggregation
[0069] where 1=the measured absorbance of the E. coli suspension without rhSP-D.
[0070] Abs=The absorbance value of the E. coli suspension+rhSP-D at 60 minutes.
[0071] Percentage (%) Aggregation values were averaged from 3 replicates and imported, along with the standard deviation, into GraphPad Prism v7.0c, (GraphPad, La Jolla, Calif. 92037). The averaged values were fit using a 4-Parameter logistic curve. The resultant values for the EC50, and Span were determined for each reconstituted rhSP-D sample. pEC50 is the -Log 10 of the EC50.
[0072] The rhSP-D samples 7H8, 1C4 and 8B11 each had activity in the bacterial aggregation assay.
Example 5--Multivariate Analysis of rhSP-D Oligomeric Species
[0073] A multivariate statistical analysis was performed to determine any correlation between peaks observed in fractograms in AF4-MALLS analyses for various formulations of rhSP-D, and activity of rhSP-D samples in either the bacterial aggregation assay or the TLR4 assay. Digitized fractograms obtained from more than 40 different samples were used as a data matrix, and correlations to the measured pIC.sub.50 values from the TLR4 assay, or pEC.sub.50 results from bacterial aggregation activity assays were determined using PLS.
[0074] A full cross validation was performed on all calibration models using standard techniques. See e.g., Katz, M. H. "Multivariate Analysis: A Practice Guide for Clinicians." Cambridge University Press, New York, pp. 158-162 (1999); Stahle, L. et al., (1988) "Multivariate data analysis and experimental design in biomedical research. Prog. Med. Chem. 25: 291-338; Wold S. (2001) "PLS-regression: a basic tool of chemometrics." Chemom. Intell. Lab. Syst. 58: 109-130 which are each incorporated by reference in its entirety. Briefly, one sample was removed at a time, the data set was recalibrated, and a new model was constructed. This process was repeated until all the calibration samples were removed once and quantified as a validation model. Therefore, the first set, containing all samples was referred to as the calibration set and the one after cross-validation as the validation set. The jack-knife algorithm was used to determine statistical significance for any factor used in constructing partial least square (PLS) models (Martens, H. et al., (2001) "Multivariate Analysis of Quality: An Introduction" Wiley and Sons, Chichester, UK).
[0075] With regard to a correlation between particular peaks observed in the AF4-MALLS analysis and activity in the bacterial aggregation assay for various formulations of rhSP-D, the majority of the activity was found to reside in Peaks 1 and 2, with some persisting throughout Peak 3. A negative correlation was found between Peak 4 and activity in the bacterial aggregation assay. With regard to a correlation between particular peaks observed in the AF4-MALLS analysis and activity in the TLR4 assay for various formulations of rhSP-D, the activity was found to localize almost exclusively in the Peak 2. Thus, activity of rhSP-D in the TLR4 assay was directly related to dodecamer species of rhSP-D. Therefore, an AF4-MALLS provides a method to determine the proportion of the sample that includes dodecamers active in a TLR4 assay. Notably, the aggregate species with radius >70 nm found in corrected Peak 4 were not associated with activity in either the bacterial aggregation assay nor the TLR4 assay, confirming that these species represented inactive forms of rhSP-D.
[0076] The term "comprising" as used herein is synonymous with "including," "containing," or "characterized by," and is inclusive or open-ended and does not exclude additional, unrecited elements or method steps.
[0077] The above description discloses several methods and materials of the present invention. This invention is susceptible to modifications in the methods and materials, as well as alterations in the fabrication methods and equipment. Such modifications will become apparent to those skilled in the art from a consideration of this disclosure or practice of the invention disclosed herein. Consequently, it is not intended that this invention be limited to the specific embodiments disclosed herein, but that it covers all modifications and alternatives coming within the true scope and spirit of the invention.
[0078] All references cited herein, including but not limited to published and unpublished applications, patents, and literature references, are incorporated herein by reference in their entirety and are hereby made a part of this specification. To the extent publications and patents or patent applications incorporated by reference contradict the disclosure contained in the specification, the specification is intended to supersede and/or take precedence over any such contradictory material.
Sequence CWU 1
1
21376PRThomo sapiensHuman SP-D polypeptide including a leader
sequence. With polymorphisms at Met 31, Thr 180, Ser 290, Ala 306.
1Met Leu Leu Phe Leu Leu Ser Ala Leu Val Leu Leu Thr Gln Pro Leu1 5
10 15Leu Gly Tyr Leu Glu Ala Glu Met Lys Thr Tyr Ser His Arg Thr
Met 20 25 30Pro Ser Ala Cys Thr Leu Val Met Cys Ser Ser Val Glu Ser
Gly Leu 35 40 45Pro Gly Arg Asp Gly Arg Asp Gly Arg Glu Gly Pro Arg
Gly Glu Lys 50 55 60Gly Asp Pro Gly Leu Pro Gly Ala Ala Gly Gln Ala
Gly Met Pro Gly65 70 75 80Gln Ala Gly Pro Val Gly Pro Lys Gly Asp
Asn Gly Ser Val Gly Glu 85 90 95Pro Gly Pro Lys Gly Asp Thr Gly Pro
Ser Gly Pro Pro Gly Pro Pro 100 105 110Gly Val Pro Gly Pro Ala Gly
Arg Glu Gly Pro Leu Gly Lys Gln Gly 115 120 125Asn Ile Gly Pro Gln
Gly Lys Pro Gly Pro Lys Gly Glu Ala Gly Pro 130 135 140Lys Gly Glu
Val Gly Ala Pro Gly Met Gln Gly Ser Ala Gly Ala Arg145 150 155
160Gly Leu Ala Gly Pro Lys Gly Glu Arg Gly Val Pro Gly Glu Arg Gly
165 170 175Val Pro Gly Asn Thr Gly Ala Ala Gly Ser Ala Gly Ala Met
Gly Pro 180 185 190Gln Gly Ser Pro Gly Ala Arg Gly Pro Pro Gly Leu
Lys Gly Asp Lys 195 200 205Gly Ile Pro Gly Asp Lys Gly Ala Lys Gly
Glu Ser Gly Leu Pro Asp 210 215 220Val Ala Ser Leu Arg Gln Gln Val
Glu Ala Leu Gln Gly Gln Val Gln225 230 235 240His Leu Gln Ala Ala
Phe Ser Gln Tyr Lys Lys Val Glu Leu Phe Pro 245 250 255Asn Gly Gln
Ser Val Gly Glu Lys Ile Phe Lys Thr Ala Gly Phe Val 260 265 270Lys
Pro Phe Thr Glu Ala Gln Leu Leu Cys Thr Gln Ala Gly Gly Gln 275 280
285Leu Ala Ser Pro Arg Ser Ala Ala Glu Asn Ala Ala Leu Gln Gln Leu
290 295 300Val Val Ala Lys Asn Glu Ala Ala Phe Leu Ser Met Thr Asp
Ser Lys305 310 315 320Thr Glu Gly Lys Phe Thr Tyr Pro Thr Gly Glu
Ser Leu Val Tyr Ser 325 330 335Asn Trp Ala Pro Gly Glu Pro Asn Asp
Asp Gly Gly Ser Glu Asp Cys 340 345 350Val Glu Ile Phe Thr Asn Gly
Lys Trp Asn Asp Arg Ala Cys Gly Glu 355 360 365Lys Arg Leu Val Val
Cys Glu Phe 370 3752355PRThomo sapiensSP-D polypeptide of SEQ ID
NO01, without leader sequence. With polymorphisms at Met 11, Thr
160, Ser 270, Ala 286. 2Ala Glu Met Lys Thr Tyr Ser His Arg Thr Met
Pro Ser Ala Cys Thr1 5 10 15Leu Val Met Cys Ser Ser Val Glu Ser Gly
Leu Pro Gly Arg Asp Gly 20 25 30Arg Asp Gly Arg Glu Gly Pro Arg Gly
Glu Lys Gly Asp Pro Gly Leu 35 40 45Pro Gly Ala Ala Gly Gln Ala Gly
Met Pro Gly Gln Ala Gly Pro Val 50 55 60Gly Pro Lys Gly Asp Asn Gly
Ser Val Gly Glu Pro Gly Pro Lys Gly65 70 75 80Asp Thr Gly Pro Ser
Gly Pro Pro Gly Pro Pro Gly Val Pro Gly Pro 85 90 95Ala Gly Arg Glu
Gly Pro Leu Gly Lys Gln Gly Asn Ile Gly Pro Gln 100 105 110Gly Lys
Pro Gly Pro Lys Gly Glu Ala Gly Pro Lys Gly Glu Val Gly 115 120
125Ala Pro Gly Met Gln Gly Ser Ala Gly Ala Arg Gly Leu Ala Gly Pro
130 135 140Lys Gly Glu Arg Gly Val Pro Gly Glu Arg Gly Val Pro Gly
Asn Thr145 150 155 160Gly Ala Ala Gly Ser Ala Gly Ala Met Gly Pro
Gln Gly Ser Pro Gly 165 170 175Ala Arg Gly Pro Pro Gly Leu Lys Gly
Asp Lys Gly Ile Pro Gly Asp 180 185 190Lys Gly Ala Lys Gly Glu Ser
Gly Leu Pro Asp Val Ala Ser Leu Arg 195 200 205Gln Gln Val Glu Ala
Leu Gln Gly Gln Val Gln His Leu Gln Ala Ala 210 215 220Phe Ser Gln
Tyr Lys Lys Val Glu Leu Phe Pro Asn Gly Gln Ser Val225 230 235
240Gly Glu Lys Ile Phe Lys Thr Ala Gly Phe Val Lys Pro Phe Thr Glu
245 250 255Ala Gln Leu Leu Cys Thr Gln Ala Gly Gly Gln Leu Ala Ser
Pro Arg 260 265 270Ser Ala Ala Glu Asn Ala Ala Leu Gln Gln Leu Val
Val Ala Lys Asn 275 280 285Glu Ala Ala Phe Leu Ser Met Thr Asp Ser
Lys Thr Glu Gly Lys Phe 290 295 300Thr Tyr Pro Thr Gly Glu Ser Leu
Val Tyr Ser Asn Trp Ala Pro Gly305 310 315 320Glu Pro Asn Asp Asp
Gly Gly Ser Glu Asp Cys Val Glu Ile Phe Thr 325 330 335Asn Gly Lys
Trp Asn Asp Arg Ala Cys Gly Glu Lys Arg Leu Val Val 340 345 350Cys
Glu Phe 355
D00001
S00001
XML
uspto.report is an independent third-party trademark research tool that is not affiliated, endorsed, or sponsored by the United States Patent and Trademark Office (USPTO) or any other governmental organization. The information provided by uspto.report is based on publicly available data at the time of writing and is intended for informational purposes only.
While we strive to provide accurate and up-to-date information, we do not guarantee the accuracy, completeness, reliability, or suitability of the information displayed on this site. The use of this site is at your own risk. Any reliance you place on such information is therefore strictly at your own risk.
All official trademark data, including owner information, should be verified by visiting the official USPTO website at www.uspto.gov. This site is not intended to replace professional legal advice and should not be used as a substitute for consulting with a legal professional who is knowledgeable about trademark law.