Cobalt-rich Wear Resistant Alloy And Method Of Making And Use Thereof
Qiao; Cong Yue ; et al.
U.S. patent application number 16/508700 was filed with the patent office on 2021-01-14 for cobalt-rich wear resistant alloy and method of making and use thereof. This patent application is currently assigned to L.E. Jones Company. The applicant listed for this patent is L.E. Jones Company. Invention is credited to Daniel W. Bancroft, David M Doll, Heidi Ziegler Doll, Douglas W. Dooley, Cong Yue Qiao.
| Application Number | 20210010113 16/508700 |
| Document ID | / |
| Family ID | 1000004246593 |
| Filed Date | 2021-01-14 |


| United States Patent Application | 20210010113 |
| Kind Code | A1 |
| Qiao; Cong Yue ; et al. | January 14, 2021 |
COBALT-RICH WEAR RESISTANT ALLOY AND METHOD OF MAKING AND USE THEREOF
Abstract
A cobalt-rich wear resistant and corrosion resistant alloy useful for parts of a combustion engine such as valve seat inserts includes, in weight % about 0.1 to about 0.8% C, about 0.1 to about 1.5% Mn, about 3 to about 5% Si, about 10 to about 20% Cr, about 5 to about 32% Fe, about 0.5 to about 4% W, about 10 to about 30% Mo, up to about 20% Ni, about 20 to about 40% Co, up to about 6% V, up to about 3% Nb, total V plus Nb of about 0.5 to about 8.5% and balance unavoidable impurities including up to 0.035% P, up to 0.015% S and up to 0.250% N.
| Inventors: | Qiao; Cong Yue; (Menominee, MI) ; Doll; David M; (Houston, TX) ; Doll; Heidi Ziegler; (Houston, TX) ; Dooley; Douglas W.; (Menominee, MI) ; Bancroft; Daniel W.; (Menominee, MI) | ||||||||||
| Applicant: |
|
||||||||||
|---|---|---|---|---|---|---|---|---|---|---|---|
| Assignee: | L.E. Jones Company Menominee MI |
||||||||||
| Family ID: | 1000004246593 | ||||||||||
| Appl. No.: | 16/508700 | ||||||||||
| Filed: | July 11, 2019 |
| Current U.S. Class: | 1/1 |
| Current CPC Class: | C22C 1/0433 20130101; C22C 38/52 20130101; C22C 38/105 20130101; C22C 38/44 20130101; C22C 38/008 20130101; C22C 38/48 20130101; C22C 38/46 20130101; F04B 53/1087 20130101 |
| International Class: | C22C 38/10 20060101 C22C038/10; C22C 38/52 20060101 C22C038/52; C22C 38/48 20060101 C22C038/48; C22C 38/46 20060101 C22C038/46; C22C 38/44 20060101 C22C038/44; C22C 38/00 20060101 C22C038/00; C22C 1/04 20060101 C22C001/04; F04B 53/10 20060101 F04B053/10 |
Claims
1. A cobalt-rich wear resistant and corrosion resistant alloy comprising, in weight %: about 0.1 to about 0.8% C; about 0.1 to about 1.5% Mn; about 3 to about 5% Si; about 10 to about 20% Cr; about 5 to about 32% Fe; about 0.5 to about 4% W; about 10 to about 30% Mo; about 0 to about 20% Ni; about 20 to about 40% Co; up to about 6% V; up to about 3% Nb; total V plus Nb of about 0.5 to about 8.5%; and balance unavoidable impurities.
2. The alloy of claim 1, wherein C is about 0.2 to about 0.5%, Mn is about 0.2 to about 0.8%, Si is about 3.5 to about 4.5%, Cr is about 13 to about 20%, Fe is about 12 to about 32%, W is about 1 to about 4% W, Mo is about 19 to about 28%, Ni is about 0 to about 5%, Co is about 20 to about 35%, V is about 3 to about 4%, and Nb is about 1 to about 2%.
3. The alloy of claim 1, having a microstructure comprising matrix phases of cobalt solid solution and Laves phases and uniformly distributed MC type carbides in the cobalt solid solution matrix.
4. The alloy of claim 3, wherein the solid solution matrix is a face-centered cubic solid solution with NbC and/or VC precipitates therein.
5. The alloy of claim 3, further comprising interdendritic primary eutectic phases.
6. A valve seat insert made of the alloy of claim 1.
7. The valve seat insert of claim 6, wherein C is about 0.18 to about 0.52%, Mn is about 0.7 to about 1.2%, Si is about 3.5 to about 4.6%, Cr is about 11 to about 15%, Fe is about 16 to about 27%, W is about 1 to about 1.5%, Mo is about 19 to about 23%, Ni is about 0.7 to about 4%, Co is about 26 to about 36%, V is about 1.3 to about 4%, and Nb is about 1.2 to about 2.3%.
8. The valve seat insert of claim 6, wherein the valve seat insert is a casting and the microstructure includes 40 to 60% by volume Laves phases and 40 to 60% by volume cobalt solid solution phases.
9. The valve seat insert of claim 6, wherein the valve seat insert has an as-cast hardness from about 50 to about 66 Rockwell C at 75 to 1000.degree. F., a compressive yield strength from about 100 ksi to about 150 ksi from 75 to 1000.degree. F.; and/or an ultimate tensile strength from about 70 ksi to about 100 ksi from 75 to 1000.degree. F.
10. The valve seat insert of claim 6, wherein C is 0.2 to 0.5%, Mn is 0.2 to 0.8%, Si is 3.5 to 4.5%, Cr is 13 to 20%, Fe is 12 to 32%, W is 1 to 4% W, Mo is 19 to 28%, Ni is from 0 to 5%, Co is 20 to 35%, V is 3 to 4%, and Nb is 1 to 2%.
11. The valve seat insert of claim 6, wherein the valve seat insert exhibits a dimensional stability of less than about 0.25.times.10.sup.-3 inches per inch of insert outside diameter (O.D.) after about 20 hours thermal soaking at about 1200.degree. F.
12. The valve seat insert of claim 6, wherein the valve seat insert exhibits a decrease in hardness of 10% or less when heated from about room temperature to about 1000.degree. F.
13. A method of manufacturing an internal combustion engine comprising inserting the valve seat insert of claim 6 in a cylinder head of the internal combustion engine.
14. The method of claim 13, wherein the engine is a diesel engine.
15. A method of operating an internal combustion engine comprising closing a valve against the valve seat insert of claim 6 to close a cylinder of the internal combustion engine and igniting fuel in the cylinder to operate the internal combustion engine.
16. The method of claim 15, wherein the engine is a diesel engine.
17. The method of claim 15, wherein the valve: (i) is composed of a high-temperature, nickel-chromium alloy strengthened by precipitation hardening; or a high-temperature, nickel-based superalloy; or (ii) the valve is hard-faced with a high temperature, wear-resistant cobalt-based alloy strengthened by carbides; or is hard-faced with a high-temperature, wear-resistant cobalt-based alloy strengthened by Laves phases.
18. A method of making a cobalt-rich wear resistant and corrosion resistant alloy according to claim 1 wherein the alloy is melted and cast from a melt at a temperature of from about 2800 to about 3000.degree. F.; or the alloy is pre-alloyed powder which is compressed into a shaped component and sintered at a temperature from about 2000 to about 2350.degree. F.
19. The method of claim 18, wherein the alloy is cast from a melt at a temperature from about 2875 to about 2915.degree. F.; the method further comprising heating the cast alloy at a temperature from about 1300 to about 1500.degree. F. for about 2 to about 10 hours in an inert, oxidizing, reducing atmosphere or in a vacuum.
Description
FIELD OF THE INVENTION
[0001] The present invention relates to wear resistant alloys useful for applications such as valve seat inserts of internal combustion engines.
BACKGROUND
[0002] In the field of internal combustion engines, iron-based alloys and nickel-based alloys have been developed for engine parts such as valve seat inserts. Although there has been some development of cobalt-based alloys for such applications, fewer cobalt-based alloy systems have been commercialized due to the high cost of cobalt. Although cobalt-based alloys have the potential for achieving required heat resistance, corrosion resistance and wear resistance of VSI applications, there is a need for lower cost cobalt-based alloys suitable for VSI applications.
SUMMARY
[0003] Disclosed herein is a cobalt-rich alloy (referred to herein as "J580") useful for VSI applications wherein the alloy comprises, in weight percent (%), about 0.1 to about 0.8% C, about 0.1 to about 1.5% Mn, about 3 to about 5% Si, about 10 to about 20% Cr, about 5 to about 32% Fe, about 0.5 to about 4% W, about 10 to about 30% Mo, up to about 20% Ni, about 20 to about 40% Co, up to about 6% V, up to about 3% Nb, total V plus Nb of about 0.5 to about 8.5%, balance unavoidable impurities including up to 0.035% P, up to 0.015% S and up to 0.250% N.
[0004] In an embodiment, the cobalt-rich alloy comprises, in weight percent (%), about 0.18 to about 0.52% C, about 0.7 to about 1.2% Mn, about 3.5 to about 4.6% Si, about 11 to about 15% Cr, about 16 to about 27% Fe, about 1 to about 1.5% W, about 19 to about 23% Mo, about 0.7 to about 4% Ni, about 26 to about 36% Co, about 1.3 to about 4% V, about 1.2 to about 2.3% Nb, balance unavoidable impurities including up to 0.035% P, up to 0.015% S and up to 0.250% N.
[0005] The cobalt-rich alloy can have a bulk hardness which exhibits less than 10% hardness variation as a function of tempering below 1500.degree. F.
[0006] The cobalt-rich alloy can have a vanadium content of about 1.3 to about 3.6% which solution phase matrix with optional Laves phase. The cobalt-rich alloy can include MC type carbide formers such as V and Nb in an amount of up to about 9 wt. %, such as about 0.5 to about 8.5 wt. % or about 3 to about 5 wt. %.
BRIEF DESCRIPTION OF THE DRAWINGS
[0007] FIG. 1 is a graph of bulk harness as a function of tempering temperature for several J580 alloy compositions.
[0008] FIG. 2 shows a correlation between measured bulk hardness and calculated bulk hardness.
[0009] FIG. 3 is a graph of radial crush toughness as a function of tempering temperature for several J580 alloy compositions.
[0010] FIG. 4 shows a correlation between measured radial crush toughness and calculated radial crush toughness.
[0011] FIG. 5 is a graph of radial crush toughness versus bulk hardness.
[0012] FIGS. 6-8 are graphs of dimensional change versus temperature wherein FIG. 6 is a graph of dimensional change versus temperature for J3, FIG. 7 is a graph of dimensional change versus temperature for J10, and FIG. 8 is a graph of dimensional change versus temperature for J580.
[0013] FIG. 9 is a graph of compressive yield strength versus temperature for several J580 alloy compositions for J580, J3, J10 and J153.
[0014] FIG. 10 is a graph of ultimate tensile strength versus temperature for several J580 alloy compositions for J580, J3, J10 and J513.
[0015] FIG. 11A and FIG. 11B are scanning electron micrographs (SEM) of a J580 alloy composition.
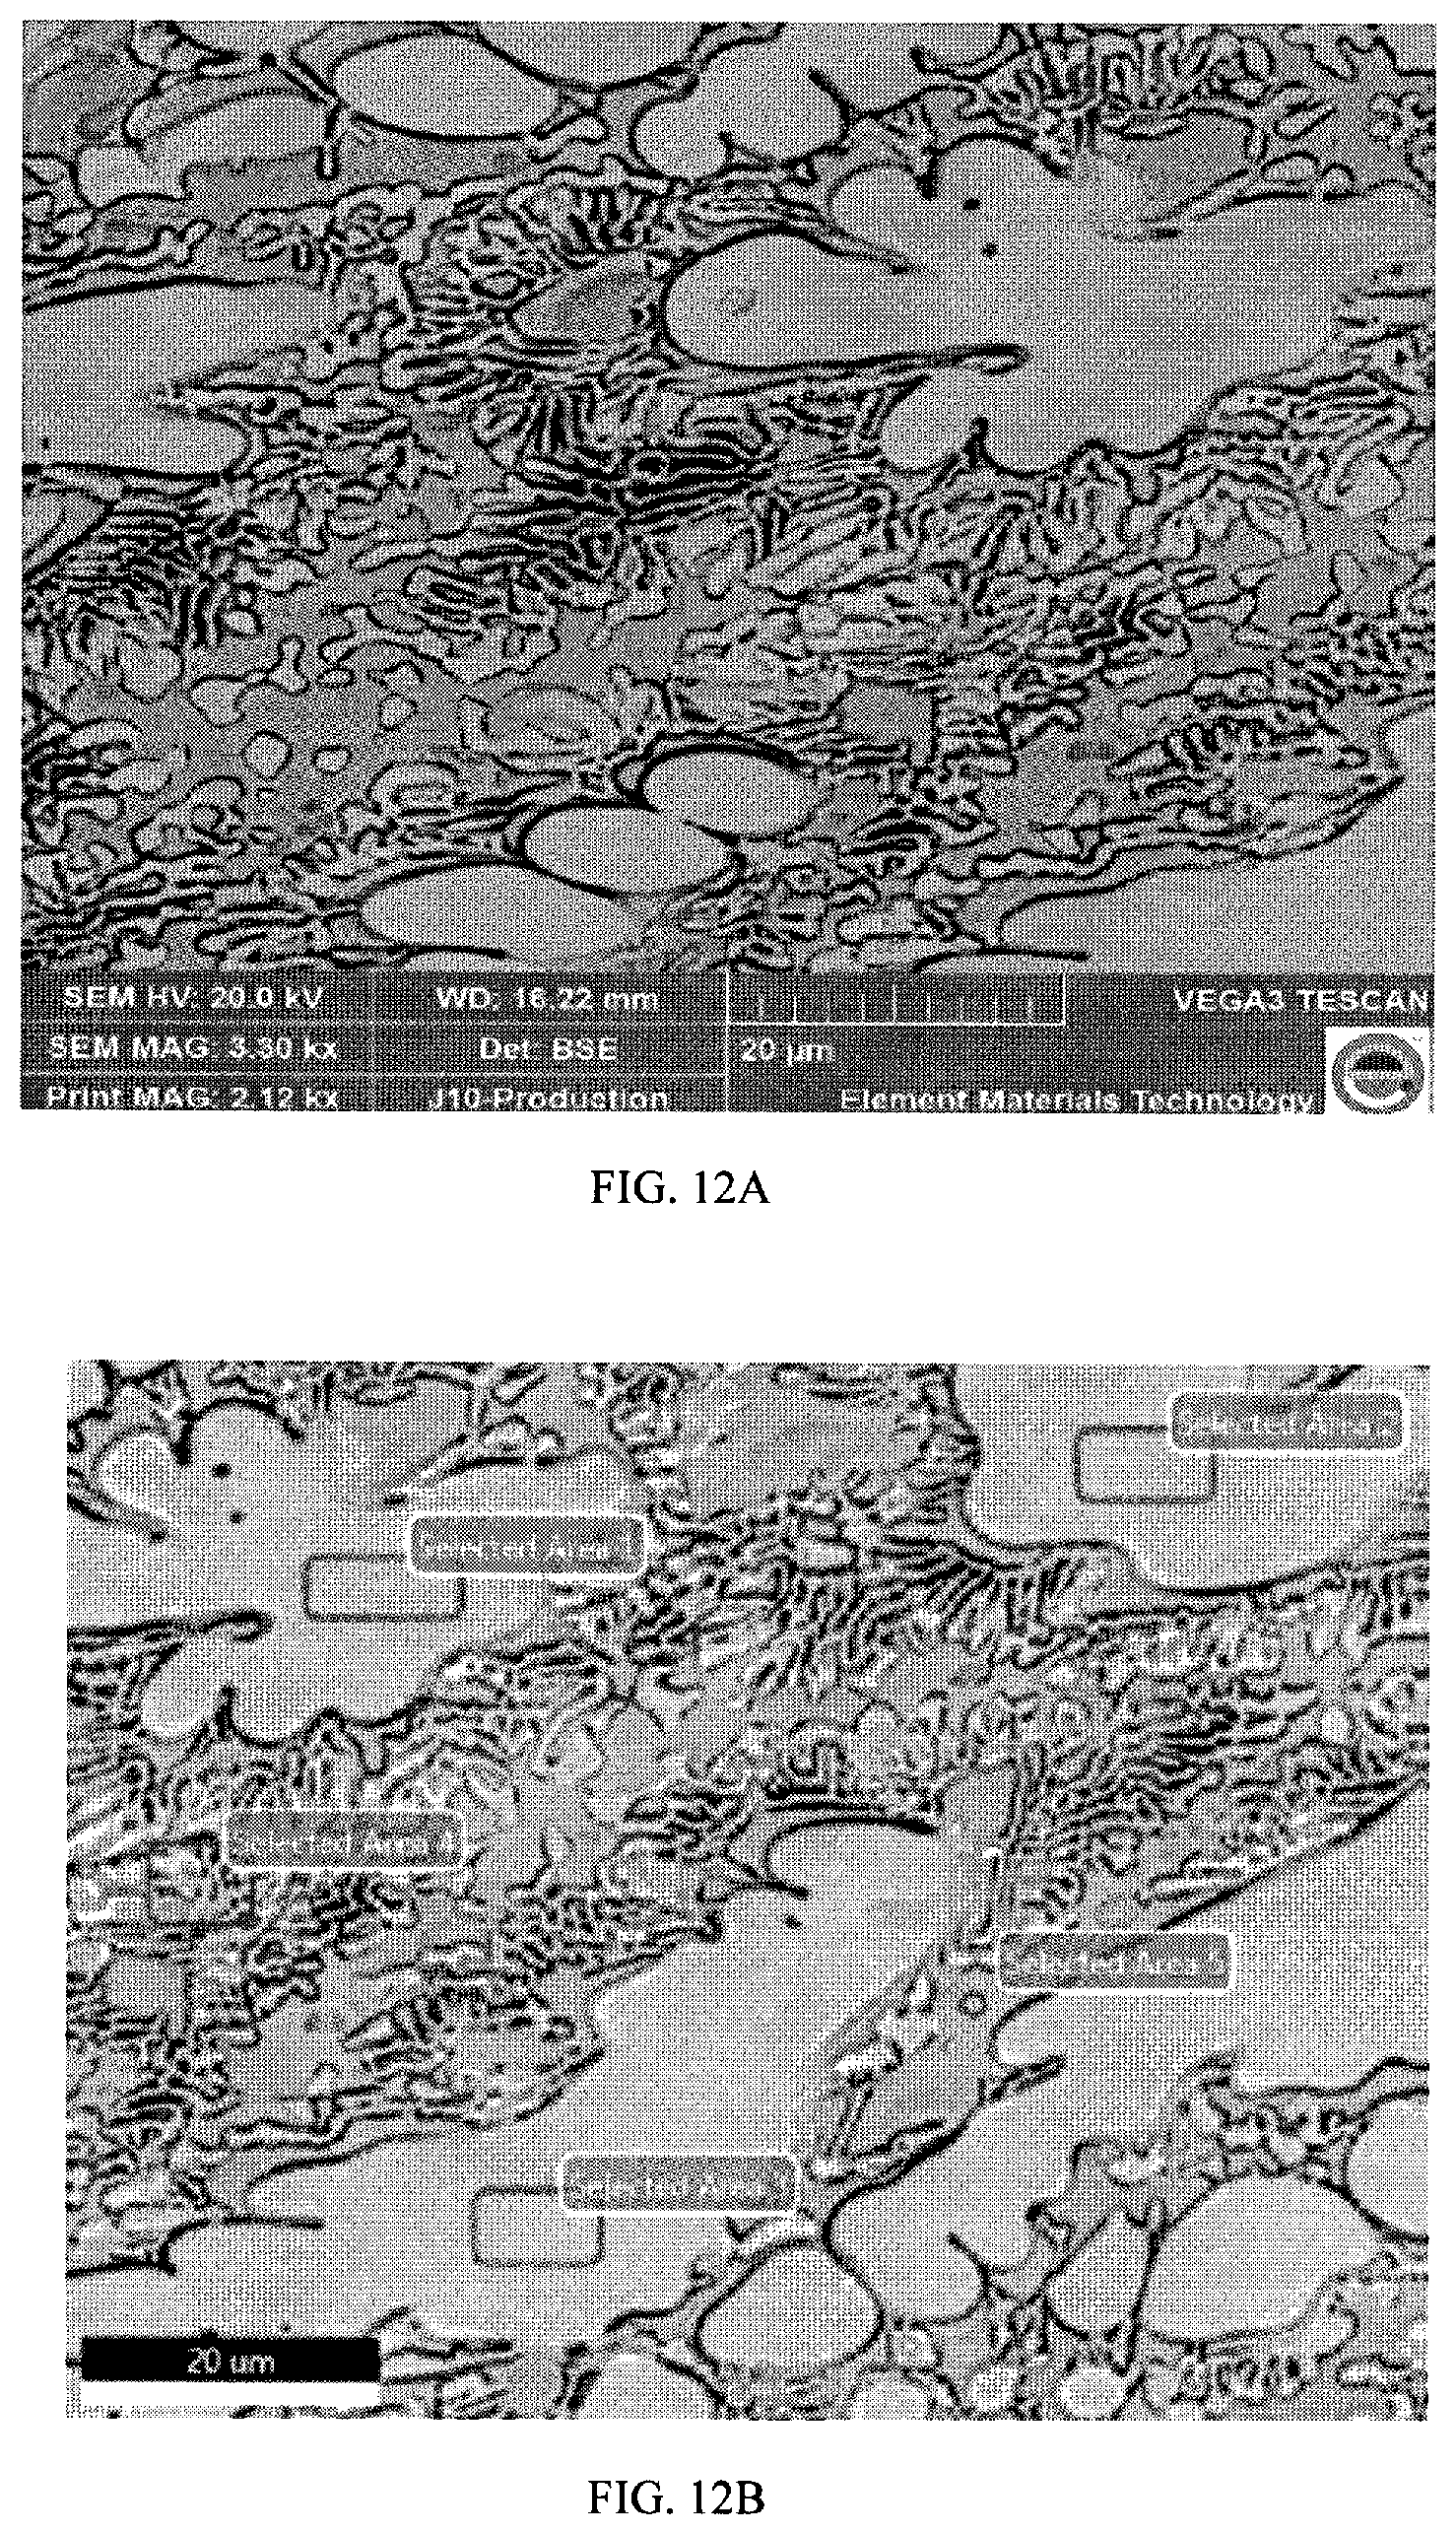
[0016] FIG. 12A and FIG. 12B are scanning electron micrographs of a J10 alloy composition.
[0017] FIGS. 13-15 show Plint wear test results for J10 and three J580 alloys wherein FIG. 13 shows pin specimen wear, FIG. 14 shows plate specimen wear, and FIG. 15 shows total materials wear.
[0018] FIG. 16 shows bulk hardness versus temperature data for various J580 alloys.
[0019] FIG. 17 shows radial crush toughness versus temperature data for various J580 alloys.
[0020] FIG. 18 shows UTS versus test temperature for various J580 alloys.
DETAILED DESCRIPTION
[0021] Disclosed herein is a cobalt-rich alloy (referred to herein as "J580" or "J580 alloy"). The J580 alloy is designed as a cost effective alloy which exhibits wear resistance and corrosion resistance along with an improved thermal shock resistance and machinability. The J580 alloy can exhibit desirable hardness, microhardness, and hardness distribution in a casting component, such as a valve seat insert ("VSI").
[0022] In developing the J580 alloy, various alloy compositions were evaluated for mechanical properties and microstructure. The J580 alloy composition can be tailored to achieve desired mechanical properties of VSIs such as bulk hardness, radial crush strength, dimensional change, compressive yield strength, tensile rupture strength, corrosion resistance, and wear resistance. To achieve desired performance objectives of VSIs, the J580 alloy composition can be tailored to provide a microstructure having a cobalt solid solution phase, eutectic phases, Laves phase, and MC type carbides. For example, the J580 alloy can have a microstructure with two primary matrix phases (lamellar shaped eutectic reaction phases and Laves phases) and fine MC type carbides for strengthening. Cobalt can form intermetallic phases with molybdenum and Sigma phase with chromium, iron can form intermetallic phases with molybdenum and chromium, and silicon can form intermetallic phases with cobalt, molybdenum, chromium and iron. In addition, nickel can be added to form inclusions to reduce the grain size of the matrix phase. Thus, in the J580 alloy, the alloy elements and ranges can be controlled to form intermetallic phases in addition to the Laves phase in the matrix to reduce the volume percent of cobalt solid solution phase by controlling the iron and silicon additions to the J580 alloy. Compared to the J10 alloy (a Co-base alloy available from L.E. Jones, the assignee of the present application) having about 60% cobalt and a matrix of about 50 vol. % Laves phases and about 50 vol. % cobalt solid solution phases, the J580 alloy which has a much lower Co content, can provide a VSI having a more homogenized microhardness distribution across a component cross section.
[0023] Table 1 summarizes experimental J580 heats for various alloy compositions. Six of the heats were adopted to make a standard VSI test rings for some basic materials testing including temper response, bulk hardness, radial crush toughness, and corrosion. The basic geometric dimensions of the test VSI samples are: 1.935'' (49.15 mm) OD, 1.570'' (39.88 mm) ID, and 0.3020'' (7.67 mm) in height.
TABLE-US-00001 TABLE 1 Summary of J580 Alloy Compositions in Weight % Heat No. C Si Mn Ni Cr Mo W V Co Fe P S Nb 8E11XC 0.485 4.19 0.71 3.42 12.06 21.74 1.30 3.97 27.03 22.97 0.024 0.005 1.67 8E04XB 0.185 4.40 0.95 0.95 14.81 22.12 1.45 3.57 29.67 19.21 0.026 0.004 2.26 8E04XA 0.187 3.84 0.95 0.74 14.83 21.89 1.39 3.79 30.93 19.08 0.027 0.005 1.95 8E03XB 0.508 4.35 0.82 3.44 12.39 21.56 1.25 3.57 27.39 22.67 0.023 0.006 1.59 8E03XA 0.481 4.29 0.80 3.53 11.86 21.58 1.29 4.25 26.52 23.34 0.023 0.005 1.60 8C22XB 0.447 4.62 0.71 3.20 13.51 21.78 1.20 1.30 35.45 16.13 0.024 0.006 1.25 8C22XA 0.489 4.45 0.76 3.16 13.91 21.44 1.17 1.52 35.08 16.46 0.025 0.005 1.16 8B15XA 0.362 4.85 0.80 3.38 13.29 21.42 1.25 1.57 36.12 15.20 0.026 0.005 1.38 8B13XA 0.412 4.45 0.99 0.53 19.29 19.38 1.33 3.77 28.74 20.57 0.022 0.004 0.10 8A16XB 0.444 4.58 1.06 0.78 13.95 22.59 1.35 3.35 30.31 19.21 0.025 0.004 1.97 8A16XA 0.404 4.35 1.01 0.82 13.84 23.35 1.33 3.43 29.60 19.75 0.024 0.004 1.70 8A05XB 0.416 4.56 1.15 2.70 13.41 18.98 1.05 2.15 26.61 27.12 0.025 0.003 1.36 8A05XA 0.430 4.21 1.10 3.55 12.35 22.22 1.05 2.02 28.68 22.63 0.025 0.003 1.32 7L19XA 0.379 4.37 0.93 0.92 13.21 22.75 1.43 3.08 37.31 13.66 0.026 0.004 1.61 7L12XB 0.353 4.57 0.95 0.91 13.29 22.75 1.42 3.08 37.20 13.54 0.026 0.004 1.59 7L12XA 0.514 3.57 0.98 3.92 11.80 21.25 1.06 1.84 28.55 24.52 0.024 0.004 1.52 7L09XA 0.526 3.92 1.13 3.94 11.16 21.12 1.07 1.87 28.44 24.82 0.024 0.003 1.54
[0024] The J580 alloys listed in Table 1 have about 0.18 to about 0.55% C, about 3.5 to about 5% Si, about 0.2 to about 1.2% Mn, about 11 to about 20% Cr, about 13 to about 28% Fe, about 1 to about 1.5% W, about 18 to about 23% Mo, about 0.5 to about 4% Ni, about 26 to about 38% Co, about 1.5 to about 4.3%V, about 0.1 to about 2.3%Nb, balance unavoidable impurities including up to 0.035% P, up to 0.015% S and up to 0.250% N.
[0025] VSI ring samples were made using six of the heats (8E04XB, 8E03XB, 8C22XB, 8A16XB, 8A05XB, 7L12XA) listed in Table 1. These six VSI ring samples were evaluated for bulk hardness and radial crush strength. Per the alloy design concepts, the bulk hardness of J580 within the alloying elemental ranges investigated did not show significant hardness variation as a function of tempering temperature when the temperature is below 1500.degree. F. The tempering response tested using the samples made of the six heats (see Table 1) confirmed that there was no significant bulk hardness variation (as a non-allotropic system) in the J580 alloy heats. Nevertheless, it has been clearly demonstrated that several alloying elements had significant influences to J580 alloy system in terms of the level of bulk hardness can be achieved. With an assumption that cobalt and iron together can be treated as a combination of "primary matrix elements" in J580 alloy system, then, the effect of carbon, nickel, chromium, molybdenum, and vanadium to bulk hardness has been analyzed. Applying a linear regression method, Equation 1 provides an estimate of the average bulk hardness as a function of several alloying elements can be expressed as:
HRc.sub.bulk=71.6378+6.34391C-2.16431Ni-1.30782Cr+0.591747Mo-3.12869V Equation 1:
[0026] The test results for bulk hardness measurements as a function of tempering temperature are shown in FIG. 1. Table 2 lists the bulk hardness values for the six samples at various tempering temperatures. FIG. 2 shows a correlation between measured bulk hardness and calculated bulk hardness.
TABLE-US-00002 TABLE 2 Hardness Measurement Results Versus Tempering Temperature Tempering Temperature Bulk Hardness (HRc) .degree. F. .degree. C. 7L12XA 8A05XB 8A16XB 8C22XB 8E03XB 8E04XB 72 22 53.5 53.0 59.0 57.0 54.9 57.9 800 427 53.7 52.3 58.7 57.3 55.1 57.8 900 482 53.9 53.5 59.0 57.3 55.1 57.7 1000 538 53.4 52.9 59.0 57.4 55.4 57.6 1050 566 53.7 52.7 58.7 57.5 55.2 58.0 1100 593 53.3 52.8 59.0 57.1 55.7 57.2 1150 621 53.9 51.9 58.9 57.5 55.5 58.1 1200 649 53.2 53.1 58.1 57.2 55.4 57.4 1250 677 52.7 52.6 58.4 57.4 55.5 58.3 1300 704 52.6 52.3 58.2 57.6 55.6 58.5 1350 732 52.9 53.3 58.3 57.7 55.6 57.5 1400 760 53.8 53.2 59.0 57.4 55.7 57.6 1450 788 53.0 52.4 58.9 57.4 56.1 58.0 1500 816 53.1 52.9 58.9 57.5 55.2 57.6 Average 53.3 52.8 58.7 57.4 55.4 57.8
[0027] Table 3 summarizes the radial toughness measurement results for six heats of J580. The radial crush toughness as a function of tempering temperature for all six heats evaluated is shown in FIG. 3. As with the relationship between bulk hardness and tempering temperature, the radial crush test as a function of tempering temperature showed a similar trend for each heat involved. For a mathematic simulation purpose, an average radial crush test toughness index is applied to perform this linear regression study. Equation 2 provides an estimate of the radial crush toughness simulation results for J580 alloy system wherein alloying elements such as carbon, nickel, chromium, and vanadium are effective to enhance the toughness while molybdenum exhibits a negative effect to J580 radial crush toughness. In Equation 2, RCT is radial crush toughness. FIG. 4 shows a correlation between measured RCT and calculated RCT.
RCT=-1.55+0.265C+0.0683Ni+0.11Cr-0.00935Mo+0.0955V Equation 2:
TABLE-US-00003 TABLE 3 Radial Crush Toughness Versus Tempering Temperature Tempering Temperature Radial Crush Toughness Index (8.33 .times. 10.sup.-2 ft-lb) .degree. F. .degree. C. 7L12XA 8A05XB 8A16XB 8C22XB 8E03XB 8E04XB 72 22 0.337 0.312 0.200 0.285 0.272 0.124 800 427 0.314 0.337 0.216 0.248 0.261 0.121 900 482 0.325 0.298 0.204 0.263 0.256 0.128 1000 538 0.294 0.292 0.180 0.244 0.280 0.132 1050 566 0.309 0.359 0.186 0.279 0.277 0.128 1100 593 0.342 0.331 0.189 0.265 0.251 0.128 1150 621 0.339 0.351 0.188 0.265 0.247 0.131 1200 649 0.331 0.342 0.197 0.270 0.268 0.127 1250 677 0.316 0.341 0.204 0.262 0.248 0.121 1300 704 0.342 0.338 0.207 0.269 0.213 0.142 1350 732 0.327 0.309 0.210 0.314 0.254 0.163 1400 760 0.361 0.315 0.202 0.279 0.259 0.146 1450 788 0.383 0.314 0.182 0.247 0.228 0.126 1500 816 0.327 0.327 0.209 0.275 0.216 0.141 Average 0.332 0.326 0.198 0.269 0.252 0.133
[0028] For the J580 alloy system, the average radial crush toughness and average bulk hardness from ambient through 1500.degree. F. (816.degree. C.) showed a reasonably good correlation which can be expressed by Equation 3 (below) where Y represents average radial crush toughness and "x" represents average bulk hardness.
Y=0.0009x.sup.2-0.1221x+4.3741. Equation 3:
[0029] Within a bulk hardness range (HRc 50 to HRc 65) which is of most interest for the intended alloy applications, the radial crush toughness index value was within a range of 0.17 to 0.35 (8.33.times.10.sup.2 ft-lb) which is a suitable range for the intended alloy application. It is hinted by Equation 3, that an increase in bulk hardness of J580 decreases the radial crush toughness but at a non-linear and slower rate than the increment rate of bulk hardness. FIG. 5 shows a correlation between bulk hardness and RCT.
[0030] Dimensional stability tests were conducted to evaluate the J580 Alloy. The dimensional stability test conditions include 20 hours heat soaking at 1200.degree. F. followed by slow air cooling for the J580 alloy evaluation. The outer diameter ("OD") dimension was measured prior to and after the thermal treatment from two perpendicular radial orientations. For the dimensional stability test, an OD dimensional change smaller than 0.0005 inches is considered PASS. Table 4 summarizes the dimensional stability test results. It is clearly demonstrated that a sound dimensional stability is possessed in the J580 alloy.
TABLE-US-00004 TABLE 4 Dimensional Stability Test Results OD Dimensional Measurement Results (inch) Material: Reading Reading Reading Reading J580 Before Before After After Heat Thermal Thermal Thermal Thermal .DELTA. in .DELTA. in Result 8E03XB Treatment Treatment Treatment Treatment Reading Reading (Pass or Sample at 0.degree. at 90.degree. at 0.degree. at 90.degree. at 0.degree. at 90.degree. Fail) 1 1.93850 1.93760 1.93850 1.93780 0.00000 0.00020 Pass 2 1.93830 1.93840 1.93820 1.93845 -0.00010 0.00005 Pass 3 1.93830 1.93810 1.93825 1.93810 -0.00005 0.00000 Pass 4 1.93790 1.93870 1.93790 1.93865 0.00000 -0.00005 Pass 5 1.93820 1.93840 1.93820 1.93830 0.00000 -0.00010 Pass Average 1.93824 1.93824 1.93821 1.93826 -0.00003 0.00002 Pass * Thermal soaking condition - 20 hours at 1200.degree. F.
[0031] Table 5 summarizes the dilatometry analysis results for five heats of the J580 alloy along with typical thermal expansion coefficient for cobalt-based VSI alloys J3 and J10 (both available from L. E. Jones, the assignee of this application). It is clearly shown that the J580 heats possess similar CTEs as the J3 and J10 cobalt-based alloys. The temperature increment (or decrement) rate was 3.degree./min for all the tests. The information in Table 5 indicates that alloying elemental concentration investigated can affect thermal expansion and contraction behavior but the variations observed are relatively small. One of the primary factors affecting the level of thermal expansion and contraction behavior in the J580 alloy is the combined matrix elements, cobalt and iron along with the ratio of cobalt to iron.
TABLE-US-00005 TABLE 5 Thermal Expansion Coefficient For J3, J10, J580 Alloys in mm/mm.degree. C.: Reference Reporting Temperature Temperature (.degree. C.) (.degree. C.) 7L12XA 7L12XB 8A05XA 8A16XA 8B13XA J3 J10 25 100 12.2 11.2 12.2 11.6 11.7 10.9 10.6 25 200 12.8 11.7 12.9 12.8 12.8 12.1 11.6 25 300 13.1 12.0 13.2 13.1 13.1 12.5 11.9 25 400 13.3 12.3 13.4 13.2 13.3 12.9 12.2 25 500 13.6 12.6 13.6 13.4 13.5 13.2 12.5 25 600 14.0 12.9 13.9 13.7 13.9 13.4 12.8 25 700 14.3 13.3 14.1 14.0 14.4 13.9 13.3 25 800 14.5 13.6 14.3 14.3 14.8 14.3 13.7 25 900 14.7 13.8 14.5 14.4 15.1 14.3 14.0 25 1000 14.9 14.1 14.6 14.4 15.4 14.4 14.2
[0032] From on-heating and on-cooling behavior among J3 (FIG. 6), J10 (FIG. 7), and J580 (FIG. 8), it is evident that J10 and J580 showed similar behavior while J3 showed a slightly different behavior in terms of dimensional changing rate between on-heating and on-cooling portion of a thermal exposure. The space separating on-heating and on-cooling curve shown in J3 indicates that a significant permanent deformation has taken place during on-heating thermal soaking. On the contrary, J10 and J580 showed a very small gap between on-heating and on-cooling curves that is an indication of stable microstructures and no significant solid state phase transformation has taken place. From a general VSI dimensional stability consideration, the dimensional gap at the ambient after heating then cooling cycle is an indicator of an alloy dimensional stability for VSI applications.
[0033] Compressive yield strength and tensile strength were evaluated for the J580 alloy. Compressive yield strength is a desired property for VSI applications. Compared to an iron-based or nickel-based alloy, especially for iron-based alloys with martensitic or ferritic microstructures, there is a threshold temperature at which compressive yield strength tends to drop rapidly. One goal of the J580 alloy is to achieve sustained compressive yield strength comparable to nickel base alloys by forming a combined "iron+cobalt" base within a fully solid state temperature range. FIG. 9 shows a comparison of compressive yield strength as a function of temperature among J3, J10, J513, and J580. J580 (X75, Heat 8C22XA) showed a very good compressive yield strengths without rapid drop behavior within a range up to 650.degree. C. and, the compressive yield strength of J580 is generally greater than J3 within that temperature range.
[0034] In evaluating tensile strength of the J580 alloy, it was found that Alloy J580 (X75, Heat 8C22XA) showed a sustained tensile rupture strength up to 650.degree. C. It is at the lower end of the tensile strength band of the four alloys discussed. However, the tensile rupture strength curve as a function of temperature has clearly exhibited a sound tensile property that only slightly varies with testing temperature up to 650.degree. C. The tensile rupture strength behavior can be beneficial to VSI applications due to lower potential stress concentration induced by alloy microstructural distribution. A comparison of ultimate tensile rupture strength for alloys J580, J3, J10, and J513 is depicted in FIG. 10.
[0035] In an evaluation of corrosion resistance, VDA immersion and condensate corrosion tests were conducted with very strong mixed acids with a pH value at 1.2 and majority of the testing cycle (6 out of 7 days) includes holding test cell at 50.degree. C. For the 1.2 pH test, the testing solution was made based upon standard VDA test solution composition. For the 2.8 pH test, an L.E. Jones (LEJ) test solution was applied including sodium sulfate: 7800 ppm SO.sub.4.sup.-2; sodium nitrate: 1800 ppm NO.sub.3.sup.- which is adjusted with acetic acid (.about.5 g/L) for obtaining 2.8 pH. The testing cycle and procedure for the 2.8 pH test is identical to the 1.2 pH test. Among the group of VSI alloys evaluated, J580 along with J10, J133 and J153 possessed the lowest corrosion rate. Essentially, no corrosion could be measured from immersion testing or condensate testing for these four alloys.
[0036] For the 2.8 pH immersion and condensate corrosion tests, J580 again showed no measureable corrosion rate.
[0037] FIGS. 11A-B and FIGS. 12A-B show typical SEM microstructural morphology for J580 and J10, respectively. It should be noted that J580 showed significant high oxidation resistance and, it took more than 15 hours to etch with LEJ etchant to show the detail of the solidification substructure. However, some interdendritic areas (between Laves phase and eutectic phases) were etched out under the etching condition. On the other hand, J10 sample could be etched in a relative shorter time to show its microstructure. In addition, it should be noted that the magnification of FIGS. 11A-B and FIGS. 12A-B is different and micron markers are attached with these photos. Therefore, J580 possesses a significantly finer microstructure than J10 including the size of Laves phase. J10 is a Co-base alloy with about 60% Co, about 28% Mo, about 8% Cr, and about 2.5% Si. In FIG. 11B, Areas 1, 2 and 3 show Laves phases, Area 4 shows eutectic phases, and Area 5 shows an etched out area. Compared to J10, the Si content of the Laves phase in J580 is significantly higher than the Si content of the Laves phases of J10.
[0038] Experiments were carried out to evaluate castability of J580 and evaluate properties of J580 compared to J3 and J10 alloys available from L.E. Jones Co. The compositions of samples evaluated are set forth in the Table 6 below wherein "Rem" refers to remainder of unavoidable elements:
TABLE-US-00006 TABLE 6 J580 (Nos. 1-5), J3 and J10 Alloy Compositions No. Co Mo Cr Fe Si Ni V Mn Nb W C Rem. 1 36 22 13 13 5 5 1 0.8 1 1 0.3 Bal 2 39 27 13 13 5 1.75 0.8 1.25 1.25 0.3 Bal 3 35 22 13 13 5 5 1 0.8 1 1 0.3 Bal 4 35 26 13 13 5 1.75 0.8 1.25 1.25 0.3 Bal 5 35 23 16 15 5 1.75 0.8 1.25 0.3 Bal J3 50 30 1.5 0.5 0.3 0.3 13 2.4 Bal J10 60 28.5 8 2.4 Bal
[0039] The J580 alloys listed in Table 6 have about 0.3% C, 5% Si, 0.8% Mn, 13-16% Cr, 13-15% Fe, 1-1.25% W, 22-27% Mo, 0-5% Ni, 35-39% Co, 1-1.75%V, 1-1.25%Nb, balance unavoidable impurities including up to 0.035% P, up to 0.015% S and up to 0.250% N.
[0040] The following Table 7 sets forth bulk hardness (HRC), peak load (lbf), deformation (inch) and radial crush toughness (8.33 ft-lb) for the samples tested.
TABLE-US-00007 TABLE 7 Mechanical Properties of J580 Heats 1-3 and J10 Radial Crush Heat Bulk Hardness Peak Load Deformation Toughness 1 53 1463.8 0.0274 0.401 2 58.5 1066.8 0.0228 0.244 3 52 1357.6 0.0263 0.357 J10 57 631 0.0196 0.124
[0041] As shown above, J580 exhibits similar hardness to J10 but J580 exhibits better radial crush toughness. The alloys for Heats 1-3 and J10 were cast and examined. It was found that the 580 alloy exhibits a more homogenized (uniform) microhardness distribution compared to J10 whereas both samples exhibited similar bulk hardness. The more evenly distributed microhardness for J580 appears to be due to the finer microstructural distribution (both cobalt solid solution phase and Laves phase) compared to that of J10.
[0042] The J580 alloy compositional system can be designed to form a composite of Co-Fe face centered cubic (FCC) phase, Co--Mo--Cr--Si rich Laves phase, and small amount of carbides. A J580 sample made of Heat 8E11XB was used to conduct an x-ray diffraction assisted phase characterization. This heat was specifically made to examine a lower end of cobalt content (27.0 wt. %) for the alloy system. In addition, a higher end of iron content (23.5 wt. %) was also examined. The ratio of cobalt to iron is 1.15. The phase characterization was carried out with a SmartLab x-ray diffractometer at Rigaku and; the disk block samples with 1.25'' in diameter and 1/2'' of thickness were prepared at L. E. Jones. Both cobalt radiation and copper radiation sources were applied for this experiment and; with cobalt radiation, the x-ray diffraction spectrum resolution was significantly better than that with copper.
[0043] Two different crystalline phase quantification methods (DD and RIR) were applied and both methods were in agreement upon the identification of four major crystalline phases namely, FCC (austenite), MoFe.sub.2 Laves phase, Martensite, and Mo.sub.6Co.sub.6C carbides. Considering the results from both DD and RIR methods, the heat sample contains greater than 59% and up to 74% FCC phase and 4.9% to 13.0% martensitic phase. Therefore, the amount of austenite (FCC) plus martensite together is more than 72% or 78.9%. This is higher than the desired/expected value for the alloy system.
[0044] In the evaluation of Heats 1-3, Heat 1 was found to exhibit a binary-phase matrix and the total amount of MC carbide formers is approximately 3 wt. %. Heat 2 was found to exhibit a three-phase matrix and the total amount of carbide formers is approximately 4.25%. Heat 3 was found to exhibit a three-phase matrix and the total amount of primary MC type carbide formers is approximately 3%. Heat 3 exhibits a three-phase domain solidification substructural distribution similar to Heat 2 but with over two times more Fe than Heat 2.
[0045] The microstructures of Heats 1-3 can be summarized as follows: Heat 1 has about 34 vol. % primary intermetallic and about 66 vol. % Co solid solution; Heat 2 has about 24 vol. % secondary intermetallic, about 48 vol. % primary intermetallic and about 28 vol. % C solid solution; and Heat 3 has about 37 vol. % secondary intermetallic, about 45 vol. % primary intermetallic and about 18 vol. % Co solid solution.
[0046] Plint wear tests summarized in Table 8 were carried out with three different heats of J580 alloy samples paired with Crutonite valve material. A standard Plint testing condition including 20N applied load, 20 Hz reciprocating frequency, 1mm stroke length, and 100,000 total testing cycles. The test temperatures for each materials pair include 23.degree. C., 50.degree. C., 100.degree. C., 150.degree. C., 200.degree. C., 250.degree. C., 300.degree. C., 350.degree. C., 400.degree. C., 450.degree. C. and 500.degree. C. The mass change of both pin and plate specimens were determined by weighing pin and plate specimens before and after a test.
TABLE-US-00008 TABLE 8 Summary of Plint Wear Test Results J580 J580 J580 Temperature J10 (8A16XA) (8E03XA) (8E04XA) (.degree. C.) (1J10A) X75-4 X75-6 X75-7 Pin Specimen Wear 23 0.4 0.5 0.2 0.6 50 0.6 0.9 0.6 0.8 100 0.6 0.8 0.7 0.9 150 0.9 0.9 1.1 1.0 200 1.1 0.9 1.2 1.0 250 1.0 1.0 1.1 1.1 300 1.4 1.1 1.5 1.2 350 1.9 0.4 1.1 1.0 400 1.4 0.3 0.6 0.3 450 0.8 0.2 0.5 0.1 500 0.3 0.0 0.0 0.0 Plate Specimen Wear 23 1.6 1.4 1.2 1.2 50 1.0 1.4 1.4 1.0 100 1.0 1.1 1.4 1.0 150 1.2 1.2 1.4 1.2 200 1.2 1.1 2.3 1.5 250 1.4 1.3 2.3 1.8 300 1.0 1.5 2.7 2.4 350 0.5 1.2 2.0 2.5 400 0.8 1.0 2.0 1.6 450 1.2 0.5 1.5 0.9 500 0.7 0.5 0.6 0.6
[0047] The Plint wear test results for pin, plate, and total materials wear as a function of testing temperature are shown in FIG. 13, FIG. 14 and FIG. 15, respectively wherein Curves A-D correspond to alloys J10 (1J10A), J580 (8A16XAA), J580 (8E03XA), and J580 (8E04XA), respectively. Among four materials pairs tested for this project, three are related to J580 pin materials (three different heats) and one is related to J10 pin material. All the plate specimens were extracted from Crutonite valves. All four materials pairs, in general, showed a reasonable pin to plate wear ratio for engine valvetrain applications along with amount of materials wear based upon general L. E. Jones Plint wear test criteria. Comparatively, the overall best wear resistance is from J580 (8A16XA) vs Crutonite materials pair.
[0048] Fourteen additional alloy compositions and HRc test results are set forth in the following Table 9. Table 10 provides bulk hardness versus tempering temperature data for seven of the alloys listed in Table 9.
TABLE-US-00009 TABLE 9 Examples of J580 Alloy Compositions in Weight % Heat No. C Si Mn Ni Cr Mo W V Co Fe Nb HRc 9A02XA 0.482 3.88 0.356 1.17 20.21 28.35 1.54 5.29 29.80 7.34 1.13 60.3 9A03XA 0.308 4.41 0.249 4.18 14.08 22.26 2.26 1.76 33.19 16.08 0.60 57.0 9A03XB 0.520 4.49 0.406 4.92 13.28 22.31 2.01 3.79 22.26 24.06 1.32 57.1 9A03XC 0.520 4.49 0.465 6.94 13.27 21.82 2.33 4.14 20.82 23.22 1.33 50.6 9A03XD 0.520 4.39 0.366 8.84 13.43 21.96 2.19 4.16 22.71 19.46 1.32 54.3 9A04XA 0.560 4.57 0.345 10.58 13.45 22.29 3.24 3.97 21.46 17.98 1.30 47.4 9A04XB 0.570 4.42 0.386 12.03 13.85 21.70 3.24 3.82 20.56 17.86 1.09 49.2 9B05XA 0.530 3.71 0.570 0 13.31 19.02 2.30 4.71 22.07 31.27 1.79 58.8 9B05XB 0.212 5.02 0.520 0 13.30 23.73 1.58 1.39 33.30 19.07 1.32 56.7 9B06XA 0.530 4.24 0.357 12.31 13.92 22.31 3.24 3.31 21.37 15.68 2.05 51.5 9B22XA 0.540 4.07 0.313 12.40 13.92 23.29 3.24 3.26 21.48 15.82 2.00 48.8 9C15XA 0.355 4.72 0.224 17.04 15.39 22.71 3.22 1.52 21.35 12.16 0.66 50.8 9C15XB 0.296 4.76 0.286 9.80 14.95 22.52 2.91 1.62 25.89 15.70 0.63 53.6 9C15XC 0.312 4.63 0.312 0 14.74 22.26 2.57 1.80 34.37 17.64 0.65 59.4
TABLE-US-00010 TABLE 10 Summary of bulk hardness as a function of tempering temperature Temper Temperature Bulk Hardness vs Tempering Temperature (HRc) (.degree. F.) 9A02XA 9A03XA 9A03XB 9A03XC 9A03XD 9A04XA 9A04XB 72 61.4 57.8 57.6 55.0 54.9 49.2 49.2 800 61.0 57.6 57.3 54.7 55.2 49.9 49.4 900 61.2 57.5 57.6 55.0 55.2 49.6 49.9 1000 61.4 57.4 57.8 53.5 54.9 49.2 49.5 1050 61.7 57.4 57.7 53.3 55.0 49.3 49.3 1100 61.1 57.5 57.7 54.0 54.9 49.1 49.5 1150 61.4 57.3 57.6 53.4 54.9 49.2 49.2 1200 61.2 57.3 57.5 54.3 55.2 48.8 49.2 1250 61.0 57.5 57.3 54.4 55.2 48.6 48.8 1300 61.3 57.4 57.5 54.6 54.0 49.3 49.5 1350 60.7 57.7 57.5 55.1 55.0 48.7 49.2 1400 61.2 57.5 57.6 55.2 54.9 49.1 49.2 1450 61.5 57.3 58.0 54.9 54.9 49.5 48.9 1500 61.8 57.7 57.8 53.7 54.6 50.0 48.8
[0049] The J580 alloys listed in Table 9 have about 0.2 to about 0.6% C, about 3.5 to about 5% Si, about 0.2 to about 0.6% Mn, about 13 to about 20% Cr, about 7 to about 32% Fe, about 1 to about 1.5% W, about 19 to about 29% Mo, 0 to about 17% Ni, about 20 to about 35% Co, about 1.3 to about 5.3% V, about 0.6 to about 2.1% Nb, balance unavoidable impurities including up to 0.035% P, up to 0.015% S and up to 0.250% N.
[0050] The bulk hardness data listed in Table 10 is depicted in FIG. 16 wherein Curves A-G correspond to alloys 9A02XA, 9A03XA, 9A03XB, 9A03XC, 9A03XD, 9A04XA and 9A04XB, respectively. The test results indicate that tempering temperature does not significantly affect bulk hardness for the J580 heats tested.
[0051] Table 11 lists the results of radial crush toughness (RCT) testing on alloys 9A02XA, 9A03XA, 9A03XB, 9A03XC, 9A03XD, 9A04XA and 9A04XB. FIG. 17 illustrates the RCT test data wherein Curves A-G correspond to alloys 9A02XA, 9A03XA, 9A03XB, 9A03XC, 9A03XD, 9A04XA and 9A04XB, respectively. As shown, heat 9A03XA exhibited the highest overall radial crush toughness compared to the other heats tested.
TABLE-US-00011 TABLE 11 Summary of radial crush toughness vs tempering temperature Temper Temperature Radial Crush Toughness (8.33 .times. 10.sup.-2) (.degree. F.) 9A02XA 9A03XA 9A03XB 9A03XC 9A03XD 9A04XA 9A04XB 72 0.311 0.285 0.210 0.193 0.205 0.176 0.184 800 0.207 0.348 0.213 0.184 0.213 0.191 0.196 900 0.139 0.324 0.210 0.162 0.217 0.184 0.200 1000 0.159 0.301 0.211 0.184 0.227 0.185 0.209 1050 0.173 0.250 0.192 0.220 0.203 0.189 0.192 1100 0.173 0.342 0.203 0.189 0.186 0.187 0.176 1150 0.175 0.274 0.204 0.175 0.216 0.199 0.206 1200 0.189 0.348 0.281 0.196 0.225 0.205 0.204 1250 0.227 0.256 0.230 0.174 0.230 0.177 0.179 1300 0.254 0.256 0.217 0.206 0.222 0.176 0.182 1350 0.224 0.245 0.224 0.195 0.214 0.187 0.207 1400 0.170 0.273 0.206 0.196 0.245 0.199 0.217 1450 0.194 0.265 0.219 0.202 0.248 0.211 0.226 1500 0.181 0.280 0.188 0.268 0.283 0.183 0.217
[0052] Multiple linear regression was made using bulk hardness and radial crush toughness as a function of alloying elements for the J580 alloy. For bulk hardness, Equations 4 and 5 were obtained from the regression process wherein the elements in parenthesis represent the amount of each element:
HRc=-479+57.0(C)-11.8(Mn)+15.0(Si)+5 (Ni)+10.7(Cr)+0.65(Mo)-5.15(W)+1.13(V)+5.6(Co)+5.3(Fe)+11.8(Nb). Equation 4:
RCT=-0.1038-2.283(C)+1.478(Mn)-0.1123(Si)+0.03739(Ni)-0.07174(Cr)+0.0968- 5(Mo). Equation 5:
[0053] As shown in Equation 5, increasing Mn, Ni and Mo and/or lowering C, Si and Cr contents can increase the radial crush toughness.
[0054] Five Experimental Heats, 8A05XA, 8B13XA, 8C22XA, 8E03XA, and 8E04XA were tested to evaluate tensile rupture strength. The compositions and tensile test results for these heats are summarized in Table 12 and Table 13, respectively. Iron contents of these J580 heats are within a range of about 16 to about 24 wt. %. In comparison to the J580 alloy, commercial TRIBALOYS T400 and T800 have a substantially lower iron content (<3 wt. %) along with much higher cobalt content (60 wt. % Co and 51 wt. % Co for T400 and T800, respectively) as listed in Table 14.
TABLE-US-00012 TABLE 12 Composition of Experimental Heats Heat C Si Mn Ni Cr Mo W V Co Fe S Nb 8A05XA 0.430 4.21 1.10 3.55 12.35 22.22 1.05 2.02 28.68 22.63 0.003 1.32 8B13XA 0.412 4.45 0.99 0.53 19.29 19.38 1.33 3.77 28.74 20.57 0.004 0.10 8C22XA 0.489 4.45 0.76 3.16 13.91 21.44 1.17 1.52 35.08 16.46 0.005 1.16 8E03XA 0.481 4.29 0.80 3.53 11.86 21.58 1.29 4.25 26.52 23.34 0.005 1.60 8E04XA 0.187 3.84 0.95 0.74 14.83 21.89 1.39 3.79 30.93 19.08 0.005 1.95 The P contents of the above alloy heats were 0.025%, 0.022%, 0.025%, 0.023% and 0.027%, respectively.
TABLE-US-00013 TABLE 13 Summary of Tensile Rupture Strength Results Test Temperature UTS (ksi) .degree. F. 8A05XA 8B13XA 8C22XA 8E03XA 8E04XA 72 85.6 55.2 99.8 64.0 21.4 200 81.9 56.0 90.7 55.6 41.6 400 72.9 44.5 79.6 50.7 23.1 600 71.0 54.8 106.6 52.8 29.4 800 69.5 48.7 92.5 52.1 41.1 1000 80.3 55.6 90.6 59.3 31.4 1100 75.4 58.6 88.3 64.5 18.9 1200 80.8 38.5 110.2 51.6 8.1
TABLE-US-00014 TABLE 14 Nominal Composition of Commercial Tribaloys T400 and T800 Co Cr Mo Si at % at. % at. % at. % C Alloys (wt. %) (wt %) (wt. %) (wt %) (wt %) Others T400 Bal. 10.4 18.8 5.9 (<0.1) Ni, Fe (8.5) (28.5) (2.6) T800 Bal. 20.8 18.4 7.7 (<0.1) Ni, Fe (17.5) (28.5) (3.5)
[0055] The J580 alloys listed in Table 12 have about 0.18 to about 0.5% C, about 3.8 to about 4.5% Si, about 0.7 to about 1.1% Mn, about 11 to about 20% Cr, about 16 to about 24% Fe, about 1 to about 1.4% W, about 19 to about 23% Mo, about 0.5 to about 4% Ni, about 26 to about 35% Co, about 1.5 to about 4.3%V, about 0.1 to about 2% Nb, balance unavoidable impurities including up to 0.035% P, up to 0.015% S and up to 0.250% N.
[0056] For the intended alloy applications, the ultimate tensile strength (UTS) is preferably equal to or greater than 50.0 ksi at ambient and elevated temperatures is preferred. Referring to Tables 11 and 12, when the C+Si content is greater than 4.86 wt. %, it is possible to achieve 50.0 ksi UTS from ambient through 1200.degree. F. Therefore, the carbon+silicon content in Heat 8E04XA will not achieve the preferred 50 ksi UTS. In addition, to achieve 50 ksi UTS, the carbon content should be greater than 0.187 wt. %. FIG. 18 plots UTS versus test temperature for heats 8A05XA (Curve A), 8B13XA (Curve B), 8E03XA (Curve C), 8E04XA (Curve D), and 8C22XA (Curve E). The effect of low carbon and carbon plus silicon on reducing the tensile rupture strength of the J580 alloy system can be seen by Curve D in FIG. 18.
[0057] Based on the properties of Heat 8B13XA, in order to attain the preferred 50 ksi UTS, several conditions must be met: (1) adding a predetermined amount of carbon; (2) adding a predetermined amount of carbon plus silicon; and/or (3) adding a predetermined amount of niobium. For example, a preferred niobium content is within a range of about 1.60 wt. % to about 1.95 wt. % in order to obtain a UTS greater than 50 ksi at 1200.degree. F.
[0058] The J580 alloy includes C, Mn, Si, Cr, Fe, W, Mo, V and/or Nb, Co, optional Ni, and unavoidable impurities. In general, the J580 alloy can include: C in any amount falling within the range of 0.1 to 0.8%, Mn in any amount falling within the range of 0.1 to 1.5%, Si in any amount falling within the range of 3 to 5%, Cr in any amount falling within the range of 10 to 20%, Fe in any amount falling within the range of 5 to 32%, W in any amount falling within the range of 0.5 to 4%, Mo in any amount falling within the range of 10 to 30%, Ni in any amount falling within the range of 0 to 20%, Co in any amount falling within the range of 20 to 40%, V in any amount falling within the range of 0 to 6%, Nb in any amount falling within the range of 0 to 3%, total V plus Nb in any amount falling within the range of 0.5 to 8.5%, balance unavoidable impurities including up to 0.035% P, up to 0.015% S and up to 0.250% N. For example, the J580 alloy can include C in any amount falling within the ranges of 0.1-0.2%, 0.2-0.3%, 0.3-0.4%, 0.4-0.5%, 0.5-0.6%, 0.6-0.7%, or 0.7-0.8%; Mn in any amount falling within the ranges of 0.1-0.2%, 0.2-0.3%, 0.3-0.4%, 0.4-0.5%, 0.5-0.6%, 0.6-0.7%, 0.7-0.8%, 0.8-0.9%, 0.9-1.0%, 1.0-1.1%, 1.1-1.2%, 1.2-1.3%, 1.3-1.4%,or 1.4-1.5%; Si in any amount falling within the ranges of 3.0-3.1%, 3.1-3.2%, 3.3-3.4%, 3.4-3.5%, 3.5-3.6%, 3.6-3.7%, 3.7-3.8%, 3.8-3.9%, 3.9-4.0%, 4.0-4.1%, 4.1-4.2%, 4.3-4.4%, 4.4-4.5%, 4.5-4.6%, 4.6-4.7%, 4.7-4.8%, 4.8-4.9%, or 4.9-5.0%; Cr in any amount falling within the ranges of 10-11%, 11-12%, 12-13%, 13-14%, 14-15%, 15-16%, 16-17%, 17-18%, 18-19%, or 19-20%; Fe in any amount falling within the ranges of 5-6%, 6-7%, 7-8%, 8-9%, 9-10%, 10-11%, 11-12%, 12-13%, 13-14%, 14-15%, 15-16%, 16-17%, 17-18%, 18-19%, 19-20%, 20-21%, 21-22%, 22-23%, 23-24%, 24-25%, 25-26%, 26-27%, 27-28%, 28-29%, 29-30%, 30-31%, or 31-32%; Win any amount falling within the ranges of 0.5-0.6%, 0.6-0.7%, 0.7-0.8%, 0.8-0.9%, 0.9-1.0%, 1.0-1.1%, 1.1-1.2%, 1.2-1.3%, 1.3-1.4%, 1.4-1.5%, 1.5-1.6%, 1.6-1.7%, 1.7-1.8%, 1.8-1.9%, 1.9-2.0%, 2.0-2.1%, 2.1-2.2%, 2.3-2.4%, 2.4-2.5%, 2.5-2.6%, 2.6-2.7%, 2.7-2.8%, 2.8-2.9%, 2.9-3.0%, 3.0-3.1%, 3.1-3.2%, 3.3-3.4%, 3.4-3.5%, 3.5-3.6%, 3.6-3.7%, 3.7-3.8%, 3.8-3.9%, or 3.9-4.0%; Mo in any amount falling within the ranges of 10-11%, 11-12%, 12-13%, 13-14%, 14-15%, 15-16%, 16-17%, 17-18%, 18-19%, 19-20%, 20-21%, 21-22%, 22-23%, 23-24%, 24-25%, 25-26%, 26-27%, 27-28%, 28-29%, 29-30%, 30-31%, 31-32%, 32-33%, 33-34%, 34-35%, 35-36%, 36-37%, 37-38%, 38-39%, or 39-40%; Ni in any amount falling within the ranges of 0-1%,1-2%, 2-3%, 3-4%, 4-5%, 5-6%, 6-7%, 7-8%, 8-9%, 9-10%, 10-11%, 11-12%, 12-13%, 13-14%, 14-15%, 15-16%, 16-17%, 17-18%, 18-19%, or 19-20%; Co in any amount falling within the ranges of 20-21%, 21-22%, 22-23%, 23-24%, 24-25%, 25-26%, 26-27%, 27-28%, 28-29%, 29-30%, 30-31%, 31-32%, 32-33%, 33-34%, 34-35%, 35-36%, 36-37%, 37-38%, 38-39%, or 39-40%; V in any amount falling within the ranges of 0-0.1%, 0.1-0.2%, 0.2-0.3%, 0.3-0.4%, 0.4-0.5%, 0.5-0.6%, 0.6-0.7%, 0.7-0.8%, 0.8-0.9%, 0.9-1.0%, 1.0-1.1%, 1.1-1.2%, 1.2-1.3%, 1.3-1.4%, 1.4-1.5%, 1.5-1.6%, 1.6-1.7%, 1.7-1.8%, 1.8-1.9%, 1.9-2.0%, 2.0-2.1%, 2.1-2.2%, 2.3-2.4%, 2.4-2.5%, 2.5-2.6%, 2.6-2.7%, 2.7-2.8%, 2.8-2.9%, 2.9-3.0%, 3.0-3.1%, 3.1-3.2%, 3.3-3.4%, 3.4-3.5%, 3.5-3.6%, 3.6-3.7%, 3.7-3.8%, 3.8-3.9%, 3.9-4.0%; 4.0-4.1%, 4.1-4.2%, 4.3-4.4%, 4.4-4.5%, 4.5-4.6%, 4.6-4.7%, 4.7-4.8%, 4.8-4.9%, 4.9-5.0%, 5.0-5.1%, 5.1-5.2%, 5.3-5.4%, 5.4-5.5%, 5.5-5.6%, 5.6-5.7%, 5.7-5.8%, 5.8-5.9%, 5.9-6.0%; Nb in any amount falling within the ranges of 0-0.1%, 0.1-0.2%, 0.2-0.3%, 0.3-0.4%, 0.4-0.5%, 0.5-0.6%, 0.6-0.7%, 0.7-0.8%, 0.8-0.9%, 0.9-1.0%, 1.0-1.1%, 1.1-1.2%, 1.2-1.3%, 1.3-1.4%, 1.4-1.5%, 1.5-1.6%, 1.6-1.7%, 1.7-1.8%, 1.8-1.9%, 1.9-2.0%, 2.0-2.1%, 2.1-2.2%, 2.3-2.4%, 2.4-2.5%, 2.5-2.6%, 2.6-2.7%, 2.7-2.8%, 2.8-2.9%, or 2.9-3.0%; total V plus Nb in any amount falling within the ranges of 0.5-1.0%, 1.0-1.5%, 1.5-2.0%, 2.0-2.5%, 2.5-3.0%, 3.0-3.5%, 3.5-4.0%, 4.0-4.5%, 4.5-5.0%, 5-5.5.0%, 5.5-6.0%, 6.0-6.5%, 6.5-7.0%, 7.0-7.5%, 7.5-8.0%, or 8.0-8.5%, balance unavoidable impurities including up to 0.035% P, up to 0.015% S and up to 0.250% N.
[0059] In order to achieve tensile rupture strengths of at least about 50 ksi over a temperature range of room temperature to 1200.degree. F., the J580 alloy can have about 0.4 to about 0.6% C, about 4.0 to about 5.0% Si, about 0.7 to about 1.2% Mn, about 0.5 to about 4.0% Ni, about 11 to about 20% Cr, about 19 to about 23% Mo, about 1.0 to about 1.5% W, about 1.5 to about 4.5% V, about 26 to about 35% Co, about 16 to about 24% Fe, about 0.1 to about 1.6% Nb, balance unavoidable impurities including up to 0.035% P, up to 0.015% S and up to 0.250% N. To achieve tensile rupture strengths of at least about 70 ksi over a temperature range of room temperature to 1200.degree. F., the J580 alloy can have about 0.45 to about 0.55% C, about 4.2 to about 4.7% Si, about 0.7 to about 0.8% Mn, about 2.5 to about 3.5% Ni, about 13 to about 15% Cr, about 21 to about 22% Mo, about 1.1 to about 1.3% W, about 1.3 to about 1.7% V, about 33 to about 37% Co, about 15 to about 18% Fe, about 1.0 to about 1.4% Nb, total V plus Nb of about 2.5 to about 2.9%, balance unavoidable impurities including up to 0.035% P, up to 0.015% S and up to 0.250% N.
[0060] The preferred embodiments are merely illustrative and should not be considered restrictive in any way. The scope of the invention is given by the appended claims, rather than the preceding description, and all variations and equivalents which fall within the range of the claims are intended to be embraced therein.
* * * * *
D00000
D00001
D00002
D00003
D00004
D00005
D00006
D00007
D00008
D00009
D00010
XML
uspto.report is an independent third-party trademark research tool that is not affiliated, endorsed, or sponsored by the United States Patent and Trademark Office (USPTO) or any other governmental organization. The information provided by uspto.report is based on publicly available data at the time of writing and is intended for informational purposes only.
While we strive to provide accurate and up-to-date information, we do not guarantee the accuracy, completeness, reliability, or suitability of the information displayed on this site. The use of this site is at your own risk. Any reliance you place on such information is therefore strictly at your own risk.
All official trademark data, including owner information, should be verified by visiting the official USPTO website at www.uspto.gov. This site is not intended to replace professional legal advice and should not be used as a substitute for consulting with a legal professional who is knowledgeable about trademark law.