Materials And Methods For Stratifying And Treating Cancers
Lee; Alex ; et al.
U.S. patent application number 16/637975 was filed with the patent office on 2021-01-14 for materials and methods for stratifying and treating cancers. The applicant listed for this patent is The Institute of Cancer Research Royal Cancer Hospital, The Royal Marsden NHS Foundation Trust. Invention is credited to Maggie Cheang, Paul Huang, Robin Jones, Alex Lee.
| Application Number | 20210010085 16/637975 |
| Document ID | / |
| Family ID | 1000005153354 |
| Filed Date | 2021-01-14 |


View All Diagrams
| United States Patent Application | 20210010085 |
| Kind Code | A1 |
| Lee; Alex ; et al. | January 14, 2021 |
MATERIALS AND METHODS FOR STRATIFYING AND TREATING CANCERS
Abstract
The present invention relates to materials and methods for stratifying and treating cancers and to methods of identifying/selecting patients for treatment of cancer with tyrosine kinase inhibitors. Gene expression profiles, TP53 mutations and FGFR1 and PDGFRA expression are used to identify/select/stratify the cancers and patients.
| Inventors: | Lee; Alex; (London, Greater London, GB) ; Huang; Paul; (London, Greater London, GB) ; Cheang; Maggie; (London, Greater London, GB) ; Jones; Robin; (London, Greater London, GB) | ||||||||||
| Applicant: |
|
||||||||||
|---|---|---|---|---|---|---|---|---|---|---|---|
| Family ID: | 1000005153354 | ||||||||||
| Appl. No.: | 16/637975 | ||||||||||
| Filed: | August 10, 2018 | ||||||||||
| PCT Filed: | August 10, 2018 | ||||||||||
| PCT NO: | PCT/EP2018/071758 | ||||||||||
| 371 Date: | February 10, 2020 |
| Current U.S. Class: | 1/1 |
| Current CPC Class: | A61P 35/00 20180101; C07K 2317/21 20130101; C07K 16/2863 20130101; C12Q 2600/106 20130101; C12Q 1/6886 20130101; A61K 31/506 20130101; C12Q 2600/158 20130101 |
| International Class: | C12Q 1/6886 20060101 C12Q001/6886; A61K 31/506 20060101 A61K031/506; C07K 16/28 20060101 C07K016/28; A61P 35/00 20060101 A61P035/00 |
Foreign Application Data
| Date | Code | Application Number |
|---|---|---|
| Aug 10, 2017 | GB | 1712871.1 |
| May 31, 2018 | GB | 1808941.7 |
Claims
1. A method of selecting an individual with cancer for treatment with a TKI, the method comprising: (a) determining the expression levels in a biological sample obtained from the individual of 40 or more of the genes selected from table 4, wherein said biological sample comprises cells, nucleic acids and/or proteins from cancer, and (b) selecting an individual for treatment with the TKI based on the expression levels of those genes.
2. A method according to claim 1, wherein the expression levels of the 40 or more of the genes determined in said step (a) may be compared with: (i) a first reference centroid corresponding to the expression profile of said 40 or more genes determined in a first group of subjects known to have cancer with PDGFRA-Hi/FGFR1-Lo expression; (ii) a second reference centroid corresponding to the expression profile of said 40 or more genes determined in a second group of subjects known to have cancer with (a) mutant TP53 and (b) PDGFRA/FGFR1 expression that is not PDGFRA-Hi/FGFR1-Lo; (iii) a third reference centroid corresponding to the expression profile of said 40 or more genes determined in a third group of subjects known to have cancer with (a) a gene expression profile having a closer match to the centroid of subgroup A shown in table 3 than subgroups B or C, and (b) TP53 wildtype, and (c) PDGFRA/FGFR1 expression that is not PDGFRA-Hi/FGFR1-Lo; (iv) a fourth reference centroid corresponding to the expression profile of said 40 or more genes determined in a fourth group of subjects known to have cancer with (a a gene expression profile having a closer match to the centroid of subgroup B shown in table 3 than subgroups A or C, and (b) TP53 wildtype, and (c) PDGFRA/FGFR1 expression that is not PDGFRA-Hi/FGFR1-Lo; and (v) a fifth reference centroid corresponding to the expression profile of said 40 or more genes determined in a fifth group of subjects known to have cancer with (a) a gene expression profile having a closer match to the centroid of subgroup C shown in table 3 than subgroups A or B, and (b) TP53 wildtype, and (c) PDGFRA/FGFR1 expression that is not PDGFRA-Hi/FGFR1-Lo; wherein the individual is selected for treatment with the TKI in step (b) when the expression levels determined in said step (a) of the 40 or more genes are a closer match to said third reference centroid than said first, second, fourth or fifth reference centroids.
3. The method of claim 2, wherein the PDGFRA/FGFR1 expression is PDGFRA-Hi/FGFR1-Hi or PDGFRA-Lo/FGFR1-Lo or PDGFRA-Lo/FGFR1-Hi.
4. The method of claim 1, wherein step (b) comprises selecting the individual for treatment with a TKI if the expression levels of the 40 or more of the genes determined in said step (a) are a closer match to the reference centroid A(3) shown in table 6, than any of reference centroids IHC+(1), TP53(2), B(4), C(5)) shown in table 6.
5. The method according to claim 1 wherein the expression levels of at least 40, at least 45, at least 50, at least 6, at least 70, at least 80, at least 90, at least 100, at least 110, at least 120, at least 130, at least 240, at least 150, at least 160, at least 170, at least 180, at least 190, at least 200, at least 210, at least 220 or all 225 of the genes in table 4 are determined.
6. The method according to claim 1 wherein the expression levels determined in step (a) are the nucleic acid expression levels.
7. The method according to claim 6, wherein the expression levels are determined using an RNA microarray, Nanostring technology, RNA-Seq or quantitative PCR.
8-33. (canceled)
34. The method according to claim 1 further comprising the step of obtaining the sample of cancer cells, nucleic acids and/or proteins from the individual, wherein the biological sample is obtained from tissue, cells or fluid from the individual.
35. (canceled)
36. (canceled)
37. A method of treating cancer with a tyrosine kinase inhibitor (TKI) in an individual in need thereof, wherein the individual has been selected for treatment according to claim 1.
38. (canceled)
39. (canceled)
40. (canceled)
41. The method according to claim 37 wherein the cancer is selected from: soft tissues sarcoma (STS), metastatic renal cell carcinomas (mRCC), gastrointestinal stromal tumour (GIST), hepatocellular carcinoma (HCC), neuroendocrine tumour (NET), medullary thyroid cancer (MTC), non-squamous non-small cell lung cancer (non-squamous NSCLC), and chronic myeloid leukaemia (CML).
42. The method according to claim 41, wherein the cancer is STS or advanced STS.
43. (canceled)
44. The method according to claim 37 wherein the TKI is selected from: Pazopanib, Regorafenib, Sorafenib, Sunitinib, Lenvatinib, Axitinib, Nintedanib, and Ponatinib, and pharmaceutically acceptable salts thereof.
45. The method according to claim 44 wherein the TKI is Pazopanib.
46. The method according to claim 37 wherein the TKI is Pazopanib and the cancer is soft tissue sarcoma or advanced soft tissue sarcoma.
47. (canceled)
48. A kit for use in identifying a cancer suitable for treatment with a TKI, the kit comprising probes for detecting the expression levels of at least 40 at least 45, at least 50, at least 60, at least 70, at least 80, at least 90, at least 100, at least 110, at least 120, at least 130, at least 240, at least 150, at least 160, at least 170, at least 180, at least 190, at least 200, at least 210, at least 220 or all 225 of the genes in table 4.
49-53. (canceled)
54. A method of determining a prognosis following TKI treatment in an individual, the method comprising determining the expression levels of 40 or more genes from table 4.
55. The method according to claim 54 wherein the individual is determined to have a good prognosis following TKI treatment if they have a cancer having the expression levels of the 40 or more genes in table 4 a closer match to a third reference centroid than said first, second, fourth or fifth reference centroids, wherein the reference centroids are: (a) a first reference centroid corresponding to the expression profile of said 40 or more genes determined in a first group of subjects known to have cancer with PDGFRA-Hi/FGFR1-Lo expression; (b) a second reference centroid corresponding to the expression profile of said 40 or more genes determined in a second group of subjects known to have cancer with mutated TP53 and PDGFRA/FGFR1 expression that is not PDGFRA-Hi/FGFR1-Lo expression; (c) a third reference centroid corresponding to the expression profile of said 40 or more genes determined in a third group of subjects known to have cancer with (a) a gene expression profile having a closer match to the centroid of subgroup A shown in table 3 than subgroups B or C, and (b) TP53 wild-type, and (c) PDGFRA/FGFR1 expression that is not PDGFRA-Hi/FGFR1-Lo expression; (d) a fourth reference centroid corresponding to the expression profile of said 40 or more genes determined in a fourth group of subjects known to have cancer with (a) a gene expression profile having a closer match to the centroid of subgroup B shown in table 3 than subgroups A or C, and (b) TP53 wild-type, and (c) PDGFRA/FGFR1 expression that is not PDGFRA-Hi/FGFR1-Lo expression; and (e) a fifth reference centroid corresponding to the expression profile of said 40 or more genes determined in a fifth group of subjects known to have cancer with (a) a gene expression profile having a closer match to the centroid of subgroup C shown in table 3 than subgroups A or B, and (b) TP53 wild-type, and (c) PDGFRA/FGFR1 expression that is not PDGFRA-Hi/FGFR1-Lo expression.
56. The method according to claim 54 wherein the individual is determined to have a poor prognosis if they have a cancer having the expression levels of the 40 or more genes in table 4 a closer match to a first, second, fourth or fifth reference centroid than a third reference centroids, wherein the reference centroids are: (a) a first reference centroid corresponding to the expression profile of said 40 or more genes determined in a first group of subjects known to have cancer with PDGFRA-Hi/FGFR1-Lo expression; (b) a second reference centroid corresponding to the expression profile of said 40 or more genes determined in a second group of subjects known to have cancer with mutated TP53 and PDGFRA/FGFR1 expression that is not PDGFRA-Hi/FGFR1-Lo expression; (c) a third reference centroid corresponding to the expression profile of said 40 or more genes determined in a third group of subjects known to have cancer with (a) a gene expression profile having a closer match to the centroid of subgroup A shown in table 3 than subgroups B or C, and (b) TP53 wild-type, and (c) PDGFRA/FGFR1 expression that is not PDGFRA-Hi/FGFR1-Lo expression; (d) a fourth reference centroid corresponding to the expression profile of said 40 or more genes determined in a fourth group of subjects known to have cancer with (a) a gene expression profile having a closer match to the centroid of subgroup B shown in table 3 than subgroups A or C, and (b) TP53 wild-type, and (c) PDGFRA/FGFR1 expression that is not PDGFRA-Hi/FGFR1-Lo expression; and (e) a fifth reference centroid corresponding to the expression profile of said 40 or more genes determined in a fifth group of subjects known to have cancer with (a) a gene expression profile having a closer match to the centroid of subgroup C shown in table 3 than subgroups A or B, and (b) TP53 wild-type, and (c) PDGFRA/FGFR1 expression that is not PDGFRA-Hi/FGFR1-Lo expression.
57-63. (canceled)
64. A method of treating cancer in an individual identified as having a cancer having the expression levels of the 40 or more genes in table 4 a closer match to a first, second, fourth or fifth reference centroid than a third reference centroids, the method comprising administering an anti-PDGFRA antibody, binding fragment thereof or a pharmaceutical composition comprising said antibody or said binding fragment to the individual, wherein the reference centroids are: (a) a first reference centroid corresponding to the expression profile of said 40 or more genes determined in a first group of subjects known to have cancer with PDGFRA-Hi/FGFR1-Lo expression; (b) a second reference centroid corresponding to the expression profile of said 40 or more genes determined in a second group of subjects known to have cancer with mutated TP53 and PDGFRA/FGFR1 expression that is not PDGFRA-Hi/FGFR1-Lo expression; (c) a third reference centroid corresponding to the expression profile of said 40 or more genes determined in a third group of subjects known to have cancer with (a) a gene expression profile having a closer match to the centroid of subgroup A shown in table 3 than subgroups B or C, and (b) TP53 wild-type, and (c) PDGFRA/FGFR1 expression that is not PDGFRA-Hi/FGFR1-Lo expression; (d) a fourth reference centroid corresponding to the expression profile of said 40 or more genes determined in a fourth group of subjects known to have cancer with (a) a gene expression profile having a closer match to the centroid of subgroup B shown in table 3 than subgroups A or C, and (b) TP53 wild-type, and (c) PDGFRA/FGFR1 expression that is not PDGFRA-Hi/FGFR1-Lo expression; and (e) a fifth reference centroid corresponding to the expression profile of said 40 or more genes determined in a fifth group of subjects known to have cancer with (a) a gene expression profile having a closer match to the centroid of subgroup C shown in table 3 than subgroups A or B, and (b) TP53 wild-type, and (c) PDGFRA/FGFR1 expression that is not PDGFRA-Hi/FGFR1-Lo expression.
65. The method according to claim 64, wherein the anti-PDGFRA antibody, binding fragment or composition is for use in a method comprising: (i) performing the method of claim 1 on at least one sample obtained from the individual, wherein the individual is identified as having a cancer having the expression levels of the 40 or more genes in table 4 a closer match to a first, second, fourth or fifth reference centroid than a third reference centroids, wherein the reference centroids are: (a) a first reference centroid corresponding to the expression profile of said 40 or more genes determined in a first group of subjects known to have cancer with PDGFRA-Hi/FGFR1-Lo expression; (b) a second reference centroid corresponding to the expression profile of said 40 or more genes determined in a second group of subjects known to have cancer with mutated TP53 and PDGFRA/FGFR1 expression that is not PDGFRA-Hi/FGFR1-Lo expression; (c) a third reference centroid corresponding to the expression profile of said 40 or more genes determined in a third group of subjects known to have cancer with (a) a gene expression profile having a closer match to the centroid of subgroup A shown in table 3 than subgroups B or C, and (b) TP53 wild-type, and (c) PDGFRA/FGFR1 expression that is not PDGFRA-Hi/FGFR1-Lo expression; (d) a fourth reference centroid corresponding to the expression profile of said 40 or more genes determined in a fourth group of subjects known to have cancer with (a) a gene expression profile having a closer match to the centroid of subgroup B shown in table 3 than subgroups A or C, and (b) TP53 wild-type, and (c) PDGFRA/FGFR1 expression that is not PDGFRA-Hi/FGFR1-Lo expression; and (e) a fifth reference centroid corresponding to the expression profile of said 40 or more genes determined in a fifth group of subjects known to have cancer with (a) a gene expression profile having a closer match to the centroid of subgroup C shown in table 3 than subgroups A or B, and (b) TP53 wild-type, and (c) PDGFRA/FGFR1 expression that is not PDGFRA-Hi/FGFR1-Lo expression; and (ii) administering a therapeutically effective amount of said anti-PDGFRA antibody, said binding fragment thereof or said pharmaceutical composition.
66-69. (canceled)
70. The method of claim 64, wherein the antibody comprises olaratumab.
Description
CROSS-REFERENCE TO RELATED APPLICATIONS
[0001] The present application is a .sctn. 371 of International Patent Application No. PCT/EP2018/071758, filed Aug. 10, 2018, which claims priority from GB Application No. 1712871.1, filed Aug. 10, 2017 and GB Application No. 1808941.7, filed May 31, 2018. The entire disclosure of each of the aforesaid applications is incorporated by reference in the present application.
INCORPORATION-BY-REFERENCE OF MATERIAL SUBMITTED IN ELECTRONIC FORM
[0002] Incorporated herein by reference in its entirety is the Sequence Listing submitted via EFS-Web as a text file named SequenceListing.txt., created Sep. 10, 2020 and having a size of 68,024 bytes.
FIELD OF THE INVENTION
[0003] The present invention relates to materials and methods for stratifying and treating cancers and to methods of identifying/selecting patients for treatment of cancer with tyrosine kinase inhibitors.
BACKGROUND
[0004] Cancer is a complex and dynamic disease, and many different ways of analysing and classifying tumours have been developed with the aims of determining the prognosis for the patient, and informing treatment decisions.
[0005] Pazopanib is an oral multi-target tyrosine kinase inhibitor (TKI) with a clinical anti-tumour effect that is thought to be exerted through its selective inhibition of VEGFR-mediated angiogenesis as well as direct blockade of growth-promoting receptor tyrosine kinases (RTKs) that include platelet-derived growth factor receptors (PDGFRs), fibroblast growth factor receptors (FGFRs) and KIT.sup.1-5. Pazopanib is the first and currently only TKI licensed for the treatment of many subtypes of advanced soft tissue sarcoma (STS) This approval was based on the results of the PALETTE study that randomised 369 patients with pre-treated advanced STS to receive either pazopanib 800 mg once daily or placebo until disease progression.sup.32. After a median follow-up of 25 months, a clinically significant improvement in progression-free survival (PFS) was seen in the pazopanib arm (median PFS 4.6 v. 1.6 months; HR 0.31; 95% CI 0.24-0.40; p<0.0001). Despite this evidence of anti-tumour effect, no significant difference in overall survival (OS) was observed between pazopanib and placebo-treated patients. The failure of PFS gain to translate to OS benefit has adversely influenced cost assessment of pazopanib for this indication, leading to funding limitations in certain health economies worldwide.sup.6,7.
[0006] The development of biomarkers capable of identifying patients most likely to benefit from a therapy is central to the notion of personalised cancer treatment. There is currently an unmet need for predictive biomarkers that are successful in prospectively selecting the subgroup of STS patients most likely to benefit from pazopanib, thus improving the clinical efficiency of the drug. The presence of such a patient subgroup was indicated in a pooled analysis of patients who received the drug within the PALETTE trial or its antecedent EORTC phase II study.sup.8. In this retrospective report of unblinded, patient-level data, 76 of 344 analysed patients (22%) experienced PFS greater than 6 months and OS greater than 18 months. No STS histological subtype was identified as being enriched in these outstanding responders. In the single arm phase II trial, prospective stratification of patients into one of four histotype-defined subgroups saw patients with adipocytic tumours fail to meet predefined efficacy cut-off, with a 12 week progression-free survival of 26%.sup.9. The leiomyosarcoma, synovial sarcoma and `other` histotype subgroups, however, all showed sufficient evidence of pazopanib response, with these histological subtypes taken forward for phase III investigation. The efficacy of pazopanib in several of the rare STS subtypes encompassed within the heterogeneous `other subtypes` subgroups has been further explored in a number of post-licensing retrospective series.sup.10-14. Whilst these studies provide further indication of pazopanib activity across a range of STS diagnoses, none of these rarer subtypes have been found to exhibit particular sensitivity relative to the general STS populations treated in phase II and III studies.
[0007] It is possible that there are aspects of tumour biology targeted by pazopanib that are shared by individual cases across different STS subtypes, presenting a potential avenue for biomarker discovery. This is supported by translational research that have identified genomic and gene expression signatures that are able to describe patient subgroups of distinct clinical phenotype both across and within STS subtypes.sup.15,16. In a 19 patient cohort of advanced STS treated with pazopanib or related TKIs, Koehler et al found that the presence of TP53 mutations was associated with significantly improved PFS compared to cases with TP53 wildtype tumours.sup.17. In a phase I trial of pazopanib in combination with the histone deacetylase inhibitor vorinostat, TP53 hotspot mutations were found in 3 of 11 tested sarcoma patients.sup.18. In this study, TP53 mutation was significantly associated with improved disease control and PFS across all tested patients, and also improved OS in a subset with either sarcoma or colorectal cancer. Meanwhile, our laboratory has recently shown that, in malignant rhabdoid tumour cells with basal pazopanib sensitivity, acquired drug resistance is mediated by modulation of PDGFRA and FGFR1 signalling.sup.19.
[0008] It therefore remains a problem in the art to identify biomarkers for classifying and stratifying patients for susceptibility to pazopanib and other similar tyrosine kinase inhibitors, so that treatment can be tailored to these groups.
SUMMARY OF THE INVENTION
[0009] The present invention is based on research to identify biomarkers associated with successful treatment with tyrosine kinase inhibitors (TKI) such as Pazopanib.
[0010] In doing so, the inventors identified several biomarkers, which could be used independently or in combination to identify patients who would benefit from TKI treatment. The inventors identified biomarkers associated with longer progression-free survival (PFS) and overall survival (OS). In other words, the inventors identified biomarkers for subtypes of cancers which have greater or lesser sensitivity to TKIs such as Pazopanib.
[0011] In particular, three groups of biomarkers have been identified for stratifying cancers: 1) baseline expression, e.g. protein expression, of FGFR1 and PDGFRA, for example using immunohistochemistry (IHC), 2) TP53 mutational status, and 3) gene expression levels of genes (shown in List 1) involved in key oncogenic pathways for example as indicated by mRNA transcript abundance levels.
[0012] Accordingly, the invention relates to the use of one or more of these groups of biomarkers for stratifying cancers, and selecting or identifying cancers for treatment with TKIs such as Pazopanib. The invention also relates to kits for testing and stratifying cancers, to methods for identifying patients for treatment, and to TKIs for use in methods of treatment of cancer.
[0013] The stratification of patients according to the invention involves determining the expression, e.g. protein expression, of FGFR1 and PDGFRA. In some cases, the method of the invention may include following the steps of a decision tree classifier, as depicted in FIG. 5 herein.
[0014] In addition, the inventors have identified a set of genes shown in table 5 that can be used to stratify PDGFRA-high/FGFR1-low IHC intrinsic resistant poor responder cases from other cases.
[0015] In addition, the inventors have developed a gene signature using the genes shown in table 4 that allows for the stratification of patients into the five distinct subgroups identified by the decision tree without the need to apply a decision tree workflow.
[0016] In a first aspect the invention provides a method of selecting an individual with cancer for treatment with a TKI. The method may comprise determining the expression levels of PDGFRA and FGFR1 as `high`(Hi) or `low`(Lo) in a sample of cancer cells from the individual, and selecting an individual for TKI treatment if they have PDGFRA-Hi/FGFR1-Hi PDGFRA-Lo/FGFR1-Lo, or PDGFRA-Lo/FGFR1-Hi expression levels. An individual may be selected for TKI treatment if they have PDGFRA-Lo and/or FGFR1-Hi expression levels. An individual may be selected for TKI treatment if they do not have PDGFRA-Hi/FGFR1-Lo expression levels.
[0017] Equally, an individual may be "deselected" for treatment with TKIs (for example selected as more appropriately treated with an alternative therapy choice, such as in one example an anti-PDGFRA antibody (e.g. olaratumab), binding fragment thereof or a pharmaceutical composition comprising said antibody or said binding fragment) if they have PDGFRA-Hi/FGFR1-Lo.
[0018] The expression levels of PDGFRA or FGFR1 determined may be the expression levels of FGFR1 and PDGFRA proteins. The expression levels may be determined to be `high` if, using immunohistochemistry (IHC), they have a score of 3 or more, wherein the expression level of PDGFRA and/or FGFR1 is scored using the addition of score for staining intensity and score for proportion of positive tumour cells, wherein for staining intensity scoring 0=absent, 1=weak, 2=moderate and 3=strong, and for proportion of positive tumour cells 0=absent, 1=1-10%, 2=11-50%, 3>50%.
[0019] In some embodiments, in the determining step, the protein expression levels of PDGFRA and FGFR1 are determined using immunohistochemistry (IHC).
[0020] The methods of selecting an individual with cancer for treatment with a TKI may comprise determining the mutation status of TP53 in a sample of, or a sample derived from, cancer cells from the individual, and selecting the individual for treatment if they have wildtype TP53. The mutation status may be determined using digital PCR, Sanger sequencing or next generation sequencing, for example.
[0021] The methods of selecting an individual with cancer for treatment with a TKI may comprise determining, within a sample of cancer cells from the individual, the expression levels of 5 or more of the genes selected from List 1, and selecting an individual for treatment with the TKI based on the expression levels of those genes. For example an individual may be selected for treatment if the expression levels resemble, for example closely resemble those of a subgroup with favourable TKI outcome.
[0022] In some embodiments, at least about 40 of the genes listed in List 1 are used in the PARSARC (Pazopanib Activity and Response in SARComa) classification model. In other embodiments, at least 41, at least 42, at least 43, at least 44, at least 45, at least 46, at least 47, at least 48, at least 49, at least 50, at least 60, at least 70, at least 80, at least 90, at least 100, at least 150, at least 200, or all 229 of the genes listed in List 1 are used in the model. As described in detail herein, the 229 genes listed in List 1 were detected at <10% FDR by SAM analysis. Without wishing to be bound by any particular theory, the present inventors believe that it is the combination of at least 115 of, or even substantially all of, the genes listed in List 1 that affords the most accurate classification of intrinsic subtype and prognostication of outcome or therapeutic response to treatment. Thus, in various preferred embodiments, the methods disclosed herein encompass obtaining the expression profile of a large number of the genes listed in List 1, for example, at least 47, at least 48, at least 49, at least 50, at least 60, at least 70, at least 80, at least 90, at least 100, at least 110, at least 115, at least 120, at least 150, at least 200, or all 229 of the genes listed in List 1. It will also be understood by one of skill in the art that one subset of the genes listed in List 1 can be used to train an algorithm to predict sarcoma subtype or outcome, and another subset of the genes used to characterize an individual subject. Preferably, all 229 genes are used to train the algorithm, and at least 5, 10, 15, 20, 25, 30, 35, 40, 45 or 50 of the genes are used to characterize a subject.
[0023] The methods may utilize a supervised algorithm to classify future subject samples according to sarcoma biological subtype. A particular exemplary algorithm, referred to herein as the PARSARC classification model, is based on the gene expression profile of a defined subset of genes that has been identified herein as superior for classifying sarcoma biological subtypes, and for predicting risk of relapse and/or response to therapy in a subject diagnosed with sarcoma. The subset of genes, is provided in List 1.
[0024] "Gene expression" used herein refers to the relative levels of expression and/or pattern of expression of a gene. The expression of a gene may be measured at the of DNA, cDNA, RNA, mRNA, or combinations thereof. "Gene expression profile" refers to the levels of expression, of multiple different genes measured for the same sample. An expression profile can be derived from a biological sample collected from a subject at one or more time points prior to, during, or following diagnosis, treatment, or therapy for sarcoma (or any combination thereof), can be derived from a biological sample collected from a subject at one or more time points during which there is no treatment or therapy for sarcoma (e.g., to monitor progression of disease or to assess development of disease in. a subject at risk for sarcoma), or can be collected from a healthy subject. Gene expression profiles may be measured in a sample, such as samples comprising a variety of cell types, different tissues, different organs, or fluids (e.g., blood, urine, spinal fluid, sweat, saliva or serum) by various methods including but not limited to next generation sequencing technologies, digital counting (such as nanostring), microarray technologies and quantitative and semi-quantitative RT-PCR techniques.
[0025] The expression levels of 10 or more, 15 or more, 20 or more, 30 or more, 40 or more, 50 or more, 60 or more, 70 or more, 80 or more, 90 or more, 100 or more, 120 or more, 140 or more, 160 or more, 180 or more 200 or more, or substantially all of, or all of the genes in List 1 may be determined, the expression levels of 10 or more, 15 or more, 20 or more, 30 or more, 40 or more, 50 or more, 60 or more, 70 or more, 80 or more, 90 or more, 100 or more, 110 or more, or substantially all of, or all of the genes in List 1 are determined.
[0026] An individual may be selected for treatment if the expression levels of genes in the sample are determined to be similar to, or to resemble, the expression levels of the same genes in a group of patients known to respond well to TKI treatment, wherein the group of patients has cancer (preferably, the same type of cancer as the individual). In other words the patients in the group all have cancer. An individual may be deselected from treatment with a TKI if the expression levels of genes in the sample are determined to be similar to, or to resemble, the expression levels of the same genes in a group of patients known to respond poorly to TKI treatment, wherein the group of patients has cancer (preferably the same type of cancer as the individual).
[0027] Accordingly, the methods may further comprise the step of comparing the expression levels of genes in the sample as determined, to the expression levels of the same genes in a group of patients known to respond well to TKI treatment, and to the expression levels of the same genes in a group of patients known to respond poorly to TKI treatment, wherein the group of patients has cancer (preferably, the same type of cancer as the individual), and selecting an individual for treatment with the TKI in step if the expression levels of the genes determined are more similar to the group of individuals which are known to respond well to TKI treatment. It is contemplated herein that the expression levels of said genes (in particular a centroid derived from the expression levels of said genes) may demonstrate predictive ability across cancer types. For example, the marker genes described herein and/or one or more centroids derived from the expression of the genes obtained from sarcoma samples may be amenable to matching a gene expression centroid of, e.g. a renal cancer sample and further more may be predictive of TKI treatment response of the renal cancer subject.
[0028] The TKI with which the groups of patients were treated may be any TKI which find use in the present invention. The TKI may be the same as that intended for treatment of the individual. In other words, the individual may be selected for treatment with the same TKI as that with which the groups of patients were treated. Alternatively, the TKI with which the groups of patients were treated may differ from that which is intended for treatment of the individual.
[0029] The expression levels determined may be nucleic acid expression levels. These may be determined using an RNA microarray, quantitative PCR or RNA-Seq, for example.
[0030] Methods of the invention may involve one, two or all three of the above approaches for selecting individuals for treatment. Accordingly, a method of selecting an individual with cancer may comprise two or more of: [0031] (a) determining the expression levels of PDGFRA and FGFR1 as `high` (Hi) or `low` (Lo) in a sample of cancer cells from the individual, and selecting an individual for treatment if they have expression levels of PDGFRA/FGFR1 that are not PDGFRA-Hi/FGFR1-Lo (e.g. PDGFRA-Hi/FGFR1-Hi, PDGFRA-Lo/FGFR1-Lo, or PDGFRA-Lo/FGFR1-Hi expression levels); [0032] (b) determining the mutation status of TP53 in a sample of cancer cells from the individual and selecting an individual for treatment if they have wildtype TP53; and [0033] (c) determining the expression levels of 5, 10, 20, 30, 40, 50, 60, 70, 80, 90, 100, 110, 115, 120 or more of the genes in List 1 in a sample of cancer cells from the individual, and selecting an individual for treatment with the TKI based on the expression levels of those genes.
[0034] The method may comprise step (a), and if an individual is selected in step (a), then step (b) may be carried out for the individual, and if the individual is selected in step (b) then step (c) may be carried out. An individual may be selected using all three of steps (a) to (c). In some cases, the method may comprise following the steps of the decision tree classifier depicted in FIG. 5.
[0035] A method of selecting an individual with cancer may comprise two or more of: [0036] (a) determining the expression levels of PDGFRA and FGFR1 as `high` (Hi) or `low` (Lo) in a sample of cancer cells from the individual, and selecting an individual for treatment if they have PDGFRA-Lo and/or FGFR1-Hi expression levels; [0037] (b) determining the mutation status of TP53 in a sample of cancer cells from the individual and selecting an individual for treatment if they have wildtype TP53; and [0038] (c) determining the expression levels of 5, 10, 20, 30, 40, 50, 60, 70, 80, 90, 100, 110, 115, 120 or more of the genes in List 1 in a sample of cancer cells from the individual, and selecting an individual for treatment with the TKI based on the expression levels of those genes.
[0039] The method may comprise step (a), and if an individual is selected in step (a), then step (b) may be carried out for the individual, and if the individual is selected in step (b) then step (c) may be carried out. An individual may be selected using all three of steps (a) to (c). In some cases, the method may comprise following the steps of the decision tree classifier depicted in FIG. 5.
[0040] A method of selecting an individual with cancer may comprise two or more of: [0041] (a) determining the expression levels of PDGFRA and FGFR1 as `high` (Hi) or `low` (Lo) in a sample of cancer cells from the individual, and selecting an individual for treatment if they have do not have PDGFRA-Hi and FGFR1-Lo expression levels; [0042] (b) determining the mutation status of TP53 in a sample of cancer cells from the individual and selecting an individual for treatment if they have wildtype TP53; and [0043] (c) determining the expression levels of 5, 10, 20, 30, 40, 50, 60, 70, 80, 90, 100, 110, 115, 120 or more of the genes in List 1 in a sample of cancer cells from the individual, and selecting an individual for treatment with the TKI based on the expression levels of those genes.
[0044] The method may comprise step (a), and if an individual is selected in step (a), then step (b) may be carried out for the individual, and if the individual is selected in step (b) then step (c) may be carried out. An individual may be selected using all three of steps (a) to (c). In some cases, the method may comprise following the steps of the decision tree classifier depicted in FIG. 5.
[0045] Any of the methods may comprise the step of obtaining a sample (e.g. a sample of cancer cells) from the individual. In other words the methods may involve the step of obtaining a sample of cancer cells from the individual before the determining step.
[0046] Methods of treatment and therapeutic uses are also contemplated.
[0047] In addition to aspects described above, the inventors have developed a gene signature for stratification of patients with differential responses to TKIs (e.g pazopanib). In place of determining the expression levels of PDGFRA and FGFR1 as `high` (Hi) or `low` (Lo) in a sample of cancer cells from the individual, in any of the aspects above, a 42 gene signature has been developed which characterises patients that have intrinsic resistance to a TKI as defined by the PDGFRA-high/FGFR1-low IHC status. In other words, instead of determining the expression levels of PDGFRA and FGFR1 as `high` (Hi) or `low` (Lo), the expression levels of 42 genes in table 5, may be used to classify/stratify the patients in all of the aspects described above.
[0048] Accordingly, in a second aspect of the invention, a patient may be selected for treatment with a TKI (e.g. pazopanib) based on the expression levels of these genes. For example an individual may be selected for treatment if the expression levels resemble, for example closely resemble those of a subgroup with favourable TKI outcome. In particular, an individual may be selected for treatment if the expression levels of the 42 genes, or a centroid derived from the expression of those genes more closely matches the `other` centroid as shown in table 7. This centroid is representative of cancers having not having PDGFRA-Hi/FGFR1-Lo expression, for example, having PDGFRA-Lo and/or FGFR1-Hi expression, for example having PDGFRA-Hi/FGFR1-Hi, PDGFRA-Lo/FGFR1-Lo, or PDGFRA-Lo/FGFR1-Hi expression.
[0049] An individual may be "deselected" for treatment with TKIs (for example selected as more appropriately treated with an alternative therapy choice, such as in one example an anti-PDGFRA antibody (e.g. olaratumab), binding fragment thereof or a pharmaceutical composition comprising said antibody or said binding fragment), based on the expression levels of the 42 marker genes shown in table 5. In particular, an individual may be deselected for treatment (or selected for alternative treatment) if the expression levels of the 42 genes, or a centroid derived from the expression of those genes more closely matches the `PDGFRA-Hi/FGFR1-Lo` centroid as shown in table 7. This centroid is representative of cancers having PDGFRA-Hi/FGFR1-Lo expression.
[0050] The comparison with a centroid may be carried out using nearest centroid single sample classification. This takes the gene expression profile of a new sample, and compares it to each of these class centroids and assigns a sample to a subtype based on the nearest centroid. Subgroup prediction is done by calculating the Spearman's rank correlation of each test case to the two centroids, and assigning a sample to a subtype based on closest Eucleadian distance (1-Spearman Correlation) the nearest centroid. Accordingly, Spearman's rank correlation may be used to calculate the distance to a centroid. Similar statistical tests to compare similarity are also known to the skilled person.
[0051] The expression levels may be determined in a sample of cancer cells from a patient. Accordingly, the methods of selecting an individual with cancer for treatment with a TKI may comprise determining, within a sample of cancer cells from the individual, the expression levels of 5 or more of the genes selected from table 5, and selecting an individual for treatment with the TKI based on the expression levels of those genes. Alternatively, an individual may be "deselected" from treatment with TKIs, or selected for treatment with an alternative therapy based on the expression levels of those genes. For example an individual be deselected from treatment with a TKI or selected for treatment with an alternative therapy if the expression levels resemble those of a subgroup with intrinsic resistance, or resemble those of a subgroup which have PDGFRA-hi/FGFR1-lo expression.
[0052] Accordingly, the invention provides a method of selecting an individual with cancer for treatment with a TKI, the method comprising: [0053] (a) determining the expression levels in a sample of cancer cells from the individual of 20 or more of the genes selected from table 5, and [0054] (b) selecting an individual for treatment with the TKI based on the expression levels of those genes.
[0055] The expression levels of said 20 or more of the genes determined in said step (a) may be compared with: [0056] (i) at least a first reference centroid corresponding to the expression profile of said 20 or more genes determined in a first group of subjects known to have PDGFRA-Hi/FGFR1-Lo expression; and [0057] (ii) at least a second reference centroid corresponding to the expression profile of said 20 or more genes determined in a second group of subjects known not to have PDGFRA-Hi/FGFR1-Lo expression (for example, having PDGFRA-Lo and/or FGFR1-Hi expression, for example having any of PDGFRA-Hi/FGFR1-Hi, PDGFRA-Lo/FGFR1-Lo, or PDGFRA-Lo/FGFR1-Hi expression), [0058] wherein the individual is selected for treatment with the TKI in step (b) when the expression levels determined in said step (a) of the 20 or more genes are a closer match to said second reference centroid than said first reference centroid.
[0059] In some embodiments, at least about 20 of the genes listed in table 5 are used. In other embodiments, at least 21, at least 22, at least 23, at least 24, at least 25, at least 26, at least 27, at least 28, at least 29, at least 30, at least 31, at least 32, at least 33, at least 34, at least 35, at least 36, at least 37, at least 38, at least 39, at least 40, at least 41, or all 42 of the genes listed in table 5 are used. For example, at least 20, 25, 30, 35, 40 or all of the genes listed in table 5 are used.
[0060] Where fewer than all 42 genes are used, comparison to the centroid shown in table 7 is done using the centroid values shown for the genes used.
[0061] As described in detail herein, the 42 genes listed in table 5 were identified using the Classification of Nearest Centroid (CLANC) methodology. Without wishing to be bound by any particular theory, the present inventors believe that it is the combination of at least 35 of, 40 of, or even substantially all of, the genes listed in table 5 that affords the most accurate classification of patients to the PDGFRA-Hi/FGFR1-Lo or `other` subtype, and thus prognostication of outcome or therapeutic response to treatment.
[0062] Accordingly, the invention provides a method of selecting an individual with cancer for treatment with a TKI, the method comprising: [0063] (a) determining the expression levels in a sample of cancer cells from the individual of 20 or more of the genes selected from table 5, and [0064] (b) selecting an individual for treatment with the TKI based if the expression levels determined in said step (a) of the 20 or more genes are a closer match to the `other` centroid in table 7, than the PDGFRA-Hi/FGFR1-Lo centroid in table 7.
[0065] It will also be understood by one of skill in the art that one subset of the genes listed in table 5 can be used to train an algorithm to predict `PDGFRA-Hi/FGFR1-Lo` or `other` subtype or outcome, and another subset of the genes used to characterize an individual subject.
[0066] Preferably, all 42 genes are used to train the algorithm, and at least 20, 25, 30, 35, 40 or all 42 of the genes are used to characterize a subject.
[0067] The methods may utilize a supervised algorithm to classify future subject samples according to sarcoma biological subtype. A particular exemplary algorithm, referred to herein as the PARSARC classification model, is based on the gene expression profile of a defined subset of genes that has been identified herein as superior for classifying biological subtypes, and for predicting risk of relapse and/or response to therapy in a subject diagnosed with sarcoma. The subset of genes is provided in table 5.
[0068] Accordingly, the methods may further comprise the step of comparing the expression levels of genes in the sample as determined, to the expression levels of the same genes in a group of patients known to have PDGFRA-Hi/FGFR1-Hi, PDGFRA-Lo/FGFR1-Lo, or PDGFRA-Lo/FGFR1-Hi expression, and to the expression levels of the same genes in a group of patients known not to have PDGFRA-Hi/FGFR1-Lo expression (for example, having PDGFRA-Lo and/or FGFR1-Hi expression, for example having PDGFRA-Hi/FGFR1-Lo expression. The group of patients has cancer (preferably, the same type of cancer as the individual).
[0069] In particular, centroids derived from the expression levels of the genes may be used for the comparison.
[0070] An individual may be selected for treatment with the TKI if the expression levels of the genes determined are more similar to the group of individuals which are known not to have PDGFRA-Hi/FGFR1-Lo expression (for example, having PDGFRA-Lo and/or FGFR1-Hi expression, for example having PDGFRA-Hi/FGFR1-Hi, PDGFRA-Lo/FGFR1-Lo, or PDGFRA-Lo/FGFR1-Hi expression.
[0071] The gene expression levels discussed above, can be used in place of determining PDGFRA and FGFR1 expression in any of the aspects described herein. For example, the methods of the invention may involve one, two or all three of: [0072] (a) determining the expression levels of at least 20, 25, 30, 35, 40 or all 42 of the genes listed in table 5 in a sample of cancer cells from the individual, and selecting an individual for treatment based on the expression levels of those genes; [0073] (b) determining the mutation status of TP53 in a sample of cancer cells from the individual and selecting an individual for treatment if they have wildtype TP53; and [0074] (c) determining the expression levels of 5, 10, 20, 30, 40, 50, 60, 70, 80, 90, 100, 110, 115, 120 or more of the genes in List 1 in a sample of cancer cells from the individual, and selecting an individual for treatment with the TKI based on the expression levels of those genes.
[0075] The method may comprise step (a), and if an individual is selected in step (a), then step (b) may be carried out for the individual, and if the individual is selected in step (b) then step (c) may be carried out. An individual may be selected using all three of steps (a) to (c). In some cases, the method may comprise following the steps of the decision tree classifier depicted in FIG. 5.
[0076] Although the expression levels of the genes shown in table 5 may be used in the context of the decision tree, it may be preferable to use the expression levels of these genes (or a sub-group thereof) alone, in order to select individuals for treatment or provide a prognosis in accordance with the invention.
[0077] Any of the methods may comprise the step of obtaining a sample (e.g. a sample of cancer cells) from the individual. In other words the methods may involve the step of obtaining a sample of cancer cells from the individual before the determining step.
[0078] In addition to aspects described above, the inventors have developed a gene signature for stratification of patients into the distinct subtypes that were distinguished between using the decision tree, without the need to apply the decision tree workflow.
[0079] In particular, a gene signature using 225 genes shown in table 4 has been developed which distinguish between 5 groups which correspond to the outcomes of the decision tree as follows: [0080] 1) PDGFRA-high/FGFR1-low (shown in table 6 as IHC+) [0081] 2) TP53 mutated and not PDGFRA-Hi/FGFR1-Lo (e.g. having PDGFRA-Lo and/or FGFR1-Hi expression, for example having PDGFRA-Hi/FGFR1-Hi, PDGFRA-Lo/FGFR1-Lo, or PDGFRA-Lo/FGFR1-Hi) (shown in table 6 as TP53) [0082] 3) Subgroup A gene expression (using genes from List 1), TP53 wildtype and not PDGFRA-Hi/FGFR1-Lo (e.g. having PDGFRA-Lo and/or FGFR1-Hi expression, for example having PDGFRA-Hi/FGFR1-Hi, PDGFRA-Lo/FGFR1-Lo, or PDGFRA-Lo/FGFR1-Hi) (shown in table 6 as A) [0083] 4) Subgroup B gene expression (using genes from List 1), TP53 wildtype and PDGFRA-Hi/FGFR1-Hi, PDGFRA-Lo/FGFR1-Lo, or PDGFRA-Lo/FGFR1-Hi (shown in table 6 as B) [0084] 5) Subgroup C gene expression (using genes from List 1), TP53 wildtype and not PDGFRA-Hi/FGFR1-Lo (e.g. having PDGFRA-Lo and/or FGFR1-Hi expression, for example having PDGFRA-Hi/FGFR1-Hi, PDGFRA-Lo/FGFR1-Lo, or PDGFRA-Lo/FGFR1-Hi) (shown in table 6 as C)
[0085] In the above descriptions, `Subgroup A gene expression` may refer to cancer with a gene expression levels having a closer match to the centroid of subgroup A shown in table 3 than subgroups B or C. `Subgroup B gene expression` may refer to cancer with a gene expression levels having a closer match to the centroid of subgroup A shown in table 3 than subgroups A or C. `Subgroup C gene expression` may refer to cancer with a gene expression levels having a closer match to the centroid of subgroup C shown in table 3 than subgroups A or B.
[0086] Accordingly, the 225 genes in table 4 (or a sub-group thereof) may be used to stratify patients into one of 5 groups, which correspond to the output of the decision tree. Similarly to the output of the decision tree, this stratification may be used to select an individual for treatment with a TKI (or for an alternative treatment), or to provide a prognosis.
[0087] Accordingly, in a third aspect the invention provides a method of selecting an individual for treatment with a TKI, the method comprising: [0088] (a) determining the expression levels in a sample of cancer cells from the individual of 40 or more of the genes selected from table 4, and [0089] (b) selecting an individual for treatment with the TKI based on the expression levels of those genes.
[0090] At least 40, at least 45, at least 50, at least 6, at least 70, at least 80, at least 90, at least 100, at least 110, at least 120, at least 130, at least 240, at least 150, at least 160, at least 170, at least 180, at least 190, at least 200, at least 210, at least 220 or all 225 of the genes in table 4 are used. For example substantially all of or all of the genes in table 4 are used.
[0091] Accordingly, the invention provides a method of selecting an individual for treatment with a TKI, the method comprising: [0092] (a) determining the expression levels in a sample of cancer cells from the individual of 40 or more of the genes selected from table 4, and [0093] (b) selecting an individual for treatment with the TKI based on the expression levels of those genes, wherein the individual is selected for treatment with a TKI if the expression levels of the 40 or more of the genes determined in said step (a) are a closer match to the reference centroid `A(3)` shown in table 6, than any other reference centroid (IHC+(1), TP53(2), B(4), C(5)) shown in table 6.
[0094] Similarly, an individual may be "deselected" for treatment with TKIs (for example selected as more appropriately treated with an alternative therapy choice, such as in one example an anti-PDGFRA antibody (e.g. olaratumab), binding fragment thereof or a pharmaceutical composition comprising said antibody or said binding fragment), based on the expression levels of the 225 marker genes shown in table 4, or a sub-group thereof. In particular, an individual may be deselected for treatment (or selected for alternative treatment) if the expression levels of the genes, or a centroid derived from the expression of those genes more closely matches any of the IHC+(1), TP53(2), B(4) or C(5) centroids as shown in table 6, than the A(3) centroid.
[0095] The comparison with a centroid may be carried out using nearest centroid single sample classification. This takes the gene expression profile of a new sample, and compares it to each of these class centroids and assigns a sample to a subtype based on the nearest centroid. Subgroup prediction is done by calculating the Spearman's rank correlation of each test case to the two centroids, and assigning a sample to a subtype based on closest Eucleadian distance (1-Spearman Correlation) the nearest centroid. Accordingly, Spearman's rank correlation may be used to calculate the distance to a centroid. Similar statistical tests to compare similarity are also known to the skilled person.
[0096] The expression levels may be determined in a sample of cancer cells from a patient. Accordingly, the methods of selecting an individual with cancer for treatment with a TKI may comprise determining, within a sample of cancer cells from the individual, the expression levels of 40 or more of the genes selected from table 4, and selecting an individual for treatment with the TKI based on the expression levels of those genes. Alternatively, an individual may be "deselected" from treatment with TKIs, or selected for treatment with an alternative therapy based on the expression levels of those genes. For example an individual be deselected from treatment with a TKI or selected for treatment with an alternative therapy if the expression levels resemble those of a subgroup with intrinsic resistance, or resemble those of a subgroup which have PDGFRA-hi/FGFR1-lo expression.
[0097] Where fewer than all 225 genes are used, comparison to the centroid shown in table 6 is done using the centroid values shown for the genes used.
[0098] As described in detail herein, the 225 genes listed in table 4 were identified using the Classification of Nearest Centroid (CLANC) methodology. Without wishing to be bound by any particular theory, the present inventors believe that it is the combination of at least 180 or 200 of, or even substantially all of, the genes listed in table 4 that affords the most accurate classification of patients, and thus prognostication of outcome or therapeutic response to treatment.
[0099] It will also be understood by one of skill in the art that one subset of the genes listed in table 4 can be used to train an algorithm to predict subtypes (1) to (5) or outcome, and another subset of the genes used to characterize an individual subject. Preferably, all 225 genes are used to train the algorithm, and at least 40 or more of the genes are used to characterize a subject.
[0100] The methods may utilize a supervised algorithm to classify future subject samples according to sarcoma biological subtype. A particular exemplary algorithm, referred to herein as the PARSARC classification model, is based on the gene expression profile of a defined subset of genes that has been identified herein as superior for classifying biological subtypes, and for predicting risk of relapse and/or response to therapy in a subject diagnosed with sarcoma. The subset of genes, is provided in table 4.
[0101] Accordingly, the methods may further comprise the step of comparing the expression levels of genes in the sample as determined, to the expression levels of the same genes in a group of patients known to correspond to groups (1)-(5) in the decision tree. The characteristics of these groups are set out above.
[0102] In other words, the expression levels of the 40 or more of the genes determined in said step may be compared with: [0103] (i) a first reference centroid corresponding to the expression profile of said 40 or more genes determined in a first group of subjects known to have cancer with PDGFRA-Hi/FGFR1-Lo expression; [0104] (ii) a second reference centroid corresponding to the expression profile of said 40 or more genes determined in a second group of subjects known to have cancer with mutated TP53 and not PDGFRA-Hi/FGFR1-Lo expression (e.g. having PDGFRA-Lo and/or FGFR1-Hi expression, e.g. PDGFRA-Hi/FGFR1-Hi, PDGFRA-Lo/FGFR1-Lo, or PDGFRA-Lo/FGFR1-Hi); [0105] (iii) a third reference centroid corresponding to the expression profile of said 40 or more genes determined in a third group of subjects known to have cancer with (a) a gene expression profile having a closer match to the centroid of subgroup A shown in table 3 than subgroups B or C, and (b) TP53 wild-type, and (c) not PDGFRA-Hi/FGFR1-Lo expression (e.g. having PDGFRA-Lo and/or FGFR1-Hi expression, e.g. PDGFRA-Hi/FGFR1-Hi or PDGFRA-Lo/FGFR1-Lo or PDGFRA-Lo/FGFR1-Hi); [0106] (iv) a fourth reference centroid corresponding to the expression profile of said 40 or more genes determined in a fourth group of subjects known to have cancer with (a) a gene expression profile having a closer match to the centroid of subgroup B shown in table 3 than subgroups A or C, and (b) TP53 wild-type, and (c) not PDGFRA-Hi/FGFR1-Lo expression (e.g. having PDGFRA-Lo and/or FGFR1-Hi expression, e.g. PDGFRA-Hi/FGFR1-Hi or PDGFRA-Lo/FGFR1-Lo or PDGFRA-Lo/FGFR1-Hi); and [0107] (v) a fifth reference centroid corresponding to the expression profile of said 40 or more genes determined in a fifth group of subjects known to have cancer with (a) a gene expression profile having a closer match to the centroid of subgroup C shown in table 3 than subgroups B or C, and (b) TP53 wild-type, and (c) not PDGFRA-Hi/FGFR1-Lo expression (e.g. having PDGFRA-Lo and/or FGFR1-Hi expression, e.g. PDGFRA-Hi/FGFR1-Hi or PDGFRA-Lo/FGFR1-Lo or PDGFRA-Lo/FGFR1-Hi); [0108] wherein the individual is selected for treatment with the TKI when the expression levels of the 40 or more genes determined are a closer match to said third reference centroid than said first, second, fourth or fifth reference centroids.
[0109] An individual may be selected for treatment with the TKI if the expression levels of the genes determined are most similar to the group of individuals which are known to be in subgroup (3), that is have (a) subgroup A gene expression, and (b) TP53 wildtype, and (c) not PDGFRA-Hi/FGFR1-Lo expression (e.g. having PDGFRA-Lo and/or FGFR1-Hi expression, e.g. PDGFRA-Hi/FGFR1-Hi or PDGFRA-Lo/FGFR1-Lo or PDGFRA-Lo/FGFR1-Hi).
[0110] An individual may be selected for treatment if the expression levels of at least 40 of the 225 genes in table 4 in the sample are determined to be similar to, or to resemble, or have the closest match to the expression levels of the same genes (for example as represented by a centroid) in a group of patients known to respond well to TKI treatment, wherein the group of patients has cancer (preferably, the same type of cancer as the individual). In other words the patients in the group all have cancer.
[0111] An individual may be deselected from treatment with a TKI if the expression levels of at least 40 of the 225 genes in table 4 in the sample are determined to be similar to, or to resemble, or have the closest match to the expression levels of the same genes (for example as represented by a centroid) in a group of patients known to respond poorly to TKI treatment, wherein the group of patients has cancer (preferably the same type of cancer as the individual). The gene expression levels discussed above, can be used in place of the decision tree or in place of combinations of the tests for stratifying patients.
[0112] Any of the methods may comprise the step of obtaining a sample (e.g. a sample of cancer cells) from the individual. In other words the methods may involve the step of obtaining a sample of cancer cells from the individual before the determining step.
[0113] Any of these selection methods may be used to inform treatment choices, in the methods of treatment disclosed herein.
[0114] The methods described above may be described as methods of detecting inherent resistance to a TKI in a cancer in an individual. In these methods, the same determining and optionally comparing steps may be carried our as in the methods of selection. In place of step (b) selecting an individual for treatment, the methods of detecting inherent resistance to a TKI comprise step (b) identifying a cancer as having inherent resistance to a TKI.
[0115] A cancer is identified as having inherent resistance if it would not be selected for treatment according to the methods described herein. For example: (1) if the cancer has one or more of: [0116] (a) PDGFRA-Hi/FGFR1-Lo expression levels, or gene expression levels that match the PDGFRA-Hi/FGFR1-Lo centroid in table 6 or 7; [0117] (b) mutated TP53 [0118] (c) the expression levels of 5 or more of the genes in List 1 are determined to be similar to the expression levels of the same genes in a group of patients known to respond poorly to TKI treatment, wherein the group of patients has cancer, preferably the same type of cancer as the individual; [0119] or (2) the gene expression levels of 40 or more of the genes in table 4 are determined to more closely match the expression levels of the same genes in a group of patients known to respond poorly to TKI treatment, wherein the group of patients has cancer, preferably the same type of cancer as the individual. In particular inherent resistance is identified, when the gene expression levels of 40 or more of the genes in table 4 are determined to more closely match the centroids 1, 2, 4 or 5 shown in table 6 than the centroid 3 shown in table 6.
[0120] In a fourth aspect the invention provides a tyrosine kinase inhibitor for use in a method of treating cancer in an individual, wherein the individual has been selected for treatment according to the method of the first, second or third aspects of the invention.
[0121] In particular, the invention provides a tyrosine kinase inhibitor (TKI) for use in a method of treating cancer in an individual, said method comprising: [0122] (i) performing the method of the first aspect of the invention on at least one sample obtained from the individual, wherein the individual is identified as having a cancer having one or more of: [0123] (a) expression levels of PDGFRA/FGFR1 that are not PDGFRA-Hi/FGFR1-Lo (e.g. PDGFRA-Hi/FGFR1-Hi, PDGFRA-Lo/FGFR1-Lo, or PDGFRA-Lo/FGFR1-Hi expression levels); [0124] (b) wildtype TP53; and [0125] (c) expression levels of 5, 10, 20, 30, 40, 50, 60, 70, 80, 90, 100, 110, 115, 120 or more of the genes in List 1 similar to the expression levels of the same genes in a group of patients known to respond well to TKI treatment, wherein the group of patients has cancer, preferably the same type of cancer as the individual; and [0126] (ii) administering the TKI to said individual.
[0127] In particular, the invention provides a tyrosine kinase inhibitor (TKI) for use in a method of treating cancer in an individual, said method comprising: [0128] (i) performing the method of the second aspect of the invention on at least one sample obtained from the individual, wherein the individual is identified as having a cancer having expression levels of 20 or more of the genes in table 5 a closer match to a second reference centroid corresponding to the expression profile of said 20 or more genes determined in a second group of subjects known not to have PDGFRA-Hi/FGFR1-Lo expression than said first reference centroid corresponding the expression profile of said 20 or more genes determined in a first group of subjects known to have PDGFRA-Hi/FGFR1-Lo expression; and [0129] (ii) administering the TKI to said individual.
[0130] In particular, the invention provides a tyrosine kinase inhibitor (TKI) for use in a method of treating cancer in an individual, said method comprising: [0131] (i) performing the method of the third aspect of the invention on at least one sample obtained from the individual, wherein the individual is identified as having a cancer having the expression levels of the 40 or more genes in table 4 a closer match to a third reference centroid than said first, second, fourth or fifth reference centroids, wherein the reference centroids are: [0132] (a) a first reference centroid corresponding to the expression profile of said 40 or more genes determined in a first group of subjects known to have cancer with PDGFRA-Hi/FGFR1-Lo expression; [0133] (b) a second reference centroid corresponding to the expression profile of said 40 or more genes determined in a second group of subjects known to have cancer with mutated TP53 and not PDGFRA-Hi/FGFR1-Lo expression; [0134] (c) a third reference centroid corresponding to the expression profile of said 40 or more genes determined in a third group of subjects known to have cancer with (a) a gene expression profile having a closer match to the centroid of subgroup A shown in table 3 than subgroups B or C, and (b) TP53 wild-type, and (c) not PDGFRA-Hi/FGFR1-Lo expression; [0135] (d) a fourth reference centroid corresponding to the expression profile of said 40 or more genes determined in a fourth group of subjects known to have cancer with (a) a gene expression profile having a closer match to the centroid of subgroup B shown in table 3 than subgroups A or C, and (b) TP53 wild-type, and (c) not PDGFRA-Hi/FGFR1-Lo expression; and [0136] (e) a fifth reference centroid corresponding to the expression profile of said 40 or more genes determined in a fifth group of subjects known to have cancer with (a) a gene expression profile having a closer match to the centroid of subgroup C shown in table 3 than subgroups B or C, and (b) TP53 wild-type, and (c) not PDGFRA-Hi/FGFR1-Lo expression; and [0137] (ii) administering the TKI to said individual.
[0138] In a fifth aspect, the invention provides a method of treating cancer with a TKI in an individual in need thereof, wherein the individual has been selected for treatment according to the method of the first, second or third aspects of the invention.
[0139] In particular, the method may comprise: [0140] (i) performing the method of the first aspect of the invention, wherein the individual is identified as having a cancer having one or more of: [0141] (a) PDGFRA-Hi/FGFR1-Hi, PDGFRA-Lo/FGFR1-Lo, or PDGFRA-Lo/FGFR1-Hi expression levels; [0142] (b) wildtype TP53; and [0143] (c) expression levels of 5, 10, 20, 30, 40, 50, 60, 70, 80, 90, 100, 110, 115, 120 or more of the genes in List 1 similar to the expression levels of the same genes in a group of patients known to respond well to TKI treatment, wherein the group of patients has cancer, preferably the same type of cancer as the individual; and [0144] (ii) administering a therapeutically effective amount of a TKI to said individual.
[0145] In particular, the method may comprise: [0146] (i) performing the method of the second aspect of the invention on at least one sample obtained from the individual, wherein the individual is identified as having a cancer having expression levels of 20 or more of the genes in table 5 a closer match to a second reference centroid corresponding to the expression profile of said 20 or more genes determined in a second group of subjects known not to have PDGFRA-Hi/FGFR1-Lo expression than said first reference centroid corresponding the expression profile of said 20 or more genes determined in a first group of subjects known to have PDGFRA-Hi/FGFR1-Lo expression; and [0147] (ii) administering a therapeutically effective amount of a TKI to said individual.
[0148] In particular, the method may comprise: [0149] (i) performing the method of the third aspect of the invention on at least one sample obtained from the individual, wherein the individual is identified as having a cancer having the expression levels of the 40 or more genes in table 4 a closer match to a third reference centroid than said first, second, fourth or fifth reference centroids, wherein the reference centroids are: [0150] (a) a first reference centroid corresponding to the expression profile of said 40 or more genes determined in a first group of subjects known to have cancer with PDGFRA-Hi/FGFR1-Lo expression; [0151] (b) a second reference centroid corresponding to the expression profile of said 40 or more genes determined in a second group of subjects known to have cancer with mutated TP53 and not PDGFRA-Hi/FGFR1-Lo expression; [0152] (c) a third reference centroid corresponding to the expression profile of said 40 or more genes determined in a third group of subjects known to have cancer with (a) a gene expression profile having a closer match to the centroid of subgroup A shown in table 3 than subgroups B or C, and (b) TP53 wild-type, and (c) not PDGFRA-Hi/FGFR1-Lo expression; [0153] (d) a fourth reference centroid corresponding to the expression profile of said 40 or more genes determined in a fourth group of subjects known to have cancer with (a) a gene expression profile having a closer match to the centroid of subgroup B shown in table 3 than subgroups A or C, and (b) TP53 wild-type, and (c) not PDGFRA-Hi/FGFR1-Lo expression; and [0154] (e) a fifth reference centroid corresponding to the expression profile of said 40 or more genes determined in a fifth group of subjects known to have cancer with (a) a gene expression profile having a closer match to the centroid of subgroup C shown in table 3 than subgroups B or C, and (b) TP53 wild-type, and (c) not PDGFRA-Hi/FGFR1-Lo expression; and [0155] (ii) administering a therapeutically effective amount of a TKI to said individual.
[0156] In a sixth aspect, the present invention provides use of a TKI in the manufacture of a medicament for treating cancer in an individual, wherein the individual has been selected for treatment according to the method of the first, second or third aspects of the invention. In particular, the use may comprise use of a TKI in the manufacture of a medicament for use in a method of the fifth aspect of the invention.
[0157] According to any one of the aspects of the invention the cancer may be selected from: soft tissues sarcoma (STS), metastatic renal cell carcinomas (mRCC), gastrointestinal stromal tumour (GIST), hepatocellular carcinoma (HCC), neuroendocrine tumour (NET), medullary thyroid cancer (MTC), non-squamous non-small cell lung cancer (non-squamous NSCLC), and chronic myeloid leukaemia (CML). In particular the cancer may be STS. In particular the cancer may be advanced STS. The cancer in the individual and in the groups of patients for whom the TKI response is known may be selected from these cancer types.
[0158] As described in detail herein, particular biomarker signatures identified herein are predictive of treatment outcomes for pazopanib therapy. The present inventors believe that the methods and kits of the present invention are similarly predictive of treatment outcomes with other TKIs, and without wishing to be bound by any particular theory, the inventors believe that, in particular, TKIs having similar pharmacological action in terms of kinases targeted will be especially applicable to the present invention. Based on an analysis of overlapping molecular targets shared by pazopanib, regorafenib and sorafenib (see FIG. 6), TKIs (either presently known or to be discovered) that inhibit at least two targets from the following list do or will find use in accordance with the present invention: [0159] BRAF [0160] CSF1R [0161] DDR1 [0162] DDR2 [0163] FGFR1 [0164] FGFR2 [0165] FGFR3 [0166] FLT1 [0167] FLT4 [0168] FRK [0169] KDR [0170] KIT [0171] LCK [0172] LYN [0173] MAP2K6 [0174] NTRK1 [0175] PDGFRA [0176] PDGFRB [0177] RAF1 [0178] RET [0179] TEK
[0180] In particular, according to any of the aspects of the invention the TKI may be selected from: Pazopanib, Regorafenib, Sorafenib, Sunitinib, Lenvatinib, Axitinib, Nintedanib, and Ponatinib, and pharmaceutically acceptable salts thereof. In particular, the TKI may be Pazopanib. While any pharmaceutically acceptable salt is contemplated herein, particular examples of salt forms of TKIs, which are contemplated in accordance with the present invention, include: [0181] Pazopanib [0182] hydrochloride [0183] 5-(4-chloropyrimidin-2ylamino)-2-methylbenzenesulfonamide [0184] N,2,3-trimethyl-2H-indazol-6-amine [0185] Regorafenib [0186] Isethionate [0187] Ethylsulfonate [0188] Hydrochloride [0189] Mesylate [0190] Phenylsulfonate [0191] Sunitinib [0192] Hydrochloride [0193] Malate [0194] Fumurate [0195] D-tartrate [0196] L-tartrate [0197] Citrate [0198] Lenvatinib [0199] Mesylate (main form) [0200] P-toluenesulfonate [0201] Nindetanib [0202] Esiliate (main form) [0203] Pontanib [0204] Hydrochloride
[0205] In particular, the TKI is Pazopanib or a pharmaceutically acceptable salt thereof and the cancer is soft tissue sarcoma, for example advanced STS.
[0206] In a seventh aspect, the invention provides a kit for use in identifying a cancer suitable for treatment with a TKI. In line with the first aspects of the invention, the kit may have reagents, probes and/or instructions for detecting at least one of: [0207] (a) the expression levels of PDGFRA and FGFR1; [0208] (b) the mutation status of TP53; and [0209] (c) the expression levels of 5 or more of the genes in List 1.
[0210] For example, the kit may have probes for detecting the expression levels of 5 or more, 10 or more, 15 or more, 20 or more, 30 or more, 40 or more, 50 or more, 60 or more, 70 or more, 80 or more, 90 or more, 100 or more, 110 or more, 115 or more, 120 or more, 140 or more, 160 or more, 180 or more 200 or more, or substantially all of, or all of the genes in List 1.
[0211] The kit may also have probes for detecting the expression levels of PDGFRA and FGFR1. The kit may also have probes for detecting the mutation status of TP53.
[0212] In some cases in accordance with the seventh aspect of the present invention, the kit takes the form of a companion diagnostic comprising: [0213] (i) said reagents, probes and/or instructions for detecting at least one of: [0214] (a) the expression levels of PDGFRA and FGFR1; [0215] (b) the mutation status of TP53; and [0216] (c) the expression levels of 5 or more of the genes in List 1; and [0217] (ii) a TKI or a pharmaceutical composition or dosage form comprising a TKI. The companion diagnostic may comprise (i) and (ii) in a single package or in separate or associated packages.
[0218] In line with the second aspect of the invention, the kit may have reagents, probes and/or instructions for detecting the expression levels of at least 20 of the genes in table 5, and optionally: (a) the mutation status of TP53; and (b) the expression levels of 5 or more of the genes in List 1.
[0219] For example, the kit may have probes for detecting the expression levels of at least about 20, at least 21, at least 22, at least 23, at least 24, at least 25, at least 26, at least 27, at least 28, at least 29, at least 30, at least 31, at least 32, at least 33, at least 34, at least 35, at least 36, at least 37, at least 38, at least 39, at least 40, at least 41, or all 42 of the genes listed in table 5.
[0220] The kit may also have probes for detecting the mutation status of TP53. The kit may have probes for detecting the expression levels of 5 or more, 10 or more, 15 or more, 20 or more, 30 or more, 40 or more, 50 or more, 60 or more, 70 or more, 80 or more, 90 or more, 100 or more, 110 or more, 115 or more, 120 or more, 140 or more, 160 or more, 180 or more 200 or more, or substantially all of, or all of the genes in List 1.
[0221] In some cases in accordance with the seventh aspect of the present invention, the kit takes the form of a companion diagnostic comprising: [0222] (i) said reagents, probes and/or instructions for detecting the expression levels of at least 20 of the genes in table 5, and optionally: (a) the mutation status of TP53; and (b) the expression levels of 5 or more of the genes in List 1; [0223] (ii) a TKI or a pharmaceutical composition or dosage form comprising a TKI.
[0224] The companion diagnostic may comprise (i) and (ii) in a single package or in separate or associated packages.
[0225] In line with the third aspect of the invention, the kit may have reagents, probes and/or instructions for detecting the expression levels of at least 40 of the genes in table 4.
[0226] For example, the kit may have probes for detecting the expression levels of at least 40, at least 45, at least 50, at least 60, at least 70, at least 80, at least 90, at least 100, at least 110, at least 120, at least 130, at least 240, at least 150, at least 160, at least 170, at least 180, at least 190, at least 200, at least 210, at least 220 or all 225 of the genes in table 4.
[0227] In some cases in accordance with the seventh aspect of the present invention, the kit takes the form of a companion diagnostic comprising: [0228] (i) said reagents, probes and/or instructions for detecting the expression levels of at least 40 of the genes in table 4; and [0229] (ii) a TKI or a pharmaceutical composition or dosage form comprising a TKI.
[0230] The companion diagnostic may comprise (i) and (ii) in a single package or in separate or associated packages.
[0231] In an eighth aspect, the invention provides a method of determining a prognosis of TKI treatment response in an individual.
[0232] In line with the first aspect of the invention, the method may comprise one or more of: [0233] (a) determining the expression levels of PDGFRA and FGFR1 as `high` (Hi) or `low`(Lo) in a sample of cancer cells from the individual; [0234] (b) determining the mutation status of TP53 in a sample of cancer cells from the individual; and [0235] (c) determining the expression levels of 5 or more 10 or more, 15 or more, 20 or more, 30 or more, 40 or more, 50 or more, 60 or more, 70 or more, 80 or more, 90 or more, 100 or more, 110 or more, 115 or more, 120 or more, 140 or more, 160 or more, 180 or more 200 or more, or substantially all of, or all of the genes in List 1 in a sample of cancer cells from the individual.
[0236] An individual may be determined to have a good prognosis following TKI treatment if they have one or more of: [0237] (a) expression levels of PDGFRA/FGFR1 that are not PDGFRA-Hi/FGFR1-Lo (e.g. PDGFRA-Hi/FGFR1-Hi, PDGFRA-Lo/FGFR1-Lo, or PDGFRA-Lo/FGFR1-Hi expression levels); [0238] (b) wildtype TP53 [0239] (c) the expression levels of genes in the sample are determined to be similar to the expression levels of the same genes in a group of patients known to respond well to TKI treatment, wherein the group of patients has cancer, preferably the same type of cancer as the individual.
[0240] The individual may be determined to have a good prognosis if they meet all of the criteria or (a), (b) and (c) for which they were tested. In other words, an individual may not have a good prognosis if they do not meet any one of the criteria for which they are tested.
[0241] An individual may be determined to have a poor prognosis if they have one or more of: [0242] (a) PDGFRA-Hi/FGFR1-Lo expression levels; [0243] (b) mutated TP53 [0244] (c) the expression levels of 5 or more 10 or more, 15 or more, 20 or more, 30 or more, 40 or more, 50 or more, 60 or more, 70 or more, 80 or more, 90 or more, 100 or more, 110 or more, 115 or more, 120 or more, 140 or more, 160 or more, 180 or more 200 or more, or substantially all of, or all of the genes in List 1 genes in the sample are determined to be similar to the expression levels of the same genes in a group of patients known to respond poorly to TKI treatment, wherein the group of patients has cancer, preferably the same type of cancer as the individual.
[0245] In line with the second aspect of the invention, the method may comprise determining the expression levels of 20 or more genes from table 5, and optionally: [0246] (i) determining the mutation status of TP53 in a sample of cancer cells from the individual; and [0247] (ii) determining the expression levels of 5 or more 10 or more, 15 or more, 20 or more, 30 or more, 40 or more, 50 or more, 60 or more, 70 or more, 80 or more, 90 or more, 100 or more, 110 or more, 115 or more, 120 or more, 140 or more, 160 or more, 180 or more 200 or more, or substantially all of, or all of the genes in List 1 in a sample of cancer cells from the individual.
[0248] An individual may be determined to have a good prognosis following TKI treatment if they have a cancer having expression levels of 20 or more of the genes in table 5 a closer match to a second reference centroid corresponding to the expression profile of said 20 or more genes determined in a second group of subjects known not to have PDGFRA-Hi/FGFR1-Lo expression, than a first reference centroid corresponding to the expression profile of said 20 or more genes determined in a first group of subjects known to have PDGFRA-Hi/FGFR1-Lo expression, and optionally: [0249] (i) wildtype TP53; and [0250] (ii) the expression levels of genes in the sample are determined to be similar to the expression levels of the same genes in a group of patients known to respond well to TKI treatment, wherein the group of patients has cancer, preferably the same type of cancer as the individual.
[0251] An individual may be determined to have a poor prognosis if they have a cancer having expression levels of 20 or more of the genes in table 5 a closer match to a first reference centroid corresponding to the expression profile of said 20 or more genes determined in a first group of subjects known to have PDGFRA-Hi/FGFR1-Lo expression, than a second reference centroid corresponding to the expression profile of said 20 or more genes determined in a second group of subjects known not to have PDGFRA-Hi/FGFR1-Lo expression.
[0252] In line with the third aspect of the invention, the method may comprise determining the expression levels of 40 or more genes from table 4.
[0253] An individual may be determined to have a good prognosis following TKI treatment if they have a cancer having the expression levels of the 40 or more genes in table 4 a closer match to a third reference centroid than said first, second, fourth or fifth reference centroids, wherein the reference centroids are: [0254] (a) a first reference centroid corresponding to the expression profile of said 40 or more genes determined in a first group of subjects known to have cancer with PDGFRA-Hi/FGFR1-Lo expression; [0255] (b) a second reference centroid corresponding to the expression profile of said 40 or more genes determined in a second group of subjects known to have cancer with mutated TP53 and not PDGFRA-Hi/FGFR1-Lo expression; [0256] (c) a third reference centroid corresponding to the expression profile of said 40 or more genes determined in a third group of subjects known to have cancer with (a) a gene expression profile having a closer match to the centroid of subgroup A shown in table 3 than subgroups B or C, and (b) TP53 wild-type, and (c) not PDGFRA-Hi/FGFR1-Lo expression; [0257] (d) a fourth reference centroid corresponding to the expression profile of said 40 or more genes determined in a fourth group of subjects known to have cancer with (a) a gene expression profile having a closer match to the centroid of subgroup B shown in table 3 than subgroups A or C, and (b) TP53 wild-type, and (c) not PDGFRA-Hi/FGFR1-Lo expression; and [0258] (e) a fifth reference centroid corresponding to the expression profile of said 40 or more genes determined in a fifth group of subjects known to have cancer with (a) a gene expression profile having a closer match to the centroid of subgroup C shown in table 3 than subgroups B or C, and (b) TP53 wild-type, and (c) not PDGFRA-Hi/FGFR1-Lo expression.
[0259] An individual may be determined to have a poor prognosis if they have a cancer having the expression levels of the 40 or more genes in table 4 a closer match to a first, second, fourth or fifth reference centroid than a third reference centroids, wherein the reference centroids are: [0260] (a) a first reference centroid corresponding to the expression profile of said 40 or more genes determined in a first group of subjects known to have cancer with PDGFRA-Hi/FGFR1-Lo expression; [0261] (b) a second reference centroid corresponding to the expression profile of said 40 or more genes determined in a second group of subjects known to have cancer with mutated TP53 and not PDGFRA-Hi/FGFR1-Lo expression; [0262] (c) a third reference centroid corresponding to the expression profile of said 40 or more genes determined in a third group of subjects known to have cancer with (a) a gene expression profile having a closer match to the centroid of subgroup A shown in table 3 than subgroups B or C, and (b) TP53 wild-type, and (c) not PDGFRA-Hi/FGFR1-Lo expression; [0263] (d) a fourth reference centroid corresponding to the expression profile of said 40 or more genes determined in a fourth group of subjects known to have cancer with (a) a gene expression profile having a closer match to the centroid of subgroup B shown in table 3 than subgroups A or C, and (b) TP53 wild-type, and (c) not PDGFRA-Hi/FGFR1-Lo expression; and [0264] (e) a fifth reference centroid corresponding to the expression profile of said 40 or more genes determined in a fifth group of subjects known to have cancer with (a) a gene expression profile having a closer match to the centroid of subgroup C shown in table 3 than subgroups B or C, and (b) TP53 wild-type, and (c) not PDGFRA-Hi/FGFR1-Lo expression.
[0265] In a ninth aspect, the present invention provides an anti-PDGFRA antibody, binding fragment thereof or a pharmaceutical composition comprising said antibody or said binding fragment for use in a method of treating cancer in an individual who has not been selected for treatment with a TKI according to the first, second or third aspects of the invention.
[0266] In line with the first aspect of the invention, the individual may have been selected as having one or more of: [0267] (a) PDGFRA-Hi/FGFR1-Lo expression levels; [0268] (b) mutated TP53 [0269] (c) the expression levels of 5 or more 10 or more, 15 or more, 20 or more, 30 or more, 40 or more, 50 or more, 60 or more, 70 or more, 80 or more, 90 or more, 100 or more, 110 or more, 115 or more, 120 or more, 140 or more, 160 or more, 180 or more 200 or more, or substantially all of, or all of the genes in List 1 genes in the sample are determined to be similar to the expression levels of the same genes in a group of patients known to respond poorly to a TKI, wherein the group of patients has cancer (for example, the same type of cancer as the individual). In particular, the anti-PDGFRA antibody, binding fragment thereof or a pharmaceutical composition may be for use in a method comprising: [0270] (i) performing the method of the eighth aspect of the invention on at least one sample obtained from the individual, wherein the individual is identified as having a cancer having one or more of [0271] (a) PDGFRA-Hi/FGFR1-Lo expression levels; [0272] (b) mutated TP53 [0273] (c) the expression levels of 5 or more 10 or more, 15 or more, 20 or more, 30 or more, 40 or more, 50 or more, 60 or more, 70 or more, 80 or more, 90 or more, 100 or more, 110 or more, 115 or more, 120 or more, 140 or more, 160 or more, 180 or more 200 or more, or substantially all of, or all of the genes in List 1 genes in the sample are determined to be similar to the expression levels of the same genes in a group of patients known to respond poorly to a TKI, wherein the group of patients has cancer (preferably the same type of cancer as the individual); and [0274] (ii) administering a therapeutically effective amount of said anti-PDGFRA antibody, said binding fragment thereof or said pharmaceutical composition.
[0275] In certain embodiments, the anti-PDGFRA antibody may comprise olaratumab.
[0276] In line with the second aspect of the invention, the individual may have been selected if they have a cancer having expression levels of 20 or more of the genes in table 5 a closer match to a first reference centroid corresponding to the expression profile of said 20 or more genes determined in a first group of subjects known to have PDGFRA-Hi/FGFR1-Lo expression, than a second reference centroid corresponding to the expression profile of said 20 or more genes determined in a second group of subjects known not to have PDGFRA-Hi/FGFR1-Lo expression.
[0277] In line with the third aspect of the invention, the individual may have been selected if they have a cancer having the expression levels of the 40 or more genes in table 4 a closer match to a first, second, fourth or fifth reference centroid than a third reference centroids, wherein the reference centroids are: [0278] (a) a first reference centroid corresponding to the expression profile of said 40 or more genes determined in a first group of subjects known to have cancer with PDGFRA-Hi/FGFR1-Lo expression; [0279] (b) a second reference centroid corresponding to the expression profile of said 40 or more genes determined in a second group of subjects known to have cancer with mutated TP53 and not PDGFRA-Hi/FGFR1-Lo expression; [0280] (c) a third reference centroid corresponding to the expression profile of said 40 or more genes determined in a third group of subjects known to have cancer with (a) a gene expression profile having a closer match to the centroid of subgroup A shown in table 3 than subgroups B or C, and (b) TP53 wild-type, and (c) not PDGFRA-Hi/FGFR1-Lo expression; [0281] (d) a fourth reference centroid corresponding to the expression profile of said 40 or more genes determined in a fourth group of subjects known to have cancer with (a) a gene expression profile having a closer match to the centroid of subgroup B shown in table 3 than subgroups A or C, and (b) TP53 wild-type, and (c) not PDGFRA-Hi/FGFR1-Lo expression; and [0282] (e) a fifth reference centroid corresponding to the expression profile of said 40 or more genes determined in a fifth group of subjects known to have cancer with (a) a gene expression profile having a closer match to the centroid of subgroup C shown in table 3 than subgroups B or C, and (b) TP53 wild-type, and (c) not PDGFRA-Hi/FGFR1-Lo expression.
[0283] In certain embodiments, the anti-PDGFRA antibody may comprise olaratumab.
[0284] The markers, methods of measuring them, cancers, tyrosine kinase inhibitors and other details of the invention are described below. These details are applicable to all of the aspects of the invention.
Markers
[0285] In the context of the present invention the `markers` or `biomarkers` allow stratification of cancers based on their association with a patient outcome. The biomarkers may include expression level of particular genes, expression levels of particular proteins and mutational status of particular genes.
[0286] The markers may be detected by conventional means in a sample containing cancer cells or cancer cell material or components (e.g. nucleic acids and/or proteins), obtained from an individual. Accordingly, the methods and uses disclosed herein may involve the step of determining the presence or absence of, expression level of or mutation status of a biomarker. The methods and uses may base a prognostic or diagnostic decision on the presence or absence of, expression level of or mutation status of a biomarker as already determined. The methods and uses may involve the step of determining the presence or absence of, expression level of or mutation status of a biomarker in a sample of cancer cells obtained from an individual.
[0287] In some embodiments the methods may comprise the step of obtaining a sample of cancer cells or cancer cell material or components (e.g. nucleic acids and/or proteins) from an individual. The obtained sample may then be tested as described.
Expression Levels FGFR1 and PDGFRA
[0288] The present inventors have found that high levels of PDGFRalpha (herein "PRGFRA", also known as PDGFRa or PDGFR.alpha.) and low levels of FGFR1 expression in cancer cells are associated with a worse outcome when treated with a TKI, as compared to other PDGFRA/FGFR1 expression profiles. This expression profile may be described as an "FGFR1-Lo/PDGFRA-Hi", or "PDGFRA-Hi/FGFR1-Lo". In particular patient groups with a PDGFRA-Hi/FGFR1-Lo expression profile have lower overall survival (OS) and progression-free survival (PFS) than other patients.
[0289] Cancers with other expression profiles i.e. not PDGFRA-Hi/FGFR1-Lo (e.g. PDGFRA-Lo and/or FGFR1-Hi, e.g. PDGFRA-Hi/FGFR1-Hi, PDGFRA-Lo/FGFR1-Lo or PDGFRA-Lo/FGFR1-Hi) are therefore more suitable for treatment with a TKI as they have better patient outcomes. Accordingly, in some embodiments an individual may be selected for treatment with a TKI if they have a cancer that does not have not PDGFRA-Hi/FGFR1-Lo expression (e.g. having PDGFRA-Lo and/or FGFR1-Hi, e.g. PDGFRA-Hi/FGFR1-Hi, PDGFRA-Lo/FGFR1-Lo or PDGFRA-Lo/FGFR1-Hi expression).
[0290] Wherever cancers or individuals having PDGFRA-Hi/FGFR1-Hi or PDGFRA-Lo/FGFR1-Lo or PDGFRA-Lo/FGFR1-Hi are referred to herein, cancers or individuals not having PDGFRA-Hi/FGFR1-Lo expression can be used in the same way. Accordingly the embodiments disclosed herein in relation to PDGFRA-Hi/FGFR1-Hi or PDGFRA-Lo/FGFR1-Lo or PDGFRA-Lo/FGFR1-Hi can be equally applied to cancers or individuals not having PDGFRA-Hi/FGFR1-Lo (e.g. having PDGFRA-Lo and/or FGFR1-Hi). Similarly, an individual may be deselected for TKI treatment, or considered for another therapy if they have a cancer which has PDGFRA-Hi/FGFR1-Lo expression.
[0291] In the present invention, references to PDGFR.alpha. denote the receptor tyrosine kinase (RTK) platelet-derived growth factor alpha. PDGFRa is a cell surface tyrosine kinase receptor.
[0292] The HUGO Gene Symbol report for PDGFR.alpha. can be found on the world wide web at genenames.org/cgi-bin/gene_symbol_report?hgnc_id=8803 which provides links to the human PDGFRA nucleic acid and amino acid sequences, as well as reference to the homologous murine and rat proteins. The human form has the HGNC ID: 8803, and the ensemble gene reference ENSG00000134853. The uniprot reference is P16234.
[0293] References to FGFR1 denote the fibroblast growth factor receptor 1. FGFR1 is a cell surface tyrosine kinase receptors.
[0294] The HUGO Gene Symbol report for FGFR1 can be found on the world wide web at genenames.org/cgi-bin/gene_symbol_report?hgnc_id=HGNC:3688 which provides links to the human FGFR1 nucleic acid and amino acid sequences, as well as reference to the homologous murine and rat proteins. The human form has the HGNC ID: 3688, and the ensemble gene reference ENSG00000077782. The uniprot reference is P11362.
[0295] The methods and uses disclosed herein may involve the step of determining the expression level of FGFR1 and PDGFRA or basing a prognostic or diagnostic decision on the expression level of FGFR1 and PDGFRA already determined. The methods and uses may involve the step of determining the expression level of FGFR1 and PDGFRA in a sample of cancer cells obtained from the individual.
[0296] In accordance with the invention the expression levels of FGFR1 and PDGFRA may be determined at the protein level or the nucleic acid level. In other words gene expression or protein expression levels of FGFR1 and PDGFRA may be determined.
[0297] Protein expression levels may be determined in a sample containing cancer cells obtained from an individual. Protein expression levels may be determined by any available means, including using immunological assays. For example, expression levels may be determined by immunohistochemistry (IHC), Western blotting, ELISA, immunoelectrophoresis, immunoprecipitation and immunostaining. Using any of these methods it is possible to determine the relative expression levels of PDGFRA and FGFR1 proteins.
[0298] Protein expression levels may be determined for example using specific binding agents capable of binding to FGFR1 or PDGFRA. A type of specific binding agent is an antibody, capable of specifically binding to FGFR1 or PDGFRA.
[0299] The antibody or other specific binding agent may be labelled to enable it to be detected or capable of detection following reaction with one or more further species, for example using a secondary antibody or binding agent that is labelled or capable of producing a detectable result, e.g. in an ELISA type assay. As an alternative a labelled binding agent may be employed in a Western blot to detect FGFR1 or PDGFRA protein.
[0300] In particular PDGFRA and FGFR1 expression levels may be determined in a sample of cancer cells, for example using immunohistochemical (IHC) analysis.
[0301] IHC analysis can be carried out using paraffin fixed samples or fresh frozen tissue samples, and generally involves staining the samples to highlight the presence, intensity and proportion of cells which express the target protein.
[0302] Using IHC, tumour/cancer specimens can be stained and scored for intensity and for proportion of positive tumour cells. For example, for intensity scoring 0=absent, 1=weak, 2=moderate, and 3=strong. For the proportion of positive tumour cells 0=absent, 1=1-10%, 2=11-50%, 3>50%. According to this system, sections with a score of 3 (intensity score+proportion score) may be counted as `high` (Hi). Cumulative scores of <3 may be counted as `low` (Lo). Accordingly, a cancer having PDGFRA-Hi/FGFR1-Hi, PDGFRA-Lo/FGFR1-Lo or PDGFRA-Lo/FGFR1-Hi or PDGFRA-Hi/FGFR1-Lo expression may be a cancer which meets the definition of Hi or Lo according to this IHC scoring system.
[0303] Expression levels may be measured using different techniques as described herein, but even if another measurement technique is used in the methods of the invention, expression may still be considered as Hi or Lo using the IHC scoring. In other words, the IHC score system above may be used to define the threshold between Hi and Lo expression, even if IHC itself is not used in the methods of the invention.
[0304] Representative examples of scored tumour tissue can be seen in supplementary FIG. 1. Using IHC scoring is a widely used approach for determining protein expression levels and there is good concordance between operators. Positive and negative controls can be used as reference points.
[0305] Alternatively or additionally, the determination of PDGFRA and FGFR1 expression levels may involve determining the presence or amount of PDGFRA and FGFR1 mRNA in a sample. Methods for doing this are well known to the skilled person. By way of example, they include using PCR involving one or more primers based on each of a PDGFRA and FGFR1 nucleic acid sequence to determine the level of PDGFRA and FGFR1 transcript is present in a sample.
[0306] Determining PDGFRA and FGFR1 mRNA levels may carried out by extracting RNA from a sample of cancer cells and measuring PDGFRA and FGFR1 expression specifically using quantitative real time RT-PCR. Alternatively or additionally, the expression of PDGFRA and FGFR1 could be assessed using RNA extracted from a sample of cancer cells for an individual using microarray analysis, which measures the levels of mRNA for a group of genes using a plurality of probes immobilised on a substrate to form the array.
[0307] Suitable kits for measuring the expression levels of these markers are described elsewhere herein. Expression levels (e.g. mRNA levels) may involve measuring expression (e.g. mRNA level) of PDGFRA and/or FGFR1 relative to the expression level (e.g. mRNA level) of one or more (e.g. 2, 3, 4, 5, 6, 7, 8, 9, 10, 11, 12, 13, 14, 15, 16, 17, 18, 18 or 20 or more) "housekeeping" genes. In this context, a housekeeping gene may be any gene for which the expression level is unaffected or largely unaffected by cancer subtype. In particular, suitable housekeeping genes may be selected from those referred to in Supplementary Methods 4 herein, i.e. ACAD9, AGK, AMMECR1L, C10orf76, CC2D1B, CNOT10, CNOT4, COG7, DDX50, DHX16, DNAJC14, EDC3, EIF2B4, ERCC3, FCF1, FTSJ2, GPATCH3, HDAC3, MRPS5, MTMR14, NOL7, NUBP1, PIAS1, PIK3R4 and PRPF38A.
[0308] As discussed elsewhere herein, the genes in table 5 (or a sub-set thereof) may be used in place of PDGFRA/FGFR1 expression to stratify patients, and identify those with inherent resistance to TKIs (e.g. pazopanib).
TP53 Status
[0309] Tumour protein p53 (`TP53` or `p53`) is a tumour suppressor protein encoded by the TP53 gene in humans. Mutation of TP53 was found to be associated with improved PFS in a retrospective study of 19 patients of mixed STS treated with an anti-angiogenic TKI (95% Pazopanib).sup.17.
[0310] In a phase 1 trial of Pazopanib combined with the histone deacetylase inhibitor vorinostat, hotspot TP53 mutations were discovered in 11 of 36 tested patients (3 of 11 sarcoma patients).sup.18. TP53 mutation was significantly associated with improved rates of disease control and progression-free survival across all tested patients, and also with improved median overall survival in a subset of tested patients with either sarcoma or colorectal cancer. This study involved tiny numbers of TP53 mutant sarcomas, and the results are not conclusive, with the association between TP53 and TKIs requiring further investigation.
[0311] Using TP53 exon sequencing, the present inventors have found that the mutational status of TP53 was associated with patient outcomes for OS (overall survival) and PFS (progression-free survival). In particular, they found that wildtype TP53 was associated with longer OS and PFS, while TP53 mutations were associated with shorter OS and PFS.
[0312] Wildtype TP53 refers to TP53 which does not have non-synonymous mutations. In particular wildtype TP53 may have no non-synonymous mutations in the exons or splice sites.
[0313] TP53 mutant refers to TP53 having non-synonymous mutations. A TP53 mutation may be a described as a mutation in TP53 that is associated with cancer. A TP53 mutation may be in a protein coding region or in a splice site for example.
[0314] Mutations of TP53 include insertions, inversions, deletions, and/or point mutations.
[0315] Mutations in TP53 can be detected using sequencing technologies such as Sanger sequencing. The International Agency for Research on Cancer compile a database of TP53 mutations relating to cancer. These mutations may be detected using the protocol and probes they suggest.
[0316] Generally PCR can be used to amplify gene sequences from genomic DNA prepared from a sample of cancer cells. Primers for amplification of exons within TP53 are generally available. The amplified DNA can be sequenced, for example using Sanger sequencing, and mutations identified. Other sequencing techniques may be used, including next generation sequencing (NGS) methods. NGS offers the speed and accuracy required to detect mutations in cancer, either through whole-genome sequencing (WGS) or by focusing on specific regions or genes using whole-exome sequencing (WES) or targeted gene sequencing. Examples of NGS techniques include methods employing sequencing by synthesis, sequencing by hybridisation, sequencing by ligation, pyrosequencing, nanopore sequencing, or electrochemical sequencing.
[0317] Additional methods to detect the mutation include matrix-assisted laser desorption/ionization time-of-flight (MALDI-TOF) spectrometry, restriction fragment length polymorphism (RFLP), high-resolution melting (HRM) curve analysis, and denaturing high performance liquid Chromatography (DHPLC). Other PCR-based methods for detecting mutations include allele specific oligonucleotide polymerase chain reaction (ASO-PCR) and sequence-specific primer (SSP)-PCR. Mutations of may also be detected in mRNA transcripts through, for example, RNA sequence or reverse transcriptase PCR. Mutations may also be detected in the protein through, for example, peptide sequencing by mass spectrometry.
[0318] In certain embodiments, determining whether the individual has a mutated TP53 cancer is performed on genomic nucleic acid extracted from a sample of cells obtained from the cancer, from a sample of cancer cells circulating in blood and/or from circulating tumour DNA (ctDNA) in blood or plasma. Techniques for enriching a blood or plasma sample for circulating tumour DNA (e.g. based on fragment size) have been described. Moreover, sequencing techniques for identifying cancer-associated mutations in ctDNA have been described (e.g. based on digital PCR, targeted deep sequencing, nested real-time PCR, and the like). See, for example, PLoS Med. 2016 December; 13(12): e1002198.
[0319] Mutant allele specific probes may also be used to detect mutated TP53. These may be nucleic acid probes. For example, a series of allele-specific probes may be used to detect TP53 mutations. Such probes may be used in PCR. Mutation detection using Nanostring technology, e.g. as described on the world wide web at nanostring.com/application/files/9514/9636/4522/GLNS_PM0005_PB_nCounter_V- antage_3D_DNA_SNV_Solid_Tumor_Panel.pdf, are specifically contemplated herein.
[0320] It is also possible to detect TP53 mutations using mismatch detection methods to detect mismatches in the DNA or mRNA using probes. It is possible to detect protein TP53 mutations using immunostaining, for example IHC, with antibodies specific to mutant alleles of p53 protein.
[0321] Suitable kits for determining the TP53 mutation status are described elsewhere herein.
[0322] The HUGO Gene Symbol report for TP53 can be found on the world wide web at genenames.org/cgi-bin/gene_symbol_report?hgnc_id=HGNC:11998 which provides links to the human TP53 nucleic acid and amino acid sequences, as well as reference to the homologous murine and rat proteins. The human form has the HGNC ID: 11998, and the ensemble gene reference ENSG00000141510. The uniprot reference is P04637.
Gene Expression Levels--List 1
[0323] There is growing evidence of shared aspects of molecular pathology that can stratify patients with mixed STS subtypes into groups of similar phenotype. The French Sarcoma Group reported an expression signature of 67 genes related to genomic instability and mitosis that was able to identify subgroups with distinct metastasis-free survival within 2 independent cohorts of mixed STS subtypes.sup.15. The so-called CINSARC (Complexity Index in SARComa) is now under prospective investigation as a possible predictive biomarker for neoadjuvant chemotherapy in unselected STS (NCT02789384). Meanwhile, molecular correlates with the long-observed variation in clinical behaviour within histological subtypes have been described in leiomyosarcoma through RNA-Seq gene expression profiling.sup.16.
[0324] Given that pazopanib directly inhibits a number of growth-promoting RTKs, expression levels of these targets in tumour cells are attractive candidates for evaluation as predictive biomarkers. In a mRCC phase II trial of the combination of interferon-alpha with sorafenib, a multi-targeted kinase inhibitor with target selectivity that overlaps with that of pazopanib, Ho et al. demonstrated using in-situ hybridisation that higher FGFR1 transcript levels was associated with shorter PFS.sup.40.
[0325] In contrast, it has recently been shown that malignant rhabdoid tumour cells that display high levels of PDGFRA and FGFR1 expression are sensitive to pazopanib treatment in vitro.sup.19. It appears likely that the effect of relative expression of these and other RTKs in modulating downstream signalling pathways and influencing drug sensitivity are complex and variably controlled at epigenetic, transcriptional and post-translational levels.
[0326] The inventors have investigated additional factors which allow further stratification of individuals with cancer. Clusters of patients with distinct gene expression signatures in the cancer cell samples were identified. These clusters were used to identify the genes which can be used to distinguish between groups of patients with differing prognosis following TKI treatment.
[0327] Identification of biological subtype samples and genes: An expanded cancer-pathway associated gene set, comprised primarily of genes found 13 cancer pathways, was initially used to identify biological subtypes. The 13 cancer pathways are: [0328] Notch [0329] APC/Wnt [0330] Hedgehog [0331] Chromatin modification [0332] Transcriptional regulation [0333] DNA damage control [0334] TGF-.beta. [0335] MAPK [0336] STAT [0337] PI3K [0338] RAS [0339] Cell cycle [0340] Apoptosis
[0341] Twenty two sarcomas with IHC-WT across 770 genes were analyzed by consensus clustering (CC). The CC algorithm statistically identifies significant/unique groups by testing the null hypothesis that a group of samples is from a single cluster, where a cluster is characterized as a multivariate normal distribution. CC was run to identify between 2 to 8 subgroups, with a permutation of 100 times and stopping when the test was no longer significant (p >0.001). Using a supervised approach, a minimized gene set was derived from these biological class labelled samples based on a non-parametric approach to identify the most significant differential genes across these three subgroups.
[0342] Using multivariable cox regression model, we confirmed the significant association of these 3 biological subgroups with progression free survival and overall survival respectively (p<0.001)
[0343] List 1: 229 genes identified at a false discovery rate (FDR)<10% in multiclass SAM analysis that identifies clinical outcome subgroups A, B and C in unbiased consensus clustering of 22 IHCneg (PDGFRA-Hi/FGFR1-Hi, PDGFRA-Lo/FGFR1-Hi, PDGFRA-Lo/FGFR1-Lo), P53 wt cases. Each gene is identified below by name with the Entrez number for each shown in brackets.
TABLE-US-00001 ACVR1B (91) CCNA2 (890) COMP (1311) AMH (268) CCNB1 (891) CSF1R (1436) APC (324) CCND1 (595) CXXC4 (80319) ATM (472) CCND2 (894) DDB2 (1643) B2M (567) CCNE2 (9134) DDIT3 (1649) BAD (572) CCR7 (1236) DKK1 (22943) BCL2A1 (597) CDC25C (995) DLL1 (28514) BCL2L1 (598) CDC7 (8317) DNMT1 (1786) BCOR (54880) CDH1 (999) DTX3 (196403) BID (637) CDKN2A (1029) DTX4 (23220) BIRC3 (330) CDKN2B (1030) DUSP10 (11221) BRCA2 (675) CDKN2C (1031) DUSP4 (1846) BRIP1 (83990) CDKN2D (1032) DUSP5 (1847) CACNA1C (775) CHAD (1101) E2F1 (1869) CACNA1G (8913) CHEK1 (1111) E2F5 (1875) CACNA1H (8912) CHUK (1147) EFNA2 (1943) CACNB2 (783) CLCF1 (23529) EFNA5 (1946) CALML5 (51806) COL1A1 (1277) EIF4EBP1 (1978) CALML6 (163688) COL27A1 (85301) ERBB2 (2064) CAPN2 (824) COL3A1 (1281) ETS2 (2114) CARD11 (84433) COL4A4 (1286) ETV1 (2115) CASP10 (843) COL4A6 (1288) EYA1 (2138) CASP7 (840) COL5A2 (1290) FANCA (2175) FANCE (2178) IL22RA1 (58985) MMP9 (4318) FANCF (2188) IL2RA (3559) MPL (4352) FBXW7 (55294) IL2RB (3560) MSH6 (2956) FEN1 (2237) IL3RA (3563) MYC (4609) FGF21 (26291) IL6 (3569) MYD88 (4615) FGF5 (2250) IL6R (3570) NFATC1 (4772) FGF7 (2252) IL7R (3575) NFKB1 (4790) FGF9 (2254) INHBA (3624) NFKBIZ (64332) FLNA (2316) IRAK2 (3656) NKD1 (85407) FLNC (2318) IRS1 (3667) NOG (9241) FN1 (2335) ITGA3 (3675) NOS3 (4846) FOS (2353) ITGA6 (3655) NOTCH2 (4853) FZD10 (11211) ITGA7 (3679) NOTCH3 (4854) FZD9 (8326) ITGA8 (8516) NRAS (4893) GADD45A (1647) ITGB3 (3690) NUPR1 (26471) GADD45G (10912) JAG1 (182) PAX5 (5079) GAS1 (2619) JAK3 (3718) PBX1 (5087) GATA3 (2625) KAT2B (8850) PDGFC (56034) GNA11 (2767) LAMA3 (3909) PDGFD (80310) GNG12 (55970) LAMA5 (3911) PDGFRA (5156) GRB2 (2885) LAMB3 (3914) PIK3CD (5293) GRIN2A (2903) LAMC2 (3918) PIK3CG (5294) GSK3B (2932) LAMC3 (10319) PIK3R5 (23533) GZMB (3002) LEFTY2 (7044) PIM1 (5292) HDAC10 (83933) LFNG (3955) PLA2G10 (8399) HES1 (3280) LIF (3976) PLA2G4C (8605) HGF (3082) MAP2K1 (5604) PLAT (5327) HMGA2 (8091) MAP2K2 (5605) PLAU (5328) HSPB1 (3315) MAP2K6 (5608) PLCB4 (5332) ID2 (3398) MAP3K8 (1326) PLD1 (5337) IDH1 (3417) MAPK10 (5602) POLD4 (57804) IDH2 (3418) MAPK8IP1 (9479) POLE2 (5427) IGF1 (3479) MCM2 (4171) PPARG (5468) IL11RA (3590) MCM4 (4173) PPARGC1A (10891) IL12RB2 (3595) MCM5 (4174) PPP3CC (5533) IL15 (3600) MET (4233) PRKAA2 (5563) IL19 (29949) MFNG (4242) PRKAR1B (5575) PRKAR2A (5576) SOCS2 (8835) TNFSF10 (8743) PRKCB (5579) SOCS3 (9021) TNR (7143) PRKX (5613) SPOP (8405) TP53 (7157) PTCH1 (5727) SPRY1 (10252) TSHR (7253) PTEN (5728) SPRY2 (10253) TSPAN7 (7102) PTPRR (5801) SYK (6850) TSPAN7 (7102) PTTG2 (10744) TGFB1 (7040) TTK (7272) RAC2 (5880) TGFB3 (7043) UBE2T (29089) RASGRF2 (5924) TGFBR2 (7048) VEGFC (7424) RASGRP2 (10235) THBS1 (7057) WHSC1 (7468) RBX1 (9978) TLR2 (7097) WNT16 (51384) RELA (5970) TLR4 (7099) WNT3 (7473) RET (5979) TLX1 (3195) ZAK (51776) RFC4 (5984) TNC (3371) ZBTB16 (7704) RUNX1 (861) TNFAIP3 (7128) ZIC2 (7546) SHC1 (6464) TNFRSF10A (8797) SMAD3 (4088) TNFRSF10D (8793)
[0344] As identified by multiclass Significance Analysis of Microarrays (SAM), these genes in List 1 are differentially expressed in subgroups of individuals which have different patient outcomes. In other words, the markers are differentially expressed between patients that are more or less susceptible to TKI treatment.
[0345] These markers can therefore be used to distinguish between subgroups of patients which have different PFS and OS outcomes after TKI treatment. The markers can be used to identify cancers as sensitive to TKI treatment or resistant to TKI treatment.
[0346] The markers are generally involved in key oncogenic pathways. In the methods and uses of the invention, the expression levels of 5 or more, 10 or more, 15 or more, 20 or more, 30 or more, 40 or more, 50 or more, 60 or more, 70 or more, 80 or more, 90 or more, 100 or more, 110 or more, 115 or more, 120 or more, 140 or more, 160 or more, 180 or more 200 or more, or substantially all of, or all of the genes in List 1 may be determined. For example, the expression levels of at least 41, at least 43, at least 44, at least 45, at least 46, at least 47, at least 48, at least 49, at least 50, at least 60, at least 70, at least 80, at least 90, at least 100, at least 150, at least 200, or all 229 the genes in List 1 may be determined.
[0347] In particular, the genes in List 1 are used to stratify cancers that are already known (a) not to have PDGFRA-Hi and FGFR1-Lo expression and (b) having TP53 wildtype, into subgroups.
Determining Expression Levels of Genes
[0348] The below techniques can be used for determination of expression levels of genes in List1, and also tables 4 and 5.
[0349] Reference to determining the expression level refers to determination of the expression level of an expression product of the gene. Expression level may be determined at the nucleic acid level or the protein level.
[0350] The gene expression levels determined may be considered to provide an expression profile. By "expression profile" is meant a set of data relating to the level of expression of one or more of the relevant genes in an individual, in a form which allows comparison with comparable expression profiles (e.g. from individuals for whom the prognosis is already known), in order to assist in the determination of prognosis and in the selection of an individual for treatment with a TKI.
[0351] The determination of gene expression levels may involve determining the presence or amount mRNA in a sample of cancer cells. Methods for doing this are well known to the skilled person. Gene expression levels may be determined in a sample of cancer cells using any conventional method, for example using nucleic acid microarrays or using nucleic acid synthesis (such as quantitative PCR). For example, gene expression levels may be determined using RNA microarrays. The nucleic acid quantification methods discussed elsewhere herein, for example in relation to FGFR1 and PDGFRA may also be applied to the genes in List 1 and tables 4 and 5.
[0352] Alternatively or additionally, the determination of gene expression levels may involve determining the protein levels expressed from the genes in a sample containing cancer cells obtained from an individual. Protein expression levels may be determined by any available means, including using immunological assays. For example, expression levels may be determined by immunohistochemistry (IHC), Western blotting, ELISA, immunoelectrophoresis, immunoprecipitation and immunostaining. Using any of these methods it is possible to determine the relative expression levels of the proteins expressed from the genes listed in List 1 and tables 4 and 5.
[0353] Methods of determining protein expression levels are discussed in relation to the determination of FGFR1 and PDGFRA expression levels and such methods may also be used here, for example using specific binding agents capable of binding each of the proteins expressed from the genes listed in List 1 and tables 4 and 5.
[0354] Suitable kits for measuring the expression levels of these markers are described elsewhere herein.
Comparing Gene Expression Levels to Control Groups
[0355] Gene expression levels (from List 1 or a subset thereof, or from table 4 or a subset thereof) may be compared with the expression levels of the same genes in cancers from a group of patients known to respond well (having a good prognosis, or good OS and PFS) to TKI treatment, or be sensitive to TKI treatment. Gene expression levels may be compared to the expression levels of the same genes in cancers from a group of patients known to respond poorly to TKI treatment (having a poor prognosis, or poor OS and PFS) or be resistant to TKI treatment.
[0356] The patients/individuals to which the comparison is made may be referred to as the `control group`. Accordingly, the determined gene expression levels may be compared to the expression levels in a control group of individuals having cancer. The comparison may be made to expression levels determined in cancer cells of the control group. The comparison may be made to expression levels determined in samples of cancer cells from the control group. The cancer in the control group may be the same type of cancer as in the individual. For example, if the expression is being determined for an individual with soft tissue sarcoma (STS), the expression levels may be compared to the expression levels in the cancer cells of patients with soft tissue sarcoma.
[0357] Other factors may also be matched between the control group and the individual and cancer being tested. For example the stage of cancer may be the same. For example, if the individual being tested has advanced soft tissue sarcoma, the expression levels of the genes may be compared to the expression levels of the same genes in advanced soft tissue sarcomas in a group of patients known to have a good prognosis after treatment with a TKI and/or a group of patients known to have a poor prognosis after treatment with a TKI.
[0358] Additionally the control group may have been treated with the same TKI. For example, if the TKI is pazopanib, all of the patients in the control group(s) may have been treated with pazopanib.
[0359] Accordingly, an individual may be stratified or grouped according to their similarity of gene expression with the group with good or poor prognosis.
[0360] As used herein, a group of patients known to respond poorly to TKI treatment may be those known to have a poor outcome following TKI treatment as defined elsewhere herein. A group of patients known to respond well to TKI treatment may be those known to have a good outcome following TKI treatment as defined elsewhere herein, or a group having a superior outcome to those found to have a poor outcome following TKI treatment.
Methods for Classification Based on Gene Expression
[0361] As described in further detail in Example 1 herein, in order to create a test to identify biological subgroups, we used consensus clustering (CC) to objectively separate the 22 tumours into stable biological groups. The goal of the consensus clustering was to search for a partition of the 22 tumours into 2 or at most 8 groups using the expression of the 730 signature genes which had already been found to be associated with 13 canonical cancer pathway. We used hierarchical consensus clustering with 1-pearson correlation to identify robust unsupervised clusters by performing 200 iterations subsampling 80% of the samples each round. We identified 3 clearly separated biological groups, namely "A", "B" and "C". Using Multi-class Significant Analysis of Microarray (Tusher PNAS 2001, PMID:11309499), we identified a list of 229 genes with significant differential expressed among the three subgroups (see List 1). Using the Prediction Analysis of Microarray (PAM) algorithm, we built a standardised centroid for each of the biological subgroup (see Table 3 herein). The centroid was the average gene expression for each gene in each subtype (or "class", i.e. A or B or C) divided by the within-class standard deviation for that gene. Nearest centroid single sample classification takes the gene expression profile of a new sample, and compares it to each of these class centroids and assigns a sample to a subtype based on the nearest centroid. Subgroup prediction is done by calculating the Spearman's rank correlation of each test case to the three centroids, and assigning a sample to a subtype based on closest Eucleadian distance (1-Spearman Correlation) the nearest centroid.
[0362] The dominance of a particular biological subgroup for an individual tumour may be determined in an analogous fashion to that widely used for identifying intrinsic breast cancer subtypes using the PAM50 genes and Nanostring technology and a closest centroid approach (see, e.g., Parker et al. JCO, PMID: 19204204; Tibshirani 2002 PNAS PMID:12011421).
[0363] In some embodiments, the present invention provides methods for classifying, prognosticating, or monitoring sarcoma in subjects. In particular, data obtained from analysis of gene expression may be evaluated using one or more pattern recognition algorithms. Such analysis methods may be used to form a predictive model, which can be used to classify test data.
[0364] For example, one convenient and particularly effective method of classification employs multivariate statistical analysis modelling, first to form a model (a "predictive mathematical model") using data ("modelling data") from samples of known subgroup (e.g., from subjects known to have a particular sarcoma biological subgroups: A, B and C as defined by the genes in List 1 and the centroids given in table 3; or from subjects known to have a particular sarcoma biological subgroups based on the genes listed in table 4 and the centroids given in table 6), and second to classify an unknown sample (e.g., "test sample") according to subgroup. Pattern recognition methods have been used widely to characterize many different types of problems ranging, for example, over linguistics, fingerprinting, chemistry and psychology. In the context of the methods described herein, pattern recognition is the use of multivariate statistics, both parametric and non-parametric, to analyse data, and hence to classify samples and to predict the value of some dependent variable based on a range of observed measurements. There are two main approaches. One set of methods is termed "unsupervised" and these simply reduce data complexity in a rational way and also produce display plots which can be interpreted by the human eye. However, this type of approach may not be suitable for developing a clinical assay that can be used to classify samples derived from subjects independent of the initial sample population used to train the prediction algorithm.
[0365] The other approach is termed "supervised" whereby a training set of samples with known class or outcome is used to produce a mathematical model which is then evaluated with independent validation data sets. Here, a "training set" of gene expression data is used to construct a statistical model that predicts correctly the "subgroup" of each sample. This training set is then tested with independent data (referred to as a test or validation set) to determine the robustness of the computer-based model. These models are sometimes termed "expert systems," but may be based on a range of different mathematical procedures such as support vector machine, decision trees, k-nearest neighbour and naive Bayes. Supervised methods can use a data set with reduced dimensionality (for example, the first few principal components), but typically use unreduced data, with all dimensionality. In all cases the methods allow the quantitative description of the multivariate boundaries that characterize and separate each subtype in terms of its intrinsic gene expression profile. It is also possible to obtain confidence limits on any predictions, for example, a level of probability to be placed on the goodness of fit (see, for example, Kowalski et al., 1986). The robustness of the predictive models can also be checked using cross-validation, by leaving out selected samples from the analysis.
[0366] The PARSARC classification model described herein is based on the gene expression profile for a plurality of subject samples using the genes listed in List 1. The plurality of samples includes a sufficient number of samples derived from subjects belonging to each subgroup class. By "sufficient samples" or "representative number" in this context is intended a quantity of samples derived from each subtype that is sufficient for building a classification model that can reliably distinguish each subgroup from all others in the group. A supervised prediction algorithm is developed based on the profiles of objectively-selected IHCnegTP53 wt (non-PDGFRA-Hi/FGFR1-Lo; TP53 wt) prototype samples for "training" the algorithm. The samples are selected and subtyped using an expanded gene set, such as that of the genes of List 1.
[0367] A similar approach may be applied to the genes listed in table 4.
[0368] Alternatively, the samples can be subtyped according to any known assay for classifying sarcoma subgroups. After stratifying the training samples according to subtype, a centroid-based prediction algorithm is used to construct centroids based on the expression profile of the intrinsic gene set described in List 1. An exemplary centroid for each of three tumour subtypes A-C is shown in Table 3 herein.
[0369] Alternatively, after stratifying the training samples according to subtype, a centroid-based prediction algorithm is used to construct centroids based on the expression profile of the intrinsic gene set described in table 4. An exemplary centroid for each of five tumour subtypes is shown in Table 6 herein.
[0370] "Translation" of the descriptor coordinate axes can be useful. Examples of such translation include normalization and mean-centering. "Normalization" may be used to remove sample-to-sample variation. Some commonly used methods for calculating normalization factor include: (i) global normalization that uses all genes on the microarray or nanostring codeset; (ii) housekeeping genes normalization that uses constantly expressed housekeeping/invariant genes; and (iii) internal controls normalization that uses known amount of exogenous control genes added during hybridization (Quackenbush (2002) Nat. Genet. 32 (Suppl.), 496-501). In one embodiment, the genes listed in List 1 can be normalized to control housekeeping genes. Exemplary housekeeping genes include MRPL19, PSMC4, SF3A1, PUM1, ACTB, GAPD, GUSB, RPLPO, and TFRC. It will be understood by one of skill in the art that the methods disclosed herein are not bound by normalization to any particular housekeeping genes, and that any suitable housekeeping gene(s) known in the art can be used. Many normalization approaches are possible, and they can often be applied at any of several points in the analysis. In one embodiment, microarray data is normalized using the LOWESS method, which is a global locally weighted scatterplot smoothing normalization function. In another embodiment, qPCR data is normalized to the geometric mean of set of multiple housekeeping genes.
[0371] "Mean-centering" may also be used to simplify interpretation for data visualisation and computation. Usually, for each descriptor, the average value of that descriptor for all samples is subtracted. In this way, the mean of a descriptor coincides with the origin, and all descriptors are "centered" at zero. In "unit variance scaling," data can be scaled to equal variance. Usually, the value of each descriptor is scaled by 1/StDev, where StDev is the standard deviation for that descriptor for all samples. "Pareto scaling" is, in some sense, intermediate between mean centering and unit variance scaling. In pareto scaling, the value of each descriptor is scaled by 1/sqrt(StDev), where StDev is the standard deviation for that descriptor for all samples. In this way, each descriptor has a variance numerically equal to its initial standard deviation. The pareto scaling may be performed, for example, on raw data or mean centered data.
[0372] "Logarithmic scaling" may be used to assist interpretation when data have a positive skew and/or when data spans a large range, e.g., several orders of magnitude. Usually, for each descriptor, the value is replaced by the logarithm of that value. In "equal range scaling," each descriptor is divided by the range of that descriptor for all samples. In this way, all descriptors have the same range, that is, 1. However, this method is sensitive to presence of outlier points. In "autoscaling," each data vector is mean centered and unit variance scaled. This technique is a very useful because each descriptor is then weighted equally, and large and small values are treated with equal emphasis. This can be important for genes expressed at very low, but still detectable, levels.
[0373] In one embodiment, data is collected for one or more test samples and classified using the PARSARC classification model described herein. When comparing data from multiple analyses (e.g., comparing expression profiles for one or more test samples to the centroids constructed from samples collected and analyzed in an independent study), it will be necessary to normalize data across these data sets. In one embodiment, Distance Weighted Discrimination (DWD) is used to combine these data sets together (Benito et al. (2004) Bioinformatics 20(1): 105-114, incorporated by reference herein in its entirety). DWD is a multivariate analysis tool that is able to identify systematic biases present in separate data sets and then make a global adjustment to compensate for these biases; in essence, each separate data set is a multi-dimensional cloud of data points, and DWD takes two points clouds and shifts one such that it more optimally overlaps the other.
[0374] In some embodiments described herein, the prognostic performance of the PARSARC IHC, TP53 mutational status and biological and/or other clinical parameters is assessed utilizing a Cox Proportional Hazards Model Analysis, which is a regression method for survival data that provides an estimate of the hazard ratio and its confidence interval. The Cox model is a well-recognized statistical technique for exploring the relationship between the survival of a patient and particular variables. This statistical method permits estimation of the hazard (i.e., risk) of individuals given their prognostic variables (e.g., intrinsic gene expression profile with or without additional clinical factors, as described herein). The "hazard ratio" is the risk of death at any given time point for patients displaying particular prognostic variables.
Prognosis
[0375] An individual grouped with the good prognosis group, may be identified as having a cancer that is sensitive to TKI treatment, they may also be referred to as an individual that responds well to TKI treatment. An individual grouped with the poor prognosis group, may be identified as having a cancer that is resistant to TKI treatment, they may also be referred to as an individual that responds poorly to TKI treatment.
[0376] Where the individual is grouped with the good prognosis group, the individual may be selected for treatment with the TKI. Where the individual is grouped with the poor prognosis group, the individual may be deselected for treatment with the TKI.
[0377] Whether a prognosis is considered good or poor may vary between cancers and stage of disease. In general terms a good prognosis is one where the OS and/or PFS is longer than average for that stage and cancer type. A prognosis may be considered poor if PFS and/or OS is lower than average for that stage and type of cancer. The average may be the mean OS or PFS.
[0378] For example, a prognosis may be considered good if the PFS is >6 months and/or OS >18 months. Similarly PFS of <6 months or OS of <18 months may be considered poor. In particular PFS of >6 months and/or OS of >18 months may be considered good for advanced cancers.
[0379] In particular PFS of >6 months and/or OS of >18 months may be considered good for pazopanib treatment, for example of soft tissue sarcoma (STS), in particular advanced STS.
[0380] In general terms, a "good prognosis" is one where survival (OS and/or PFS) of an individual patient can be favourably compared to what is expected in a population of patients within a comparable disease setting. This might be defined as better than median survival (i.e. survival that exceeds that of 50% of patients in population).
[0381] In particular, PFS >4 months and/or OS >12 months may be considered good following pazopanib treatment for patients with advanced soft tissue sarcomas, based on median survival in the pazopanib arm in the PALLETTE trial. Very good survival in the same population might be considered PFS >6 months and/or OS >18 months.
[0382] "Predicting the likelihood of survival of a sarcoma patient" is intended to assess the risk that a patient will die as a result of the underlying sarcoma.
[0383] "Predicting the likelihood of progression-free survival" is intended to mean that the patient neither dies nor experiences radiological disease progression by RECIST criteria.
[0384] "Predicting the response of a sarcoma patient to a selected treatment" is intended to mean assessing the likelihood that a patient will experience a positive or negative outcome with a particular treatment.
[0385] As used herein, "indicative of a positive treatment outcome" refers to an increased likelihood that the patient will experience beneficial results from the selected treatment (e.g. reduction in tumour size, `good` prognostic outcome, improvement in disease-related symptoms and/or quality of life).
[0386] "Indicative of a negative treatment outcome" is intended to mean an increased likelihood that the patient will not receive the aforementioned benefits of a positive treatment outcome.
Combinations of Tests
[0387] The present inventors have found that the FGFR1/PDGFRA expression, TP53 mutation status and gene expression signatures using the genes in List 1, or a sub-set thereof have more predictive power for response to TKI when used in combination. In one particular example, they may be combined in a decision tree classifier as depicted in FIG. 5.
[0388] Accordingly, in the methods of the invention, any of the three methods may be used individually or in combination.
[0389] For example, the TP53 mutational status and the expression levels of FGFR1 & PDGFRA may both be determined. These two tests were found to have an additive predictive ability for progression-free and overall survival.
[0390] For example, for an individual with a cancer determined to have the PDGFRA-Hi/FGFR1-Lo phenotype, an alternative therapy to the TKI may be considered. For cancers with other PDGFRA/FGFR1 expression profiles, further tests may be carried out. In other words in cancers determined not to have PDGFRA-Hi/FGFR1-Lo expression, e.g. to have PDGFRA-Hi/FGFR1-Hi, PDGFRA-Lo/FGFR1-Lo, PDGFRA-Lo/FGFR1-Hi further test may be carried out.
[0391] The mutation status of TP53 may be determined for a cancer determined not to have PDGFRA-Hi/FGFR1-Lo expression be PDGFRA-Hi/FGFR1-Hi, PDGFRA-Lo/FGFR1-Lo or PDGFRA-Lo/FGFR1-Hi.
[0392] Similarly, for cancers determined to be TP53 wildtype, further tests can be carried out. For example, PDGFRA/FGFR1 expression levels can be determined.
[0393] Accordingly, cancers which are determined not to have PDGFRA-Hi/FGFR1-Lo expression (e.g. as having PDGFRA-Hi/FGFR1-Hi, PDGFRA-Lo/FGFR1-Lo or PDGFRA-Lo/FGFR1-Hi) and TP53 wildtype may be identified as having a relatively good prognosis following TKI treatment and be selected for treatment with a TKI.
[0394] Cancers determined not to have PDGFRA-Hi/FGFR1-Lo expression (e.g. to be PDGFRA-Hi/FGFR1-Hi, PDGFRA-Lo/FGFR1-Lo or PDGFRA-Lo/FGFR1-Hi) and TP53 mutated may be deselected from TKI treatment. Cancers determined to be PDGFRA-Hi/FGFR1-Lo and TP53 wildtype may be deselected from TKI treatment. In other words if a cancer is determined to be TP53 mutated, and/or PDGFRA-Hi/FGFR1-Lo it may be determined to have a relatively poor prognosis following treatment with a TKI and deselected for treatment with a TKI.
[0395] The TP53 and FGFR1/PDGFRA statuses may also be combined with the levels of gene expression of the genes in List 1 to further select patients with cancers suitable for TKI (eg. Pazopanib) treatment. In particular, for a cancer which determined not to have PDGFRA-Hi/FGFR1-Lo expression (e.g. to have PDGFRA-Hi/FGFR1-Hi, PDGFRA-Lo/FGFR1-Lo or PDGFRA-Lo/FGFR1-Hi) and TP53 wildtype, the gene expression levels of genes selected from those in List 1 may be determined.
[0396] Any combination of the tests is possible. For example individuals may be selected or deselected for treatment with the TKI, stratified, or given a prognosis based on expression of PDGFRA and FGFR1 and the expression levels of genes selected from List 1. For example, individuals may be selected or deselected for treatment with the TKI, stratified, or given a prognosis based on expression of PDGFRA and FGFR1 and TP53 mutation status. For example individuals may be selected or deselected for treatment with the TKI, stratified, or given a prognosis based on TP53 mutation status and the expression levels of genes selected from List 1. For example individuals may be selected or deselected for treatment with the TKI, stratified, or given a prognosis based on expression of PDGFRA and FGFR1, TP53 mutation status, and the expression levels of genes selected from List 1.
[0397] In particular, an individual may be selected for treatment with a TKI or determined to have a good prognosis following TKI treatment if they meet one, two or all of the criteria: [0398] (a) they do not to have PDGFRA-Hi/FGFR1-Lo expression (e.g. have PDGFRA-Hi/FGFR1-Hi, PDGFRA-Lo/FGFR1-Lo, or PDGFRA-Lo/FGFR1-Hi expression levels); [0399] (b) they have wildtype TP53; and [0400] (c) based on the expression levels of genes selected from List 1.
[0401] In particular, for part (c), an individual may be selected for treatment with a TKI or determined to have a good prognosis if they are identified as sensitive to TKI treatment based on the expression levels of genes selected from List 1. For example, an individual may be selected for treatment with a TKI if the expression profile of the genes of List 1 measured for the sample from the individual are a closest match to the centroid of subgroup A relative to the centroids of subgroup B and C. The centroids may be pre-determined centroids such as the exemplary centroids shown in Table 3 or otherwise pre-determined and, for example, retrieved from an electronic data record or the centroids may be established de novo by making use of a training set of gene expression profiles from a plurality of subjects known to have responded well to TKI therapy, and from a plurality of subjects known to have responded poorly to TKI therapy, for a cancer of interest.
[0402] In particular, an individual may be deselected from treatment with a TKI or determined to have a poor prognosis following TKI treatment if they meet one, two or all of the criteria: [0403] (a) they have PDGFRA-Hi/FGFR1-Lo expression levels; [0404] (b) they have mutated TP53; and [0405] (c) based on the expression levels of genes selected from List 1.
[0406] In particular, for part (c), an individual may be deselected for treatment with a TKI or determined to have a poor prognosis if they are identified as resistant to TKI treatment based on the expression levels of genes selected from List 1. For example, an individual may be deselected for treatment with a TKI if the expression profile of the genes of List 1 measured for the sample from the individual are a closest match to the centroid of subgroup B or C relative to the centroid of subgroup A. The centroids may be pre-determined centroids such as the exemplary centroids shown in Table 3 or otherwise pre-determined and, for example, retrieved from an electronic data record or the centroids may be established de novo by making use of a training set of gene expression profiles from a plurality of subjects known to have responded well to TKI therapy, and from a plurality of subjects known to have responded poorly to TKI therapy, for a cancer of interest.
[0407] Details of the protocols are given elsewhere herein.
[0408] In some embodiments the determining steps are carried out in series. After a determining step an individual with cancer may be selected for a further determining step using the criteria above, or may be deselected. This makes a `decision tree` allowing efficient selection of patients for treatment with a TKI. For example, the decision tree shown in FIG. 5 can be followed.
[0409] For example the PDGFRA and FGFR1 expression status may be determined in a sample of cancer cells from an individual. If the expression levels are PDGFRA-Hi/FGFR1-Lo, the individual is deselected or determined to have a poor prognosis.
[0410] If the expression levels are not PDGFRA-Hi/FGFR1-Lo (e.g. PDGFRA-Hi/FGFR1-Hi, PDGFRA-Lo/FGFR1-Lo or PDGFRA-Lo/FGFR1-Hi) then the individual is selected to determine the TP53 mutation status. If the TP53 is mutated, the individual may be deselected or determined to have a poor prognosis.
[0411] If TP53 is wildtype, then the individual is selected to determine the expression levels of 5 or more of the genes in List 1. The patient may be selected or deselected based on the expression profile. In particular, the gene expression profile measured for a sample from the individual may be assessed for closeness of fit to gene expression centroids of subgroups differing in respect of their TKI treatment outcome for the cancer of interest. For example, the gene expression profile measured for a sample from the individual may be assessed for closeness of fit to gene expression centroids shown in Table 3.
[0412] Similarly, the TP53 mutation status may be first determined. If the TP53 is mutated, the individual may be deselected or determined to have a poor prognosis. If TP53 is wildtype, then the individual is selected to determine PDGFRA and FGFR1 expression status. If the expression levels are PDGFRA-Hi/FGFR1-Lo, the individual is deselected or determined to have a poor prognosis. If the expression levels are not PDGFRA-Hi/FGFR1-Lo (e.g. PDGFRA-Hi/FGFR1-Hi, PDGFRA-Lo/FGFR1-Lo or PDGFRA-Lo/FGFR1-Hi) then the individual is selected to determine the expression levels of genes selected from List 1. The patient may be selected or deselected based on the expression profile of these genes.
[0413] In some embodiments the gene expression profile is only determined for an individual having a cancer which has been determined not to have PDGFRA-Hi/FGFR1-Lo expression (e.g. PDGFRA-Hi/FGFR1-Hi, PDGFRA-Lo/FGFR1-Lo or PDGFRA-Lo/FGFR1-Hi) and TP53 wildtype. Testing of PDGFRA & FGFR1 expression and TP53 mutation status may be sequential or in parallel.
[0414] In some embodiments the gene expression profile, PDGFRA & FGFR1 expression and TP53 mutation status are all determined in parallel.
Tyrosine Kinase Inhibitors
[0415] Tyrosine kinase inhibitors which can be used for the treatment of cancer find use in the present invention, in particular TKIs with a similar activity profile to Pazopanib.
[0416] These include the small molecule inhibitors Pazopanib (CAS number 444731-52-6), Regorafenib (CAS number 755037-03-7), Sorafenib (CAS number 284461-73-0), Sunitinib (CAS number 341031-54-7), Lenvatinib (CAS number 417716-92-8), Axitinib (CAS number 319460-85-0), Nintedanib (CAS number 656247-18-6), and Ponatinib (CAS number 943319-70-8), and pharmaceutically acceptable salts thereof.
[0417] Any one of these TKIs may be used in accordance with the present invention. In a preferred embodiment the TKI is Pazopanib.
[0418] Salts or derivatives of the exemplary inhibitors may be used for the treatment of cancer. As used herein "derivatives" of the therapeutic agents includes salts, coordination complexes, esters such as in vivo hydrolysable esters, free acids or bases, hydrates, prodrugs or lipids, coupling partners.
[0419] Salts of the compounds of the invention are preferably physiologically well tolerated and non-toxic. Many examples of salts are known to those skilled in the art. Compounds having acidic groups, such as phosphates or sulfates, can form salts with alkaline or alkaline earth metals such as Na, K, Mg and Ca, and with organic amines such as triethylamine and Tris (2-hydroxyethyl) amine. Salts can be formed between compounds with basic groups, e.g., amines, with inorganic acids such as hydrochloric acid, phosphoric acid or sulfuric acid, or organic acids such as acetic acid, citric acid, benzoic acid, fumaric acid, or tartaric acid. Compounds having both acidic and basic groups can form internal salts.
[0420] Esters can be formed between hydroxyl or carboxylic acid groups present in the compound and an appropriate carboxylic acid or alcohol reaction partner, using techniques well known in the art.
[0421] Derivatives which as prodrugs of the compounds are convertible in vivo or in vitro into one of the parent compounds. Typically, at least one of the biological activities of compound will be reduced in the prodrug form of the compound, and can be activated by conversion of the prodrug to release the compound or a metabolite of it.
[0422] Other derivatives include coupling partners of the compounds in which the compounds is linked to a coupling partner, e.g. by being chemically coupled to the compound or physically associated with it. Examples of coupling partners include a label or reporter molecule, a supporting substrate, a carrier or transport molecule, an effector, a drug, an antibody or an inhibitor. Coupling partners can be covalently linked to compounds of the invention via an appropriate functional group on the compound such as a hydroxyl group, a carboxyl group or an amino group. Other derivatives include formulating the compounds with liposomes.
Cancers
[0423] The cancers which are stratified and treated according to the present invention are any of the cancers treatable using the TKIs. Accordingly, cancers to be treated or stratified according to the present invention include:
[0424] Soft tissues sarcomas (STS), for example advanced soft tissue sarcomas, metastatic renal cell carcinomas (mRCC), gastrointestinal stromal tumour (GIST), hepatocellular carcinoma (HCC), neuroendocrine tumour (NET), medullary thyroid cancer (MTC; also known as medullary thyroid carcinoma), non-squamous non-small cell lung cancer (NSCLC), and chronic myeloid leukaemia (CML).
[0425] In particular the cancer may be STS, for example advanced STS.
[0426] The treatment may be the first, second or third line treatment.
[0427] If the cancer is a soft tissues sarcoma (STS), the methods disclosed herein may be employed to determine suitability for treatment with Pazopanib or Regorafenib, in particular Pazopanib.
[0428] If the cancer is a metastatic renal cell carcinoma (mRCC), the methods disclosed herein may be employed to determine suitability for treatment with Pazopanib, Sorafenib, Sunitinib, Lenvatinib or Axitinib. In particular the methods may be used to determine suitability of Pazopanib for treatment of metastatic renal cell carcinoma.
[0429] If the cancer is a gastrointestinal stromal tumour (GIST), the methods disclosed herein may be employed to determine suitability for treatment with Regorafenib or Sunitinib. The methods may be used to determine suitability of Regorafenib as a third-line treatment for GIST.
[0430] If the cancer is a hepatocellular carcinoma (HCC), the methods disclosed herein may be employed to determine suitability for treatment with Sorafenib.
[0431] If the cancer is a neuroendocrine tumour (NET), the methods disclosed herein may be employed to determine suitability for treatment with Sunitinib.
[0432] If the cancer is a medullary thyroid cancer (MTC), the methods disclosed herein may be employed to determine suitability for treatment with Lenvatinib.
[0433] If the cancer is a non-squamous non-small cell lung cancer (non-squamous NSCLC), the methods disclosed herein may be employed to determine suitability for treatment with Nintedanib. The methods may be used to determine suitability of Nintedanib as a second-line treatment for non-squamous NSCLC.
[0434] If the cancer is a chronic myeloid leukaemia (CML), the methods disclosed herein may be employed to determine suitability for treatment with Ponatinib. The methods may be used to determine suitability of Ponatinib to treat solid tumour CML.
[0435] In particular the cancer may be a soft-tissue sarcoma and the TKI may be Pazopanib. For example the cancer may be an advanced soft tissue sarcoma.
[0436] Methods of stratification, identification and treatments disclosed herein particularly apply to soft-tissue sarcomas and treatment with pazopanib. In particular the soft-tissue sarcoma is advanced STS and the TKI is pazopanib.
[0437] The methods disclosed herein may be applied to advanced cancers. Generally `advanced` cancers are not amenable to curative surgery, because they are locally advanced, locally recurrent or metastatic. For example, advanced STS is STS that is not amenable to curative surgery.
[0438] It is also contemplated that the methods disclosed herein would be useful in early stage disease, for example pre-operatively.
Individuals
[0439] The individuals to be treated, stratified or tested for selection in accordance with the present invention may, in some cases, not have previously been treated with the TKI, e.g. pazopanib. However, in certain cases, the individual may have been treated with, or may be undergoing treatment with, a TKI (e.g. pazopanib). In such cases, the methods of the present invention may find use in, for example, monitoring treatment and/or predicting the future course of continuing treatment with a TKI (e.g. pazopanib).
[0440] The individual to be treated is an animal, preferably a mammal, in particular a human.
[0441] Any individual that is not selected for treatment with a TKI, or who is given a poor prognosis with TKI treatment, may be `deselected` from treatment with a TKI, or selected for an alternative treatment as discussed elsewhere herein.
[0442] The aspects of the invention relating to prognosis, treatment, selection of patients for treatment and devices suitable for use in these methods are discussed in more detail below. The details about particular TKIs, cancers and methods of carrying out tests on cancer cell samples as described above apply to all of these aspects.
Samples
[0443] A "test sample" as used herein may, in some cases, be a cell or tissue sample (e.g. a biopsy), a biological fluid, an extract (e.g. a protein or DNA extract obtained from the subject). In particular, the sample may be a tumour sample, a blood sample (including plasma or serum sample), a cerebrospinal fluid sample, or a non-tumour tissue sample. The sample may be one which has been freshly obtained from the subject or may be one which has been processed and/or stored prior to making a determination (e.g. frozen, fixed or subjected to one or more purification, enrichment or extractions steps). In some cases, the sample may be obtained directly from the tumour, obtained from circulating cancer cells and/or circulating tumour DNA.
Determining Prognosis, Selecting Individuals for Treatment and Stratification of Patients
[0444] In one aspect, the invention relates to methods for determining a prognosis, and in particular to methods of identifying individuals with a poor prognosis or good prognosis following TKI treatment. Such a prognosis may help determine whether a TKI inhibitor should be administered.
[0445] The invention also relates to methods for stratification or grouping of individuals with cancer according to their prognoses following treatment with a TKI. The method may involve stratifying individuals into a sub-group having poor prognoses or good prognoses.
[0446] The invention also relates to methods of selecting individuals for treatment with a tyrosine kinase inhibitor. An individual determined to have a good prognosis following TKI treatment may be selected for treatment with a TKI. An individual determined to have a poor prognosis following TKI treatment may be deselected for treatment with a TKI.
[0447] These methods may be described as in vitro methods.
[0448] The methods may be useful for determining the likelihood of an individual responding to treatment with a TKI and for helping to determine appropriate treatments for individuals with cancer.
[0449] The methods may be useful for identifying individuals with cancer having inherent resistance to a TKI, e.g. pazopanib.
[0450] The markers identified by the present inventors are markers of patient outcomes. They can be used to predict prognosis following treatment with a tyrosine kinase inhibitor. In particular, the inventors have identified markers of progression-free survival (PFS) and overall survival (OS).
[0451] PFS is the time from first dose of TKI until radiological disease progression or death from any cause. OS is the time from first dose with a TKI until death from any cause. PFS and OS are generally expressed in months.
[0452] In this context the poor and good prognosis are relative. Whether a prognosis is considered good or poor may very between cancers and stage of disease. In general terms a good prognosis is one where the OS and/or PFS is longer than average for that stage and cancer type. A prognosis may be considered poor if PFS and/or OS is lower than average for that stage and type of cancer. The average may be the mean OS or PFS.
[0453] For example, a prognosis may be considered good if the PFS is >6 months and/or OS >18 months. Similarly PFS of <6 months or OS of <18 months may be considered poor. In particular PFS of >6 months and/or OS of >18 months may be considered good for advanced cancers.
[0454] In particular PFS of >6 months and/or OS of >18 months may be considered good for pazopanib treatment, for example of soft tissue sarcoma (STS), in particular advanced STS.
[0455] For example, a prognosis may be considered good if the PFS is >6 months and/or OS >18 months. Similarly PFS of <6 months or OS of <18 months may be considered poor. In particular PFS of >6 months and/or OS of >18 months may be considered good for advanced cancers.
[0456] In particular PFS of >6 months and/or OS of >18 months may be considered good for pazopanib treatment, for example of soft tissue sarcoma (STS), in particular advanced STS.
[0457] In general terms, a "good prognosis" is one where survival (OS and/or PFS) of an individual patient can be favourably compared to what is expected in a population of patients within a comparable disease setting. This might be defined as better than median survival (i.e. survival that exceeds that of 50% of patients in population).
[0458] In particular, PFS >4 months and/or OS >12 months may be considered good following pazopanib treatment for patients with advanced soft tissue sarcomas, based on median survival in the pazopanib arm in the PALLETTE trial. Very good survival in the same population might be considered PFS >6 months and/or OS >18 months.
[0459] Any of the methods may use one or more of: 1) expression of FGFR1 and PDGFRA, 2) TP53 mutational status, and 3) expression profiles for genes involved in key oncogenic pathways (those shown in list 1).
[0460] The methods may make use of the expression profiles of genes shown in table 5.
[0461] The methods may make use of the expression profiles of genes shown in table 4.
[0462] The same methods and markers may be applied to determine whether a cancer in an individual is likely to be sensitive to TKI treatment. In other words, markers of a good prognosis following TKI treatment are also markers of a cancer that is sensitive to TKI treatment. Markers of a poor prognosis following TKI treatment are also markers of a cancer that is resistant to TKI treatment. Accordingly, the methods of determining a prognosis may also be considered methods of determining sensitivity of a cancer to TKI treatment.
[0463] The methods may comprise the step of determining the expression levels of PDGFRA and FGFR1 as `high`(Hi) or `low`(Lo) in a sample of cancer cells from an individual. The individual is selected for treatment or determined to have a good prognosis or stratified as having a good prognosis if they have: [0464] (i) PDGFRA-Hi/FGFR1-Hi [0465] (ii) PDGFRA-Lo/FGFR1-Lo, or [0466] (iii) PDGFRA-Lo/FGFR1-Hi expression levels.
[0467] The individual may be selected for treatment or determined to have a good prognosis or stratified as having a good prognosis if they have PDGFRA-Lo and/or FGFR1-Hi expression levels. Accordingly, the criteria of PDGFRA-Lo and/or FGFR1-Hi may be applied to any of the applications and methods disclosed herein in place of the PDGFRA-Hi/FGFR1-Hi or PDGFRA-Lo/FGFR1-Lo, or PDGFRA-Lo/FGFR1-Hi criterion.
[0468] The methods may also use the mutation status of TP53. Accordingly, the methods may comprise the step of determining the mutation status of TP53 in a sample of cancer cells from an individual. The individual is selected for treatment or determined to have a good prognosis or stratified as having a good prognosis if they have wildtype TP53.
[0469] The methods may also use gene expression profiles. Accordingly, the method may comprise the step of determining the expression levels in a sample of cancer cells from the individual of 5 or more of the genes selected from List 1. The individual is selected for treatment or determined to have a good prognosis or stratified as having a good prognosis based on the expression levels of those genes. In particular, the individual is selected for treatment or determined to have a good prognosis or stratified as having a good prognosis if the expression profile of the genes of List 1 measured in a sample obtained from the individual is a closest match for the centroid of subgroup A as defined herein (e.g. the exemplary centroids shown in Table 3). These gene expression profiles may be applied to cancers that are already determined (a) not to be PDGFRA-Hi/FGFR1-Lo, and (b) TP53 wildtype.
[0470] As mentioned elsewhere these methods may be combined for further selection and to give a better indication of patient outcome.
[0471] Accordingly the methods may comprise the steps of: [0472] (a) determining the expression levels of PDGFRA and FGFR1 as `high` (Hi) or `low` (Lo) in a sample of cancer cells from the individual, and selecting an individual for treatment or determining a good prognosis following treatment with a TKI if they have PDGFRA-Hi/FGFR1-Hi, PDGFRA-Lo/FGFR1-Lo, or PDGFRA-Lo/FGFR1-Hi expression levels, [0473] (b) determining the mutation status of TP53 in a sample of cancer cells from the individual and selecting an individual for treatment with a TKI or determining a good prognosis following treatment with a TKI if they have wildtype TP53, and [0474] (c) determining the expression levels of 5 or more of the genes in List 1 in a sample of cancer cells from the individual, and selecting an individual for treatment with the TKI or determining a good prognosis following treatment with a TKI based on the expression levels of those genes if the expression.
[0475] The methods may comprise the steps of: [0476] (a) determining the expression levels of PDGFRA and FGFR1 as `high` (Hi) or `low` (Lo) in a sample of cancer cells from the individual, and selecting an individual for treatment or determining a good prognosis following treatment with a TKI if they have PDGFRA-Lo and/or FGFR1-Hi expression levels, [0477] (b) determining the mutation status of TP53 in a sample of cancer cells from the individual and selecting an individual for treatment with a TKI or determining a good prognosis following treatment with a TKI if they have wildtype TP53, and [0478] (c) determining the expression levels of 5 or more of the genes in List 1 in a sample of cancer cells from the individual, and selecting an individual for treatment with the TKI or determining a good prognosis following treatment with a TKI based on the expression levels of those genes if the expression.
[0479] The patient/individual may only selected for treatment with the TKI or determining a good prognosis following treatment with a TKI if the selection criteria are met for the determining steps carried out in the method.
[0480] A patient/individual may be selected for treatment with the TKI or determined to have a good prognosis following treatment with a TKI if they have PDGFRA-Hi/FGFR1-Hi, PDGFRA-Lo/FGFR1-Lo, or PDGFRA-Lo/FGFR1-Hi expression levels and they have wildtype TP53. A patient may be selected for treatment with the TKI or determined to have a good prognosis following treatment with a TKI if they have PDGFRA-Hi/FGFR1-Hi, PDGFRA-Lo/FGFR1-Lo, or PDGFRA-Lo/FGFR1-Hi expression levels and based on the expression levels of 5 or more of the genes in List 1. A patient may be selected for treatment with the TKI or determined to have a good prognosis following treatment with a TKI if they have wildtype TP53 and based on the expression levels of 5 or more of the genes in List 1.
[0481] A patient may be selected for treatment with the TKI or determined to have a good prognosis following treatment with a TKI if they have PDGFRA-Hi/FGFR1-Hi, PDGFRA-Lo/FGFR1-Lo, or PDGFRA-Lo/FGFR1-Hi expression levels, wildtype TP53, and based on the expression levels of 5 or more of the genes in List 1.
[0482] Patients who do not meet one more of the criteria may be deselected from treatment with the tyrosine kinase inhibitor.
[0483] In some embodiments the determining steps are carried out in series. After a determining step an individual with cancer may be selected for a further determining step using the criteria above, or may be deselected. This makes a `decision tree` allowing efficient selection of patients for treatment with a TKI. For example, the decision tree shown in FIG. 5 can be followed.
[0484] Alternatively, the methods may make use of the expression profiles of genes shown in table 5. The method may comprise determining the expression levels of 20 or more genes from table 5, and optionally: [0485] (i) determining the mutation status of TP53 in a sample of cancer cells from the individual; and [0486] (ii) determining the expression levels of 5 or more 10 or more, 15 or more, 20 or more, 30 or more, 40 or more, 50 or more, 60 or more, 70 or more, 80 or more, 90 or more, 100 or more, 110 or more, 115 or more, 120 or more, 140 or more, 160 or more, 180 or more 200 or more, or substantially all of, or all of the genes in List 1 in a sample of cancer cells from the individual.
[0487] An individual may be determined to have a good prognosis following TKI treatment if they have a cancer having expression levels of 20 or more of the genes in table 5 a closer match to a second reference centroid corresponding to the expression profile of said 20 or more genes determined in a second group of subjects known not to have PDGFRA-Hi/FGFR1-Lo expression, than a first reference centroid corresponding to the expression profile of said 20 or more genes determined in a first group of subjects known to have PDGFRA-Hi/FGFR1-Lo expression, and optionally: [0488] (i) wildtype TP53; and [0489] (ii) the expression levels of genes in the sample are determined to be similar to the expression levels of the same genes in a group of patients known to respond well to TKI treatment, wherein the group of patients has cancer, preferably the same type of cancer as the individual.
[0490] An individual may be determined to have a poor prognosis if they have a cancer having expression levels of 20 or more of the genes in table 5 a closer match to a first reference centroid corresponding to the expression profile of said 20 or more genes determined in a first group of subjects known to have PDGFRA-Hi/FGFR1-Lo expression, than a second reference centroid corresponding to the expression profile of said 20 or more genes determined in a second group of subjects known not to have PDGFRA-Hi/FGFR1-Lo expression.
[0491] The methods may make use of the expression profiles of genes shown in table 4. The method may comprise determining the expression levels of 40 or more genes from table 4.
[0492] An individual may be determined to have a good prognosis following TKI treatment if they have a cancer having the expression levels of the 40 or more genes in table 4 a closer match to a third reference centroid than said first, second, fourth or fifth reference centroids, wherein the reference centroids are: [0493] (a) a first reference centroid corresponding to the expression profile of said 40 or more genes determined in a first group of subjects known to have cancer with PDGFRA-Hi/FGFR1-Lo expression; [0494] (b) a second reference centroid corresponding to the expression profile of said 40 or more genes determined in a second group of subjects known to have cancer with mutated TP53 and not PDGFRA-Hi/FGFR1-Lo expression; [0495] (c) a third reference centroid corresponding to the expression profile of said 40 or more genes determined in a third group of subjects known to have cancer with (a) a gene expression profile having a closer match to the centroid of subgroup A shown in table 3 than subgroups B or C, and (b) TP53 wild-type, and (c) not PDGFRA-Hi/FGFR1-Lo expression; [0496] (d) a fourth reference centroid corresponding to the expression profile of said 40 or more genes determined in a fourth group of subjects known to have cancer with (a) a gene expression profile having a closer match to the centroid of subgroup B shown in table 3 than subgroups A or C, and (b) TP53 wild-type, and (c) not PDGFRA-Hi/FGFR1-Lo expression; and [0497] (e) a fifth reference centroid corresponding to the expression profile of said 40 or more genes determined in a fifth group of subjects known to have cancer with (a) a gene expression profile having a closer match to the centroid of subgroup C shown in table 3 than subgroups B or C, and (b) TP53 wild-type, and (c) not PDGFRA-Hi/FGFR1-Lo expression.
[0498] An individual may be determined to have a poor prognosis if they have a cancer having the expression levels of the 40 or more genes in table 4 a closer match to a first, second, fourth or fifth reference centroid than a third reference centroids, wherein the reference centroids are: [0499] (a) a first reference centroid corresponding to the expression profile of said 40 or more genes determined in a first group of subjects known to have cancer with PDGFRA-Hi/FGFR1-Lo expression; [0500] (b) a second reference centroid corresponding to the expression profile of said 40 or more genes determined in a second group of subjects known to have cancer with mutated TP53 and not PDGFRA-Hi/FGFR1-Lo expression; [0501] (c) a third reference centroid corresponding to the expression profile of said 40 or more genes determined in a third group of subjects known to have cancer with (a) a gene expression profile having a closer match to the centroid of subgroup A shown in table 3 than subgroups B or C, and (b) TP53 wild-type, and (c) not PDGFRA-Hi/FGFR1-Lo expression; [0502] (d) a fourth reference centroid corresponding to the expression profile of said 40 or more genes determined in a fourth group of subjects known to have cancer with (a) a gene expression profile having a closer match to the centroid of subgroup B shown in table 3 than subgroups A or C, and (b) TP53 wild-type, and (c) not PDGFRA-Hi/FGFR1-Lo expression; and [0503] (e) a fifth reference centroid corresponding to the expression profile of said 40 or more genes determined in a fifth group of subjects known to have cancer with (a) a gene expression profile having a closer match to the centroid of subgroup C shown in table 3 than subgroups B or C, and (b) TP53 wild-type, and (c) not PDGFRA-Hi/FGFR1-Lo expression.
[0504] More details of the determining steps and combinations thereof are given elsewhere herein.
[0505] In any of the methods described herein the determining steps may be historical, and the methods may make use of expression levels that have already been determined.
Treatment of Cancer with TKIs
[0506] In one aspect the present invention provides methods and medical uses for the treatment of cancers with TKIs. According to these methods and treatments the cancers are ones which are identified herein as being sensitive to treatment with TKI.
[0507] Accordingly, a tyrosine kinase inhibitor for use in a method of treating cancer in an individual is provided, wherein the cancer has PDGFRA-Hi/FGFR1-Hi, PDGFRA-Lo/FGFR1-Lo, or PDGFRA-Lo/FGFR1-Hi expression levels; and/or wildtype TP53; and/or has been identified as sensitive to TKI treatment based on the expression levels of 5 or more of the genes in List 1.
[0508] Also provided is the use of a TKI in the manufacture of a medicament for treating a cancer in an individual wherein the cancer has been identified as having PDGFRA-Hi/FGFR1-Hi, PDGFRA-Lo/FGFR1-Lo, or PDGFRA-Lo/FGFR1-Hi expression levels, and/or wildtype TP53, and/or has been identified as sensitive based on the expression levels of 5 or more of the genes in List 1.
[0509] Also provided is a method of treating a cancer in an individual comprising administration of a TKI, wherein the cancer has PDGFRA-Hi/FGFR1-Hi, PDGFRA-Lo/FGFR1-Lo, or PDGFRA-Lo/FGFR1-Hi expression levels, and/or wildtype TP53, and/or has been identified as sensitive based on the expression levels of 5 or more of the genes in List 1.
[0510] Also provided is a tyrosine kinase inhibitor for use in a method of treating cancer in an individual is provided, wherein the cancer has been identified as sensitive to TKI treatment based on the expression levels of 20 or more of the genes in table 5. Also provided is a tyrosine kinase inhibitor for use in a method of treating cancer in an individual is provided, wherein the cancer has been identified as sensitive to TKI treatment based on the expression levels of 40 or more of the genes in table 4.
[0511] Also provided is the use of a TKI in the manufacture of a medicament for treating a cancer in an individual wherein the cancer has been identified as sensitive to TKI treatment based on the expression levels of 20 or more of the genes in table 5. Also provided is the use of a TKI in the manufacture of a medicament for treating a cancer in an individual wherein the cancer has been identified as sensitive to TKI treatment based on the expression levels of 40 or more of the genes in table 4.
[0512] Also provided is a method of treating a cancer in an individual comprising administration of a TKI, wherein the cancer has been identified as sensitive to TKI treatment based on the expression levels of 20 or more of the genes in table 5. Also provided is a method of treating a cancer in an individual comprising administration of a TKI, wherein the cancer has been identified as sensitive to TKI treatment based on the expression levels of 40 or more of the genes in table 4.
[0513] The methods and treatments disclosed herein may involve the steps of determining whether a patient is suitable for treatment.
[0514] The methods and treatments may relate to treatment of an individual who has been pre-selected for treatment using the methods described herein. For example, a tyrosine kinase inhibitor is provided for use in a method of treating cancer in an individual, wherein the individual has been selected for treatment as described herein.
[0515] Also provided is the use of a tyrosine kinase inhibitor in the manufacture of a medicament for treating cancer in an individual, wherein the individual has been selected for treatment as described herein.
[0516] Also provided is a method of treating cancer in an individual in need thereof with a tyrosine kinase inhibitor, wherein the individual has been selected for treatment as described herein.
[0517] While the individuals or patients for treatment may have been pre-selected, the methods and uses may also comprise the active steps of selecting an individual for treatment.
[0518] The uses and methods may comprise the step of determining if the cancer is susceptible to TKI treatment using one or more of 1) baseline expression of FGFR1 and PDGFRA, for example using immunohistochemistry (IHC), 2) TP53 mutational status, and 3) mRNA transcript abundance for genes involved in key oncogenic pathways (shown in List 1).
[0519] The methods may involve the step of obtaining a sample of cancer cells from the individual, and selecting the individual for treatment based on the tests disclosed herein.
[0520] For example, the methods may involve the steps of: [0521] a) obtaining a sample of cancer cells from an individual [0522] b) determining one or more of: (i) the expression levels of PDGFRA and FGFR1 as `high` (Hi) or `low`(Lo) in the sample of cancer cells from the individual, (ii) the mutation status of TP53 in a sample of cancer cells from the individual, and (iii) the expression levels of 5 or more of the genes in List 1 in a sample of cancer cells from the individual; and [0523] c) selecting the patient for treatment if they meet the selection criteria for one or more of step (i) to (iii). For example a patient may be selected for treatment if they meet the selection criteria for all of the tests in part (i) to (iii) that are carried out.
[0524] For example, a patient may be selected for treatment if they have PDGFRA-Hi/FGFR1-Hi, PDGFRA-Lo/FGFR1-Lo, or PDGFRA-Lo/FGFR1-Hi expression levels, and/or wildtype TP53, and/or based on the expression levels of 5 or more of the genes in List 1.
[0525] The selection criteria are set out in more detail elsewhere herein, as are the methods and techniques for carrying out the determining steps.
[0526] The methods may involve the step: [0527] (d) of treating the individual with a TKI.
[0528] The individual to be treated is preferably a mammal, in particular a human.
[0529] The treatments disclosed may be described including the step of administering the TKI to the individual, e.g. in a therapeutically effective amount. Treatment of an individual with cancer may also be described as treatment of a patient in need thereof.
Administration and Pharmaceutical Compositions
[0530] The TKIs disclosed herein for the treatment of cancer, may be administered alone, but it is generally preferable to provide them in pharmaceutical compositions that additionally comprise with one or more pharmaceutically acceptable carriers, adjuvants, excipients, diluents, fillers, buffers, stabilisers, preservatives, lubricants, or other materials well known to those skilled in the art and optionally other therapeutic or prophylactic agents. Examples of components of pharmaceutical compositions are provided in Remington's Pharmaceutical Sciences, 20th Edition, 2000, pub. Lippincott, Williams & Wilkins.
[0531] The term "pharmaceutically acceptable" as used herein includes compounds, materials, compositions, and/or dosage forms which are, within the scope of sound medical judgement, suitable for use in contact with the tissues of a subject (e.g. human) without excessive toxicity, irritation, allergic response, or other problem or complication, commensurate with a reasonable benefit/risk ratio. Each carrier, excipient, etc. must also be "acceptable" in the sense of being compatible with the other ingredients of the formulation.
[0532] The active agents disclosed herein for the treatment of cancer are preferably for administration to an individual in a "prophylactically effective amount" or a "therapeutically effective amount" (as the case may be, although prophylaxis may be considered therapy), this being sufficient to show benefit to the individual. For example, the agents (inhibitors) may be administered in amount sufficient to delay tumour progression, or prevent tumour growth and/or metastasis or to shrink tumours. For example, the agents may be administered in an amount sufficient to induce apoptosis of cancer cells.
[0533] The actual amount administered, and rate and time-course of administration, will depend on the nature and severity of what is being treated. Prescription of treatment, e.g. decisions on dosage etc., is within the responsibility of general practitioners and other medical doctors, and typically takes account of the disorder to be treated, the condition of the individual patient, the site of delivery, the method of administration and other factors known to practitioners. Examples of the techniques and protocols mentioned above can be found in Remington's Pharmaceutical Sciences, 20th Edition, 2000, Lippincott, Williams & Wilkins. A composition may be administered alone or in combination with other treatments, either simultaneously or sequentially, dependent upon the condition to be treated.
[0534] The formulations may conveniently be presented in unit dosage form and may be prepared by any methods well known in the art of pharmacy. Such methods include the step of bringing the active compound into association with a carrier, which may constitute one or more accessory ingredients. In general, the formulations are prepared by uniformly and intimately bringing into association the active compound with liquid carriers or finely divided solid carriers or both, and then if necessary shaping the product.
[0535] The agents disclosed herein for the treatment of deficient cancer may be administered to a subject by any convenient route of administration, whether systemically/peripherally or at the site of desired action, including but not limited to, oral (e.g. by ingestion); topical (including e.g. transdermal, intranasal, ocular, buccal, and sublingual); pulmonary (e.g. by inhalation or insufflation therapy using, e.g. an aerosol, e.g. through mouth or nose); rectal; vaginal; parenteral, for example, by injection, including subcutaneous, intradermal, intramuscular, intravenous, intraarterial, intracardiac, intrathecal, intraspinal, intracapsular, subcapsular, intraorbital, intraperitoneal, intratracheal, subcuticular, intraarticular, subarachnoid, and intrasternal; by implant of a depot, for example, subcutaneously or intramuscularly.
[0536] Formulations suitable for oral administration (e.g., by ingestion) may be presented as discrete units such as capsules, cachets or tablets, each containing a predetermined amount of the active compound; as a powder or granules; as a solution or suspension in an aqueous or non-aqueous liquid; or as an oil-in-water liquid emulsion or a water-in-oil liquid emulsion; as a bolus; as an electuary; or as a paste.
[0537] Formulations suitable for parenteral administration (e.g., by injection, including cutaneous, subcutaneous, intramuscular, intravenous and intradermal), include aqueous and non-aqueous isotonic, pyrogen-free, sterile injection solutions which may contain anti-oxidants, buffers, preservatives, stabilisers, bacteriostats, and solutes which render the formulation isotonic with the blood of the intended recipient; and aqueous and non-aqueous sterile suspensions which may include suspending agents and thickening agents, and liposomes or other microparticulate systems which are designed to target the compound to blood components or one or more organs. Examples of suitable isotonic vehicles for use in such formulations include Sodium Chloride Injection, Ringer's Solution, or Lactated Ringer's Injection. Typically, the concentration of the active compound in the solution is from about 1 ng/ml to about 10 .mu.g/ml, for example from about 10 ng/ml to about 1 .mu.g/ml. The formulations may be presented in unit-dose or multi-dose sealed containers, for example, ampoules and vials, and may be stored in a freeze-dried (lyophilised) condition requiring only the addition of the sterile liquid carrier, for example water for injections, immediately prior to use. Extemporaneous injection solutions and suspensions may be prepared from sterile powders, granules, and tablets. Formulations may be in the form of liposomes or other microparticulate systems which are designed to target the active compound to blood components or one or more organs.
[0538] Compositions comprising agents disclosed herein for the treatment of cancer may be used in the methods described herein in combination with standard chemotherapeutic regimes or in conjunction with radiotherapy. Examples of other chemotherapeutic agents include Amsacrine (Amsidine), Bleomycin, Busulfan, Capecitabine (Xeloda), Carboplatin, Carmustine (BCNU), Chlorambucil (Leukeran), Cisplatin, Cladribine (Leustat), Clofarabine (Evoltra), Crisantaspase (Erwinase), Cyclophosphamide, Cytarabine (ARA-C), Dacarbazine (DTIC), Dactinomycin (Actinomycin D), Daunorubicin, Docetaxel (Taxotere), Doxorubicin, Epirubicin, Etoposide (Vepesid, VP-16), Fludarabine (Fludara), Fluorouracil (5-FU), Gemcitabine (Gemzar), Hydroxyurea (Hydroxycarbamide, Hydrea), Idarubicin (Zavedos). Ifosfamide (Mitoxana), Irinotecan (CPT-11, Campto), Leucovorin (folinic acid), Liposomal doxorubicin (Caelyx, Myocet), Liposomal daunorubicin (DaunoXome.RTM.) Lomustine, Melphalan, Mercaptopurine, Mesna, Methotrexate, Mitomycin, Mitoxantrone, Oxaliplatin (Eloxatin), Paclitaxel (Taxol), Pemetrexed (Alimta), Pentostatin (Nipent), Procarbazine, Raltitrexed (Tomudex.RTM.), Streptozocin (Zanosar.RTM.), Tegafur-uracil (Uftoral), Temozolomide (Temodal), Teniposide (Vumon), Thiotepa, Tioguanine (6-TG) (Lanvis), Topotecan (Hycamtin), Treosulfan, Vinblastine (Velbe), Vincristine (Oncovin), Vindesine (Eldisine) and Vinorelbine (Navelbine).
[0539] Methods of determining the most effective means and dosage of administration are well known to those of skill in the art and will vary with the formulation used for therapy, the purpose of the therapy, the target cell being treated, and the subject being treated. Single or multiple administrations can be carried out with the dose level and pattern being selected by the treating physician.
[0540] In general, a suitable dose of the active compound is in the range of about 100 .mu.g to about 250 mg per kilogram body weight of the subject per day. Where the active compound is a salt, an ester, prodrug, or the like, the amount administered is calculated on the basis of the parent compound, and so the actual weight to be used is increased proportionately.
Kits
[0541] The invention also provides kits for use in the methods described herein. In other words, the invention provides a kit for stratifying individuals with cancer, for identifying a cancer suitable for treatment with a TKI, for determining a prognosis, and for determining if a cancer is likely to be sensitive to treatment with a TKI.
[0542] The kit may comprise specific binding agents for detecting the biomarkers. These specific binding agents may also be referred to as probes.
[0543] In particular, the kit may contain probes for detecting 5 or more, 10 or more, 15 or more, 20 or more, 30 or more, 40 or more, 50 or more, 60 or more, 70 or more, 80 or more, 90 or more, 100 or more, 120 or more, 140 or more, 160 or more, 180 or more 200 or more, or substantially all of, or all of the gene expression products of the genes in List 1. For example, the kit may contain nucleic acid probes which specifically bind to the mRNA expression products of the genes in List 1. The device (kit) can quantify the gene expression level of the genes in List 1.
[0544] The binding agents may be immobilised on one or more solid supports, for example on a microarray chip.
[0545] The kit may also have probes for expression analysis of PDGFRA and FGFR1. The kits may have probes for detection of PDGFRA and FGFR1 nucleic acids or proteins. For example, specific binding proteins such as antibodies may be used for the detection of PDGFRA and FGFR1 proteins, or specific nucleic acid probes may be used for the detection of PDGRA and FGFR1 gene or mRNA transcript.
[0546] The kit may also comprise probes for determining TP53 mutation status. For example, the kit may comprise probes specific for mutations in TP53.
[0547] Accordingly, the kit may comprise probes for determining TP53 mutation status, determining PDGFRA and FGFR1 expression and determining the expression of at least 5 genes selected from List 1.
[0548] The probes may all be used in a single device, for example on a single microarray. The kit may thus allow simultaneous determination of TP53 status, PDGFRA and FGFR1 expression and expression levels of 5 or more of the genes in List 1. In other words, the kit may allow determination of TP53 status, PDGFRA and FGFR1 expression and expression levels of 5 or more of the genes in List 1 in a single assay, or on a single microarray.
[0549] Suitable kits for mutation status, protein quantification and gene expression include nCounter.RTM. Vantage 3D.TM. Solid Tumor Assays (nanoString Technologies).
[0550] In addition, the kit may comprise one or more binding agents capable of binding specifically to an expression product of a control gene which is not differentially expressed between individuals affected and unaffected by the cancer of interest. The level of expression from this control gene may be measured in order to assist in quantification of the expression products of the genes of List 1, and/or for quality assurance of an assay performed using the kit. Preferably a control gene is chosen which is constitutively expressed in the cells of the biological sample (i.e. always expressed, at substantially the same level, under substantially all conditions). Such genes are often referred to as "housekeeping" genes. Exemplary housekeeping genes include any one or more of the housekeeping genes described in Supplementary methods 4 herein (ACAD9, AGK, AMMECR1L, C10orf76, CC2D1B, CNOT10, CNOT4, COG7, DDX50, DHX16, DNAJC14, EDC3, EIF2B4, ERCC3, FCF1, FTSJ2, GPATCH3, HDAC3, MRPS5, MTMR14, NOL7, NUBP1, PIAS1, PIK3R4 and PRPF38A).
[0551] The kit may comprise further binding agents capable of binding to expression products of other biomarker genes or control genes. However, in preferred embodiments, the kit comprises binding agents for expression products of less than 1000 different genes, e.g. less than 500 different genes, less than 400, less than 300, less than 250, less than 200, or less than 160 different genes. For example, the kit may comprise comprises binding agents for expression products of the genes listed in List 1 and/or PDGFRA & FGFR1, and/or TP53, and no more than 10, 20, 30, 40, 50, 60, 70, 80, 90, 100, 150, 200, 250, 300, 400, 500, 600, 700, 800 or 900 additional genes expression products.
[0552] Alternatively, the kit may have probes for detecting the expression levels of at least 20, at least 21, at least 22, at least 23, at least 24, at least 25, at least 26, at least 27, at least 28, at least 29, at least 30, at least 31, at least 32, at least 33, at least 34, at least 35, at least 36, at least 37, at least 38, at least 39, at least 40, at least 41, or all 42 of the genes listed in table 5. For example, the kit may contain nucleic acid probes which specifically bind to the mRNA expression products of the genes in table 5. The device (kit) can quantify the gene expression level of the genes in table 5.
[0553] Alternatively, the kit may have probes for detecting the expression levels of at least 40, at least 45, at least 50, at least 60, at least 70, at least 80, at least 90, at least 100, at least 110, at least 120, at least 130, at least 240, at least 150, at least 160, at least 170, at least 180, at least 190, at least 200, at least 210, at least 220 or all 225 of the genes in table 4. For example, the kit may contain nucleic acid probes which specifically bind to the mRNA expression products of the genes in table 4. The device (kit) can quantify the gene expression level of the genes in table 4.
[0554] These kits may contain binding agents/probes for control genes as described above.
[0555] The kit is suitable for use in the methods of the invention described in this specification, and may comprise instructions for performing one or more methods of the invention.
[0556] In certain embodiments, the kit of the invention takes the form of a companion diagnostic and includes (in addition to the components described above) with it, or is intended to be provided alongside, a TKI or pharmaceutical composition or dosage form comprising a TKI.
[0557] Embodiments of the present invention will now be described by way of example and not limitation with reference to the accompanying figures. However various further aspects and embodiments of the present invention will be apparent to those skilled in the art in view of the present disclosure.
[0558] The present invention includes the combination of the aspects and preferred features described except where such a combination is clearly impermissible or is stated to be expressly avoided. These and further aspects and embodiments of the invention are described in further detail below and with reference to the accompanying examples and figures.
BRIEF DESCRIPTION OF THE FIGURES
[0559] FIG. 1 shows a flow diagram of identification of the study cohort and experimental plan.
[0560] FIG. 2 shows identification of 3 clinical subgroups in IHCnegP53 wt patients based on analysis of gene expression data for 730 cancer pathway-related genes. A. Consensus clustering identified optimal separation of 22 IHCnegTP53 wt patients into 5 biological subgroups. Shown here is a heatmap of the 22 patients based on expression data of the list of 223 genes which were identified to be significantly differential among the 5 biological subgroups using multiclass SAM analysis set at .ltoreq.5% FDR. Kaplan Meier curves of the 5 biological subgroups for (B) PFS and (C) OS of 22 patients. D. Combination of biological subgroups 1 with 2, and 4 with 5, results in 3 clinical subgroups (A, B, C). Shown here is a heatmap of the 22 patients based on expression of list of 229 genes which were identified to be significantly differential among the 3 clinical subgroups using multiclass SAM analysis set at .ltoreq.10% FDR. Kaplan Meier curves of the 3 clinical subgroups for (E) PFS and (F) OS within the subset of 22 patients. SAM=Significance Analysis of Microarray. FDR=False Discovery Rate. PFS=Progression-free survival. OS=overall survival. HR=Hazard Ratio, 95% CI (95% Confidence Interval) and P value derive by log-rank testing.
[0561] FIG. 3 shows that combination of FGFR1 and PDGFRA IHC, TP53 mutation status and gene expression analysis provides optimal risk classification. Kaplan Meier curves of the 5 decision tree-defined subgroups for (A) PFS and (B) OS of 38 patients. C. Bar charts showing LR.chi..sup.2 for PFS and OS for 5 proportional hazards regressions. All regression models included baseline clinico-pathological factors, with additional terms being either F-Lo/P-Hi IHC status alone; TP53 mutational status alone; IHC and TP53 mutational status as parallel terms; or decision tree-defined subgroups. Percentage increases in LR.chi..sup.2 compared to regression model using clinico-pathological factors only are stated. PFS=progression-free survival. OS=overall survival. LR.chi..sup.2=Likelihood ratio .chi..sup.2 value. F-Lo/P-Hi=FGFR1-Low/PDGFRA-High. HR=Hazard Ratio, 95% CI (95% Confidence Interval) and P value derive by Cox proportional hazards testing.
[0562] FIG. 4 shows that there is no prognostic association between PARSARC risk classifier and overall survival in TCGA SARC dataset. A. Kaplan-Meier curves of F-Lo/P-Hi and all other patient subgroups for overall survival of 250 cases within TCGA-SARC dataset with available gene expression data. B. Kaplan-Meier curves of TP53 mutated and TP53 wildtype patient subgroups for overall survival of 232 cases within TCGA-SARC dataset with available TP53 sequence data. C. Kaplan-Meier curves of 3 clinical subgroups A-C for overall survival of 250 cases within TCGA-SARC dataset with available gene expression data. D. Kaplan-Meier Curves of 5 PARSARC classifier-defined subgroups for overall survival of 229 cases within TCGA-SARC dataset with available gene expression and TP53 sequence data. F-Lo/P-Hi=FGFR1-Low/PDGFRA-High. HR=hazard ratio, 95% CI (95% confidence interval) and P value derive by log-rank testing.
[0563] FIG. 5 shows a decision tree for patients with advanced STS under consideration for pazopanib therapy.
[0564] FIG. 6 shows a Venn diagram depicting the number of targets for Regorfenib (upper left); Pazopanib (upper right); and Sorfenib (lower circle).
[0565] Supplementary FIG. 1 shows representative IHC images of FGFR1 and PDGFRA expression levels in pre-pazopanib STS tumour specimen. FFPE tumour tissue from each case was stained for FGFR1 and PDGFRA. Representative images (.times.100 magnification, insert at .times.400) demonstrate examples of staining scores 0-6, derived from the sum of scores for percentage of tumour cells with plasma membrane and/or cytoplasmic staining (0--absent, 1--1-10%, 2--11-50%, 3-->50%) and staining intensity (0--absent, 1--weak, 2--moderate, 3--strong). For each stain, tumours with a score 3 were classed as `high` expression; tumours with a score <3 were classed as `low expression` Positive controls T740 cells (FGFR1) and myoepithelial cells within breast tissue (PDGFRA). Digital microscopy images captured with Hamamatsu Nanozoomer at .times.40 resolution.
[0566] Supplementary FIG. 2 shows exonic TP53 mutations detected by Sanger sequencing in pazopanib-treated STS cohort. A. Lollipop plot showing position of detected mutations within coding exons on TP53. B. List of detected mutations of TP53. Each row represents one of 10 cases with detected TP53 mutation.
[0567] Supplementary FIG. 3 shows low FGFR1 expression and high PDGFRA expression identifies a subgroup with poor post-pazopanib outcome. A. Results of Cox Proportional Hazard modelling of PFS and OS association of FGFR1 and PDGFRA expression with and without inclusion of term for interaction between the two protein markers. Kaplan Meier curves of 4 subgroups defined by protein expression level of FGFR1 and PDGFRA as assessed by IHC for B) PFS and C) OS of 38 patients. PFS=progression-free survival. OS=overall survival. HR=Hazard ratio, 95% CI (95% Confidence Interval) and P value derive by log-rank testing, comparing FGFR1-Lo/PDGFRA-Hi subgroup to all other subgroups combined.
[0568] Supplementary FIG. 4 shows TP53 mutation is associated with worse post-pazopanib outcome in IHCneg patients. Kaplan Meier curves of 2 subgroup defined by presence or absence of detected TP53 mutation for (A) PFS and (B) OS of 31 IHCneg patients. PFS=progression-free survival. OS=overall survival. HR=Hazard ratio, 95% CI (95% Confidence Interval) and P value derive by log-rank testing.
[0569] Supplementary FIG. 5 shows consensus clustering of IHCnegTP53 wt cases optimally identifies 5 clusters. A. Cumulative distribution plots for empirically imposed number of clusters. B. Relative increase in area under CDF curve with increasing number of imposed clusters. C. Consensus clustering matrix of gene expression of 22 IHCnegP53 wt patients using 5 subgroups (1-5).
[0570] Supplementary FIG. 6 shows genes highly expressed in subgroup B cluster are also upregulated in smooth muscle-like leiomyosarcoma molecular subgroup in an independent LMS cohort. A. Scatter plots showing assignment of 99 LMS cases from independent Stanford-LMS dataset.sup.16 to one of three subgroups A-C on basis of distance from centroid defined within our cohort. Axes values represent difference between distances of cases from pairs of centroids as indicated. Contingency tables showing enrichment of LMS subtype I compared to (B) LMS subtype II and (C) LMS subtype III in cases assigned to gene expression-defined subgroup B through assessment of centroid distance. P values derive from Fishers exact testing. D. Hierarchical clustering of Stanford-LMS cohort using 115 genes with significantly differential expression within RMH-SARC cohort. Shown here is a heat-map of 99 LMS cases with colour bar indicating LMS molecular subtype of each case as described by Guo et al.sup.16.
[0571] Supplementary FIG. 7. Low FGFR1 and high PDGFRA high gene expression identify a patient subgroup with worse post-pazopanib PFS. A. Box and tail plot showing normalised gene expression levels for FGFR1 and PDGFRA when grouped by high or low protein expression as assessed by IHC. P values derive from unpaired T test. B. Scatter plot of normalised gene expression values for FGFR1 and PDGFRA, grouped by IHC assessment of protein expression. Dotted box denotes cases designated as FGFR1-Lo/PDGFRA-Hi by gene expression analysis. Circled case denotes single case of extraskeletal myxoid chondrosarcoma designated F-Lo/P-Lo by IHC but FGFR1-Lo/PDGFR-Hi by gene expression analysis. On IHC review, this case exhibited high PDGFRA expression in intratumor blood vessels but not in tumour cells themselves. As such, this case was re-designated as non-FGFR1-Lo/PDGFRA-Hi. Kaplan Meier curves of 2 subgroups defined by presence or absence or F-Lo/P-Hi status as determined by gene expression analysis for (C) PFS and (D) OS for 38 patients. F-Lo=FGFR1-Lo. F-Hi=FGFR1-Hi. P-Lo=PDGFRA-Lo. P-Hi=PDGFRA-Hi. PFS=progression-free survival. OS=overall survival. HR=Hazard ratio, 95% CI (95% Confidence Interval) and P value derive by log-rank testing, comparing FGFR1-Lo/PDGFRA-Hi subgroup to all other subgroups combined.
[0572] Supplementary FIG. 8. Assignment of TCGA-SARC cases to subgroup A-C on basis of distance from centroids defined within RMH-SARC cohort. Scatter plots show distance of each of 251 eligible cases within TCGA-SARC dataset from centroids. Plot axes values represent difference between distances between pairs of centroid as indicated. Colours reflect assignment of each case to one of subgroups A-C. Table shows subgroup assignment of cases of LMS within TCGA-SARC cohort.
[0573] Supplementary FIG. 9 FGFR1-Lo/PDGFRA-Hi tumours are enriched for expression of JAK/STAT pathway-related genes. A. Hierarchical clustering and heatmap of 38 patients of RMH-SARC cohort based on expression data of 86 genes annotated as involved in JAK/STAT signalling pathway. B. Box and tail plots showing average expression level of JAK-STAT pathway-related genes in 5 PARSARC classifier subgroups within RMH-SARC cohort. P values derive from one way ANOVA and are corrected Average expression level of JAK-STAT pathway genes in 5 patient subgroups in decision tree risk classifier. P values derive from Tukey's multiple comparisons testing. NS=non-significant.
[0574] Supplementary FIG. 10. Gene expression analysis of full 38 patient cohort fails to identify subgroups of distinct clinical outcome. A. Consensus clustering identified optimal separation of RMH-SARC cohort into 5 clusters. Shown here is a heatmap of the 38 patients based on expression data of 480 genes identified as significantly differential between the 5 clusters using multiclass SAM analysis set at .ltoreq.5% FDR. Kaplan Meier curves of patients in each of these 5 clusters for (B) PFS and (B) OS for 38 patients. PFS=progression-free survival. OS=overall survival. P values derive from log-rank testing.
[0575] "and/or" where used herein is to be taken as specific disclosure of each of the two specified features or components with or without the other. For example "A and/or B" is to be taken as specific disclosure of each of (i) A, (ii) B and (iii) A and B, just as if each is set out individually herein.
[0576] The following is presented by way of example and is not to be construed as a limitation to the scope of the claims.
EXAMPLES
Example 1
Materials and Methods
Patient Selection and Treatment
[0577] Collection and analysis of anonymised archival FFPE tissue and associated clinical data was approved in as a sub-study protocol amendment to the Royal Marsden-sponsored Elucidation of a Molecular signature of Pazopanib Response in Advanced soft tissue Sarcoma including solitary fibrous tumours (EMPRASS) study. (RMH Committee for Clinical Research reference 4107, NHS Research Ethic Committee reference 14/WA/0164). This cohort is referred to as RMH-SARC in this manuscript.
[0578] Patients were retrospectively identified for inclusion by search of institutional database and electronic patient records compiled during routine clinical practice. Eligibility criteria for inclusion were: i) histopathological diagnosis of soft tissue tumour as confirmed by contemporaneous report by specialist sarcoma histopathologist; ii) received at least one dose of pazopanib for treatment of unresectable or advanced STS; iii) available FFPE tumour specimen, obtained from patient prior to first dose of pazopanib. Treatment and response monitoring was as per standard institutional practice, with pazopanib at 800 mg once daily until disease progression, intolerable toxicity or significant clinical deterioration. Dose interruption and/or reduction were instigated based on standard institutional guidelines and the discretion of the treating physician. Baseline clinico-pathological characteristics and survival data were collected on retrospective review of contemporaneous electronic medical records. All related radiological imaging was retrospectively reviewed and disease response assessed according to RECIST 1.1. This manuscript is written according to the Reporting Recommendations for Tumor Marker Prognostic Studies (REMARK) guidelinesl5.
Tissue Selection and Processing
[0579] Available pre-pazopanib FFPE tumour specimens were identified and retrieved from an institutional diagnostic archive, with the specimen taken closest to pazopanib initiation processed in cases where several pre-treatment specimens were available. Newly sectioned haematoxylin and eosin (H&E) stained slides were reviewed to confirm viable tumour content. With reference to H&E, blocks containing tumour material of sufficient size were marked in three spatially discrete areas of representative viable tumour tissue. 1 mm diameter core biopsies were taken from each marked site and re-embedded lengthways into a new paraffin block to form a tissue microarray (TMA). Following coring, 4.times.10 .mu.m sections were cut and, where necessary, macrodissected to enrich for >75% viable tumour content. Sections were then used for tumour DNA and total RNA extraction using All Prep DNA/RNA FFPE kit (Qiagen, Hilden, Germany) following vendor's standard protocol. DNA and RNA concentrations were measured using Qubit fluorometric quantitation (Thermo Fisher Scientific, Waltham, Mass., USA). RNA Integrity Number and percentage of total RNA <300 bp in size was measured using 2100 Bioanalyzer system (Agilent, CA, USA). RNA and DNA samples were stored at -80.degree. C. until use in downstream analyses.
Immunohistochemistry
[0580] Serial 4 .mu.m sections were cut from TMA and from specimens not included in the TMA due to inadequate size. Tumour cell plasma membrane and cytoplasmic staining for PDGFRA (Cell Signalling, clone D1E1E) and FGFR1 (Epitomics, 2144-1) was assessed by immunohistochemistry by researchers blinded to associated outcome data (see Supplemental Methods for reagent and method details). IHC staining was scored in terms of intensity (0=absent, 1=weak, 2=moderate, 3=strong) and proportion of positive tumour cells (0=absent, 1=1-10%, 2: =11-50%, 3: >50%). The summation of the two scores give values ranging from 0 to 6 (Supplemental FIG. 1). Staining score .gtoreq.3 was classified as high expression and scores <3 as low expression. In cases of discrepancy between related TMA cores an average score was calculated and used to categorise the parent tumour as positive or negative.
TP53 Exon Sequencing
[0581] Extracted tumour DNA was used as a template for amplification and Sanger sequencing of exons 2-11 of TP53 as per International Agency for Research on Cancer (IARC) protocol16 (see Supplemental Methods for primer design and PCR experimental conditions). PCR products were Sanger sequenced (Eurofins Genomics, Ebersberg, Germany). Sequences were aligned to reference human TP53 sequence (GrCH38.p7) and analysed for variants using CLC Sequence Viewer v7.7 (Qiagen).
Gene Expression Analysis
[0582] Expression of 730 genes, representing 13 major cancer pathways including key driver genes was assessed using nCounter PanCancer Pathways panel (NanoString Technologies, Seattle, Wash., USA). 150 ng total RNA was used as input for hybridisation and digital analysis as per manufacturer's instructions using nCounter Dx analysis system (NanoString Technologies). In cases with high RNA degradation, loading adjustments of up to 300 ng were made. Expression data was processed as follows: a) background correction was done by subtracting the geometric mean of the negative control probes, b) normalised by positive control normalization factor calculated as geometric mean of the positive controls followed by normalisation with the housekeeping genes. Expression values were then Log 2 transformed and subjected to gene-based centring.
[0583] In order to identify biological subgroups within a subset of 22 patients defined by the absence of identified IHC or TP53 sequencing-based markers, consensus clustering (CC) was used to objectively separate the tumours into stable biological subgroups17. The goal of CC was to search for a partition of the 22 tumours into at least 2 or, at most, 8 groups using expression of the 730 cancer pathway-associated genes. CC with 1-Pearson was used to identify robust unsupervised clusters by performing 200 iterations subsampling 80% of the samples each round. Having identified initially five clusters that were consolidated into three clearly separated subgroups, Multiclass Significance Analysis of Microarrays (SAM)18 was used to identify a subset of genes with significant differential expression (false discovery rate .ltoreq.5%) among the three subgroups. Functional enrichment analysis of these gene subsets was performed using the Database for Annotation, Visualization and Integrated Discovery (DAVID. Reference (training) gene expression profiles datasets for each of the three subgroups were built using gene subsets identified by SAM analysis. These gene subsets were also used to calculate a standardised centroid representing each of the three subgroups based on the Prediction Analysis of Microarray (PAM) algorithm. The nearest centroid single sample classification was used to assign individual tumour case to one of three subgroups from independent cohorts. The algorithm compared the individual cases' gene expression profile to each of three class centroids and was assigned to a subgroup based on the closest Euclidean distance to the centroid.
[0584] In order to assess whether gene expression data alone could be used to identify subgroups of distinct outcomes following pazopanib therapy, CC was also performed as above to partition all 38 patients into at least 2 or, at most, 8 groups using expression of the 730 cancer pathway-associated genes. Hierarchical clustering of the 38 patients using expression data for genes annotated as involved in each of 13 canonical cancer pathways was performed in order investigate for enrichment of biological processes in identified patient subgroups.
[0585] Independent Evaluation of identified biomarkers in TCGA-SARC dataset RNA sequencing (RNA-Seq) and accompanying clinical data for 261 cases of mixed STS were downloaded from The Cancer Genome Atlas (TCGA-SARC; accessed 27 Feb. 2017). The abundance of transcripts was estimated using an Expectation-Maximization algorithm implemented in the software package RSEM8 v1.1.13. Quality control of RNA-Seq data was performed as described in TCGA, and RSEM data was upper quartile normalized and Log 2 transformed. When comparing data from multiple analyses (e.g. comparing expression profiles for one or more test samples to the centroids constructed from samples collected and analyzed in an independent study), it is necessary to normalize data across these data sets. Distance Weighted Discrimination (DWD) was used to combine TCGA-SARC and RMH-SARC data sets together to adjust for systematic biases between these two separate datasets23.
[0586] Each eligible case with available gene expression data was assigned to one of three subgroups on the basis of distance from centroids defined within the RMH-SARC cohort. High and low expression levels of FGFR1 and PDGFRA were defined using a cutoff at the first tertile of normalized gene expression values. Associated TP53 mutational status (defined as exonic non-synonymous single nucleotide variant or small indel) from DNA sequencing data for the cohort was downloaded from cBioPortal (accessed 22 Apr. 2017).
Independent Evaluation of the Biological Subgroups on Stanford-LMS Dataset
[0587] Normalised gene expression profile data by 3'End RNA-sequencing (3SEQ) from a cohort of 99 cases of leiomyosarcoma (LMS) (GSE45510; accessed Sep. 3, 2017) was obtained.sup.16, referred to here as Stanford-LMS. DWD was used to combine Stanford-LMS and RMH-SARC datasets together to adjust for systematic biases between these two separate datasets. Each case was assigned to one of three subgroups on the basis of distance from centroids defined within our RMH-SARC cohort. Descriptive statistics was done to compare the frequency of our subgroups within each of the molecular LMS subgroups as described by Guo et al.sup.16. Hierarchical clustering of Stanford-LMS using our list of significant differential genes identified in RMH-SARC was used to illustrate the gene expression pattern.
Statistical Analysis
[0588] The stepwise primary objectives were to assess whether a surrogate of two immunohistochemical markers (FGFR1 and PDGFRA) and TP53 mutation status had statistical significant prognostic information for advanced STS. In this event, the two biomarkers panel were tested to determine if there is added statistically significant prognostic information to standard clinicopathological variables in multivariable comparisons. The secondary analyses included identification of biological subgroups based on gene expression profiles, and evaluation of the significance of these biological subgroups association with patient outcome. Progression free survival (PFS--defined as time in months from first dose of pazopanib to radiological disease progression or death from any cause) was the primary outcome endpoint, with overall survival (OS--defined as a time in months from first dose of pazopanib to death from any cause) as the secondary outcome endpoint. Data cut-off for survival follow-up was 30 Nov. 2016. Statistical analyses were performed by two senior statisticians. The Kaplan-Meier method was used to estimate PFS and OS, and the log-rank test to compare survival in different strata. Multivariable cox regression model was used to estimate the significance adjusted for the standard clinicopathological variables (including age, tumour grade, performance status and histological subtype). Proportional hazard assumption was tested using Schoenfeld residuals, and where deemed appropriate, Restricted Mean Survival was used. Interaction tests between FGFR1 and PDGFRA expression to predict for survival were evaluated for PFS and OS respectively. Likelihood ratio tests based on proportional hazards regression were used to test the prognostic information of all biomarkers. The quantification of the amount of prognostic information provided by one biomarker was assessed by the likelihood ratio .chi..sup.2 value (LR.chi..sup.2), and the additional information of one biomarker to biomarker score was measured by the increase of the likelihood ratio .chi..sup.2 value (.DELTA.LR.chi..sup.2) obtained from the proportional hazards model.
Ethics and Funding
[0589] Retrospective retrieval and analysis of anonymous archival FFPE tissue was approved in a protocol amendment to the Elucidation of a Molecular signature of Pazopanib Response in Advanced soft tissue Sarcoma including solitary fibrous tumours (EMPRASS) study, a Royal Marsden sponsored-single arm translational phase II study (CCR 4107, REC 14/WA/0164).
[0590] This is a summary of independent research supported by the National Institute for Health Research (NIHR) Biomedical Research Centre at The Royal Marsden NHS Foundation Trust and The Institute of Cancer Research, the Liddy Shriver Sarcoma Initiative and The Royal Marsden Charity. The views expressed are those of the author(s) and not necessarily those of the NHS, the NIHR or the Department of Health.
Supplementary Methods 1. IHC Antibody Details and Methods
[0591] DAKO link automated stainer was used for all IHC processing. Tissue sections were deparaffinised with xylene then rehydrated with graded ethanol (100%, 95% to 80%). Antigen retrieval was performed using DAKO FlexEnvision kit (K8002) with either microwave baking for 18 mins in citrate at pH6 (PDGFRa) or pressure cooking for 2 mins in citrate pH6 (FGFR1). Slides were incubated with primary antibodies (FRFR1--E pitomics 2144-1, 1:50 dilution; PDGFRA--Cell Signalling clone D1E1E, 1:250) for 60 minutes at room temperature and visualised using DAKO FlexEnvision (Rabbit/Mouse) kit (K8002), followed by application of DAB, resulting in visible brown colouration reaction at site of target antigen. Finally, nuclear counterstaining with haematoxylin was performed prior to coverslipping. Positive controls were normal breast (PDGFRA) and appendix (FGFR1). Negative control was through omission of primary antibody.
TABLE-US-00002 Supplementary methods 2. TP53 primer and PCR details (from IARC protocol) TP53 PCR exon(s) Forward primer.sup.l Reverse Primer.sup.l program 2-3 Tctcatgctggatccccact(1) Agtcagaggaccaggtcctc(2) A 4 Tgaggacctggtcctctgac(3) Agaggaatcccaaagttcca(4) A 5-6 Tgttcacttgtgccctgact(5) Ttaacccctcctcccagaga(6) A 7 Aggcgcactggcctcatctt(7) Tgtgcagggtggcaagtggc(8) A 8-9 Ttgggagtagatggagcct(9) Agtgttagactggaaacttt(10) A 10 Caattgtaacttgaaccatc(11) Ggatgagaatggaatcctat(12) B 11 Agaccctctcactcatgtga(13) Tgacgcacacctattgcaag(14) A .sup.1SEQ ID Nos: are listed next to each sequence. PCR program A: 94.degree. C. for 2 min (94.degree. C. for 30 sec, 63.degree. C.* for 45 sec, 72.degree. C. for 60 sec) .times. 20* = -0.5.degree. C. every 3 cycles (94.degree. C. for 30 sec, 60.degree. C. for 45 sec, 72.degree. C. for 60 sec) .times. 30 72.degree. C. for 10 min PCR program B 94.degree. C. for 2 min (94.degree. C. for 30 sec, 58.5.degree. C.* for 45 sec, 72.degree. C. for 60 sec) .times. 20* = -0.5.degree. C. every 3 cycles (94.degree. C. for 30 sec, 55.degree. C. for 45 sec, 72.degree. C. for 60 sec) .times. 30 72.degree. C. for 10 min
TABLE-US-00003 Supplementary methods 3. Endogenous 730 gene list for NanoString PanCancer Pathways Codeset ABL1 ATR BMP7 CACNG4 CCND3 ACVR1B ATRX BMP8A CACNG6 CCNE1 ACVR1C AXIN1 BMPR1B CALML3 CCNE2 ACVR2A AXIN2 BNIP3 CALML5 CCNO AKT1 B2M BRAF CALML6 CCR7 AKT2 BAD BRCA1 CAMK2B CD14 AKT3 BAIAP3 BRCA2 CAPN2 CD19 ALK BAMBI BRIP1 CARD11 CD40 ALKBH2 BAP1 C19orf40 CASP10 CDC14A ALKBH3 BAX CACNA1C CASP12 CDC14B AMER1 BCL2 CACNA1D CASP3 CDC25A AMH BCL2A1 CACNA1E CASP7 CDC25B ANGPT1 BCL2L1 CACNA1G CASP8 CDC25C APC BCOR CACNA1H CASP9 CDC6 APH1B BDNF CACNA2D1 CBL CDC7 AR BID CACNA2D2 CBLC CDH1 ARID1A BIRC3 CACNA2D3 CCNA1 CDK2 ARID1B BIRC7 CACNA2D4 CCNA2 CDK4 ARID2 BMP2 CACNB2 CCNB1 CDK6 ARNT2 BMP4 CACNB3 CCNB3 CDKN1A ASXL1 BMP5 CACNB4 CCND1 CDKN1B ATM BMP6 CACNG1 CCND2 CDKN1C CDKN2A CSF3 EP300 FGF22 GATA2 CDKN2B CSF3R EPHA2 FGF23 GATA3 CDKN2C CTNNB1 EPO FGF3 GDF6 CDKN2D CUL1 EPOR FGF4 GHR CEBPA CXXC4 ERBB2 FGF5 GLI1 CEBPE CYLD ERCC2 FGF6 GLI3 CHAD DAXX ERCC6 FGF7 GNA11 CHEK1 DDB2 ETS2 FGF8 GNAQ CHEK2 DDIT3 ETV1 FGF9 GNAS CHUK DDIT4 ETV4 FGFR1 GNG12 CIC DKK1 ETV7 FGFR2 GNG4 CLCF1 DKK2 EYA1 FGFR3 GNG7 CNTFR DKK4 EZH2 FGFR4 GNGT1 COL11A1 DLL1 FANCA FIGF GPC4 COL11A2 DLL3 FANCB FLNA GRB2 COL1A1 DLL4 FANCC FLNC GRIA3 COL1A2 DNMT1 FANCE FLT1 GRIN1 COL24A1 DNMT3A FANCF FLT3 GRIN2A COL27A1 DTX1 FANCG FN1 GRIN2B COL2A1 DTX3 FANCL FOS GSK3B COL3A1 DTX4 FAS FOSL1 GTF2H3 COL4A3 DUSP10 FASLG FOXL2 GZMB COL4A4 DUSP2 FBXW7 FOXO4 H2AFX COL4A5 DUSP4 FEN1 FST H3F3A COL4A6 DUSP5 FGF1 FUBP1 H3F3C COL5A1 DUSP6 FGF10 FUT8 HDAC1 COL5A2 DUSP8 FGF11 FZD10 HDAC10 COL6A6 E2F1 FGF12 FZD2 HDAC11 COMP E2F5 FGF13 FZD3 HDAC2 CREB3L1 EFNA1 FGF14 FZD7 HDAC4 CREB3L3 EFNA2 FGF16 FZD8 HDAC5 CREB3L4 EFNA3 FGF17 FZD9 HDAC6 CREB5 EFNA5 FGF18 GADD45A HELLS CREBBP EGF FGF19 GADD45B HES1 CRLF2 EGFR FGF2 GADD45G HES5 CSF1R EIF4EBP1 FGF20 GAS1 HGF CSF2 ENDOG FGF21 GATA1 HHEX HHIP IL12RB2 ITGA9 LIG4 MLH1 HIST1H3B IL13 ITGB3 LRP2 MLLT3 HIST1H3G IL13RA2 ITGB4 LTBP1 MLLT4 HIST1H3H IL15 ITGB6 MAD2L2 MMP3 HMGA1 IL19 ITGB7 MAML2 MMP7 HMGA2 ILIA ITGB8 MAP2K1 MMP9 HNF1A IL1B JAG1 MAP2K2 MNAT1 HOXA10 IL1R1 JAG2 MAP2K4 MPL HOXA11 IL1R2 JAK1 MAP2K6 MPO HOXA9 IL1RAP JAK2 MAP3K1 MSH2 HPGD IL20RA JAK3 MAP3K12 MSH6 HRAS IL20RB JUN MAP3K13 MTOR HSP90B1 IL22RA1 KAT2B MAP3K14 MUTYH HSPA1A IL22RA2 KDM5C MAP3K5 MYB HSPA2 IL23A KDM6A MAP3K8 MYC HSPA6 IL23R KIT MAPK1 MYCN HSPB1 IL24 KITLG MAPK10 MYD88 IBSP IL2RA KLF4 MAPK12 NASP ID1 IL2RB KMT2C MAPK3 NBN ID2 IL3 KMT2D MAPK8 NCOR1 ID4 IL3RA KRAS MAPK8IP1 NF1 IDH1 IL5RA LAMA1 MAPK8IP2 NF2 IDH2 IL6 LAMA3 MAPK9 NFATC1 IFNA17 IL6R LAMA5 MAPT NFE2L2 IFNA2 IL7 LAMB3 MCM2 NFKB1 IFNA7 IL7R LAMB4 MCM4 NFKBIA IFNG IL8 LAMC2 MCM5 NFKBIZ IGF1 INHBA LAMC3 MCM7 NGF IGF1R INHBB LAT MDC1 NGFR IGFBP3 IRAK2 LEF1 MDM2 NKD1 IKBKB IRAK3 LEFTY1 MECOM NODAL IKBKG IRS1 LEFTY2 MED12 NOG IL10 ITGA2 LEP MEN1 NOS3 IL11 ITGA3 LEPR MET NOTCH1 IL11RA ITGA6 LFNG MFNG NOTCH2 IL12A ITGA7 LIF MGMT NOTCH3 IL12B ITGA8 LIFR MLF1 NPM1 NPM2 PIK3R5 PPP3R1 RASGRF2 SKP2 NR4A1 PIM1 PPP3R2 RASGRP1 SMAD2 NR4A3 PITX2 PRDM1 RASGRP2 SMAD3 NRAS PKMYT1 PRKAA2 RB1 SMAD4 NSD1 PLA1A PRKACA RBX1 SMAD9 NTF3 PLA2G10 PRKACB RELA SMARCA4 NTHL1 PLA2G2A PRKACG RELN SMARCB1 NTRK1 PLA2G3 PRKAR1B RET SMC1A NTRK2 PLA2G4A PRKAR2A RFC3 SMC1B NUMBL PLA2G4C PRKAR2B RFC4 SMC3 NUPR1 PLA2G4E PRKCA RHOA SMO OSM PLA2G4F PRKCB RIN1 SOCS1 PAK3 PLA2G5 PRKCG RNF43 SOCS2 PAK7 PLAT PRKDC RPA3 SOCS3 PAX3 PLAU PRKX RPS27A SOS1 PAX5 PLCB1 PRL RPS6KA5 SOS2 PAX8 PLCB4 PRLR RPS6KA6 SOST PBRM1 PLCE1 PRMT8 RRAS2 SOX17 PBX1 PLCG2 PROM1 RUNX1 SOX9 PBX3 PLD1 PTCH1 RUNX1T1 SP1 PCK1 PML PTCRA RXRG SPOP PCNA POLB PTEN SETBP1 SPP1 PDGFA POLD1 PTPN11 SETD2 SPRY1 PDGFB POLD4 PTPN5 SF3B1 SPRY2 PDGFC POLE2 PTPRR SFN SPRY4 PDGFD POLR2D PTTG2 SFRP1 SRSF2 PDGFRA POLR2H RAC1 SFRP2 SSX1 PDGFRB POLR2J RAC2 SFRP4 STAG2 PGF PPARG RAC3 SGK2 STAT1 PHF6 PPARGC1A RAD21 SHC1 STAT3 PIK3CA PPP2CB RAD50 SHC2 STAT4 PIK3CB PPP2R1A RAD51 SHC3 STK11 PIK3CD PPP2R2B RAD52 SHC4 STMN1 PIK3CG PPP2R2C RAF1 SIN3A SUV39H2 PIK3R1 PPP3CA RASA4 SIRT4 SYK PIK3R2 PPP3CB RASAL1 SIX1 TBL1XR1 PIK3R3 PPP3CC RASGRF1 SKP1 TCF3 TCF7L1 UTY TCL1B VEGFA TET2 VEGFC TFDP1 VHL TGFB1 WEE1 TGFB2 WHSC1 TGFB3 WHSC1L1 TGFBR2 WIFI THBS1 WNT10A THBS4 WNT10B THEM4 WNT11 TIAM1 WNT16 TLR2 WNT2 TLR4 WNT2B TLX1 WNT3 TMPRSS2 WNT4 TNC WNT5A TNF WNT5B TNFAIP3 WNT6 TNFRSF10A WNT7A TNFRSF10B WNT7B TNFRSF10C WT1 TNFRSF10D XPA TNFSF10 XRCC4 TNN ZAK TNR ZBTB16 TP53 ZBTB32 TPO ZIC2 TRAF7 TSC1 TSHR TSLP TSPAN7 TTK U2AF1 UBB UBE2T
TABLE-US-00004 Supplementary methods 4. Housekeeping genes used in analysis of NanoString PanCancer Pwathways gene expression data ACAD9 AGK AMMECR1L C10orf76 CC2D1B CNOT10 CNOT4 COG7 DDX50 DHX16 DNAJC14 EDC3 EIF2B4 ERCC3 FCF1 FTSJ2 GPATCH3 HDAC3 MRPS5 MTMR14 NOL7 NUBP1 PIAS1 PIK3R4 PRPF38A
Results
Patients
[0592] Between October 2009 and September 2016, 99 patients with advanced soft tissue sarcoma were treated with pazopanib at the Royal Marsden Hospital. Of these, 46 patients had retrievable FFPE tumour material that had been sampled prior to initiation of pazopanib. On examination of these materials, tissue that was adequate for downstream analysis was available for 38 patients (FIG. 1).
[0593] Baseline clinic-pathological characteristics are summarised in Table 1.
TABLE-US-00005 TABLE 1 Baseline clinico-pathological factors N = 38 (%) Age: <45 years 10 (26) 45-65 years 18 (48) >65 years 10 (26) Gender: Female 25 (66) Male 13 (34) Performance status 0 7 (18) 1 17 (44) 2 7 (18) NA 7 (18) Prior lines of systemic therapy 0 10 (26) 1-2 19 (50) 3+ 9 (24) Disease stage Unresectable localised 1 (3) Metastatic 37 (97) Organs involved 1 11 (29) 2 12 (32) 3 5 (13) 4+ 10 (26) Grade 1 2 (5) 2 18 (47) 3 18 (47) Histopathological subtype Leiomyosarcoma 11 (29) Solitary fibrous tumour 7 (18) Spindle cell sarcoma 3 (8) Myxofibrosarcoma 3 (8) Undifferentiated pleomorphic sarcoma 2 (5) Myxoid liposarcoma 2 (5) Other * 10 (26) * `Other` subtype groups consisted of single cases of mesenchymal chondrosarcoma, extraskeletal myxoid chondrosarcoma, fibrosarcoma, malignant peripheral nerve sheath tumour, malignant PEComa, granular cell tumour, clear cell sarcoma, alveolar soft part sarcoma, malignant epithelioid haemangioendothelioma, angiosarcoma
[0594] Average age was 54.4 years (range 19.8-81.2). Median number of prior lines of therapy was 1.5 (interquartile range (IQR) 0-2). All patients with documented performance status were ECOG 0-2. All but one patient had metastatic disease, with a median of 2 organ sites involved by disease (IQR1.75-3.25). Sixteen distinct STS subtypes were represented within our cohort, with leiomyosarcoma the most common subtype (11 cases). Solitary fibrous tumour (SFT) was the second most represented subtype (7 cases)--the over-representation of this rare subtype resulted from the stated focus of the EMPRASS study on SFT and subsequent pursuit of tissue blocks from referring centres. All but two of 38 cases were intermediate or high histological grade--of the two cases with low histological grade by FNLCC criteria, one was unresectable solitary fibrous tumour of the retroperitoneum whilst the other was a metastatic case of extraskeletal myxoid chondrosarcoma, an STS subtype not typically allocated grade on the basis of low grade morphological appearances that are incongruent with a more aggressive clinical phenotype. In this case, grade 1 was allocated on basis of FNLCC differentiation score of 2, <10 mitoses/high power field and no necrosis present.
[0595] At data cut-off on 30 Nov. 2016 (median follow-up 26.2 months), 35 of 38 patients (92%) had experienced a progression-free survival event and 31 (82%) had died. Median PFS for the cohort was 3.7 months (IQR 1.8-6.9), median OS was 9.5 months (IQR 3.9-19.6). Following retrospective review of imaging series by RECIST 1.1 criteria, 1/38 (2.6%) patient experienced objective radiological response, 20/38 (52.6%) had stable disease and 17/38 (44.7%) progression as best response. For patients with partial response or stable disease, median PFS was 6.4 months (IQR 3.7-12.9).
[0596] We analysed pre-pazopanib tumour material to categorise cases as having either high or low tumour expression of FGFR1 and PDGFRA by IHC, and as either TP53 mutated or wildtype tumours through Sanger sequencing of TP53 coding exons. 20/38 cases had high FGFR1 expression, 17/38 had high PDGFRA expression, and 10/38 tumours harboured non-synonymous mutations of TP53. These mutations were primarily missense single nucleotide variants (SNV) within the DNA binding domain of the gene, although single examples of small frameshift deletion, SNV at splice donor site and a 272 bp intragenic inversion were found (Supplemental FIG. 2).
[0597] FGFR1 expression level was not significantly associated with post-pazopanib PFS or OS. High PDGFRA was associated with worse OS (HR 2.08; 95% CI 1.01-4.35; p=0.04) but no difference in PFS. The interaction test between FGFR1 and PDGFRA expression status for PFS was statistically significant (p=0.001), suggesting that the effect of PDGFRA expression on progression depends on FGFR1 and vice versa. To examine the clinical value of combining the FGFR1 and PDGFRA expression status, patients were stratified into 4 subgroups as follows: FGFR1-Hi/PDGFRA-Hi, FGFR1-Hi/PDGFRA-Lo, FGFR1-Lo/PDGFRA-Lo and FGFR1-Lo/PDGFRA-Hi. In univariate analysis, patients with FGFR1-Lo/PDGFRA-Hi tumours (henceforth designated F-Lo/P-Hi) had significantly associated with worse PFS (HR 9.64; 95% CI 3.58-25.94; p<0.0001) and OS (HR 6.70; 95% CI 2.51-17.91; p<0.0001) when compared to patients with tumours exhibiting one of the other three FGFR1/PDGFRA combinations (hereafter designated IHCneg) (Table 2; Supplemental FIG. 3A-B). These data indicate that assessment of pre-treatment protein expression of these two RTKs that are targeted by pazopanib can be a surrogate panel to identify a subgroup of STS patients with poor treatment outcome.
[0598] Only one of the seven F-Lo/P-Hi cases harboured a TP53 mutation. In the remaining 31 IHCneg cases, TP53 mutation was associated with significantly worse PFS (HR 2.34; 95% CI 1.03-5.34; p=0.04) and OS (HR 3.47; 95% CI 1.44-8.39; p=0.003) when compared to those with wildtype TP53 (TP53 wt) (Supplemental FIG. 4A-B). This indicates that TP53 mutational status identified a further subgroup of patients with poor post-pazopanib outcome that had little overlap with the F-Lo/P-Hi subgroup.
[0599] The independent association of F-Lo/P-Hi status and TP53 mutation status with poor outcome was evaluated in multivariable Cox proportional hazard models adjusted for clinico-pathological factors (age, tumour grade, performance status, tumour histological subtype) (Table 2). F-Lo/P-Hi status (IHCneg vs F-Lo/P-Hi: PFS HR 12.54; 95% CI 3.86-40.72; p<0.001) and TP53 mutation (TP53 wt vs mutation: PFS HR 3.97; 95% CI 1.45-10.86; p=0.007) were independently associated with significantly higher risk of progression. F-Lo/P-Hi status (OS HR 22.11; 95% CI 5.90-82.81; p<0.001) and TP53 mutation (OS HR 7.90; 95% CI 2.56-24.41; p<0.001) also demonstrated independent association with OS. Higher histological grade (HR 3.51; 95% CI 1.40-8.79; p=0.007) and performance status (HR 8.23; 95% CI 2.54-26.69; p<0.001) were also independently associated with worse OS but not with PFS. Histological subtype did not demonstrate independent association with either PFS or OS.sup.6,7. Taken together, these data show that both F-Lo/P-Hi IHC status and TP53 mutational status separately identify subgroups of patients with poor outcome following pazopanib, and that this prognostic information is independent of STS histological subtype or other clinico-pathological factors.
TABLE-US-00006 TABLE 2 Univariate and multivariate analysis of PFS and OS by clinical and tumour factors. PFS event Univariate analysis Multivariate analysis OS event N N % HR 95% CI P HR 95% CI P N % Age(continuous) 38 35 92.1 0.96-1.02 31 81.6 Grade 1/2 20 18 90.0 1 -- -- 1 -- -- 14 70.0 3 18 17 94.4 1.54 0.21 1.18 0.51-2.71 0.70 17 94.0 Performance Status 0/1 24 23 95.8 1 -- -- 1 -- -- 20 83.3 2 7 7 100.0 1.00 0.42-2.37 0.99 1.17 0.75 7 100.0 NA 7 5 71.4 0.06 0.28 0.08-0.95 0.04 4 57.1 Histological subtype Leiomycsarcoma 11 10 90.1 1 -- -- 1 -- -- 9 81.8 Solitary Fibrous 7 6 85.7 0.48 0.17-1.36 0.17 0.77 0.23-2.62 0.68 5 71.4 Tissue Other 20 19 95.0 0.76 0.35-1.66 0.49 1.25 0.47-3.37 17 85.0 IHC Signature FGFR1-Hi and 31 28 90.3 1 -- -- 1 -- -- 24 77.4 PDGFRA-Lo FGFR1-Lo and 7 7 100.0 9.64 1.58-25.94 <0.001 12.54 3.86-40.72 <0.001 7 100.0 PDGFRA-Hi TP53 status Wildtype 28 25 89.3 1 -- -- 1 -- -- 21 75.0 Mutated 10 10 100.0 1.77 0.83-3.76 0.14 0.97 1.46-10.86 0.007 10 100.0 Univariate analysis Multivariate analysis N HR 95% CI P HR 95% CI P Age(continuous) 38 1.01 0.65 0.99 0.96-1.03 0.73 Grade 1/2 20 1 -- -- 1 -- -- 3 18 2.01 0.99-4.09 0.06 0.007 Performance Status 0/1 24 1 -- -- 1 -- -- 2 7 2.41 0.96-6.09 0.06 0.23 2.54-26.69 <0.001 NA 7 0.49 0.16-1.43 0.19 0.17 0.04-0.73 0.02 Histological subtype Leiomycsarcoma 11 1 -- -- 1 -- -- Solitary Fibrous 7 0.68 0.22-2.06 0.50 20.6 0.53-7.98 0.56 Tissue Other 20 1.06 0.46-2.45 0.89 2.57 0.86-7.67 0.09 IHC Signature FGFR1-Hi and 31 1 -- -- 1 -- -- PDGFRA-Lo FGFR1-Lo and 7 2.51-17.91 <0.001 22.11 5.90-82.81 <0.001 PDGFRA-Hi TP53 status Wildtype 28 1 -- -- 1 -- -- Mutated 10 2.51 1.15-5.51 0.02 7.90 2.56-24.41 <0.001 indicates data missing or illegible when filed
Analysis of Cancer Pathway-Related Gene Expression Reveals Subgroups with Distinct Pazopanib Outcomes
[0600] To gain a better understanding of the underlying biology driving improved pazopanib outcome in the remaining 22 IHCnegTP53 wt patients within our cohort, we performed expression analysis of cancer pathway-related genes in these cases. Consensus clustering demonstrated optimal separation of the cases into five biologically-defined clusters, labelled as biological subgroups 1-5 (FIG. 2A and Supplemental FIG. 5A-C). Log rank tests revealed statistically significant differences in both PFS and OS between these subgroups (FIG. 2B-C). Notably, we found that the five biologically-defined subgroups could be consolidated into three subgroups with comparable outcome and shared dendrogram clades--patients in subgroup 1 and 2 having comparable good outcomes, subgroups 4 and 5 comparable poor outcomes, and subgroup 3 intermediate/poor outcomes. Hence, we consolidated these 5 groups into 3 based on their similarities in survival estimates, designated as Clinical subgroup A (combining subgroups 1 and 2), subgroup B (subgroup 3) and subgroup C (combining subgroups 4 and 5) for further analysis. Comparing survival outcomes between subgroups by log rank test and Cox proportional hazards models, we found that patients in subgroup A had significantly improved PFS (HR 0.27; 95% CI 0.09-0.85; p=0.02) and OS (HR 0.20; 95% CI 0.04-0.96; p=0.03) compared to patients in subgroup B or C (FIG. 2E-F). Subgroup B and C exhibited similar PFS; Subgroup B appeared to have an intermediate OS that was not statistically significantly different to subgroup C. SAM analysis identified 229 genes (FDR <=10%) showing significant differential expression across these 3 subgroups (FIG. 2D and List 1); we built a standardised centroid for each of the clinical subgroup using gene expression data of these 229 genes.
[0601] Noting that all six cases of LMS within the 22 patients clustered together in subgroup B (FIG. 2D), we sought to compare the gene expression profile of our subgroup with the three LMS molecular subtypes previously reported by Guo et al on the Stanford-LMS dataset.sup.12. We assigned each of the 99 case from the same Stanford-LMS dataset into one of our three Clinical subgroups based on the nearest distance to subgroup centroids (Supplemental FIG. 6A). We found that cases assigned to Clinical subgroup B were significantly enriched for LMS molecular subtype I (Supplemental FIG. 6B-C). This subgroup, as described by Guo et al, was enriched for genes related to smooth muscle and associated with better survival outcomes when compared to the other LMS molecular subtypes. Hierarchical clustering of the 99 LMS cases using the list of 229 genes differentially expressed between Clinical subgroups A-C demonstrated that both LMS subtype I and subgroup B shared an overlapping set of upregulated genes (Supplemental FIG. 6D). This analysis provides independent validation that that we have identified an intermediate outcome, LMS-enriched subgroup and suggests that LMS subtype I may represent a disease entity with distinct pazopanib sensitivity. Meanwhile, gene ontology enrichment and interrogation of manually curated databases showed that Clinical subgroup A was enriched for genes involved with developmental and proliferation pathways including Notch and MAP kinase/growth factor RTK signalling respectively, while Clinical subgroup C displayed upregulation of genes involved in key inflammatory pathways including NFkB.
Integration of Molecular Risk Classifiers into a Clinical Decision Tree Model
[0602] Based on the observation that our cohort could be stratified into subgroups of contrasting post-pazopanib outcome through the sequential assessment of FGFR1/PDGFRA IHC, TP53 mutational status and then gene expression analysis, we conceived a clinical decision tree based on this approach for molecular risk classification (FIG. 3A). We allocated the 38 cases according to this decision tree classifier, namely into one of five molecularly-defined subgroups (F-Lo/P-Hi, TP53 mutated or gene expression-defined subgroups A-C). As expected, there was significant differential PFS and OS among the five subgroups (FIG. 3B-C). The F-Lo/P-HI subgroup had the worst PFS and OS overall (median PFS 1.4 months, median OS 1.7 months), whilst gene expression subgroup A had significantly superior PFS and OS (median PFS 12.8 months, median OS 34.4 months) compared to F-Lo/P-Hi, TP53 mutated and clinical subgroup C.
[0603] Multivariable comparison is shown in FIG. 3D. Both IHC status and TP53 mutational status provided statistical significant prognostic value for PFS (change in .DELTA.LR.chi..sup.2+22.5 [272%]) and OS (change in .DELTA.LR.chi..sup.2+40.83 [307%]) when added to a model comprising of baseline clinicopathological variables. The decision tree classifier, because of its additional risk stratification, provided the largest additional amount of prognostic information, with a 340% and 322% increase in predictive information for PFS and OS respectively relative to the use of clinicopathological factors only, compared to 272% and 307% when using FGFR1/PDGFRA IHC and TP53 mutational status as parallel terms in the model. These findings demonstrate that while the use of both the F-Lo/P-Hi IHC signature and TP53 mutational status considerably improves risk classification for both PFS and OS after pazopanib therapy compared to clinic-pathological variable alone, a decision tree classifier that sequentially integrates F-Lo/P-Hi IHC status, TP53 mutational status and gene expression subgroup analysis performed best for risk classification of PFS and OS. We have named this decision tree the Pazopanib Activity and Response in SARComas (PARSARC) classifier
Evaluation of Prognostic Value of the PARSARC Classifier in an Independent, Pazopanib-Naive STS Population
[0604] Recognising that the PARSARC classifier could potentially reflect general prognostic associations in STS rather than a pazopanib-specific effect, we sought to assess whether the classifier was indeed associated with differential OS in an independent cohort of patients with STS who had not received pazopanib. While no such cohort with annotated FGFR1 and PDGFRA protein expression is publicly available, a 261 case STS cohort annotated with genomic and mRNA transcript data is publically available from TCGA, referred here as TCGA-SARC. Due to lack of IHC data, we first sought to assess whether quantitation of FGFR1 and PDGFRA mRNA transcripts can be used as a surrogate marker to recapitulate the group defined by F-Lo/P-Hi IHC in our RMH-SARC cohort. We also assessed the degree to which FGFR1 and PDGFRA mRNA transcript abundance reflected IHC scoring of these proteins in our cohort. Cases with high FGFR1 or PDGFRA protein expression on IHC had significantly higher gene transcript levels than those with low protein expression (Supplementary FIG. 7A). When gene expression levels for FGFR1 and PDGFRA were plotted by the 4 IHC-defined subgroups, (F-Hi/P-Hi, F-Lo/P-Lo, F-Lo/P-Hi, F-Hi P-Lo), we found all 7 F-Lo/P-Hi cases had corresponding low FGFR1 and high PDGFRA gene expression (Supplementary FIG. 7B), as did several other cases without F-Lo/P-Hi assignment by IHC. However, on IHC review, one case scored FGFR1-Lo/PDGFRA-Lo on IHC but FGFR1-Lo/PDGFRA-Hi by gene expression was found to have high levels of PDGFRA expression in tumour-associated vasculature but not tumour cells themselves. When this case was reallocated to the FGFR1-Lo/PDGFRA-Lo gene expression subgroup, significantly worse PFS was seen in the FGFR1-Lo/PDGFRA-Hi subgroup, in line with the IHC findings (supplementary FIGS. 7C and 7D). This analysis indicates that the poor outcome associated with the F-Lo/P-Hi IHC status is also reflected at the transcript level in our cohort, while also highlighting the greater resolution of IHC over gene expression analysis to detect tumour cell-specific expression. We therefore continued to evaluate the TCGA dataset, including the use of FGFR1 and PDGFRA transcript level as a surrogate for protein expression.
[0605] We assessed whether F-Lo/P-Hi gene expression, TP53 mutation and/or gene expression-defined subgroups A-C had prognostic associations in a STS cohort which had not received pazopanib therapy using the TCGA-SARC dataset. After exclusion of 7 cases who had received pazopanib, gene expression data and TP53 sequencing data were available for 250 and 232 patients respectively. Having defined a high/low expression cut-off at the 1.sup.st tertile of normalised expression scores for FGFR1 and PDGFRA, 49/250 (19.6%) of TCGA patients exhibited low FGFR1 and high PDGFRA expression. No significant difference in overall survival was seen between these patients and those without the F-Lo/P-Hi signature (FIG. 4A). 80/232 (34%) patients had tumours with detected single nucleotide variants or small indels of TP53. Again, no significant difference in overall survival was seen between these TP53 mutated cases and those without TP53 mutation (FIG. 4B). From the 250 cases with gene expression data, 46, 82 and 122 cases were respectively assigned to Clinical subgroup A, B and C based on the nearest distance to each of the three subgroups centroids (Supplemental FIG. 8). There was no overall survival difference observed across the 3 subgroups (FIG. 4C). Finally, we allocated the 229/254 pazopanib-naive patients for whom both DNA and RNA sequencing data was available to one of the five subgroups defined the PARSARC risk classifier (F-Lo/P-Hi 45; TP53 mutated--67; Clinical subgroup A--22 cases; subgroup B--38; subgroup C--57) (FIG. 4D). We again found no significant difference in overall survival between any of the five subgroups.
[0606] Collectively, this analysis finds that while the molecular risk classifiers can be used to categorize subgroups demonstrating significantly different prognosis in our pazopanib-treated cohort, we did not observe significant different prognosis of these subgroups when applied in an independent mixed STS cohort of patients who had not received pazopanib therapy.
Discussion
[0607] In this retrospective study of a heterogeneous cohort of STS patients treated with pazopanib, we performed targeted molecular analysis including assessing expression levels of pazopanib targets FGFR1 and PDGFRA, TP53 mutational analysis and cancer pathway-related gene expression profiling. To our knowledge, this is the largest molecular study of pazopanib-treated STS to date and the first to provide an in-depth examination of multiple aspects of molecular pathology within the same cohort.
[0608] When assessing tumour specimens sampled prior to initiation of pazopanib therapy, the combination of low FGFR1 and high PDGFRA protein expression on IHC was associated with very poor PFS and OS following pazopanib therapy. Furthermore, the presence or absence of TP53 mutation in the IHC negative tumours was able to identify two subgroups of contrasting outcomes, with cases harbouring TP53 mutations experiencing worse PFS and OS compared to TP53 wildtype cases. Finally, consensus clustering of gene expression data was able to further stratify the remaining patients with IHCnegTP53 wt tumours resulting in three clinical subgroups with patients in subgroup A associated with the best outcomes. Inclusion of F-Lo/P-Hi IHC status, TP53 mutational status and gene expression subgroup allocation into multivariable analysis produced the best performing predictive model. Taken together, we propose that these data form the basis for a clinical decision making tree that could potentially assist in identifying suitable candidates for pazopanib therapy from an unselected advanced STS population (FIG. 5).
[0609] Pazopanib shows selectivity for both FGFR1 and PDGFRA which are RTKs with documented capacity to activate multiple canonical oncogenic pathways.sup.24-26. We recently reported that malignant rhabdoid tumour cells with high expression of both FGFR1 and PDGFR.alpha. are sensitive to pazopanib, and that downregulation of PDGFRA expression was associated with the development of an acquired pazopanib resistance that could be overcome through the addition of a selective FGFR1 inhibitor.sup.27. In our cohort, there was significant interaction between protein expression levels of FGFR1 and PDGFRA in predicting PFS, suggesting that the poor prognosis F-Lo/P-Hi IHC subgroup may reflect a currently undefined oncogenic pathway biology that confers primary pazopanib resistance. Pathway enrichment analysis of gene expression data from the full 38 patient cohort finds an upregulation of genes involved in the JAK-STAT signalling pathway in 6 of 7 IHC-positive cases, reflecting a potential role of this pathway in pazopanib resistance (supplementary FIG. 9). Further investigation of our cohort to determine the underlying biology reflected in the F-Lo/P-Hi IHC subgroup is planned.
[0610] The presence of TP53 mutation provided independent prognostic information in multivariable analysis for PFS and OS in our 38 patient cohort. Additionally, in patients without the poor prognosis F-Lo/P-Hi signature, presence of TP53 mutation identified a further poor prognosis subgroup that had significantly worse PFS and OS compared to IHCnegTP53 wt patients. This finding is in contrast to the reported findings of a study by Koehler et al where the presence of TP53 mutation as detected with targeted next-generation gene sequencing was associated with favourable PFS following pazopanib therapy compared to patients with TP53 wildtype tumours (HR0.38; 95CI 0.09-0.83; p=0.036).sup.17. The reason for the inconsistency of the associations of TP53 mutation with pazopanib-related between the two studies is unclear. Both studies included patients from a broad range of STS subtypes, with few patients representing each subtype, and so random error in patient selection may have introduced biological differences between the two study cohorts. Whilst LMS was the most represented subtype in both studies, SFT accounted for 0 of 19 patients in Koehler's study as opposed to 7 of 38 patients in our study, with TP53 mutation found in 3 of 7 SFT cases. The functional impact of the TP53 mutations in our cohort has not been established. Koehler et al did not state the specific mutations detected in their cohort, although note that all were predicted to be loss of function. As it is recognised that specific point mutations of TP53 can result in loss or gain of function.sup.28 it is possible that variation in the functional impact of TP53 mutation between studies resulted in opposite clinical phenotypes in relation to pazopanib. Differences in TP53 sequencing methods used in the two studies could also have contributed to the discrepancy--the higher rate of TP53 mutation seen in Koehler's study (10 of 19 patients vs. 10 of 38 patients) may indicate the greater sensitivity of their next-generation sequencing over our Sanger sequencing in terms of ability to detect low level TP53-mutant clones. The role of TP53 mutation as a marker for both pazopanib therapy and overall prognosis in advanced STS requires further investigation--of note, in our cohort the presence of TP53 mutation was almost mutually exclusive to the F-Lo/P-Hi IHC subgroup, with TP53 mutation detected in only 1 of 7 cases with the poor-outcome-related IHC signature.
[0611] Gene expression analysis has been widely used in translational cancer research as a means of identifying tumour subgroups of distinct clinical behaviour and underlying biology. A number of reported studies have demonstrated that different STS histological subtypes have distinct, subtype-specific gene expression profiles.sup.29-31 . On analysing gene expression data from our heterogeneous 38 patient cohort, cases of the same STS subtype clustered together in a manner consistent with these previously reported findings and thus providing validation to our data (supplementary FIG. 10). Consensus clustering of the 38 patient cohort did not, however, identify subgroups with significantly distinct post-pazopanib outcomes, indicating that gene expression analysis alone was insufficient to stratify our cohort (supplemental FIG. 10B+C). Only when F-Lo/P-Hi and TP53 mutated cases were excluded from the cohort did gene expression analysis provide additional prognostic information in identifying 3 gene expression signature-defined subgroups (FIGS. 2 and 3). A relative strength of IHC over mRNA transcript abundance-based gene expression analysis was highlighted by a single case of extraskeletal myxoid chondrosarcoma. IHC provided the compartmental spatial resolution to distinguish between vessel and tumour cell PDGFRA expression, allowing for allocation to the better prognosis F-Lo/P-Lo subgroup, whereas the high levels of PDGFRA detected by NanoString analysis within this sample resulted into misallocation to a poor prognosis F-Lo/P-Hi subgroup. Whilst pathway enrichment analysis of gene expression data offers preliminary clues, our cohort is underpowered to provide reliable information on the biology that underlies the range of outcomes seen. Overall, PFS and OS in our cohort is broadly in keeping with other reported pazopanib-treated STS cohorts.sup.32-35. As was the case in the pazopanib phase II and III trials, a minority of patients in our cohort experienced PFS greater than 6 months and overall survival greater than 18 months. It is important that further research explores the biology underlying such exceptional responders to enable further biomarker development and an understanding of the mechanisms of sensitivity and primary and acquired resistance to pazopanib.
[0612] There are several limitations to our study. Our single institution cohort, although the largest tissue-based study of a pazopanib-treated cohort to date, is small and has been assessed retrospectively, producing vulnerability to systematic and random biases. Clinical annotation was based on retrospective review of contemporaneous medical documentation, where the absence of a prospective protocol will have contributed to variations in management such as decisions regarding dose reductions/interruptions, timing of radiological assessment and cessation of therapy. The included patients represented a broad range of STS subtypes, representing heterogeneous biology and reflecting daily clinical practice. Further heterogeneity was introduced by the study of archival tumour tissue which variably represented primary, recurrence or metastatic lesions that were taken only days prior to pazopanib commencement in some cases, whilst in other cases the archival sample originated several years earlier with several lines of intervening systemic therapy delivered. Some patients died during or shortly after completion of pazopanib therapy, whilst others went on to receive varied post-pazopanib therapies. Despite these limitations, we have been able to identify molecular signatures that identify patient subgroups with a significantly distinct post-pazopanib outcome. The heterogeneity of disease and specimen studied is representative of a typical scenario faced by oncologists considering prescribing pazopanib for patients with advanced STS, and supports the potential usefulness of our candidate decision tree. Whilst we found no such associations in the TCGA STS cohort not defined by pazopanib exposure, it cannot be established in our retrospective cohort whether the association between the identified molecular readouts and outcome is specific to pazopanib treatment, rather than a more general prognostic association unrelated to drug exposure. Our findings should be considered as hypothesis generating, with analysis of carefully selected pazopanib-naive control cohorts and/or prospective assessment of the identified molecular signature required to provide greater insight into any predictive relationship with pazopanib.
[0613] Advanced STS remains associated with poor prognosis and limited lines of effective treatment.sup.36. The recruitment of heterogeneous `all-comer` cohorts to phase III drug trials in STS continues to contribute to the frequent failure to translate early efficacy signals into definitive evidence of survival benefit.sup.37. Whilst pazopanib received regulatory approval on the basis of PFS advantage over placebo in a mixed STS cohort, the drug's clinical effectiveness is limited by the lack of predictive biomarkers for benefit. In a retrospective, heterogeneous advanced STS cohort, we have identified a method of molecular classification of tumours that identifies patient subgroups with distinct PFS and OS following pazopanib therapy. If successfully validated, our proposed clinical decision tree would assist in the prospective identification a group less likely to benefit from pazopanib for whom alternative drugs or best supportive care should be considered. Notably, the PDGFRa-targeting monoclonal antibody olaratumab recently received accelerated FDA approval for the 1st line treatment of advanced STS in combination with doxorubicin on the basis of marked OS benefit in a randomised phase II study--this drug would represent an avenue of interest in the F-Lo/P-Hi PDGFRA-overexpressing, poor prognosis patient group that we have identified.sup.38. Furthermore, recently published results of a randomised phase II trial of regorafenib, a TKI with target selectivity overlap with pazopanib, indicates efficacy in several STS subtypes but not adipocytic tumours.sup.39. The similarity of these clinical data with those of pazopanib raises the question of whether the molecular signature we have identified can also provide risk classification for treatment with regorafenib and other related TKIs. Our study presents a basis for development of biomarkers that may employ simple IHC or genotyping approaches or more sophisticated companion diagnostic assays that can identify STS patients most likely to benefit from pazopanib and other related TKIs.
TABLE-US-00007 TABLE 3 Sarcoma Centroids Gene Symbol Accession Target Sequence Isoform Coverage Hit List Subgroup B centroid Subgroup A centroid Subgroup C centroid FGF9 NM_002010.2 TGTTGCCAAACTTTGT NM_002010 -0.787299586 0.684375081 0.071127474 CGCATGCATAATGTAT GATGGAGGCTTGGATG GGAATATGCTGATTTT GTTCTGCACTTAAAGG CTTCTCCTCCTGGAGG GCTG (SEQ ID NO: 15) NFATC1 NM_172389.1 CGAATTCTCTGGTGGT NM_172389; NM_001278675; -0.371691666 0.704052833 0.023044704 TGAGATCCCGCCATTT NM_172390; NM_001278672; CGGAATCAGAGGATAA NM_001278670; NM_172387; CCAGCCCCGTTCACGT NM_006162; NM_001278669; CAGTTTCTACGTCTGC NM_172388; NM_001278673 AACGGGAAGAGAAAGC GAAG (SEQ ID NO:16) FZD10 NM_007197.2 CCGTGCCGGCCACCTG NM_007197 -0.440193224 0.660391129 0.172537497 TGTGATCGCCTGCTAC TTTTACGAACGCCTCA ACATGGATTACTGGAA GATCCTGGCGGCGCAG CACAAGTGCAAAATGA ACAA (SEQ ID NO: 17) HMGA2 NM_003484.1 GAGGAGGAATTCTTTC NM_003484; NM_003483 -1.323612428 0.295732763 0.90817728 CCCGCCTAACATTTCA AGGGACACAATTCACT CCAAGTCTCTTCCCTT TCCAAGCCGCTTCCGA AGTGCTCCCGGTGCCC GCAA (SEQ ID NO: 18) FZD9 NM_003508.2 CCTGCCCGCGCTCAAG NM_003508 -1.075145616 0.616942772 0.410943305 ACCATCGTCATCCTGA CCCTGCGCAAGGTGGC GGGTGATGAGCTGACT GGGCTTTGCTACGTGG CCAGCACGGATGCAGC AGCG (SEQ ID NO: 19) PRKX NM_005044.1 CAGTGAAGCTGGGTGC NM_005044 -1.153743629 0.02023958 1.480748471 GGTGGTGCACTCCTGT AACCCTGGGACTTTGG GAAGCTGAGGCAGGAA GATTGAGCCTAGGAGT TCGAGACTGACCTGGG CAGC (SEQ ID NO: 20) CCND1 NM_053056.2 TTGAACACTTCCTCTC NM_053056 -0.847605437 -0.047679935 0.844326227 CAAAATGCCAGAGGCG GAGGAGAACAAACAGA TCATCCGCAAACACGC GCAGACCTTCGTTGCC CTCTGTGCCACAGATG TGAA (SEQ ID NO: 21) MAP2K6 NM_002758.3 AGCCAGGAACAGAAAC NM_002758 -1.186458783 0.341738061 1.094717343 GGCTACTGATGGATTT GGATATTTCCATGAGG ACGGTGGACTGTCCAT TCACTGTCACCTTTTA TGGCGCACTGTTTCGG GAGG (SEQ ID NO: 22) TP53 NM_000546.2 GGGGAGCAGGGCTCAC NM_000546; NM_001126117; -1.053931167 0.276137891 -0.07221507 TCCAGCCACCTGAAGT NM_001126118; NM_001126113; CCAAAAAGGGTCAGTC NM_001276760; NM_001276699; TACCTCCCGCCATAAA NM_001276697; NM_001276695; AAACTCATGTTCAAGA NM_001126115; NM_001276761; CAGAAGGGCCTGACTC NM_001126116; NM_001126112; AGAC (SEQ ID NM_001276696; NM_001276698; NO: 23) NM_001126114 FANCF NM_022725.2 CTGTCTATCTGGGTCT NM_022725 -2.562689656 0.02114079 0.285248682 GCTAACAGACTGGGGT CAACGTTTGCACTATG ACCTTCAGAAAGGCAT TTGGGTTGGAACTGAG TCCCAAGATGTGCCCT GGGA (SEQ ID NO: 24) HDAC10 NM_032019.5 CCAGCGTCCTTTACTT NM_032019; NM_001159286 -0.864986527 -0.466408988 1.358279782 CTCCTGGCACCGCTAT GAGCATGGGCGCTTCT GGCCTTTCCTGCGAGA GTCAGATGCAGACGCA GTGGGGCGGGGACAGG GCCT (SEQ ID NO: 25) CARD11 NM_032415.2 TTGAAAATCGGCCCAA NM_032415 -1.225657695 0.031589204 1.277944476 GAAGGAGCAGGTTCTG GAACTGGAGCGGGAGA ATGAAATGCTGAAGAC CAAAAACCAGGAGCTG CAGTCCATCATCCAGG CCGG (SEQ ID NO: 26) FGF5 NM_004464.3 AAGAGTTACCTCCTCC NM_004464; NM_033143 -1.030325063 0.388725522 0.844361302 ATCTTACTCTGCCCTA TTTGAAAGTCTCAGGG GAGAAAAGGGAACAAG ATGCTGATCCAACCTG AGTGGAGTCAGGTGAG GCAT (SEQ ID NO: 27) DUSP4 NM_057158.2 GCACCGTAGCATGCAG NM_057158; NM_001394 -0.851980221 -0.18231116 0.820109581 ATGTCAAGGCAGTTAG GAAGTAAATGGTGTCT TGTAGATATGTGCAAG GTAGCATGATGAGCAA CTTGAGTTTGTTGCCA CTGA (SEQ ID NO: 28) IL12RB2 NM_001559.2 CCTCCGTGGGACATTA NM_001559; -0.380856163 -0.42852557 0.791789922 GAATCAAATTTCAAAA NR_047584; NR_047583; GGCTTCTGTGAGCAGA NM_001258216; TGTACCCTTTATTGGA NM_001258215; GAGATGAGGGACTGGT NM_001258214 ACTGCTTAATCGACTC AGAT (SEQ ID NO: 29) E2F5 NM_001951.3 AATTGAAGATCTAGAA NM_001951; -1.194613628 -0.049929218 0.829615055 CTGAAGGAAAGAGAAC NM_001083589; TTGATCAGCAGAAGTT NM_001083588 GTGGCTACAGCAAAGC ATCAAAAATGTGATGG ACGATTCCATTAATAA TAGA (SEQ ID NO: 30) CCR7 NM_001838.2 TTCCGAAAACCAGGCC NM_001838 -0.084056229 -0.0392025 0.836628323 TTATCTCCAAGACCAG AGATAGTGGGGAGACT TCTTGGCTTGGTGAGG AAAAGCGGACATCAGC TGGTCAAACAAACTCT CTGA (SEQ ID NO: 31) PAX5 NM_016734.1 CTCCAAGAGGAGCACA NM_016734; NR_104000; -0.643065022 0.250705882 0.802373206 CTTTGGGGAGATGTCC NR_103999; NM_001280556; TGGTTTCCTGCCTCCA NM_001280555; NM_001280554; TTTCTCTGGGACCGAT NM_001280553; NM_001280549; GCAGTATCAGCAGCTC NM_001280548; NM_001280547; TTTTCCAGATCAAAGA NM_001280552; NM_001280551; ACTC (SEQ ID NM_001280550 NO: 32) NOG NM_005450.4 ACAGAGAAAAGAGAGA NM_005450 -0.995613082 0.777936727 -0.257207914 CTTATTCTGGTTGTTG CTAATAATGTTAACCT GCTATTTATATTCCAG TGCCCTTCGCATGGCG AAGCAGGGGGGAAAAG TTAT (SEQ ID NO: 33) PTCH1 NM_000264.3 AATCTCCTTCTCTCGG NM_000264; NM_001083607; -0.633931616 2.131940241 -0.891766233 ATCATTGTGATGGATG NM_001083606; CTGGAACCTCAGGGTA NM_001083605; TGGAGCTCACATCAGT NM_001083604; TCATCATGGTGGGTGT NM_001083603; TAGAGAATTCGGTGAC NM_001083602 ATGC (SEQ ID NO: 34) ZIC2 NM_007129.2 AAAAATAAAAACCCAC NM_007129 0.148829172 0.771918368 -0.805607102 AAAAATGTTGAACCAA ACCTCCCTGCTAATCT CCATGCCCACGTTCTT TCCCACCCTGTTCCCA GTCTTCTGACAAACTG TGTA (SEQ ID NO: 35) CACNA1G NM_198397.1 TTTGACAACATTGGCT NM_198397; NM_001256359; -0.66346841 0.911704604 -0.1016264 ATGCCTGGATCGCCAT NM_198382; XM_006722161; CTTCCAGGTCATCACG NM_001256327; NM_198396; CTGGAGGGCTGGGTCG NM_198384; NM_001256333; ACATCATGTACTTTGT NM_001256325; NM_198379; GATGGATGCTCATTCC NM_001256328; NM_001256360; TTCT (SEQ ID XM_006722160; NR_046054; NO: 36) NM_198376; NM_198383; NM_001256334; NM_198377; NM_198386; NM_001256324; NM_001256330; NM_018896; NR_046055; NM_001256326; NM_001256361; NM_198385; NM_001256331; NR_046057; NM_198388; NR_046058; NM_198378; NM_001256329; NM_198387; NR_046056; NM_001256332; NM_198380 SMAD3 NM_005902.3 TTAAAGGACAGTTGAA NM_005902; NM_001145104; -0.393760319 1.018703135 -0.451762506 AAGGGCAAGAGGAAAC NM_001145102; NM_001145103 CAGGGCAGTTCTAGAG GAGTGCTGGTGACTGG ATAGCAGTTTTAAGTG GCGTTCACCTAGTCAA CACG (SEQ ID NO: 37) CHAD NM_001267.2 ACACCAACCTGGAGAA NM_001267 0.029259868 0.92288135 0.235476291 GTTCTCAGATGGTGCC TTCCTGGGTGTAACCA
CGCTGAAACACGTCCA TTTGGAGAACAACCGC TTGAACCAGCTACCCT CCAA (SEQ ID NO: 38) TLX1 NM_005521.3 ACCACACATCCCAGCC NM_005521; NM_001195517 0.06809746 0.867855103 -0.263254402 CAATCCAGGTACGCAC AGACAGGTTTTCACAT AAATGCAGCCCATTTC TCCAGAACCCATTTGA GGGGTGGGGGGGTGTT AATT (SEQ ID NO: 39) BCOR NM_001123383.1 CACCTCCTCTGTTGGA NM_001123383; NM_001123384; 0.102427544 1.716828147 -1.525569877 GAAGCAGACCGTTACC NM_001123385; NM_017745 AAAGACGTCACAGATA AGCCACTAGACTTGTC TTCTAAAGTGGTGGAT GTAGATGCTTCCAAAG CTGA (SEQ ID NO: 40) EFNA2 NM_001405.3 TCCCTCTCCGAGGCCG NM_001405 0.452825555 0.641136053 -0.36647518 AGAAGACCTTCTGTTC CTGTAAATACAGCCAG CAAGTGCAAACTGTGA TTTTATTTTCCACGTA TTCCTGAGGACGGACT GGAC (SEQ ID NO: 41) LEFTY2 NM_003240.2 AGTGCTCCTGTGTGAC NM_003240; NM_001172425 0.779378173 0.416545389 -0.967518679 CTTCGCCCTGTGTCCT TCCATTTCCTGTCTTT CCCGTCCATCACCCAT CCTAAGCACTTACGTG AGTAAATAATGCAGCT CAGA (SEQ ID NO: 42) NOTCH2 NM_024408.3 AAGAGTCACCAAATTT NM_024408; NM_001200001 0.252055478 0.336041946 -0.976488588 TGAGAGTTATACTTGC TTGTGTGCTCCTGGCT GGCAAGGTCAGCGGTG TACCATTGACATTGAC GAGTGTATCTCCAAGC CCTG (SEQ ID NO: 43) ATM NM_138292.3 CTTTATGGCAGGGGTG NM_138292; NM_000051 -1.079149788 -0.154750465 0.653606333 GAAGGAGGTACATTTA ATTCCCACTGCCTGCC TTTGGCAAGCCCTGGG TTCTTTGCTCCCCATA TAGATGTCTAAGCTAA AAGC (SEQ ID NO: 44) TNFRSF10D NM_003840.3 GTATCTTTGGGAAGCC NM_003840 -1.120751017 -0.023301806 0.695417144 ATGTGTCTGGTTTGTC GTGCTGGGACAGTCAT GGGACTGCATCTTCCG ACTTGTCCACAGCAGA TGAGGACAGTGAGAAT TAAG (SEQ ID NO: 45) TGFB1 NM_000660.3 TATATGTTCTTCAACA NM_000660 -0.899502256 0.365260494 0.465688467 CATCAGAGCTCCGAGA AGCGGTACCTGAACCC GTGTTGCTCTCCCGGG CAGAGCTGCGTCTGCT GAGGCTCAAGTTAAAA GTGG (SEQ ID NO: 46) DKK1 NM_012242.2 CGGCACGGTTTCGTGG NM_012242 -0.51629809 0.494457312 0.681706191 GGACCCAGGCTTGCAA AGTGACGGTCATTTTC TCTTTCTTTCTCCCTC TTGAGTCCTTCTGAGA TGATGGCTCTGGGCGC AGCG (SEQ ID NO: 47) IDH1 NM_005896.2 GTGGCGCCCCAACTCT NM_005896 -0.456773483 0.280037814 1.328340834 TCGCCAGCATATCATC CCGGCAGGCGATAAAC TACATTCAGTTGAGTC TGCAAGACTGGGAGGA ACTGGGGTGATAAGAA ATCT (SEQ ID NO: 48) COMP NM_000095.2 TGGCTGTGGGTTACAC NM_000095 -0.493285797 0.819951452 0.559484802 TGCCTTCAATGGCGTG GACTTCGAGGGCACGT TCCATGTGAACACGGT CACGGATGACGACTAT GCGGGCTTCATCTTTG GCTA (SEQ ID NO: 49) PTEN NM_000314.3 TGTGGTCTGCCAGCTA NM_000314 -0.764885608 0.128186717 0.825774951 AAGGTGAAGATATATT CCTCCAATTCAGGACC CACACGACGGGAAGAC AAGTTCATGTACTTTG AGTTCCCTCAGCCGTT ACCT (SEQ ID NO: 50) CALML6 NM_138705.2 ATGGCCAAGGATGTGG NM_138705 -1.273555604 0.849552584 0.267196887 ACAGAGACAACAAAGG GTTCTTCAACTGCGAT GGTTTCCTGGCACTAA TGGGAGTTTACCATGA GAAGGCCCAGAACCAG GAGA (SEQ ID NO: 51) ERBB2 NM_004448.2 CTGAAAGAGACGGAGC NM_004448; NM_001005862 -0.657891493 0.868247895 -0.336671826 TGAGGAAGGTGAAGGT GCTTGGATCTGGCGCT TTTGGCACAGTCTACA AGGGCATCTGGATCCC TGATGGGGAGAATGTG AAAA (SEQ ID NO: 52) IL11RA ND4_147162.1 TCCAGCCCGCCCTGTT ND4_147162; NR_052010; -0.574798229 0.757662318 -0.163619158 GTCTCCTGCCAAGCAG NM_001142784 CCGACTATGAGAACTT CTCTTGCACTTGGAGT CCCAGCCAGATCAGCG GTTTACCCACCCGCTA CCTC (SEQ ID NO: 53) PDGFD NM_025208.4 CATACCATGACCGGAA NM_025208; NM_033135 -1.453013751 0.553101435 0.342655917 GTCAAAAGTTGACCTG GATAGGCTCAATGATG ATGCCAAGCGTTACAG TTGCACTCCCAGGAAT TACTCGGTCAATATAA GAGA (SEQ ID NO: 54) PRKAR1B NM_001164759.1 CGTGTGCTGGGGCCCT NM_001164759; -0.861735578 0.972622807 -0.165967303 GCTCTGAGATCCTCAA NM_001164762; NM_001164761; GAGGAACATTCAGCGT NM_001164760; NM_001164758; TACAACAGCTTCATCT NM_002735 CCCTCACCGTCTGAGC ACAGCTCCCGCCCTGC AGCC (SEQ ID NO: 55) DDB2 NM_000107.1 GGGGAACGTGATCCTG NM_000107 -1.048250131 1.204621227 0.153767602 CTGAACATGGACGGCA AAGAGCTTTGGAATCT CAGAATGCACAAAAAG AAAGTGACGCATGTGG CCCTGAACCCATGCTG TGAT (SEQ ID NO: 56) TSPAN7 NM_004615.3 GGCGTTTGGAATCGCA NM_004615 -0.586966677 1.295666073 -0.034132673 TTCTCCCAGTTAATTG GCATGCTGCTGGCCTG CTGTCTGTCCCGGTTC ATCACGGCCAATCAGT ATGAGATGGTGTAAGG AGAA (SEQ ID NO: 57) FBXW7 NM_018315.4 TGGGTCATGTTGCAGC NM_018315; NM_001013415; -0.551931516 0.743952534 -0.032066214 AGTCCGCTGTGTTCAA NM_033632 TATGATGGCAGGAGGG TTGTTAGTGGAGCATA TGATTTTATGGTAAAG GTGTGGGATCCAGAGA CTGA (SEQ ID NO: 58) DLL1 NM_005618.3 ACCAGTCGGTGTACGT NM_005618 -0.787054447 1.297166278 -0.028735448 CATATCCGAGGAGAAG GATGAGTGCGTCATAG CAACTGAGGTGTAAAA TGGAAGTGAGATGGCA AGACTCCCGTTTCTCT TAAA (SEQ ID NO: 59) HES1 NM_005524.2 GCTGGAGAGGCGGCTA NM_005524 -1.350029079 1.708702854 -0.435881651 AGGTGTTTGGAGGCTT CCAGGTGGTACCGGCT CCCGATGGCCAGTTTG CTTTCCTCATTCCCAA CGGGGCCTTCGCGCAC AGCG (SEQ ID NO: 60) COL27A1 NM_032888.2 GGATCCAAACCTTGGC NM_032888 -0.678678331 0.932985532 -0.06990641 TGCTCCTCTGACACCA TCGAGGTCTCCTGCAA CTTCACTCATGGTGGA CAGACGTGTCTCAAGC CCATCACGGCCTCCAA GGTC (SEQ ID NO: 61) PDGFRA NM_006206.3 TAGTGCTTGGTCGGGT NM_006206 -0.631137099 0.771453391 0.002225072 CTTGGGGTCTGGAGCG TTTGGGAAGGTGGTTG AAGGAACAGCCTATGG ATTAAGCCGGTCCCAA CCTGTCATGAAAGTTG CAGT (SEQ ID NO: 62) CCND2 NM_001759.2 AGCCTGCATCCCTTCG NM_001759 -0.962072017 0.560935922 0.380438596 CCTGCAGCCTACTTTG GGGAAATAAAGTGCCT TACTGACTGTAGCCAT
TACAGTATCCAATGTC TTTTGACAGGTGCCTG TCCT (SEQ ID NO: 63) CXXC4 NM_025212.1 AGCCTCAGCAGCCGTC NM_025212 -1.135455693 0.927997254 0.168080612 ACAGACAGTGCGTTTC AAATTGCCAATCTGGC AGACTGCCCGCAGAAT CATTCCTCCTCCTCCT CGTCCTCCTCAGGGGG AGCT (SEQ ID NO: 64) ACVR1B NM_004302.3 CGGGAGAGACTCGCTC NM_004302; NM_020328; -0.715425503 1.035669748 -0.098350604 ACTCCCATGTTGGGTT NM_020327 TGAGACAGACACCTTT TCTATTTACCTCCTAA TGGCATGGAGACTCTG AGAGCGAATTGTGTGG AGAA (SEQ ID NO: 65) DTX4 NM_015177.1 GCATCTACTACCTTGA NM_015177 -0.980772905 1.188830049 0.344156922 CACAGAGTGTTTTCCC ACTAGAAGCTCTGCTC TGCTCTCCTGGCCCAA GTAGGGGATTCCATGC CTTCCCTTTCATGGTC TTAG (SEQ ID NO: 66) TGFB3 NM_003239.2 CCCTCGATCATATTTC NM_003239 0.779010809 0.453512809 -1.151684947 CCCTTGGACACTTGGT TAGACGCCTTCCAGGT CAGGATGCACATTTCT GGATTGTGGTTCCATG CAGCCTTGGGGCATTA TGGG (SEQ ID NO: 67) ZBTB16 NM_006006.4 TCCTGGATAGTTTGCG NM_006006; NM_001018011 0.744144038 0.300340307 -1.501842069 GCTGAGAATGCACTTA CTGGCTCATTCAGCGG GTGCCAAAGCCTTTGT CTGTGATCAGTGCGGT GCACAGTTTTCGAAGG AGGA (SEQ ID NO: 68) MAPK10 NM_002753.2 GTATTCATACAGCACT NM_002753; NM_138982; 0.746376668 -0.429814494 -0.788117541 ACTTACTTAGAGATGC NM_138981; NM_138980 TACTGTCAGTGTCCTC AGGGCTCTACCAAGAC ATAATGCACTGGGGTA CCACATGGTCCATTTC ATGT (SEQ ID NO: 69) SPOP NM_001007226.1 GCCTTGTCTCTTGGGT NM_001007226; NM_001007230; 1.211367282 -0.57725145 -0.550759513 CTGAGTCCCTTGCTTA NM_001007229; NM_001007228; AGGGATTTTGAAGTCC NM_003563; NM_001007227 TAGTTTTCAGCTTGCA GAGATTATGTCTGAAA TGCCTAATGAGTCGCA GGGA (SEQ ID NO: 70) CASP7 NM_001227.3 ATCAATGACACAGATG NM_001227; NM_001267058; 0.943717067 -1.042835031 0.467273755 CTAATCCTCGATACAA NM_001267057; GATCCCAGTGGAAGCT NM_001267056; GACTTCCTCTTCGCCT NM_033340; NM_033339; ATTCCACGGTTCCAGG NM_033338 CTATTACTCGTGGAGG AGCC (SEQ ID NO: 71) FGF21 NM_019113.2 GATCACCTGAGGACCC NM_019113 0.616732498 -1.397117511 -0.041120318 GAGCCATTGATGGACT CGGACGAGACCGGGTT CGAGCACTCAGGACTG TGGGTTTCTGTGCTGG CTGGTCTTCTGCTGGG AGCC (SEQ ID NO: 72) BAD NM_004322.3 CAGCACAGCGCTATGG NM_004322; NM_032989 0.606883027 -1.201194407 0.232550134 CCGCGAGCTCCGGAGG ATGAGTGACGAGTTTG TGGACTCCTTTAAGAA GGGACTTCCTCGCCCG AAGAGCGCGGGCACAG CAAC (SEQ ID NO: 73) GSK3B NM_002093.2 ACTGATTATACCTCTA NM_002093; NM_001146156 0.885705342 -1.39075106 0.610667114 GTATAGATGTATGGTC TGCTGGCTGTGTGTTG GCTGAGCTGTTACTAG GACAACCAATATTTCC AGGGGATAGTGGTGTG GATC (SEQ ID NO: 74) RBX1 NM_014248.2 ATTATGGATCTTTGCA NM_014248 0.166483538 -1.055858889 0.71029212 TAGAATGTCAAGCTAA CCAGGCGTCCGCTACT TCAGAAGAGTGTACTG TCGCATGGGGAGTCTG TAACCATGCTTTTCAC TTCC (SEQ ID NO: 75) RELA NM_021975.2 GATGGCTTCTATGAGG NM_021975; NM_001243985; 0.611208315 -0.869112536 0.201460338 CTGAGCTCTGCCCGGA NM_001243984; NM_001145138 CCGCTGCATCCACAGT TTCCAGAACCTGGGAA TCCAGTGTGTGAAGAA GCGGGACCTGGAGCAG GCTA (SEQ ID NO: 76) NUPR1 NM_001042483.1 GAAACTGGGGCTCCTC NM_001042483; NM_012385 0.939785066 -0.614213269 -0.451309641 CAGGGTGGCAGCAACA ATAAATAGACACGCAC GGCAGCCACAGCTTGG GTGTGTGTTCATCCTT GTTAAAAAAAAAAAAA AAAA (SEQ ID NO: 77) DDIT3 NM_004083.4 TTAAAGATGAGCGGGT NM_004083; NM_001195057; 1.18240637 -1.318487563 0.223796918 GGCAGCGACAGAGCCA NM_001195056; NM_001195053; AAATCAGAGCTGGAAC NM_001195054; NM_001195055 CTGAGGAGAGAGTGTT CAAGAAGGAAGTGTAT CTTCATACATCACCAC ACCT (SEQ ID NO: 78) LAMB3 NM_000228.2 AAATGGGGGGAAGGTC NM_000228; NM_001017402; 1.552616212 -0.901993606 0.038750971 CAACTTAACCTTATGG NM_001127641 ATTTAGTGTCTGGGAT TCCAGCAACTCAAAGT CAAAAAATTCAAGAGG TGGGGGAGATCACAAA CTTG (SEQ ID NO: 79) TSHR NM_001018036.2 GGATATGCTTTCAATG NM_001018036; NM_001142626; 0.452978334 -1.281483556 0.321335827 GGACAAAGCTGGATGC NM_000369 TGTTTACCTAAACAAG AATAAATACCTGACAG TTATTGACAAAGATGC ATTTGGAGGAGTATAC AGTG (SEQ ID NO: 80) BCL2L1 NM_138578.1 CTAAGAGCCATTTAGG NM_138578; NM_001191 0.490231758 -0.792877145 0.85930403 GGCCACTTTTGACTAG GGATTCAGGCTGCTTG GGATAAAGATGCAAGG ACCAGGACTCCCTCCT CACCTCTGGACTGGCT AGAG (SEQ ID NO: 81) PIM1 NM_002648.2 CTTCATCATGAGTTCT NM_002648; NM_001243186 1.163851083 -0.58387838 0.43760126 GCTGAATGCCGCGATG GGTCAGGTAGGGGGGA AACAGGTTGGGATGGG ATAGGACTAGCACCAT TTTAAGTCCCTGTCAC CTCT (SEQ ID NO: 82) PRKCB NM_212535.1 GCATTTGGAGTCCTGC NM_212535; NM_002738 -0.220213795 -0.44819218 0.693162357 TGTATGAAATGTTGGC TGGGCAGGCACCCTTT GAAGGGGAGGATGAAG ATGAACTCTTCCAATC CATCATGGAACACAAC GTAG (SEQ ID NO: 83) PLD1 NM_002662.3 AGTCCAGAAATCTTCC NM_002662; NM_001130081 0.078761527 -0.747955173 0.330941788 TGAAACGCCCAGTGGT TGAGGGAAATCGTTGG AGGTTGGACTGCATTC TTAAACGAAAAGCACA ACAAGGAGTGAGGATC TTCA (SEQ ID NO: 84) WNT3 NM_030753.3 CCAACTCGCCTGTGGA NM_030753 0.443885608 -0.810662403 0.009175691 CGGGGAGGCTCTCCCT CTCTCTCATCTTACAT TTCTCACCCTACTCTG GATGGTGTGTGGTTTT TAAAGAAGGGGGCTTT CTTT (SEQ ID NO: 85) EIF4EBP1 NM_004095.3 CTGCGCAATAGCCCAG NM_004095 -0.070945866 -0.897973905 0.010952684 AAGATAAGCGGGCGGG CGGTGAAGAGTCACAG TTTGAGATGGACATTT AAAGCACCAGCCATCG TGTGGAGCACTACCAA GGGG (SEQ ID NO: 86) IRAK2 NM_001570.3 GTGTTGGCCGAGGTCC NM_001570 1.48428277 -1.194483728 -0.40789912 TCACGGGCATCCCTGC AATGGATAACAACCGA AGCCCGGTTTACCTGA AGGACTTACTCCTCAG TGATATTCCAAGCAGC ACCG (SEQ ID NO: 87) PRKAA2 NM_006252.2 ATAGTGGTGACCCTCA NM_006252 1.381125373 -0.775485013 -0.577567956 AGACCAGCTTGCAGTG GCTTATCATCTTATCA TTGACAATCGGAGAAT AATGAACCAAGCCAGT
GAGTTCTACCTCGCCT CTAG (SEQ ID NO: 88) DUSP5 NM_004419.3 GTGGATGTAAAACCCA NM_004419 0.327417325 -1.005227809 0.322905127 TTTCACAAGAGAAGAT TGAGAGTGAGAGAGCC CTCATCAGCCAGTGTG GAAAACCAGTGGTAAA TGTCAGCTACAGGCCA GCTT (SEQ ID NO: 89) IL8 #N/A #N/A #N/A 0.47273382 -1.183932351 0.413001976 MAP2K1 NM_002755.2 ACGGAATGGACAGCCG NM_002755 0.630232347 -1.253785345 -0.076450981 ACCTCCCATGGCAATT TTTGAGTTGTTGGATT ACATAGTCAACGAGCC TCCTCCAAAACTGCCC AGTGGAGTGTTCAGTC TGGA (SEQ ID NO: 90) BIRC3 NM_182962.1 GTGAGACTCGCGCCCT NM_182962; NM_001165 0.718062464 -1.255101549 0.237248246 CCGGCACGGAAAAGGC CAGGCGACAGGTGTCG CTTGAAAAGACTGGGC TTGTCCTTGCTGGTGC ATGCGTCGTCGGCCTC TGGG (SEQ ID NO: 91) PLA2G4C NM_003706.2 CCAATGTCCAGATGGC NM_003706; NM_001159323; 1.496594473 -1.346242957 -0.15784499 CAGAATGAATGTGATA NM_001159322 GTTCAGACCAATGCCT TCCACTGCTCCTTTAT GACTGCACTTCTAGCC AGTAGCTCTGCACAAG TTAG (SEQ ID NO: 92) PPP3CC NM_005605.3 AGCAGAAGGAAGCACT NM_005605; NM_001243975; 0.664650863 -1.36423635 0.256830574 ACAGTTCGTAAGGAGA NM_001243974 TCATCAGGAATAAGAT CAGAGCCATTGGGAAG ATGGCACGGGTCTTTT CAATTCTTCGGCAAGA AAGT (SEQ ID NO: 93) CAPN2 NM_001748.4 CCATGAATTCCTATGA NM_001748; NM_001146068 0.643376276 -1.155868131 0.247414615 AATGCGGAAGGCATTA GAAGAAGCAGGTTTCA AGATGCCCTGTCAACT CCACCAAGTCATCGTT GCTCGGTTTGCAGATG ACCA (SEQ ID NO: 94) GZMB NM_004131.3 ACACTACAAGAGGTGA NM_004131 0.675014406 -1.142799947 0.722529353 AGATGACAGTGCAGGA AGATCGAAAGTGCGAA TCTGACTTACGCCATT ATTACGACAGTACCAT TGAGTTGTGCGTGGGG GACC (SEQ ID NO: 95) CLCF1 NM_013246.2 GATGGGTGTTGCTCCC NM_013246; NM_001166212 0.716776379 -0.847605107 0.342471593 TTATCCCCAAATCACT CTATACATCCAATTCA GGAAACAAACATGGTG GCAATTCTACACAAAA AGAGATGAGATTAACA GTGC (SEQ ID NO: 96) HGF NM_000601.4 TCATTGGTAAAGGACG NM_000601; NM_001010934; 0.290481662 -0.610592648 0.50255412 CAGCTACAAGGGAACA NM_001010931; NM_001010932; GTATCTATCACTAAGA NM_001010933 GTGGCATCAAATGTCA GCCCTGGAGTTCCATG ATACCACACGAACACA GCTT (SEQ ID NO: 97) ITGA3 NM_005501.2 CATGATTCAGCGCAAG NM_005501; NM_002204 0.656718626 -2.639015229 0.467661891 GAGTGGGACTTATCTG AGTATAGTTACAAGGA CCCAGAGGACCAAGGA AACCTCTATATTGGGT ACACGATGCAGGTAGG CAGC (SEQ ID NO: 98) IL6R NM_000565.2 CTTTCTACATAGTGTC NM_000565; NM_001206866; 1.25332586 -1.599829447 -0.032175941 CATGTGCGTCGCCAGT NM_181359 AGTGTCGGGAGCAAGT TCAGCAAAACTCAAAC CTTTCAGGGTTGTGGA ATCTTGCAGCCTGATC CGCC (SEQ ID NO: 99) POLD4 NM_021173.2 AGGCACCACGTAAGAC NM_021173; NR_046412; 0.672053389 -1.147721365 0.210396896 CTCCTGCCCTTAGCTC NR_046411; NM_001256870; TCTTGCTCACCACCCA NR_046413 AGAACCTCAGGACAGA AGCGAGAGCCCATTGC TCCTGCTCAGCTCAGC CCGG (SEQ ID NO: 100) AMH NM_000479.3 GACCTCCGCGCCGAGC NM_000479 0.288540555 0.250910932 -0.994093078 GCTCCGTACTCATCCC CGAGACCTACCAGGCC AACAATTGCCAGGGCG TGTGCGGCTGGCCTCA GTCCGACCGCAACCCG CGCT (SEQ ID NO: 101) CACNA1C NM_199460.2 TGAAACACCCTGTGGT NM_199460; NM_001129840; 1.676167163 -0.351229666 -0.670030512 AGCAGCTTTGCTGTCT NM_001129835; NM_001129834; TCTACTTCATCAGCTT NM_001129830; NM_001129837; CTACATGCTCTGTGCC NM_001129832; NM_001129838; TTCCTGATCATCAACC NM_000719; NM_001167625; TCTTTGTAGCTGTCAT NM_001129843; NM_001129846; CATG (SEQ ID NM_001129839; NM_001129827; NO: 102) NM_001129829; NM_001129831; NM_001167624; NM_001129833; NM_001129841; NM_001129836; NM_001167623; NM_001129842; NM_001129844 CACNA1H NM_021098.2 GACACGGACGAGGACA NM_021098; NM_001005407 0.850490171 0.252197083 -0.853900562 AGACGTCGGTCCACTT CGAGGAGGACTTCCAC AAGCTCAGAGAACTCC AGACCACAGAGCTGAA GATGTGTTCCCTGGCC GTGA (SEQ ID NO: 103) GNA11 NM_002067.1 TTCGAGCATCAGTACG NM_002067 1.124323404 -0.745622387 -0.153580798 TCAGTGCCATCAAGAC CCTGTGGGAGGACCCG GGCATCCAGGAATGCT ACGACCGCAGGCGCGA GTACCAGCTCTCCGAC TCTG (SEQ ID NO: 104) ITGA7 NM_002206.1 TGATAGTGGGTGCCCC NM_002206; NM_001144997; 1.042754581 -0.659327019 -0.17332686 CTACTTCTTTGAGCGC NM_001144996 CAAGAAGAGCTGGGGG GTGCTGTGTATGTGTA CTTGAACCAGGGGGGT CACTGGGCTGGGATCT CCCC (SEQ ID NO: 105) JAG1 NM_000214.2 TTGCTTGTGGAGGCGT NM_000214 0.728317828 -0.512594469 -0.375946652 GGGATTCCAGTAATGA CACCGTTCAACCTGAC AGTATTATTGAAAAGG CTTCTCACTCGGGCAT GATCAACCCCAGCCGG CAGT (SEQ ID NO: 106) LAMAS NM_005560.3 GCCATGAATTTCTCCT NM_005560 1.622724844 -1.060012408 0.072913031 ACTCGCCGCTGCTACG TGAGTTCACCAAGGCC ACCAACGTCCGCCTGC GCTTCCTGCGTACCAA CACGCTGCTGGGCCAT CTCA (SEQ ID NO: 107) IDH2 NM_002168.2 CACCGGCTCATTGATG NM_002168 1.478046247 -0.923619017 0.358613769 ACATGGTGGCTCAGGT CCTCAAGTCTTCGGGT GGCTTTGTGTGGGCCT GCAAGAACTATGACGG AGATGTGCAGTCAGAC ATCC (SEQ ID NO: 108) PLA2G10 NM_003561.1 CAGAGCGTCCTGTGCG NM_003561 0.931837184 -0.102139226 0.135420614 GACCGGCAGAGAACAA ATGCCAAGAACTGTTG TGCAAGTGTGACCAGG AGATTGCTAACTGCTT AGCCCAAACTGAGTAC AACT (SEQ ID NO: 109) HSPB1 NM_001540.3 AGCCGCGCGCTCAGCC NM_001540 1.258279601 -1.731442887 0.471013239 GGCAACTCAGCAGCGG GGTCTCGGAGATCCGG CACACTGCGGACCGCT GGCGCGTGTCCCTGGA TGTCAACCACTTCGCC CCGG (SEQ ID NO: 110) LAMC2 NM_005562.2 CAAGCGGAAATTGAAG NM_005562; NM_018891 1.16859924 -1.360857477 0.005444094 CAGATAGGTCTTATCA GCACAGTCTCCGCCTC CTGGATTCAGTGTCTC GGCTTCAGGGAGTCAG TGATCAGTCCTTTCAG GTGG (SEQ ID NO: 111) FLNC NM_001127487.1 GGGCCTGTCCATTGCT NM_001127487; NM_001458 1.839552557 -1.255013658 0.013631778 GTGGAGGGTCCTAGCA AAGCGGAGATTGCATT TGAGGATCGCAAAGAT GGCTCCTGCGGCGTCT CCTATGTCGTCCAGGA ACCA (SEQ ID NO: 112) NFKBIZ NM_001005474.1 ATTTGGTTCCCGATGG NM_001005474; NM_031419 2.315727502
-1.292126131 0.197458225 CCCTGTGGGAGAACAG ATCCGACGTATCCTGA AGGGAAAGTCCATTCA GCAGAGAGCTCCACCG TATTAGCTCCATTAGC TTGG (SEQ ID NO: 113) FN1 NM_212482.1 GGGAATGGACATGCAT NM_212482; NM_212476; 0.660402717 -1.171486781 0.234728184 TGCCTACTCGCAGCTT NM_054034; NM_002026; CGAGATCAGTGCATTG NM_212478; NM_212474 TTGATGACATCACTTA CAATGTGAACGACACA TTCCACAAGCGTCATG AAGA (SEQ ID NO: 114) GNG12 NM_018841.3 ATAAAGGTTTCGAAGG NM_018841 0.867571726 -0.981276666 0.471261377 CATCAGCGGACCTCAT GTCCTACTGTGAGGAA CATGCCAGGAGTGACC CTTTGCTGATAGGAAT ACCAACTTCAGAAAAC CCTT (SEQ ID NO: 115) PDGFC NM_016205.1 CCGCATCTATTGGCAG NM_016205; NR_036641 1.196009475 -1.133981891 0.004647767 CTTTGTTATTGATCAG AAACTGCTCGCCGCCG ACTTGGCTTCCAGTCT GGCTGCGGGCAACCCT TGAGTTTTCGCCTCTG TCCT (SEQ ID NO: 116) GAS1 NM_002048.2 CTGTGGCTTGGGACAG NM_002048 0.779622888 -0.752350475 0.219109788 ATAGAAGGGATGGTTG GGGATACTTCCCAAAA CTTTTTCCAAGTCAAC TTGGTGTAGCCGGTTC CCCGGCCACGACTCTG GGCA (SEQ ID NO: 117) CDKN2D NM_001800.3 CTTTCTCTTCTTGTTT NM_001800; NM_079421 1.442455149 -2.288021107 0.432605996 CTCCTGCCCACTGCTG CAGTAGGGGAGGAGCA CAGTTTGTGGCTTATA GGTGTTGGTTTTGGGG GTGTGAGTGTTTGGGG GACG (SEQ ID NO: 118) TNC NM_002160.3 CGCCAACTGAAAAAGT NM_002160 2.489192272 -1.589168535 -0.18592867 GGGAAAGGATGTCTGG AGGCGAGGCGTCCCAT TACAGAGGAAGGAGCT CGCTATATAAGCCAGC CAAAGTTGGCTGCACC GGCC (SEQ ID NO: 119) CDKN2A NM_000077.3 AAGCGCACATTCATGT NM_000077; NM_058197; 1.509085425 -0.73385756 -0.063471162 GGGCATTTCTTGCGAG NM_058195; NM_001195132 CCTCGCAGCCTCCGGA AGCTGTCGACTTCATG ACAAGCATTTTGTGAA CTAGGGAAGCTCAGGG GGGT (SEQ ID NO: 120) CDKN2B NM_004936.3 CACTTGGGTGACGGCA NM_004936; NM_078487 1.969916123 -1.427909465 0.040850212 GTCGATGCGTTCACTC CAATGTCTGCTGAGGA GTTATGGTGAACCCAC AACTTAGGCCCTAGCG GCAGAAAGGAAAACCT GAAG (SEQ ID NO: 121) INHBA NM_002192.2 GCGCTTCTGAACGCGA NM_002192 1.701129382 -1.951616488 0.011540028 TCAGAAAGCTTCATGT GGGCAAAGTCGGGGAG AACGGGTATGTGGAGA TAGAGGATGACATTGG AAGGAGGGCAGAAATG AATG (SEQ ID NO: 122) PTPRR NM_001207015.1 AAACCAGTGAGCAGTA NM_001207015; NM_001207016; 1.451595841 -1.532015885 0.509429781 TGAATTTGTGCACCAT NM_002849; NM_130846; GCTCTGTGCCTGTATG NR_073474 AGAGCAGACTTTCAGC AGAGACTGTCCAGTGA GTCATTGAAGACTTGT CAGA (SEQ ID NO: 123) NOTCH3 NM_000435.2 CTTTGGAGTCTGCCGT NM_000435 0.896323229 -0.97089252 0.204819781 GATGGCATCAACCGCT ACGACTGTGTCTGCCA ACCTGGCTTCACAGGG CCCCTTTGTAACGTGG AGATCAATGAGTGTGC TTCC (SEQ ID NO: 124) FLNA NM_001456.3 CCCTCAGGAGCCCTGG NM_001456; NM_001110556 3.352606408 -1.630559407 0.110599618 AGGAGTGCTATGTCAC AGAAATTGACCAAGAT AAGTATGCTGTGCGCT TCATCCCTCGGGAGAA TGGCGTTTACCTGATT GACG (SEQ ID NO: 125) ITGB3 NM_000212.2 GAATAAGCCTTGGAAT NM_000212 2.029627821 -1.363726479 0.172308131 TAGATATGGGGCAATG ACTGAGCCCTGTCTCA CCCATGGATTACTCCT TACTGTAGGGAATGGC AGTATGGTAGAGGGAT AAAT (SEQ ID NO: 126) CDH1 NM_004360.2 CGATAATCCTCCGATC NM_004360 1.417579351 -0.563519168 -0.012000775 TTCAATCCCACCACGT ACAAGGGTCAGGTGCC TGAGAACGAGGCTAAC GTCGTAATCACCACAC TGAAAGTGACTGATGC TGAT (SEQ ID NO: 127) IL22RA1 NM_021258.2 GACGGGTACAATAACA NM_021258 0.677423648 -0.861368018 -0.084338277 CACTGTACTGATGTCA CAACTTTGCAAGCTCT GCCTTGGGTTCAGCCC ATCTGGGCTCAAATTC CAGCCTCACCACTCAC AAGC (SEQ ID NO: 128) PRKAR2A NM_004157.2 ATTTAGAAAACTTGAA NM_004157 0.954173113 -1.411559699 -0.110220662 AGTCAGCACTAAAGGA TGGGCAGAGGTTCAAC CCACACCTCCACTTTG CTTCTGAAGGCCCATT CATTAGACCACTTGTA AAGA (SEQ ID NO: 129) DTX3 NM_178502.2 CTCCCCGTGTACATAT NM_178502; NM_001286246; 0.836185822 -0.362975758 -0.481378145 ACTCCCGGTTTCCCTG NM_001286245 CCCCTCCATTGCCCTT GGCTTTTTCTGGTATG TGCTGTGCTCCACGAC CAAGCCGAGAAAGGAC CTAG (SEQ ID NO: 130) GRIN2A NM_000833.3 GAATGACAGCTATCTT NM_000833; NM_001134407; 1.367454914 -0.535776184 -0.271174006 CGGTCGTCCTTGAGGT NM_001134408 CAACGGCATCGTACTG TTCCAGGGACAGTCGG GGCCACAATGATGTGT ATATTTCGGAGCATGT TATG (SEQ ID NO: 131) POLE2 NM_002692.2 GAGAGTGTATCCTGTG NM_002692; NM_001197330 0.797767805 -0.686659307 -0.015103545 CCCGATCTACTTGTCA TTGCAGACAAATATGA TCCTTTCACTACGACA AATACCGAATGCCTCT GCATAAACCCTGGCTC TTTT (SEQ ID NO: 132) CDKN2C NM_001262.2 ATAATGTAAACGTCAA NM_001262; NM_078626 1.659187221 -0.368692467 -0.280435804 TGCACAAAATGGATTT GGAAGGACTGCGCTGC AGGTTATGAAACTTGG AAATCCCGAGATTGCC AGGAGACTGCTACTTA GAGG (SEQ ID NO: 133) CCNE2 NM_057735.1 CGCCAGCTGAGCCGAG NM_057735; NM_057749 2.322615612 -0.285274237 -0.620886998 CGGTAGCTGGTCTGGC GAGGTTTTATACACCT GAAAGAAGAGAATGTC AAGACGAAGTAGCCGT TTACAAGCTAAGCAGC AGCC (SEQ ID NO: 134) FANCE NM_021922.2 CCAGAAGCCTCTTTCT NM_021922 1.739950882 -0.174523797 -1.115444165 TGGACGGATCCTCTCC TTGACTTCCTCAGCCT CCCGCCTGCTTACAAC TGCCCTGACCTCCTTC TGTGCCAAATATACAT ACCC (SEQ ID NO: 135) CDC25C NM_001790.2 CTCTCTGTGTGACATT NM_001790; NM_001287582; 0.885753996 -0.614233996 -0.633132809 ACTATCACTCAGATGC NM_022809; NM_001287583 TGGAGGAAGATTCTAA CCAGGGGCACCTGATT GGTGATTTTTCCAAGG TATGTGCGCTGCCAAC CGTG (SEQ ID NO: 136) FANCA NM_000135.2 GCAAAGTGATTGACTG NM_000135; NM_001286167; 0.843349767 -0.327032636 -0.853923908 TGACAGTTCTGAGGCC NM_001018112 TATGCTAATCATTCTA GTTCATTTATAGGCTC TGCTTTGCAGGATCAA GCCTCAAGGCTGGGGG TTCC (SEQ ID NO: 137) CCNA2 NM_001237.2 CGGGACAAAGCTGGCC NM_001237 1.709739605 -0.762854153 -0.151256005
TGAATCATTAATACGA AAGACTGGATATACCC TGGAAAGTCTTAAGCC TTGTCTCATGGACCTT CACCAGACCTACCTCA AAGC (SEQ ID NO: 138) DNMT1 NM_001379.2 CAAAACCAATCTATGA NM_001379; NM_001130823 1.087975952 -0.772201927 -0.139753541 TGATGACCCATCTCTT GAAGGTGGTGTTAATG GCAAAAATCTTGGCCC CATAAATGAATGGTGG ATCACTGGCTTTGATG GAGG (SEQ ID NO: 139) WHSC1 NM_007331.1 AAAAGAGTGCACGCCA NM_007331; NM_133334; 1.011227482 -0.710351274 0.184213773 GTATCACGTACAGTTC NM_133331; NM_133335; TTTGGTGACGCCCCAG NM_133330; NM_001042424 AAAGAGCTTGGATATT TGAGAAGAGCCTCGTA GCTTTTGAAGGAGAAG GACA (SEQ ID NO: 140) E2F1 NM_005225.1 CCAGCTCCAAGCCGTG NM_005225 1.066547328 -0.894977636 -0.186057173 GACTCTTCGGAGAACT TTCAGATCTCCCTTAA GAGCAAACAAGGCCCG ATCGATGTTTTCCTGT GCCCTGAGGAGACCGT AGGT (SEQ ID NO: 141) PTTG2 NM_006607.2 TACTCTGATCTACGTT NM_006607 0.995372679 -1.454954386 0.043486443 GATAAGGAAATTGGAG AACCAGGCACCCGTGT GGCTGCCAAGGATGTG CTGAAGCTGGAGTCTA GACCTTCAATCAAAGC ATTA (SEQ ID NO: 142) RFC4 NM_181573.2 ACAGGTGGAAAGGAGA NM_181573; NM_002916 1.730057786 -0.638599876 -0.508480338 TCACAGAGAAAGTGAT TACAGACATTGCCGGG GTAATACCAGCTGAGA AAATTGATGGAGTATT TGCTGCCTGTCAGAGT GGCT (SEQ ID NO: 143) MCM2 NM_004526.2 TTTGTGCTTCTCACCT NM_004526; NR_073375 1.529183146 -0.36493793 -0.479749297 TTGGGTGGGATGCCTT GCCAGTGTGTCTTACT TGGTTGCTGAACATCT TGCCACCTCCGAGTGC TTTGTCTCCACTCAGT ACCT (SEQ ID NO: 144) MCM4 NM_182746.1 CAGTTATCCTGTTTGC NM_182746; NM_005914 1.070557299 -0.628650321 0.140545393 TCACAATGATCTCGTT GACAAGGTCCAGCCTG GGGACAGAGTGAATGT TACAGGCATCTATCGA GCTGTGCCTATTCGAG TCAA (SEQ ID NO: 145) BRCA2 NM_000059.3 GGGGACAGATTTGTGA NM_000059 1.292667438 -0.897838271 0.100241908 CCGGCGCGGTTTTTGT CAGCTTACTCCGGCCA AAAAAGAACTGCACCT CTGGAGCGGACTTATT TACCAAGCATTGGAGG AATA (SEQ ID NO: 146) TTK NM_003318.3 AACCAGAGGTTCCAGA NM_003318; NM_001166691 2.388139352 -0.618834387 -0.128012393 GAGTAACCAGAAACAG TGGCAATCTAAGAGAA AGTCAGAGTGTATTAA CCAGAATCCTGCTGCA TCTTCAAATCACTGGC AGAT (SEQ ID NO: 147) CCNB1 NM_031966.2 AACTTGAGGAAGAGCA NM_031966 1.451881304 -0.619865956 -0.079524277 AGCAGTCAGACCAAAA TACCTACTGGGTCGGG AAGTCACTGGAAACAT GAGAGCCATCCTAATT GACTGGCTAGTACAGG TTCA (SEQ ID NO: 148) MSH6 NM_000179.1 GCTGGCTTATTAGCTG NM_000179; NM_001281494; 1.499274067 -0.5013127 -0.336590614 TAATGGCCCAGATGGG NM_001281493; NM_001281492 TTGTTACGTCCCTGCT GAAGTGTGCAGGCTCA CACCAATTGATAGAGT GTTTACTAGACTTGGT GCCT (SEQ ID NO: 149) MOMS NM_006739.3 ATGAGACGAAGGGGGA NM_006739 1.98081102 -0.697209461 -0.578660576 GGACAACATTGACTTC ATGCCCACCATCTTGT CGCGCTTCGACATGAT CTTCATCGTCAAGGAT GAGCACAATGAGGAGA GGGA (SEQ ID NO: 150) UBE2T NM_014176.3 AAACAAAAGGCTGATG NM_014176 1.85858348 -0.105697652 -0.665881982 AGGAAGAGATGCTTGA TAATCTACCAGAGGCT GGTGACTCCAGAGTAC ACAACTCAACACAGAA AAGGAAGGCCAGTCAG CTAG (SEQ ID NO: 151) FEN1 NM_004111.4 CCGGGAGAATGACATC NM_004111 1.86125434 -0.646411517 -0.576062555 AAGAGCTACTTTGGCC GTAAGGTGGCCATTGA TGCCTCTATGAGCATT TATCAGTTCCTGATTG CTGTTCGCCAGGGTGG GGAT (SEQ ID NO: 152) CHEK1 NM_001114121.1 AGGGTGATGGATTGGA NM_001114121; NR_045205; 1.448005524 -0.836815017 -0.357022212 GTTCAAGAGACACTTC NR_045204; NM_001244846; CTGAAGATTAAAGGGA NM_001274; NM_001114122 AGCTGATTGATATTGT GAGCAGCCAGAAGATT TGGCTTCCTGCCACAT GATC (SEQ ID NO: 153) BRIP1 NM_032043.1 GATGTGCAAAGCCTGG NM_032043 1.969177489 -0.504861708 -0.218232737 GATATAGAAGAACTTG TCAGCCTGGGGAAGAA ACTAAAGGCCTGTCCA TATTACACAGCCCGAG AACTAATACAAGATGC TGAC (SEQ ID NO: 154) CDC7 NM_003503.2 ATCCCACATAATCACA NM_003503; NM_001134420; 1.699141198 -0.915926744 -0.522885786 GGAAACAAGATTCCAC NM_001134419 TGAGTGGCCCAGTACC TAAGGAGCTGGATCAG CAGTCCACCACAAAAG CTTCTGTTAAAAGACC CTAC (SEQ ID NO: 155) ITGA8 NM_003638.1 ATCGGAGTGCCTTTTG NM_003638 1.543535453 -0.238387103 -1.639134229 CAGGCAAGGATCAAAG AGGCAAAGTGCTCATT TATAATGGGAACAAAG ATGGCTTAAACACCAA GCCTTCCCAAGTTCTG CAAG (SEQ ID NO: 156) ETS2 NM_005239.4 CAACCATGTCTTTCAA NM_005239; NM_001256295 0.779810809 0.198093282 -0.575997412 GGATTACATCCAAGAG AGGAGTGACCCAGTGG AGCAAGGCAAACCAGT TATACCTGCAGCTGTG CTGGCCGGCTTCACAG GAAG (SEQ ID NO: 157) COL4A6 NM_001847.2 TGGGATTTCCTGGGCT NM_001847; NM_001287760; 1.658235267 -0.282608549 -1.56570051 TAATGGATTCCAAGGA NM_001287759; NM_001287758; ATTGAGGGTCAAAAGG NM_033641 GTGACATTGGCCTGCC AGGCCCAGATGTTTTC ATCGATATAGATGGTG CTGT (SEQ ID NO: 158) LAMA3 NM_000227.3 CAGAGGACTGGTGTTT NM_000227; NM_001127717; 2.083772989 -0.709274494 -0.584584899 CACACGGGCACTAAGA NM_198129; NM_001127718 ACTCCTTTATGGCTCT TTATCTTTCAAAAGGA CGTCTGGTCTTTGCAC TGGGGACAGATGGGAA AAAA (SEQ ID NO: 159) GADD45G NM_006705.3 CAAAGTCTTGAACGTG NM_006705 1.022032515 -0.43766438 -0.202119219 GACCCCGACAATGTGA CCTTCTGTGTGCTGGC TGCGGGTGAGGAGGAC GAGGGCGACATCGCGC TGCAGATCCATTTTAC GCTG (SEQ ID NO: 160) ID2 NM_002166.4 CGGATATCAGCATCCT NM_002166 0.62903887 -0.510034449 0.119602389 GTCCTTGCAGGCTTCT GAATTCCCTTCTGAGT TAATGTCAAATGACAG CAAAGCACTGTGTGGC TGAATAAGCGGTGTTC ATGA (SEQ ID NO: 161) CACNB2 NM_000724.3 TCTTTTGTAAGTGCTA NM_000724; NM_201572; 0.981132087 -0.865116096 0.038963893 CATAAATTGGCCTGGT NM_201571; NM_001167945; ATGGCTGCAGTCCTCC NM_201570; NM_201593; GGTTGCATACTGGACT NM_201597; NM_201590; CTTCAAAAACTGTTTT NM_201596 GGGTAGCTGCCACTTG AACA (SEQ ID NO: 162) NKD1 NM_033119.3 ACAGTGATACACACAC NM_033119 2.691019394 -0.322986548 -0.744692386 GTATTTAAGGACTATC
CCTGAGACCATCCCTC TCATTTTGGAAACTGC TAGGGAGGGAACCAAC CACTTAAACAAGCGTG GTTT (SEQ ID NO: 163) SOCS2 NM_003877.3 GGAACGGCACTGTTCA NM_003877; NM_001270469; 0.834990812 -0.655453649 -0.071526563 CCTTTATCTGACCAAA NM_001270468; NM_001270467; CCGCTCTACACGTCAG NM_001270470; NM_001270471 CACCATCTCTGCAGCA TCTCTGTAGGCTCACC ATTAACAAATGTACCG GTGC (SEQ ID NO: 164) PLCB4 NM_000933.3 TATTCGGTCGGGAGCC NM_000933; NM_182797; 0.508382694 -1.029629816 -0.727123493 ATACCAAAGGATCCCA NM_001172646 AAATCTTGGCTGCTCT TGAAGCTGTTGGAAAA TCAGAAAATGATCTGG AAGGGCGGATAGTTTG TGTC (SEQ ID NO: 165) RASGRP2 NM_001098670.1 CAGACGGTGGAGGATG NM_001098670; NM_001098671; 1.415707148 -0.84422873 -0.216800183 GGGTGTTTGACATCCA NM_153819 CTTGTAATAGATGCTG TGGTTGGATCAAGGAC TCATTCCTGCCTTGGA GAAAATACTTCAACCA GAGC (SEQ ID NO: 166) IRS1 NM_005544.2 TTGATGGTGGCATCAA NM_005544 1.47181196 -0.40396467 0.227234957 ACTACCGATTTAAAAC TGGAAGTTGCTGGTAC TCAAACCAAAAGTTCA TACTCTGGCGACACGA AGGGTTTCCTTTGAGC AACG (SEQ ID NO: 167) TNR NM_003285.2 CAAAAGACATCACAAT NM_003285 1.180868996 -0.840068366 -0.092317008 TAGCAATGTGACCAAG GACTCAGTGATGGTCT CCTGGAGCCCTCCTGT TGCATCTTTCGATTAC TACCGAGTATCATATC GACC (SEQ ID NO: 168) GADD45A NM_001924.2 GTTACTCCCTACACTG NM_001924; NM_001199741; 1.287113277 -1.517075592 0.011215464 ATGCAAGGATTACAGA NM_001199742 AACTGATGCCAAGGGG CTGAGTGAGTTCAACT ACATGTTCTGGGGGCC CGGAGATAGATGACTT TGCA (SEQ ID NO: 169) ZAK NM_016653.2 GACACGAGCCTTCCTG NM_016653; NM_133646 1.643122992 -0.497654428 -0.637329531 ACAAGTGTAACTCATT CCTACACAACAAGGCG GAGTGGAGGTGCGAAA TTGAGGCAACTCTTGA GAGGCTAAAGAAACTA GAGC (SEQ ID NO: 170) FGF7 NM_002009.3 GAAAGGCTCAAGTTGC NM_002009 1.698227137 -1.240536774 -0.522181449 ACCAGGCAGACAACAG ACATGGAATTCTTATA TATCCAGCTGTTAGCA ACAAAACAAAAGTCAA ATAGCAAACAGCGTCA CAGC (SEQ ID NO: 171) PBX1 NM_002585.2 CGGGAGGAAGCAGGAC NM_002585; NM_001204963; 1.467757304 -0.234263903 -0.375071496 ATTGGAGACATTTTAC NM_001204961 AGCAAATTATGACCAT CACAGACCAGAGTTTG GATGAGGCGCAGGCCA GAAAACATGCTTTAAA CTGC (SEQ ID NO: 172) PPARG NM_015869.3 GAGCAAAGAGGTGGCC NM_015869; NM_138712; 0.138766121 -0.932222796 0.483262572 ATCCGCATCTTTCAGG NM_138711; NM_005037 GCTGCCAGTTTCGCTC CGTGGAGGCTGTGCAG GAGATCACAGAGTATG CCAAAAGCATTCCTGG TTTT (SEQ ID NO: 173) THBS1 NM_003246.2 ACCCTCGTCACATAGG NM_003246 0.254930123 -0.997056609 0.173708474 CTGGAAAGATTTCACC GCCTACAGATGGCGTC TCAGCCACAGGCCAAA GACGGGTTTCATTAGA GTGGTGATGTATGAAG GGAA (SEQ ID NO: 174) TNFAIP3 NM_006290.2 CAAAGCCCTCATCGAC NM_006290; NM_001270508; 0.145328112 -1.051965129 0.524290309 AGAAACATCCAGGCCA NM_001270507 CCCTGGAAAGCCAGAA GAAACTCAACTGGTGT CGAGAAGTCCGGAAGC TTGTGGCGCTGAAAAC GAAC (SEQ ID NO: 175) EYA1 NM_172059.2 CACAGCAGAGTACAGC NM_172059; XM_006716435; 0.2928126 -1.028756263 0.071321766 ACAATCCACAGCCCAT XM_005251182; NM_000503; CAACACCCATTAAAGA NM_172058; NM_001288574; TTCAGATTCTGATCGA XM_005251184; NM_001288575; TTGCGTCGAGGTTCAG XM_006716437; XM_006716436; ATGGGAAATCACGTGG NM_172060 ACGG (SEQ ID NO: 176) EFNA5 NM_001962.2 AGTCAAAATCCGCTCT NM_001962 0.001526286 -1.149909284 0.044343314 CCATGCTTACTCTTGA CACCCCATTGAAGCCA CTCATTGTGTGTGCGT CTGGGTGTGAAGTCCA GCTCCGTGTGGTCCTG TGCT (SEQ ID NO: 177) MYC NM_002467.3 TCGGACACCGAGGAGA NM_002467 0.001204978 -1.246321996 0.792535029 ATGTCAAGAGGCGAAC ACACAACGTCTTGGAG CGCCAGAGGAGGAACG AGCTAAAACGGAGCTT TTTTGCCCTGCGTGAC CAGA (SEQ ID NO: 178) NFKB1 NM_003998.2 AGGGTATAGCTTCCCA NM_003998; NM_001165412 -0.04492968 -1.203821974 0.563903708 CACTATGGATTTCCTA CTTATGGTGGGATTAC TTTCCATCCTGGAACT ACTAAATCTAATGCTG GGATGAAGCATGGAAC CATG (SEQ ID NO: 179) RUNX1 NM_001754.4 CAGCCATGAAGAACCA NM_001754; NM_001122607; -0.29660105 -0.587183221 0.975896848 GGTTGCAAGATTTAAT NM_001001890 GACCTCAGGTTTGTCG GTCGAAGTGGAAGAGG GAAAAGCTTCACTCTG ACCATCACTGTCTTCA CAAA (SEQ ID NO: 180) COL3A1 NM_000090.3 TTGGCACAACAGGAAG NM_000090 -0.05310455 -0.938619869 0.330406692 CTGTTGAAGGAGGATG TTCCCATCTTGGTCAG TCCTATGCGGATAGAG ATGTCTGGAAGCCAGA ACCATGCCAAATATGT GTCT (SEQ ID NO: 181) COL5A2 NM_000393.3 GGTTCATGCTACCCTG NM_000393 0.066324157 -1.298836749 0.702791004 AAGTCACTCAGTAGTC AGATTGAAACCATGCG CAGCCCCGATGGCTCG AAAAAGCACCCAGCCC GCACGTGTGATGACCT AAAG (SEQ ID NO: 182) SPRY1 NM_005841.1 GGATGACTTGAAGGGT NM_005841; NM_199327; -0.261396451 -0.572573824 0.808702985 TCCTTGAAAGAGGACC NM_001258038; NM_001258039 TGACACAGCACAAGTT CATTTGTGAACAGTGT GGGAAGTGCAAGTGTG GAGAATGCACTGCTCC CAGG (SEQ ID NO: 183) VEGFC NM_005429.2 GGCGAGGCCACGGCTT NM_005429 0.277920507 -0.584003317 0.583459169 ATGCAAGCAAAGATCT GGAGGAGCAGTTACGG TCTGTGTCCAGTGTAG ATGAACTCATGACTGT ACTCTACCCAGAATAT TGGA (SEQ ID NO: 184) COL4A4 NM_000092.4 CGTGCTGGAAATCTGG NM_000092 -0.215428822 -0.865628696 0.850231366 GATGCTTCCTTCTGGG TTCTGATTCTCAGTGA GTGGAGCCCATTCATC CAGGCAGGTTTCCATG CTATGAGTGGCCCTTT CGTT (SEQ ID NO: 185) SOCS3 NM_003955.3 GGAGGATGGAGGAGAC NM_003955 0.190162345 -0.966843307 1.157732644 GGGACATCTTTCACCT CAGGCTCCTGGTAGAG AAGACAGGGGATTCTA CTCTGTGCCTCCTGAC TATGTCTGGCTAAGAG ATTC (SEQ ID NO: 186) ETV1 NM_004956.4 CACATACCAACGGCGA NM_004956; NM_001163150; -0.483944692 -0.472162475 0.667492018 GGATCACTTCAGCTCT NM_001163152; NM_001163151; GGCAGTTTTTGGTAGC NM_001163148; NM_001163149; TCTTCTGGATGACCCT NM_001163147 TCAAATTCTCATTTTA TTGCCTGGACTGGTCG AGGC (SEQ ID NO: 187) NRAS NM_002524.3 ACCCTGGTCCTGACTT NM_002524 -0.40205324 -0.741671466 0.618482163 CCCTGGAGGAGAAGTA TTCCTGTTGCTGTCTT
CAGTCTCACAGAGAAG CTCCTGCTACTTCCCC AGCTCTCAGTAGTTTA GTAC (SEQ ID NO: 188) LIF NM_002309.3 GGGATGGAAGGCTGTC NM_002309; NM_001257135 -0.427738236 -0.89005586 0.65285878 TTCTTTTGAGGATGAT CAGAGAACTTGGGCAT AGGAACAATCTGGCAG AAGTTTCCAGAAGGAG GTCACTTGGCATTCAG GCTC (SEQ ID NO: 189) APC NM_000038.3 AAACAGCCACCACTTC NM_000038; NM_001127511; -0.41323835 -1.145962291 0.569063763 TCCTAGAGGAGCCAAG NM_001127510 CCATCTGTGAAATCAG AATTAAGCCCTGTTGC CAGGCAGACATCCCAA ATAGGTGGGTCAAGTA AAGC (SEQ ID NO: 190) PLAT NM_000931.2 CAAGGTTACCAACTAC NM_000931; NM_000930; 0.255086414 -0.897781696 0.652706703 CTAGACTGGATTCGTG NM_033011 ACAACATGCGACCGTG ACCAGGAACACCCGAC TCCTCAAAAGCAAATG AGATCCCGCCTCTTCT TCTT (SEQ ID NO: 191) KAT2B NM_003884.3 CATCTGGAGGCACCAT NM_003884 0.169588215 -0.715561144 0.808610693 CTCAACGAAGACTGCG ATCTCCCAATGATGAT ATTTCTGGATACAAAG AGAACTACACAAGGTG GCTGTGTTACTGCAAC GTGC (SEQ ID NO: 192) MET NM_000245.2 AAATGAGGAAGACCTT NM_000245; NM_001127500 -0.487219685 -0.569517119 0.528969462 CAGAAGGTTGCTGAGT ACAAGACTGGGCCTGT GCTGGAACACCCAGAT TGTTTCCCATGTCAGG ACTGCAGCAGCAAAGC CAAT (SEQ ID NO: 193) DUSP10 NM_144728.2 AGTTCGAGGAAGACCT NM_144728; NM_144729; 1.162440885 -1.43248128 0.453731599 AAACAACGGTGTGACA NM_007207 CCGAGAATCCTTACAC CAAAGCTGATGGGCGT GGAGACGGTTGTGTGA CAATGGTCTGGATGGA AAGG (SEQ ID NO: 194) PPARGC1A NM_013261.3 GAACAAGCACTTCGGT NM_013261 1.101127687 -0.885265217 0.209763192 CATCCCAGTCAAGCTG TTTTTGACGACGAAGC AGACAAGACCGGTGAA CTGAGGGACAGTGATT TCAGTAATGAACAATT CTCC (SEQ ID NO: 195) WNT16 NM_057168.1 GAAGATAATCTGTTTC NM_057168; NM_016087 0.569244222 -1.353938971 0.786026088 CTAAGCAAGAAATAAC AGGAAAGATCCCTTAT GCCAGGAGGCCTGCCA TACTCAGGATAAGATC CTTGAATATGGAACTT AGTT (SEQ ID NO: 196) CALML5 NM_017422.4 CCGGTGAGCTGACTCC NM_017422 -0.254803322 -1.202570257 0.868342334 TGAGGAGGAGGCCCAG TACAAAAAGGCTTTCT CCGCGGTTGACACGGA TGGAAACGGCACCATC AATGCCCAGGAGCTGG GCGC (SEQ ID NO: 197) GATA3 NM_001002295.1 AAGAGTCCGGCGGCAT NM_001002295; NM_002051 -0.095593162 -1.173998403 0.559141534 CTGTCTTGTCCCTATT CCTGCAGCCTGTGCTG AGGGTAGCAGTGTATG AGCTACCAGCGTGCAT GTCAGCGACCCTGGCC CGAC (SEQ ID NO: 198) IL15 NM_172174.1 AGGGTGATAGTCAAAT NM_172174; NM_172175; 0.185965654 -0.529551785 0.811668987 TATGTATTGGTGGGGC NM_000585; NR_037840 TGGGTACCAATGCTGC AGGTCAACAGCTATGC TGGTAGGCTCCTGCCA GTGTGGAACCACTGAC TACT (SEQ ID NO: 199) IL2RB NM_000878.2 GTCCTGCTGCCCGAGC NM_000878 0.867636615 -0.725722192 0.404721588 CAGGAACTGTGTGTGT TGCAGGGGGGCAGTAA CTCCCCAACTCCCTCG TTAATCACAGGATCCC ACGAATTTAGGCTCAG AAGC (SEQ ID NO: 200) IL7R NM_002185.2 TTGCTTTGACCACTCT NM_002185 0.500044032 -1.04018038 0.461856038 TCCTGAGTTCAGTGGC ACTCAACATGAGTCAA GAGCATCCTGCTTCTA CCATGTGGATTTGGTC ACAAGGTTTAAGGTGA CCCA (SEQ ID NO: 201) IL3RA NM_002183.2 GACGTCCAGTACGACC NM_002183; NM_001267713 0.322997508 -0.744100389 0.710771403 TGTACTTGAACGTTGC CAACAGGCGTCAACAG TACGAGTGTCTTCACT ACAAAACGGATGCTCA GGGAACACGTATCGGG TGTC (SEQ ID NO: 202) NOS3 NM_000603.4 CCGGACCACCTCGTCC NM_000603; NM_001160111; 0.031965527 -0.55997275 1.008066472 CTGTGGAAAGACAAGG NM_001160110; NM_001160109 CAGCAGTGGAAATCAA CGTGGCCGTGCTGCAC AGTTACCAGCTAGCCA AAGTCACCATCGTGGA CCAC (SEQ ID NO: 203) IL6 NM_000600.1 TGACAAACAAATTCGG NM_000600 0.25202091 -1.057818045 0.521808798 TACATCCTCGACGGCA TCTCAGCCCTGAGAAA GGAGACATGTAACAAG AGTAACATGTGTGAAA GCAGCAAAGAGGCACT GGCA (SEQ ID NO: 204) MAP3K8 NM_005204.2 CTGGCTACTTCAATCT NM_005204; NM_001244134 0.525534565 -0.629689865 0.558661012 TGTTCGGGGACCACCA ACGCTTGAATATGGCT GAAGGATGCCATGTTT GCTCTAAATTAAGACA GCATTGATCTCCTGGA GGCT (SEQ ID NO: 205) BCL2A1 NM_004049.2 TCATGTGTCATAACTC NM_004049; NM_001114735 -0.118492282 -1.248060312 0.535233973 AGTCAAGCTCAGTGAG CATTCTCAGCACATTG CCTCAACAGCTTCAAG GTGAGCCAGCTCAAGA CTTTGCTCTCCACCAG GCAG (SEQ ID NO: 206) SHC1 NM_183001.4 TGGCCTTGTGGATAAG NM_183001; NM_001130041; 0.432448249 -1.095032147 0.793300777 GGAGAGTTGACCGTTT NM_001202859; NM_001130040; TCATCCTGGCCTCCTT NM_003029 TTGCTGTTTGGATGTT TCCACGGGTCTCACTT ATACCAAAGGGAAAAC TCTT (SEQ ID NO: 207) TNFRSF10A NM_003844.2 CACAACGAGATTCTGA NM_003844 -0.469698881 -0.657359638 0.525516546 GCAACGCAGACTCGCT GTCCACTTTCGTCTCT GAGCAGCAAATGGAAA GCCAGGAGCCGGCAGA TTTGACAGGTGTCACT GTAC (SEQ ID NO: 208) CASP10 NM_032977.3 GAAAGCCTGAAGCACT NM_032977; NM_001206524; -0.489827618 -0.346416482 1.154981817 TTGTGGCTTCCACGGG NM_001230; NM_032974; TTCGTTTCTAGGAAGC NM_001206542; NM_032976 TTTTGCTTTACCTGGG GAAACCCCAAGCTCTA CAGTGAGAAAGTTGTA AATT (SEQ ID NO: 209) TLR4 NM_138554.2 ACTCAGAAAAGCCCTG NM_138554; NM_138557; -0.502549677 -0.321086708 0.889080653 CTGGATGGTAAATCAT NM_003266 GGAATCCAGAAGGAAC AGTGGGTACAGGATGC AATTGGCAGGAAGCAA CATCTATCTGAAGAGG AAAA (SEQ ID NO: 210) GRB2 NM_002086.4 TCAAAAGGGGGGACAT NM_002086; NM_203506 -0.437187727 -0.814409187 2.119019854 CCTCAAGGTTTTGAAC GAAGAATGTGATCAGA ACTGGTACAAGGCAGA GCTTAATGGAAAAGAC GGCTTCATTCCCAAGA ACTA (SEQ ID NO: 211) RAC2 NM_002872.3 GCTGCCACAACTTGTG NM_002872 -0.813796838 -0.558222741 0.746175214 TACCTTCAGGGATGGG GCTCTTACTCCCTCCT GAGGCCAGCTGCTCTA ATATCGATGGTCCTGC TTGCCAGAGAGTTCCT CTAC (SEQ ID NO: 212) CSF1R NM_005211.2 CATACTGGTACTGCTG NM_005211; NR_109969; -0.763822741 -0.332235482 1.156562363 TAATGAGCCAAGTGGC NM_001288705 AGCTAAAAGTTGGGGG TGTTCTGCCCAGTCCC GTCATTCTGGGCTAGA
AGGCAGGGGACCTTGG CATG (SEQ ID NO: 213) PIK3R5 NM_001142633.1 TTTCTCTCAAGTTTCC NM_001142633; NM_001251855; -0.422120799 -0.424025806 1.087625971 TGAGTCTCCAGAAAAA NM_001251852; NM_001251851; CAGCACTAACGCTGGA NM_014308; NM_001251853 CCTGTCTACTCTCAGA ACCCGGCACAGATTCT CTCTTGATCTCCTTTT GGAA (SEQ ID NO: 214) TLR2 NM_003264.3 CTGCTTTCAACTGGTA NM_003264 -0.457895575 -0.566882875 1.200496741 GTTGTGGGTTGAAGCA CTGGACAATGCCACAT ACTTTGTGGATGGTGT GGGTCTTGGGGGTCAT CATCAGCCTCTCCAAG GAAG (SEQ ID NO: 215) PIK3CG NM_002649.2 AAAACATACCAATTGT NM_002649; NM_001282427; -0.498928755 -0.404086965 1.099985115 TGGCCAGAAGGGAAGT NM_001282426 CTGGGATCAAAGTGCT TTGGATGTTGGGTTAA CAATGCAGCTCCTGGA CTGCAACTTCTCAGAT GAAA (SEQ ID NO: 216) SYK NM_003177.3 CGGACTCTCCAAAGCA NM_003177; NM_001174168; -0.471120916 -0.497930912 1.929710234 CTGCGTGCTGATGAAA NM_001174167; NM_001135052 ACTACTACAAGGCCCA GACCCATGGAAAGTGG CCTGTCAAGTGGTACG CTCCGGAATGCATCAA CTAC (SEQ ID NO: 217) IL2RA NM_000417.1 CTTGGTAAGAAGCCGG NM_000417 -0.030524763 -0.840989014 0.663049508 GAACAGACAACAGAAG TCATGAAGCCCAAGTG AAATCAAAGGTGCTAA ATGGTCGCCCAGGAGA CATCCGTTGTGCTTGC CTGC (SEQ ID NO: 218) MFNG NM_002405.2 CGAACAGGACCAGATT NM_002405; NR_029413; -0.384916371 -0.481471138 1.033405111 TTGTTTGGAGCCTCAG NM_001166343 CATGCCGGGGCCCAGA TGATGGAGCATAACGG GTCCCAGCCAATTGTG ATGATCCTTTTTGCTC ATTT (SEQ ID NO: 219) BID NM_197966.1 GCTTAGCTTTAGAAAC NM_197966; NM_001244569; 0.088886574 -0.575331123 0.818429222 AGTGCAACACTGGTCT NM_197967; NM_001244567; GCTGTTCCAGTGGTAA NM_001244572; NM_001244570; GCTATGTCCCAGGAAT NM_001196 CAGTTTAAAAGCACGA CAGTGGATGCTGGGTC CATA (SEQ ID NO: 220) PIK3CD NM_005026.3 TGACACTCATTGATTC NM_005026 -0.17143245 0.010877708 1.174375031 TAAAGCATCTTTAATC TGCCAGGCGGAGGGGG CTTTGCTGGTCTTTCT TGGACTATTCCAGAGA GGACAACTGTCATCTG GGAA (SEQ ID NO: 221) RASGRF2 NM_006909.1 GAGTCCACCAGGCTTT NM_006909 -0.455902975 -0.189934532 0.843247694 AACAACACCGAGAGAA CATGTGATAAAGAGTT TATTATACGGAGAACG GCTACCAATCGAGTTC TGAACGTCCTCCGTCA CTGG (SEQ ID NO: 222) TNFSF10 NM_003810.2 GGGGGGACCCAGCCTG NM_003810; NR_033994; -0.475279967 -0.931256638 1.231408832 GGACAGACCTGCGTGC NM_001190943; NM_001190942 TGATCGTGATCTTCAC AGTGCTCCTGCAGTCT CTCTGTGTGGCTGTAA CTTACGTGTACTTTAC CAAC (SEQ ID NO: 223) ITGA6 NM_000210.1 CTCATGCGAGCCTTCA NM_000210; NM_001079818 -0.832468699 -0.251085473 0.693305201 TTGATGTGACTGCTGC TGCCGAAAATATCAGG CTGCCAAATGCAGGCA CTCAGGTTCGAGTGAC TGTGTTTCCCTCAAAG ACTG (SEQ ID NO: 224) MMP9 NM_004994.2 CACTACTGTGCCTTTG NM_004994 -0.182247094 -0.647025881 1.303500224 AGTCCGGTGGACGATG CCTGCAACGTGAACAT CTTCGACGCCATCGCG GAGATTGGGAACCAGC TGTATTTGTTCAAGGA TGGG (SEQ ID NO: 225) IGF1 NM_000618.3 CGTGGATGAGTGCTGC NM_000618; NM_001111285; -1.319084701 0.348703024 0.801157409 TTCCGGAGCTGTGATC NM_001111284; NM_001111283 TAAGGAGGCTGGAGAT GTATTGCGCACCCCTC AAGCCTGCCAAGTCAG CTCGCTCTGTCCGTGC CCAG (SEQ ID NO: 226) JAK3 NM_000215.2 GTGCTGCTGAAGGTCA NM_000215 -1.313284985 0.162243618 0.887569963 TGGATGCCAAGCACAA GAACTGCATGGAGTCA TTCCTGGAAGCAGCGA GCTTGATGAGCCAAGT GTCGTACCGGCATCTC GTGC (SEQ ID NO: 227) TGFBR2 NM_001024847.1 ATTTGGAGAATGTTGA NM_001024847; NM_003242 -0.576704709 -0.33857086 0.682451581 GTCCTTCAAGCAGACC GATGTCTACTCCATGG CTCTGGTGCTCTGGGA AATGACATCTCGCTGT AATGCAGTGGGAGAAG TAAA (SEQ ID NO: 228) SPRY2 NM_005842.2 AAAGAGGAAATACTCC NM_005842 -0.648697274 -0.11309924 0.649505825 GCGTGCGCTTGTAGAA GGGGAGTCGTCTCCAG CTCCGAACCCCGGAGT GTTCATCAGCGGGGAA TCTGGCTCCGAATTCT CTTT (SEQ ID NO: 229) LFNG NM_001040168.1 TCCAGGCCATGGAGCG NM_001040168; NM_001040167; -0.644681481 -0.098858024 0.709630093 GGTCAGCGAGAACAAG NM_001166355; NM_002304 GTGCGTCCTGTCCACT TCTGGTTTGCCACGGG CGGCGCTGGCTTCTGC ATCAGCCGTGGGCTGG CTCT (SEQ ID NO: 230) MPL NM_005373.2 CAGTGGCACTTGGACT NM_005373 -0.067370728 -0.6571279 0.612307561 GCAATGCTTTACCTTG GACCTGAAGAATGTTA CCTGTCAATGGCAGCA ACAGGACCATGCTAGC TCCCAAGGCTTCTTCT ACCA (SEQ ID NO: 231) LAMC3 NM_006059.3 CCGCCAGCCTCCTGGG NM_006059 -0.133458348 -0.185543739 1.057434835 TGGAGATTTGTTCATG TCCCACTGGCTACACG GGCCAGTTCTGTGAAT CCTGTGCTCCGGGATA CAAGAGGGAGATGCCA CAGG (SEQ ID NO: 232) RET NM_020630.4 AGGAGCCAGGGTCGGA NM_020630; NM_020975 -0.205916792 -0.027391926 0.770810755 TTCCAGTTAAATGGAT GGCAATTGAATCCCTT TTTGATCATATCTACA CCACGCAAAGTGATGT ATGGTCTTTTGGTGTC CTGC (SEQ ID NO: 233) FOS NM_005252.2 ACTCAAGTCCTTACCT NM_005252 -0.494262419 -0.199625214 0.643536599 CTTCCGGAGATGTAGC AAAACGCATGGAGTGT GTATTGTTCCCAGTGA CACTTCAGAGAGCTGG TAGTTAGTAGCATGTT GAGC (SEQ ID NO: 234) MAPK8IP1 NM_005456.2 TCCCAATTTCAGGCTC NM_005456 -0.239136578 -0.505341384 0.517286908 ACCCATGACATCAGCC TGGAGGAGTTTGAGGA TGAAGACCTCTCGGAG ATCACTGATGAGTGTG GCATCAGCTTACAGTG CAAA (SEQ ID NO: 235) B2M NM_004048.2 CGGGCATTCCTGAAGC NM_004048 0.234106651 -0.551781156 1.211511026 TGACAGCATTCGGGCC GAGATGTCTCGCTCCG TGGCCTTAGCTGTGCT CGCGCTACTCTCTCTT TCTGGCCTGGAGGCTA TCCA (SEQ ID NO: 236) MYD88 NM_002468.3 ACGTTTTTCTAGGTAC NM_002468; NM_001172569; -1.01250718 -0.955275251 1.683288678 AGCTCCCAGGAACAGC NM_001172568; NM_001172567; TAGGTGGGAAAGTCCC NM_001172566 ATCACTGAGGGAGCCT AACCATGTCCCTGAAC AAAAATTGGGCACTCA TCTA (SEQ ID NO: 237) CHUK NM_001278.3 TAGAACCCATGGAAAA NM_001278 0.031111998 -0.563848617 1.112479518 CTGGCTACAGTTGATG TTGAATTGGGACCCTC AGCAGAGAGGAGGACC TGTTGACCTTACTTTG AAGCAGCCAAGATGTT TTGT (SEQ ID
NO: 238) MAP2K2 NM_030662.2 GCGGACCTGAAGATGC NM_030662 0.297626549 -1.301076449 0.810353045 TCACAAACCACACCTT CATCAAGCGGTCCGAG GTGGAAGAAGTGGATT TTGCCGGCTGGTTGTG TAAAACCCTGCGGCTG AACC (SEQ ID NO: 239) IL19 NM_013371.3 CCACAGACATGCACCA NM_013371; NM_153758 0.114049756 -1.237506873 0.753586963 TATAGAAGAGAGTTTC CAAGAAATCAAAAGAG CCATCCAAGCTAAGGA CACCTTCCCAAATGTC ACTATCCTGTCCACAT TGGA (SEQ ID NO: 240) COL1A1 NM_000088.3 CAGAAACATCGGATTT NM_000088 -0.295920059 -0.715165274 0.638320928 GGGGAACGCGTGTCAA TCCCTTGTGCCGCAGG GCTGGGCGGGAGAGAC TGTTCTGTTCCTTGTG TAACTGTGTTGCTGAA AGAC (SEQ ID NO: 241) PLAU NM_002658.2 TTCATTGATTACCCAA NM_002658; NM_001145031 0.011625842 -0.971909393 0.821172402 AGAAGGAGGACTACAT CGTCTACCTGGGTCGC TCAAGGCTTAACTCCA ACACGCAAGGGGAGAT GAAGTTTGAGGTGGAA AACC (SEQ ID NO: 242)
Example 2
Materials and Methods
Patient Selection and Treatment
[0614] Patients were identified by retrospective search of prospectively compiled institutional database and electronic patient records. Eligibility criteria for inclusion were: i) histopathological diagnosis of soft tissue tumour as confirmed by contemporaneous report by specialist sarcoma histopathologist; ii) received at least one dose of Pazopanib for treatment of unresectable or advanced STS; iii) available FFPE tumour specimen, obtained from patient prior to first dose of Pazopanib. Treatment and response monitoring was as per local practice, with Pazopanib at 800 mg once daily until disease progression, intolerable toxicity or significant clinical deterioration. Dose interruption and/or reduction were used as per treating physician's judgement. Baseline clinico-pathological characteristics and survival data was collected on retrospective review of contemporaneous electronic medical records. All related radiological imaging was retrospectively reviewed and disease response assessed according to RECIST 1.1.
Tissue Selection and Processing
[0615] Available pre-Pazopanib FFPE tumour specimens were identified and retrieved from our institutional diagnostic archive. Where more than one pre-treatment specimen was identified, the one taken closest to Pazopanib start date was processed. Newly sectioned H&E slides were reviewed to confirm viable tumour content. With reference to H&E, blocks containing tumour material of sufficient size were marked in three spatially discrete areas of representative viable tumour tissue. Sections were then used for total RNA extraction using All Prep DNA/RNA FFPE kit (Qiagen, Hilden, Germany) following vendor's standard protocol. RNA concentrations were measured using Qubit fluorometric quantitation (Thermo Fisher Scientific, Waltham, Mass., USA). RNA Integrity Number and percentage of tRNA <300 bp in size was measured using 2100 Bioanalyzer system (Agilent, CA, USA). RNA were stored at -80c until use in downstream analyses.
Gene Expression Analysis
[0616] Expression of 730 genes, representing 13 major cancer pathways including key driver genes was assessed using nCounter PanCancer Pathways panel (NanoString Technologies, Seattle, Wash., USA). 150 ng total RNA was used as input for hybridisation and digital analysis as per manufacturer's instructions using nCounter Dx analysis system (NanoString Technologies). In cases with high RNA degradation, loading adjustments of up to 300 ng were made. Expression data was processed as follows: a) background correction was done by subtracting the geometric mean of the negative control probes, b) normalised by positive control normalization factor calculated as geometric mean of the positive controls followed by normalisation with the housekeeping genes. Expression values were then Log 2 transformed and subjected to gene-based centring.
Gene-Expression Based Algorithm for the PARSARC Tree-Based Classifier
[0617] A 225-gene subtype predictor was developed using cancer pathway-related gene expression profiles from Nanostring using 38 prototype samples obtained at Royal Marsden Hospital (RMH-SARC). The Classification of Nearest Centroid (CLANC) and cross-validation (random 10% left out in each of 10 cycles) were used to assess the robustness of the minimized gene set for reproducibility of classification.sup.19. The 225 genes selected genes contributing to distinguishing the different subtypes are provided in Table 6. The final algorithm consists of centroids constructed as described for the PAM algorithm.sup.20 and distances calculated using Spearman's rank correlation (or similar statistical tests to compare similarity). The centroids of the training set using the 225-gene classifier and their contributions are provided in Table 6.
Gene-Expression Based Algorithm to Identify PDGFRA-High/FGFR1-Low IHC Patients which are Intrinsically Resistant to Pazopanib.
[0618] A 42-gene predictor for pazopanib resistance was developed based on the 225-gene algorithm. The list of 42 genes provided in Table 7 was selected based on their relative importance contributing to identify the tumours resistant to pazopanib therapy (as defined by PDGFRA-high/FGFR1-low IHC) from others. The final algorithm consists of the two centroids constructed for pazopanib resistant cases and others (Table 7), and the distance respectively calculated using Spearman's rank correlation (or similar statistical tests to compare similarity). A test sample will be assigned to resistant type based on the following formula
A=[Correlation coefficient to Resistant -Correlation coefficient to others]
With A >=0.5
Results
[0619] Building on earlier reports, we assembled a clinically annotated tumour cohort from patients with STS treated with pazopanib at the Royal Marsden Hospital (RMH-SARC). Eligible patients were identified through retrospective search of hospital medical and histopathology records. Eligibility for inclusion was defined as: i) histopathological diagnosis of soft tissue tumour as confirmed by contemporaneous report by specialist sarcoma histopathologist; ii) received at least one dose of pazopanib for treatment of unresectable or advanced STS; and iii) available adequate FFPE tumour specimen, obtained from patient prior to first dose of pazopanib. In total, 38 cases that met eligibility criteria were identified, with collected tumour specimen and associated clinical data included in the analyses described below (clinic-pathological characteristics summarised in Table 1 in example 1, above). Average age was 54.4 years (range 19.8-81.2). Median number of prior lines of therapy was 1.5 (interquartile range (IQR) 0-2). All patients with documented performance status were ECOG 0-2. All but one patient had metastatic disease, with a median of 2 organ sites involved by disease (IQR 1.75-3.25). 16 distinct STS subtypes were represented within our cohort, with leiomyosarcoma and solitary fibrous tumour the most represented subtypes (11 and 7 cases respectively). All but two tumours were intermediate or high grade on archival pre-treatment specimen--of the two cases with low histological grade, one was extraskeletal myxoid chondrosarcoma with metastatic disease, and the other was unresectable solitary fibrous tumour of the retroperitoneum.
[0620] Progression free survival (PFS), defined as time in months from first dose of pazopanib to radiological disease progression or death from any cause, was the primary clinical outcome endpoint. Overall survival (OS), defined as a time in months from first dose of pazopanib to death from any cause, was the secondary clinical outcome endpoint. The Kaplan-Meier method was used to estimate PFS and OS, and the log-rank test to compare survival in different strata. Multivariable cox regression model was used to estimate the significance adjusted for the standard clinic-pathological variables (including age, tumour grade and performance status). Interaction tests for biomarkers, FGFR and PDGFR, for survival effect were performed for association with PFS and OS. Proportional hazard assumption was tested using Schoenfeld residuals. Restricted mean progression free and overall all survival estimates were also calculated by the biomarkers strata.
[0621] At the time of data collection (median follow-up 26.2 months), 35 of 38 patients (92%) had experienced a progression-free survival event and 31 (82%) had experienced an overall survival event. Median PFS for the cohort was 3.7 months (IQR 1.8-6.9), median OS was 9.5 months (IQR 3.9-19.6 m). Following radiology review of imaging series, 1/38 (2.6%) patient experienced objective radiological response, 20/38 (52.6%) had stable disease and 17/38 (44.7%) progression as best response. For patients with partial response or stable disease, median PFS was 6.4 m (IQR 3.7-12.9).
[0622] Our overarching goal in this study was to identify a gene signature that allows for the stratification of patients into the five distinct subgroups without the need to apply the previously reported decision tree workflow. In addition, we sought to identify a set of genes that is capable of identifying PDGFR-high/FGFR1-low IHC intrinsic resistant poor responder cases from other subgroups. Using the Classification of Nearest Centroid (CLANC) methodology described in the methods section, we identified a set of 225 genes that is capable of classifying patients into one of the 5 previously described subgroups (Table 4).
TABLE-US-00008 TABLE 4 225 gene risk classifier identified by CLANC analysis as optimally describing 5 PARSARC-defined subgroups Gene name ENTREZ ID ACVR1B 91 AKT2 208 ALKBH3 221120 AMH 268 ARID2 196528 AMER1 139285 ATM 472 ATR 545 B2M 567 BAD 572 BCL2 596 BCOR 54880 BID 637 BIRC3 330 BMP4 652 BNIP3 664 BRAF 673 CACNA1C 775 CACNA1E 777 CACNA1G 8913 CALML6 163688 CARD11 84433 CASP10 843 CCNB1 891 CCND1 595 CCNE1 898 CCNE2 9134 CCNO 10309 CDC25C 995 CDC6 990 CDC7 8317 CDH1 999 CDK4 1019 CDK6 1021 CDKN2A 1029 CDKN2B 1030 CDKN2C 1031 CDKN2D 1032 CHEK1 1111 CHUK 1147 COL27A1 85301 COL3A1 1281 COL4A4 1286 COL4A6 1288 COL5A1 1289 COL5A2 1290 CREB3L4 148327 CREBBP 1387 CSF2 1437 CXXC4 80319 DAXX 1616 DDB2 1643 DLL1 28514 DLL3 10683 DNMT1 1786 DTX3 196403 DTX4 23220 DUSP4 1846 DUSP6 1848 E2F1 1869 E2F5 1875 EFNA1 1942 EFNA5 1946 ERBB2 2064 ERCC6 2074 ETV4 2118 EZH2 2146 FANCA 2175 FANCB 2187 FANCE 2178 FANCL 55120 FAS 355 FBXW7 55294 FEN1 2237 FGF12 2257 FGF5 2250 FGF7 394217 FGF7 2252 FGF7 100132771 FLNA 2316 FLNC 2318 FN1 2335 FOSL1 8061 FUBP1 8880 GADD45A 1647 GLI3 2737 GNA11 2767 GNG12 55970 GRIN2A 2903 GSK3B 2932 GTF2H3 2967 HDAC10 83933 HDAC11 79885 HDAC4 9759 HDAC5 10014 HELLS 3070 HES1 3280 HIST1H3B 8358 HOXA9 3205 HSPB1 3315 IBSP 3381 IDH1 3417 IDH2 3418 IL11 3589 IL11RA 3590 IL12RB2 3595 IL6 3569 IL8 3576 INHBA 3624 IRS1 3667 ITGA6 3655 ITGA7 3679 ITGA8 8516 ITGB3 3690 JAG1 182 JAK3 3718 KAT2B 8850 KITLG 4254 KMT2C 58508 LAMA3 3909 LAMA5 3911 LAMB3 3914 LAMC3 10319 LEFTY2 7044 LFNG 3955 LIF 3976 LIG4 3981 MAD2L2 10459 MAP2K4 6416 MAP2K6 5608 MAPK10 5602 MAPK8IP1 9479 MCM2 4171 MCM4 4173 MCM5 4174 MDC1 9656 MDM2 4193 MEN1 4221 MET 4233 MFNG 4242 MLF1 4291 MLH1 4292 MLLT3 4300 MLLT4 4301 MMP7 4316 MMP9 4318 MSH2 4436 MSH6 2956 MTOR 2475 MUTYH 4595 MYC 4609 MYD88 4615 NASP 4678 NFKB1 4790 NFKBIZ 64332 NOS3 4846 NOTCH2 4853 NPM1 4869 NTHL1 4913 NUMBL 9253 PAX5 5079 PBX1 5087 PCNA 5111 PDGFC 56034 PDGFRA 5156 PLCB4 5332 PPP2CB 5516 PPP2R2C 5522 PPP3R1 5534 PRKACA 5566 PRKAR1B 5575 PRKAR2A 5576 PRKCB 5579 PRKX 5613 PRLR 5618 PTCH1 5727 PTEN 5728 PTTG2 10744 RAD21 5885 RAD52 5893 RB1 5925 RBX1 9978 RET 5979 RFC4 5984 SF3B1 23451 SHC2 25759 SHC4 399694 SIN3A 25942 SKP1 6500 SKP2 6502 SMAD3 4088 SMAD4 4089 SOCS2 8835 SOCS3 9021 SP1 6667 SPOP 8405 SPRY1 10252 SPRY2 10253 SSX1 6756 STAT4 6775 MYC 4609 MYD88 4615 NASP 4678 NFKB1 4790 NFKBIZ 64332 NOS3 4846 NOTCH2 4853 NPM1 4869 NTHL1 4913 NUMBL 9253 PAX5 5079 PBX1 5087 PCNA 5111 PDGFC 56034 PDGFRA 5156 PLCB4 5332 PPP2CB 5516 PPP2R2C 5522 PPP3R1 5534 PRKACA 5566 PRKAR1B 5575 PRKAR2A 5576 PRKCB 5579 PRKX 5613 PRLR 5618 PTCH1 5727 PTEN 5728 PTTG2 10744 RAD21 5885 RAD52 5893 RB1 5925 RBX1 9978 RET 5979 RFC4 5984 SF3B1 23451 SHC2 25759 SHC4 399694 SIN3A 25942 SKP1 6500 SKP2 6502 SMAD3 4088 SMAD4 4089 SOCS2 8835 SOCS3 9021
SP1 6667 SPOP 8405 SPRY1 10252 SPRY2 10253 SSX1 6756 STAT4 6775 STK11 6794 SYK 6850 TFDP1 7027 TGFB3 7043 TGFBR2 7048 THBS1 7057 TLR4 7099 TLX1 3195 TNC 3371 TNFRSF10B 8795 TNFRSF10D 8793 TNFSF10 8743 TNR 7143 TP53 7157 TSPAN7 7102 TTK 7272 U2AF1 7307 UBE2T 29089 VEGFA 7422 WEE1 7465 WHSC1L1 54904 WNT10B 7480 WNT6 7475 WT1 7490 ZAK 51776 ZBTB16 7704 ZIC2 7546
[0623] We also identified a 42 gene predictor to classify patients that have intrinsic resistance to pazopanib as defined by the PDGFRA-high/FGFR1-low IHC status (Table 5).
TABLE-US-00009 TABLE 5 42 genes identified by CLANC analysis as identifying F-Lo/P-Hi subgroup vs all other patients Gene name ENTREZ IDs ART2 208 ALKBH3 221120 AMER1 139285 ATR 545 BMP4 652 CCNO 10309 COL5A1 1289 CSF2 1437 DAXX 1616 DUSP6 1848 ETV4 2118 FANCL 55120 FOSL1 8061 GSK3B 2932 HDAC11 79885 HDAC5 10014 IL11 3589 IL6 3569 IL8 3576 LIF 3976 LIG4 3981 MDC1 9656 MLF1 4291 MSH2 4436 MUTYH 4595 NPM1 4869 NTHL1 4913 PCNA 5111 PPP2CB 5516 PPP2R2C 5522 PRKACA 5566 RAD21 5885 RBX1 9978 SMAD4 4089 SOCS3 9021 SPRY1 10252 SSX1 6756 STAT 4 6775 STK11 6794 THBS1 7057 WEE1 7465 WNT10B 7480
TABLE-US-00010 TABLE 6 centroids for 225 gene risk classifier Subgroup A Subgroup B Subgroup C centroid centroid centroid IHC+ (1) TP53 (2) (3) (4) (5) ACVR1B -0.15832131 -0.15832131 0.54151057 -0.15832131 -0.15832131 AKT2 -0.30994329 -0.01919342 -0.01919342 -0.01919342 -0.01919342 ALKBH3 -0.51139577 -0.06705258 -0.06705258 -0.06705258 -0.06705258 AMER1 -0.53544069 -0.00240749 -0.00240749 -0.00240749 -0.00240749 AMH -0.15178973 -0.15178973 -0.15178973 -0.15178973 -1.44283676 ARID2 -0.01621451 -0.21931165 -0.01621451 -0.01621451 -0.01621451 ATM -0.14140818 -0.14140818 -0.14140818 -0.59982807 -0.14140818 ATR -0.41755241 -0.0616667 -0.0616667 -0.0616667 -0.0616667 B2M 0.03806218 0.03806218 0.03806218 0.03806218 0.47297616 BAD 0.0248534 0.27474345 0.0248534 0.0248534 0.0248534 BCL2 0.06351095 0.06351095 0.88344382 0.06351095 0.06351095 BCOR 0.05103077 0.05103077 1.27280929 0.05103077 0.05103077 BID 0.58151032 0.0455798 0.0455798 0.0455798 0.0455798 BIRC3 -0.02761286 -0.02761286 -1.18099641 -0.02761286 -0.02761286 BMP4 1.30239681 0.21301304 0.21301304 0.21301304 0.21301304 BNIP3 -0.19708889 -0.90886955 -0.19708889 -0.19708889 -0.19708889 BRAF -0.05422312 -0.05422312 0.2484416 -0.05422312 -0.05422312 CACNA1C -0.13582518 -0.13582518 -0.13582518 0.96758744 -0.13582518 CACNA1E 0.17105202 -0.67762073 0.17105202 0.17105202 0.17105202 CACNA1G 0.01978593 0.99078335 0.01978593 0.01978593 0.01978593 CALML6 0.01910958 0.01910958 0.93075557 0.01910958 0.01910958 CARD11 0.3510245 0.3510245 0.3510245 0.3510245 1.54991905 CASP10 -0.18050625 -0.18050625 -0.18050625 -0.18050625 0.39904926 CCNB1 -0.08780076 0.35186891 -0.08780076 -0.08780076 -0.08780076 CCND1 0.06716593 0.06716593 0.06716593 0.06716593 0.89918266 CCNE1 0.03028376 0.4673283 0.03028376 0.03028376 0.03028376 CCNE2 -0.02855095 -0.02855095 -0.02855095 0.96943946 -0.02855095 CCNO -0.74650411 0.05814408 0.05814408 0.05814408 0.05814408 CDC25C -0.20812329 0.4321119 -0.20812329 -0.20812329 -0.20812329 CDC6 -0.13977911 0.25507254 -0.13977911 -0.13977911 -0.13977911 CDC7 -0.0401465 -0.0401465 -0.0401465 -0.0401465 -0.48566159 CDH1 0.5933622 0.5933622 0.5933622 2.70632966 0.5933622 CDK4 0.02878578 0.02878578 0.02878578 0.02878578 0.43127765 CDK6 -0.09882276 -0.80702231 -0.09882276 -0.09882276 -0.09882276 CDKN2A -0.43348608 0.40775211 -0.43348608 -0.43348608 -0.43348608 CDKN2B -0.30199667 -0.30199667 -1.13360288 -0.30199667 -0.30199667 CDKN2C -0.0741678 0.71842723 -0.0741678 -0.0741678 -0.0741678 CDKN2D -0.07445202 -0.07445202 -0.88415539 -0.07445202 -0.07445202 CHEK1 -0.03670758 0.36086714 -0.03670758 -0.03670758 -0.03670758 CHUK 0.01020521 0.01020521 0.01020521 0.01020521 0.3304295 COL27A1 -0.058947 -0.058947 -0.058947 -1.02899246 -0.058947 COL3A1 -0.04583553 -0.04583553 -1.12616257 -0.04583553 -0.04583553 COL4A4 -0.19065625 -0.19065625 -0.19065625 -0.19065625 0.4691999 COL4A6 -0.07291156 -0.07291156 -0.07291156 2.30094864 -0.07291156 COL5A1 0.82895474 0.02869965 0.02869965 0.02869965 0.02869965 COL5A2 -0.10633063 -0.10633063 -1.20961533 -0.10633063 -0.10633063 CREB3L4 -0.11547721 -0.11547721 -0.11547721 -0.11547721 -0.52285762 CREBBP -0.06115984 -0.06115984 0.41412808 -0.06115984 -0.06115984 CSF2 1.21387949 0.22876539 0.22876539 0.22876539 0.22876539 CXXC4 0.1857577 0.1857577 1.56739048 0.1857577 0.1857577 DAXX -0.51598315 -0.03754511 -0.03754511 -0.03754511 -0.03754511 DDB2 -0.02877707 -0.02877707 0.73742541 -0.02877707 -0.02877707 DLL1 -0.02445967 -0.02445967 1.38299745 -0.02445967 -0.02445967 DLL3 0.11550972 0.11550972 0.11550972 0.11550972 0.99134018 DNMT1 -0.06492494 0.22828132 -0.06492494 -0.06492494 -0.06492494 DTX3 -0.00091037 -0.00091037 -0.00091037 0.57881747 -0.00091037 DTX4 -0.13468574 -0.13468574 -0.13468574 -1.34786396 -0.13468574 DUSP4 -0.06613786 -0.06613786 -0.06613786 -0.06613786 0.79464751 DUSP6 0.64607125 -0.13511565 -0.13511565 -0.13511565 -0.13511565 E2F1 -0.15690288 0.58630128 -0.15690288 -0.15690288 -0.15690288 E2F5 -0.15133642 -0.15133642 -0.15133642 -0.15133642 0.49181536 EFNA1 -0.11668426 -0.11668426 -0.11668426 -0.11668426 0.53773733 EFNA5 -0.36099156 -0.36099156 -2.00486828 -0.36099156 -0.36099156 ERBB2 -0.17090683 -0.17090683 0.56247468 -0.17090683 -0.17090683 ERCC6 -0.03591121 -0.03591121 0.35637641 -0.03591121 -0.03591121 ETV4 1.42923832 0.17676653 0.17676653 0.17676653 0.17676653 EZH2 -0.13282806 -0.13282806 -0.13282806 -0.13282806 -0.54806145 FANCA -0.09874728 -0.09874728 -0.09874728 -0.09874728 -0.73163501 FANCB -0.07545182 0.28149725 -0.07545182 -0.07545182 -0.07545182 FANCE 0.03359085 0.03359085 0.03359085 0.82988961 0.03359085 FANCL -0.56516661 -0.01293858 -0.01293858 -0.01293858 -0.01293858 FAS -0.11858783 0.47425096 -0.11858783 -0.11858783 -0.11858783 FBXW7 -0.03157043 -0.03157043 0.54732624 -0.03157043 -0.03157043 FEN1 0.05373816 0.05373816 0.05373816 0.82272386 0.05373816 FGF12 -0.14368413 -0.91516385 -0.14368413 -0.14368413 -0.14368413 FGF5 0.48339559 0.48339559 0.48339559 0.48339559 1.59245056 FGF7 -0.45472135 -0.45472135 -0.45472135 1.11593826 -0.45472135 FLNA 0.13671796 0.13671796 0.13671796 1.69109283 0.13671796 FLNC -0.467287 -0.467287 -0.467287 0.96770635 -0.467287 FN1 -0.04593874 -0.04593874 -1.18366565 -0.04593874 -0.04593874 FOSL1 0.85033616 0.03958811 0.03958811 0.03958811 0.03958811 FUBP1 -0.06703661 -0.06703661 0.36412825 -0.06703661 -0.06703661 GADD45A 0.06766933 0.06766933 0.06766933 0.84508039 0.06766933 GLI3 -0.17664829 -0.17664829 -0.17664829 -0.17664829 -0.77449891 GNA11 0.02755931 0.02755931 0.02755931 0.64967723 0.02755931 GNG12 -0.16995566 -0.16995566 -0.85810693 -0.16995566 -0.16995566 GRIN2A 0.36120599 1.33705393 0.36120599 0.36120599 0.36120599 GSK3B -0.3289616 -0.04260185 -0.04260185 -0.04260185 -0.04260185 GTF2H3 -0.09051522 -0.09051522 0.33573726 -0.09051522 -0.09051522 HDAC10 -0.12352944 -0.12352944 -0.12352944 -0.12352944 0.1647408 HDAC11 -0.66902718 -0.09322847 -0.09322847 -0.09322847 -0.09322847 HDAC4 -0.02614516 -0.02614516 0.6056055 -0.02614516 -0.02614516 HDAC5 -0.44311772 -0.02343759 -0.02343759 -0.02343759 -0.02343759 HELLS -0.08627003 0.26759075 -0.08627003 -0.08627003 -0.08627003 HES1 -0.14475643 -0.14475643 1.09720336 -0.14475643 -0.14475643 HIST1H3B -0.02480871 0.56445002 -0.02480871 -0.02480871 -0.02480871 HOXA9 -0.12800919 0.60420276 -0.12800919 -0.12800919 -0.12800919 HSPB1 -0.10464244 -0.10464244 -0.10464244 0.60254908 -0.10464244 IBSP 0.25316339 1.48773858 0.25316339 0.25316339 0.25316339 IDH1 -0.0139642 -0.0139642 -0.0139642 -0.0139642 0.35797145 IDH2 0.14237266 0.14237266 0.14237266 0.97071118 0.14237266 IL11 1.73407021 0.23740715 0.23740715 0.23740715 0.23740715 IL11RA -0.01835972 -0.01835972 0.89759852 -0.01835972 -0.01835972 IL12RB2 0.12363856 0.12363856 0.12363856 0.12363856 1.18873886 IL6 1.68316336 0.1815675 0.1815675 0.1815675 0.1815675 IL8 2.10056954 0.1309187 0.1309187 0.1309187 0.1309187 INHBA -0.44395722 -0.44395722 -1.93039159 -0.44395722 -0.44395722 IRS1 0.06052758 0.06052758 0.06052758 1.18660836 0.06052758 ITGA6 0.0423311 0.0423311 0.0423311 0.0423311 0.62988286 ITGA7 0.0163744 0.0163744 0.0163744 1.40919398 0.0163744 ITGA8 -0.60196552 -0.60196552 -0.60196552 1.2401644 -0.60196552 ITGB3 -0.03320016 -0.03320016 -1.24850492 -0.03320016 -0.03320016 JAG1 0.16492599 0.71120586 0.16492599 0.16492599 0.16492599 JAK3 -0.20341296 -0.20341296 -0.20341296 -1.06969998 -0.20341296 KAT2B -0.04101357 -0.04101357 -0.04101357 -0.04101357 0.32993194 KITLG -0.11534823 0.37839946 -0.11534823 -0.11534823 -0.11534823 KMT2C -0.06007021 -0.06007021 0.27599606 -0.06007021 -0.06007021 LAMA3 -0.02993329 -0.02993329 -0.02993329 1.33919007 -0.02993329 LAMA5 0.22274146 0.22274146 0.22274146 1.55832429 0.22274146 LAMB3 -0.12041485 -0.12041485 -0.12041485 1.14007598 -0.12041485 LAMC3 0.04945966 0.04945966 0.04945966 0.04945966 1.10866665 LEFTY2 0.51860941 0.51860941 0.51860941 0.51860941 -0.56354027 LFNG 0.10700215 0.10700215 0.10700215 -0.67796456 0.10700215 LIF 1.39370879 -0.06116073 -0.06116073 -0.06116073 -0.06116073 LIG4 -0.50530259 -0.04785678 -0.04785678 -0.04785678 -0.04785678 MAD2L2 0.03722618 0.6081764 0.03722618 0.03722618 0.03722618 MAP2K4 0.08248544 0.08248544 0.08248544 0.64727212 0.08248544 MAP2K6 -0.13138211 -0.13138211 -0.13138211 -1.47415459 -0.13138211 MAPK10 -0.07793461 -0.07793461 -0.07793461 1.43393339 -0.07793461 MAPK8IP1 -0.00825569 -0.00825569 -0.00825569 -0.00825569 0.92651997 MCM2 -0.07381755 0.42160047 -0.07381755 -0.07381755 -0.07381755 MCM4 -0.04139259 0.37963662 -0.04139259 -0.04139259 -0.04139259 MCM5 -0.13706634 -0.13706634 -0.13706634 0.29064389 -0.13706634 MDC1 -0.37977203 -0.06129361 -0.06129361 -0.06129361 -0.06129361 MDM2 0.0314102 -0.47856785 0.0314102 0.0314102 0.0314102 MEN1 -0.10998162 -0.10998162 0.25826164 -0.10998162 -0.10998162 MET 0.03488567 -0.86253667 0.03488567 0.03488567 0.03488567 MFNG 0.08194644 0.08194644 0.08194644 0.08194644 0.69798176 MLF1 -0.7380756 -0.07707883 -0.07707883 -0.07707883 -0.07707883 MLH1 -0.10111681 -0.10111681 0.31198563 -0.10111681 -0.10111681 MLLT3 -0.15727151 -0.58592957 -0.15727151 -0.15727151 -0.15727151 MLLT4 -0.21907125 -0.68832348 -0.21907125 -0.21907125 -0.21907125 MMP7 0.39833697 1.54606409 0.39833697 0.39833697 0.39833697 MMP9 -0.10394205 1.60133616 -0.10394205 -0.10394205 -0.10394205 MSH2 -0.55489979 -0.03095062 -0.03095062 -0.03095062 -0.03095062 MSH6 -0.05432838 -0.05432838 -0.05432838 0.27491694 -0.05432838 MTOR -0.06272839 0.18781661 -0.06272839 -0.06272839 -0.06272839 MUTYH -0.50532612 -0.06272888 -0.06272888 -0.06272888 -0.06272888 MYC -0.18641001 -0.18641001 -0.18641001 -0.18641001 0.74902785 MYD88 -0.08502077 -0.08502077 -0.08502077 -0.58812129 -0.08502077 NASP -0.02523895 -0.02523895 -0.02523895 -0.02523895 -0.55068349 NFKB1 -0.1830597 -0.51522965 -0.1830597 -0.1830597 -0.1830597 NFKBIZ -0.02574918 -0.02574918 -1.18521256 -0.02574918 -0.02574918 NOS3 -0.0004462 -0.0004462 -0.0004462 -0.0004462 0.5365944 NOTCH2 -0.14817229 -0.14817229 -0.14817229 -0.14817229 -0.72029657 NPM1 -0.57600022 0.00332197 0.00332197 0.00332197 0.00332197 NTHL1 -0.50778533 -0.07866785 -0.07866785 -0.07866785 -0.07866785 NUMBL -0.00052321 -0.00052321 0.59451543 -0.00052321 -0.00052321 PAX5 0.25809009 0.25809009 0.25809009 0.25809009 1.00231025 PBX1 0.08501597 0.08501597 0.08501597 0.92159476 0.08501597 PCNA -0.62485093 -0.01603919 -0.01603919 -0.01603919 -0.01603919 PDGFC -0.11165439 -0.11165439 -0.83987243 -0.11165439 -0.11165439 PDGFRA -0.16915031 -0.16915031 -0.16915031 -1.68249338 -0.16915031 PLCB4 -0.35341736 -0.35341736 -0.35341736 0.81476038 -0.35341736 PPP2CB -0.48697106 0.0230338 0.0230338 0.0230338 0.0230338 PPP2R2C -0.68521206 0.56494494 0.56494494 0.56494494 0.56494494 PPP3R1 -0.29772681 -0.04706913 -0.04706913 -0.04706913 -0.04706913 PRKACA -0.42317444 -0.03705625 -0.03705625 -0.03705625 -0.03705625 PRKAR1B -0.28935676 -0.28935676 0.84966941 -0.28935676 -0.28935676 PRKAR2A -0.00446406 -0.00446406 -0.00446406 0.37327539 -0.00446406 PRKCB -0.04967629 -0.04967629 -0.04967629 -0.04967629 0.78745301 PRKX -0.05123099 -0.05123099 -0.05123099 -0.70281335 -0.05123099 PRLR 0.26338038 -0.55930099 0.26338038 0.26338038 0.26338038 PTCH1 -0.07195229 -0.07195229 2.15165073 -0.07195229 -0.07195229 PTEN -0.10472757 -0.10472757 -0.10472757 -0.86880722 -0.10472757 PTTG2 -0.01924501 -0.01924501 -0.59690658 -0.01924501 -0.01924501 RAD21 -0.3994352 -0.0135588 -0.0135588 -0.0135588 -0.0135588 RAD52 -0.04587358 -0.04587358 0.38455164 -0.04587358 -0.04587358 RB1 -0.03910675 -0.6771363 -0.03910675 -0.03910675 -0.03910675 RBX1 -0.39080421 -0.04389815 -0.04389815 -0.04389815 -0.04389815 RET 0.18149733 0.18149733 0.18149733 0.18149733 1.43631232 RFC4 -0.05754212 -0.05754212 -0.05754212 0.54843713 -0.05754212 SF3B1 -0.11220033 -0.11220033 0.23297253 -0.11220033 -0.11220033 SHC2 0.15686283 -0.51491502 0.15686283 0.15686283 0.15686283 SHC4 0.13709987 0.13709987 0.13709987 0.13709987 1.1213424 SIN3A -0.03351662 -0.03351662 -0.03351662 -0.03351662 -0.26555161 SKP1 -0.03003935 -0.03003935 0.30725406 -0.03003935 -0.03003935 SKP2 -0.04245311 0.24218446 -0.04245311 -0.04245311 -0.04245311 SMAD3 -0.02574518 -0.02574518 -0.02574518 -0.02574518 -0.51213148 SMAD4 -0.33056479 0.00374378 0.00374378 0.00374378 0.00374378 SOCS2 0.0433981 0.0433981 0.0433981 1.45120858 0.0433981 SOCS3 0.71728949 -0.23035904 -0.23035904 -0.23035904 -0.23035904 SP1 -0.0610679 0.152345 -0.0610679 -0.0610679 -0.0610679 SPOP -0.01412036 -0.01412036 -0.01412036 0.49523109 -0.01412036 SPRY1 0.84793748 -0.07997049 -0.07997049 -0.07997049 -0.07997049 SPRY2 -0.04705577 -0.04705577 -0.04705577 -0.04705577 0.47891039 SSX1 2.35670991 0.66335378 0.66335378 0.66335378 0.66335378 STAT4 0.73250358 0.06969255 0.06969255 0.06969255 0.06969255 STK11 -0.33740066 -0.0326569 -0.0326569 -0.0326569 -0.0326569 SYK -0.03690692 -0.03690692 -0.03690692 -0.03690692 0.40943317 TFDP1 0.0962478 0.54940854 0.0962478 0.0962478 0.0962478 TGFB3 0.07718645 0.07718645 0.07718645 0.07718645 -0.67517129 TGFBR2 0.48530313 0.00452876 0.00452876 0.00452876 0.00452876 THBS1 0.66888057 -0.21515608 -0.21515608 -0.21515608 -0.21515608 TLR4 0.04571647 0.04571647 0.04571647 0.04571647 0.67564346 TLX1 0.48484768 0.48484768 2.37838279 0.48484768 0.48484768 TNC -0.02780559 -0.02780559 -1.65410027 -0.02780559 -0.02780559 TNFRSF10B -0.01012048 -0.01012048 0.53370864 -0.01012048 -0.01012048 TNFRSF10D -0.02057269 -0.02057269 -0.02057269 -1.20440978 -0.02057269 TNFSF10 -0.09580323 -0.09580323 -0.09580323 -0.09580323 0.56529496 TNR 0.11575176 0.11575176 0.11575176 1.38183963 0.11575176 TP53 -0.26722651 -0.26722651 -0.26722651 -1.37187095 -0.26722651 TSPAN7 0.07016174 0.07016174 1.15874199 0.07016174 0.07016174 TTK -0.09832583 -0.09832583 -0.09832583 0.56938185 -0.09832583 U2AF1 -0.00812952 0.24625843 -0.00812952 -0.00812952 -0.00812952 UBE2T -0.02355507 -0.02355507 -0.02355507 -0.02355507 -0.58524998 VEGFA -0.03429483 -0.03429483 -0.03429483 -0.03429483 -0.69022185 WEE1 -0.6704469 -0.09453667 -0.09453667 -0.09453667 -0.09453667 WHSC1L1 0.00932376 0.00932376 0.52040958 0.00932376 0.00932376 WNT10B 1.04430335 0.1033825 0.1033825 0.1033825 0.1033825 WNT6 -0.03094321 0.46879856 -0.03094321 -0.03094321 -0.03094321 WT1 0.46923473 -0.36957191 0.46923473 0.46923473 0.46923473 ZAK 0.11046378 0.11046378 0.11046378 0.94265393 0.11046378 ZBTB16 -0.16972395 -0.16972395 -0.16972395 -0.16972395 -1.98760677 ZIC2 0.10008527 0.10008527 1.69354244 0.10008527 0.10008527
TABLE-US-00011 TABLE 7 centroids for 42 genes for identifying F-Lo/P-Hi subgroup Other (PDGFRA-Hi/FGFR1-Hi, PDGFRA-Lo/FGFR1-Lo, or gene PDGFRA-HI/FGFR1-Lo PDGFRA-Lo/FGFR1-Hi) CCNO -0.7465041 0.05814408 MLF1 -0.7380756 -0.07707883 PPP2R2C -0.6852121 0.56494494 WEE1 -0.6704469 -0.09453667 HDAC11 -0.6690272 -0.09322847 PCNA -0.6248509 -0.01603919 NPM1 -0.5760002 0.00332197 FANCL -0.5651666 -0.01293858 MSH2 -0.5548998 -0.03095062 AMER1 -0.5354407 -0.00240749 DAXX -0.5159832 -0.03754511 ALKBH3 -0.5113958 -0.06705258 NTHL1 -0.5077853 -0.07866785 MUTYH -0.5053261 -0.06272888 LIG4 -0.5053026 -0.04785678 PPP2CB -0.4869711 0.0230338 HDAC5 -0.4431177 -0.02343759 PRKACA -0.4231744 -0.03705625 ATR -0.4175524 -0.0616667 RAD21 -0.3994352 -0.0135588 RBX1 -0.3908042 -0.04389815 MDC1 -0.379772 -0.06129361 STK11 -0.3374007 -0.0326569 SMAD4 -0.3305648 0.00374378 GSK3B -0.3289616 -0.04260185 AKT2 -0.3099433 -0.01919342 DUSP6 0.64607125 -0.13511565 THBS1 0.66888057 -0.21515608 SOCS3 0.71728949 -0.23035904 STAT4 0.73250358 0.06969255 COL5A1 0.82895474 0.02869965 SPRY1 0.84793748 -0.07997049 FOSL1 0.85033616 0.03958811 WNT10B 1.04430335 0.1033825 CSF2 1.21387949 0.22876539 BMP4 1.30239681 0.21301304 LIF 1.39370879 -0.06116073 ETV4 1.42923832 0.17676653 IL6 1.68316336 0.1815675 IL11 1.73407021 0.23740715 IL8 2.10056954 0.1309187 SSX1 2.35670991 0.66335378
REFERENCES
[0624] 1. Kitagawa, D. et al. Activity-based kinase profiling of approved tyrosine kinase inhibitors. Genes to Cells 18, 110-122 (2013). [0625] 2. Ku, X., Heinzlmeir, S., Helm, D., Medard, G. & Kuster, B. New Affinity Probe Targeting VEGF Receptors for Kinase Inhibitor Selectivity Profiling by Chemical Proteomics. J. Proteome Res. 13, 2445-2452 (2014). [0626] 3. Kumar, R. et al. Pharmacokinetic-pharmacodynamic correlation from mouse to human with pazopanib, a multikinase angiogenesis inhibitor with potent antitumor and antiangiogenic activity. Mol. Cancer Ther. 6, 2012-2021 (2007). [0627] 4. Noujaim, J., Payne, L. S., Judson, I., Jones, R. L. & Huang, P. H. Phosphoproteomics in translational research: a sarcoma perspective. Ann. Oncol. (2016). doi:10.1093/annonc/mdw030 [0628] 5. Podar, K. et al. The small-molecule VEGF receptor inhibitor pazopanib (GW786034B) targets both tumor and endothelial cells in multiple myeloma. Proc. Natl. Acad. Sci. 103, 19478-19483 (2006). [0629] 6. Delea, T. E. et al. Cost-effectiveness of pazopanib in advanced soft-tissue sarcoma in Canada. Curr. Oncol. 21, 748 (2014). [0630] 7. Amdahl, J. et al. Cost-effectiveness of pazopanib in advanced soft tissue sarcoma in the United kingdom. Sarcoma 2014, 481071 (2014). [0631] 8. Kasper, B. et al. Long-term responders and survivors on pazopanib for advanced soft tissue sarcomas: subanalysis of two European Organisation for Research and Treatment of Cancer (EORTC) clinical trials 62043 and 62072. Ann. Oncol. 25, 719-24 (2014). [0632] 9. Sleijfer, S. et al. Pazopanib, a multikinase angiogenesis inhibitor, in patients with relapsed or refractory advanced soft tissue sarcoma: a phase II study from the European organisation for research and treatment of cancer-soft tissue and bone sarcoma group (EORTC study 620. J. Clin. Oncol. 27, 3126-32 (2009). [0633] 10. Stacchiotti, S. et al. Preclinical and clinical evidence of activity of pazopanib in solitary fibrous tumour. Eur. J. Cancer 50, 3021-8 (2014). [0634] 11. Maruzzo, M. et al. Pazopanib as first line treatment for solitary fibrous tumours: the Royal Marsden Hospital experience. Clin. Sarcoma Res. 5, 5 (2015). [0635] 12. Kollar, A. et al. Pazopanib in advanced vascular sarcomas: an EORTC Soft Tissue and Bone Sarcoma Group (STBSG) retrospective analysis. Acta Oncol. (Madr). 56, 88-92 (2017). [0636] 13. Lipplaa, A., Dijkstra, S. & Gelderblom, H. Efficacy of pazopanib and sunitinib in advanced axial chordoma: a single reference centre case series. Clin. Sarcoma Res. 6, 19 (2016). [0637] 14. Nakamura, T. et al. The clinical outcome of pazopanib treatment in Japanese patients with relapsed soft tissue sarcoma: A Japanese Musculoskeletal Oncology Group (JMOG) study. Cancer 122, 1408-16 (2016). [0638] 15. Chibon, F. et al. Validated prediction of clinical outcome in sarcomas and multiple types of cancer on the basis of a gene expression signature related to genome complexity. Nat. Med. 16, 781-7 (2010). [0639] 16. Guo, X. et al. Clinically Relevant Molecular Subtypes in Leiomyosarcoma. Clin. Cancer Res. 21, 3501-11 (2015). [0640] 17. Koehler, K., Liebner, D. & Chen, J. L. TP53 mutational status is predictive of pazopanib response in advanced sarcomas. Ann. Oncol. 26, 2361-2362 (2015). [0641] 18. Fu, S. et al. Phase I study of pazopanib and vorinostat: a therapeutic approach for inhibiting mutant p53-mediated angiogenesis and facilitating mutant p53 degradation. Ann. Oncol. 26, 1012-8 (2015). [0642] 19. Wong, J. P. et al. Dual Targeting of PDGFR.alpha. and FGFR1 Displays Synergistic Efficacy in Malignant Rhabdoid Tumors. Cell Rep. 17, 1265-1275 (2016). [0643] 20. Altman, D. G. et al. Reporting Recommendations for Tumor Marker Prognostic Studies (REMARK): Explanation and Elaboration. PLoS Med. 9, e1001216 (2012). [0644] 21. Tusher, V. G., Tibshirani, R. & Chu, G. Significance analysis of microarrays applied to the ionizing radiation response. Proc. Natl. Acad. Sci. U.S.A 98, 5116-21 (2001). [0645] 22. Tibshirani, R., Hastie, T., Narasimhan, B. & Chu, G. Diagnosis of multiple cancer types by shrunken centroids of gene expression. Proc. Natl. Acad. Sci. 99, 6567-6572 (2002). [0646] 23. Parker, J. S. et al. Supervised risk predictor of breast cancer based on intrinsic subtypes. J. Clin. Oncol. 27, 1160-7 (2009). [0647] 24. Velghe, A. I. et al. PDGFRA alterations in cancer: characterization of a gain-of-function V536E transmembrane mutant as well as loss-of-function and passenger mutations. Oncogene 33, 2568-2576 (2014). [0648] 25. Corless, C. L. et al. PDGFRA Mutations in Gastrointestinal Stromal Tumors: Frequency, Spectrum and In Vitro Sensitivity to Imatinib. J. Clin. Oncol. 23, 5357-5364 (2005). [0649] 26. Ahmad, I., Iwata, T. & Leung, H. Y. Mechanisms of FGFR-mediated carcinogenesis. Biochim. Biophys. Acta--Mol. Cell Res. 1823, 850-860 (2012). [0650] 27. Wong, J. P. et al. Dual Targeting of PDGFR.alpha. and FGFR1 Displays Synergistic Efficacy in Malignant Rhabdoid Tumors. Cell Rep. 17, 1265-1275 (2016). [0651] 28. Muller, P. A. J. & Vousden, K. H. Mutant p53 in cancer: new functions and therapeutic opportunities. Cancer Cell 25, 304-17 (2014). [0652] 29. Segal, N. H. et al. Classification and subtype prediction of adult soft tissue sarcoma by functional genomics. Am. J. Pathol. 163, 691-700 (2003). [0653] 30. Henderson, S. R. et al. A molecular map of mesenchymal tumors. Genome Biol. 6, R76 (2005). [0654] 31. Nielsen, T. O. et al. Molecular characterisation of soft tissue tumours: a gene expression study. Lancet 359, 1301-1307 (2002). [0655] 32. Van der Graaf, W. T. et al. Pazopanib for metastatic soft-tissue sarcoma (PALETTE): a randomised, double-blind, placebo-controlled phase 3 trial. Lancet 379, 1879-1886 (2012). [0656] 33. Yoo, K. H. et al. Efficacy of pazopanib monotherapy in patients who had been heavily pretreated for metastatic soft tissue sarcoma: a retrospective case series. BMC Cancer 15, 154 (2015). [0657] 34. Ray-Coquard, I. et al. Treatment patterns and survival in an exhaustive French cohort of pazopanib-eligible patients with metastatic soft tissue sarcoma (STS). BMC Cancer 17, 111 (2017). [0658] 35. Nakamura, T. et al. The clinical outcome of pazopanib treatment in Japanese patients with relapsed soft tissue sarcoma: A Japanese Musculoskeletal Oncology Group (JMOG) study. Cancer 122, 1408-16 (2016). [0659] 36. Linch, M., Miah, A. B., Thway, K., Judson, I. R. & Benson, C. Systemic treatment of soft-tissue sarcoma-gold standard and novel therapies. Nat. Rev. Clin. Oncol. 11, 187-202 (2014). [0660] 37. Lee, A. T. J., Pollack, S. M., Huang, P. & Jones, R. L. Phase III Soft Tissue Sarcoma Trials: Success or Failure? Curr. Treat. Options Oncol. 18, 19 (2017). [0661] 38. Tap, W. D. et al. Olaratumab and doxorubicin versus doxorubicin alone for treatment of soft-tissue sarcoma: an open-label phase 1b and randomised phase 2 trial. Lancet 388, 488-497 (2016). [0662] 39. Mir, O. et al. Safety and efficacy of regorafenib in patients with advanced soft tissue sarcoma (REGOSARC): a randomised, double-blind, placebo-controlled, phase 2 trial. Lancet Oncol. 0, e20294-711 (2016). [0663] 40. Ho, T. H. et al. The impact of FGFR1 and FRS2.alpha. expression on sorafenib treatment in metastatic renal cell carcinoma. BMC Cancer 15, 304 (2015).
[0664] All references cited herein are incorporated herein by reference in their entirety and for all purposes to the same extent as if each individual publication or patent or patent application was specifically and individually indicated to be incorporated by reference in its entirety.
[0665] The specific embodiments described herein are offered by way of example, not by way of limitation. Any sub-titles herein are included for convenience only, and are not to be construed as limiting the disclosure in any way.
Sequence CWU 1
1
2421100DNAArtificial SequenceSarcoma centroid target sequence
1tgttgccaaa ctttgtcgca tgcataatgt atgatggagg cttggatggg aatatgctga
60ttttgttctg cacttaaagg cttctcctcc tggagggctg 1002100DNAArtificial
SequenceSarcoma centroid target sequence 2cgaattctct ggtggttgag
atcccgccat ttcggaatca gaggataacc agccccgttc 60acgtcagttt ctacgtctgc
aacgggaaga gaaagcgaag 1003100DNAArtificial SequenceSarcoma centroid
target sequence 3ccgtgccggc cacctgtgtg atcgcctgct acttttacga
acgcctcaac atggattact 60ggaagatcct ggcggcgcag cacaagtgca aaatgaacaa
1004100DNAArtificial SequenceSarcoma centroid target sequence
4gaggaggaat tctttccccg cctaacattt caagggacac aattcactcc aagtctcttc
60cctttccaag ccgcttccga agtgctcccg gtgcccgcaa 1005100DNAArtificial
SequenceSarcoma centroid target sequence 5cctgcccgcg ctcaagacca
tcgtcatcct gaccctgcgc aaggtggcgg gtgatgagct 60gactgggctt tgctacgtgg
ccagcacgga tgcagcagcg 1006100DNAArtificial SequenceSarcoma centroid
target sequence 6cagtgaagct gggtgcggtg gtgcactcct gtaaccctgg
gactttggga agctgaggca 60ggaagattga gcctaggagt tcgagactga cctgggcagc
1007100DNAArtificial SequenceSarcoma centroid target sequence
7ttgaacactt cctctccaaa atgccagagg cggaggagaa caaacagatc atccgcaaac
60acgcgcagac cttcgttgcc ctctgtgcca cagatgtgaa 1008100DNAArtificial
SequenceSarcoma centroid target sequence 8agccaggaac agaaacggct
actgatggat ttggatattt ccatgaggac ggtggactgt 60ccattcactg tcacctttta
tggcgcactg tttcgggagg 1009100DNAArtificial SequenceSarcoma centroid
target sequence 9ggggagcagg gctcactcca gccacctgaa gtccaaaaag
ggtcagtcta cctcccgcca 60taaaaaactc atgttcaaga cagaagggcc tgactcagac
10010100DNAArtificial SequenceSarcoma centroid target sequence
10ctgtctatct gggtctgcta acagactggg gtcaacgttt gcactatgac cttcagaaag
60gcatttgggt tggaactgag tcccaagatg tgccctggga 10011100DNAArtificial
SequenceSarcoma centroid target sequence 11ccagcgtcct ttacttctcc
tggcaccgct atgagcatgg gcgcttctgg cctttcctgc 60gagagtcaga tgcagacgca
gtggggcggg gacagggcct 10012100DNAArtificial SequenceSarcoma
centroid target sequence 12ttgaaaatcg gcccaagaag gagcaggttc
tggaactgga gcgggagaat gaaatgctga 60agaccaaaaa ccaggagctg cagtccatca
tccaggccgg 10013100DNAArtificial SequenceSarcoma centroid target
sequence 13aagagttacc tcctccatct tactctgccc tatttgaaag tctcagggga
gaaaagggaa 60caagatgctg atccaacctg agtggagtca ggtgaggcat
10014100DNAArtificial SequenceSarcoma centroid target sequence
14gcaccgtagc atgcagatgt caaggcagtt aggaagtaaa tggtgtcttg tagatatgtg
60caaggtagca tgatgagcaa cttgagtttg ttgccactga 10015100DNAArtificial
SequenceSarcoma centroid target sequence 15cctccgtggg acattagaat
caaatttcaa aaggcttctg tgagcagatg taccctttat 60tggagagatg agggactggt
actgcttaat cgactcagat 10016100DNAArtificial SequenceSarcoma
centroid target sequence 16aattgaagat ctagaactga aggaaagaga
acttgatcag cagaagttgt ggctacagca 60aagcatcaaa aatgtgatgg acgattccat
taataataga 10017100DNAArtificial SequenceSarcoma centroid target
sequence 17ttccgaaaac caggccttat ctccaagacc agagatagtg gggagacttc
ttggcttggt 60gaggaaaagc ggacatcagc tggtcaaaca aactctctga
10018100DNAArtificial SequenceSarcoma centroid target sequence
18ctccaagagg agcacacttt ggggagatgt cctggtttcc tgcctccatt tctctgggac
60cgatgcagta tcagcagctc ttttccagat caaagaactc 10019100DNAArtificial
SequenceSarcoma centroid target sequence 19acagagaaaa gagagactta
ttctggttgt tgctaataat gttaacctgc tatttatatt 60ccagtgccct tcgcatggcg
aagcaggggg gaaaagttat 10020100DNAArtificial SequenceSarcoma
centroid target sequence 20aatctccttc tctcggatca ttgtgatgga
tgctggaacc tcagggtatg gagctcacat 60cagttcatca tggtgggtgt tagagaattc
ggtgacatgc 10021100DNAArtificial SequenceSarcoma centroid target
sequence 21aaaaataaaa acccacaaaa atgttgaacc aaacctccct gctaatctcc
atgcccacgt 60tctttcccac cctgttccca gtcttctgac aaactgtgta
10022100DNAArtificial SequenceSarcoma centroid target sequence
22tttgacaaca ttggctatgc ctggatcgcc atcttccagg tcatcacgct ggagggctgg
60gtcgacatca tgtactttgt gatggatgct cattccttct 10023100DNAArtificial
SequenceSarcoma centroid target sequence 23ttaaaggaca gttgaaaagg
gcaagaggaa accagggcag ttctagagga gtgctggtga 60ctggatagca gttttaagtg
gcgttcacct agtcaacacg 10024100DNAArtificial SequenceSarcoma
centroid target sequence 24acaccaacct ggagaagttc tcagatggtg
ccttcctggg tgtaaccacg ctgaaacacg 60tccatttgga gaacaaccgc ttgaaccagc
taccctccaa 10025100DNAArtificial SequenceSarcoma centroid target
sequence 25accacacatc ccagcccaat ccaggtacgc acagacaggt tttcacataa
atgcagccca 60tttctccaga acccatttga ggggtggggg ggtgttaatt
10026100DNAArtificial SequenceSarcoma centroid target sequence
26cacctcctct gttggagaag cagaccgtta ccaaagacgt cacagataag ccactagact
60tgtcttctaa agtggtggat gtagatgctt ccaaagctga 10027100DNAArtificial
SequenceSarcoma centroid target sequence 27tccctctccg aggccgagaa
gaccttctgt tcctgtaaat acagccagca agtgcaaact 60gtgattttat tttccacgta
ttcctgagga cggactggac 10028100DNAArtificial SequenceSarcoma
centroid target sequence 28agtgctcctg tgtgaccttc gccctgtgtc
cttccatttc ctgtctttcc cgtccatcac 60ccatcctaag cacttacgtg agtaaataat
gcagctcaga 10029100DNAArtificial SequenceSarcoma centroid target
sequence 29aagagtcacc aaattttgag agttatactt gcttgtgtgc tcctggctgg
caaggtcagc 60ggtgtaccat tgacattgac gagtgtatct ccaagccctg
10030100DNAArtificial SequenceSarcoma centroid target sequence
30ctttatggca ggggtggaag gaggtacatt taattcccac tgcctgcctt tggcaagccc
60tgggttcttt gctccccata tagatgtcta agctaaaagc 10031100DNAArtificial
SequenceSarcoma centroid target sequence 31gtatctttgg gaagccatgt
gtctggtttg tcgtgctggg acagtcatgg gactgcatct 60tccgacttgt ccacagcaga
tgaggacagt gagaattaag 10032100DNAArtificial SequenceSarcoma
centroid target sequence 32tatatgttct tcaacacatc agagctccga
gaagcggtac ctgaacccgt gttgctctcc 60cgggcagagc tgcgtctgct gaggctcaag
ttaaaagtgg 10033100DNAArtificial SequenceSarcoma centroid target
sequence 33cggcacggtt tcgtggggac ccaggcttgc aaagtgacgg tcattttctc
tttctttctc 60cctcttgagt ccttctgaga tgatggctct gggcgcagcg
10034100DNAArtificial SequenceSarcoma centroid target sequence
34gtggcgcccc aactcttcgc cagcatatca tcccggcagg cgataaacta cattcagttg
60agtctgcaag actgggagga actggggtga taagaaatct 10035100DNAArtificial
SequenceSarcoma centroid target sequence 35tggctgtggg ttacactgcc
ttcaatggcg tggacttcga gggcacgttc catgtgaaca 60cggtcacgga tgacgactat
gcgggcttca tctttggcta 10036100DNAArtificial SequenceSarcoma
centroid target sequence 36tgtggtctgc cagctaaagg tgaagatata
ttcctccaat tcaggaccca cacgacggga 60agacaagttc atgtactttg agttccctca
gccgttacct 10037100DNAArtificial SequenceSarcoma centroid target
sequence 37atggccaagg atgtggacag agacaacaaa gggttcttca actgcgatgg
tttcctggca 60ctaatgggag tttaccatga gaaggcccag aaccaggaga
10038100DNAArtificial SequenceSarcoma centroid target sequence
38ctgaaagaga cggagctgag gaaggtgaag gtgcttggat ctggcgcttt tggcacagtc
60tacaagggca tctggatccc tgatggggag aatgtgaaaa 10039100DNAArtificial
SequenceSarcoma centroid target sequence 39tccagcccgc cctgttgtct
cctgccaagc agccgactat gagaacttct cttgcacttg 60gagtcccagc cagatcagcg
gtttacccac ccgctacctc 10040100DNAArtificial SequenceSarcoma
centroid target sequence 40cataccatga ccggaagtca aaagttgacc
tggataggct caatgatgat gccaagcgtt 60acagttgcac tcccaggaat tactcggtca
atataagaga 10041100DNAArtificial SequenceSarcoma centroid target
sequence 41cgtgtgctgg ggccctgctc tgagatcctc aagaggaaca ttcagcgtta
caacagcttc 60atctccctca ccgtctgagc acagctcccg ccctgcagcc
10042100DNAArtificial SequenceSarcoma centroid target sequence
42ggggaacgtg atcctgctga acatggacgg caaagagctt tggaatctca gaatgcacaa
60aaagaaagtg acgcatgtgg ccctgaaccc atgctgtgat 10043100DNAArtificial
SequenceSarcoma centroid target sequence 43ggcgtttgga atcgcattct
cccagttaat tggcatgctg ctggcctgct gtctgtcccg 60gttcatcacg gccaatcagt
atgagatggt gtaaggagaa 10044100DNAArtificial SequenceSarcoma
centroid target sequence 44tgggtcatgt tgcagcagtc cgctgtgttc
aatatgatgg caggagggtt gttagtggag 60catatgattt tatggtaaag gtgtgggatc
cagagactga 10045100DNAArtificial SequenceSarcoma centroid target
sequence 45accagtcggt gtacgtcata tccgaggaga aggatgagtg cgtcatagca
actgaggtgt 60aaaatggaag tgagatggca agactcccgt ttctcttaaa
10046100DNAArtificial SequenceSarcoma centroid target sequence
46gctggagagg cggctaaggt gtttggaggc ttccaggtgg taccggctcc cgatggccag
60tttgctttcc tcattcccaa cggggccttc gcgcacagcg 10047100DNAArtificial
SequenceSarcoma centroid target sequence 47ggatccaaac cttggctgct
cctctgacac catcgaggtc tcctgcaact tcactcatgg 60tggacagacg tgtctcaagc
ccatcacggc ctccaaggtc 10048100DNAArtificial SequenceSarcoma
centroid target sequence 48tagtgcttgg tcgggtcttg gggtctggag
cgtttgggaa ggtggttgaa ggaacagcct 60atggattaag ccggtcccaa cctgtcatga
aagttgcagt 10049100DNAArtificial SequenceSarcoma centroid target
sequence 49agcctgcatc ccttcgcctg cagcctactt tggggaaata aagtgcctta
ctgactgtag 60ccattacagt atccaatgtc ttttgacagg tgcctgtcct
10050100DNAArtificial SequenceSarcoma centroid target sequence
50agcctcagca gccgtcacag acagtgcgtt tcaaattgcc aatctggcag actgcccgca
60gaatcattcc tcctcctcct cgtcctcctc agggggagct 10051100DNAArtificial
SequenceSarcoma centroid target sequence 51cgggagagac tcgctcactc
ccatgttggg tttgagacag acaccttttc tatttacctc 60ctaatggcat ggagactctg
agagcgaatt gtgtggagaa 10052100DNAArtificial SequenceSarcoma
centroid target sequence 52gcatctacta ccttgacaca gagtgttttc
ccactagaag ctctgctctg ctctcctggc 60ccaagtaggg gattccatgc cttccctttc
atggtcttag 10053100DNAArtificial SequenceSarcoma centroid target
sequence 53ccctcgatca tatttcccct tggacacttg gttagacgcc ttccaggtca
ggatgcacat 60ttctggattg tggttccatg cagccttggg gcattatggg
10054100DNAArtificial SequenceSarcoma centroid target sequence
54tcctggatag tttgcggctg agaatgcact tactggctca ttcagcgggt gccaaagcct
60ttgtctgtga tcagtgcggt gcacagtttt cgaaggagga 10055100DNAArtificial
SequenceSarcoma centroid target sequence 55gtattcatac agcactactt
acttagagat gctactgtca gtgtcctcag ggctctacca 60agacataatg cactggggta
ccacatggtc catttcatgt 10056100DNAArtificial SequenceSarcoma
centroid target sequence 56gccttgtctc ttgggtctga gtcccttgct
taagggattt tgaagtccta gttttcagct 60tgcagagatt atgtctgaaa tgcctaatga
gtcgcaggga 10057100DNAArtificial SequenceSarcoma centroid target
sequence 57atcaatgaca cagatgctaa tcctcgatac aagatcccag tggaagctga
cttcctcttc 60gcctattcca cggttccagg ctattactcg tggaggagcc
10058100DNAArtificial SequenceSarcoma centroid target sequence
58gatcacctga ggacccgagc cattgatgga ctcggacgag accgggttcg agcactcagg
60actgtgggtt tctgtgctgg ctggtcttct gctgggagcc 10059100DNAArtificial
SequenceSarcoma centroid target sequence 59cagcacagcg ctatggccgc
gagctccgga ggatgagtga cgagtttgtg gactccttta 60agaagggact tcctcgcccg
aagagcgcgg gcacagcaac 10060100DNAArtificial SequenceSarcoma
centroid target sequence 60actgattata cctctagtat agatgtatgg
tctgctggct gtgtgttggc tgagctgtta 60ctaggacaac caatatttcc aggggatagt
ggtgtggatc 10061100DNAArtificial SequenceSarcoma centroid target
sequence 61attatggatc tttgcataga atgtcaagct aaccaggcgt ccgctacttc
agaagagtgt 60actgtcgcat ggggagtctg taaccatgct tttcacttcc
10062100DNAArtificial SequenceSarcoma centroid target sequence
62gatggcttct atgaggctga gctctgcccg gaccgctgca tccacagttt ccagaacctg
60ggaatccagt gtgtgaagaa gcgggacctg gagcaggcta 10063100DNAArtificial
SequenceSarcoma centroid target sequence 63gaaactgggg ctcctccagg
gtggcagcaa caataaatag acacgcacgg cagccacagc 60ttgggtgtgt gttcatcctt
gttaaaaaaa aaaaaaaaaa 10064100DNAArtificial SequenceSarcoma
centroid target sequence 64ttaaagatga gcgggtggca gcgacagagc
caaaatcaga gctggaacct gaggagagag 60tgttcaagaa ggaagtgtat cttcatacat
caccacacct 10065100DNAArtificial SequenceSarcoma centroid target
sequence 65aaatgggggg aaggtccaac ttaaccttat ggatttagtg tctgggattc
cagcaactca 60aagtcaaaaa attcaagagg tgggggagat cacaaacttg
10066100DNAArtificial SequenceSarcoma centroid target sequence
66ggatatgctt tcaatgggac aaagctggat gctgtttacc taaacaagaa taaatacctg
60acagttattg acaaagatgc atttggagga gtatacagtg 10067100DNAArtificial
SequenceSarcoma centroid target sequence 67ctaagagcca tttaggggcc
acttttgact agggattcag gctgcttggg ataaagatgc 60aaggaccagg actccctcct
cacctctgga ctggctagag 10068100DNAArtificial SequenceSarcoma
centroid target sequence 68cttcatcatg agttctgctg aatgccgcga
tgggtcaggt aggggggaaa caggttggga 60tgggatagga ctagcaccat tttaagtccc
tgtcacctct 10069100DNAArtificial SequenceSarcoma centroid target
sequence 69gcatttggag tcctgctgta tgaaatgttg gctgggcagg caccctttga
aggggaggat 60gaagatgaac tcttccaatc catcatggaa cacaacgtag
10070100DNAArtificial SequenceSarcoma centroid target sequence
70agtccagaaa tcttcctgaa acgcccagtg gttgagggaa atcgttggag gttggactgc
60attcttaaac gaaaagcaca acaaggagtg aggatcttca 10071100DNAArtificial
SequenceSarcoma centroid target sequence 71ccaactcgcc tgtggacggg
gaggctctcc ctctctctca tcttacattt ctcaccctac 60tctggatggt gtgtggtttt
taaagaaggg ggctttcttt 10072100DNAArtificial SequenceSarcoma
centroid target sequence 72ctgcgcaata gcccagaaga taagcgggcg
ggcggtgaag agtcacagtt tgagatggac 60atttaaagca ccagccatcg tgtggagcac
taccaagggg 10073100DNAArtificial SequenceSarcoma centroid target
sequence 73gtgttggccg aggtcctcac gggcatccct gcaatggata acaaccgaag
cccggtttac 60ctgaaggact tactcctcag tgatattcca agcagcaccg
10074100DNAArtificial SequenceSarcoma centroid target sequence
74atagtggtga ccctcaagac cagcttgcag tggcttatca tcttatcatt gacaatcgga
60gaataatgaa ccaagccagt gagttctacc tcgcctctag 10075100DNAArtificial
SequenceSarcoma centroid target sequence 75gtggatgtaa aacccatttc
acaagagaag attgagagtg agagagccct catcagccag 60tgtggaaaac cagtggtaaa
tgtcagctac aggccagctt 10076100DNAArtificial SequenceSarcoma
centroid target sequence 76acggaatgga cagccgacct cccatggcaa
tttttgagtt gttggattac atagtcaacg 60agcctcctcc aaaactgccc agtggagtgt
tcagtctgga 10077100DNAArtificial SequenceSarcoma centroid target
sequence 77gtgagactcg cgccctccgg cacggaaaag gccaggcgac aggtgtcgct
tgaaaagact 60gggcttgtcc ttgctggtgc atgcgtcgtc ggcctctggg
10078100DNAArtificial SequenceSarcoma centroid target sequence
78ccaatgtcca gatggccaga atgaatgtga tagttcagac caatgccttc cactgctcct
60ttatgactgc acttctagcc agtagctctg cacaagttag 10079100DNAArtificial
SequenceSarcoma centroid target sequence 79agcagaagga agcactacag
ttcgtaagga gatcatcagg aataagatca gagccattgg 60gaagatggca cgggtctttt
caattcttcg gcaagaaagt 10080100DNAArtificial SequenceSarcoma
centroid target sequence 80ccatgaattc ctatgaaatg cggaaggcat
tagaagaagc aggtttcaag atgccctgtc 60aactccacca agtcatcgtt gctcggtttg
cagatgacca 10081100DNAArtificial SequenceSarcoma centroid target
sequence 81acactacaag aggtgaagat gacagtgcag gaagatcgaa agtgcgaatc
tgacttacgc 60cattattacg acagtaccat tgagttgtgc gtgggggacc
10082100DNAArtificial SequenceSarcoma centroid target sequence
82gatgggtgtt gctcccttat ccccaaatca ctctatacat ccaattcagg aaacaaacat
60ggtggcaatt ctacacaaaa agagatgaga ttaacagtgc 10083100DNAArtificial
SequenceSarcoma centroid target sequence 83tcattggtaa aggacgcagc
tacaagggaa cagtatctat cactaagagt ggcatcaaat 60gtcagccctg gagttccatg
ataccacacg aacacagctt 10084100DNAArtificial SequenceSarcoma
centroid target sequence 84catgattcag cgcaaggagt gggacttatc
tgagtatagt tacaaggacc cagaggacca
60aggaaacctc tatattgggt acacgatgca ggtaggcagc 10085100DNAArtificial
SequenceSarcoma centroid target sequence 85ctttctacat agtgtccatg
tgcgtcgcca gtagtgtcgg gagcaagttc agcaaaactc 60aaacctttca gggttgtgga
atcttgcagc ctgatccgcc 10086100DNAArtificial SequenceSarcoma
centroid target sequence 86aggcaccacg taagacctcc tgcccttagc
tctcttgctc accacccaag aacctcagga 60cagaagcgag agcccattgc tcctgctcag
ctcagcccgg 10087100DNAArtificial SequenceSarcoma centroid target
sequence 87gacctccgcg ccgagcgctc cgtactcatc cccgagacct accaggccaa
caattgccag 60ggcgtgtgcg gctggcctca gtccgaccgc aacccgcgct
10088100DNAArtificial SequenceSarcoma centroid target sequence
88tgaaacaccc tgtggtagca gctttgctgt cttctacttc atcagcttct acatgctctg
60tgccttcctg atcatcaacc tctttgtagc tgtcatcatg 10089100DNAArtificial
SequenceSarcoma centroid target sequence 89gacacggacg aggacaagac
gtcggtccac ttcgaggagg acttccacaa gctcagagaa 60ctccagacca cagagctgaa
gatgtgttcc ctggccgtga 10090100DNAArtificial SequenceSarcoma
centroid target sequence 90ttcgagcatc agtacgtcag tgccatcaag
accctgtggg aggacccggg catccaggaa 60tgctacgacc gcaggcgcga gtaccagctc
tccgactctg 10091100DNAArtificial SequenceSarcoma centroid target
sequence 91tgatagtggg tgccccctac ttctttgagc gccaagaaga gctggggggt
gctgtgtatg 60tgtacttgaa ccaggggggt cactgggctg ggatctcccc
10092100DNAArtificial SequenceSarcoma centroid target sequence
92ttgcttgtgg aggcgtggga ttccagtaat gacaccgttc aacctgacag tattattgaa
60aaggcttctc actcgggcat gatcaacccc agccggcagt 10093100DNAArtificial
SequenceSarcoma centroid target sequence 93gccatgaatt tctcctactc
gccgctgcta cgtgagttca ccaaggccac caacgtccgc 60ctgcgcttcc tgcgtaccaa
cacgctgctg ggccatctca 10094100DNAArtificial SequenceSarcoma
centroid target sequence 94caccggctca ttgatgacat ggtggctcag
gtcctcaagt cttcgggtgg ctttgtgtgg 60gcctgcaaga actatgacgg agatgtgcag
tcagacatcc 10095100DNAArtificial SequenceSarcoma centroid target
sequence 95cagagcgtcc tgtgcggacc ggcagagaac aaatgccaag aactgttgtg
caagtgtgac 60caggagattg ctaactgctt agcccaaact gagtacaact
10096100DNAArtificial SequenceSarcoma centroid target sequence
96agccgcgcgc tcagccggca actcagcagc ggggtctcgg agatccggca cactgcggac
60cgctggcgcg tgtccctgga tgtcaaccac ttcgccccgg 10097100DNAArtificial
SequenceSarcoma centroid target sequence 97caagcggaaa ttgaagcaga
taggtcttat cagcacagtc tccgcctcct ggattcagtg 60tctcggcttc agggagtcag
tgatcagtcc tttcaggtgg 10098100DNAArtificial SequenceSarcoma
centroid target sequence 98gggcctgtcc attgctgtgg agggtcctag
caaagcggag attgcatttg aggatcgcaa 60agatggctcc tgcggcgtct cctatgtcgt
ccaggaacca 10099100DNAArtificial SequenceSarcoma centroid target
sequence 99atttggttcc cgatggccct gtgggagaac agatccgacg tatcctgaag
ggaaagtcca 60ttcagcagag agctccaccg tattagctcc attagcttgg
100100100DNAArtificial SequenceSarcoma centroid target sequence
100gggaatggac atgcattgcc tactcgcagc ttcgagatca gtgcattgtt
gatgacatca 60cttacaatgt gaacgacaca ttccacaagc gtcatgaaga
100101100DNAArtificial SequenceSarcoma centroid target sequence
101ataaaggttt cgaaggcatc agcggacctc atgtcctact gtgaggaaca
tgccaggagt 60gaccctttgc tgataggaat accaacttca gaaaaccctt
100102100DNAArtificial SequenceSarcoma centroid target sequence
102ccgcatctat tggcagcttt gttattgatc agaaactgct cgccgccgac
ttggcttcca 60gtctggctgc gggcaaccct tgagttttcg cctctgtcct
100103100DNAArtificial SequenceSarcoma centroid target sequence
103ctgtggcttg ggacagatag aagggatggt tggggatact tcccaaaact
ttttccaagt 60caacttggtg tagccggttc cccggccacg actctgggca
100104100DNAArtificial SequenceSarcoma centroid target sequence
104ctttctcttc ttgtttctcc tgcccactgc tgcagtaggg gaggagcaca
gtttgtggct 60tataggtgtt ggttttgggg gtgtgagtgt ttgggggacg
100105100DNAArtificial SequenceSarcoma centroid target sequence
105cgccaactga aaaagtggga aaggatgtct ggaggcgagg cgtcccatta
cagaggaagg 60agctcgctat ataagccagc caaagttggc tgcaccggcc
100106100DNAArtificial SequenceSarcoma centroid target sequence
106aagcgcacat tcatgtgggc atttcttgcg agcctcgcag cctccggaag
ctgtcgactt 60catgacaagc attttgtgaa ctagggaagc tcaggggggt
100107100DNAArtificial SequenceSarcoma centroid target sequence
107cacttgggtg acggcagtcg atgcgttcac tccaatgtct gctgaggagt
tatggtgaac 60ccacaactta ggccctagcg gcagaaagga aaacctgaag
100108100DNAArtificial SequenceSarcoma centroid target sequence
108gcgcttctga acgcgatcag aaagcttcat gtgggcaaag tcggggagaa
cgggtatgtg 60gagatagagg atgacattgg aaggagggca gaaatgaatg
100109100DNAArtificial SequenceSarcoma centroid target sequence
109aaaccagtga gcagtatgaa tttgtgcacc atgctctgtg cctgtatgag
agcagacttt 60cagcagagac tgtccagtga gtcattgaag acttgtcaga
100110100DNAArtificial SequenceSarcoma centroid target sequence
110ctttggagtc tgccgtgatg gcatcaaccg ctacgactgt gtctgccaac
ctggcttcac 60agggcccctt tgtaacgtgg agatcaatga gtgtgcttcc
100111100DNAArtificial SequenceSarcoma centroid target sequence
111ccctcaggag ccctggagga gtgctatgtc acagaaattg accaagataa
gtatgctgtg 60cgcttcatcc ctcgggagaa tggcgtttac ctgattgacg
100112100DNAArtificial SequenceSarcoma centroid target sequence
112gaataagcct tggaattaga tatggggcaa tgactgagcc ctgtctcacc
catggattac 60tccttactgt agggaatggc agtatggtag agggataaat
100113100DNAArtificial SequenceSarcoma centroid target sequence
113cgataatcct ccgatcttca atcccaccac gtacaagggt caggtgcctg
agaacgaggc 60taacgtcgta atcaccacac tgaaagtgac tgatgctgat
100114100DNAArtificial SequenceSarcoma centroid target sequence
114gacgggtaca ataacacact gtactgatgt cacaactttg caagctctgc
cttgggttca 60gcccatctgg gctcaaattc cagcctcacc actcacaagc
100115100DNAArtificial SequenceSarcoma centroid target sequence
115atttagaaaa cttgaaagtc agcactaaag gatgggcaga ggttcaaccc
acacctccac 60tttgcttctg aaggcccatt cattagacca cttgtaaaga
100116100DNAArtificial SequenceSarcoma centroid target sequence
116ctccccgtgt acatatactc ccggtttccc tgcccctcca ttgcccttgg
ctttttctgg 60tatgtgctgt gctccacgac caagccgaga aaggacctag
100117100DNAArtificial SequenceSarcoma centroid target sequence
117gaatgacagc tatcttcggt cgtccttgag gtcaacggca tcgtactgtt
ccagggacag 60tcggggccac aatgatgtgt atatttcgga gcatgttatg
100118100DNAArtificial SequenceSarcoma centroid target sequence
118gagagtgtat cctgtgcccg atctacttgt cattgcagac aaatatgatc
ctttcactac 60gacaaatacc gaatgcctct gcataaaccc tggctctttt
100119100DNAArtificial SequenceSarcoma centroid target sequence
119ataatgtaaa cgtcaatgca caaaatggat ttggaaggac tgcgctgcag
gttatgaaac 60ttggaaatcc cgagattgcc aggagactgc tacttagagg
100120100DNAArtificial SequenceSarcoma centroid target sequence
120cgccagctga gccgagcggt agctggtctg gcgaggtttt atacacctga
aagaagagaa 60tgtcaagacg aagtagccgt ttacaagcta agcagcagcc
100121100DNAArtificial SequenceSarcoma centroid target sequence
121ccagaagcct ctttcttgga cggatcctct ccttgacttc ctcagcctcc
cgcctgctta 60caactgccct gacctccttc tgtgccaaat atacataccc
100122100DNAArtificial SequenceSarcoma centroid target sequence
122ctctctgtgt gacattacta tcactcagat gctggaggaa gattctaacc
aggggcacct 60gattggtgat ttttccaagg tatgtgcgct gccaaccgtg
100123100DNAArtificial SequenceSarcoma centroid target sequence
123gcaaagtgat tgactgtgac agttctgagg cctatgctaa tcattctagt
tcatttatag 60gctctgcttt gcaggatcaa gcctcaaggc tgggggttcc
100124100DNAArtificial SequenceSarcoma centroid target sequence
124cgggacaaag ctggcctgaa tcattaatac gaaagactgg atataccctg
gaaagtctta 60agccttgtct catggacctt caccagacct acctcaaagc
100125100DNAArtificial SequenceSarcoma centroid target sequence
125caaaaccaat ctatgatgat gacccatctc ttgaaggtgg tgttaatggc
aaaaatcttg 60gccccataaa tgaatggtgg atcactggct ttgatggagg
100126100DNAArtificial SequenceSarcoma centroid target sequence
126aaaagagtgc acgccagtat cacgtacagt tctttggtga cgccccagaa
agagcttgga 60tatttgagaa gagcctcgta gcttttgaag gagaaggaca
100127100DNAArtificial SequenceSarcoma centroid target sequence
127ccagctccaa gccgtggact cttcggagaa ctttcagatc tcccttaaga
gcaaacaagg 60cccgatcgat gttttcctgt gccctgagga gaccgtaggt
100128100DNAArtificial SequenceSarcoma centroid target sequence
128tactctgatc tacgttgata aggaaattgg agaaccaggc acccgtgtgg
ctgccaagga 60tgtgctgaag ctggagtcta gaccttcaat caaagcatta
100129100DNAArtificial SequenceSarcoma centroid target sequence
129acaggtggaa aggagatcac agagaaagtg attacagaca ttgccggggt
aataccagct 60gagaaaattg atggagtatt tgctgcctgt cagagtggct
100130100DNAArtificial SequenceSarcoma centroid target sequence
130tttgtgcttc tcacctttgg gtgggatgcc ttgccagtgt gtcttacttg
gttgctgaac 60atcttgccac ctccgagtgc tttgtctcca ctcagtacct
100131100DNAArtificial SequenceSarcoma centroid target sequence
131cagttatcct gtttgctcac aatgatctcg ttgacaaggt ccagcctggg
gacagagtga 60atgttacagg catctatcga gctgtgccta ttcgagtcaa
100132100DNAArtificial SequenceSarcoma centroid target sequence
132ggggacagat ttgtgaccgg cgcggttttt gtcagcttac tccggccaaa
aaagaactgc 60acctctggag cggacttatt taccaagcat tggaggaata
100133100DNAArtificial SequenceSarcoma centroid target sequence
133aaccagaggt tccagagagt aaccagaaac agtggcaatc taagagaaag
tcagagtgta 60ttaaccagaa tcctgctgca tcttcaaatc actggcagat
100134100DNAArtificial SequenceSarcoma centroid target sequence
134aacttgagga agagcaagca gtcagaccaa aatacctact gggtcgggaa
gtcactggaa 60acatgagagc catcctaatt gactggctag tacaggttca
100135100DNAArtificial SequenceSarcoma centroid target sequence
135gctggcttat tagctgtaat ggcccagatg ggttgttacg tccctgctga
agtgtgcagg 60ctcacaccaa ttgatagagt gtttactaga cttggtgcct
100136100DNAArtificial SequenceSarcoma centroid target sequence
136atgagacgaa gggggaggac aacattgact tcatgcccac catcttgtcg
cgcttcgaca 60tgatcttcat cgtcaaggat gagcacaatg aggagaggga
100137100DNAArtificial SequenceSarcoma centroid target sequence
137aaacaaaagg ctgatgagga agagatgctt gataatctac cagaggctgg
tgactccaga 60gtacacaact caacacagaa aaggaaggcc agtcagctag
100138100DNAArtificial SequenceSarcoma centroid target sequence
138ccgggagaat gacatcaaga gctactttgg ccgtaaggtg gccattgatg
cctctatgag 60catttatcag ttcctgattg ctgttcgcca gggtggggat
100139100DNAArtificial SequenceSarcoma centroid target sequence
139agggtgatgg attggagttc aagagacact tcctgaagat taaagggaag
ctgattgata 60ttgtgagcag ccagaagatt tggcttcctg ccacatgatc
100140100DNAArtificial SequenceSarcoma centroid target sequence
140gatgtgcaaa gcctgggata tagaagaact tgtcagcctg gggaagaaac
taaaggcctg 60tccatattac acagcccgag aactaataca agatgctgac
100141100DNAArtificial SequenceSarcoma centroid target sequence
141atcccacata atcacaggaa acaagattcc actgagtggc ccagtaccta
aggagctgga 60tcagcagtcc accacaaaag cttctgttaa aagaccctac
100142100DNAArtificial SequenceSarcoma centroid target sequence
142atcggagtgc cttttgcagg caaggatcaa agaggcaaag tgctcattta
taatgggaac 60aaagatggct taaacaccaa gccttcccaa gttctgcaag
100143100DNAArtificial SequenceSarcoma centroid target sequence
143caaccatgtc tttcaaggat tacatccaag agaggagtga cccagtggag
caaggcaaac 60cagttatacc tgcagctgtg ctggccggct tcacaggaag
100144100DNAArtificial SequenceSarcoma centroid target sequence
144tgggatttcc tgggcttaat ggattccaag gaattgaggg tcaaaagggt
gacattggcc 60tgccaggccc agatgttttc atcgatatag atggtgctgt
100145100DNAArtificial SequenceSarcoma centroid target sequence
145cagaggactg gtgtttcaca cgggcactaa gaactccttt atggctcttt
atctttcaaa 60aggacgtctg gtctttgcac tggggacaga tgggaaaaaa
100146100DNAArtificial SequenceSarcoma centroid target sequence
146caaagtcttg aacgtggacc ccgacaatgt gaccttctgt gtgctggctg
cgggtgagga 60ggacgagggc gacatcgcgc tgcagatcca ttttacgctg
100147100DNAArtificial SequenceSarcoma centroid target sequence
147cggatatcag catcctgtcc ttgcaggctt ctgaattccc ttctgagtta
atgtcaaatg 60acagcaaagc actgtgtggc tgaataagcg gtgttcatga
100148100DNAArtificial SequenceSarcoma centroid target sequence
148tcttttgtaa gtgctacata aattggcctg gtatggctgc agtcctccgg
ttgcatactg 60gactcttcaa aaactgtttt gggtagctgc cacttgaaca
100149100DNAArtificial SequenceSarcoma centroid target sequence
149acagtgatac acacacgtat ttaaggacta tccctgagac catccctctc
attttggaaa 60ctgctaggga gggaaccaac cacttaaaca agcgtggttt
100150100DNAArtificial SequenceSarcoma centroid target sequence
150ggaacggcac tgttcacctt tatctgacca aaccgctcta cacgtcagca
ccatctctgc 60agcatctctg taggctcacc attaacaaat gtaccggtgc
100151100DNAArtificial SequenceSarcoma centroid target sequence
151tattcggtcg ggagccatac caaaggatcc caaaatcttg gctgctcttg
aagctgttgg 60aaaatcagaa aatgatctgg aagggcggat agtttgtgtc
100152100DNAArtificial SequenceSarcoma centroid target sequence
152cagacggtgg aggatggggt gtttgacatc cacttgtaat agatgctgtg
gttggatcaa 60ggactcattc ctgccttgga gaaaatactt caaccagagc
100153100DNAArtificial SequenceSarcoma centroid target sequence
153ttgatggtgg catcaaacta ccgatttaaa actggaagtt gctggtactc
aaaccaaaag 60ttcatactct ggcgacacga agggtttcct ttgagcaacg
100154100DNAArtificial SequenceSarcoma centroid target sequence
154caaaagacat cacaattagc aatgtgacca aggactcagt gatggtctcc
tggagccctc 60ctgttgcatc tttcgattac taccgagtat catatcgacc
100155100DNAArtificial SequenceSarcoma centroid target sequence
155gttactccct acactgatgc aaggattaca gaaactgatg ccaaggggct
gagtgagttc 60aactacatgt tctgggggcc cggagataga tgactttgca
100156100DNAArtificial SequenceSarcoma centroid target sequence
156gacacgagcc ttcctgacaa gtgtaactca ttcctacaca acaaggcgga
gtggaggtgc 60gaaattgagg caactcttga gaggctaaag aaactagagc
100157100DNAArtificial SequenceSarcoma centroid target sequence
157gaaaggctca agttgcacca ggcagacaac agacatggaa ttcttatata
tccagctgtt 60agcaacaaaa caaaagtcaa atagcaaaca gcgtcacagc
100158100DNAArtificial SequenceSarcoma centroid target sequence
158cgggaggaag caggacattg gagacatttt acagcaaatt atgaccatca
cagaccagag 60tttggatgag gcgcaggcca gaaaacatgc tttaaactgc
100159100DNAArtificial SequenceSarcoma centroid target sequence
159gagcaaagag gtggccatcc gcatctttca gggctgccag tttcgctccg
tggaggctgt 60gcaggagatc acagagtatg ccaaaagcat tcctggtttt
100160100DNAArtificial SequenceSarcoma centroid target sequence
160accctcgtca cataggctgg aaagatttca ccgcctacag atggcgtctc
agccacaggc 60caaagacggg tttcattaga gtggtgatgt atgaagggaa
100161100DNAArtificial SequenceSarcoma centroid target sequence
161caaagccctc atcgacagaa acatccaggc caccctggaa agccagaaga
aactcaactg 60gtgtcgagaa gtccggaagc ttgtggcgct gaaaacgaac
100162100DNAArtificial SequenceSarcoma centroid target sequence
162cacagcagag tacagcacaa tccacagccc atcaacaccc attaaagatt
cagattctga 60tcgattgcgt cgaggttcag atgggaaatc acgtggacgg
100163100DNAArtificial SequenceSarcoma centroid target sequence
163agtcaaaatc cgctctccat gcttactctt gacaccccat tgaagccact
cattgtgtgt 60gcgtctgggt gtgaagtcca gctccgtgtg gtcctgtgct
100164100DNAArtificial SequenceSarcoma centroid target sequence
164tcggacaccg aggagaatgt caagaggcga acacacaacg tcttggagcg
ccagaggagg 60aacgagctaa aacggagctt ttttgccctg cgtgaccaga
100165100DNAArtificial SequenceSarcoma centroid target sequence
165agggtatagc ttcccacact atggatttcc tacttatggt gggattactt
tccatcctgg 60aactactaaa tctaatgctg ggatgaagca tggaaccatg
100166100DNAArtificial SequenceSarcoma centroid target sequence
166cagccatgaa gaaccaggtt gcaagattta atgacctcag gtttgtcggt
cgaagtggaa 60gagggaaaag cttcactctg accatcactg tcttcacaaa
100167100DNAArtificial SequenceSarcoma centroid target sequence
167ttggcacaac aggaagctgt tgaaggagga tgttcccatc ttggtcagtc
ctatgcggat 60agagatgtct ggaagccaga accatgccaa atatgtgtct
100168100DNAArtificial SequenceSarcoma centroid target sequence
168ggttcatgct accctgaagt cactcagtag tcagattgaa accatgcgca
gccccgatgg 60ctcgaaaaag cacccagccc gcacgtgtga tgacctaaag
100169100DNAArtificial SequenceSarcoma centroid target sequence
169ggatgacttg aagggttcct tgaaagagga cctgacacag cacaagttca
tttgtgaaca 60gtgtgggaag tgcaagtgtg gagaatgcac tgctcccagg
100170100DNAArtificial SequenceSarcoma centroid target sequence
170ggcgaggcca cggcttatgc aagcaaagat ctggaggagc agttacggtc
tgtgtccagt 60gtagatgaac tcatgactgt actctaccca gaatattgga
100171100DNAArtificial SequenceSarcoma centroid target sequence
171cgtgctggaa atctgggatg cttccttctg ggttctgatt ctcagtgagt
ggagcccatt 60catccaggca ggtttccatg ctatgagtgg ccctttcgtt
100172100DNAArtificial SequenceSarcoma centroid target sequence
172ggaggatgga ggagacggga catctttcac ctcaggctcc tggtagagaa
gacaggggat 60tctactctgt gcctcctgac tatgtctggc taagagattc
100173100DNAArtificial SequenceSarcoma centroid target sequence
173cacataccaa cggcgaggat cacttcagct ctggcagttt ttggtagctc
ttctggatga 60cccttcaaat tctcatttta ttgcctggac tggtcgaggc
100174100DNAArtificial SequenceSarcoma centroid target sequence
174accctggtcc tgacttccct ggaggagaag tattcctgtt gctgtcttca
gtctcacaga 60gaagctcctg ctacttcccc agctctcagt agtttagtac
100175100DNAArtificial SequenceSarcoma centroid target sequence
175gggatggaag gctgtcttct tttgaggatg atcagagaac ttgggcatag
gaacaatctg 60gcagaagttt ccagaaggag gtcacttggc attcaggctc
100176100DNAArtificial SequenceSarcoma centroid target sequence
176aaacagccac cacttctcct agaggagcca agccatctgt gaaatcagaa
ttaagccctg 60ttgccaggca gacatcccaa ataggtgggt caagtaaagc
100177100DNAArtificial SequenceSarcoma centroid target sequence
177caaggttacc aactacctag actggattcg tgacaacatg cgaccgtgac
caggaacacc 60cgactcctca aaagcaaatg agatcccgcc tcttcttctt
100178100DNAArtificial SequenceSarcoma centroid target sequence
178catctggagg caccatctca acgaagactg cgatctccca atgatgatat
ttctggatac 60aaagagaact acacaaggtg gctgtgttac tgcaacgtgc
100179100DNAArtificial SequenceSarcoma centroid target sequence
179aaatgaggaa gaccttcaga aggttgctga gtacaagact gggcctgtgc
tggaacaccc 60agattgtttc ccatgtcagg actgcagcag caaagccaat
100180100DNAArtificial SequenceSarcoma centroid target sequence
180agttcgagga agacctaaac aacggtgtga caccgagaat ccttacacca
aagctgatgg 60gcgtggagac ggttgtgtga caatggtctg gatggaaagg
100181100DNAArtificial SequenceSarcoma centroid target sequence
181gaacaagcac ttcggtcatc ccagtcaagc tgtttttgac gacgaagcag
acaagaccgg 60tgaactgagg gacagtgatt tcagtaatga acaattctcc
100182100DNAArtificial SequenceSarcoma centroid target sequence
182gaagataatc tgtttcctaa gcaagaaata acaggaaaga tcccttatgc
caggaggcct 60gccatactca ggataagatc cttgaatatg gaacttagtt
100183100DNAArtificial SequenceSarcoma centroid target sequence
183ccggtgagct gactcctgag gaggaggccc agtacaaaaa ggctttctcc
gcggttgaca 60cggatggaaa cggcaccatc aatgcccagg agctgggcgc
100184100DNAArtificial SequenceSarcoma centroid target sequence
184aagagtccgg cggcatctgt cttgtcccta ttcctgcagc ctgtgctgag
ggtagcagtg 60tatgagctac cagcgtgcat gtcagcgacc ctggcccgac
100185100DNAArtificial SequenceSarcoma centroid target sequence
185agggtgatag tcaaattatg tattggtggg gctgggtacc aatgctgcag
gtcaacagct 60atgctggtag gctcctgcca gtgtggaacc actgactact
100186100DNAArtificial SequenceSarcoma centroid target sequence
186gtcctgctgc ccgagccagg aactgtgtgt gttgcagggg ggcagtaact
ccccaactcc 60ctcgttaatc acaggatccc acgaatttag gctcagaagc
100187100DNAArtificial SequenceSarcoma centroid target sequence
187ttgctttgac cactcttcct gagttcagtg gcactcaaca tgagtcaaga
gcatcctgct 60tctaccatgt ggatttggtc acaaggttta aggtgaccca
100188100DNAArtificial SequenceSarcoma centroid target sequence
188gacgtccagt acgacctgta cttgaacgtt gccaacaggc gtcaacagta
cgagtgtctt 60cactacaaaa cggatgctca gggaacacgt atcgggtgtc
100189100DNAArtificial SequenceSarcoma centroid target sequence
189ccggaccacc tcgtccctgt ggaaagacaa ggcagcagtg gaaatcaacg
tggccgtgct 60gcacagttac cagctagcca aagtcaccat cgtggaccac
100190100DNAArtificial SequenceSarcoma centroid target sequence
190tgacaaacaa attcggtaca tcctcgacgg catctcagcc ctgagaaagg
agacatgtaa 60caagagtaac atgtgtgaaa gcagcaaaga ggcactggca
100191100DNAArtificial SequenceSarcoma centroid target sequence
191ctggctactt caatcttgtt cggggaccac caacgcttga atatggctga
aggatgccat 60gtttgctcta aattaagaca gcattgatct cctggaggct
100192100DNAArtificial SequenceSarcoma centroid target sequence
192tcatgtgtca taactcagtc aagctcagtg agcattctca gcacattgcc
tcaacagctt 60caaggtgagc cagctcaaga ctttgctctc caccaggcag
100193100DNAArtificial SequenceSarcoma centroid target sequence
193tggccttgtg gataagggag agttgaccgt tttcatcctg gcctcctttt
gctgtttgga 60tgtttccacg ggtctcactt ataccaaagg gaaaactctt
100194100DNAArtificial SequenceSarcoma centroid target sequence
194cacaacgaga ttctgagcaa cgcagactcg ctgtccactt tcgtctctga
gcagcaaatg 60gaaagccagg agccggcaga tttgacaggt gtcactgtac
100195100DNAArtificial SequenceSarcoma centroid target sequence
195gaaagcctga agcactttgt ggcttccacg ggttcgtttc taggaagctt
ttgctttacc 60tggggaaacc ccaagctcta cagtgagaaa gttgtaaatt
100196100DNAArtificial SequenceSarcoma centroid target sequence
196actcagaaaa gccctgctgg atggtaaatc atggaatcca gaaggaacag
tgggtacagg 60atgcaattgg caggaagcaa catctatctg aagaggaaaa
100197100DNAArtificial SequenceSarcoma centroid target sequence
197tcaaaagggg ggacatcctc aaggttttga acgaagaatg tgatcagaac
tggtacaagg 60cagagcttaa tggaaaagac ggcttcattc ccaagaacta
100198100DNAArtificial SequenceSarcoma centroid target sequence
198gctgccacaa cttgtgtacc ttcagggatg gggctcttac tccctcctga
ggccagctgc 60tctaatatcg atggtcctgc ttgccagaga gttcctctac
100199100DNAArtificial SequenceSarcoma centroid target sequence
199catactggta ctgctgtaat gagccaagtg gcagctaaaa gttgggggtg
ttctgcccag 60tcccgtcatt ctgggctaga aggcagggga ccttggcatg
100200100DNAArtificial SequenceSarcoma centroid target sequence
200tttctctcaa gtttcctgag tctccagaaa aacagcacta acgctggacc
tgtctactct 60cagaacccgg cacagattct ctcttgatct ccttttggaa
100201100DNAArtificial SequenceSarcoma centroid target sequence
201ctgctttcaa ctggtagttg tgggttgaag cactggacaa tgccacatac
tttgtggatg 60gtgtgggtct tgggggtcat catcagcctc tccaaggaag
100202100DNAArtificial SequenceSarcoma centroid target sequence
202aaaacatacc aattgttggc cagaagggaa gtctgggatc aaagtgcttt
ggatgttggg 60ttaacaatgc agctcctgga ctgcaacttc tcagatgaaa
100203100DNAArtificial SequenceSarcoma centroid target sequence
203cggactctcc aaagcactgc gtgctgatga aaactactac aaggcccaga
cccatggaaa 60gtggcctgtc aagtggtacg ctccggaatg catcaactac
100204100DNAArtificial SequenceSarcoma centroid target sequence
204cttggtaaga agccgggaac agacaacaga agtcatgaag cccaagtgaa
atcaaaggtg 60ctaaatggtc gcccaggaga catccgttgt gcttgcctgc
100205100DNAArtificial SequenceSarcoma centroid target sequence
205cgaacaggac cagattttgt ttggagcctc agcatgccgg ggcccagatg
atggagcata 60acgggtccca gccaattgtg atgatccttt ttgctcattt
100206100DNAArtificial SequenceSarcoma centroid target sequence
206gcttagcttt agaaacagtg caacactggt ctgctgttcc agtggtaagc
tatgtcccag 60gaatcagttt aaaagcacga cagtggatgc tgggtccata
100207100DNAArtificial SequenceSarcoma centroid target sequence
207tgacactcat tgattctaaa gcatctttaa tctgccaggc ggagggggct
ttgctggtct 60ttcttggact attccagaga ggacaactgt catctgggaa
100208100DNAArtificial SequenceSarcoma centroid target sequence
208gagtccacca ggctttaaca acaccgagag aacatgtgat aaagagttta
ttatacggag 60aacggctacc aatcgagttc tgaacgtcct ccgtcactgg
100209100DNAArtificial SequenceSarcoma centroid target sequence
209ggggggaccc agcctgggac agacctgcgt gctgatcgtg atcttcacag
tgctcctgca 60gtctctctgt gtggctgtaa cttacgtgta ctttaccaac
100210100DNAArtificial SequenceSarcoma centroid target sequence
210ctcatgcgag ccttcattga tgtgactgct gctgccgaaa atatcaggct
gccaaatgca 60ggcactcagg ttcgagtgac tgtgtttccc tcaaagactg
100211100DNAArtificial SequenceSarcoma centroid target sequence
211cactactgtg cctttgagtc cggtggacga tgcctgcaac gtgaacatct
tcgacgccat 60cgcggagatt gggaaccagc tgtatttgtt caaggatggg
100212100DNAArtificial SequenceSarcoma centroid target sequence
212cgtggatgag tgctgcttcc ggagctgtga tctaaggagg ctggagatgt
attgcgcacc 60cctcaagcct gccaagtcag ctcgctctgt ccgtgcccag
100213100DNAArtificial SequenceSarcoma centroid target sequence
213gtgctgctga aggtcatgga tgccaagcac aagaactgca tggagtcatt
cctggaagca 60gcgagcttga tgagccaagt gtcgtaccgg catctcgtgc
100214100DNAArtificial SequenceSarcoma centroid target sequence
214atttggagaa tgttgagtcc ttcaagcaga ccgatgtcta ctccatggct
ctggtgctct 60gggaaatgac atctcgctgt aatgcagtgg gagaagtaaa
100215100DNAArtificial SequenceSarcoma centroid target sequence
215aaagaggaaa tactccgcgt gcgcttgtag aaggggagtc gtctccagct
ccgaaccccg 60gagtgttcat cagcggggaa tctggctccg aattctcttt
100216100DNAArtificial SequenceSarcoma centroid target sequence
216tccaggccat ggagcgggtc agcgagaaca aggtgcgtcc tgtccacttc
tggtttgcca 60cgggcggcgc tggcttctgc atcagccgtg ggctggctct
100217100DNAArtificial SequenceSarcoma centroid target sequence
217cagtggcact tggactgcaa tgctttacct tggacctgaa gaatgttacc
tgtcaatggc 60agcaacagga ccatgctagc tcccaaggct tcttctacca
100218100DNAArtificial SequenceSarcoma centroid target sequence
218ccgccagcct cctgggtgga gatttgttca tgtcccactg gctacacggg
ccagttctgt 60gaatcctgtg ctccgggata caagagggag atgccacagg
100219100DNAArtificial SequenceSarcoma centroid target sequence
219aggagccagg gtcggattcc agttaaatgg atggcaattg aatccctttt
tgatcatatc 60tacaccacgc aaagtgatgt atggtctttt ggtgtcctgc
100220100DNAArtificial SequenceSarcoma centroid target sequence
220actcaagtcc ttacctcttc cggagatgta gcaaaacgca tggagtgtgt
attgttccca 60gtgacacttc agagagctgg tagttagtag catgttgagc
100221100DNAArtificial SequenceSarcoma centroid target sequence
221tcccaatttc aggctcaccc atgacatcag cctggaggag tttgaggatg
aagacctctc 60ggagatcact gatgagtgtg gcatcagctt acagtgcaaa
100222100DNAArtificial SequenceSarcoma centroid target sequence
222cgggcattcc tgaagctgac agcattcggg ccgagatgtc tcgctccgtg
gccttagctg 60tgctcgcgct actctctctt tctggcctgg aggctatcca
100223100DNAArtificial SequenceSarcoma centroid target sequence
223acgtttttct aggtacagct cccaggaaca gctaggtggg aaagtcccat
cactgaggga 60gcctaaccat gtccctgaac aaaaattggg cactcatcta
100224100DNAArtificial SequenceSarcoma centroid target sequence
224tagaacccat ggaaaactgg ctacagttga tgttgaattg ggaccctcag
cagagaggag 60gacctgttga ccttactttg aagcagccaa gatgttttgt
100225100DNAArtificial SequenceSarcoma centroid target sequence
225gcggacctga agatgctcac aaaccacacc ttcatcaagc ggtccgaggt
ggaagaagtg 60gattttgccg gctggttgtg taaaaccctg cggctgaacc
100226100DNAArtificial SequenceSarcoma centroid target sequence
226ccacagacat gcaccatata gaagagagtt tccaagaaat caaaagagcc
atccaagcta 60aggacacctt cccaaatgtc actatcctgt ccacattgga
100227100DNAArtificial SequenceSarcoma centroid target sequence
227cagaaacatc ggatttgggg aacgcgtgtc aatcccttgt gccgcagggc
tgggcgggag 60agactgttct gttccttgtg taactgtgtt gctgaaagac
100228100DNAArtificial SequenceSarcoma centroid target sequence
228ttcattgatt acccaaagaa ggaggactac atcgtctacc tgggtcgctc
aaggcttaac 60tccaacacgc aaggggagat gaagtttgag gtggaaaacc
10022920DNAArtificial SequenceTP53 primer 229tctcatgctg gatccccact
2023020DNAArtificial SequenceTP53 primer 230agtcagagga ccaggtcctc
2023120DNAArtificial SequenceTP53 primer 231tgaggacctg gtcctctgac
2023220DNAArtificial SequenceTP53 primer 232agaggaatcc caaagttcca
2023320DNAArtificial SequenceTP53 primer 233tgttcacttg tgccctgact
2023420DNAArtificial SequenceTP53 primer 234ttaacccctc ctcccagaga
2023520DNAArtificial SequenceTP53 primer 235aggcgcactg gcctcatctt
2023620DNAArtificial SequenceTP53 primer 236tgtgcagggt ggcaagtggc
2023719DNAArtificial SequenceTP53 primer 237ttgggagtag atggagcct
1923820DNAArtificial SequenceTP53 primer 238agtgttagac tggaaacttt
2023920DNAArtificial SequenceTP53 primer 239caattgtaac ttgaaccatc
2024020DNAArtificial SequenceTP53 primer 240ggatgagaat ggaatcctat
2024120DNAArtificial SequenceTP53 primer 241agaccctctc actcatgtga
2024220DNAArtificial SequenceTP53 primer 242tgacgcacac ctattgcaag
20
D00000
D00001
D00002
D00003
D00004
D00005
D00006
D00007
D00008
D00009
D00010
D00011
D00012

D00013

D00014

D00015

D00016

D00017

D00018

D00019
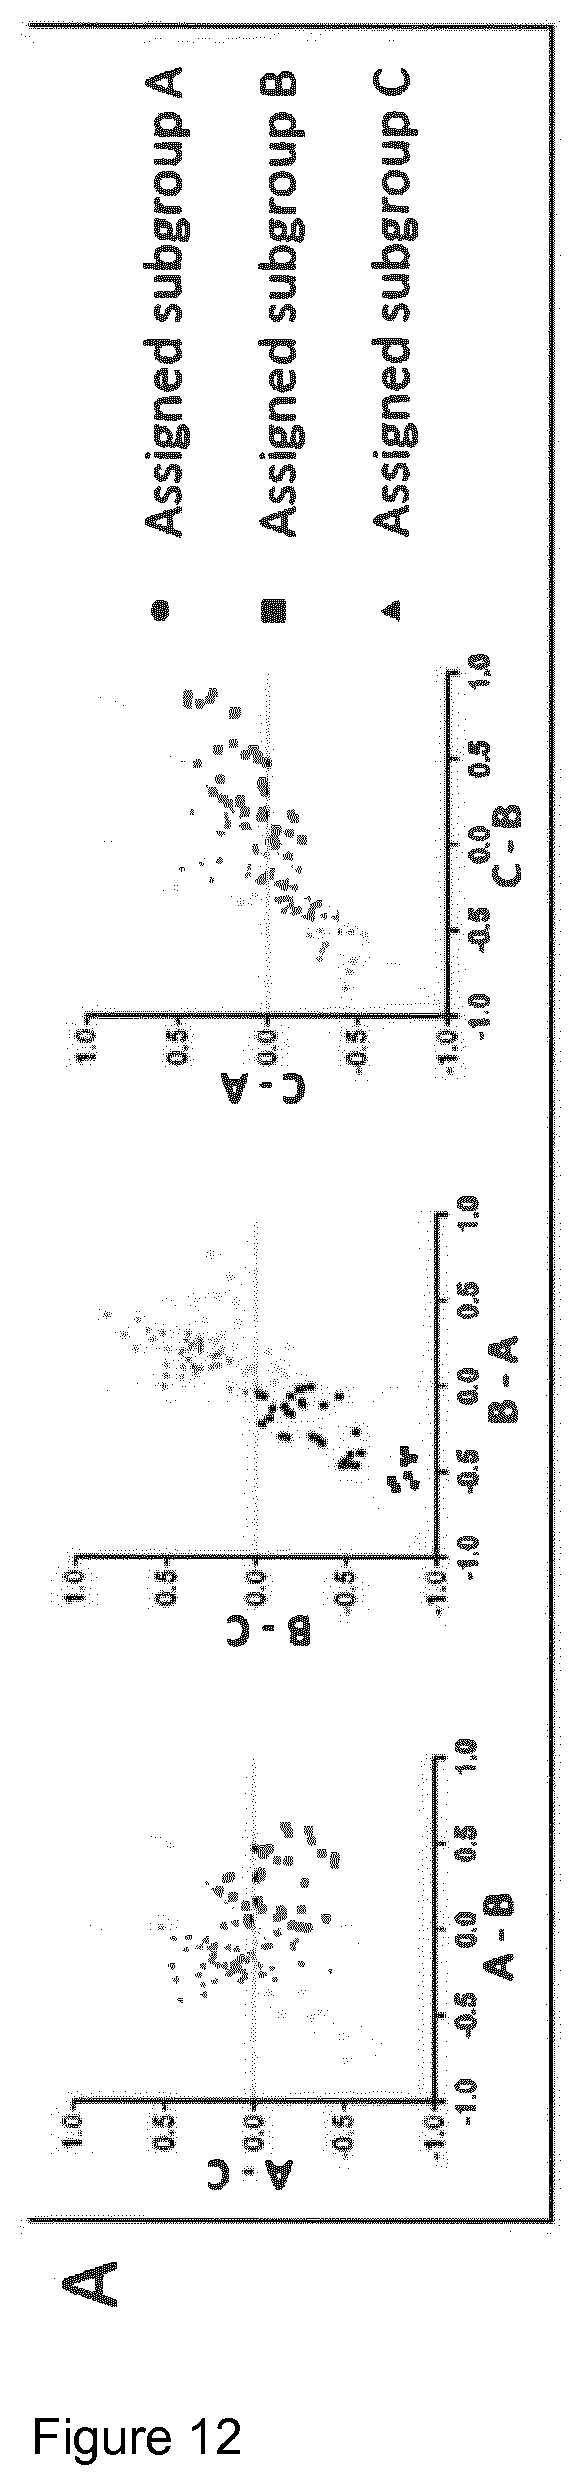
D00020

D00021
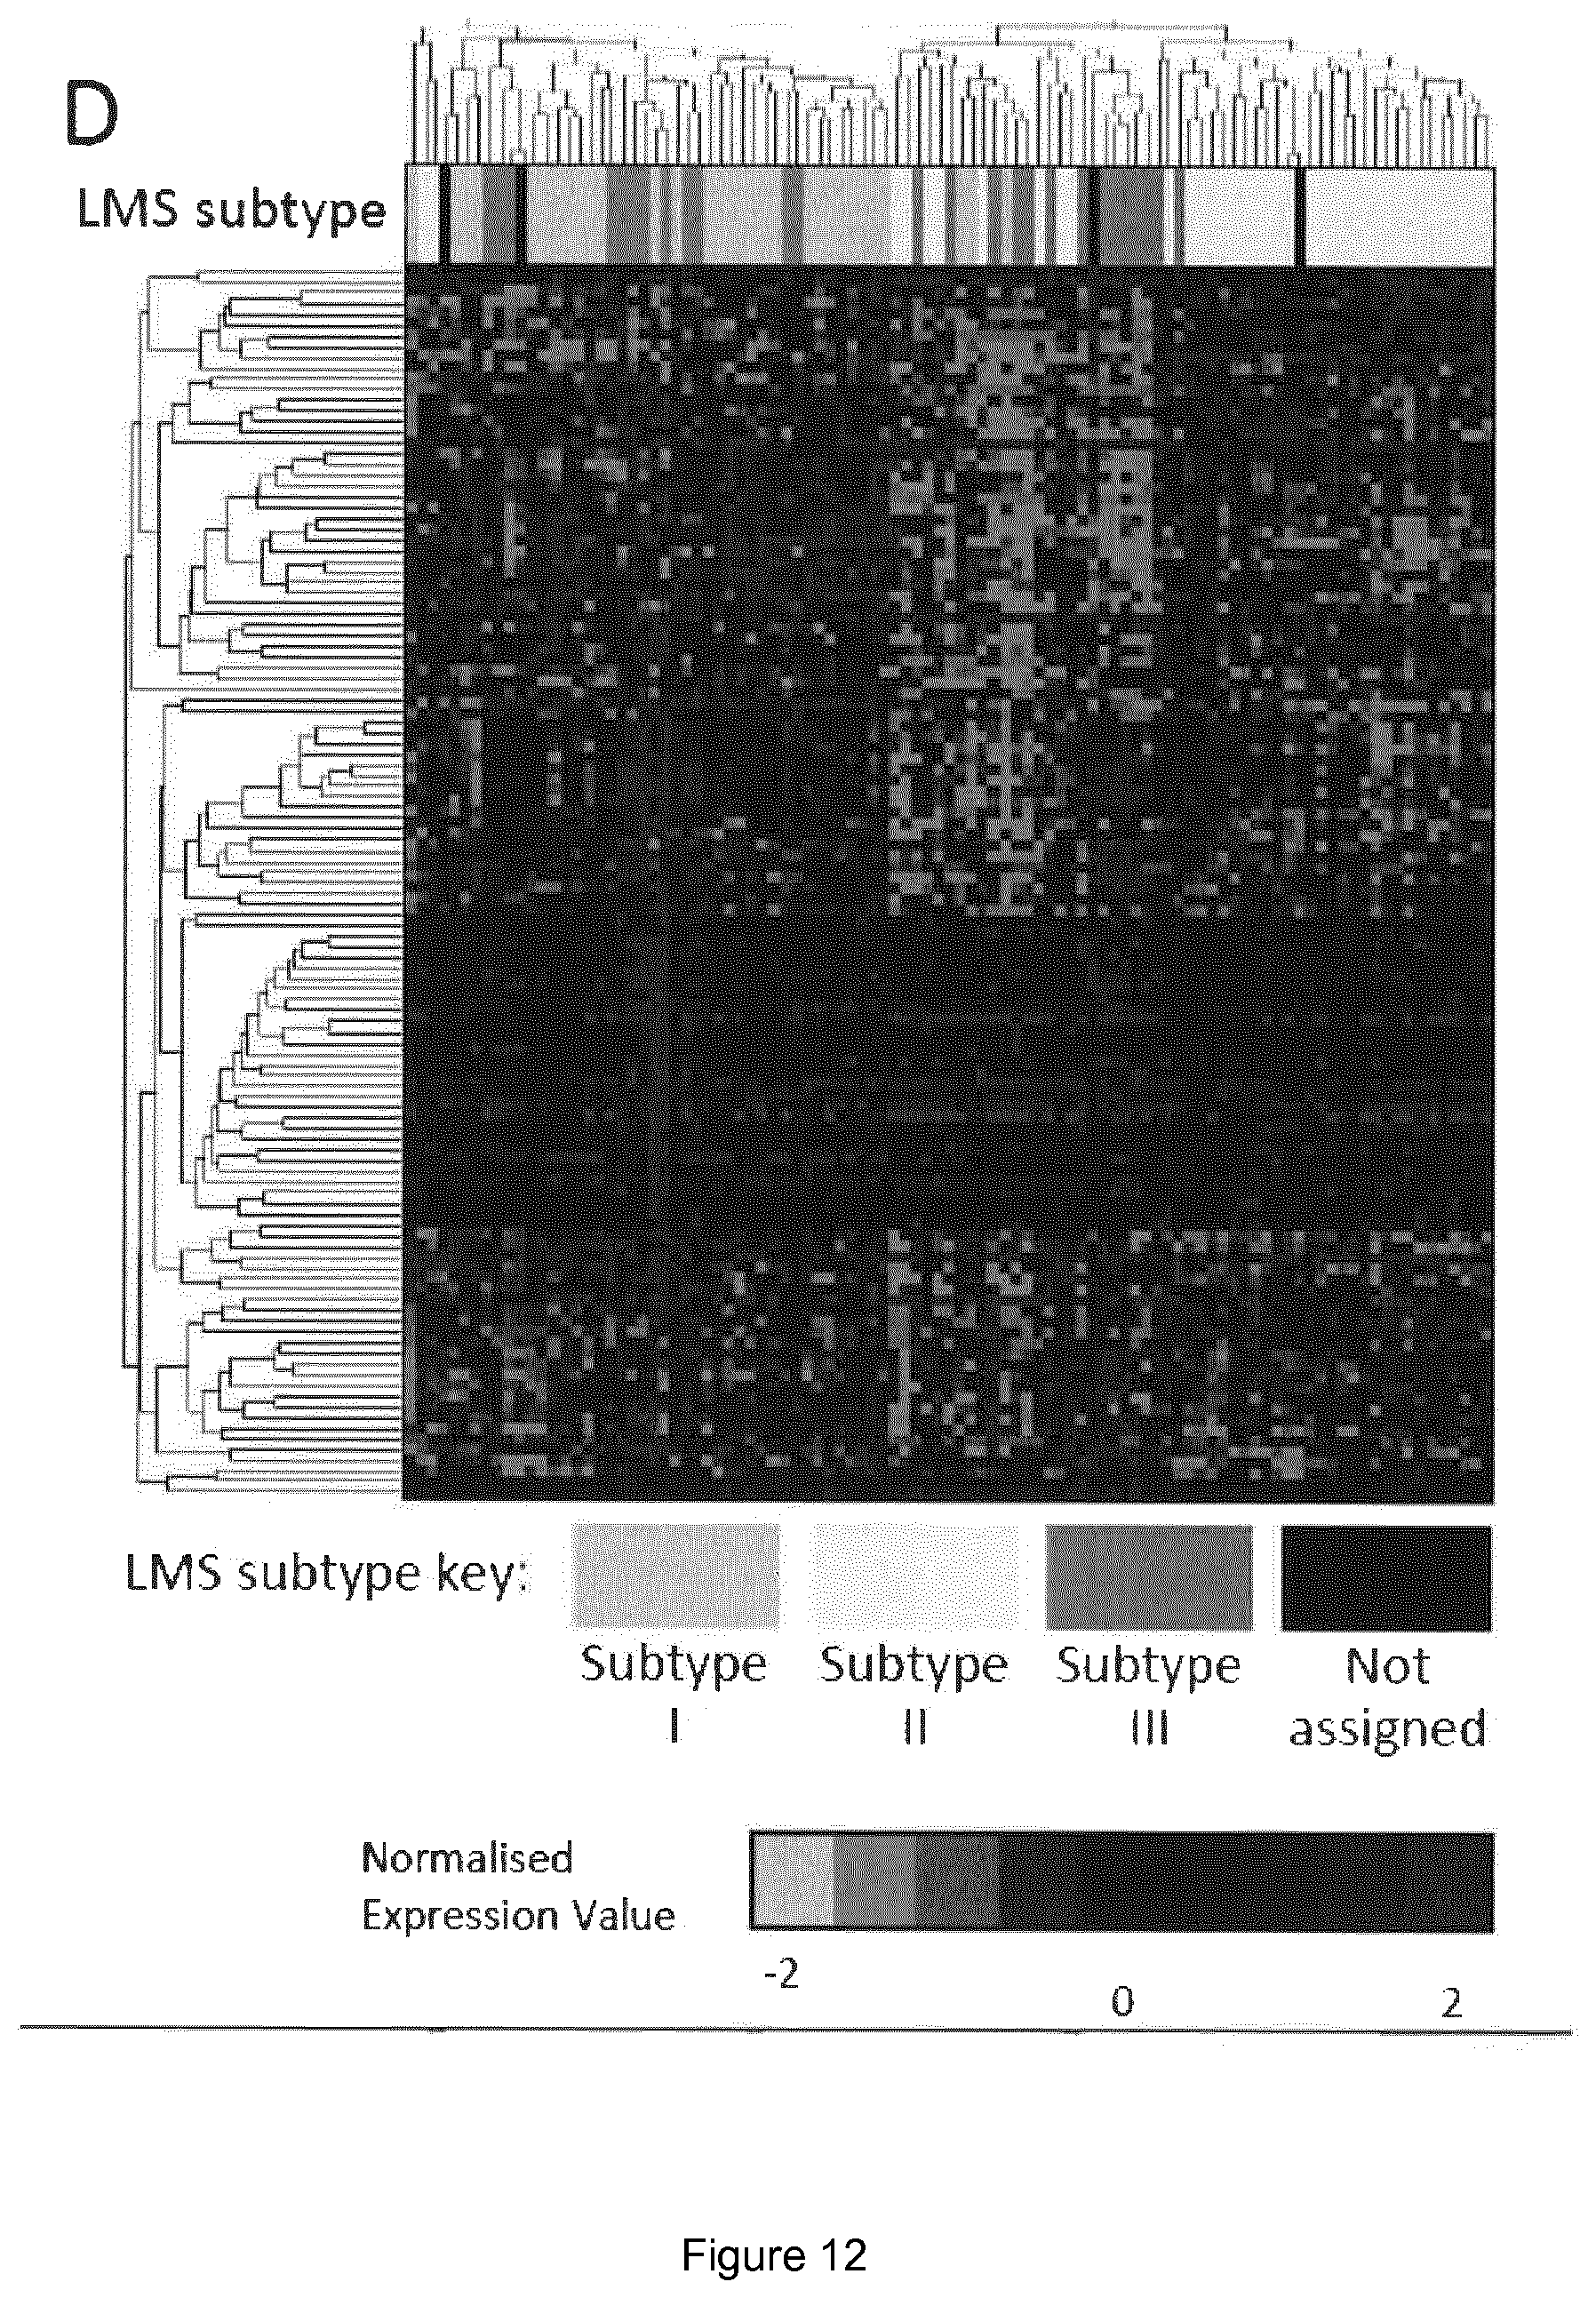
D00022

D00023
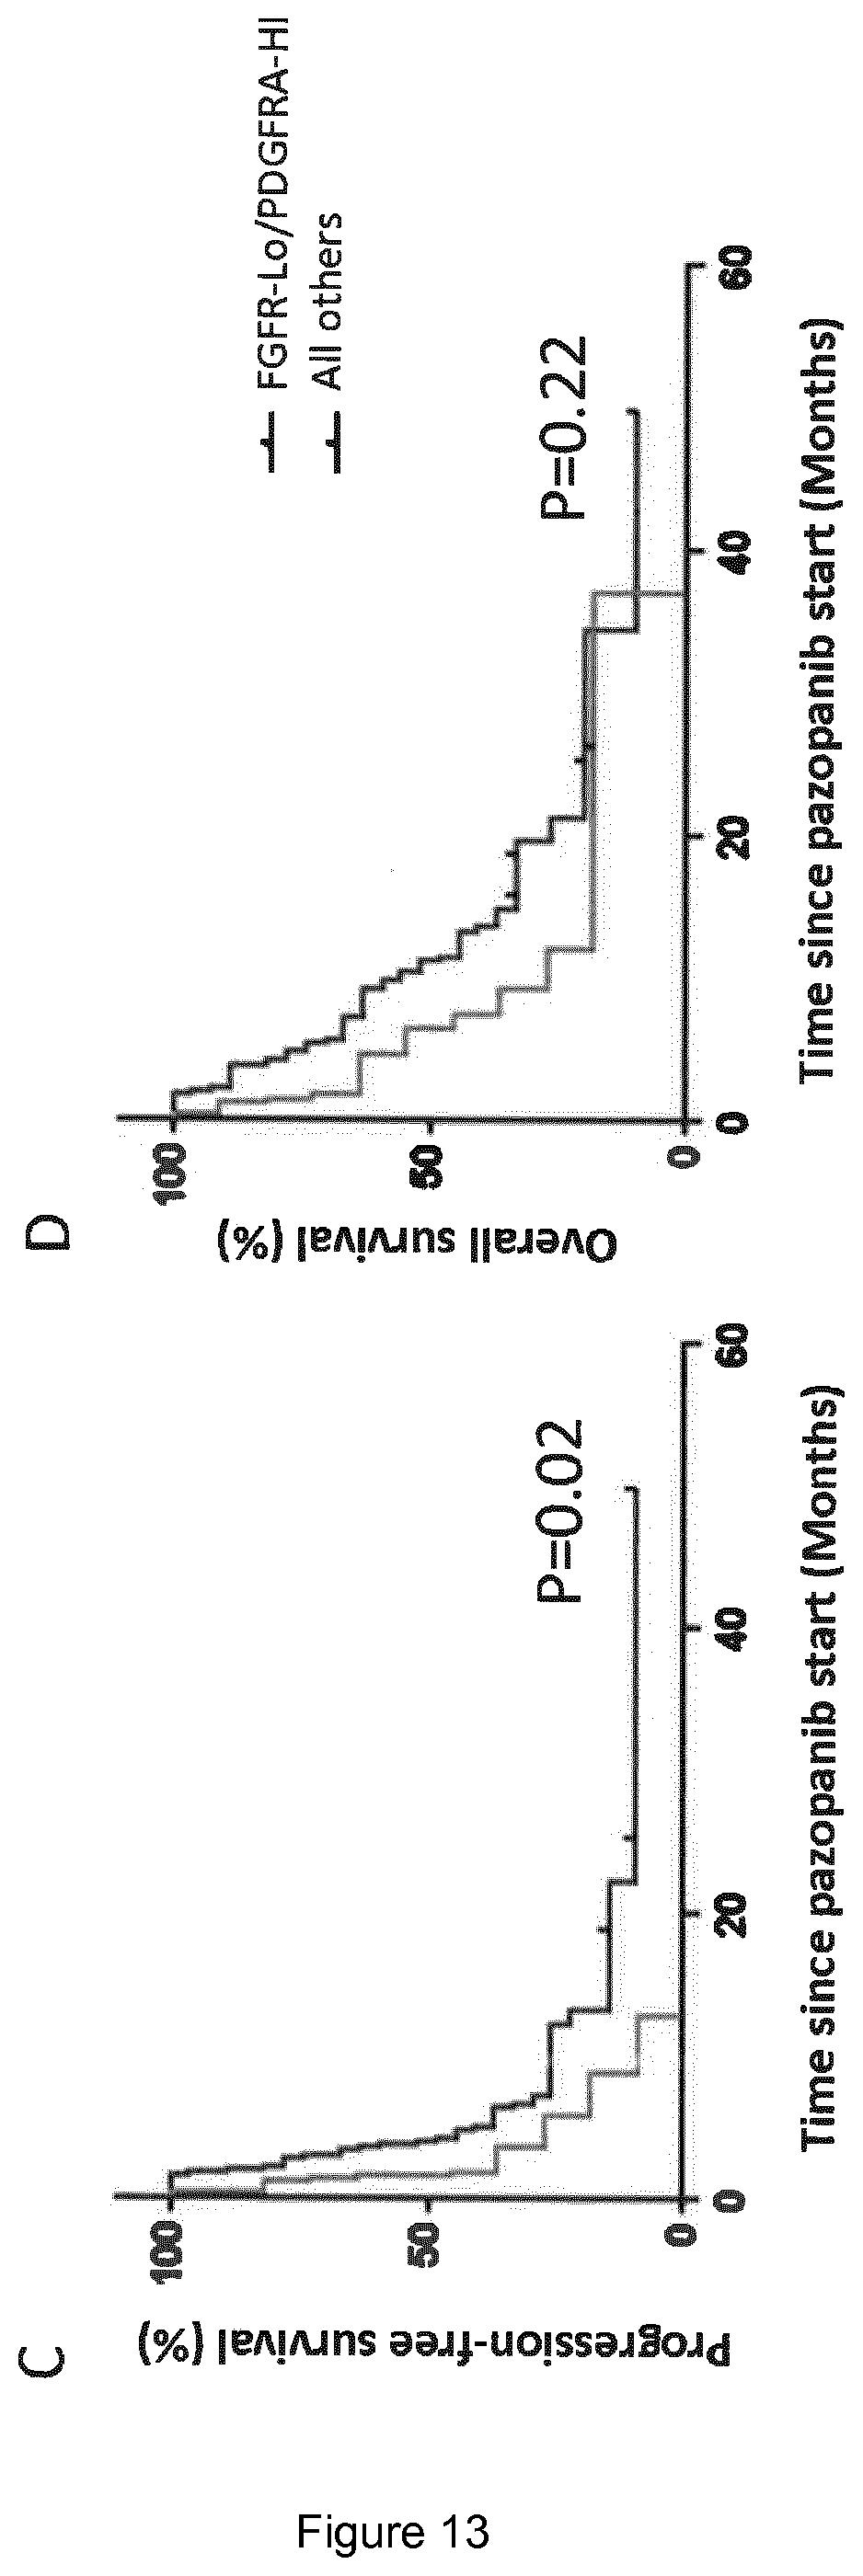
D00024
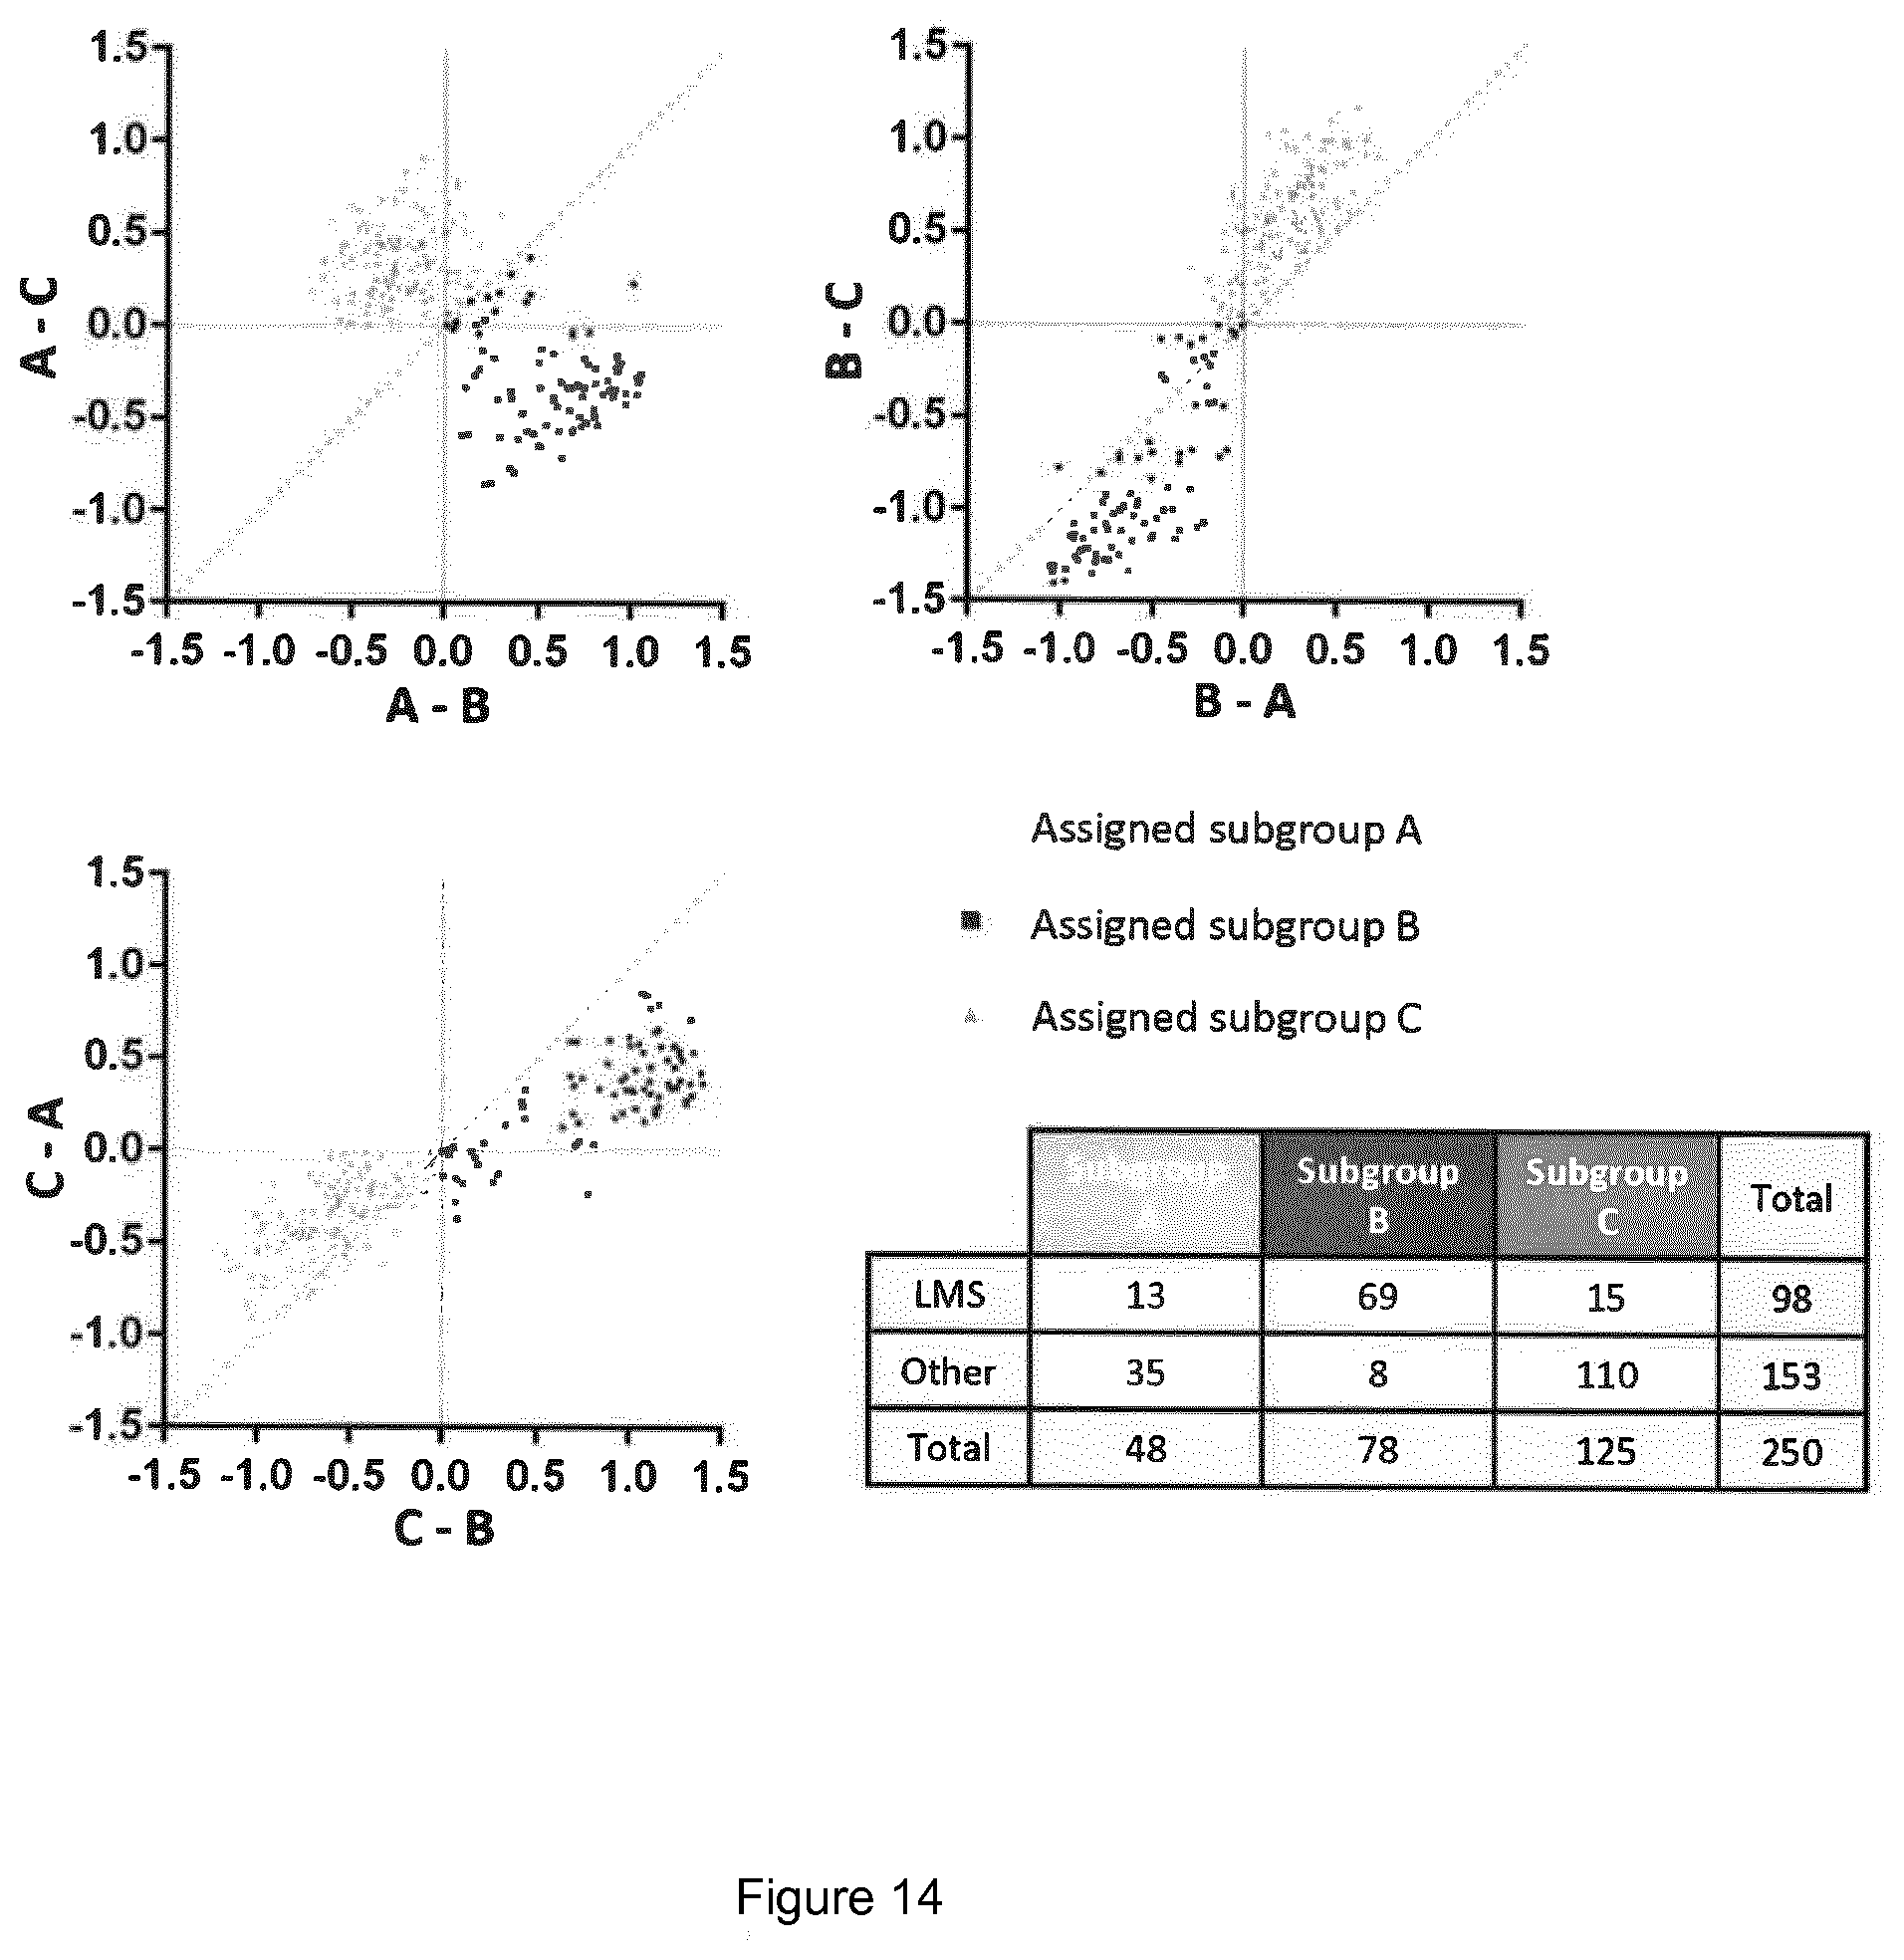
D00025

D00026
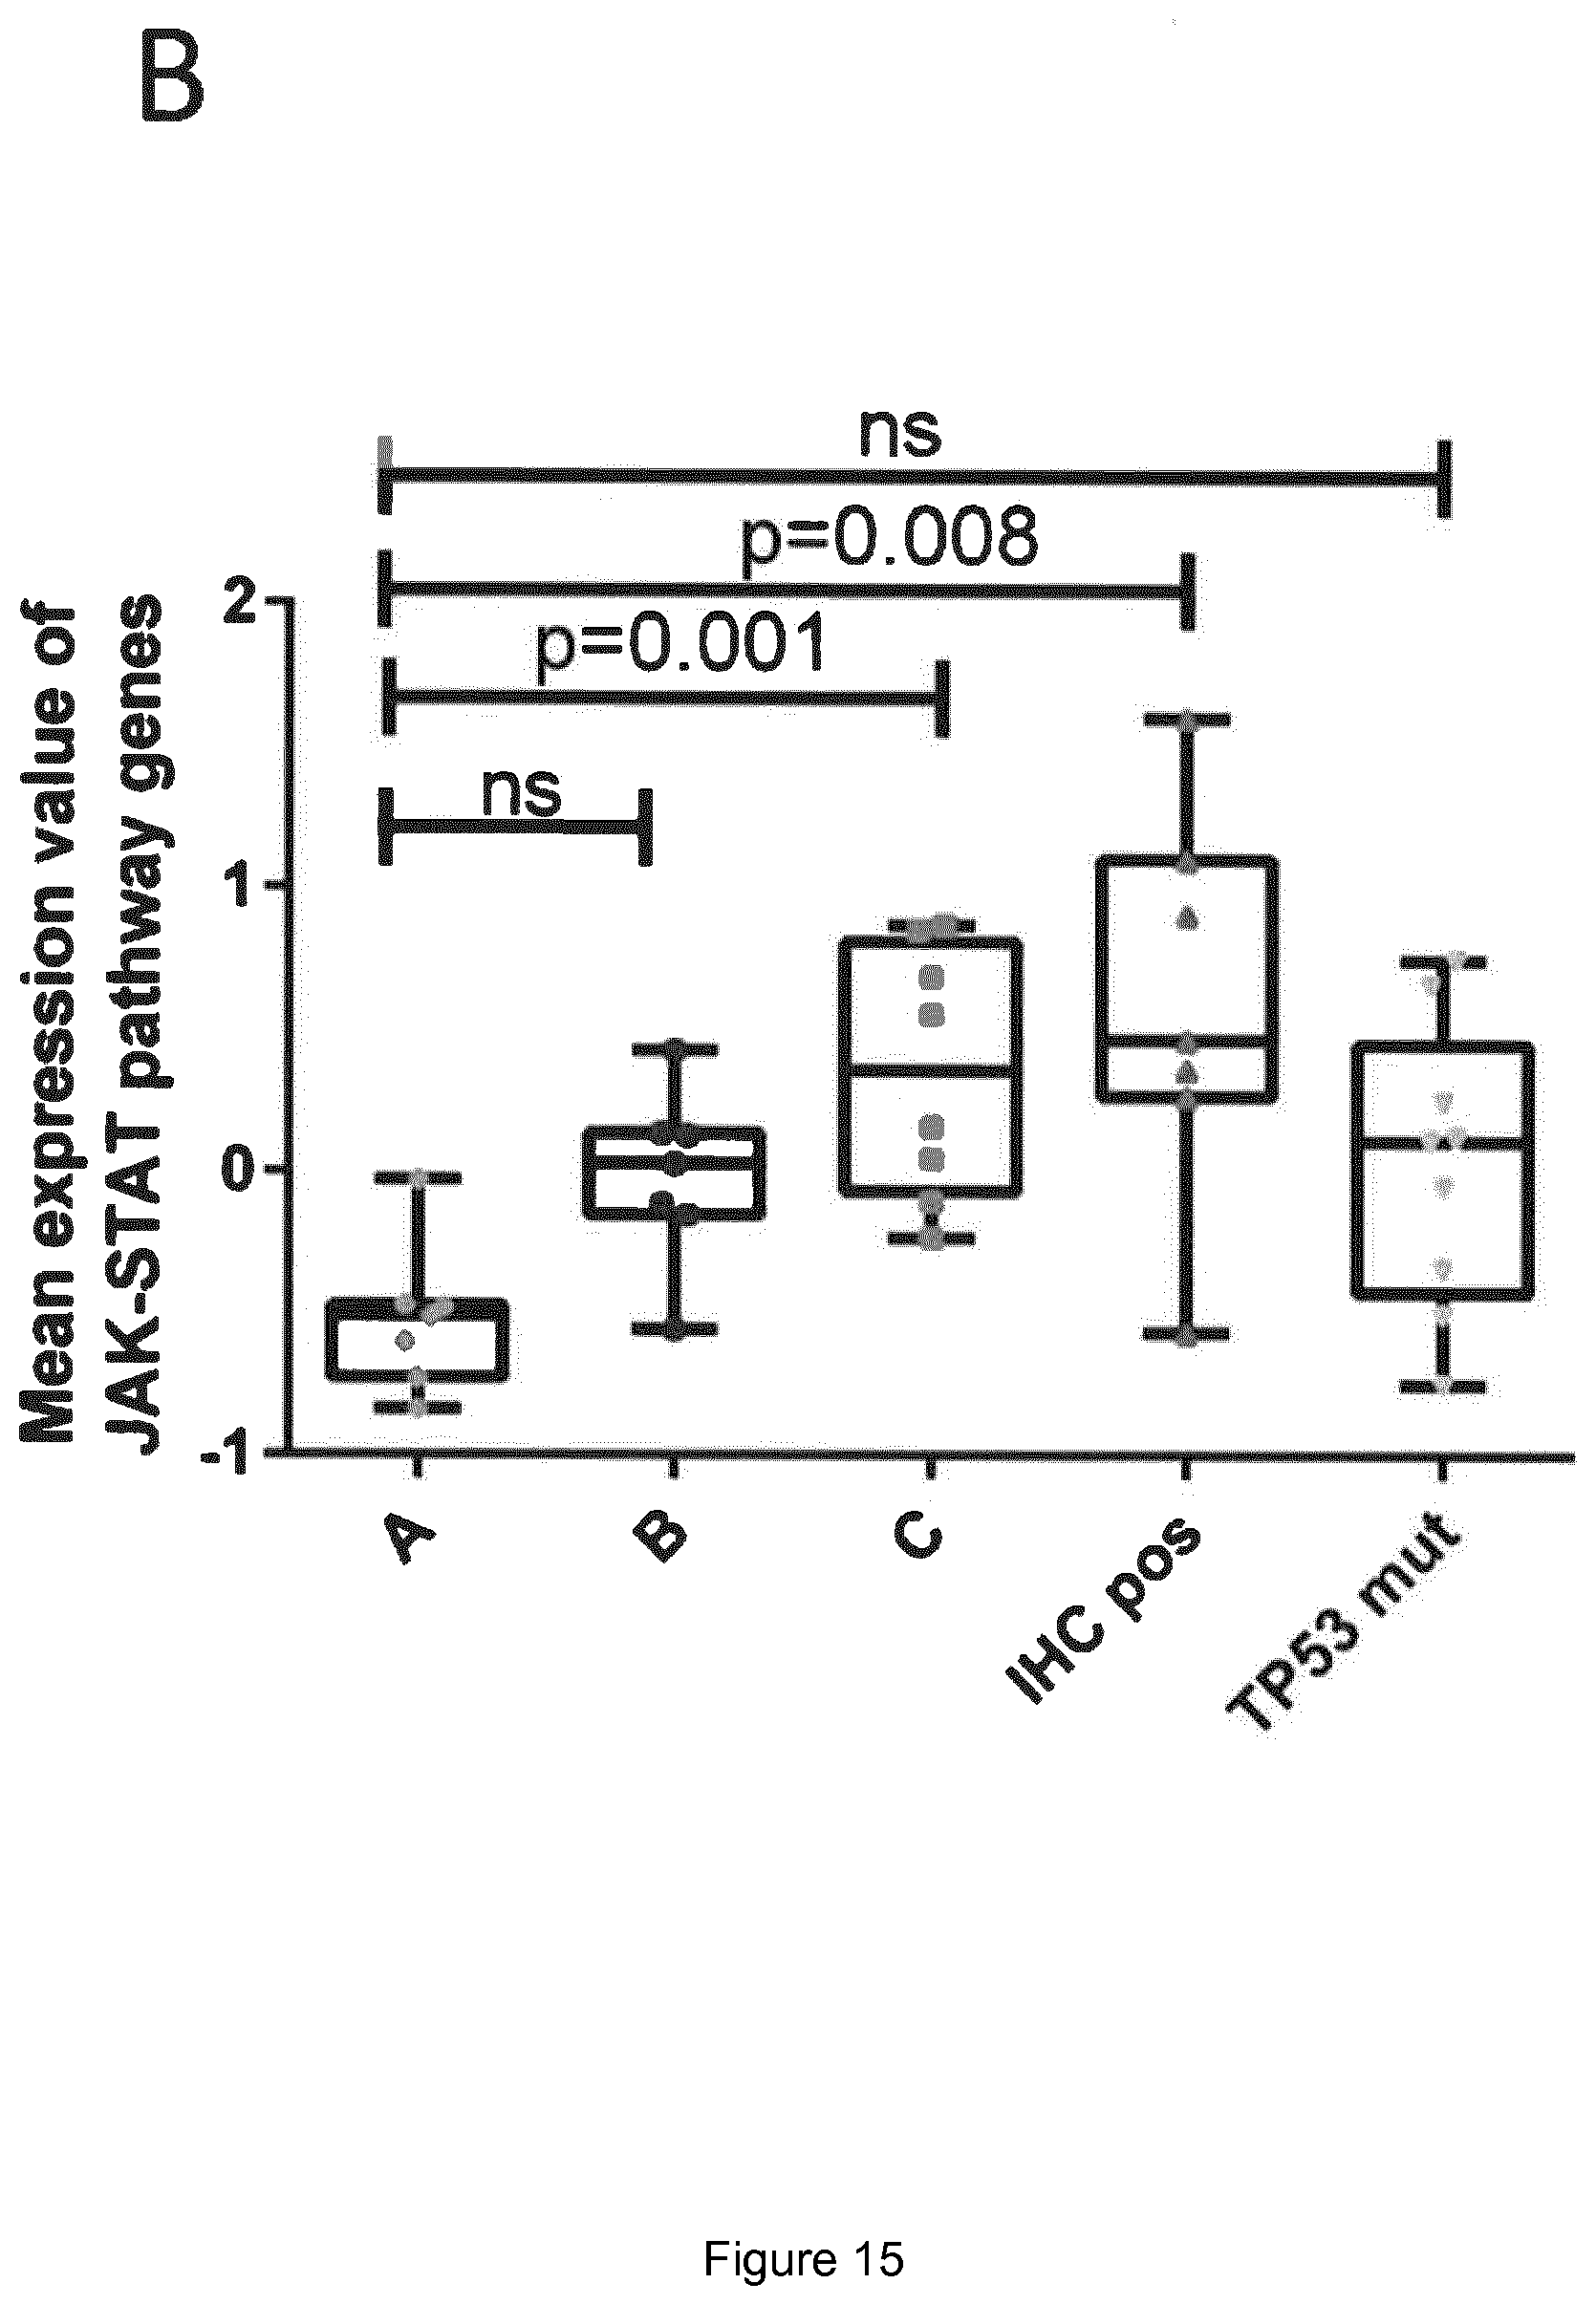
D00027

D00028

P00899

S00001
XML
uspto.report is an independent third-party trademark research tool that is not affiliated, endorsed, or sponsored by the United States Patent and Trademark Office (USPTO) or any other governmental organization. The information provided by uspto.report is based on publicly available data at the time of writing and is intended for informational purposes only.
While we strive to provide accurate and up-to-date information, we do not guarantee the accuracy, completeness, reliability, or suitability of the information displayed on this site. The use of this site is at your own risk. Any reliance you place on such information is therefore strictly at your own risk.
All official trademark data, including owner information, should be verified by visiting the official USPTO website at www.uspto.gov. This site is not intended to replace professional legal advice and should not be used as a substitute for consulting with a legal professional who is knowledgeable about trademark law.