Hm-3 Fusion Protein And Application Thereof
HUANG; Ruijing ; et al.
U.S. patent application number 16/768619 was filed with the patent office on 2021-01-14 for hm-3 fusion protein and application thereof. The applicant listed for this patent is TASLY BIOPHARMACEUTICALS CO., LTD.. Invention is credited to Xiaodan CAO, Yan CHEN, Baoqing FAN, Ruijing HUANG, Jian LI, Wenlei LI, Xiaohui MA, Pengyin WANG, Yibo WANG, Lihua ZHANG.
| Application Number | 20210009717 16/768619 |
| Document ID | / |
| Family ID | 1000005165207 |
| Filed Date | 2021-01-14 |


View All Diagrams
| United States Patent Application | 20210009717 |
| Kind Code | A1 |
| HUANG; Ruijing ; et al. | January 14, 2021 |
HM-3 FUSION PROTEIN AND APPLICATION THEREOF
Abstract
The present invention belongs to the technical field of biological pharmacy, and particularly relates to a long-acting HM-3 fusion protein molecule and an application thereof. In the present invention, on the basis of the sequence of HM-3 molecule, an active polypeptide HM-3 and derivatives thereof are linked to a human Fc (IgG) fragment or a fragment of an Fc (IgG) mutant directly or by a linker peptide (Linker), thus forming a novel molecular entity. The general formula of the molecular entity is (HM-3).sub.n-Linker-Fc(IgG), Fc(IgG)-Linker-(HM-3).sub.n, or (HM-3).sub.n-Linker-Fc(IgG)-Linker-(HM-3).sub.n. The fusion protein effectively prolongs the half-life of HM-3, is low in cost and overcomes the major problem of druggability of small peptides. Therefore, the fusion protein of the present invention may serve as a potential drug for the treatment of autoimmune diseases, neovascular diseases, osteoarthritis and the like.
| Inventors: | HUANG; Ruijing; (Shanghai, CN) ; FAN; Baoqing; (Shanghai, CN) ; LI; Jian; (Shanghai, CN) ; MA; Xiaohui; (Shanghai, CN) ; WANG; Yibo; (Shanghai, CN) ; ZHANG; Lihua; (Tianjin, CN) ; CAO; Xiaodan; (Shanghai, CN) ; LI; Wenlei; (Shanghai, CN) ; WANG; Pengyin; (Shanghai, CN) ; CHEN; Yan; (Shanghai, CN) | ||||||||||
| Applicant: |
|
||||||||||
|---|---|---|---|---|---|---|---|---|---|---|---|
| Family ID: | 1000005165207 | ||||||||||
| Appl. No.: | 16/768619 | ||||||||||
| Filed: | November 23, 2018 | ||||||||||
| PCT Filed: | November 23, 2018 | ||||||||||
| PCT NO: | PCT/CN2018/117188 | ||||||||||
| 371 Date: | September 23, 2020 |
| Current U.S. Class: | 1/1 |
| Current CPC Class: | C07K 2319/30 20130101; A61K 38/16 20130101; A61K 9/0019 20130101; A61K 9/0053 20130101; C07K 19/00 20130101 |
| International Class: | C07K 19/00 20060101 C07K019/00; A61K 9/00 20060101 A61K009/00; A61K 38/16 20060101 A61K038/16 |
Foreign Application Data
| Date | Code | Application Number |
|---|---|---|
| Dec 6, 2017 | CN | 201711273473.9 |
Claims
1.-10. (canceled)
11. A fusion protein, comprising an HM-3 and IgG-Fc, wherein the HM-3 is a polypeptide linked directly or by a Linker to an N-terminus and/or a C-terminus of the IgG-Fc, wherein the fusion protein consists of (HM-3).sub.n-Linker-IgG-Fc, IgG-Fc-Linker-(HM-3).sub.n, or (HM-3).sub.n-Linker-IgG-Fc-Linker-(HM-3).sub.n, wherein n is selected from 1, 2, 3, 4 or 5, and wherein the IgG-Fc is an IgG-Fc fragment comprising a human wild-type or mutant Fc sequence.
12. The fusion protein according to claim 1, wherein the Linker is a peptide sequence selected from the group consisting of {circle around (1)} (GGGGS).sub.a, wherein a is 1, 2, 3, 4, 5 or 6 (SEQ ID NO: 21); {circle around (2)} A(EAAAK).sub.bA, wherein b is 1, 2, 3, 4, 5 or 6 (SEQ ID NO: 22); {circle around (3)} (AP).sub.c, wherein c is 1 to 18 (SEQ ID NO: 23); and {circle around (4)} G.sub.d, wherein d is 1 to 15 (SEQ ID NO: 24).
13. The fusion protein according to claim 12, wherein the Linker is (GGGGS).sub.a, wherein a is 3, 4 or 5 (SEQ ID NO: 25).
14. The fusion protein according to claim 12, wherein the Linker is A(EAAAK).sub.bA, wherein b is selected from 3, 4, or 5 (SEQ ID NO: 22).
15. The fusion protein according to claim 12, wherein the Linker is G.sub.d, wherein d is 5 to 8 (SEQ ID NO: 24).
16. The fusion protein according to claim 1, wherein the IgG-Fc fragment comprises a human wild-type or mutant Fc of IgG1, IgG2, IgG3 or IgG4.
17. The fusion protein according to claim 1, wherein the IgG-Fc fragment comprises a human wild-type or mutant Fc sequence of IgG2 or IgG4.
18. The fusion protein according to claim 1, wherein fusion protein is selected from the group consisting of TABLE-US-00033 TSL-1: (SEQ ID NO: 9) HM-3-(GGGGS).sub.3-IgG2-Fc; TSL-2: (SEQ ID NO: 10) HM-3-(GGGGS).sub.3-mIgG4-Fc; TSL-3: (SEQ ID NO: 11) IgG2-Fc-(GGGGS).sub.3-HM-3; TSL-4: (SEQ ID NO: 12) mIgG4-Fc-(GGGGS).sub.3-HM-3; TSL-13: (SEQ ID NO: 15) HM-3-(GGGGS).sub.3-mIgG4-Fc-(GGGGS)3-HM-3; TSL-14: (SEQ ID NO: 16) HM-3-HyFc; TSL-15: (SEQ ID NO: 17) mIgG4-Fc-G5-HM-3-G8-HM-3; TSL-16: (SEQ ID NO: 18) HyFc-(GGGGS).sub.3-HM-3; TSL-17: (SEQ ID NO: 19) mIgG4-Fc-A(EAAAK).sub.4A-HM-3; and L-18: (SEQ ID NO: 20) mIgG4-Fc-(AP).sub.9-HM-3;
19. The fusion protein according to claim 18, wherein the fusion protein is TSL-1, TSL-2, TSL-3, or TSL-4.
20. The fusion protein according to claim 18, wherein the fusion protein is TSL-4.
21. The fusion protein according to claim 1, wherein the fusion protein is produced in yeast, CHO, SP2/0, BHK and/or HEK293 cells.
22. A pharmaceutical composition comprising the fusion protein according to claim 1.
23. The pharmaceutical composition according to claim 22, wherein the pharmaceutical composition is a dosage form selected from the group consisting of an injection, capsule, tablet, pill, nasal spray, and aerosol.
24. The pharmaceutical composition according to claim 22, wherein the pharmaceutical composition is administered by oral administration, intravenous injection, intravenous drip, subcutaneous injection, or intramuscular injection.
25. A method of treating a disease, comprising administration of a therapeutic amount of the pharmaceutical composition of claim 22, wherein the disease is an autoimmune disease, a neovascular disease, or osteoarthritis.
26. The method of claim 25, wherein the disease is an autoimmune disease, wherein the autoimmune disease is rheumatoid arthritis.
27. The method of claim 25, wherein the disease is an neovascular disease, wherein the neovascular disease is wet age-related macular degeneration.
28. A method of prolonging the half life of HM-3, comprising administration of the fusion protein of claim 11.
29. A method of prolonging the half life of HM-3, comprising administration of the fusion protein of claim 12.
30. A method of prolonging the half life of HM-3, comprising administration of the fusion protein of claim 18.
Description
CROSS-REFERENCE TO RELATED APPLICATIONS
[0001] This application is a U.S. national phase application under 35 USC 371 of PCT/CN2018/117188 filed Nov. 23, 2018, and claims priority to CN201711273473.9 filed Dec. 6, 2017, which are incorporated herein by reference in their entirety.
SEQUENCE LISTING
[0002] This application contains a Sequence Listing which has been submitted electronically in ASCII format and is hereby incorporated by reference in its entirety. Said ASCII copy, created on Mar. 24, 2020, is named 107244_000019_SL.txt and is 46,210 bytes in size.
TECHNICAL FIELD
[0003] The invention belongs to the technical field of biological pharmacy, and particularly relates to a long-acting HM-3 fusion protein molecule and an application thereof.
BACKGROUND ART
[0004] Autoimmune diseases refer to diseases caused by body's immunoreaction to autoantigen, resulting in tissue injury thereof. If autoimmune disease is not controlled effectively in time, it causes very serious consequences and even endangers lives. Common autoimmune diseases include: systemic lupus erythematosus, rheumatoid arthritis, sclerodenna, hyperthyroidism, juvenile diabetes, idiopathic thrombocytopenic purpura, autoimmune hemolytic anemia, ulcerative colitis, as well as a wide variety of skin diseases, autoimmune liver diseases, and the like.
[0005] Rheumatoid arthritis (RA) is a systemic chronic autoimmune disease characterized by joint synovitis. Persistent and recurrent episodes of synovitis may lead to the damage on articular cartilage and bones, joint dysfunction, and even disability. Vasculitis involves all organs of our body, so it is called rheumatoid disease.
[0006] Inflammatory autoimmune diseases represented by rheumatoid arthritis are high in morbidity and disability rate, and there are more than ten million patients in China; therefore, it is a kind of major diseases influencing human health and quality of life. TNF .alpha. inhibitors are mainstream biological agents in the treatment of rheumatoid arthritis at present; in 2013, the total sales of three TNF .alpha. inhibitors, namely, HUMIRA.RTM., ENBREL.RTM. and REMICADE.RTM. was $28.108 billion, occupying 84.58% of the total sales in the global market of rheumatoid arthritis. However, to achieve a better therapeutic effect, TNF inhibitors need to be used in combination with methotrexate, while some rheumatoid arthritis patients are intolerant to methotrexate, resulting in the failure of such combined therapy. In addition, clinical statistics indicate that about 30% to 40% of patients treated with the TNF.alpha. inhibitor combination treatment of TNF .alpha. inhibitors still do not response to the treatment regimen, which fails to achieve the major therapeutic indicator (20% symptom relief). Therefore, besides TNF .alpha. inhibitors, the major mainstream pharmaceuticals companies have actively studied other hot biological drug targets for the treatment of rheumatoid arthritis currently, such as, JAK inhibitors, interleukin inhibitors, inflammatory cell infiltration inhibitors, cyclophilins and integrin blockers. These drugs can supplement each other with TNF .alpha. inhibitors to provide a variety of pharmaceutical options for the patients suffering from different types of rheumatoid arthritis.
[0007] The so-called new blood vessel is a kind of spiral capillary newly protruding from a common blood vessel. New blood vessels may occur in human body under certain conditions, e.g., pregnancy and the like, and moreover, specific diseases may be caused by the occurrence of new blood vessels, and these diseases are collectively referred to as "neovascular diseases", such as cancers, wet macular degeneration. Wet macular degeneration, also known as neovascular macular degeneration, is clinically featured by the formation of choroidal neovascularization primarily.
[0008] Osteoarthritis is a kind of degenerative diseases, namely, injury of cartilago articularis degeneration, reactive hyperplasia of joint edge and subchondral bone caused by aging, obesity, strain, trauma, congenital abnormality of joint, joint deformity and many other factors. It is also known as osteoarthropathy, degenerative arthritis, senile arthritis, hypertrophic arthritis and so on. Osteoarthritis is clinically featured by slowly-developing joint pain, tenderness, stiffness, joint swelling, confined activity, joint deformities, etc.
[0009] HM-3 is a polypeptides of 18 amino acid residues containing an arginine-glycine-aspartic acid sequence (RGD sequence), and the amino acid sequence is as follows:
[0010] Ile-Val-Arg-Arg-Ala-Asp-Arg-Ala-Ala-Val-Pro-Gly-Gly-Gly-Gly-Arg-Gly- -Asp (SEQ ID NO: 3)
[0011] HM-3 has a known structure and has been disclosed in CN1314705C. HM-3 has high affinity to an integrin .alpha.v.beta.3 and inhibits the expression of VEGF and TNF.alpha. by blocking the signal pathway of integrin .alpha.v.beta.3, thus inhibiting endothelial cell migration and neovascularization, as well as inhibiting RA synovial hyperplasia thereby. Acute, subacute and chronic inflammation tests in mice body showed that: HM-3 could simultaneously inhibit angiogenesis and inflammatory reaction, regulate the content of VEGF and TNF.alpha. in synovial tissues of collagen-induced arthritis (CIA) DBA/1 mice to effectively relieve RA symptoms, and moreover, its therapeutic effect is better than methotrexate.
[0012] Although the HM-3 molecule has the advantages of clear efficacy and good safety, the in vivo half-life of the small peptide is only 27.66.+-.7.37 minutes; if the product is put into clinical use, it needs to administrate the drug for once or twice per day, greatly limiting its clinical application. In the art, modification or transformation of the molecular structure is a common method to solve the problems of short half-life and continuous administration, of which chemical modification is applied most extensively.
[0013] A polyethylene glycol (PEG)-modified HM-3: mPEG-SC-HM-3 has been disclosed in a Chinese patent application CN102417540A, and its half-life is much higher than HM-3.
[0014] However, there are various problems in PEG modification itself. PEG modification achieves the reduction of immunogenicity and extension of half-life by covering proteins, therefore, PEG modification is not suitable for all proteins. Namely, some proteins cannot be modified normally as the modification site is not exposed; some are covered on active sites, resulting in the activity decrease; after modified, some proteins change in conformation, resulting in decreased activity or easy aggregation. PEG-modified products must gradually expose drug proteins through the degradation of PEG molecules, but low molecular weight PEG has renal toxicity, and high molecular weight PEG has unclear degradation mechanism in vivo, which brings obvious administration risks to PEG-modified drugs. In addition, as PEG modification relates to a complex protein process and the length of PEG molecules is different to make the molecular weight of PEG-modified products not uniform, which drops the uniformity of finished products while increasing the production cost, bringing difficulties to industrialization.
[0015] The invention provides an HM-3-Fc fusion protein and application thereof, so as to overcome the problems of short in vivo half-life of HM-3 protein, high synthesis cost of polypeptide, unsuitability for industrial production and the like.
SUMMARY OF THE INVENTION
[0016] Based upon the present invention, HM-3 and Fc are prepared into a fusion protein to prolong the half-life of HM-3 and improve pharmaceutical activity. It is found in the present invention that the fusion protein shows higher biological activity and stability in vivo and in vitro, and can remarkably inhibit inflammatory reaction; relieve the symptoms of autoimmune diseases, neovascular diseases and osteoarthritis as well as has a long-acting plasma half-life period.
[0017] For this purpose, the present invention discloses an HM-3-Fc fusion protein formed by linking an active polypeptide HM-3 to a human IgG-Fc fragment or an IgG-Fc mutant fragment.
[0018] The fusion protein of the present invention is prepared by linking HM-3 to a human IgG-Fc fragment or a mutant of the IgG-Fc fragment via a C-terminal or an N-terminal or C-terminal and N-terminal simultaneously, and the ligation may be achieved by a Linker peptide.
[0019] The fusion protein of the present invention may be described by the following structures:
(HM-3).sub.n-Linker-IgG-Fc,
IgG-Fc-Linker-(HM-3).sub.n,
or
(HM-3).sub.n-Linker-IgG-Fc-Linker-(HM-3).sub.n;
wherein n is selected from 1, 2, 3, 4 or 5, wherein Linker represents a linker peptide, and the linker peptide is selected from:
[0020] {circle around (1)} (GGGGS).sub.a, where a is 1, 2, 3, 4, 5 or 6 (SEQ ID NO: 21);
[0021] {circle around (2)} A (EAAAK).sub.b A, where b is 1, 2, 3, 4, 5 or 6 (SEQ ID NO: 22);
[0022] {circle around (3)} (AP).sub.c, where c is 1 to 18 (SEQ ID NO: 23);
[0023] {circle around (4)} G.sub.d, where d is 1 to 15 (SEQ ID NO: 24); and
wherein, preferably, the Linker peptide is the sequence of (GGGGS).sub.a, and the repeat number a is preferably 3, 4 or 5 (SEQ ID NO: 25).
[0024] The IgG-Fc is a human Fc fragment of IgG1, IgG2, IgG3 or IgG4 or its mutant fragment; preferably, is Fc of IgG2 or IgG4 or its mutant, and most preferably it is a mutant mIgG4-Fc.
[0025] The fusion protein of the present invention is preferably selected from proteins consisting of the following sequences:
TABLE-US-00001 TSL-1: (SEQ ID NO: 9) HM-3-(GGGGS).sub.3-IgG2-Fc; TSL-2: (SEQ ID NO: 10) HM-3-(GGGGS).sub.3-mIgG4-Fc; TSL-3: (SEQ ID NO: 11) IgG2-Fc-(GGGGS).sub.3-HM-3; TSL-4: (SEQ ID NO: 12) mIgG4-Fc-(GGGGS).sub.3-HM-3; TSL-5: (SEQ ID NO: 13) HM-3-(GGGGS).sub.3-IgG4-Fc; TSL-6: (SEQ ID NO: 14) IgG4-Fc-(GGGGS).sub.3-HM-3; TSL-13: (SEQ ID NO: 15) H14-3-(GGGGS).sub.3-mIgG4-Fc-(GGGGS).sub.3-HM-3; TSL-14: (SEQ ID NO: 16) HM-3-HyFc; TSL-15: (SEQ ID NO: 17) mIgG4-Fc-G5-HM-3-G8-HM-3; TSL-16: (SEQ ID NO: 18) HyFc-(GGGGS).sub.3-HM-3; TSL-17: (SEQ ID NO: 19) mIgG4-Fc-A(EAAAK).sub.4A-HM-3; and TSL-18: (SEQ ID NO: 20) mIgG4-Fc-(AP).sub.9-HM-3;
[0026] The fusion protein of the present invention may be prepared by synthesis, and the synthesis is to link HM-3 polypeptide to a Linker via a covalent bond, and then to link another end of the Linker with IgG-Fc.
[0027] The fusion protein may also be obtained by gene recombination, such as it is expressed by yeast, CHO, SP2/0, BHK and/or HEK 293 cells; preferably, it is expressed by CHO cells and/or HEK 293 cells.
[0028] The fusion protein of the present invention may increase the action time of drugs in vivo, thus prolonging the half-life, and improving adaptability and compliance of patients.
[0029] The present invention further provides a pharmaceutical composition containing the fusion protein of the present invention, which exists in a suitable dosage form; the dosage form is selected from the group consisting of injections, capsules, tablets, pills, nasal sprays, or aerosols; and the mode of administration includes oral administration, intravenous injection, intravenous drip, subcutaneous or intramuscular injection.
[0030] The present invention further provides an application of the fusion protein of the present invention in the preparation of drugs for the treatment of autoimmune disease. Preferably, the autoimmune disease is rheumatoid arthritis and has pharmacokinetic characteristics.
[0031] The invention further provides an application of the fusion protein of the present invention in the preparation of drugs for the treatment of neovascular diseases. Preferably, the neovascular diseases are wet age-related macular degeneration and tumor metastasis.
[0032] The fusion protein of the present invention may serve as an ophthalmic drug, and it has pharmacokinetic characteristics in eyes, especially in aqueous humor and vitreous body.
[0033] The present invention further provides an application of the fusion protein of the present invention in the preparation of drugs for the treatment of osteoarthritis.
[0034] The fusion protein of the present invention may play a protective role on chondrocytes to prevent and treat osteoarthritis via pathological alteration of chondrocytes, and meanwhile, the fusion protein has a pharmacokinetic characteristic.
[0035] A DNA molecule encoding the fusion protein is firstly synthesized when the fusion protein of the present invention is prepared by gene recombination, and nucleotide sequence of the DNA is preferably the sequence of Sequence Listing 1.
[0036] In the present invention, when gene recombination is used for preparation, the synthesized DNA molecule is prepared into a recombinant expression vector through a plasmid, preferably a mammalian cell expression vector, e.g., pcDNA3.4 (INVITROGEN).
[0037] The present invention is further to transfect the expression vector into a host cell, preferably a mammalian expression cell, more preferably a HEK 293 cell, a CHO cell. The host cells are expressed and cultured to separate the fusion protein of the present invention from a cell culture fluid, and the fusion protein is purified and separated to obtain the fusion protein of the present invention. Therefore, the present invention further provides a purification process of the fusion protein of the present invention, preferably, it is purified by Protein A or Protein G affinity chromatography.
BRIEF DESCRIPTION OF THE DRAWINGS
[0038] FIG. 1 shows affinity capture map of a TSL-4 protein.
[0039] FIG. 2 shows further separation and purification of the TSL-4 protein.
[0040] FIG. 3 shows electrophoretogram with a batch 20160308.
[0041] FIG. 4 shows HPLC-SEC with a batch 20160308.
[0042] FIG. 5 shows electrophoretogram of TSL-5 and TSL-6 after being purified.
[0043] FIG. 6A shows a comparison diagram of the inhibitory effect on splenic lymphocyte proliferation of TSL-1 fusion protein in mice.
[0044] FIG. 6B shows a comparison diagram of the inhibitory effect on splenic lymphocyte proliferation of TSL-2 fusion protein in mice.
[0045] FIG. 6C shows a comparison diagram of the inhibitory effect on splenic lymphocyte proliferation of TSL-3 fusion protein in mice.
[0046] FIG. 6D shows a comparison diagram of the inhibitory effect on splenic lymphocyte proliferation of TSL-4 fusion protein in mice.
[0047] FIG. 7A shows a comparison diagram of the inhibitory effect on splenic lymphocyte proliferation of TSL-13 fusion protein in mice.
[0048] FIG. 7B shows a comparison diagram of the inhibitory effect on splenic lymphocyte proliferation of TSL-14 fusion protein in mice.
[0049] FIG. 7C shows a comparison diagram of the inhibitory effect on splenic lymphocyte proliferation of TSL-15 fusion protein in mice.
[0050] FIG. 7D shows a comparison diagram of the inhibitory effect on splenic lymphocyte proliferation of TSL-16 fusion protein in mice.
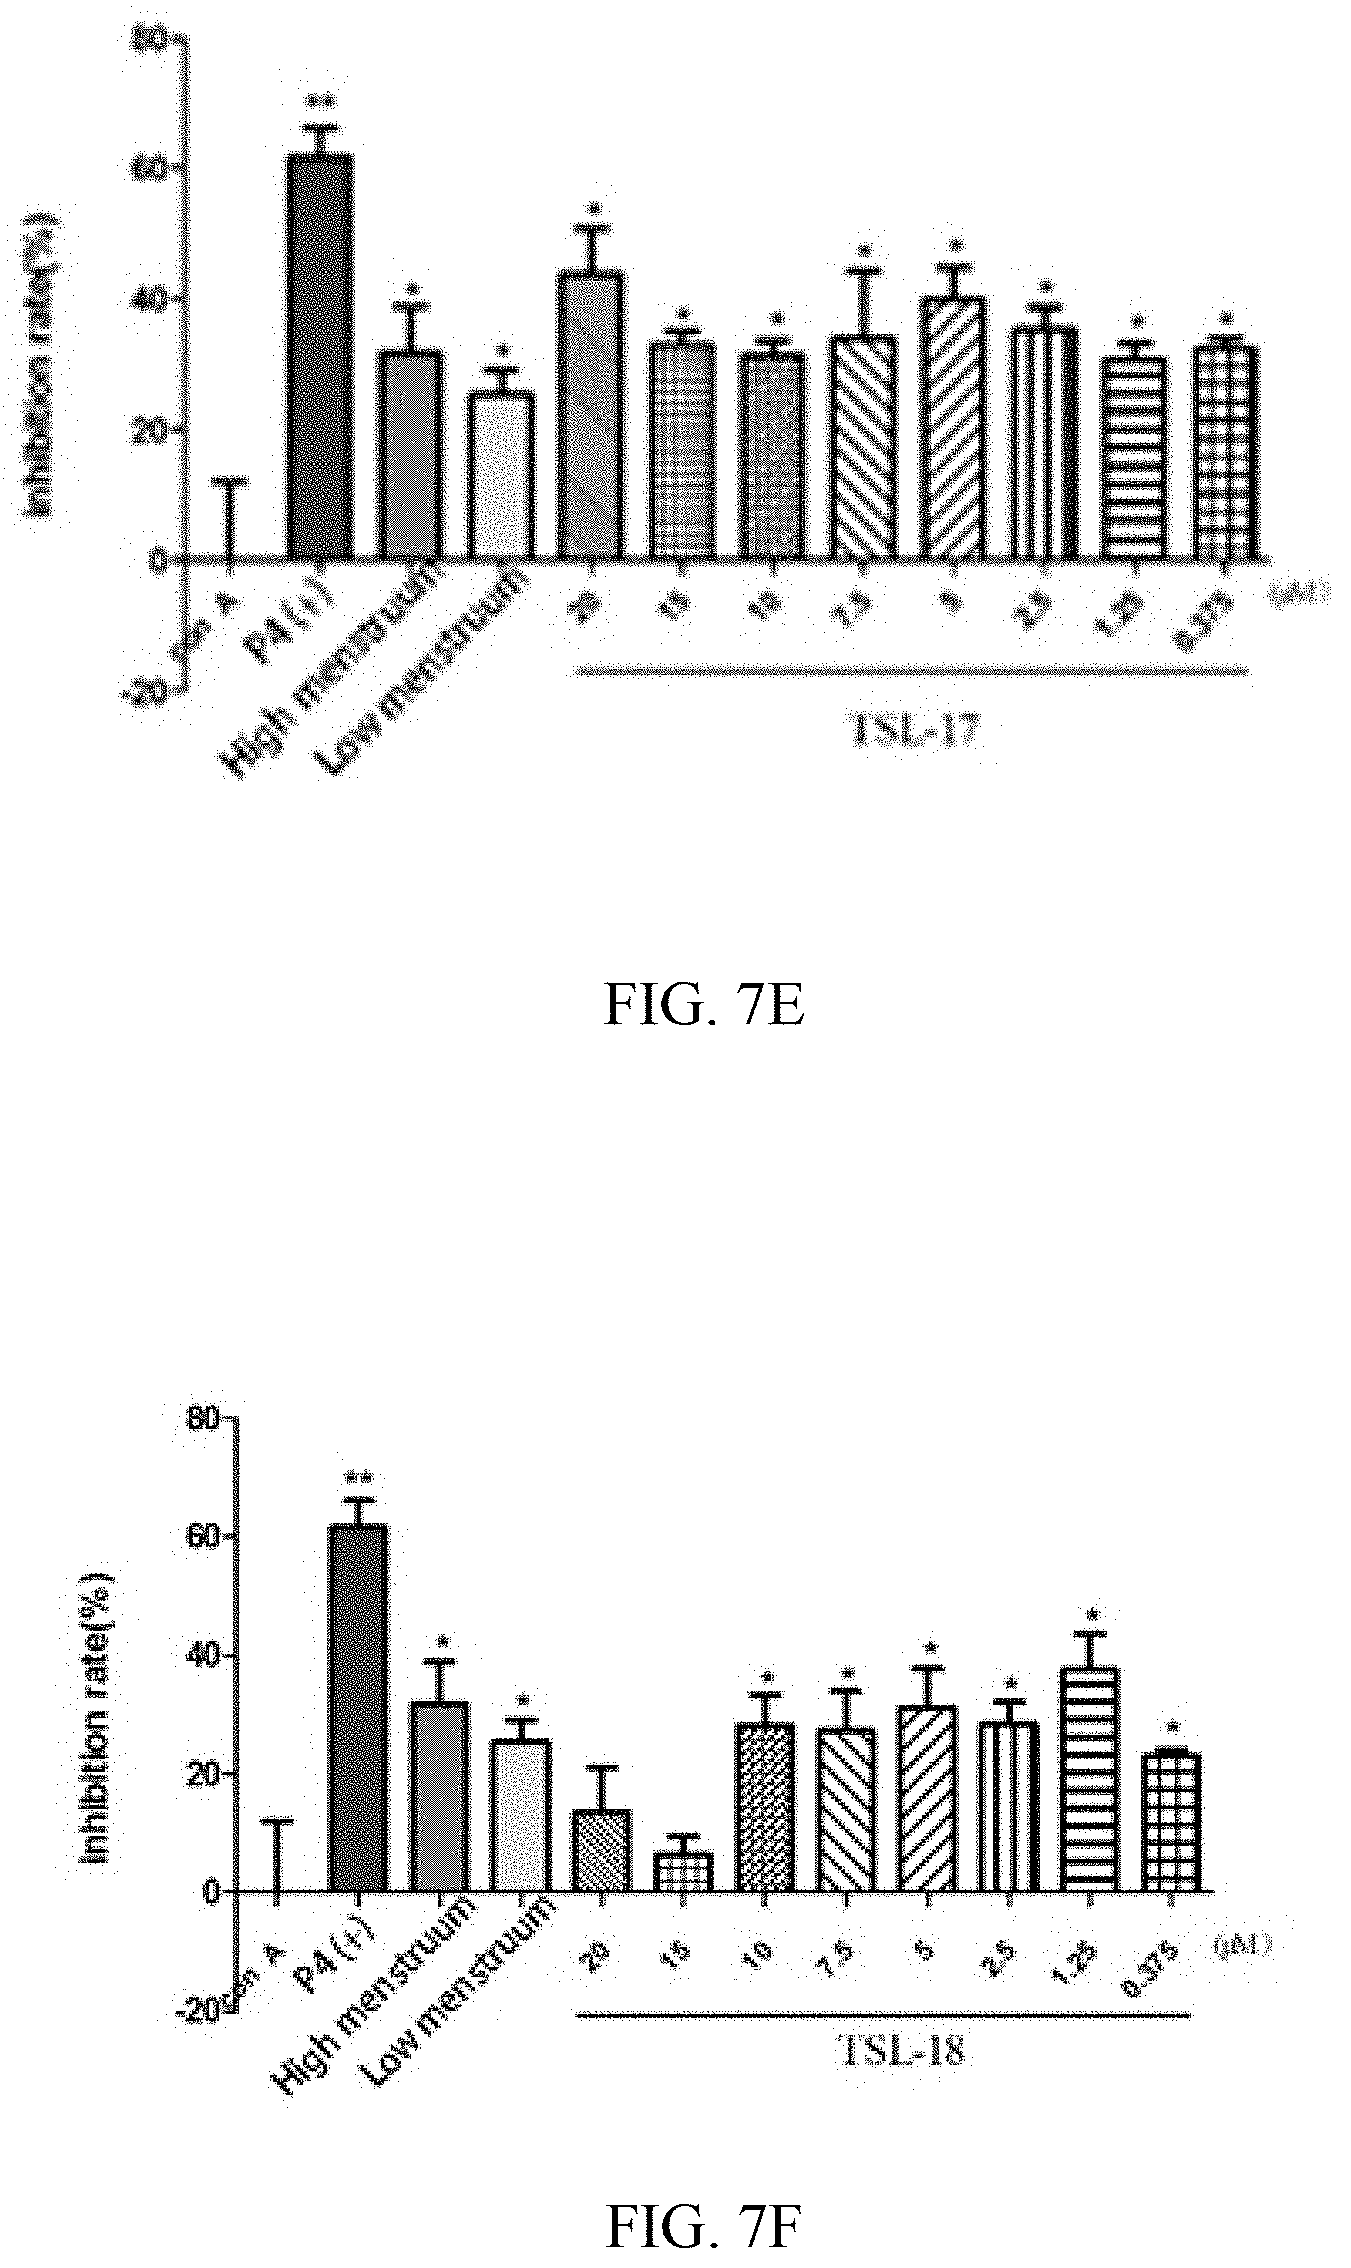
[0051] FIG. 7E shows a comparison diagram of the inhibitory effect on splenic lymphocyte proliferation of TSL-17 fusion protein in mice.
[0052] FIG. 7F shows a comparison diagram of the inhibitory effect on splenic lymphocyte proliferation of TSL-18 fusion protein in mice.
[0053] FIG. 8A shows a comparison diagram of the inhibitory effect on splenic lymphocyte proliferation of TSL-1 fusion protein in mice.
[0054] FIG. 8B shows a comparison diagram of the inhibitory effect on splenic lymphocyte proliferation of TSL-2 fusion protein in mice.
[0055] FIG. 8C shows a comparison diagram of the inhibitory effect on splenic lymphocyte proliferation of TSL-3 fusion protein in mice.
[0056] FIG. 8D shows a comparison diagram of the inhibitory effect on splenic lymphocyte proliferation of TSL-4 fusion protein in mice.
[0057] FIG. 8E shows a comparison diagram of the inhibitory effect on splenic lymphocyte proliferation of TSL-14 fusion protein in mice.
[0058] FIG. 8F shows a comparison diagram of the inhibitory effect on splenic lymphocyte proliferation of TSL-16 fusion protein in mice.
[0059] FIG. 9A shows a comparison diagram of the inhibition effect on splenic lymphocyte proliferation of Linker fusion protein TSL-4 in mice.
[0060] FIG. 9B shows a comparison diagram of the inhibition effect on splenic lymphocyte proliferation of Linker fusion protein TSL-17 in mice.
[0061] FIG. 9C shows a comparison diagram of the inhibition effect on splenic lymphocyte proliferation of Linker fusion protein TSL-18 in mice.
[0062] FIG. 10A shows a comparison diagram of the inhibitory effect on splenic lymphocyte proliferation of TLS-2 fusion protein in mice containing HM-3.
[0063] FIG. 10B shows a comparison diagram of the inhibitory effect on splenic lymphocyte proliferation of TLS-4 fusion protein in mice containing HM-3.
[0064] FIG. 10C shows a comparison diagram of the inhibitory effect on splenic lymphocyte proliferation of TLS-13 fusion protein in mice containing HM-3.
[0065] FIG. 10D shows a comparison diagram of the inhibitory effect on splenic lymphocyte proliferation of TLS-15 fusion protein in mice containing HM-3.
[0066] FIG. 11A shows a comparison diagram of the inhibiting effect of TSL-1 fusion protein on an inflammatory factor TNF-.alpha. production by human macrophage U937.
[0067] FIG. 11B shows a comparison diagram of the inhibiting effect of TSL-2 fusion protein on TNF-.alpha. production by human macrophage U937.
[0068] FIG. 11C shows a comparison diagram of the inhibiting effect of TSL-3 fusion protein on TNF-.alpha. production by human macrophage U937.
[0069] FIG. 11D shows a comparison diagram of the inhibiting effect of TSL-4 fusion protein on TNF-.alpha. production by human macrophage U937.
[0070] FIG. 11E shows a comparison diagram of the inhibiting effect of HM-3, mPEG-SC-HM-3, and mPEG-Sc-HM-3 on TNF-.alpha. production by human macrophage U937.
[0071] FIG. 12 shows a comparison diagram of inhibition ratio of TSL-1-4 fusion proteins on the angiopoiesis of zebra fish.
[0072] FIG. 13A is a diagram showing the influence of TSL-4 on weight of type-II CIA mice after 30-60 days.
[0073] FIG. 13B is a diagram showing the influence of TSL-4 on weight of type-II CIA mice after 60 days.
[0074] FIG. 14A is a diagram showing the influence of TSL-4 on sole thickness of type-II CIA mice after 30-60 days.
[0075] FIG. 14B is a diagram showing the influence of TSL-4 on sole thickness of type-II CIA mice after 60 days.
[0076] FIG. 15A is a diagram showing the influence of TSL-4 on ankle width of type-II CIA mice after 30-60 days.
[0077] FIG. 15B is a diagram showing the influence of TSL-4 on ankle width of type-II CIA mice after. 60 days
[0078] FIG. 16A is a diagram showing the influence of TSL-4 on paw circumference of type-II CIA mice after 30-60 days.
[0079] FIG. 16B is a diagram showing the influence of TSL-4 on paw circumference of type-II CIA mice after 60 days.
[0080] FIG. 17A is a diagram showing the influence of TSL-4 on arthritis scoring of type-II CIA mice after 30-60 days.
[0081] FIG. 17B is a diagram showing the influence of TSL-4 on arthritis scoring of type-II CIA mice after 60 days.
[0082] FIG. 18A is a diagram showing the influence of TSL-4 on spleen weight of type-II CIA mice.
[0083] FIG. 18B is a diagram showing the influence of TSL-4 on thymus weight of type-II CIA mice.
[0084] FIG. 19 is a diagram showing the influence of TSL-4 on paw weight of type-II CIA mice.
[0085] FIG. 20 shows a plasma concentration time curve after receiving 12.5 mg/kg TSL-4 via single subcutaneous injection.
[0086] FIG. 21 shows a plasma concentration time curve after receiving 37.5 mg/kg TSL-4 via single subcutaneous injection.
[0087] FIG. 22 shows a plasma concentration time curve after receiving 4.17 mg/kg TSL-4 via single subcutaneous injection.
[0088] FIG. 23 shows a mean plasma concentration time curve after receiving different doses of TSL-4 via single subcutaneous injection in rats.
[0089] FIG. 24 shows a relation graph between TSL-4 peak concentration (Cmax) and dose administered.
[0090] FIG. 25 shows a relation graph between AUC and dose administered.
[0091] FIG. 26 shows a PET/CT scanning radioactivity uptake image of arthritis model rats after receiving 89Zr-HM-3 via subcutaneous injection at 6 time points.
[0092] FIG. 27 shows a scanning radioactivity uptake image of arthritis model rats after receiving 89Zr-HM-3 via subcutaneous injection at 48 h and 120 h.
[0093] FIG. 28 shows a radioactivity uptake image of arthritis model rats after receiving 89Zr-HM-3 on left ankle joints via subcutaneous injection at 6 time points.
[0094] FIG. 29 shows a tissue radioactivity image of arthritis model rats after receiving 89Zr-HM-3 via subcutaneous injection collected at 48 h and 120 h.
DETAILED DESCRIPTION OF THE INVENTION
[0095] The present invention is further described by the following embodiments.
Embodiment 1 Molecular Design of HM-3 Fusion Protein
[0096] HM-3-Fc fusion protein consists of three parts, including an active part HM-3 polypeptide, a linker and a human IgG-Fc fragment or IgG-Fc mutant fragment; the specific design method includes the following steps:
[0097] 1. Selection of an Fc Fragment
[0098] Due to the difference of heavy chains, the human IgG antibody is divided into four subtypes, namely IgG1, IgG2, IgG3 and IgG4. The existing research results have shown that the four subtypes have different plasma half-life, cytotoxicity and other characteristics (as shown in Table 1) and are directly related to the Fc fragment. IgG3 has the shortest half-life in vivo, and its Fc fragment is not too suitable as a molecular chaperone to prolong the in vivo half-life of a target protein, so IgG3 is firstly excluded by the test. Affinity of the Fc fragment to complements and Fc receptors determines the capacity of antibody-dependent cellular cytotoxicity (ADCC effect) and complement-dependent cytotoxicity (CDC effect). IgG1 and IgG3 have the strongest ADCC and CDC effects, and it is determined by tests that IgG1 and IgG3 are not suitable to be constructed as a fusion protein with healthy cells as target spots. Therefore, Fc fragments of IgG1 and IgG3 were excluded after being screened.
[0099] Based on the fact that the developed indication is an autoimmune disease, the target is a normal somatic cell, the need to inhibit the signaling pathway only and to prolong in vivo half-life as far as possible, it requires a fragment with low or no ADCC effect and CDC effect, and accordingly, the Fc fragment of IgG2 or IgG4 is more suitably selected for the Fc fragment of the HM-3 fusion protein. To further improve characteristics of the natural Fc fragment, Fc fragment mutants of IgG2 and IgG4 are also extensively considered within the screening range of the present invention.
TABLE-US-00002 TABLE 1 Comparison of properties of four IgG subtypes Property IgG1 IgG2 IgG3 IgG4 Heavy chain and molecular weight .gamma.1 (52) .gamma.2 (52) .gamma.3 (58) .gamma.4 (52) (kDa) Monomer molecular weight (kD) 146 146 170 146 Number of amino acids in hinge 15 12 62 12 region Half-life in blood plasma (day) 21~23 21~23 7~8 21~23 Complement fixing ++ + +++ - Binding to FcR: Fc.gamma.RI +++ - +++ + Fc.gamma.RH +++ + +++ + Fc.gamma.RHI ++ - ++ - Binding to SPA + + + - Passing through placenta ++ + ++ ++
[0100] 2. Selection of Linker
[0101] Linker is a polypeptide chain to link functional and chaperone proteins; the Linker's sequence and length are crucial to the functions of fusion protein. The choice of Linker needs to consider the following aspects:
[0102] 1) The length should be moderate, too short to guarantee the relative independence between proteins in the space. Too long may increase the risk of Linker rupture and cause immunogenicity; 2) Linker's sequence cannot contain protein enzyme cutting sites so as to avoid being cut off; 3) Linker may be a natural or artificial Linker; 4) Linker may be divided into a rigid Linker and a flexible Linker.
[0103] Through a large number of experiments, four artificially-designed Linkers were selected as verification alternatives in the present invention: [0104] a. (GGGGS).sub.n, is the most widely used flexible Linker, where a may be 1, 2, 3, 4, 5, or 6 (SEQ ID NO: 21); [0105] b. A (EAAAK).sub.bA, is an .alpha.-spiral rigid Linker, where b may be 1, 2, 3, 4, 5 or 6 (SEQ ID NO: 22); [0106] c. (AP).sub.c, is a linear rigid Linker, where c may be 1 to 18 (SEQ ID NO: 23); [0107] d. G.sub.d (SEQ ID NO: 24), is a flexible Linker analogous to (GGGGS).sub.n (SEQ ID NO: 28), where d may be from 1 to 15.
[0108] 3. Fusion Sequence of HM-3 and Fc Fragment
[0109] Due to the unique direction of amino acid sequence, there are two modes of linking the fusion of two proteins, and N-terminal ligation is to the attachment of a functional protein to the N-terminal of the Fc fragment, and C-terminal ligation is to the attachment of a functional protein to a C-terminal of the Fc fragment.
[0110] 4. Structure Design for Alternative Fusion Proteins
[0111] Combined with the factors for the design of the fusion protein, at least more than 300 fusion protein structures may be generated, so it is impractical to express the structures and verify their efficacy one by one. Therefore, from the angle of single factor comparison, the most common (GGGGS) 3 Linker (SEQ ID NO: 26) is preferred, and the following six molecules were designed:
TABLE-US-00003 TSL-1: (SEQ ID NO: 9) HM-3-(GGGGS).sub.3-IgG2-Fc; TSL-2: (SEQ ID NO: 10) HM-3-(GGGGS).sub.3-mIgG4-Fc; TSL-3: (SEQ ID NO: 11) IgG2-Fc-(GGGGS).sub.3-HM-3; TSL-4: (SEQ ID NO: 12) mIgG4-Fc-(GGGGS).sub.3-HM-3; TSL-5: (SEQ ID NO: 13) HM-3-(GGGGS).sub.3-IgG4-Fc; TSL-6: (SEQ ID NO: 14) IgG4-Fc-(GGGGS).sub.3-HM-3;
and
[0112] Afterwards, on the basis of the six structures mentioned above, 6 new fusion protein structures were formed by replacing a single factor and introducing multiple design ideas, such as HyFc, rigid Linker and overlapping peptide:
TABLE-US-00004 TSL-13: (SEQ ID NO: 15) HM-3-(GGGGS).sub.3-mIgG4-Fc-(GGGGS)3-HM-3; TSL-14: (SEQ ID NO: 16) HM-3-HyFc; TSL-15: (SEQ ID NO: 17) mIgG4-Fc-G5-HM-3-G8-HM-3; TSL-16: (SEQ ID NO: 18) HyFc-(GGGGS).sub.3-HM-3; TSL-17: (SEQ ID NO: 19) mIgG4-Fc-A(EAAAK).sub.4A-HM-3; and TSL-18: (SEQ ID NO: 20) mIgG4-Fc-(AP).sub.9-HM-3;
[0113] The amino acid sequences above are shown in the Sequence Listing.
[0114] The above 12 fusion proteins are the most representative candidate protein structures and the cell expression and in vitro pharmacodynamic experiment were performed simultaneously and the results of in vitro pharmacodynamic experiment were obtained.
[0115] Through different modes of comparison, each structure variable can be compared with each other to screen out an optimal fusion protein structure. The possibility of druggability was evaluated by in vivo pharmacodynamics, pharmacokinetics, toxicology and the like, thus further developing an innovative drug for the treatment of autoimmune diseases, e.g., rheumatoid arthritis.
Embodiment 2: Vector Construction
[0116] Based upon the same design approach and the application of the same expression vector, the 12 fusion proteins had completely consistent construction process of the transient-transfection expression vector; mIgG4-Fc-(GGGGS).sub.3-HM3 (TSL-4) was taken as an example to introduce the construction process of the expression vector.
[0117] TSL-4 fusion protein was obtained by linking an mIgG4-Fc fragment to a HM-3 molecule, and (GGGGS).sub.a served as a Linker, where a was 3 (SEQ ID NO: 26).
[0118] Amino acid sequences constituting each portion of TSL-4 were spliced with each other in accordance with the order of mIgG4-Fc-(GGGGS).sub.3-HM3, and the sequence was shown in Sequence Listing 12.
[0119] The DNA sequence corresponding to the mIgG4-Fc-(GGGGS).sub.3-HM3 fusion protein was shown in Sequence Listing 1.
[0120] In order to adapt to the secretory expression of eukaryotic cells, such as CHO or HEK 293, the necessary Kozak sequence and signal peptide were added to obtain a complete mIgG4-Fc-(GGGGS).sub.3-HM3 expression sequence, and the DNA sequence was shown in Sequence Listing 2.
[0121] A Biotechnology Company was entrusted to completely synthesize the above DNA sequence, and then DNA sequence was ligated with the commercial expression vector pcDNA 3.4-TOPO from Invitrogen Corporation via subcloning, thus obtaining an expression vector pcDNA3.4-mIgG4-Fc-(GGGGS).sub.3-HM3. The expression vector was preserved in an E. coli DH5.alpha. glycerol tube and sent to the laboratory for storage at -80.degree. C.
Embodiment 3: Long-Term Preservation of Bacterial Strain of the Expression Vector
[0122] Under sterile conditions, the E. coli DH5.alpha. glycerol tube containing pcDNA3.4-mIgG4-Fc-(GGGGS).sub.3-HM3 was thawed and inoculated into a 250 ml shake flask containing 50 ml of 100 ug/ml Amp-resistant LB medium according to 1% inoculum size, and then vibrated at 160 rpm for culture overnight at 37.degree. C.
[0123] Afterwards, 25 ml of sterile 60% glycerol was added to the bacteria solution under sterile conditions, after mixed fully and evenly, the bacteria solution was dispensed into 1.5 ml sterile centrifuge tubes at a concentration of 1 ml/pcs. to complete the preparation of the glycerol tube, and finally, the glycerol tube was preserved for a long time at -80.degree. C.
Embodiment 4 Preparation of the Expression Vector
[0124] All vectors for cell transfection must be sterile and endotoxin-controlled, so the plasmid extraction of all expression vectors was performed by Genopure plasmid Maxi Kit from Roche, and plasmids were sterilized.
[0125] (1) A glycerol tube was taken out at -80.degree. C. one day morning before plasmid extraction, and the bacteria solution was inoculated into a test tube containing 5 ml of 100 ug/ml Amp-resistant LB medium according to 1% inoculum size under aseptic conditions for shaking culture for 6-8 h at 37.degree. C. and 160 rpm.
[0126] (2) Under sterile conditions, the bacteria solution in the tube were totally inoculated into a 2 L shake flask containing 500 ml of 100 ug/ml Amp-resistant LB medium, and then vibrated at 160 rpm for culture overnight at 37.degree. C.
[0127] (3) Plasmid extraction was performed by the Genopure plasmid Maxi Kit from Roche. The method was as follows:
[0128] a. 3000-5000 g were centrifuged for 5-10 min to collect 500 ml of E. coli bacteria at 4.degree. C. 24 ml of Suspension Buffer (containing RNase) was added to fully resuspend the bacteria.
[0129] b. 24 ml of Lysis Buffer was added, inverted and mixed for 6-8 times fully, standing for 2-3 min at room temperature.
[0130] c. 24 ml of Neutralization Buffer was added, immediately inverted and mixed for 6-8 times fully till flocculent precipitate appeared.
[0131] d. lysate was purified. 12000 g Lysate were centrifuged for 45 min above at 4.degree. C., and then supernatant was carefully transferred to an adsorption column.
[0132] e. A paper ring in the kit was attached to the adsorption column and placed at the neck of a conical flask, and 6 ml of Equilibration Buffer was dropwisely added on the adsorbing material.
[0133] f. The clean lysate obtained in step e was added to the adsorption column for naturally flowing through by gravity. The liquid flowing through the column was discarded.
[0134] g. 12 ml of Wash Buffer was added to the adsorption column for naturally flowing through by gravity, then the liquid flowing through the column was discarded. The operation above was repeated for twice.
[0135] h. On a super clean bench, the adsorption column was placed onto a 50 ml of sterile, high-speed, endotoxin-free and round-bottomed centrifuge tube, then 14 ml of Elution Buffer pre-heated at 50.degree. C. was added to the adsorption column for flowing through by gravity.
[0136] i. Plasmid DNA was precipitated by adding 20 ml of isopropanol, 15000 g were centrifuged at 4.degree. C. for 30 min, and the supernatant was carefully discarded on the super clean bench. (Pay more attention to the step. Sometimes the plasmid formed viscous liquid at the bottom of the centrifuge tube instead of solid precipitate, therefore, a transfer pipette was used to remove most of the liquid from the upper layer, and then the remaining supernatant was carefully transferred into a sterile and conical centrifuge tube, such as a 15 ml centrifuge tube or a 50 ml centrifuge tube. Please try not to absorb the viscous liquid containing the plasmid as little as possible. Subsequently, the conical centrifuge tube was observed, and then the viscous liquid containing the plasmid absorbed carelessly at the bottom was absorbed back into the round-bottomed centrifuge tube.)
[0137] j. 4 ml of pre-cooled 75% ethanol was used, and the lid of the centrifuge tube was tightened, and then the tube was rotated to allow the 75% ethanol to wet the interior of the entire centrifuge tube. On the one hand, the plasmid possibly remaining on the tube wall was washed, and on the other hand, the entire inner wall of the centrifuge tube was sterilized. More than 15000 g were centrifuged at 4.degree. C. for 10 min. The operation above was repeated for once.
[0138] k. 75% ethanol was discarded on a super clean bench, the residual liquid was carefully pipetted off by a 10 ul pipettor, and then the centrifuge tube was inverted on an absorbent paper and dried for about 20 min.
[0139] l. On a super clean bench, the solid plasmid was completely soaked by 200-400 ul of sterile ddH2O, and the centrifuge tube was tilted for standing overnight at 4.degree. C. after tightening the lid thereof, thus fully dissolving the plasmid. The plasmid was transferred to a 1.5 ml of sterile centrifuge tube and 2 ul was taken for concentration detection on the super clean bench. According to the detection results, the plasmid concentration was adjusted to 1 ug/ul by sterile ddH2O (double distilled water), and the plasmid was sterilized by a 0.22 .mu.m sterile filter membrane, and then, 5 ul of plasmids were taken and inoculated into a test tube containing 5 ml of non-resistant LB culture medium for shaking culture overnight at 37.degree. C., finally, sterility was confirmed. The preparation of the sterile plasmid was complete at this time. Plasmid DNA was preserved at 4.degree. C. or -20.degree. C.
[0140] Thus, the preparation of the expression vector was completed.
Embodiment 5 Quick Expression of the Fusion Protein
[0141] Expi293 Expression System from ThermoFisher is a commercial quick kit for protein preparation based on the transient transfection of 293F cell (a kind of screened HEK293 cell), used for the quick acquisition of fusion protein. The preparation for the 12 fusion proteins shall follow the experimental scheme below.
[0142] 1. According to the operation instructions of Expi 293 Expression System, the final volume of each bottle of cells is 800 ml when a 2 L shake flask was used for the experiment.
[0143] 2. Transfected Expi293F cells were passaged at least for three times from recovery. The culture scale might be sequentially enlarged according to experimental requirements in subculture process.
[0144] 3. One day before transient transfection, cells were inoculated into a total volume of 1200 ml Expi293 Expression Medium according to the living cell density of 2.times.10.sup.6 for shaking culture under the conditions of 37.degree. C., 8% CO.sub.2 (carbon dioxide?) and 125 rpm.
[0145] 4. On the day of transient transfection, the cells cultured the previous day were counted, and the cell density should be 3-5.times.10.sup.6 cells/ml and its motility rate should be greater than 95%. The cell density was adjusted to 3.times.10.sup.6 cells/ml and the cell volume in each 2 L shake flask was adjusted to 680 ml.
[0146] 5. 800 ug plasmid DNA was re-constituted in 40 ml of Opti-MEM I Reduced Serum Medium and mixed gently.
[0147] 6. 2.16 mL of ExpiFectamine 293 Reagent was added to Opti-MEM I Reduced Serum Medium to a constant volume of 40 ml. It was mixed gently and incubated at room temperature for 5 min (transformation efficiency may be affected by long incubation).
[0148] 7. The above two kinds of solution were mixed gently and incubated at room temperature for 20-30 min. The preparation of the plasmid-transfection reagent mixed liquor was completed.
[0149] 8. 80 ml of the plasmid-transfection reagent mixture was added to the culture medium of step 4 to obtain a total volume of 760 ml.
[0150] 9. Shaking culture was performed for 18 h at 37.degree. C., 8% CO.sub.2 and 125 rpm.
[0151] 10. 4 mL of ExpiFectamine 293 Transfection Enhancer 1 and 40 ml of ExpiFectamine 293 Transfection Enhancer 2 were added. The total volume was 804 ml at this timepoint.
[0152] 11. Shaking culture was performed at 37.degree. C., 8% CO.sub.2 and 125 rpm.
[0153] 12. Sampling was performed to detect the yield by an immunoturbidimeter at the end of fermentation 6 days later after transfection, and protein purification was conducted.
Embodiment 6 Purification of the Fusion Protein
[0154] Since the above 12 kinds of fusion proteins were essentially Fc fusion proteins, and they were captured by a Protein A affinity column. In actual purification, it was found that the purification parameters were completely identical. Therefore, the purification of a certain batch of TSL-4 protein was taken as an example to describe the purification process of the fusion protein.
[0155] 1. Sample pretreatment: 1.60 L of fermentation liquor of batch 20160308 was centrifuged by a Beckman J.times.25 centrifugal machine and a 500 ml centrifuge cup under the conditions of 7500 imp, 20 min, 4.degree. C., and about 1.46 L of the obtained supernatant was further used for the next step, namely, protein A capture.
[0156] 2. Affinity capture of the target protein:
[0157] Information of the chromatographic column
TABLE-US-00005 Filler Mabselect SuRe Chromatographic column XK50/20 Column height (cm) 10 Cross sectional area of the 19.62 chromatographic column (cm.sup.2) Filler volume (mL) 196.2
[0158] Method information was as follows:
[0159] 1) firstly, 500 ml of 0.2 M NaOH was used to sterilize at a flow rate of 10 ml/min;
[0160] 2) the chromatographic column was equilibrated by a buffer solution of 20 mM PB, 0.15 M NaCl, pH 7.0, where the volume was about 1000 ml and flow rate was 20 ml/min;
[0161] 3) sample loading: pH of the sample was pre-adjusted to be neutral, and the flow rate was 20 ml/min;
[0162] 4) the chromatographic column was washed by a buffer solution of 20 mM PB, 0.15 M NaCl, pH 7.0, where the volume was about 800 ml and the flow rate was 20 ml/min;
[0163] 5) target protein was eluted by a buffer solution of 50 mM citric acid-sodium citrate, 0.15 M NaCl, pH 3.0, it begun to collect the target protein at a peak of 20 mAu, and stopped collecting at 20 mAu after the peak; the flow rate was 20 ml/min;
[0164] 6) finally, the chromatographic column was washed by 500 ml of 0.2 M NaOH solution, and rinsed to be neutral with ddH.sub.2O water, and then preserved by 20% ethanol;
[0165] The samples were combined in a volume of about 138 ml, and the mixed solution was adjusted within a range of pH 4.12 to 7.0 with 1N NaOH 20 ml, and the eluate turned from slightly cloudy to clear. Measured results were shown in FIG. 1.
[0166] 3. Further separation and purification with gel chromatography
[0167] Column parameters:
TABLE-US-00006 Filler Superdex200 Chromatographic column XK50/60 Column height (cm) 58 Cross sectional area of the 19.62 chromatographic column (cm.sub.2) Filler volume (mL) 1138 Flow rate ml/min Sample loading 1-10% loading quantity of sample
[0168] Method information:
[0169] 1) the chromatographic column was sterilized with 0.5M NaOH 300 ml at a flow rate of 10 ml/min, and then washed by ultrapure water to be about neutral;
[0170] 2) the chromatographic column was equilibrated by a PBS buffer solution, pH 7.4, and the equilibrium volume was about 1500 ml and the flow rate was 10 ml/min;
[0171] 3) sample loading was performed, and the sample was protein A eluent, and the loading quantity of sample was 40 ml;
[0172] 4) the sample was collected, where peak 3 was a target protein peak and was collected; it began to collect the protein at the peak of 10 mAU and stop collecting 10 mAu later after the peak;
[0173] 5) finally, the chromatographic column was preserved with 0.1 M NaOH at a flow rate of 10 ml/min.
[0174] Measured results were shown in FIG. 2.
[0175] 4. Sample ultrafiltration concentration: samples at peak 3 were combined, ultrafiltrated and concentrated, where 10 kDa served as an ultrafiltration membrane; samples were concentrated till the concentration of the target protein was more than 5 mg/ml, and dispensed, then preserved in a -80.degree. C. refrigerator. At the beginning of combination, the volume of the sample in this batch was about 550 ml and the concentration was about 0.29 mg/ml; finally it was concentrated to 27 ml and the final concentration was about 5.53 mg/ml; the sample was dispensed and frozen.
[0176] 5. Purity of the final sample
[0177] As shown in FIG. 3, the electrophoresis purity of batch 20160308 was about 96.9%; as shown in FIG. 4, the HPLC-SEC purity of batch 20160308 was about 99.3%.
[0178] Same purification process was followed to successfully express and prepare into 12 kinds of fusion proteins:
[0179] TSL-1 fusion protein: HM-3-(GGGGS).sub.3--IgG2-Fc;
[0180] TSL-2 fusion protein: HM-3-(GGGGS).sub.3-mIgG4-Fc;
[0181] TSL-3 fusion protein: IgG2-Fc-(GGGGS).sub.3-HM-3;
[0182] TSL-4 fusion protein: mIgG4-Fc-(GGGGS).sub.3-HM-3.
[0183] TSL-5 fusion protein: HM-3-(GGGGS).sub.3-IgG4-Fc
[0184] TSL-6 fusion protein: IgG4-Fc-(GGGGS).sub.3-HM-3
[0185] TSL-13 fusion protein: HM-3-(GGGGS).sub.3-mIgG4-Fc-(GGGGS).sub.3-HM-3
[0186] TSL-14 fusion protein: HM3-HyFc
[0187] TSL-15 fusion protein: mIgG4-Fc-G.sub.5-HM-3-G.sub.8-HM-3
[0188] TSL-16 fusion protein: HyFc-(GGGGS).sub.3-HM-3
[0189] TSL-17 fusion protein: mIgG4-Fc-A(EAAAK).sub.4 A-HM-3
[0190] TSL-18 fusion protein: mIgG4-Fc-(AP).sub.9--HM-3
[0191] During protein preparation, as shown in FIG. 5, it was found that there was a serious problem of dimer degradation to the two fusion proteins of TSL-5 and TSL-6, and most of them existed in a monomeric form, indicating that the fusion protein prepared by IgG4-Fc could not form a dimer stably; therefore, the design scheme of the two fusion proteins of TSL-5 and TSL-6 was eliminated.
Embodiment 7: Test on the Splenic Lymphocyte Proliferation of Fusion Protein Mice
[0192] Experimental method: mice orbit was by bloodletting to death, and immediately immersed in 75% ethanol for 5-10 min, and then the spleen was removed on a clean bench and placed in PBS. The spleen was placed on a sterile cell strainer (200 mesh) and ground with a syringe nozzle; during grinding process, PBS was added continuously; the slurry was collected and centrifuged (1000 rpm for 5 min), then cells were washed 3 times with Tris-ammonium chloride solution, and washed again with a medium, and then re-suspended in the medium. Finally, trypan blue living cell staining was performed on the cells, and the survival rate was more than 95%. The concentration of viable cells was adjusted to 2.times.10.sup.6/mL. 100 of cells was added to each well of a 96-well plate, meanwhile, ConA (concanavalin to simulate splenocyte proliferation) and drugs were added to each well. Six duplicates were set in each group.
[0193] The 96-well plate was incubated for 48 h in a 5% CO2 incubator at 37.degree. C. 5 mg/mL of MTT was added to the 96-well plate, 20 .mu.L for each well, and then it was incubated continuously for 4 h in the incubator. The culture medium in the 96-well plate was discarded and 100 .mu.L DMSO was added to each well and mixed gently. Absorbance was measured by a microplate reader at the wavelength of 570 nm and reference wavelength of 630 nm.
[0194] Proliferation inhibition rate (PI) was calculated according to formula:
Pi ( % ) = 1 - A test A control .times. 100 % ##EQU00001##
wherein, A.sub.test is the absorbance of dosing group, and A.sub.control is the absorbance of negative control. Test results were expressed as mean.+-.SD, and statistical T test was performed. *P<0.05 indicates significant difference, **P<0.01 indicates extremely significant difference. Based upon the results, the efficacy of the fusion protein against rheumatoid arthritis was screened. In the first round, TSL-1-4 was tested and the specific dosing scheme was shown in Table 2.
TABLE-US-00007 TABLE 2 Dosing scheme Blank Group medium ConA Dosage Blank group 10 .mu.L / Blank culture medium 90 .mu.L Negative group / 10 .mu.L, Blank culture medium 90 .mu.L 5 .mu.g/mL Solvent control / 10 .mu.L, solvent with equal volume 5 .mu.g/mL to sample Positive group / 10 .mu.L, Dexamethasone 50 .mu.mol/L 5 .mu.g/mL (20 .mu.g/mL) 90 .mu.L HM-3 / 10 .mu.L, 5, 10, 20 .mu.mol/L, 90 .mu.L 5 .mu.g/mL mPEG-SC-HM-3 / 10 .mu.L, 5, 10, 20 .mu.mol/L, 90 .mu.L 5 .mu.g/mL HM-3 fusion / 10 .mu.L, 0.625, 1.25, 2.5, 5, 10, Protein 5 .mu.g/mL 20 .mu.mol/L, 90 .mu.L (TSL-1, TSL-2, TSL-3, TSL-4)
[0195] Experimental results: As shown in FIGS. 6A-6E, in order to screen the anti-rheumatoid arthritis activity of HM-3 fusion proteins TSL-1, TSL-2, TSL-3 and TSL-4, the mouse spleen lymphocyte proliferation experiment was used to preliminarily screen the FM-3 fusion proteins TSL-1, TSL-2, TSL-3 and TSL-4; results showed that the optimal inhibition rates of the HM-3, mPEG-SC-HM-3 and HM-3 fusion proteins TSL-1, TSL-2, TSL-3 and TSL-4 were respectively 17.9%18.8%, 40.5%19.3%, 39.6%19.4%, 34.1%111.7%, 61.4%11.6% and 63.3%111.0%. The inhibition rate of the HM-3 fusion proteins TSL-3 and TSL-4 was higher than that of the positive control group, moreover, there was a significant difference compared with the negative control group.
[0196] In the second round, TSL-13-18 was tested and the specific dosing scheme was shown in Table 3. In the P4 control group, TSL-4 fusion protein served as a control agent.
TABLE-US-00008 TABLE 3 Dosing scheme Final concentration Group of Con A Dosage Con A group 5 .mu.g/mL Culture medium 100 .mu.L High solvent 5 .mu.g/mL Sodium citrate buffer solution (17 mmol/L, 100 .mu.L) Low solvent 5 .mu.g/mL Sodium citrate buffer solution (8.5 mmol/L, 100 .mu.L) P4 positive 5 .mu.g/mL TSL-4 solution control group (12 .mu.mol/L, 100 .mu.L) TSL-13 5 .mu.g/mL 0.375, 1.25, 2.5, 5, 7.5, 10, 15 .mu.mol/L, 100 .mu.L TSL-14 5 .mu.g/mL 0.4165, 0.208, 0.104, 0.052, 0.026 .mu.mol/L, 100 .mu.L TSL-15 5 .mu.g/mL 20, 15, 10, 7.5, 5, 2.5, 1.25, 0.375 .mu.mol/L, 100 .mu.L TSL-16 5 .mu.g/mL 8.67, 4.33, 2.17, 1.08, 0.54 .mu.mol/L, 100 .mu.L TSL-17 5 .mu.g/mL 15, 10, 7.5, 5, 2.5, 1.25, 0.375 .mu.mol/L, 100 .mu.L TSL-18 5 .mu.g/mL 20, 15, 10, 7.5, 5, 2.5, 1.25, 0.375 .mu.mol/L, 100 .mu.L
Experimental Results
[0197] FIGS. 7A-7F showed an inhibiting effect of agents in each group of TSL-13-18 on splenocyte proliferation stimulated by ConA. Compared with group ConA, the inhibition ratio of mice splenic lymphocyte proliferation in the P4 positive control group and solvent group enhanced significantly (P<0.05); while in each group of TSL-13-18, the concentration gradient of samples TSL-17 and TSL-18 improved significantly (P<0.05) in the inhibition ratio of mice splenic lymphocyte proliferation relative to group ConA; but its inhibition amplitude was less than the P4 positive control group.
Embodiment 8 Single Factor Comparison of 12 Alternative Fusion Protein Structures
[0198] First, as already mentioned in Embodiment 6 that during purification, it was found that TSL-5 and TSL-6 fusion proteins were not naturally stable in maintaining the expected normal dimer state, both of the TSL-5 and TSL-6 based on natural human IgG 4-Fc fragments were eliminated, meanwhile, IgG4-Fc was no longer an candidate fusion protein Fc fragment. Based on the results of mice splenic lymphocyte proliferation inhibition experiment, a single structural-factor comparison was performed on the remaining 10 candidate fusion proteins.
[0199] 1, Comparison on Fc Fragments and Ligation Direction
[0200] GGGGS*3 Linker (SEQ ID NO: 26) was selected as a unified Linker, and there were 3 kinds of candidate Fc fragments, namely, IgG2-Fc, mIgG4-Fc and HyFc after excluding the natural human IgG 4-Fc. 6 candidate fusion proteins were formed in combination with two linking directions, namely TSL-1, 2, 3, 4, 14 and 16 respectively; and the optimal inhibition rate of each sample was shown in Table 4.
TABLE-US-00009 TABLE 4 Comparison on the best inhibition rate of splenic lymphocyte proliferation experiments in three Fc fragments/two linking-directed fusion protein mice Fc linking direction fragment N-terminal C-terminal IgG2-Fc TSL-1 39.6% .+-. 9.4% TSL-3 61.4% .+-. 1.6% mIgG4-Fc TSL-2 34.1% .+-. 11.7% TSL-4 63.3% .+-. 11.0% HyFc TSL-14 Significantly lower TSL-16 Significantly lower than the control than the control group group Note: the numbers in the Table are the splenic lymphocyte inhibition rate of mice
[0201] As shown in FIGS. 8A-8F, data was compared to obtain the following results:
[0202] 1) In vitro efficacy of the fusion protein constructed in the base of HyFc was significantly lower than that of the TSL-4 fusion protein in control group, therefore, HyFc was eliminated to be as a molecular chaperone to prolong the efficacy of HIM-3.
[0203] 2) C-terminal linking mode, namely HM-3 is linked to a C-terminal of the Fc fragment, and its efficacy was significantly better than that of N-terminal linking mode, therefore, N-terminal linking was excluded.
[0204] 3) Similarly, a C-terminal linking mode was taken, and the efficacy of TSL-4 was slightly higher than that of TSL-3. Therefore, it was preliminarily considered that mIgG4-Fc was batter than that of IgG2-Fc, and IgG2-Fc was retained temporarily. A further comparison was made between TSL-3 and TSL-4 in the subsequent experiment.
[0205] 2, Linker Single Factor Comparison
[0206] As shown in FIGS. 9A-9C, mIgG4-Fc and C-terminal linking mode were uniformly used in TSL-4, TSL-17, TSL-18; Linker was screened by comparing in vitro efficacy. The results of mice splenic lymphocyte proliferation inhibition experiments showed that the cell inhibition rate of TSL-17 and TSL-18 were lower than that of TSL-4, so it could be concluded that among the three types of Linker, such two rigid Linkers of A(EAAAK).sub.nA (SEQ ID NO: 27) and (AP).sub.n were not suitable for the construction of Fc fusion protein of HM-3.
[0207] 3, Comparison on Single HM-3 and Multiple HM-3 Fusion Proteins
[0208] Theoretically, the fusion protein molecule contains more HM-3, thus bringing stronger efficacy under the same dosage. Based on the idea, TSL-13 was designed to link HM-3 at both ends of the Fc fragment, and TSL-15 was designed to link two HM-3s at the C-terminal of the Fc fragment.
[0209] As shown in FIG. 10A-10D, mIgG4-Fc and GGGGS*3 Linker (SEQ ID NO: 26) were uniformly used in the mice splenic lymphocyte proliferation inhibition experiment to make a comparison on the in vitro efficacy of TSL-2, 4, 13, 15, and to analyze the action of multiple HM-3 on efficacy.
[0210] By comparison, it was found that the efficacy of TSL-13 and TSL-15 was lower than that of TSL-4 protein, and multiple HM-3 did not show the value of improving efficacy, therefore, the design scheme of fusion protein containing multiple HM-3 was eliminated.
[0211] By multiple rounds of comparison, it was confirmed that HM-3 was linked to a C-terminal of Fc; a single HM-3 molecule was ligated by a flexible GGGGS*3 Linker (SEQ ID NO: 26) to keep the efficacy of HM-3 to the maximum extent; a comparison was made on the two Fc fragments of IgG2-Fc and mIgG4-Fc, mIgG4-Fc achieved a better efficacy, but it was not enough to eliminate IgG 2-Fc. Thus, the two structures of TSL-3 and TSL-4 were further compared in subsequent experiments.
Embodiment 9: In Vitro Efficacy Screening of the HM-3 Fusion Protein in Inhibition Reaction of Human Macrophage U937
[0212] Experimental method: Human macrophage U937 was cultured in RPMI-1640 medium containing 10% fetal bovine serum and double antibodies in a constant temperature incubator at 37.degree. C. under the condition of 5% CO.sub.2, and the medium was replaced every 2 days. U937 cells in the logarithmic phase were collected, resuspended and adjusted to the concentration of 5.times.10.sup.5/mL. 100 .mu.L of cells was added to each well of a 96-well plate overnight and induced with LPS (1 .mu.g/mL) in the following day, where n=3. At the same time, the cells were treated with agents, and respectively divided into a positive control group adalimumab, an HM-3 polypeptide group, an mPEG-SC-HM-3 polypeptide group, an HM-3 fusion protein (TSL-1, TSL-2, TSL-3, TSL-4) group, and the specific dosing scheme was shown in Table 5.
TABLE-US-00010 TABLE 5 dosing scheme Culture Group medium LPS Dosage Blank 100 .mu.L / / Negative 90 .mu.L 10 .mu.L, 1 .mu.g/mL / adalimumab / 10 .mu.L, 1 .mu.g/mL 50 .mu.g/mL, 90 .mu.L HM-3 / 10 .mu.L, 1 .mu.g/mL 9, 18 .mu.mol/L, 90 .mu.L mPEG-SC-HM-3 / 10 .mu.L, 1 .mu.g/mL 9, 18 .mu.mol/L, 90 .mu.L HM-3 fusion / 10 .mu.L, 1 .mu.g/mL 4.5, 9, 18 .mu.mol/L, 90 .mu.L Protein (TSL-1, TSL-2, TSL-3, TSL-4)
[0213] 48 h after the agents worked, culture medium was collected and centrifuged, and supernatant was taken to measure the content of TNF-.alpha. therein by ELISA. Test results were expressed as mean.+-.SD, and statistical T test was performed. *P<0.05 indicates significant difference, **P<0.01 indicates extremely significant difference. Based upon the results, the efficacy of the HM-3 fusion protein against rheumatoid arthritis was screened.
[0214] Experimental results: As shown in FIGS. 11A-11E, in order to screen the anti-rheumatoid arthritis of HM-3 fusion proteins TSL-1, TSL-2, TSL-3 and TSL-4; in the experiment, ELISA was taken to detect the content of TNF-.alpha. in supernatant of LPS-induced macrophage, thus determining the activity of anti-rheumatoid arthritis of HM-3 fusion proteins TSL-1, TSL-2, TSL-3 and TSL-4. The results indicated that the dosage (9 .mu.M) of HM-3 fusion proteins TSL-3 and TSL-4 showed an best inhibitory effect; the TNF-.alpha. content in cell supernatant was 38.6.+-.12.9 pg/mL and 22.2.+-.8.9 pg/mL. Compared with the negative group (77.6.+-.19.6 pg/mL), there was a significant difference. In addition, the TNF-.alpha. content in cell supernatant of the high/low-dosage HM-3 was respectively 58.9.+-.10.6 pg/mL and 83.9.+-.20.4 pg/mL. The content of TNF-.alpha. in cell supernatant of high/low-dosage mPEG-SC-HM-3 was 45.6.+-.5.9 pg/mL, 57.3.+-.2.7 pg/mL respectively. From the aspect of inhibitory effect, TSL-4 was much better than that of polypeptide HM-3 and mPEG-SC-HM-3.
Embodiment 10: Screening of In Vivo Anti-Angiogenesis Effects of the HM-3 Fusion Protein in Zebrafish
[0215] Experimental method: transgenic blood vessel fluorescent zebrafish was randomly selected and put into a six-well plate with 30 fish per well, and intravenously injected HM-3 polypeptide, TSL-1 fusion protein, TSL-2 fusion protein, TSL-3 fusion protein and TSL-4 fusion protein respectively in accordance with the dosage of 20 ng/tail and 66 ng/tail; the dosage was 500 nL/tail in Avastin positive control and the injection volume was 20 nL/tail; the zebrafish injected 20 nL/tail of buffer solution served as a solvent control group, and the zebrafish without any treatment served as a normal control group. 10 pieces of zebrafish were randomly selected from each group after processed for 24 h to observe the intestinal vessels of the transgenic zebrafish by a fluorescence microscope, as well as to take and maintain images. Image analysis was performed by Nikon MS-Elements D 3.10 to calculate the area (S) of SIVs (subintestinal vessel, SIV). The calculation formula of angiogenesis inhibition rate was as follows:
Angiogenesis inhibition rate (%)=(1-S(Test sample group)/S(Normal control group)).times.100%
[0216] Statistical analysis was performed by variance analysis and Dunnett's T-test and the results were expressed as Mean.+-.SD, where p<0.05 indicates a significant difference.
[0217] Experimental Results:
[0218] As shown in FIG. 12, a comparison of SIVs area was made between the positive control group (Avastin 500 ng/tail) (37853) and the normal control group (53193), and p<0.001 (compared with the normal control group, *p<0.05, **p<0.01, ***p<0.001), and the inhibition rate of angiogenesis was 29%, indicating that Avastin has obvious angiogenesis inhibition effect.
[0219] The area of SIVs was respectively 52186, 39929, 42828, 40705 and 33869 when zebrafish was injected 20 ng/tail with HM-3 polypeptide, 20 ng/tail TSL-1, 20 ng/tail TSL-2, 20 ng/tail TSL-3 and 20 ng/tail TSL-4 fusion proteins. Compared with the normal control group (53193), the inhibition rate of angiogenesis was 2%, 25%, 19%, 23% and 36% respectively. The results showed that HM-3 polypeptide had no inhibiting effect on angiogenesis at the dose of 20 ng/tail; the fusion proteins TSL-1, TSL-2, TSL-3 and TSL-4 had significant inhibitory effect on angiogenesis at the dose of 20 ng/tail, of which TSL-4 achieved the best inhibitory effect on angiogenesis.
[0220] The area of SIVs was 42492, 37022, 32374, 38660 and 28297 respectively when the dosage of HM-3, TSL-1, TSL-2, TSL-3 and TSL-4 was 66 ng/tail. Compared with the normal control group (53193), the inhibition rate of angiogenesis was 20%, 30%, 39%, 27% and 47% respectively. It indicated that the five fusion proteins had significant inhibiting effect on angiogenesis at the dose of 66 ng/tail, of which TSL-4 achieved the best effect.
Embodiment 11: Chronic Inflammation Mode of Type-II CIA in Mice
[0221] Experimental method: Balb/c mice were taken and immunized for the first time. The concentration of type-II bovine collagen was 4 mg/mL. On the day of the experiment (day 0), complete Freund's adjuvant (CFA) and CII solution were mixed evenly in equal volume and emulsified. Excepting for the normal control group of Balb/c mice, mice in each group were sensitized by intracutaneous injection of 50 .mu.L emulsifier at the end of tails. 21 days later, mice were re-immunized with the same dose of emulsifier at the end of tails, and incomplete Freund's adjuvant (IFA) served as an adjuvant at this time. Redness and swelling other arthritic symptoms appeared on toe joints of mice models approximately on the 29.sup.th day of the experiment, indicating successful modeling.
[0222] Treatment Method
[0223] Animals in the modeling group on the 30.sup.th day of the experiment were randomly divided into:
[0224] G1 (normal control group);
[0225] G2 (model group);
[0226] G3 (positive Adalimumab group);
[0227] G4 (HIM-3 group);
[0228] G5 (mPEG-SC-HM-3 group);
[0229] G6 (TSL-4, 50 mg/kg, administered once for 5 days, 3 times in total);
[0230] G7 (TSL-4, 25 mg/kg, administered once for 5 days, 3 times in total);
[0231] G8 (TSL-4, 25 mg/kg, administered once for 7 days, 2 times in total);
[0232] G9 (TSL-4, 25 mg/kg, administered once for 14 days, 1 time in total);
[0233] G10 (TSL-4, 12.5 mg/kg, administered once for 5 days, 3 times in total);
[0234] G11 (TSL-4, 12.5 mg/kg, administered once for 7 days, 2 times in total);
[0235] G12 (TSL-4, 12.5 mg/kg, administered once for 14 days, 1 time in total);
[0236] There were 12 groups in total, and there were 8 pieces of mice in remaining each group excepting for 12 pieces in G1 (normal control group) and G2 (model group). Mice in the normal control group and the model control group were injected with normal saline subcutaneously once every other day for 8 times in total with the dosage volume of 0.1 mL/10 g; mice in the positive Adalimumab group were subcutaneously injected with 8 mg/kg Adalimumab once every two weeks with the dosage volume of 0.1 mL/10 g, and then the mice were observed for another 15 days after 15 days of treatment. Specific dosing scheme was shown in Table 6.
TABLE-US-00011 TABLE 6 dosing scheme Dosage of Group n administration Frequency Route Normal group (G1) 12 Normal saline 1 time/2 d, 8 times SC Model group (G2) 12 Normal saline 1 time/2 d, 8 times SC Adalimumab (G3) 8 8 mg/kg 1 time/14 d, 1 time .sup. SC HM-3 (G4) 8 1.6 mg/kg .sup. 2 times/d, 30 times IV mPEG-SC-HM-3 8 20 mg/kg 1 time/2 d, 8 times SC (G5) TSL-4 (G6) 8 50 mg/kg 1 time/5 d, 3 times SC TSL-4 (G7) 8 25 mg/kg 1 time/5 d, 3 times SC TSL-4 (G8) 8 25 mg/kg 1 time/7 d, 2 times SC TSL-4 (G9) 8 25 mg/kg 1 time/14 d, 1 time .sup. SC TSL-4 (G10) 8 12.5 mg/kg 1 time/5 d, 3 times SC TSL-4 (G11) 8 12.5 mg/kg 1 time/7 d, 2 times SC TSL-4 (G12) 8 12.5 mg/kg 1 time/14 d, 1 time .sup. SC
[0237] Arthritis Index Evaluation
[0238] Measurement of mice weight: mice were weighed by an electronic balance every two days.
[0239] Measurement of sole thickness: the thickness of left, right and hind soles for each mouse was measured by a vernier caliper every two days.
[0240] Measurement of ankle joint width: the width of left and right ankle joints for each mouse was measured by vernier caliper every two days.
[0241] Arthritis index (AI) score: the severity of arthritis for each mouse was evaluated by a paw joint scoring method. 0: no redness and swelling; 1: redness and swelling of little toe joints; 2: redness and swelling of toe joints and toes; 3: redness and swelling of the portion below ankle joints; 4: redness and swelling of toe joints, toes and ankle joints. Scoring was performed once every two days until the end of the experiment.
[0242] Pathological Index Evaluation
[0243] Blood was collected from the orbit and serum was separated. After mice were killed by cervical dislocation, spleen and thymus were separated and weighed to calculate a spleen coefficient, and then the spleen and thymus were fixed in formalin stationary liquid. Paw was cut off from the joint part of superior borders between malleolus medialis and lateral malleolus at the extremitas anterior of tibia, and the entrire paw including ankle joints were weighed and fixed in formalin stationary liquid for histopathological examination.
[0244] Experimental results: TSL-4 had different therapeutic effects on type-II CIA mice models based upon different dosage regimens, where better therapeutic effect achieved in group G3 (positive Adalimumab group), group G4 (HM-3 group), group G5 (mPEG-SC-HM-3 group), group G6 (TSL-4, 50 mg/kg, administrated once for 5 days, 3 times in total), group G7 (TSL-4, 25 mg/kg, administered once for 5 days, 3 times in total), group G8 (TSL-4, 25 mg/kg, administered once for 7 days, 2 times in total), group G10 (TSL-4, 12.5 mg, administered once for 5 days, 3 times in total); compared with the model group, there were significant differences (*p<0.05) in paw thickness, ankle width, paw circumference, arthritis scoring, spleen weight and paw weight; the therapeutic effect of the group G5 (mPEG-SC-HM-3 group), group G6 (TSL-4, 50 mg/kg, administrated once for 5 days, 3 times in total), group G7 (TSL-4, 25 mg/kg, administered once for 5 days, 3 times in total), group G8 (TSL-4, 25 mg/kg, administered once for 7 days, 2 times in total) was better than the group G3 (positive Adalimumab group), while there was no significant difference among them. Based on the index of paw thickness, ankle width, paw circumference and arthritis scoring, it was found that the effect of the group G3 (positive Adalimumab group) was better than that of other groups in early stage of the therapy; in middle and late stage of the therapy, the therapeutic effect of the group G3 (positive Adalimumab group) was inferior to that of the group G5 (mPEG-SC-HM-3 group), group G6 (TSL-4, 50 mg/kg, administrated once for 5 days, 3 times in total), group G7 (TSL-4, 25 mg/kg, administered once for 5 days, 3 times in total), group G8 (TSL-4, 25 mg/kg, administered once for 7 days, 2 times in total); moreover, the therapeutic effect of the group G4 (HM-3 group) and group G10 (TSL-4, 12.5 mg, administered once for 5 days, 3 times in total) was slightly lower than that of the group G3 (positive Adalimumab group), and compared with the group G2 (model group), there was a significant difference (*p<0.05), while compared with the group G3 (positive Adalimumab group), there was no significant difference; based upon the dynamic curve of weight and in-vitro toxicity test on normal cells, it was found that there was no obvious toxic and side effect in each therapeutic group.
[0245] 1. Effect of TSL-4 on Weight of the Type-II CIA Mice
[0246] As shown in FIGS. 13A-13B, the weight of mice in groups G3, G4, G5, G6, G7, G8, G10 was 21.0.+-.1.5, 20.9.+-.1.5, 21.5.+-.1.3, 20.8.+-.1.8, 21.1.+-.1.6, 20.8.+-.1.7, 21.5.+-.1.5 g at the end of the experiment on the 60.sup.th day; compared with the model group (group G2, 19.5.+-.1.6 g), the weight increased obviously;
[0247] 2. Effect of TSL-4 on Sole Thickness of the Type-II CIA Mice
[0248] As shown in FIGS. 14A-14B, the sole thickness of mice in groups G3, G4, G5, G6, G7, G8, G10 was 3.0410.11, 3.0610.23, 2.9410.13, 2.9210.11, 2.9410.07, 2.9910.17, 3.1510.07 mm at the end of the experiment on the 60th day; compared with the model group (group G2, 3.8510.30 mm), there was a significant difference;
[0249] 3. Effect of TSL-4 on Ankle Width of the Type-II CIA Mice
[0250] As shown in FIGS. 15A-15B, the ankle width of mice in groups G3, G4, G5, G6, G7, G8, G10 was 4.23.+-.0.08, 4.21.+-.0.15, 3.99.+-.0.12, 3.96.+-.0.09, 3.98.+-.0.08, 4.00.+-.0.16, 4.26.+-.0.13 mm at the end of the experiment on the 60th day; compared with the model group (group G2, 4.83.+-.0.20 mm), the ankle width increased obviously;
[0251] 4. Effect of TSL-4 on Paw Circumference of the Type-II CIA Mice
[0252] As shown in FIGS. 16A-16B, the paw circumference of mice in groups G3, G4, G5, G6, G7, G8, G10 was 11.42.+-.0.20, 11.41.+-.0.53, 10.88.+-.0.28, 10.80.+-.0.26, 10.87.+-.0.14, 10.97.+-.0.32, 11.64.+-.0.19 mm at the end of the experiment on the 60th day; compared with the model group (group G2, 13.6210.64 mm), there was an extremely significant difference;
[0253] 5. Effect of TSL-4 on Arthritis Scoring of the Type-II CIA Mice
[0254] As shown in FIGS. 17A-17B, the arthritis scoring of mice in groups G3, G4, G5, G6, G7, G8, G10 was 7.6.+-.0.9, 7.8.+-.1.4, 6.1.+-.1.2, 6.5.+-.1.1, 6.6.+-.1.1, 7.1.+-.0.6, 8.6.+-.1.8 at the end of the experiment on the 60th day; compared with the model group (group G2, 11.5.+-.1.7), there was an extremely significant difference;
[0255] 6. Effect of TSL-4 on Spleen and Thymus of the Type-II CIA Mice
[0256] As shown in FIGS. 18A-18B, the spleen weight of mice in groups G3, G4, G5, G7, G8, G10 was 94.6.+-.6.7 mg, 94.2.+-.13.3 mg, 96.0.+-.5.2 mg, 95.1.+-.9.5 mg, 95.8.+-.11.4 mg, 97.5.+-.5.1 mg at the end of the experiment on the 60.sup.th day; compared with the model group (group G2, 114.6.+-.14.5 mg), there was an significant difference; excepting for a significant difference (*p<0.05) of the mice thymus weight between the model group (39.9.+-.8.9 mg) and the normal control group (25.9.+-.6.2 mg), there was no significant difference between the remaining each group and the model group.
[0257] 7. Effect of TSL-4 on Paw Weight of the Type-II CIA Mice
[0258] As shown in FIG. 19, the paw weight of mice in groups G5, G6, G7, G8 was 174.6.+-.11.7 mg, 176.2.+-.8.9 mg, 176.4.+-.9.7 mg, 177.1.+-.7.8 mg at the end of the experiment on the 60.sup.th day; compared with the model group (group G2, 219.3.+-.20.6 mg), there was an significant difference.
[0259] It was seen from the above conclusion that the TSL-4 fusion protein of the application could still achieve the therapeutic effect the same as that of the group G4 (administered twice per day) and group G5 (administered once for two days) under the conditions of groups G6, G7 and G10 (administered once for 5 days) and even the group G8 (administered once for 7 days); moreover, there was an equivalent dosage in groups G4, G5, G7 after converted in an equimolar manner, indicating that the half-life of the fusion protein in the application prolonged significantly.
Embodiment 12: Pharmacokinetic Analysis of TSL-4
1. Mode of Administration of SD Rats
[0260] (1) 18 SD rats (half male and half female) were purchased and fed for one week.
[0261] (2) Rats were divided into 3 groups, half male and half female, and weight of rats were recorded respectively.
[0262] (3) 4.17, 12.5 and 37.5 mg/kg of TSL-4 were subcutaneously administered on the back for once, and blood sampling was performed from orbit respectively at 0 h, 0.5 h, 1 h, 3 h, 5 h, 6 h, 7 h, 8 h, 10 h, 12 h, 16 h, 20 h, 24 h, 28 h, 41 h, 53 h, 65 h, 77 h. The blood was centrifuged at 12000 rpm/min to take 200 .mu.L of supernatant, then the supernatant was diluted with PBS solution according to a ratio of 1:3, and finally placed in an EP tube and stored in a -80.degree. C. refrigerator.
[0263] (4) Biological samples were measured by double-antibody sandwich ELISA.
2. Detection Mode of Plasma Concentration
[0264] Establishment for the Basic Procedure of Double-Antibody Sandwich ELISA
[0265] (1) Coating, HM-3 monoclonal antibody was diluted with a coating buffer (CBS) in certain concentration, added to an ELISA plate and coated overnight.
[0266] (2) Plate washing, the coating buffer was discarded, and the plate was washed by PBST for 3 times, and then dried by patting.
[0267] (3) Sealing, a blocking buffer was added for sealing at 37.5.degree. C., the plate washing process was repeated and the plate was dried by patting.
[0268] (4) Addition of samples to be measured, the samples to be measured were added to the ELISA plate with multiple wells, and then incubated at 37.5.degree. C.; the plate washing process was repeated and the plate was dried by patting.
[0269] (5) Addition of a secondary antibody, the secondary antibody diluted proportionally was added for incubation at 37.5.degree. C. The plate washing process was repeated and the plate was dried by patting.
[0270] (6) Addition of the enzyme-labeled secondary antibody for reaction, the HRP-labeled secondary antibody which was diluted by 5% skim milk powder solution according to certain proportion was added for incubation at 37.5.degree. C. The plate washing process was repeated and the plate was dried by patting.
[0271] (7) Addition of a substrate, a TMB substrate in certain volume L was added for reaction in the dark.
[0272] (8) Termination of the reaction, a certain amount of stop buffer was added to terminate the reaction.
[0273] (9) Detection, read OD450 nm with a microplate reader.
3. Experimental Results
[0274] 3.1 Results of Pharmacokinetics of SD Rats with a Single Subcutaneous Injection of 12.5 mg/kg TSL-4
[0275] After receiving a single subcutaneous injection of 12.5 mg/kg TSL-4, results of the plasma concentration-time curve were shown in FIG. 20, measured results of the plasma concentration were shown in Table 7, and results of the pharmacokinetic parameters were shown in Table 10.
TABLE-US-00012 TABLE 7 Plasma concentration of rats after receiving a single subcutaneous injection of 12.5 mg/kg TSL-4 (unit: .mu.g/mL) Rat No. Time/h 1 2 3 4 5 Mean 0.00 NA NA NA NA NA NA 0.50 0.176 0.741 0.995 0.598 1.728 0.848 1.00 0.740 1.435 1.875 1.153 4.180 1.877 3.00 1.459 2.970 4.100 2.070 9.793 4.078 5.00 2.030 5.512 8.329 6.748 14.973 7.518 6.00 2.337 7.869 11.753 9.720 18.172 9.970 7.00 3.372 8.202 11.959 7.582 35.951 13.413 8.00 4.395 6.684 10.711 6.343 24.998 10.626 10.00 3.014 5.271 9.706 6.000 17.430 8.284 12.00 2.663 4.448 7.496 5.562 16.780 7.390 16.00 2.587 3.719 6.053 4.976 14.124 6.292 20.00 1.900 3.086 5.605 3.962 12.480 5.407 24.00 1.822 2.513 2.747 3.966 10.192 4.248 28.00 0.336 1.653 0.766 2.703 4.077 1.907 41.00 0.241 0.700 0.417 1.185 1.189 0.746 53.00 0.131 0.542 0.247 0.734 0.357 0.402 65.00 0.127 0.396 0.181 0.648 0.299 0.330 77.00 0.064 0.285 0.160 0.505 0.290 0.261 NA means below the lower limit of detection 3.2 Pharmacokinetic results of SD rats after receiving a single subcutaneous injection of 37.5 mg/kg TSL-4
[0276] After receiving a single subcutaneous injection of 37.5 mg/kg TSL-4, results of the plasma concentration-time curve were shown in FIG. 21, measured results of the plasma concentration were shown in Table 8, and results of the pharmacokinetic parameters were shown in Table 10.
TABLE-US-00013 TABLE 8 Plasma concentration of rats after receiving a single subcutaneous injection of 37.5 mg/kg TSL-4 (unit: .mu.g/mL) Rat No. Time/h 1 2 3 4 5 Mean 0.00 NA NA NA NA NA NA 0.50 1.180 1.202 1.816 1.534 1.277 1.402 1.00 1.974 1.514 2.370 1.151 3.838 2.169 3.00 23.044 13.341 9.819 5.861 14.678 13.349 5.00 36.313 18.726 10.891 12.949 19.600 19.696 6.00 44.277 20.173 20.450 16.158 38.541 27.920 7.00 64.960 21.479 38.009 22.359 29.552 35.272 8.00 62.784 25.446 31.080 12.944 20.137 30.478 10.00 44.656 21.055 21.153 10.006 26.810 24.736 12.00 36.576 17.149 17.361 8.919 15.856 19.172 16.00 13.903 7.767 12.942 6.885 13.925 11.084 20.00 9.514 3.313 9.915 4.605 11.259 7.721 24.00 4.801 3.205 5.617 3.076 5.918 4.523 28.00 1.952 2.730 3.953 1.833 0.959 2.285 41.00 0.780 0.912 1.824 0.779 0.303 0.920 53.00 0.431 0.466 0.510 0.391 0.237 0.407 65.00 0.357 0.301 0.370 0.291 0.243 0.312 77.00 0.269 0.253 0.169 0.244 0.138 0.215 NA means below the lower limit of detection 3.3 Pharmacokinetic results of SD rats after receiving a single subcutaneous injection of low-dose TSL-4
[0277] After receiving a single subcutaneous injection of 4.17 mg/kg TSL-4, results of the plasma concentration-time curve were shown in FIG. 22, measured results of the plasma concentration were shown in Table 9, and results of the pharmacokinetic parameters were shown in Table 10.
TABLE-US-00014 TABLE 9 Plasma concentration of rats after receiving a single subcutaneous injection of 4.17 mg/kg TSL-4 (unit: .mu.g/mL) Rat No. Time/h 1 2 3 4 5 Mean 0.00 0 0 0 0 0 0 0.50 0.00626 0.0985 0.131 0.0504 0.122 0.0818 1.00 0.0588 0.162 0.168 0.136 0.151 0.135 3.00 0.238 0.382 0.412 0.338 0.570 0.388 5.00 0.667 0.482 0.575 0.374 0.766 0.573 6.00 1.278 0.699 1.024 0.491 0.978 0.894 7.00 1.696 0.903 1.556 0.914 1.415 1.297 8.00 1.383 1.584 1.319 1.407 1.088 1.356 10.00 1.192 1.305 0.854 0.960 0.980 1.058 12.00 0.947 0.964 0.712 0.363 0.867 0.771 16.00 0.767 0.682 0.237 0.183 0.471 0.468 20.00 0.249 0.252 0.179 0.172 0.172 0.205 24.00 0.0638 0.0738 0.0533 0.155 0.155 0.100 28.00 0.0454 0.0406 0.0381 0.105 0.105 0.0667 41.00 0.0298 0.0288 0.0231 0.0954 0.0954 0.0545 53.00 0.0108 0.00740 0.0171 0.0669 0.0809 0.0366 65.00 0.008536 0.003139 0.0168 0.0440 0.044002 0.0233 77.00 0.005846 0.002666 0.0125 0.0181 0.018107 0.0114 NA means below the lower limit of detection 3.4 Comparison on pharmacokinetic parameters of SD rats after receiving a single subcutaneous injection of TSL-4 at different doses
[0278] After receiving a single subcutaneous injection of TSL-4 at different doses, the mean plasma concentration-time curve of rats was shown in FIG. 23; the relation between TSL-4 peak concentration (Cmax) and dosage of administration in plasma was shown in FIG. 24; the relation between area (AUC) and dosage of administration was shown in FIG. 25; and comparison results of major pharmacokinetic parameters were shown in Table 10.
TABLE-US-00015 TABLE 10 Comparison results of major pharmacokinetic parameters (n = 6) Single subcutaneous administration High-dose Medium-dose Low-dose group group group Parameter (37.5 mg/kg) (12.5 mg/kg) (4.17 mg/kg) ka 0.116 0.247 0.258 .alpha., ke 0.197 0.149 0.090 t1/2ka(h) 3.079 3.249 2.265 t1/2ke(h) 34.355 32.321 30.710 Vd/F(L/kg) 4.967 3.177 4.200 CL/F(L/h/kg) 0.101 0.071 0.925 AUC 0-77(.mu.g/L*h) 166338 116190.1 7055.774 AUC 0-.infin.(.mu.g/L*h) 176110 128430.2 9006.668 MRT 0-77(h) 13.988 18.248 14.880 MRT 0-.infin.(h) 15.755 20.882 17.330 Tmax(h) 7 7 7.4 Cmax(.mu.g/L) 37862.95 14045.39 1531.335
[0279] The above results indicated that after SD rats were subcutaneously injected high, medium and low doses (37.5 mg/kg, 12.5 mg/kg, 4.17 mg/kg) of TSL-4, AUC.sub.0-.infin. in each dose group was 9006.668.+-.3859.519, 147501.4.+-.28351.84, 176110.+-.39596.45 .mu.g/Lh respectively, showing a good linear relation with the dosage of administration (R.sup.2=0.9421); Cmax was 1.531.+-.0.122, 14.045.+-.3.182, 37.863.+-.8.396 .mu.g/mL respectively, showing a good linear relation with the dosage of administration (R.sup.2=0.9729); absorption half-life T.sub.1/2ka was respectively: 2.824.+-.0.697 h, 3.788.+-.0.848 h, 4.478.+-.0.223 h; the elimination half-life T.sub.1/2ke was 30.710.+-.3.100 h, 32.321.+-.4.935 h, 34.356.+-.1.578 h respectively; and peak time T.sub.max was 7.4.+-.0.55 h, 7.+-.0.707 h, 7.+-.0.707 h respectively. CL was 1.383.+-.0.528 L/h/kg, 0.070759.+-.0.0369 L/h/kg, 0.0569.+-.0.0336 L/h/kg respectively.
[0280] After receiving a single subcutaneous injection of TSL-4 at high, medium and low doses (37.5 mg/kg, 12.5 mg/kg, 4.17 mg/kg), TSL-4 showed a first-order kinetic process in SD rats, consistent with linear pharmacokinetic characteristics, and the C-T curve was consistent with a two-compartment model. The Time of TSL-4 at high, medium and low-dose groups was relatively longer, indicating that TSL-4 was more slowly eliminated in SD rats.
Embodiment 13: TSL-4 Tissue Distribution
[0281] Objectives:
[0282] (1) In vivo PET/CT scanning may be used to study the distribution for the ankle joints and rest tissues of the whole body of arthritis model rats after receiving a single subcutaneous injection of .sup.89Zr-HM-3.
[0283] (2) In-vitro tissue gamma counting may be used to study the distribution for the ankle joints and rest tissues of the whole body of arthritis model rats after receiving a single subcutaneous injection of .sup.89Zr-HM-3.
[0284] (3) In vivo PET/CT scanning may be used to study the distribution for the ankle joints and rest tissues of the whole body of arthritis model rats after receiving a single injection of .sup.89Zr-FIM-3 in ankle joint cavities.
[0285] Experimental Method:
[0286] Modeling method of type-II CIA model rats: 3 mL incomplete Freund's adjuvant (Chondrex Inc, batch No. 160111) and 3 mL type-II collagen (Chondrex Inc, Lot No. 160346) were emulsified on ice with a homogenizer until the emulsion was undispersed after dripped into water. Intracutaneous injections (2 points, 0.15 mL emulsion for each point) were conducted on the tails of Wistar rats (female, 130-150 g, certification No. 2015000526387 and 2015000527320, Shanghai SLAC Laboratory Animal Co., Ltd), and each rat was injected 0.3 mL emulsion to form local bulges on the skin surface. About 2 weeks later, the morbidity of rats was observed and scored.
TABLE-US-00016 TABLE 11 Scoring criteria of model morbidity Scoring Observation standards 0 No obvious redness and swelling 1 Erythema and mild swelling in tarsal or ankle joints only 2 Erythema and mild swelling extended to tarsal bones from ankle joints 3 Erythema and mild swelling extended metatarsal joints from ankle joints 4 Erythema and serious swelling in ankle joints, paws and toes
[0287] The arthritis model rats received standard CT/PET body scanning by a small-animal PET/CT at 1 h, 12 h, 24 h, 48 h, 120 h and 192 h respectively after subcutaneously injected .sup.89Zr-HM-3 and free .sup.89Zr; the arthritis model rats received standard CT/PET body scanning by the small-animal PET/CT at 1 h, 24 h, 48 h, 120 h, 192 h and 360 h respectively after injected .sup.89Zr-HM-3 via left ankle cavity. Combined with CT images, radioactivity intakes SUV and % ID/g were obtained by sketching the heart, liver, lung, kidney, brain, ankle joint cavity, vertebra and muscle of arthritis model rats.
[0288] The arthritis model rats received standard CT/PET body scanning at 48 h and 120 h firstly after subcutaneously injected .sup.89Zr-HM-3; then fluid of ankle joint cavity, whole blood, heart, liver, spleen, lung, kidney, stomach, small intestine (near pylorus), pancreas, vertebra, muscle, gonad and brain tissue were collected in a micro-perfusion manner, and placed into a radioimmunoassay tube after weighed, thus detecting radioactive uptake values in joint cavity fluid, whole blood and tissues by gamma counting. y counting results served to calculate the radioactivity intake % ID/g in blood and tissues of arthritis model rats
TABLE-US-00017 TABLE 12 Animal grouping, dosage of administration and sampling plan Administration Dosage of Radioactive Group Objective n Subject route administration dosage Time point 1 Tissue 3 female .sup.89Zr-HM-3 Subcutaneous About 12.5 300 .+-. 100 Static scanning.sup.a 1 h, distribution arthritis injection mg/kg .mu.Ci/pcs. 12 h, 24 h, 48 h, model rats 120 h, 192 h after administration 2 Tissue 3 female .sup.89Zr-HM-3 Subcutaneous About 12.5 300 .+-. 100 Static scanning 48 h Distribution arthritis injection mg/kg .mu.Ci/pcs. after administration, model rats The intra-articular fluid, whole blood and tissue were collected for gamma counting.sup.b 3 Tissue 3 female .sup.89Zr-HM-3 Subcutaneous About 12.5 300 .+-. 100 Static scanning, distribution arthritis injection mg/kg .mu.Ci/pcs. collection of joint model rats cavity fluid and whole blood, as well as gamma counting.sup.b 120 h after administration 4 Tissue 3 female .sup.89Zr-HM-3 Injection via NA 50 .+-. 20 Static scanning.sup.a 1 h, distribution arthritis ankle joint .mu.Ci/pcs. 24 h, 48 h, 120 h, model rats cavity 192 h, 360 h after administration 5 Tissue 1 female .sup.89Zr Subcutaneous NA 300 .+-. 100 Static scanning.sup.a 1 h, distribution arthritis injection .mu.Ci/pcs. 24 h, 24 h, 48 h, model rat 120 h, 192 h after administration .sup.aRats received multiple-bed body scanning (PET scanning for 10 min each one) 1 h, 12 h, 24 h, 48 h later after administration, multiple-bed body scanning (PET scanning for 15 min each one) 120 h and 192 h later as well as multiple-bed body scanning (PET scanning for 20 min each one) 360 h later. .sup.bTissue collection included the collection 12 organs, namely, heart, liver, spleen, lung, kidney, stomach, small intestine (near pylorus), pancreas, vertebra, muscle, gonad and brain. c: Arthritis model rats were anesthetized 10 min before scanning. The specific anesthesia was to induce anesthesia of SD rats by 3-5% isoflurane and 0.5-2 L/min air, and to maintain the anesthesia by 1-3% isoflurane and 0.5-1 L/min air. During the experiment, detailed information, such as animal weight, initial injection dose and measurement time, injection time, residual dose and measurement time, and scanning time of small-animal PET/CT at different time points were accurately recorded on the original record form.
Experimental Results
[0289] 1. Subject Labeling
TABLE-US-00018 TABLE 13 Experimental results of .sup.89Zr-HM-3 quality control Lot No. 16121501 16121502 L17011101 Character Clear and Clear and Clear and PH 7.2 7.2 7.2 Radio-chemically 90.40 90.40 92.71 purity(%) Chemical purity (%) 98.37 98.37 98.09
TABLE-US-00019 TABLE 14 Result-1 of .sup.89Zr-HM-3 in vitro stability test Lot No. 1 h 4 h 8 h 9 h 16121501 90.40% 90.01% 90.74% 90.11% 16121502 90.40% 90.01% 90.74% 90.11%
TABLE-US-00020 TABLE 15 Result-2 of 89Zr-HM-3 in vitro stability test Lot No. 1 h 4 h 7 h L17011101 91.03% 90.73% 90.89%
[0290] As shown in Tables 13-15, .sup.89Zr-HM-3 quality control of Lot No. 16121501, 16121502 and L17011101 conformed to experimental requirements.
[0291] 2. PET/CT Scanning
TABLE-US-00021 TABLE 16 PET/CT scanning radioactivity intake % ID/g of arthritis model rats after injected .sup.89Zr-HM-3 subcutaneously at 6 time points Tissue Time Left ankle Right ankle point Heart Lung Liver Kidney Brain cavity cavity Vertebra Muscle 1 h 0.01 .+-. 0.01 0.04 .+-. 0.06 0.00 .+-. 0.00 0.04 .+-. 0.01 0.00 .+-. 0.00 0.01 .+-. 0.00 0.01 .+-. 0.00 0.01 .+-. 0.00 0.01 .+-. 0.01 12 h 0.90 .+-. 0.04 0.34 .+-. 0.08 0.41 .+-. 0.03 0.66 .+-. 0.04 0.04 .+-. 0.01 0.28 .+-. 0.04 0.27 .+-. 0.10 0.17 .+-. 0.02 0.05 .+-. 0.01 24 h 1.02 .+-. 0.12 0.40 .+-. 0.11 0.58 .+-. 0.07 1.28 .+-. 0.05 0.08 .+-. 0.01 0.5 .+-. 0.13 0.50 .+-. 0.21 0.29 .+-. 0.03 0.11 .+-. 0.02 48 h 1.00 .+-. 0.03 0.50 .+-. 0.09 0.62 .+-. 0.04 2.08 .+-. 0.19 0.05 .+-. 0.02 0.52 .+-. 0.09 0.73 .+-. 0.42 0.4 .+-. 0.02 0.13 .+-. 0.02 120 h 0.59 .+-. 0.07 0.27 .+-. 0.07 0.69 .+-. 0.07 3.89 .+-. 0.08 0.06 .+-. 0.02 0.51 .+-. 0.11 0.57 .+-. 0.38 0.74 .+-. 0.19 0.14 .+-. 0.04 192 h 0.39 .+-. 0.07 0.22 .+-. 0.01 1.02 .+-. 0.27 4.42 .+-. 0.11 0.05 .+-. 0.01 0.47 .+-. 0.16 0.53 .+-. 0.31 1.02 .+-. 0.05 0.08 .+-. 0.01
[0292] As shown in Table 16, kidney radioactivity intake % ID/g of arthritis model rats was up to the maximum (0.04.+-.0.01) 1 h after receiving the subcutaneous injection of .sup.89Zr-HM-3, followed by lung>left ankle cavity=right ankle cavity=vertebra>heart=muscle>liver; at 12 h, the heart radioactivity intake % ID/g was up to the maximum (0.90.+-.0.04), followed by kidney>liver>lung>left ankle cavity>right ankle cavity>vertebra>muscle; at 24 h, the kidney radioactivity intake % ID/g was up to the maximum (1.28.+-.0.05), followed by heart>liver>left ankle cavity>right ankle cavity>lung>vertebra>muscle; at 48 h, the kidney radioactivity intake % ID/g was up to the maximum (2.08.+-.0.19), followed by heart>right ankle cavity>liver>left ankle cavity>lung>vertebra>muscle; at 120 h, the kidney radioactivity intake % ID/g was up to the maximum (3.89.+-.0.08), followed by vertebra>liver>heart>right ankle cavity>left ankle cavity>lung>muscle; at 192 h, the kidney radioactivity intake % ID/g was up to the maximum (4.42.+-.0.11), followed by vertebra>liver>right ankle cavity>left ankle cavity>heart>lung>muscle.
[0293] After arthritis model rats received the subcutaneous injection of .sup.89Zr-HM-3, the radioactivity intake % ID/g of heart was up to the minimum (0.01.+-.0.01) at 1 h and up to the maximum (1.02.+-.0.12) at 24 h, afterwards gradually decreased with time; the radioactivity intake % ID/g of lung, left ankle cavity and right ankle cavity was up to the minimum at 1 h, being 0.04.+-.0.06, 0.01.+-.0.00 and 0.01.+-.0.00 respectively, and up to the maximum at 48 h, namely, 0.50.+-.0.09, 0.52.+-.0.09 and 0.73.+-.0.42 respectively, afterwards, it gradually decreased with time; the radioactivity intake % ID/g of liver, kidney and vertebra was up to the minimum at 1 h, namely, 0.00.+-.0.00, 0.04.+-.0.01 and 0.01.+-.0.00 respectively, and gradually increased with time, being up to the maximum at 192 h, namely, 1.02.+-.0.27, 4.42.+-.0.11, 1.02.+-.0.05 respectively; the radioactivity intake % ID/g muscle was up to the minimum (0.01.+-.0.01) at 1 h and up to the maximum (0.14.+-.0.04) at 120 h. Specific results were shown in FIG. 26.
TABLE-US-00022 TABLE 17 PET/CT scanning radioactivity intake % ID/g of arthritis model rats after receiving the subcutaneous injection of .sup.89Zr-HM-3 at 48 h and 120 h respectively Tissue Time Left ankle Right ankle point Heart Lung Liver Kidney Brain cavity cavity Vertebra Muscle 48 h 1.12 .+-. 0.06 0.61 .+-. 0.05 0.81 .+-. 0.04 2.60 .+-. 0.09 0.12 .+-. 0.02 0.42 .+-. 0.11 0.38 .+-. 0.07 0.46 .+-. 0.01 0.22 .+-. 0.03 120 h 0.67 .+-. 0.02 0.60 .+-. 0.35 0.66 .+-. 0.15 3.72 .+-. 0.70 0.12 .+-. 0.03 0.50 .+-. 0.32 0.39 .+-. 0.09 0.65 .+-. 0.13 0.20 .+-. 0.05
[0294] As shown in Table 17, PET/CT scanning was performed to arthritis model rats after receiving the subcutaneous injection of .sup.89Zr-HM-3 at 48 h, and then tissues were collected for gamma counting to obtain the following results: the radioactivity intake % ID/g of kidney was up to the maximum (2.60.+-.0.09), followed by heart>liver>lung>vertebra>left ankle cavity>right ankle cavity>muscle; PET/CT scanning was performed to arthritis model rats after receiving the subcutaneous injection of .sup.89Zr-HM-3 at 120 h, and then tissues were collected for gamma counting to obtain the following results: the radioactivity intake % ID/g of kidney was up to the maximum (3.72.+-.0.70), followed by heart>liver>vertebra>lung>left ankle cavity>right ankle cavity>muscle. Specific results were shown in FIG. 27.
TABLE-US-00023 TABLE 18 Radioactivity intake % ID/g of arthritis model rats after injected .sup.89Zr-HM-3 in left ankle cavity at 6 time points Tissue Time Left ankle Right ankle point Heart Lung Liver Kidney Brain cavity cavity Vertebra Muscle 1 h 0.59 .+-. 0.94 0.25 .+-. 0.42 0.40 .+-. 0.65 0.39 .+-. 0.57 0.02 .+-. 0.04 42.20 .+-. 17.33 0.11 .+-. 0.18 0.10 .+-. 0.17 0.06 .+-. 0.10 24 h 1.15 .+-. 0.14 0.71 .+-. 0.39 0.88 .+-. 0.21 1.37 .+-. 0.42 0.12 .+-. 0.03 6.50 .+-. 3.06 0.49 .+-. 0.31 0.38 .+-. 0.05 0.18 .+-. 0.01 48 h 0.77 .+-. 0.21 0.48 .+-. 0.12 0.66 .+-. 0.16 1.67 .+-. 0.57 0.05 .+-. 0.01 2.75 .+-. 0.64 0.73 .+-. 0.05 0.47 .+-. 0.11 0.19 .+-. 0.03 120 h 0.43 .+-. 0.12 0.34 .+-. 0.05 0.61 .+-. 0.29 2.78 .+-. 0.44 0.06 .+-. 0.04 1.90 .+-. 0.26 0.56 .+-. 0.25 0.44 .+-. 0.14 0.12 .+-. 0.01 192 h 0.35 .+-. 0.06 0.25 .+-. 0.10 0.74 .+-. 0.54 3.04 .+-. 0.52 0.07 .+-. 0.06 1.72 .+-. 0.29 0.53 .+-. 0.27 0.66 .+-. 0.18 0.09 .+-. 0.02 360 h 0.39 .+-. 0.27 0.11 .+-. 0.04 0.81 .+-. 0.05 2.70 .+-. 0.54 0.08 .+-. 0.04 1.69 .+-. 0.29 0.42 .+-. 0.42 0.82 .+-. 0.13 0.09 .+-. 0.07
[0295] As shown in Table 18, the radioactivity intake % ID/g of left ankle cavity of arthritis model rats was up to the maximum (42.20.+-.17.33) 1 h later after injected 89 Zr-HM-3 in left ankle cavity, followed by heart>liver>kidney>lung>right ankle cavity>vertebra>muscle; at 24 h, the radioactivity intake % ID/g of left ankle cavity was up to the maximum (6.50.+-.3.06), followed by kidney>heart>liver>lung>right ankle cavity>vertebra>muscle; at 48 h, the radioactivity intake % ID/g of left ankle cavity was up to the maximum (2.75.+-.0.64), followed by kidney>heart>right ankle cavity>liver>lung>vertebra>muscle; at 120 h, the radioactivity intake % ID/g of kidney was up to the maximum (2.78.+-.0.44), followed by left ankle cavity>liver>right ankle cavity>vertebra>heart>lung>muscle; at 192 h, the radioactivity intake % ID/g of kidney was up to the maximum (3.04.+-.0.52), followed by left ankle cavity>liver>vertebra>right ankle cavity>heart>lung>muscle; at 360 h, the radioactivity intake % ID/g of kidney was up to the maximum (2.70.+-.0.54), followed by left ankle cavity>vertebra>liver>right ankle cavity>heart>muscle.
[0296] After arthritis model rats were injected with 89Zr-HM-3 into left ankle cavity, the radioactivity intake % ID/g of heart and lung was 0.59.+-.0.94 and 0.25.+-.0.42 at 1 h respectively, up to the maximum at 24 h, being 1.15.+-.0.14 and 0.71.+-.0.39 respectively, afterwards gradually decreased with time; the radioactivity intake % ID/g of left ankle cavity was up to the maximum at 1 h (42.20.+-.17.33), then decreased gradually with the time and up to the minimum at 360 h (1.69.+-.0.29); the radioactivity intake % ID/g of right ankle cavity and muscle was up to the minimum at 1 h, being 0.11.+-.0.18 and 0.06.+-.0.10 respectively, and up to the maximum at 48 h, being 0.73.+-.0.05 and 0.19.+-.0.03 respectively, afterwards gradually decreased with time; the radioactivity intake % ID/g of liver was up to the minimum (0.40.+-.0.65) at 1 h and up to the maximum (0.88.+-.0.21) at 24 h, afterwards slightly decreased with time; the radioactivity intake % ID/g of kidney was up to the minimum (0.39.+-.0.57) at 1 h and up to the maximum (3.04.+-.0.52) at 192 h, afterwards gradually decreased with time; the radioactivity intake % ID/g of vertebra was up to the minimum (0.10.+-.0.17) at 1 h and gradually increased with time, being up to the maximum (0.82.+-.0.13) at 360 h. Specific results were shown in FIG. 28.
TABLE-US-00024 TABLE 19 Radioactivity intake % ID/g of arthritis model rats after receiving the subcutaneous injection of free .sup.89Zr at 6 time points Tissue Time Left ankle Right ankle point Heart Lung Liver Kidney Brain cavity cavity Vertebra Muscle 1 h 1.08 0.45 0.52 0.60 0.07 0.06 0.16 0.52 0.12 12 h 1.62 0.85 0.86 0.89 0.17 0.25 0.65 2.43 0.31 24 h 1.18 0.56 0.77 0.75 0.19 0.27 0.92 3.64 0.23 48 h 0.46 0.41 0.76 0.79 0.10 0.34 1.13 4.05 0.17 120 h 0.17 0.14 0.57 0.73 0.23 0.34 1.25 5.35 0.16 192 h 0.11 0.10 0.44 0.55 0.13 0.32 1.05 5.38 0.20
[0297] As shown in Table 19, the heart radioactivity intake % ID/g was up to the maximum (1.08) at 2 h, followed by kidney>liver=vertebra>lung>right ankle cavity>muscle>left ankle cavity; the vertebra radioactivity intake % ID/g was up to the maximum at 12 h, 24 h, 48 h, 120 h, 192 h, being 2.43, 3.64, 4.05, 5.35, 5.38 respectively, which was much higher than other tissues at the same time point.
[0298] 3. Gamma Counting
TABLE-US-00025 TABLE 20 Tissue radioactivity intake % ID/g of arthritis model rats after receiving the subcutaneous injection of .sup.89Zr-HM-3 at 48 h and 120 h respectively Time point Tissue 48 h 120 h Whole blood 2.32 .+-. 0.20 1.63 .+-. 0.21 Heart 0.41 .+-. 0.01 0.31 .+-. 0.02 Liver 0.58 .+-. 0.04 0.63 .+-. 0.08 Spleen 0.44 .+-. 0.05 0.67 .+-. 0.11 Lung 0.80 .+-. 0.08 0.98 .+-. 0.42 Kidney 0.79 .+-. 0.21 2.16 .+-. 1.94 Stomach 0.27 .+-. 0.03 0.26 .+-. 0.06 Intestines 0.38 .+-. 0.01 0.62 .+-. 0.18 Pancreas 0.31 .+-. 0.02 0.36 .+-. 0.12 Vertebra 0.37 .+-. 0.03 0.50 .+-. 0.05 Muscle 0.17 .+-. 0.02 0.17 .+-. 0.05 Gonad 0.73 .+-. 0.09 0.69 .+-. 0.17 Brain 0.03 .+-. 0.01 0.03 .+-. 0.01 Joint cavity fluid 0.34 .+-. 0.18 0.65 .+-. 0.32
[0299] As shown in Table 20, whole blood and tissues of arthritis model rats were collected at 48 h after receiving the subcutaneous injection of .sup.89Zr-HM-3, the radioactivity intake % ID/g of whole blood was up to the maximum (2.32.+-.0.20), followed by lung>kidney>gonad>liver>spleen>heart>intestines>vert- ebra>joint cavity fluid>pancreas>stomach>muscle; whole blood and tissues of experimental animals were collected at 120 h after receiving the subcutaneous injection of .sup.89Zr-HM-3, the radioactivity intake % ID/g of kidney was up to the maximum (2.16.+-.1.94), followed by whole blood>lung>gonad>spleen>joint cavity fluid>liver>intestine>vertebra>pancreas>heart>stomach&g- t;muscle. Specific results were shown in FIG. 29.
[0300] 4. Conclusion
[0301] The results showed that the free 89Zr was mainly distributed in bones 12 h after administration, the 89Zr radioactivity intake % ID/g in bones was much higher than other tissues at 12 h, 24 h, 48 h, 120 h and 196 h, indicating that 89Zr-HM-3 could basically stably exist in arthritis model rats; and the radioactivity intake % ID/g in brain was always very low at all time points, and close to or lower than that in muscle at the same time points, indicating that 89Zr-HM-3 crossed blood-brain barrier difficulty. The radioactivity intake of heart in arthritis model rats after receiving the subcutaneous injection of 89Zr-HM-3 and injection into left ankle cavity was up to the maximum at 24 h, and then gradually decreased with time; the radioactivity intake of ankle cavity (non-administrated site) was up to the maximum at 48 h, and then decreased gradually with time. The radioactivity intake of kidney and liver gradually increased or kept a higher level with time.
TABLE-US-00026 TABLE 21 Half-life (h) in the heart of arthritis model rats after receiving the subcutaneous injection of .sup.89Zr-HM-3 and injection into left ankle cavity respectively Experiment No. G1-F-01 G1-F-02 G1-F-03 G4-F-01 G4-F-02 G4-F-03 T.sub.1/2 153.17 89.21 119.66 56.84 127.11 111.09
[0302] As shown in Table 21, analyzed by a DAS3.2.8 non-compartment model, the half-life of arthritis model rats subcutaneously injected 89Zr-HM-3 was 120.68.+-.31.99 h; the half-life of arthritis model rats injected 89Zr-HM-3 in left ankle cavity was 98.35.+-.36.83 h.
Embodiment 14 Protective Effect of HM-3 Fusion Protein TSL-4 on Bone Tissue Cells Injured by Hydrogen Peroxide
1. Experimental Method
[0303] All cell experiments should be operated in a sterile biosafety cabinet, and the operating platform should be sterilized (UV irradiation and 75% medical alcohol), moreover, waste cell liquor should be collected in a waste liquor barrel, furthermore, the waste transfer pipette and pipette tip used in the experiment should be put into an autoclaved bag for autoclaved sterilization.
[0304] Chondrocytes were cultured in a T75 flask for 3-4 days. When the degree of fusion reached 80%, the original culture medium was removed, and sterile PBS was added to clean the cells for 2-3 times, then a proper amount of digestive juice was added, and a fresh culture medium was added after the cells were detached. Cells were centrifuged to remove the cell sap containing the digestive juice, and a proper amount of fresh culture medium was added to be prepared into a cell suspension with appropriate concentration for cell subculture or cell experiments. Cell subculture began from generation P1 and ended till generation P5, and there were cryopreserved cells in each generation. Cells were used for the experiment when subcultured to P2-P5.
[0305] According to the inoculum size of 200 .mu.L/well, the cell suspension with the density of 2.5*10.sup.4/mL was inoculated onto a 96-well cell culture plate, and 3 groups were prepared in total, one for control group, and the other two groups were stimulated by hydrogen peroxide. A cell-free medium was prepared as a blank group. There were 4-5 sub-wells prepared in each group. The cell culture plate was put to an incubator for incubation for 24 hours. The culture medium was replaced to different experimental groups in the following day with a dose volume of 100 .mu.l and incubated for 24 or 48 hours respectively.
[0306] At the end of incubation according to the experimental plan, 10 .mu.L of 5 mg/ml MTT was added to each experimental group based upon 1/10 of the cell culture volume, so that the cells were incubated with MTT in the incubator for 4 hours. Afterwards, supernatant was carefully discarded, and 200 .mu.L of dimethyl sulfoxide (DMSO) was added for mixing well, then the absorbance was measured on a microplate reader at a test wavelength of 570 nm. Calculating formula of relative cell activity ratio (%): a mean value of the absorbance (per well) in the experimental group/the absorbance in the control group multiplies by 100%. All experimental groups were expressed as mean.+-.standard deviation (X.+-.SD). The difference between each group was analyzed by Prism 7.0, and tested by one-way ANOVA. *P<0.05 means statistical difference, **P<0.01 means significant statistical difference, and **P<0.001 means extremely significant statistical difference.
2. Main Experimental Materials
[0307] (1) Rat chondrocyte, Art. No.: RAT-iCell-s003, iCell Bioscience. [0308] (2) Molding agent: Medical LIRCON.RTM.3% hydrogen peroxide disinfectant solution (H.sub.2O.sub.2, hydrogen peroxide) (0.9 M), Lot No.: 170928, LIRCON. [0309] (3) Cell culture medium system: primary chondrocyte basal medium+10% fetal bovine serum (FBS)+1% cell culture additives+1% penicillin/streptomycin (PS) (Art. No.: PriMed-iCell-020, iCell Bioscience) [0310] (4) Related reagents of cell subculture: PBS sterile saline solution (pH=7.2) (Art. No.: C0221A, Beyotime Biotechnology); digestive juice: 0.02% EDTA+0.25% trypsin solution (Art. No.: 25200056, Thermo Fischer Scientific Inc.); common sterile heating-inactivated serum (Art. No.: 10100147, Gibco). [0311] (5) MTT-related reagents: MTT (thiazolyl blue) (Art. No.: M2128-500 mg, Sigma); DMSO (D5879-500 ml, Sigma).
3. Experimental Results
Experiment 1 H.sub.2O.sub.2 Molding Time and Dosage Optimization
[0312] The experimental concentration of hydrogen peroxide ranged within 0.01, 0.1, 0.5, 1, 10 mM. In order to determine the H.sub.2O.sub.2 molding time and dosage, three molding time points at 24 hours, 48 hours and 72 hours were selected, and two detection wells were prepared in total for each dosage of hydrogen peroxide.
TABLE-US-00027 TABLE 22 MTT test values under different molding time and dosages of H.sub.2O.sub.2 Dosage (mM) of chondrocytes injured by H.sub.2O.sub.2 24 h 48 h 72 h 0 2.35 2.24 1.94 0.01 2.51 2.1 1.99 0.1 2.29 2.08 1.92 1 1.28 1.47 0.81 10 0.06 0.56 -0.07
[0313] The above results indicated that after simulated by hydrogen peroxide, chondrocytes had similar changes in cell viability at 24, 48 and 72 hours; cell viability decreased with the increase of H.sub.2O.sub.2 concentration. Moreover, compared with the control group (0 mM H.sub.2O.sub.2), the cell viability under the concentration of 1 and 10 mM significantly dropped at the three time points, therefore, 24 h served as H.sub.2O.sub.2 molding time. In addition, the dosage of hydrogen peroxide was optimal when the relative activity to the control group was about 0.5. The results showed that the dosage of hydrogen peroxide should be selected within 0.1-1 mM.
Experiment 2 Optimization for the Dosage of HM-3 Fusion Protein TSL-4
[0314] The concentration of TSL-4 should be selected within 0.1, 0.3, 1, 3, 9, 27 .mu.M.
[0315] To determine whether TSL-4 influenced the viability of chondrocytes, 3 incubation time points at 24, 48 and 72 hours were selected, and two detection wells were prepared for each dosage of TSL-4 solution in total.
TABLE-US-00028 TABLE 23 MTT test values under different administration time and dosages of TSL-4 TSL-4 dosage of administration (.mu.M) 24 h 48 h 72 h 0 1.43 1.70 1.51 1 1.59 1.43 1.61 3 1.67 1.43 1.52 9 1.72 1.51 1.57 27 1.45 1.30 1.31
[0316] The above results indicated that TSL-4 had no significant influence on cell viability at 24, 48, and 72 hours, and there was no significant difference between each dosage of TSL-4 and the control group (0 .mu.M TSL-4). Thus, 24 hours was selected as the TSL-4 administration time. However, there was no difference to TSL-4 among 1-27 .mu.M dosages, so the effect of low-dose TSL-4 on cell viability should be tested again.
TABLE-US-00029 TABLE 24 MTT test values 24 hours later after administrating the low-dose TSL-4 TSL-4 dosage of administration (.mu.M) 24 h 0 1.23 0.1 1.26 0.3 1.2 1 1.15 3 1.08
[0317] The above results indicated that TSL-4 had no significant difference to the influence on cell viability among 0.1-3 .mu.M.
[0318] In early experiment, the TSL-4 at each concentration had no effect on cell viability, therefore, it was diluted to 0.23 .mu.M from 29.3 .mu.M according to a dilution ratio of 1:5 based upon the concentration (293 .mu.M) of the primary TSL-4 solution.
TABLE-US-00030 TABLE 25 MTT test values 24 hours after administrating the recommended dosage of TSL-4 TSL-4 dosage of administration (.mu.M) 24 h 0 1.68 0.23 1.59 1.17 1.4 5.86 1.39 29.3 1.24
[0319] Similarly, there was no significant change in cell viability after the TSL-4 at various concentrations (0.23-29.3 .mu.M) and chondrocytes were cultured for 24 h, therefore, 0.23, 1.17, 5.86, 29.3 .mu.M were selected as the dosing concentration of TSL-4 in the subsequent experiments.
Experiment 3 Detection on the Protective Effect of TSL-4 on Chondrocytes Injured by Hydrogen Peroxide
[0320] In order to detect the protective effect of TSL-4 on chondrocytes injured by hydrogen peroxide, the experiment was divided into three groups control group (no hydrogen peroxide and TSL-4, only adding fresh culture medium), hydrogen peroxide modeling group (only adding hydrogen peroxide cell culture medium containing different concentrations) and TSL-4 administration group (containing hydrogen peroxide). In order to detect the protective effect of TSL-4 on chondrocytes injured by hydrogen peroxide, TSL-4 and hydrogen peroxide were cultured with chondrocytes for 24 hours. The dosage of hydrogen peroxide was selected within 0.1, 0.25, 0.5 and 1 mM; the TSL-4 dosage was 0.23, 1.17, 5.86, 29.3
[0321] In the presence of different doses of H.sub.2O.sub.2, TSL-4 at proper concentration and chondrocytes were cultured for 24 h, and the relative cell viability in each administration group (relative absorbance percentage to the control group) was expressed as the following X.+-.SD.
TABLE-US-00031 TABLE 26 Effect of hydrogen peroxide at different concentration and TSL-4 at different dosages on the viability of chondrocytes TSL-4 dosage of Concentration of molding agent H.sub.2O.sub.2 (mM) administration (.mu.M) 0.1 0.25 0.5 1 0 106.87 .+-. 9.52 70.96 .+-. 11.61 1.68 .+-. 0.82 3.57 .+-. 0.60 0.23 84.23 .+-. 20.42*** 71.42 .+-. 6.74 3.17 .+-. 1.45 0.89 .+-. 0.32 1.17 100.01 .+-. 5.02 85.11 .+-. 8.08* 16.56 .+-. 5.91* 1.14 .+-. 1.07 5.86 102.36 .+-. 9.75 86.35 .+-. 4.20* 10.27 .+-. 7.08 1.21 .+-. 0.70 29.3 76.46 .+-. 5.45**** 59.72 .+-. 3.49 3.87 .+-. 6.00 0.43 .+-. 0.53 The above results indicated that 1.17 or 5.86 .mu.M TSL-4 may significantly improve the viability of chondrocytes injured by hydrogen peroxide at the concentration of 0.25 and 0.5 mM H.sub.2O.sub.2; in addition, simulated by 0.1 mM H.sub.2O.sub.2, 0.23 and 29.3 .mu.M TSL-4 played an significant role on cell viability; *P < 0.05; **P < 0.01; ***P < 0.001; ****P < 0.0001.
[0322] In Experiment 1 of Embodiment 14, the optimal molding concentration of hydrogen peroxide was measured within 0.1 and 1 mM. In this experiment, the cell viability ratio (%) decreased to about 5% when the concentration of hydrogen peroxide was 0.5 mM and 1 mM, which indicated that H.sub.2O.sub.2 molding was unstable, easy to cause a result difference. The result difference may be resulted from the poor oxidation resistance of chondrocytes caused by the difference in the number of chondrocyte subculture (chondrocytes were subcultured to P4 in this experiment). It can be seen from a literature that chondrocytes are susceptible to fibrosis in a 2D monocellular culture environment, and the type-II collagen and polysaccharides expressed thereby decrease. To detect the TSL-4 protective effect on chondrocytes injured by hydrogen peroxide accurately, and according to the above experimental results, the H.sub.2O.sub.2 molding concentration should be lower than 0.5 mM, and the viability ratio of chondrocytes stimulated by 0.25 mM H.sub.2O.sub.2 was about 70%, so a concentration should be selected from the range within 0.25 and 0.5 mM, for example: 0.35 mM H.sub.2O.sub.2. In addition, there was a statistical difference (P<0.05) when the concentration of H.sub.2O.sub.2 was 0.25 or 0.5 mM, and the optimal dosing concentration of TSL-4 was 1.17 and 5.86 .mu.M. On the contrary, 0.23/29.3 .mu.M TSL-4 had a relatively significantly inhibiting effect on the viability of chondrocytes stimulated by 0.1 mM H.sub.2O.sub.2. Therefore, the experiment was repeated for the second time and the dosing concentration of TSL-4 was selected 1.17 and 5.86 .mu.M.
[0323] In the presence of the molding agent H.sub.2O.sub.2 at 0.25, 0.35, 0.5 mM, 1.17 and 5.86 .mu.M TSL-4 were cultured with chondrocytes for 24 h, and the relative cell viability in each administration group (relative absorbance percentage to the control group) was expressed as the followings X.+-.SD.
TABLE-US-00032 TABLE 27 Repeated trials on the effect of hydrogen peroxide and TSL-4 on the viability of chondrocytes TSL-4 dosage of Concentration of molding agent H.sub.2O.sub.2 (mM) administration (.mu.M) 0.25 0.35 0.5 0 78.77 .+-. 7.45 63.96 .+-. 6.46 37.10 .+-. 6.53 1.17 85.31 .+-. 7.36 68.54 .+-. 3.62 41.46 .+-. 2.08 5.86 87.36 .+-. 7.85 73.29 .+-. 4.39 45.07 .+-. 6.36
[0324] The above results indicated that stimulated by three-dosage (0.25, 0.35, 0.5 mM) of H.sub.2O.sub.2, chondrocytes injured by H.sub.2O.sub.2 achieved improvement in the viability under the conditions of 1.17 and 5.86 .mu.M TSL-4; and in the presence of 0.35 mM of H.sub.2O.sub.2, 5.86 .mu.M TSL-4 may significantly improve the viability of chondrocytes. One-way ANOVA served to analyze the comparison of the difference between each administration group and model group at corresponding concentration, * expressed a statistical difference and *P<0.05. Therefore, compared with the model group, the group of co-culturing 5.86 .mu.M TSL-4 and 0.25-0.5 mM for 24 h may significantly improve the viability of chondrocytes injured by H.sub.2O.sub.2.
[0325] To sum up, the co-incubation of TSL-4 and H.sub.2O.sub.2 may remarkably improve the viability of chondrocytes, therefore, TSL-4 and H.sub.2O.sub.2 were incubated together for 24 which served as the best administration time. The modeling concentration of hydrogen peroxide ranged within 0.25-0.5, and H.sub.2O.sub.2 was incubated with TSL-4 to significantly improve cell viability; TSL-4 achieved better improvement for cell viability at the dosing concentration of 1.17 and 5.86 .mu.M.
Sequence CWU 1
1
281789DNAArtificial SequenceDescription of Artificial Sequence
Synthetic polynucleotide 1gctgagtcca aatatggtcc cccatgccca
ccctgcccag cacctgaggc cgccggggga 60ccatcagtct tcctgttccc cccaaaaccc
aaggacactc tcatgatctc ccggacccct 120gaggtcacgt gcgtggtggt
ggacgtgagc caggaagacc ccgaggtcca gttcaactgg 180tacgtggatg
gcgtggaggt gcataatgcc aagacaaagc cgcgggagga gcagttcaac
240agcacgtacc gtgtggtcag cgtcctcacc gtcctgcacc aggactggct
gaacggcaag 300gagtacaagt gcaaggtctc caacaaaggc ctcccgtcct
ccatcgagaa aaccatctcc 360aaagccaaag ggcagccccg agagccacag
gtgtacaccc tgcccccatc ccaggaggag 420atgaccaaga accaggtcag
cctgacctgc ctggtcaaag gcttctaccc cagcgacatc 480gccgtggagt
gggagagcaa tgggcagccg gagaacaact acaagaccac gcctcccgtg
540ctggactccg acggctcctt cttcctctac agcaggctaa ccgtggacaa
gagcaggtgg 600caggagggga atgtcttctc atgctccgtg atgcatgagg
ctctgcacaa ccactacaca 660cagaagagcc tctccctgtc tctgggtggc
ggcggcggca gcggcggcgg cggcagcggc 720ggcggcggca gcatcgtccg
ccgcgcggac cgcgcggcgg tcccgggcgg cggcggccgc 780ggcgactga
7892858DNAArtificial SequenceDescription of Artificial Sequence
Synthetic polynucleotide 2gccaccatgg catgccctgg cttcctgtgg
gcacttgtga tctccacctg tcttgaattt 60agcatggctg ctgagtccaa atatggtccc
ccatgcccac cctgcccagc acctgaggcc 120gccgggggac catcagtctt
cctgttcccc ccaaaaccca aggacactct catgatctcc 180cggacccctg
aggtcacgtg cgtggtggtg gacgtgagcc aggaagaccc cgaggtccag
240ttcaactggt acgtggatgg cgtggaggtg cataatgcca agacaaagcc
gcgggaggag 300cagttcaaca gcacgtaccg tgtggtcagc gtcctcaccg
tcctgcacca ggactggctg 360aacggcaagg agtacaagtg caaggtctcc
aacaaaggcc tcccgtcctc catcgagaaa 420accatctcca aagccaaagg
gcagccccga gagccacagg tgtacaccct gcccccatcc 480caggaggaga
tgaccaagaa ccaggtcagc ctgacctgcc tggtcaaagg cttctacccc
540agcgacatcg ccgtggagtg ggagagcaat gggcagccgg agaacaacta
caagaccacg 600cctcccgtgc tggactccga cggctccttc ttcctctaca
gcaggctaac cgtggacaag 660agcaggtggc aggaggggaa tgtcttctca
tgctccgtga tgcatgaggc tctgcacaac 720cactacacac agaagagcct
ctccctgtct ctgggtggcg gcggcggcag cggcggcggc 780ggcagcggcg
gcggcggcag catcgtccgc cgcgcggacc gcgcggcggt cccgggcggc
840ggcggccgcg gcgactga 858318PRTArtificial SequenceDescription of
Artificial Sequence Synthetic peptide 3Ile Val Arg Arg Ala Asp Arg
Ala Ala Val Pro Gly Gly Gly Gly Arg1 5 10 15Gly Asp4232PRTHomo
sapiens 4Glu Pro Lys Ser Cys Asp Lys Thr His Thr Cys Pro Pro Cys
Pro Ala1 5 10 15Pro Glu Leu Leu Gly Gly Pro Ser Val Phe Leu Phe Pro
Pro Lys Pro 20 25 30Lys Asp Thr Leu Met Ile Ser Arg Thr Pro Glu Val
Thr Cys Val Val 35 40 45Val Asp Val Ser His Glu Asp Pro Glu Val Lys
Phe Asn Trp Tyr Val 50 55 60Asp Gly Val Glu Val His Asn Ala Lys Thr
Lys Pro Arg Glu Glu Gln65 70 75 80Tyr Asn Ser Thr Tyr Arg Val Val
Ser Val Leu Thr Val Leu His Gln 85 90 95Asp Trp Leu Asn Gly Lys Glu
Tyr Lys Cys Lys Val Ser Asn Lys Ala 100 105 110Leu Pro Ala Pro Ile
Glu Lys Thr Ile Ser Lys Ala Lys Gly Gln Pro 115 120 125Arg Glu Pro
Gln Val Tyr Thr Leu Pro Pro Ser Arg Asp Glu Leu Thr 130 135 140Lys
Asn Gln Val Ser Leu Thr Cys Leu Val Lys Gly Phe Tyr Pro Ser145 150
155 160Asp Ile Ala Val Glu Trp Glu Ser Asn Gly Gln Pro Glu Asn Asn
Tyr 165 170 175Lys Thr Thr Pro Pro Val Leu Asp Ser Asp Gly Ser Phe
Phe Leu Tyr 180 185 190Ser Lys Leu Thr Val Asp Lys Ser Arg Trp Gln
Gln Gly Asn Val Phe 195 200 205Ser Cys Ser Val Met His Glu Ala Leu
His Asn His Tyr Thr Gln Lys 210 215 220Ser Leu Ser Leu Ser Pro Gly
Lys225 2305228PRTHomo sapiens 5Glu Arg Lys Cys Cys Val Glu Cys Pro
Pro Cys Pro Ala Pro Pro Val1 5 10 15Ala Gly Pro Ser Val Phe Leu Phe
Pro Pro Lys Pro Lys Asp Thr Leu 20 25 30Met Ile Ser Arg Thr Pro Glu
Val Thr Cys Val Val Val Asp Val Ser 35 40 45His Glu Asp Pro Glu Val
Gln Phe Asn Trp Tyr Val Asp Gly Val Glu 50 55 60Val His Asn Ala Lys
Thr Lys Pro Arg Glu Glu Gln Phe Asn Ser Thr65 70 75 80Phe Arg Val
Val Ser Val Leu Thr Val Val His Gln Asp Trp Leu Asn 85 90 95Gly Lys
Glu Tyr Lys Cys Lys Val Ser Asn Lys Gly Leu Pro Ala Pro 100 105
110Ile Glu Lys Thr Ile Ser Lys Thr Lys Gly Gln Pro Arg Glu Pro Gln
115 120 125Val Tyr Thr Leu Pro Pro Ser Arg Glu Glu Met Thr Lys Asn
Gln Val 130 135 140Ser Leu Thr Cys Leu Val Lys Gly Phe Tyr Pro Ser
Asp Ile Ser Val145 150 155 160Glu Trp Glu Ser Asn Gly Gln Pro Glu
Asn Asn Tyr Lys Thr Thr Pro 165 170 175Pro Met Leu Asp Ser Asp Gly
Ser Phe Phe Leu Tyr Ser Lys Leu Thr 180 185 190Val Asp Lys Ser Arg
Trp Gln Gln Gly Asn Val Phe Ser Cys Ser Val 195 200 205Met His Glu
Ala Leu His Asn His Tyr Thr Gln Lys Ser Leu Ser Leu 210 215 220Ser
Pro Gly Lys2256279PRTHomo sapiens 6Glu Leu Lys Thr Pro Leu Gly Asp
Thr Thr His Thr Cys Pro Arg Cys1 5 10 15Pro Glu Pro Lys Ser Cys Asp
Thr Pro Pro Pro Cys Pro Arg Cys Pro 20 25 30Glu Pro Lys Ser Cys Asp
Thr Pro Pro Pro Cys Pro Arg Cys Pro Glu 35 40 45Pro Lys Ser Cys Asp
Thr Pro Pro Pro Cys Pro Arg Cys Pro Ala Pro 50 55 60Glu Leu Leu Gly
Gly Pro Ser Val Phe Leu Phe Pro Pro Lys Pro Lys65 70 75 80Asp Thr
Leu Met Ile Ser Arg Thr Pro Glu Val Thr Cys Val Val Val 85 90 95Asp
Val Ser His Glu Asp Pro Glu Val Gln Phe Lys Trp Tyr Val Asp 100 105
110Gly Val Glu Val His Asn Ala Lys Thr Lys Pro Arg Glu Glu Gln Tyr
115 120 125Asn Ser Thr Phe Arg Val Val Ser Val Leu Thr Val Leu His
Gln Asp 130 135 140Trp Leu Asn Gly Lys Glu Tyr Lys Cys Lys Val Ser
Asn Lys Ala Leu145 150 155 160Pro Ala Pro Ile Glu Lys Thr Ile Ser
Lys Thr Lys Gly Gln Pro Arg 165 170 175Glu Pro Gln Val Tyr Thr Leu
Pro Pro Ser Arg Glu Glu Met Thr Lys 180 185 190Asn Gln Val Ser Leu
Thr Cys Leu Val Lys Gly Phe Tyr Pro Ser Asp 195 200 205Ile Ala Val
Glu Trp Glu Ser Ser Gly Gln Pro Glu Asn Asn Tyr Asn 210 215 220Thr
Thr Pro Pro Met Leu Asp Ser Asp Gly Ser Phe Phe Leu Tyr Ser225 230
235 240Lys Leu Thr Val Asp Lys Ser Arg Trp Gln Gln Gly Asn Ile Phe
Ser 245 250 255Cys Ser Val Met His Glu Ala Leu His Asn Arg Phe Thr
Gln Lys Ser 260 265 270Leu Ser Leu Ser Pro Gly Lys 2757229PRTHomo
sapiens 7Glu Ser Lys Tyr Gly Pro Pro Cys Pro Ser Cys Pro Ala Pro
Glu Phe1 5 10 15Leu Gly Gly Pro Ser Val Phe Leu Phe Pro Pro Lys Pro
Lys Asp Thr 20 25 30Leu Met Ile Ser Arg Thr Pro Glu Val Thr Cys Val
Val Val Asp Val 35 40 45Ser Gln Glu Asp Pro Glu Val Gln Phe Asn Trp
Tyr Val Asp Gly Val 50 55 60Glu Val His Asn Ala Lys Thr Lys Pro Arg
Glu Glu Gln Phe Asn Ser65 70 75 80Thr Tyr Arg Val Val Ser Val Leu
Thr Val Leu His Gln Asp Trp Leu 85 90 95Asn Gly Lys Glu Tyr Lys Cys
Lys Val Ser Asn Lys Gly Leu Pro Ser 100 105 110Ser Ile Glu Lys Thr
Ile Ser Lys Ala Lys Gly Gln Pro Arg Glu Pro 115 120 125Gln Val Tyr
Thr Leu Pro Pro Ser Gln Glu Glu Met Thr Lys Asn Gln 130 135 140Val
Ser Leu Thr Cys Leu Val Lys Gly Phe Tyr Pro Ser Asp Ile Ala145 150
155 160Val Glu Trp Glu Ser Asn Gly Gln Pro Glu Asn Asn Tyr Lys Thr
Thr 165 170 175Pro Pro Val Leu Asp Ser Asp Gly Ser Phe Phe Leu Tyr
Ser Arg Leu 180 185 190Thr Val Asp Lys Ser Arg Trp Gln Glu Gly Asn
Val Phe Ser Cys Ser 195 200 205Val Met His Glu Ala Leu His Asn His
Tyr Thr Gln Lys Ser Leu Ser 210 215 220Leu Ser Leu Gly
Lys2258229PRTArtificial SequenceDescription of Artificial Sequence
Synthetic polypeptide 8Ala Glu Ser Lys Tyr Gly Pro Pro Cys Pro Pro
Cys Pro Ala Pro Glu1 5 10 15Ala Ala Gly Gly Pro Ser Val Phe Leu Phe
Pro Pro Lys Pro Lys Asp 20 25 30Thr Leu Met Ile Ser Arg Thr Pro Glu
Val Thr Cys Val Val Val Asp 35 40 45Val Ser Gln Glu Asp Pro Glu Val
Gln Phe Asn Trp Tyr Val Asp Gly 50 55 60Val Glu Val His Asn Ala Lys
Thr Lys Pro Arg Glu Glu Gln Phe Asn65 70 75 80Ser Thr Tyr Arg Val
Val Ser Val Leu Thr Val Leu His Gln Asp Trp 85 90 95Leu Asn Gly Lys
Glu Tyr Lys Cys Lys Val Ser Asn Lys Gly Leu Pro 100 105 110Ser Ser
Ile Glu Lys Thr Ile Ser Lys Ala Lys Gly Gln Pro Arg Glu 115 120
125Pro Gln Val Tyr Thr Leu Pro Pro Ser Gln Glu Glu Met Thr Lys Asn
130 135 140Gln Val Ser Leu Thr Cys Leu Val Lys Gly Phe Tyr Pro Ser
Asp Ile145 150 155 160Ala Val Glu Trp Glu Ser Asn Gly Gln Pro Glu
Asn Asn Tyr Lys Thr 165 170 175Thr Pro Pro Val Leu Asp Ser Asp Gly
Ser Phe Phe Leu Tyr Ser Arg 180 185 190Leu Thr Val Asp Lys Ser Arg
Trp Gln Glu Gly Asn Val Phe Ser Cys 195 200 205Ser Val Met His Glu
Ala Leu His Asn His Tyr Thr Gln Lys Ser Leu 210 215 220Ser Leu Ser
Leu Gly2259261PRTArtificial SequenceDescription of Artificial
Sequence Synthetic polypeptide 9Ile Val Arg Arg Ala Asp Arg Ala Ala
Val Pro Gly Gly Gly Gly Arg1 5 10 15Gly Asp Gly Gly Gly Gly Ser Gly
Gly Gly Gly Ser Gly Gly Gly Gly 20 25 30Ser Glu Arg Lys Cys Cys Val
Glu Cys Pro Pro Cys Pro Ala Pro Pro 35 40 45Val Ala Gly Pro Ser Val
Phe Leu Phe Pro Pro Lys Pro Lys Asp Thr 50 55 60Leu Met Ile Ser Arg
Thr Pro Glu Val Thr Cys Val Val Val Asp Val65 70 75 80Ser His Glu
Asp Pro Glu Val Gln Phe Asn Trp Tyr Val Asp Gly Val 85 90 95Glu Val
His Asn Ala Lys Thr Lys Pro Arg Glu Glu Gln Phe Asn Ser 100 105
110Thr Phe Arg Val Val Ser Val Leu Thr Val Val His Gln Asp Trp Leu
115 120 125Asn Gly Lys Glu Tyr Lys Cys Lys Val Ser Asn Lys Gly Leu
Pro Ala 130 135 140Pro Ile Glu Lys Thr Ile Ser Lys Thr Lys Gly Gln
Pro Arg Glu Pro145 150 155 160Gln Val Tyr Thr Leu Pro Pro Ser Arg
Glu Glu Met Thr Lys Asn Gln 165 170 175Val Ser Leu Thr Cys Leu Val
Lys Gly Phe Tyr Pro Ser Asp Ile Ser 180 185 190Val Glu Trp Glu Ser
Asn Gly Gln Pro Glu Asn Asn Tyr Lys Thr Thr 195 200 205Pro Pro Met
Leu Asp Ser Asp Gly Ser Phe Phe Leu Tyr Ser Lys Leu 210 215 220Thr
Val Asp Lys Ser Arg Trp Gln Gln Gly Asn Val Phe Ser Cys Ser225 230
235 240Val Met His Glu Ala Leu His Asn His Tyr Thr Gln Lys Ser Leu
Ser 245 250 255Leu Ser Pro Gly Lys 26010262PRTArtificial
SequenceDescription of Artificial Sequence Synthetic polypeptide
10Ile Val Arg Arg Ala Asp Arg Ala Ala Val Pro Gly Gly Gly Gly Arg1
5 10 15Gly Asp Gly Gly Gly Gly Ser Gly Gly Gly Gly Ser Gly Gly Gly
Gly 20 25 30Ser Ala Glu Ser Lys Tyr Gly Pro Pro Cys Pro Pro Cys Pro
Ala Pro 35 40 45Glu Ala Ala Gly Gly Pro Ser Val Phe Leu Phe Pro Pro
Lys Pro Lys 50 55 60Asp Thr Leu Met Ile Ser Arg Thr Pro Glu Val Thr
Cys Val Val Val65 70 75 80Asp Val Ser Gln Glu Asp Pro Glu Val Gln
Phe Asn Trp Tyr Val Asp 85 90 95Gly Val Glu Val His Asn Ala Lys Thr
Lys Pro Arg Glu Glu Gln Phe 100 105 110Asn Ser Thr Tyr Arg Val Val
Ser Val Leu Thr Val Leu His Gln Asp 115 120 125Trp Leu Asn Gly Lys
Glu Tyr Lys Cys Lys Val Ser Asn Lys Gly Leu 130 135 140Pro Ser Ser
Ile Glu Lys Thr Ile Ser Lys Ala Lys Gly Gln Pro Arg145 150 155
160Glu Pro Gln Val Tyr Thr Leu Pro Pro Ser Gln Glu Glu Met Thr Lys
165 170 175Asn Gln Val Ser Leu Thr Cys Leu Val Lys Gly Phe Tyr Pro
Ser Asp 180 185 190Ile Ala Val Glu Trp Glu Ser Asn Gly Gln Pro Glu
Asn Asn Tyr Lys 195 200 205Thr Thr Pro Pro Val Leu Asp Ser Asp Gly
Ser Phe Phe Leu Tyr Ser 210 215 220Arg Leu Thr Val Asp Lys Ser Arg
Trp Gln Glu Gly Asn Val Phe Ser225 230 235 240Cys Ser Val Met His
Glu Ala Leu His Asn His Tyr Thr Gln Lys Ser 245 250 255Leu Ser Leu
Ser Leu Gly 26011256PRTArtificial SequenceDescription of Artificial
Sequence Synthetic polypeptide 11Val Glu Cys Pro Pro Cys Pro Ala
Pro Pro Val Ala Gly Pro Ser Val1 5 10 15Phe Leu Phe Pro Pro Lys Pro
Lys Asp Thr Leu Met Ile Ser Arg Thr 20 25 30Pro Glu Val Thr Cys Val
Val Val Asp Val Ser His Glu Asp Pro Glu 35 40 45Val Gln Phe Asn Trp
Tyr Val Asp Gly Val Glu Val His Asn Ala Lys 50 55 60Thr Lys Pro Arg
Glu Glu Gln Phe Asn Ser Thr Phe Arg Val Val Ser65 70 75 80Val Leu
Thr Val Val His Gln Asp Trp Leu Asn Gly Lys Glu Tyr Lys 85 90 95Cys
Lys Val Ser Asn Lys Gly Leu Pro Ala Pro Ile Glu Lys Thr Ile 100 105
110Ser Lys Thr Lys Gly Gln Pro Arg Glu Pro Gln Val Tyr Thr Leu Pro
115 120 125Pro Ser Arg Glu Glu Met Thr Lys Asn Gln Val Ser Leu Thr
Cys Leu 130 135 140Val Lys Gly Phe Tyr Pro Ser Asp Ile Ser Val Glu
Trp Glu Ser Asn145 150 155 160Gly Gln Pro Glu Asn Asn Tyr Lys Thr
Thr Pro Pro Met Leu Asp Ser 165 170 175Asp Gly Ser Phe Phe Leu Tyr
Ser Lys Leu Thr Val Asp Lys Ser Arg 180 185 190Trp Gln Gln Gly Asn
Val Phe Ser Cys Ser Val Met His Glu Ala Leu 195 200 205His Asn His
Tyr Thr Gln Lys Ser Leu Ser Leu Ser Pro Gly Lys Gly 210 215 220Gly
Gly Gly Ser Gly Gly Gly Gly Ser Gly Gly Gly Gly Ser Ile Val225 230
235 240Arg Arg Ala Asp Arg Ala Ala Val Pro Gly Gly Gly Gly Arg Gly
Asp 245 250 25512262PRTArtificial SequenceDescription of Artificial
Sequence Synthetic polypeptide 12Ala Glu Ser Lys Tyr Gly Pro Pro
Cys Pro Pro Cys Pro Ala Pro Glu1 5 10 15Ala Ala Gly Gly Pro Ser Val
Phe Leu Phe Pro Pro Lys Pro Lys Asp 20 25 30Thr Leu Met Ile Ser Arg
Thr Pro Glu Val Thr Cys Val Val Val Asp 35 40 45Val Ser Gln Glu Asp
Pro Glu Val Gln Phe Asn Trp Tyr Val Asp Gly 50 55 60Val Glu Val His
Asn Ala Lys Thr Lys Pro Arg Glu Glu Gln Phe Asn65 70 75 80Ser Thr
Tyr Arg Val Val Ser Val Leu Thr Val Leu His Gln Asp Trp 85 90 95Leu
Asn Gly Lys Glu Tyr Lys Cys Lys Val Ser
Asn Lys Gly Leu Pro 100 105 110Ser Ser Ile Glu Lys Thr Ile Ser Lys
Ala Lys Gly Gln Pro Arg Glu 115 120 125Pro Gln Val Tyr Thr Leu Pro
Pro Ser Gln Glu Glu Met Thr Lys Asn 130 135 140Gln Val Ser Leu Thr
Cys Leu Val Lys Gly Phe Tyr Pro Ser Asp Ile145 150 155 160Ala Val
Glu Trp Glu Ser Asn Gly Gln Pro Glu Asn Asn Tyr Lys Thr 165 170
175Thr Pro Pro Val Leu Asp Ser Asp Gly Ser Phe Phe Leu Tyr Ser Arg
180 185 190Leu Thr Val Asp Lys Ser Arg Trp Gln Glu Gly Asn Val Phe
Ser Cys 195 200 205Ser Val Met His Glu Ala Leu His Asn His Tyr Thr
Gln Lys Ser Leu 210 215 220Ser Leu Ser Leu Gly Gly Gly Gly Gly Ser
Gly Gly Gly Gly Ser Gly225 230 235 240Gly Gly Gly Ser Ile Val Arg
Arg Ala Asp Arg Ala Ala Val Pro Gly 245 250 255Gly Gly Gly Arg Gly
Asp 26013262PRTArtificial SequenceDescription of Artificial
Sequence Synthetic polypeptide 13Ile Val Arg Arg Ala Asp Arg Ala
Ala Val Pro Gly Gly Gly Gly Arg1 5 10 15Gly Asp Gly Gly Gly Gly Ser
Gly Gly Gly Gly Ser Gly Gly Gly Gly 20 25 30Ser Glu Ser Lys Tyr Gly
Pro Pro Cys Pro Ser Cys Pro Ala Pro Glu 35 40 45Phe Leu Gly Gly Pro
Ser Val Phe Leu Phe Pro Pro Lys Pro Lys Asp 50 55 60Thr Leu Met Ile
Ser Arg Thr Pro Glu Val Thr Cys Val Val Val Asp65 70 75 80Val Ser
Gln Glu Asp Pro Glu Val Gln Phe Asn Trp Tyr Val Asp Gly 85 90 95Val
Glu Val His Asn Ala Lys Thr Lys Pro Arg Glu Glu Gln Phe Asn 100 105
110Ser Thr Tyr Arg Val Val Ser Val Leu Thr Val Leu His Gln Asp Trp
115 120 125Leu Asn Gly Lys Glu Tyr Lys Cys Lys Val Ser Asn Lys Gly
Leu Pro 130 135 140Ser Ser Ile Glu Lys Thr Ile Ser Lys Ala Lys Gly
Gln Pro Arg Glu145 150 155 160Pro Gln Val Tyr Thr Leu Pro Pro Ser
Gln Glu Glu Met Thr Lys Asn 165 170 175Gln Val Ser Leu Thr Cys Leu
Val Lys Gly Phe Tyr Pro Ser Asp Ile 180 185 190Ala Val Glu Trp Glu
Ser Asn Gly Gln Pro Glu Asn Asn Tyr Lys Thr 195 200 205Thr Pro Pro
Val Leu Asp Ser Asp Gly Ser Phe Phe Leu Tyr Ser Arg 210 215 220Leu
Thr Val Asp Lys Ser Arg Trp Gln Glu Gly Asn Val Phe Ser Cys225 230
235 240Ser Val Met His Glu Ala Leu His Asn His Tyr Thr Gln Lys Ser
Leu 245 250 255Ser Leu Ser Leu Gly Lys 26014262PRTArtificial
SequenceDescription of Artificial Sequence Synthetic polypeptide
14Glu Ser Lys Tyr Gly Pro Pro Cys Pro Ser Cys Pro Ala Pro Glu Phe1
5 10 15Leu Gly Gly Pro Ser Val Phe Leu Phe Pro Pro Lys Pro Lys Asp
Thr 20 25 30Leu Met Ile Ser Arg Thr Pro Glu Val Thr Cys Val Val Val
Asp Val 35 40 45Ser Gln Glu Asp Pro Glu Val Gln Phe Asn Trp Tyr Val
Asp Gly Val 50 55 60Glu Val His Asn Ala Lys Thr Lys Pro Arg Glu Glu
Gln Phe Asn Ser65 70 75 80Thr Tyr Arg Val Val Ser Val Leu Thr Val
Leu His Gln Asp Trp Leu 85 90 95Asn Gly Lys Glu Tyr Lys Cys Lys Val
Ser Asn Lys Gly Leu Pro Ser 100 105 110Ser Ile Glu Lys Thr Ile Ser
Lys Ala Lys Gly Gln Pro Arg Glu Pro 115 120 125Gln Val Tyr Thr Leu
Pro Pro Ser Gln Glu Glu Met Thr Lys Asn Gln 130 135 140Val Ser Leu
Thr Cys Leu Val Lys Gly Phe Tyr Pro Ser Asp Ile Ala145 150 155
160Val Glu Trp Glu Ser Asn Gly Gln Pro Glu Asn Asn Tyr Lys Thr Thr
165 170 175Pro Pro Val Leu Asp Ser Asp Gly Ser Phe Phe Leu Tyr Ser
Arg Leu 180 185 190Thr Val Asp Lys Ser Arg Trp Gln Glu Gly Asn Val
Phe Ser Cys Ser 195 200 205Val Met His Glu Ala Leu His Asn His Tyr
Thr Gln Lys Ser Leu Ser 210 215 220Leu Ser Leu Gly Lys Gly Gly Gly
Gly Ser Gly Gly Gly Gly Ser Gly225 230 235 240Gly Gly Gly Ser Ile
Val Arg Arg Ala Asp Arg Ala Ala Val Pro Gly 245 250 255Gly Gly Gly
Arg Gly Asp 26015295PRTArtificial SequenceDescription of Artificial
Sequence Synthetic polypeptide 15Ile Val Arg Arg Ala Asp Arg Ala
Ala Val Pro Gly Gly Gly Gly Arg1 5 10 15Gly Asp Gly Gly Gly Gly Ser
Gly Gly Gly Gly Ser Gly Gly Gly Gly 20 25 30Ser Ala Glu Ser Lys Tyr
Gly Pro Pro Cys Pro Pro Cys Pro Ala Pro 35 40 45Glu Ala Ala Gly Gly
Pro Ser Val Phe Leu Phe Pro Pro Lys Pro Lys 50 55 60Asp Thr Leu Met
Ile Ser Arg Thr Pro Glu Val Thr Cys Val Val Val65 70 75 80Asp Val
Ser Gln Glu Asp Pro Glu Val Gln Phe Asn Trp Tyr Val Asp 85 90 95Gly
Val Glu Val His Asn Ala Lys Thr Lys Pro Arg Glu Glu Gln Phe 100 105
110Asn Ser Thr Tyr Arg Val Val Ser Val Leu Thr Val Leu His Gln Asp
115 120 125Trp Leu Asn Gly Lys Glu Tyr Lys Cys Lys Val Ser Asn Lys
Gly Leu 130 135 140Pro Ser Ser Ile Glu Lys Thr Ile Ser Lys Ala Lys
Gly Gln Pro Arg145 150 155 160Glu Pro Gln Val Tyr Thr Leu Pro Pro
Ser Gln Glu Glu Met Thr Lys 165 170 175Asn Gln Val Ser Leu Thr Cys
Leu Val Lys Gly Phe Tyr Pro Ser Asp 180 185 190Ile Ala Val Glu Trp
Glu Ser Asn Gly Gln Pro Glu Asn Asn Tyr Lys 195 200 205Thr Thr Pro
Pro Val Leu Asp Ser Asp Gly Ser Phe Phe Leu Tyr Ser 210 215 220Arg
Leu Thr Val Asp Lys Ser Arg Trp Gln Glu Gly Asn Val Phe Ser225 230
235 240Cys Ser Val Met His Glu Ala Leu His Asn His Tyr Thr Gln Lys
Ser 245 250 255Leu Ser Leu Ser Leu Gly Gly Gly Gly Gly Ser Gly Gly
Gly Gly Ser 260 265 270Gly Gly Gly Gly Ser Ile Val Arg Arg Ala Asp
Arg Ala Ala Val Pro 275 280 285Gly Gly Gly Gly Arg Gly Asp 290
29516263PRTArtificial SequenceDescription of Artificial Sequence
Synthetic polypeptide 16Ile Val Arg Arg Ala Asp Arg Ala Ala Val Pro
Gly Gly Gly Gly Arg1 5 10 15Gly Asp Arg Asn Thr Gly Arg Gly Gly Glu
Glu Lys Lys Lys Glu Lys 20 25 30Glu Lys Glu Glu Gln Glu Glu Arg Glu
Thr Lys Thr Pro Glu Cys Pro 35 40 45Ser His Thr Gln Pro Leu Gly Val
Phe Leu Phe Pro Pro Lys Pro Lys 50 55 60Asp Thr Leu Met Ile Ser Arg
Thr Pro Glu Val Thr Cys Val Val Val65 70 75 80Asp Val Ser Gln Glu
Asp Pro Glu Val Gln Phe Asn Trp Tyr Val Asp 85 90 95Gly Val Glu Val
His Asn Ala Lys Thr Lys Pro Arg Glu Glu Gln Phe 100 105 110Asn Ser
Thr Tyr Arg Val Val Ser Val Leu Thr Val Leu His Gln Asp 115 120
125Trp Leu Asn Gly Lys Glu Tyr Lys Cys Lys Val Ser Asn Lys Gly Leu
130 135 140Pro Ser Ser Ile Glu Lys Thr Ile Ser Lys Ala Lys Gly Gln
Pro Arg145 150 155 160Glu Pro Gln Val Tyr Thr Leu Pro Pro Ser Gln
Glu Glu Met Thr Lys 165 170 175Asn Gln Val Ser Leu Thr Cys Leu Val
Lys Gly Phe Tyr Pro Ser Asp 180 185 190Ile Ala Val Glu Trp Glu Ser
Asn Gly Gln Pro Glu Asn Asn Tyr Lys 195 200 205Thr Thr Pro Pro Val
Leu Asp Ser Asp Gly Ser Phe Phe Leu Tyr Ser 210 215 220Arg Leu Thr
Val Asp Lys Ser Arg Trp Gln Glu Gly Asn Val Phe Ser225 230 235
240Cys Ser Val Met His Glu Ala Leu His Asn His Tyr Thr Gln Lys Ser
245 250 255Leu Ser Leu Ser Leu Gly Lys 26017278PRTArtificial
SequenceDescription of Artificial Sequence Synthetic polypeptide
17Ala Glu Ser Lys Tyr Gly Pro Pro Cys Pro Pro Cys Pro Ala Pro Glu1
5 10 15Ala Ala Gly Gly Pro Ser Val Phe Leu Phe Pro Pro Lys Pro Lys
Asp 20 25 30Thr Leu Met Ile Ser Arg Thr Pro Glu Val Thr Cys Val Val
Val Asp 35 40 45Val Ser Gln Glu Asp Pro Glu Val Gln Phe Asn Trp Tyr
Val Asp Gly 50 55 60Val Glu Val His Asn Ala Lys Thr Lys Pro Arg Glu
Glu Gln Phe Asn65 70 75 80Ser Thr Tyr Arg Val Val Ser Val Leu Thr
Val Leu His Gln Asp Trp 85 90 95Leu Asn Gly Lys Glu Tyr Lys Cys Lys
Val Ser Asn Lys Gly Leu Pro 100 105 110Ser Ser Ile Glu Lys Thr Ile
Ser Lys Ala Lys Gly Gln Pro Arg Glu 115 120 125Pro Gln Val Tyr Thr
Leu Pro Pro Ser Gln Glu Glu Met Thr Lys Asn 130 135 140Gln Val Ser
Leu Thr Cys Leu Val Lys Gly Phe Tyr Pro Ser Asp Ile145 150 155
160Ala Val Glu Trp Glu Ser Asn Gly Gln Pro Glu Asn Asn Tyr Lys Thr
165 170 175Thr Pro Pro Val Leu Asp Ser Asp Gly Ser Phe Phe Leu Tyr
Ser Arg 180 185 190Leu Thr Val Asp Lys Ser Arg Trp Gln Glu Gly Asn
Val Phe Ser Cys 195 200 205Ser Val Met His Glu Ala Leu His Asn His
Tyr Thr Gln Lys Ser Leu 210 215 220Ser Leu Ser Leu Gly Gly Gly Gly
Gly Gly Ile Val Arg Arg Ala Asp225 230 235 240Arg Ala Ala Val Pro
Gly Gly Gly Gly Arg Gly Asp Gly Gly Gly Gly 245 250 255Gly Gly Gly
Gly Ile Val Arg Arg Ala Asp Arg Ala Ala Val Pro Gly 260 265 270Gly
Gly Gly Arg Gly Asp 27518278PRTArtificial SequenceDescription of
Artificial Sequence Synthetic polypeptide 18Arg Asn Thr Gly Arg Gly
Gly Glu Glu Lys Lys Lys Glu Lys Glu Lys1 5 10 15Glu Glu Gln Glu Glu
Arg Glu Thr Lys Thr Pro Glu Cys Pro Ser His 20 25 30Thr Gln Pro Leu
Gly Val Phe Leu Phe Pro Pro Lys Pro Lys Asp Thr 35 40 45Leu Met Ile
Ser Arg Thr Pro Glu Val Thr Cys Val Val Val Asp Val 50 55 60Ser Gln
Glu Asp Pro Glu Val Gln Phe Asn Trp Tyr Val Asp Gly Val65 70 75
80Glu Val His Asn Ala Lys Thr Lys Pro Arg Glu Glu Gln Phe Asn Ser
85 90 95Thr Tyr Arg Val Val Ser Val Leu Thr Val Leu His Gln Asp Trp
Leu 100 105 110Asn Gly Lys Glu Tyr Lys Cys Lys Val Ser Asn Lys Gly
Leu Pro Ser 115 120 125Ser Ile Glu Lys Thr Ile Ser Lys Ala Lys Gly
Gln Pro Arg Glu Pro 130 135 140Gln Val Tyr Thr Leu Pro Pro Ser Gln
Glu Glu Met Thr Lys Asn Gln145 150 155 160Val Ser Leu Thr Cys Leu
Val Lys Gly Phe Tyr Pro Ser Asp Ile Ala 165 170 175Val Glu Trp Glu
Ser Asn Gly Gln Pro Glu Asn Asn Tyr Lys Thr Thr 180 185 190Pro Pro
Val Leu Asp Ser Asp Gly Ser Phe Phe Leu Tyr Ser Arg Leu 195 200
205Thr Val Asp Lys Ser Arg Trp Gln Glu Gly Asn Val Phe Ser Cys Ser
210 215 220Val Met His Glu Ala Leu His Asn His Tyr Thr Gln Lys Ser
Leu Ser225 230 235 240Leu Ser Leu Gly Lys Gly Gly Gly Gly Ser Gly
Gly Gly Gly Ser Gly 245 250 255Gly Gly Gly Ser Ile Val Arg Arg Ala
Asp Arg Ala Ala Val Pro Gly 260 265 270Gly Gly Gly Arg Gly Asp
27519269PRTArtificial SequenceDescription of Artificial Sequence
Synthetic polypeptide 19Ala Glu Ser Lys Tyr Gly Pro Pro Cys Pro Pro
Cys Pro Ala Pro Glu1 5 10 15Ala Ala Gly Gly Pro Ser Val Phe Leu Phe
Pro Pro Lys Pro Lys Asp 20 25 30Thr Leu Met Ile Ser Arg Thr Pro Glu
Val Thr Cys Val Val Val Asp 35 40 45Val Ser Gln Glu Asp Pro Glu Val
Gln Phe Asn Trp Tyr Val Asp Gly 50 55 60Val Glu Val His Asn Ala Lys
Thr Lys Pro Arg Glu Glu Gln Phe Asn65 70 75 80Ser Thr Tyr Arg Val
Val Ser Val Leu Thr Val Leu His Gln Asp Trp 85 90 95Leu Asn Gly Lys
Glu Tyr Lys Cys Lys Val Ser Asn Lys Gly Leu Pro 100 105 110Ser Ser
Ile Glu Lys Thr Ile Ser Lys Ala Lys Gly Gln Pro Arg Glu 115 120
125Pro Gln Val Tyr Thr Leu Pro Pro Ser Gln Glu Glu Met Thr Lys Asn
130 135 140Gln Val Ser Leu Thr Cys Leu Val Lys Gly Phe Tyr Pro Ser
Asp Ile145 150 155 160Ala Val Glu Trp Glu Ser Asn Gly Gln Pro Glu
Asn Asn Tyr Lys Thr 165 170 175Thr Pro Pro Val Leu Asp Ser Asp Gly
Ser Phe Phe Leu Tyr Ser Arg 180 185 190Leu Thr Val Asp Lys Ser Arg
Trp Gln Glu Gly Asn Val Phe Ser Cys 195 200 205Ser Val Met His Glu
Ala Leu His Asn His Tyr Thr Gln Lys Ser Leu 210 215 220Ser Leu Ser
Leu Gly Ala Glu Ala Ala Ala Lys Glu Ala Ala Ala Lys225 230 235
240Glu Ala Ala Ala Lys Glu Ala Ala Ala Lys Ala Ile Val Arg Arg Ala
245 250 255Asp Arg Ala Ala Val Pro Gly Gly Gly Gly Arg Gly Asp 260
26520265PRTArtificial SequenceDescription of Artificial Sequence
Synthetic polypeptide 20Ala Glu Ser Lys Tyr Gly Pro Pro Cys Pro Pro
Cys Pro Ala Pro Glu1 5 10 15Ala Ala Gly Gly Pro Ser Val Phe Leu Phe
Pro Pro Lys Pro Lys Asp 20 25 30Thr Leu Met Ile Ser Arg Thr Pro Glu
Val Thr Cys Val Val Val Asp 35 40 45Val Ser Gln Glu Asp Pro Glu Val
Gln Phe Asn Trp Tyr Val Asp Gly 50 55 60Val Glu Val His Asn Ala Lys
Thr Lys Pro Arg Glu Glu Gln Phe Asn65 70 75 80Ser Thr Tyr Arg Val
Val Ser Val Leu Thr Val Leu His Gln Asp Trp 85 90 95Leu Asn Gly Lys
Glu Tyr Lys Cys Lys Val Ser Asn Lys Gly Leu Pro 100 105 110Ser Ser
Ile Glu Lys Thr Ile Ser Lys Ala Lys Gly Gln Pro Arg Glu 115 120
125Pro Gln Val Tyr Thr Leu Pro Pro Ser Gln Glu Glu Met Thr Lys Asn
130 135 140Gln Val Ser Leu Thr Cys Leu Val Lys Gly Phe Tyr Pro Ser
Asp Ile145 150 155 160Ala Val Glu Trp Glu Ser Asn Gly Gln Pro Glu
Asn Asn Tyr Lys Thr 165 170 175Thr Pro Pro Val Leu Asp Ser Asp Gly
Ser Phe Phe Leu Tyr Ser Arg 180 185 190Leu Thr Val Asp Lys Ser Arg
Trp Gln Glu Gly Asn Val Phe Ser Cys 195 200 205Ser Val Met His Glu
Ala Leu His Asn His Tyr Thr Gln Lys Ser Leu 210 215 220Ser Leu Ser
Leu Gly Ala Pro Ala Pro Ala Pro Ala Pro Ala Pro Ala225 230 235
240Pro Ala Pro Ala Pro Ala Pro Ile Val Arg Arg Ala Asp Arg Ala Ala
245 250 255Val Pro Gly Gly Gly Gly Arg Gly Asp 260
2652130PRTArtificial SequenceDescription of Artificial Sequence
Synthetic polypeptideMISC_FEATURE(1)..(30)This sequence may
encompass 1-6 "Gly Gly Gly Gly Ser" repeating units 21Gly Gly Gly
Gly Ser Gly Gly Gly Gly Ser Gly Gly Gly Gly Ser Gly1 5 10
15Gly Gly Gly Ser Gly Gly Gly Gly Ser Gly Gly Gly Gly Ser 20 25
302232PRTArtificial SequenceDescription of Artificial Sequence
Synthetic polypeptideMISC_FEATURE(2)..(31)This region may encompass
1-6 "Glu Ala Ala Ala Lys" repeating units 22Ala Glu Ala Ala Ala Lys
Glu Ala Ala Ala Lys Glu Ala Ala Ala Lys1 5 10 15Glu Ala Ala Ala Lys
Glu Ala Ala Ala Lys Glu Ala Ala Ala Lys Ala 20 25
302336PRTArtificial SequenceDescription of Artificial Sequence
Synthetic polypeptideMISC_FEATURE(1)..(36)This sequence may
encompass 1-18 "Ala Pro" repeating units 23Ala Pro Ala Pro Ala Pro
Ala Pro Ala Pro Ala Pro Ala Pro Ala Pro1 5 10 15Ala Pro Ala Pro Ala
Pro Ala Pro Ala Pro Ala Pro Ala Pro Ala Pro 20 25 30Ala Pro Ala Pro
352415PRTArtificial SequenceDescription of Artificial Sequence
Synthetic peptideMISC_FEATURE(1)..(15)This sequence may encompass
1-15 residues 24Gly Gly Gly Gly Gly Gly Gly Gly Gly Gly Gly Gly Gly
Gly Gly1 5 10 152525PRTArtificial SequenceDescription of Artificial
Sequence Synthetic peptideMISC_FEATURE(1)..(25)This sequence may
encompass 3-5 "Gly Gly Gly Gly Ser" repeating units 25Gly Gly Gly
Gly Ser Gly Gly Gly Gly Ser Gly Gly Gly Gly Ser Gly1 5 10 15Gly Gly
Gly Ser Gly Gly Gly Gly Ser 20 252615PRTArtificial
SequenceDescription of Artificial Sequence Synthetic peptide 26Gly
Gly Gly Gly Ser Gly Gly Gly Gly Ser Gly Gly Gly Gly Ser1 5 10
15277PRTArtificial SequenceDescription of Artificial Sequence
Synthetic peptide 27Ala Glu Ala Ala Ala Lys Ala1 5285PRTArtificial
SequenceDescription of Artificial Sequence Synthetic peptide 28Gly
Gly Gly Gly Ser1 5
D00000
D00001
D00002
D00003
D00004
D00005
D00006
D00007
D00008
D00009
D00010
D00011
D00012

D00013

D00014

D00015

D00016

D00017

D00018

D00019

D00020
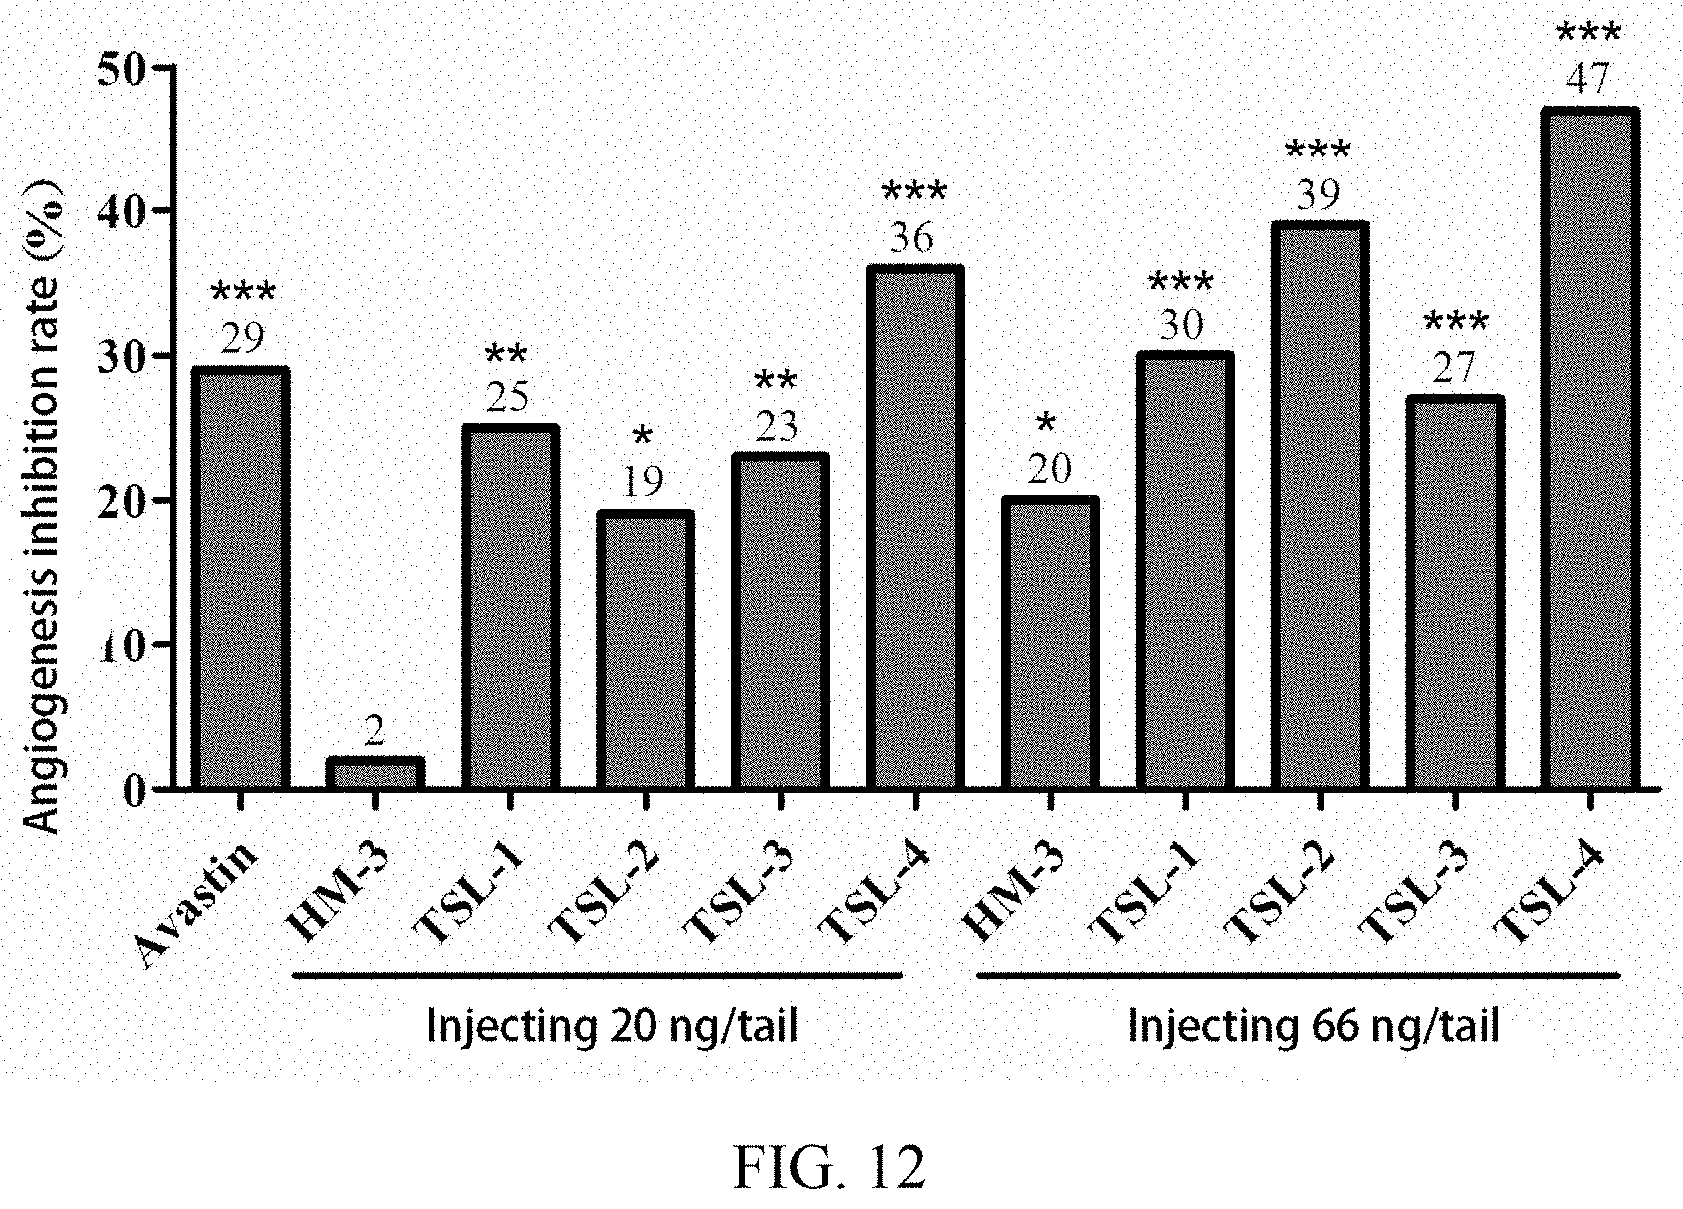
D00021

D00022

D00023
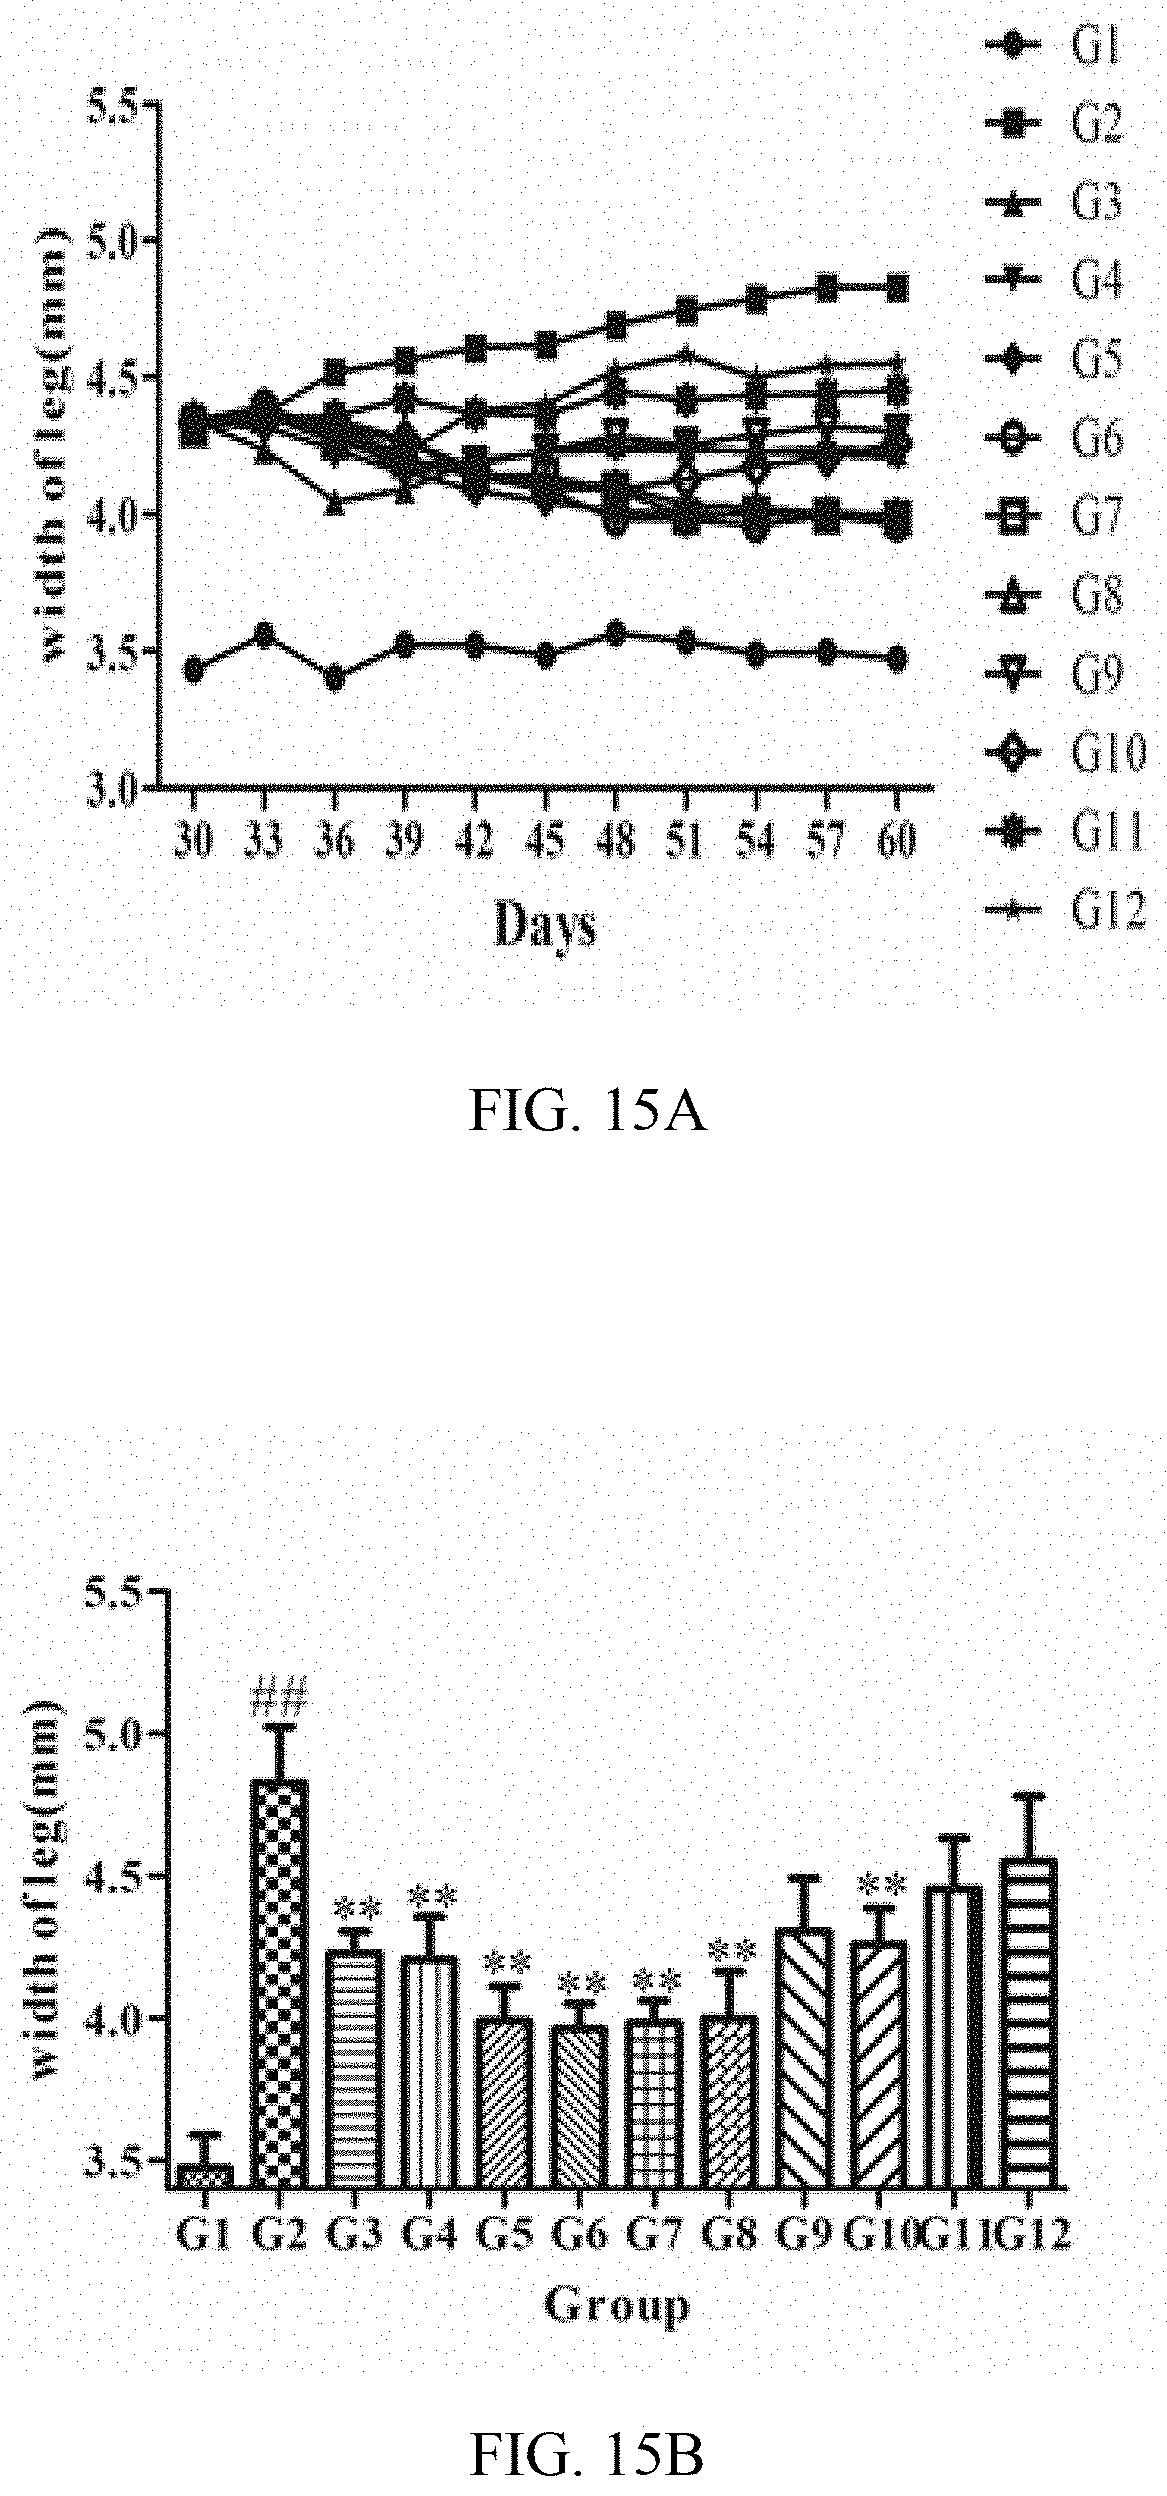
D00024

D00025

D00026

D00027

D00028

D00029

D00030

D00031

D00032


S00001
XML
uspto.report is an independent third-party trademark research tool that is not affiliated, endorsed, or sponsored by the United States Patent and Trademark Office (USPTO) or any other governmental organization. The information provided by uspto.report is based on publicly available data at the time of writing and is intended for informational purposes only.
While we strive to provide accurate and up-to-date information, we do not guarantee the accuracy, completeness, reliability, or suitability of the information displayed on this site. The use of this site is at your own risk. Any reliance you place on such information is therefore strictly at your own risk.
All official trademark data, including owner information, should be verified by visiting the official USPTO website at www.uspto.gov. This site is not intended to replace professional legal advice and should not be used as a substitute for consulting with a legal professional who is knowledgeable about trademark law.