Polysaccharide Priming Plant Resistance To Viruses
Yeh; Hsin-Hung ; et al.
U.S. patent application number 16/432230 was filed with the patent office on 2020-12-10 for polysaccharide priming plant resistance to viruses. The applicant listed for this patent is Academia Sinica. Invention is credited to Yi-Shu Chiu, Hsin-Hung Yeh.
| Application Number | 20200383335 16/432230 |
| Document ID | / |
| Family ID | 1000004333797 |
| Filed Date | 2020-12-10 |


View All Diagrams
| United States Patent Application | 20200383335 |
| Kind Code | A1 |
| Yeh; Hsin-Hung ; et al. | December 10, 2020 |
POLYSACCHARIDE PRIMING PLANT RESISTANCE TO VIRUSES
Abstract
The present disclosure relates to fungi, a culture filtrate thereof and a polysaccharide and their applications in inducing or priming plant resistance to viruses. Aspects of the present disclosure provides a cultured filtrate, derived from a fungus belonging to the genus Trichosporon, induces strong resistance to various viruses on different plants.
| Inventors: | Yeh; Hsin-Hung; (Keelung City, TW) ; Chiu; Yi-Shu; (Yilan County, TW) | ||||||||||
| Applicant: |
|
||||||||||
|---|---|---|---|---|---|---|---|---|---|---|---|
| Family ID: | 1000004333797 | ||||||||||
| Appl. No.: | 16/432230 | ||||||||||
| Filed: | June 5, 2019 |
| Current U.S. Class: | 1/1 |
| Current CPC Class: | C12R 1/645 20130101; A01N 63/30 20200101 |
| International Class: | A01N 63/04 20060101 A01N063/04; C12R 1/645 20060101 C12R001/645 |
Claims
1. A biologically pure culture filtrate derived from fungi, which comprises a polysaccharide comprising D-mannose, D-galactose and D-glucose with a 1,4-glucan linkage.
2. The biologically pure culture filtrate of claim 1, wherein the fungi is Trichosporon sp.
3. The biologically pure culture filtrate of claim 2, wherein the Trichosporon sp. is Trichosporon scarabaeorum.
4. The biologically pure culture filtrate of claim 1, wherein the D-mannose, D-galactose and D-glucose has a .alpha.-1,4-glucan linkage.
5. The biologically pure culture filtrate of claim 1, wherein the D-mannose, D-galactose and D-glucose has a .alpha.-D-1,4-glucan linkage.
6. The biologically pure culture filtrate of claim 1, wherein the D-mannose, D-galactose and D-glucose in the ratio about 0.5 to about 1.5:about 0.8 to about 2.0:about 8.0 to 12.0.
7. The biologically pure culture filtrate or the polysaccharide of claim 6, wherein the ratio is about 1.0:about 1.2:about 10.0.
8. A method for inducing resistance to virus in plant or priming plant resistant to viruses, or decreasing virus accumulation or increasing PR1 expression in a plant, comprising treating and/or contacting the plant with a biologically pure culture filtrate derived from fungi or a polysaccharide comprising D-mannose, D-galactose and D-glucose with a 1,4-glucan linkage.
9. The method of claim 8, wherein the fungi is Trichosporon sp.
10. The method of claim 8, wherein the Trichosporon sp. is Trichosporon scarabaeorum.
11. The method of claim 8, wherein the D-mannose, D-galactose and D-glucose has a .alpha.-1,4-glucan linkage.
12. The method of claim 8, wherein the D-mannose, D-galactose and D-glucose in the ratio about 0.5 to about 1.5:about 0.8 to about 2.0:about 8.0 to 12.0.
13. The method of claim 12, wherein the ratio is about 1.0:about 1.2:about 10.0.
14. The method of claim 8, wherein the plant is Nicotiana or Brassica.
15. The method of claim 14, wherein the Nicotiana is N. glutinosa or N. benthamiana
16. The method of claim 14, wherein the Brassica is B. juncea.
17. The method of claim 8, which does not induce canonical SAR.
18. The method of claim 8, wherein the virus is Tobacco mosaic virus.
19. A composition comprising a culture filtrate of biologically pure culture filtrate of claim 1.
Description
FIELD OF THE INVENTION
[0001] The present disclosure generally relates to a microorganism and component priming plant resistant to viruses. Particularly, the present disclosure relates to fungi, a culture filtrate thereof and a polysaccharide and their applications in inducing or priming plant resistance to viruses.
[0002] The instant application contains a Sequence Listing which has been submitted electronically in ASCII format and is hereby incorporated by reference in its entirety. Said ASCII copy, created on Sep. 3, 2019, is named G4590-05400_SeqListing.txt and is 5 KB in size.
BACKGROUND OF THE INVENTION
[0003] Viruses cause serious diseases in crops, and the lost yield is estimated to total more than $30 billion annually. However, because viruses are intracellular parasites, cost-effective elimination of viruses from infected plants is difficult. Currently, no curative viricides are available for plant viral disease management. Thus, unlike other pests, if viruses can evade preventive control measures and infect plants, roguing is the main option for farmers to prevent further spread of viral disease. Traditional resistance breeding, use of pesticides to control viral vectors, and transgenic approaches to control viral diseases in crops often come at the cost of time, compromised flavor, hazardous concerns to the environment and health, as well as issues associated with genetically modified foods. One way to alleviate this problem is to induce a plant immune response to defend against virus infection.
[0004] Plants protect against pest attack by structural barriers or preexisting pest-toxic chemicals. In addition, plants have evolved a complex immune response that can ward off attack by most microbes. Plants can recognize microbe/pathogen-conserved molecular structures termed microb/pathogen-associated molecular patterns (MAMPs/PAMPs) and induce an immune response. An example of MAMPs/PAMPs are bacterial flagellin, chitin or different glucans that constitute fungal and oomycete cell walls. In addition to MAMPs/PAMPs, host-derived molecules may be generated during attacks by microbes/pathogens through lytic enzymes or mechanical forces. Some of these molecules may serve as elicitors of a plant defense response. These molecules are termed danger- or damage-associated molecular patterns (DAMPs). MAMPs and DAMPs are detected/perceived by membrane-localized pattern recognition receptors (PRRs) and induce a diverse array of defense responses commonly referred to as pattern-triggered immunity (PTI). PTI can defend against most pathogen infection; however, some plant pathogens have evolved effectors that are injected into the host cells to compromise PTI. To defend against pathogens armed with an effector, plants have evolved resistance (R) proteins to detect these effectors and induce a stronger defense response, termed effector-triggered immunity (ETI). ETI usually triggers programmed cell death at the site of infection to prevent further spreading of invasive pathogens. Both PTI and ETI are coordinated by phytohormones, such as salicylic acid (SA), jasmonic acid (JA), ethylene (ET) and abscisic acid (Pieterse, C. M., Van der Does, D., Zamioudis, C., Leon-Reyes, A., and Van Wees, S. C. 2012. Hormonal modulation of plant immunity. Annual review of cell and developmental biology 28:489-521). The coordination between these hormones activates a specific immune response under PTI and ETI to protect against a particular pathogen (Pieterse, C. M., Van der Does, D., Zamioudis, C., Leon-Reyes, A., and Van Wees, S. C. 2012. Hormonal modulation of plant immunity. Annual review of cell and developmental biology 28:489-521).
SUMMARY OF THE INVENTION
[0005] The present disclosure provides, in one aspect, culture filtrates derived from soil microorganisms to induce effective plant defense against viruses. In one embodiment, the present disclosure obtains a culture filtrate derived from Trichosporon sp. (F8-culture filtrate) that is much better than SA in inducing plant resistance to different viruses but without a fitness cost. The present disclosure also identifies the specific mode of action of the F8-culture filtrate, which induced an unusual priming of SA-governed responsive genes, as well as the active component of F8-culture filtrate. The finding in the present disclosure reveals an effective way for inducing plant resistance against viruses. Furthermore, the present disclosure uncovers several unusual features, which provide important knowledge for further application of induced resistance against virus infection.
[0006] In one aspect, the present disclosure provides a biologically pure culture filtrate derived from fungi, which comprises a polysaccharide comprising D-mannose, D-galactose and D-glucose with a 1,4-glucan linkage.
[0007] In one aspect, the present disclosure provides a polysaccharide comprising D-mannose, D-galactose and D-glucose with a 1,4-glucan linkage.
[0008] In one aspect, the present disclosure provides a composition comprising a culture filtrate or a polysaccharide of the present disclosure.
[0009] In another aspect, the present disclosure provides a method for inducing resistance to virus in plant or priming plant resistant to viruses, comprising treating the plant with a biologically pure culture filtrate derived from fungi or a polysaccharide comprising D-mannose, D-galactose and D-glucose with a 1,4-glucan linkage.
[0010] In another aspect, the present disclosure provides a method for decreasing virus accumulation in a plant, comprising treating the plant with a biologically pure culture filtrate derived from fungi or a polysaccharide comprising D-mannose, D-galactose and D-glucose with a 1,4-glucan linkage.
[0011] In a further aspect, the present disclosure provides a method for increasing PR1 expression in a plant, comprising treating the plant with a biologically pure culture filtrate derived from fungi or a polysaccharide comprising D-mannose, D-galactose and D-glucose with a 1,4-glucan linkage.
[0012] In some embodiment, the fungi is Trichosporon sp. Certain embodiment of the Trichosporon sp. includes Trichosporon scarabaeorum.
[0013] In one embodiment, the D-mannose, D-galactose and D-glucose has a .alpha.-1,4-glucan linkage; further embodiment is .alpha.-D-1,4-glucan linkage. In further embodiment, the D-mannose, D-galactose and D-glucose in the ratio about 0.5 to about 1.5:about 0.8 to about 2.0:about 8.0 to 12.0. Certain embodiment includes that the D-mannose, D-galactose and D-glucose in the ratio about 1.0:about 1.2:about 10.0.
[0014] In one embodiment, the culture filtrate and the method do not induce canonical SAR.
[0015] Certain embodiments of the plant include, but are not limited to, Nicotiana or Brassica. In some embodiment, the Nicotiana is N. glutinosa or N. benthamiana and the Brassica is B. juncea.
[0016] In one embodiment, the virus is Tobacco mosaic virus.
BRIEF DESCRIPTION OF THE DRAWING
[0017] FIG. 1A to FIG. 1D show lesion number and symptoms induced by Tobacco mosaic virus (TMV) with F2- and F8-culture filtrate pretreatment. (FIG. 1A) Nicotiana glutinosa was pretreated with H.sub.2O, 5 mM salicylic acid (SA), vegetable broth (VB), or F2- and F8-culture filtrate for total of three times with a 24-h interval between each spray. Pretreated plants were inoculated with TMV at 24 hpt, and untreated plants were inoculated with buffer (mock) for a control. Photos were taken at 5 dpi. (FIG. 1B) Lesion numbers induced by TMV recorded at 5 dpi. Data are mean+SD from three plants. Different letters above the bars represent significant differences among groups, P<0.05 by one-way ANOVA with Tukey's post-test. Experiments were repeated three times with similar results. (FIG. 1C) N. benthamiana was pretreated with H.sub.2O, 5 mM SA, VB, F2- or F8-culture filtrate for total of three times with a 24-h interval between each spray. All pretreated plants were inoculated with TMV at 24 hpt. Photos of TMV inoculated plants were taken at 7 dpi. (FIG. 1D) The level of disease index induced by TMV was recorded at 7 dpi. Box plots represent medians, 25-75 percentiles (boxes), and minimum and maximum values (whiskers) from 6 plants. Different letters above the bars represent significant differences among groups, P<0.05 by one-way ANOVA with Tukey's post-test. Experiments were repeated three times with similar results.
[0018] FIG. 2A and Figure B show lesion number on F8-culture filtrate treated Nicotiana glutinosa inoculated with purified Tobacco mosaic virus (TMV) particle. (FIG. 2A) N. glutinosa was pretreated with H.sub.2O, 5 mM salicylic acid (SA), vegetable broth (VB) and F8-culture filtrate for total of three times with a 24-h interval between each spray. Pretreated plants were inoculated with 1 .mu.g/ml, 10 .mu.g/ml and 50 .mu.g/ml of TMV particles, respectively at 24 hpt, and untreated plants were inoculated with buffer (mock) for a control. Photos were taken at 5 dpi. (FIG. 2B) Lesion numbers induced by TMV particle was recorded at 5 dpi. UC, uncountable. Data are mean+SD from three plants. Different letters above the bars represent significant differences among groups, P<0.05 by one-way ANOVA with Tukey's post-test. Different letters above the bars represent significant differences among groups, P<0.05 by one-way ANOVA with Tukey's post-test.
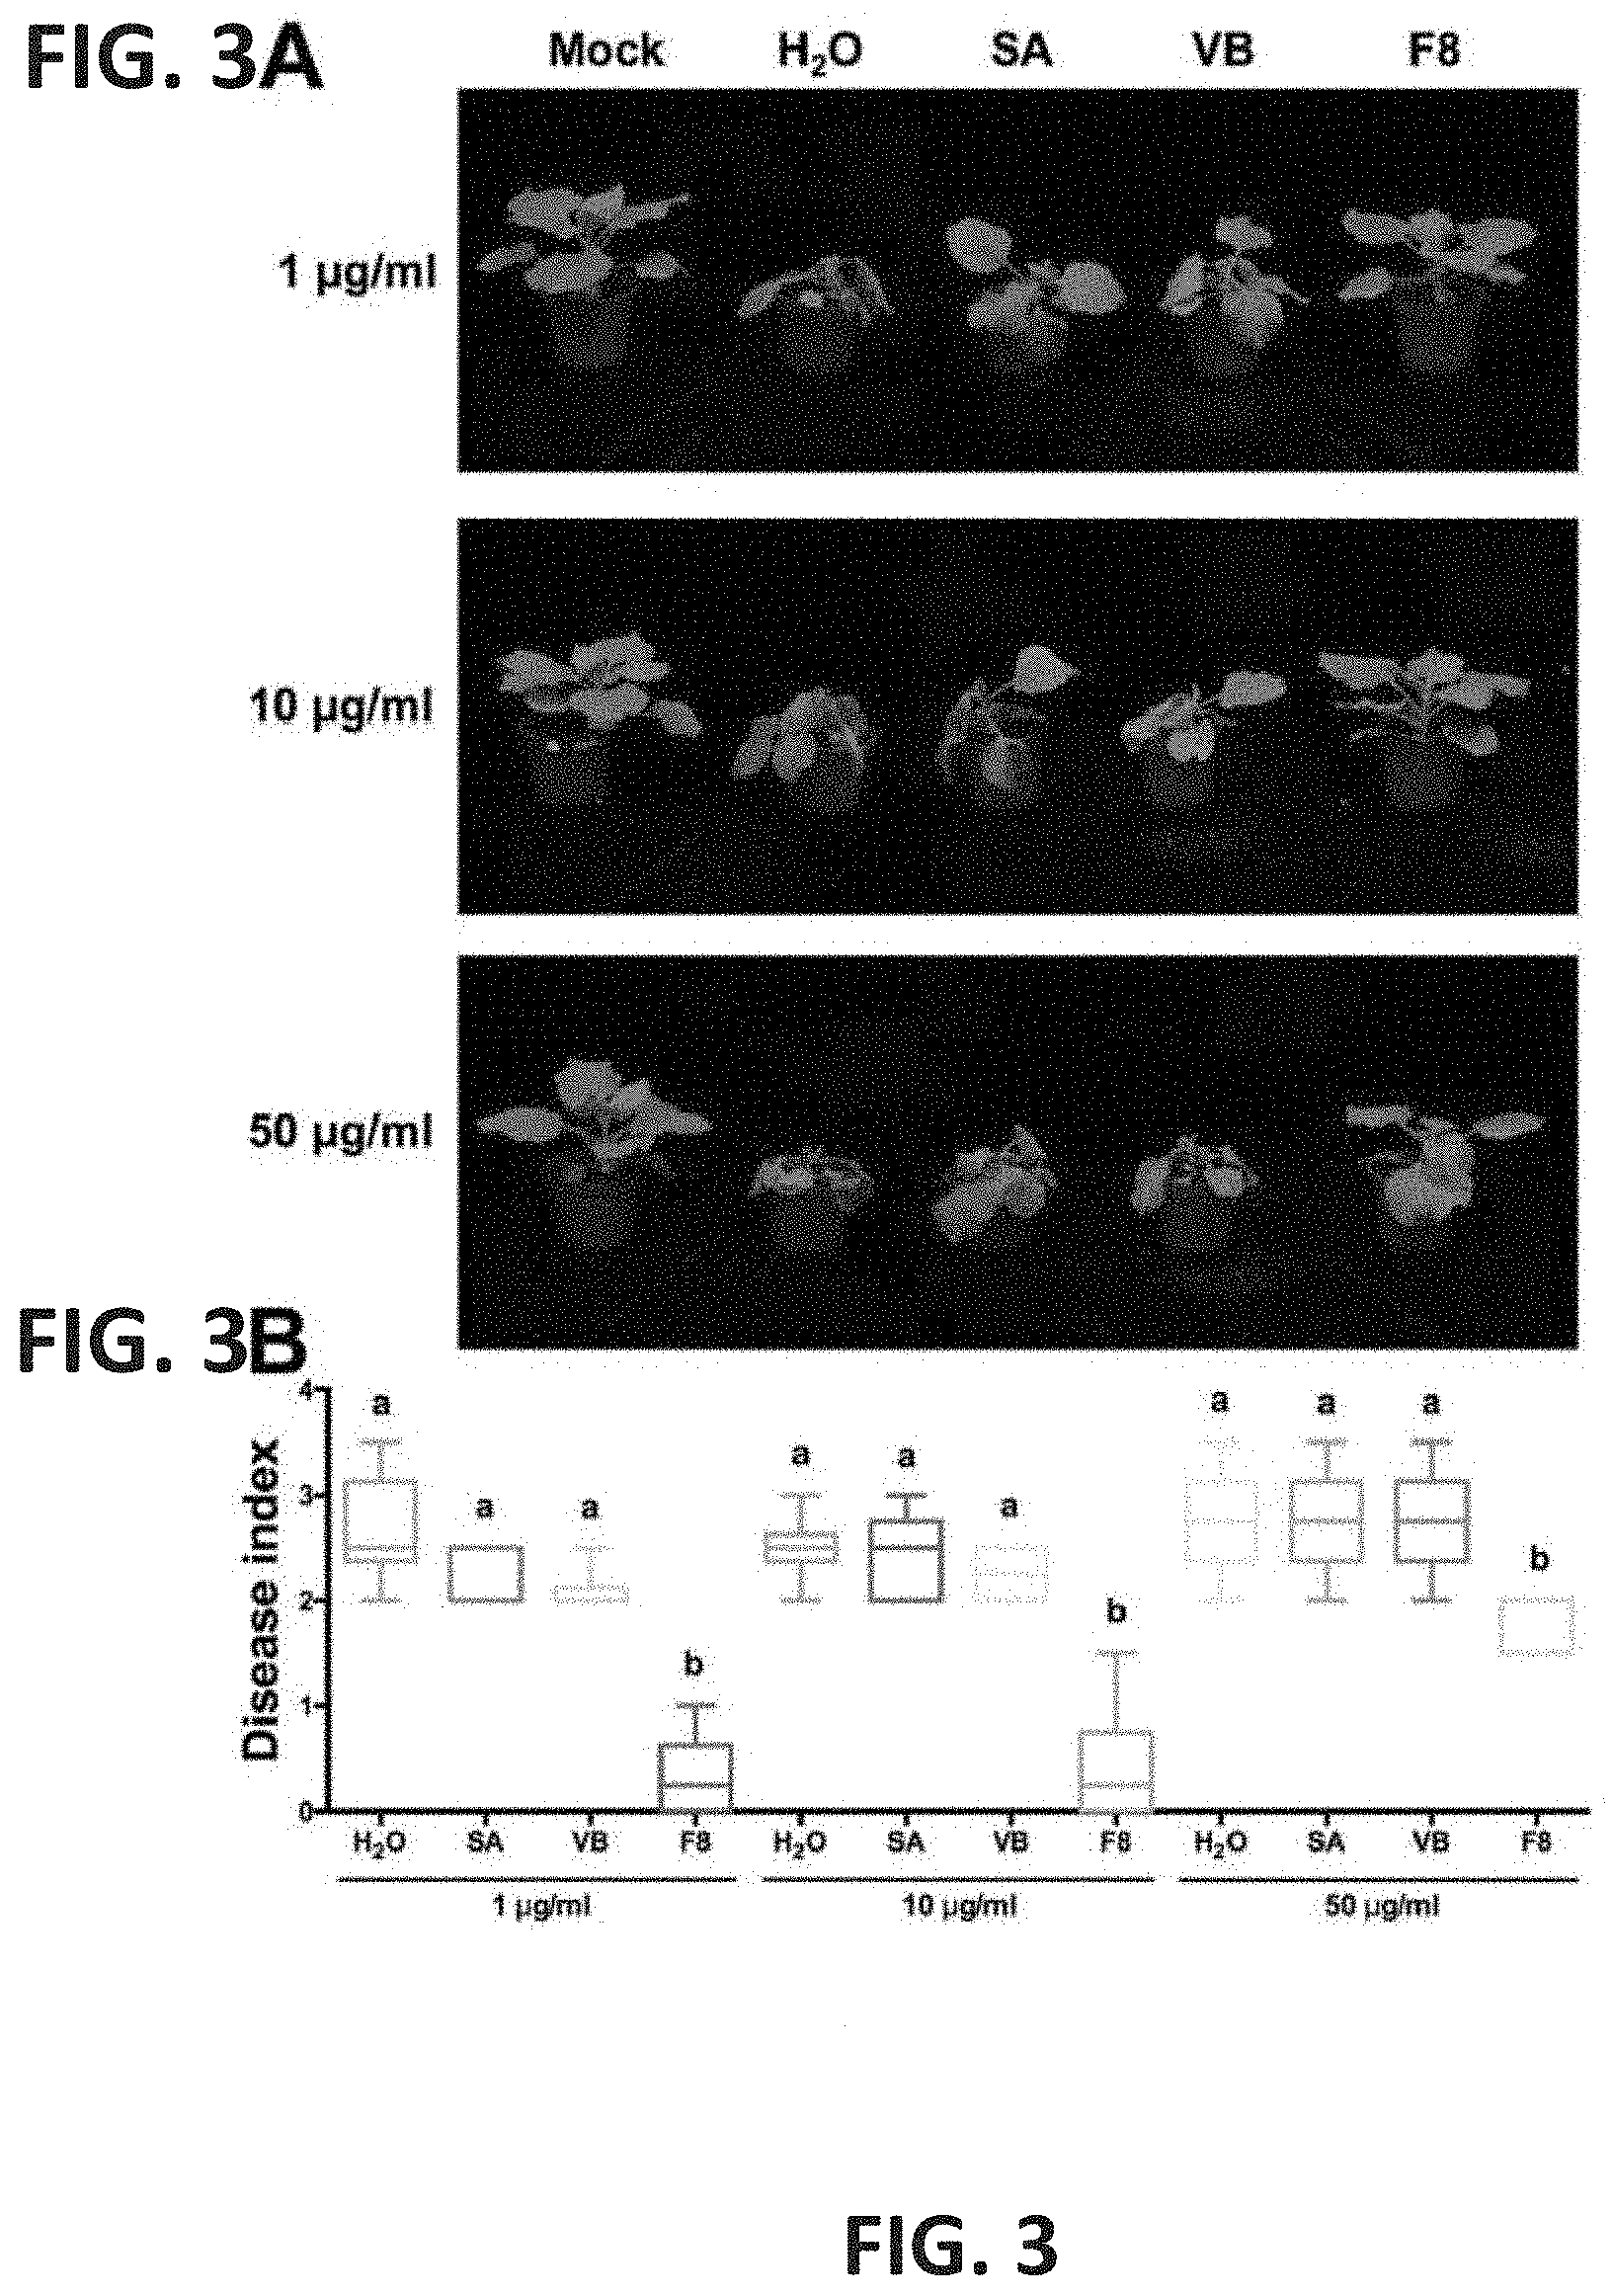
[0019] FIG. 3A and FIG. 3B show symptom on F8-culture filtrate treated Nicotiana benthamiana inoculated with purified Tobacco mosaic virus (TMV) particle. (FIG. 3A) N. benthamiana was pretreated with H2O, 5 mM salicylic acid (SA), VB or F8-culture filtrate (F8) three times at 24-h intervals. All plants were inoculated with 1 .mu.g/ml, 10 .mu.g/ml or 50 .mu.g/ml of TMV particles at 24 hpt. The photo was taken at 5 dpi. (FIG. 3B) The level of disease index induced by TMV was recorded at 5 dpi. Box plots represent medians, 25-75 percentiles (boxes), and minimum and maximum values (whiskers) from six plants. Different letters above the bars represent significant differences among groups, P<0.05 by one-way ANOVA with Tukey's post-test.
[0020] FIGS. 4A to 4F show that F8-culture filtrate does not confer systemic protection against Tobacco mosaic virus (TMV) or conical systemic acquired resistance (SAR) in Nicotiana benthamiana. The lower three leaves (local) of N. benthamiana were pretreated with H.sub.2O (H.sub.2O.sup.L), 5 mM salicylic acid (SA.sup.L), vegetable broth (VB.sup.L) or F8-culture filtrate (F8.sup.L) for total of three times with a 24-h interval between each spray. The three upper leaves (systemic) were inoculated with TMV at 2 dpt. Whole plants treated with F8-culture filtrate (F8) for total of three times with a 24-h interval between each spray was used as control. The photo was taken at 7 dpi (FIG. 4A), and the level of disease induced by TMV was recorded (FIG. 4B). Box plots represent medians, 25-75 percentiles (boxes), and minimum and maximum values (whiskers) from five plants. Different letters above the bars represent significant differences among groups, P<0.05 by one-way ANOVA with Tukey's post-test. Experiments were repeated at least three times with similar results. For expression analysis of SAR marker gene PR-1, local leaves of plants were pretreated with H.sub.2O, 5 mM SA, VB or F8-culture filtrate (F8) for total of three times with a 24-h interval between each spray. After treatment, local leaves (FIG. 4C) and systemic leaves (FIG. 4D) were collected at 24 hpt. Whole plants treated with H2O, 5 mM SA, VB or F8-culture filtrate (F8) were controls. The relative expression of PR-1 was detected by qRT-PCR. Data are mean+SD from three plants. Student's t test was used to analyzed the data between indicated treatment and H.sub.2O-pretreated control group. Asterisks indicate significant differences between H.sub.2O or F8 treated plants (*P<0.05, **P<0.01); ns, not significant. Experiments were repeated at least three times with similar results. (FIG. 4E) The whole plant was pretreated with H2O, 5 mM SA, VB or F8-culture filtrate (F8) for total of three times with a 24-h interval between each spray. Leaves were collected at 24 hpt. The relative expression of PR-1 was detected by qRT-PCR. Data are mean+SD from three plants. Student's t test was used to analyzed the data between indicated treatment and H.sub.2O-pretreated control group. Asterisks indicate significant differences between H.sub.2O or F8 treated plants (*P<0.05, **P<0.01); ns, not significant. Experiments were repeated at least three times with similar results. The whole plant was pretreated with H.sub.2O or F8-culture filtrate (F8) for total of three times with a 24-h interval between each spray. Pretreated plants were inoculated with TMV at 24 hpt. Inoculated leaves were collected at 24 hpi, 48 hpi, 72 hpi and 96 hpi. The relative expression of PR-1 was detected by qRT-PCR. Data are mean+SD from three to five plants. Asterisks indicate significant differences between H.sub.2O or F8 treated plants (*P<0.05, **P<0.01); ns, not significant. (FIG. 4F) The whole plant was pretreated with H.sub.2O or F8-culture filtrate (F8) for total of three times with a 24-h interval between each spray. Pretreated plants were inoculated with TMV at 24 hpt. Inoculated leaves were collected at 24 hpi, 48 hpi, 72 hpi and 96 hpi. The relative expression of PR-1 was detected by qRT-PCR. Data are mean+SD from three to five plants. Student's t test was used to analyzed the data between F8 treatment and H.sub.2O-pretreated control group. Asterisks indicate significant differences between H.sub.2O or F8 treated plants (*P<0.05, **P<0.01); ns, not significant.
[0021] FIG. 5A to FIG. 5F show Nicotiana benthamiana infected with TMV tagged with green fluorescence protein (TMV-GFP). (FIG. 5A) N. benthamiana was pretreated with H.sub.2O, 5 mM salicylic acid (SA), VB or F8-culture filtrate (F8) for total of three times with a 24-h interval between each spray. All plants were inoculated with TMV-GFP at 24 hpt. Photos were taken under UV light at 5 and 7 dpi. Scale bar=2 cm. (FIG. 5B) The mean number of TMV-GFP infection foci per plant at 5 dpi. Data are mean+SD from two to five plants. Different letters above the bars represent significant differences among groups, P<0.05 by one-way ANOVA with Tukey's post-test. (FIG. 5C) The relative accumulation of TMV-GFP per foci. TMV-GFP was quantified by qRT-PCR, and (3-actin was an internal control. Data are mean+SD from two to five plants. Different letters above the bars represent significant differences among groups, P<0.05 by one-way ANOVA with Tukey's post-test. (FIG. 5D) The area (mm.sup.2) of TMV-GFP infection foci was measured at 5 and 7 dpi. FIG. 5E) Photos of TMV-GFP-infected plants taken under white light or UV light at 13 dpi. (FIG. 5F) The mean time (days) for TMV-GFP to move to apical leaves. Experiments were repeated at least three times with similar results. Data are mean+SD from two to five plants.
[0022] FIG. 6A to FIG. 6D show symptoms induced by Turnip mosaic virus (TuMV) in Brassica juncea pretreated with F8-culture filtrate and fitness cost analysis of Nicotiana benthamiana and Brassica juncea with F8-culture filtrate pretreatment. (FIG. 6A) Brassica juncea was pretreated with H.sub.2O, VB or F8-culture filtrate (F8) for total of three times with a 24-h interval between each spray, then inoculated with TuMV at 24 hpt. Photos were taken at 13 dpi. Scale bar=5 cm. (FIG. 6B) The disease index induced by TuMV was recorded at 13 dpi. Box plots represent medians, 25-75 percentiles (boxes), and minimum and maximum values (whiskers) from six plants. Different letters above the bars represent significant differences among groups, P<0.05 by one-way ANOVA with Tukey's post-test. Experiments were repeated three times with similar results. Shoots of 6 N. benthamiana (15 days after seeding) (FIG. 6C) or Brssica juncea (10 days after seeding) (FIG. 6D) without treatment (WO) or with F8-culture filtrate (F8) pretreatment were used to measure fresh weight and leaf area at 20 or 25 dpt, respectively. All leaves were photographed with identical illumination and exposure conditions. The average leaf area per plant was calculated.
[0023] FIG. 7A to FIG. 7C show identification of F8 fungi. Phylogenetic tree of F8 fungi based on D1/D2 region (FIG. 7A) and ITS region (FIG. 7B) by neighbor-joining and maximum likelihood methods. The result using both analysis methods was similar, and only the neighbor-joining tree is shown here. (FIG. 7C) F8 fungi was cultured on 10% V-8 agar plate (V-8) and potato dextrose agar plate (PDA) for 15 days at 25.degree. C. Colony morphology was photographed and presented with front and back side. Microscopy depicting the morphology of arthroconidia and hyphae of F8 fungi grown on V-8 plate, 25.degree. C., for 7 days. Scale bar=20 .mu.m.
[0024] FIG. 8A to FIG. 8F show fractionation of F8-culture for antiviral activity analysis, and identification, NMR and linkage analysis of active functional compound derived from F8-culture filtrate. Nicotiana benthamiana was pretreated with H2O, 5 mM salicylic acid (SA), VB, F8-culture filtrate (F8), F8-sephadex fraction 2 (F8-fr2), H.sub.2O-re-suspended pellets derived from F8-fr2 precipitated with 20%, 50% and 80% ethanol (F8-fr2-20, 50 and 80% EtOH ppt) and HPLC-purified peaks 1 to 3 (*1 to *3) from H.sub.2O-re-suspended F8-fr2-80% EtOH ppt for total of three times with a 24-h interval between each spray. We define peak *2 as F8-polysaccharide. Pretreated plants were inoculated with TMV at 24 hpt. (FIG. 8A) Photos of Tobacco mosaic virus (TMV) inoculated plants taken at 7 dpi. (FIG. 8B) The disease index induced by TMV was recorded at 7 dpi. Box plots represent medians, 25-75 percentiles (boxes), and minimum and maximum values (whiskers) from six plants. Different letters above the bars represent significant differences among groups, P<0.05 by one-way ANOVA with Tukey's post-test. Experiments were repeated three times with similar results. (FIG. 8C) MALDI-TOF mass spectra of F8-sephadex fraction 2 (F8-fr2), H.sub.2O-re-suspended pellets derived from F8-fr2 precipitated with 20%, 50% and 80% ethanol (F8-fr2-20, 50 and 80% EtOH ppt) and HPLC-purified peaks 1 to 3 (*1 to *3) from H.sub.2O re-suspended F8-fr2-80% EtOH ppt at m/z 1800-6000, where the most peaks are. (FIG. 8D) HPLC-ELSD profile of F8-fr2-80% EtOH ppt. Three major peaks, *1 to *3, were collected for MALDI-TOF mass spectra analysis in (C). *2 was defined to be F8-polysaccharide. (FIG. 8E) Heteronuclear Single Quantum Coherence spectrum (.sup.1H-.sup.13C HSQC, D20, 323K, 600 MHz) of F8-polysaccharide. Determination of the .sup.1J.sub.HC of G1 (alpha configuration) was based on the satellite signals of G1 (dH 5.63, dc 99.9) in the Heteronuclear Multiple Bond Correlation spectrum (.sup.1H-.sup.13C HMBC). (FIG. 8F) Gas chromatography mass spectrometry (GC-MS) linkage analysis of F8-polysaccharide. 1,4-linked-D-glucopyranosyl residue was the main linkage composition.
[0025] FIG. 9A to FIG. 9D show the relative expression of salicylic acid (SA) associated immune marker genes. The relative expression of SA-responsive genes PR-1 (FIG. 9A) and PR-2 (FIG. 9C) detected by qRT-PCR. Plants were pretreated with H.sub.2O or F8-polysaccharide for total of three times with a 24-h interval between each spray, then samples collected at 0, 12, 24, 36, 48, 72, 96 hpt. Tobacco mosaic virus (TMV) inoculation or mock treatment was conducted on different indicated 24 hpt plants (FIG. 9B, FIG. 9D). Leaf samples were collected from TMV-infected plants at 1-, 36-, 48- and 72-h post TMV inoculation. The relative expression of PR-1 (FIG. 9B) and PR-2 (FIG. 9D) was detected by qRT-PCR. Data are mean+SD from three to five plants. All lettering indicates statistically significance (P<0.05 by one-way ANOVA with Tukey's post-test). "a" indicates statistically significance between F8-polysaccharide-treated samples at indicated time to F8-polysaccharide-treated samples collected at 0 hpt. "b" indicates statistically significant between H.sub.2O and F8-polysaccharide-treated samples at each time course. "c" indicates statistically significance between H.sub.2O-treated mock-inoculated and F8-treated mock-inoculated. "d" indicates statistically significance between H.sub.2O-treated TMV-inoculated and F8-treated TMV-inoculated. "e" indicates statistically significance between H.sub.2O-treated mock-inoculated and H.sub.2O-treated TMV-inoculated. "f" indicates statistically significance between F8-treated mock-inoculated and F8-treated TMV-inoculated. "g" indicates statistically significance to H.sub.2O-treated mock-inoculated at 0 hpi.
[0026] FIG. 10 shows screening of culture filtrates derived from soil microorganisms for inducing resistance to TMV in N. glutinosa. Soil microorganisms including actinomycetes, bacteria, and fungi were cultured with VB, and culture filtrates were collected. Each collected culture filtrate was sprayed on N. glutinosa three times at 24-h intervals. TMV was inoculated at 24 h post-treatment (hpt). Lesion numbers induced by TMV on leaves were counted at 5 days post-inoculation (dpi). Results are percentage of total lesion number induced by TMV in each culture filtrate to VB pretreatment. NTU1-4 indicates soil samples were collected at different locations. Isolated actinomycetes, bacteria, and fungi isolates are represented as A, B and C, respectively, followed by a number. Black arrow indicates fewer lesions induced by TMV with (F8)- and NTU4 F2 (F2)-culture filtrate pretreatment. A total of 199 microorganisms were isolated, including 77 actinomycetes, 68 bacteria and 54 fungi; only part of our analysis are presented here.
[0027] FIG. 11A and FIG. 11B show symptoms induced by TMV in N. benthamiana with F8-culture filtrate and pellet pretreatment. (FIG. 11A) N. benthamiana was pretreated with H.sub.2O, 5 mM salicylic acid (SA), VB, F8-culture filtrate (F8), F8-derived pellet (F8-pellet) or 2-fold F8-derived pellet (2*F8-pellet) three times at 24-h intervals. All plants were inoculated with TMV at 24 hpt. The photo was taken at 7 dpi. (FIG. 11B) The level of disease index induced by TMV was recorded at 7 dpi. Box plots represent medians, 25-75 percentiles (boxes), and minimum and maximum values (whiskers) from six plants. Different letters above the bars represent significant differences among groups, P<0.05 by one-way ANOVA with Tukey's post-test. Experiments were repeated at least three times with similar results.
[0028] FIG. 12A to FIG. 12D show analysis of fractions derived from fractionation of F8-cluture filtrate on inducing plant resistance against TMV. F8-culture filtrate was passed through a Sephadex LH2O column, and 8 fractions (F8-fr1 to -fr8) were collected. Nicotiana glutinosa (FIG. 12A) and N. benthamiana (FIG. 12B and FIG. 12C) were pretreated with H.sub.2O, 5 mM SA, VB, F8-culture filtrate (F8) or F8-culture filtrate fractions F8-fr1-8 three times at 24-h intervals. Pretreated plants were inoculated with TMV at 24 hpt. Lesion numbers induced by TMV on N. glutinosa were recorded at 5 dpi. Data are mean+SD from three plants. Different letters above the bars represent significant differences among groups, P<0.05 by one-way ANOVA with Tukey's post-test. Experiments were repeated three times with similar results. The level of disease induced by TMV on N. benthamiana was recorded at 7 dpi. Only fractions F8-fr1-4 are shown here. Box plots represent medians, 25-75 percentiles (boxes), and minimum and maximum values (whiskers) from six plants. The different letters above the bars represent significant differences among groups, P<0.05 by one-way ANOVA with Tukey's post-test. Experiments were repeated three times with similar results. (FIG. 12D) MALDI-TOF mass spectra of F8-fr1-8 at m/z 1000-5000, area with the most peaks.
[0029] FIG. 13 shows molecular weight estimation of F8-polysaccharide using polyethylene glycol as standards by HPLC analysis. Column: Two TSK SuperAW2500 (each 15 cm.times.4.6 mm, 5 .mu.m); Flow rate: 0.1 mL/min; Mobile phase: 100% ddH.sub.2O; Detector: ELSD. MW 12600, Rt 36.5 min; MW6550, Rt 37.2 min; MW4270, Rt 38.4 min; MW1400, Rt 43.2 min; MW 4260-12000, Rt 36.7, 38.4 min).
[0030] FIG. 14A to FIG. 14D show the relative expression of immune marker genes. (FIG. 14A) Plants were pretreated with 5 mM salicylic acid (SA), 250 .mu.M methyl jasmonate (Me-JA) or 2 mM 1-aminocyclopropane-1-carboxylic acid (ACC). Leaves were collected at the indicated time. The relative expression of SA-responsive genes PR-1 and PR-2, jasmonic acid (JA)-responsive genes plant defensin 1.2 (PDF-1.2) and PR-4, and ethylene (ET)-responsive genes osmotin (OSM) and ethylene-responsive element binding proteins (EREBP) were detected by qRT-PCR. Plants were pretreated with H.sub.2O or F8-polysaccharide for total of three times with a 24-h interval between each spray, then collected at 0, 12 and 24 hpt. At 24 hpt, Tobacco mosaic virus (TMV) was inoculated into treated plants, and leaf samples were collected from TMV-infected plants at 12, 24, 48 and 72-h post TMV inoculation. The TMV-CP was quantified by qRT-PCR (FIG. 14B). The relative expression of PDF1.2 (FIG. 14C) and EREBP (FIG. 14D) was detected by qRT-PCR from TMV-infected plants at 1, 12, 24, 48 and 72-h post TMV inoculation that were pretreated with H.sub.2O or F8-polysaccharide. Data are mean+SD from three plants. All H.sub.2O-treated samples are compared to H.sub.2O-treated samples collected at 0 hpt and "a" indicates statistically significant (P<0.05 by one-way ANOVA with Tukey's post-test). All F8-polysaccharide-treated samples are compared to F8-polysaccharide-treated samples collected at 0 hpt, and "b" indicates statistically significant (P<0.05 by one-way ANOVA with Tukey's post-test). H.sub.2O and F8-polysaccharide-treated samples were compared at each time course, and "c" indicates statistically significant (P<0.05). N. D., not detected.
[0031] FIG. 15A and FIG. 15B show disease index of N. benthamiana inoculated with TMV and Brassica juncea inoculated with TuMV. (FIG. 15A) N. benthamiana were inoculated with TMV. The disease index was classified into 4 levels according to the degree of yellowing, stunting and wilting at 7 dpi. (FIG. 15B) Brassica juncea were inoculated with TuMV. The disease index was classified into 3 levels according to the degree of leaf mosaic and stunting at 13 dpi.
DETAILED DESCRIPTION OF THE INVENTION
[0032] When the articles "a," "an," "one," "the," and "said" are used herein, the mean "at least one" or "one or more" unless otherwise indicated.
[0033] As used herein, a "biologically pure fungi culture" refers to a culture of fungi containing no other fungi or bacterial species in quantities sufficient to interfere with the replication of the culture or be detected by normal techniques.
[0034] As used herin, the terms "agriculturally acceptable carrier" and "carrier" are interchangeable.
[0035] As used herein, the terms "composition" and "formulation" are interchangeable throughout the application.
[0036] As used herein, the term "effective amount" refers to a quantity which is sufficient to prime a statistically significant resistance to viruses in a plant as compared to the control-treated plant.
[0037] Plant viruses cause devastating diseases in plants, yet not effective viricide is available for agricultural application. In plants, local infection may also induce a systemic plant immune response. Two types of induced systemic immune responses, systemic acquired response (SAR) and induced systemic response (ISR), have been reported in plants (Pieterse, C. M., Zamioudis, C., Berendsen, R. L., Weller, D. M., Van Wees, S. C., and Bakker, P. A. 2014. Induced systemic resistance by beneficial microbes. Annual review of phytopathology 52:347-375). ISR is induced by plant growth-promoting rhizobacteria (PGPR) and depends on JA and ET (Pieterse, C. M., Zamioudis, C., Berendsen, R. L., Weller, D. M., Van Wees, S. C., and Bakker, P. A. 2014. Induced systemic resistance by beneficial microbes. Annual review of phytopathology 52:347-375). The onset of SAR depends on SA, and SAR is efficient against a broad spectrum of pathogens including viruses. SAR is usually induced by pathogens that cause a necrotic lesion resulting from a hypersensitive response during an incompatible interaction or cell death with a compatible interaction.
[0038] The systemic immune response is usually associated with a primed state, whereby plants respond faster and/or more strongly in activating defense responses when subsequently challenged by pathogens (Mauch-Mani, B., Baccelli, I., Luna, E., and Flors, V. 2017. Defense Priming: An Adaptive Part of Induced Resistance. Annual review of plant biology 68:485-512). Elevated levels of pattern recognition receptors, dormant signaling enzymes, transcription factors, and alterations in chromatin state have been suggested to provide plants with a memory to establish a defense primed state (Mauch-Mani, B., Baccelli, I., Luna, E., and Flors, V. 2017. Defense Priming: An Adaptive Part of Induced Resistance. Annual review of plant biology 68:485-512). The immune priming allows plants to better defend against pathogen invasion with lower resistance-associated fitness cost (Mauch-Mani, B., Baccelli, I., Luna, E., and Flors, V. 2017. Defense Priming: An Adaptive Part of Induced Resistance. Annual review of plant biology 68: 485-512).
[0039] Viruses usually trigger the SA-related plant defense response, and exogenous application of SA or its analogs such as benzo-thiadiazol-7-carbothioic acid-S-methyl ester (BTH) and acibenzolar-S-methyl (a derivative of BTH) can trigger the SAR against virus infection. However, effectiveness and phytotoxicity hamper the application of SA or its analogs in the field.
[0040] The present disclosure provides a culture filtrate, filtrate fractations and polysaccharides derived from fungi that enhance plant viral resistance. In an embodiment, a cultured filtrate, designated F8-culture filtrate, derived from a fungus belonging to the genus Trichosporon, induced strong resistance to various viruses on different plants. In some embodiments, the infection rate of TMV-inoculated N. benthamiana with F8-culture filtrate pretreatment may decrease to 0%, whereas salicylic acid (SA) pretreated N. benthamiana attenuated TMV caused symptoms, but remained 100% infected. Notably, F8-culture filtrate only triggered local defense, but was much more effective than conventional SA-mediated systematic acquired resistance. Our finding revealed that microbial cultured metabolites provided a rich source for identification of potent elicitors in plant defense.
[0041] From the culture filtrate, a previously unknown polysaccharide is identified, which comprises D-mannose, D-galactose and D-glucose with a 1,4-glucan linkage to be responsible for the induction of plant resistance against viruses through priming of SA-governed immune responsive genes.
[0042] The culture filtrate is derived from fungi, comprising a polysaccharide comprising D-mannose, D-galactose and D-glucose with a 1,4-glucan linkage. Preferably, the linkage isa-1,4-glucan linkage; more preferably, the linkage isa-D-1,4-glucan linkage.
[0043] The D-mannose, D-galactose and D-glucose in the ratio about 0.5 to about 1.5:about 0.8 to about 2.0:about 8.0 to 12.0. Preferably, the D-mannose, D-galactose and D-glucose in the ratio about 1.0:about 1.2:about 10.0.
[0044] Examples of the fungi include, but are not limited to, Trichosporon sp. Certain embodiment of the Trichosporon sp. includes Trichosporon scarabaeorum.
[0045] The present disclosure also provides a composition comprising a culture filtrate or a polysaccharide of the present disclosure.
[0046] Accordingly, the fungi, the culture filtrate and the polysaccharide of the present disclosure can induce resistance to virus in plant or prime plant resistant to viruses, comprising treating the plant with a biologically pure culture filtrate derived from fungi or a polysaccharide comprising D-mannose, D-galactose and D-glucose with a 1,4-glucan linkage.
[0047] Alternatively, the fungi, the culture filtrate and the polysaccharide of the present disclosure can decrease virus accumulation in a plant, comprising treating the plant with a biologically pure culture filtrate derived from fungi or a polysaccharide comprising D-mannose, D-galactose and D-glucose with a 1,4-glucan linkage.
[0048] Alternatively, the fungi, the culture filtrate and the polysaccharide of the present disclosure can increase PR1 expression in a plant, comprising treating the plant with a biologically pure culture filtrate derived from fungi or a polysaccharide comprising D-mannose, D-galactose and D-glucose with a 1,4-glucan linkage.
[0049] The fungi, the culture filtrate and the polysaccharide of the present disclosure do not induce canonical SAR.
[0050] Certain embodiments of the plant include, but are not limited to, Nicotiana or Brassica. In some embodiment, the Nicotiana is N. glutinosa or N. benthamiana and the Brassica is B. juncea.
[0051] The virus to be resisted includes, but is not limited to, Tobacco mosaic virus.
[0052] In addition to one or more biologically pure culture filtrates as described in the present disclosure, the composition also comprises an agriculturally acceptable carrier. The carrier can include a dispersant, a surfactant, an additive, water, a thickener, an anti-caking agent, residue breakdown, a composting formulation, a granular application, diatomaceous earth, an oil, a coloring agent, a stabilizer, a preservative, a polymer, a coating, or a combination thereof. One of ordinary skill in the art can readily determine the appropriate carrier to be used taking into consideration factors such as a particular fungi strain, plant to which the composition is to be applied, type of soil, climate conditions, whether the composition is in liquid, solid or powder form, and the like.
[0053] The additive can comprise an oil, a gum, a resin, a clay, a polyoxyethylene glycol, a terpene, a viscid organic, a fatty acid ester, a sulfated alcohol, an alkyl sulfonate, a petroleum sulfonate, an alcohol sulfate, a sodium alkyl butane diamate, a polyester of sodium thiobutant dioate, a benzene acetonitrile derivative, a proteinaceous material, or a combination thereof. The proteinaceous material can include a milk product, wheat flour, soybean meal, blood, albumin, gelatin, or a combination thereof. The thickener can comprise a long chain alkylsulfonate of polyethylene glycol, polyoxyethylene oleate, or a combination thereof. The surfactant can contain a heavy petroleum oil, a heavy petroleum distillate, a polyol fatty acid ester, a polyethoxylated fatty acid ester, an aryl alkyl polyoxyethylene glycol, an alkyl amine acetate, an alkyl aryl sulfonate, a polyhydric alcohol, an alkyl phosphate, or a combination thereof. The anti-caking agent can include a sodium salt such as a sodium sulfite, a sodium sulfate, a sodium salt of monomethyl naphthalene sulfonate, a sodium salt of dimethyl naphthalene sulfonate, or a combination thereof; or a calcium salt such as calcium carbonate, diatomaceous earth, or a combination thereof.
[0054] Any agriculturally acceptable carrier can be used. Such carriers include, but are not limited to, vermiculite, charcoal, sugar factory carbonation press mud, rice husk, carboxymethyl cellulose, peat, perlite, fine sand, calcium carbonate, flour, alum, a starch, talc, polyvinyl pyrrolidone, or a combination thereof.
[0055] Compositions can be prepared as solid, liquid or powdered formulations as is known in the art. When the composition is prepared as a liquid formulation for application to plants or to a plant growth medium, it can be prepared in a concentrated formulation or a working form formulation. When the composition is prepared as a solid formulation for application to plants or to a plant growth medium, it can be prepared as a granular formulation or a powder agent.
[0056] The following non-limiting examples illustrate various aspects of the present invention.
EXAMPLES
[0057] Material and Methods
[0058] Isolation of soil microorganisms and preparation of culture filtrate for antiviral activity assay.
[0059] Soil samples (10-20 g) were collected from 5-10 cm depth in Taipei, Taiwan. Soil micoorganisms were isolated with selective medium as reported by Ko et al. (2010), except we adjusted the pH of vegetable broth (VB) to 4.7 for culture of F8 fungi and the VB was filtrated through a 25-.mu.m filter before storing at -80.degree. C.
[0060] Plant Materials and Inoculation of Viruses
[0061] Plants were grown in a growth chamber with 10,000 lux fluorescent light and a 16-h light/8-h dark cycle. N. glutinosa (6-7 weeks old, 8-10 leaf stage), N. benthamiana (3-4 weeks old, 5-6 leaf stage) and Brassica juncea (14 days old, 2-3 true-leaf stage) were used for treatment and/or inoculation. For virus inoculation, plants were dusted with 600-grit silicon carbide powder (Sigma-Aldrich, St. Louis, Mo., USA) and mechanically inoculated. Virus inoculum was prepared with 100 ml of 0.1 M potassium phosphate (KP) buffer (61.5% of 0.1 M K2HPO4 and 38.5% 0.1 M KH2PO4, pH 7.0) mixed with 0.1 g of lyophilized leaves of plants infected with Tobacco mosaic virus (TMV) (FIGS. 1, 4A-E, 8 and 9; FIG. 10, 11, 12, 14 and 15; Table 1), or TMV tagged with green fluorescence protein (TMV-GFP) (FIG. 5) (Rabindran, S., and Dawson, W.O. 2001. Assessment of recombinants that arise from the use of a TMV-based transient expression vector. Virology 284:182-189). Different concentrations of TMV purified particle inoculum was diluted with 0.1 M potassium phosphate (KP) buffer (61.5% of 0.1 M K2HPO4 and 38.5% 0.1 M KH2PO4, pH 7.0) (FIGS. 2, 3, and 4F; Table 2). Turnip mosaic virus (TuMV) inoculum was prepared with 0.1 g of fresh leaves from plants infected with TuMV ground with 10 ml of 0.1 M sodium phosphate buffer (0.1 M NaH2PO4, 0.1 M Na2HPO4 and 0.5% Na2SO3, pH 7.4). The severity of TMV or TuMV symptom of infected plants were scored based on external phenotype (FIG. 15). Transmission electron microscope (Philips Electronic Instruments, Mahwah, N.J.) was used to examine TMV particles of different inoculums.
[0062] Purification of TMV Particles
[0063] Leaves of TMV-infected N. benthamiana were harvested approximately 5 days after inoculation. The initial purification of TMV virus particles followed the protocol as described by Gooding and Hebert (1967) with modifications. Briefly, polyethylene glycol with molecular weight 8000 (PEG 8000) (Sigma-Aldrich) was used instead of PEG 6000. In addition, the semi-purified preparation was submitted to linear density sucrose gradient (0-18%), and ultracentrifuged at 228,000.times.g for 1.5 h. The light scattering region was collected and diluted with 100 ml of suspension buffer (35 mM Na2HPO4, 15 mM NaH2PO4 and 0.05% 2-mercaptoethanol, pH7.2). NaCl (0.4 g) and PEG 8000 (4 g) were added and stirred for at least 1 h on ice, then centrifuged at 9000.times.g for 15 min at 4.degree. C. The pellets were re-suspended in 1 ml of suspension buffer. The concentration of the purified TMV suspension was determined (A260 nm=0.3 for 1 mg/mL of TMV) with a Nanodrop (ND-1000, Thermo Fisher Scientific, MA, USA).
[0064] Antiviral Activity Assays
[0065] Whole plants were sprayed with 0.4 ml H.sub.2O, VB, culture filtrate derived from microorganism or 5 mM salicylic acid (SA, Sigma-Aldrich) for total of three times with a 24-h interval between each spray. Twenty-four hours after the final treatment, plants were rubbed with the virus inoculum.
[0066] Measurement of Area of TMV-GFP Infection Foci
[0067] Photographs of TMV-GFP fluorescent infection foci in N. benthamiana leaves were taken under UV light at 5 and 7 days post-inoculation (dpi), and the level of fluorescence as well as the areas of fluorescent infection sites in each leaf were measured by using ImageJ v1.47. All imaging was conducted under identical illumination and exposure conditions to allow for comparisons. Mean values of areas of all infection foci per treatment were calculated.
[0068] RNA Extraction and Gene Expression Analysis
[0069] Total RNA was isolated by use of Trizol (Invitrogen, Bethesda, Md.) according to the manufacturer's instruction. Residual DNA was removed by using the TURBO DNA-free kit (Ambion, Austin Tex., USA). cDNA was synthesized by using the PrimeScript RT-PCR Kit (Takara Bio, Shiga, Japan). Quantitative RT-PCR (qRT-PCR) involved the SYBR protocol (Life Technologies) and the ABI 7100 real-time PCR system (Applied Biosystems, Carlsbad, Calif.). For quantitative analysis, actin was used as an input control. Relative fold change in mRNA expression was determined by calculating 2.sup.-.DELTA..DELTA.Ct. The sequences of primers used are in Table 51.
[0070] Identification of Fungi and Phylogenetic Analysis
[0071] Genomic DNA was extracted by the CTAB method (Chang et al., 1993). Internal transcribed spacer or 26S rDNA region sequences were amplified with specific primers designed for the ITS1-5.85-ITS2 region (ITS5e-F and ITS4e-R) and D1/D2 domain (LR1-F and LR3-R), respectively (Table 51). The sequence alignment involved use of CLUSTAL X (1.81) (Thompson, JD., Gibson, T. J., Plewniak, F., Jeanmougin, F., and Higgins, D. G. 1997. The CLUSTAL_X windows interface: flexible strategies for multiple sequence alignment aided by quality analysis tools. Nucleic acids research 25:4876-4882). All of the phylogenetic trees in this study were generated by using MEGA5 (Tamura, K., Peterson, D., Peterson, N., Stecher, G., Nei, M, and Kumar, S. 2011. MEGA5: molecular evolutionary genetics analysis using maximum likelihood, evolutionary distance, and maximum parsimony methods. Molecular biology and evolution 28:2731-2739). Phylogenetic analyses involved neighbor-joining (NJ) and maximum likelihood (ML) methods. The branch supports of NJ and ML methods were analyzed by using PAUP* 4.0 b 10 (Swofford, D. L. 2003. (PAUP*. Phylogenetic Analysis Using Parsimony (*and Other Methods). Version 4.}. Sinauer Associates) with bootstrapping. NJ involved a Kimura 2-parameter model, and node support was analyzed by bootstrapping with 1,000 replicates. ML involved a Jukes-Cantor model and bootstrapping with 1,000 replicates. Bootstrap minimal concordance was set to 80%. These sequence data have been submitted to the GenBank databases under accession number MG757354 and MG752969.
[0072] Measurement of Leaf Area and Fresh Weight
[0073] N. benthamiana (16 days after seeding) and Brassica juncea (10 days after seeding) were treated with the F8-culture filtrate as described in the antiviral activity assay. All shoot tissues of individual plants were measured for fresh weight. Leaves were randomly collected from 6 individual N. benthamiana or Brassica juncea plants with or without F8-culture filtrate treatment at 20 days or 25 days post-treatment (dpt), respectively. Photos were taken from every collected leaf by using identical illumination and exposure conditions. Each leaf area was measured by using Image J.
[0074] Identifying the Active Functional Compound of F8-Culture Filtrate for Inducing Plant Resistance
[0075] To purify and characterize the active functional compound, freeze-dried powder (from 90 ml of F8-culture filtrate) was dissolved in 90 ml of distilled H.sub.2O. After centrifugation at 6000.times.g for 10 min, the supernatant was separated on a prepacked gel filtration Sephadex LH-20 column (GE Healthcare Life Sciences, Uppsala, Sweden) eluted with 500 ml of H.sub.2O per fraction. Eight fractions derived from the F8-culture filtrate (F8-fr1-8) were collected and freeze-dried, then dissolved in 90 ml distilled H.sub.2O and tested for antiviral activity.
[0076] Isolation of Polysaccharides
[0077] The F8-fr was mixed with a ratio of ethanol to H.sub.2O/ethanol [80:20 (v/v)] and stirred vigorously at 4.degree. C. The precipitate was centrifuged at 6000.times.g for 10 min. The supernatant was precipitated again by the addition of a ratio of ethanol to H.sub.2O/ethanol [50:50 (v/v)] and H.sub.2O/ethanol [20:80 (v/v)]. All of the precipitate was dissolved in 90 ml distilled H.sub.2O, then tested for antiviral activity. To remove minor impurities, the F8-fr2-80% EtOH pellets were further purified by preparative high-performance liquid chromatography (HPLC) with a TSKgel P2500GW column (21.5 mm.times.60 cm, Tosoh Bioscience LLC, Japan) for structure elucidation. The HPLC-purified F8-frs were dissolved in distilled H.sub.2O, then tested for antiviral activity.
[0078] Polysaccharide Structure Elucidation
[0079] For sugar composition analysis, the purified polysaccharide underwent methanolysis by 3N Methanolic-HCl (Supelco) for 14 h at 85.degree. C. in a sealed glass tube. After drying with Na, the residue was then acetylated with 50 .mu.L acetic anhydride and 10 .mu.L pyridine in 500 .mu.L methanol at room temperature for 20 min. All solvent was removed by a steady stream of nitrogen, then the Sylon HTP kit (Supelco) was used for trimthylation at room temperature for 30 min. The dried sample was dissolved with 800 .mu.L n-hexane (HPLC grade, Sigma), then analyzed by GC-MS. All data were collected by GC-MS (Bruker) with a HP-5MS silica capillary column (30 m.times.0.25 mm I.D., HP) and temperature gradient of 1 min at 60.degree. C., 2 min at 60-90.degree. C., 9 min at 90-290.degree. C., 5 min at 290.degree. C., 36 min at 290-300.degree. C., and kept for 2 min at 300.degree. C.
[0080] For the linkage analysis, the polysaccharide was lyophilized, then dissolved in 1 mL DMSO overnight at 80.degree. C. NaOH pellets were ground with a motor and added into the sample solution for 2-h incubation in a sealed tube. The sample was methylated by using CH3I and powder NaOH in DMSO. Furthermore, the dried sample was partitioned with H.sub.2O and CHC13 to give the organic layer. The dried organic layer residue was further hydrolyzed with 2 M trifluoroacetic acid (TFA) at 120.degree. C. for 1 h to give the partially methylated monosaccharides. Then the sample was reduced by NaBD.sub.4 at room temperature for 1 h and neutralized with AcOH. The solution was co-evaporated with MeOH to remove the boric acid. After that, the sample was acetylated with 1:2 pyridine-Ac.sub.2O at 80.degree. C. for 1 h and the mixture was partitioned with H.sub.2O--CHCl.sub.3. The organic layer containing methyl alditol acetates was analyzed by GC-MS on HP-5MS silica capillary column (30 m.times.0.25 mm I.D., HP) temperature gradient 1 min at 60.degree. C., 2 min at 60-90.degree. C., 9 min at 90-290.degree. C., 5 min at 290.degree. C., 36 min at 290-300.degree. C., and kept for 2 min at 300.degree. C. The polysaccharide consisted of terminal-D-glucopyranosyl residue, 4-linked-D-glucopyranosyl residue, and 4,6-linked-D-gluctopyranosyl residue.
[0081] The 1D and 2D NMR spectra were collected by using a Bruker AVANCE 600 spectrometer in D.sub.2O at 323K. All 2D NMR experiments were carried out with standard pulse sequences provided by Bruker. For the NMR data, the major composition of the polysaccharide was determined to be .alpha.-1,4-glucan. The assignments of protons and carbons of the sample are in Table 4.
TABLE-US-00001 TABLE 4 .sup.1H and .sup.13C NMR chemical shifts (.delta., D.sub.2O, 323K) of F8-polysaccharide H-1 H-2 H-3 H-4 H-5 H-6a; H-6b C-1 C-2 C-3 C-4 C-5 C-6 .sup.a-(1.fwdarw.4)-.alpha.-D- 5.63 3.88 4.21 3.90 4.10 4.11; 4.08 Glcp-(1.fwdarw.4)- 99.9 71.8 73.6 77.4 71.8 60.8 .sup.aThe configuration was determined based on the .sup.1J.sub.H1-C1 = 173.3 Hz
[0082] MALDI-TOF MS
[0083] An amount of 1 .mu.L sample was spotted on a MTP 384 ground steel plate and 1 .mu.L saturated universal matrix solution (Sigma, dissolved in 50% acetonitrile with 0.1% TFA) was spotted on top of the sample for MALDI-TOF MS analysis. A Bruker Autoflex Speed MALDI-TOF/TOF MS (Bruker, Bremen, Germany) equipped with a Smartbeam laser (1000 Hz) was used for MALDI-TOF MS analysis. All data were collected in positive ion liner mode and analyzed by using Daltonics flexAnalysis 3.0 (Bruker).
[0084] Preparation of F8-Culture Pellet Suspension
[0085] F8-culture filtrate (100 ml) was centrifuged at 23000.times.g for 30 min. The supernatant was removed, and 100 ml of H.sub.2O was added to re-suspend the pellet. The re-suspended pellet was squeezed twice in a high-pressure homogenizer EF-C3 (Avestin EF-C3, Canada) at 20 kpsi. The final F8-culture pellet suspension was used for assay of induced plant resistance.
[0086] Determination of Molecular Weight of Polysaccharide
[0087] The molecular weight of polysaccharide was determined by using a Hitachi HPLC system equipped with an ELSD Detector (Alltech 3300, Grace) and two in-series TSK SuperAW2500 columns were used (6.0 mm.times.15 cm, Tosoh Bioscience LLC, Japan). The molecular weight standard kit (Polyethylene Glycol Standards Kit, PSS Polymer Standards
[0088] GmbH, Germany) was used for calibration. In total, 10 of standard (1 mM) and purified polysaccharides were used for analysis (eluted with distilled H.sub.2O; flow rate 0.1 mL/min). The standards with molecular weight 12600, 6550, 4270, and 1400 Da were eluted with the following tR: 36.5, 37.2, 38.4, and 43.2 min. The polysaccharide was eluted at 36.7 and 38.4 min. Example 1 Screening of culture filtrates derived from soil microorganisms for inducing plant resistance against Tobacco mosaic virus (TMV)
[0089] To identify PAMPs/DAMPs that can provide plant defense against viruses, we first collected soil samples at different locations and followed a previously reported method for microorganism isolation (Ko, W. H., Tsou, El, Lin, Mi, and Chern, L. L. 2010. Activity and characterization of secondary metabolites produced by a new microorganism for control of plant diseases. New biotechnology 27:397-402). We isolated 199 microorganisms including 77 actinomycetes, 68 bacteria and 54 fungi.
[0090] We selected TMV and its local lesion host N. glutinosa as a system for the initial screening. TMV can induce local lesions on N. glutinosa. The number and size of lesions reflects the degree of resistance to TMV (Loebenstein, 2009). The soil microorganisms were cultured in vegetable broth (VB) for 14 days, then culture filtrates were directly sprayed on N. glutinosa (0.4 ml per plant) for total of three times with a 24-h interval between each spray. Then, TMV inoculum was rubbed onto leaves of N. glutinosa. The lesion number was counted at 5 days post-inoculation (dpi). Because VB may contain DAMPs that trigger plant immunity, the results are represented as percentage lesion number induced by TMV on plants pretreated with culture filtrates from isolated microorganisms relative to VB-pretreated plants. Plants pretreated with culture filtrates from two fungi (F2 and F8) had fewer lesions than did VB-pretreated plants (FIG. 10).
[0091] To verify the ability of F2- and F8-culture filtrate to induce resistance in N. glutinosa, we treated plants with H.sub.2O, SA, VB, F2- or F8-culture filtrate followed by TMV inoculation. All experiments were repeated at least 3 times, and the results were consistent, showing much reduced lesion numbers on N. glutinosa pretreated with F2- and F8-culture filtrate (FIGS. 1A and B).
Example 2 Demonstration of Exemplary F8-Culture Filtrate Induces Strong Resistance in N. benthamiana
[0092] Besides using N. glutinosa for our initial screening, we also used N. benthamiana, a host that is highly susceptible to TMV, for resistance assay. N. benthamiana was pretreated with H.sub.2O, SA, VB, F2- or F8-culture filtrate as for pretreatment of N. glutinosa. All treated plants were inoculated with TMV inoculum made from lyophilized leaves of TMV infected N. benthamiana. Plants pretreated with H.sub.2O, SA, VB and F2-culture filtrate showed severe symptoms; however, most plants with F8-culture filtrate pretreatment remained healthy looking (FIGS. 1C and D). With RT-PCR to detect TMV on all treated plants, the infection rate was much reduced with F8-culture filtrate than H2O, SA, VB or F2-culture filtrate pretreatment (Table 1). In our repeat experiments, the infection rate of TMV-inoculated plants with F8-culture filtrate pretreatment even decreased to 0% (Table 1). In addition, plants with F8-culture filtrate pretreatment and TMV infection showed no obvious symptoms (FIG. 1D). We prepared at least 7 different batches of F8-culture filtrate, and the ability to induce resistance against TMV was consistent between different batches (Table 1). Of note, F2-culture filtrate did not induce resistance to TMV in N. benthamiana (Table 1, FIGS. 1C and D), so our later experiments focused on F8-culture filtrate.
TABLE-US-00002 TABLE 1 The infection rate of Tobacco mosaic virus (TMV) on Nicotiana benthamiana with different pretreatments Exp. Exp. Exp. Exp. Exp. Exp. Exp. Exp. Pretreatment Inoculum 1 2 3 4 5 6 7 8 Total -- Buffer .sup. 0/5.sup.c 0/5 0/5 0/5 0/5 0/5 0/5 0/5 0/40 H.sub.2O.sup.a TMV.sup.b 5/5 5/5 5/5 5/5 5/5 5/5 5/5 5/5 40/40 SA TMV 5/5 5/5 4/5 5/5 5/5 5/5 5/5 5/5 39/40 VB TMV 5/5 5/5 5/5 4/5 5/5 5/5 5/5 5/5 39/40 F2 TMV 5/5 5/5 5/5 -- -- -- -- -- 15/15 F8 TMV 1/5 0/5 0/5 1/5 0/5 1/5 0/5 0/5 3/40 .sup.aPlants pretreated with H.sub.2O, 5 mM salicylic acid (SA), vegetable broth (VB) and culture filtrate derived from fungi F2 (F2) or fungi F8 (F8). .sup.bInoculum were made from lyophilized TMV-inoculated leaves. .sup.cNumber of plants detected with TMV to total TMV inoculated plants. All leaf samples were collected at 7 dpi, and TMV was detected by RT-PCR.
[0093] Experiments (Exp) were repeated at least 8 times. F8-culture filtrate used in Exp. 1-2 is from the same batch of preparation. F8-culture filtrate used in Exp. 3-8 was prepared individually.
[0094] In addition to using inoculum made from lyophilized leaves of TMV infected N. benthamiana, we also used different concentrations (1 .mu.g/ml, 10 .mu.g/ml and 50 .mu.g/ml) of purified TMV particles as inoculum to inoculate N. glutinosa and N. benthamiana pretreated with H2O, SA, VB, or F8-culture filtrate (FIG. 2, FIG. 3). The results are consistent with previous results, which showed that TMV particle inoculated N. glutinosa and N. benthamiana showed less lesion and less disease severity in F8-culture filtrate treated N. glutinosa and N. benthamiana, respectively (FIGS. 2 and 3). The results also showed that increased TMV particle concentration positively correlated with increased lesion number and disease severity on leaves of F8-culture filtrate treated N. glutinosa, and N. benthamiana, respectively. The infection rate of TMV on N. benthamiana was also detected by use of qRT-PCR (Table 2). Reduced infection rate was only observed on F8-culture filtrate treated N. benthamiana, when TMV particle at the concentration of 1 .mu.g/ml was used as inoculum (Table 2). Collectively, the data indicated that F8-culture filtrate can induce plant resistance to TMV infection, and increased concentration of TMV inoculum will increase the infectivity.
TABLE-US-00003 TABLE 2 The infection rate of Tobacco mosaic virus (TMV) particle on Nicotiana benthamiana with different pretreatments Exp. 1 Exp. 2 Exp. 3 .sup.a1 .sup.a10 .sup.a50 .sup.a1 .sup.a1 Pretreatment Inoculum .mu.g/ml .mu.g/ml .mu.g/ml .mu.g/ml .mu.g/ml -- Buffer .sup. 0/5.sup.c 0/3 0/3 H.sub.2O.sup.b TMV particle 6/6 6/6 6/6 6/6 9/9 SA TMV particle 6/6 6/6 6/6 6/6 15/15 VB TMV particle 6/6 6/6 6/6 6/6 15/15 F8 TMV particle 4/6 6/6 6/6 3/6 6/15 .sup.aPlant were inoculated with difference concentration of TMV particle. .sup.bPlants pretreated with H.sub.2O, 5 mM salicylic acid (SA), vegetable broth (VB) and culture filtrate derived from fungi F8 (F8). .sup.cNumber of plants detected with TMV to total TMV inoculated plants. All leaf samples were collected at 7 dpi, and TMV was detected by RT-PCR.
Example 3 Demonstration of More Resistance with F8-Culture Filtrate than F8-Culture Pellets
[0095] To investigate whether pellets of F8-culture also induce plant resistance against TMV, pellets of F8-culture were re-suspended with H.sub.2O (same volume of original F8-culture). The re-suspended pellet was squeezed twice in a high-pressure homogenizer to break down the fungi cells. The final F8-culture pellet suspension, as well as H.sub.2O, SA, VB or F8-culture filtrate, were used to pretreat N. benthamiana followed by inoculation with TMV as previously described. F8-pellet-treated plants showed mild symptoms, with no obvious symptoms seen with F8-culture filtrate pretreatment (FIGS. 11A and B). Even when the concentration of F8-pellets was doubled, the TMV-induced symptoms were still more severe than with F8-culture filtrate pretreatment (FIGS. 11A and B).
Example 4 Treating Local Leaves with F8-Culture Filtrate does not Protect Against Inoculation of the Upper Leaves
[0096] To investigate whether F8-culture filtrate can protect plants systemically, we treated only the lower leaves (local) of N. benthamiana (method described above) with H.sub.2O, SA, VB or F8-culture filtrate, and inoculated TMV in the upper untreated (systemic) leaves. As a control, we used F8-culture filtrate to treat whole plants followed by TMV inoculation. Whole plants pretreated with F8-culture filtrate showed much resistance to TMV (FIGS. 4A and B); however, all plants with pretreatment of only local leaves showed severe viral symptoms (FIGS. 4A and B). Therefore, F8-culture filtrate provides strong resistance in only treated leaves.
[0097] In another set of experiments, we pretreated local leaves of plants with H.sub.2O, SA, VB or F8-culture filtrate, but did not inoculate them with TMV. We collected both the local and upper un-treated (systemic) leaves at 24 h post-treatment (hpt) to analyze the expression of the PR-1 gene (a SAR marker gene) (Zheng et al., 2015). PR-1 gene expression was detected in SA- and VB- but not F8-culture filtrate-treated local leaves (FIG. 4C). However, only SA-treated plants (positive control) showed increased PR-1 gene expression on systemic leaves (FIG. 4D). In addition, we collected leaves from plants with whole plants pretreated with H.sub.2O, SA, VB or F8-culture filtrate. Consistently, PR-1 gene induction was detected in leaves of whole plants pretreated with SA and VB but not whole plants pretreated with F8-culture filtrate at 24 hpt (FIG. 4E). Thus, F8-culture filtrate does not induce canonical SAR.
[0098] To analyze whether F8-culture induces stronger resistance on TMV inoculated leaves infection, we inoculated TMV (1 .mu.g/ml) on H.sub.2O or F8-culture filtrate pretreated leaves of N. benthamiana, and collected TMV-inoculated leaves at 24, 48, 72 and 96 h post-inoculation (hpi) to analyze the TMV accumulation and expression of the PR-1 gene by qRT-PCR. The data showed that in comparison to H.sub.2O treated plants, decreased TMV accumulation and increased PR1 expression were observed on F8-culture filtrate treated plants (FIG. 4F).
Example 5 Treatment with F8-Culture Filtrate Affects the Establishment of Initial TMV Infection
[0099] To analyze which virus infection steps are affected in F8-culture filtrate-treated plants, we used TMV tagged with green fluorescence protein (GFP) to inoculate N. benthamiana and monitor the infection of TMV. Similar to our previous result, the infection rate of TMV-GFP was much reduced in N. benthamiana pretreated with F8-culture filtrate as compared with H2O, SA or VB (Table S2). In addition, with TMV-GFP infection, the number of initial infection foci was reduced with both SA and F8-culture filtrate pretreatment (FIGS. 5A and B). To compare TMV-GFP accumulation in each foci, we used a puncher to collect GFP foci under UV light and used qRT-PCR to quantify the TMV-GFP expression. The mean TMV accumulation per foci was similar with H2O, SA, VB and F8-culture filtrate pretreatment (FIG. 5C).
TABLE-US-00004 TABLE S2 The infection rate of TMV tagged with green fluorescence protein (TMV- GFP) on Nicotiana benthamiana with different pretreatments Inoculum Exp. 1 Exp. 2 Buffer .sup. 0/5.sup.b 0/6 TMV-GFP 5/5 6/6 TMV-GFP 5/5 4/6 TMV-GFP 5/5 6/6 TMV-GFP 2/5 1/6 .sup.aPlants pretreated with H.sub.2O, 5 mM salicylic acid (SA), vegetable broth (VB) and culture filtrate derived from fungi F8 (F8). .sup.bNumber of plants exhibiting green fluorescence under UV illumination to total TMV-GFP inoculated plants. Data were recorded at 7 dpi. Two repeated experiments (Exp) were conducted.
[0100] To understand whether the cell-to-cell movement of TMV was affected with F8-culture filtrate pretreatment, we measured the average size of TMV-GFP infection foci at 5 and 7 dpi. In TMV-GFP-infected plants, the mean size of infection foci did not differ between plants with different pretreatment at 5 and 7 dpi (P<0.05) (FIGS. 5A and D).
[0101] To analyze whether long-distance movement is affected by F8-culture filtrate pretreatment, we measured the average time for TMV-GFP to move to apical leaves. The mean time (days) for TMV to move to apical leaves was similar with different pretreatments (FIGS. 5E and F).
Example 6 Demonstration of Exemplary F8-Culture Filtrate Induces Resistance to Turnip Mosaic Virus (TuMV) in Brassica juncea
[0102] To analyze whether F8-culture filtrate induced resistance to different viruses in other plants, we treated plants from an economically important vegetable, Brassica juncea, with H.sub.2O, VB and F8-culture filtrate by using the method mentioned above, and inoculated the plants with TuMV. TuMV induced severe mosaic and stunting symptoms in plants without any treatment or with VB pretreatment or induced severe mosaic symptoms in plants with H.sub.2O pretreatment (FIG. 6A); however, F8-culture filtrate pretreatment did not confer obvious symptoms (FIGS. 6A and B).
Example 7 F8-Culture Filtrate Pretreatment does not Cause Resistance-Associated Fitness Cost
[0103] To analyze whether F8-culture filtrate pretreatment reduces resistance-associated fitness cost in plants, we analyzed the fresh weight and leaf area in untreated and F8-culture filtrate-treated N. benthamiana and Brassica juncea. Both F8-culture filtrate-treated and untreated N. benthamiana and Brassica juncea showed similar leaf area and fresh weight (FIGS. 6C and D).
Example 8 F8 Fungi is Most Related to Trichosporon scarabaeorum
[0104] To identify the F8 fungi, we designed primers (Table S1) to amplify the D1/D2 domain and the ITS regions of the 26S rDNA (Scorzetti et al., 2002). Phylogenetic analysis was performed by neighbor-joining and maximum likelihood methods. The result using both methods was similar and indicated that F8 fungi is related to T. scarabaeorum (FIGS. 7A and B).
[0105] F8 is a yeast-like fungus. After culturing the fungi on PDA plate for 15 days, the diameter of colony grew to 54-57 mm. The colony of F8 is beige butter-like and wrinkled on PDA, but silk-like and flat on V-8 agar plate (FIG. 7C). Under microscope observation, F8 generated arthroconidia. The arthroconidia were hyaline, short rod-shaped, and obovate (FIG. 7C). Together, molecular phylogenetic analysis of D1/D2 domain, ITS, and morphological features showed that our identified F8 fungus belongs to the basidiomycetous yeast, T. scarabaeorum.
TABLE-US-00005 TABLE S1 Primer sequence TMV CP-F CGTGTTCTTGTCATCAGCGT (SEQ ID NO: 1) TMV CP-R GCATCTAACGTTTCGGCAGT (SEQ ID NO: 2) GFP-F TACAAGACGCGTGCTGAAGT (SEQ ID NO: 3) GFP-R CAATGTTGTGGCGAATTTT (SEQ ID NO: 4) CMV CA-F ACGAACTGGTGATGCATTTACTTAT (SEQ ID NO: 5) CMV CA-R TTCCGAAGAAACCTAGGAGATGGTT (SEQ ID NO: 6) ITS5e-F TTAGAGGAAGTAAAAGTCGTAACAAGGTT (SEQ ID NO: 7) ITS4e-R TCCTCCGCTTATTGATATGCTTAAG (SEQ ID NO: 8) LR1-F GCATATCAATAAGCGGAGGAAAAG (SEQ ID NO: 9) LR3-R GGTCCGTGTTTCAAGACGG (SEQ ID NO: 10) Nb PR-1-F ATGCCCATAACAGCTCG (SEQ ID NO: 11) Nb PR-1-R GAGGATCATAGTTGCAAGAG (SEQ ID NO: 12) Nb PR-2-F GGTGTTTGCTATGGAATGC (SEQ ID NO: 13) Nb PR-2-R TCTGTACCCACCATCTTGC (SEQ ID NO: 14) Nb PDF1.2-F GGAAATGGCAAACTCCATGCG (SEQ ID NO: 15) Nb PDF1.2-R ATCCTTCGGTCAGACAAACG (SEQ ID NO: 16) Nb PR-4-F CAGAACATTAACTGGGATTTGAGAG (SEQ ID NO: 17) Nb PR-4-R CTCCATTTGCTGCATTGATCTACT (SEQ ID NO: 18) Nb Osm-F ACTTATGCTTCCGGCGTA (SEQ ID NO: 19) Nb Osm-R GCACCAGGGCATTCACCA (SEQ ID NO: 20) Nb EREBP-F GGGAAAACGGGTTTGGTTGGG (SEQ ID NO: 21) Nb EREBP-R CGTCAAAGTCAAACTCGCCGAATTC (SEQ ID NO: 22) Nb .beta.-actin-F TGCCATTCTCCGTCTTGACT (SEQ ID NO: 23) Nb .beta.-actin-R TGCAGTCTCGAGTTCCTGTT (SEQ ID NO: 24)
Example 9 a Fraction of Polysaccharide Derived from F8-Culture Filtrate is the Major Active Component for Inducing Plant Virus Resistance
[0106] To identify the active functional compound(s) in F8-culture filtrate that are responsible for inducing plant resistance, we separated the F8-culture filtrate by size-exclusion chromatography. Eight fractions (F8-fr1-8) were eluted by H.sub.2O with a Sephadex LH.sub.2O column. Each fraction was analyzed by MALDI-TOF MS, and the activity in inducing resistance against TMV was initially analyzed in N. glutinosa. Our repeat experiments indicated that the second fraction (F8-fr2) induced the strongest antiviral activity in N. glutinosa (FIG. 12A). To determine whether F8-fr2 also induced strong resistance in N. benthamiana, we treated N. benthamiana with F8-fr1-4, then inoculated plants with TMV (FIGS. 12B and C). Consistently, F8-fr2 induced the strongest antiviral activity in N. benthamiana (FIGS. 12B and 12C and Table S3), although the F8-culture filtrate still induced the best resistance (FIGS. 12B and 12C and Table S3).
TABLE-US-00006 TABLE S3 The infection rate of Tobacco mosaic virus (TMV) on Nicotiana benthamiana pretreated with different fractions derived from F8-culture filtrate Pre-treatment Inoculum Exp. 1 Exp. 2 Exp. 3 Total -- Buffer .sup. 0/5.sup.b 0/5 0/5 0/15 H.sub.2O.sup.a TMV 5/5 5/5 5/5 15/15 SA TMV 5/5 5/5 5/5 15/15 VB TMV 5/5 5/5 5/5 15/15 F8 TMV 1/5 0/5 0/5 1/15 F8-fr2 TMV 5/5 5/5 5/5 15/15 F8-fr2-20% EtOH ppt TMV 5/5 5/5 5/5 15/15 F8-fr2-50% EtOH ppt TMV 5/5 5/5 5/5 15/15 F8-fr2-80% EtOH ppt TMV 5/5 5/5 5/5 15/15 *1 TMV 5/5 5/5 5/5 15/15 *2 (F8-polysaccharide) TMV 5/5 5/5 5/5 15/15 *3 TMV 5/5 5/5 5/5 15/15 .sup.aPlants pretreated with H.sub.2O, 5 mM salicylic acid (SA), vegetable broth (VB) and culture filtrate derived from fungi F8 (F8), F8-sephadex fraction 2 (F8-fr2), H.sub.2O re-suspended pellets derived from F8-fr2 precipitated with 20%, 50% and 80% ethanol (F8-fr2-20, 50 and 80% EtOH ppt) and HPLC purified peak 1 to 3 (*1 to 3*) from H.sub.2O re-suspended F8-fr2-80% EtOH ppt (Please see FIG. 10). We define peak *2 as F8-polysaccharide. .sup.bThe number of plants detected with TMV to the total TMV inoculated plants. All leaf samples were collected at 7 dpi, and TMV was detected by use of RT-PCR. Three repeated experiments were conducted.
[0107] On MALDI-TOF MS, F8-fr2 showed a polysaccharide signal, with no obvious signals observed after F8-fr4 (FIG. 12D). To purify F8-fr2 polysaccharides, we created three consecutive precipitations with increasing concentrations of ethanol (20%, 50% and 80%). The H.sub.2O-re-suspended pellets derived from 80% ethanol precipitation (F8-fr2-80% EtOH ppt) exhibited the strongest antiviral activity (FIGS. 8A and B). Results of MALDI-TOF MS analysis suggested that F8-fr2-80% EtOH ppt mainly consists of polysaccharides (FIG. 8C). F8-fr2-80% EtOH ppt was further separated by high-performance liquid chromatography (HPLC) into 3 peaks (*1 to *3) (FIG. 8D). The *2 peak (designated F8-polysaccharide) showed the strongest antiviral activity (FIGS. 8A and B). The sugar composition of F8-polysaccharide was analyzed by gas chromatography mass spectrometry (GC-MS), which revealed D-mannose D-galactose and D-glucose in the ratio 1.0:1.2:10.0 (Table 3). Linkage analysis with GC-MS and NMR analysis suggested the F8-polysaccharide is mainly .alpha.-D-1,4-glucan (FIGS. 8E and F). The assignments of protons and carbons of the sample are in Table 3. HPLC analysis revealed the molecular weight of the F8-polysaccharide as 4.2 to 12.6 kD (FIG. 13).
TABLE-US-00007 TABLE 3 Sugar composition (mol %) of F8-polysaccharide D-Man D-Gal D-Glu 1.0 1.2 10.0
Example 10 Demonstration of Exemplary F8-Polysaccharide Induces Priming of SA-Governed Immune Response Genes
[0108] To analyze how F8-polysaccharide induces plant viral resistance, we measured the expression of SA-, JA- and ET-responsive immune marker genes in H2O- and F8-polysaccharide-treated plants (Cortes-Barco et al., 2010; Milling et al., 2011; Zhu et al., 2014). We first confirmed the induction of marker genes induced by SA (PR-1 and PR-2), JA (PDF-1.2 and PR-4), and ET (Osm and EREBP) in N. benthamiana (FIG. 14A). Plants were pretreated with H.sub.2O and F8-polysacccharide for total of three times with a 24-h interval between each spray as described previously, then leaves were collected from one set of individual plants at 0, 12, 24, 36, 48, 72, and 96 hpt. In another set of plants with H.sub.2O and F8-polysacccharide pretreatment, TMV was inoculated at 24 hpt, and the inoculated leaves from individual plants were collected at 0, 12, 24, 48 and 72 hpi. We detected the accumulation of TMV and the expression of SA-, JA- and ET-responsive immune marker genes (FIG. 9A-D, FIGS. S5C and D). Consistently, TMV accumulation at 48 and 72 hpi was lower in F8-polysaccharide-than H.sub.2O-pretreated plants in our three repeats (FIG. 14B). Inconsistent induction of PR-4 (JA marker gene) and Osmin (ET marker gene) was observed in the three repeats. Therefore, the expression of PR-4 and Osmin genes in N. benthamiana is not related to F8-polysaccharide treatment. The expression of PR-1, PR-2, PDF-1.2, and EREBP was consistent in our repeats (FIG. 9A-D, FIGS. 14C and D). A comparison of H2O- and F8-polysaccharide-pretreated plants over different times showed that the expression of PR-1 was highly induced at 12 hpt and gradually reduced (FIG. 9A). However, after TMV inoculation, the expression of PR-1 was highly induced in plants treated with F8-polysaccharide at 48 and 72 hpi (FIG. 9B). The expression pattern of PR-2 was similar to that of PR-1 with or without TMV inoculation (FIGS. 9C and D). The expression of PR-1 and PR-2 show a typical priming expression pattern.
[0109] PDF-1.2 was induced at 12 hpt and 12 hpi but with no significant difference between H.sub.2O- and F8-polysaccharide-pretreated plants in our repeated experiments (FIG. S5C). No significant induction of EREBP expression was observed in H.sub.2O- and F8-polysaccharide-pretreated plants in our repeats (FIG. 14D).
Sequence CWU 1
1
24120DNAArtificial sequencesynthetic oligonucleotide 1cgtgttcttg
tcatcagcgt 20220DNAartificial sequencesynthetic oligonucleotide
2gcatctaacg tttcggcagt 20320DNAartificial sequencesynthetic
oligonucleotide 3tacaagacgc gtgctgaagt 20419DNAartificial
sequencesynthetic oligonucleotide 4caatgttgtg gcgaatttt
19525DNAartificial sequencesynthetic oligonucleotide 5acgaactggt
gatgcattta cttat 25625DNAartificial sequencesynthetic
oligonucleotide 6ttccgaagaa acctaggaga tggtt 25729DNAartificial
sequencesynthetic oligonucleotide 7ttagaggaag taaaagtcgt aacaaggtt
29825DNAartificial sequencesynthetic oligonucleotide 8tcctccgctt
attgatatgc ttaag 25924DNAartificial sequencesynthetic
oligonucleotide 9gcatatcaat aagcggagga aaag 241019DNAartificial
sequencesynthetic oligonucleotide 10ggtccgtgtt tcaagacgg
191117DNAartificial sequencesynthetic oligonucleotide 11atgcccataa
cagctcg 171220DNAartificial sequencesynthetic oligonucleotide
12gaggatcata gttgcaagag 201319DNAartificial sequencesynthetic
oligonucleotide 13ggtgtttgct atggaatgc 191419DNAartificial
sequencesynthetic oligonucleotide 14tctgtaccca ccatcttgc
191521DNAartificial sequencesynthetic oligonucleotide 15ggaaatggca
aactccatgc g 211620DNAartificial sequencesynthetic oligonucleotide
16atccttcggt cagacaaacg 201725DNAartificial sequencesynthetic
oligonucleotide 17cagaacatta actgggattt gagag 251824DNAartificial
sequencesynthetic oligonucleotide 18ctccatttgc tgcattgatc tact
241918DNAArtificial sequencesynthetic oligonucleotide 19acttatgctt
ccggcgta 182018DNAartificial sequencesynthetic oligonucleotide
20gcaccagggc attcacca 182121DNAartificial sequencesynthetic
oligonucleotide 21gggaaaacgg gtttggttgg g 212225DNAartificial
sequencesynthetic oligonucleotide 22cgtcaaagtc aaactcgccg aattc
252320DNAartificial sequencesynthetic oligonucleotide 23tgccattctc
cgtcttgact 202420DNAartificial sequencesynthetic oligonucleotide
24tgcagtctcg agttcctgtt 20
D00000
D00001
D00002
D00003
D00004
D00005
D00006
D00007
D00008
D00009
D00010
D00011
D00012

D00013

D00014

D00015

S00001
XML
uspto.report is an independent third-party trademark research tool that is not affiliated, endorsed, or sponsored by the United States Patent and Trademark Office (USPTO) or any other governmental organization. The information provided by uspto.report is based on publicly available data at the time of writing and is intended for informational purposes only.
While we strive to provide accurate and up-to-date information, we do not guarantee the accuracy, completeness, reliability, or suitability of the information displayed on this site. The use of this site is at your own risk. Any reliance you place on such information is therefore strictly at your own risk.
All official trademark data, including owner information, should be verified by visiting the official USPTO website at www.uspto.gov. This site is not intended to replace professional legal advice and should not be used as a substitute for consulting with a legal professional who is knowledgeable about trademark law.