Hybridization Chain Reaction-based Method For Amplifying Immunosignals
Lin; Rui ; et al.
U.S. patent application number 16/964386 was filed with the patent office on 2020-12-03 for hybridization chain reaction-based method for amplifying immunosignals. This patent application is currently assigned to NATIONAL INSTITUTE OF BIOLOGICAL SCIENCES, BEIJING. The applicant listed for this patent is NATIONAL INSTITUTE OF BIOLOGICAL SCIENCES, BEIJING. Invention is credited to Rui Lin, Minmin Luo.
| Application Number | 20200377926 16/964386 |
| Document ID | / |
| Family ID | 1000005091037 |
| Filed Date | 2020-12-03 |


View All Diagrams
| United States Patent Application | 20200377926 |
| Kind Code | A1 |
| Lin; Rui ; et al. | December 3, 2020 |
HYBRIDIZATION CHAIN REACTION-BASED METHOD FOR AMPLIFYING IMMUNOSIGNALS
Abstract
The invention provides an antibody-based bioanalytical method, specifically a hybridization Chain Reaction-based Method for Amplifying Immunosignals named immunosignal HCR (isHCR), which combines antibody-antigen interactions with hybridization Chain Reaction (HCR) technology for amplifying immunosignals. The invention also provides a kit for performing the above isHCR.
| Inventors: | Lin; Rui; (Beijing, CN) ; Luo; Minmin; (Beijing, CN) | ||||||||||
| Applicant: |
|
||||||||||
|---|---|---|---|---|---|---|---|---|---|---|---|
| Assignee: | NATIONAL INSTITUTE OF BIOLOGICAL
SCIENCES, BEIJING BEIJING CN |
||||||||||
| Family ID: | 1000005091037 | ||||||||||
| Appl. No.: | 16/964386 | ||||||||||
| Filed: | January 26, 2018 | ||||||||||
| PCT Filed: | January 26, 2018 | ||||||||||
| PCT NO: | PCT/CN2018/074362 | ||||||||||
| 371 Date: | July 23, 2020 |
| Current U.S. Class: | 1/1 |
| Current CPC Class: | G01N 33/6854 20130101; C12Q 2563/107 20130101; C12Q 1/6818 20130101; C12Q 1/6804 20130101 |
| International Class: | C12Q 1/6804 20060101 C12Q001/6804; C12Q 1/6818 20060101 C12Q001/6818; G01N 33/68 20060101 G01N033/68 |
Claims
1. An immunosignal Hybridization Chain Reaction (isHCR), which comprises conjugating a hybridization chain reaction (HCR) initiator to an antibody specific to an analyte, and adding a pair of HCR amplifiers to conduct a hybridization chain reaction.
2. The immunosignal Hybridization Chain Reaction of claim 1, wherein the HCR initiator has a region for hybridizing with a HCR amplifier, and a region for conjugating an antibody specific to an analyte.
3. The immunosignal Hybridization Chain Reaction of claim 1, wherein the HCR initiator and/or the amplifier are terminally modified and/or internally modified with biotin, acrydite, amine, thiol, DBCO, and/or fluorescent dye, and said fluorescent dye is selected from FITC, Cyanine dyes, Dylight fluors, Atto dyes, Janelia Fluor dyes, Alexa Fluro 546, Alexa Fluor 488, and Alexa Fluor 647.
4. The immunosignal Hybridization Chain Reaction of claim 1, wherein the HCR initiator is conjugated to an antibody via an interaction selected from streptavidin-biotin interaction and covalent bond interaction.
5. The immunosignal Hybridization Chain Reaction of claim 4, wherein the HCR initiator is a biotinylated initiator, which is capable of attaching to the vacant binding sites of streptavidin, and the streptavidin is capable of attaching to a biotinylated antibody, and whereby the HCR initiator is conjugated to the antibody.
6. The immunosignal Hybridization Chain Reaction of claim 4, wherein the covalent bond interaction is an interaction via a chemical linker selected from an amine-reactive linker containing a succinimidyl ester group and a click chemistry linker.
7. The immunosignal Hybridization Chain Reaction of claim 6, wherein the click chemistry linker is selected from NHS-Azide linker, NHS-DBCO linker, maleimide-azide linker, and maleimide-DBCO linker.
8. The immunosignal Hybridization Chain Reaction of claim 1, wherein an amplifier or a pair of amplifiers are modified to access branched multiple-round amplification in order to branch and grow HCR polymers, or the amplifier or the pair of amplifiers are terminally modified or internally modified with a chemical group and/or a fluorescent dye, which allows initiating further rounds of amplification, the said chemical group is selected from biotin, digoxigenin, acrydite, amine, succinimidyl ester, thiol, azide, TCO, Tetrazine, Alkyne, and/or DBCO, and the said fluorescent dye is selected from FITC, Cyanine dyes, Dylight fluors, Atto dyes, Janelia Fluor dyes, Alexa Fluro 546, Alexa Fluor 488, and Alexa Fluor 647.
9. (canceled)
10. The immunosignal Hybridization Chain Reaction of claim 8, wherein a pair of fluorophore-tagged amplifiers are added to the final round of the multiple-round isHCR for visualization.
11. The immunosignal Hybridization Chain Reaction of claim 8, wherein the amplifiers are modified at internal positions, which are accessible to streptavidins, which serve as anchors for each successive round of branching in multi-round isHCR.
12. The immunosignal Hybridization Chain Reaction of claim 1, wherein the antibody is a secondary antibody that reacts with a primary antibody specific to an analyte, the secondary antibody is a IgG or a Nanobody, and the primary antibody is a IgG, a Nanobody or a scFv.
13. The immunosignal Hybridization Chain Reaction of claim 1, further comprising using grapheme oxide (GO) for absorbing unassembled HCR amplifiers; or further comprising using grapheme oxide (GO) for absorbing unassembled HCR amplifiers and quenching the fluorescence, wherein the amplifiers are terminally modified and/or internally modified with fluorescent dye, wherein GO has a particle size of <500 nm.
14. (canceled)
15. (canceled)
16. A kit for an immunosignal Hybridization Chain Reaction (isHCR), comprising: (1) an antibody specific to an analyte; (2) a HCR initiator; and (3) a pair of HCR amplifiers, wherein the HCR initiator has a region for hybridizing with a HCR amplifier, and a region for conjugating the antibody.
17. The kit of claim 16, wherein the HCR initiator and/or the amplifier are terminally modified and/or internally modified with biotin, acrydite, amine, thiol, DBCO, and/or fluorescent dye, and said fluorescent dye is selected from FITC, Cyanine dyes, Dylight fluors, Atto dyes, Janelia Fluor dyes, Alexa Fluro 546, Alexa Fluor 488, and Alexa Fluor 647; preferably, wherein the HCR initiator is conjugated to an antibody via an interaction selected from streptavidin-biotin interaction and covalent bond interaction, wherein the HCR initiator is a biotinylated initiator, which is capable of attaching to the vacant binding sites of streptavidin, and the streptavidin is capable of attaching to a biotinylated antibody, and whereby the HCR initiator is conjugated to the antibody, and wherein the covalent bond interaction is an interaction via a chemical linker selected from an amine-reactive linker containing a succinimidyl ester group and a click chemistry linker.
18. (canceled)
19. (canceled)
20. (canceled)
21. The kit of claim 17, wherein the click chemistry linker is selected from NHS-Azide linker, NHS-DBCO linker, maleimide-azide linker, and maleimide-DBCO linker.
22. The kit of claim 16, wherein an amplifier or a pair of amplifiers are modified to access branched multiple-round amplification in order to branch and grow HCR polymers; or wherein the amplifier or the pair of amplifiers are terminally modified or internally modified with a chemical group selected from biotin, digoxigenin, acrydite, amine, succinimidyl ester, thiol, azide, TCO, Tetrazine, Alkyne, and/or DBCO and/or a fluorescent dye selected from FITC, Cyanine dyes, Dylight fluors, Atto dyes, Janelia Fluor dyes, Alexa Fluro 546, Alexa Fluor 488, and Alexa Fluor 647, which allows initiating further rounds of amplification.
23. (canceled)
24. The kit of claim 22, wherein a pair of fluorophore-tagged amplifiers are added to the final round of the multiple-round isHCR for visualization.
25. The kit of claim 22, wherein the amplifiers are modified at internal positions, which are accessible to streptavidins and which serve as anchors for each successive round of branching in multi-round isHCR.
26. The kit of claim 16, wherein the antibody is a secondary antibody that reacts with a primary antibody specific to an analyte, the secondary antibody is a IgG or a Nanobody, and the primary antibody is a IgG, a Nanobody or a scFv.
27. The kit of claim 16, further comprising grapheme oxide (GO) for absorbing unassembled HCR amplifiers; or further comprising grapheme oxide (GO) for absorbing unassembled HCR amplifiers and quenching the fluorescence.
28. (canceled)
29. Use of the immunosignal Hybridization Chain Reaction of claim 1 or the kit of claim 16 for powerfully amplifying immunosignal, for analyzing an analyte in a biological sample, or for laboratory, clinical or diagnostic application.
30. The use of claim 29, wherein the clinical or diagnostic application is selected from biological research, forensic examination, clinical tests or diagnosis, Western blotting and ELISA.
31. The use of claim 29, wherein the biological sample is selected from cultured cell, dissociated cell, tissue section, body fluid, and whole organ.
32. (canceled)
Description
BACKGROUND
[0001] Owing to their ease of use, speed, and cost effectiveness, antibody-based immunoassays remain the most popular methods for detecting and identifying the location of proteins and other biomolecules in biological samples. These methods use a primary antibody that binds selectively to a target molecule (antigen), and this antibody-antigen interaction can be visualized via a conjugated reporter or a labeled secondary antibody that can recognize and react with the primary antibody-epitope complex (Han, K. N., Li, C. A. & Seong, G. H. Annu. Rev. Anal. Chem. 6, 119-141 (2013)). A major limitation in the use of immunoassays is that the low abundance of a given target molecule in a sample often necessitates signal amplification before detection is possible. Amplification can be achieved using conjugated enzymes such as horseradish peroxidase (HRP) and alkaline phosphatase, which catalyze the deposition of chromogenic substrates on target complexes (Bobrow, M. N., Harris, T. D., Shaughnessy, K. J. & Litt, G. J. J. Immunol. Methods 125, 279-285 (1989)). Fluorogenic substrates, especially those based on HRP-tyramide reaction chemistries, have been developed to support high-resolution fluorescence microscopy (Stack, E. C., Wang, C., Roman, K. A. & Hoyt, C. C. Methods 70, 46-58 (2014)). Although very useful and widely-employed, current amplification methods have several drawbacks: they often generate high background, they can reduce spatial resolution due to dye diffusion, they are difficult to use for the simultaneous detection of multiple amplified signals (Carvajal-Hausdorf, D. E., Schalper, K. A., Neumeister, V. M. & Rimm, D. L. Lab. Invest. 95, 385-396 (2015)), and they are unsuitable for use with large-volume samples in several powerful new tissue expansion and clearing techniques.
[0002] In this invention, we find that an enzyme-free amplification approach could overcome many of these limitations. In particular, hybridization chain reaction (HCR) technology is adapted to amplify immunosignals. HCR, which is based on recognition and hybridization events that occur between sets of DNA hairpin oligomers that self-assemble into polymers, has to date been used primarily for the amplification of mRNA signals from in situ hybridization samples (Choi, H. M. T., Beck, V. A. & Pierce, N. A. ACS Nano 8, 4284-4294 (2014); Shah, S. et al. Development 143, 2862-2867 (2016)), and more recently for the detection of protein-protein interactions (Koos, B. et al. Nat. Commun. 6, 7294 (2015)). In a typical usage case, nucleic acid probes complementary to the target mRNA molecule are used as `initiator` oligos. Starting from the initiator oligos, a series of polymerization reactions are used to add fluorophore-labeled nucleic acid `amplifier` oligos to the target mRNA-initiator complex; the fluorophores are then visualized.
SUMMARY OF THE INVENTION
[0003] The invention provides an antibody-based bioanalytical method, specifically a method named immunosignal HCR (isHCR), which combines antibody-antigen interactions with hybridization Chain Reaction (HCR) technology. The invention also provides a kit for performing the above isHCR. The invention further provides an antibody-based bioanalytical method, specifically a method named multi-round immunosignal HCR (isHCR) (multi-round isHCR), which combines antibody-antigen interactions with hybridization Chain Reaction (HCR), wherein multiple amplification rounds are used to branch and grow the HCR polymers. Correspondingly, the invention also provides a kit for performing multi-round isHCR.
[0004] In the first aspect, the invention provides an isHCR method, which comprises conjugating a HCR initiator to an antibody (including but not limited to a traditional IgG and a nanobody) specific to an analyte, and adding a pair of amplifiers to conduct a hybridization chain reaction.
[0005] In the second aspect, the invention provides a kit for performing the isHCR method, which comprises (1) an antibody specific to an analyte; (a) a HCR initiator; and (3) a pair of HCR amplifiers, wherein the HCR initiator has a region for hybridizing with a HCR amplifier, and a region for conjugating the antibody.
[0006] In the third aspect, the invention provides a HCR initiator, having a region for hybridizing with HCR amplifiers and a region for conjugating an antibody specific to an analyte to be analyzed.
[0007] In the fourth aspect, the invention provides an antibody specific to an analyte to be analyzed, which is directly or indirectly conjugated to a HCR initiator.
[0008] The HCR initiators can be hybridized with any of several types of self-assembling DNA HCR amplifiers, including a fluorophore-labeled amplifier oligo that can be used for visualization of the original target signal.
[0009] The amplifiers are fluorophore-tagged amplifiers or biotinylated HCR amplifiers.
[0010] HCR initiators are conjugated to antibodies using many interactions, such as the streptavidin-biotin interaction, covalent bond interaction (chemical linkers, e.g., amine-reactive linkers, thiol-reactive linkers or click chemistry linkers), and etc. The amine-reactive linkers can be linkers containing succinimidyl ester group. The thiol-reactive linkers can be linkers containing maleimide group. The click chemistry linkers can be linkers containing click chemistry functional groups, such as NHS-Azide linkes, NHS-DBCO linkers, maleimide-azide linkers, or maleimide-DBCO linkers.
[0011] Preferably, the HCR initiator is a biotinylated initiator, which is capable of attaching to the vacant binding sites of streptavidin, and the streptavidin is capable of attaching to a biotinylated antibody, and whereby the HCR initiator is conjugated to the antibody.
[0012] Preferably, the HCR initiators and amplifiers (H1 and H2) used in the present isHCR method can be terminally modified or internally modified for improving the signal strength or as an interface to access other chemical reactions. The HCR initiators and amplifiers (H1 and H2) used in the present isHCR method can be terminally modified or internally modified with chemical groups and/or fluorescent dyes. For example, the HCR initiators and amplifiers (H1 and H2) used in the present isHCR method can be terminally modified and/or internally modified with biotin, acrydite, amine, thiol, DBCO, and/or fluorescent dye. The fluorescent dye may be FITC, Cyanine dyes, Alexa Fluors, Dylight fluors, Atto dyes or Janelia Fluor dyes.
[0013] Preferably, the isHCR method uses biotin-streptavidin interaction, wherein DNA-biotin HCR initiator is attached to a biotinylated antibody and in turn trigger the self-assembly of labeled HCR amplifiers into polymers. For example, the labeled HCR amplifiers are fluorophore labeled HCR amplifiers.
[0014] The isHCR method uses label-free streptavidin, which allows the attachment of synthesized 5'-biotinylated DNA HCR initiators to the vacant binding sites of streptavidin, which is attached to the biotinylated antibody.
[0015] The biotinylated antibody can be a biotinylated secondary antibody that reacts with a primary antibody specific to a target antigen.
[0016] Preferably, the present invention provides a kit, which comprises: (1) a biotinylated antibody specific to an analyte; (2) streptavidin; (3) a biotinylated initiator; and (4) a pair of HCR amplifiers.
[0017] The present isHCR method or kit can be used to powerfully amplify immunosignals at different subcellular locations (e.g., cell and vesicle membrane, cytosol, mitochondrion, and cell nucleus) and in various types of samples (e.g., blotting, cultured cells, tissue sections, and whole organ). Therefore, the isHCR method can be used to analyze an analyte in a biological sample. In particular, the present isHCR method is useful for laboratory, clinical or diagnostic application, especially, on site application, for example the clinical point care.
[0018] The isHCR method is especially useful in applications that require sensitive detection of immunosignals. We here demonstrated its use for amplifying immunosignals with monoclonal antibodies, and for detecting the extremely low-abundance signal of translocated bacterial effectors, among other applications. The actual amplification performance of isHCR depends on the particular applications and on the abundance of a given target signal: for signal amplification in western blotting and tissue section samples, isHCR outperformed standard IHC by up to 2 orders of magnitude.
[0019] In the fifth aspect, the invention provides a multi-round isHCR method, which comprises conjugating a HCR initiator to an antibody (including but not limited to traditional IgGs and nanobodies) specific to an analyte, and adding a pair of amplifiers to conduct a hybridization chain reaction, wherein an amplifier or a pair of amplifiers are modified to access branched multiple-round amplification in order to branch and grow the HCR polymers.
[0020] In the sixth aspect, the invention provides a kit for performing multi-round isHCR, which comprises (1) an antibody specific to an analyte; (a) a HCR initiator; and (3) a pair of HCR amplifiers, wherein the HCR initiator has a region for hybridizing with a HCR amplifier, and a region for conjugating the antibody, and an amplifier or a pair of amplifiers are modified to access branched multiple-round amplification in order to branch and grow the HCR polymers.
[0021] In the seventh aspect, the invention provides a pair of amplifiers, wherein an amplifier or a pair of amplifiers are modified to access branched multiple-round amplification in order to branch and grow the HCR polymers.
[0022] The HCR initiators can be hybridized with any of several types of self-assembling DNA HCR amplifiers, including a fluorophore-labeled amplifier oligo that can be used for visualization of the original target signal.
[0023] HCR initiators are conjugated to antibodies using many interactions, such as the streptavidin-biotin interaction, covalent bond interaction (chemical linkers, e.g., amine-reactive linkers or click chemistry linkers), and etc. The amine-reactive linkers can be linkers containing the succinimidyl ester group. The click chemistry linkers can be linkers containing click chemistry functional groups, such as NHS Azide linkes, NHS-DBCO linkers, maleimide-azide linkers, or maleimide-DBCO linkers.
[0024] Preferably, the HCR initiator is a biotinylated initiator, which is capable of attaching to the vacant binding sites of streptavidin, and the streptavidin is capable of attaching to a biotinylated antibody, and whereby the HCR initiator is conjugated to the antibody.
[0025] The HCR initiators/or and amplifiers (H1 and H2) used in the present multi-round isHCR can be terminally modified or internally modified for improving the signal strength or as an interface to access other chemical reactions.
[0026] The HCR amplifiers (H1 and H2) used in the present multi-round isHCR can be terminally modified or internally modified with chemical groups and/or fluorescent dyes, which allows initiating further rounds of amplification. In this situation, the amplifiers (H1 and H2) can be terminally modified or internally modified with biotin, digoxigenin, acrydite, amine, succinimidyl ester, thiol, azide, TCO, Tetrazine, Alkyne, and/or DBCO. Fluorescent dye, such as FITC, Cyanine dyes, Alexa Fluors, Dylight fluors, Atto dyes or Janelia Fluor dyes, wherein the Alexa Fluors can be for example Alexa Fluro 546, Alexa Fluor 488, and/or Alexa Fluor 647, can be also tagged to the amplifiers together with biotin, digoxigenin, acrydite, amine, succinimidyl ester, thiol, azide, TCO, Tetrazine, Alkyne, and/or DBCO. For example, amplifiers can be labeled with bitoin groups. Once these DNA-biotin amplifiers have self-assembled and joined the growing isHCR polymer, their biotins can be reacted with newly-added streptavidins (and hence can be reacted with more HCR initiators, etc.), thereby initiating further rounds of polymer elaboration. A pair of signal molecule-modified amplifiers (e.g., a pair of fluorophore-tagged amplifiers) can be added to the final round of isHCR.sup.n for visualization.
[0027] Preferably, the amplifiers are modified at internal positions, which are more accessible to the binding partners, such as streptavidins, which serve as anchors for each successive round of branching in multi-round isHCR (isHCR.sup.n).
[0028] The HCR initiators used in the present multi-round isHCR method can be terminally modified or internally modified for improving the signal strength. The HCR initiators used in the present multi-round isHCR method can be terminally modified or internally modified with chemical groups and/or fluorescent dyes. For example, the HCR initiators used in the present multi-round isHCR can be terminally modified and/or internally modified with biotin, acrydite, amine, thiol, DBCO, and/or fluorescent dye. The fluorescent dye may be FITC, Cyanine dyes, Alexa Fluors, Dylight fluors, Atto dyes or Janelia Fluor dyes, wherein the Alexa Fluors can be for example Alexa Fluro 546, Alexa Fluor 488, or Alexa Fluor 647.
[0029] Preferably, the multi-round isHCR uses biotin-streptavidin interaction, wherein DNA-biotin HCR initiator is attached to a biotinylated antibody and in turn trigger the self-assembly of labeled DNA HCR amplifiers into polymers. For example, the labeled HCR amplifiers are fluorophore labeled HCR amplifiers.
[0030] The multi-round isHCR uses label-free streptavidin, which allows the attachment of synthesized 5'-biotinylated DNA HCR initiators to the vacant binding sites of streptavidin, which is attached to the biotinylated antibody.
[0031] The biotinylated antibody can be a biotinylated secondary antibody that reacts with a primary antibody specific to a target antigen.
[0032] The multi-round isHCR can be used to powerfully amplify immunosignals at different subcellular locations (e.g., cell and vesicle membrane, cytosol, mitochondrion, and cell nucleus) and in various types of samples (e.g., blotting, cultured cells, tissue sections, and whole organ). Therefore, the isHCR method can be used to analyze an analyte in a biological sample. In particular, the present isHCR method is useful for laboratory, clinical or diagnostic application, especially, on site application, for example the clinical point care.
[0033] The multi-round isHCR is especially useful in applications that require sensitive detection of immunosignals. The isHCR method can be used for amplifying immunosignals with monoclonal antibodies, for detecting the extremely low-abundance signal of translocated bacterial effectors, and for enhancing diluted immunosignals in ExM, among other applications. The actual amplification performance of isHCR depends on the particular applications and on the abundance of a given target signal: for signal amplification in western blotting and tissue section samples, isHCR outperformed standard IHC by up to 2 orders of magnitude; improvements of 3 orders of magnitude were achieved with ExM samples. Compared with non-multi-round isHCR, tests based on western blotting of HA-tagged scFv revealed that two extra rounds of amplification (isHCR.sup.3) resulted in an additional ten-fold improvement in protein-detection sensitivity. When we tested the performance of isHCR.sup.nfor immunostaining against TH, the immunopositive signal intensity increased with each round of isHCR amplification.
[0034] In the eighth aspect, the invention provides an improved isHCR method or an improved isHCR.sup.n method for amplifying immunofluorescence with lower background, which in addition to the above isHCR or isHCR.sup.n, further comprises using grapheme oxide (GO) to absorb unassembled HCR amplifiers. If the amplifiers are terminally modified and/or internally modified with fluorescent dye, grapheme oxide (GO) may also quench the fluorescence.
[0035] In the ninth aspect, the invention provides a kit for performing the improved isHCR method, which comprises: (1) an antibody specific to an analyte; (a) a HCR initiator; (3) a pair of HCR amplifiers, wherein the HCR initiator has a region for hybridizing with a HCR amplifier, and a region for conjugating the antibody; and (4) grapheme oxide (GO).
[0036] In the tenth aspect, the invention provides a kit for performing the improved multi-round isHCR, which comprises (1) an antibody specific to an analyte; (a) a HCR initiator; and (3) a pair of HCR amplifiers, wherein the HCR initiator has a region for hybridizing with a HCR amplifier, and a region for conjugating the antibody, and an amplifier or a pair of amplifiers are modified to access branched multiple-round amplification in order to branch and grow the HCR polymers; and (4) grapheme oxide (GO).
[0037] Graphene Oxide in the present invention has a particle size of <500 nm. Crucially, in addition to abolishing the fluorescence of HCR amplifiers, the addition of HCR initiators along with HCR amplifiers and GO resulted in substantial recovery of fluorescence, likely because the initiators triggered the formation of double-strand-nicked polymers of HCR amplifiers, thereby protecting them from the adsorption activity of GO. That is, GO can be used to suppress background levels, further enhancing the performance of isHCR.
[0038] The addition of GO reduced the background but did not diminish the signal intensity, resulting in an improved signal-to-noise ratio as compared to isHCR amplification without GO. Surprisingly, further analysis using antibody serial dilution experiments showed that isHCR with GO significantly increased signal intensity as compared to a standard IHC staining method, achieving a greater than 80.times. amplification factor when the primary antibody was highly diluted.
[0039] The invention encompasses all combination of the particular embodiments recited herein.
BRIEF DESCRIPTION OF THE FIGURES
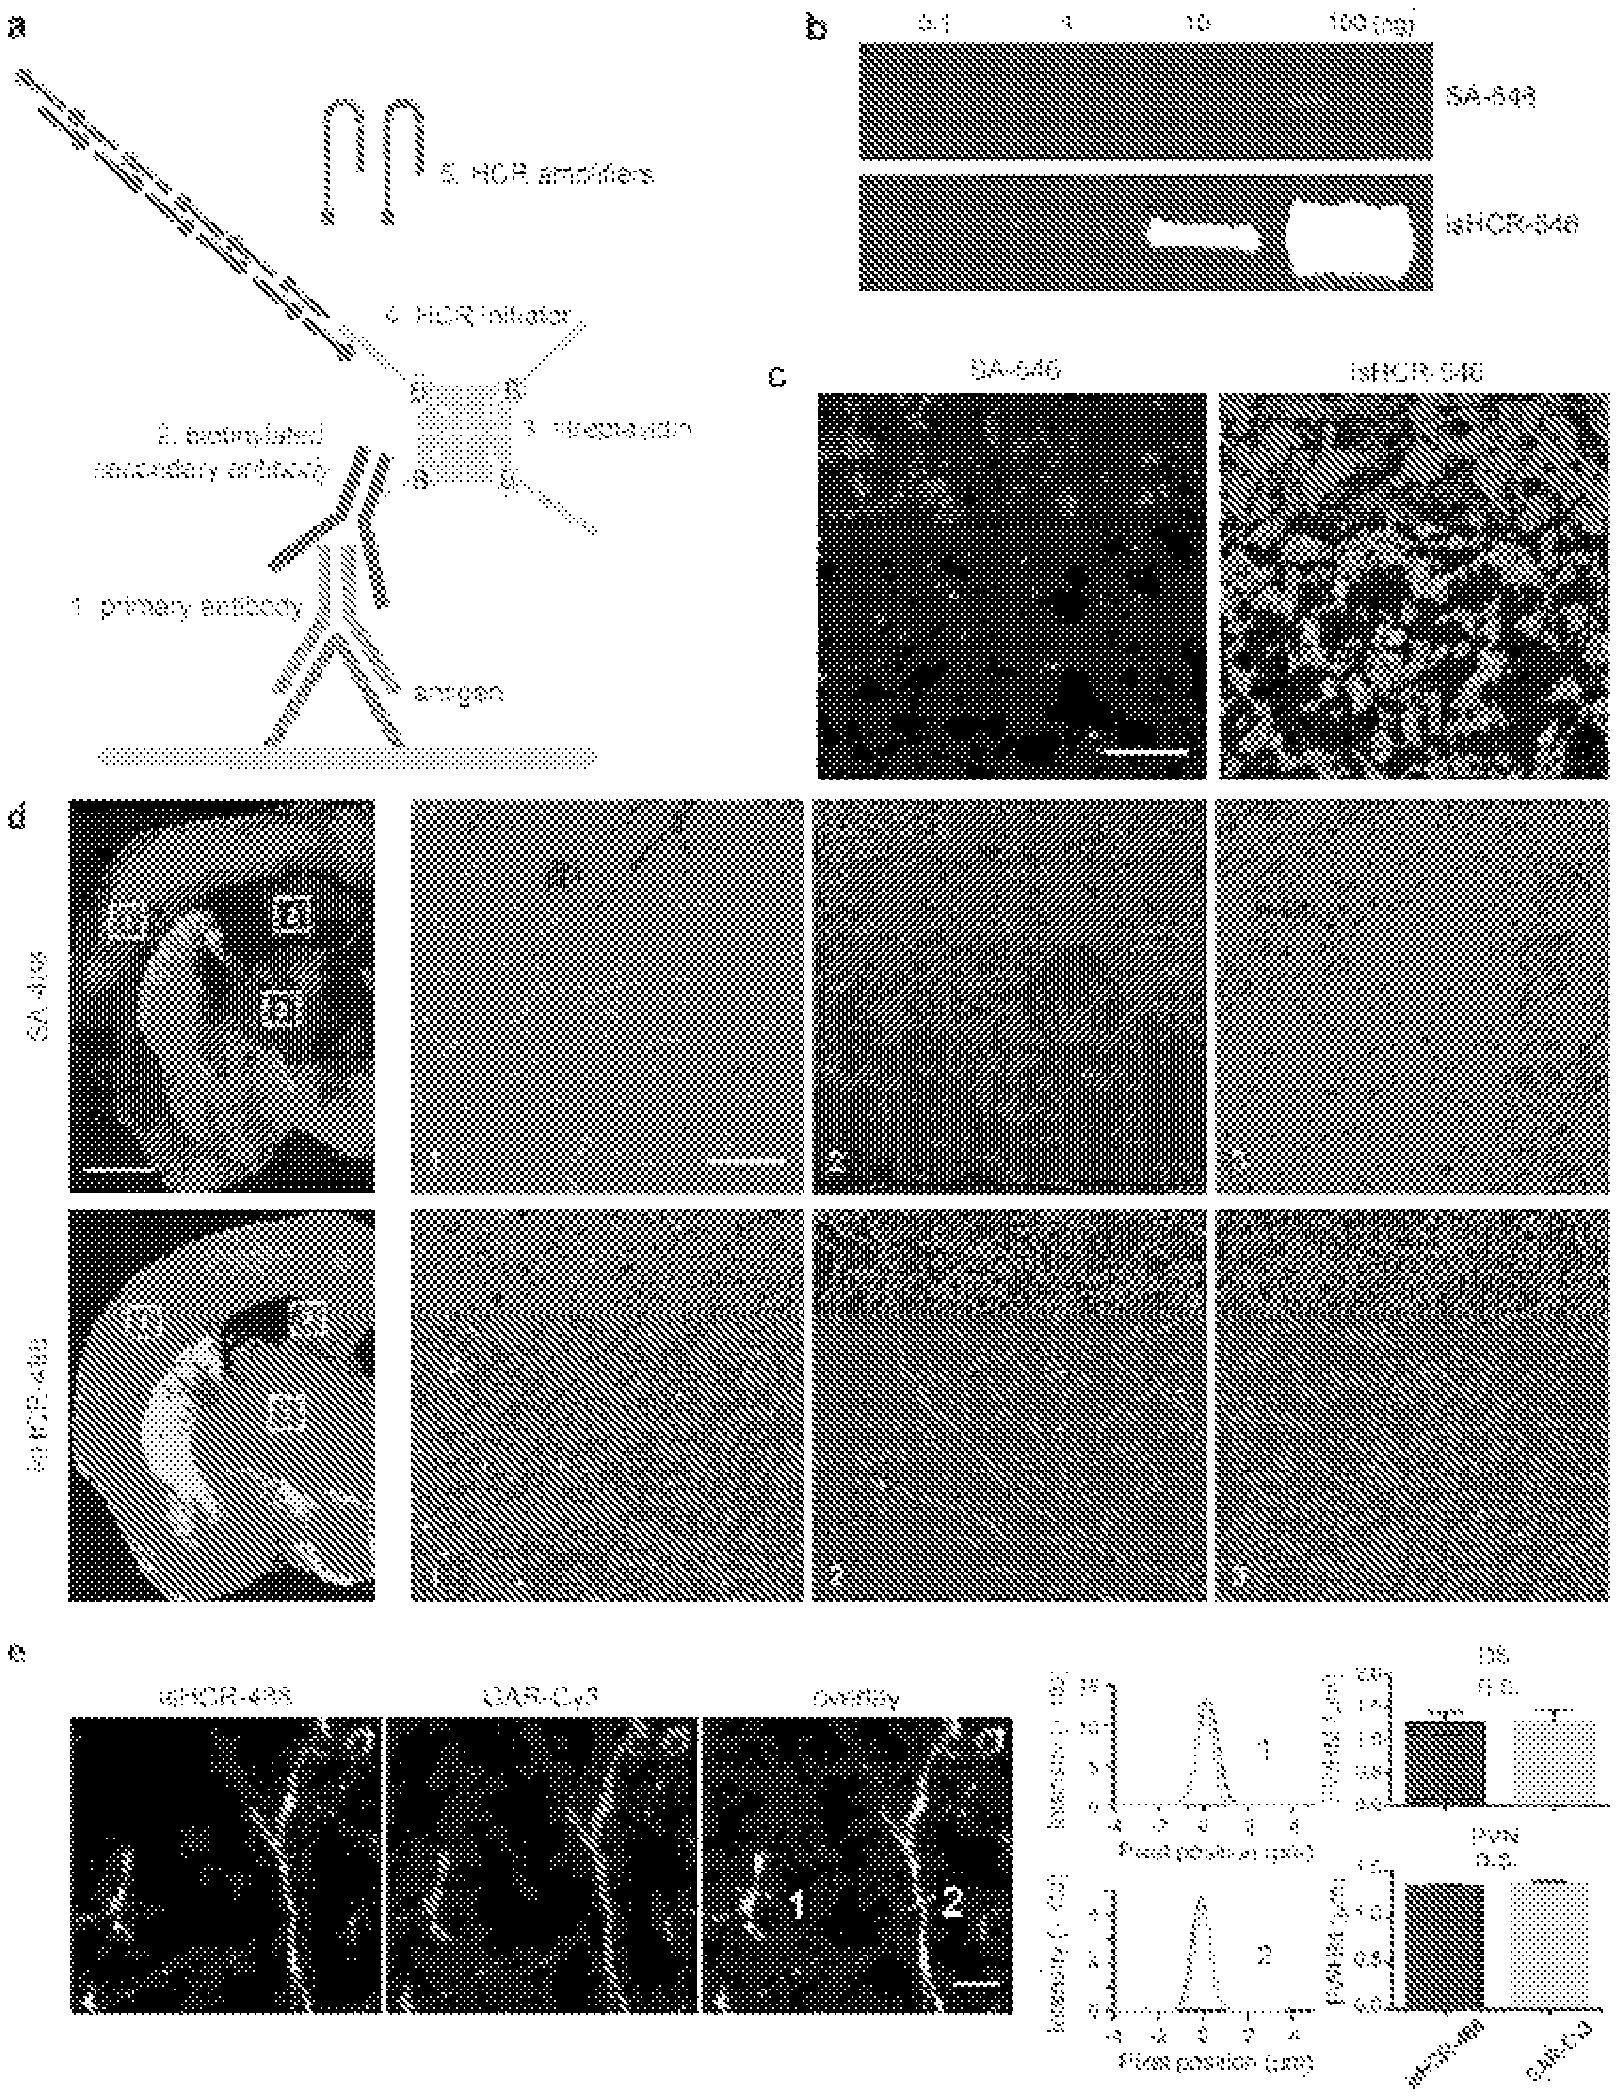
[0040] FIG. 1 The isHCR method can dramatically amplify immunofluorescent signals in various types of biological samples.
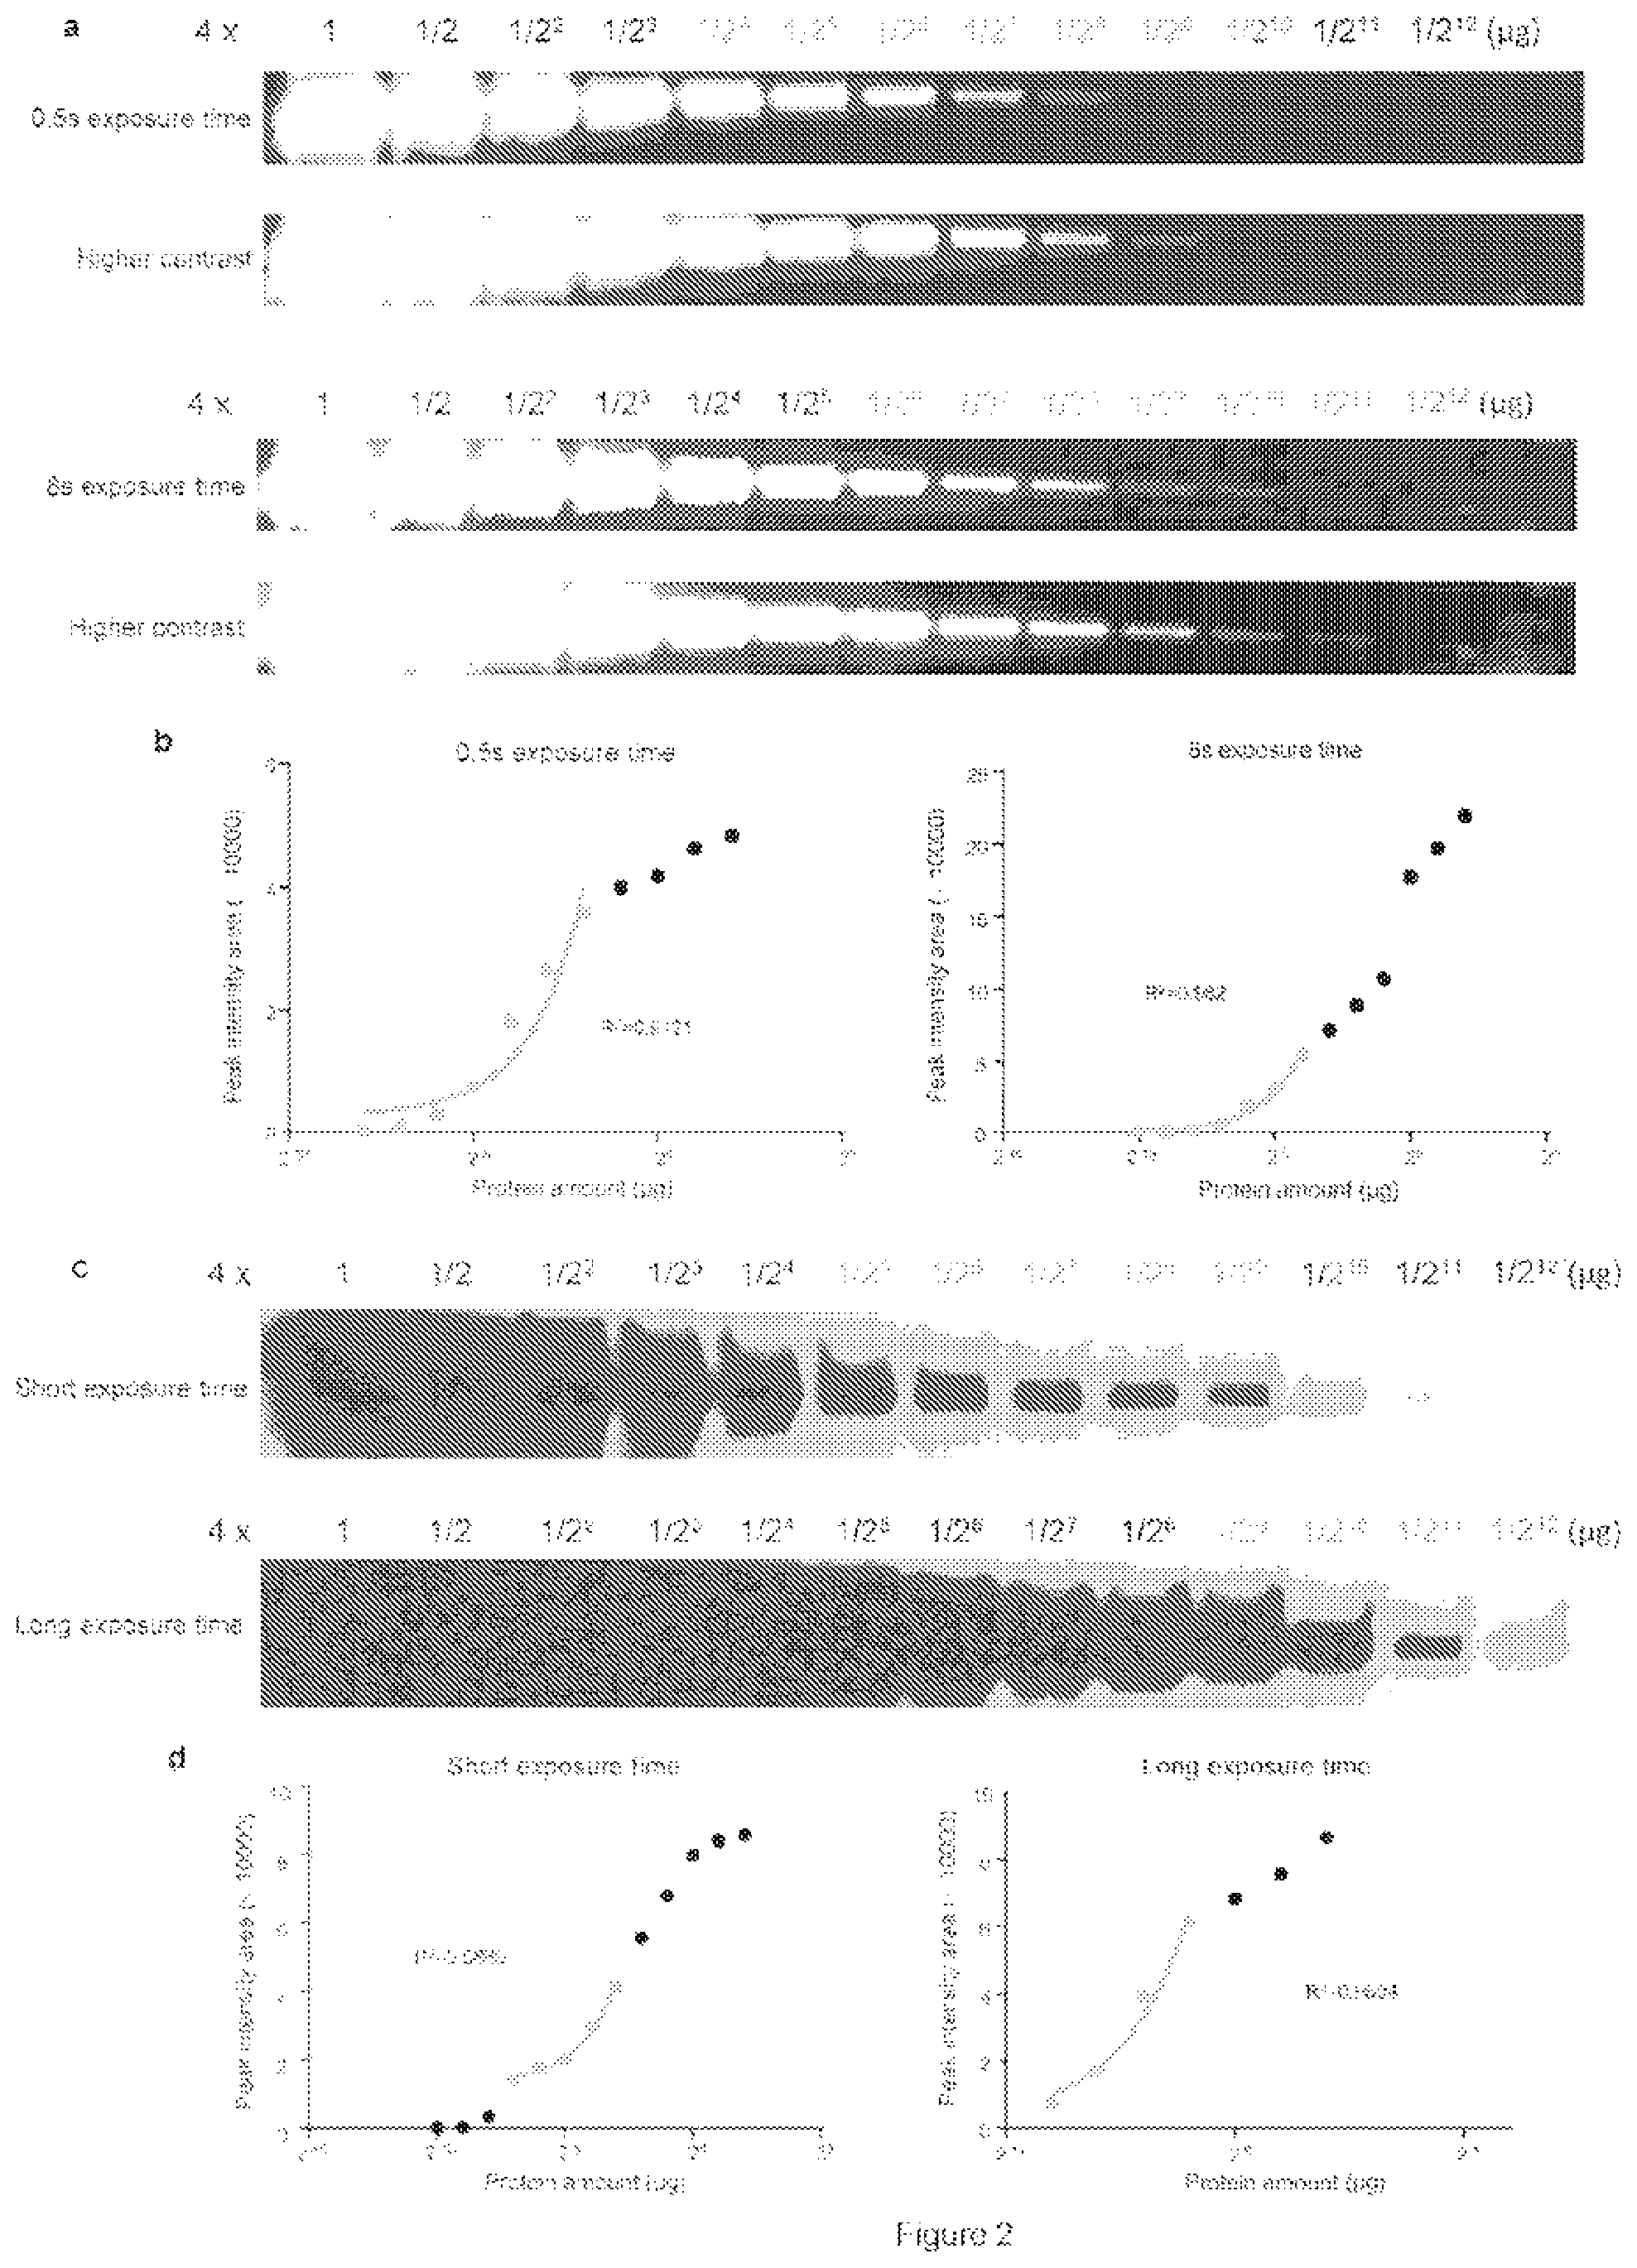
[0041] FIG. 2. Determining the dynamic range for Western blotting using isHCR. Purified scFv-GCN4-HA-GB1 protein was serially diluted.
[0042] FIG. 3. isHCR amplification maintains the spatial resolution of membrane-bound GFP (mGFP) immunosignals in cultured cells.
[0043] FIG. 4. TH immunostaining using isHCR reveals much richer catecholaminergic innervations in the brain.
[0044] FIG. 5. Optimization of isHCR that reduces background noise.
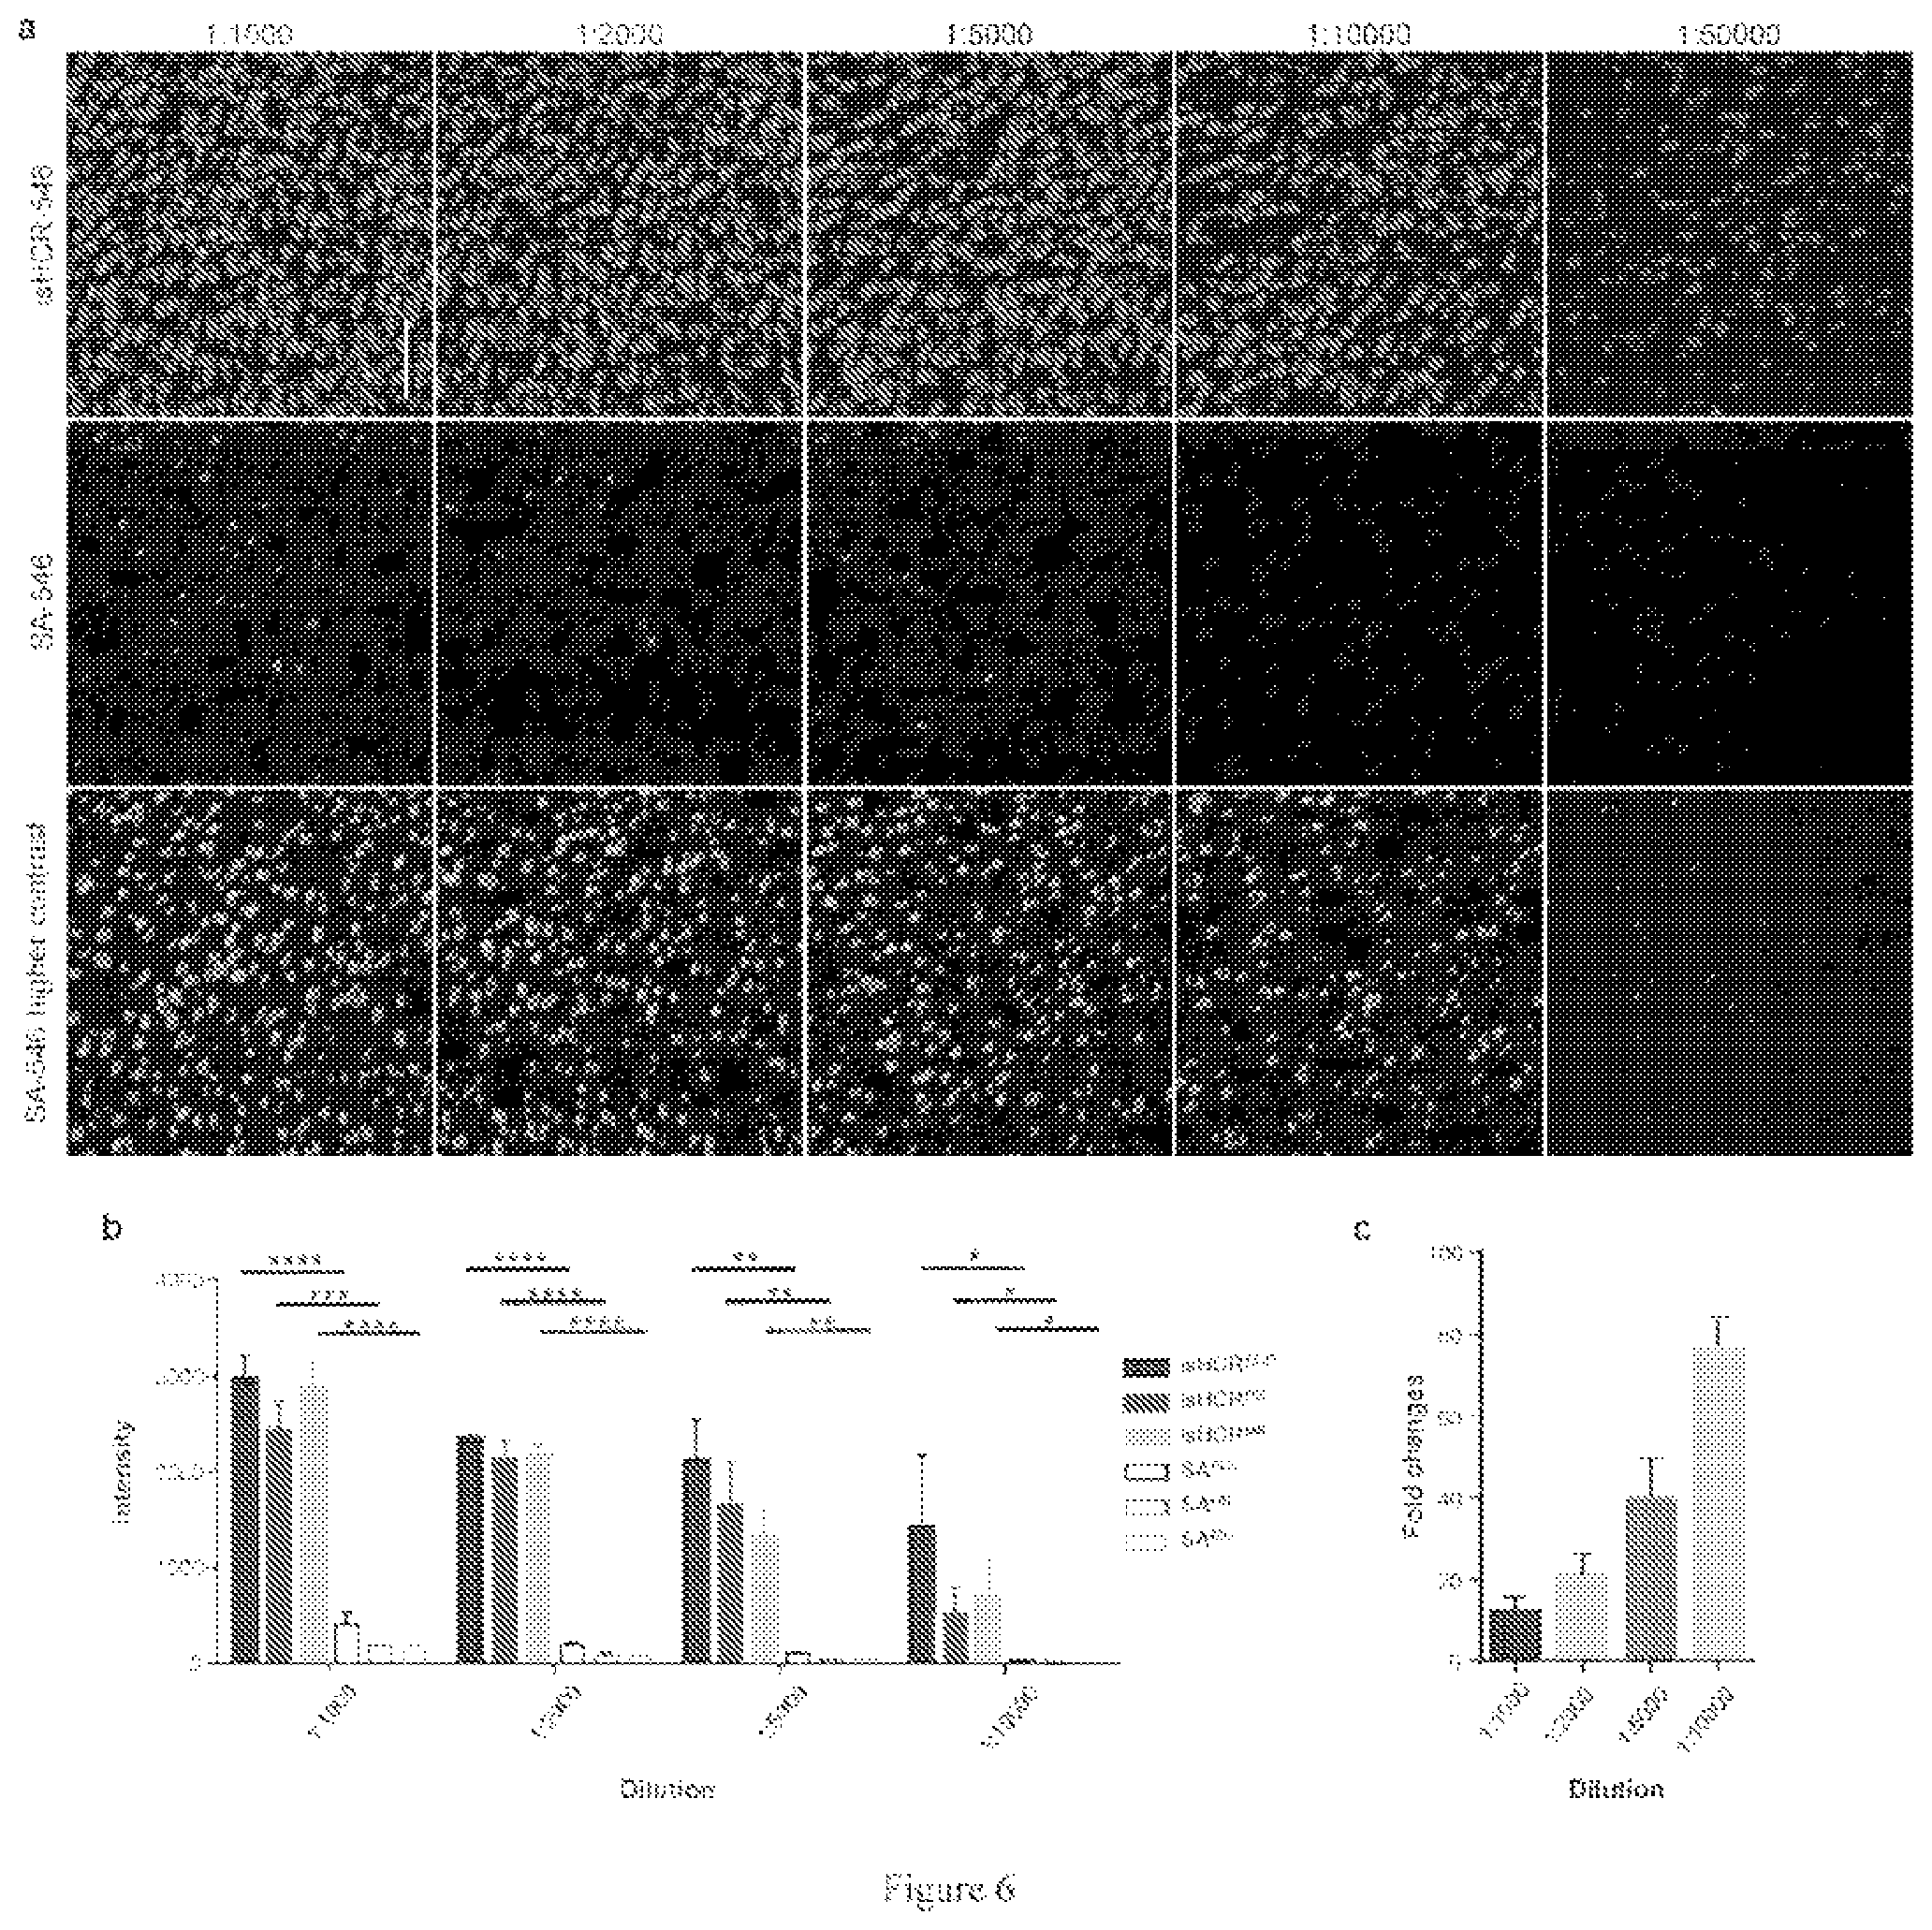
[0045] FIG. 6. isHCR dramatically increases IHC signals in mouse brain sections.
[0046] FIG. 7. isHCR specifically amplifies Vglut3 immunosignals in mouse brain sections.
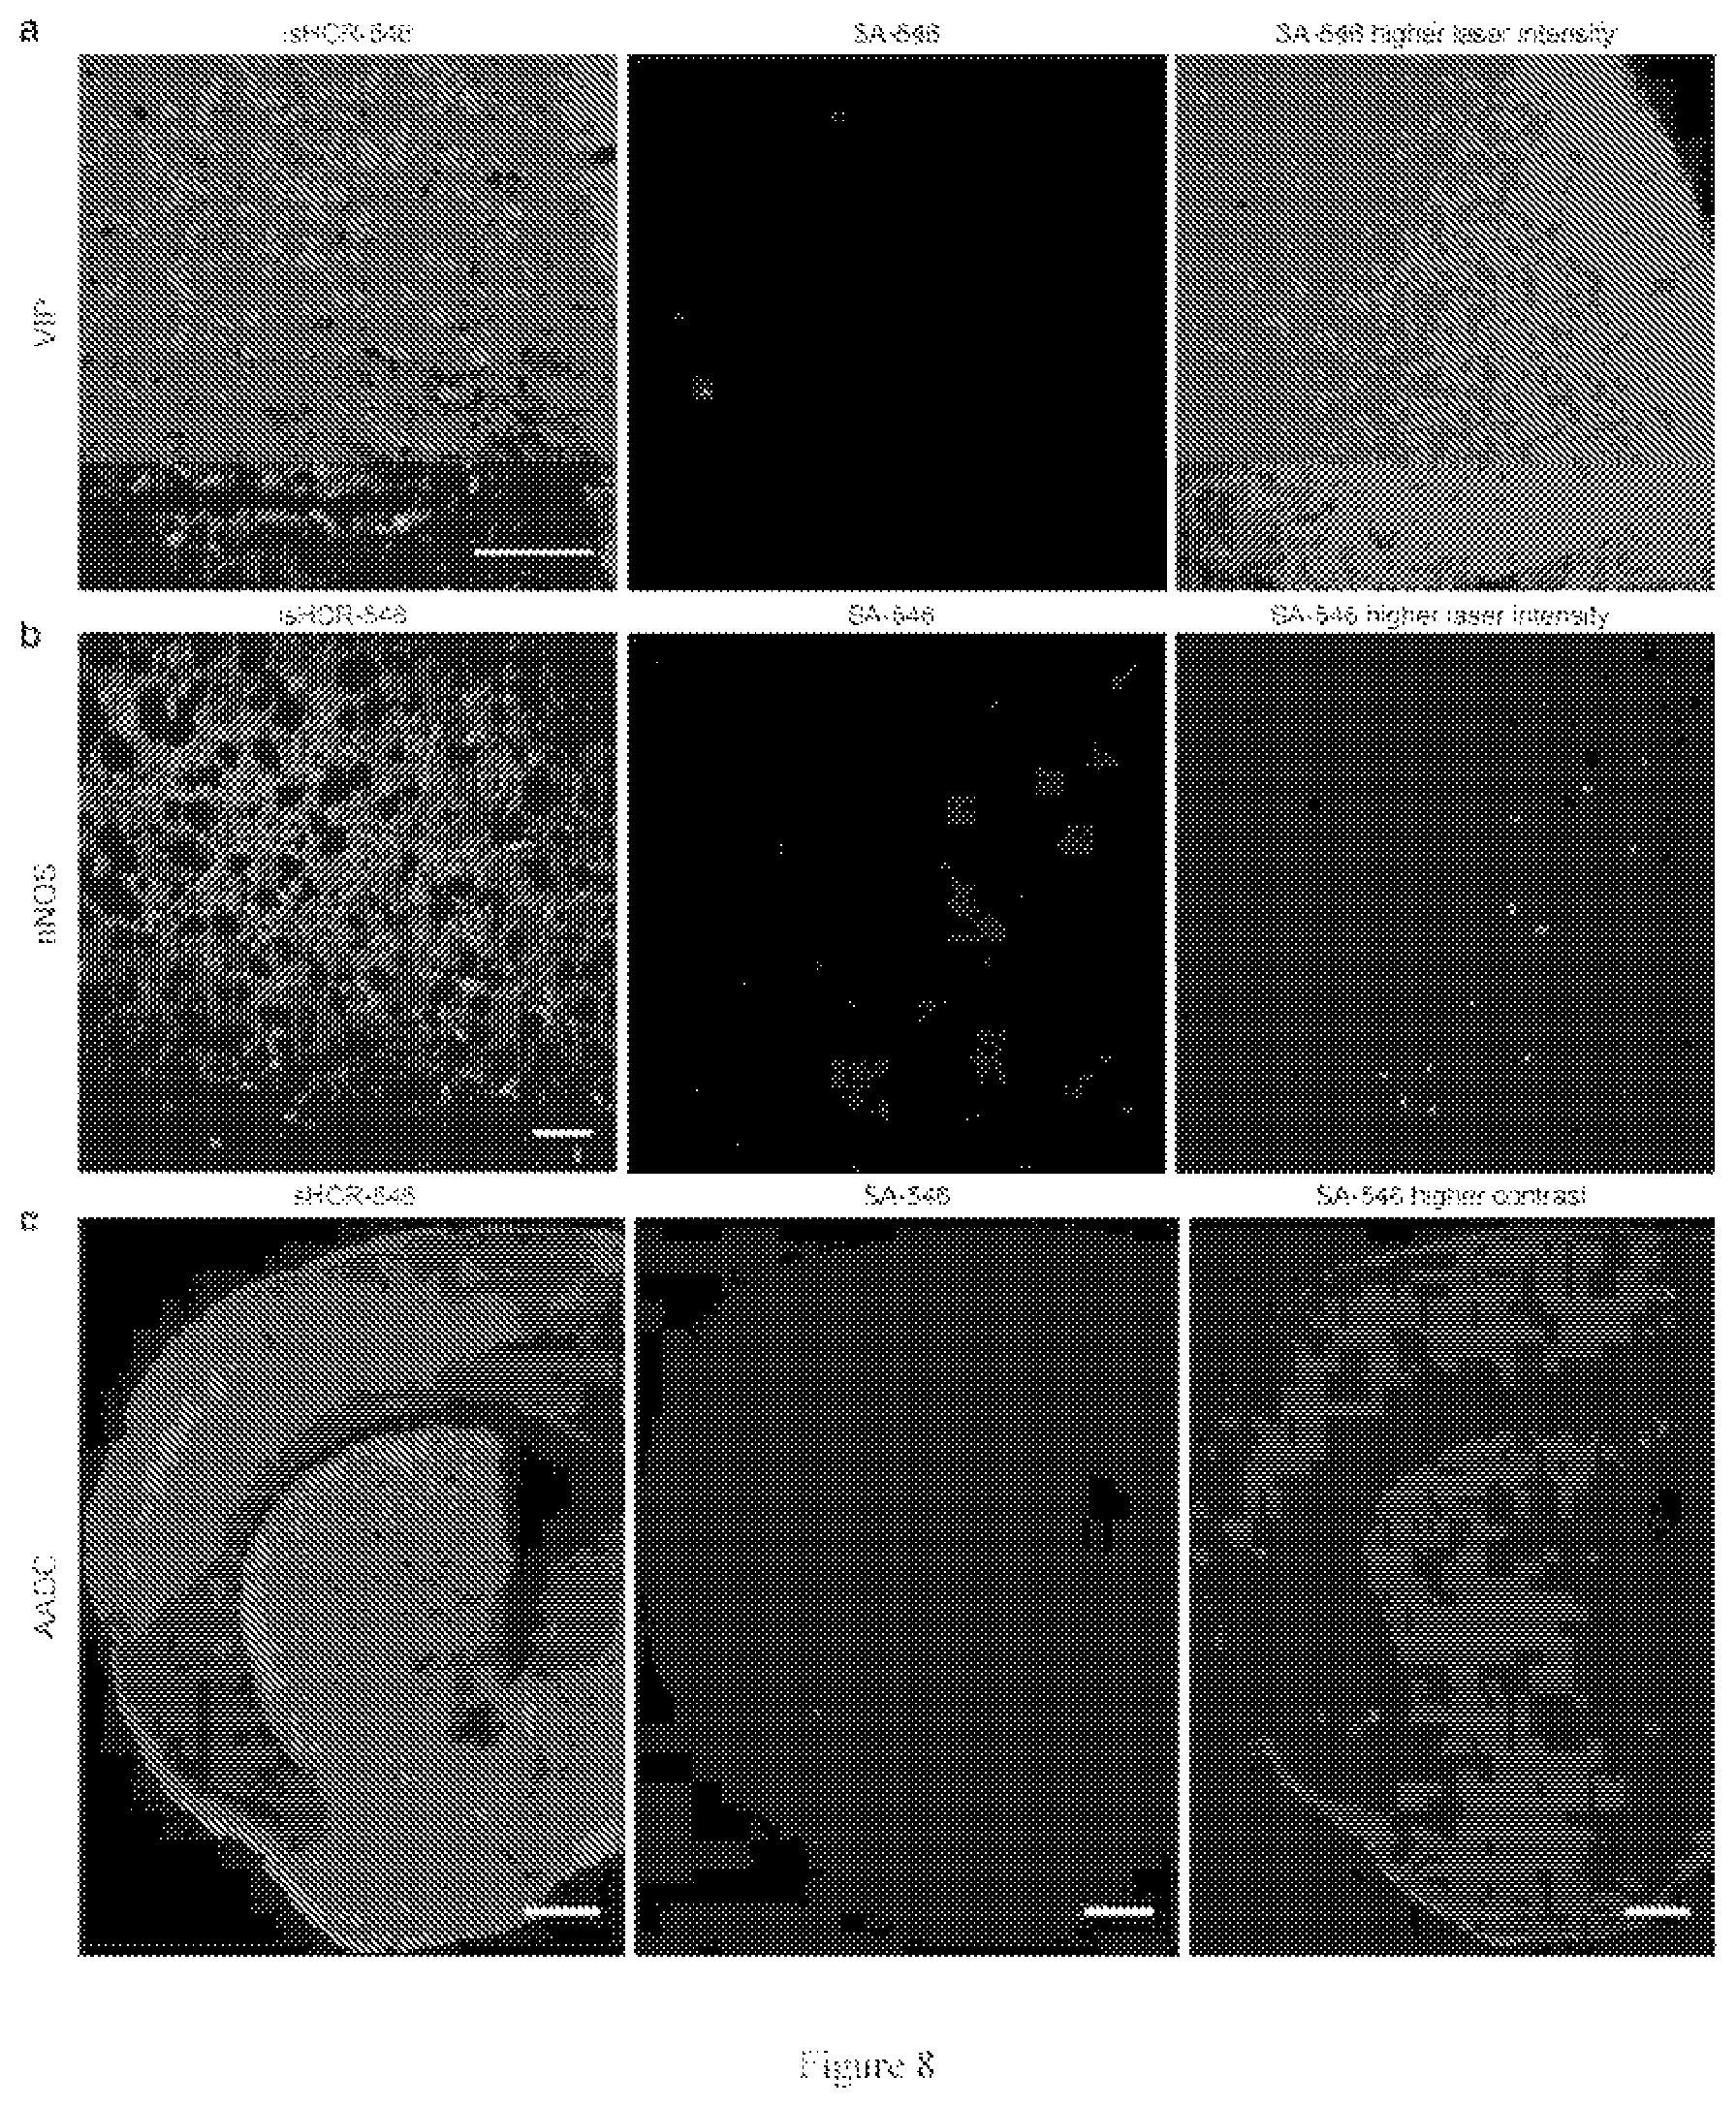
[0047] FIG. 8. isHCR effectively amplifies various immunofluorescence signals.
[0048] FIG. 9. isHCR enables the detection of biomolecules that are challenging for a standard IHC method.
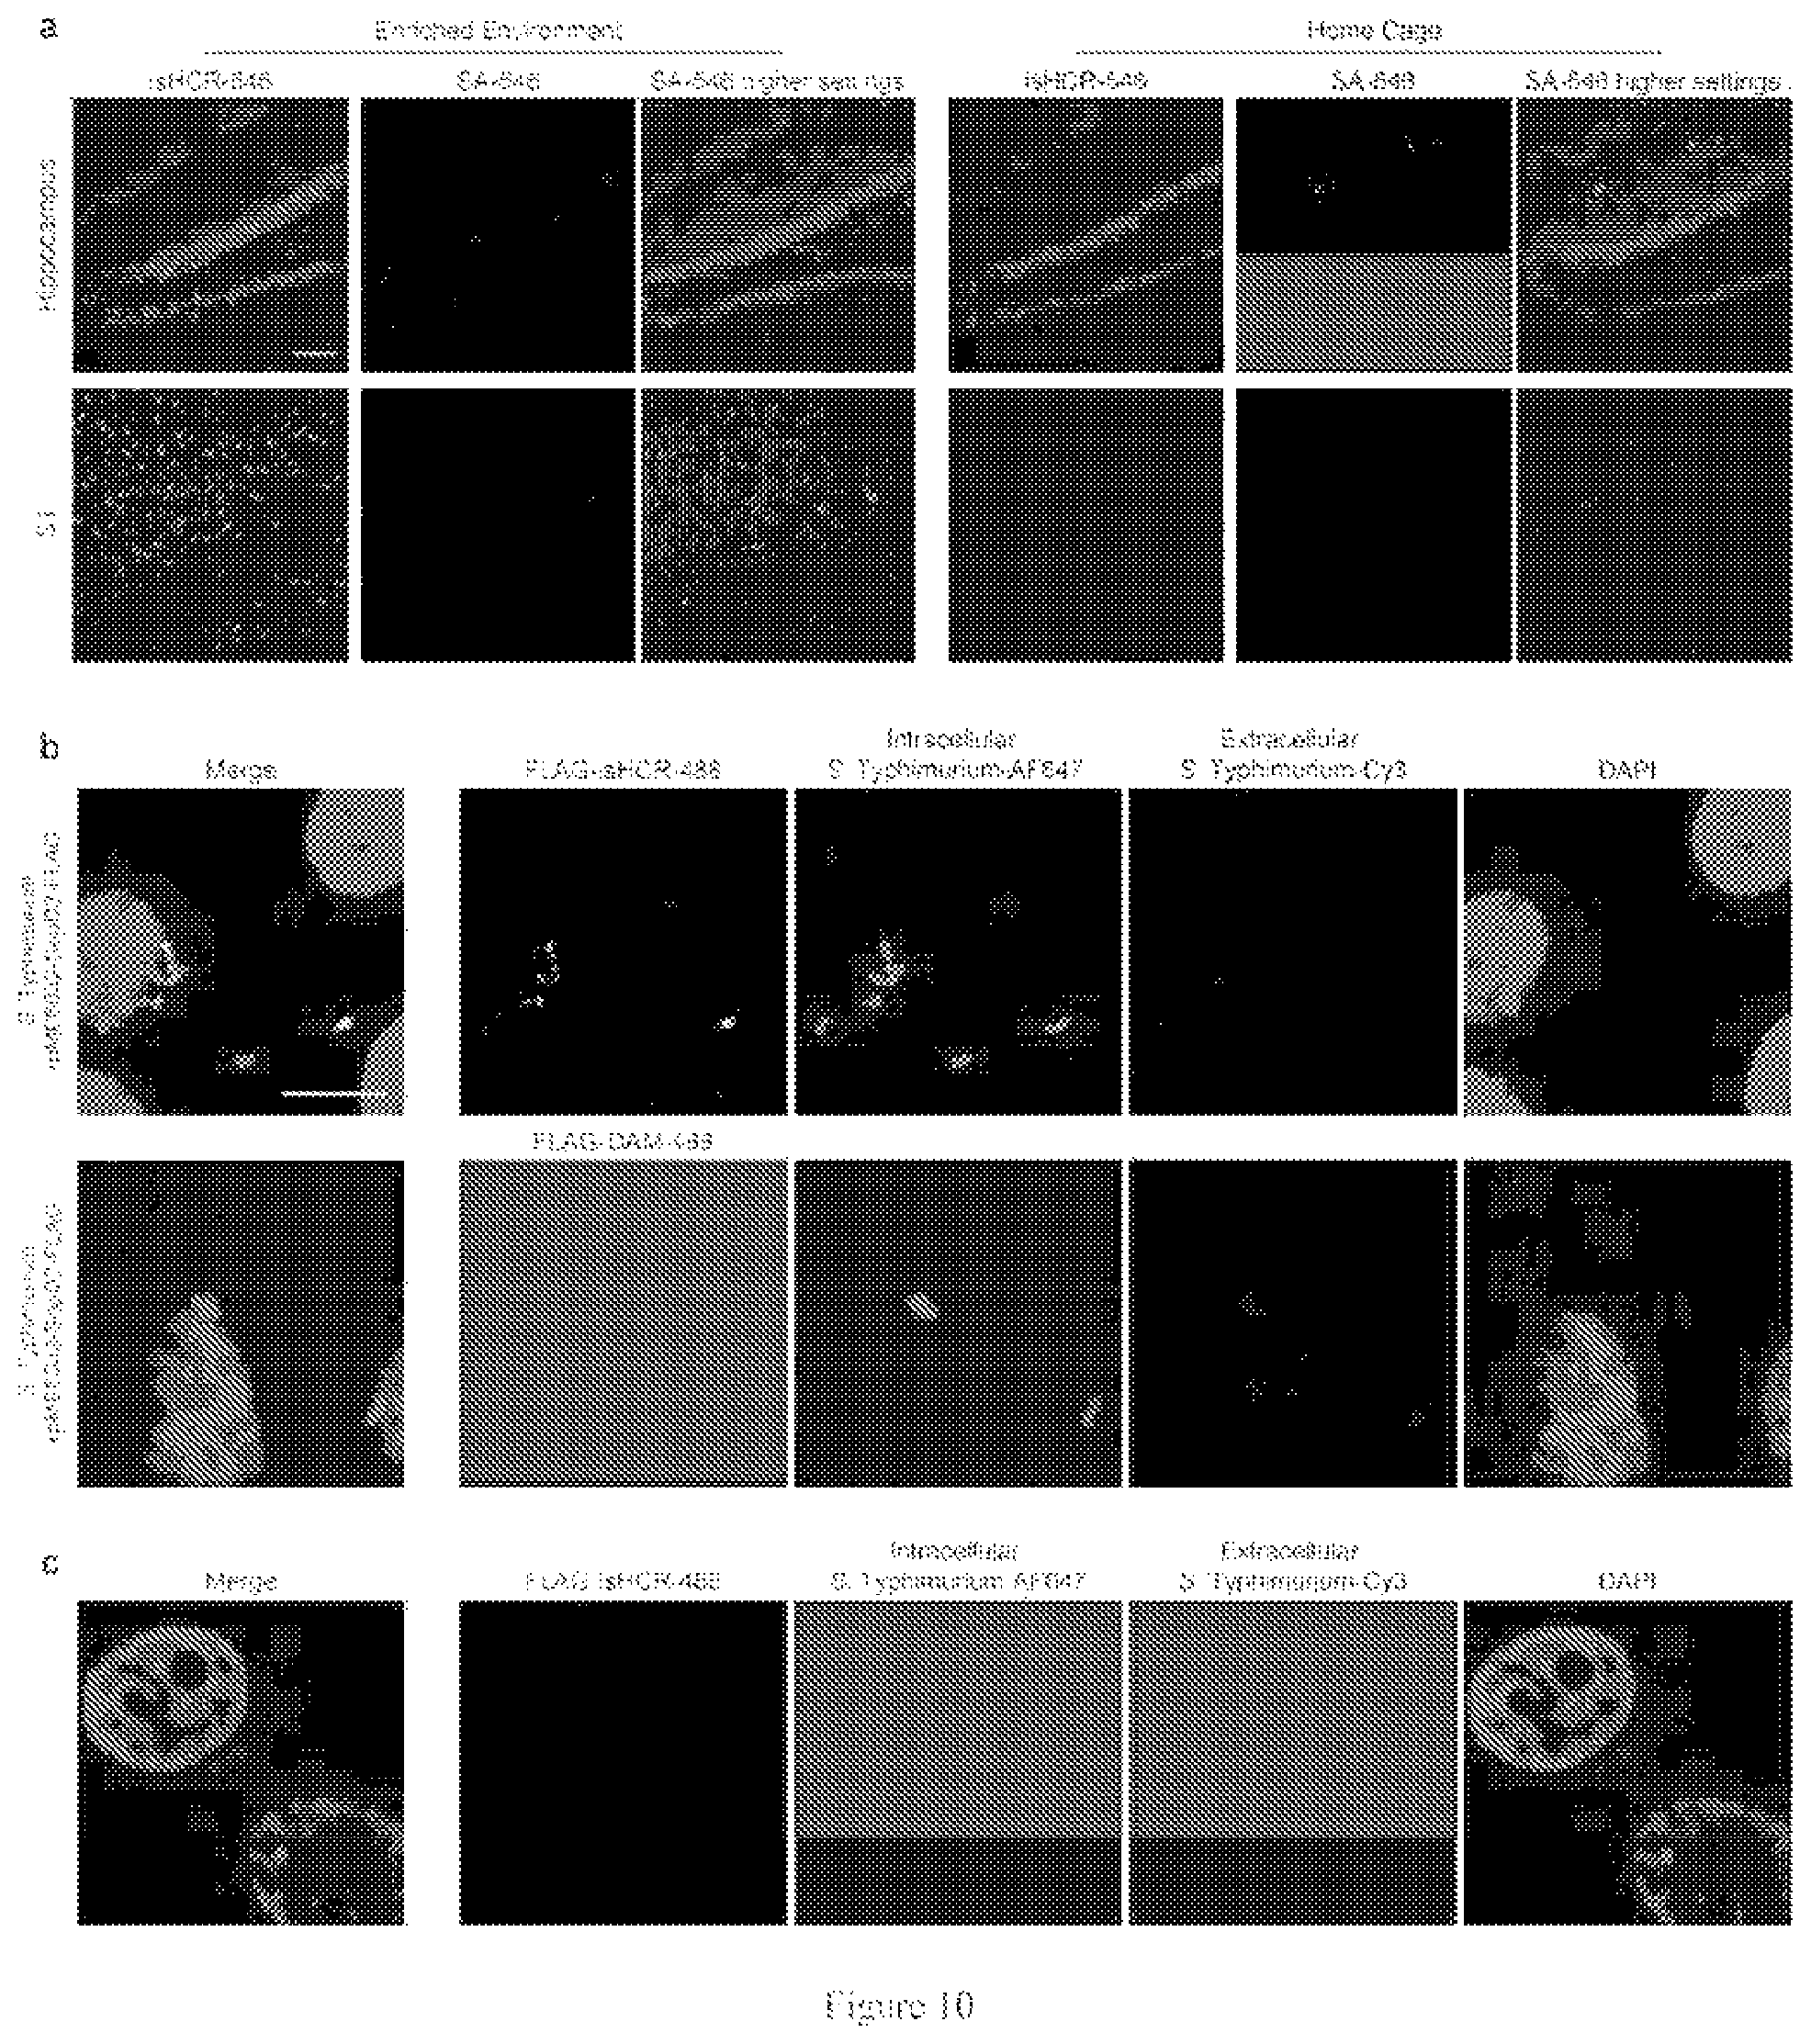
[0049] FIG. 10. isHCR amplification enables the detection of low-abundance proteins.
[0050] FIG. 11. HCR initiators can be conjugated directly onto antibodies using chemical linkers.
[0051] FIG. 12. Multi-round amplification using isHCR.sup.n.
DESCRIPTION OF PARTICULAR EMBODIMENTS OF THE INVENTION
[0052] In the first embodiment, the inventors used isHCR to analyze a purified HA-tagged protein with typical western blotting methods. The analyte protein was a purified single-chain variable fragment (scFv) (Tanenbaum, M. E., Gilbert, L. A., Qi, L. S., Weissman, J. S., and Vale, R. D. Cell 159, 635-646.(2014)), and these experiments used DNA-Alexa Fluor 546 HCR amplifiers (HCR-546). The isHCR-amplified fluorescence signal for 1 ng of scFv was comparable in strength to the fluorescence signal for 100 ng of scFv as measured with a traditional Alexa Fluor 546-conjugated streptavidin method (SA-546), indicating that isHCR can produce a 100-fold increase in protein-detection sensitivity (FIG. 1b). In comparison to a popular commercially-available enzyme-based chemiluminescent detection method, isHCR exhibited similar detection sensitivity, but had a broader dynamic range (FIG. 2).
[0053] Then, in the second embodiment, the inventors next examined its performance in cells. Cultured HEK293T cells expressing membrane-bound enhanced GFP (mGFP) were immunostained against GFP. The immunosignal was amplified via isHCR using DNA-fluorophore HCR amplifiers. The isHCR-amplified fluorescence signal for the target was dramatically stronger than the signal measured with a typical fluorophore-conjugated streptavidin method (FIG. 1c). To confirm the specificity of isHCR amplification, additional control experiments and analyses with mGFP-expressing cells were performed. An antibody mixture containing equal amounts of Alexa Fluor 488-conjugated secondary antibodies and biotinylated secondary antibodies were used for the detection of anti-GFP primary antibodies, and the signals for the biotinylated secondary antibodies were amplified using isHCR-546. Confocal microscopy showed that unamplified and amplified signals were colocalized, indicating that isHCR amplified the true mGFP signal (FIG. 3a). Moreover, these experiments confirmed that isHCR does not affect the spatial resolution of diffraction-limited confocal imaging at the subcellular level: the mean width of cell membranes as calculated from the unamplified mGFP signal data did not differ from the mean width calculated from isHCR-amplified mGFP signal data (FIG. 3b, c).
[0054] In the third embodiment, isHCR was applied to enhance immunohistochemistry (IHC) staining signals in tissues. Mouse brain sections were immunostained against tyrosine hydroxylase (TH), a key enzyme for catecholamine biosynthesis. Compared to a traditional fluorophore-conjugated streptavidin method carried out in parallel, our isHCR analysis revealed a more widespread distribution of TH-positive signals in neuronal processes throughout the brain. In addition to the strong signals that were visible with both methods, isHCR amplification revealed numerous discrete TH-positive neuronal processes in the cortex and subcortical structures; TH-positive signals for these processes were very weak or negligible in the traditional immunostaining analysis (FIG. 1d and FIG. 4a). Omitting the primary antibody against TH produced no specific labeling in the brain (FIG. 4b). Additional control TH-immunostaining experiments on two brain areas showed strong TH signals in the traditional IHC analysis: the dorsal striatum (DS) and the periventricular nucleus (PVN) (FIG. 1e and FIG. 4c). For both brain regions, the unamplified and isHCR-amplified signals were colocalized, and no significant difference was observed in the mean width of TH-positive neuronal processes (FIG. 1e and FIG. 4c), further confirming the specificity of isHCR amplification and showing that isHCR amplification does not affect the spatial resolution of diffraction-limited confocal imaging at the cellular and sub-cellular level.
[0055] Considering the vast number of biotinylated antibodies (secondary antibodies and monoclonal primary antibodies) that are commercially available, the compatibility isHCR with the streptavidin-biotin interaction will allow rapid adoption of isHCR as an optional "add-on" amplification step for most existing immunoassays. The streptavidin-biotin version of isHCR will also likely be used in combination with other protein-streptavidin technologies (e.g., Strep-tags and in vivo biotinylation using biotin ligases).
[0056] These direct conjugation strategies will reduce the size of isHCR amplification complexes, and thereby likely facilitate the use of isHCR in large-volume samples and in high-resolution imaging. All of the required reagents for isHCR are commercially available and are very affordable. Considering the vast expanse of biotechnologies (e.g., protein tags, DNA modifications, reaction chemistries, etc.) that can potentially be incorporated into isHCR, it is conceivable that a great many biosensors and antibody-based methods in life science research could be improved or extended via the creative application of these methods.
[0057] Despite the impressive performance of isHCR in immunosignal amplification in western blotting, cultured cells, and tissue section applications, the inventors noted that in brain sections isHCR produced higher background than the traditional fluorescence IHC (FIG. 5a and FIG. 4a, b). Incubating brain sections with DNA-fluorophore HCR amplifiers alone resulted in high background levels, even after extensive washing (FIG. 5a), suggesting that unassembled HCR amplifiers in tissue sections contribute to the high background levels we observed. Considering that a reduction in background intensity would be expected to improve the signal-to-noise ratio, ways to modify the isHCR process to suppress background fluorescence were explored.
[0058] In the fourth embodiment, HCR initiators were reacted with DNA-biotin amplifiers. Once these DNA-biotin amplifiers have self-assembled and joined the growing isHCR polymer, their biotins can be reacted with newly-added streptavidins (and hence more HCR initiators, etc.), thereby initiating further rounds of polymer elaboration (FIG. 12a). The final round of isHCR.sup.n should add amplifiers for visualization (e.g., DNA-fluorophore amplifiers). Tests based on western blotting of HA-tagged scFv revealed that two extra rounds of amplification (isHCR.sup.3) resulted in an additional ten-fold improvement in protein-detection sensitivity (FIG. 12b).
[0059] In the fifth embodiment, we tested the performance of isHCR.sup.n for immunostaining against TH, the immunopositive signal intensity increased with each round of isHCR amplification (FIG. 12c).
[0060] In addition, in this embodiment, we found the biotinylation position is critically important in determining amplification efficiency. Compared to amplifiers with biotins at their terminal ends, amplifiers with biotin groups at internal positions are more accessible to streptavidins, which serve as anchors for each successive round of branching in isHCR.sup.n (FIG. 12c).
[0061] Control experiments confirmed that the specificity and optical resolution were retained over multiple rounds of isHCR.sup.n amplification (FIG. 12d, e). Further tests showed that the immunosignals of the neuropeptide substance P were progressively amplified by three rounds of isHCR, which upon isHCR.sup.3 revealed rich substance P expression in neuronal processes in both the striatum and the basal forebrain (FIG. 12f, g).
[0062] In the sixth embodiment, GO is used to adsorb unassembled HCR amplifiers and thereby quench their fluorescence (FIG. 5b). In microplate wells, GO completely abolished the fluorescence of HCR amplifiers (FIG. 5c). Crucially, the addition of HCR initiators along with HCR amplifiers and GO resulted in substantial recovery of fluorescence, likely because the initiators triggered the formation of double-strand-nicked polymers of HCR amplifiers, thereby protecting them from the adsorption activity of GO (FIG. 5c). In brain sections, the application of a mixture of GO and DNA-fluorophore HCR amplifiers produced substantially lower background fluorescence levels compared to DNA-fluorophore HCR amplifiers alone (FIG. 5a). We immunostained brain sections against NeuN to quantitatively assess the effect of GO on isHCR amplification in tissue samples. The addition of GO reduced the background but did not diminish the signal intensity, resulting in an improved signal-to-noise ratio as compared to isHCR amplification without GO (FIG. 5d). Further analysis using antibody serial dilution experiments showed that isHCR with GO significantly increased signal intensity as compared to a standard IHC staining method, achieving a greater than 80.times. amplification factor when the primary antibody was highly diluted (FIG. 6).
[0063] In the seventh embodiment, immunostainings against a membrane protein, a peptide neurotransmitter, and two enzymes were carried out to examine the generality of isHCR with GO in brain sections. It has been challenging to localize the expression of vesicular glutamate transporter-3 (Vglut3; a vesicular membrane protein) using standard IHC method (FIG. 5e and FIG. 7a). isHCR conducted without the addition of GO produced strong labeling signals in the brainstem raphe nuclei but also showed high background noise. Encouragingly, isHCR with the addition of GO reduced the background and revealed sharp, punctate labeling of Vglut3-positive synaptic terminals (FIG. 5e and FIG. 7a, c). No specific labeling was observed in brain sections without primary antibody or in mutant mice lacking the functional gene encoding Vglut3 (FIG. 7b). Additional control experiments verified that isHCR faithfully amplified the true Vglut3 signals and preserved spatial resolution for confocal imaging (FIG. 7d, e). The inventors next used isHCR to examine the expression patterns of vasoactive intestinal peptide (VIP), neuronal nitric oxide synthase (nNOS), and aromatic L-amino acid decarboxylase (AADC) in brain sections. In all cases, isHCR with GO produced strong immunopositive signals with low background, consistently revealing much richer expression patterns for each of these proteins than were observed with traditional IHC method (FIG. 8).
[0064] Our successful use of GO to decrease background signal intensity prompted us to explore the use of isHCR with monoclonal antibodies. Although monoclonal antibodies are often more specific than polyclonal antibodies, they frequently fail to provide a sufficiently strong signal for detection via traditional IHC staining. In the sixth embodiment, the inventors used two strategies to test isHCR with monoclonal antibodies in mouse brain sections: a biotinylated primary monoclonal antibody against GAD67, and the combination of a primary monoclonal antibody against c-Fos with a biotinylated secondary antibody (FIG. 9a, b and FIG. 10a). In both cases, much stronger signals in the isHCR-amplified samples than in the non-isHCR samples were obtained.
[0065] More importantly, isHCR using GO enabled detection of immunosignals that were too weak for traditional IHC. Bacterial pathogens deliver protein effectors into host cells to manipulate their physiology; however, the presence and precise distribution of some translocated effectors remain unclear because their concentrations are extremely low. In the seventh embodiment, the inventors tagged the Salmonella enterica serovar Typhimurium (S. Typhimurium) effectors SteA and SopD2 with FLAG-tags and expressed these fusion proteins in S. Typhimurium, and used these transformed strains to infect HeLa cells. (FIG. 9c and FIG. 10b). isHCR amplification yielded strong signals in cells infected with S. Typhimurium expressing the FLAG-tagged SteA and SopD2 proteins, but not in uninfected HeLa cells or in HeLa cells infected with wild-type S. Typhimurium (FIG. 9c top and middle panels; FIG. 10b, c). In contrast, a standard IHC staining method failed to detect any FLAG-tag epitope signal (FIG. 9c lower panel and FIG. 10b). These results thus highlight the utility of isHCR amplification for making new biological discoveries.
[0066] HCR is the abbreviation of Hybridization Chain Reaction. When a single-stranded DNA initiator is added to a reaction system, it opens a hairpin of one species (H1 amplifier), exposing a new single-stranded region that opens a hairpin of the other species (H2 amplifier). This process, in turn, exposes a single-stranded region identical to the original initiator. The resulting chain reaction leads to the formation of a nicked double helix that grows until the hairpin supply is exhausted.
[0067] Click chemistry is a class of biocompatible reactions intended primarily to join substrates of choice with specific biomolecules. Click chemistry is not a single specific reaction, but describes a way of generating products that follow examples in nature, which also generates substances by joining small modular units. In general, click reactions usually join a biomolecule and a reporter molecule. Click chemistry is not limited to biological conditions: the concept of a "click" reaction has been used in pharmacological and various biomimetic applications. However, they have been made notably useful in the detection, localization and qualification of biomolecules. The typical click chemistry reaction includes (1) cycloadditions, such as the Huisgen 1,3-dipolar cycloaddition, in particular the Cu(I)-catalyzed stepwise variant; (2) thiol-ene reaction; (3) diels-Alder reaction and inverse electron demand Diels-Alder reaction; (4) cycloadditions between isonitriles (isocyanides) and tetrazines; (5) nucleophilic substitution especially to small strained rings like epoxy and aziridine compounds; (6) carbonyl-chemistry-like formation of ureas but not reactions of the aldol type due to low thermodynamic driving force; and (7) addition reactions to carbon-carbon double bonds like dihydroxylation or the alkynes in the thiol-yne reaction.
[0068] Graphite oxide is a compound of carbon, oxygen, and hydrogen in variable ratios, obtained by treating graphite with strong oxidizers. The maximally oxidized bulk product is a yellow solid with C:0 ratio between 1.3 and 2.9, that retains the layer structure of graphite but with a much larger and irregular spacing.
[0069] Antibody in the present invention includes but not limit to traditional IgGs and nanobodies.
EXAMPLES
[0070] Methods and Materials
[0071] Reagents and reagent preparation. DNA oligos were synthesized by Thermo Fisher Scientific and Sangon Biotech. Detailed sequences and modifications of DNA oligos can be found in Table 1. All oligos were dissolved in ddH.sub.2O and stored at -20.degree. C.
[0072] The detailed information for antibodies and fluorescent reagents is shown in Table 2. Dextran sulfate (D8906) were purchased from Sigma-Aldrich. Graphene Oxide (GO, XF020, particle size <500 nm, C/O ratio=1.6) was obtained from Nanjing XFNANO Materials Tech Co., Ltd.
[0073] Plasmid construction. scFv-GCN4-HA-GB1 sequence was amplified from pHR-scFv-GCN4-sfGFP-GB1-NLS-dWPRE (Addgene plasmid # 60906, a gift from Ron Vale). For membrane targeting, a GAP43-palmitoylation sequence was added by PCR to the 5' end of GFP (hereafter named mGFP). mGFP was cloned into the pcDNA3.1 vector. scFv-GCN4-HA-GB1 was cloned into the pET-21a vector for bacterial cytosolic expression. The sequences encoding S. Typhimurium effectors SteA or SopD2 were amplified by PCR from genomic DNA of a wild-type S. Typhimurium strain SL1344. SteA and SopD2 were then cloned into pME6032 with a C-terminal FLAG-tag.
[0074] Purification of recombinant protein. E. coli BL21 (DE3) cells harboring pET-21a-scFv-GCN4-HA-GB1 were grown in lysogeny broth (LB) medium supplemented with 100 .mu.g mL.sup.-1 ampicillin. Protein expression was induced with IPTG at a concentration of 0.1 M for 3 h at 37.degree. C.
[0075] Cells were then pelleted by a 20-min spin at 2,000.times.g at 4.degree. C. Cells were lysed via ultrasonic sonication. Cellular debris was removed via 1 h of centrifugation at 39,000.times.g at 4.degree. C. The supernatant was bound to His-Select nickel affinity resin, washed with His-wash buffer (20 mM NaH.sub.2PO.sub.4, pH 8.0, 1 M NaCl, 20 mM imidazole), eluted with His-elution buffer (20 mM sodium phosphate, pH 8.0, 0.5 M NaCl, 250 mM imidazole), and the eluate was then dialyzed with phosphate buffer saline (PBS).
[0076] Protein-HCR DNA Initiator conjugation. The conjugation was performed using Maleimide-PEG2-NHS (SMCC, 746223, Sigma-Aldrich) or NHS-Azide (synthesized or purchased from Thermo Fisher Scientific, 26130) as linkers. For Maleimide-PEG2-NHS conjugation, proteins (IgGs) were dialyzed into phosphate buffered saline (PBS, pH 7.4) and reacted with Maleimide-PEG2-NHS (7.5-fold molar excess) at room temperature for 2 h. Excess crosslinkers were removed from maleimide-activated proteins using Zeba spin columns (7000 MWCO). In parallel, thiol-modified HCR initiators were reduced using dithiothreitol (DTT, 100 mM) in PBS (1 mM EDTA, pH 8.0) for 2 h at room temperature, and then purified using Micro Bio-Spin P-6 Gel columns. The maleimide-activated proteins and reduced initiators (15-fold molar excess for IgGs) were mixed and reacted at room temperature for 2 h. HCR initiator-labeled proteins were purified using Amicon Ultra Centrifugal Filters (50 kDa MWCO) or Zeba spin columns (7000 MWCO).
[0077] For NHS-Azide conjugation, proteins were dialyzed into phosphate buffered saline (PBS, pH 7.4) and reacted with NHS-Azide (7.5-fold molar excess) at room temperature for 2 h. Excess crosslinkers were removed from azide-activated proteins using Zeba spin columns (7000 MWCO). The azide-activated proteins were mixed with DBCO-labeled HCR initiators (15-fold molar excess for IgGs) and then reacted at room temperature for 12 h. HCR initiator-labeled proteins were purified using Amicon Ultra Centrifugal Filters (50 kDa MWCO) or Zeba spin columns (7000 MWCO).
[0078] Cell culture and bacterial infections. HEK293T cells (ATCC CRL-3216) and HeLa cells (ATCC CCL-2) were used for the cultured-cell staining experiments. Cells were seeded on 12 mm #1.5 coverglass slips. Transfection was done using PEI. Cells were fixed with paraformaldehyde before subsequent experiments. The S. Typhimurium infection was performed according to a previous report (Shi, J. et al. Nature 514, 187-192 (2014)).
[0079] Mice. Animal care and use were in accordance with the institutional guidelines of the National Institute of Biological Sciences, Beijing (NIBS), as well as the governmental regulations of China.
[0080] Adult (8-12 weeks old) Vglut3-/- mice (Liu, Z. et al. Neuron 81, 1360-1374 (2014)) and C57BL/6N mice of either sex were used. Mice were maintained with a 12/12 photoperiod (light on at 8 AM) and were provided food and water ad libitum. Mice were anaesthetized with pentobarbital (i.p., 80 mg.times.kg.sup.-1) before scarification.
[0081] Mouse behaviors. The enriched environment experiments were performed using adult (8-12 weeks old) C57BL/6N male mice according to the following protocol. The mice were singly housed three days before the experiments. They were randomly assigned into the "environmentally enriched" group and "homecage control group" (n=3 mice for each group). The enriched environment arena was a 50.times.50 cm plastic box containing a running wheel, a plastic tunnel, wooden chips for chewing, and buried food. The mice from experimental groups (n=3 mice) were allowed to explore the arena for 1 h. The mice were removed from the novel environment and returned to the homecage. The mice were sacrificed after 30 min. Homecage control mice (n=3 mice) were sacrificed directly without exploring the arena. c-Fos expression was examined without blinding.
[0082] Tissue sample preparation. Mice were anesthetized with an overdose of pentobarbital and perfused intracardially with PBS, followed by paraformaldehyde (PFA, 4% wt/vol in PBS). Tissues (brains or lungs) were dissected out and postfixed in 4% PFA for 4 h at room temperature or 1 d at 4.degree. C. Tissue samples were first dehydrated in 30% sucrose solution for preparing thin sections (50 .mu.m). The thickness of mouse brain sections was 50 .mu.m for immunofluorescent labeling. Thin sections were prepared on a Cryostat microtome (Leica CM1950). The brain section samples for those experiments that compared the signal intensity from isHCR amplification and traditional IHC methods were serial sections from the same mice, and were prepared on the same day. Serial sections were divided equally into two groups for the subsequent experiments.
[0083] Immunohistochemistry. The detailed information, working concentrations, and incubation times for antibodies can be found in Table 2. For brain sections and cultured cells, samples were permeabilized with 0.3% Triton X-100 in PBS (PBST) and blocked in 2% BSA in PBST at room temperature for 1 h. Sections were then incubated with primary antibodies. Samples were washed three times in PBST and were then incubated with biotinylated or HCR initiator-conjugated secondary antibodies. For control experiments, we used a mixture containing equal amounts of fluorophore-conjugated secondary antibodies and biotinylated secondary antibodies. Samples were then washed again three times in PB ST. The biotinylated secondary antibodies were visualized by fluorophore-conjugated Streptavidin or DNA-fluorophore HCR amplifiers. HCR initiator-conjugated secondary antibodies were visualized by DNA-fluorophore HCR amplifiers.
[0084] For S. Typhimurium infected HeLa cells, samples were washed with PBS once, and fixed using 4% PFA for 15 min at room temperature. Samples were washed three times in PBS to remove PFA, and were then incubated with anti-Salmonella primary antibody at room temperature for 1 h. Samples were then washed again three times in PBS. Cy3-conjugated goat anti-rabbit secondary antibodies were applied to detect extracellular S. Typhimurium. After incubation at room temperature for 1 h, samples were washed three times in PBS. Samples were then permeabilized in 0.3% PBST for 5 min at room temperature. Samples were incubated in an antibody mixture containing anti-FLAG and anti-Salmonella primary antibodies for lh at room temperature. Samples were washed three times in PBS to remove the unbound primary antibodies. A mixture containing biotinylated donkey anti-mouse secondary antibody (for detecting FLAG-tag) and Alexa Fluor-647 conjugated secondary antibody (for detecting intracellular S. Typhimurium) was applied. Samples were washed three times in PBS after incubation at room temperature for lh. The biotinylated donkey anti-mouse secondary antibodies were visualized by fluorophore-conjugated streptavidin or DNA-fluorophore HCR amplifiers.
[0085] Labeling of isHCR initiators. All reagents were dissolved in HCR amplification buffer [5.times. sodium chloride citrate (SCC buffer), 0.1% vol/vol Tween-20, and 10% wt/vol dextran sulfate in ddH.sub.2O]. After labeling with biotinylated secondary antibodies, samples were incubated in 1 .mu.gmL.sup.-1 streptavidin at room temperature for 30 min. After being washed three times in PBST, samples were incubated with 0.5 .mu.M DNA-biotin HCR initiators at room temperature for 30 min. Samples were then washed three times and stored in PBST.
[0086] isHCR amplification. Note that while the experimental steps regarding the isHCR initiators varied according the conjugation strategies, the basic isHCR amplification process is common to all of the experiments. First, HCR amplification buffer was prepared [5.times. sodium chloride citrate (SCC buffer), 0.1% vol/vol Tween-20, and 10% wt/vol dextran sulfate in ddH2O]. Next, a pair of DNA-fluorophore HCR amplifiers were snap-cooled separately in 5.times.SSC buffer by heating at 95.degree. C. for 90s and cooling to room temperature over 30 min. Both of these amplifiers were then added to amplification buffer (typically to a final concentration of 12.5 nM for thin sections). isHCR amplification proceeded as samples were incubated with this buffer overnight at room temperature, and free amplifiers were then removed by washing the three times with PBST prior to signal detection. Note that an additional graphene oxide step was added to this basic process for applications that demands background suppression. Briefly, to include the quenching step, GO (20 .mu.gmL.sup.-1) was mixed with the amplifiers in amplification buffer. The amplifier/GO mixture was vortexed thoroughly and incubated at room temperature for at least 5 min before being added to initiator-labeled samples.
[0087] To perform multi-round amplification, we used DNA-biotin HCR amplifiers. Before use, DNA-biotin HCR amplifiers were snap-cooled. Samples were incubated with 12.5 nM DNA-biotin HCR amplifiers overnight at room temperature. After extensive washing, streptavidin (1 .mu.gmL.sup.-1) was applied again to start the next round of amplification. The procedure of adding DNA-biotin HCR amplifiers and then streptavidin was repeated two or three times to achieve desired signal intensity. DNA-fluorophore amplifiers (12.5 nM) were used in the final round to visualize the signals. For control experiments, biotin and Alexa Fluor-488 dual-labeled HCR amplifiers were used for the first round of amplification. Alexa Fluor-546-labeled HCR amplifiers were used for the second round of amplification.
[0088] We initially conducted tests of the effects of GO on the performance of both unassembled and polymerized HCR amplifiers (FIG. 5c). Here, DNA-Alexa Fluor 546 HCR amplifiers were snap-cooled and added to the amplification buffer at the final concentrations of 12.5 nM, and GO (20 .mu.gmL.sup.-1) was added to quench the fluorescence of free HCR amplifiers in solution. After 5 min of quenching, DNA-biotin HCR initiators (0.5 .mu.M) were added to trigger the polymerization of HCR amplifiers and the attendant recovery of fluorescence. After incubating samples overnight at room temperature, we measured the fluorescence of samples using a Molecular Device SpectraMax M3 microplate reader.
[0089] Fluorescence microscopy. Confocal microscopy was performed on a Zeiss Meta LSM510 confocal scanning microscope using a 10.times.0.3 NA, a 20.times.0.5 NA, a 63.times.1.4 NA, or a 100.times.1.3 NA objective, or on a Zeiss LSM880 confocal scanning microscope using a 20.times.0.5 NA or a 40.times.0.75 NA objective. Images were processed and measured with FIJI and Matlab. For confocal imaging, brain sections from both groups were imaged using identical laser intensity, pin hole value, detector gain, and offset. In some experiments, higher laser intensities were used to image brain sections for the SA group samples: such images have been labeled as `higher laser intensity` in the figures.
[0090] To image the entire brain sections, we performed wide-field fluoresce imaging using the Olympus VS120 virtual microscopy slide scanning system with a 10.times. objective. For slide scanner imaging, brain sections from both groups on the same slide were imaged during the same imaging run using identical light intensity and exposure time. The images were acquired at 16 bit and were converted directly to the TIFF format for publication.
[0091] Data analysis. To determine the width of immunopositive neuronal processes or cell membrane (FIG. 1e, FIGS. 3b, and 7e), we calculated the full width at half maximum (FWHM) using signals from either unamplified or isHCR-amplified channels (Ramanathan, S. P. et al. Nat. Cell Biol. 17, 148-159 (2015)). A series of straight lines perpendicular to the membrane or neuronal process were drawn (FIG. 1e and FIG. 3a). The corresponding intensity profiles were plotted and averaged for each channel. For neuronal process measurement, the baseline correction was applied. The corrected average intensity of each channel was fit to a Gaussian distribution with a non-linear least square method. FWHM was calculated with the equation: FWHM=2 {square root over (2in2)}.sigma., where .sigma. is the standard deviation of the fitted Gaussian curve. For cell membrane measurement, the mean intensity of the distance from the edge of the membrane or neuronal process (typically between -3 .mu.m to -2 .mu.m) was calculated as the baseline (denoted m). The peak value of the curve was determined (denoted p). Half-peak intensity (I) was defined (p+m)/2. The full width at half maximum (FWHM) was quantified as the width of the average intensity curve at I.
[0092] To determine the dynamic range of blotting signals (FIG. 2), the peak intensity area of each lane was calculated and plotted using the signals acquired with short or long exposure time. We then plotted the intensity values vs. analyte protein amount using a log.sub.2 scale. We then performed a series of linear regression across ranges of protein amount and calculated the R-squared value for each regression. The linear dynamic range represented the range that reported the maximum R-squared value.
[0093] To calculate the amplification factors of isHCR in brain sections (FIG. 6), we performed NeuN immunostaining using anti-NeuN primary antibodies with different dilution ratios. We then visualized the signals using isHCR (with or without GO) or SA-546. The images of isHCR-546 and SA-546 samples from the ACC, DS, and MS were acquired using identical microscopy settings. We then calculated the average signal intensity within each data group.
[0094] Statistical significance was determined using t-test or Kolmogorov-Smirnov test. P<0.05 was considered significant.
TABLE-US-00001 TABLE 1 Oligo nucleotide sequences and modifications Name Sequence (5' to 3') Modifications B1 I2 ATATAgCATTCTTTCTTgAggAgggCAg 5' Biotin CAAACgggAAgAg(SEQ ID NO: 1) B1 I2 Thiol ATATAgCATTCTTTCTTgAggAgggCAg 5' Thiol CAAACgggAAgAg(SEQ ID NO: 1) B1 I2 DBCO ATATAgCATTCTTTCTTgAggAgggCAg 5' DBCO CAAACgggAAgAg(SEQ ID NO: 1) B1 Amplifier CgTAAAggAAgACTCTTCCCgTTTgCTg 5' Alexa H1 546 CCCTCCTCgCATTCTTTCTTgAggAggg Fluor 546 CAgCAAACgggAAgAg(SEQ ID NO: 2) B1 Amplifier gAggAgggCAgCAAACgggAAgAgTCTT 3' Alexa H2 546 CCTTTACgCTCTTCCCgTTTgCTgCCCT Fluor 546 CCTCAAgAAAgAATgC(SEQ ID NO: 3) B1 Amplifier H1 CgTAAAggAAgACTCTTCCCgTTTgCTg 5' Biotin Terminal Biotin CCCTCCTCgCATTCTTTCTTgAggAggg CAgCAAACgggAAgAg(SEQ ID NO: 2) B1 Amplifier H2 gAggAgggCAgCAAACgggAAgAgTCTT 3' Biotin Terminal Biotin CCTTTACgCTCTTCCCgTTTgCTgCCCT CCTCAAgAAAgAATgC(SEQ ID NO: 3) B1 Amplifier H1 CgTAAAggAAgACTCTTCCCgTTTgCTg Internal Internal Biotin gCCCTCCTCgCATTCTTTCTTAggAggg Biotin CAgCAAACgggAAgAg(SEQ ID NO: 2) B1 Amplifier H2 gAggAgggCAgCAAACgggAAgAgTCTT Internal Internal Biotin CCTTTACgCTCTTCCCgTTTgCTgCCCT Biotin CCTCAAgAAAgAATgC(SEQ ID NO: 3) B1 Amplifier H1 CgTAAAggAAgACTCTTCCCgTTTgCTg Internal Internal Biotin CCCTCCTCgCATTCTTTCTTgAggAggg Biotin and 5'-488 CAgCAAACgggAAgAg(SEQ ID NO: 2) 5' Alexa Fluor 488 B1 Amplifier H2 gAggAgggCAgCAAACgggAAgAgTCTT Internal Internal Biotin CCTTTACgCTCTTCCCgTTTgCTgCCCT Biotin and 3'-488 CCTCAAgAAAgAATgC(SEQ ID NO: 3) 3' Alexa Fluor 488 B5 I2 ATATACACTTCATATCACTCACTCCCAA 5' Biotin TCTCTATCTACCC(SEQ ID NO: 4) B5 I2 Thiol ATATACACTTCATATCACTCACTCCCAA 5' Thiol TCTCTATCTACCC(SEQ ID NO: 4) B5 I2 DBCO ATATACACTTCATATCACTCACTCCCAA 5' DBCO TCTCTATCTACCC(SEQ ID NO: 4) B5 Amplifier ATTggATTTgTAgggTAgATAgAgATTg 5' Alexa H1 488 ggAgTgAgCACTTCATATCACTCACTCC Fluor 488 CAATCTCTATCTACCC(SEQ ID NO: 5) B5 Amplifier CTCACTCCCAATCTCTATCTACCCTACA 3' Alexa H2 488 AATCCAATgggTAgATAgAgATTgggAg Fluor 488 TgAgTgATATgAAgTg(SEQ ID NO: 6)
TABLE-US-00002 TABLE 2 Antibodies and Fluorescent reagents Primary antibodies: Epitope Vendor Cat. No. Dilution Incubation Time GFP Thermo Fisher Scientific A10259 1:1000 Overnight at 4.degree. C. for brain sections; 1 h at RT for cultured cells and western blotting Vglut3 Synaptic Systems 135 203 1:1000 48 h at 4.degree. C. for brain sections Tyrosine Hydroxylase (TH) Millipore ab152 1:1000 Overnight at 4.degree. C. for brain sections Choline acetyltransferase (ChAT) Millipore AB144P 1:500 Overnight at 4.degree. C. for brain sections Vasoactive intestinal peptide (VIP) ImmunoStar 20077 1:500 Overnight at 4.degree. C. for brain sections DOPA decarboxylase (AADC) Abcam ab3905 1:500 24 h at 4.degree. C. for brain sections Neuronal nitric oxide synthase (nNOS) Sigma N7280 1:500 Overnight at 4.degree. C. for brain sections GAD67 Millipore MAB5406B 1:1000 Overnight at 4.degree. C. for brain sections NeuN Millipore ABN78 1:1000- Overnight at 4.degree. C. for brain 1:50000 sections c-Fos Santa Cruz sc-166940 1:200 48 h at 4.degree. C. for brain sections FLAG Sigma F1804 1:1000 1 h at RT for cultured cells Salmonella Abcam ab35156 1:1000 1 h at RT for cultured cells HA BioLegend 901505 1:500 1 h at RT for Western blot Substance P Abcam ab7340 1:200 48 h at 4.degree. C. for brain sections Secondary antibodies: Secondary ab. Vendor Label Cat. No. Dilution Incubation Time Goat anti-rabbit Abcam Biotin ab6720 1:1000 2 h at RT for brain sections Donkey anti-mouse Jackson ImmunoResearch Biotin 715-065-151 1:1000 1 h at RT for cultured cells Goat anti-rabbit Jackson ImmunoResearch AF647 111-605-144 1:500 1 h at RT for cultured cells Goat anti-rabbit Jackson ImmunoResearch Cy3 111-165-008 1:500 2 h at RT for brain sections Goat anti-rabbit Jackson ImmunoResearch AF488 111-545-144 1:500 2 h at RT for brain sections Goat anti-mouse Thermo Fisher scientific AF488 a11001 1:500 1 h at RT for cultured cells Goat anti-rabbit Thermo Fisher scientific DNA HCR 31212 5 .mu.g mL.sup.-1 2 h at RT for brain initiators sections; 1 h at RT for Western blot and cultured cells Goat anti-rat Thermo Fisher scientific DNA HCR 31220 5 .mu.g mL.sup.-1 2 h at RT for brain initiators sections; 1 h at RT for Western blot and cultured cells Fluorescent reagents: Name Vendor Label Cat. No. Conc. Incubation Time Streptavidin-AF546 Thermo Scientific Alexa Fluor 546 S-11225 1 .mu.g mL.sup.-1, 1 h at RT for thin 1:500 brain sections Streptavidin-AF488 Jackson ImmunoResearch Alexa Fluor 488 016-540-084 1 .mu.g mL.sup.-1, 1 h at RT 1:500 Streptavidin Sigma-Aldrich N.A. S4762 1 .mu.g mL.sup.-1, 30 min at RT for 1:500 thin brain sections
Example 1
[0095] The isHCR method can dramatically amplify immunofluorescent signals in various types of biological samples.
[0096] FIG. 1(a) shows schematic of the isHCR method using the biotin-streptavidin interaction. DNA-biotin HCR initiators are attached to antibodies and in turn trigger the self-assembly of DNA-fluorophore HCR amplifiers into fluorescent polymers. FIG. 1(b) shows validation with western blotting of purified scFv-GCN4-HA-GB, which was recognized by a biotinylated anti-HA primary antibody and visualized with Alexa Fluor 546-conjugated streptavidin (SA-546) or with Alexa Fluor 546-conjugated HCR amplifiers (isHCR-546). FIG. 1(c) shows that HEK293T cells expressing membrane-bound enhanced GFP (mGFP) were immunostained for GFP using a biotinylated anti-GFP antibody with SA-546 or isHCR-546. FIG. 1(d) shows images of mouse brain sections immunostained against TH using SA-488 (upper panels) or isHCR-488 (lower panels). Right panels show zoomed-in views of the boxed regions. In this and the following figures, the same imaging parameters were used for the comparison of the signal intensities from standard IHC methods and from isHCR, unless otherwise specified. FIG. 1(e) shows a mixture containing equal amounts of Cy3-conjugated secondary antibodies (GAR-Cy3, unamplified) and biotinylated secondary antibodies was used to detect the anti-TH primary antibodies. The signals of the biotinylated secondary antibodies were amplified using isHCR-488. The laser powers were adjusted to produce similar intensity profiles for the two channels. The width of TH-positive neuronal processes was measured using signals from either unamplified or isHCR-amplified channels. An example of two measured fibers is shown. No significant difference of the mean FWHM was observed in either the DS or the PVN (n=196, P=0.1069 for DS; n=256, P=0.8327 for PVN; paired t-test). Error bars indicate s.e.m. Scale bars, 100 .mu.m (c, d right panel), 1 mm (d left panel), 10 .mu.m (e).
Example 2
[0097] Determining the dynamic range for Western blotting using isHCR. Purified scFv-GCN4-HA-GB1 protein was serially diluted.
[0098] FIG. 2 shows that the analyte proteins were recognized by a biotinylated anti-HA primary antibody and visualized with isHCR-546 (a) or a traditional HRP-ECL method (c). The peak intensity area of each lane was calculated and plotted using the signals acquired with short (up panels of a, c) and long (bottom panels of a, c) exposure time. The lanes that contained the lowest amount of analyte protein detected are highlighted in red color. The linear dynamic range using either detection method under each exposure time is plotted using a loge scale and highlighted in blue color (b, d). Note that the isHCR amplification method covers a dynamic range of 7 units (b), whereas the HRP-ECL method covers a range of 4 or 5 units depending on the exposure time (d).
Example 3
[0099] isHCR amplification maintains the spatial resolution of membrane-bound GFP (mGFP) immunosignals in cultured cells.
[0100] FIG. 3 shows that isHCR amplification maintains the spatial resolution of membrane-bound GFP (mGFP) immunosignals in cultured cells. FIG. 3(a) shows that mGFP proteins in HEK293T cells were immunostained and visualized using an antibody mixture that contained equal amounts of Alexa Fluor 488-conjugated secondary antibodies (GAR-488, green) and biotinylated secondary antibodies. The signals of biotinylated secondary antibodies were visualized using isHCR-546 (red). For comparison purpose, images were collected with different parameters to achieve similar intensity profiles for the two channels. FIG. 3(b) shows that a series of straight lines perpendicular to the membrane were drawn as illustrated for (a). The corresponding intensity profiles were plotted. The average intensity of each channel was calculated. The mean intensity of the distance from the cell edge (between -3 .mu.m to -2 .mu.m) was calculated as the baseline (denoted m). The peak value of the curve was determined (denoted p). Half-peak intensity (I) was defined (p+m)/2. The full width at half maximum (FWHM) was quantified as the width of the average intensity curve at I. FIG. 3(c) shows that no significant difference was observed between the FWHM calculated using the data from unamplified and isHCR-amplified samples (n=12; P=0.9163; paired t-test). Error bars indicate s.e.m. Scale bars, 10 .mu.m.
Example 4
[0101] TH immunostaining using isHCR reveals much richer catecholaminergic innervations in the brain.
[0102] FIG. 4 shows TH immunostaining using isHCR reveals much richer catecholaminergic innervations in the brain. FIG. 4 (a) shows confocal images of the TH expression pattern in the VTA, the interpeduncular nucleus (IPN; upper panels), and the superior colliculus (lower panels) in mouse brain sections immunostained against TH using isHCR-488 or SA-488. FIG. 4(b) shows that no immunopositive signals were observed when we omitted the primary antibody. FIG. 4(c) shows images of mouse brain sections immunostained against TH using standard IHC and isHCR. A mixture containing equal amounts of Cy3-conjugated secondary antibodies (GAR-Cy3, unamplified) and biotinylated secondary antibodies was used to detect the anti-TH primary antibodies. The signals of the biotinylated secondary antibodies were amplified using isHCR-488. The signals of unamplified (red) and amplified (green) channels were colocalized. Note that we used different imaging parameters to achieve similar intensity profiles for the two channels. Scale bars, 100 .mu.m (a, b), 50 .mu.m (c).
Example 5
[0103] Optimization of isHCR that reduces background noise.
[0104] FIG. 5 shows that optimization of isHCR reduces background noise. FIG. 5(a) shows the effect of unassembled HCR amplifiers and the addition of graphene oxide (GO) on the background fluorescence level after washing. FIG. 5(b) is a schematic showing that GO adsorbs the single-stranded overhang of HCR amplifiers and quenches the fluorescence of HCR amplifiers that are not assembled into double-stranded polymers. FIG. 5(c) shows in microplate wells, GO quenched the fluorescence of unassembled but not polymerized HCR amplifiers. In the bar plot, ns, not significant; *, P<0.05; ****, P<0.0001; t-test corrected for multiple comparisons using the Holm-Sidak method for analyzing the difference between each group (n=3 replicates). FIG. 5(d) shows images of the anterior cingulate cortex (ACC) in mouse brain sections immunostained against NeuN using isHCR-546 without GO or isHCR-546 with GO. The addition of GO significantly reduced the background signals and enhanced the signal-to-noise ratio (n=3; ns, not significant; *, P<0.05; ***, P<0.005; t-test). FIG. 5(e) shows images of the dorsal raphe nucleus in mouse brain sections immunostained against Vglut3 using SA-546, isHCR-546 without GO, or isHCR-546 with GO. Lower panels show zoomed-in views of boxed regions in the upper panels. The images of SA-546 samples were collected using higher pin hole values, detector gain settings, and laser intensities (higher settings). Error bars indicate s.e.m. in (c and e). Scale bars, 50 .mu.m (a, d, e).
Example 6
[0105] isHCR dramatically increases IHC signals in mouse brain sections.
[0106] FIG. 6(a) shows that mouse brain sections were immunostained against NeuN. Parallel experiments were performed using anti-NeuN primary antibodies with different dilution ratios. The signals were visualized using isHCR-546 (top) or SA-546 (middle and bottom). The images of isHCR-546 and SA-546 samples from the ACC area were acquired using identical microscopy settings. Bottom panels show the higher contrast images of SA-546 samples. FIG. 6(b) shows the quantification of the signal intensity in three regions of the samples in FIG. 6(a). The signal intensity of isHCR-amplified samples was significantly higher than that of unamplified SA-546 samples. * P<0.05; ** P<0.01; *** P<0.001; **** P<0.0001; unpaired t-test. (c) The amplification factors of isHCR-546 vs. SA-546 at different antibody dilutions. Error bars indicate s.e.m. in (b and c). Scale bar, 100 .mu.m.
Example 7
[0107] isHCR specifically amplifies Vglut3 immunosignals in mouse brain sections.
[0108] FIG. 7 shows that isHCR specifically amplifies Vglut3 immunosignals in mouse brain sections. FIG. 7(a) indicates confocal images of the medial raphe nucleus in mouse brain sections immunostained against Vglut3 using isHCR-546 or SA-546. For isHCR-546, graphene oxide (GO) was mixed with HCR amplifiers to quench the background fluorescence. FIG. 7(b) shows that no Vglut3-immunopositive signals were observed in brain sections with the primary antibody omitted (upper panel) or in the brain sections of Vglut3-/- mice immunostained using isHCR-546 (lower panel). FIG. 7(c) shows the quantification of data from brain section samples immunostained against Vglut3 using SA-546, isHCR546 without GO, or isHCR with GO (n=3 brain sections for each group; P<0.0001; Kolmogorov-Smirnov test). FIG. 7(d) shows comparison between isHCR and standard IHC. A mixture containing equal amounts of Alexa Fluor 488-conjugated secondary antibodies (GAR-488) and biotinylated secondary antibodies was used to detect the anti-Vglut3 primary antibodies. The signals of the biotinylated secondary antibodies were amplified using isHCR-546. The signals of unamplified (green) and amplified (red) channels were colocalized. FIG. 7(e) shows that the mean diameter of Vglut3-positive puncta was measured using the data from unamplified and isHCR-amplified samples. A representative measured punctum is shown. A straight line across the punctum was drawn and rotated using the punctum as the center of rotation. For every 6 degrees, the intensity profile along the line of both the unamplified and isHCR-amplified channel was plotted. The average intensity of each channel was calculated, and baseline correction was then applied. The corrected average intensity of each channel was fit to a Gaussian distribution with a non-linear least square method. FWHM was calculated with the equation: FWHM=2 {square root over (2in2)}.sigma., where .sigma. is the standard deviation of the fitted Gaussian curve. The results of FWHM for the two channels were compared. No difference of the mean diameter of Vglut3-positive puncta was observed (n=20; P=0.1846; paired t-test). Error bars indicate s.e.m. in (e). Scale bars, 100 .mu.m (a, b), 50 .mu.m (d), 10 .mu.m (e).
Example 8
[0109] isHCR effectively amplifies various immunofluorescence signals.
[0110] FIG. 8 shows that mouse brain sections were immunostained for (a) vasoactive intestinal peptide (VIP; a neuropeptide), (b) neuronal nitric oxide synthase (nNOS; a cytosolic enzyme), or (c) aromatic L-amino acid decarboxylase (AADC; an enzyme in axon terminals) using isHCR-546 or SA-546. Scale bars, 100 .mu.m (a, b), 500 .mu.m (c).
Example 9
[0111] isHCR enables the detection of biomolecules that are challenging for a standard IHC method.
[0112] FIG. 9(a) shows wide-field images of mouse brain sections immunostained against GAD67 using a biotinylated monoclonal primary antibody. The signals were visualized with isHCR-546 (top) or SA-546 (bottom). FIG. 9(b) indicates high-power confocal images showing GAD67 immunoreactivity in boxed areas in FIG. 9(a). The images of SA-546 and isHCR-546 samples were collected using identical microscopy settings. The right panels show images of the same regions in the middle panels collected using higher settings. FIG. 9(c) shows images of HeLa cells infected with S. Typhimurium. SteA-FLAG mutant strain (top and bottom) and wild-type strain (middle) were used. The detection of FLAG-tagged SteA was achieved using isHCR-488 (up). No specific signal was observed using a standard IHC method (unamplified, Donkey anti-mouse, DAM-488, bottom) or in HeLa cells samples infected with wild-type S. Typhimurium (middle). Scale bars, 1 mm (a), 100 .mu.m (b), 10 .mu.m (c).
Example 10
[0113] isHCR amplification enables the detection of low-abundance proteins.
[0114] FIG. 10 shows that isHCR amplification enables the detection of low-abundance proteins. FIG. 10(a) shows images of mouse brain sections immunostained against c-Fos using a monoclonal antibody. The signals were visualized using isHCR-546 or SA-546. The left panel shows the images of the mice that explored the enriched environment. The right panel shows the images of the control mice that were not allowed to explore the enriched environment. FIG. 10(b) shows images of HeLa cells infected with SopD2-FLAG S. Typhimurium mutant strain. The detection of FLAG-tagged SopD2 was achieved using isHCR-488 (up) but not the standard IHC using Alexa Fluor 488-labeled secondary antibody (unamplified, Donkey anti-mouse, DAM-488, bottom). FIG. 10(c) shows that no specific signal was detected in HeLa cells that were not infected by S. Typhimurium. Scale bar, 50 .mu.m (a), 10 .mu.m (b, c).
Example 11
[0115] HCR initiators can be conjugated directly onto antibodies using chemical linkers.
[0116] FIG. 11(a) shows schematic of the direct conjugation of HCR initiators and IgGs. FIG. 11(b) shows mouse brain sections immunostained against DAT using HCR initiator-conjugated secondary antibodies. The HCR initiators were conjugated onto antibodies using SMCC as linkers. The signals were amplified using isHCR-546. FIG. 11(c) shows images of HEK 293T cells immunostained against the nuclear protein Ki67 using HCR initiator-conjugated secondary antibodies. The HCR initiators were conjugated onto antibodies using NHS-Azide as linkers. The signals were amplified using isHCR-488. Scale bar, 500 .mu.m (b), 10 .mu.m (c).
[0117] Experimental Results
[0118] As shown in Table 3, the present isHCR using various reagents, antibodies and amplifier with different modification not only dramatically enhances the detection of analyte proteins in western blotting, but also dramatically enhances the performance of IHC in cultured cell samples and in tissue section samples. In addition, the present improved isHCR with GO achieves high-level amplification with low background noise in IHC in tissue section samples. In particular, the present improved isHCR with GO significantly enhances the detection of a vesicular transporter, successfully enhances various immunofluorescence signals, dramatically enhances the performance of monoclonal antibodies in IHC, and enables the detection of bacterial effectors that are translocated in vivo.
TABLE-US-00003 TABLE 3 Summary of Experimental Results Antibodies and Reagents used in Examples Figures and Examples Effects and Results Streptavidin, Streptavidin-AF546, B1 I2, B1 Amplifier FIG. 1b and FIG. 2 isHCR dramatically enhances the H1 546, B1 Amplifier H2 546, anti-HA antibody (Examples 1 and 2) detection of analyte proteins in western blotting. Streptavidin, Streptavidin-AF546, B1 I2, B1 Amplifier FIG. 1c and FIG. 3. isHCR dramatically enhances the H1 546, B1 Amplifier H2 546, anti-GFP antibody, (Examples 1 and 3) performance of IHC in cultured cell biotinylated goat anti-rabbit antibody, AF488-goat anti- samples. rabbit antibody Streptavidin, Streptavidin-AF546, B1 I2, B1 Amplifier FIG. 1d, e and FIG. 4 isHCR dramatically enhances the H1 546, B1 Amplifier H2 546, B5 I2, B5 Amplifier H1 (Examples 1 and 4) performance of IHC in tissue section 488, B5 Amplifier H2 488, anti-TH antibody, samples. biotinylated goat anti-rabbit antibody, Cy3-goat anti- rabbit antibody B1 I2, B1 Amplifier H1 546, B1 Amplifier H2 546, GO FIG. 5a, c GO significantly reduces the (Example 5) background signals of isHCR amplification. Streptavidin, Streptavidin-AF546, B1 I2, B1 Amplifier FIG. 2d and FIG. 6 The improved isHCR with GO H1 546, B1 Amplifier H2 546, anti-NeuN antibody, (Examples 2 and 6) achieves high-level amplification GO, biotinylated goat anti-rabbit antibody with low background noise in IHC in tissue section samples. Streptavidin, Streptavidin-AF546, B1 I2, B1 Amplifier FIG. 5e and FIG. 7 The improved isHCR with GO H1 546, B1 Amplifier H2 546, anti-Vglut3 antibody, (Examples 5 and 7) significantly enhances the detection GO, biotinylated goat anti-rabbit antibody, AF488-goat of a vesicular transporter (Vglut3), anti-rabbit antibody which is difficult for traditional IHC method. Streptavidin, Streptavidin-AF546, B1 I2, B1 Amplifier FIG. 8 The improved isHCR with GO H1 546, B1 Amplifier H2 546, GO, anti-VIP antibody, (Example 8) successfully enhances various anti-AADC antibody, anti-nNOS antibody, biotinylated immunofluorescence signals. goat anti-rabbit antibody Streptavidin-AF546, B1 I2, B1 Amplifier H1 546, B1 FIG. 9a and FIG. 10a The improved isHCR with GO Amplifier H2 546, GO, anti-GAD67 antibody, anti-c- (Examples 9 and 10) dramatically enhances the Fos antibody, biotinylated donkey anti-mouse antibody. performance of monoclonal antibodies in IHC. Streptavidin, Streptavidin-AF546, B1 I2, B1 Amplifier FIG. 9c and FIG. 10b, c The improved isHCR with GO H1 546, B1 Amplifier H2 546, GO, anti-FLAG (Examples 9 and 10) enables the detection of bacterial antibody, anti-Salmonella antibody, biotinylated effectors that are translocated in vivo. donkey anti-mouse antibody, Cy3-goat anti-rabbit antibody, AF647-goat anti-rabbit antibody, AF488- anti-mouse antibody. Goat anti-rabbit antibody, Goat anti-rat antibody, FIG. 11 The direct conjugation of isHCR SMCC linker, NHS-azide linker, B1 I2 Thiol, B5 I2 (Example 11) initiators with IgGs through chemical Thiol, B1 I2 DBCO, B5 I2 DBCO linkers allows rapid amplification of immunosignals Streptavidin, Goat anti-rat antibody, anti-substance P FIG. 12 Multi-round amplification using antibody, B1 Amplifier H1 Terminal Biotin, B1 (Example 12) isHCR.sup.n Amplifier H2 Terminal Biotin, B1 Amplifier H1 Internal Biotin, B1 Amplifier H2 Internal Biotin, B1 Amplifier H1 Internal Biotin and 5'-488, B1 Amplifier H2 Internal Biotin and 3'-488, B1 Amplifier H1 546, B1 Amplifier H2 546, B1 I2
Example 12
[0119] Multi-round amplification using isHCR.sup.n.
[0120] FIG. 12 (a) shows schematic overview of isHCR.sup.n. The initial and branching rounds use DNA-biotin HCR amplifiers for additional attachment of HCR initiators. The final round uses DNA-fluorophore HCR amplifiers to visualize the signals. (b) Western blots of purified scFv-GCN4-HA-GB1 protein after one or three rounds of isHCR (isHCR.sup.1 vs. isHCR.sup.3). (c) In order to evaluate the accessibility of biotin groups on the amplification polymers, we performed immunostaining against TH on brain sections using isHCR.sup.n. We tested the performance of two pairs of amplifiers with biotin attached at either an internal or the terminal site. After each round of amplification, SA-546 was applied to detect the biotin groups. Tagging biotin at the internal position led to substantially higher amplification efficiency than at the terminal site. (d) Mouse brain sections were immunostained against TH. The signals were first amplified by isHCR using biotin and Alexa-fluor-488 dual-labeled HCR amplifiers, and then further amplified by an additional round of isHCR using Alexa-fluor-546 labeled HCR amplifiers. The signals of the first and second round of amplification were colocalized. We used different imaging parameters to achieve similar intensity profiles for the two channels. (e) The width of TH-positive neuronal processes was measured using signals from either isHCR.sup.1-488 or isHCR.sup.2-546 channels. An example of a measured fiber is shown. No significant difference of the mean FWHM was observed (n=50; P=0.7119; paired t-test). (f) Images of mouse brain slices immunostained against substance P without amplification (SA-546) or with 1-3 rounds of amplification (isHCR.sup.1-546, isHCR.sup.2-546, and isHCR.sup.3-546). (g) Mouse brain sections were immunostained against substance P using isHCR.sup.3. Multi-round amplification by isHCR.sup.3 revealed a patchy distribution of substance P in the striatum. The right panel shows the zoomed-in image of the boxed region at the left. Error bars indicate s.e.m. in (e). Scale bars, 500 .mu.m (c, f, g left), 100 .mu.m (g right), 50 .mu.m (d), 10 .mu.m (e).
Sequence CWU 1
1
6141DNAArtificial SequenceSynthesized Probe 1atatagcatt ctttcttgag
gagggcagca aacgggaaga g 41272DNAArtificial SequenceSynthesized
Amplifier 2cgtaaaggaa gactcttccc gtttgctgcc ctcctcgcat tctttcttga
ggagggcagc 60aaacgggaag ag 72372DNAArtificial SequenceSynthesized
Amplifier 3gaggagggca gcaaacggga agagtcttcc tttacgctct tcccgtttgc
tgccctcctc 60aagaaagaat gc 72441DNAArtificial SequenceSynethesized
Probe 4atatacactt catatcactc actcccaatc tctatctacc c
41572DNAArtificial SequenceSynthesized Amplifier 5attggatttg
tagggtagat agagattggg agtgagcact tcatatcact cactcccaat 60ctctatctac
cc 72672DNAArtificial SequenceSynthesized Amplifier 6ctcactccca
atctctatct accctacaaa tccaatgggt agatagagat tgggagtgag 60tgatatgaag
tg 72
D00000
D00001
D00002
D00003
D00004
D00005
D00006
D00007
D00008
D00009
D00010
D00011
D00012

S00001
XML
uspto.report is an independent third-party trademark research tool that is not affiliated, endorsed, or sponsored by the United States Patent and Trademark Office (USPTO) or any other governmental organization. The information provided by uspto.report is based on publicly available data at the time of writing and is intended for informational purposes only.
While we strive to provide accurate and up-to-date information, we do not guarantee the accuracy, completeness, reliability, or suitability of the information displayed on this site. The use of this site is at your own risk. Any reliance you place on such information is therefore strictly at your own risk.
All official trademark data, including owner information, should be verified by visiting the official USPTO website at www.uspto.gov. This site is not intended to replace professional legal advice and should not be used as a substitute for consulting with a legal professional who is knowledgeable about trademark law.