Biomarker Proxy Tests And Methods For Standard Blood Chemistry Tests
Huentelman; Matthew ; et al.
U.S. patent application number 16/763553 was filed with the patent office on 2020-09-03 for biomarker proxy tests and methods for standard blood chemistry tests. The applicant listed for this patent is THE TRANSLATIONAL GENOMICS RESEARCH INSTITUTE. Invention is credited to Matthew Huentelman, Timothy McDaniel, Marcus Naymik.
| Application Number | 20200277669 16/763553 |
| Document ID | / |
| Family ID | 1000004853119 |
| Filed Date | 2020-09-03 |


View All Diagrams
| United States Patent Application | 20200277669 |
| Kind Code | A1 |
| Huentelman; Matthew ; et al. | September 3, 2020 |
BIOMARKER PROXY TESTS AND METHODS FOR STANDARD BLOOD CHEMISTRY TESTS
Abstract
The present disclosure relates to alternative methods of conducting standard blood chemistry tests, the methods typically comprising: extracting an RNA from a blood sample, determining a mRNA level of a predictive gene in the blood sample, and converting the mRNA level of the predictive gene into the blood test result of the target blood component. The present disclosure also relates to blood test for performing the proxy methods. The blood test includes a plasmid with at least an exon of a predictive gene, a reagent for detecting a mRNA level of the predictive gene, and a reagent for detecting a mRNA level of a housekeeping gene.
| Inventors: | Huentelman; Matthew; (Phoenix, AZ) ; McDaniel; Timothy; (Phoenix, AZ) ; Naymik; Marcus; (Phoenix, AZ) | ||||||||||
| Applicant: |
|
||||||||||
|---|---|---|---|---|---|---|---|---|---|---|---|
| Family ID: | 1000004853119 | ||||||||||
| Appl. No.: | 16/763553 | ||||||||||
| Filed: | November 15, 2018 | ||||||||||
| PCT Filed: | November 15, 2018 | ||||||||||
| PCT NO: | PCT/US2018/061394 | ||||||||||
| 371 Date: | May 12, 2020 |
Related U.S. Patent Documents
| Application Number | Filing Date | Patent Number | ||
|---|---|---|---|---|
| 62586301 | Nov 15, 2017 | |||
| Current U.S. Class: | 1/1 |
| Current CPC Class: | C12Q 2600/158 20130101; C12Q 1/6869 20130101; C12Q 1/6881 20130101 |
| International Class: | C12Q 1/6869 20060101 C12Q001/6869; C12Q 1/6881 20060101 C12Q001/6881 |
Claims
1. A method of performing a blood test, comprising: extracting an RNA from a blood sample; selecting a predictive gene, wherein a mRNA level of the predictive gene in the blood sample relates to a target blood component; determining the mRNA level of the predictive gene in the blood sample; and converting the mRNA level into a blood test result of the target blood component.
2. The method of claim 1, wherein the blood sample is selected from the group consisting of: whole blood, plasma, and a dried blood spot.
3. The method of claim 2, wherein the blood sample is whole blood.
4. The method of claim 2, wherein the blood sample is the dried blood spot.
5. The method of claim 4, further comprising determining the quality of the dried blood spot and selecting the predictive gene based on the quality.
6. The method of any one of claims 1-5, wherein the blood sample has a volume of between 30 .mu.l and 1 ml.
7. The method of claim 6, wherein the blood sample has a volume of between 30 .mu.l and 100 .mu.l.
8. The method of any one of claims 1-7, wherein the mRNA level is determined using RNA sequencing, quantitative PCR, or hybridization.
9. The method of claim 8, wherein the mRNA level is determined using next-generation sequencing and normalized to a normalized gene count using a DESeq2 algorithm.
10. The method of any one of claims 1-10, wherein the blood test result is reported as: an amount of the target blood component, a concentration of the target blood component; a volume of the target blood component, a distribution of the target blood component; a ratio between the target blood component and a second target blood component; or combinations thereof.
11. The method of any one of claims 1-10, wherein the blood sample is whole blood, plasma, dried blood spot, or combinations thereof, and the target blood component is Segmented Neutrophils, Eosinophils, Prostate-Specific Antigen, red blood cells, monocytes, creatinine, lymphocytes, eosinophil, alanine aminotransferase, electrolytes, non-HDL cholesterol, or combinations thereof.
12. The method of any one of claims 1-10, wherein the blood sample is whole blood, plasma, dried blood spot, or combinations thereof, and the blood test is selected from the group consisting of: Prostate-Specific Antigen (PSA_total), Red Blood Cell count (RBC_m.mm3), Absolute Eosinophil, Anion Gap (AG), red cell distribution width (RDW_sd), and Thyroid Index (T7).
13. The method of any one of claims 1-12, wherein converting the mRNA level into the blood test result uses the following formula: blood test result=C+C.sub.1*(gene), C and C.sub.1 are constants, and (gene) represents the normalized gene count of the predictive gene.
14. The method of any one of claims 1-12, wherein converting the mRNA level into the blood test result uses the following formula: blood test result=C+C.sub.1*(gene.sub.1)+C.sub.2*(gene.sub.2)+ . . . +C.sub.n*(gene.sub.n), n is 1, 2, 3, 4, or 5, C, C.sub.1, C.sub.2, . . . and C.sub.n are constants, and (gene.sub.1), (gene.sub.2), . . . , and (gene.sub.n) represent the normalized gene count of gene.sub.1, gene.sub.2, . . . , and gene.sub.n.
15. The method of claim 13, wherein the blood sample is whole blood, the target blood component is Segmented Neutrophils, and the predictive gene is selected from the group consisting of: MNDA, STX3, TNFRSF1A, MSL1, and TLR1.
16. The method of claim 15, wherein C is between 27.9 and 34.1, and C.sub.1 is between 27.5 and 33.6 for MNDA; C is between 29.8 and 36.4, and C.sub.1 is between 25.6 and 31.3 for STX3; C is between 26.8 and 32.7, and C.sub.1 is between 28.6 and 35.0 for TNFRSF1A; C is between 25.9 and 31.6, and C.sub.1 is between 29.5 and 36.0 for MSL1; and C is between 32.1 and 39.2, and C.sub.1 is between 23.3 and 28.5 for TLR1.
17. The method of claim 13, wherein the blood sample is whole blood, the target blood component is Eosinophils, and the predictive gene is selected from the group consisting of: SLC29A1, SIGLEC8, IL5RA, TMIGD3, and SMPD3.
18. The method of claim 17, wherein C is between -0.48 and -0.39, and C.sub.1 is between 2.81 and 3.44 for SLC29A1; C is between 0.43 and 0.53, and C.sub.1 is between 2.0 and 2.5 for SIGLEC8; C is between -0.105 and -0.086, and C.sub.1 is between 2.5 and 3.1 for IL5RA; C is between -0.00088 and -0.00072, and C.sub.1 is between 2.4 and 2.9 for TMIGD3; and C is between 0.14 and 0.17, and C.sub.1 is between 2.3 and 2.8 for SMPD3.
19. The method of claim 13, wherein the blood sample is the dried blood spot, the blood test is PSA_total, and the predictive gene is selected from the group consisting of: CTC-265F19.1, ADAM9, RAB11FIP5, SNAPC4, and LMNA.
20. The method of claim 19, wherein C is between 0.39 and 0.48, and C.sub.1 is between 0.47 and 0.58 for CTC-265F19.1; C is between 0.39 and 0.48, and C.sub.1 is between 1.5 and 1.9 for ADAM9; C is between 0.40 and 0.49, and C.sub.1 is between 0.53 and 0.65 for RAB11FIP5; C is between 0.40 and 0.49, and C.sub.1 is between 0.55 and 0.67 for SNAPC4; and C is between 0.37 and 0.45, and C.sub.1 is between 0.31 and 0.38 for LMNA.
21. The method of claim 13, wherein the blood sample is the dried blood spot, the target blood component is Eosinophils, and the predictive gene is selected from the group consisting of: SCARNA22, SNORA36C, SNORA11, RN7SL4P, and SNHG15.
22. The method of claim 21, wherein C is between 1.2 and 1.4, and C.sub.1 is between 1.4 and 1.7 for SCARNA22; C is between 1.2 and 1.5, and C.sub.1 is between 1.3 and 1.6 for SNORA36C; C is between 1.1 and 1.4, and C.sub.1 is between 1.3 and 1.6 for SNORA11; C is between 1.0 and 1.2, and C.sub.1 is between 1.4 and 1.7 for RN7SL4P; and C is between 1.3 and 1.5, and C.sub.1 is between 1.2 and 1.5 for SNHG15.
23. The method of claim 13, wherein the blood sample is plasma, the blood test is PSA_total, and the predictive gene is selected from the group consisting of: HNRNPA3P3, GTF3A, RP11-342M1.6, HNRNPLP2, and RPS11P5.
24. The method of claim 23, wherein C is between 0.19 and 0.23, and C.sub.1 is between 0.42 and 0.52 for HNRNPA3P3; C is between -0.41 and -0.34, and C.sub.1 is between 0.9 and 1.1 for GTF3A; C is between 0.36 and 0.44, and C.sub.1 is between 0.29 and 0.36 for RP11-342M1.6; C is between 0.30 and 0.36, and C.sub.1 is between 0.29 and 0.35 for HNRNPLP2, and C is between 0.22 and 0.27, and C.sub.1 is between 0.44 and 0.54 for RPS11P5.
25. The method of claim 13, wherein the blood sample is plasma, the target blood component is red blood cells, the blood test is red blood cell count (RBC_m.mm3), and the predictive gene is selected from the group consisting of: UTY, DDX3Y, ZFY, TXLNGY, and RPS4Y1.
26. The method of claim 25, wherein C is between 4.0 and 4.9, and C.sub.1 is between 0.31 and 0.38 for UTY; C is between 4.0 and 4.9, and C.sub.1 is between 0.30 and 0.37 for DDX3Y; C is between 4.0 and 4.9, and C.sub.1 is between 0.30 and 0.36 for ZFY; C is between 4.1 and 5.0, and C.sub.1 is between 0.29 and 0.36 for TXLNGY; and C is between 4.1 and 5.0, and C.sub.1 is between 0.29 and 0.35 for RPS4Y1.
27. The method of claim 14, wherein the blood sample is whole blood, the target blood component is Segmented Neutrophils, gene.sub.1 is RNF24, gene.sub.2 is MNDA, gene.sub.3 is WIPF1, C is between 25.4 and 31.0, C.sub.1 is between 5.9 and 7.3, C.sub.2 is between 9.5 and 11.7, and C.sub.3 is between 14.9 and 18.2.
28. The method of claim 14, wherein the blood sample is whole blood, the target blood component is lymphocytes, gene.sub.1 is GRB2, gene.sub.2 is MNDA, gene.sub.3 is NFAM1, C is between 55.2 and 67.5, C.sub.1 is between -15.9 and -13.0, C.sub.2 is between -9.4 and -7.7, and C.sub.3 is between -11.0 and -9.0.
29. The method of claim 14, wherein the blood sample is whole blood, the target blood component is monocytes, gene.sub.1 is NAGA, gene.sub.2 is RIN2, gene.sub.3 is ADA2, gene.sub.4 is PLXNB2, gene.sub.5 is ANXA2, C is between -1.6 and -1.3, C.sub.1 is between 2.4 and 2.9, C.sub.2 is between 2.9 and 3.5, C.sub.3 is between 3.8 and 4.6, C.sub.4 is between -3.3 and -2.7, and C.sub.5 is between 1.5 and 1.9.
30. The method of claim 14, wherein the blood sample is plasma, the target blood component is eosinophil, the blood test is Absolute Eosinophil, gene.sub.1 is CLC, gene.sub.2 is ADAT1, gene.sub.3 is SNRPEP4, gene.sub.4 is GPC6, C is between 0.0027 and 0.0033, C.sub.1 is between 0.052 and 0.064, C.sub.2 is between 0.100 and 0.122, C.sub.3 is between -0.030 and -0.024, and C.sub.4 is between 0.015 and 0.019.
31. The method of claim 14, wherein the blood sample is plasma, the target blood component is electrolytes, the blood test is Anion Gap (AG), gene.sub.1 is DHX40, gene.sub.2 is SLC1A4, gene.sub.3 is IMPA2, gene.sub.4 is KATNA1, gene.sub.5 is MEIS3P1, C is between 7.6 and 9.3, C.sub.1 is between 2.2 and 2.7, C.sub.2 is between -1.1 and -0.9, C.sub.3 is between 1.1 and 1.4, C.sub.4 is between 1.5 and 1.8, and C.sub.5 is between 0.46 and 0.56.
32. The method of claim 14, wherein the blood sample is plasma, the target blood component is Segmented Neutrophils, gene.sub.1 is RXFP1, gene.sub.2 is POLR3GL, gene.sub.3 is FOXK2, gene.sub.4 is LAMB, C is between 52.7 and 64.4, C.sub.1 is between 1.9 and 2.3, C.sub.2 is between -6.0 and -4.9, C.sub.3 is between 4.6 and 5.6, and C.sub.4 is between 2.0 and 2.4.
33. The method of claim 14, wherein the blood sample is whole blood or plasma, the target blood component red blood cells, the blood test is red blood cell distribution width (RDW_sd), gene.sub.1 is CHCHD2P6 from plasma, gene.sub.2 is SEC63P1 from plasma, gene.sub.3 is DNAL1 from whole blood, gene.sub.4 is ENSG00000197262 from whole blood, C is between 33.7 and 41.2, C.sub.1 is between 1.3 and 1.6, C.sub.2 is between 1.3 and 1.6, C.sub.3 is between 2.9 and 3.6, and C.sub.4 is between 1.1 and 1.3.
34. The method of claim 14, wherein the blood sample is whole blood or plasma, the blood test is Thyroid Index (T7.Index), gene.sub.1 is IGHV3-33 from whole blood, gene.sub.2 is ZNF266 from whole blood, gene.sub.3 is CCDC183-AS1 from whole blood, gene.sub.4 is ENSG00000232745 from plasma, C is between 2.4 and 3.0, C.sub.1 is between -0.17 and -0.14, C.sub.2 is between -0.84 and -0.69, C.sub.3 is between 0.27 and 0.33, and C.sub.4 is between -0.14 and -0.11.
35. The method of claim 14, wherein the blood sample is dried blood spot, the target blood component is alanine aminotransferase, gene.sub.1 is EIF1AY, gene.sub.2 is SRXN1, gene.sub.3 is NDUFAF2, gene.sub.4 is TBCE, C is between 17.1 and 20.9, C.sub.1 is between 3.3 and 4.1, C.sub.2 is between 2.7 and 3.3, C.sub.3 is between 3.9 and 4.7, and C.sub.4 is between -6.1 and -5.0.
36. The method of claim 14, wherein the blood sample is the dried blood spot, the target blood component is Eosinophils, gene.sub.1 is SCARNA22, gene.sub.2 is TET3, C is between 0.77 and 0.94, C.sub.1 is between 0.85 and 1.04, and C.sub.2 is between 0.78 and 0.95.
37. The method of claim 14, wherein the blood sample is the dried blood spot, the target blood component is Segmented Neutrophils, gene.sub.1 is HMGB1P1, gene.sub.2 is CSRNP1, gene.sub.3 is CCNJL, C is between 50.2 and 61.4, C.sub.1 is between 2.5 and 3.1, C.sub.2 is between 2.5 and 3.1, and C.sub.3 is between 2.2 and 2.7.
38. The method of claim 14, wherein the blood sample is high-quality dried blood spot, the target blood component is non-HDL cholesterol, gene.sub.1 is BMT2, gene.sub.2 is PKD1P5, gene.sub.3 is ARIH1, C is between 171 and 209, C.sub.1 is between -44 and -36, C.sub.2 is between 22.3 and 27.3, and C.sub.3 is between -40 and -33.
39. The method of claim 14, wherein the blood sample is high-quality dried blood spot, the target blood component is Eosinophils, gene.sub.1 is NDUFA5, gene.sub.2 is MCM8, C is between 1.5 and 1.8, C.sub.1 is between 0.59 and 0.72, and C.sub.2 is between -1.0 and -0.8.
40. The method of claim 14, wherein the blood sample is high-quality dried blood spot, the target blood component is Segmented Neutrophils, gene.sub.1 is AKAP12, gene.sub.2 is APP, C is between 3.1 and 3.8, C.sub.1 is between 1.3 and 1.6, and C.sub.2 is between 2.1 and 2.6.
41. The method of claim 14, wherein the blood sample is whole blood, the target blood component is lymphocytes, gene.sub.1 is EVI2B, gene.sub.2 is NFAM1, C is between 51.1 and 62.4, C.sub.1 is between -17.5 and -14.3, and C.sub.2 is between -13.6 and -11.1.
42. The method of claim 14, wherein the blood sample is whole blood, the target blood component is monocytes, gene.sub.1 is RIN2, gene.sub.2 is ADA2, C is between -0.17 and -0.14, C.sub.1 is between 3.5 and 4.3, and C.sub.2 is between 3.2 and 3.9.
43. The method of claim 14, wherein the blood sample is whole blood, the target blood component is Segmented Neutrophils, gene.sub.1 is RNF24, gene.sub.2 is MNDA, gene.sub.3 is TLR1, and C is between 32.1 and 39.3, C.sub.1 is between 8.0 and 9.7, C.sub.2 is between 8.8 and 10.7, and C.sub.3 is between 6.7 and 8.2.
44. A blood test, comprising: a plasmid comprising an exon of a predictive gene, wherein a mRNA level of the predictive gene in the blood sample relates to a target blood component; a first reagent for detecting the mRNA level of the predictive gene, the first reagent comprising a primer or a probe hybridizing to the exon of the predictive gene; and a second reagent for detecting a mRNA level of a housekeeping gene, the second reagent comprising a primer or a probe hybridizing to the exon of the housekeeping gene.
45. The blood test of claim 44, wherein the housekeeping gene is selected from the group consisting of: glyceraldehyde-3-phosphate dehydrogenase (GAPDH), ACTB actin, beta2-microglobulin (B2M), Porphobilinogen deaminase (HMBS), and Peptidylprolyl Isomerase B (PPIB).
46. The blood test of claim 44 or 45, wherein the target blood component is selected from the group consisting of: Segmented Neutrophils, Eosinophils, Prostate-Specific Antigen, red blood cells, monocytes, creatinine, lymphocytes, eosinophil, alanine aminotransferase, electrolytes, and non-HDL cholesterol.
47. The blood test of claim 44 or 45, wherein the blood test is selected from the group consisting of: Prostate-Specific Antigen (PSA_total), Red Blood Cell count (RBC_m.mm3), Absolute Eosinophil, Anion Gap (AG), red cell distribution width (RDW_sd), and Thyroid Index (T7).
48. The blood test of claim 46, wherein the target blood component is Segmented Neutrophils, and the predictive gene is selected from the group consisting of: MNDA, STX3, TNFRSF1A, MSL1, TLR1, RNF24, WIPF1, RXFP1, POLR3GL, FOXK2, LAMB1, HMGB1P1, CSRNP1, CCNJL, AKAP12, and APP.
49. The blood test of claim 46, wherein the target blood component is Eosinophils, and the predictive gene is selected from the group consisting of: SLC29A1, SIGLEC8, IL5RA, TMIGD3, SMPD3, SCARNA22, SNORA36C, SNORA11, RN7SL4P, SNHG15, TET3, NDUFA5, and MCM8.
50. The blood test of claim 47, wherein the blood test is PSA_total, and the predictive gene is selected from the group consisting of: CTC-265F19.1, ADAM9, RAB11FIP5, SNAPC4, LMNA, HNRNPA3P3, GTF3A, RP11-342M1.6, HNRNPLP2, and RPS11P5.
51. The blood test of claim 47, wherein the blood test is Red Blood Cell count (RBC_m.mm3), and the predictive gene is selected from the group consisting of: UTY, DDX3Y, ZFY, TXLNGY, and RPS4Y1.
52. The blood test of claim 46, wherein the target blood component is lymphocytes, and the predictive gene is selected from the group consisting of: GRB2, MNDA, NFAM1, and EVI2B.
53. The blood test of claim 46, wherein the target blood component is monocytes, and the predictive gene is selected from the group consisting of: NAGA, RIN2, ADA2, PLXNB2, and ANXA2.
54. The blood test of claim 47, wherein the blood test is Absolute Eosinophil, and the predictive gene is selected from the group consisting of: CLC, ADAT1, SNRPEP4, and GPC6.
55. The blood test of claim 47, wherein the blood test is Anion Gap (AG), and the predictive gene is selected from the group consisting of: DHX40, SLC1A4, IMPA2, KATNA1, and MEIS3P1.
56. The blood test of claim 47, wherein the blood test is red blood cell distribution width (RDW_sd), and the predictive gene is selected from the group consisting of: CHCHD2P6, SEC63P1, DNAL1, and ENSG00000197262.
57. The blood test of claim 47, wherein the blood test is Thyroid Index (T7.Index), and the predictive gene is selected from the group consisting of: IGHV3-33, ZNF266, CCDC183-AS1, and ENSG00000232745.
58. The blood test of claim 46, wherein the target blood component is alaine aminotransferase, and the predictive gene is selected from the group consisting of: EIF1AY, SRXN1, NDUFAF2, and TBCE.
59. The blood test of claim 46, wherein the target blood component is non-HDL cholesterol, and the predictive gene is selected from the group consisting of: BMT2, PKD1P5, and ARIH1.
Description
CROSS-REFERENCE TO RELATED APPLICATIONS
[0001] This application claims the benefit of U.S. Provisional Patent Application No. 62/586,301, filed on Nov. 15, 2017, the contents of which are incorporated herein by reference in its entirety.
FIELD OF THE INVENTION
[0002] The present disclosure relates to blood tests and proxy methods of conducting standard blood tests using genetic markers, for example, a complete blood count, comprehensive metabolic panel, chemistry panel, and thyroid-related blood tests (thyroxine, T3, and TSH levels).
BACKGROUND OF THE INVENTION
[0003] Blood tests offer a variety of information for the diagnosis of diseases or conditions or maintenance of a subject's health. A well-chosen complement of blood tests, such as a complete blood count panel, comprehensive metabolic panel, or chemistry panel, can thoroughly assess one's overall state of health, as well as detect the silent warning signals that precede the development of serious diseases such as diabetes and heart disease. However, the current technology for conducting blood tests requires more than a few drops of blood. These tests require venipuncture to obtain cells and extracellular fluid (plasma) from the body for analysis. Although minimally invasive, venipuncture still requires a technician, and thus these tests cannot be performed without visiting a laboratory, whether one within a hospital or clinic or a standalone testing site. Another limitation of these tests is that for each test conducted, often at least one tube of blood collection required. For example, if a patient has orders for a complete blood count panel, comprehensive metabolic panel, and thyroid-related tests, it can require the collection of four tubes of blood. With the increased frequency of blood test monitoring, the subject can develop iatrogenic anemia, which is low red blood cell counts due to too much removal of blood. The amount of blood collected and the need to visit a laboratory for blood collection are significant obstacles for greater use of these tests as monitors of one's state of health. Thus, more convenient alternatives for obtaining the same results as standard blood tests are needed.
SUMMARY OF THE INVENTION
[0004] One aspect of the invention is directed to a method of performing a blood test. The method of performing the blood test generally includes extracting RNA from a blood sample; determining an mRNA level associated with a predictive gene in the blood sample; and converting the mRNA level into a blood test result for a target blood component, wherein the mRNA level of the predictive gene in the blood sample relates to the target blood component. In certain aspects, the method further includes selecting the predictive gene.
[0005] In an exemplary embodiment, the method comprises: extracting an RNA from a blood sample; selecting a predictive gene, wherein an mRNA level of the predictive gene in the blood sample relates a target blood component; determining the mRNA level of the predictive gene in the blood sample; and converting the mRNA level into a blood test result of the target blood component.
[0006] In certain exemplary embodiments, the blood sample is whole blood, plasma, or dried blood spot. In those embodiments wherein the blood sample is a dried blood spot, the quality of the dried blood spot may be determined by assessing quality of the extracted RNA.
[0007] Other exemplary aspects of the invention, the blood sample has a volume in the range of: 10 .mu.l-3 ml, 10 .mu.l-2.5 ml, 15 .mu.l-2.5 ml, 15 .mu.l-2 ml, 20 .mu.l-2 ml, 25 .mu.l-2 ml, 25 .mu.l-1.5 ml, 30 .mu.l-1.5 ml, 30 .mu.l-1 ml, 10-300 .mu.l, 10-250 .mu.l, 15-250 .mu.l, 15-200 .mu.l, 20-200 .mu.l, 25-200 .mu.l, 25-150 .mu.l, 30-150 .mu.l, or 30-100 .mu.l. In further particular aspects, the blood sample has a volume of between 10 .mu.l and 1 ml or a volume of between 10-100 .mu.l.
[0008] The mRNA level can be determined using many methods, for example, RNA sequencing, quantitative PCR, and hybridization. In certain preferred embodiments, the mRNA level is determined using next-generation sequencing and normalized using DESeq2 algorithm or edgeR algorithm.
[0009] In an exemplary embodiment, the blood test is reported as an amount of the target blood component; a concentration of the target blood component; a volume of the target blood component; a distribution of the target blood component; a ratio of the target blood component to a second blood component; or combinations thereof.
[0010] In one specific embodiment, the blood test is reported as a volume ratio of red blood cells to total blood (hematocrit level). In other aspects, the blood test is reported as a volume ratio of mean corpuscular hemoglobin (MCH) to mean corpuscle (cell) (MCV) (mean corpuscular hemoglobin concentration (MCHC)).
[0011] Examples of the blood test or blood component targeted by the blood test include: Absolute Basophils, Absolute Eosinophil, Absolute Lymphocyte, Absolute Monocyte, Absolute Neutrophil, Alanine Aminotransferase, Albumin, Alkaline Phosphatase, Anion Gap, Aspartate Aminotransferase, Total Bilirubin, Blood Urea Nitrogen (BUN), Calcium, Chloride, Cholesterol, CO2, Creatinine, Eosinophils, Gamma-Glutamyl Transferase (GGT), Globulin, Glucose, HDL Cholesterol, Hemoglobin, Immature Granulocyte, Lactic Dehydrogenase, LDL Cholesterol, Lymphocytes, mean corpuscular hemoglobin (MCH), mean corpuscle (cell) volume (MCV), Monocytes, mean platelet volume (MPV), Non-HDL Cholesterol, Osmolality, Inorganic Phosphorus, Platelet Count, Potassium, Total Protein, Red Blood Cell (RBC), red cell distribution width (RDW), Segmented Neutrophils, Sodium, Total T3, T3 Uptake, T7 Index, Thyroxine (T4), Triglycerides, Thyroid Stimulating Hormone (TSH), Uric Acid, VLDL Cholesterol, and White Blood Cell (WBC).
[0012] In preferred embodiments, the blood sample is whole blood, plasma, dried blood spot, or combinations thereof, and the target blood component is selected from the group consisting of: Segmented Neutrophils, Eosinophils, Prostate-Specific Antigen, red blood cells, monocytes, creatinine, lymphocytes, eosinophil, alanine aminotransferase, electrolytes, and non-HDL cholesterol.
[0013] In other preferred embodiments, the blood test includes: Prostate-Specific Antigen (PSA_total), Red Blood Cell count (RBC_m.mm3), Absolute Eosinophil, Anion Gap (AG), red cell distribution width (RDW_sd), Thyroid Index (T7), or combinations thereof.
[0014] In a particular non-limiting embodiment, converting the mRNA level into a blood test result uses the following formula: blood test result=C+C.sub.1*(gene), C and C.sub.1 are constants, and (gene) represents the mRNA level of the predictive gene. In particular preferred embodiment, the mRNA level is normalized gene count.
[0015] In a specific embodiment, the target blood component is Segmented Neutrophils and the predictive gene is: MNDA, STX3, TNFRSF1A, MSL1, or TLR1. In a specific exemplary aspects, for MNDA, C is: 21.7-40.3, 21.7-37.2, 24.8-37.2, 24.8-34.1, and 27.9-34.1; and C.sub.1 is: 21.4-39.7, 21.4-36.6, 24.4-36.6, 24.4-33.6, and 27.5-33.6; for STX3: C is 23.1-43.0, 23.1-39.7, 26.4-39.7, 26.4-36.4, and 29.8-36.4; and C.sub.1 is: 19.9-36.9, 19.9-34.1, 22.7-34.1, 22.7-31.3, and 25.6-31.3; for TNFRSF1A: C is: 20.8-38.6, 20.8-35.7, 23.8-35.7, 23.8-32.7, and 26.8-32.7, and C.sub.1 is: 22.2-41.3, 22.2-38.1, 25.4-38.1, 25.4-35.0, and 28.6-35.0; for MSL1: C is: 20.1-37.3, 20.1-34.5, 23.0-34.5, 23.0-32.7, and 25.9-31.6, and C.sub.1 is: 22.9-42.5, 22.9-39.3, 26.2-39.3, 26.2-36.0, and 29.5-36.0; for TLR1: C is: 24.9-46.3, 24.9-42.8, 28.5-42.8, 28.5-39.2, and 32.1-39.2, and C.sub.1 is: 18.2-33.7, 18.2-31.1, 20.8-31.1, 20.8-28.5, and 23.3-28.5.
[0016] In a particular exemplary embodiment, the blood sample is whole blood, the target blood component is Eosinophils, the predictive gene is: SLC29A1, SIGLEC8, IL5RA, TMIGD3, or SMPD3. In a further specific exemplary embodiment, for SLC29A1: C is: between -0.57 and -0.31, between -0.52 and -0.31, between -0.52 and -0.35, between -0.48 and -0.35, and between -0.48 and -0.39, and C.sub.1 is: 2.19-4.07, 2.19-3.75, 2.50-3.75, 2.50-3.44, and 2.81-3.44; for SIGLEC8: C is: 0.34-0.62, 0.34-0.57, 0.38-0.57, 0.38-0.53, and 0.43-0.53; and C.sub.1 is: 1.6-2.9, 1.6-2.7, 1.8-2.7, 1.8-2.5, and 2.0-2.5; for IL5RA: C is: between -0.124 and -0.067, between -0.115 and -0.067, between -0.115 and -0.076, between -0.105 and -0.076, and between -0.105 and -0.086, etc., and C.sub.1 is: 2.0-3.7, 2.0-3.4, 2.2-3.4, 2.2-3.1, and 2.5-3.1; for TMIGD3: C is: between -0.00104 and -0.00056, between -0.00096 and -0.00056, between -0.00096 and -0.00064, between -0.00088 and -0.00064, and between -0.00088 and -0.00072, and C.sub.1 is: 1.8-3.4, 1.8-3.2, 2.1-3.2, 2.1-2.9, and 2.4-2.9; for SMPD3: C is: 0.11-0.20, 0.11-0.18, 0.12-0.18, 0.12-0.17, and 0.14-0.17, and C.sub.1 is: 1.8-3.3, 1.8-3.1, 2.0-3.1, 2.0-2.8, and 2.3-2.8.
[0017] In another nonlimiting exemplary embodiment, the blood sample is dried blood spot, the target blood component is PSA_total, the predictive gene is: CTC-265F19.1, ADAM9, RAB1FIP5, SNAPC4, or LMNA. In a further specific exemplary embodiment, for CTC-265F19.1: C is: 0.30-0.56, 0.30-0.52, 0.35-0.52, 0.35-0.48, and 0.39-0.48, and C.sub.1 is: 0.37-0.68, 0.37-0.63, 0.42-0.63, 0.42-0.58, and 0.47-0.58; for ADAM9, C is: 0.30-0.56, 0.30-0.52, 0.35-0.52, 0.35-0.48, and 0.39-0.48, and C.sub.1 is: 1.2-2.2, 1.2-2.0, 1.3-2.0, 1.3-1.9, and 1.5-1.9; for RAB11FIP5: C is: 0.31-0.58, 0.31-0.53, 0.36-0.53, 0.36-0.49, and 0.40-0.49, and C.sub.1 is: 0.42-0.77, 0.42-0.71, 0.48-0.71, 0.48-0.65, and 0.53-0.65; for SNAPC4: C is: 0.31-0.58, 0.31-0.53, 0.36-0.53, 0.36-0.49, and 0.40-0.49, and C.sub.1 is: 0.43-0.80, 0.43-0.74, 0.49-0.74, 0.49-0.67, and 0.55-0.67; for LMNA, C is: 0.29-0.53, 0.29-0.49, 0.33-0.49, 0.33-0.45, and 0.37-0.45, and C.sub.1 is: 0.24-0.45, 0.24-0.42, 0.28-0.42, 0.28-0.38, and 0.31-0.38.
[0018] In yet other particular embodiments, the blood sample is dried blood spot, the target blood component is Eosinophils, the predictive gene is: SCARNA22, SNORA36C, SNORA11, RN7SL4P, or SNHG15. In a further specific exemplary embodiment, for SCARNA22: C is: 0.9-1.7, 0.9-1.6, 1.0-1.6, 1.0-1.4, and 1.2-1.4, and C.sub.1 is: 1.1-2.0, 1.1-1.8, 1.2-1.8, 1.2-1.7, and 1.4-1.7; for SNORA36C: C is: 0.9-1.7, 0.9-1.6, 1.1-1.6, 1.1-1.5, and 1.2-1.5, and C.sub.1 is: 1.0-1.9, 1.0-1.8, 1.2-1.8, 1.2-1.6, and 1.3-1.6, for SNORA11: C is: 0.9-1.6, 0.9-1.5, 1.0-1.5, 1.0-1.4, and 1.1-1.4, and C.sub.1 is: 1.0-1.9, 1.0-1.7, 1.2-1.7, 1.2-1.6, and 1.3-1.6; for RN7SL4P: C is: 0.7-1.4, 0.7-1.3, 0.8-1.3, 0.8-1.2, and 1.0-1.2, and C.sub.1 is: 1.1-2.0, 1.1-1.9, 1.3-1.9, 1.3-1.7, and 1.4-1.7; for SNHG15, C is: 1.0-1.8, 1.0-1.7, 1.1-1.7, 1.1-1.5, and 1.3-1.5, and C.sub.1 is: 1.0-1.8, 1.0-1.6, 1.1-1.6, 1.1-1.5, and 1.2-1.5.
[0019] In further exemplary embodiments, the blood sample is plasma, the target blood component is PSA_total, the predictive gene is: HNRNPA3P3, GTF3A, RP1l-342M1.6, HNRNPLP2, and RPS1 P5. In a further specific exemplary embodiment, for HNRNPA3P3: C is: 0.15-0.27, 0.15-0.25, 0.17-0.25, 0.17-0.23, and 0.19-0.23, and C.sub.1 is: 0.33-0.61, 0.33-0.56, 0.38-0.56, 0.38-0.52, and 0.42-0.52; for GTF3A: C is: between -0.48 and -0.26, between -0.45 and -0.26, between -0.45 and -0.30, between -0.41 and -0.30, and between -0.41 and -0.34, C.sub.1 is: 0.7-1.3, 0.7-1.2, 0.8-1.2, 0.8-1.1, and 0.9-1.1; for RP11-342M1.6: C is: 0.28-0.52, 0.28-0.48, 0.32-0.48, 0.32-0.44, and 0.36-0.44; and C.sub.1 is: 0.23-0.42, 0.23-0.39, 0.26-0.39, 0.26-0.36, and 0.29-0.36. In further aspects, for HNRNPLP2: C is: 0.23-0.43, 0.23-0.39, 0.26-0.39, 0.26-0.36, and 0.30-0.36; and C.sub.1 is: 0.22-0.41, 0.22-0.38, 0.25-0.38, 0.25-0.35, and 0.29-0.35. In yet further aspects, for RPS11P5: C is: 0.17-0.32, 0.17-0.29, 0.20-0.29, 0.20-0.27, and 0.22-0.27; and C.sub.1 is: 0.34-0.64, 0.34-0.59, 0.39-0.59, 0.39-0.54, and 0.44-0.54.
[0020] In yet further embodiments, the blood sample is plasma, the blood test is Red Blood Cell count (RBC_m.mm3), the predictive gene is: UTY, DDX3Y, ZFY, TXLNGY, and RPS4Y1. In a further specific exemplary embodiment, for UTY: C is: 3.1-5.8, 3.1-5.4, 3.6-5.4, 3.6-4.9, and 4.0-4.9, and C.sub.1 is: 0.24-0.45, 0.24-0.41, 0.28-0.41, 0.28-0.38, and 0.31-0.38; for DDX3Y: C is: 3.1-5.8, 3.1-5.4, 3.6-5.4, 3.6-4.9, and 4.0-4.9, and C.sub.1 is: 0.23-0.43, 0.23-0.40, 0.27-0.40, 0.27-0.37, and 0.30-0.37; for ZFY: C is: 3.1-5.8, 3.1-5.4, 3.6-5.4, 3.6-4.9, and 4.0-4.9, and C.sub.1 is: 0.23-0.43, 0.23-0.40, 0.26-0.40, 0.26-0.36, and 0.30-0.36; for TXLNGY: C is: 3.2-5.9, 3.2-5.4, 3.6-5.4, 3.6-5.0, and 4.1-5.0; and C.sub.1 is: 0.23-0.42, 0.23-0.39, 0.26-0.39, 0.26-0.36, and 0.29-0.36; for RPS4Y1: C is: 3.2-5.9, 3.2-5.4, 3.6-5.4, 3.6-5.0, and 4.1-5.0, and C.sub.1 is: 0.22-0.42, 0.22-0.38, 0.26-0.38, 0.26-0.35, and 0.29-0.35.
[0021] In yet another example, converting the mRNA level into the blood test result uses the following formula: blood test result=C+C.sub.1*(gene.sub.1)+C.sub.2*(gene.sub.2)+ . . . +C.sub.n*(gene.sub.n), n is 1, 2, 3, 4, or 5, C, C.sub.1, C.sub.2, . . . and C.sub.n are constants, and (gene.sub.1), (gene.sub.2), . . . , and (gene.sub.n) represent the mRNA level of gene.sub.1, gene.sub.2, . . . , and gene.sub.n. In particular embodiments, the mRNA level is the normalized gene count.
[0022] In a particular exemplary embodiment, the blood sample is whole blood, the target blood component is Segmented Neutrophils, gene.sub.1 is RNF24, gene.sub.2 is MNDA, and gene.sub.3 is WIPF1. In some aspects, C is: 19.7-36.6, 19.7-33.8, 22.5-33.8, 22.5-31.0, and 25.4-31.0; C.sub.1 is: 4.6-8.6, 4.6-7.9, 5.3-7.9, 5.3-7.3, and 5.9-7.3; C.sub.2 is: 7.4-13.8, 7.4-12.7, 8.5-12.7, 8.5-11.7, and 9.5-11.7; and C.sub.3 is: 11.6-21.5, 11.6-19.8, 13.2-19.8, 13.2-18.2, and 14.9-18.2.
[0023] In yet another embodiment, the blood sample is whole blood, the target blood component is Lymphocytes, gene.sub.1 is GRB2, gene.sub.2 is MNDA, and gene.sub.3 is NFAM1, C is: 43.0-79.8, 43.0-73.6, 49.1-73.6, 49.1-67.5, and 55.2-67.5; C.sub.1 is: between -18.8 and -10.1, between -17.3 and -10.1, between -17.3 and -11.5, between -15.9 and -11.5, and between -15.9 and -13.0; C.sub.2 is: between -11.1 and -6.0, between -10.2 and -6.0, between -10.2 and -6.8, between -9.4 and -6.8, and between -9.4 and -7.7; and C.sub.3 is: between -13.0 and -7.0, between -12.0 and -7.0, between -12.0 and -8.0, between -11.0 and -8.0, and between -11.0 and -9.0.
[0024] In further embodiments, the blood sample is whole blood, the target blood component is Monocytes, gene.sub.1 is NAGA, gene.sub.2 is RIN2, gene.sub.3 is ADA2, gene.sub.4 is PLXNB2, and gene.sub.5 is ANXA2, C is: between -1.9 and -1.0, between -1.8 and -1.0, between -1.8 and -1.2, between -1.6 and -1.2, and between -1.6 and -1.3, etc; C.sub.1 is: 1.8-3.4, 1.8-3.2, 2.1-3.2, 2.1-2.9, and 2.4-2.9; C.sub.2 is: 2.2-4.2, 2.2-3.8, 2.6-3.8, 2.6-3.5, and 2.9-3.5; C.sub.3 is: 2.9-5.5, 2.9-5.0, 3.4-5.0, 3.4-4.6, and 3.8-4.6; C.sub.4 is: between -3.9 and -2.1, between -3.6 and -2.1, between -3.6 and -2.4, between -3.3 and -2.4, and between -3.3 and -2.7; and C.sub.5 is: 1.2-2.2, 1.2-2.0, 1.4-2.0, 1.4-1.9, and 1.5-1.9.
[0025] In still further embodiments, the blood sample is plasma, the target blood component is Absolute Eosinophil, gene, is CLC, gene.sub.2 is ADAT1, gene.sub.3 is SNRPEP4, and gene.sub.4 is GPC6, C is: 0.0021-0.0039, 0.0021-0.0036, 0.0024-0.0036, 0.0024-0.0033, and 0.0027-0.0033; C.sub.1 is: 0.041-0.075, 0.041-0.070, 0.046-0.070, 0.046-0.064, and 0.052-0.064; C.sub.2 is: 0.078-0.144, 0.078-0.133, 0.089-0.133, 0.089-0.122, and 0.100-0.122; C.sub.3 is: between -0.035 and -0.019, between -0.032 and -0.019, between -0.032 and -0.022, between -0.030 and -0.022, and between -0.030 and -0.024; and C.sub.4 is: 0.012-0.022, 0.012-0.020, 0.014-0.020, 0.014-0.019, and 0.015-0.019.
[0026] In another embodiment, the blood sample is plasma, the blood test is Anion Gap (Anion.Gap, AG), gene.sub.1 is DHX40, gene.sub.2 is SLC1A4, gene.sub.3 is IMPA2, gene.sub.4 is KATNA1, and gene.sub.5 is MEIS3P1, C is: 5.9-11.0, 5.9-10.2, 6.8-10.2, 6.8-9.3, and 7.6-9.3; C.sub.1 is: 1.7-3.2, 1.7-2.9, 1.9-2.9, 1.9-2.7, and 2.2-2.7; C.sub.2 is: between -1.3 and -0.7, between -1.2 and -0.7, between -1.2 and -0.8, between -1.1 and -0.8, and between -1.1 and -0.9; C.sub.3 is: 0.9-1.6, 0.9-1.5, 1.0-1.5, 1.0-1.4, and 1.1-1.4; C.sub.4 is: 1.2-2.2, 1.2-2.0, 1.3-2.0, 1.3-1.8, and 1.5-1.8; and C.sub.5 is: 0.35-0.66, 0.35-0.61, 0.40-0.61, 0.40-0.56, and 0.46-0.56.
[0027] In some embodiments, the blood sample is plasma, the target blood component is Segmented Neutrophils, gene, is RXFP1, gene.sub.2 is POLR3GL, gene.sub.3 is FOXK2, and gene.sub.4 is LAMB1, C is: 41.0-76.1, 41.0-70.2, 46.8-70.2, 46.8-64.4, and 52.7-64.4; C.sub.1 is: 1.5-2.8, 1.5-2.5, 1.7-2.5, 1.7-2.3, and 1.9-2.3; C.sub.2 is: between -7.1 and -3.8, between -6.5 and -3.8, between -6.5 and -4.4, between -6.0 and -4.4, and between -6.0 and -4.9; C.sub.3 is: 3.6-6.6, 3.6-6.1, 4.1-6.1, 4.1-5.6, and 4.6-5.6; and C.sub.4 is: 1.6-2.9, 1.6-2.7, 1.8-2.7, 1.8-2.4, and 2.0-2.4.
[0028] In other embodiments, the blood sample is whole blood or plasma, the blood test is red blood cell distribution width (RDW_sd), gene.sub.1 is CHCHD2P6 from plasma, gene.sub.2 is SEC63P1 from plasma, gene.sub.3 is DNAL1 from whole blood, and gene.sub.4 is ENSG00000197262 from whole blood, C is: 26.2-48.7, 26.2-44.9, 30.0-44.9, 30.0-41.2, and 33.7-41.2; C.sub.1 is: 1.0-1.9, 1.0-1.8, 1.2-1.8, 1.2-1.6, and 1.3-1.6; C.sub.2 is: 1.0-1.9, 1.0-1.8, 1.2-1.8, 1.2-1.6, and 1.3-1.6; C.sub.3 is: 2.3-4.2, 2.3-3.9, 2.6-3.9, 2.6-3.6, and 2.9-3.6; and C.sub.4 is: 0.8-1.6, 0.8-1.5, 1.0-1.5, 1.0-1.3, and 1.1-1.3.
[0029] In yet other embodiments, the blood sample is whole blood or plasma, the blood test is Thyroid Index (T7.Index), gene.sub.1 is IGHV3-33 from whole blood, gene.sub.2 is ZNF266 from whole blood, gene.sub.3 is CCDC183-AS1 from whole blood, gene.sub.4 is ENSG00000232745 from plasma, C is: 1.9-3.5, 1.9-3.2, 2.2-3.2, 2.2-3.0, and 2.4-3.0; C.sub.1 is: between -0.20 and -0.11, between -0.18 and -0.11, between -0.18 and -0.12, between -0.17 and -0.12, and between -0.17 and -0.14; C.sub.2 is: between -0.99 and -0.53, between -0.91 and -0.53, between -0.91 and -0.61, between -0.84 and -0.61, and between -0.84 and -0.69; C.sub.3 is: 0.21-0.38, 0.21-0.36, 0.24-0.36, 0.24-0.33, and 0.27-0.33; and C.sub.4 is: between -0.16 and -0.09, between -0.15 and -0.09, between -0.15 and -0.10, between -0.14 and -0.10, and between -0.14 and -0.11.
[0030] In further embodiments, the blood sample is dried blood spot, the target blood component is Alaine Aminotransferase, gene.sub.1 is EIF1AY, gene.sub.2 is SRXN1, gene.sub.3 is NDUFAF2, and gene.sub.4 is TBCE, C is: 13.3-24.7, 13.3-22.8, 15.2-22.8, 15.2-20.9, and 17.1-20.9; C.sub.1 is: 2.6-4.8, 2.6-4.5, 3.0-4.5, 3.0-4.1, and 3.3-4.1; C.sub.2 is: 2.1-3.9, 2.1-3.6, 2.4-3.6, 2.4-3.3, and 2.7-3.3; C.sub.3 is: 3.0-5.6, 3.0-5.2, 3.4-5.2, 3.4-4.7, and 3.9-4.7; and C.sub.4 is: between -7.2 and -3.9, between -6.6 and -3.9, between -6.6 and -4.4, between -6.1 and -4.4, and between -6.1 and -5.0.
[0031] In some embodiments, the blood sample is dried blood spot, the target blood component is Eosinophils, gene.sub.1 is SCARNA22, and gene.sub.2 is TET3, C is: 0.60-1.11, 0.60-1.02, 0.68-1.02, 0.68-0.94, and 0.77-0.94; C.sub.1 is: 0.66-1.22, 0.66-1.13, 0.75-1.13, 0.75-1.04, and 0.85-1.04; and C.sub.2 is: 0.61-1.13, 0.61-1.04, 0.69-1.04, 0.69-0.95, and 0.78-0.95.
[0032] In other embodiments, the blood sample is dried blood spot, the target blood component is Segmented Neutrophils, gene.sub.1 is HMGB1P1, gene.sub.2 is CSRNP1, and gene.sub.3 is CCNJL, C is: 39.1-72.5, 39.1-67.0, 44.6-67.0, 44.6-61.4, and 50.2-61.4; C.sub.1 is: 2.0-3.7, 2.0-3.4, 2.3-3.4, 2.3-3.1, and 2.5-3.1; C.sub.2 is: 2.0-3.7, 2.0-3.4, 2.3-3.4, 2.3-3.1, and 2.5-3.1; and C.sub.3 is: 1.7-3.2, 1.7-2.9, 2.0-2.9, 2.0-2.7, and 2.2-2.7.
[0033] In yet other embodiments, the blood sample is high-quality dried blood spot, the target blood component is non-HDL cholesterol, gene.sub.1 is BMT2, gene.sub.2 is PKD1P5, and gene.sub.3 is ARIH1, C is: 133-247, 133-228, 152-228, 152-209, and 171-209; C.sub.1 is: between -52 and -28, or any number range in between, e.g., between -48 and -28, between -48 and -32, between -44 and -32, and between -44 and -36; C.sub.2 is: 17.4-32.2, 17.4-29.8, 19.8-29.8, 19.8-27.3, and 22.3-27.3; and C.sub.3 is: between -47 and -25, between -44 and -25, between -44 and -29, between -40 and -29, and between -40 and -33.
[0034] In further embodiments, the blood sample is high-quality dried blood spot, the target blood component is Eosinophils, gene.sub.1 is NDUFA5, and gene.sub.2 is MCM8, C is: 1.1-2.1, 1.1-2.0, 1.3-2.0, 1.3-1.8, and 1.5-1.8; C.sub.1 is: 0.46-0.85, 0.46-0.78, 0.52-0.78, 0.52-0.72, and 0.59-0.72; and C.sub.2 is: between -1.2 and -0.6, between -1.1 and -0.6, between -1.1 and -0.7, between -1.0 and -0.7, and between -1.0 and -0.8.
[0035] In yet further embodiments, the blood sample is high-quality dried blood spot, the target blood component is Segmented Neutrophils, gene.sub.1 is AKAP12, and gene.sub.2 is APP, C is: 2.4-4.5, 2.4-4.2, 2.8-4.2, 2.8-3.8, and 3.1-3.8; C.sub.1 is: 1.0-1.9, 1.0-1.7, 1.1-1.7, 1.1-1.6, and 1.3-1.6; and C.sub.2 is: 1.6-3.0, 1.6-2.8, 1.9-2.8, 1.9-2.6, and 2.1-2.6.
[0036] In some embodiments, the blood sample is whole blood, the target blood component is Lymphocytes, gene.sub.1 is EVI2B, and gene.sub.2 is NFAM1, C is: 39.7-73.7, 39.7-68.1, 45.4-68.1, 45.4-62.4, and 51.1-62.4; C.sub.1 is: between -20.6 and -11.1, between -19.1 and -11.1, between -19.1 and -12.7, between -17.5 and -12.7, and between -17.5 and -14.3; and C.sub.2 is: between -16.1 and -8.7, between -14.8 and -8.7, between -14.8 and -9.9, between -13.6 and -9.9, and between -13.6 and -11.1.
[0037] In other embodiments, the blood sample is whole blood, the target blood component is Monocytes, gene.sub.1 is RIN2, and gene.sub.2 is ADA2, C is: between -0.21 and -0.11, between -0.19 and -0.11, between -0.19 and -0.13, between -0.17 and -0.13, and between -0.17 and -0.14; C.sub.1 is: 2.8-5.1, 2.8-4.7, 3.1-4.7, 3.1-4.3, and 3.5-4.3; and C.sub.2 is: 2.5-4.6, 2.5-4.3, 2.8-4.3, 2.8-3.9, and 3.2-3.9.
[0038] In yet other embodiments, the blood sample is whole blood, the target blood component is Segmented Neutrophils, gene.sub.1 is RNF24, gene.sub.2 is MNDA, and gene.sub.3 is TLR1, C is: 25.0-46.4, 25.0-42.8, 28.6-42.8, 28.6-39.3, and 32.1-39.3; C.sub.1 is: 6.2-11.5, 6.2-10.6, 7.1-10.6, 7.1-9.7, and 8.0-9.7; C.sub.2 is: 6.8-12.7, 6.8-11.7, 7.8-11.7, 7.8-10.7, and 8.8-10.7; and C.sub.3 is: 5.2-9.7, 5.2-9.0, 6.0-9.0, 6.0-8.2, and 6.7-8.2.
[0039] Herein the inventors also disclose a blood test. Typically, the blood test comprises a positive control plasmid, a first reagent, and a second reagent. The positive control plasmid comprising an exon of a predictive gene selected from Tables 1-9, wherein an mRNA level of the predictive gene in the blood sample relates to a blood test result of a target blood component. The first reagent detects the mRNA level of the predictive gene, comprises at least a primer or a probe hybridizing to the exon of the predictive gene. The second reagent detects an mRNA level of a housekeeping gene, for example, a primer or a probe hybridizing to the exon of the housekeeping gene.
[0040] Non-limiting examples of the housekeeping genes include glyceraldehyde-3-phosphate dehydrogenase (GAPDH), ACTB actin, beta2-microglobulin (B2M), Porphobilinogen deaminase (HMBS), or Peptidylprolyl Isomerase B (PPIB), etc.
[0041] Non-limiting examples of the target blood component include Segmented Neutrophils, Eosinophils, Prostate-Specific Antigen (PSA_total), Red Blood Cell count (RBC_m.mm3), Monocytes, Creatinine, Lymphocytes, Absolute Eosinophil, Anion Gap (AG), red cell distribution width (RDW_sd), Thyroid Index (T7), Alanine Aminotransferase, or non-HDL cholesterol, etc.
[0042] In some embodiments, the target blood component is Segmented Neutrophils, and the predictive gene is: MNDA, STX3, TNFRSF1A, MSL1, TLR1, RNF24, WIPF1, RXFP1, POLR3GL, FOXK2, LAMB, HMGB1P1, CSRNP1, CCNJL, AKAP12, or APP. In other embodiments, the target blood component is Eosinophils, and the predictive gene is: SLC29A1, SIGLEC8, IL5RA, TMIGD3, SMPD3, SCARNA22, SNORA36C, SNORA11, RN7SL4P, SNHG15, TET3, NDUFA5, or MCM8. In yet other embodiments, the target blood component is PSA_total, and the predictive gene is: CTC-265F19.1, ADAM9, RABllFIP5, SNAPC4, LMNA, HNRNPA3P3, GTF3A, RP11-342M1.6, HNRNPLP2, or RPSllP5. In further embodiments, the target blood component is Red Blood Cell count (RBC_m.mm3), and the predictive gene is: UTY, DDX3Y, ZFY, TXLNGY, or RPS4Y1. In yet further embodiments, the target blood component is Lymphocytes, and the predictive gene is: GRB2, MNDA, NFAM1, or EVI2B.
[0043] In some aspects, the target blood component is Monocytes, and the predictive gene is: NAGA, RIN2, ADA2, PLXNB2, or ANXA2. In other aspects, the target blood component is Absolute Eosinophil, and the predictive gene is: CLC, ADAT1, SNRPEP4, or GPC6. In yet other aspects, target blood component is Anion Gap (AG), and the predictive gene is: DHX40, SLC1A4, IMPA2, KATNA1, or MEIS3P1. In further aspects, the target blood component is red blood cell distribution width (RDW_sd), and the predictive gene is: CHCHD2P6, SEC63P1, DNAL1, or ENSG00000197262. In yet further aspects, the target blood component is Thyroid Index (T7.Index), and the predictive gene is: IGHV3-33, ZNF266, CCDC183-AS1, or ENSG00000232745.
[0044] In some embodiments, the target blood component is Alaine Aminotransferase, and the predictive gene is: EIF1AY, SRXN1, NDUFAF2, or TBCE. In other embodiments, the target blood component is non-HDL cholesterol, and the predictive gene is: BMT2, PKD1P5, or ARIH1.
[0045] Additional objectives, advantages and novel features will be set forth in the description which follows or will become apparent to those skilled in the art upon examination of the drawings and detailed description which follows.
BRIEF DESCRIPTION OF THE DRAWINGS
[0046] FIGS. 1 and 2 show the range in the number of genes detected whole blood samples, plasma samples, and dried blood spot samples.
[0047] FIG. 3 depicts the spread of RNA yield from whole blood samples, plasma samples, and dried blood spot samples.
[0048] FIGS. 4-13 depict the simple regression graphs of the RNA expression of gene in dried blood spot samples with the results of a blood test for highly predictive single genes.
[0049] FIGS. 14-33 depict the simple regression graphs of the RNA expression of a gene in plasma samples with the results of a blood test for highly predictive single genes.
[0050] FIGS. 34-63 depict the simple regression graphs of the RNA expression of a gene in whole blood samples with the results of a blood test for highly predictive single genes.
[0051] FIGS. 64-68 depict the 2D representation of the multiple regression graphs of the RNA expression of a combination of genes in whole blood samples with the results of a blood test. The R2 value (correlations score) shown are for the real analysis rather than the line of best fit for the 2D representation. The genes used in the multiple regression analysis for each blood result test is identified in Table 4.
[0052] FIGS. 69-73 depict the 2D representation of the multiple regression graphs of the RNA expression of a combination of genes in plasma samples with the results of a blood test. The R2 value (correlations score) shown are for the real analysis rather than the line of best fit for the 2D representation. The genes used in the multiple regression analysis for each blood result test is identified in Table 5.
[0053] FIGS. 74-79 depict the 2D representation of the multiple regression graphs of the RNA expression of a combination of genes in either whole blood or plasma samples with the results of a blood test. The R2 value (correlations score) shown are for the real analysis rather than the line of best fit for the 2D representation. The genes used in the multiple regression analysis for each blood result test is identified in Table 6.
[0054] FIGS. 80-84 depict the 2D representation of the multiple regression graphs of the RNA expression of a combination of genes in all dried blood spot samples with the results of a blood test. The R2 value (correlations score) shown are for the real analysis rather than the line of best fit for the 2D representation. The genes used in the multiple regression analysis for each blood result test is identified in Table 7.
[0055] FIGS. 85-89 depict 2D representation of the multiple regression graphs of the RNA expression of a combination of genes in high-quality dried blood spot samples with the results of a blood test. The R2 value (correlations score) shown are for the real analysis rather than the line of best fit for the 2D representation. The genes used in the multiple regression analysis for each blood result test is identified in Table 8.
[0056] The headings used in the figures should not be interpreted to limit the scope of the claims.
DETAILED DESCRIPTION
[0057] The disclosure is directed to methods of using biomarker proxies (predictive gene(s)) in predicting the results of standard blood tests based on hematology or chemistry, for example, the results from a complete blood count panel, a comprehensive metabolic panel, a chemistry panel, or an endocrine panel (such as levels of thyroxine, T3, and TSH). Instead of collecting multiple tubes of blood for conducting a variety of tests, a simple blood sample collection, for example of whole blood, plasma, or a dried spot, will enable a determination that correlates to the results of a standard blood test. Accordingly, some embodiments are directed to blood tests for measuring the RNA expression of the biomarker proxies, while other embodiments are directed to methods for determining a blood test result based on the RNA expression of the biomarkers.
[0058] In the following description, and for the purposes of explanation, numerous specific details are set forth in order to provide a thorough understanding of the various aspects of the invention. It will be understood, however, by those skilled in the relevant arts, that the present invention may be practiced without these specific details. It should be noted that there are many different and alternative configurations, devices and technologies to which the disclosed inventions may be applied. The full scope of the disclosure is not limited to the examples that are described below.
[0059] The singular forms "a," "an," and "the" include plural referents unless the context clearly dictates otherwise. Thus, for example, a reference to "a step" includes reference to one or more of such steps. Unless specifically noted, it is intended that the words and phrases in the specification and the claims be given their plain, ordinary, and accustomed meaning to those of ordinary skill in the applicable arts.
[0060] As used herein, the term "subject" refers to any mammal, for example, mice, rats, primates, or humans.
[0061] The present disclosure is directed to the discovery of a predictive gene (biomarkers), the expression of which relates to a result of a standard blood test, for example, results for a complete blood count with differential and platelet, a basic chemistry panel, a lipid panel, thyroid tests (such as the levels of thyroxine, T3, and thyroid-stimulating hormone (TSH)), or a prostate-specific antigen (PSA) test.
[0062] The inventors disclose a method of performing a blood test. The method typically comprises the steps of: extracting an RNA (total RNA or mRNA) from a blood sample; quantifying a mRNA level of the predictive gene in the blood sample from the extracted RNA; and converting the mRNA level of the predictive gene in the blood sample into a blood test result. In some aspects, the method further comprising selecting a predictive gene or a set of predictive genes, for example, from Tables 1-9. In some implementations, the mRNA level of the predictive gene relates to a target blood component.
[0063] As used herein, the term "blood test" or "standard blood tests" refers to tests conducted that directly measure chemical or hematological components found in blood. The chemical components include T3, T3 uptake, Thyroxine (T4), T7 Index, TSH, PSA, cholesterol (HDL, non-HDL, LDL, and VLDL), cholesterol/HDL ratio, triglyceride, glucose, blood urea nitrogen (BUN), creatinine, BUN/creatine ratio, uric acid, sodium, potassium, chloride, CO2, anion gap, osmolality, total protein, albumin, globulin, albumin/globulin ratio, calcium, phosphorus (inorganic), alkaline phosphatase, gamma-glutamyl transferase (GGT), alanine aminotransferase, aspartate aminotransferase, lactic dehydrogenase, and bilirubin. The hematological components include white blood cell (WBC), red blood cell (RBC), hemoglobin, hematocrit, mean corpuscular volume (MCV), mean corpuscular hemoglobin (MCH), mean corpuscular hemoglobin concentration (MCHC), platelet count, mean platelet volume, segmented neutrophils, lymphocytes, monocytes, eosinophils, basophils, absolute neutrophil, absolute lymphocyte, absolute monocyte, absolute eosinophil, absolute basophil, immature granulocyte, and absolute granulocyte. Table 10 lists some of the standard blood tests and how they may belong in blood test panels.
[0064] The term "blood test result," as used herein, refers to the results from conducting the blood test or standard blood test. The third and fourth columns in Table 10 list the specific blood test and the units of the results of the specific blood test.
[0065] In some aspects, the blood test is reported as: an amount of the target blood component; a concentration of the target blood component; a volume of the target blood component; a distribution of the target blood component; a ratio of the target blood component to a second blood component; or combinations thereof. In other aspects, the blood test is reported as a volume ratio of red blood cells to total blood (hematocrit level). In other aspects, the blood test is reported as a volume ratio of mean corpuscular hemoglobin (MCH) to mean corpuscle (cell) (MCV) (mean corpuscular hemoglobin concentration (MCHC)).
[0066] Non-limiting examples of the blood tests or target blood components include: Absolute Basophils, Absolute Eosinophil, Absolute Lymphocyte, Absolute Monocyte, Absolute Neutrophil, Alanine Aminotransferase, Albumin, Alkaline Phosphatase, Anion Gap, Aspartate Aminotransferase, Total Bilirubin, Blood Urea Nitrogen (BUN), Calcium, Chloride, Cholesterol, CO2, Creatinine, Eosinophils, Gamma-Glutamyl Transferase (GGT), Globulin, Glucose, HDL Cholesterol, Hemoglobin, Immature Granulocyte, Lactic Dehydrogenase, LDL Cholesterol, Lymphocytes, mean corpuscular hemoglobin (MCH), mean corpuscle (cell) volume (MCV), Monocytes, mean platelet volume (MPV), Non-HDL Cholesterol, Osmolality, Inorganic Phosphorus, Platelet Count, Potassium, Total Protein, Red Blood Cell (RBC), red cell distribution width (RDW), Segmented Neutrophils, Sodium, Total T3, T3 Uptake, T7 Index, Thyroxine (T4), Triglycerides, Thyroid Stimulating Hormone (TSH), Uric Acid, VLDL Cholesterol, and White Blood Cell (WBC).
[0067] In preferred embodiments, the blood sample is whole blood, plasma, dried blood spot, or combinations thereof. Non-limiting examples of target blood component include: Segmented Neutrophils, Eosinophils, Prostate-Specific Antigen, red blood cells, monocytes, creatinine, lymphocytes, eosinophil, alanine aminotransferase, electrolytes, or non-HDL cholesterol, etc. Non-limiting examples of blood test include: red blood Cell count (RBC_m.mm3), Absolute Eosinophil, red cell distribution width (RDW_sd), Thyroid Index (T7), or Anion Gap (AG), etc.
[0068] In one aspect, the present disclosure is directed to a method of determining a blood test result, e.g., an amount of a target blood component, a concentration of a target blood component, a volume of a target blood component, a distribution of a target blood component, and a ratio between a target blood component and a second target blood component.
[0069] The present disclosure is also directed to methods of quantifying a target blood component in a blood sample. Typically, the methods comprising the steps of: extracting an RNA from a blood sample; selecting a predictive gene from Tables 1-9; measuring an mRNA level of the predictive gene (from the extracted RNA of the blood sample) in the blood sample; and converting the mRNA level of the predictive gene in the blood sample into an amount or ratio of the target blood component in the blood sample. In some embodiments, the target blood component is a chemical component, while in other embodiments, the target blood component is a hematological component.
[0070] As used herein, the term "blood sample" refers to a sample collected using blood, for example, a whole blood sample, a plasma sample, or a dried blood spot (DBS). The methodologies of the present invention can be used in conjunction with a small quantity of a blood sample. In some implementations, the volume of the blood sample is less than 1 ml (cubic centimeter, cc). In preferred implementations, the volume of the blood sample is less than 0.1 ml (cc), e.g., about 30 .mu.l.
[0071] Not all dried blood spots are quality samples for providing predictive RNA expression levels (see FIG. 2), as some dried blood spots (referenced as low-quality dried blood spots, "DBS LQ") can only provide information for less than half the number of genes than other dried blood spots (referenced as high-quality dried blood spots, "DBS HQ"). Accordingly, if RNA expression from dried blood spots is used to predict blood test results, the dried blood spot is preferably analyzed for the number of genes detectable from the sample. If at least 5,000 genes can be detected from the dried blood spot sample, then the dried blood spot is a high-quality sample and provides a more accurate prediction of the blood test results.
[0072] In some aspects, the quality of the dried blood spot is determined by assessing the quality of the extracted RNA, for example, by capillary electrophoresis (e.g., using an Agilent Bioanalyzer). In some aspects, the RNA quality is quantified as a RIN, wherein the RIN is calculated by an algorithmic assessment of the number of various RNAs presented within the extracted RNA. High-quality cellular RNA generally exhibits an RNA value approaching 10. In yet further aspects, the predictive gene is selected based on the quality of the blood sample. For example, if a dried blood sample is determined to be of high-quality, the predictive gene can be selected from Table 8.
[0073] The term "extraction" as used herein refers to any method for separating or isolating the nucleic acids from a sample, more particularly from a biological sample, such as a blood sample. Nucleic acids such as RNA or DNA may be released, for example, by cell lysis. Moreover, in some aspects, extraction may encompass the separation or isolation of coding RNA (mRNA).
[0074] Some embodiments of the invention include the extraction of one or more forms of nucleic acids from one or more samples. In some aspects, the extraction of the nucleic acids can be provided using one or more techniques known in the art. For example, in some aspects, the extraction steps can be accomplished using the QIAAMP.RTM. RNA Blood Kit from QIAGEN.RTM. (e.g., for the isolation of total RNA) or EXORNEASY.RTM. Serum/Plasma Kit from QIAGEN.RTM. (e.g., for the isolation of intracellular and/or extracellular RNA). In other embodiments, methodologies of the invention can use any other conventional methodology and/or product intended for the isolation of intracellular and/or extracellular nucleic acids (e.g., RNA).
[0075] The term "nucleic acid" or "polynucleotide" as referred to herein comprises all forms of RNA (mRNA, miRNA, rRNA, tRNA, piRNA, ncRNA), DNA (genomic DNA or mtDNA), as well as recombinant RNA and DNA molecules or analogs of DNA or RNA generated using nucleotide analogues. The nucleic acids may be single-stranded or double-stranded. The nucleic acids may include the coding or non-coding strands. The term also comprises fragments of nucleic acids, such as naturally occurring RNA or DNA which may be recovered using one or more extraction methods disclosed herein. "Fragment" refers to a portion of nucleic acid (e.g., RNA or DNA).
[0076] The term "library," as used herein refers to a library of genome/transcriptome-derived sequences. The library may also have sequences allowing amplification of the "library" by the polymerase chain reaction or other in vitro amplification methods well known to those skilled in the art. In various embodiments, the library may have sequences that are compatible with next-generation high throughput sequencing platforms. In some embodiments, as a part of the sample preparation process. "barcodes" may be associated with each sample. In this process, short oligonucleotides are added to primers, where each different sample uses a different oligo in addition to a primer.
[0077] In certain embodiments, primers and barcodes are ligated to each sample as part of the library generation process. Thus during the amplification process associated with generating the ion amplicon library, the primer and the short oligo are also amplified. As the association of the barcode is done as part of the library preparation process, it is possible to use more than one library, and thus more than one sample. Synthetic nucleic acid barcodes may be included as part of the primer, where a different synthetic nucleic acid barcode may be used for each library. In some embodiments, different libraries may be mixed as they are introduced to a flow cell, and the identity of each sample may be determined as part of the sequencing process.
[0078] The term "expression" or "expression level" is used broadly to include a genomic expression profile, e.g., an expression profile of nucleic acids. Profiles may be generated by any convenient means for determining a level of a nucleic acid sequence, e.g., quantitative hybridization of nucleic acid, labeled nucleic acid, amplified nucleic acid, cDNA, etc., quantitative PCR, ELISA for quantitation, sequencing (e.g., RNA sequencing) and the like. According to some embodiments, the term "expression level" means measuring the abundance of the nucleic acid in the measured samples.
[0079] Expression level or other determinable traits regarding nucleic acids may function as one or more markers or biomarkers. As described herein, the expression level of the one or more biomarkers may be correlated with a blood test result and may be indicative of or predictive of a presence or stage of a disease, condition, or medical state. As such, embodiments of the invention can be employed in medically related analyses to diagnose, assess, provide prognostic information, and make therapeutic decisions regarding any biologically related state.
[0080] The expression of these RNA markers from a blood sample determine blood test results with an accuracy of at least 80% when comparing the predicted blood test result based on the RNA markers to the actual blood test result. In particular, these RNA markers determine results in a complete blood count, a comprehensive metabolic panel, and a chemistry panel, and the levels of thyroxine, T3, and TSH an accuracy of at least 80%. In some aspects, accuracy is determined based on regression analysis from the R.sup.2-value.
[0081] The mRNA level is determined, for example, using RNA sequencing, quantitative PCR (e.g., real-time RT-PCR), or hybridization (e.g., DNA microarray), etc. In preferred embodiments, the mRNA level is determined using next-generation sequencing. The methods of determining the expression of RNA from a dried blood spot is explained in PCT Application No. PCT/US2016/038243, the contents of which are incorporated herein.
[0082] In some implementations, the methods further comprise standardizing the level of RNA expression of the predictive gene.
[0083] In other implementations, the methods further comprise normalizing the mRNA level of the predictive gene. In some embodiments, the mRNA level of the predictive gene is normalized according to a method of differential analysis. In some aspects, the count data from next-generation sequencing is normalized using an algorithm. Any normalization algorithm normalization that normalizes library size may be used to normalize the mRNA level of the predictive gene. Non-limiting examples include a DESeq2 algorithm, or edgeR algorithm, etc. In some aspects, the mRNA level of the predictive gene is expressed as a normalized gene count. In these aspects, the normalized gene count is used to report the blood test result (e.g., an amount of the target component in the blood sample).
[0084] In some embodiments, the methods encompass converting a mRNA level of a single predictive gene in a blood sample into a blood test result using the formula: blood test result=C+C.sub.1*(gene). C and C.sub.1 are constants, and (gene) represents the mRNA level of the predictive gene. In some aspects, (gene) represents normalized gene count. In other aspects, a normalized gene count of a single predictive gene in a blood sample is converted into a blood test result according to a formula set forth in Tables 1-3. In some embodiments, the range of C and C.sub.1 are .+-.30% of the disclosed value. For example, for formula 0.153698762623272+2.5434273948207*SMPD3, C is between 0.11 and 0.20, and C.sub.1 is between 1.8 and 3.3. In preferred embodiments, the range of C and C.sub.1 are .+-.20% of the disclosed value. For the same formula, C is between 0.12 and 0.18, and C.sub.1 is between 2.0 and 3.1. In the most preferred embodiments, the range of C and C.sub.1 are .+-.10% of the disclosed value. For the same formula, C is between 0.14 and 0.17, and C.sub.1 is between 2.3 and 2.8.
[0085] In other embodiments, the methods encompass converting a mRNA level of each of a set of predictive genes in a blood sample into a blood test result using the formula: blood test result=C+C.sub.1*(gene.sub.1)+C.sub.2*(gene.sub.2)+ . . . +C.sub.n*(gene.sub.n), n is 1, 2, 3, 4, or 5, C, C.sub.1, C.sub.2, . . . and C.sub.n are constants, and (gene.sub.1), (gene.sub.2), . . . , and (gene.sub.n) represent the mRNA level of gene.sub.1, gene.sub.2, . . . , and gene.sub.n. In some aspects, (gene.sub.1), (gene.sub.2), . . . , and (gene.sub.n) represents the normalized gene count for each predictive gene within the set. C and C, may be positive or negative. In certain non-limiting aspects, the blood sample is a dried blood spot, and n is 1, 2, or 3. In some aspects, a set of normalized gene counts of a set of predictive genes in a blood sample is converted into a blood test result according to a formula set forth in Tables 4-9. In some aspects, C, C.sub.1, . . . C, is .+-.30% of the disclosed value. In other aspects, C, C.sub.1, . . . C.sub.n is .+-.20% of the disclosed value. In further aspects, C, C.sub.1, . . . C.sub.n is .+-.10% of the disclosed value.
[0086] In some implementations, a range in the mRNA level of the predictive gene corresponds to the normal range in the results of a blood test. Accordingly, detecting the mRNA level of genes listed in Tables 1-9 below replaces the need for conducting standard blood tests. Whereas conventional blood tests usually require a visit to a laboratory to get blood drawn as each blood test may have particular requirements for the blood collection process, the methods of the invention simplify the process of monitoring of a subject's state of health. One such benefit is that a single sample collection where a relatively small amount of blood is collected replaces the need to collect multiple tubes of blood by a visit to a laboratory. In the examples, a total of 1 cc of blood was collected for the whole blood sample and the generation of the plasma sample, whereas the typical collection volume for blood tests is 8 cc per tube of blood. In some implementations, less than 1 cc blood needs to be collected. In the case of the dried blood sample, a blood smear or the amount of blood released from a typical finger prick (for example, for blood sugar monitoring) is sufficient. Dried blood spot samples may also be easily kept in storage in case other blood tests analysis needs to be conducted on the sample, for example, if additional analysis is needed weeks, months, or years after collection of the dried blood sample. Another exemplary benefit of the invention is that one can track health status without the need to visit a laboratory or blood collection site. Instead, the subject may collect his or her own sample and send the sample for analysis in a laboratory. This is particularly convenient for subjects who cannot make the required visits to a laboratory, for example, ailing house-bound subjects or those residing far from a laboratory. Often, the former group of subjects has the most need for careful monitoring of their health status.
[0087] Tables 1-3 list the blood test results and the single most predictive genes based on the gene's mRNA level in whole blood, dried blood spot, and plasma samples respectively. In some aspects, the mRNA level of one or more of the genes listed in Table 1 in a subject's whole blood sample is used to determine the amount of eosinophils, absolute eosinophils, segmented neutrophils, lymphocytes, monocytes, or prostate-specific antigen (PSA) in the subject. In other aspects, the mRNA level of one or more of the genes listed in Table 2 in a subject's dried blood spot sample is used to determine the amount of eosinophils, absolute eosinophils, or PSA in the subject. In yet other aspects, the mRNA level of one or more of the genes listed in Table 3 in a subject's plasma sample is used to determine the amount of creatinine, PSA, red blood cell (RBC), or the mean corpuscular hemoglobin concentration (MCHC) in the subject.
TABLE-US-00001 TABLE 1 Top predictive gene based on the gene's expression in whole blood samples for each blood test result according to linear regression analysis Correlation Score Blood Test Result Gene Name Ensemble ID Formula 0.81 Eosinophils_. SLC29A1.sup.1 ENSG00000112759 -0.436114553980279 + 3.12697159781888*SLC29A1 0.79 Eosinophils_. SIGLEC8.sup.1 ENSG00000105366 0.478995513524416 + 2.26645036634396*SIGLEC8 0.77 Eosinophils_. IL5RA ENSG00000091181 -0.0955461742354181 + 2.81222141861621*IL5RA 0.74 Eosinophils_. TMIGD3.sup.1 ENSG00000121933 -0.000801764004280439 + 2.63814405484868*TMIGD3 0.70 Eosinophils_. SMPD3 ENSG00000103056 0.153698762623272 + 2.5434273948207*SMPD3 0.80 Seqmented.Neutrophils_. MNDA.sup.2 ENSG00000163563 30.985358159929 + 30.5084860077407*MNDA 0.78 Seqmented.Neutrophils_. STX3 ENSG00000166900 33.0607692672898 + 28.4228215061986*STX3 0.77 Seqmented.Neutrophils_. TNFRSF1A ENSG00000067182 29.7291893891555 + 31.7745523363709*TNFRSF1A 0.76 Seqmented.Neutrophils_. MSL1 ENSG00000188895 28.7271661674218 + 32.7254991645035*MSL1 0.75 Seqmented.Neutrophils_. TLR1 ENSG00000174125 35.631442374894 + 25.9402923721921*TLR1 0.79 Lymphocytes_. EVI2B ENSG00000185862 56.1863937273014 + -27.7092017568931*EVI2B 0.77 Lymphocytes_. GRB2 ENSG00000177885 66.2749627281548 + -37.7780282518198*GRB2 0.77 Lymphocytes_. LAMP2 ENSG00000005893 54.9921800155255 + -26.5119940169167*LAMP2 0.77 Lymphocytes_. MNDA.sup.2 ENSG00000163563 53.8657745533577 + -25.3929463761467*MNDA 0.77 Lymphocytes_. NFAM1 ENSG00000235568 52.358694909343 + -23.8995935882078*NFAM1 0.71 PSA . . . total..sub.-- C9orf142 ENSG00000148362 -0.917861007929147 + 1.69760056628958*C9orf142 0.65 PSA . . . total..sub.-- ARHGEF28 ENSG00000214944 0.357399121217485 + 0.338880229114067*ARHGEF28 0.65 PSA . . . total..sub.-- SSBP4 ENSG00000130511 -0.576221661574983 + 1.25786772240861*SSBP4 0.64 PSA . . . total..sub.-- ADAM22 ENSG00000008277 -0.0422931052522241 + 0.8800693985004*ADAM22 0.63 PSA . . . total..sub.-- GZMH ENSG00000100450 0.325075313876093 + 0.32428066183067*GZMH 0.74 Monocytes_. CECR1 ENSG00000093072 -0.396158811208197 + 7.73352673027494*CECR1 0.72 Monocytes_. PLXNB2 ENSG00000196576 1.04851193227865 + 6.31022452456754*PLXNB2 0.71 Monocytes_. NAGA ENSG00000198951 -0.427809486988276 + 7.72986242198722*NAGA 0.67 Monocytes_. RIN2 ENSG00000132669 1.30473405937088 + 5.96955611215279*RIN2 0.67 Monocytes_. CST3 ENSG00000101439 0.523411654697532 + 6.85269617206023*CST3 0.68 Absolute.Eosinophil_k.uL SLC29A1 ENSG00000112759 -0.00476612865203703 + 0.197930659524045*SLC29A1 0.65 Absolute.Eosinophil_k.uL SIGLEC8 ENSG00000105366 0.0535915596920504 + 0.142306293239556*SIGLEC8 0.63 Absolute.Eosinophil_k.uL IL5RA ENSG00000091181 0.026206273258456 + 0.16193658999382*IL5RA 0.60 Absolute.Eosinophil_k.uL TMIGD3 ENSG00000121933 0.0201738288843809 + 0.170369927489743*TMIGD3 0.58 Absolute.Eosinophil_k.uL SMPD3 ENSG00000103056 0.04135790555759 + 0.143797323307533*SMPD3 .sup.1Transmembrane proteins .sup.2The myeloid cell nuclear differentiation antigen (MNDA) is detected only in nuclei of cells of the granulocyte-monocyte lineage. MNDA was correlated with the amount of both lymphocytes and neutrophils. However, for lymphocytes, the correlation is negative.
TABLE-US-00002 TABLE 2 Top predictive gene based on the gene's expression in dried blood spot samples for each blood test result according to linear regression analysis Correlation Score Blood Test Result Gene Name Ensemble ID Formula 0.81 PSA . . . total..sub.-- CTC-265F19.1 ENSG00000267749 0.432690717089027 + 0.526112710280575*CTC-265F19.1 0.81 PSA . . . total..sub.-- ADAM9 ENSG00000168615 0.43193992452492 + 1.68403340939593*ADAM9 0.78 PSA . . . total..sub.-- RAB11FIP5 ENSG00000135631 0.444522689514033 + 0.593999903134511*RAB11FIP5 0.76 PSA . . . total..sub.-- SNAPC4 ENSG00000165684 0.444889943948596 + 0.612746005772941*SNAPC4 0.76 PSA . . . total..sub.-- LMNA ENSG00000160789 0.409986470208812 + 0.348402891412522*LMNA 0.64 Eosinophils_. SCARNA22 ENSG00000249784 1.29455961910828 + 1.51157194408083*SCARNA22 0.57 Eosinophils_. SNORA36C ENSG00000207016 1.32106746570246 + 1.4949289970043*SNORA36C 0.54 Eosinophils_. SNORA11 ENSG00000221716 1.24052900576161 + 1.44230554450022*SNORA11 0.54 Eosinophils_. RN7SL4P ENSG00000263740 1.05935580726772 + 1.57417742477499*RN7SL4P 0.53 Eosinophils_. SNHG15 ENSG00000232956 1.40294345290673 + 1.36081043128595*SNHG15 0.45 Absolute.Eosinophil_k.uL TMSB4X ENSG00000205542 0.0722050887230592 + 0.102186450139369*TMSB4X 0.41 Absolute.Eosinophil_k.uL CCT3 ENSG00000163468 0.215519649778949 + -0.085289845232217*CCT3 0.40 Absolute.Eosinophil_k.uL TRIM37 ENSG00000108395 0.195256420982459 + -0.0697165663394102*TRIM37 0.38 Absolute.Eosinophil_k.uL C6orf120 ENSG00000185127 0.186400956788973 + -0.0636136758785107*C6orf120 0.38 Absolute.Eosinophil_k.uL SCARNA22 ENSG00000249784 0.102654265156325 + 0.104862734769039*SCARNA22
TABLE-US-00003 TABLE 3 Top predictive gene based on the gene's expression in plasma samples for each blood test result according to linear regression analysis Correlation Score Blood Test Result Gene Name Ensemble ID Formula 0.45 Creatinine_mg.dL DDX3Y ENSG00000067048 0.793889595070931 + 0.111042880176709*DDX3Y 0.45 Creatinine_mg.dL ZFY ENSG00000067646 0.794717048177349 + 0.110912224291987*ZFY 0.44 Creatinine_mg.dL RPS4Y1 ENSG00000129824 0.797691770712918 + 0.1063974025239*RPS4Y1 0.43 Creatinine_mg.dL UTY ENSG00000183878 0.79536615038728 + 0.108780857628159*UTY 0.40 Creatinine_mg.dL EIF1AY ENSG00000198692 0.80259827969781 + 0.102254210816211*EIF1AY 0.48 RBC_m.mm3 UTY ENSG00000183878 4.48521231457716 + 0.344360244986884*UTY 0.45 RBC_m.mm3 DDX3Y ENSG00000067048 4.49212644733203 + 0.333391370781157*DDX3Y 0.45 RBC_m.mm3 ZFY ENSG00000067646 4.49582762495249 + 0.329309620007345*ZFY 0.44 RBC_m.mm3 TXLNGY ENSG00000131002 4.50282284950475 + 0.324347929232679*TXLNGY 0.43 RBC_m.mm3 RPS4Y1 ENSG00000129824 4.50659391938372 + 0.319801899143571*RPS4Y1 0.51 MCHC_g.dL XRCC5 ENSG00000079246 28.4745390044457 + 5.10566513836356*XRCC5 0.42 MCHC_g.dL RAD50 ENSG00000113522 31.2775402234416 + 2.31530729768107*RAD50 0.38 MCHC_g.dL SMARCAD1 ENSG00000163104 31.4895542606002 + 2.10410631998518*SMARCAD1 0.38 MCHC_g.dL TOP2B ENSG00000077097 29.7561062495169 + 3.81519551882321*TOP2B 0.38 MCHC_g.dL UTRN ENSG00000152818 30.6829018688001 + 2.89159349570542*UTRN 0.61 PSA . . . total..sub.-- HNRNPA3P3 ENSG00000214653 0.210294096516657 + 0.469934269166632*HNRNPA3P3 0.58 PSA . . . total..sub.-- GTF3A ENSG00000122034 -0.372586762800658 + 0.97034975245291*GTF3A 0.57 PSA . . . total..sub.-- RP11-342M1.6 ENSG00000237090 0.396515609660464 + 0.324918619671395*RP11-342M1.6 0.55 PSA . . . total..sub.-- HNRNPLP2 ENSG00000259917 0.328107495935833 + 0.317193096343151*HNRNPLP2 0.54 PSA . . . total..sub.-- RPS11P5 ENSG00000232888 0.24545455693342 + 0.491684664852536*RPS11P5
[0088] Tables 4-8 list the blood test results with the most predictive set of genes of based on the genes' mRNA level in whole blood samples, plasma samples, the combination of results from whole blood and plasma samples, all dried blood spot samples, and dried blood spot samples with RNA expression of a high number of genes detected (high-quality dried blood spot samples), respectively. Accordingly, some implementations of the disclosure are directed to kits comprising reagents to measuring the RNA expression of the specific sets of genes listings in Tables 1-8 in whole blood samples, plasma samples, the combination of results from whole blood and plasma samples, any dried blood spot samples, or high-quality dried blood spot samples. Other implementations of the disclosure are directed to methods of using the mRNA level of genes in the specific combinations listed in Tables 4-9 to predict corresponding blood test results. The formulas shown in Tables 1-9 transform the mRNA level into the typically presented blood test results.
[0089] In some implementations, the method comprises determining the subject's blood test result is in the normal range based on the RNA expression count of a gene, which may be determined from the conversion formula. Accordingly, the methods comprise quantifying the RNA expression of a set of genes, for example, the set of genes described listed Tables 1-8 for each combination of blood test and sample type, in the whole blood, plasma, or dried blood spot sample from a subject; and determining the subject has normal results for the corresponding blood test based on the RNA expression count of the set of genes.
[0090] For example, the subject is determined to have a normal percentage of segmented neutrophils if the subject's whole blood has gene counts of between 508 and 574 for RNF24, between 21829 and 22878 for MNDA, and between 9031 and 10757 for WIPF1. In another example, the subject is determined to have a normal percentage of lymphocytes if the subject's whole blood has gene counts of between 4345 and 4583 for GRB2, between 17569 and 19699 for MNDA, and between 3862 and 4492 for NFAM1. In still another example, the subject is determined to have a normal percentage of monocytes if the subject's whole blood has gene counts of between 1311 and 1642 for NAGA, between 629 and 828 for RIN2, between 2773 and 3436 for ADA2, between 3220 and 4087 for PLXNB2, and between 3907 and 5210 for ANXA2. Also from the whole blood sample, a subject may be determined to have a normal level of cholesterol if the subject's whole blood has gene counts of between 13 and 20 for RP5-1139B12.2, between 466 and 794 for GOLGA8A, between 83 and 99 for ENSG00000233280, and between 1186 and 1445 for SMC5. A subject may also be determined to have normal concentration of Aspartate Aminotransferase if the gene count in the whole blood sample for NEFM is between 9 and 52, for THUMPD1 is between 438 and 584, for LDLR is between 570 and 630, for CRTAM is between 66 and 97, and for CHCHD1 is between 35 and 37. Accordingly, if the gene counts for the set of the genes are not within the aforementioned range, the subject may be determined to have abnormal percentage of segmented neutrophils, lymphocytes, or monocytes, abnormal level of cholesterol, or abnormal concentration of Aspartate Aminotransferase.
TABLE-US-00004 TABLE 4 Predictive combination of genes for a blood test result based on the genes' expression in whole blood samples according to multiple regression analysis R.sup.2 Blood Test Result value Combination of Genes Conversion Formula Lymphocytes_. 0.87 GRB2 | MNDA | NFAM1 | 61.368 + GRB2* - 14.435 + MNDA* - 8.518 + NFAM1* - 10.035 Monocytes_. 0.79 NAGA | RIN2 | ADA2 | PLXNB2 | -1.485 + NAGA*2.640 + RIN2*3.203 + ADA2*4.201 + ANXA2 | PLXNB2* - 2.979 + ANXA2*1.699 Segmented.Neutrophils_. 0.77 RNF24 | MNDA | WIPF1 | 28.186 + RNF24*6.599 + MNDA*10.596 + WIPF1*16.517 Apartate.Aminotransferase_IU.L 0.74 NEFM | THUMPD1 | LDLR | CRTAM 29.107 + NEFM*2.117 + THUMPD1*8.922 + LDLR* - | CHCHD1 | 6.926 + CRTAM* - 4.987 + CHCHD1* - 8.460 Cholesterol.sub.-- 0.72 RP5-1139B12.2 | GOLGA8A | -10.889 + RP5-1139B12.2*29.644 + GOLGA8A*51.591 + ENSG00000233280 | SMC5 | ENSG00000233280*71.333 + SMC5*71.353 Eosinophils_. 0.72 PRSS33 | CYSLTR2 | FBN1 | -0.130 + PRSS33*0.793 + CYSLTR2*1.035 + FBN1*0.816 VLDL.Cholesterol.sub.-- 0.69 MAP3K15 | SPDYE5 | 17.169 + MAP3K15*6.338 + SPDYE5*3.931 + KL | CDK15 | KL* - 5.687 + CDK15*3.963 Triglyceride.sub.-- 0.69 MAP3K15 | SPDYE5 | 86.793 + MAP3K15*31.417 + SPDYE5*19.132 + KL | CDK15 | KL* - 28.689 + CDK15*19.605 LDL.Cholesterol . . . Calculated.sub.-- 0.68 ENSG00000233280 | GOLGA8A | -79.067 + ENSG00000233280*60.257 + HGSNAT | PTMAP5 | GOLGA8A*66.896 + HGSNAT*64.237 + PTMAP5*14.510 WBC_K.mm3 0.68 GYPE | SAP30BP | MINPP1 | 3.618 + GYPE* - 0.635 + SAP30BP*4.597 + IGHV2-5 | MINPP1* - 1.280 + IGHV2-5*0.654 Absolute.Neutrophil_k.uL 0.68 SRPK1 | ZFP36L1 | DHRS12 | 0.599 + SRPK1*1.290 + ZFP36L1*1.508 + DHRS12*1.049 TSH . . . High.Sensitivity_mU.L 0.67 ZNF100 | SNHG8 | TMCO6 | 2.512 + ZNF100*0.672 + SNHG8* - 0.852 + MYO15B | TMCO6* - 1.367 + MYO15B*0.775 Anion.Gap_mmol.L 0.66 PGLS | CPSF7 | CXorf65 | 17.595 + PGLS* - 6.162 + CPSF7*3.144 + COX18 | CXorf65*0.882 + COX18* - 2.475 Immature.Granulocyte_. 0.66 RPSAP46 | NUP155 | PCYT2 | -1.755 + RPSAP46*0.235 + NUP155*1.306 + ERCC3 | NFE2L1 | PCYT2*0.832 + ERCC3*0.971 + NFE2L1* - 1.244 Alkaline.Phosphatase_IU.L 0.64 SH3YL1 | NAA38 | SYNM | 51.866 + SH3YL1* - 18.148 + NAA38*15.025 + FLJ21408 | YBEY | SYNM*8.467 + FLJ21408*4.472 + YBEY*5.892 Chloride_mmol.L 0.63 GNPDA1 | NBR2 | HUS1 | 104.120 + GNPDA1* - 1.814 + NBR2*1.105 + IGHJ3 | SPA17 | HUS1* - 1.884 + IGHJ3*0.496 + SPA17* - 0.735 MCH_pg 0.63 SMIM5 | IL1RAP | 33.051 + SMIM5* - 1.319 + IL1RAPM.036 + C10orf128 | PLB1 | C10orf128*0.970 + PLB1* - 1.183 CO2_mmol.L 0.62 FAM157A | NFKB2 | IDI1 | 32.847 + FAM157A* - 1.026 + NFKB2* - 2.175 + BTBD19 | IDI1* - 2.866 + BTBD19* - 1.263 Calcium_mg.dL 0.61 MIOS | SREBF1 | NAA20 | 7.973 + MIOS*1.222 + SREBF1* - 0.414 + ITSN1 | NAA20*0.407 + ITSN1*0.325 T3.Uptake_. 0.61 ZNF469 | ING2 | RP11-22B23.1 | 29.359 + ZNF469*3.708 + ING2* - 3.657 + RP11- EXTL2 | XYLB | 22B23.1* - 1.311 + EXTL2*0.914 + XYLB* - 1.030 T7.Index.sub.-- 0.61 IGHV3-33 | ZNF266 | CCDC183-AS1 3.030 + IGHV3-33* - 0.153 + ZNF266* - 0.781 + | GALK1 | CCDC183-AS1*0.272 + GALK1* - 0.382 Protein . . . Total_g.dL 0.6 ITM2A | CDK2 | SNORA80A | DLG3 | 6.270 + ITM2A*0.435 + CDK2*0.469 + SNORA80A* - 0.278 + DLG3*0.297 Phosphorus . . . inorganic._mg.dL 0.6 IL18RAP | SMPD2 | KANSL2 | 3.756 + IL18RAP* - 0.273 + SMPD2* - 0.606 + CLCN1 | SNORA20 | KANSL2*0.688 + CLCN1* - 0.188 + SNORA20* - 0.177 GGT_IU.L 0.6 SERPINE1 | OTUD3 | SORBS2 | -9.959 + SERPINE1*4.791 + OTUD3*14.382 + TMEM189 | TFF3 | SORBS2*3.572 + TMEM189*5.399 + TFF3*3.206 MCV_fl 0.59 TMEM183A | DTX3 | RPL36AL | 89.752 + TMEM183A* - 8.108 + DTX3*4.893 + COCH | RPL36AL*6.015 + COCH* - 1.233 Non.HDL.Cholesterol.sub.-- 0.59 HGSNAT | ENSG00000233280 | -102.769 + HGSNAT*93.920 + PKD1P5 | SMC5 | ENSG00000233280*46.891 + PKD1P5*17.329 + SMC5*96.950 Sodium_mmol.L 0.59 BTRC | AMD1P3 | WASHC2C | 137.476 + BTRC*2.416 + AMD1P3*0.793 + ZNF575 | RP11-156P1.3 | WASHC2C* - 1.945 + ZNF575*0.861 + RP11- 156P1.3*0.777 Globulin_g.dL 0.59 MYH3 | IL18BP | ENSG00000196533 3.455 + MYH3* - 0.292 + IL18BP* - 0.619 + | FASLG | ENSG00000196533* - 0.178 + FASLG*0.266 Absolute.Lymphocyte_k.uL 0.59 OAZ2 | KCNE3 | RRP1B | 2.699 + OAZ2* - 0.986 + KCNE3* - 0.580 + RRP1B*0.778 Platelet.Count_k.mm3 0.59 SLC37A2 | ERG | IGLV3-12 | 295.099 + SLC37A2* - 62.377 + ERG* RASSF8 | 13.913 + IGLV3-12*15.408 + RASSF8*18.805 MPV_fl 0.59 TMCO3 | GKAP1 | LRRN1 | 11.973 + TMCO3* - 1.361 + GKAP1*0.850 + SEPT7P8 | LRRN1* - 0.438 + SEPT7P8* - 0.194 T3.Total_ng.dL 0.58 MTPAP | EBPL | NRROS | 113.871 + MTPAP* - 23.347 + EBPL*16.072 + PMS2P5 | KIF17 | NRROS* - 15.683 + PMS2P5*18.738 + KIF17*8.796 BUN_mg.dL 0.58 RFX2 | HIST2H2BA | ALG1L10P | 19.980 + RFX2* - 2.309 + HIST2H2BA*1.226 + CDK16 | MEIS2 | ALG1L10P*0.784 + CDK16* - 7.209 + MEIS2*0.785 Cholesterol.HDL.Ratio.sub.-- 0.57 NCBP2L | ENSG00000157828 | 0.238 + NCBP2L*0.458 + ENSG00000157828*0.205 + BRWD1 | NOS3 | BRWD1*3.580 + NOS3* - 0.658 RDW . . . sd._fl 0.57 PLEKHA5 | DNAL1 | 40.743 + PLEKHA5*1.542 + DNAL1*2.069 + ENSG00000197262 | HNRNPCP2 | ENSG00000197262* - 0.857 + HNRNPCP2* - 2.781 + IGHV1-69 | IGHV1-69*1.463 Thyroxine . . . T4._ug.dL 0.56 IQCE | PNLDC1 | RP1-34B20.4 | 6.393 + IQCE*1.833 + PNLDC1*0.717 + RP1- GTF2H2B | RBM3 | 34B20.4*0.793 + GTF2H2B* - 0.514 + RBM3* - 1.689 BUN.Creatine.Ratio.sub.-- 0.55 HIST2H2BA | ENSG00000235999 | 17.177 + HIST2H2BA*1.583 + USF2 | LOC652276 | ENSG00000235999*2.443 + USF2* - 7.711 + LOC652276*2.267 Albumin . . . Globulin.Ratio.sub.-- 0.55 IL18BP | SYCE1 | SNORA80A | 0.842 + IL18BP*0.386 + SYCE1*0.069 + CCZ1 | SNORA80A*0.192 + CCZ1*0.257 Absolute.Monocyte_k.uL 0.55 NAGA | ADA2 | -0.012 + NAGA*0.322 + ADA2*0.202 Bilirubin . . . Total_mg.dL 0.55 CHI3L2 | ATXN7L1 | INTS4P1 | 0.742 + CHI3L2*0.091 + ATXN7L1* - 0.359 + ZNF853 | EGFL7 | INTS4P1*0.056 + ZNF853* - 0.139 + EGFL7*0.090 Uric.Acid_mg.dL 0.54 PARVB | ST7 | 2.013 + PARVB*1.483 + ST7*1.231 RDW . . . cv._. 0.54 PLEKHH2 | NMT2 | HNRNPLP2 | 11.820 + PLEKHH2*0.422 + NMT2*0.964 + HNRNPLP2* - 0.516 MCHC_g.dL 0.54 DTX4 | SCOC | PCMTD1 | 29.803 + DTX4*1.328 + SCOC*1.293 + PCMTD1*1.242 HDL.Cholesterol.sub.-- 0.54 SCARB1 | FLYWCH1 | NDUFS6 | 67.537 + SCARB1* - 10.340 + FLYWCH1*7.970 + RPSAP14 | ZNF442 | NDUFS6* - 17.096 + RPSAP14*2.312 + ZNF442*5.841 Potassium_mmol.L 0.53 LRRC28 | RP11-167N4.2 | 3.919 + LRRC28*0.614 + RP11-167N4.2* - 0.270 + CLEC11A | CLEC11A*0.165 Albumin_g.dL 0.5 KANSL3 | FNBP4 | PGM1 | 3.347 + KANSL3*0.837 + FNBP4*0.724 + PGM1* - 0.376 Glucose_mg.dL 0.49 HMGB1P1 | EXT2 | SCAMP5 | 62.755 + HMGB1P1*6.262 + EXT2*23.950 + GUSBP3 | SCAMP5* - 4.129 + GUSBP3*4.837 Absolute.Basophil_k.uL 0.49 GATA2 | SLC45A3 | -0.047 + GATA2*0.084 + SLC45A3*0.024 Absolute.Eosinophil_k.uL 0.49 PRSS41 | CLC | ACOT11 | 0.051 + PRSS41*0.031 + CLC*0.031 + ACOT11*0.052 Creatinine_mg.dL 0.48 USP9Y | 0.789 + USP9Y*0.122 Lactic.Dehydrogenase_IU.L 0.47 PITPNM3 | RAB31 | 173.513 + PITPNM3*7.515 + RAB31* - 35.371 + ZNF138 | CLEC9A | ZNF138*19.571 + CLEC9A* - 8.565 RBC_m.mm3 0.47 DDX3Y | 4.476 + DDX3Y*0.343 Hematocrit_. 0.46 NFYA | PRKY | 51.088 + NFYA* - 9.748 + PRKY*1.422 Alaine.Aminotransferase_IU.L 0.46 RNASE3 | DEFA4 | 14.551 + RNASE3*5.042 + DEFA4*4.534 Osmolality . . . Calculated_mOsm.kg 0.39 EIF1AY | 284.603 + EIF1AY*2.352 Hemoglobin_g.dL 0.37 USP9Y | 13.649 + USP9Y*0.878
TABLE-US-00005 TABLE 5 Predictive combination of genes for a blood test result based on the genes' expression in plasma samples according to multiple regression analysis R.sup.2 Blood Test Result value Combination of Genes Conversion Formula Absolute.Eosinophil_k.uL 0.65 CLC | ADAT1 | SNRPEP4 | GPC6 | 0.003 + CLC*0.058 + ADAT1*0.111 + SNRPEP4* - 0.027 + GPC6*0.017 Anion.Gap_mmol.L 0.65 DHX40 | SLC1A4 | IMPA2 | KATNA1 | 8.466 + DHX40*2.429 + SLC1A4* - 1.006 + MEIS3P1 | IMPA2*1.263 + KATNA1*1.667 + MEIS3P1*0.506 Lymphocytes_. 0.6 LAMB1 | IRF6 | RXFP1 | FPGT | 25.096 + LAMB1* - 1.424 + IRF6* - CLECL1 | 2.601 + RXFP1* - 1.102 + FPGT*4.816 + CLECL1*3.539 CO2_mmol.L 0.6 C8orf58 | CFL2 | EPHX2 | AHDC1 | 25.672 + C8orf58* - 1.275 + CFL2* - 1.462 + EPHX2*1.095 + AHDC1*1.706 Absolute.Basophil_k.uL 0.58 RRM1 | SLC7A8 | CCSER2 | 0.189 + RRM1* - 0.097 + SLC7A8*0.031 + CCSER2* - 0.070 MCV_fl 0.57 CLCNKB | OTUD4P1 | PIKFYVE | 96.222 + CLCNKB* - 1.520 + OTUD4P1*1.489 + MFN2 | PIKFYVE* - 6.486 + MFN2*1.711 RDW . . . cv._. 0.57 SKIL | RAMP3 | KDM8 | SOCS4 | 13.499 + SKIL* - 1.011 + RAMP3*0.205 + KDM8*0.663 + SOCS4* - 0.688 BUN_mg.dL 0.57 C5orf66 | BLOC1S5 | MRPL54 | 12.909 + C5orf66*1.426 + BLOC1S5*1.948 + MRPL54* - 2.900 MCHC_g.dL 0.56 XRCC5 | RAD50 | SPRTN | 29.328 + XRCC5*2.587 + RAD50*0.909 + SPRTN*0.805 T7.Index.sub.-- 0.55 AXDND1 | ENSG00000232745 | 1.737 + AXDND1* - 0.119 + FAM117A | C9orf172 | ENSG00000232745* - 0.171 + FAM117A*0.409 + C9orf172*0.113 Segmented.Neutrophils_. 0.53 RXFP1 | POLR3GL | FOXK2 | 58.500 + RXFP1*2.118 + POLR3GL* - LAMB1 | 5.441 + FOXK2*5.098 + LAMB1*2.226 Cholesterol.HDL.Ratio.sub.-- 0.52 DES | TUG1 | KIAA1217 | 2.370 + DES* - 0.389 + TUG1*0.348 + MFSD9 | KIAA1217*0.422 + MFSD9*0.968 Uric.Acid_mg.dL 0.52 ZFY | C9orf78 | CDH26 | 2.179 + ZFY*0.432 + C9orf78*1.823 + CDH26*0.476 Osmolality . . . Calculated_mOsm.kg 0.52 ZFY | SLC15A2 | 289.077 + ZFY*1.786 + SLC15A2* - 4.292 BUN.Creatine.Ratio.sub.-- 0.51 CHN1 | ENSG00000205021 | RDM1B | 7.190 + CHN1*1.694 + ENSG00000205021*1.256 + C5orf66 KDM1B*4.564 + C5orf66*1.421 Globulin_g.dL 0.51 HNRNPLP2 | HLA-G | SETP14 | 2.218 + HNRNPLP2*0.177 + HLA-G*0.242 + SETP14*0.142 Alkaline.Phosphatase_IU.L 0.51 LNX2 | CH17-12M21.1 | TTC26 | 30.327 + LNX2*25.914 + CH17-12M21.1*4.929 + TTC26*7.892 Lactic.Dehydrogenase_IU.L 0.51 AFF2 | MERTK | AXDND1 | RP11- 149.778 + AFF2*17.419 + MERTK* - 11.816 + 603B24.1 | AXDND1*7.350 + RP11-603B24.1* - 4.700 Absolute.Neutrophil_k.uL 0.5 MYO1A | ENSG00000140181 | ROBO1 | 5.258 + MYO1A* - 0.566 + ENSG00000140181* - 0.969 + ROBO1*0.348 T3.Uptake_. 0.5 AP3S2 | RPL23AP52 | PSMC3IP | 29.044 + AP3S2* - 1.168 + RPL23AP52* - 1.337 + SAXO2 | PSMC3IP*1.603 + SAXO2* - 0.715 Alaine.Aminotransferase_IU.L 0.5 MMP8 | CRISP3 | RPL39L | 12.355 + MMP8*5.526 + CRISP3*3.331 + RPL39L*3.528 Bilimbin . . . Total_mg.dL 0.5 TGM2 | NEK6 | XCL2 | BZW2 | 0.547 + TGM2*0.096 + NEK6* - 0.171 + XCL2* - 0.104 + BZW2*0.087 Thyroxine . . . T4._ug.dL 0.49 CDCA8 | RPS12P23 | GTSE1 | 7.359 + CDCA8* - 0.532 + RPS12P23*0.582 + N4BP3 | GTSE1* - 0.552 + N4BP3*0.563 Triglyceride.sub.-- 0.49 RP11-516A11.1 | CHSY1 | ZNF816 | 56.067 + RP11-516A11.1* - 27.741 + CHSY1*57.871 + ZNF816*30.405 VLDL.Cholesterol.sub.-- 0.49 RP11-516A11.1 | CHSY1 | ZNF816 | 11.166 + RP11-516A11.1* - 5.595 + CHSY1*11.697 + ZNF816*6.044 Sodium_mmol.L 0.49 MRRF | PDCD6IP | SMN2 | ERRFI1 | 144.248 + MRRF* - 1.755 + PDCD6IP* - 1.584 + SMN2* - 0.501 + ERRFI1* - 0.598 Albumin_g.dL 0.49 SNF8 | TWF2 | PAQR4 | FAM26F | 3.950 + SNF8*0.254 + TWF2*0.118 + PAQR4*0.122 + FAM26F*0.154 Albumin . . . Globulin.Ratio.sub.-- 0.49 SEPT10 | HLA-G | GPR146 | 1.591 + SEPT10*0.165 + HLA-G* - 0.071 + HNRNPLP2 | GPR146*0.109 + HNRNPLP2* - 0.084 RBC_m.mm3 0.48 UTY 4.485 + UTY*0.344 Platelet.Count_k.mm3 0.48 JADE3 | ZMIZ1 | VNN1 | 328.471 + JADE3*16.865 + ZMIZ1* - 50.872 + ENSG00000214982 | VNN1*16.123 + ENSG00000214982* - 37.657 MPV_fl 0.48 CBR1 | CHIC2 | FANK1 | BAIAP2 | 10.962 + CBR1*0.549 + CHIC2* - 1.242 + FANK1*0.300 + BAIAP2*0.475 TSH . . . High.Sensitivity_mU.L 0.47 SLC26A8 | ITGB8 | WNK4 | 0.947 + SLC26A8*0.530 + ITGB8*0.292 + WNK4*0.229 Creatinine_mg.dL 0.47 ZFY | 0.793 + ZFY*0.120 Calcium_mg.dL 0.47 IGLV3-19 | HSPA1B | JCHAIN | 10.138 + IGLV3-19* - 0.153 + HSPA1B* - 0.458 + JCHAIN* - 0.118 Potassium_mmol.L 0.46 SYK | BAK1 | SCIN | ANO5 | 4.995 + SYK* - 0.265 + BAK1* - 0.206 + SCIN* - 0.113 + ANO5* - 0.103 RDW . . . sd._fl 0.45 EOGT | ABHD13 | NUDCD1 | 42.919 + EOGT*2.466 + ABHD13* - 1.634 + NUDCD1* - 1.817 Cholesterol.sub.-- 0.45 AURKB | RNF103 | C3orf79 | 169.209 + AURKB* - 22.224 + RNF103*43.571 + C3orf79*17.506 Protein . . . Total_g.dL 0.45 RP11-516A11.1 | SLC4A11 | UBR7 | 6.619 + RP11-516A11.1*0.136 + SLC4A11*0.102 + BFSP2 | UBR7*0.334 + BFSP2*0.099 Absolute.Lymphocyte_k.uL 0.44 AC138623.1 | DPPA4 | ZNF688 | 1.450 + AC138623.1*0.177 + DPPA4*0.241 + ZNF688*0.221 Absolute.Monocyte_k.uL 0.44 TMED7 | ADSSL1 | PSMB6 | RP11- 0.422 + TMED7* - 0.067 + ADSSL1*0.045 + 832N8.1 | PSMB6*0.136 + RP11-832N8.1* - 0.054 LDL.Cholesterol . . . Calculated.sub.-- 0.43 ENG | MERTK | PSMD9 | NFIC | 214.896 + ENG* - 21.550 + MERTK* - 26.626 + PSMD9* - 14.801 + NFIC* - 42.993 Eosinophils_. 0.42 SUPT3H | ZNF662 | ZSCAN30 | -0.566 + SUPT3H*1.584 + ZNF662*0.474 + ZSCAN30*0.965 Non.HDL.Cholesterol.sub.-- 0.41 SBDSP1 | RNF103 | DES | 80.611 + SBDSP1*36.140 + RNF103*39.399 + DES* - 11.264 Glucose_mg.dL 0.41 ENSG00000138297 | JAG2 | DNAJB4 | 75.380 + ENSG00000138297*12.952 + JAG2* - 3.585 + DNAJB4*7.969 Hematocrit_. 0.4 UTY | C9orf40 | 39.838 + UTY*1.450 + C9orf40*2.060 Phosphorus . . . inorganic._mg.dL 0.4 CNRIP1 | NSL1 | MUC4 | 3.928 + CNRIP1* - 0.181 + NSL1* - 0.488 + MUC4* - 0.128 GGT_IU.L 0.4 CD84 | SCIN | UCP2 | 10.005 + CD84*4.097 + SCIN*3.028 + UCP2*4.275 WBC_K.mm3 0.39 HAVCR2 | SLC24A1 | 8.561 + HAVCR2* - 0.990 + SLC24A1* - 0.934 Monocytes_. 0.38 CADM2 | MTCL1 | SAMD10 | 7.869 + CADM2* - 0.751 + MTCL1* - 0.837 + SAMD10*0.597 T3.Total_ng.dL 0.38 OPA1 | FDX1 | TRDV1 | 70.678 + OPA1*28.331 + FDX1*14.297 + TRDV1*5.626 MCH_pg 0.37 SH2B2 | MIPEP | TPMT | 30.413 + SH2B2* - 0.591 + MIPEP* - 0.528 + TPMT*1.203 Immature.Granulocyte_. 0.37 CDCA7L | TMEM99 | FUT10 | -0.454 + CDCA7L*0.384 + TMEM99*0.229 + FUT10*0.213 HDL.Cholesterol.sub.-- 0.37 SBNO1 | ACTR8 | ZFY | 87.733 + SBNO1* - 20.008 + ACTR8* - 10.976 + ZFY* - 3.830 Hemoglobin_g.dL 0.33 ANOS2P | ZFY | 13.685 + ANOS2P*0.458 + ZFY*0.428 Chloride_mmol.L 0.18 HBEGF | IL1RAPL1 | 101.368 + HBEGF* - 0.524 + IL1RAPL1*0.585 Apartate.Aminotransferase_IU.L 0.11 HHEX | 14.976 + HHEX*5.171
TABLE-US-00006 TABLE 6 Predictive combination of genes for a blood test result based on the genes' expression in either whole blood or plasma samples according to multiple regression analysis R.sup.2 Combination of Genes and Source Blood Test Result value of Expression Information Conversion Formula RDW . . . sd._fl 0.68 CHCHD2P6 (Plasma) | SEC63P1 (Plasma) | 37.446 + CHCHD2P6*1.489 + SEC63P1*1.463 + DNAL1 (Blood) | ENSG00000197262 (Blood) | DNAL1*3.237 + ENSG00000I97262*1.214 T7.Index.sub.-- 0.65 IGHV3-33 (Blood) | ZNF266 (Blood) | CCDC183- 2.706 + IGHV3-33* - 0.152 + ZNF266* - 0.762 + AS1 (Blood) | ENSG00000232745 (Plasma) | CCDC183-AS1*0.296 + ENSG00000232745* - 0.125 MCHC_g.dL 0.62 DTX4 (Blood) | LRIF1 (Plasma) | SCOC (Blood) | 29.423 + DTX4*0.884 + LRIF1*0.755 + SCOC*1.191 + PCMTD1 (Blood) | PCMTD1*1.435 Thyroxine . . . T4._ug.dL 0.57 CDCA8 (Plasma) | IQCE (Blood) | PNLDC1 4.553 + CDCA8* - 0.693 + IQCE*2.069 + (Blood) | RP1-34B20.4 (Blood) | PNLDC1*0.730 + RP1-34B20.4*0.943
TABLE-US-00007 TABLE 7 Predictive combination of genes for a blood test result based on the genes' expression in all dried blood spot samples according to multiple regression analysis R.sup.2 Blood Test Result value Combination of Genes Conversion Formula Alaine.Aminotransferase_IU.L 0.66 EIF1AY | SRXN1 | NDUFAF2 | TBCE | 19.003 + EIF1AY*3.710 + SRXN1*2.987 + NDUFAF2*4.296 + TBCE* - 5.521 Eosinophils_. 0.63 SCARNA22 | TET3 | 0.850 + SCARNA22*0.942 + TET3*0.868 Absolute.Neutrophil_k.uL 0.58 MMP25 | KAT2B | DOK3 | 3.574 + MMP25*0.681 + KAT2B* - 0.558 + DOK3*0.610 RBC_m.mm3 0.58 EIF1AY | DDX3Y | BCL2L13 | 4.387 + EIF1AY*0.215 + DDX3Y*0.147 + BCL2L13*0.174 Platelet.Count_k.mm3 0.55 SNORA19 | SNCA | FCHO2 | 280.688 + SNORA19*12.416 + SNCA* - 19.917 + ARHGAP10 | FCHO2* - 21.947 + ARHGAP10*19.487 RDW . . . sd._fl 0.55 JAM3 | PEX10 | N4BP2L2 | NCAPG | 43.901 + JAM3*0.830 + PEX10*1.106 + N4BP2L2* - 2.563 + NCAPG* - 0.876 Anion.Gap_mmol.L 0.54 FOLR3 | SNORD116-15 | TIMELESS | 13.470 + FOLR3* - 0.512 + ANKRD54 | SNORD116-15* - 0.446 + TIMELESS*0.816 + ANKRD54* - 0.661 CO2_mmol.L 0.54 PPP1R12C | TPT1 | IK | 26.246 + PPP1R12C* - 1.447 + TPT1*1.727 + IK* - 0.807 HDL.Cholesterol.sub.-- 0.53 GNAQ | SCARNA9 | DDX3Y | INTS13 | 49.432 + GNAQ*3.596 + SCARNA9*3.748 + DDX3Y* - 3.237 + INTS13*4.036 Osmolality . . . Calculated_mOsm.kg 0.52 EIF1AY | CCNF | DDX41 | TRAPPC8 | 286.876 + EIF1AY*1.130 + CCNF*1.099 + DDX41* - 1.006 + TRAPPC8* - 1.648 Creatinine_mg.dL 0.51 EIF1AY | PRKY | XIST | RPS4Y1 | 0.835 + EIF1AY*0.046 + PRKY*0.042 + XIST* - 0.042 + RPS4Y1*0.034 Hematocrit_. 0.51 DDX3Y | TTC8 | UTY | SPDL1 | 41.765 + DDX3Y*1.047 + TTC8* - 1.199 + UTY*0.827 + SPDL1*1.051 Lymphocytes_. 0.5 RPL23A | LPIN1 | MRPS11 | RGS6 | 25.554 + RPL23A*4.075 + LPIN1*2.745 + MRPS11*3.109 + RGS6* - 5.810 Absolute.Eosinophil_k.uL 0.5 CCT3 | C6orf120 | RHOG | 0.211 + CCT3* - 0.042 + C6orf120* - 0.032 + RHOG* - 0.022 MCV_fl 0.49 ISPD | MARK3 | CHD3 | STRN3 | 92.995 + ISPD* - 1.413 + MARK3* - 1.332 + CHD3*2.159 + STRN3* - 1.626 Absolute.Lymphocyte_k.uL 0.49 CAMP | ENDOD1 | NEDD4L | 2.180 + CAMP*0.123 + ENDOD1*0.154 + ALS2CR12 | NEDD4L* - 0.259 + ALS2CR12* - 0.230 TSH . . . High.Sensitivity_mU.L 0.49 KIF21A | MIA3 | 1.216 + KIF21A*0.402 + MIA3*0.475 LDL.Cholesterol . . . Calculated.sub.-- 0.48 SNORD116-26 | PTMAP5 | ECT2 | 98.596 + SNORD116-26*10.898 + PTMAP5*14.280 + IL31RA | NAP1L2 | ECT2*11.341 + IL31RA* - 17.483 + NAP1L2*7.391 Calcium_mg.dL 0.46 RPS11 | TLK2P1 | UBTD1 | 9.444 + RPS11*0.225 + TLK2P1* - 0.122 + UBTD1* - 0.171 Segmented.Neutrophils_. 0.45 HMGB1P1 | CSRNP1 | CCNJL | 55.794 + HMGB1P1*2.817 + CSRNP1*2.822 + CCNJL*2.452 RDW . . . cv._. 0.44 RGS10 | N4BP2L2 | MMD | 12.957 + RGS10*0.370 + N4BP2L2* - 0.695 + MMD*0.139 Sodium_mmol.L 0.44 PGBD2 | PRPF18 | TATDN3 | KRT1 | 140.710 + PGBD2* - 0.385 + PRPF18*0.595 + TATDN3* - 0.333 + KRT1* - 0.536 WBC_K.mm3 0.43 CDK8 | EPB41 | RAB11B | 8.013 + CDK8* - 0.483 + EPB41* - 0.709 + RAB11B* - 0.318 Bilirubin . . . Total_mg.dL 0.43 LRRC37A4P | DNAJC2 | PIK3CB | 0.423 + LRRC37A4P*0.077 + DNAJC2*0.077 + PDP2 | PIK3CB* - 0.055 + PDP2* - 0.048 T7.Index.sub.-- 0.42 UBBP4 | LUC7L | GIT2 | COA5 | 1.950 + UBBP4*0.127 + LUC7L*0.103 + GIT2* - 0.097 + COA5* - 0.101 Immature.Granulocyte_. 0.42 TRAF3IP1 | NOC3L | CFAP161 | -0.007 + TRAF3IP1*0.173 + NOC3L*0.236 + CFAP161*0.112 BUN_mg.dL 0.42 FSD1L | C6orf48 | ZC3H15 | LRRK2 | 10.116 + FSD1L*1.476 + C6orf48*0.902 + RP11-632K20.7 | ZC3H15* - 1.686 + LRRK2*1.607 + RP11-632K20.7*1.534 Albumin_g.dL 0.42 ORC1 | BICDL2 | PSMC3IP | 4.527 + ORC1*0.067 + BICDL2* - 0.110 + PSMC3IP*0.076 Non.HDL.Cholesterol.sub.-- 0.41 IL31RA | PARL | BLOC1S6 | 143.318 + IL31RA* - 14.229 + PARL* - 18.019 + BLOC1S6*24.533 Hemoglobin_g.dL 0.41 DDX3Y | IFNGR2 | FBXW7 | 14.050 + DDX3Y*1.140 + IFNGR2*0.577 + FBXW7* - 0.947 Absolute.Monocyte_k.uL 0.4 UBBP4 | GGA1 | KLF7 | FARSA | 0.471 + UBBP4* - 0.073 + GGA1*0.041 + KLF7*0.041 + FARSA*0.040 Monocytes_. 0.39 CCDC115 | RECQL4 | SASS6 | 8.259 + CCDC115* - 1.082 + RECQL4* - 0.505 + SASS6* - 0.432 MCH_pg 0.39 MIR15A | C1GALT1 | SAMD9 | SNCA | 30.097 + MIR15A*0.372 + C1GALT1* - 0.498 + SAMD9*0.275 + SNCA*0.434 Uric.Acid_mg.dL 0.38 EIF1AY | IFNGR2 | WHAMMP2 | 4.400 + EIF1AY*0.449 + IFNGR2*0.274 + WHAMMP2* - 0.377 Absolute.Basophil_k.uL 0.38 POLB | ATRIP | DIP2A | 0.091 + POLB* - 0.018 + ATRIP* - 0.023 + DIP2A* - 0.016 Phosphorus . . . inorganic._mg.dL 0.38 RECK | HIKESHI | CMC1 | 3.554 + RECK* - 0.146 + HIKESHI* - 0.125 + CMC1* - 0.197 Cholesterol.HDL.Ratio.sub.-- 0.37 GOLGA2 | UTY | ARIH1 | 4.056 + GOLGA2* - 0.432 + UTY*0.447 + ARIH1* - 0.532 VLDL.Cholesterol.sub.-- 0.37 G0S2 | ZHX3 | 24.116 + G0S2*4.296 + ZHX3* - 4.787 MPV_fl 0.37 IMPDH1 | FCHO1 | 11.584 + IMPDH1* - 0.514 + FCHO1* - 0.359 T3.Total_ng.dL 0.37 RP11-707O23.5 | UQCC1 | BEX3 | 113.352 + RP11-707023.5*7.613 + UQCC1*5.937 + BEX3* - 9.050 GGT_IU.L 0.36 EIF1AY | SEPT2 | MTMR3 | 20.448 + EIF1AY*4.166 + SEPT2* - 3.769 + MTMR3* - 2.967 Potassium_mmol.L 0.36 STAG3 | SREBF1 | HSP90AA1 | 4.615 + STAG3* - 0.128 + SREBF1* - 0.105 + HSP90AA1* - 0.103 Globulin_g.dL 0.36 ABCG2 | LSM2 | 2.524 + ABCG2*0.157 + LSM2*0.129 Lactic.Dehydrogenase_IU.L 0.35 NSUN6 | ENSG00000211953 | SMIM13 161.058 + NSUN6* - 5.722 + ENSG00000211953*8.385 + SMIM13* - 7.785 Protein . . . Total_g.dL 0.35 VAMP4 | TREML1 | SHMT1 | 6.992 + VAMP4*0.166 + TREML1*0.098 + SHMT1*0.096 Albumin . . . Globulin.Ratio.sub.-- 0.33 ABCG2 | ACOT8 | 1.815 + ABCG2* - 0.103 + ACOT8* - 0.108 MCHC_g.dL 0.33 DDX3Y | AURKA | 33.101 + DDX3Y*0.361 +AURKA*0.390 Glucose_mg.dL 0.31 AKIRIN1 | ENSG00000196331 | 87.285 + AKIRIN1*4.455 + ENSG00000196331*4.462 Alkaline.Phosphatase_IU.L 0.31 SCAF8 | POLE4 | 58.928 + SCAF8*5.435 + POLE4*6.309 T3.Uptake_. 0.3 SRF | ZNF736 | 29.281 + SRF* - 1.142 + ZNF736* - 0.955 Apartate.Aminotransferase_IU.L 0.29 RASSF4 | MECP2 | ACTR6 | 21.744 + RASSF4*11.652 + MECP2* - 11.011 + ACTR6* - 3.542 BUN.Creatine.Ratio.sub.-- 0.29 MTMR11 | ZNF865 | 12.749 + MTMR11*1.415 + ZNF865*1.554 Chloride_mmol.L 0.28 SPC24 | IL17RA | 100.088 + SPC24*0.557 + IL17RA*1.141 Cholesterol.sub.-- 0.27 BLOC1S6 | ARPP19 | 181.520 + BLOC1S6*20.047 + ARPP19*15.122 Triglyceride.sub.-- 0.25 RN7SL5P | G0S2 | 98.336 + RN7SL5P*18.347 + G0S2*13.272 Thyroxine . . . T4._ug.dL 0.23 DIRC2 | LDLR | 6.827 + DIRC2*0.526 + LDLR*0.589
TABLE-US-00008 TABLE 8 Predictive combination of genes for a blood test result based on the genes' expression in high-quality dried blood spot samples according to multiple regression analysis R.sup.2 Blood Test Result value Combination of Genes Conversion Formula Non.HDL.Cholesterol.sub.-- 0.84 BMT2 | PKD1P5 | ARIH1 | 190.187 + BMT2* - 39.633 + PKD1P5*24.799 + ARIH1* - 36.288 Eosinophils_. 0.78 NDUFA5 | MCM8 | 1.637 + NDUFA5*0.652 + MCM8* - 0.888 RBC_m.mm3 0.76 PRKY | OARD1 | 5.018 + PRKY*0.306 + OARD1* - 0.552 Absolute.Neutrophil_k.uL 0.76 AC079140.2 | RAP1GAP | 1.295 + AC079140.2*0.434 + RAP1GAP*0.191 T7.Index.sub.-- 0.74 C7orf50 | ARHGAP10 | 169.734 + C7orf50*60.129 + ARHGAP10*45.009 Lymphocytes_. 0.73 C7orf73 | ATG16L2 | 3.708 + C7orf73* - 1.104 + ATG16L2*1.673 Creatinine_mg.dL 0.73 RPS6KA5 | HAL | MYO6 | 2.205 + RPS6KA5* - 0.307 + HAL* - 0.158 + MYO6*0.314 Absolute.Eosinophil_k.uL 0.71 SEPT7 | DDX11L5 | ODF2L | 137.493 + SEPT7*2.407 + DDX11L5*0.771 + ODF2L* - 0.574 Platelet.Count_k.mm3 0.71 RPL4P5 | RN7SL396P | 11.287 + RPL4P5*8.000 + RN7SL396P*2.881 Cholesterol.sub.-- 0.7 CENPE | PLEC | NEK1 | 13.118 + CENPE* - 0.541 + PLEC*0.542 + NEK1* - 0.622 CO2_mmol.L 0.69 UTRN | CD247 | FAM133B | 21.612 + UTRN*7.280 + CD247*3.664 + FAM133B* - 2.998 Globulin_g.dL 0.69 TOPORS | CHD3 | LCMT2 | 37.378 + TOPORS* - 3.897 + CHD3* - 4.481 + LCMT2* - 1.476 Albumin . . . Globulin.Ratio.sub.-- 0.69 BLOC1S2 | PRPF18 | PRKY | 281.269 + BLOC1S2*2.260 + PRPF18*1.743 + PRKY*1.671 GGT_IU.L 0.68 GSK3A | RHOBTB1 | TMEM64 | 35.870 + GSK3A*2.889 + RHOBTB1*2.033 + TMEM64*2.648 Osmolality . . . Calculated_mOsm.kg 0.68 EPSTI1 | CIR1 | PMS2P1 | 217.443 + EPSTI1* - 62.074 + CIR1* - 43.229 + PMS2P1* - 20.816 RDW . . . sd._fl 0.68 EPSTI1 | PMS2P1 | CIR1 | 43.728 + EPSTI1* - 12.414 + PMS2P1* - 4.321 + CIR1* - 8.806 Absolute.Basophil_k.uL 0.68 SPDL1 | XIST | 0.868 + SPDL1*0.125 + XIST* - 0.133 T3.Total_ng.dL 0.67 BEND2 | METTL9 | ARHGAP10 | -0.012 + BEND2*0.040 + METTL9*0.060 + ARHGAP10*0.045 Anion.Gap_mmol.L 0.67 RAD18 | MTFMT | 7.714 + RAD18*3.284 + MTFMT*2.233 MPV_fl 0.67 SPIDR | SCARNA8 | MRPL1 | 0.700 + SPIDR* - 0.225 + SCARNA8*0.075 + MRPL1* - 0.122 BUN.Creatine.Ratio.sub.-- 0.66 SENP6 | PTPN9 | 31.454 + SENP6*1.849 + PTPN9*0.407 Absolute.Monocyte_k.uL 0.66 BMT2 | ZNF561 | 205.331 + BMT2* - 45.826 + ZNF561*32.029 WBC_K.mm3 0.66 ISPD | RHOBTB1 | 22.903 + ISPD*2.134 + RHOBTB1*1.206 Segmented.Neutrophils_. 0.65 AKAP12 | APP | 3.478 + AKAP12*1.431 + APP*2.342 HDL.Cholesterol.sub.-- 0.64 C1GALT1 | SSX2IP | 2.335 + C1GALT1*0.276 + SSX2IP*0.245 Uric.Acid_mg.dL 0.63 ATG16L2 | EPB41 | 5.763 + ATG16L2*2.012 + EPB41* - 1.000 Lactic.Dehydrogenase_IU.L 0.63 CASP8AP2 | PIN1 | 1.676 + CASP8AP2*0.190 + PIN1* - 0.177 Cholesterol.HDL.Ratio.sub.-- 0.63 FBXO28 | UNC13B | PAFAH1B2 | 76.189 + FBXO28* - 7.825 + UNC13B*9.059 + PAFAH1B2* - 11.419 Albumin_g.dL 0.62 KPNA5 | MTCH2 | SIRT5 | 18.205 + KPNA5*10.349 + MTCH2* - 6.415 + SIRT5* - 6.980 LDL.Cholesterol . . . Calculated.sub.-- 0.6 BRIX1 | BABAM1 | GSK3A | 11.947 + BRIX1*0.980 + BABAM1*0.632 + GSK3A*0.885 BUN_mg.dL 0.59 GNG11 | NCOA2 | 44.944 + GNG11*1.759 + NCOA2* - 4.385 Immature.Granulocyte_. 0.59 NUDT3 | YEATS4 | ANP32B | -0.026 + NUDT3*0.045 + YEATS4* - 0.020 + ANP32B*0.041 Phosphorus . . . inorganic._mg.dL 0.59 RMND1 | TRAF4 | 98.038 + RMND1*14.283 + TRAF4*9.635 Hematocrit_. 0.59 MARC1 | SREK1IP1 | PF4V1 | 13.017 + MARC1* - 0.711 + SREK1IP1*1.181 + PF4V1* - 0.778 Potassium_mmol.L 0.58 AP001004.1 | COX11 | 94.483 + AP001004.1* - 1.813 + COX11* - 2.265 Calcium_mg.dL 0.58 PEX5 | RPL26 | 10.234 + PEX5* - 0.526 + RPL26*1.150 Absolute.Lymphocyte_k.uL 0.58 ZNF155 | PRDM8 | 10.759 + ZNF155*2.778 + PRDM8*2.815 Protein . . . Total_g.dL 0.57 PLXNB2 | APP | APOL1 | 0.191 + PLXNB2*0.118 + APP*0.109 + APOL1*0.098 Triglyceride.sub.-- 0.56 ST13 | CCT3 | 3.280 + ST13* - 0.932 + CCT3* - 0.486 VLDL.Cholesterol.sub.-- 0.55 C7orf73 | SMAD4 | 71.124 + C7orf73* - 5.658 + SMAD4* - 5.247 T3.Uptake_. 0.54 MAPK6 | BMP6 | 83.258 + MAPK6*6.674 + BMP6*8.335 Thyroxine . . . T4._ug.dL 0.54 MAP1LC3B | HPF1 | 3.184 + MAP1LC3B*1.204 + HPF1*0.472 Alkaline.Phosphatase_IU.L 0.54 GAD1 | PDP2 | 158.447 + GAD1* - 16.450 + PDP2*12.011 Sodium_mmol.L 0.53 UTY | PKD1P5 | 2.954 + UTY*0.599 + PKD1P5*0.485 Alaine.Aminotransferase_IU.L 0.53 QRICH2 | SLC25A1 | 4.761 + QRICH2* - 0.148 + SLC25A1* - 0.160 Bilimbin . . . Total_mg.dL 0.52 DLEU2 | KIF14 | 29.102 + DLEU2*0.725 + KIF14*1.098 MCHC_g.dL 0.52 SCARNA9 | UTY | 54.066 + SCARNA9*6.618 + UTY* - 5.407 Hemoglobin_g.dL 0.5 DIP2C | CCDC137 | 6.071 + DIP2C*0.899 + CCDC137*0.892 MCV_fl 0.5 ARIH1 | BMT2 | 179.700 + ARIH1* - 45.553 + BMT2* - 32.071 MCH_pg 0.48 FAM228B | LINC00969 | 0.228 + FAM228B*0.432 + LINC00969* - 0.346 TSH . . . High.Sensitivity_mU.L 0.48 RECK | FAM76A | 3.635 + RECK* - 0.315 + FAM76A* - 0.271 Apartate.Aminotransferase_IU.L 0.47 PVALB | ABCB7 | 6.799 + PVALB*0.262 + ABCB7*0.244 Monocytes_. 0.44 ENSG00000254184 | TMEM18 | 4.780 + ENSG00000254184* - 0.230 + TMEM18* - 0.218 Chloride_mmol.L 0.44 ABCB7 | SPDL1 | 9.065 + ABCB7*0.319 + SPDL1*0.143 RDW . . . cv._. 0.41 SLAIN1 | CCDC115 | 10.961 + SLAIN1*4.311 + CCDC115*4.465 Glucose_mg.dL 0.17 LOC100506302 | 101.975 + LOC100506302* - 0.769
TABLE-US-00009 TABLE 9 Predictive combination of genes for a blood test result based on the genes' expression in whole blood, plasma samples, or dried blood-spot samples according to multiple regression analysis R.sup.2 Test value genes forumla Lymphocytes_. 0.84 EVI2B (Blood) | NFAM1 56.7246715975982 + EVI2B (Blood) * - (Blood) 15.8825524318068 + NFAM1 (Blood) * - 12.3596561059337 Monocytes_. 0.8 RIN2 (Blood) | ADA2 -0.158183662335998 + RIN2 (Blood) *3.93278986538093 + (Blood) | ADA2 (Blood) *3.5561768635177 Seqmented.Neutrophils_. 0.74 RNF24 (Blood) | MNDA 35.6931236896115 + RNF24 (Blood) *8.85994146801373 + MNDA (Blood) | TLR1 (Blood) (Blood) *9.76462219780331 + TLR1 (Blood) *7.46277245596464 Eosinophils_. 0.72 SIGLEC8 (Blood) | FBN1 0.239650247438389 + SIGLEC8 (Blood) *1.07664315020184 + FBN1 (Blood) | (Blood) *1.24348775920263 Anion.Gap_mmol.L 0.67 PGLS (Blood) | BTBD19 13.497493355259 + PGLS (Blood) * - 5.33321876906759 + BTBD19 (Blood) | LUC7L (Blood) (Blood) *1.20890323544764 + LUC7L (Blood) *3.80083623295323 LDL.Cholesterol . . . Calculated.sub.-- 0.62 ENSG00000233280 (Blood) | -88.1273832988103 + ENSG00000233280 (Blood) GOLGA8A (Blood) | SMC5 *76.7777518719049 + GOLGA8A (Blood) *72.0126373761645 + (Blood) SMC5 (Blood) *64.9019008350544 VLDL.Cholesterol.sub.-- 0.6 MAP3K15 (Blood) | 18.0359463299043 + MAP3K15 (Blood) *8.01564614798221 + SPDYE5 (Blood) | KL SPDYE5 (Blood) *4.51098808994539 + KL (Blood) * - (Blood) 5.79001413042372 Calcium_mg.dL 0.6 MIOS (Blood) | METTL27 9.04429378541027 + MIOS (Blood) *0.975925061845625 + (Blood) | SREBF1 (Blood) METTL27 (Blood) *0.176272133075835 + SREBF1 (Blood) * - 0.658990356157586 Absolute.Neutrophil_k.uL 0.59 NTNG2 (Blood) | TLE3 0.207173484373919 + NTNG2 (Blood) *1.2255813525448 + TLE3 (Blood) | (Blood) *2.95112923413471 Cholesterol.sub.-- 0.59 AL353593.1 (Blood) | -8.89616538539591 + AL353593.1 (Blood) *35.1472237736851 + GOLGA8A (Blood) | SMC5 GOLGA8A (Blood) *40.9974581099568 + SMC5 (Blood) (Blood) *144.75178829258 Triglyceride.sub.-- 0.59 MAP3K15 (Blood) | 90.9925979507341 + MAP3K15 (Blood) *39.696698822413 + SPDYE5 (Blood) | KL SPDYE5 (Blood) *22.0302935559495 + KL (Blood) * - (Blood) 29.0497443084864 Alkaline.Phosphatase_IU.L 0.59 SH3YL1 (Blood) | NAA38 58.2398378742039 + SH3YL1 (Blood) * - 22.3047606118879 + (Blood) | SYNM (Blood) NAA38 (Blood) *19.9891213359575 + SYNM (Blood) *10.4119638636418 MCHC_g.dL 0.58 DTX4 (Blood) | LRIF1 31.5919289067614 + DTX4 (Blood) *1.22187120717758 + LRIF1 (Plasma) | DDX3Y (DBS) (Plasma) *0.677253108836186 + DDX3Y (DBS) *0.344965207259182 MPV_fl 0.57 TMCO3 (Blood) | GKAP1 11.9329246913931 + TMCO3 (Blood) * - 1.540745991263 + GKAP1 (Blood) | LRRN1 (Blood) (Blood) *0.990929913508873 + LRRN1 (Blood) * - 0.501948155611101 Absolute.Lymphocyte_k.uL 0.57 OAZ2 (Blood) | KCNE3 3.86546727874129 + OAZ2 (Blood) * - 1.270425943019 + (Blood) | KCNE3 (Blood) * - 0.713214848990538 T3.Uptake_. 0.57 ZNF469 (Blood) | 29.793090781956 + ZNF469 (Blood) *4.25243087247019 + AC009533.1 (Blood) | ING2 AC009533.1 (Blood) * - 1.74462338232437 + ING2 (Blood) * - (Blood) 4.27258736309824 TSH . . . High.Sensitivity_mU.L 0.57 ZNF100 (Blood) | SNHG8 3.19874435967558 + ZNF100 (Blood) *0.885504781564805 + (Blood) | TMCO6 (Blood) SNHG8 (Blood) * - 0.895518070606725 + TMCO6 (Blood) * - 1.47539482145919 Absolute.Monocyte_k.uL 0.56 NAGA (Blood) | ADA2 -0.0132838072590899 + NAGA (Blood) *0.31303328641343 + (Blood) | ADA2 (Blood) *0.212312268574206 Protein . . . Total_g.dL 0.55 ITM2A (Blood) | CDK2 6.42969507497666 + ITM2A (Blood) *0.48446965070971 + (Blood) | SNORA80A CDK2 (Blood) *0.578526892265614 + SNORA80A (Blood) * - (Blood) 0.297860482683532 WBC_K.mm3 0.54 GYPB (Blood) | CDK8 8.75731192981126 + GYPB (Blood) * - 1.19669632836611 + (DBS) | GYPE (Blood) CDK8 (DBS) * - 0.555271823408771 + GYPE (Blood) * - 0.497538891339749 RDW . . . sd._fl 0.54 CHCHD2P6 (Plasma) | JAM3 36.4961904978741 + CHCHD2P6 (Plasma) *1.18804830985846 + (DBS) | PLEKHA5 (Blood) JAM3 (DBS) *1.40776378934959 + PLEKHA5 (Blood) *3.71863771779343 Potassium_mmol.L 0.54 LRRC28 (Blood) | 3.91480059363952 + LRRC28 (Blood) *0.615635316747977 + AP003717.1 (Blood) | AP003717.1 (Blood) * - 0.268337277773096 + CLEC11A (Blood) CLEC11A (Blood) *0.168320177486421 Absolute.Eosinophil_k.uL 0.53 CCT3 (DBS) | CLC (Blood) | 0.158025801580431 + CCT3 (DBS) * - 0.0357543172038057 + TRIM37 (DBS) CLC (Blood) *0.0420117960778139 + TRIM37 (DBS) * - 0.0291472504478695 Cholesterol.HDL.Ratio.sub.-- 0.53 NCBP2L (Blood) | CNPY4 4.91205323233742 + NCBP2L (Blood) *0.723951587039121 + (Blood) CNPY4 (Blood) * - 1.85894964453232 Phosphorus . . . inorganic._mg.dL 0.53 IL18RAP (Blood) | SMPD2 4.6242871887666 + IL18RAP (Blood) * - 0.334249474991653 + (Blood) | SNORA20 (Blood) SMPD2 (Blood) * - 0.789192760531163 + SNORA20 (Blood) * - 0.304324426243099 GGT_IU.L 0.53 SERPINE1 (Blood) | OTUD3 -8.20472237821403 + SERPINE1 (Blood) *9.65320012119823 + (Blood) | SORBS2 (Blood) OTUD3 (Blood) *15.2619055752769 + SORBS2 (Blood) *3.6777083142664 MCV_fl 0.52 TMEM183A (Blood) | 96.407560101612 + TMEM183A (Blood) * - 9.17520928654472 + AC092490.1 (Blood) | DTX3 AC092490.1 (Blood) * - 1.40669741860889 + DTX3 (Blood) (Blood) *5.29603408779261 Non.HDL.Cholesterol.sub.-- 0.51 HGSNAT (Blood) | -33.7319304845757 + HGSNAT (Blood) *104.791759023732 + ENSG00000233280 (Blood) | ENSG00000233280 (Blood) *59.6894397836695 + AC027309.2 AC027309.2 (Blood) (Blood) *20.267866956693 Albumin_g.dL 0.51 KANSL3 (Blood) | FNBP4 2.76592669611056 + KANSL3 (Blood) *0.886820024932328 + (Blood) | COL9A2 (Blood) FNBP4 (Blood) *0.655112995219229 + COL9A2 (Blood) *0.256841598168667 BUN_mg.dL 0.5 RFX2 (Blood) | ALG1L10P 14.8385962751296 + RFX2 (Blood) * - 3.97673032999744 + (Blood) | HIST2H2BA ALG1L10P (Blood) *0.975798500220197 + HIST2H2BA (Blood) (Blood) *1.31765775405616 Albumin . . . Globulin.Ratio.sub.-- 0.5 IL18BP (Blood) | 1.00809686565828 + IL18BP (Blood) *0.43690587433331 + SNORA80A (Blood) | SNORA80A (Blood) *0.213881752825225 + SYCE1 (Blood) SYCE1 (Blood) *0.0879911614032978 RDW . . . cv._. 0.49 NMT2 (Blood) | PLEKHH2 9.68380709762748 + NMT2 (Blood) *1.1639957216907 + PLEKHH2 (Blood) | TMEM245 (Blood) (Blood) *0.286892303141383 + TMEM245 (Blood) *1.61864203340345 MCH_pg 0.48 TMEM273 (Blood) | IL1RAP 32.3291274277572 + TMEM273 (Blood) *1.07159539254098 + (Blood) | SMIM5 (Blood) IL1RAP (Blood) * - 1.68802662235095 + SMIM5 (Blood) * - 1.15265411525787 Creatinine_mg.dL 0.48 USP9Y (Blood) 0.791262056112685 + USP9Y (Blood) *0.121419890322682 Globulin_g.dL 0.48 MYH3 (Blood) | IL18BP 3.55573198888647 + MYH3 (Blood) * - 0.461465147890139 + (Blood) | ABCG2 (DBS) IL18BP (Blood) * - 0.518152000005631 + ABCG2 (DBS) *0.128213641962725 RBC_m.mm3 0.47 DDX3Y (Blood) 4.48514538508006 + DDX3Y (Blood) *0.340768206800471 Platelet.Count_k.mm3 0.47 SLC37A2 (Blood) | IGLV3- 337.931177295631 + SLC37A2 (Blood) * - 87.7079726147655 + 13 (Blood) | IGLV3-13 (Blood) *22.5377387049476 T7.Index.sub.-- 0.47 IGHV3-33 (Blood) | ZNF266 2.87096861063423 + IGHV3-33 (Blood) * - 0.224132194657099 + (Blood) | ABHD17AP4 ZNF266 (Blood) * - 0.612950925919992 + ABHD17AP4 (Blood) (Blood) * - 0.0997566798097242 Sodium_mmol.L 0.47 BTRC (Blood) | WASHC2C 138.883276573839 + BTRC (Blood) *3.39463427490849 + (Blood) | AMD1P3 (Blood) WASHC2C (Blood) * - 2.77858809739364 + AMD1P3 (Blood) *0.798496161860985 CO2_mmol.L 0.47 FAM157A (Blood) | NFKB2 31.4496060708057 + FAM157A (Blood) * - 2.21544050441395 + (Blood) | NFKB2 (Blood) * - 3.56645987757677 Alaine.Aminotransferase_IU.L 0.47 RNASE3 (Blood) | DEFA4 14.4248577378265 + RNASE3 (Blood) *5.0882012572435 + DEFA4 (Blood) | (Blood) *4.65136914688879 Hematocrit_. 0.44 NFYA (Blood) | USP9Y 50.7828595935722 + NFYA (Blood) * - 9.37767350069941 + (Blood) | USP9Y (Blood) *1.43978771568548 HDL.Cholesterol.sub.-- 0.44 SCARB1 (Blood) | 82.7610301362919 + SCARB1 (Blood) * - 15.370144223283 + FLYWCH1 (Blood) | FLYWCH1 (Blood) *8.21837672821879 + NDUFS6 (Blood) * - NDUFS6 (Blood) 20.8961962050542 Uric.Acid_mg.dL 0.44 PROS1 (Blood) 3.14682258245291 + PROS1 (Blood) *1.61277932298865 Glucose_mg.dL 0.42 SAR1B (DBS) | HMGB1P1 63.2945313509948 + SAR1B (DBS) *4.07249192713006 + (Blood) | MPC2 (Blood) HMGB1P1 (Blood) *5.43121538759866 + MPC2 (Blood) *22.1820621067802 T3.Total_ng.dL 0.41 EBPL (Blood) | MTPAP 157.005257929307 + EBPL (Blood) *19.3280952080184 + MTPAP (Blood) | NRROS (Blood) (Blood) * - 34.6142095073691 + NRROS (Blood) * - 27.3385865176937 Thyroxine . . . T4._ug.dL 0.4 CDCA8 (Plasma) | PHKA1P1 5.56382805834608 + CDCA8 (Plasma) * - 0.828628892995684 + (Plasma) IQCE (Blood) PHKA1P1 (Plasma) *0.380736434918838 + IQCE (Blood) *2.31407501016819 Lactic.Dehydrogenase_IU.L 0.4 PITPNM3 (Blood) | NUMA1 108.780505731206 + PITPNM3 (Blood) *10.4819435495866 + (Blood) | RAB31 (Blood) NUMA1 (Blood) *64.8667532767841 + RAB31 (Blood) * - 25.1238658063081 Bilirubin . . . Total_mg.dL 0.4 ATXN7L1 (Blood) | MAGI2 0.832953190599145 + ATXN7L1 (Blood) * - 0.547061215778317 + (Blood) | CHI3L2 (Blood) MAGI2 (Blood) *0.0638082975470622 + CHI3L2 (Blood) *0.132047306873859 BUN.Creatine.Ratio.sub.-- 0.39 ALG1L10P (Blood) | 12.4257435214487 + ALG1L10P (Blood) *1.91216977539833 + HIST2H2BA (Blood) | HIST2H2BA (Blood) *1.63567334248823 Osmolality . . . Calculated_mOsm.kg 0.39 EIF1AY (Blood) 284.712173286834 + EIF1AY (Blood) *2.31346985184965 Hcmoglobin_g.dL 0.37 USP9Y (Blood) 13.6628105965376 + USP9Y (Blood) *0.878879525161311 Chloride_mmol.L 0.33 RMRP (Blood) | PDK4 100.285307143487 + RMRP (Blood) *1.56514051132095 + PDK4 (Blood) | SIRT7 (DBS) (Blood) * - 1.10764371640888 + SIRT7 (DBS) *0.734799171039523 Apartate.Aminotransferase_IU.L 0.24 PLIN5 (Blood) | FBXO48 20.1666477248498 + PLIN5 (Blood) * - 4.53574445013183 + (Blood) | FBXO48 (Blood) *3.83345216930802
EXAMPLES
[0091] It should be understood that while particular embodiments have been illustrated and described, various modifications can be made thereto without departing from the spirit and scope of the invention as will be apparent to those skilled in the art. Such changes and modifications are within the scope and teachings of this invention as defined in the claims appended hereto.
1: Sample Collection
[0092] Whole blood, plasma, and dried blood spot (DBS) samples were collected from 50 non-fasting individuals. Two sets of blood samples were collected on the same day. The set to be sent for analysis by Sonora Quest Laboratories contained collections of whole blood and plasma according to standard procedure. The set for analysis of RNA expression contained collections of whole blood, plasma, and DBS. Instead of collecting 8 ccs of blood, the total amount of blood for the second section was 1 cc. Blood was collected in blood collection tubes with K2EDTA. Plasma samples were produced by centrifuging the whole blood collected in K2EDTA tubes according to standard procedure.
[0093] Dried blood spot samples may be obtained using a finger-puncture technique in which a single drop of blood from the subject's finger was applied to a sample collection apparatus (i.e., RNA collection paper from FORTIUSBIO.RTM.). The blood spot is allowed to dry on the FORTIUSBIO.RTM. sample collection apparatus. A portion of the sample that has dried on the sample collection apparatus is then removed for nucleic acid extraction.
2: Measurement of Genes Detected in the Sample and Quantification of RNA Expression in the Sample
[0094] RNA, including mRNA, may be extracted using commercially available kits. RNA was extracted from whole blood, plasma, and dried blood spot samples using exoRNeasy (QIAGEN.RTM., Germantown, Md.) according to the manufacturer's instructions. The extracted RNA or mRNA was sequenced using the ILLUMINA.RTM. system (San Diego, Calif.) to determine the RNA or mRNA expression level of each predictive gene. In various embodiments, mRNA may be sequenced using next-generation sequencing (NGS) to obtain raw sequencing data.
[0095] After the mRNA from the blood sample is sequenced, some embodiments provide methods of analyzing the data. For example, the analyzing steps of the methodology include steps such as processing the raw sequencing data/reads to remove information related to barcodes and adapters using technologies provided by Cutadapt and AlienTrimmer. Thereafter, the sequences can be aligned to a reference sequence using technologies such as STAR or Tophat. After alignment, the data can be quantitated to generate numerical estimates of each gene's expression or "counts" provided by technologies like FeatureCounts or htseq-count. For example, a number of copies or reads of a predictive gene in the sequencing data can be quantified or counted to determine a gene count. A gene count represents a relative expression level of the predictive gene in the blood sample and is independent of the volume of the blood sample. The gene count is a value that can then be used as an input into one or more bioinformatic analysis steps used to correlate the gene count to an output value of a blood test result.
[0096] Gene counts were obtained and normalized within each sample type for sequencing depth and then standardized for performing linear regression.
[0097] The normalization of gene counts reduces the impact of different sequencing length on the gene count. For example, when the total gene count of sample A is 1 million counts, and the total gene count for sample B is 1.3 million counts, the difference may mainly be attributed to technical variation and not a true biological difference. Accordingly, normalization is applied to the total gene counts of these samples so that the sequencing results of sample A can be compared to the sequencing results of sample B. A variety of algorithms for normalizing library size exist in the prior art, for example, DESeq2, and they may all be used for normalization the gene count in the methods of the invention.
[0098] The standardization of the gene count is a mathematical correction applied to ensure the variables of comparison are on the same scale. This step helps stabilize the results of any kind of machine learning. While gene counts do not need to be standardized, the step increases the accuracy of the blood test result determination. Any method of standardizing variables may be used. In one implementation, the gene counts are standardized by dividing each value by the root mean square of all the samples values for the given gene.
3: Blood Tests Results
[0099] The samples were sent to Sonora Quest for the analysis of the specific blood tests listed in Table 10.
TABLE-US-00010 TABLE 10 Test Category Panel Test Units Chemistry Thyroid T3 Uptake % Thyroxine (T4) ug/dL T7 Index T3 Total ng/dL TSH, High Sensitivity mU/L PSA (Males Only) PSA (total) Lipid Panel Cholesterol Triglyceride Cholesterol/HDL Ratio HDL Cholesterol Non-HDL Cholesterol LDL Cholesterol, Calculated VLDL Cholesterol Chemistry Panel, Glucose mg/dL Basic BUN mg/dL Creatinine mg/dL BUN/Creatine Ratio Uric Acid mg/dL Sodium mmol/L Potassium mmol/L Chloride mmol/L CO.sub.2 mmol/L Anion Gap mmol/L Osmolality, Calculated mOsm/kg Protein, Total g/dL Albumin g/dL Globulin g/dL Albumin/Globulin Ratio Calcium mg/dL Phosphorus (inorganic) mg/dL Alkaline Phosphatase IU/L GGT IU/L Alanine Aminotransferase IU/L Aspartate Aminotransferase IU/L Lactic Dehydrogenase IU/L Bilirubin, Total mg/dL Hematology CBC with Differential, WBC K/mm.sup.3 with Platelet RBC m/mm.sup.3 Hemoglobin g/dL Hematocrit % MCV fl MCH Pg MCHC g/dL Platelet Count k/mm.sup.3 RDW (sd) fl RDW (cv) % MPV fl Segmented Neutrophils % Lymphocytes % Monocytes % Eosinophils % Basophils % Absolute Neutrophil k/uL Absolute Lymphocyte k/uL Absolute Monocyte k/uL Absolute Eosinophil k/uL Absolute Basophil k/uL Immature Granulocyte % Absolute Granulocyte k/uL
4: Regression Analysis
[0100] Simple linear regression was performed after removing any outliers by regressing each gene individually on each blood test. The single genes whose expression levels are most highly correlated values of standard blood chemistry tests (as measured by R.sup.2 values) were noted in Tables 1-3.
[0101] Multiple linear regression was performed by considering up to 5 genes that could be used on the regression model. Outliers were imputed with the mean, and two rounds of feature selection were performed to identify genes of interest for each blood test. The first round selected the 5 highest (3 for DBS) scoring genes based on a univariate F-test followed by a second round where genes were potentially removed based on the Akaike information criterion. This process was performed for each sample type separately and in combination by considering whole blood with plasma as well as all three sample types together. A combination of sample types was created by allowing genes from any of the included sample types to be selected during the first round of feature selection.
* * * * *
D00001
D00002
D00003
D00004
D00005
D00006
D00007
D00008
D00009
D00010
D00011
D00012
D00013

D00014

D00015
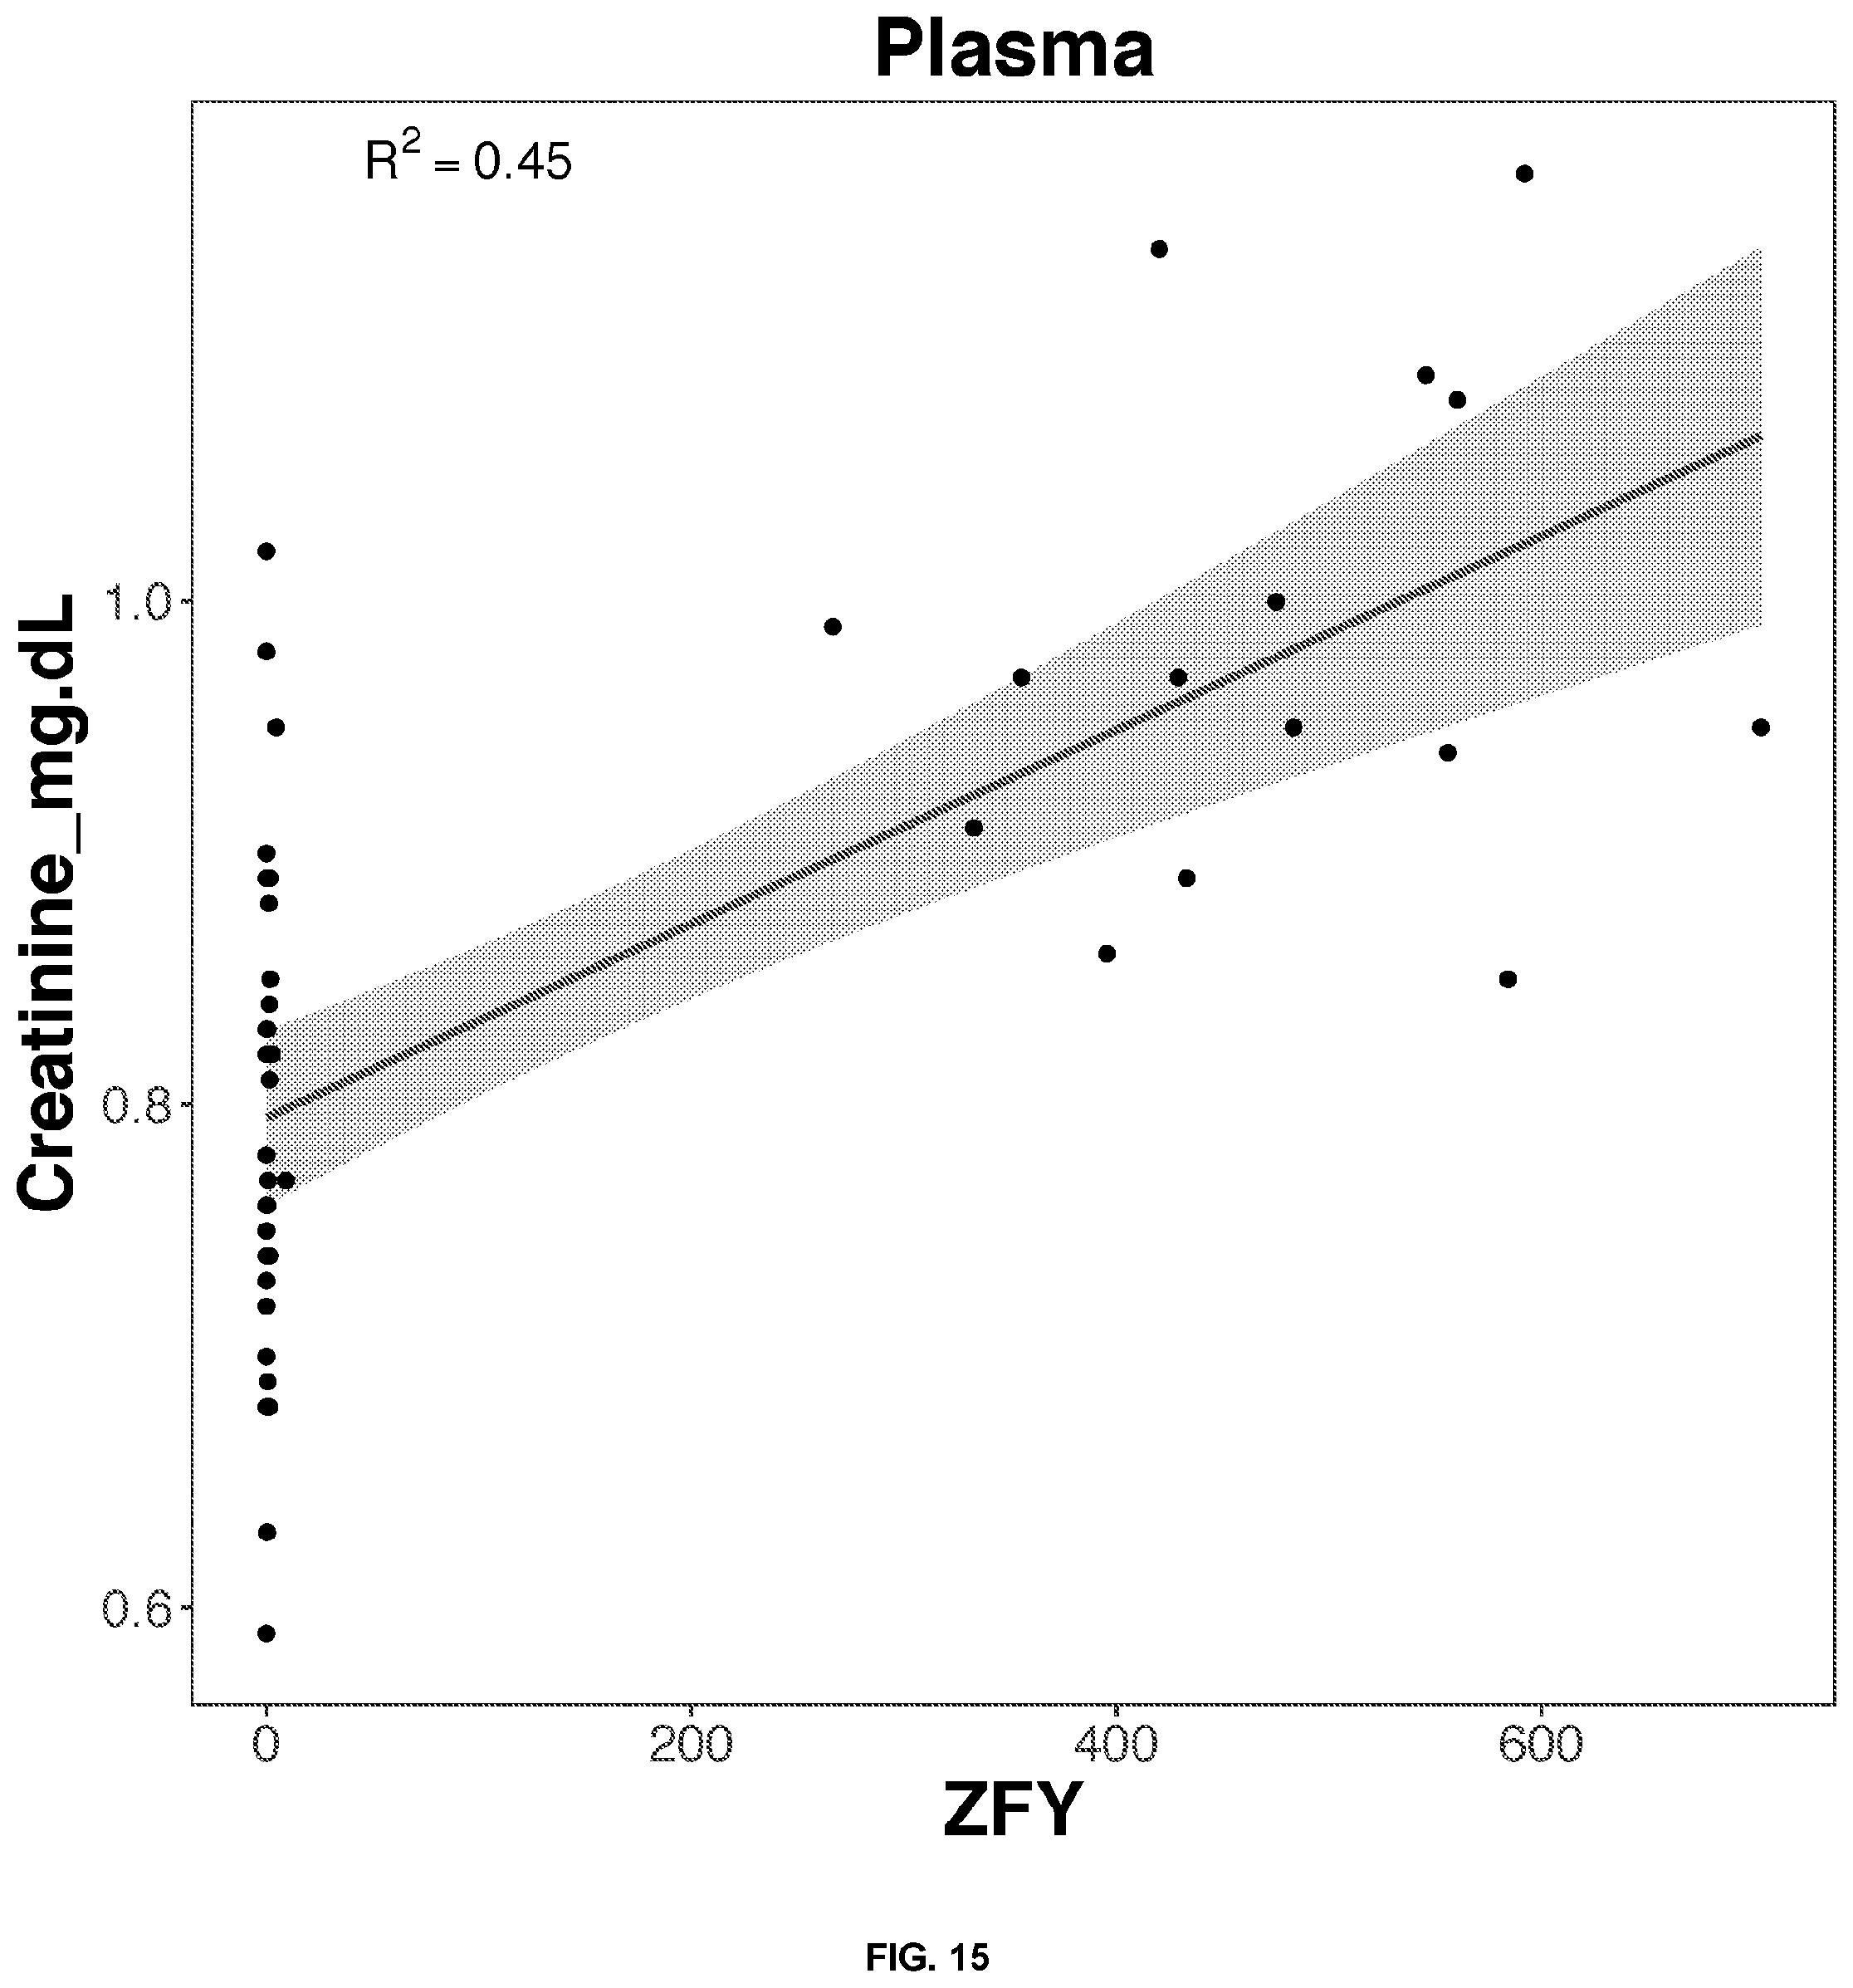
D00016

D00017
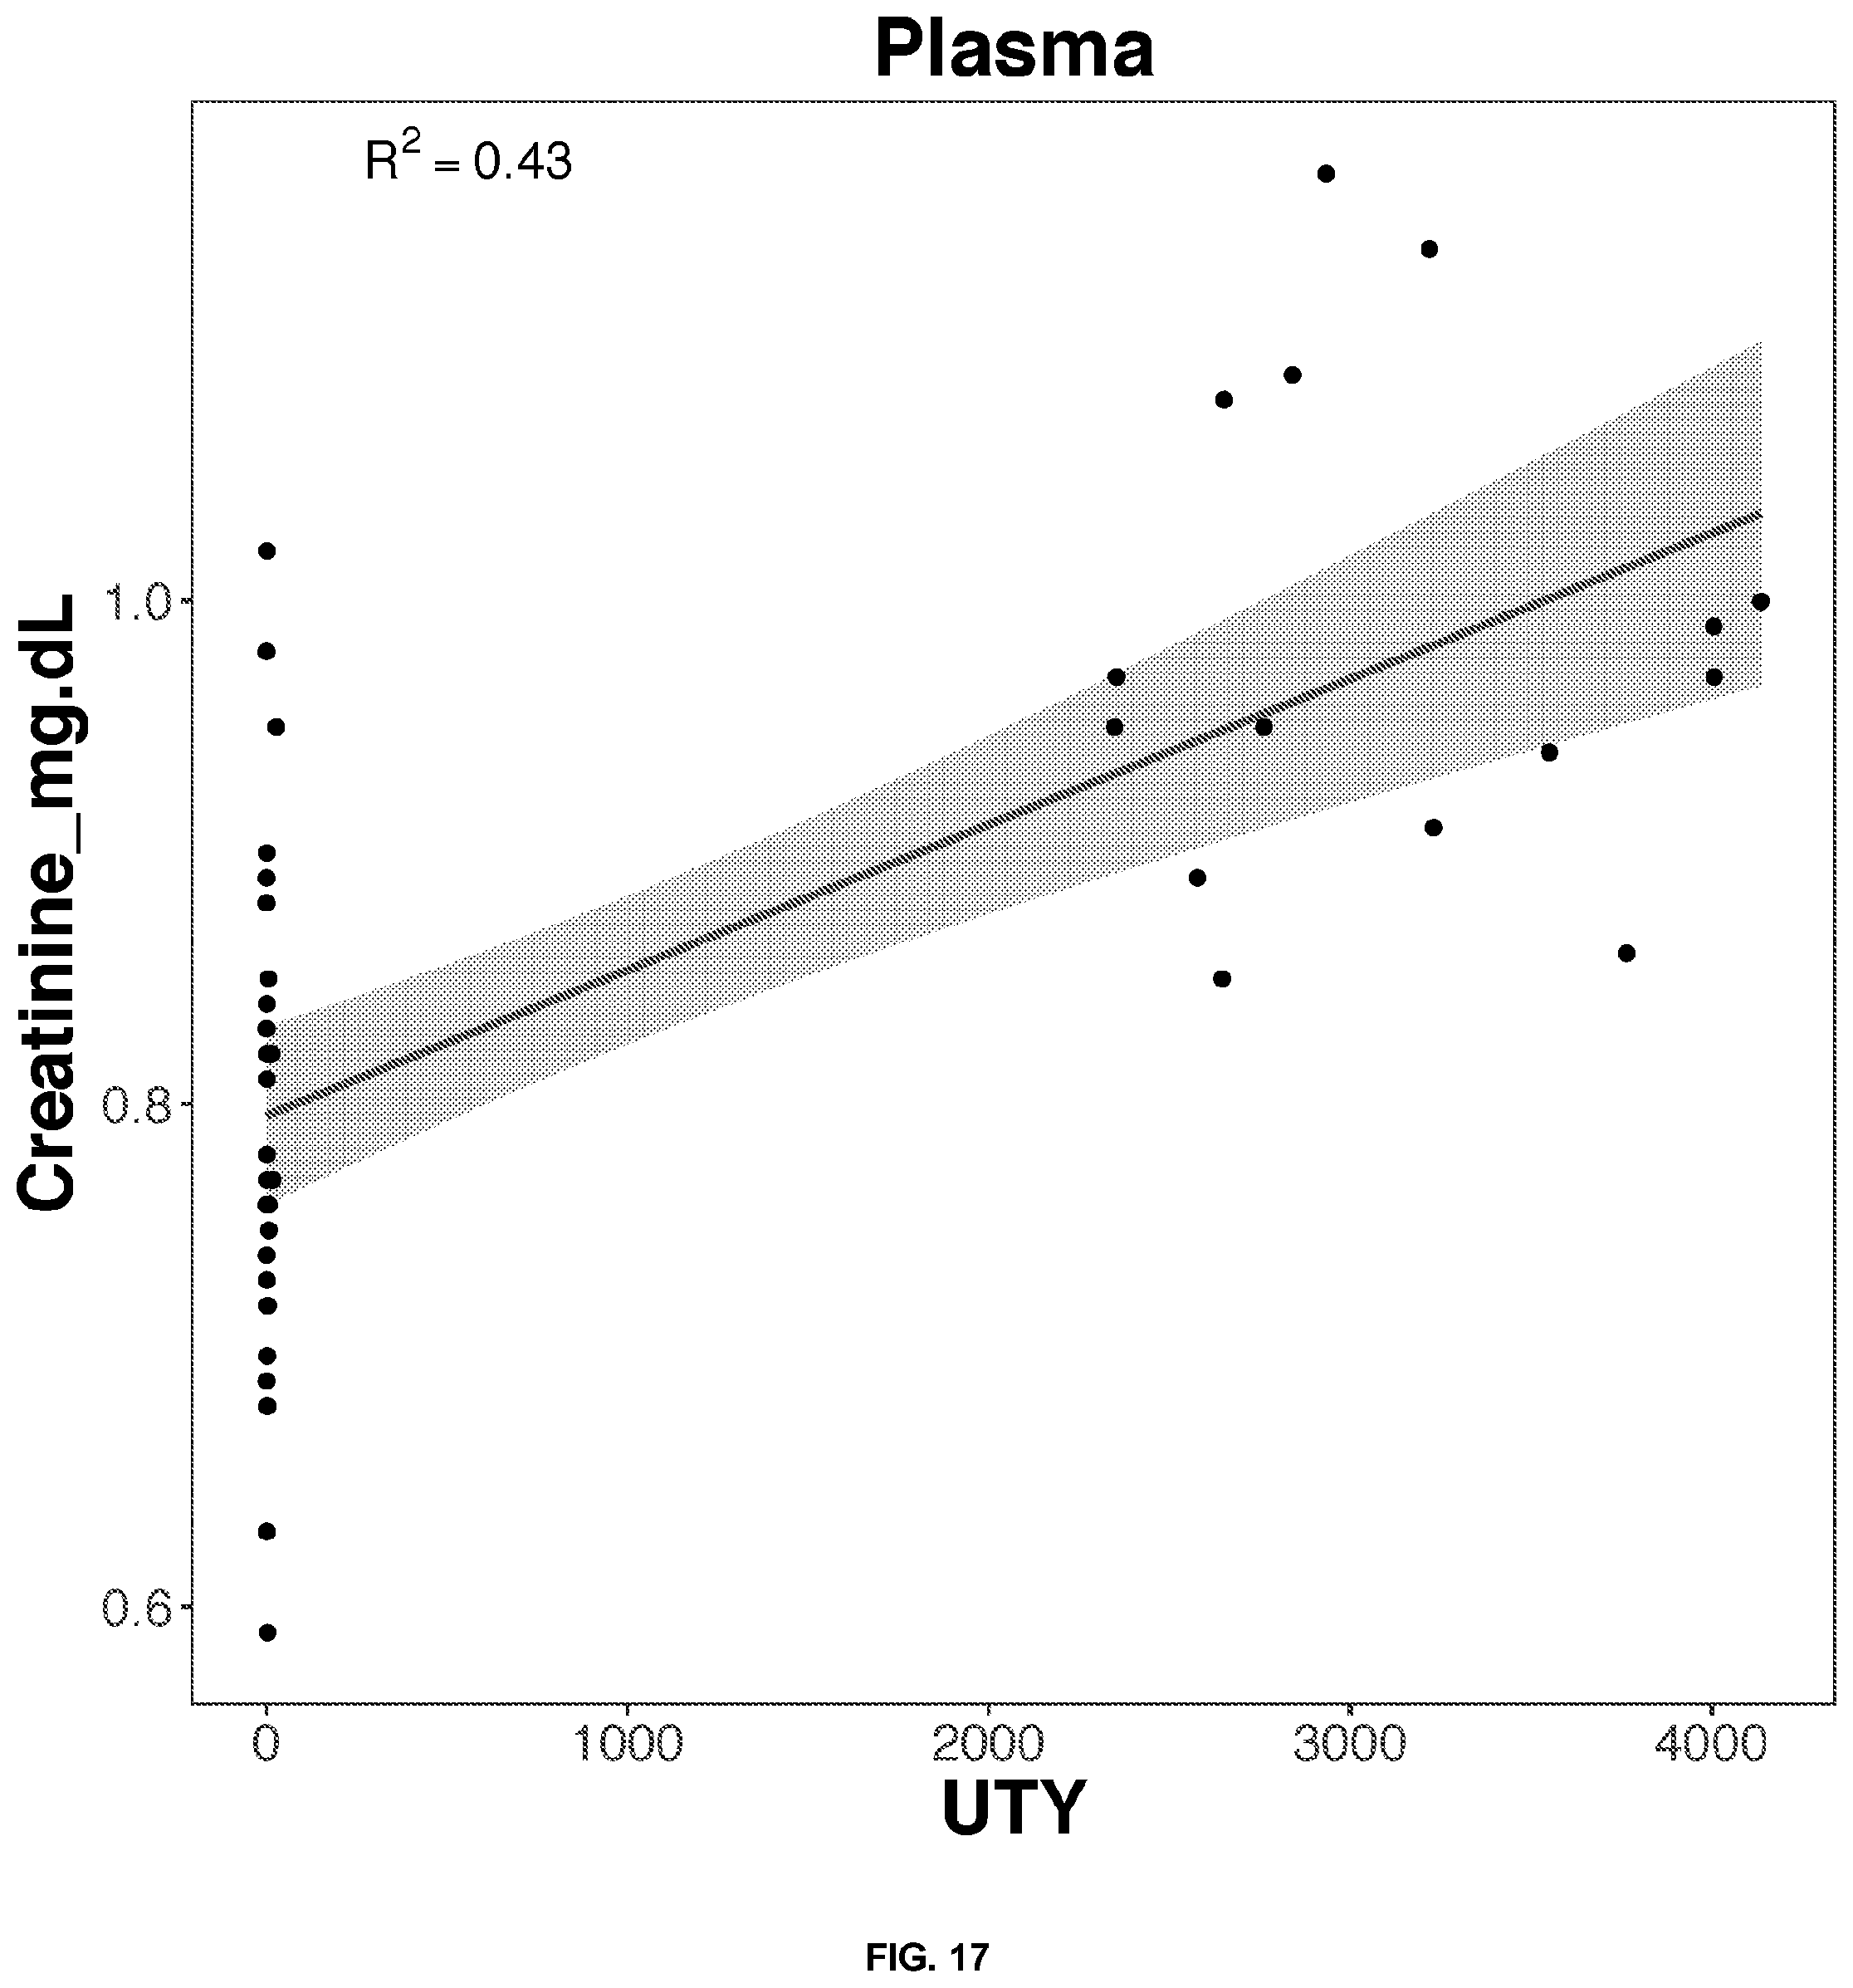
D00018

D00019

D00020

D00021

D00022

D00023

D00024

D00025

D00026

D00027

D00028

D00029

D00030

D00031

D00032
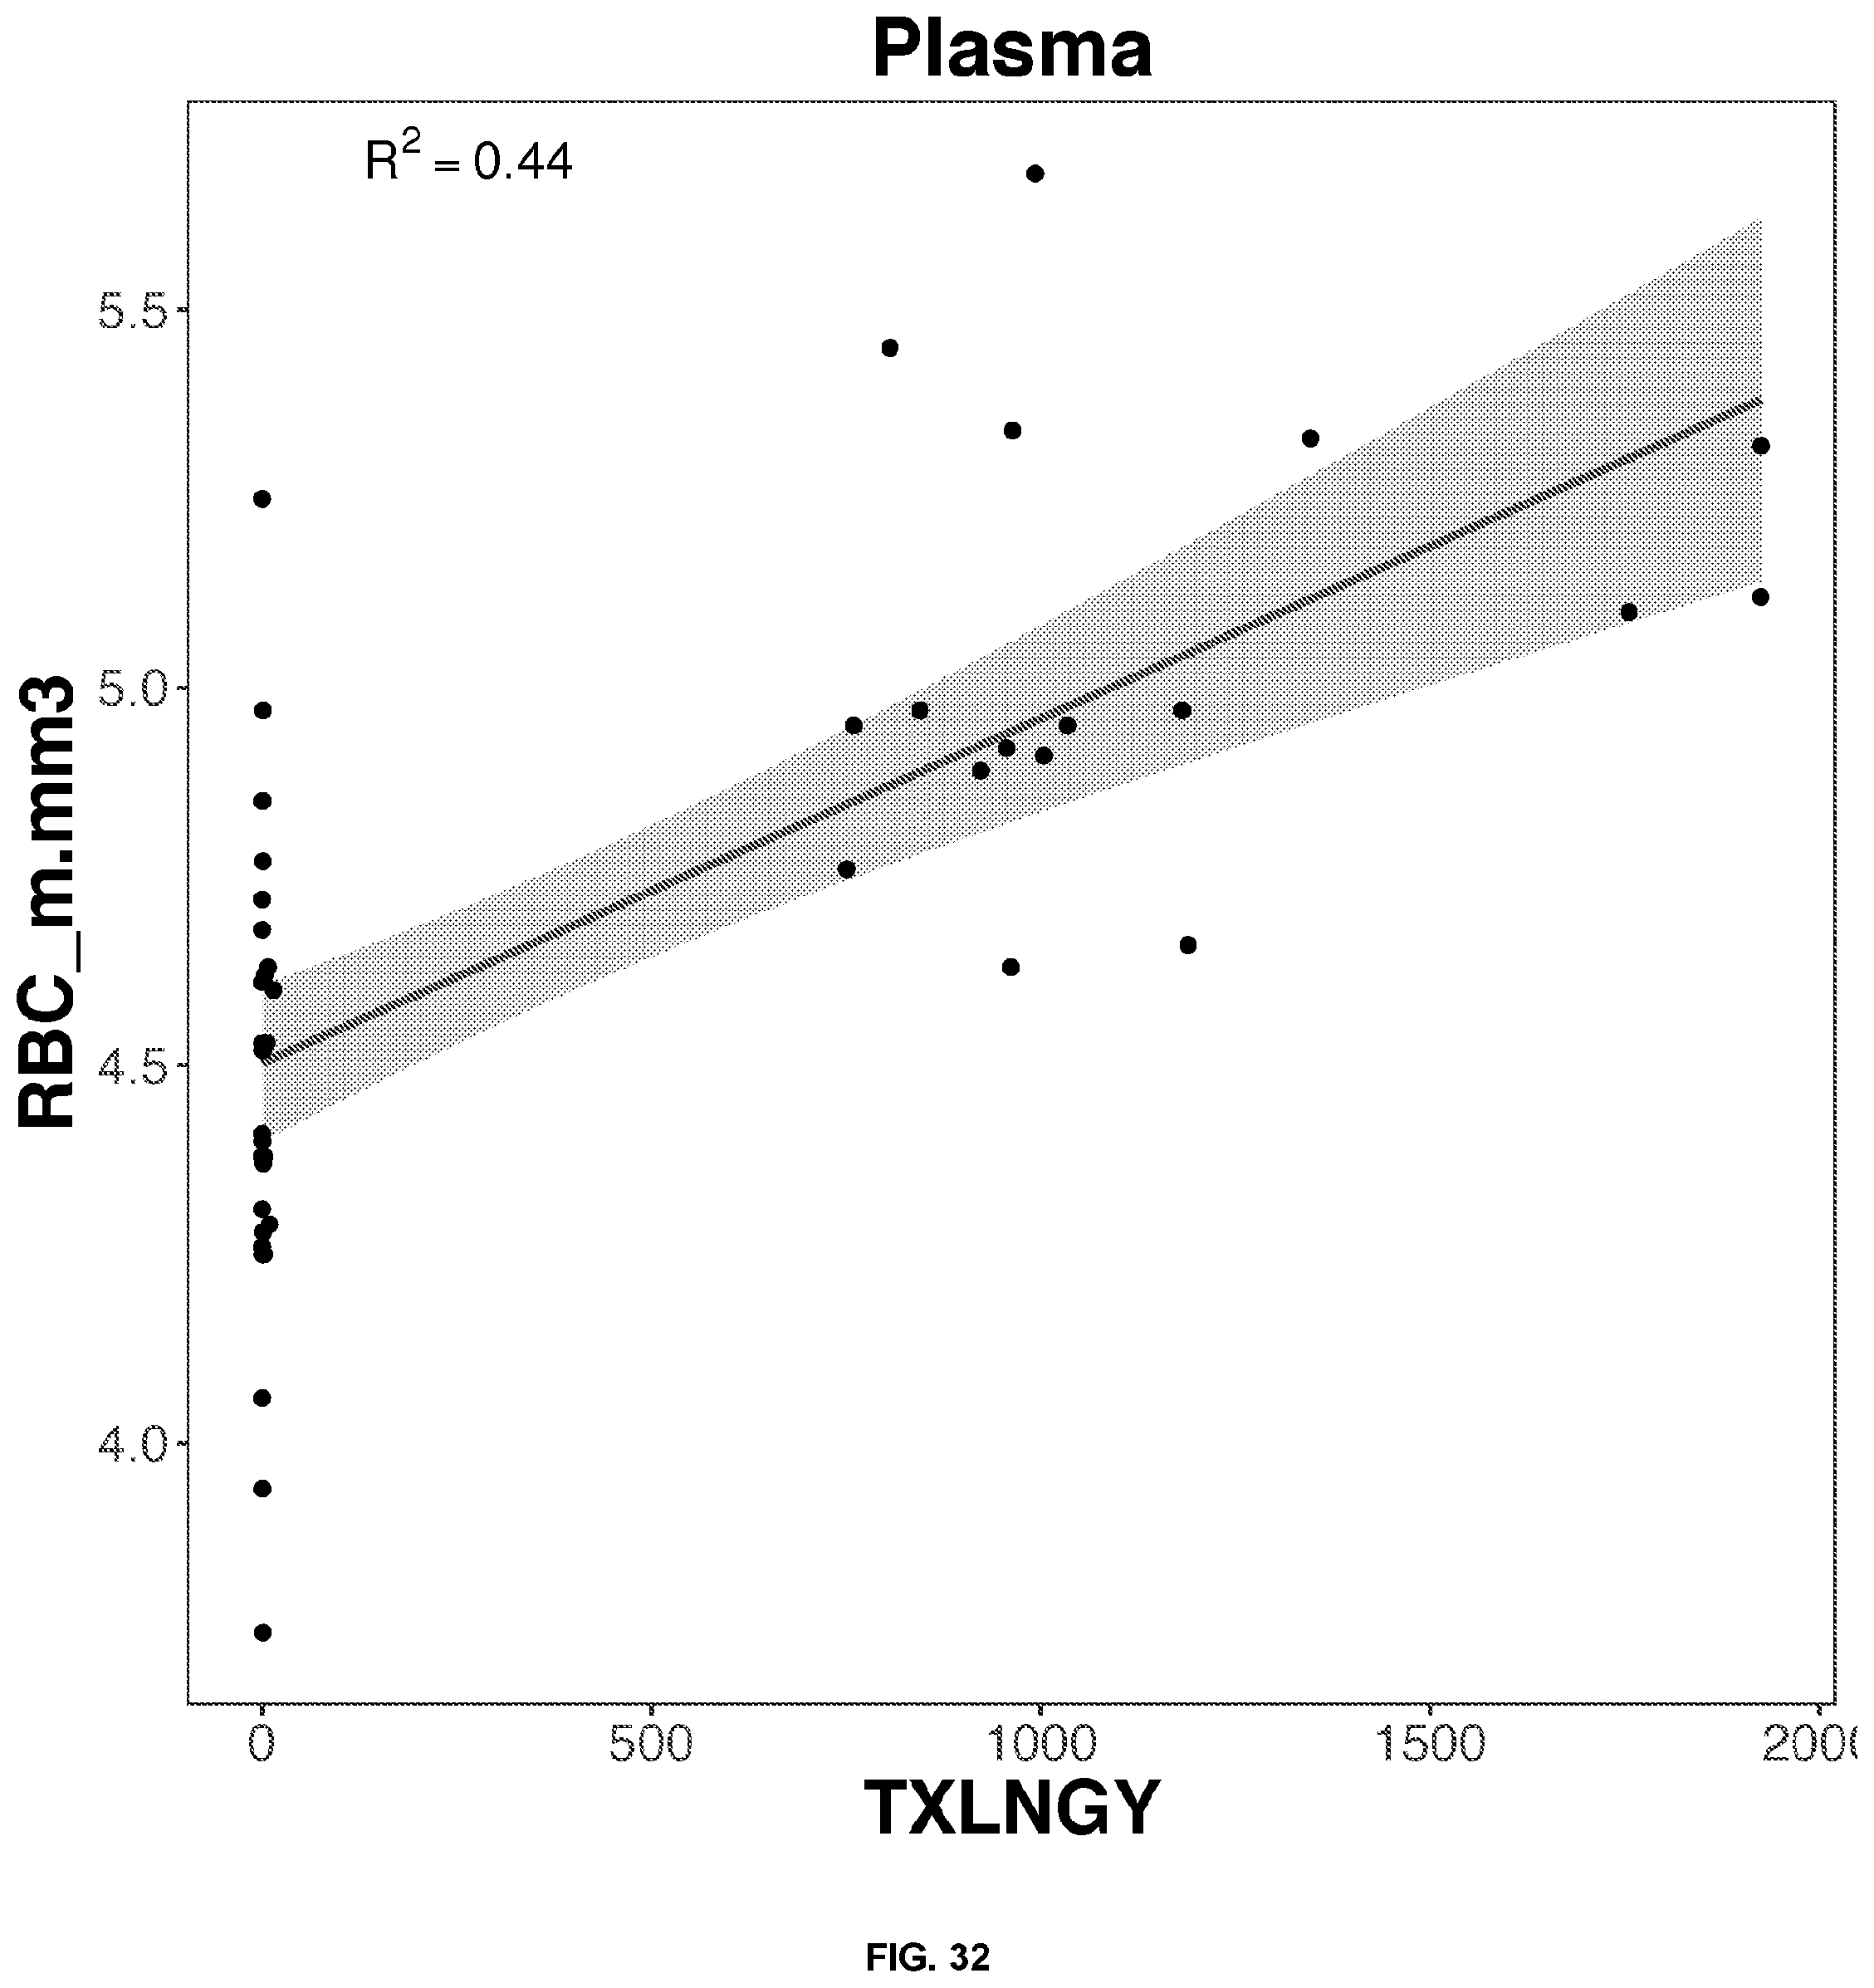
D00033

D00034

D00035

D00036

D00037

D00038

D00039

D00040

D00041

D00042

D00043
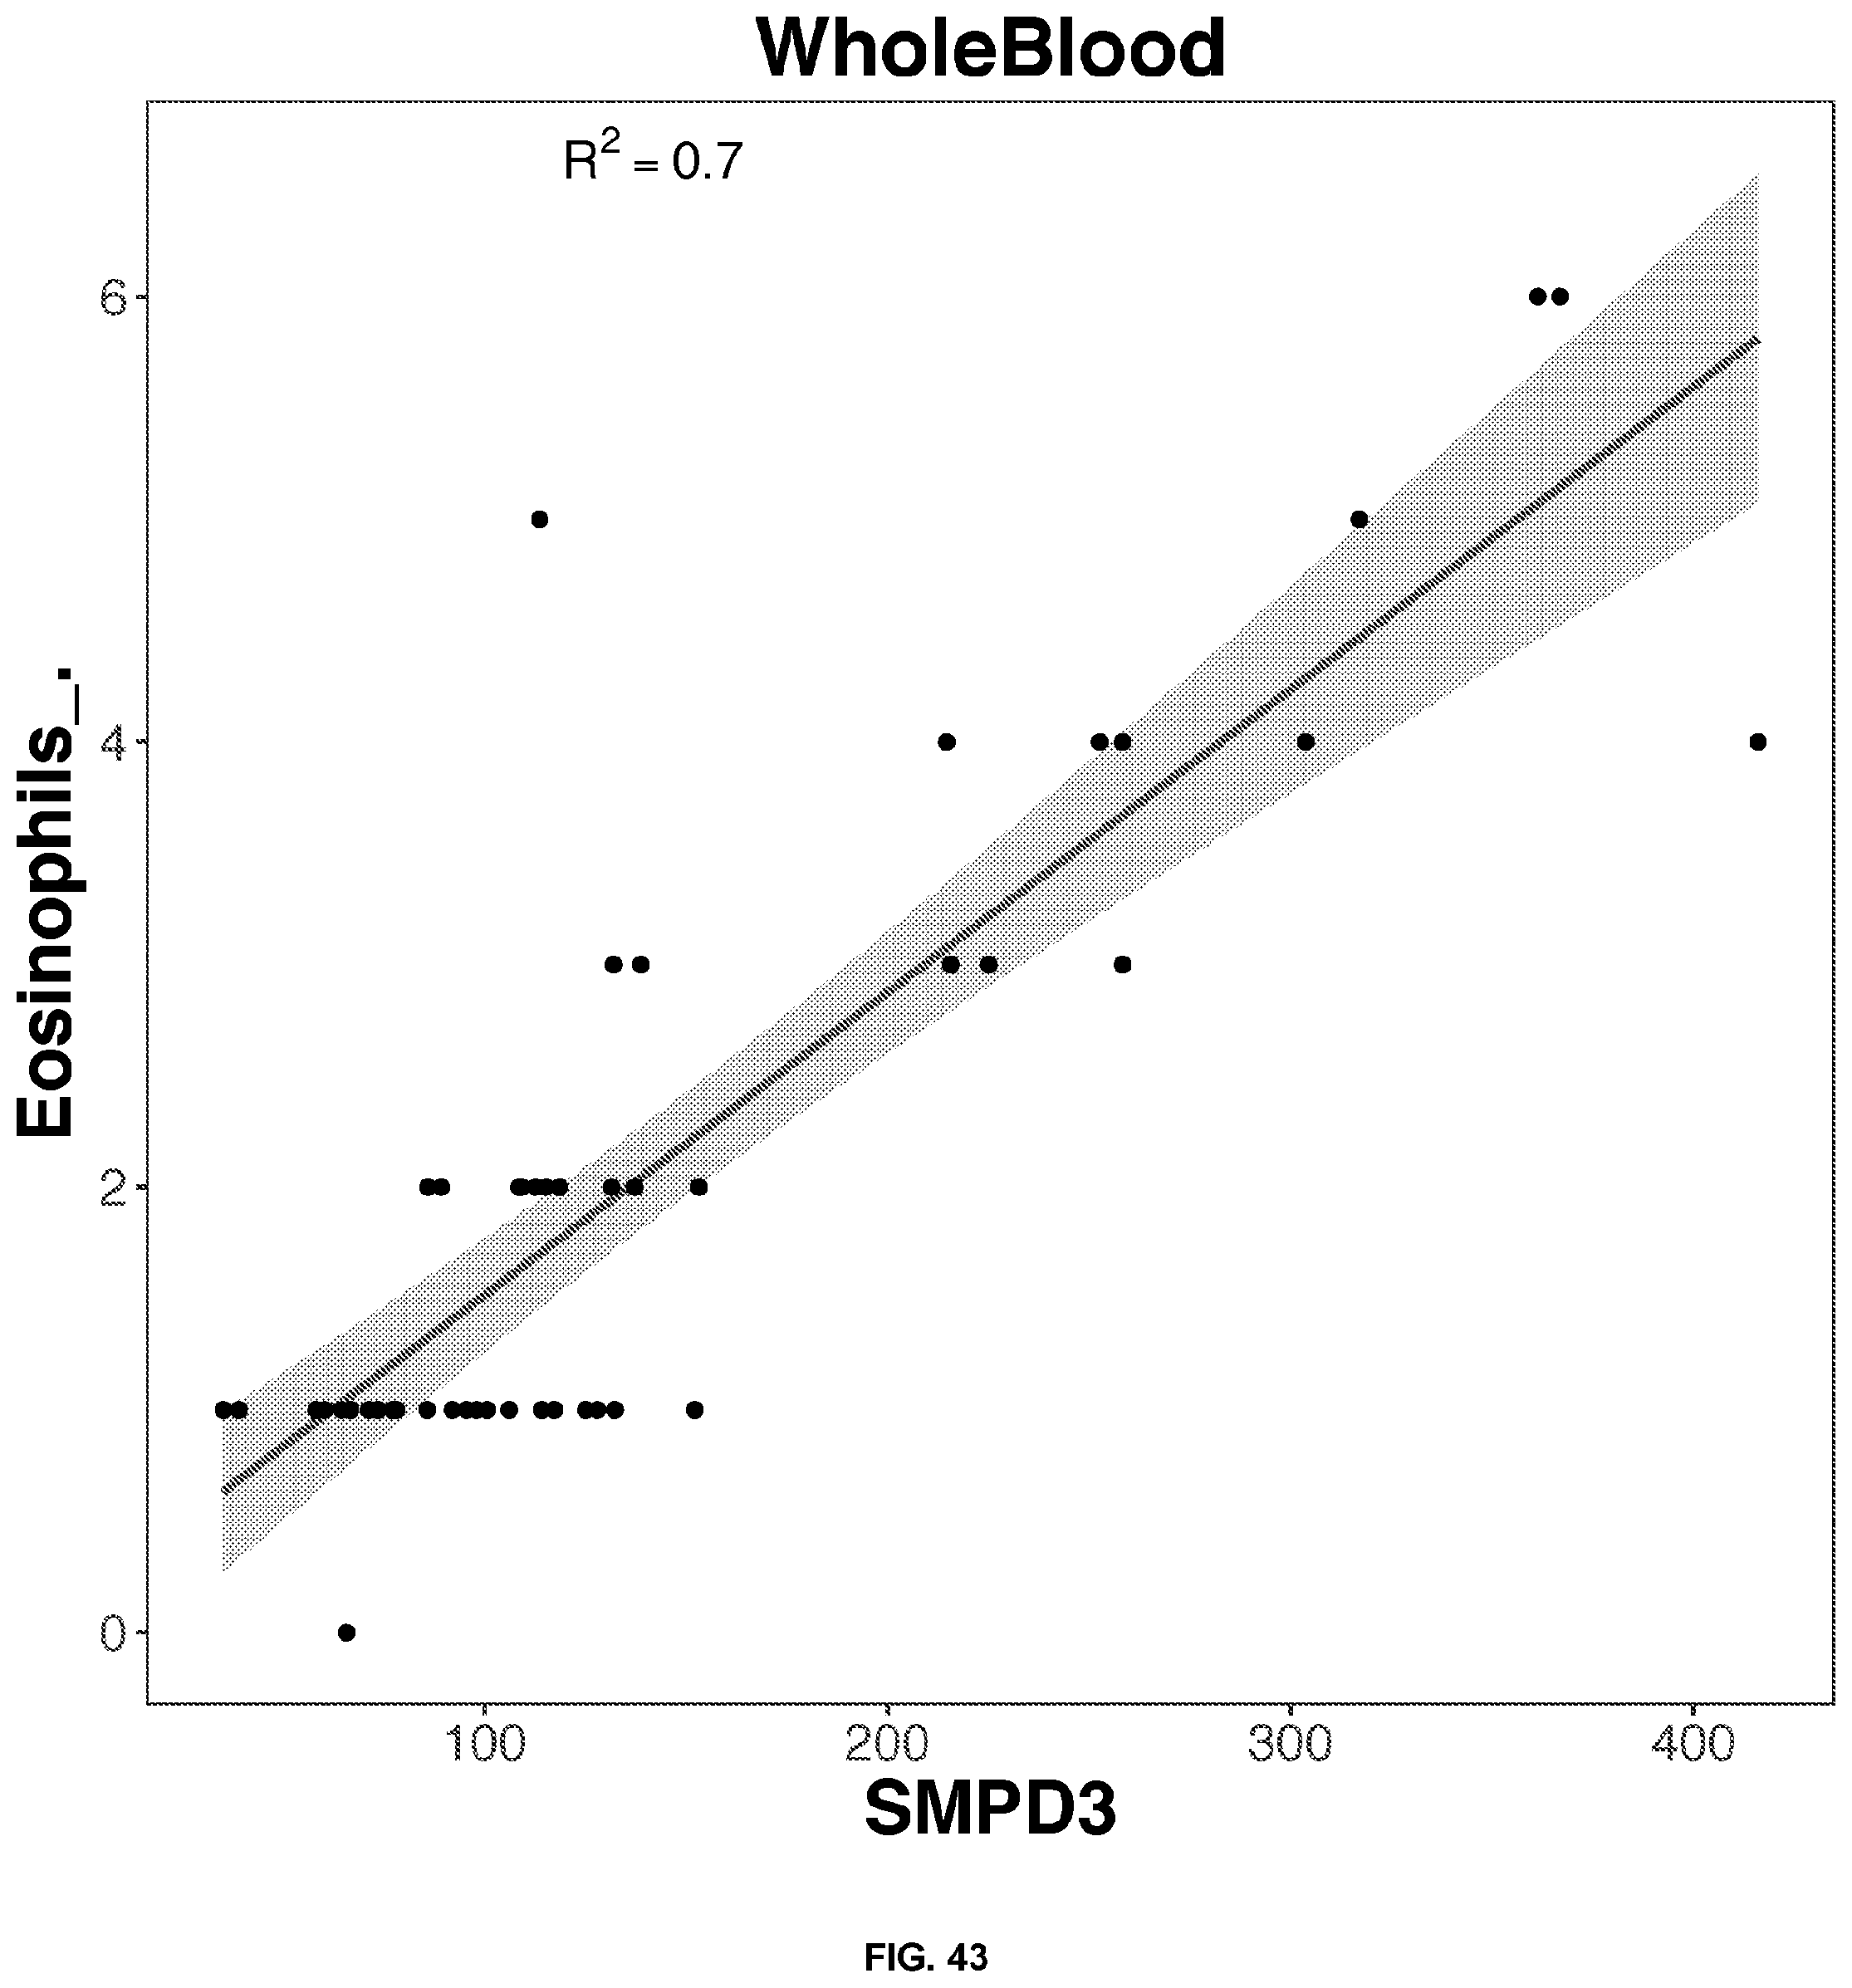
D00044
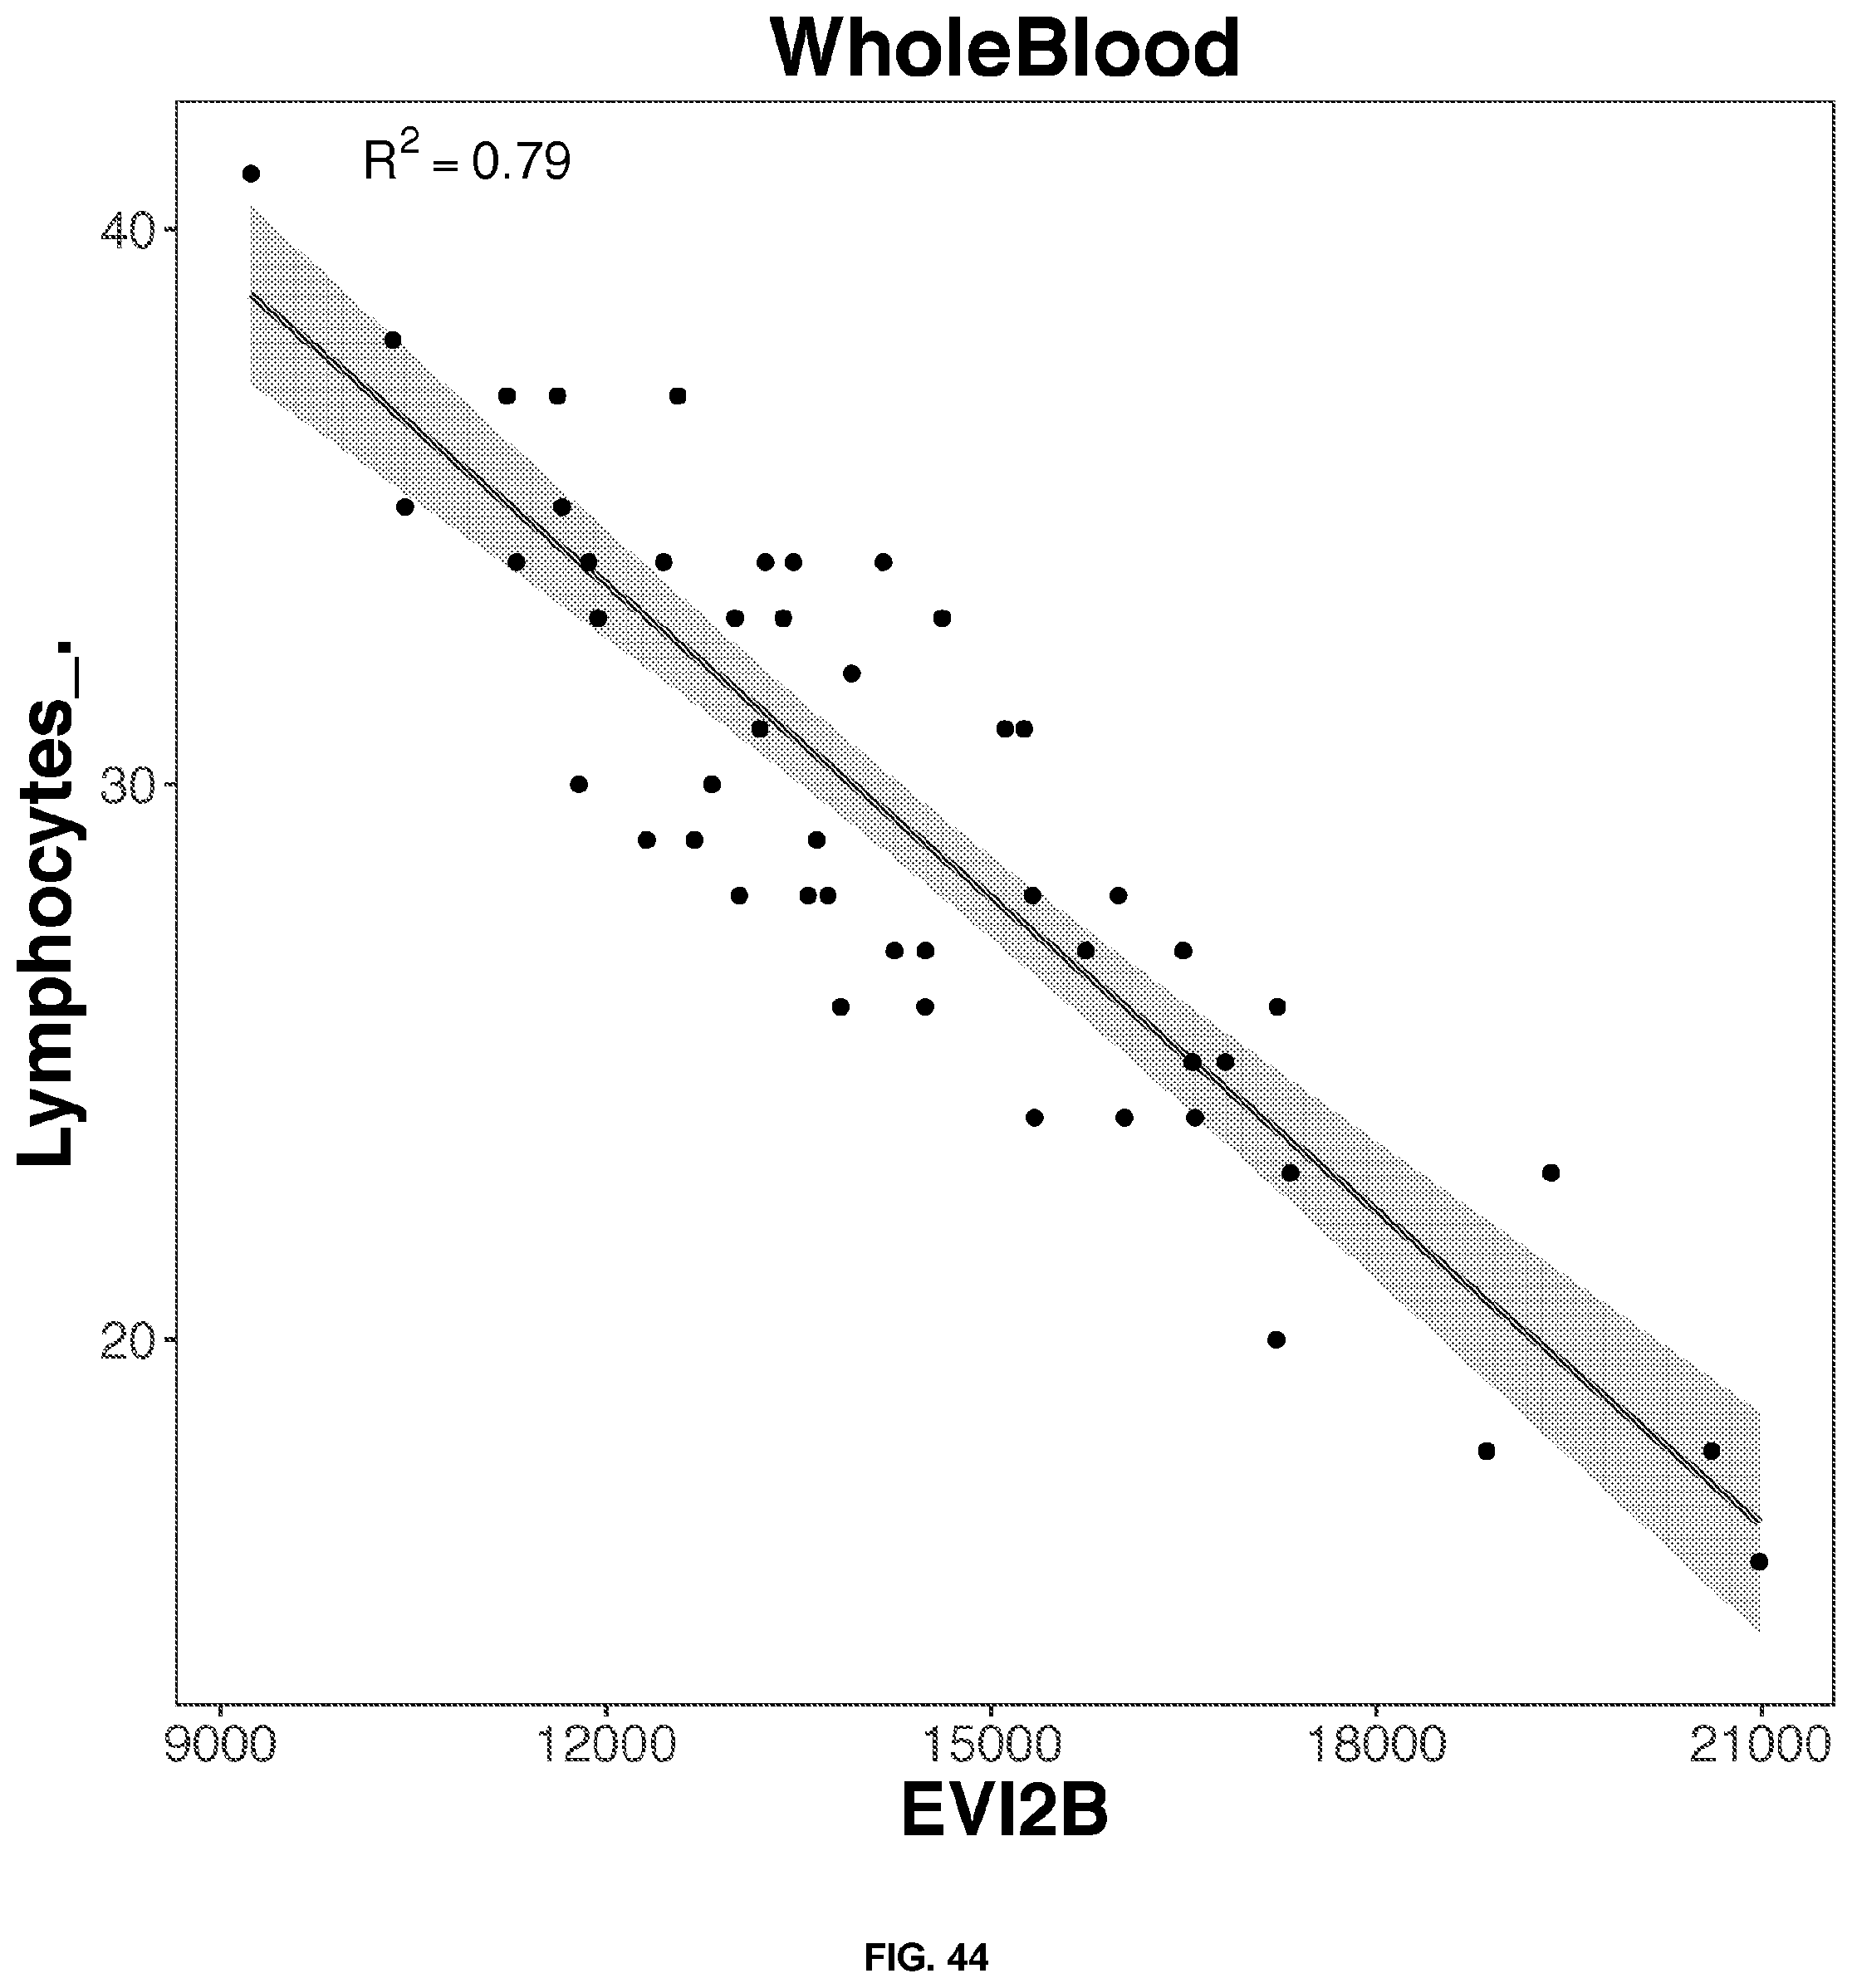
D00045

D00046

D00047

D00048

D00049

D00050
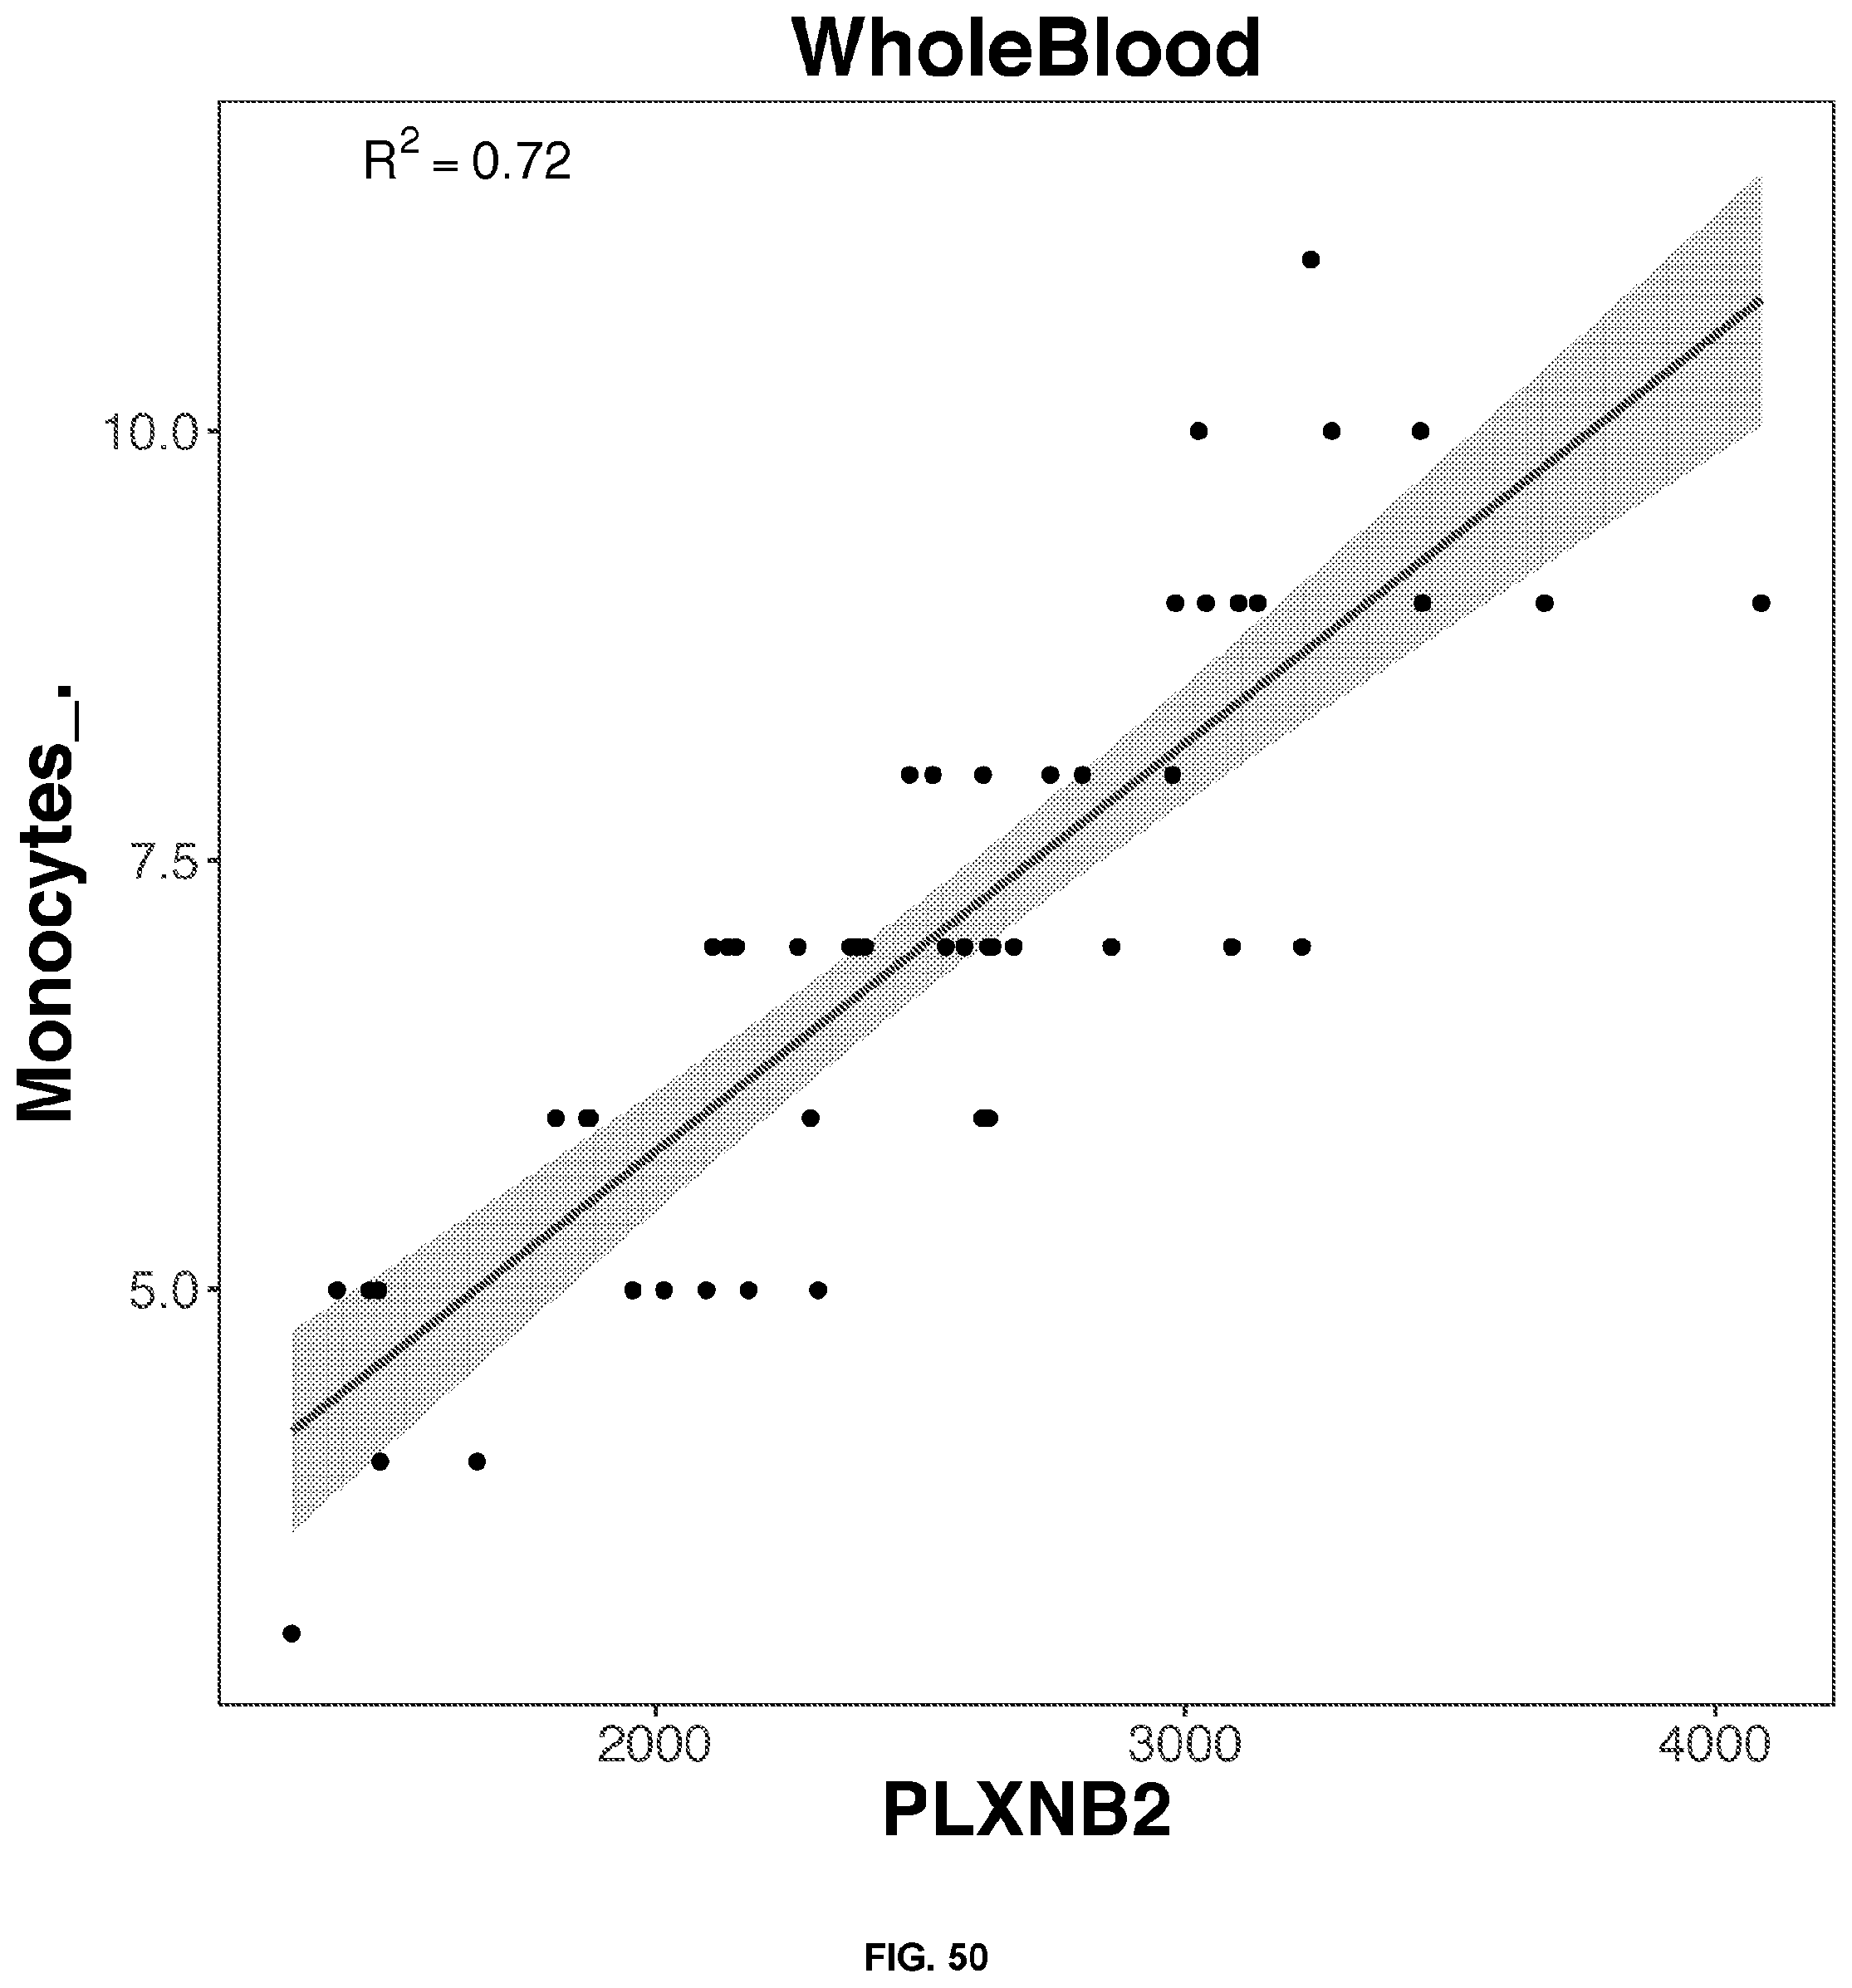
D00051

D00052

D00053

D00054
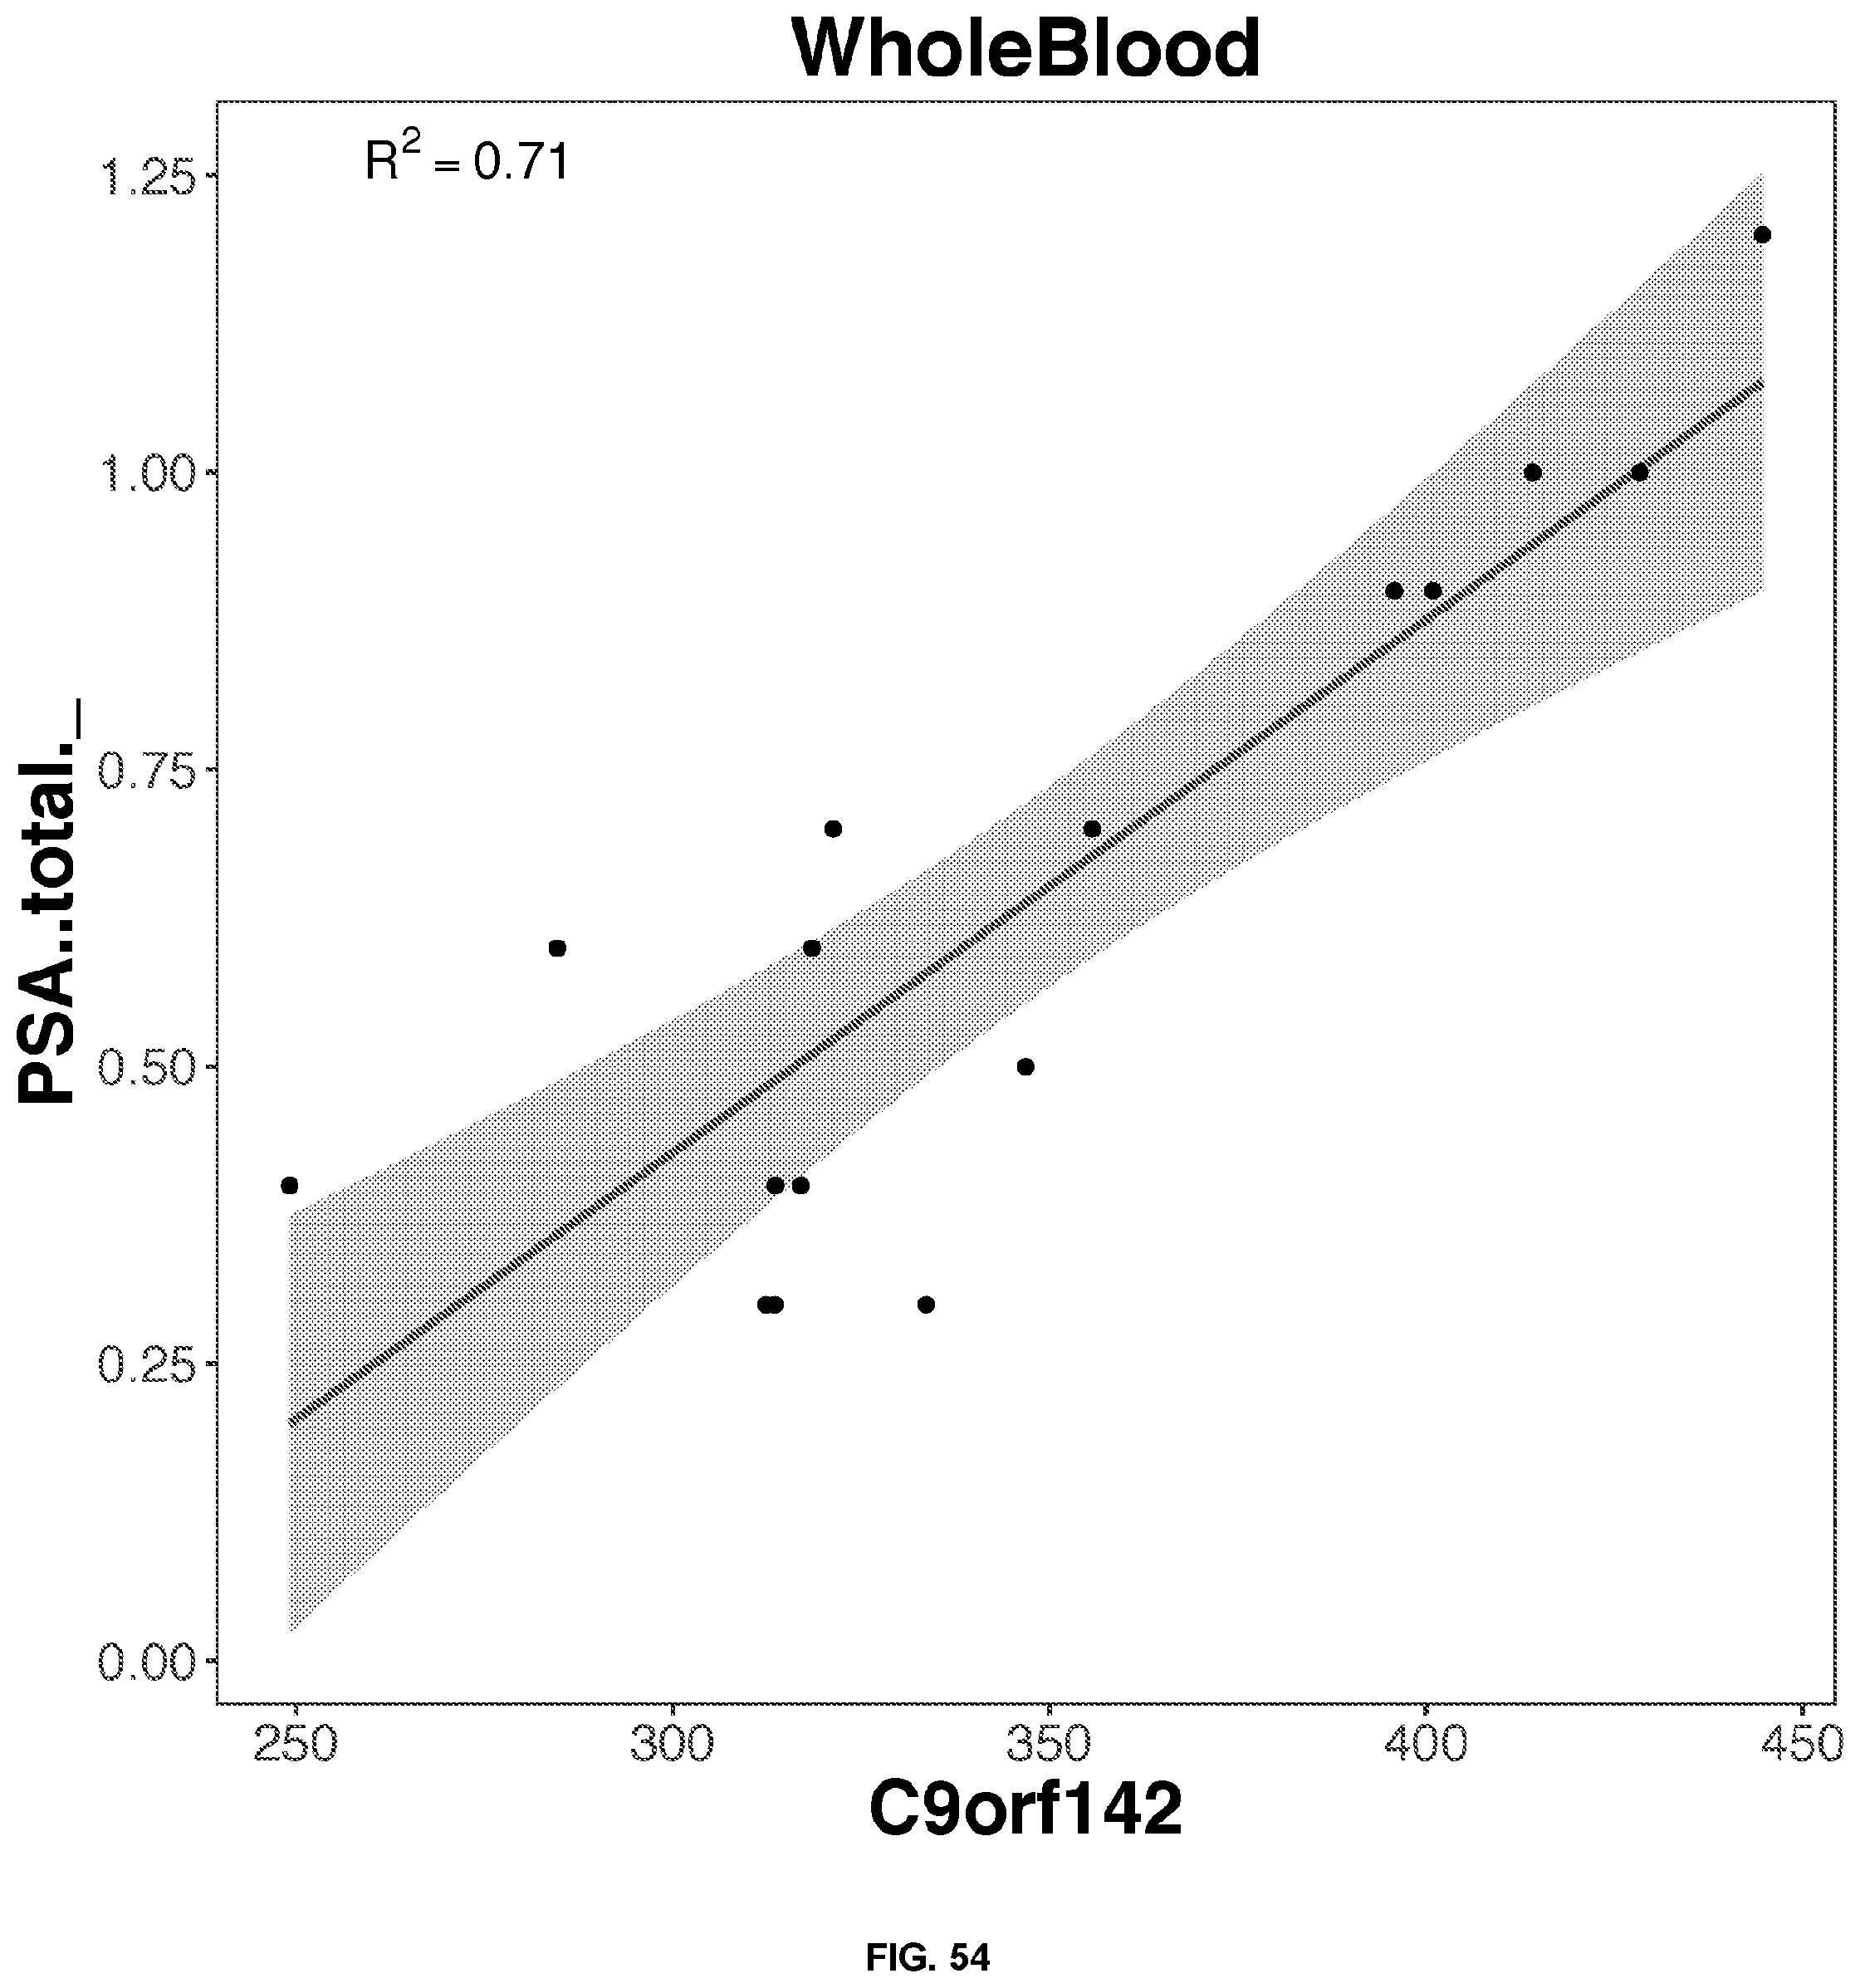
D00055

D00056

D00057

D00058

D00059

D00060

D00061

D00062

D00063

D00064

D00065

D00066
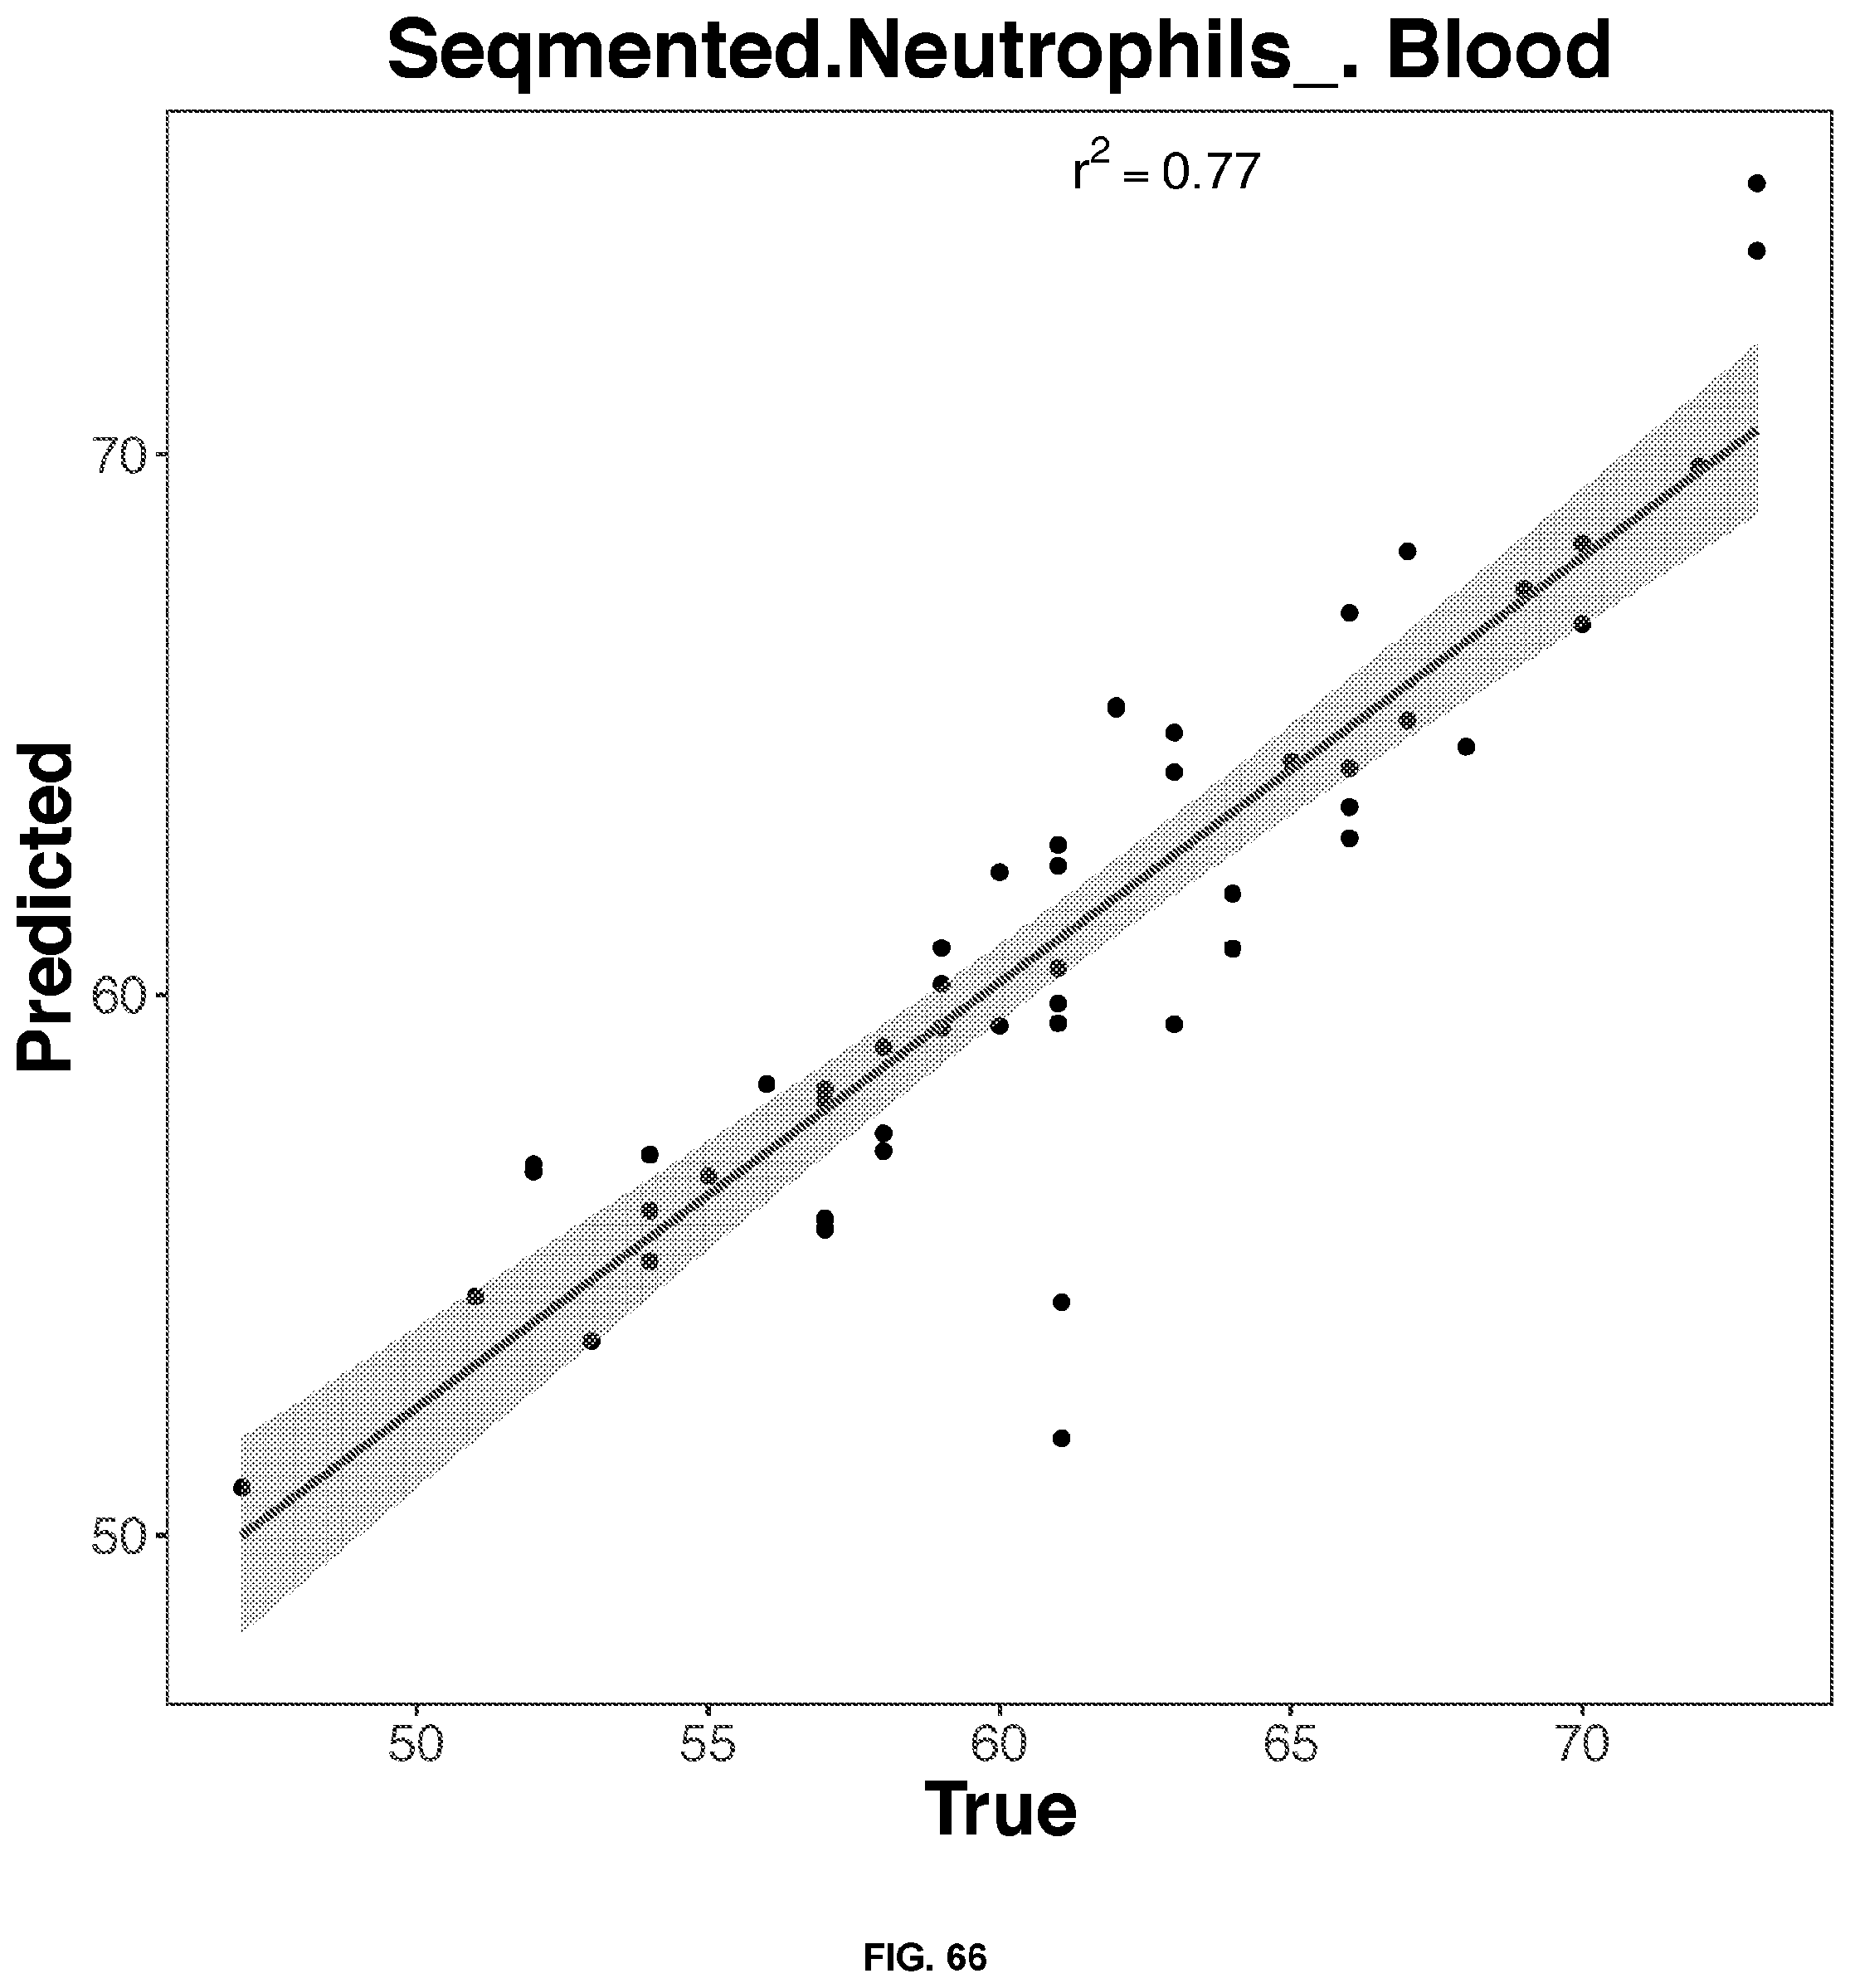
D00067
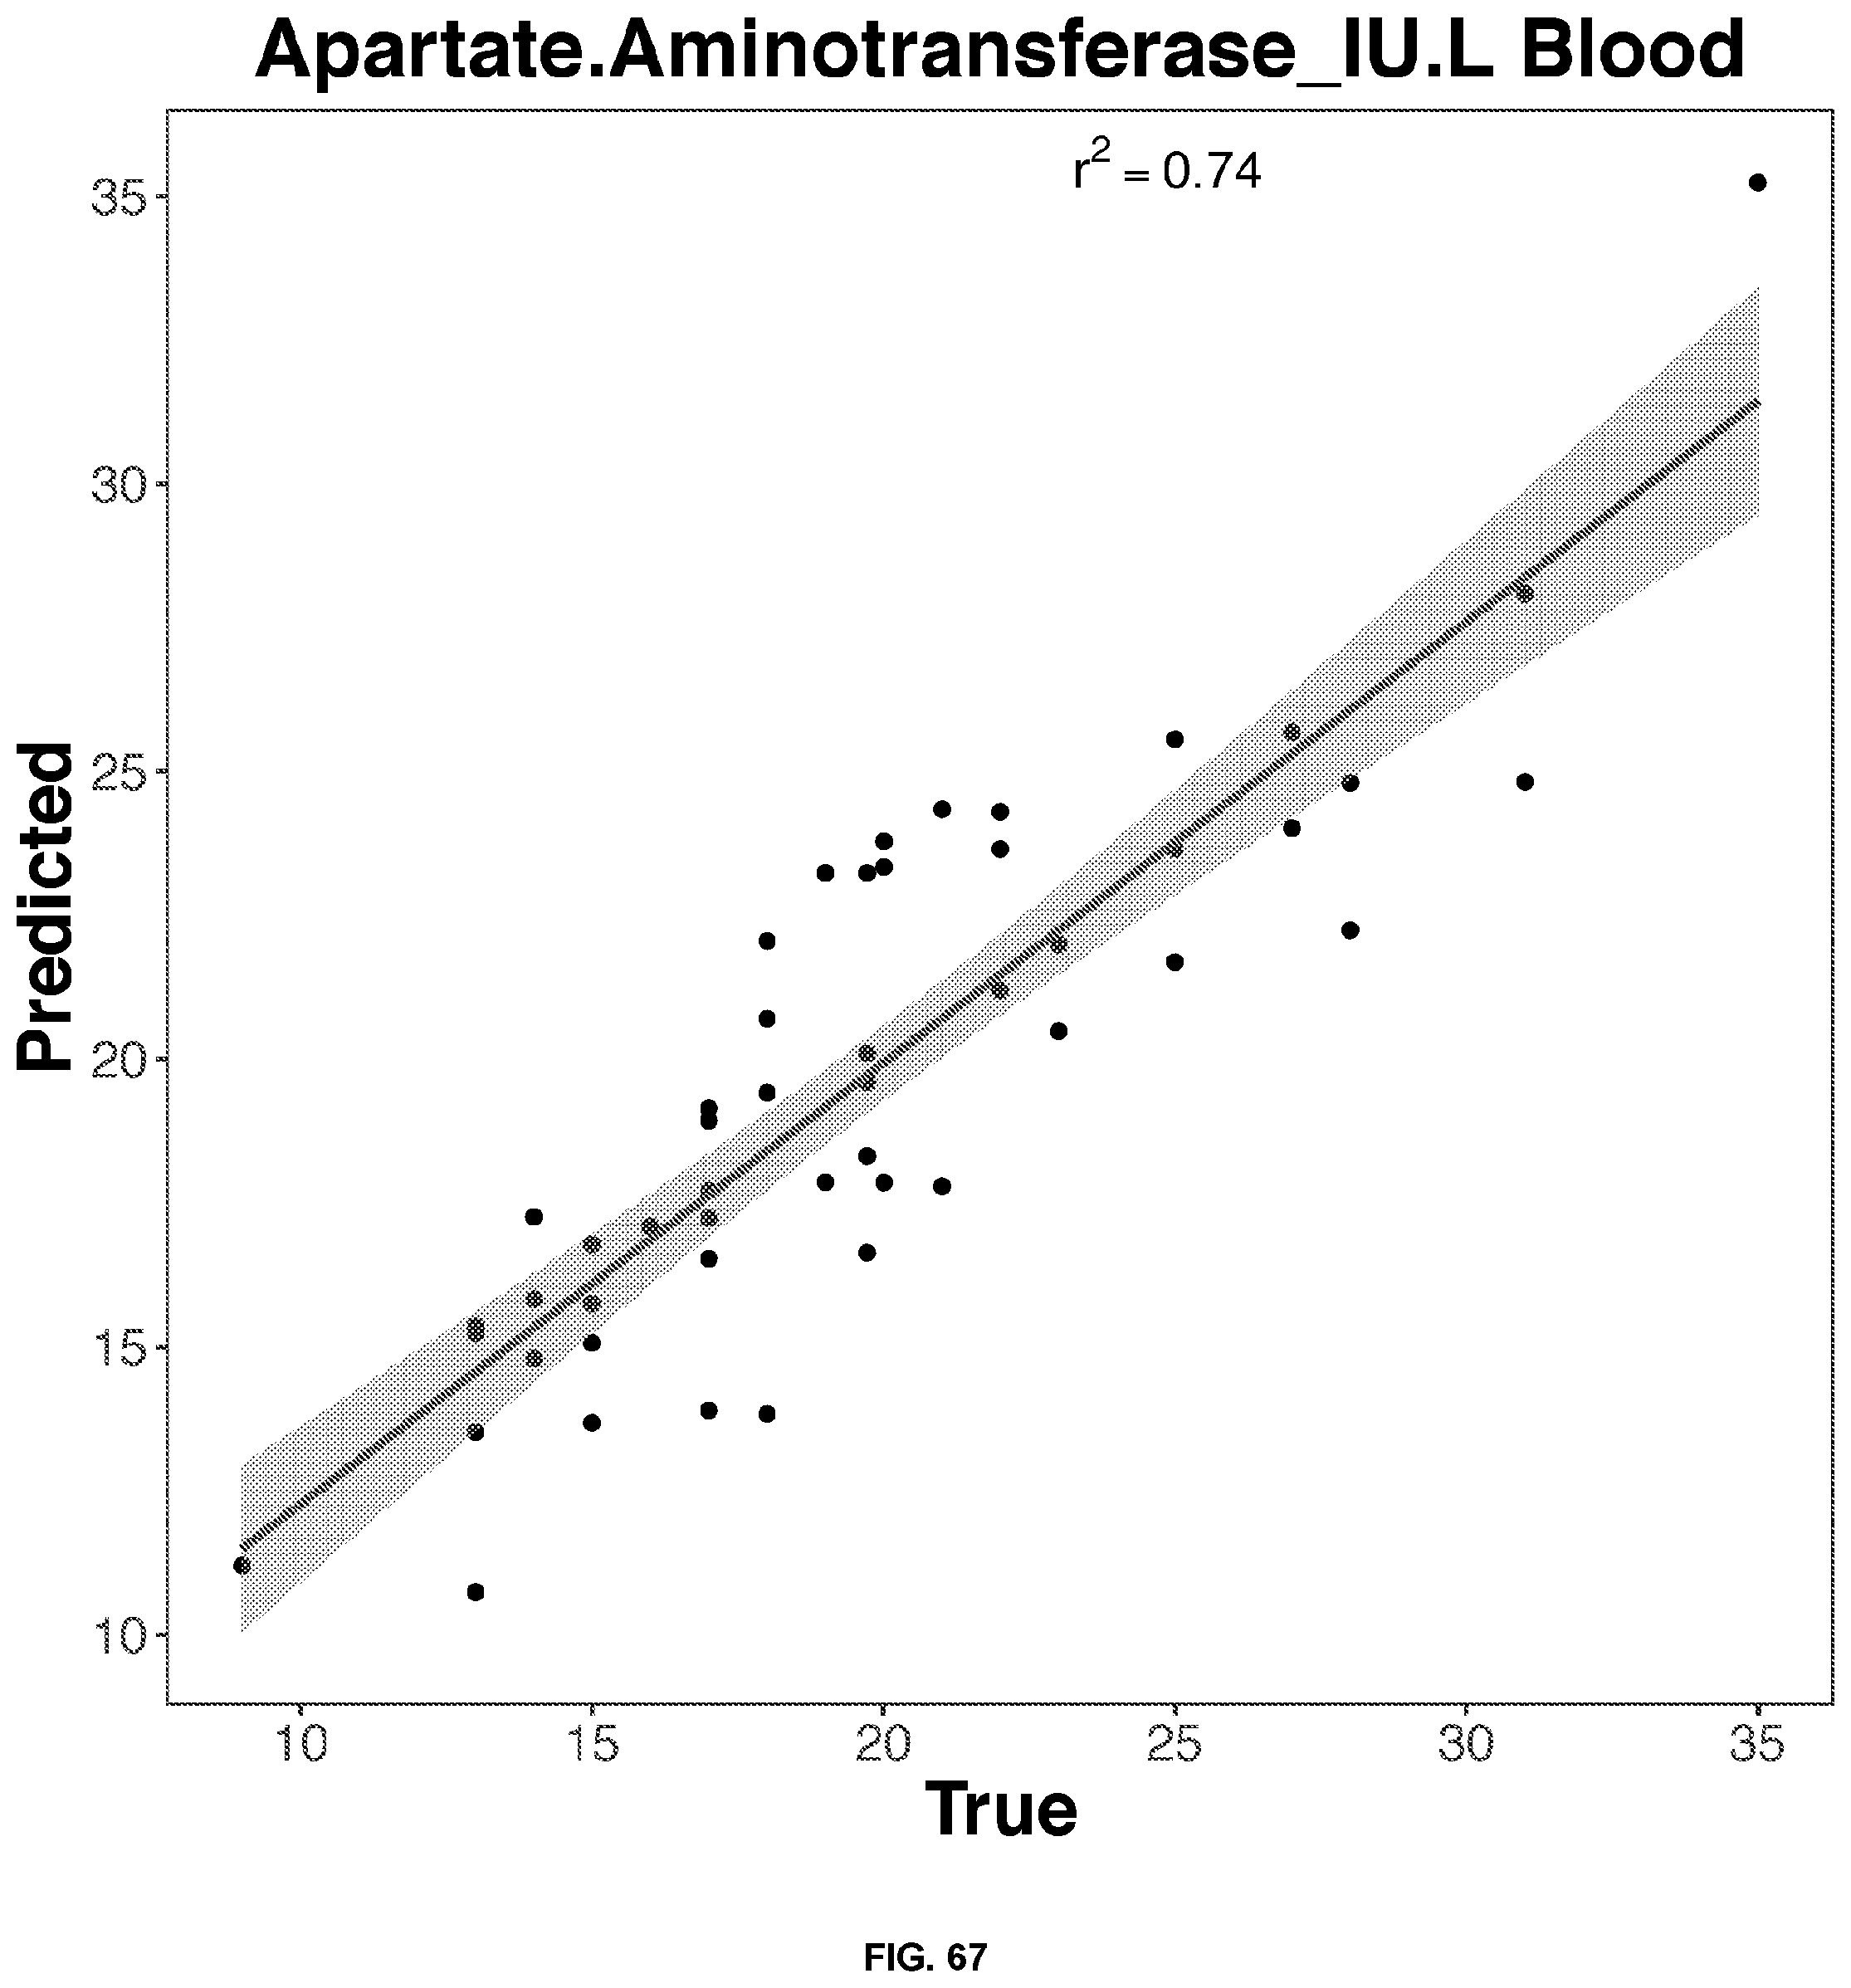
D00068
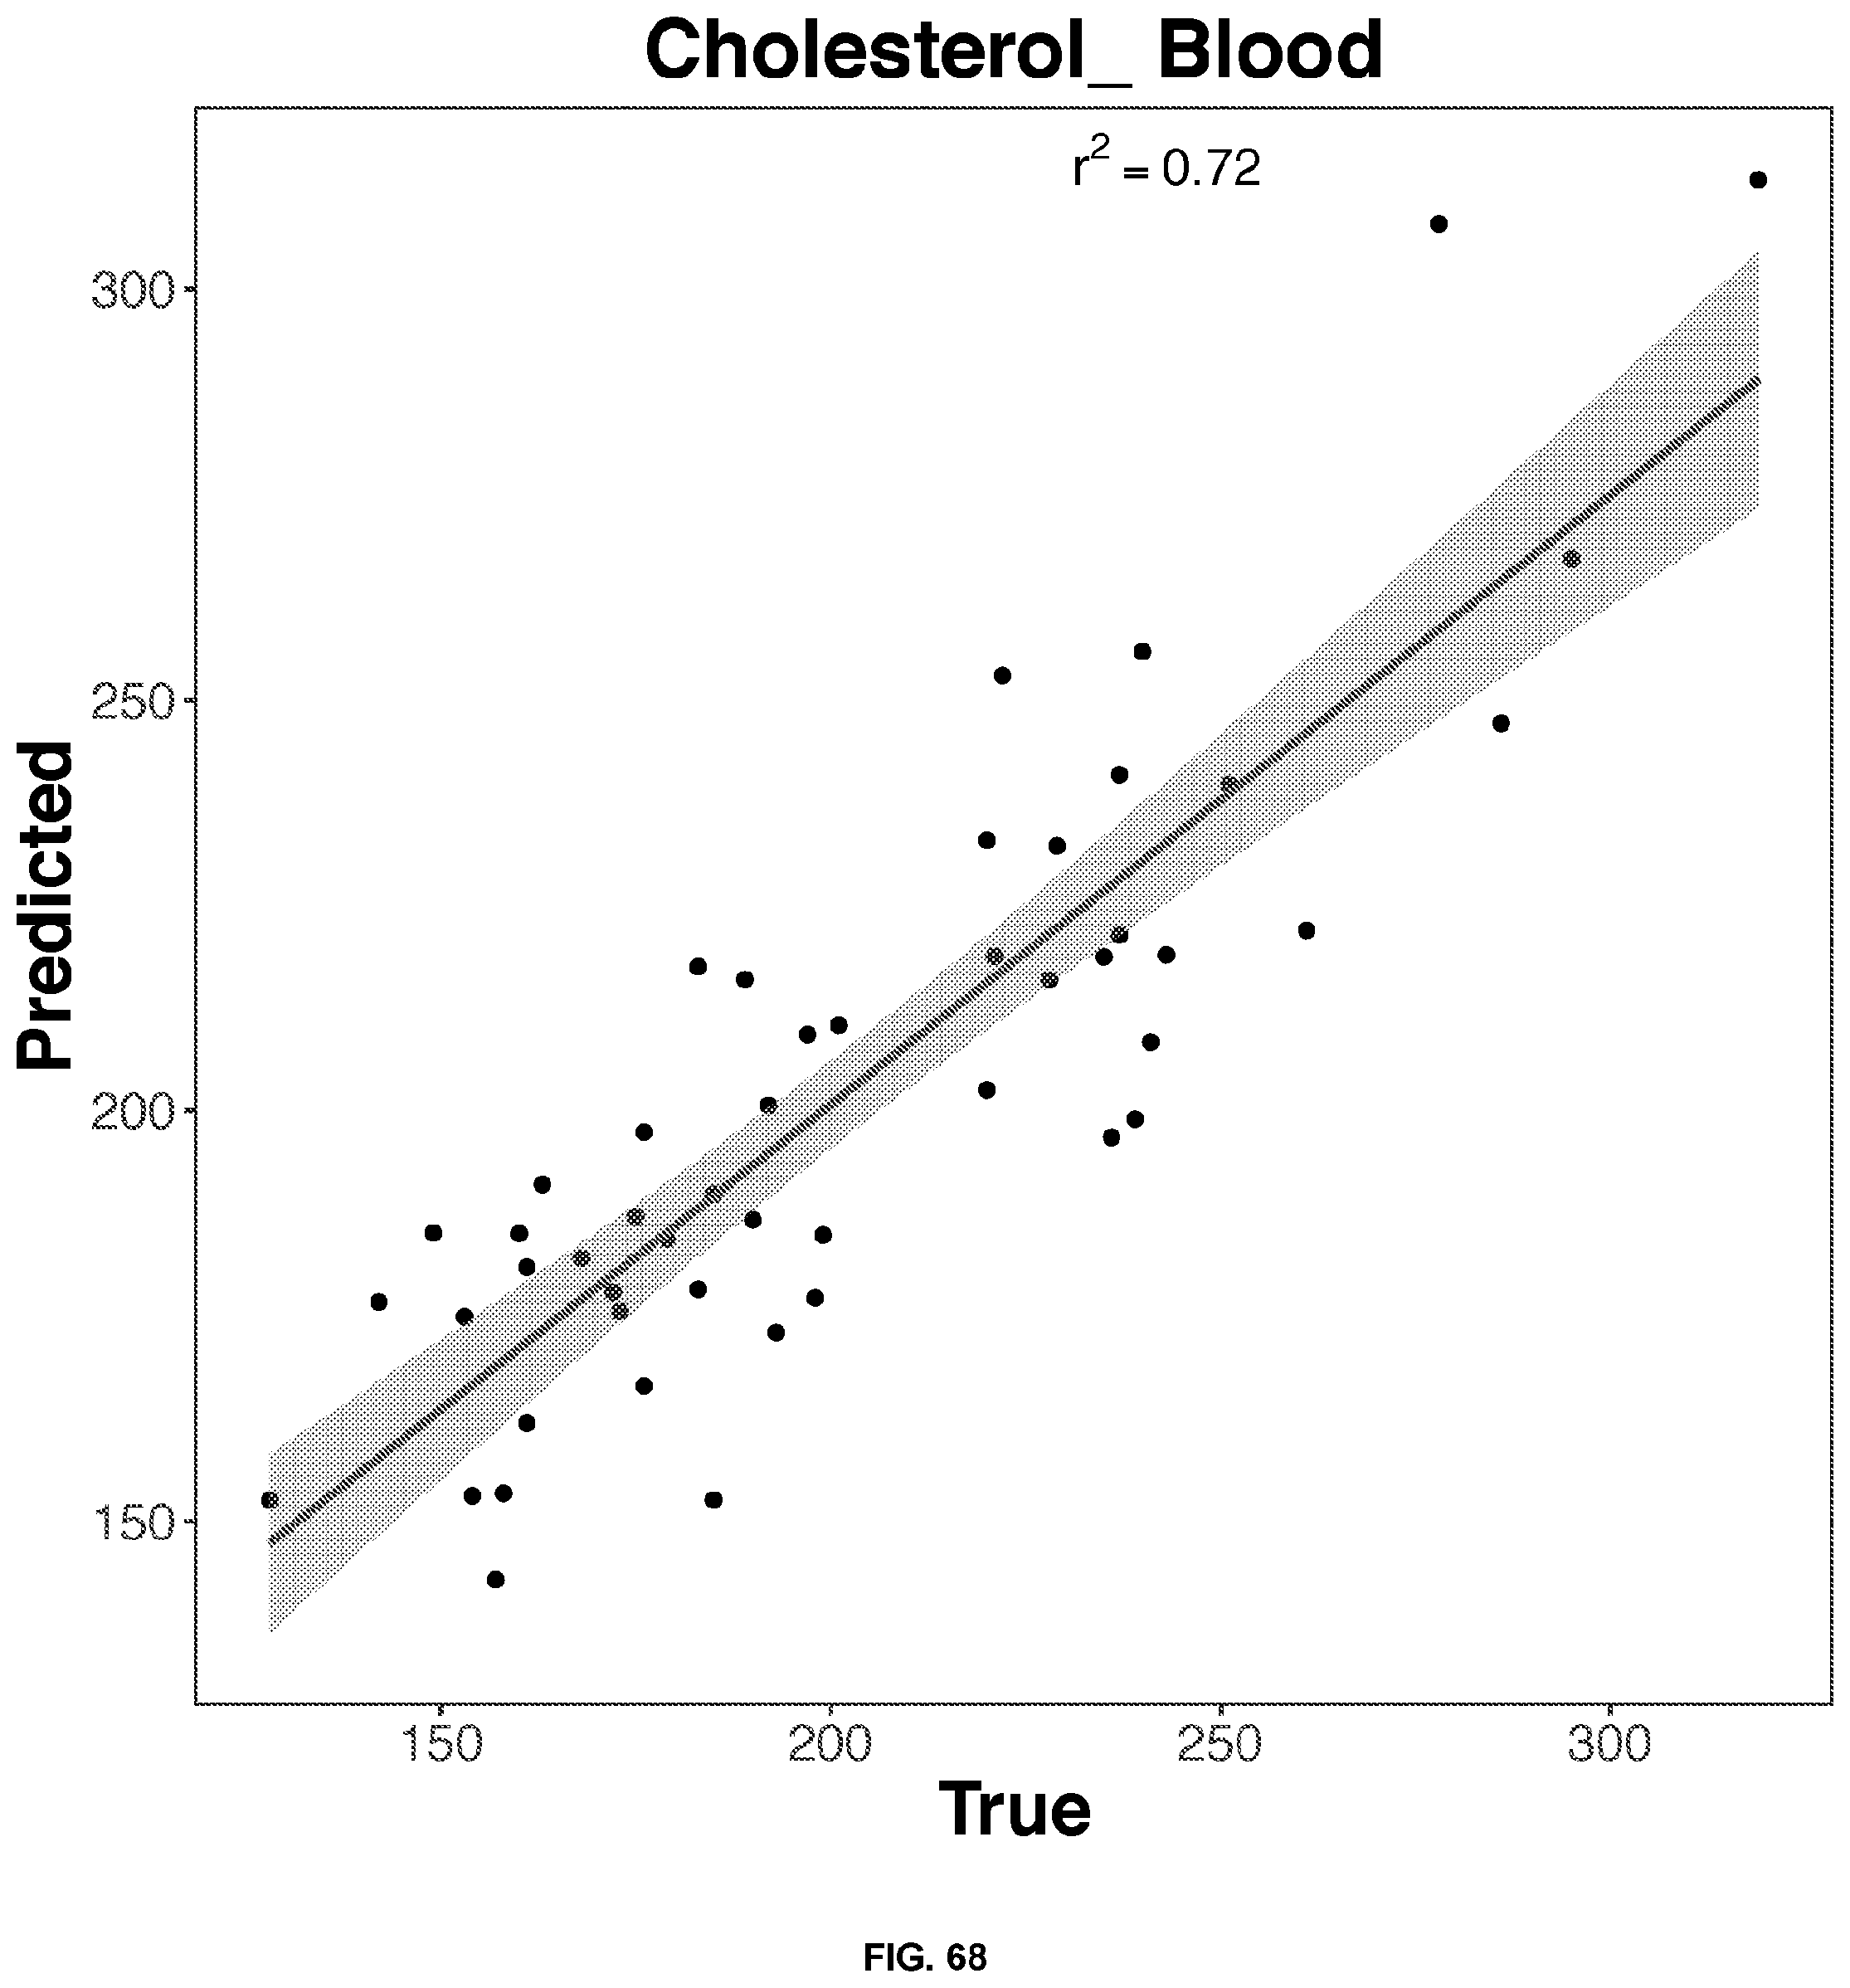
D00069

D00070

D00071

D00072

D00073

D00074

D00075

D00076

D00077
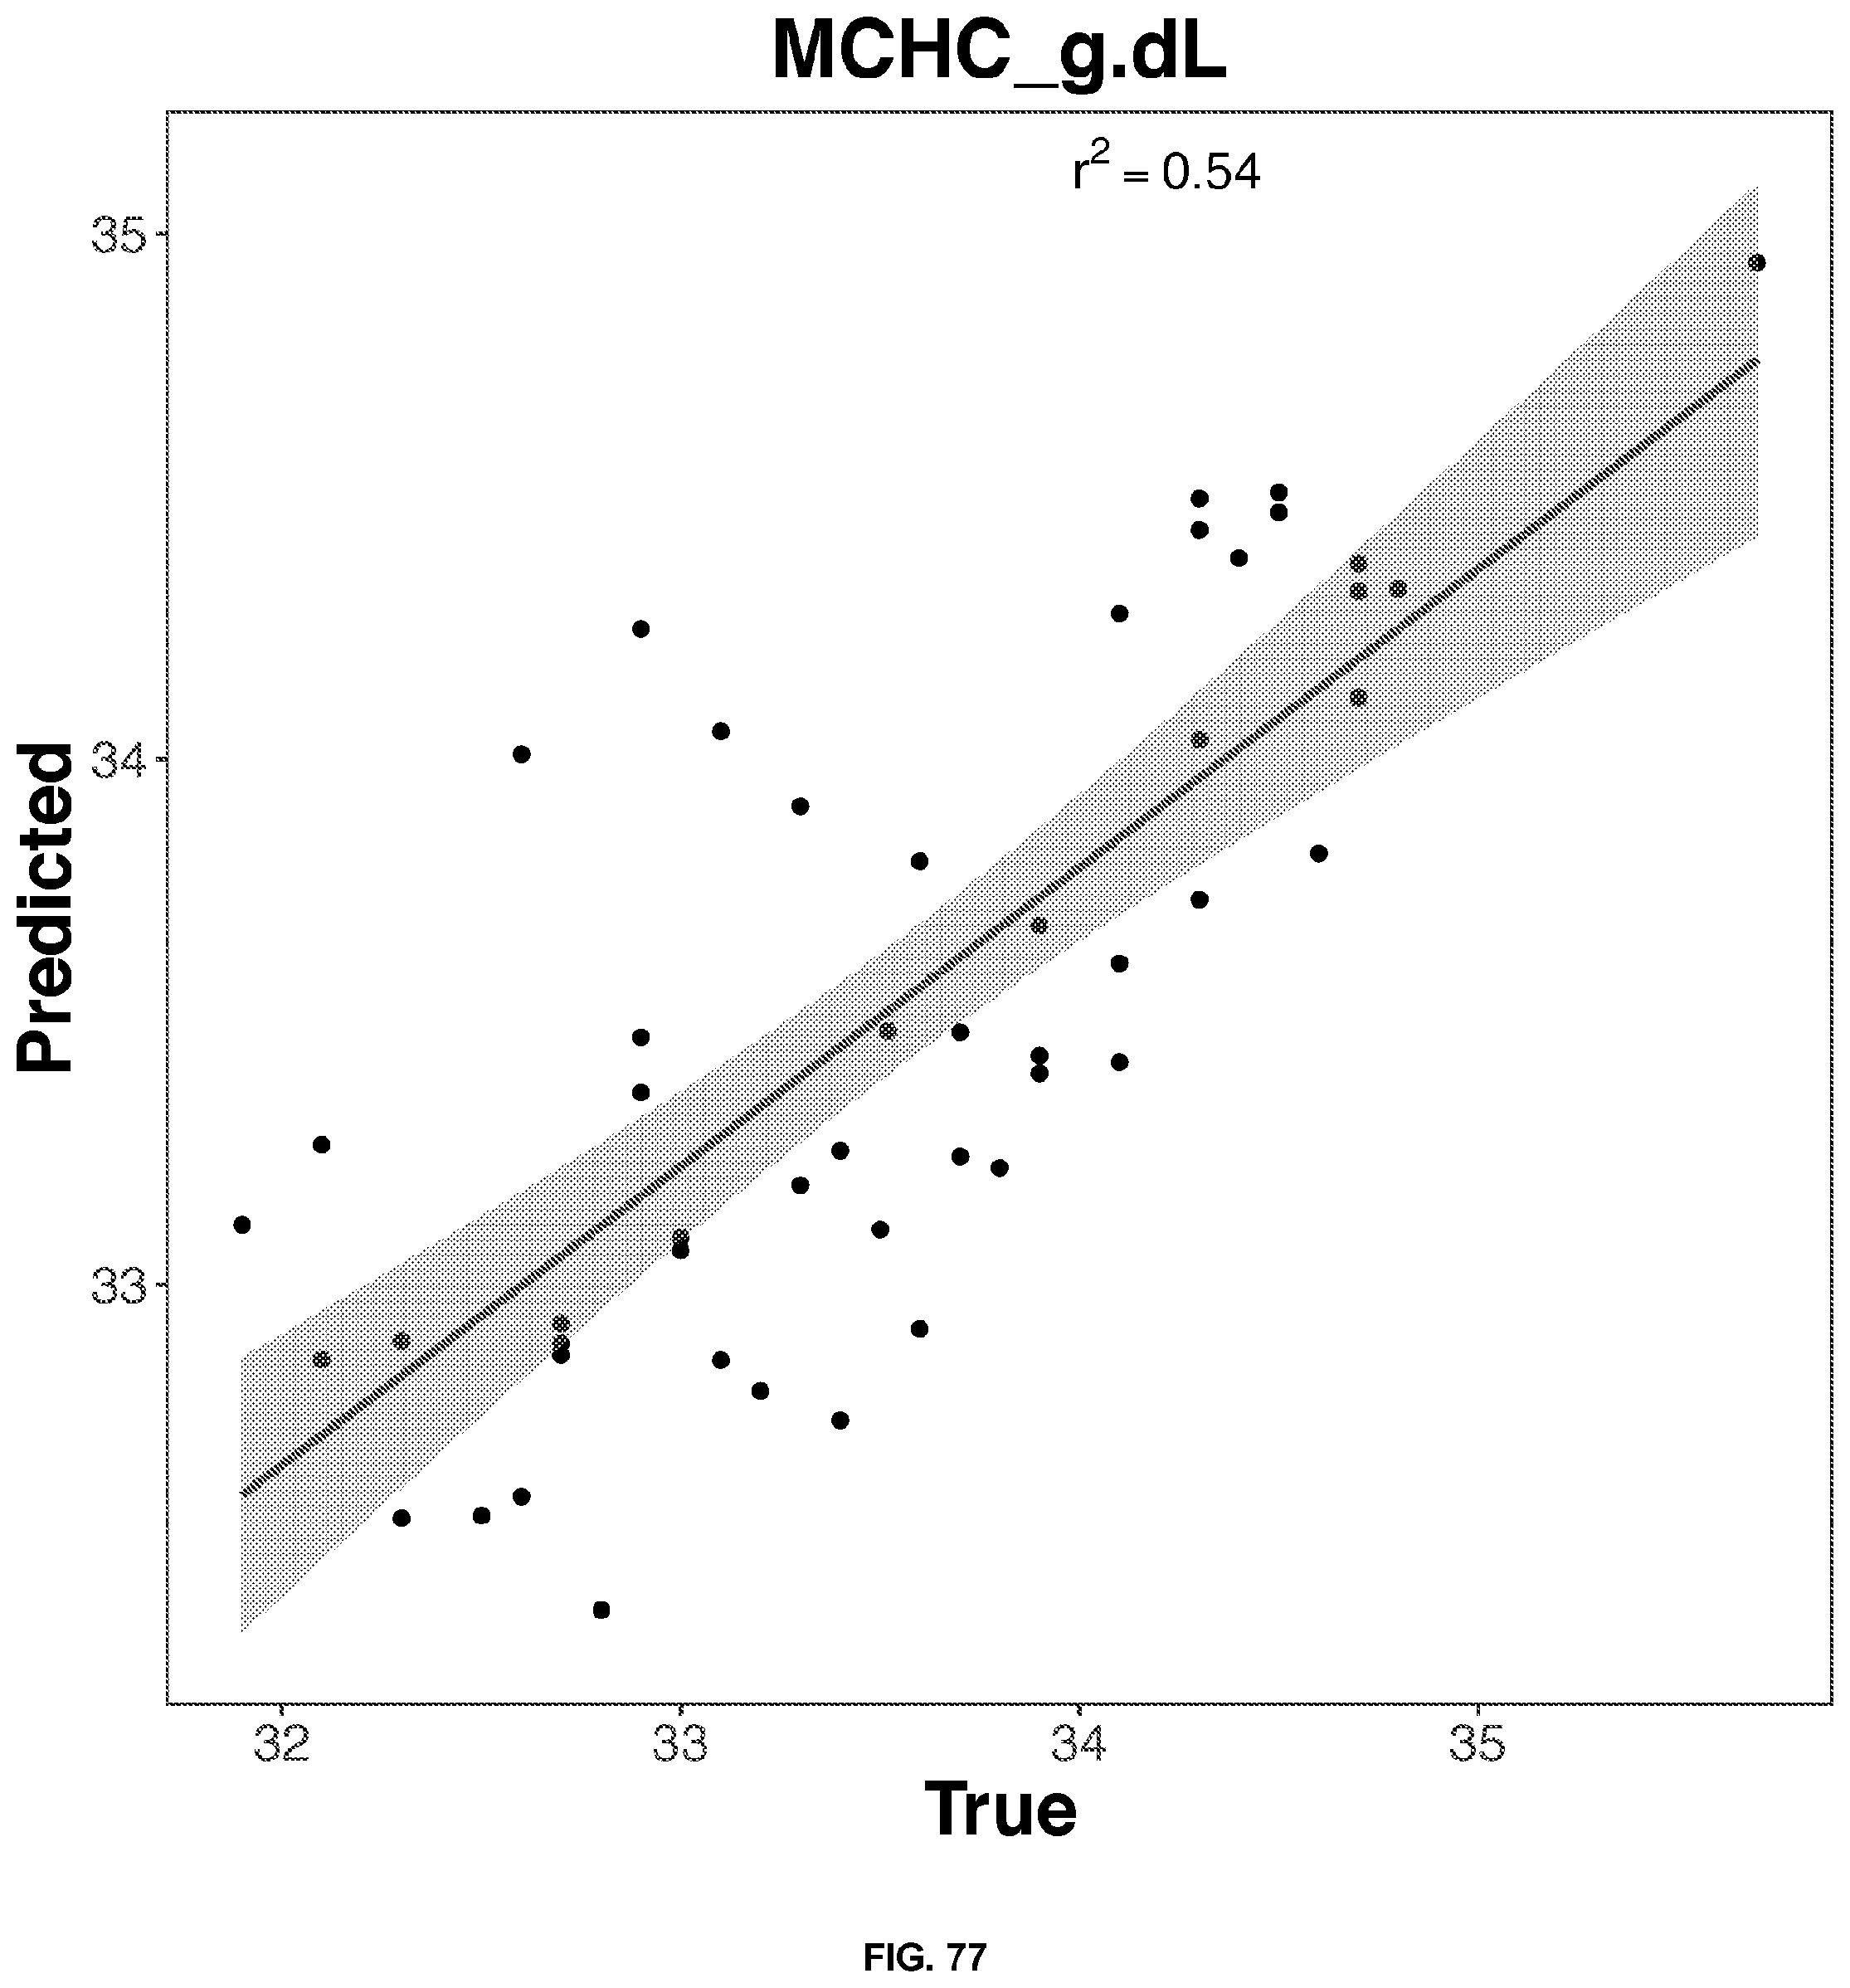
D00078

D00079

D00080

D00081

D00082

D00083

D00084

D00085

D00086

D00087

D00088
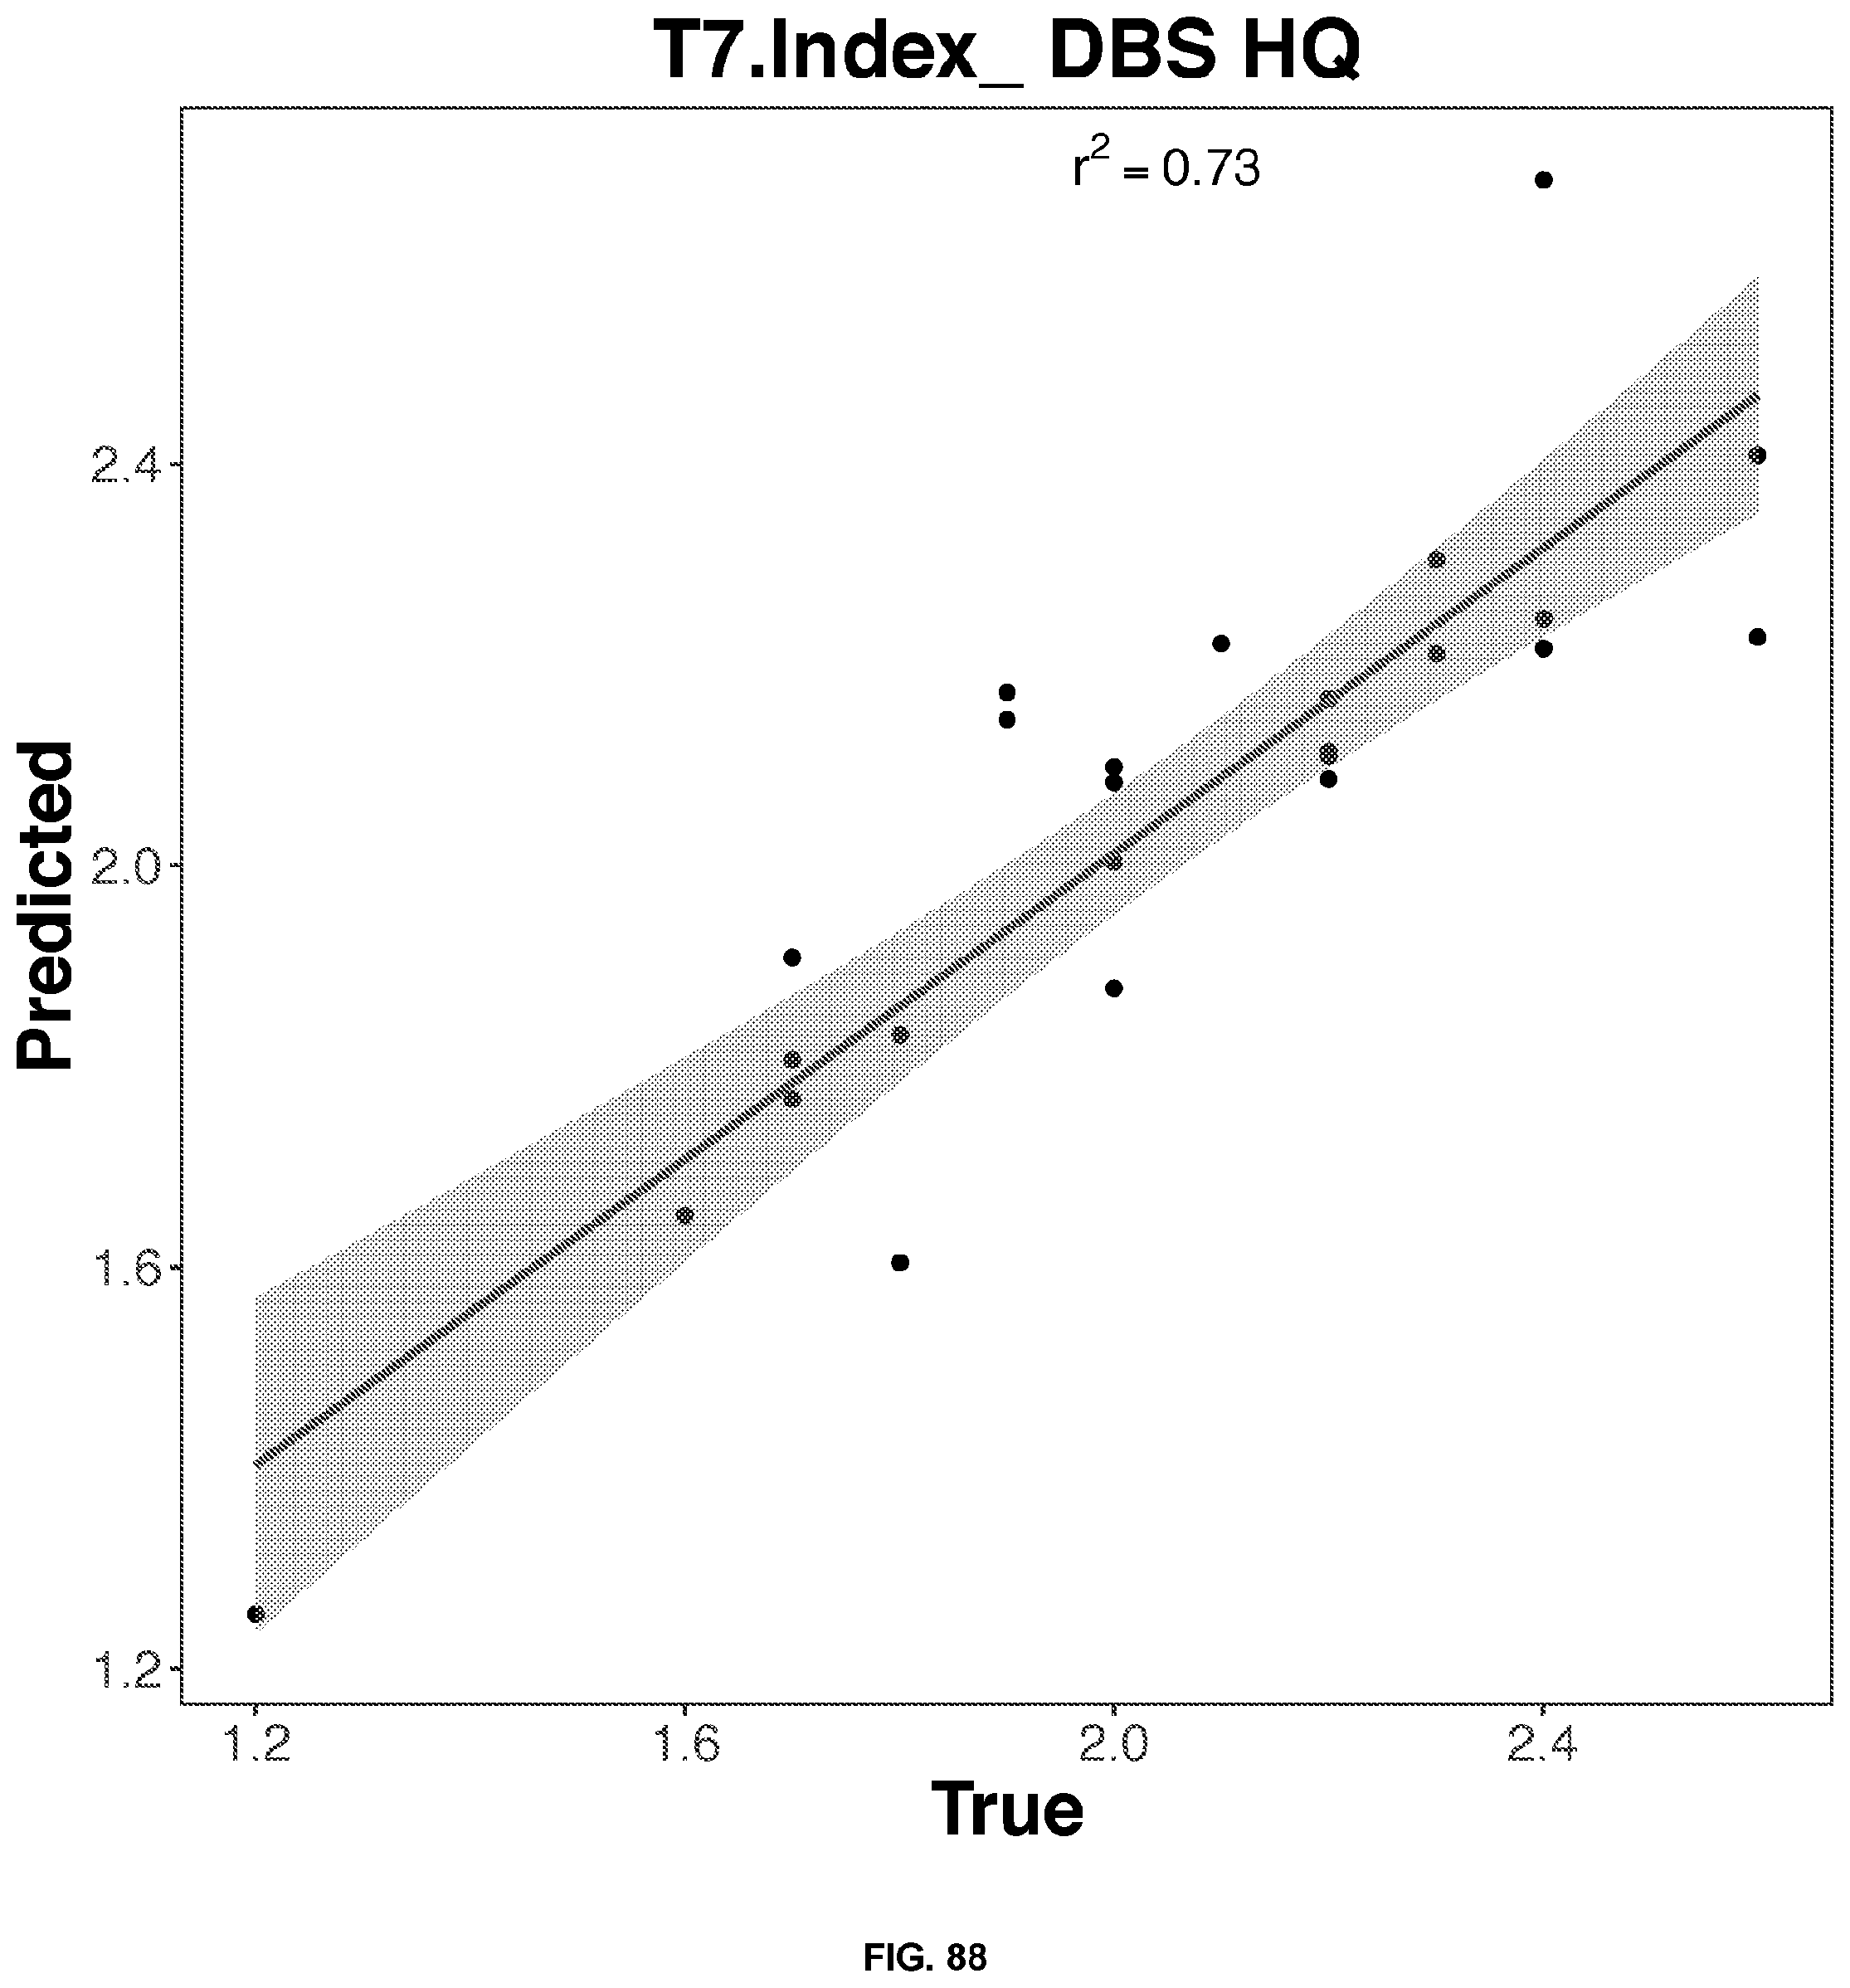
D00089

XML
uspto.report is an independent third-party trademark research tool that is not affiliated, endorsed, or sponsored by the United States Patent and Trademark Office (USPTO) or any other governmental organization. The information provided by uspto.report is based on publicly available data at the time of writing and is intended for informational purposes only.
While we strive to provide accurate and up-to-date information, we do not guarantee the accuracy, completeness, reliability, or suitability of the information displayed on this site. The use of this site is at your own risk. Any reliance you place on such information is therefore strictly at your own risk.
All official trademark data, including owner information, should be verified by visiting the official USPTO website at www.uspto.gov. This site is not intended to replace professional legal advice and should not be used as a substitute for consulting with a legal professional who is knowledgeable about trademark law.