New Tools For Assessing Fimh Blockers Therapeutic Efficiency
CERVINO; Alessandra ; et al.
U.S. patent application number 16/755829 was filed with the patent office on 2020-09-03 for new tools for assessing fimh blockers therapeutic efficiency. The applicant listed for this patent is ENTEROME. Invention is credited to Christophe BONNY, Alessandra CERVINO, Jonathan PLASSAIS.
| Application Number | 20200277655 16/755829 |
| Document ID | / |
| Family ID | 1000004845255 |
| Filed Date | 2020-09-03 |


View All Diagrams
| United States Patent Application | 20200277655 |
| Kind Code | A1 |
| CERVINO; Alessandra ; et al. | September 3, 2020 |
NEW TOOLS FOR ASSESSING FIMH BLOCKERS THERAPEUTIC EFFICIENCY
Abstract
The present invention relates to an in vitro method for identifying subjects hosting high amounts of Fim H expressing proteobacteria in their gut, said method comprising the step of detecting the expression of the fimH gene in a stool sample of said subjects.
| Inventors: | CERVINO; Alessandra; (BOIS-LE-ROI, FR) ; BONNY; Christophe; (PARIS, FR) ; PLASSAIS; Jonathan; (ASNIERES-SUR-SEINE, FR) | ||||||||||
| Applicant: |
|
||||||||||
|---|---|---|---|---|---|---|---|---|---|---|---|
| Family ID: | 1000004845255 | ||||||||||
| Appl. No.: | 16/755829 | ||||||||||
| Filed: | October 16, 2018 | ||||||||||
| PCT Filed: | October 16, 2018 | ||||||||||
| PCT NO: | PCT/EP2018/078297 | ||||||||||
| 371 Date: | April 13, 2020 |
| Current U.S. Class: | 1/1 |
| Current CPC Class: | A61K 31/7064 20130101; C12Q 1/689 20130101; C12Q 2600/106 20130101 |
| International Class: | C12Q 1/689 20060101 C12Q001/689; A61K 31/7064 20060101 A61K031/7064 |
Foreign Application Data
| Date | Code | Application Number |
|---|---|---|
| Oct 16, 2017 | EP | 17306402.3 |
Claims
1-36. (canceled)
37. A method comprising the step of detecting the expression of the fimH gene in a stool sample of subjects, wherein said detecting step is performed by measuring the switch of the fim operon transcription from OFF to ON in a nucleotide fraction of said stool sample or by measuring the abundance of the fimH gene in a nucleotide fraction of said stool sample.
38. The method of claim 37, wherein the switch of the fim operon transcription from OFF to ON is detected by qPCR by using primers amplifying parts of the nucleotide regions of SEQ ID NO:13 to SEQ ID NO:33 within the FimS, the FimA and FimE region of the fim operon.
39. The method of claim 37, wherein the abundance of the fimH gene is measured by qPCR by using the primer pairs of SEQ ID NO:35 to 40.
40. The method of claim 37, for predicting if said subject will benefit from a treatment with a FimH blocker.
41. The method of claim 37, for identifying subsets of patients that are sensitive or resistant to a treatment with a FimH blocker.
42. The method of claim 37, for diagnosing and/or monitoring a FimH proteobacteria related disease in a subject.
43. The method of claim 37, for testing the therapeutic efficiency of a treatment in a subject suffering from a FimH proteobacteria related disease.
44. The method of claim 37, wherein said detecting step consists in measuring the presence of the ON region of SEQ ID NO:14 of the fim operon transcription in said stool sample.
45. The method of claim 37, wherein said detecting step consists in measuring the presence of the ON region of SEQ ID NO:14 of the fim operon transcription in said stool sample by using the primer pair of SEQ ID NO:5&7.
46. The method of claim 37, wherein said detecting step consists in measuring the presence of the OFF region of SEQ ID NO: 13 of the fim operon transcription in said stool sample.
47. The method of claim 37, wherein said detecting step consists in measuring the presence of the OFF region of SEQ ID NO: 13 of the fim operon transcription in said stool sample, by using the primer pair of SEQ ID NO:5&8.
48. A method for treating a subject suffering from a FimH proteobacteria related disease, said method comprising the steps of: a) Isolating the nucleotide fraction of a stool sample from said subject, b) Detecting the expression of the fimH gene in said nucleotide fraction as described in claim 37, c) Administering a FimH blocker only if said subject express high amounts of FimH in said nucleotide fraction.
49. The method of claim 48, wherein said detecting step b) consists in measuring the presence of the ON region of SEQ ID NO:14 of the fim operon transcription in said stool sample.
50. The method of claim 48, wherein said detecting step consists in measuring the presence of the ON region of SEQ ID NO:14 of the fim operon transcription in said stool sample by using the primer pair of SEQ ID NO:5&7.
51. The method of claim 48, wherein said detecting step consists in measuring the presence of the OFF region of SEQ ID NO: 13 of the fim operon transcription in said stool sample.
52. The method of claim 48, wherein said detecting step consists in measuring the presence of the OFF region of SEQ ID NO: 13 of the fim operon transcription in said stool sample, by using the primer pair of SEQ ID NO:5&8.
53. The method of claim 40, wherein said FimH blocker is a mannose derivative of the formula: ##STR00003##
54. The method of any one of claim 42, wherein said FimH proteobacteria related disease is an Inflammatory Bowel Disease or a urinary tract infection.
55. The method of any one of claim 42, wherein said subject is a human being.
56. The method of any one of claim 42, wherein said subject is a human being suffering from the Crohn's disease.
Description
SUMMARY OF THE INVENTION
[0001] The present invention relates to an in vitro method for predicting or assessing a therapeutic response to a FimH blocker in a subject, said method comprising the step of measuring the switch of the fim operon transcription from OFF to ON in a nucleotide fraction of a biological sample of said subject. Said subject will benefit from a treatment with a FimH blocker if the normalized amplification level of the ON position of the fim operon is superior to a reference value. It is also possible to monitor the IBD disease activity in said subject by using this biomarker. Preferably, the biological sample used in this method is a stool sample.
BACKGROUND OF THE INVENTION
[0002] The gut microbiota plays an important role in several diseases, as gut microbiota lies at the interface of the gut, the host immune system and the environment. A typical human gut microbiota comprises thousands of microbial species, among which commensal, beneficial or pathogenic bacteria. The role of each of these microorganisms is hardly described; however, it is known they change their behavior in diseased individuals in favor of the pathogenic potential of certain commensal bacteria. The microbial content of the gut is believed to weigh about 1.5 kg and to outnumber the cells of the host by 10 to 1.
[0003] Inflammatory bowel diseases are characterized by an aberrant immune response occurring in a genetically predisposed host in response to microbes and/or microbial compounds found in the gut microbiota.
[0004] Crohn's disease (CD) is a chronic inflammatory bowel disease (IBD) that may affect any part of the gastrointestinal tract from mouth to anus. The age of onset is generally between 15-30 years and it is equally prevalent in women and men. The highest prevalence is found in Europe and North America with just over 300 per 100.000 persons (Molodecky et al., 2012). CD generally leads to abdominal pain, severe diarrhea and weight disorders. The disease is of unknown etiology and multifactorial: environmental factors, host genetics and gut microbiome have all been shown to impact the risk of disease and its severity (Cho et al., 2011). The clinical diagnosis of CD is supported by serologic, radiologic, endoscopic, and histologic findings.
[0005] Ulcerative colitis (or UC) is another form of inflammatory bowel disease (IBD). Ulcerative colitis is a form of colitis, a disease of the colon (the largest portion of the large intestine), that includes characteristic ulcers, or open sores. The main symptom of active disease is usually constant diarrhea mixed with blood, of gradual onset.
[0006] Of the bacteria that may play a role in the pathogenesis of these diseases, a pathotype of E. coli, called "AIEC" for "adherent-invasive Escherichia coli", has been strongly implicated (Boudeau et al., 1999). AIEC are able to adhere to the intestinal epithelium and colonize gut mucosa where they participate to IBD onset. More precisely, AIEC were found to be associated with ileal mucosa in 36.4% of CD patients compared with 6.2% of controls, suggesting that these bacteria are involved in CD pathogenesis (Darfeuille-Michaud et al., 2004; Dreux N. et al., 2013).
[0007] AIECs have also been demonstrated to be implicated in inflammatory bowel diseases of animals such as dogs and cats, in particular in connection with animals suffering from CD or from granulomatous colitis (also called histiocytic ulcerative colitis), a disease close to the corresponding human ulcerative colitis (Simpson et al., 2006).
[0008] Therefore, this has been of crucial importance to elaborate a strategy to efficiently eradicate these bacteria from the digestive and/or urinary tract.
[0009] E. coli's adhesion to mucosal epithelial cells is mediated by proteinaceous, rod-like organelles that are called type-1 fimbriae. Type-1 fimbriae carry an adhesin at the edge of a flexible tip fibrillum.
[0010] This adhesin, FimH, is a lectin having a strong affinity for highly mannosylated glycoproteins (Bouckaert J. et al., 2006).
[0011] The type 1 pili interact with glycoproteins such as CEACAM6 (Barnich et al 2007; Barnich et al., 2010), TLR4 (Mossman et al., 2008) or GP2 (Chassaing et al., 2011) in a mannose-associated manner. CEACAM6 and TLR4 receptors are upregulated by inflammatory cytokines in CD patients with ileal disease. The binding of FimH to TLR4 induces the production of TNF.alpha., IL-6 and IL-8 in the gut, independently of LPS. Additionally, FimH binding to GP2 on the surface of M cells in the Peyer's patches allow AIEC to enter into the lamina propria. The subsequent phagocytosis of the AIEC by the macrophages further contributes to the chronic production of TNF.alpha.. A vicious cycle of proinflammatory cytokine release is produced by the TNF.alpha. driven overexpression of CEACAM6 and TNF.alpha. driven increase in M-cell development (Bennett et al, 2016). Thus, FimH appears as a critical factor that not only stimulates direct production of pro-inflammatory cytokines from the gut epithelium, but plays an important role in the invasion of the lamina propria.
[0012] Not only AIECs, but a number of other proteobacteria express FimH at their surface. These proteobacteria are for example responsible for urinary tract infections.
[0013] It is also of crucial importance to elaborate a strategy to efficiently detect these FimH-expressing proteobacteria in infected subjects in order to eventually eradicate them from their digestive and/or urinary tract, e.g., by treating said subjects with FimH blockers.
[0014] Yet, such identification is currently viewed as a difficult task.
[0015] The AIEC pathovar has originally been defined by in vitro cell-line assays examining specific bacteria/cell interactions (Darfeuille-Michaud et al., 2004). Since then, the only way to identify them has been to isolate bacterial cells from patient samples obtained by invasive proceedings (mostly during biopsies of mucosal tissues or lymph nodes), cultivate them for several weeks, and conduct bacteria/cell interaction assays, for example with epithelial cells or macrophages in which AIECs are known to survive and replicate (Glasser A L. et al., 2001; Bringer M A. et al., 2006). These protocols are however invasive, time-consuming, costly, and hardly reproducible across laboratories. They can, therefore, not be used routinely as biomarkers or diagnostics.
[0016] To date the search for molecular markers of AIEC has failed (O'Brien et al., 2016). This could be due to the lack of a standardised and highly reproducible protocol as just mentioned, but could also be explained by the fact that AIEC are not under control by a single gene but rather under complex genetic regulation and/or under environmental control.
[0017] Thus, there is still a need for non-invasive and sensitive diagnostic tests to easily and reliably detect the expression of FimH in proteobacteria from infected subjects.
[0018] Type 1 fimbriae are encoded by the fim operon, and their expression is phase variable, depending on an invertible DNA element (the fimS region) that is located upstream of the fim operon and contains the fim promoter (Barnich et al., 2003). More precisely, the fimS region is the intergenic region that spans between the fimE and fimA genes. Two tyrosine recombinases, FimB and FimE, are known to control the orientation of the fimS-invertible region by a switch mechanism as shown on FIG. 1. FimB has bidirectional activity but predominantly switches fim operon transcription from OFF to ON, while FimE exclusively mediates ON to OFF phase switching (Holden et al., 2007; Kulasekara et al., 1999). This switch is known to occur at a high frequency. This so-called "FimS switch mechanism" regulates in bacteria the expression of the fim operon and of the fimH gene in particular (Burns et al., 2000; Zhang et al., 2016).
DETAILED EMBODIMENTS OF THE INVENTION
[0019] Using a large collection of E. coli bacterial strains isolated from IBD patients and controls that have been well characterized and fully sequenced, the present Inventors were able to isolate bacterial strains that aggregate efficiently to FimH blockers and therefore express a sufficient amount of the FimH lectin at their surface to bind a FimH blocker. Based on these strains, they searched and identified an easy, reproducible and quantitative test for measuring in an ex vivo sample the number of bacteria actually expressing the FimH lectin at their surface (and not only carrying the FimH gene).
[0020] The molecular signature identified by the inventors is focused on the FimH molecular pattern and, more precisely, on the "FimS switch mechanism" switching the fim operon transcription from OFF to ON, leading to the expression of the FimH lectin at the surface of proteobacteria. The inventors herein show that this molecular signature can be detected by conventional means (such as qPCR). It can be obtained rapidly after the sample is collected. It is quantitative and reproducible. Last but not least, it works very well on whole stool samples that have not undergone any purification/separation.
[0021] Because the switch mechanism that occurs in the ileum is known to revert extremely fast from the ON position to the OFF position, this test surprisingly appeared to be able to detect the ON position of the switch in a sensitive and quantitative manner when applied on whole raw stool samples that have been collected from patients. This is of primary importance, since it means that the practician does not need to analyze endoscopic biopsies, and that non-invasively obtained stool samples are sufficient. Moreover, as the test of the invention does not require to isolate or cultivate the bacteria present in the sample, it is far quicker and more reliable than the protocols of the prior art.
[0022] This is also very surprising. As a matter of fact, AIEC have been reported to be significantly increased in the ileal mucosa of CD patients versus controls but not in the stool where they were found at similar low amounts as in the controls. One possible explanation is that expressing FimH is energy consuming for the bacteria so that FimH expression will be triggered by the environment only when there is a real need/benefit for adhesion. Therefore, in the stool and in a healthy gut the E. coli bacteria will in majority not express the FimH lectin (OFF position of the fim operon). Consequently, no method has ever been proposed to detect FimH-expression in stool samples.
[0023] The present inventors fortunately fulfilled this need, by proposing a molecular signature that can be used to detect FimH-expressing bacteria in stool samples of infected patients and therefore assess the virulence of these bacteria.
[0024] In addition, the molecular signature of the invention enables to prognose the effect of therapeutic interventions that aimed at blocking the FimH-based interaction between FimH-expressing bacteria and gut mucosa. Eventually, it enables to design tailored treatments for particular subsets of patients hosting high amounts of FimH-expressing bacteria. Personalized treatment will now be possible by prescreening the samples of the patients for detecting the molecular signature of the invention before administering the FimH blocker treatments.
[0025] As used herein, the term "proteobacteria" designates Gram-negative bacteria including, among others, Escherichia, Klebsiella, Shigella, Salmonella, Vibrio, Yersinia and Helicobacter bacteria. The proteobacteria are divided into six classes with validly published names, referred to by the Greek letters alpha (a) through epsilon (E) and the Acidithiobacillia and Oligoflexia. Alphaproteobacteria include Brucella, Rhizobium, Agrobacterium, Caulobacter, Rickettsia, and Wolbachia bacteria. Betaproteobacteria include Bordetella, Ralstonia, Neisseria, and Nitrosomonas bacteria. Gammaproteobacteria include Escherichia, Shigella, Salmonella, Yersinia, Buchnera, Haemophilus, Vibrio, and Pseudomonas bacteria. Epsilonproteobacteria include Helicobacter, Campylobacter, and Wolinella bacteria.
[0026] As used herein, the term "FimH expressing proteobacteria" designates proteobacteria as defined above, expressing a high amount of functional FimH lectin at their surface. Preferably, said FimH expressing proteobacteria are pathogenic. In particular, they are Gammaproteobacteria expressing high amount of functional FimH lectin at their surface. In contrast, the term "FimH carrying bacteria" relates to any bacteria carrying the fimH gene in their genome, but that do not necessarily express it as proteins presented at the surface of the bacteria.
[0027] The purpose of the invention is to detect patients hosting high amounts of gut bacteria expressing high amount of functional FimH lectin at their surface, simply by using molecular means and non-invasively obtained samples such as stool samples. These patients will indeed benefit from a FimH-blocker treatment, and his/her disease can be followed accordingly.
[0028] A "high amount of functional FimH lectin" expressed by bacteria at their surface can be assessed by aggregation tests or adhesion tests such as those disclosed in the art (Yakovenko O., 2015; Sokurenko E V 1995). The amount of expressed functional FimH lectin is said to be "high" when aggregation of the tested bacteria is observed as opposed to reference bacteria that are known not to express any functional FimH lectin at their surface and do not aggregate. The E. coli K12 strain, alternatively the deltaFimH LF82 strain which is the LF82 strain lacking the FimH gene, can for example be used as reference bacteria. The previously described AAEC191A strain can also be used as reference bacteria, because they do not express the FimH lectin at their surface (Sokurenko E V et al., 1995).
[0029] In one aspect, the present invention relates to an in vitro method for detecting the presence of FimH expressing proteobacteria in a biological sample of a subject, said method comprising the steps of: [0030] a) optionally isolating the nucleotide fraction of said biological sample, [0031] b) detecting the expression of the fimH gene in said nucleotide fraction, preferably by qPCR.
[0032] As mentioned above, this method can be used for identifying subjects hosting high amounts of FimH expressing proteobacteria in their gut.
[0033] As used herein, the term "subject" refers to a mammal, preferably a human. More preferably, said mammal or human has been diagnosed to suffer from a disease relying on FimH-expressing proteobacteria infection, such as a urinary tract infection (UTI) or an IBD (Crohn's disease or Ulcerative Colitis, in adults or in children). More preferably, said subject is a human being suffering from the Crohn's disease or having underwent a surgical operation as a Crohn's disease treatment. Alternatively, said subject is a human being suffering from a urinary tract infection.
[0034] As used herein, the term "biological sample" designates any sample collected from a subject, that may contain bacterial cells. It can be a serum sample, a plasma sample, a urine sample, a blood sample, a stool sample, a lymph sample, or a biopsy. In the context of the invention, said biological sample is preferably a stool sample or a mucosal biopsy.
[0035] As "biological sample", it is also possible to use surgical specimens obtained during surgical operations and stored in a bio-bank, as the presence of AIECs in these specimens is known to be representative of a high risk for severe endoscopic post-operative recurrence of Crohn's disease (Barnich N. et al, AGA Abstract 2017).
[0036] The term "biological sample" may also designate a bacterial isolate purified from said samples. Bacterial purification is well known in the art. Any appropriate method can be used in this respect.
[0037] As used herein, the "expression" of a gene (here the fimH gene) is the process by which information from a gene is used in the synthesis of a functional gene product (here the FimH lectin). Gene expression can be detected by determining the presence of the corresponding mRNA and/or the gene products at the protein level, by conventional means.
[0038] The expression of a gene can also be assessed in the context of the invention by measuring the abundance of the gene in terms of "copy number". As a matter of fact, when a core gene is considered (e.g., the fimH gene), its abundance correlates with the its expression. The higher its copy number is, the more expressed the gene is.
[0039] Preferably, the level of expression of the fimH gene as concluded by the molecular methods of the invention can be confirmed by functional assays showing that the FimH lectin is actually present at the surface of the bacterial cells.
[0040] As shown in the experimental part below, the step b) of said method is preferably performed by analyzing the level of expression of the mRNA of the fimH gene, or by detecting the switch of the fim operon transcription from OFF to ON, or the abundance of the fimH gene, in the nucleotide fraction of said biological sample.
[0041] Therefore, as used herein, the term "nucleotide fraction" designates double-stranded DNA, single-stranded DNA and products of transcription of said DNAs, and also the nucleotide sequences which hybridize with them, that can be isolated or retrieved from a stool sample. As such, this term is similar to the terms "nucleic acid", "nucleic acid sequence" or "sequence of nucleic acid", "polynucleotide", "oligonucleotide", "polynucleotide sequence", and "nucleotide sequence", which will be used equally in the present description. It should be understood that the present invention does not relate to the genomic nucleotide sequences in their natural chromosomal environment, i.e., in their natural state. It involves sequences which have been "isolated" and/or "purified", i.e., they have been removed, directly or indirectly, from their natural chromosomal environment, for example by copying, synthetizing, etc.
[0042] Methods to isolate nucleotide fractions are known in the art. Some DNA isolation techniques are described in, for example, EP 145,356, EP 240,191, and EP 245,945, all of which use an alcohol and an enzymatic protein decomposer in certain sequences of steps. Standard nucleic acid extraction techniques are disclosed in Maniatis et al, Molecular Cloning: A Laboratory Manual (New York: Cold Spring Harbor Laboratory, 1982), pp. 280-281 and, more recently, in Ayoib A. et al, 2017.
[0043] Measuring the level of expression of the mRNA of the fimH gene can be done by any conventional means, such as RT-qPCR. Isolation of mRNA from a sample is also widely disclosed, and commercial kits are available, depending on the nature of the sample. Amplification of DNA by different means has been thoroughly disclosed in the art.
[0044] Mammal DNA can be distinguished from microbial DNA by any conventional mean, such as detection of CpG methylation or of the bacterial 16S ribosomal DNA. It is also possible to use qPCR targeting the ALU (STR) repeat regions in human DNA, or the Beta-globulin, Beta-actin, and hTERT genes. Nanostring technologies could be also useful.
[0045] The most commonly used methods known in the art for the quantification of DNA copies in a sample include Northern blotting, in situ hybridization and PCR-based methods, such as quantitative polymerase chain reaction (qPCR). Alternatively, antibodies may be employed that can recognize sequence-specific duplexes, including DNA duplexes or DNA-protein duplexes. Representative methods for sequencing-based analysis include chain-termination methods, shotgun sequencing methods, de novo sequencing, next generation sequencing methods (including Massively Parallel Signature Sequencing (MPSS), Polony sequencing, 454 pyrosequencing, Illumina (Solexa) sequencing, SOLiD sequencing, Ion semiconductor sequencing, DNA nanoball sequencing, Helioscope single molecule sequencing, Single molecule real time (SMRT) sequencing, RNAP sequencing, Nanopore DNA sequencing, Sequencing by hybridization and Microfluidic Sanger sequencing).
[0046] qPCR is a well-known technology whose conditions are thoroughly explained in the notice of commercial kits (SIGMA-ALDRICH, QIAGEN, . . . ). It is a routine task for the skilled person to identify the appropriate conditions to be used once the target regions or the primers are known. Any qPCR method can be used for amplifying and detecting the amplification level of the targeted regions in the present invention. SYBR GREEN qPCR which has been used by the inventors in the experimental part below, is currently the preferred amplification method to detect the expression level of FimH by means of the molecular signature according to the present invention.
[0047] To implement the methods of the invention, it is also possible to use multiplexed technologies such as the Nanostring's nCounter technology (for example described in U.S. Pat. No. 7,473,767).
[0048] As disclosed herein, the terms "in vitro" and "ex vivo" are equivalent and refer to studies or experiments that are conducted using samples (e.g. cells or population of cells present in a stool sample) that have been isolated from their usual host organisms (e.g. animals or humans). Such samples can be directly used in the methods of the invention, without further processing. Alternatively, bacterial cells may be purified before their nucleotide fraction is used in the methods of the invention. These methods can be for example reduced to practice in laboratory materials such as tubes, flasks, wells, eppendorfs, etc. In contrast, the term "in vivo" refers to studies that are conducted in whole living organisms.
[0049] As used herein, the term "stool sample" designates a sample of whole stool that has been collected non-invasively after defaecation in an appropriate recipient. Said recipient was clean, and preferably devoid of any contaminating agents (bacteria, material, virus, etc.). Particular recipients and protocols can be used in this aim, such as those described in EP 1371964, EP 1986 006, or FR1456674.
[0050] It is not necessary to exclude, purify or extract particular cells from this sample, all the DNA contained in the raw sample can be used in the methods of the invention.
[0051] In a first preferred embodiment, the fimH surface level of the bacterial cells is assessed by measuring the switch of the fim operon transcription from OFF to ON in the DNA of the fimH gene. DNA is preferably extracted from said stool sample by using a convenient commercial extraction protocol such as those proposed by MOBIO, Qiagen or Zymo. Of note, the bacterial DNA and the host DNA do not need to be physically separated for reducing the methods of the invention to practice.
[0052] The present invention more precisely relates to an in vitro method for detecting the presence of FimH expressing proteobacteria in a stool sample of a subject, or for identifying subjects hosting high amounts of FimH expressing proteobacteria in their gut, said method comprising the steps of: [0053] a) isolating the nucleotide fraction of the stool sample, [0054] b) detecting the expression of the fimH gene by measuring by qPCR the switch of the fim operon transcription from OFF to ON in said nucleotide fraction.
[0055] The switch of the fim operon transcription from OFF to ON has been characterized long ago (Klemm P., 1986). However, since then, it has only been studied in mutant cells or systems that have been engineered so as to express molecular identifiers (see for example Zhang H. et al., 2016). This kind of detection is not possible in natural biological samples such as stool samples. The only reliable means proposed in the art to detect the fim operon switch in naturally occurring bacteria was to detect directly the expression of the FimH lectin at the surface of the bacteria. This detection required first to isolate the bacteria from the sample (generally biopsies), then to cultivate them in order to amplify their number, and finally to use anti-FimH antibodies or conduct aggregation tests with FimH antagonists. Yet, these methods were time-consuming and not quantitative at all, due to the ex vivo expansion of the bacterial cells. Moreover, as mentioned above, they were not transposable to stool samples in which the amount of FimH-expressing bacteria is very low as compared with the amount of total bacteria, because multiple bacteria coexist within a same sample.
[0056] Despite all these prejudices, the inventors managed to identify a quantitative test enabling to assess the amount of FimH-expressing bacteria in a stool sample of a subject. More precisely, they identified a molecular signature that correlates with the expression of the FimH lectin at the surface of the proteobacteria (as revealed by aggregation tests) and that can be detected in stool samples.
[0057] In this particular embodiment, this molecular signature relies on detecting the fimS switching mechanism by using appropriately chosen molecular tools. Particularly, it requires to use primers targeting specific regions within the FimS, the FimA and FimE regions, so as to detect the relative amounts of ON and OFF positions within a sample. Also, it can use probes hybridizing specifically to the switch regions in the FimS nucleotide sequence.
[0058] The FimE-FimS-FimA OFF position has the nucleotide sequence as shown in SEQ ID NO:13.
[0059] The FimE-FimS-FimA ON position has the nucleotide sequence as shown in SEQ ID NO:14.
[0060] The FimE nucleotide sequence in the OFF position has the sequence SEQ ID NO:15. The FimS nucleotide sequence in the OFF position has the sequence SEQ ID NO:16. The FimA nucleotide sequence in the OFF position has the sequence SEQ ID NO:17.
[0061] The FimE nucleotide sequence in the ON position has the sequence SEQ ID NO:18. The FimS nucleotide sequence in the ON position has the sequence SEQ ID NO:19. The FimA nucleotide sequence in the ON position has the sequence SEQ ID NO:20.
[0062] The "switch regions" within the FimS gene are those having the sequence SEQ ID NO:9 and SEQ ID NO:10.
[0063] The nucleotide regions of SEQ ID NO:11 (ttggggcca) and SEQ ID NO:12 (tggccccaa) correspond to Inverted Repeat Regions located in the FimS gene located respectively in SEQ ID NO:27 and SEQ ID NO:30.
[0064] In a preferred embodiment, measuring the switch of the fim operon transcription from OFF to ON in the methods of the invention is performed by targeting one or more of these particular regions, e.g., by using primers or probes specifically amplifying or hybridizing one or more of these regions.
[0065] More particularly, the following nucleotide regions can be targeted: [0066] Within the fimE gene: SEQ ID NO:21, SEQ ID NO:22, SEQ ID NO:23, SEQ ID NO:24, SEQ ID NO:25, and/or SEQ ID NO:26, [0067] Within the fimS gene: SEQ ID NO:27, SEQ ID NO:28, SEQ ID NO:29, SEQ ID NO:30, SEQ ID and/or NO:31, [0068] Within the fimA gene: SEQ ID NO:32 and/or SEQ ID NO:33.
[0069] Primers amplifying partially or totally a nucleotide region having a sequence chosen in the group consisting of: SEQ ID NO:15-17 (OFF position), SEQ ID NO:18-20 (ON position), and SEQ ID NO:21-SEQ ID NO: 33, are encompassed within the present invention.
[0070] Primers amplifying partially or totally a nucleotide region containing or consisting of the specific "switch regions" SEQ ID NO: 9 and/or SEQ ID NO:10 or more specifically to the Inverted Repeat Regions of SEQ ID NO:11 (ttggggcca) and/or SEQ ID NO:12 (tggccccaa) are also encompassed within the present invention.
[0071] Probes hybridizing to the specific "switch regions" SEQ ID NO: 9 and/or SEQ ID NO:10 or more specifically to the Inverted Repeat Regions of SEQ ID NO:11 (ttggggcca) and/or SEQ ID NO:12 (tggccccaa) are also encompassed within the present invention.
[0072] In a particular embodiment, homologous regions can be targeted. In the context of the invention, "homologous regions" refer to nucleotide regions whose sequences have, with respect to the reference nucleic acid sequence to which they refer (e.g., SEQ ID NO:9 to 33), certain modifications, such as in particular a deletion, a truncation, an extension, a chimeric fusion and/or a mutation, in particular a point mutation. In a particular embodiment, the nucleotide sequences of these homologous regions share at least 80%, preferably 90% or 95%, identity with the reference nucleic acid sequence to which they refer (e.g., SEQ ID NO:9 to 33).
[0073] For the purpose of the present invention, the percentage of identity between two nucleic acid sequences is intended to refer to a percentage of nucleotides which is identical between the two sequences to be compared, obtained after the best alignment, this percentage being purely statistical and the differences between the two sequences being distributed randomly and throughout their length. Sequence comparisons between two nucleic acid sequences are traditionally carried out by comparing these sequences after having optimally aligned them, said comparison being carried out by segment or by "window of comparison" in order to identify and compare local regions of sequence similarity. The optimal alignment of the sequences for comparison can be produced, besides manually, by means of the global homology algorithm of Needleman and Wunsch (1970) [J. Mol. Biol. 48:443]. The percentage of identity is calculated by determining the number of identical positions for which the nucleotide is identical between the two sequences, dividing this number of identical positions by the total number of positions and multiplying the result obtained by 100 so as to obtain the percentage of identity between these two sequences. For example, the needle program available on the site ebi.ac.uk, may be used, the parameters used being those given by default (in particular for the parameters "Gap open":10, and "gap extend":0.5; the matrix chosen being, for example, the "BLOSUM 62" matrix proposed by the program), the percentage of identity between the two sequences to be compared being calculated directly by the program.
[0074] The following qPCR primers have been tested by the Inventors (see also the experimental part below):
TABLE-US-00001 Name of the primer Sequence of the primer SEQ ID NO: p1 GTAATGCTGCTCGTTTTGCC SEQ ID NO: 1 p2 CATATAGCGGAGGTGATGTGAA SEQ ID NO: 2 P3 TGCGCGATGCTTTCCTCTAT SEQ ID NO: 3 p4 GCGCAAGCGGCGTTA SEQ ID NO: 4 p5 CGGATTATGGGAAAGAAAT SEQ ID NO: 5 p6 TCAAACAGTTAGATGCTTT SEQ ID NO: 6 p7 CGATGCTTTCCTCTATGA SEQ ID NO: 7 p8 TTGTTTTGTCAACGAGTT SEQ ID NO: 8
[0075] The relative position of these primers is disclosed in FIG. 3. Moreover, their sequence is disclosed in the enclosed sequence listing under appropriate format.
[0076] In a more preferred embodiment, measuring the switch of the fim operon transcription from OFF to ON in the methods of the invention is performed by using the primers of SEQ ID NO:1-8.
[0077] In an even more preferred embodiment, measuring the expression of the FimH lectin is performed by amplifying the nucleotide fractions contained in the sample with the primers of SEQ ID NO:1, SEQ ID NO:2, SEQ ID NO:3, and SEQ ID NO:4 or with the primers of SEQ ID NO:5, SEQ ID NO:6, SEQ ID NO:7 and SEQ ID NO:8 that highlight the ON and the OFF positions of the fimH operon. The two primer pairs [SEQ ID NO:5; SEQ ID NO:7] and [SEQ ID NO:6; SEQ ID NO:8], or the two primer pairs [SEQ ID NO:1; SEQ ID NO:3] and [SEQ ID NO:2; SEQ ID NO:4] can be used more specifically for detecting the ON position. Preferably, the primer pairs [SEQ ID NO:5; SEQ ID NO:7] and [SEQ ID NO:6; SEQ ID NO:8] are used for detecting the ON position of the fimH operon. More preferably, the primer pair [SEQ ID NO:5; SEQ ID NO:7] is used for detecting the ON position of the fimH operon. The two primer pairs [SEQ ID NO:5; SEQ ID NO:8] and [SEQ ID NO:7; SEQ ID NO:8], or the two primer pairs [SEQ ID NO:1; SEQ ID NO:2] and [SEQ ID NO:3; SEQ ID NO:4] can be used more specifically for detecting the OFF position. Preferably, the primer pairs [SEQ ID NO:5; SEQ ID NO:8] and [SEQ ID NO:7; SEQ ID NO:8] are used for detecting the OFF position of the fimH operon. More preferably, the primer pair [SEQ ID NO:5; SEQ ID NO:8] is used for detecting the OFF position of the fimH operon.
[0078] The amplification level observed with these pairs of primers can then be normalized with the amounts of total DNA contained in the sample, or the amount of total bacteria (excluding the amount of host DNA) or only the amount of FimH expressing bacteria. This can be done by concomitantly amplifying bacterial housekeeping genes that will reflect the absolute amount of bacteria contained in the sample or by using a conserved region of the FimH gene. It is also possible to normalize the results generated by the qPCR of the invention by expressing all the results in DNA copy number per .mu.L.
[0079] When the normalized amplification level of the fim operon measured by using the pairs of primers dedicated to the ON position is superior to a reference value, then the fim operon is in position ON, what reflects a high level of expression of FimH at the surface of the bacterial cells present in the sample, so that the tested subject hosts a high amount of FimH expressing bacteria in his/her gut, and will therefore be sensitive to a FimH blocker.
[0080] When the normalized amplification level of the fim operon measured by using the pairs of primers dedicated to the OFF position is superior to a reference value, then the fim operon is in position OFF, what reflects a low level of expression of FimH at the surface of the bacterial cells present in the sample, so that the tested subject hosts a low amount of FimH expressing bacteria in his/her gut, and will therefore be unresponsive to a FimH blocker.
[0081] As used herein, the term "reference value" (or "control value") refers to a specific value or predetermined value, which can take a variety of forms. It can be a single cut-off value, such as a median or mean. It can be a single number, equally applicable to every sample individually, or it can vary, according to specific types of sample or subpopulations of patients. This reference value can be easily determined by the skilled person by using reference bacteria that are known not to express the FimH lectin at their surface (e.g., bacteria from the K12 or AAEC191A strains). It can be also determined in stool samples of healthy subjects. K12 bacteria have been described in the art, for example in Boudeau et al., 2001, or in O'Brien et al, 2016.
[0082] When stool samples are used, typical reference values for the normalized amplification level of the ON position are of 1%, 2%, 3%, 4% 5%, 10%, 15%.
[0083] When stool samples are used, typical reference values for the normalized amplification level of the OFF position are of 1%, 2%, 3%, 4% 5%, 10%, 15%.
[0084] To go further, the inventors identified that it is also possible to use the ON/OFF ratio or an ON/(ON+OFF) ratio provided in the samples in order to assess the surface level of FimS in the bacterial contained in these samples.
[0085] They therefore propose particular systems of primers that enable to evaluate the ON/OFF ratio or an ON/(ON+OFF) ratio of FimS in bacterial samples as well as in stool samples. The systems of primers are the following: [SEQ ID NO:3; SEQ ID NO:4] or [SEQ ID NO:7; SEQ ID NO:8] for the OFF position, and [SEQ ID NO:1; SEQ ID NO:3] or [SEQ ID NO:5; SEQ ID NO:7] for the ON position. The two primer pairs [SEQ ID NO:5; SEQ ID NO:7] and [SEQ ID NO:6; SEQ ID NO:8], or the two primer pairs [SEQ ID NO:1; SEQ ID NO:3] and [SEQ ID NO:2; SEQ ID NO:4] can be used more specifically for detecting the ON position. Preferably, the primer pairs [SEQ ID NO:5; SEQ ID NO:7] and [SEQ ID NO:6; SEQ ID NO:8] are used for detecting the ON position. More preferably, the primer pair [SEQ ID NO:5; SEQ ID NO:7] is used for detecting the ON position. The two primer pairs [SEQ ID NO:5; SEQ ID NO:8] and [SEQ ID NO:7; SEQ ID NO:8], or the two primer pairs [SEQ ID NO:1; SEQ ID NO:2] and [SEQ ID NO:3; SEQ ID NO:4] can be used more specifically for detecting the OFF position.
[0086] When appropriately combined, these pairs of primers enable to determine the ON/OFF ratio of the fim operon. An ON/OFF ratio or an ON/(ON+OFF) ratio superior to a reference value closely reflects a high level of expression of FimH at the surface of said bacterial cells and therefore the ability of the bacterial cells present in the sample to aggregate a FimH blocker.
[0087] As shown in the experimental part below, FimH expressing bacteria such as LF82 AIECs have a typical ON/(ON+OFF) ratio which is superior to 30%, whereas non-aggregative cells have a typical ON/(ON+OFF) ratio inferior to 5%. Therefore, the reference value associated with isolated strains can be of about 15%.
[0088] When stool samples are used, typical reference values for the ON/(ON+OFF) ratio are of 1%, 2%, 3%, 4%, 5%, 10% and 15%.
[0089] When stool samples are used, typical reference values for the ON/OFF ratio are of 1%, 2%, 3%, 4%, 5%, 10% and 15%.
[0090] In a more preferred embodiment, measuring the switch of the fim operon transcription from OFF to ON in the methods of the invention is therefore performed by targeting the above-mentioned particular regions using these particular pairs of primers.
[0091] In a preferred embodiment, the amplification level for the OFF position is detected by using the primers pair [SEQ ID NO:3; SEQ ID NO:4], and the amplification level for the ON position is detected by using the primers pair [SEQ ID NO:2; SEQ ID NO:4].
[0092] In a preferred embodiment, the amplification level for the OFF position is detected by using the primers pair [SEQ ID NO:3; SEQ ID NO:4], and the amplification level for the ON position is detected by using the primers pair [SEQ ID NO:1; SEQ ID NO:3].
[0093] In a preferred embodiment, the amplification level for the OFF position is detected by using the primers pair [SEQ ID NO:1; SEQ ID NO:2], and the amplification level for the ON position is detected by using the primers pair [SEQ ID NO:1; SEQ ID NO:3].
[0094] In a preferred embodiment, the amplification level for the OFF position is detected by using the primers pair [SEQ ID NO:1; SEQ ID NO:2], and the amplification level for the ON position is detected by using the primers pair [SEQ ID NO:2; SEQ ID NO:4].
[0095] In a preferred embodiment, the amplification level for the OFF position is detected by using the primers pair [SEQ ID NO:7; SEQ ID NO:8], and the amplification level for the ON position is detected by using the primers pair [SEQ ID NO:6; SEQ ID NO:8].
[0096] In a preferred embodiment, the amplification level for the OFF position is detected by using the primers pair [SEQ ID NO:7; SEQ ID NO:8], and the amplification level for the ON position is detected by using the primers pair [SEQ ID NO:5; SEQ ID NO:7].
[0097] In a preferred embodiment, the amplification level for the OFF position is detected by using the primers pair [SEQ ID NO:5; SEQ ID NO:8], and the amplification level for the ON position is detected by using the primers pair [SEQ ID NO:5; SEQ ID NO:7].
[0098] In a more preferred embodiment, the amplification level for the OFF position is detected by using the primer pair [SEQ ID NO:5; SEQ ID NO:8], and the amplification level for the ON position is detected by using the primer pair [SEQ ID NO:6; SEQ ID NO:8].
[0099] A normalized amplification level of ON or an ON/OFF ratio or an ON/(ON+OFF) ratio superior to said reference values is of predictive value for a FimH blocker treatment, because it enables to distinguish patients who have a high probability of clinical benefit (because the bacteria cells express the FimH lectin that will be blocked by the FimH blocker) from those who will take no benefit from said treatment (because they do not host bacteria whose behavior is sensitive to said treatment).
[0100] More precisely, when the normalized amplification level of ON or the ON/OFF or ON/(ON+OFF) ratio which is calculated by the above-means is higher than the said reference values, then it can be concluded that the tested sample contains a considerable amount of FimH-expressing bacteria, and that the patient from which the sample has been collected will benefit from a treatment with FimH blockers.
[0101] On the contrary, when the normalized amplification level of ON or the ON/OFF or ON/(ON+OFF) ratio is lower than the said reference values, then it can be concluded that the tested sample contains a low amount of FimH-expressing bacteria, and that the patient from which the sample has been collected hosts too few of these bacteria to benefit from a treatment with FimH blockers. Healthy subjects are in this category.
[0102] In a second preferred embodiment, the fimH lectin surface level of the bacterial cells is assessed by measuring the abundance of the fimH gene in the nucleotide fraction of the biological sample collected from the subjects.
[0103] Indeed, the present inventors have shown that the copy number of the fimH gene measured in a stool sample of a subject correlates with the amount of gut bacterial cells (isolated from biopsies) aggregating the FimH blocker EB8018, therefore expressing a lectin at their surface. It is therefore possible, simply by measuring the abundance of the fimH gene in a stool sample of a subject, to identify if and to what extend the bacteria present in the gut of said subject carry high amount of the FimH lectin at their surface, and will therefore be--or not--sensitive to a treatment with a FimH blocker.
[0104] This result is unexpected, since it was thought that the abundance of the fimH gene detected in stool was not enhanced in patients suffering from IBDs, even though AIECs were known to be significantly increased in the ileal mucosa of CD patients versus controls.
[0105] Example 6 below (and FIG. 7) shows that a qPCR assay performed on the fimH gene of SEQ ID NO:34 leads the skilled person to identifying and/or discriminating the subjects hosting fimH expressing bacteria.
[0106] By using for example, the primer pairs of SEQ ID NO:35-36, SEQ ID NO:37-38, SEQ ID NO:39-40, it is therefore possible to detect with a high reliability the presence of FimH expressing proteobacteria in the gut of a subject.
[0107] By using for example, the probes of SEQ ID NO:41-43, it is also possible to detect with a high reliability the presence of FimH expressing proteobacteria in the gut of a subject.
[0108] By "gene abundance", it is herein meant the absolute or relative amount of the tested genes. "Absolute amount" (or "absolute abundance") of a gene designates the total number of copies of said gene in a define volume of the tested sample, whereas "relative amount" (or "relative abundance") of a gene designates the total number of copies of said gene relative to the total amount of genes or alternatively the total number of copies of said gene relative to the amount of a single reference gene or preferably a combination of reference genes present in the tested sample. Ubiquitous genes, such as genes essential for the survival of the organism like DNA polymerases or genes coding for proteins involved in glucose metabolism, are good candidates for reference genes in metagenomic studies.
[0109] The methods of the invention preferably require the measurement of the absolute amount of the gene, e.g., the total number of copies by .mu.L, as classically provided by nanostring or qPCR technologies.
[0110] When the abundance of the fimH gene measured by using the appropriate pairs of primers is superior to a reference value, then it can be concluded that the tested subject hosts a high amount of FimH expressing bacteria in his/her gut, and will therefore be sensitive to a FimH blocker.
[0111] When the abundance of the fimH gene measured by using the appropriate pairs of primers is inferior to a reference value, then it can be concluded that the tested subject hosts a low amount of FimH expressing bacteria in his/her gut, and will therefore be poorly sensitive (or even unresponsive) to a FimH blocker.
[0112] The abundance measured with these pairs of primers is usually normalized with the amounts of total DNA contained in the sample, or with the amount of total bacteria (excluding the amount of host DNA). This can be done by concomitantly amplifying bacterial housekeeping genes that will reflect the absolute amount of bacteria contained in the sample.
[0113] When stool samples are used, typical reference values for the abundance of the FimH gene are of 1%, 2%, 3%, 4% 5%, 10%, 15%.
[0114] In a third preferred embodiment, the two molecular markers disclosed above are combined so as to calculate the ratio called "FimS ON/FimH". This ratio has been found by the inventors to be highly valuable to detect subjects hosting high amounts of AIECs in their gut.
[0115] To calculate this ratio, the two molecular markers "FimS ON" and "FimH" are detected and quantified as disclosed above, i.e., by using particular primer sets hybridizing either with the switch region, or the "ON" regions, or with the fimH gene of SEQ ID NO:34. The signals are then normalized and the ratio is calculated before being compared to a reference value.
[0116] Said reference value is for example the mean abundance of the fimH gene of SEQ ID NO:34 measured in stool samples of at least two healthy subjects.
[0117] When the ratio FimS ON/FimH is superior to this reference value, then it can be concluded that the tested subject hosts a high amount of FimH expressing bacteria in his/her gut, and will therefore be sensitive to a FimH blocker. Thanks to the methods of the invention, it will be now possible to easily identify the patients that will effectively (or more effectively) benefit from a FimH blocker treatment. In other terms, it will be possible to evaluate or predict the therapeutic response of a subject when a FimH blocker is administered. As used herein, the term "FimH blocker" (or "FimH inhibitor" or "FimH antagonist") designates any compound that is able to interfere with the interaction of the FimH lectin and the mannose residues from glycosylated proteins on the epithelial cells of the gut. When this interaction is weakened or abolished, so does the bacteria invasion of the gut mucosa in the treated patient. Consequently, the cascade of inflammatory reaction is impeded or prevented and the inflammatory disease is alleviated.
[0118] A number of efficient mannose derivatives having this interfering activity have been described. They are all herewith encompassed: [0119] Heptylmannose (HM) is one of the most efficient FimH antagonists and a potent in vitro AIEC adhesion inhibitor (Bouckaert et al., 2005, Bouckaert et al., 2013). HM is generally used as a reference in the antiadhesive assays but proved disappointing in vivo. Indeed, millimolar concentrations are required to observe a significant bacterial load reduction in a cystitis murine model (Wellens et al., 2008) and gave no effect with AIEC in a CEABAC 10 Crohn's disease model (Sivignon 2015). [0120] Thiazolylmannosides (TazMans) that have strong anti-adhesive properties for E. coli strains implied in the gut inflammation of patients with Crohn's disease (Brument et al, 2013; Chalopin T et al, 2013 and 2015), [0121] Mydock-McGrane et al., 2016 disclosed in its Table 1 the generic structures of a number of alternative mannose-based FimH antagonists that have been published between 2005 and 2015. All of them are encompassed. [0122] ZFH-04269 as disclosed in Totsika M. et al, 2013 and all the compounds disclosed in Cusumano C K et al, 2011. [0123] The FimH inhibitors disclosed in WO2013/134415 (VERTEX), WO 2014/055474 (VERTEX) [0124] The FimH inhibitors disclosed in WO 2011/050323 (WASHINGTON UNIVERSITY), WO 2012/109263 (WASHINGTON UNIVERSITY), WO 2014/194270 (WASHINGTON UNIVERSITY), [0125] The FimH inhibitors disclosed in WO 2012/164074 (UNIVERSITAET BASEL) and WO 2011/073112 (UNIVERSITAET BASEL).
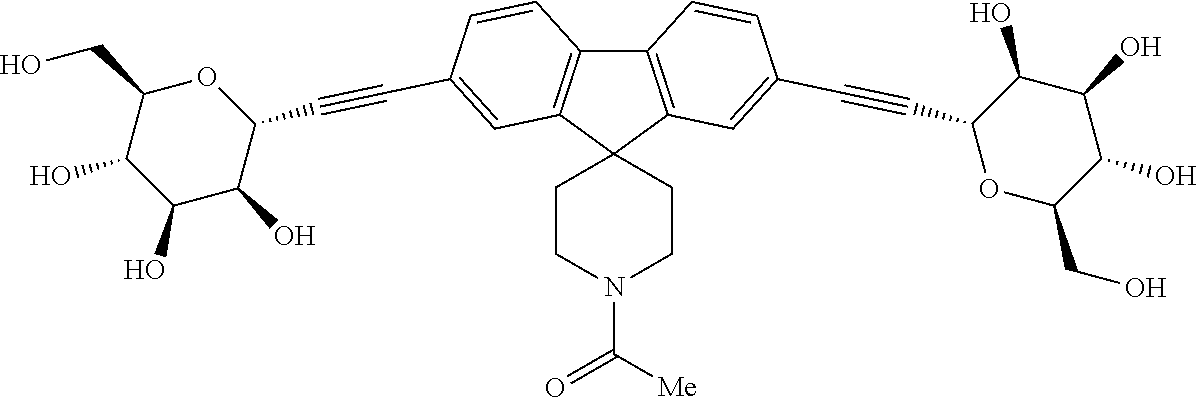
[0126] Other mannose derivatives have been proposed for treating AIECs based pathologies such as CD and UC. One of them is the compound of formula (I):
##STR00001##
(1-(2,7-bis(((2R,3S,4R,5S,6R)-3,4,5-trihydroxy-6-(hydroxylmethyl)tetrahyd- ro-2H-pyran-2-yl)ethynyl)spiro[fluorene-9,4'-piperidin]-1'-yl)ethan-1-one)- , which is currently clinically tested. It will be hereafter referred to as EB8018.
[0127] This compound comprises two mannoside residues held together by a chemically inert linker. These mannosides efficiently compete for binding with mannose residues such as those found on glycosylated proteins. Furthermore, because of its "bi-valent" nature, this compound can bind a FimH receptor on one bacterial cell, and another FimH on a different bacterial cell at the same time resulting in the enchaining of several bacterial cells together (Moor et al., 2017). This leads to the "clumping" of the bacteria, which has been shown to facilitate the selective clearing of bacteria from the gut lumen (Spaulding et al., 2017). In addition to facilitating clearance, the clumping process may significantly slow or prevent the penetration of FimH expressing bacteria into the mucus layer and the intestinal epithelium thereby preventing interaction with receptors such as TLR4, CEACAM6 and GP2, that contribute to the inflammation in the gut of patients with Crohn's disease.
[0128] Non-mannoside compounds have been also disclosed as potent FimH antagonists. They are for example disclosed in WO 2016/183501 (WASHINGTON UNIVERSITY) and WO 2014/173904 (VLAAMS INTERUNIVERSITAIR INSTITUUT VOOR BIOTECHNOLOGIE VZW). They are also encompassed in the present application.
[0129] By blocking the interaction of the FimH lectin of the FimH-expressing proteobacteria with the epithelial cells, the above-mentioned compounds inhibit their adhesion to the epithelial cells of the digestive and/or urinary tract mucosa and their subsequent invasion of both the ileum and the colon.
[0130] In another aspect, the present invention therefore relates to an in vitro method for predicting if a subject will benefit from a treatment with a FimH blocker, said method comprising the steps of the method disclosed previously, namely: [0131] a) isolating the nucleotide fraction of a biological sample from said subject, [0132] b) detecting the expression of the fimH gene in said nucleotide fraction by qPCR.
[0133] As shown in the experimental part below, step b) of said method is preferably performed by detecting the abundance of the fimH gene, and/or by detecting in the DNA of said sample the switch of the fim operon transcription from OFF to ON by any of the methods disclosed above. Said biological sample is preferably a stool sample.
[0134] All the embodiments described above for the detecting method of the invention apply mutatis mutandis to the predicting method of the invention.
[0135] In a preferred embodiment, the invention relates to an in vitro method for predicting a therapeutic response to a FimH blocker in a subject, said method comprising the steps of: [0136] a) isolating the nucleotide fraction of a stool sample from said subject, [0137] b) detecting the expression of the fimH gene in said nucleotide fraction by measuring the switch of the fim operon transcription from OFF to ON in said nucleotide fraction by qPCR, [0138] c) predicting that said subject will benefit from a treatment with a FimH blocker if the amplification of the ON position is superior to a reference value, as explained above.
[0139] In another preferred embodiment, the invention relates to an in vitro method for predicting a therapeutic response to a FimH blocker in a subject, said method comprising the steps of: [0140] a) isolating the nucleotide fraction of a stool sample from said subject, [0141] b) detecting the expression of the fimH gene in said nucleotide fraction by measuring the abundance of the fimH gene in said nucleotide fraction by qPCR, [0142] c) predicting that said subject will benefit from a treatment with a FimH blocker if the abundance of the fimH gene in said nucleotide fraction is superior to a reference value, as explained above.
[0143] All the embodiments and definitions disclosed above for the detecting method of the invention apply to this predicting method.
[0144] In a more preferred embodiment, said step b) consists in measuring the normalized amplification level of the ON position or the ON/OFF ratio or the ON/(OFF+ON) ratio of the fim operon transcription in said stool sample, and comparing same with a reference value, said reference value being preferably obtained by measuring the switch of the fim operon transcription from OFF to ON in the stool of healthy subjects.
[0145] In a more preferred embodiment, said step b) consists in measuring both the normalized amplification level of the ON position and the abundance of the fimH gene in said stool sample, calculating the ratio "ON/fimH" as explained above, and comparing same with a reference value, said reference value being preferably obtained after measuring the switch of the fim operon transcription from OFF to ON and the fimH abundance in the stool of healthy subjects.
[0146] In other terms, the molecular signature of the invention enables to identify sub-groups of patients that are either unresponsive or sensitive to FimH blocker treatment.
[0147] In another aspect, the present invention therefore relates to an in vitro screening method for identifying subsets of patients that are sensitive or unresponsive to a treatment with a FimH blocker, said method comprising the steps of the detecting method of the invention.
[0148] If the normalized amplification level of ON or the ON/OFF ratio or the ON/(OFF+ON) ratio of the fim operon measured in the stool sample of said subject is superior to said reference value, then said subject will be identified as being sensitive to a treatment with a FimH blocker. On the contrary, if the normalized amplification level of ON or the ON/OFF ratio or the ON/(ON+OFF) ratio of the fim operon measured in the stool sample of said subject is inferior to said reference value, then said subject will be identified as being sensitive to a treatment with a FimH blocker.
[0149] If the abundance of the fimH gene measured by using the appropriate pairs of primers is superior to a reference value, then it can be concluded that the tested subject hosts a high amount of FimH expressing bacteria in his gut, and will therefore be sensitive to a FimH blocker.
[0150] If the ratio FimS ON/FimH is superior to the reference value, then it can be concluded that the tested subject hosts a high amount of FimH expressing bacteria in his gut, and will therefore be sensitive to a FimH blocker. All the embodiments and definitions disclosed for the detecting method of the invention apply to this screening method.
[0151] The molecular signature of the invention can be used to adjust the dosage regimen of such a FimH blocker and to design tailored treatments for particular subsets of patients hosting high amount of FimH expressing proteobacteria. The detecting method of the invention indeed reveals, without any colonoscopy or biopsy analysis, if a patient hosts a low or high amount of FimH expressing proteobacteria in his/her gut. This information can be used to personalize his/her treatment based on this information by prescreening the stool samples of the patients for detecting the molecular signature of the invention before administering the FimH blocker.
[0152] In another aspect, the present invention relates to a method for treating subjects suffering from a disease caused by FimH proteobacteria, said method comprising the steps of: [0153] a) isolating the nucleotide fraction of a biological sample, for example a stool sample, from said subject, [0154] b) detecting the expression of the fimH gene in said nucleotide fraction by qPCR, preferably by measuring the switch of the fim operon transcription from OFF to ON in said nucleotide fraction by qPCR, [0155] c) administering a FimH blocker only in subjects hosting high amounts of FimH expressing proteobacteria in their gut.
[0156] Said subjects are preferably those in which the normalized amplification level of ON or the ON/OFF ratio or the ON/(ON+OFF) ratio of the fim operon is superior to a reference value, or those in which the abundance of the fimH gene measured by using the appropriate pairs of primers is superior to a reference value, or those in which the ratio FimS ON/FimH is superior to the reference value.
[0157] In this case, the present invention relates to a FimH blocker for use for treating subjects hosting high amounts of FimH expressing proteobacteria in their gut, preferably those in which the normalized amplification level of ON or the ON/OFF ratio or the ON/(ON+OFF) ratio of the fim operon is superior to a reference value, or those in which the abundance of the fimH gene measured by using the appropriate pairs of primers is superior to a reference value, or those in which the ratio FimS ON/FimH is superior to the reference value.
[0158] If the normalized amplification level of ON or the ON/OFF ratio or the ON/(ON+OFF) ratio of the fim operon or the fimH gene abundance or the FimS ON/FimH ratio measured in the sample of said subject is inferior to the respective reference value then administering a FimH blocker to said subject will be useless. In this case, other treatments have to be administered.
[0159] Other IBD treatments are for example chosen in the group consisting of: azathioprine, mesalamine, abatacept, adalimumab, anakinra, certolizumab, etanercept, golimumab, infliximab, rituximab, tocilizumab, natalizumab, corticosteroids, cyclosporine, methotrexate, tacrolimus, Anti-JAK (tofacitinib), anti-integrins (Vedolizumab, rhuMAb Beta7, MAdCAM-1 Antagonist), or Anti IL12/IL23 (Ustekinumab, ABT874).
[0160] All the embodiments and definitions disclosed for the detecting method of the invention apply to this treating method. A preferred biological sample is a stool sample.
[0161] In other terms, the invention relates to the use of a FimH blocker for preparing a drug intended to treat a subset of subjects that are sensitive to said treatment, i.e., in which FimH-expressing proteobacteria are detected according to the detecting method of the invention (for example, if the ON/OFF ratio or the ON/(ON+OFF) ratio or the fimH gene abundance or the ON/FimH ratio measured in the stool sample of said subjects is superior to the reference value). The FimH blocker can be used for treating a subset of subjects suffering from a disease caused by FimH proteobacteria that are sensitive to said treatment, i.e., in which FimH-expressing proteobacteria are detected according to the detecting method of the invention (for example, if the ON/OFF ratio or the ON/(ON+OFF) ratio of the fim operon or the fimH gene abundance or the ON/FimH ratio measured in the stool sample of said subjects is superior to the reference value). The subjects are preferably mammals and human beings that suffer from urinary tract infections (such as chronic cystitis), or an IBD (preferably Crohn's disease), these diseases being known to be caused--at least partially--by virulent FimH-expressing proteobacteria (Totsika et al, 2013; Mydock-McGrane et al, 2016).
[0162] All the embodiments and definitions disclosed for the detecting method of the invention apply to these treating methods.
[0163] Another interesting aspect of the molecular signature of the invention is to predict the potential virulence of proteobacteria present in stool samples of subjects. Based on this information, it is possible to diagnose diseases whose etiology involves virulent FimH-expressing proteobacteria and to monitor the activity of these diseases.
[0164] Diseases whose etiology involves virulent FimH-expressing proteobacteria are for example: urinary infections such as chronic cystitis and IBD (such as UC or CD, in adults or in children). These diseases will be herein referred to as "FimH proteobacteria related diseases". It also encompasses postoperative recurrence of Crohn's disease in patients that have been surgically treated.
[0165] In another aspect, the present invention relates to an in vitro method for diagnosing a FimH proteobacteria related disease in a subject, by detecting the presence of FimH expressing bacteria in a stool sample of a subject by means of the detecting method of the invention which is exposed above.
[0166] In another aspect, the present invention relates to an in vitro method for monitoring the evolution of a FimH proteobacteria related disease in a subject, by detecting the presence of FimH expressing bacteria in a stool sample of a subject by means of the detecting method of the invention which is exposed above.
[0167] If the normalized amplification level of ON or the ON/OFF ratio or the ON/(ON+OFF) ratio of the fim operon measured in the stool sample of said subject is superior to said reference value, then said subject will be diagnosed as suffering from a FimH proteobacteria related disease which is in a virulent state. On the contrary, if the normalized amplification level of ON or the ON/OFF ratio or the ON/(ON+OFF) ratio of the fim operon measured in the stool sample of said subject is inferior to said reference value, then said subject will be identified as healthy or at least not hosting FimH-expressing proteobacteria in its gut, therefore not likely to suffer from a FimH proteobacteria related disease such as IBD.
[0168] If the abundance of the fimH gene measured by using the appropriate pairs of primers is superior to a reference value, then it can be concluded that the tested subject will be diagnosed as suffering from a FimH proteobacteria related disease which is in a virulent state.
[0169] If the ratio FimS ON/FimH is superior to the reference value, then it can be concluded that the tested subject will be diagnosed as suffering from a FimH proteobacteria related disease which is in a virulent state. These results have been confirmed by the present inventors experimentally (see example 7 and FIG. 10).
[0170] In another aspect, the present invention relates to an in vitro method for testing the therapeutic efficiency of a treatment in a subject suffering from a FimH proteobacteria related disease, said method comprising the step of predicting the therapeutic response as described previously before and after the administration of said treatment.
[0171] It can be concluded that said treatment is efficient in said subject if the normalized amplification level of ON or the ON/OFF ratio or the ON/(ON+OFF) ratio of the fim operon or the fimH gene abundance, or the ON/FimH ratio measured in the sample obtained before said treatment is superior respectively to the normalized amplification level of ON or the ON/OFF ratio or the ON/(ON+OFF) ratio of the fim operon or the fimH gene abundance, or the ON/FimH ratio measured in the sample obtained after said treatment.
[0172] The efficiency of any treatment (even classical antibiotics) can be assessed by means of this method. In a preferred embodiment, said treatment is one of the FimH blocker disclosed above. All the embodiments and definitions disclosed for the detecting method of the invention apply to these methods.
[0173] In particular, it will be possible to use primers specifically amplifying specific regions within the FimS, the FimA and FimE region having the SEQ ID NO:15 to 20 or homologous regions thereof, preferably the regions having the SEQ ID NO: 21-33 by using the primer systems mentioned above. In another aspect, the present invention relates to nucleotide primers amplifying specifically the nucleotide regions within the FimS, the FimA and FimE regions having the SEQ ID NO:15 to 20 or the regions having the SEQ ID NO:21-33. It also relates to kits containing said primers.
[0174] These nucleotide primers have preferably at least 80%, preferably at least 90% or at least 95% identity with at least one fragment of the complementary sequence of SEQ ID NO:15 to 33.
[0175] More precisely, the present invention relates to kits containing at least one of the following primer pairs, that can be used to measure the amplification level of the ON position of the fim operon: [0176] [SEQ ID NO:1; SEQ ID NO:3], [0177] [SEQ ID NO:2; SEQ ID NO:4], [0178] [SEQ ID NO:5; SEQ ID NO:7], [0179] [SEQ ID NO:6; SEQ ID NO:8].
[0180] Furthermore, said kits may contain at least one of the following primer pairs, that can be used to measure the amplification level of the OFF position of the fim operon: [0181] [SEQ ID NO:1; SEQ ID NO:2], [0182] [SEQ ID NO:3; SEQ ID NO:4], [0183] [SEQ ID NO:5; SEQ ID NO:8], [0184] [SEQ ID NO:7; SEQ ID NO:8].
[0185] Furthermore, said kits may contain at least one of the following primer pairs, that can be used to measure the abundance of the fimH gene: [0186] [SEQ ID NO:35; SEQ ID NO:36], [0187] [SEQ ID NO:37; SEQ ID NO:38], [0188] [SEQ ID NO:39; SEQ ID NO:40].
[0189] Preferably, the kits contain at least the primer pairs [SEQ ID NO:5; SEQ ID NO:7] and [SEQ ID NO:6; SEQ ID NO:8]. More preferably, the kits contain the primer pair [SEQ ID NO:5; SEQ ID NO:7]. More preferably, the kits contain at least the primer pair [SEQ ID NO:35; SEQ ID NO:36], optionally in combination with the primer pair [SEQ ID NO:5; SEQ ID NO:7].
[0190] The invention also concerns the nucleotide primers per se, having the following sequence: SEQ ID NO: 1 (p1), SEQ ID NO:2 (p2), SEQ ID NO: 3 (p3), SEQ ID NO:4 (p4), SEQ ID NO: Z5 (p5), SEQ ID NO:6 (p6), SEQ ID NO: 7 (p7), SEQ ID NO:8 (p8), SEQ ID NO:35, SEQ ID NO:36.
[0191] In a preferred embodiment, the primers of SEQ ID NO:1 to 8 and/or SEQ ID NO:35 to 40 can be used to screen the samples before implementing any of the methods of the invention.
[0192] In another aspect, the present invention relates to the pairs of primers p1-p8 of SEQ ID NO:1 to 8 identified by the inventors as reproducible and reliable tools for measuring the amplification level of the ON position or the ON/OFF ratio or the ON/(ON+OFF) ratio of the fim operon in stool samples. It also relates to kits containing said pairs of primers. Any appropriate combination between the said primers for detecting the OFF and ON position of the fim operon is herewith encompassed.
[0193] In another aspect, the present invention relates to the pairs of primers of SEQ ID NO:35 to 40 identified by the inventors as reproducible and reliable tools for measuring the abundance of the fimH gene in stool samples. It also relates to kits containing said pairs of primers. Any appropriate combination between the said primers and those for detecting the OFF and ON position of the fim operon is herewith encompassed.
[0194] Moreover, the invention relates to a kit (or micro-array) containing (or carrying) probes targeting at least one of the following nucleotide regions:
TABLE-US-00002 (the small characters representing known polymorphisms): SEQ ID NO: 9 TTAACTaATTGATAATAAAGTTAAAAAACAAATAAATACAAGACAATTGG GGCCAAACTGTCtATATCATAAATAAGTTACGTATTTTTTCTCAAGCA (the small characters representing known polymorphisms): SEQ ID NO: 10 AGTCAAACTCGTTGACAAAACAAAGTGTACAGAACGACTGCCCATGTCGA TTTAGAAATAgTTTTTTTAAAGGAAAGCAGCATGAAA
[0195] SEQ ID NO:9 and SEQ ID NO:10 correspond to the switch region of the fimS gene. Probes hybridizing these nucleotide regions may therefore be useful for detecting the ON position of the fim operon.
[0196] In a preferred embodiment, the probes of the invention hybridize the IRR (Inverted Repeat Region) located in the FimS gene, having SEQ ID NO:11 and/or SEQ ID NO:12.
[0197] In one embodiment, the invention relates to probes hybridizing specifically the nucleotide regions of SEQ ID NO:9, SEQ ID NO:10, SEQ ID NO:11 and/or SEQ ID NO:12.
[0198] In another embodiment, the invention relates to probes hybridizing specifically the nucleotide regions of the fimH gene of SEQ ID NO:34, especially the probes of SEQ ID NO:41, SEQ ID NO:42 and SEQ ID NO:43.
[0199] Specific hybridization is preferably observed under high stringency conditions, i.e., when the temperature and ionic strength conditions are chosen so as to allow the hybridization between two complementary DNA fragments to be maintained. By way of illustration, high stringency conditions can be as follows. The DNA-DNA or DNA-RNA hybridization is carried out in two steps: (1) prehybridization at 42.degree. C. for 3 hours in phosphate buffer (20 mM, pH 7.5) containing 5*SSC (1*SSC corresponds to a 0.15 M NaCl+0.015 M sodium citrate solution), 50% of formamide, 7% of sodium dodecyl sulfate (SDS), 10*Denhardt's, 5% of dextran sulfate and 1% of salmon sperm DNA; (2) actual hybridization for 20 hours at a temperature dependent on the size of the probe (i.e. 42.degree. C. for a probe of size>100 nucleotides), followed by two 20-minute washes at 20.degree. C. in 2*SSC+2% SDS and one 20-minute wash at 20.degree. C. in 0.1*SSC+0.1% SDS. The final wash is carried out in 0.1*SSC+0.1% SDS for 30 minutes at 60.degree. C. for a probe of size>100 nucleotides. The high stringency hybridization conditions described above for a polynucleotide of defined size will be adjusted by those skilled in the art for oligonucleotides of greater or smaller size, as well-known in the art.
[0200] The invention also relates to nucleic microarray carrying said probes t. According to the invention, a "nucleic microarray" consists of different nucleic acid probes that are attached to a substrate, which can be a microchip, a glass slide or a microsphere-sized bead. A microchip may be constituted of polymers, plastics, resins, polysaccharides, silica or silica-based materials, carbon, metals, inorganic glasses, or nitrocellulose. Probes can be nucleic acids such as cDNAs ("cDNA microarray") or oligonucleotides ("oligonucleotide microarray"), and the oligonucleotides may be about 25 to about 60 base pairs or less in length. Said nucleic acid microarray may comprise additional nucleic acids specific for additional genes and optionally one or more reference gene(s), but preferably consists of a maximum of 500, 400, 300, 200 preferably 100, 90, 80, 70 more preferably 60, 50, 45, 40, 35, 30, 25, 20, 15, 10, or even less (for instance 9, 8, 7, 6, 5, 4, 3, 2 or 1) distinct nucleic acids.
[0201] Said kits (or microarrays) may comprise additional reagents (e.g., primers, probes or antibodies) that are specific for additional genes or gene products of one or more reference gene(s). Reference genes herein designate genes having a ubiquitous level of expression and/or abundance across bacteria, that can be used to normalize the gene levels for the signature. Said kit may also contain instructions for how to use the kit in order to reduce the methods of the invention to practice.
[0202] The present inventors propose to use these kits, primers, and/or probes (or the microarrays carrying the said probes) for detecting the presence of FimH-positive expressing proteobacteria in a stool sample of a subject or for predicting if a subject will benefit from a treatment with a FimH blocker or for testing the therapeutic efficiency of a treatment in a subject suffering from a FimH proteobacteria related disease. It is also possible to use these kits or microarrays in the treating, diagnosing and monitoring methods disclosed above.
DESCRIPTION OF THE FIGURES
[0203] FIG. 1 discloses the structure of the fim operon, in position ON or in position OFF (from Van der Woude and Baumler, 2004).
[0204] FIG. 2 discloses the percentage of ON reads measured on 113 aggregating or non-aggregation bacterial isolates.
[0205] FIG. 3 discloses the position of the two different sets of primers used in the present invention (p1-p4 in A, p5-p8 in B).
[0206] FIG. 4 discloses the ON/(OFF+ON) ratio measured in CD feces. The two samples on the left have a lower CQ ratio than the two samples on the right, indicating a higher amount of bacteria in the ON position.
[0207] FIG. 5 discloses the distribution of FimS OFF-targeting assays in logarithmic scale, by group, on the global population of the MOBIDIC study.
[0208] FIG. 6 discloses the distribution of FimS ON-targeting assays in logarithmic scale, by group, on the global population.
[0209] FIG. 7 discloses the distribution of FimH targeting assay in absence or in presence of aggregation.
[0210] FIG. 8 shows the ROC curve for the assay p5p7. Sensitivity refers to aggregation and specificity to Abs. of aggregation or No growth.
[0211] FIG. 9 discloses the distribution of FimS ON-targeting assays in logarithmic scale, by group of active or non-active patients, with the p1.p3 ON or the p6.p8 ON assays.
[0212] FIG. 10 discloses the Principal Component Analysis performed on the MOBIDIC cohort with several clinical variables.
EXAMPLES
I. Description of the qPCR Assay of the Invention
[0213] The inventors have developed a qPCR assay based on the FimH switch mechanism to be used as a complementary diagnostic.
[0214] Aggregation tests have been performed initially on all available isolated strains and later in more complex samples such biopsy samples of CD patients which can contain a mixture of bacterial strains. Sequencing data was used to determine the FimS position in the isolated strains, whilst FimS qPCR assay has been performed on DNA extracted from the stool samples of CD patients. Ultimately for the qPCR test to be useful as a diagnostic test, the assay performed on the DNA extracted from stool samples has to correlate to the aggregation tests performed on the patient's mucosal biopsy.
[0215] The following tests have been carried out: [0216] 1. the link between FimS switch mechanism and aggregation to EB8018 experimentally has been confirmed, [0217] 2. a qPCR based assay FimS switch mechanism assessing the FimS switch mechanism in stool samples has been developed,
[0218] The performance of this qPCR assay in the stool of CD patients in terms of correlation with ileal E. coli aggregation to EB8018 is evaluated.
I.I. Material and Methods
[0219] 1. Stool Collection & DNA Extraction
[0220] An exploratory longitudinal study of CD patients--CrohnOmeter (Enterome sponsored)--was conducted between July 2012 and December 2014, at the St. Antoine and St. Louis Hospitals (Paris, France) and at the French patient association I'Association Francois Aupetit (AFA, Paris, France). Eligibility of 98 subjects volunteering for participation in this study was assessed. Inclusion criteria were age .gtoreq.18 years, an established diagnosis of CD according to endoscopic, radiological and/or histological features. The main exclusion criteria were the use of antibiotics in the last 8 weeks preceding inclusion, history of intestinal resection, and bowel cleaning for colonoscopy in the last 3 months preceding inclusion. Patients were followed longitudinally for about 9 months, providing monthly stool samples collected at home.
[0221] Stool samples were collected by CD patients at home using Sarstedt tubes (Numbrecht, Germany) filled with 9 ml of preservative buffer. Upon reception, the tubes were stored at -80.degree. C. Aliquoting and DNA isolation were outsourced to Eurofins/GATC Biotech (Konstanz, Germany). Tubes have been aliquoted by batch and were stored at -80.degree. C. until extraction. For isolation of bacterial content, a commercial extraction kit, the QIAamp Stool DNA mini kit (Qiagen, Hilden, Germany) was used. DNA concentrations were measured using Qubit fluorometric quantitation (Life Technologies, Carlsbad, Calif., United States).
[0222] 2. Strains Isolation and Culture
[0223] 110 E. coli strains from La Girona University (Margarita Medina-Martinez Lab-Girona-Spain) and Cornell (Kenneth Simpson Lab--Ithaca--USA) have been made available through MTA. These isolated strains had been previously extracted from the stool or ileal/colonic biopsies of IBD patients or controls and had been characterised for their AIEC phenotype (for Cornell strains see Dogan B. et al., 2014; Baumgart M. et al., 2007, summarized in the Appendix). Those 110 strains have been sent to SMALTIS (Besancon, France) who is in charge of all laboratory work. An additional 3 non E. coli strains have been ordered as well as LF82 and LF82 deltaFimH that serve as respectively positive and negative controls.
[0224] Three days before aggregation assays, bacterial strains were defrosted on TSA (Tryptone Soya Agar) plates. A first overnight culture was performed by inoculation of 3 mL of LB broth with a single colony of bacteria followed by a second overnight culture (1 mL of the first culture+4 mL LB broth).
[0225] 3. Aggregation Test
##STR00002##
[0226] Six concentrations of EB8018 (sample SP-0010269-017 produced by China Gateway) were tested in the aggregation assays (1 nM/10 nM/100 nM/1 .mu.M/10 .mu.M and 100 .mu.M), 500.times. working solutions were prepared in pure DMSO by 10-fold serial dilutions from a 100 mM stock solution (65 mg EB8018+1 mL DMSO; M.sub.EB8018: 649.68 g/mol). The 500.times. working solutions (1 .mu.M, 10 .mu.M, 100 .mu.M, 1 mM, 10 mM and 100 mM) were split into aliquots and stored at -20.degree. C., until use.
[0227] On the day of the test, an aliquot of each EB8018 500.times. working solution (1 .mu.M, 10 .mu.M, 100 .mu.M, 1 mM, 10 mM and 100 mM) was defrosted and diluted twice in LB medium (1:20 for the first dilution and 1:25 for the second dilution) to obtain respectively six 2.times. working solutions (2 nM, 20 nM, 200 nM, 2 .mu.M, 20 .mu.M and 200 .mu.M). The second overnight bacterial cultures were diluted in LB medium (50-fold dilution). Fifty .mu.L of these bacteria dilutions were dispensed into 96-well plates (8 wells/strain). Fifty .mu.L of the EB8018 2.times. working solutions or fresh LB or LB with 0.2% DMSO were added to the wells. Microplates were incubated for 5 hours at 37.degree. C. under constant shaking (200 rpm). Every hour, each well was observed and the starting time of aggregation was recorded. After 5 hours of incubation, a picture was taken only in wells where an aggregation was observed. For each concentration and each time point, aggregation was evaluated by a technician. The level of aggregation was reported according to four different levels as follows: [0228] "-" for no aggregation [0229] "+/--" for low aggregation [0230] "+/-" for moderate aggregation [0231] "+" for strong aggregation
[0232] For further statistical analysis, the aggregation to EB8018 by strains was determined using the following rule: [0233] An isolated strain did aggregate if at least one "+" or one "+/-" across all conditions (concentration and time of incubation) [0234] An isolated strain did not aggregate if all results were negative ("-") across all conditions (concentration and time of incubation) [0235] A grey zone contained all remaining strains (hence with low aggregation)
[0236] This protocol was applied to the 113 isolated bacterial strains. On each plate, a positive control (LF82) and a negative control (LF82-.DELTA.FimH) were used.
[0237] 4. Extraction of DNA from Isolated Strains, Sequencing and Bioinformatics
[0238] DNA extraction were performed by SMALTIS using the ZymoBIOMICS DNA PrepKit according to manufacturer's instructions. The genome sequencing was performed by GATC (Konstance, Germany) and was carried out as 300 bp paired end with a MiSeq, using the V4 chemistry from Illumina, which will not vary for the duration of this project to ensure continuity. Negative controls are added to each of the sequencing runs and a final pared score analysis took place to ensure a suitable quality level. To control the sequencing process for contaminations, we used a PhiX control.
[0239] The E. coli strain `LF82` was used as reference for the mapping. This strain contains 4376 genes and the sequence was uploaded from NCBI. Alignment of the LF82 genes with all isolated E. coli genomes was done using these following criteria: 95% of identity and 90% of coverage. A table of the genes presence and absence in each isolated genome has been generated.
[0240] 5. qPCR Design
[0241] The regions of the fimE, fimS and fimA genes were selected from the Escherichia coli LF82 genome from Ensembl Bacteria database. 391 metagenomics CD samples available in the inventors internal database were mapped on the fimE/fimS/fimA region to inspect coverage and polymorphisms and select the candidate regions for qPCR primers. A 4 primers strategy was developed, where 2 primers are designed on the fimS region (on the forward and reverse strand) while the others 2 are designed on the fimE (forward strand) and fimA (reverse strand) regions, as shown in FIG. 3.
TABLE-US-00003 TABLE 1 Name of the primer Sequence of the primer SEQ ID NO: p1 GTAATGCTGCTCGTTTTGCC SEQ ID NO: 1 p2 CATATAGCGGAGGTGATGTGAA SEQ ID NO: 2 P3 TGCGCGATGCTTTCCTCTAT SEQ ID NO: 3 p4 GCGCAAGCGGCGTTA SEQ ID NO: 4 p5 CGGATTATGGGAAAGAAAT SEQ ID NO: 5 p6 TCAAACAGTTAGATGCTTT SEQ ID NO: 6 p7 CGATGCTTTCCTCTATGA SEQ ID NO: 7 p8 TTGTTTTGTCAACGAGTT SEQ ID NO: 8
[0242] Table 1 above recapitulates the nucleotide sequences of the 8 tested primers.
[0243] Four separate qPCR reactions can be performed on each sample, involving the combinations of primers p1+p3 (SEQ ID NO:1 and 3) and p2+p4 (SEQ ID NO:2 and 4) to detect the ON switch and p1+p2 (SEQ ID NO:1 and 2) and p3+p4 (SEQ ID NO:3 and 4) to detect the OFF switch.
[0244] Eight assays have been designed and applied to the following samples: 5 DNAs extracted from the stool of CD patients selected on their NGS sequence information on the FimS region. The two samples with the highest reads in the ON position were selected and two samples with no reads in the ON position and maximum sequencing depth and an intermediate sample.
[0245] A SYBR based assay has been validated, targeting the FimS on/off switch. The two assay sets were called p1-4 and p5-p8, and differ in Tm: 60.degree. C. for set p1-p4 and 55.degree. C. for set p5-p8. Of the eight assays designed, four target the FimS OFF switch (p1p2, p3p4, p5p6, p7p8) and four target the ON switch (p1p3, p2p4, p5p7, p6p8).
TABLE-US-00004 TABLE 2 Expected size for the assays targeting the FimS switch Assays Region Expected size p1p2 FimS-OFF 268 p3p4 FimS-OFF 293 p1p3 FimS-ON 162 p2p4 FimS-ON 403 p5p6 FimS-OFF 198 p7p8 FimS-OFF 95 p5p7 FimS-ON 139 p6p8 FimS-ON 154
[0246] 6. qPCR Protocols
[0247] DNA was diluted 20 times in DNase/RNase free distilled water prior to analysis. The qPCR analysis was performed on 4 CD samples with the 8 assays (SYBR-based) in duplicate 10 .mu.l reactions on the LC480 (Roche) instrument, using TATAA SYBR.RTM. GrandMaster Mix (TATAA Biocenter AB). 2 .mu.l of the diluted sample were added to the reactions. EpMotion 5070 (Eppendorf) robot performed all the pipetting. TATAA interplate calibrator (IPC) and NTCs were included on all plates. All the samples were run in the same plate with 4 assays/run (due to different Tm between the 2 set of primers). The following protocol and conditions were used for the qPCR analysis.
[0248] Master Mix Protocol:
TABLE-US-00005 Stock FINAL Conc Conc. 1 rxn Type Comment (.mu.M) (nM) 1 Primer pair: (Fw + Rv) 10 400 0.4 MMX: TATAA SYBR GrandMaster r2x -- 5 H2O: 2.6 Sum: 8
[0249] Temperature Protocol:
TABLE-US-00006 Temp Time Fluorescence Program (.degree. C.): (s): Cycles: acquisition Polymerase activation: 95 60 1 Amplification: Denaturation 95 5 Annealing 60/55 30 45 Extension 72 10 SYBR Dissociation curve: Denaturation 95 15 Melting 60/55 15 1 95 -- Continious (SYBR)
[0250] Cq-values were retrieved by absolute quantification/2nd derivative max for all samples in the Light Cycler 480 (Roche) software.
I.II. Results
[0251] Association Between the ON Switch and Aggregation of the Bacteria to EB80018 in Isolated Strains
[0252] The aggregation tests on EB8018 on the 110 isolated E. coli strains together with three additional non E. coli strains has led to the following conclusion.
[0253] Aggregation assays were successfully performed for the series of 110 strains. Positive control LF82 aggregated from 2 h of incubation. After 5 h of incubation, a strong aggregation was observed for concentrations 1 nM, 10 nM and 100 nM. At concentration of 1 .mu.M, a moderate aggregation was observed. Negative control LF82-AFimH did not aggregate with EB8018 whatever the concentration tested and whatever the time of incubation. The experiment highlighted a wide heterogeneity of aggregation profiles among E. coli isolates. Some of them aggregated very quickly and strongly, while others needed more time. For isolates with a slight aggregation, the phenomenon appeared stable over time. The heterogeneity of aggregation profiles could be attributed to the size of bacteria (microscopic observations revealed a morphological heterogeneity among the collection) and/or to the structure/function of FimH protein.
[0254] For each isolated strain, aggregation to EB8018 was measured at 6 different concentrations of EB8018 every hour for 5 hours with 4 different levels as described before. The aggregation to EB8018 was categorized in three groups `aggregation`, `no aggregation` and `grey zone` (see above). Among all analyzable strains, 42% did aggregate, 44% did not aggregate and 13% were classified on the grey zone (low aggregation).
[0255] Association tests were performed between aggregation classification and some phenotype/information. There were no association between aggregation and the AIEC phenotype (p-value=0.15, Pearson's Chi-squared test).
[0256] The number of reads that mapped to FimA and FimE on both ON and OFF positions was analyzed using the sequence data of those strains, and the percentage of reads on FimS was estimated as the mean of percentage of reads mapped to FimA ON and FimE ON. If no read mapped to FimA on position ON and OFF or no read mapped to FimE on position ON and OFF, the percentage of reads on FimS cannot be estimated.
[0257] The FIG. 2 shows the distribution of percentage of reads on FimS according to our aggregation classification. There was a huge association between the percentage of reads on FimS and the aggregation classification (p<0.0001, Wilcoxon rank test; Low aggregation (grey zone) vs. Aggregation, p<0.0001, Wilcoxon rank test).
[0258] A cutoff of 1% was applied on the percentage of reads on FimS. The confusion matrix below reports the FimS classification according to aggregation outcome. 35 strains had more than 1% of reads on FimS and did aggregate with EB8018 and 24 strains had less than 1% of reads on FimS and did not aggregate with EB8018. The number of false positive is 9 and the number of false negative is 7, hence the sensitivity reached 0.83 and the specificity reached 0.73. 13 strains were on the grey zone: 6 of them had more than 1% of reads on FimS and 7 of them had less than 1%. For 11 strains there was no reads on FimA or FimE so it was not possible to estimate the percentage of reads on FimS, however these strains did no aggregate with EB8018.
TABLE-US-00007 TABLE 3 Conclusion: FimS in ON position is characteristic of strains that aggregate to EB8018. Aggregation outcome Grey zone (agg = No Aggregation +/--) aggregation At least TRUE 35 6 9 0.80 1% read Unknown 0 0 11 -- on FIMS FALSE 7 7 24 0.77 0.83 -- 0.73
[0259] Characterization of the qPCR Primers Specific of the Switch Change
[0260] The strong association between aggregation to EB8018 and FimS switch led to the development of qPCR assays targeting the ON position of FimS, the OFF position of FimS and the FimH region as reference.
[0261] A qPCR assay targeting the four regions identified above has been developed. Two sets of four assays were designed as shown on FIGS. 3 A and B where 4 primers (p2, p3, p6 and p7) were designed on the fimS region (on the forward and reverse strand) while two others were designed on the fimE (p1, p5, forward strand) and two others on the fimA (p4, p8, reverse strand) regions.
[0262] The designed assays were validated using a simplified validation protocol using 10 samples (5 strains and 5 fecal samples). Validation was based on a standard curve with 5 target concentrations measured in duplicates.
TABLE-US-00008 TABLE 4 Information for the ten samples used for the technical development of FimS qPCR assay Prediction of Tissue/ aggregation ID Other ID Type Origine Source Disease Aggregation? with FimS 09_404_G C08914 Isolated cornell Stool Control Aggregation ON strain 38AW_1 B96817 Isolated cornell Intestinal ICD Aggregation ON strain Biopsy 538_6 C08890 Isolated cornell Intestinal ICD Absence of OFF strain Biopsy aggregation 40EM_1 B96818 Isolated cornell Intestinal UC Absence of OFF strain Biopsy aggregation 09_406_B C08915 Isolated cornell Stool Control Grey zone OFF strain AFA15_13 S8 stool CrohnOmeter Stool CD -- ON sample AFA19_10 S9 stool CrohnOmeter Stool CD -- Grey sample AFA38_06 S6 stool CrohnOmeter Stool CD -- OFF sample AFA59_06 S7 stool CrohnOmeter Stool CD -- OFF sample AFA70_03 S10 stool CrohnOmeter Stool CD -- ON sample
[0263] SYBR based assays targeting the FimS on/off switch have been developed. As described on the material and methods section, two sets of four assays were developed; of the eight assays designed, four target the FimS OFF switch (p1p2, p3p4, p5p6, p7p8) and four target the ON switch (p1p3, p2p4, p5p7, p6p8). As first results, Enterome checked the correct amplification and the linearity of all PCR for all samples. An exploratory analysis was done to investigate a ratio between OFF and ON assays on unnormalized values (in Cq). Based on primary data, it was possible to discriminate strains and feces with high level of ON to the strains and feces with low level of ON. Thus, eight assays have been validated. The ON switch was detected by the four following assays: p1.p3; p2.p4; p5.p7; and p6.p8. The OFF switch was detected by the four following assays: p1.p2; p3.p4; p5.p8; and p7.p8.
[0264] After the technical development and validation, for each assay and each PCR product from the five stool samples, the efficiency of PCR reactions was estimated and one PCR product by assay was selected, maximizing the efficiency for further normalization. However, a good efficiency was observed for all assays (ranged from 0.90 to 0.98). Finally, efficiency, LOD and LOQ values as well as normalization parameter were saved for further normalization of new samples (see table 4 below for details).
TABLE-US-00009 TABLE 5 Normalization settings for the 8 Fims assays. IPC Patients/ LOQ LOQ LOD Efficiency Ids PCR product Assays slope intercept efficiency (Copies/rxn) (Cq) (Copies/rxn) plates S10.AFA70_03.p1.p2 AFA70_03 p1.p2 -3.44 33.85 0.95 20 29.58 3.440 14.31 S7.AFA59_06.p1.p3 AFA59_06 p1.p3 -3.37 34.33 0.98 20 30.3 5.438 14.31 S9.AFA19_10.p2.p4 AFA19_10 p2.p4 -3.58 35.23 0.9 200 27.15 4.003 14.31 S10.AFA70_03.p3.p4 AFA70_03 p3.p4 -3.51 34.93 0.93 20 30.61 5.932 14.31 S10.AFA70_03.p5.p6 AFA70_03 p5.p6 -3.37 34.03 0.98 20 29.4 4.328 14.40 S6.AFA38_06.p5.p7 AFA38_06 p5.p7 -3.39 34.44 0.97 20 29.98 7.893 14.40 S7.AFA59_06.p6.p8 AFA59_06 p6.p8 -3.57 35.64 0.91 200 27.67 5.281 14.40 S10.AFA70_03.p7.p8 AFA70_03 p7.p8 -3.51 36.08 0.93 20 31.26 8.760 14.40
[0265] The PCR products for all the primer pairs for a selection of 5 samples were sequenced by GATC using Sanger technology. The alignments showed no cross match against any unexpected bacteria. The inserts were also aligned on the Escherichia coli K12 reference genome to check their positions around the fimS region. The alignments of the inserts corresponded to the regions of amplification around the fimS region, and, as expected, the primers corresponding to the ON position were aligned on the reverse strand or are split between the forward and reverse strand when they overlap one of the two transposons.
[0266] For the development of a PCR assay based on the ratio between two assays (for example ratio or delta between ON and OFF targeted regions), care should be taken to selected the two assays with the highest efficiencies. PCR efficiency can be used to gauge the performance of PCR assays.
[0267] The PCR amplification efficiency values were estimated using the slope of standard curves. The variability of OFF targeted assays was lower than the variability for ON targeted assays. For all assays, the median of efficiency values was always lower than 1 (corresponding to 100%).
[0268] A linear regression line was plotted and the regression equation reported with the r.sup.2 factor. The assays were designed to catch the same quantity of DNA and the same mechanism hence assays should be correlated to each other with a low variability and a slope of 1 with a intercept of 0.
[0269] A very good correlation was observed for p3.p4 and p7.p8 (r.sup.2=0.99) and the slope was almost 1 (slope=0.972) with an intercept close to 0. Associations between p1.p2 and p3.p4 and between p1.p2 and p7.p8 were also good, even if the correlation coefficient was biased by an outlier. A high variability was observed for p5.p6.
[0270] A good correlation was observed for p1.p3 and p5.p7 the slope was not equal to 1 and a shift for the intercept was observed. This shift was induced by low concentrations. For other associations, the correlation was slower, except for p1.p3 and p6.p8 but for this comparison, the dispersion was larger for low Cq values.
[0271] As can be seen in FIG. 4, the two FimH "ON" samples are clearly separated from the two FimH "OFF" samples based on the qPCR assays. In particular when using the assays p1-p3 and p5-p7 to measure the ON expression and assays p3-p4 and p7-p8 to measure the OFF position, one can clearly see that a good cutoff would be between the values of 55 and 58% when calculated based on the Cq values.
II. Use of the qPCR Assay of the Invention on Two Different Representative Populations
[0272] 1. MOBIDIC Study
[0273] A clinical study for MOlecular Blomarkers and Adherent and Invasive Escherichia coli (AIEC) Detection study In Crohn's disease patients (MOBIDIC) was conducted between September 2016 and October 2017. Eligibility of 122 Crohn's disease patients in this multicenter study was assessed. Inclusion criteria were (i) male or female between 18 and 75 years of age, inclusive (ii) diagnosis of ileal or ileo-colonic Crohn's disease for a minimum of 3 months prior to inclusion (iii) an ileocolonoscopy scheduled prior to study inclusion (iv) agreeing to participate and to sign an informed consent form (v) able to perform stool collection at home. The main exclusion criteria were (i) colonic Crohn's disease of L2 phenotype based on Montreal classification (ii) extensive small bowel resection (>100 cm) or short bowel syndrome (iii) bowel strictures/stenosis contraindicating ileocolonoscopy (iv) currently with an ostomy or an ileoanal pouch (iv) currently receiving total parenteral nutrition (v) bowel preparation received in the previous 3 months (vi) an increased risk of hemorrhage (patients with anticoagulant/antiplatelet therapy) (vii) history of intestinal carcinoma or colorectal cancer, alcohol or substance abuse, chronic uncontrolled disorders.
[0274] 2. Stool Sample Collection and DNA Extraction
[0275] Stool samples were collected by CD patients at home using Sarstedt tubes (Numbrecht, Germany) filled with 9 ml of a preservative buffer. Upon reception, the tubes were stored at -80.degree. C. Aliquoting and DNA isolation were outsourced to Eurofins/GATC Biotech (Konstanz, Germany). Tubes have been aliquoted by batch and were stored at -80.degree. C. until extraction. For isolation of bacterial content, a commercial extraction kit, the QIAamp Stool DNA mini kit (Qiagen, Hilden, Germany) was used. DNA concentrations were measured using Qubit fluorometric quantitation (Life Technologies, Carlsbad, Calif., United States).
[0276] 3. Biopsies Collection Mucosal specimens, isolated from CD patients have been collected from the MOBIDIC study. For each patient, 4 biopsies were collected, 2 or 3 for further investigations and 1 or 2 as back-up sample stored at Cell&Co (Clermont-Ferrand, France). The ileal specimens were introduced immediately into preweighed vials containing 1.8 mL of refrigerated DMEM with 15% glycerol. The vials were weighed to establish the weight of sample. Ideally, the size of the biopsies must be between 5 and 10 mg. After being frozen at -80.degree. C., vials were sent to Cell&Co and stored at -80.degree. C. upon receipt.
[0277] 4. Aggregation of EB8018 to the Bacteria Isolated from Said Biopsies Collection
[0278] The aggregation to EB8018 of bacterial strains isolated from MOBIDIC biopsies has been outsourced to SMALTIS (Besancon, France). The main procedure is described below.
[0279] On day 1, biopsies were processed to retrieve adherent bacteria (extract A) and invasive bacteria (extract I). The detachment of the adherent bacteria from epithelial cells was done by sonication (30 kHZ, 300 w) and then the biopsy was washed by PBS, placed in LB broth for culture and tissues were breakdown for isolation of the invasive bacteria by vortexing. For both invasive and adherent extracts, 100 .mu.L of extracts were plated on MH agar plates in order to observe the different bacteria morphotypes, 100 .mu.L of extracts were inoculated in 3 mL of EC LB broth for further aggregation tests and the remaining was stored at -80.degree. C. for long term conservation.
[0280] Extracts A and I were cultivated in LB broth for 2.times.24 hours and on day 3, the LB overnight cultures were used for aggregation assays with EB8018 compound. Three concentrations of EB8018 were tested (10 nM/100 nM/1 .mu.M final concentrations), 500.times. working solutions were prepared in DMSO by 10-fold serial dilution from the 100 mM stock solutions, such as the final DMSO concentration in 96-well plates is 0.1%. DMSO (without any compound) was also diluted 500-fold in the LB in order to prepare LB with 0.2% DMSO (0.1% final concentration in the wells). 50 .mu.L of solutions (EB8018 or DMSO) and then 50 .mu.L of bacteria diluted suspensions were dispensed into the 96-well plate according the plate template. Plates were incubated for 5 hours at 37.degree. C. under agitation in the SPARK 10M (96 rpm). Every hour, bacterial growth was measured and a picture of each well was taken using a SPARK10M. After 5 hours, the microplate was shacked and 10 min after, a picture was taken for aggregation assessment (aggregation was evaluated by a technician with comparison with DMSO). In case of aggregation for any extract and any concentration, morphotypes were isolated from the 2 O/N cultures by plating a 10.sup.-5/6 dilutions of the LB cultures used for the aggregations. Then, aggregation assays were performed on each morphotype with similar conditions as aggregation on extracts. Morphotypes that show aggregation in presence of EB8018 compound were identified (MALDI-TOF) and frozen at -80.degree. C. On each plate, a positive control (LF82) and a negative control (LF82-AFimH) were used.
[0281] For extracts and isolated morphotypes, aggregation was primary evaluated by a technician and reported on SMALTIS technical reports as follows: [0282] "-" no aggregation [0283] "+/--" very low aggregation [0284] "+/-" moderate aggregation [0285] "+" aggregation [0286] "++" strong aggregation [0287] "+++/++++" very strong aggregation
[0288] When no aggregation was observed on extracts or in case of inconclusive evaluation (for example with observation of aggregation with the DMSO without any compound), a second biopsy was analysed following the same protocol.
[0289] After the analysis of all biopsies, in order to avoid any misinterpretation of aggregation and to standardize the results, Enterome had requested SMALTIS to do a final blind review of all results. For isolated morphotypes, Enterome had prepared PDFs with pictures taken at 4 h, 5 h and 5 h after shaking and strains IDs were anonymized. All pictures were reviewed by two independent technicians at SMALTIS and results were unblinded by Enterome. Aggregation of isolated morphotypes was evaluated by four levels: `no aggregation`, `low/medium aggregation`, `aggregation` or `inconclusive`.
[0290] 5. Validation of the qPCR Analysis on Stool Samples
[0291] 5.1. Stool samples from the MOBIDIC study were sent to Eurofins/GATC Biotech (Konstanz, Germany) for aliquoting and DNA isolation using the QIAamp Stool DNA mini kit. For each stool samples, three aliquots were obtained and we extracted the two first aliquots. For some stool samples, the third aliquot was also extracted. A quality control was performed by looking at the concentration and the degradation. The samples had been processed in two batches, a first batch of 30 samples and the remaining samples in a second batch. We observed smeared bands on gel electrophoresis for the first batch and some samples did not pass the quality controls. However, these quality checks have been adjusted by Eurofins/GATC as control for further sequencing, and we decided to use them for qPCR analysis by selecting the best aliquots.
[0292] 121 DNA samples were sent to TATAA biocenter for qPCR analysis. The experiment was performed according to ISO 17025 accredited method "ME 5.4247 qPCR Analysis with MGS assays SYBR". All samples were analyzed on all 9 assays in duplicates. Overall the qPCR went well with no amplifying NTCs (template controls) except for one replicate in the p1p3 assay which showed late amplification (>Cq35). This was only a one well contamination and was thus not thought to affect the samples or prove any general contamination of the mastermix. The standard deviation between replicates was for the most part below 0.5 which is the criteria used in the method for acceptable spread between replicates. Some reactions reaching close to Cq 30 and above demonstrated an increase in SD between replicates, since this is close to or equal to the LOQ of the various assays. Raw data were sent by TATAA in Excel files and Cq values were normalized by Enterome. Only the accredited results were used normalization, the amplification values for all other samples were set to 0. Cq values were normalized by interpolation with the amplification curve after correction by inter-plate calibrator. Absolute concentrations of each assay for each sample were expressed as copies/.mu.L.
[0293] 5.2. Aggregation to EB8018 had been performed by Smaltis as described on the material and methods section. At the end, the aggregation was evaluated by looking at pictures for isolated morphotypes from one to two biopsies. The evaluation of aggregation was done in blind by two independent technicians at Smaltis and data were merged by the Data Management at Enterome. Through the 122 CD patients, 113 patients have had at least one biopsy evaluated by Smaltis. Among them, the results for 7 patients were inconclusive. For the remaining 106 patients, 69 patients (65%) had at least one morphotype that aggregated, 21 patients (20%) had sterile biopsies and 16 patients (15%) had no aggregation.
[0294] 5.3. Association tests were performed between aggregation to EB8108 on biopsies and expression of FimS-On, FimS-Off and FimH targeting assays on stool samples. Association was evaluated by taking account for continuous expression of qPCR assays by performing Wilcoxon rank tests or by taking account for discrete variables (amplification vs. no amplification) by performing Pearson's chi-squared tests. Due to strong correlation between the assays, no correction for multiple testing was done. Hereafter we are reporting results considering the aggregation to EB8018 as two classes: `aggregation` vs. `no aggregation or no growth`. Addition results can be found on the statistical report for the MOBIDIC study.
[0295] 5.4. Results
[0296] 5.4.1. Results of the FimS OFF Assay
[0297] The following table presents the descriptive statistics of the FimS OFF-targeting assays and the p-values for the two tests (Wilcoxon and Pearson's chi-squared tests) and its significativity (S for significant or NS for non-significant).
TABLE-US-00010 TABLE 6 Descriptive statistics on the global population for FimS-OFF assays. Number of patients Number of with Abs of Pearson's patients aggregation chi- with or No Wilcoxon squared Assay aggregation growth test test p1.p2 OFF (log10) 68 37 <0.001 (S) 0.002 (S) p3.p4 OFF (log10) 68 37 0.032 (S) 1.000 (NS)* p5.p6 OFF (log10) 68 37 <0.001 (S) 0.342 (NS)* p7.p8 OFF (log10) 68 37 <0.001 (S) 0.283 (NS)* *Fisher exact test was used instead of Pearson's chi-squared.
[0298] The graphics in FIG. 5 present the distribution of FimS OFF-targeting assays in logarithmic scale, by group, on the global population.
[0299] 5.4.2. Results of the FimS ON Assay
[0300] The following table presents the descriptive statistics of the FimS ON-targeting assays and the p-values for the two tests (Wilcoxon and Pearson's chi-squared tests) and its significativity (S for significant or NS for non significant).
TABLE-US-00011 TABLE 7 Descriptive statistics on the global population for FimS-ON assays Number of patients Number of with Abs of Pearson's patients aggregation chi- with or No Wilcoxon squared Assay aggregation growth test test p1.p3 ON (log10) 68 37 0.002 (S) 0.009 (S) p2.p4 ON (log10) 68 37 0.007 (S) 0.004 (S) p5.p7 ON (log10) 68 37 <0.001 (S) 0.010 (S) p6.p8 ON (log10) 68 37 0.001 (S) <0.001 (S)
[0301] The graphics in FIG. 6 present the distribution of FimS ON-targeting assays in logarithmic scale, by group, on the global population.
[0302] 5.4.3. These results showed a strong correlation between all qPCR markers and the aggregation to EB8018. However, the strongest association was obtained for FimS ON-targeting assays, in terms of amplitude (Wilcoxon rank tests) and detection/no detection of the sequence (Pearson's chi-squared tests). By looking specifically at the FimS-ON targeting assay p5p7, the following contingency table was obtained, using a threshold of 10 copies/.mu.L, which corresponded to the limit of detection. The AUC value for this assay was 0.7.
TABLE-US-00012 TABLE 8 Contingency table for the classification of `aggregation` vs. `abs. of aggregation or no growth` with the On-targeting assays for FimS p5.p7 and a threshold of 10 copies/.mu.L. This threshold corresponds to the limit of quantification. Abs. of aggregation Aggregation or No growth p5p .gtoreq. 10 copies/.mu.L 47 16 74.60 p5p7 < 10 copies/.mu.L 21 21 50.00 69.11 56.75
[0303] FIG. 8 discloses the ROC curve obtained for this particular assay.
[0304] 6. The FimH Assay
[0305] A qPCR assay targeting the E. coli gene FimH was also developed. The technical development and the technical validation were performed in compliance with ISO17025.
[0306] 6.1. Selection of Candidate Regions for qPCR Primers and Design of Primers
[0307] Four regions on the FimH gene were selected for primer design. For each of the four regions, three assays were designed. Hydrolysis probe based assay design was carried out using Allele ID & Beacon designer (PREMIER Biosoft). The probes are labelled with FAM in the 5'-end and with IBFQ quencher in the 3'-end plus an internal ZEN quencher (PrimeTime ZEN probes, IDT). The probe sequences, sense and anti-sense primers for all assays are reported on the table below (Table 9).
TABLE-US-00013 TABLE 9 the probe sequences, sense and anti-sense primers for all assays. Assay Sequence Sequence Probe Sense Anti-sense name Definition Length Sequence Primer Primer FIMH_2_1 2149699|FIMH 912 ACCTCTCCGGCAC CCTCTTACCGTT ACGACGCGGT AACCGCAGATGC TATTGTGCGAAA ATTGGTGAA FIMH_2_2 2149699|FIMH 912 ACCTCTCCGGCAC TGTGCGAAAAGC ACGACGCGGT AACCGCAGATGC CAAAACCTG ATTGGTGAA FIMH_2_3 2149699|FIMH 912 CGCCACCGGCCA GCCGCGGGTTGT ACTGCTCACA CGGCTTATCC TTATAATTCG GGCGTCAA
[0308] 6.2. Development of the qPCR Assay
[0309] The technical development and validation of qPCR assays for FimH was conducted by TATAA biocenter.
[0310] After checking for correct amplification and linearity, the efficiency of PCR reactions was estimated for each assay and FIMH_2_1 was selected by maximization of the efficiency for further normalization. Finally, efficiency, LOD and LOQ values as well as normalization parameter were saved for further normalization of new samples (see table below for details).
TABLE-US-00014 TABLE 10 Normalization settings for the FimH assays. IPC Patients/PCR LOQ LOD Efficiency product Assays slope intercept efficiency (Copies/rxn) (Copies/rxn) plates AFA38_06 FIMH_2_1 -3.35 35.26 0.99 20 14.15 14.62
[0311] The following table presents the descriptive statistics of the FimH targeting assay and the p-value associated to the Wilcoxon test and its significativity.
TABLE-US-00015 TABLE 11 Descriptive statistics on the global population for the FimH assay Abs of aggregation Wilcoxon Assay Aggregation or No growth test FimH_2_1 (log10) 68 (1) 37 (0) <0.001 (S)
[0312] The graphics in FIG. 7 present the distribution of FimH-targeting assays in logarithmic scale, by group, on the global population.
[0313] 7. Association Between the Crohn Disease Activity Index (CDAI) and FimS ON
[0314] On the MOBIDIC Study, 35 patients were classified as `active` (i.e., having a CDAI>150) and 75 patients were classified as `non-active` (i.e., having a CDAI.ltoreq.150). Two FimS-ON assays were significantly associated with the disease activity (p1.p3 ON, p=0.027; p6.p8 ON, p=0.031). The CDAI score is well known in the art. It is described for example in Best et al, 1976.
[0315] The graphics in FIG. 9 discloses the distribution of FimS ON-targeting assays in logarithmic scale, by group.
[0316] The MOBIDIC cohort (n=87) was analyzed by performing a Principal Component Analysis on clinical variables including endoscopic scores, protein levels (CRP, calprotectin), E. coli abundance and age and weight.
[0317] CRP and Calprotectin were correlated with endoscopic activity, as was previously reported (Sipponen, I B D, 2010 and Sipponen, I B D, 2008).
[0318] E. coli was correlated with disease activity. Disease activity and E. coli were orthogonal to endoscopic activity. For example, the correlation between SES-CD and CDAI was 0.25 (spearman's coefficient) for MOBIDIC (see FIG. 10).
[0319] This is surprising, since the correlation between fecal markers and the disease activity or between the disease activity and the endoscopic activity has been shown to be weak (see Sipponen T, IBD, 2010 and Sipponen T, IBD, 2008).
[0320] In short, this means that:
[0321] i) the presence of FimH expressing bacteria in stool samples of the patients correlates with the activity of the disease, but not with the inflammatory level and symptoms;
[0322] ii) it is possible to prognose the Crohn's disease activity by assaying the presence of the biomarkers of the invention in whole stool samples, but not with ulceration markers such as SES-CD scores.
CONCLUSIONS
[0323] The sequencing of isolated strains allowed us to identify a strong association between the DNA sequences of the FimS region and aggregation to EB8018 (p<0.0001, Wilcoxon rank test). A technical development and validation of nine qPCR assays was done to target the FimS switch and the FimH gene. The MOBIDIC study allowed us to obtain stool and biopsies samples from CD patients. Bacterial DNA was isolated from stool samples and the nine qPCR assays were performed on the DNA samples. In the same time, aggregation tests to EB8018 were performed on isolated morphotype isolated from ileal biopsies. Statistical analyses shown a strong association between all qPCR assays and aggregation to EB8018, and especially for the FimS-ON targeting assays (p<0.001 for p5p7, Wilcoxon rank test).
BIBLIOGRAPHIC REFERENCES
[0324] Ayoib A. et al. Appl Microbiol Biotechnol. 2017 [0325] Barnich N et al., Mol. Microbiol. 2003, 48:781-794 [0326] Barnich N et al, J. Clin. Invest 2007, 117, 1566-1574 [0327] Barnich N et al, Virulence 2010 July-August; 1(4): 281-2 [0328] Barnich N. et al, AGA Abstract 2017 [0329] Bennett et al, Am J of Pathology 2016 May; 186(5):1166-79 [0330] Best W R et al, Gastroenterology 1976, March; 70(3):439-444 [0331] Baumgart M. et al., ISME J. 2007 September; 1(5):403-18 [0332] Bouckaert J et al. Mol. Microbiol. 2005, 55: 441-455. [0333] Bouckaert J et al. Mol. Microbiol. 2006, 61: 1556-1568. [0334] Bouckaert J et al. 2013 Chemistry, a European Journal 19: 7847-7855. [0335] Boudeau J et al Infect. Immun. 1999, 67, 4499-4509 [0336] Boudeau J. et al, Mol. Microbiol. 2001; 39:1272-1284 [0337] Bringer M A. Et al, Cellular Microbiology (2006); 8(3), 471-484 [0338] Brument et al Journal of Medicinal Chemistry 2013, 56(13), 5395-5406 [0339] Burns L. et al., Journal of Bacteriology, May 2000, p. 2953-2959 [0340] Chalopin T. et al, Org. Biomol. Chem., 2015 [0341] Chalopin T. et al, J. Name 00, 1-3, 2013 [0342] Chassaing et al., J Clin Invest. 2011 March; 121(3):966-75. [0343] Cho et al. Gastroenterology 2011, 140(6), 1704-12. doi: 10.1053/j.gastro.2011.02.046 [0344] Cusumano C K et al, Sci. Transl. Med. 2011; 3:109ra15 [0345] Darfeuille-Michaud et al Gastroenterology 2004, 127(2), 412-421 [0346] Dogan B. et al., Inflamm Bowel Dis. 2014; 0:1-14 [0347] Dreux N. et al PLOS Pathogens 2013, 9, 1, e1003141 [0348] Glasser A L. et al, Infection and Immunity, September 2001, p. 5529-5537 [0349] Godon J J. et al, Appl. Environ. Microbiol. 1997 [0350] Holden N. et al., Microbiology 2007, 153:4138-4149 [0351] Klemm P., 1986, The EMBO journal, vol. 5, n.degree. 6, pp. 1389-1393 [0352] Kulasekara H D et al., 1999, Mol. Microbiol. 31:1171-1181 [0353] Molodecky N A, et al. Gastroenterology. 2012 [0354] Moor et al., Nature. 2017 Apr. 27; 544(7651):498-502. [0355] Mossman et al. J Immunol. 2008 Nov. 15; 181(10):6702-6 [0356] Mydock-McGrane L. et al., Expert Opinion on Therapeutic Patents, 26:2, 175-197, 2016 [0357] O'Brien et al., 2016, Gut 2016; 0:1-8 [0358] Simpson et al., Infect Immun. 2006 August; 74(8):4778-92 [0359] Sivignon A. et al., MBio 2015, nov 17; 6(6) [0360] Sokurenko E V., JOURNAL OF BACTERIOLOGY, July 1995, p. 3680-3686 [0361] Spaulding et al., Nature 2017, Jun. 22; 546(7659):528-532. [0362] Sipponen T., Inflamm. Bowel. Dis. Vol. 14, Number I, January 2008 [0363] Sipponen T., Inflamm. Bowel. Dis. Vol. 16, Number 12, December 2010 [0364] Totsika M. et al, JID, 2013: 208 [0365] van der Woude and Baumler. Clin Microbiol Rev. 2004 July; 17(3): 581-611. [0366] Wellens et al. PLoS ONE 2008, 3(4), e2040 [0367] Yakovenko O., PNAS 2015, vol. 112, No 32, pp. 9884-9889 [0368] Zhang H et al., PNAS 2016, vol. 113, No15, pp. 4182-4187
Sequence CWU 1
1
43120DNAartificialprimer p1 1gtaatgctgc tcgttttgcc
20222DNAartificialprimer p2 2catatagcgg aggtgatgtg aa
22320DNAartificialprimer p3 3tgcgcgatgc tttcctctat
20415DNAartificialprimer p4 4gcgcaagcgg cgtta
15519DNAartificialprimer p5 5cggattatgg gaaagaaat
19619DNAartificialprimer p6 6tcaaacagtt agatgcttt
19718DNAartificialprimer p7 7cgatgctttc ctctatga
18818DNAartificialprimer p8 8ttgttttgtc aacgagtt
18998DNAescherichia colimisc_featureswitch region of FimS
9ttaactaatt gataataaag ttaaaaaaca aataaataca agacaattgg ggccaaactg
60tctatatcat aaataagtta cgtatttttt ctcaagca 981087DNAescherichia
colimisc_featureSwitch region of FimS 10agtcaaactc gttgacaaaa
caaagtgtac agaacgactg cccatgtcga tttagaaata 60gtttttttaa aggaaagcag
catgaaa 87119DNAartificialIRR1 within the fimS genemisc_featureIRR
1 of the fim operon (within FimS) 11ttggggcca 9129DNAartificialIRR2
within the FimS region 12tggccccaa 9131633DNAescherichia
colimisc_featureFimE-fimS-FimA region OFF position 13gtgagtaaac
gtcgttatct taccggtaaa gaagttcagg ccatgatgca ggcggtgtgt 60tacggggcaa
cgggagccag agattattgt cttattctgt tggcatatcg gcatgggatg
120cgtattagtg aactgcttga tctgcattat caggatcttg accttaatga
aggtcgaata 180aatattcgcc gactgaagaa cggattttct accgttcacc
cgttacgttt tgatgagcgt 240gaagccgtgg aacgctggac ccaggaacgt
gctaactgga aaggcgctga ccggaccgac 300gctatattta tttctcgccg
tgggagtcgg ctttctcgcc agcaggccta tcgcattatt 360cgcgatgccg
gtattgaagc tggaaccgta acgcagactc atcctcatat gttaaggcat
420gcttgtggtt atgaactggc tgagcgtggt gcagataccc gtttaattca
ggattatctc 480gggcatcgaa atattcgcca tactgtgcgt tataccgcca
gtaatgctgc tcgttttgcc 540ggattatggg aaagaaataa tctcataaac
gaaaaattaa aaagagaaga agcttgattt 600aactaattga taataaagtt
aaaaaacaaa taaatacaag acaattgggg ccaaactgtc 660tatatcataa
ataagttacg tattttttct caagcataaa aatattaaaa aacgacaaaa
720agcatctaac tgtttgatat ataaattatt tctcttgtaa attaatttca
catcacctcc 780gctatatgta aagctaacgt ttctgtagct cgacgcaact
tcctcattct tctctccaaa 840aaccacctca tgcaatataa aaaactgcaa
ataaagataa ctatagaaca ttaagccaac 900aaataaactg aaaaagtttg
tgcgcgatgc tttcctctat gagtcaaaat ggccccaaat 960gtttcatctt
ttgggggaaa actgtgcagt gttggcagtc aaactcgttg acaaaacaaa
1020gtgtacagaa cgactgccca tgtcgattta gaaatagttt ttttaaagga
aagcagcatg 1080aaaattaaaa ctctggcaat tgttgttctg tcggctctgt
ccctgagttc tacagcggct 1140ctggctgata ctacacccac gacggtaaat
ggtgggaccg ttcactttaa aggggaagtt 1200gttaacgccg cttgcgcagt
tgatgcaggc tctgttgatc aaaccgttca gttaggacag 1260gttcgtaccg
ccactttgaa gcaggctgga gcaaccagct ctgctgtcgg ttttaacatt
1320cagctgaatg attgcgatac cactgttgcc acaaaagccg ctgttgcctt
cttggggacg 1380gcgattgaca gtactcatcc taaagtcctg gctctacaga
gttcagctgc gggtagcgca 1440acaaacgttg gcgtgcagat tctggacaga
acaggtaatg agctgacgct ggacggtgcg 1500acatttagtg cagaaacaac
cctgaataac ggtactaaca ccattccgtt ccaggcgcgt 1560tattttgcaa
ccggtgctgc aaccccaggt gctgctaatg cggatgcgac cttcaaggtt
1620cagtatcaat aac 1633141573DNAescherichia
colimisc_featurefimE-fimS-fimA ON position 14tacggggcaa cgggagccag
agattattgt cttattctgt tggcatatcg gcatgggatg 60cgtattagtg aactgcttga
tctgcattat caggatcttg accttaatga aggtcgaata 120aatattcgcc
gactgaagaa cggattttct accgttcacc cgttacgttt tgatgagcgt
180gaagccgtgg aacgctggac ccaggaacgt gctaactgga aaggcgctga
ccggaccgac 240gctatattta tttctcgccg tgggagtcgg ctttctcgcc
agcaggccta tcgcattatt 300cgcgatgccg gtattgaagc tggaaccgta
acgcagactc atcctcatat gttaaggcat 360gcttgtggtt atgaactggc
tgagcgtggt gcagataccc gtttaattca ggattatctc 420gggcatcgaa
atattcgcca tactgtgcgt tataccgcca gtaatgctgc tcgttttgcc
480ggattatggg aaagaaataa tctcataaac gaaaaattaa aaagagaaga
agcttgattt 540aactaattga taataaagtt aaaaaacaaa taaatacaag
acaattgggg ccattttgac 600tcatagagga aagcatcgcg cacaaacttt
ttcagtttat ttgttggctt aatgttctat 660agttatcttt atttgcagtt
ttttatattg catgaggtgg tttttggaga gaagaatgag 720gaagttgcgt
cgagctacag aaacgttagc tttacatata gcggaggtga tgtgaaatta
780atttacaaga gaaataattt atatatcaaa cagttagatg ctttttgtcg
ttttttaata 840tttttatgct tgagaaaaaa tacgtaactt atttatgata
tagacagttt ggccccaaat 900gtttcatctt ttgggggaaa actgtgcagt
gttggcagtc aaactcgttg acaaaacaaa 960gtgtacagaa cgactgccca
tgtcgattta gaaatagttt ttttaaagga aagcagcatg 1020aaaattaaaa
ctctggcaat tgttgttctg tcggctctgt ccctgagttc tacagcggct
1080ctggctgata ctacacccac gacggtaaat ggtgggaccg ttcactttaa
aggggaagtt 1140gttaacgccg cttgcgcagt tgatgcaggc tctgttgatc
aaaccgttca gttaggacag 1200gttcgtaccg ccactttgaa gcaggctgga
gcaaccagct ctgctgtcgg ttttaacatt 1260cagctgaatg attgcgatac
cactgttgcc acaaaagccg ctgttgcctt cttggggacg 1320gcgattgaca
gtactcatcc taaagtcctg gctctacaga gttcagctgc gggtagcgca
1380acaaacgttg gcgtgcagat tctggacaga acaggtaatg agctgacgct
ggacggtgcg 1440acatttagtg cagaaacaac cctgaataac ggtactaaca
ccattccgtt ccaggcgcgt 1500tattttgcaa ccggtgctgc aaccccaggt
gctgctaatg cggatgcgac cttcaaggtt 1560cagtatcaat aac
157315598DNAescherichia colimisc_featurefimE in the OFF position
15gtgagtaaac gtcgttatct taccggtaaa gaagttcagg ccatgatgca ggcggtgtgt
60tacggggcaa cgggagccag agattattgt cttattctgt tggcatatcg gcatgggatg
120cgtattagtg aactgcttga tctgcattat caggatcttg accttaatga
aggtcgaata 180aatattcgcc gactgaagaa cggattttct accgttcacc
cgttacgttt tgatgagcgt 240gaagccgtgg aacgctggac ccaggaacgt
gctaactgga aaggcgctga ccggaccgac 300gctatattta tttctcgccg
tgggagtcgg ctttctcgcc agcaggccta tcgcattatt 360cgcgatgccg
gtattgaagc tggaaccgta acgcagactc atcctcatat gttaaggcat
420gcttgtggtt atgaactggc tgagcgtggt gcagataccc gtttaattca
ggattatctc 480gggcatcgaa atattcgcca tactgtgcgt tataccgcca
gtaatgctgc tcgttttgcc 540ggattatggg aaagaaataa tctcataaac
gaaaaattaa aaagagaaga agcttgat 59816485DNAescherichia
colimisc_featurefimS in the OFF position 16ttaactaatt gataataaag
ttaaaaaaca aataaataca agacaattgg ggccaaactg 60tctatatcat aaataagtta
cgtatttttt ctcaagcata aaaatattaa aaaacgacaa 120aaagcatcta
actgtttgat atataaatta tttctcttgt aaattaattt cacatcacct
180ccgctatatg taaagctaac gtttctgtag ctcgacgcaa cttcctcatt
cttctctcca 240aaaaccacct catgcaatat aaaaaactgc aaataaagat
aactatagaa cattaagcca 300acaaataaac tgaaaaagtt tgtgcgcgat
gctttcctct atgagtcaaa atggccccaa 360atgtttcatc ttttggggga
aaactgtgca gtgttggcag tcaaactcgt tgacaaaaca 420aagtgtacag
aacgactgcc catgtcgatt tagaaatagt ttttttaaag gaaagcagca 480tgaaa
48517550DNAescherichia colimisc_featurefimA in the OFF position
17attaaaactc tggcaattgt tgttctgtcg gctctgtccc tgagttctac agcggctctg
60gctgatacta cacccacgac ggtaaatggt gggaccgttc actttaaagg ggaagttgtt
120aacgccgctt gcgcagttga tgcaggctct gttgatcaaa ccgttcagtt
aggacaggtt 180cgtaccgcca ctttgaagca ggctggagca accagctctg
ctgtcggttt taacattcag 240ctgaatgatt gcgataccac tgttgccaca
aaagccgctg ttgccttctt ggggacggcg 300attgacagta ctcatcctaa
agtcctggct ctacagagtt cagctgcggg tagcgcaaca 360aacgttggcg
tgcagattct ggacagaaca ggtaatgagc tgacgctgga cggtgcgaca
420tttagtgcag aaacaaccct gaataacggt actaacacca ttccgttcca
ggcgcgttat 480tttgcaaccg gtgctgcaac cccaggtgct gctaatgcgg
atgcgacctt caaggttcag 540tatcaataac 55018598DNAescherichia
colimisc_featurefimE in the ON position 18gtgagtaaac gtcgttatct
taccggtaaa gaagttcagg ccatgatgca ggcggtgtgt 60tacggggcaa cgggagccag
agattattgt cttattctgt tggcatatcg gcatgggatg 120cgtattagtg
aactgcttga tctgcattat caggatcttg accttaatga aggtcgaata
180aatattcgcc gactgaagaa cggattttct accgttcacc cgttacgttt
tgatgagcgt 240gaagccgtgg aacgctggac ccaggaacgt gctaactgga
aaggcgctga ccggaccgac 300gctatattta tttctcgccg tgggagtcgg
ctttctcgcc agcaggccta tcgcattatt 360cgcgatgccg gtattgaagc
tggaaccgta acgcagactc atcctcatat gttaaggcat 420gcttgtggtt
atgaactggc tgagcgtggt gcagataccc gtttaattca ggattatctc
480gggcatcgaa atattcgcca tactgtgcgt tataccgcca gtaatgctgc
tcgttttgcc 540ggattatggg aaagaaataa tctcataaac gaaaaattaa
aaagagaaga agcttgat 59819485DNAescherichia colimisc_featurefimS in
the ON position 19ttaactaatt gataataaag ttaaaaaaca aataaataca
agacaattgg ggccattttg 60actcatagag gaaagcatcg cgcacaaact ttttcagttt
atttgttggc ttaatgttct 120atagttatct ttatttgcag ttttttatat
tgcatgaggt ggtttttgga gagaagaatg 180aggaagttgc gtcgagctac
agaaacgtta gctttacata tagcggaggt gatgtgaaat 240taatttacaa
gagaaataat ttatatatca aacagttaga tgctttttgt cgttttttaa
300tatttttatg cttgagaaaa aatacgtaac ttatttatga tatagacagt
ttggccccaa 360atgtttcatc ttttggggga aaactgtgca gtgttggcag
tcaaactcgt tgacaaaaca 420aagtgtacag aacgactgcc catgtcgatt
tagaaatagt ttttttaaag gaaagcagca 480tgaaa 48520550DNAescherichia
colimisc_featurefimA in the ON position 20attaaaactc tggcaattgt
tgttctgtcg gctctgtccc tgagttctac agcggctctg 60gctgatacta cacccacgac
ggtaaatggt gggaccgttc actttaaagg ggaagttgtt 120aacgccgctt
gcgcagttga tgcaggctct gttgatcaaa ccgttcagtt aggacaggtt
180cgtaccgcca ctttgaagca ggctggagca accagctctg ctgtcggttt
taacattcag 240ctgaatgatt gcgataccac tgttgccaca aaagccgctg
ttgccttctt ggggacggcg 300attgacagta ctcatcctaa agtcctggct
ctacagagtt cagctgcggg tagcgcaaca 360aacgttggcg tgcagattct
ggacagaaca ggtaatgagc tgacgctgga cggtgcgaca 420tttagtgcag
aaacaaccct gaataacggt actaacacca ttccgttcca ggcgcgttat
480tttgcaaccg gtgctgcaac cccaggtgct gctaatgcgg atgcgacctt
caaggttcag 540tatcaataac 55021100DNAescherichia
colimisc_featurefimE 1_100 21gtgagtaaac gtcgttatct taccggtaaa
gaagttcagg ccatgatgca ggcggtgtgt 60tacggggcaa cgggagccag agattattgt
cttattctgt 10022100DNAescherichia colimisc_featurefimE 101_200
22tggcatatcg gcatgggatg cgtattagtg aactgcttga tctgcattat caggatcttg
60accttaatga aggtcgaata aatattcgcc gactgaagaa
10023100DNAescherichia colimisc_featurefimE 201_300 23cggattttct
accgttcacc cgttacgttt tgatgagcgt gaagccgtgg aacgctggac 60ccaggaacgt
gctaactgga aaggcgctga ccggaccgac 10024100DNAescherichia
colimisc_featurefimE 301_400 24gctatattta tttctcgccg tgggagtcgg
ctttctcgcc agcaggccta tcgcattatt 60cgcgatgccg gtattgaagc tggaaccgta
acgcagactc 10025100DNAescherichia colimisc_featurefimE 401_500
25atcctcatat gttaaggcat gcttgtggtt atgaactggc tgagcgtggt gcagataccc
60gtttaattca ggattatctc gggcatcgaa atattcgcca 1002698DNAescherichia
colimisc_featurefimE 501_597 26tactgtgcgt tataccgcca gtaatgctgc
tcgttttgcc ggattatggg aaagaaataa 60tctcataaac gaaaaattaa aaagagaaga
agcttgat 982798DNAescherichia colimisc_featurefimS 1_100
27ttaactaatt gataataaag ttaaaaaaca aataaataca agacaattgg ggccaaactg
60tctatatcat aaataagtta cgtatttttt ctcaagca 9828100DNAescherichia
colimisc_featurefimS 101_200 28taaaaatatt aaaaaacgac aaaaagcatc
taactgtttg atatataaat tatttctctt 60gtaaattaat ttcacatcac ctccgctata
tgtaaagcta 10029100DNAescherichia colimisc_featureFimS 201_300
29acgtttctgt agctcgacgc aacttcctca ttcttctctc caaaaaccac ctcatgcaat
60ataaaaaact gcaaataaag ataactatag aacattaagc
10030100DNAescherichia colimisc_featurefimS 301_400 30caacaaataa
actgaaaaag tttgtgcgcg atgctttcct ctatgagtca aaatggcccc 60aaatgtttca
tcttttgggg gaaaactgtg cagtgttggc 1003187DNAescherichia
colimisc_featurefimS 401_488 31agtcaaactc gttgacaaaa caaagtgtac
agaacgactg cccatgtcga tttagaaata 60gtttttttaa aggaaagcag catgaaa
8732100DNAescherichia colimisc_featurefimA 101_200 32actttaaagg
ggaagttgtt aacgccgctt gcgcagttga tgcaggctct gttgatcaaa 60ccgttcagtt
aggacaggtt cgtaccgcca ctttgaagca 10033100DNAescherichia
colimisc_featurefimA 401_500 33tgacgctgga cggtgcgaca tttagtgcag
aaacaaccct gaataacggt actaacacca 60ttccgttcca ggcgcgttat tttgcaaccg
gtgctgcaac 10034912DNAEscherichia colimisc_featureFimH gene
34atgattgtaa tgaaacgagt tattaccctg tttgctgtac tgctgatggg ctggtcggta
60aatgcctggt cattcgcctg taaaaccgcc aatggtaccg caatccctat tggcggtggc
120agcgccaatg tttatgtaaa ccttgcgcct gccgtgaatg tggggcaaaa
cctggtcgtg 180gatctttcga cgcaaatctt ttgccataac gattacccgg
aaaccattac agattatgtc 240acactgcaac gaggctcggc ttatggcggc
gtgttatcta atttttccgg gaccgtaaaa 300tataatggca gtagctatcc
tttccctact accagcgaaa cgccgcgggt tgtttataat 360tcgagaacgg
ataagccgtg gccggtggcg ctttatttga cgcctgtgag cagtgcgggg
420ggagtggcga ttaaagctgg ctcattaatt gccgtgctaa ttttgcgaca
gaccaacaac 480tataacagcg atgatttcca gtttgtgtgg aatatttacg
ccaataatga tgtggtggtg 540cctactggcg gctgtgatgt ttctgctcgt
gatgtcaccg ttactctgcc ggactaccct 600ggttcagtgc cgcttcctct
taccgtttat tgtgcgaaaa gccaaaacct ggggtattac 660ctctccggca
caaccgcaga tgcgggcaac tcgattttca ccaataccgc gtcgttttca
720ccagcgcagg gcgtcggcgt acagttgacg cgcaacggta cgattattcc
agcgaataac 780acggtatcgt taggagtagt agggacttcg gcggtaagtc
tgggattaac ggcaaattac 840gcacgtaccg gagggcaggt gactgcaggg
aatgtgcaat cgattattgg cgtaactttt 900gtttatcaat aa
9123524DNAartificialprimer sens FimH_2_1 35cctcttaccg tttattgtgc
gaaa 243619DNAartificialprimer antisens FimH_2_1 36acgacgcggt
attggtgaa 193721DNAartificialSense primer FimH_2_2 37tgtgcgaaaa
gccaaaacct g 213819DNAartificialantisense primer FimH_2_2
38acgacgcggt attggtgaa 193922DNAartificialSense primer FimH_2_3
39gccgcgggtt gtttataatt cg 224018DNAartificialantisense primer
FimH_2_3 40actgctcaca ggcgtcaa 184125DNAartificialProbe FimH_2_1
41acctctccgg cacaaccgca gatgc 254225DNAartificialProbe FimH_2_2
42acctctccgg cacaaccgca gatgc 254322DNAartificialProbe FimH_2_3
43cgccaccggc cacggcttat cc 22


D00001
D00002
D00003
D00004
D00005
D00006
D00007
D00008
D00009
D00010

S00001
XML
uspto.report is an independent third-party trademark research tool that is not affiliated, endorsed, or sponsored by the United States Patent and Trademark Office (USPTO) or any other governmental organization. The information provided by uspto.report is based on publicly available data at the time of writing and is intended for informational purposes only.
While we strive to provide accurate and up-to-date information, we do not guarantee the accuracy, completeness, reliability, or suitability of the information displayed on this site. The use of this site is at your own risk. Any reliance you place on such information is therefore strictly at your own risk.
All official trademark data, including owner information, should be verified by visiting the official USPTO website at www.uspto.gov. This site is not intended to replace professional legal advice and should not be used as a substitute for consulting with a legal professional who is knowledgeable about trademark law.