Blood-pressure Measurement Apparatus And Blood-pressure Measurement Method
Kawakami; Ken
U.S. patent application number 16/804134 was filed with the patent office on 2020-09-03 for blood-pressure measurement apparatus and blood-pressure measurement method. The applicant listed for this patent is KABUSHIKI KAISHA TOSHIBA, Toshiba Electronic Devices & Storage Corporation. Invention is credited to Ken Kawakami.
| Application Number | 20200275845 16/804134 |
| Document ID | / |
| Family ID | 1000004706218 |
| Filed Date | 2020-09-03 |


View All Diagrams
| United States Patent Application | 20200275845 |
| Kind Code | A1 |
| Kawakami; Ken | September 3, 2020 |
BLOOD-PRESSURE MEASUREMENT APPARATUS AND BLOOD-PRESSURE MEASUREMENT METHOD
Abstract
A blood-pressure measurement apparatus according to an embodiment comprises a measurer and a blood-pressure acquirer. The measurer is configured to measure a pulse of a subject based on a received-light signal scattered in a body of the subject when a light signal in a predetermined frequency band is irradiated. The blood-pressure acquirer is configured to acquire a diastolic blood pressure based on a first value and a second value, the first value corresponding to a blood flow of the subject in a first time period in a time period from a first reference time at which a value obtained by first-order differentiation of the pulse with respect to a time becomes the maximum to a second reference time at which a next pulse rises, the second value corresponding to a vascular resistance of the subject.
| Inventors: | Kawakami; Ken; (Kawasaki Kanagawa, JP) | ||||||||||
| Applicant: |
|
||||||||||
|---|---|---|---|---|---|---|---|---|---|---|---|
| Family ID: | 1000004706218 | ||||||||||
| Appl. No.: | 16/804134 | ||||||||||
| Filed: | February 28, 2020 |
| Current U.S. Class: | 1/1 |
| Current CPC Class: | A61B 5/02141 20130101; A61B 5/0261 20130101; A61B 5/02125 20130101; A61B 5/022 20130101; A61B 5/02416 20130101 |
| International Class: | A61B 5/026 20060101 A61B005/026; A61B 5/022 20060101 A61B005/022; A61B 5/021 20060101 A61B005/021 |
Foreign Application Data
| Date | Code | Application Number |
|---|---|---|
| Feb 28, 2019 | JP | 2019-035280 |
| May 17, 2019 | JP | 2019-093999 |
| Feb 19, 2020 | JP | 2020-026521 |
Claims
1. A blood-pressure measurement apparatus comprising: a measurer configured to measure a pulse of a subject based on a received-light signal scattered in a body of the subject when a light signal in a predetermined frequency band is irradiated; and a blood-pressure acquirer configured to acquire a diastolic blood pressure based on a first value and a second value, the first value corresponding to a blood flow of the subject in a first time period in a time period from a first reference time at which a value obtained by first-order differentiation of the pulse with respect to a time becomes a maximum to a second reference time at which a next pulse rises, the second value corresponding to a vascular resistance of the subject.
2. The apparatus of claim 1, wherein the blood-pressure acquirer acquires a systolic blood pressure further based on a third value corresponding to a blood flow of the subject in a second time period in a time period from a third reference time at which the pulse rises to a fourth reference time of a maximum peak of the pulse.
3. The apparatus of claim 2, wherein the first time period is between the first reference time and the fourth reference time, and the second time period is a time period from the third reference time to the first reference time.
4. The apparatus of claim 2, wherein the blood-pressure acquirer obtains a fifth reference time that has an equivalent value to the pulse at the first reference time in a time period from the fourth reference time to the second reference time, and the first time period and the second time period are a time period from the fourth reference time to the fifth reference time.
5. The apparatus of claim 2, wherein the second time period is a time period from the third reference time to the first reference time.
6. The apparatus of claim 4, wherein the second time period is a time period from the fourth reference time to the fifth reference time.
7. The apparatus of claim 2, wherein blood-pressure acquirer acquires the third reference time based on a value obtained by dividing a first difference value obtained by subtracting a direct-current component of the pulse from a value of the pulse at the first reference time, by the maximum value of the first-order differentiation.
8. The apparatus of claim 2, wherein the blood-pressure acquirer acquires at least one of the first value and the third value based on a value corresponding to a blood vessel volume of the subject at the first reference time.
9. A blood-pressure measurement method comprising: measuring a pulse of a subject based on a received-light signal that is scattered in a body of the subject and is then received when a light signal in a predetermined frequency band is irradiated to the subject; and acquiring a diastolic blood pressure based on a first value and a second value, the first value corresponding to a blood flow of the subject in a first time period in a time period from a first reference time at which a value obtained by first-order differentiation of the pulse with respect to a time becomes a maximum to a second reference time at which a next pulse rises, the second value corresponding to a vascular resistance of the subject.
10. The method of claim 9, wherein the blood-pressure acquiring acquires a systolic blood pressure further based on a third value corresponding to a blood flow of the subject in a second time period in a time period from a third reference time at which the pulse rises to a fourth reference time of a maximum peak of the pulse.
11. The method of claim 10, wherein the first time period is between the first reference time and the fourth reference time, and the second time period is a time period from the third reference time to the first reference time.
12. The method of claim 10, wherein the blood-pressure acquiring obtains a fifth reference time that has an equivalent value to the pulse at the first reference time in a time period from the fourth reference time to the second reference time, and the first time period and the second time period are a time period from the fourth reference time to the fifth reference time.
13. The method of claim 10, wherein the second time period is a time period from the third reference time to the first reference time.
14. The method of claim 12, wherein the second time period is a time period from the fourth reference time to the fifth reference time.
15. The method of claim 10, wherein blood-pressure acquiring acquires the third reference time based on a value obtained by dividing a first difference value obtained by subtracting a direct-current component of the pulse from a value of the pulse at the first reference time, by the maximum value of the first-order differentiation.
16. The method of claim 10, wherein the blood-pressure acquiring acquires at least one of the first value and the third value based on a value corresponding to a blood vessel volume of the subject at the first reference time.
Description
CROSS-REFERENCE TO RELATED APPLICATIONS
[0001] This application is based upon and claims the benefit of priority from Japanese Patent Application No. 2019-035280, filed on Feb. 28, 2019, Japanese Patent Application No. 2019-093999, filed on May 17, 2019 and Japanese Patent Application No. 2020-26521, filed on Feb. 19, 2020; the entire contents of which are incorporated herein by reference.
FIELD
[0002] Embodiments of the present invention relate to a blood-pressure measurement apparatus and a blood-pressure measurement method.
BACKGROUND
[0003] There is known a photoplethysmogram (PPG) sensor that detects a pulse associated with a heartbeat by measuring a change of a blood volume in an artery and capillaries which corresponds to a change of a heart rate. A method that detects the heart rate by using the PPG sensor based on the blood volume passing through a tissue at each pulse beat is called "blood volume pulse (BVP) measurement".
[0004] There is generally known a method that estimates a blood pressure based on feature points of a waveform shape of a blood volume pulse. However, the waveform of the blood volume pulse fluctuates depending on a state of activity or a mental state of a subject, so that disturbance occurs in the blood volume pulse. While the blood volume pulse is disturbed, it is impossible to accurately measure the feature points or the like, and the accuracy of measurement of the blood pressure is deteriorated.
BRIEF DESCRIPTION OF THE DRAWINGS
[0005] FIG. 1 is a block diagram illustrating a schematic configuration of a blood-pressure measurement apparatus according to a first embodiment;
[0006] FIG. 2 is a diagram illustrating an example of a watch type blood-pressure measurement apparatus;
[0007] FIG. 3 is a diagram illustrating an example of a blood volume pulse measured by a measurer;
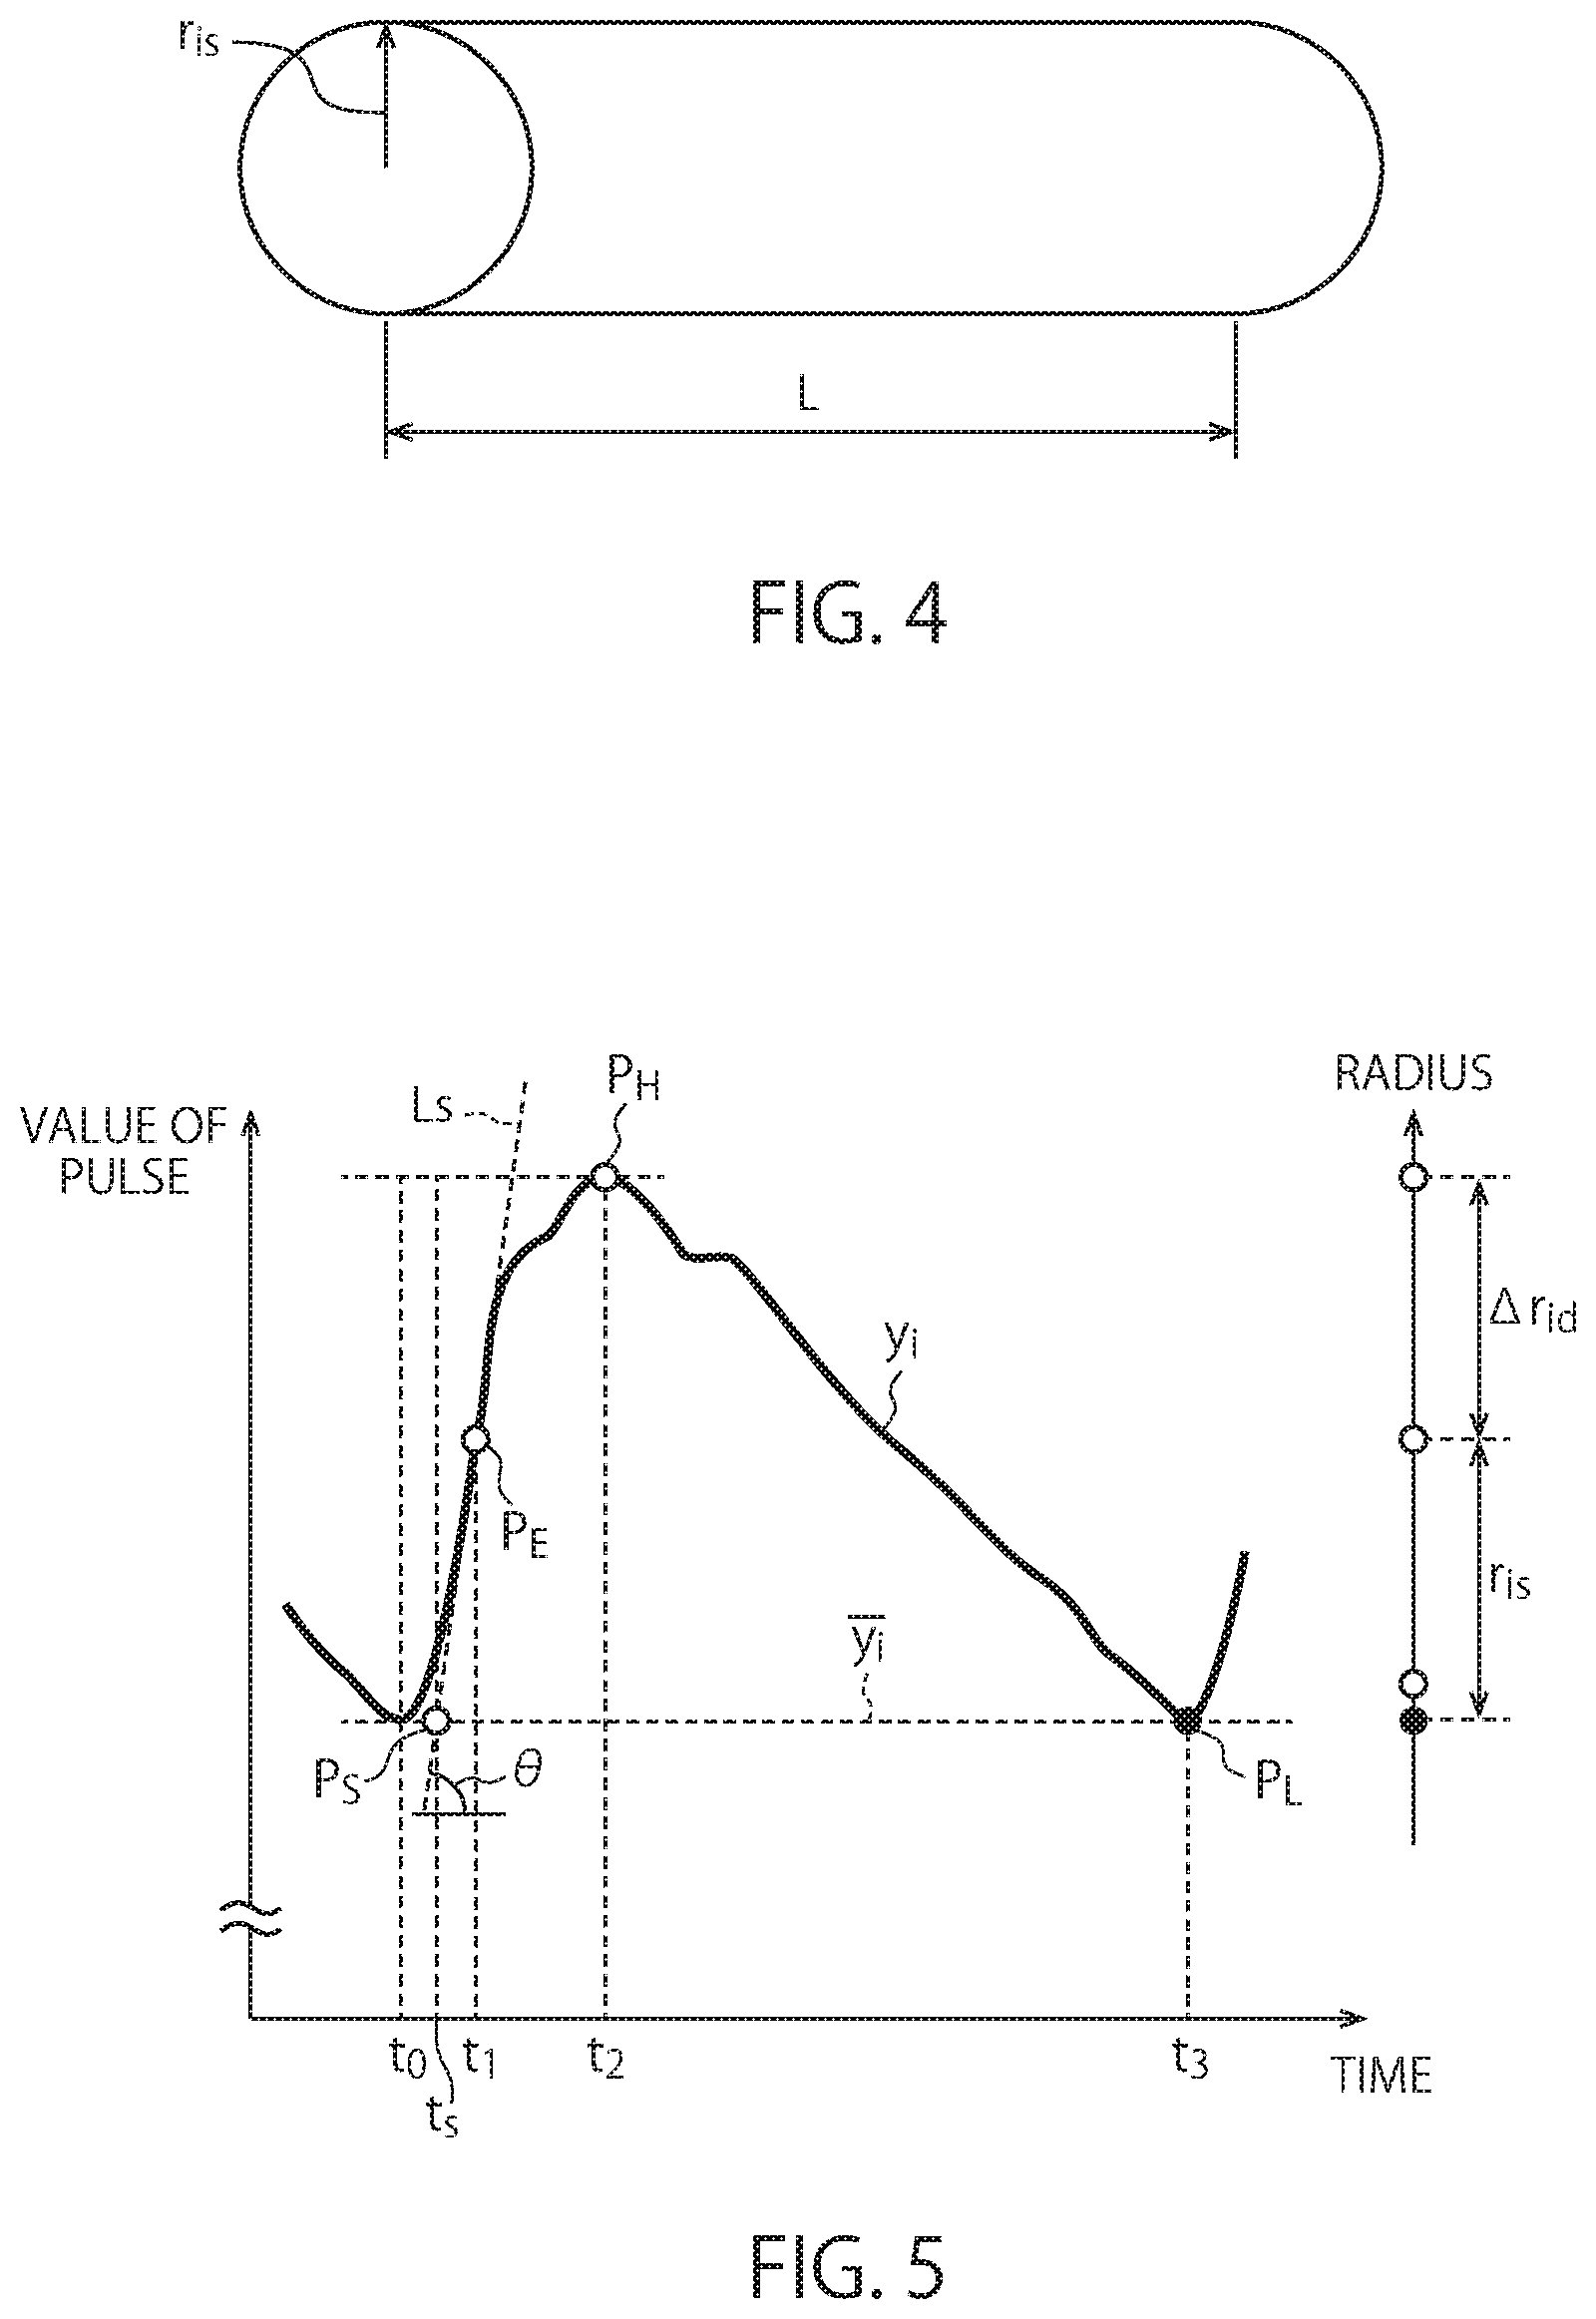
[0008] FIG. 4 is a diagram illustrating a blood vessel obtained by approximation by a cylindrical tube;
[0009] FIG. 5 is a diagram illustrating a relation between an example of a pulse waveform and a radius of a cylindrical tube model;
[0010] FIG. 6 is a diagram schematically illustrating a change of a radius of a cylindrical tube which is associated with a change of a blood vessel volume;
[0011] FIG. 7A is a diagram schematically illustrating a flow rate from a point P.sub.S to a point P.sub.E;
[0012] FIG. 7B is a diagram schematically illustrating a flow rate from the point P.sub.E to a point P.sub.H;
[0013] FIG. 8 is a diagram illustrating an example of information acquired by a feature-point processor;
[0014] FIG. 9A is a diagram illustrating measured data of a subject having a relatively high blood pressure;
[0015] FIG. 9B is a diagram illustrating measured data of a subject having a relatively low blood pressure;
[0016] FIG. 10 is a flowchart illustrating processing by the blood-pressure measurement apparatus;
[0017] FIG. 11 is a diagram illustrating a relation between an example of a pulse waveform and a radius of a cylindrical tube model according to a second embodiment;
[0018] FIG. 12 is a diagram schematically illustrating a change of a radius of a cylindrical tube which is associated with a change of a blood vessel volume from the point P.sub.S to a point P.sub.L via a point P.sub.D;
[0019] FIG. 13A is a diagram schematically illustrating a flow rate from the point P.sub.S to the point P.sub.H via the point P.sub.E;
[0020] FIG. 13B is a diagram schematically illustrating a flow rate from the point P.sub.H to the point P.sub.D; and
[0021] FIG. 14 is a diagram illustrating an example of information acquired from a pulse by a feature-point processor according to the second embodiment.
DETAILED DESCRIPTION
[0022] A blood-pressure measurement apparatus according to an embodiment comprises a measurer and a blood-pressure acquirer. The measurer is configured to measure a pulse of a subject based on a received-light signal scattered in a body of the subject when a light signal in a predetermined frequency band is irradiated. The blood-pressure acquirer is configured to acquire a diastolic blood pressure based on a first value and a second value, the first value corresponding to a blood flow of the subject in a first time period in a time period from a first reference time at which a value obtained by first-order differentiation of the pulse with respect to a time becomes the maximum to a second reference time at which a next pulse rises, the second value corresponding to a vascular resistance of the subject.
First Embodiment
[0023] FIG. 1 is a block diagram illustrating a schematic configuration of a blood-pressure measurement apparatus 1 according to a first embodiment. The blood-pressure measurement apparatus 1 includes a measurer 2 and a blood-pressure acquirer 4. The blood-pressure measurement apparatus 1 can be incorporated in a watch type biological measurement apparatus 6 illustrated in FIG. 2, for example. The biological measurement apparatus 6 may be arranged on an upper arm, the chest, or the like.
[0024] The measurer 2 measures a change of a blood volume in an artery and capillaries which is associated with a change of a heart rate of a subject, to acquire information on a blood volume pulse associated with a heartbeat. The blood volume pulse may be simply referred to as "pulse" in the following descriptions. The measurer 2 includes a light emitter 22, a light receiver 24, and a pulse generator 26. The light emitter 22 includes an LED (Light Emitting Device) that emits a light signal in a specific wavelength band (a green band, a near infrared band, or the like), for example. The light receiver 24 receives a signal after the light signal from the light emitter 22 is absorbed or reflected/scattered in the body of the subject. The pulse generator 26 generates a pulse at each heartbeat based on a received-light signal.
[0025] When the amount of light emission of the light signal fluctuates, the received-light amount of the received-light signal also fluctuates. Therefore, the pulse generator 26 separates the received-light signal into a DC component and an AC component, and generates a pulse based on an AC/DC ratio. Accordingly, the generated pulse is dimensionless data.
[0026] FIG. 3 is a diagram illustrating an example of a blood volume pulse measured by the measurer 2. The vertical axis represents a value of pulse and the horizontal axis represents a time. As illustrated in FIG. 3, the pulse repeats fluctuation every heartbeat. A pulse y.sub.i at the i-th beat is formed by an AC component that fluctuates periodically and a DC component V.
[0027] The blood-pressure acquirer 4 acquires a blood pressure of a subject based on the pulse. This blood-pressure acquirer 4 includes a feature-point processor 42 and a blood-pressure calculator 44.
[0028] First, a model used in the blood-pressure acquirer 4 is described referring to FIGS. 4 to 7B. FIG. 4 is a diagram illustrating a blood vessel model. The blood vessel model illustrated in FIG. 4 is obtained by approximation by a cylindrical tube having a radius r.sub.is and a length L. Fluctuation of a blood pressure is fluctuation of a pressure applied to a vascular wall by blood ejected from the heart. This blood-pressure fluctuation is linked with the pulse y.sub.i.
[0029] A relation among a pressure difference .DELTA.P, a flow rate Q, and a resistance R of the cylindrical tube is derived from the Navier-Stokes equations and is represented by Expression (1).
.DELTA.P=QR (1)
The blood-pressure acquirer 4 calculates values corresponding to the flow rate Q and the resistance R by using the pulse y.sub.i based on the cylindrical tube model to acquire the blood pressure of the subject. In general, a human blood pressure is evaluated by using a systolic blood pressure SBP that is the maximum pressure in a blood vessel in a systolic phase of the heart, a diastolic blood pressure DBP that is the minimum pressure in the blood vessel in a diastolic phase of the heart, and a pulse pressure PP obtained by subtracting the diastolic blood pressure from the systolic blood pressure.
[0030] FIG. 5 is a diagram illustrating a relation between an example of a pulse waveform and a radius of a cylindrical tube model according to the first embodiment. The left part of FIG. 5 illustrates an example of a normal pulse waveform for one beat. The vertical axis represents a value of pulse and the horizontal axis represents a time. The right part of FIG. 5 illustrates the radius of the cylindrical tube model. A change of a blood vessel volume is represented by the radius r.sub.is and a change .DELTA.r.sub.id. That is, the radius r.sub.is is the radius of a blood vessel at a point P.sub.E, and .DELTA.r.sub.id is increase of the radius associated with increase of the volume from the point P.sub.E to a point P.sub.H.
[0031] In the normal pulse y.sub.i, the amplitude starts at a bottom position (t.sub.0), increases substantially monotonically and reaches a maximum peak (t.sub.2), thereafter monotonically decreases and reaches a bottom position (t.sub.3), and ends. Here, the suffix i is the number for identifying each pulse in blood volume pulse data. That is, the suffix i indicates data corresponding to a pulse at the i-th beat. Although calculation for each beat is performed in the calculation according to the present embodiment, a manner of calculation is not limited thereto. Data for several beats may be averaged and be subjected to calculation, for example.
[0032] t.sub.1 is a time between to and t.sub.2, at which a value obtained by the first-order differentiation of the pulse y.sub.3 with respect to a time becomes the maximum. This t.sub.1 corresponds to an equilibrium point of a displacement r(t) of an equation of viscoelastic motion represented by Equation (4) described later.
[0033] t.sub.s is a time based on a value obtained by dividing a first difference value obtained by subtracting a direct-current component
y.sub.i
from a value y.sub.is of the pulse y.sub.i at the time t.sub.1 by the maximum first-order differentiation value
y'.sub.i
as represented by Equation (2). Here, the first-order differentiation value
y'.sub.i
is calculated by Equation (15) described later, for example.
t.sub.s=t.sub.1-(y.sub.is-y.sub.i)/y'.sub.i (2)
A line Ls is a tangent at the point P.sub.E. That is, tan .theta. calculated by an angle .theta. between the line Ls and a line horizontal to the horizontal axis corresponds to this first-order differentiation value
y'.sub.i
P.sub.S, P.sub.E, P.sub.H, and P.sub.L denote points that correspond to the times t.sub.s, t.sub.1, t.sub.2, and t.sub.3, respectively. The time t.sub.L according to the present embodiment corresponds to a first time, the time t.sub.2 corresponds to a second time, and the time t.sub.0 or t.sub.s corresponds to a third time.
[0034] FIG. 6 is a diagram schematically illustrating a change of a radius of a cylindrical tube which is associated with a change of a blood vessel volume from the point P.sub.S to the point P.sub.L. The vertical axis represents a time and the horizontal axis represents a change of the radius from the point P.sub.S. The radius increases from the point P.sub.S to the point P.sub.H with the time, and thereafter decreases.
[0035] A blood flow is measured as a volumetric flow rate Q based on the radius r in accordance with the volume change of a blood vessel model. Therefore, the flow rate Q can be defined by using an average rate of change of the radius per unit time (.DELTA.r/.DELTA.t). .DELTA.t represents a time change amount of t, and .DELTA.r represents a change amount of the radius r for .DELTA.t.
[0036] FIG. 7A is a diagram schematically illustrating a flow rate Q.sub.SE from the point P.sub.S to the point P.sub.E. FIG. 7B is a diagram schematically illustrating a flow rate Q.sub.EH from the point P.sub.E to the point P.sub.H. The horizontal axis represents the square of an average rate of change (.DELTA.r/.DELTA.t), and the vertical axis represents a value obtained by multiplying the length L and n. An average rate of change m.sub.is is represented by Equation (8) described later. The average rate of change m.sub.is in FIG. 7A is a value obtained by dividing the radius r.sub.is from the point P.sub.S to the point P.sub.E by a value obtained by subtracting the time t, from the time t.sub.1. An average rate of change m.sub.id in FIG. 7B is a value obtained by dividing .DELTA.r.sub.id by a value obtained by subtracting the time t.sub.b from the time t.sub.2. Further, a flow rate Q.sub.EL (not illustrated) from the point P.sub.H to the point P.sub.L can be obtained by Equation (3) by using a time T.sub.id2 from the point P.sub.H to the point P.sub.L, the resistance R, compliance C of a blood vessel, and the flow rate Q.sub.EH. In Equation (3), the term of the Napier's constant is known as a method of representing a pressure drop after a systolic phase in a two-element Windkessel model.
Q.sub.EL=Q.sub.EHe.sup.-T.sup.id2.sup./RC
[0037] A displacement r(t) of a vascular wall, that is, a displacement of the radius r(t) is linked with a value of the pulse y.sub.i. Further, a pressure can be approximated by the displacement r(t) of the vascular wall, and the displacement of the radius r(t) is equivalent to the equation of viscoelastic motion represented by Equation (4). That is, in a case of approximating a blood vessel by a cylindrical tube, a blood pressure can be calculated based on information on the pulse y.sub.i.
d 2 r ( t ) dt 2 = - b dr ( t ) dt - kr ( t ) - F ( t ) ( 4 ) ##EQU00001##
[0038] Here, b is a viscosity constant, k is an elastic constant, and elasticity of a blood vessel is reflected on them. The left side in Equation (4) represents an entire force in the Newton's second law. The first term in the right side represents a damping force, the second term represents a restoring force, and the third term represents a force by the Windkessel effect. An equilibrium position of the displacement r(t) corresponds to the point P.sub.E.
[0039] In a systolic phase of the heart, a vascular wall is displaced mainly by the Windkessel effect from rising of the pulse y.sub.i to the point P.sub.E. Meanwhile, from the point P.sub.E to the point P.sub.H, the vascular wall is displaced by the damping force and the restoring force. At the point P.sub.H, the Windkessel effect and the damping force can be ignored.
[0040] Therefore, in the systolic phase of the heart, expansion of the radius r.sub.is to the point P.sub.E is caused mainly by the Windkessel effect. Accordingly, a force generated in the systolic phase of the heart, that is, a systolic blood pressure SBP is reflected on the flow rate Q.sub.SE. Meanwhile, a diastolic blood pressure DBP is reflected on the flow rate Q.sub.EL. Since the flow rate Q.sub.EL is a lower limit of the force by the Windkessel effect, it is obtained from the flow rate Q.sub.EH from the point P.sub.E to the point P.sub.H. The flow rate Q.sub.EH according to the present embodiment corresponds to a first value, the resistance R corresponds to a second value, and the flow rate Q.sub.SE corresponds to a third value.
[0041] Accordingly, in the present embodiment, a systolic blood pressure SBP.sub.i at a heartbeat i is modeled by Equation (5). R represents a value that reflects a peripheral circulation resistance in observation of flow rates Q.sub.SEi and Q.sub.ELi. Here, a and a are constants.
SBP.sub.i=aQ.sub.SE.sub.iR.sub.i+DBP.sub.i+.alpha. (5)
[0042] Further, a diastolic blood pressure DBP; is modeled by Equation (6).
DBP.sub.i+bQ.sub.EL.sub.iR.sub.i+.beta. (6)
[0043] Here, b and .beta. are constants. The constants a, .alpha., b, and .beta. can be calculated by the least squares method, for example, in such a manner that values of measurement by the blood-pressure measurement apparatus 1 and data measured by a medical instrument (for example, a wrist-cuff type) simultaneously with the measurement by the blood-pressure measurement apparatus 1 are coincident with each other. Once the constants a, .alpha., b, and .beta. are determined, calculation of the constants a, .alpha., b, and .beta. is not necessary in measurement performed later. A pulse pressure PP; is a value obtained by subtracting the diastolic blood pressure DBP.sub.i from the systolic blood pressure SBP.sub.i.
[0044] The model used by the blood-pressure acquirer 4 according to the present embodiment has been described above. The detailed configurations of the blood-pressure acquirer 4 are described below. FIG. 8 is a diagram illustrating an example of information acquired by the feature-point processor 42 from the pulse y.sub.i. The vertical axis represents a value of pulse and the horizontal axis represents a time.
[0045] The feature-point processor 42 detects to as a rising time and t.sub.2 as a time of the maximum peak. The feature-point processor 42 also calculates t.sub.1 between to and t.sub.2, at which a value obtained by the first-order differentiation of a pulse with respect to a time becomes the maximum.
[0046] Further, the feature-point processor 42 calculates a first difference value .DELTA.y.sub.is obtained by subtracting the direct-current component
y.sub.i
from a value of the pulse y.sub.i at the time t.sub.1 and a second difference value .DELTA.y.sub.ih obtained by subtracting the direct-current component
y.sub.i
from a value of the pulse y.sub.i at the time t.sub.2.
[0047] The feature-point processor 42 calculates a time T.sub.is by using Equation (7). Ti, is a time obtained by dividing the first difference value .DELTA.y.sub.is by tan .theta. corresponding to a differential value of the time t.sub.1. The second rising time t; obtained by subtracting T.sub.is from t.sub.1 is then calculated. T.sub.id1 is a time obtained by subtracting t from the time t.sub.2, and T.sub.id2 is a time obtained by subtracting t.sub.2 from the time t.sub.3.
T is = .DELTA. y is tan .theta. ( 7 ) ##EQU00002##
[0048] The shape of the pulse y.sub.i at the rising time t.sub.0 is highly different between individuals, and changes gently for some people and changes steeply for other people. Therefore, a difference value between the rising time t.sub.0 and the time t.sub.0 can easily fluctuate because of the difference between individuals. Meanwhile, in the time difference T.sub.is between the second rising time t.sub.s and the time t.sub.1, fluctuation because of the difference between individuals is reduced, so that the time difference T.sub.is has a stable value. Therefore, calculation of a flow rate uses this time difference T.sub.is. For a certain shape of the pulse y.sub.i, the time T.sub.is may be calculated as a time difference between the time t.sub.0 and the time t.sub.1. Accordingly, calculation can be simplified.
[0049] The blood-pressure calculator 44 acquires a diastolic blood pressure DBP based on the flow rate Q.sub.EH (the first value) corresponding to a blood flow of a subject from the first time t.sub.1 at which a value obtained by the first-order differentiation of the pulse y.sub.i with respect to a time becomes the maximum to the second time t.sub.2 of the maximum peak of the pulse, and the resistance R (the second value) corresponding to a vascular resistance of the subject, as represented by Equations (3) and (6). That is, the blood-pressure calculator 44 calculates a value obtained by multiplying a product of the flow rate Q.sub.EL based on the flow rate Q.sub.EH and the resistance R by a predetermined constant b and further adding a predetermined constant 13, as the diastolic blood pressure DBP. The resistance R is calculated based on Equations (14) and (15) described later. Further, this blood-pressure calculator 44 acquires a systolic blood pressure SBP further based on the flow rate Q.sub.SE (the third value) corresponding to a blood flow from the third time t.sub.s or to of rising of the pulse to the time t.sub.1 by using Equation (5). The first time according to the present embodiment corresponds to a first reference time, the second time corresponds to a fourth reference time, and the third time corresponds to a third reference time.
[0050] In more detail, the blood-pressure calculator 44 calculates r.sub.is based on Equation (8) and calculates the average rate of change m.sub.is based on Equation (9). The blood-pressure calculator 44 calculates the flow rate Q.sub.SE based on Equation (10). Here,
.DELTA.y.sub.is/y.sub.i
is proportional to a blood vessel volume at the point P.sub.E. In this manner, the blood-pressure calculator 44 acquires the systolic blood pressure SBP based on Equations (5) and (10). The first difference value .DELTA.y.sub.is of the pulse y.sub.i, the direct-current component
y.sub.i
and the time T, that are calculated at this time can be stably and simply calculated, also with respect to fluctuation of the pulse y.sub.i. Therefore, it is possible to acquire the systolic blood pressure SBP.sub.i simply and accurately. G is a constant.
r is = G L .DELTA. y is .pi. y _ i ( 8 ) m is ~ r is T is ( 9 ) Q SE = .pi. L ( m is ) 2 = .pi. L ( r is T is ) 2 = .pi. L G L .DELTA. y is .pi. y _ i ( T is ) 2 = G .DELTA. y is y _ i ( T is ) 2 ( 10 ) ##EQU00003##
[0051] The blood-pressure calculator 44 calculates .DELTA.r.sub.id based on Equation (11) and calculates the average rate of change m.sub.id based on Equation (12). The blood-pressure calculator 44 further calculates the flow rate Q.sub.EL from the point P.sub.H to the point P.sub.L based on Equation (2). In this manner, the blood-pressure calculator 44 acquires the diastolic blood pressure DBP.sub.i based on Equations (6) and (13). The first difference value .DELTA.y.sub.is, the second difference value .DELTA.y.sub.ih, the direct-current component
y.sub.i
and the times T.sub.is and T.sub.id that are calculated at this time can be stably and simply calculated, also with respect to fluctuation of the pulse y.sub.i. Therefore, it is possible to acquire the systolic blood pressure SBP.sub.E simply and accurately.
.DELTA. r id = G 4 L .DELTA. y ih - .DELTA. y is .DELTA. y is .DELTA. y is .pi. y _ i ( 11 ) m id = .DELTA. r id T id 1 ( 12 ) Q EH = .pi. L ( m id ) 2 = .pi. L ( .DELTA. r id T id 1 ) 2 = .pi. L ( G 4 L .DELTA. y i h - .DELTA. y is .DELTA. y i s .DELTA. y is .pi. y _ i T i d l ) 2 = G 4 ( .DELTA. y ih - .DELTA. y is .DELTA. y is ) 2 .DELTA. y is y _ i ( T id 1 ) 2 ( 13 ) ##EQU00004##
[0052] In this manner, the first value Q.sub.EL and the third value Q.sub.SE are values based on
.DELTA.y.sub.is/y.sub.i
corresponding to the blood vessel volume of a subject at the time t.sub.s. The blood vessel volume is a value based on a value obtained by dividing the first difference value .DELTA.y.sub.is by the direct-current component
y.sub.i
That is, the first value Q.sub.EL is a value based on a product of a value obtained by subtracting the first difference value .DELTA.y.sub.is from the second difference value .DELTA.y.sub.ih and dividing that result by the first difference value .DELTA.y.sub.is, and the square root of
.DELTA.y.sub.is/y.sub.i
corresponding to the blood vessel volume.
[0053] The blood-pressure calculator 44 calculates R.sub.i corresponding to a vascular resistance of the subject based on Equations (14) and (15).
R i = y _ i - .DELTA. y is y i ' ( 14 ) y i ' := max t 0 < t < t 2 y ( t + 1 / fs ) - y ( t ) 1 / fs ( 15 ) ##EQU00005##
Here, f.sub.s is a sampling frequency of the pulse y.sub.i.
[0054] FIG. 9A is a diagram illustrating measured data of a subject having a relatively high blood pressure. FIG. 9B is a diagram illustrating measured data of a subject having a relatively low blood pressure. The vertical axis represents a blood pressure and the horizontal axis represents a time. Rhombic marks represent values of measurement by the blood-pressure measurement apparatus 1, and solid lines represent data measured by a medical instrument (a wrist-cuff type) for comparison. The values measured by the blood-pressure measurement apparatus 1 according to the present embodiment well coincide with data measured for comparison in both cases.
[0055] FIG. 10 is a flowchart illustrating processing by the blood-pressure measurement apparatus 1. First, the measurer 2 acquires a pulse of a subject (Step S100). Subsequently, the feature-point processor 42 performs processing based on the pulse y.sub.i.
[0056] Next, the blood-pressure calculator 44 calculates the flow rate Q.sub.EL corresponding to a blood flow of the subject from a time at which a value obtained by the first-order differentiation of the pulse y.sub.i with respect to a time becomes the maximum to a time of the maximum peak of the pulse y.sub.i, the resistance R corresponding to a vascular resistance of the subject, and the flow rate Q.sub.SE corresponding to a blood flow from a rising time of the pulse to the time at which the value obtained by the first-order differentiation of the pulse with respect to the time becomes the maximum (Step S102).
[0057] Next, the blood-pressure calculator 44 calculates the diastolic blood pressure DBP, the systolic blood pressure SBP, and the pulse pressure PP based on the flow rate Q.sub.EL, the resistance R, and the flow rate Q.sub.SE (Step S104). The blood-pressure calculator 44 determines whether to end the overall processing (Step S106), ends the overall processing when the overall processing is determined to be ended (Step S106: YES), and repeats the processes from Step S100 when the overall processing is determined not to be ended (Step S106: NO).
[0058] As described above, the systolic blood pressure SBP.sub.i is acquired based on Equations (5) and (10) and the diastolic blood pressure DBP.sub.i is acquired based on Equations (6) and (13) in the present embodiment. Therefore, it is possible to simply and accurately detect a blood pressure.
Second Embodiment
[0059] While the blood-pressure measurement apparatus 1 according to the first embodiment calculates the systolic blood pressure SBP based on the flow rate Q.sub.SE (FIG. 6), the blood-pressure measurement apparatus 1 according to a second embodiment calculates the systolic blood pressure SBP also based on the flow rate Q.sub.EH. Further, the blood-pressure measurement apparatus 1 according to the first embodiment is different from the blood-pressure measurement apparatus 1 according to the second embodiment in that, while the blood-pressure measurement apparatus 1 according to the first embodiment calculates the diastolic blood pressure DBP based on the flow rate Q.sub.EH (FIG. 6), the blood-pressure measurement apparatus 1 according to the second embodiment calculates the diastolic blood pressure DBP based on a flow rate Q.sub.HD. In the following descriptions, different points from the first embodiment are described.
[0060] A blood pressure measured by the blood-pressure measurement apparatus 1 according to the first embodiment well coincides with a systolic blood pressure SBP and a diastolic blood pressure DBP of ordinary people. However, it has been found that there are some subjects who have different pulse characteristics from ordinary people. The blood-pressure measurement apparatus 1 according to the second embodiment is configured to be able to treat such subjects.
[0061] FIG. 11 is a diagram illustrating a relation between an example of a pulse waveform and a radius of a cylindrical tube model according to the second embodiment. The left part of FIG. 11 illustrates an example of a normal pulse waveform for one beat, similarly to FIG. 5. The vertical axis represents a value of pulse and the horizontal axis represents a time. The right part illustrates the radius of the cylindrical tube model. A change of a blood vessel volume is represented by a radius r.sub.si and a change .DELTA.r.sub.di. A point P.sub.D is a point between the point P.sub.H and the point P.sub.L, which has the same value of a blood volume pulse as the point P.sub.E. I.sub.dc is a direct-current component of the blood volume pulse. Here, the suffix i is the number for identifying each pulse in blood volume pulse data. That is, the suffix i indicates data corresponding to a pulse at the i-th beat. A time of the point P.sub.0 corresponds to a fifth reference time.
[0062] FIG. 12 is a diagram schematically illustrating a change of a radius of a cylindrical tube which is associated with a change of a blood vessel volume from the point P.sub.S to the point P.sub.L. That is, FIG. 12 illustrates the change of the radius of the cylindrical tube in association with a pulse for one beat. The vertical axis represents a time and the horizontal axis represents a change of the radius from the point P.sub.S. The radius increases from the point P.sub.S to the point P.sub.H with the time, and thereafter decreases.
[0063] FIG. 13A is a diagram schematically illustrating a flow rate Q.sub.S from the point P.sub.S to the point P.sub.H via the point P.sub.E. FIG. 13B is a diagram schematically illustrating a flow rate Q.sub.HD from the point P.sub.H to a point P.sub.D. The horizontal axis represents the square of an average rate of change of the radius r of a blood vessel (.DELTA.r/.DELTA.t), and the vertical axis represents a value obtained by multiplying the length L and n. m.sub.si in FIG. 13A is an average rate of change of a radius from the point P.sub.S to the point P.sub.E, and m.sub.d1i is an average rate of change of the radius from the point P.sub.E to the point P.sub.H. m.sub.d2i in FIG. 13B is an average rate of change of the radius from the point P.sub.H to the point P.sub.D. The flow rate Q.sub.HD according to the present embodiment corresponds to the first value, the resistance R corresponds to the second value, and the flow rate Q.sub.S corresponds to the third value.
[0064] In the present embodiment, the systolic blood pressure SBP is calculated by using the flow rate Q.sub.S. Expansion of a blood vessel diameter to the point P.sub.E in a systolic phase of the heart is mainly caused by the Windkessel effect. After the point P.sub.E, a restoring force and a damping force become dominant gradually. That is, in the present embodiment, a range of a force generated in the systolic phase of the heart is expanded up to the flow rate Q.sub.SE from the point P.sub.E at which the restoring force is added to the Windkessel effect to the point P.sub.H, and the systolic blood pressure SBP is modeled. It is considered that there are some subjects for which the Windkessel effect appears more strongly also in the range from the point P.sub.E to the point P.sub.H. In a case of performing measurement also for such people, use of the flow rate Q.sub.S can improve the measurement accuracy of the systolic blood pressure SBP. It is experimentally verified that, even if the flow rate Q.sub.S is used, the accuracy of the systolic blood pressure SBP of ordinary people is not lowered.
[0065] Meanwhile, it is considered that, for the people for which the Windkessel effect appears more strongly in the range from the point P.sub.E to the point P.sub.H, a point at which the Windkessel effect becomes weak is shifted toward the point P.sub.L. Since a diastolic blood pressure is a lower limit of a force by the Windkessel effect, the point at which the Windkessel effect becomes weak is shifted up to the point P.sub.H and the diastolic blood pressure DBP is modeled by using a flow rate Q.sub.D in the range from the point P.sub.H to the point P.sub.D. In particular, the flow rate Q.sub.D is calculated based on the flow rate Q.sub.HD. It is experimentally verified that, even if the flow rate Q.sub.HD is used, the accuracy of the diastolic blood pressure DBP of ordinary people is not also lowered.
[0066] The model used by the blood-pressure acquirer 4 according to the present embodiment has been described above. An example of detailed processing by the blood-pressure acquirer 4 is described below.
[0067] FIG. 14 is a diagram illustrating an example of information acquired from the pulse y.sub.i by the feature-point processor 42 according to the second embodiment. The vertical axis represents a value of pulse and the horizontal axis represents a time. The right part of FIG. 14 illustrates a radius of a cylindrical tube model. A change of a blood vessel volume is represented by the radius r.sub.si and the change .DELTA.r.sub.di.
[0068] The feature-point processor 42 calculates the first difference value .DELTA.y.sub.si obtained by subtracting the direct-current component I.sub.dc from a value of the pulse y.sub.i at the time t.sub.1 and the second difference value .DELTA.y.sub.hi obtained by subtracting the direct-current component I.sub.dc from a value of the pulse y.sub.i at the time t.sub.2.
[0069] Further, the feature-point processor 42 calculates a time T.sub.d2i by using Equation (16). T.sub.d2i is a time between the point P.sub.D and the point PH. T.sub.si is a time obtained by subtracting to from the time t.sub.1, T.sub.d1i is a time obtained by subtracting t.sub.1 from the time t.sub.2, and T.sub.d3i is a time obtained by subtracting t.sub.2 from the time t.sub.3. That is, the feature-point processor 42 acquires a time of the point P.sub.D which has an equivalent value to the pulse y.sub.i at the time t.sub.1 in a time period from the time t.sub.2 of the pulse y.sub.i to the time t.sub.3 as the fifth reference time, and calculates a time between the time t.sub.2 and the fifth reference time as the time T.sub.d2i.
T d 2 i ~ T d 3 i .DELTA. y hi - .DELTA. y si .DELTA. y hi ( 16 ) ##EQU00006##
[0070] When a volume corresponding to the point P.sub.L is assumed as a reference, .DELTA.y.sub.si/I.sub.dc is proportional to a volume at the points P.sub.E and P.sub.D, and similarly .DELTA.y.sub.hi/I.sub.dc is proportional to a volume at the point P.sub.H. G is a proportional constant, and I.sub.dc is a value of a DC component of a pulse.
[0071] When the radius of the cylindrical tube changes from r.sub.si to r.sub.si+.DELTA.r.sub.di, .DELTA.r.sub.di can be calculated by Equations (17) to (19) by using the radius r.sub.si at the point P.sub.E,
V i = G .DELTA. y si / I d c ( 17 ) .DELTA. V i = G .DELTA. y h i I d c - V i ( 18 ) .DELTA. r di = T r i 2 .DELTA. V i V i ( 19 ) ##EQU00007##
[0072] Here, when the radius r.sub.si in Equation (19) is arranged by using Equation (17), it can be deformed to Equations (20) and (21) described below. The blood-pressure calculator 44 calculates the radius r.sub.si and .DELTA.r.sub.di by using Equations (20) and (21). L is the length of the cylindrical tube model.
r si = G L .DELTA. y si .pi. I d c ( 20 ) .DELTA. r di = 1 2 .DELTA. y hi - .DELTA. y s i .DELTA. y si G L .DELTA. y s i .pi. I di ( 21 ) ##EQU00008##
[0073] The blood-pressure calculator 44 calculates the average rate of change ms by using Equation (22).
m si = r si T si ( 22 ) ##EQU00009##
The blood-pressure calculator 44 also calculates the average rates of change m.sub.d1i and m.sub.d2i by using Equations (23) and (24), respectively.
m d 1 i = .DELTA. r di T d 1 i ( 23 ) m d 2 i = .DELTA. r di T d 2 i ( 24 ) ##EQU00010##
[0074] The blood-pressure calculator 44 calculates a flow rate Q.sub.si based on the average rates of change m.sub.d1i and m.sub.d2i by using Equation (25).
{square root over (Q.sub.si)}=.pi.L(m.sub.si+m.sub.di).sup.2 (25)
[0075] The blood-pressure calculator 44 calculates the resistance R.sub.i by using Equation (26). Here, V.sub.i is a volume of the cylindrical tube model, and V.sub.i(t.sub.1) is a volume of the cylindrical tube model at the time t.sub.1. That is, I.sub.dc corresponds to in the first embodiment. Accordingly, Equation (26) has an equivalent value to Equation (16).
? = ? ? indicates text missing or illegible when filed ( 26 ) ##EQU00011##
[0076] The blood-pressure calculator 44 calculates the flow rate Q.sub.Di from the point P.sub.H to the point P.sub.L based on Equation (27) by using the resistance R.sub.i and the compliance C.
Q Di = Q HDi e - T d 3 i / R di C = .pi. L ( m d 2 i ) 2 e - T d 3 i / R di C = G ( .DELTA. y hi - .DELTA. y si ) 2 4 I d c .DELTA. y si ( T d 2 i ) 2 e - T d 3 i / R di C ( 27 ) ##EQU00012##
The blood-pressure calculator 44 calculates R.sub.di corresponding to a vascular resistance of the subject based on Equations (28) and (29).
y di ' = y i ( t 2 + T d 2 i + i / f s ) - y i ( t 2 + T d 2 i ) 1 / fs ( 28 ) R d i = y di ' y i ' ( 29 ) ##EQU00013##
[0077] The blood-pressure calculator 44 calculates the diastolic blood pressure DBP and the systolic blood pressure SBP at each i-th heartbeat based on Equations (30) and (31).
ln DBP.sub.i=a.sub.1 ln Q.sub.Di+a.sub.2 ln R.sub.di+.alpha. (30)
ln SBP.sub.i=b.sub.1 ln Q.sub.Si+b.sub.2 ln R.sub.di+.beta.+ln DBP.sub.i (31)
Here, a.sub.1, a.sub.2, b.sub.1, b.sub.2 .alpha., and .beta. are constants.
[0078] As described above, the blood-pressure calculator 44 acquires the diastolic blood pressure DBP based on the flow rate Q.sub.HD (the first value) corresponding to a blood flow of a subject in the time period T.sub.d2i (a first time period) in a time period from the first time t.sub.1 at which a value obtained by the first-order differentiation of the pulse y.sub.i with respect to a time becomes the maximum to a fourth time t.sub.3 at which a next pulse rises, and Rd.sub.i (the second value) corresponding to a vascular resistance of the subject. Further, the blood-pressure calculator 44 acquires the systolic blood pressure further based on the flow rate Q.sub.S (the third value) corresponding to a blood flow of the subject in a time period (T.sub.si+T.sub.d1i) (a second time period) in a time period from the third time t.sub.0 at which the pulse rises to the second time t.sub.2 of the maximum peak of the pulse. The first time according to the present embodiment corresponds to the first reference time, the second time corresponds to the fourth reference time, the third time corresponds to the third reference time, and the fourth time corresponds to a second reference time.
[0079] As described above, the diastolic blood pressure DBP.sub.i is acquired based on Equations (27) and (30) and the systolic blood pressure SBP.sub.i is acquired based on Equations (25) and (31) in the present embodiment. Therefore, it is possible to simply and accurately detect a blood pressure.
[0080] At least a part of the blood-pressure measurement apparatus 1 may be constituted by hardware or software. When the apparatus is constituted by software, it is possible to configure that a program for realizing at least a part of the functions of the blood-pressure measurement apparatus 1 is held in a recording medium such as a flexible disk or a CD-ROM and a computer is caused to read and execute the program. The recording medium is not limited to a detachable one such as a magnetic disk or an optical disk, and a stationary recording medium such as a hard disk device or a memory may be also applicable.
[0081] Further, the program for realizing at least a part of the functions of the blood-pressure measurement apparatus 1 may be distributed via a communication line (including wireless communication) such as the Internet. Furthermore, the program may be distributed via a wired line or a wireless line such as the Internet or distributed while being held in a recording medium, in a state where the program is encrypted, modulated, or compressed.
[0082] While certain embodiments have been described, these embodiments have been presented by way of example only, and are not intended to limit the scope of the inventions. Indeed, the novel methods and systems described herein may be embodied in a variety of other forms; furthermore, various omissions, substitutions and changes in the form of the methods and systems described herein may be made without departing from the spirit of the inventions. The accompanying claims and their equivalents are intended to cover such forms or modifications as would fall within the scope and spirit of the inventions.
* * * * *
D00000
D00001
D00002
D00003
D00004
D00005
D00006
D00007
D00008
D00009
D00010


XML
uspto.report is an independent third-party trademark research tool that is not affiliated, endorsed, or sponsored by the United States Patent and Trademark Office (USPTO) or any other governmental organization. The information provided by uspto.report is based on publicly available data at the time of writing and is intended for informational purposes only.
While we strive to provide accurate and up-to-date information, we do not guarantee the accuracy, completeness, reliability, or suitability of the information displayed on this site. The use of this site is at your own risk. Any reliance you place on such information is therefore strictly at your own risk.
All official trademark data, including owner information, should be verified by visiting the official USPTO website at www.uspto.gov. This site is not intended to replace professional legal advice and should not be used as a substitute for consulting with a legal professional who is knowledgeable about trademark law.