Methods Of Reducing Or Preventing Oxidative Modification Of Membrane Polyunsaturated Fatty Acids
Mason; Richard Preston
U.S. patent application number 16/846762 was filed with the patent office on 2020-07-30 for methods of reducing or preventing oxidative modification of membrane polyunsaturated fatty acids. The applicant listed for this patent is Amarin Pharmaceuticals Ireland Limited. Invention is credited to Richard Preston Mason.
| Application Number | 20200237699 16/846762 |
| Document ID | 20200237699 / US20200237699 |
| Family ID | 1000004754043 |
| Filed Date | 2020-07-30 |
| Patent Application | download [pdf] |


View All Diagrams
| United States Patent Application | 20200237699 |
| Kind Code | A1 |
| Mason; Richard Preston | July 30, 2020 |
METHODS OF REDUCING OR PREVENTING OXIDATIVE MODIFICATION OF MEMBRANE POLYUNSATURATED FATTY ACIDS
Abstract
In various embodiments, the present invention provides methods of treating and/or preventing cardiovascular-related disease and, in particular, a method of reducing or preventing membrane cholesterol domain formation in a subject, the method comprising administering to a subject in need thereof a pharmaceutical composition comprising eicosapentaenoic acid or a derivative thereof.
| Inventors: | Mason; Richard Preston; (Bridgewater, NJ) | ||||||||||
| Applicant: |
|
||||||||||
|---|---|---|---|---|---|---|---|---|---|---|---|
| Family ID: | 1000004754043 | ||||||||||
| Appl. No.: | 16/846762 | ||||||||||
| Filed: | April 13, 2020 |
Related U.S. Patent Documents
| Application Number | Filing Date | Patent Number | ||
|---|---|---|---|---|
| 14193531 | Feb 28, 2014 | |||
| 16846762 | ||||
| 61771423 | Mar 1, 2013 | |||
| 61928826 | Jan 17, 2014 | |||
| Current U.S. Class: | 1/1 |
| Current CPC Class: | A61K 31/202 20130101 |
| International Class: | A61K 31/202 20060101 A61K031/202 |
Claims
1. (canceled)
2. (canceled)
3. (canceled)
4. (canceled)
5. (canceled)
6. (canceled)
7. (canceled)
8. A method of reducing or preventing oxidative modification of membrane polyunsaturated fatty acids in a subject, the method comprising administering to the subject a pharmaceutical composition comprising eicosapentaenoic acid or a derivative thereof.
9. The method of claim 8, wherein the pharmaceutical composition comprises at least 90%, by weight of all fatty acids (and/or derivatives thereof) present, eicosapentaenoic acid or a derivative thereof.
10. The method of claim 8, wherein the pharmaceutical composition comprises no more than about 20%, no more than about 10%, no more than about 5%, or no more than about 3%, by weight of all fatty acids (and/or derivatives thereof) present, docosahexaenoic acid or esters thereof.
11. The method of claim 8, wherein the pharmaceutical composition comprises no docosahexaenoic acid or esters thereof.
12. The method of claim 8, wherein the reduction or prevention occurs by a free radical chain-breaking mechanism.
13. The method of claim 8 further comprising a step of measuring oxidative modification of membrane polyunsaturated fatty acids in the subject prior to administering to the subject the pharmaceutical composition comprising eicosapentaenoic acid or a derivative thereof.
14. The method of claim 13 further comprising a step of measuring oxidative modification of membrane polyunsaturated fatty acids in the subject after administering to the subject the pharmaceutical composition comprising eicosapentaenoic acid or a derivative thereof and determining a reduction in or absence of an increase in oxidative modification of membrane polyunsaturated fatty acids in the subject.
15. The method of claim 8, wherein the subject is diabetic.
16. The method of claim 8, wherein the pharmaceutical composition comprises at least 95%, by weight of all fatty acids (and/or derivatives thereof) present, eicosapentaenoic acid or a derivative thereof.
17. The method of claim 8, wherein the pharmaceutical composition comprises at least 96%, by weight of all fatty acids and/or derivatives thereof present, eicosapentaenoic acid or a derivative thereof.
Description
PRIORITY CLAIM
[0001] This application is a divisional of U.S. patent application Ser. No. 14/193,531 filed Feb. 28, 2014, which claims priority to U.S. provisional Patent Application No. 61/771,423, filed on Mar. 1, 2013, and U.S. provisional Patent Application No. 61/928,826, filed on Jan. 17, 2014, the entire contents of each of which are incorporated herein by reference and relied upon.
BACKGROUND
[0002] Cardiovascular disease is one of the leading causes of death in the United States and most European countries. It is estimated that over 70 million people in the United States alone suffer from a cardiovascular disease or disorder including but not limited to high blood pressure, coronary heart disease, dyslipidemia, congestive heart failure and stroke. A need exists for improved treatments for cardiovascular diseases and disorders.
SUMMARY
[0003] In one embodiment, the present invention provides a method of reducing or preventing membrane cholesterol domain formation in a subject, the method comprising administering to the subject a pharmaceutical composition comprising eicosapentaenoic acid or a derivative thereof.
[0004] In another embodiment, the present invention provides a method of reducing or preventing oxidative modification of membrane polyunsaturated fatty acids in a subject, the method comprising administering to the subject a pharmaceutical composition comprising eicosapentaenoic acid or a derivative thereof.
[0005] These and other embodiments of the present invention will be disclosed in further detail herein below.
BRIEF DESCRIPTION OF THE FIGURES
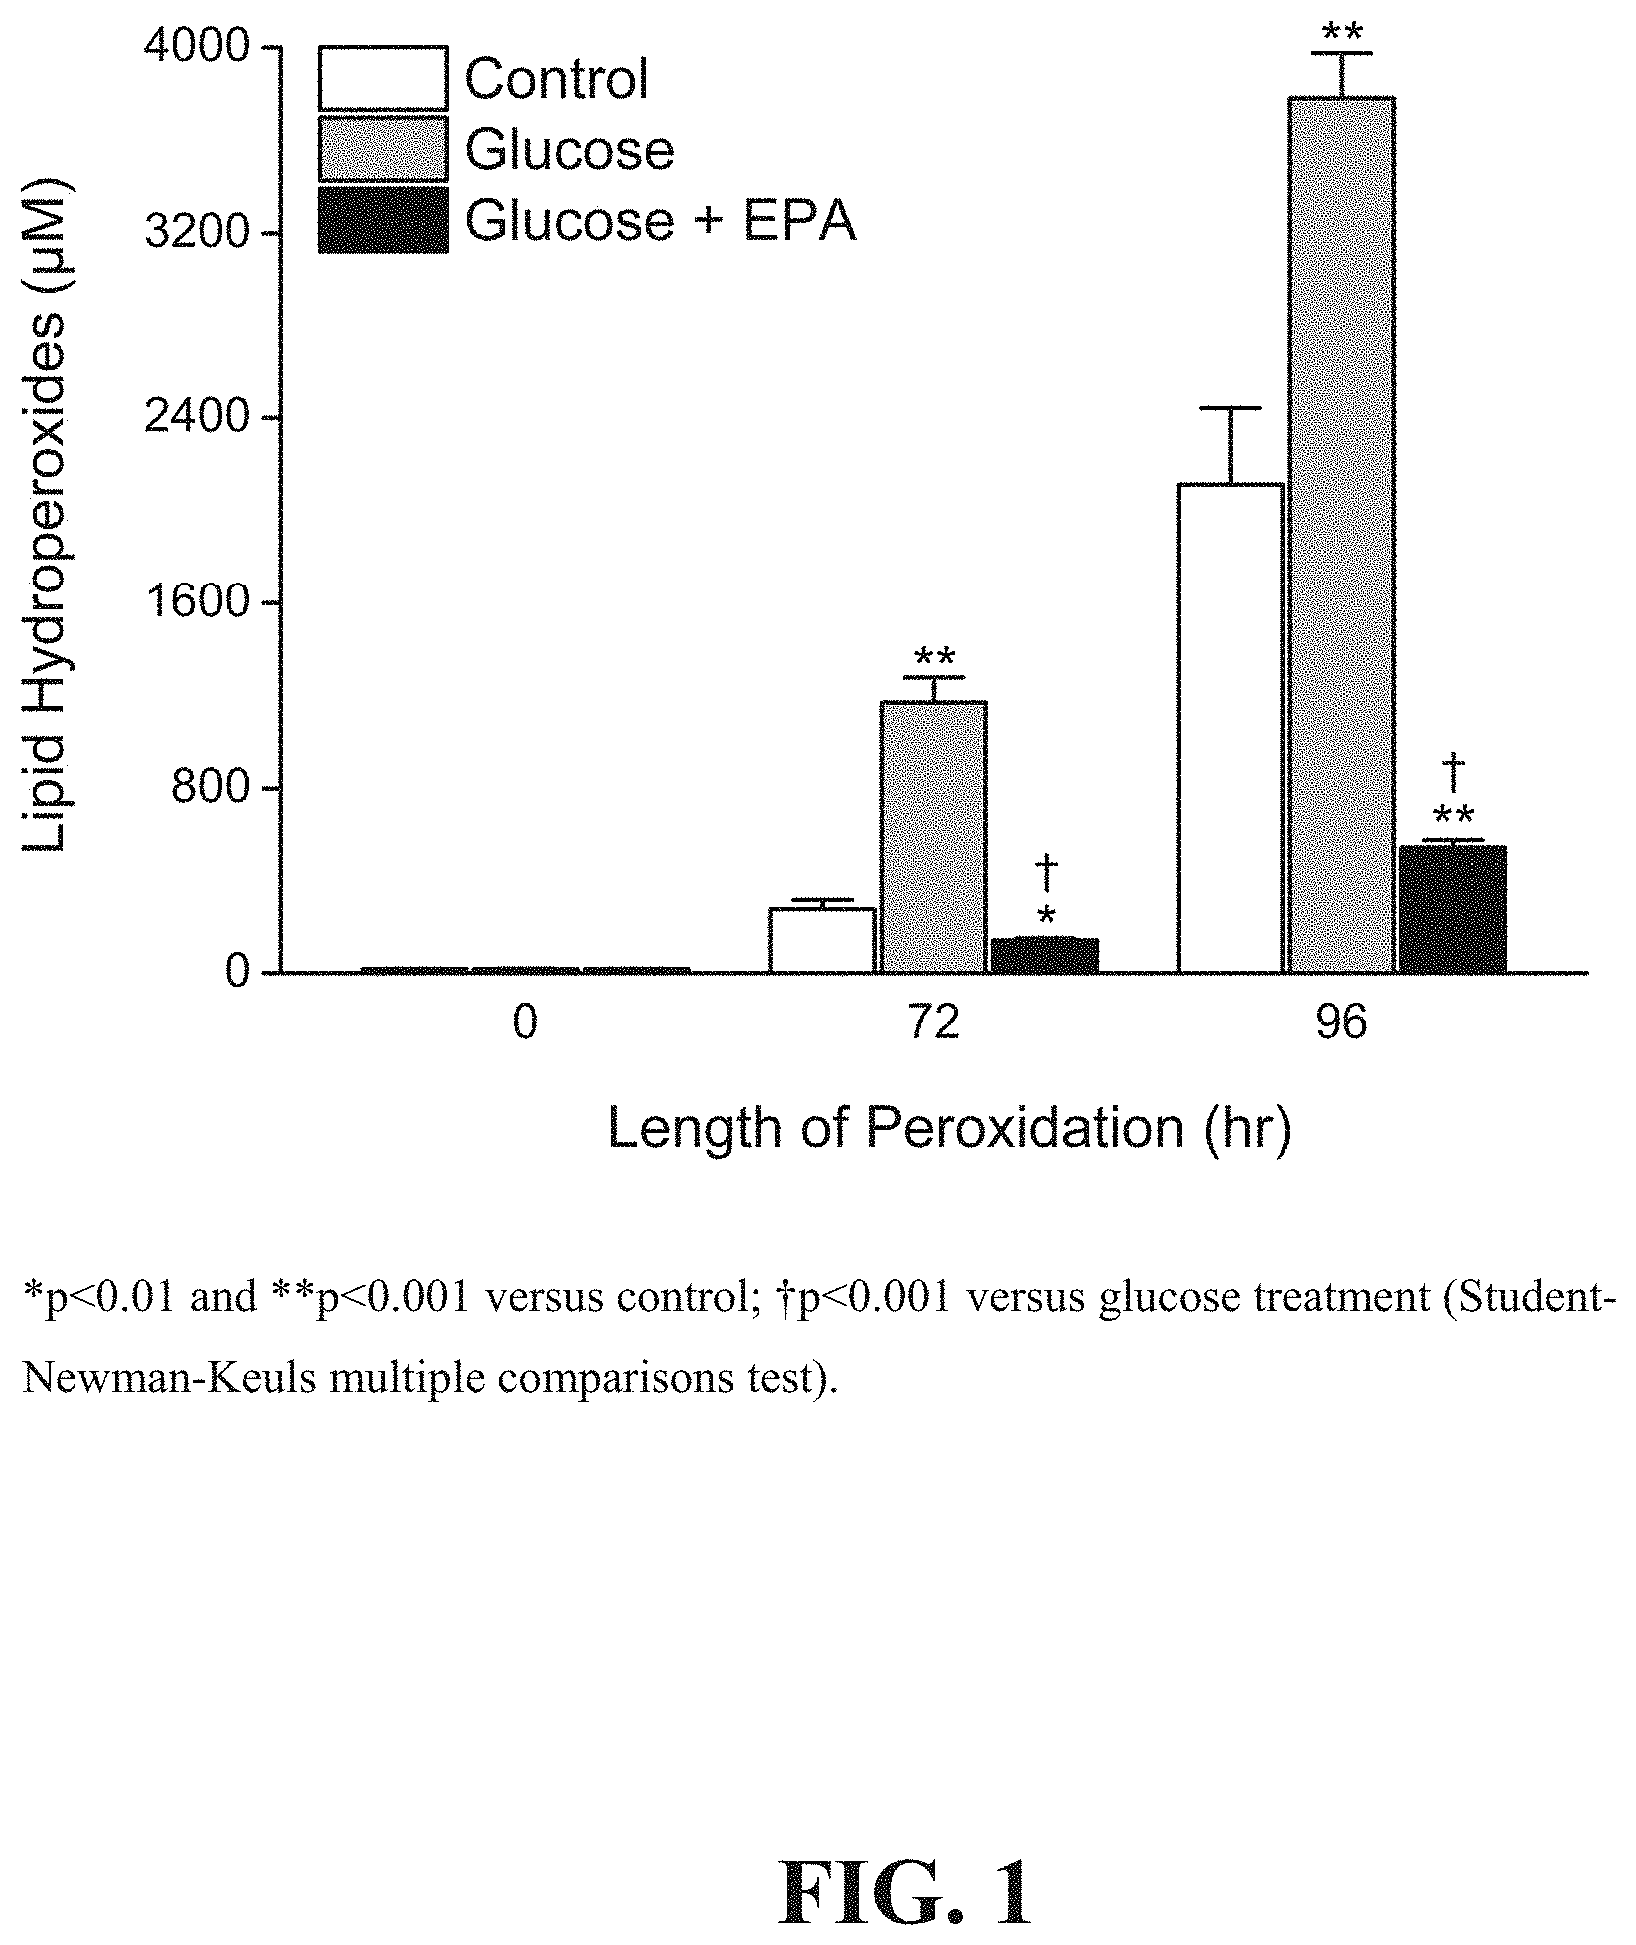
[0006] FIG. 1 depicts the effects of ethyl eicosapentaenoate ("EPA") on glucose-induces membrane lipid peroxidation from 0-96 hours compared to glucose or vehicle control.
[0007] FIG. 2 depicts dose-dependent effects of EPA on glucose-induced membrane lipid peroxidation in model membranes.
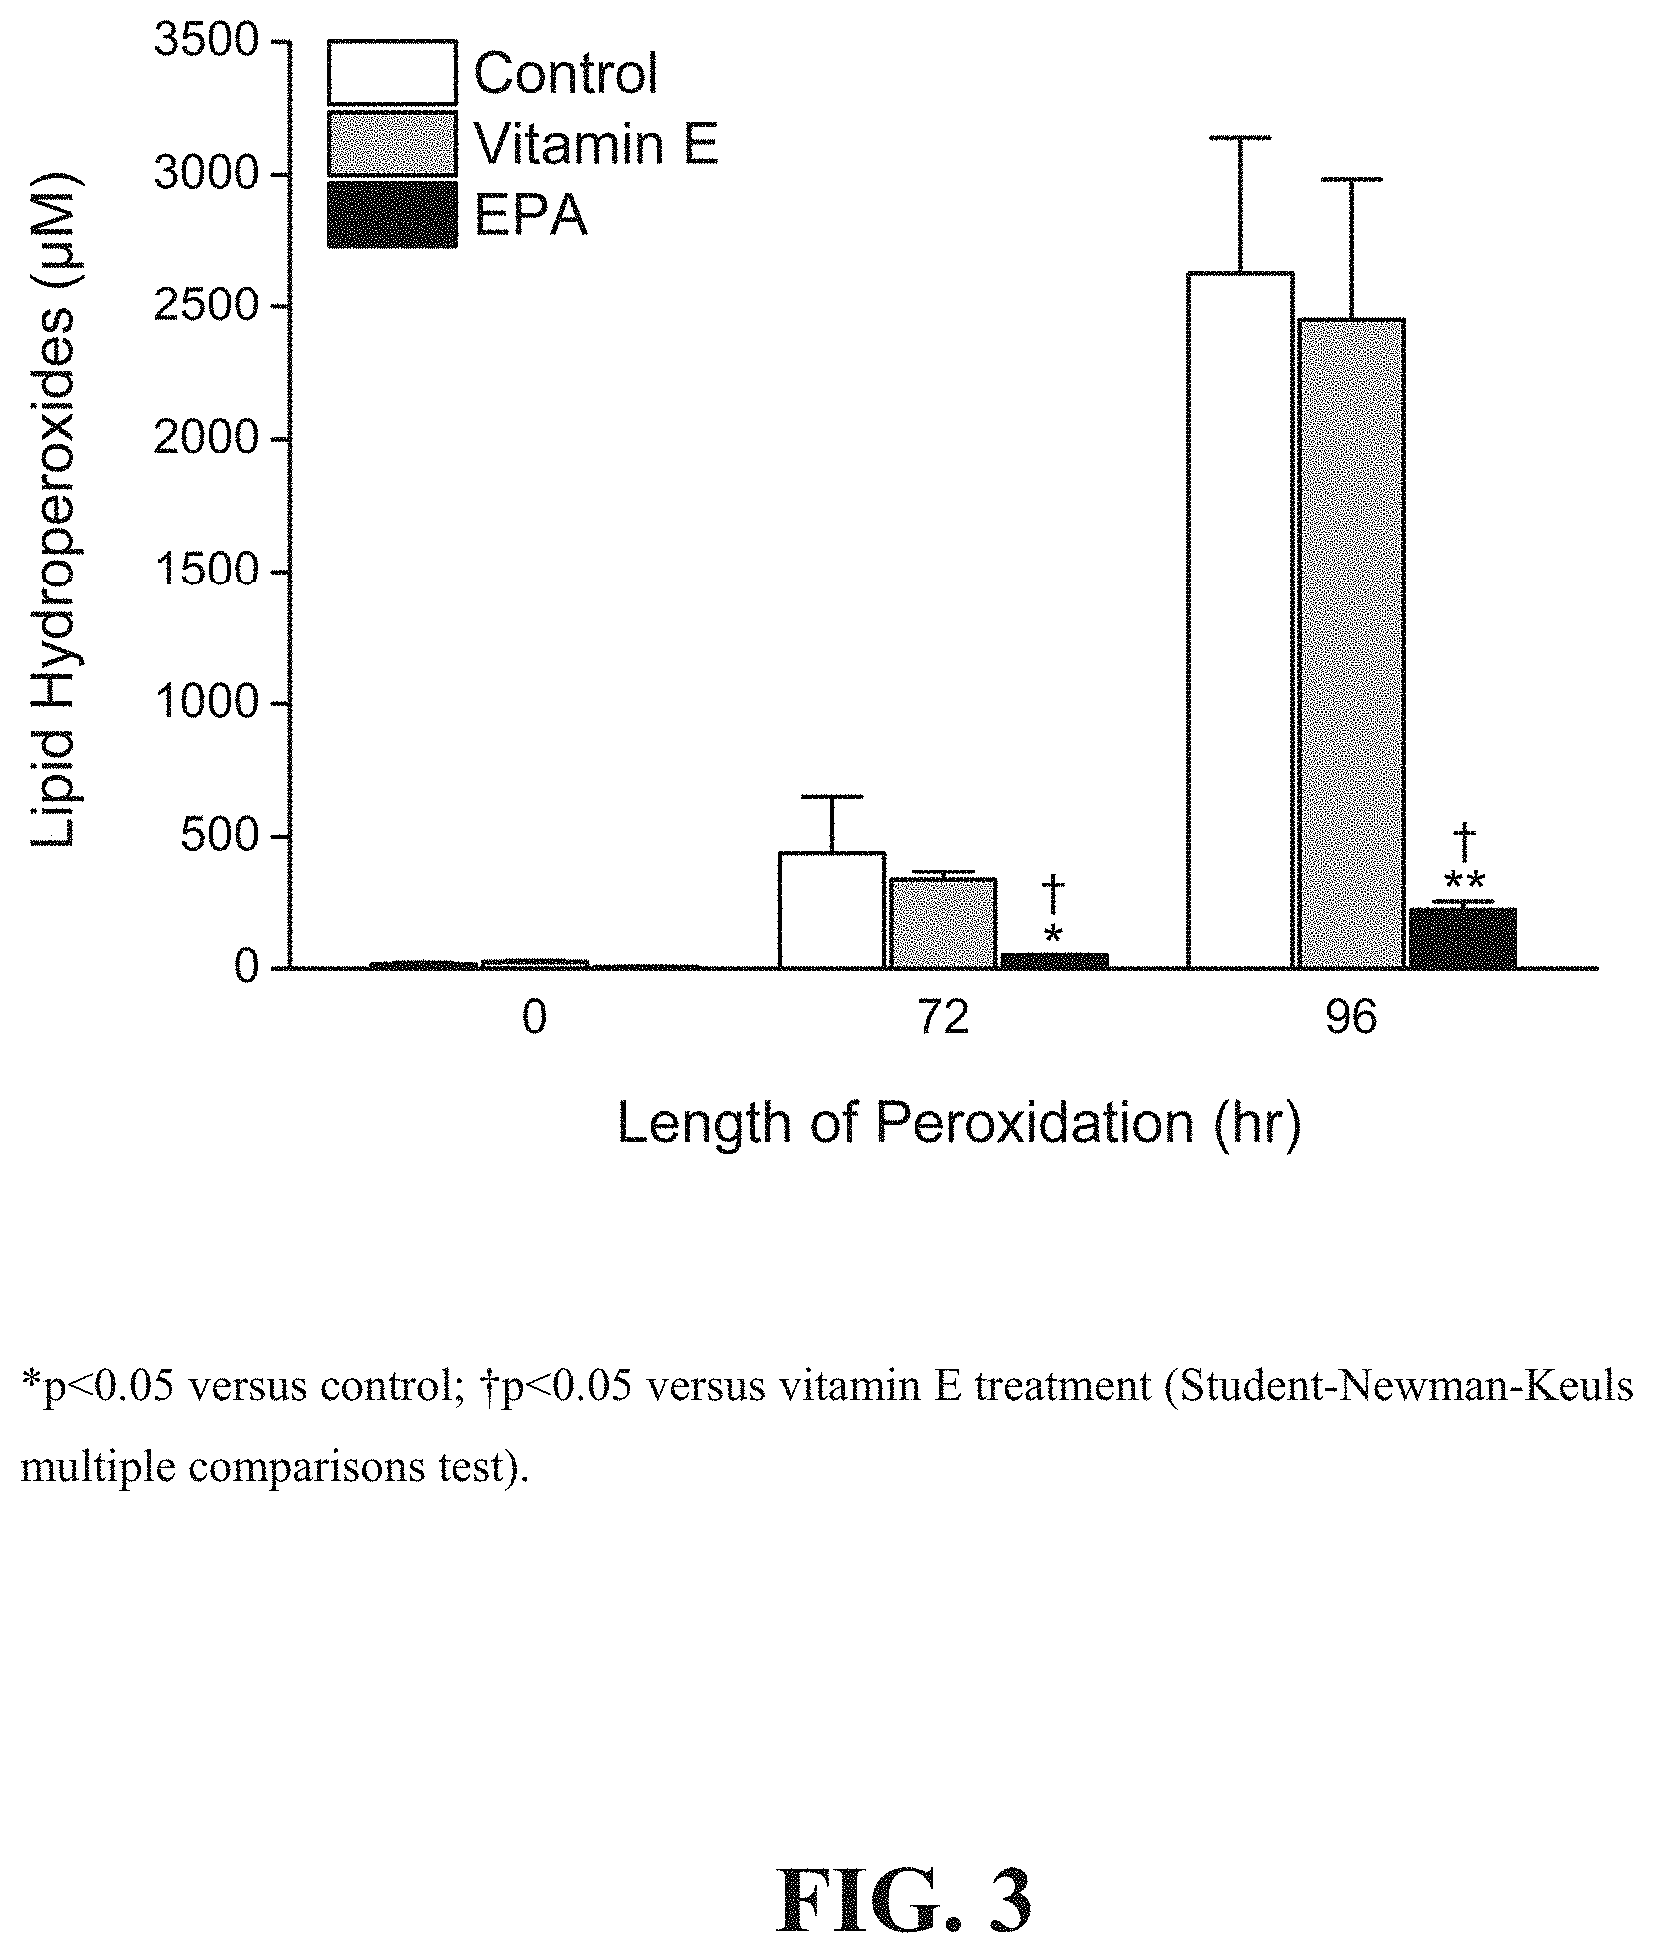
[0008] FIG. 3 shows a comparison of the effects of vitamin E and EPA on glucose-induced membrane lipid peroxidation in model membranes.
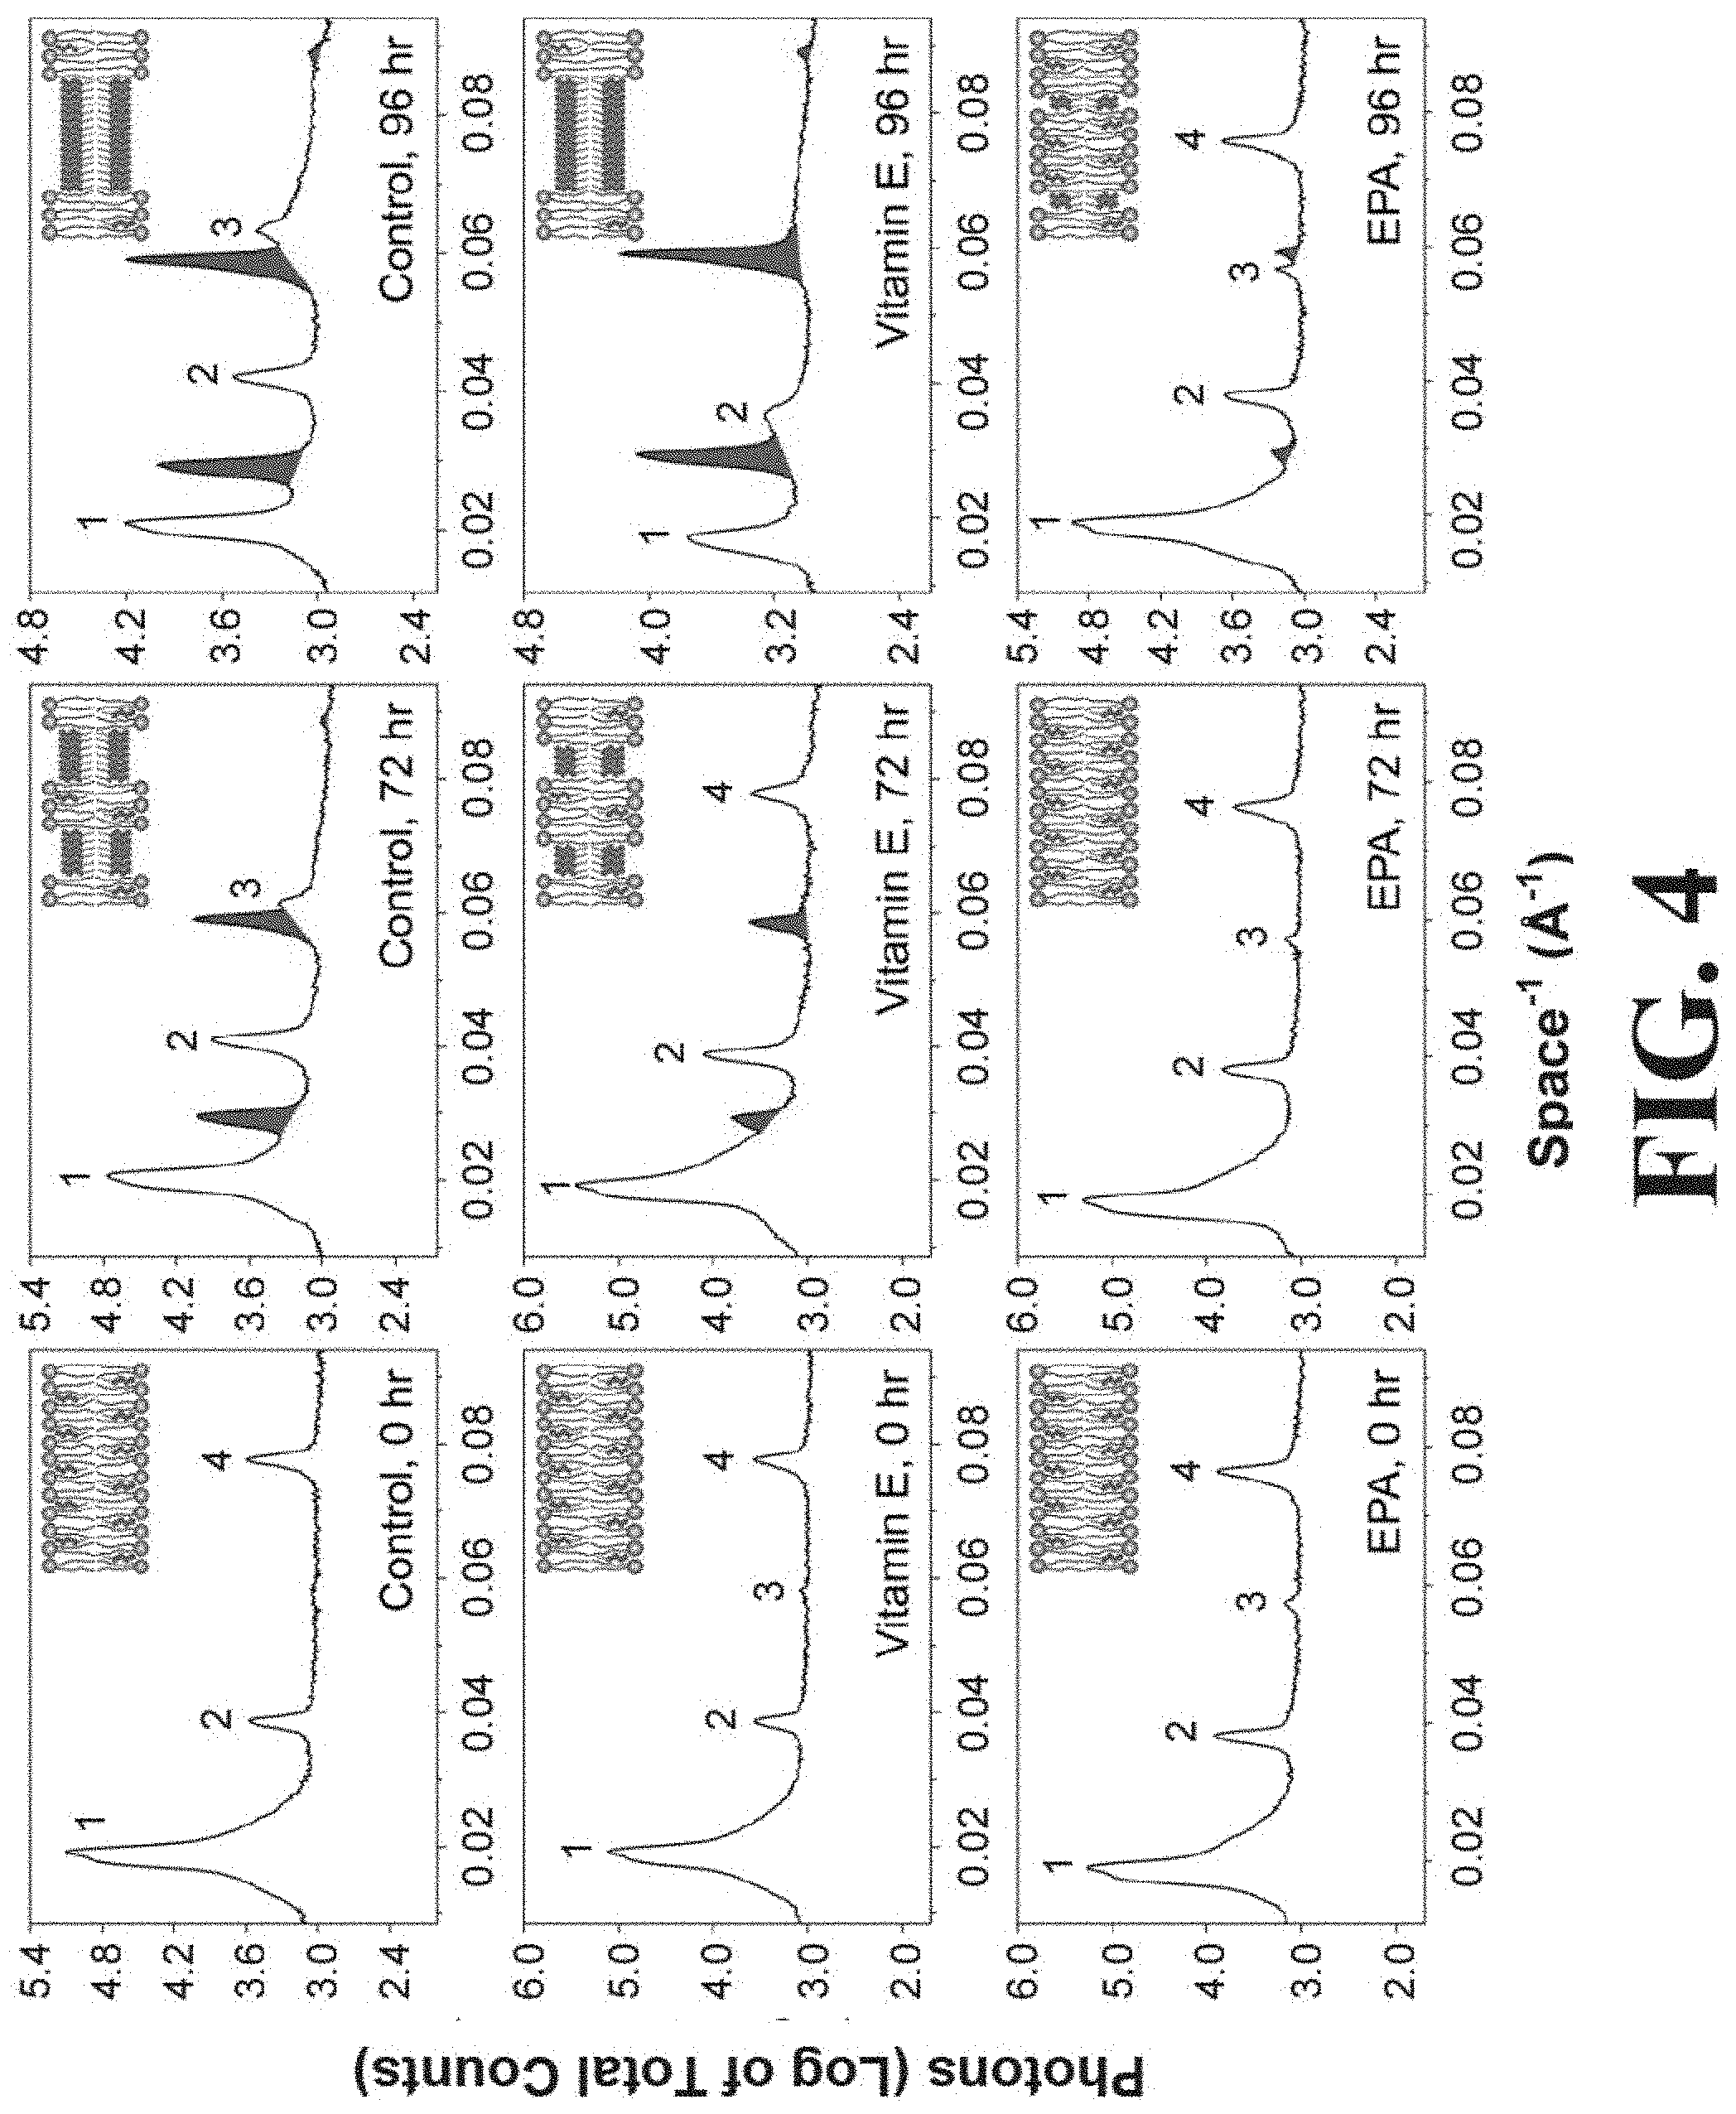
[0009] FIG. 4 shows representative X-ray diffraction patterns for model membranes prepared in the presence of glucose and treated with vehicle control (top row), vitamin E (middle row), or EPA (bottom row) at 0 hours (left column), 72 hours (middle column) and 96 hours (right column).
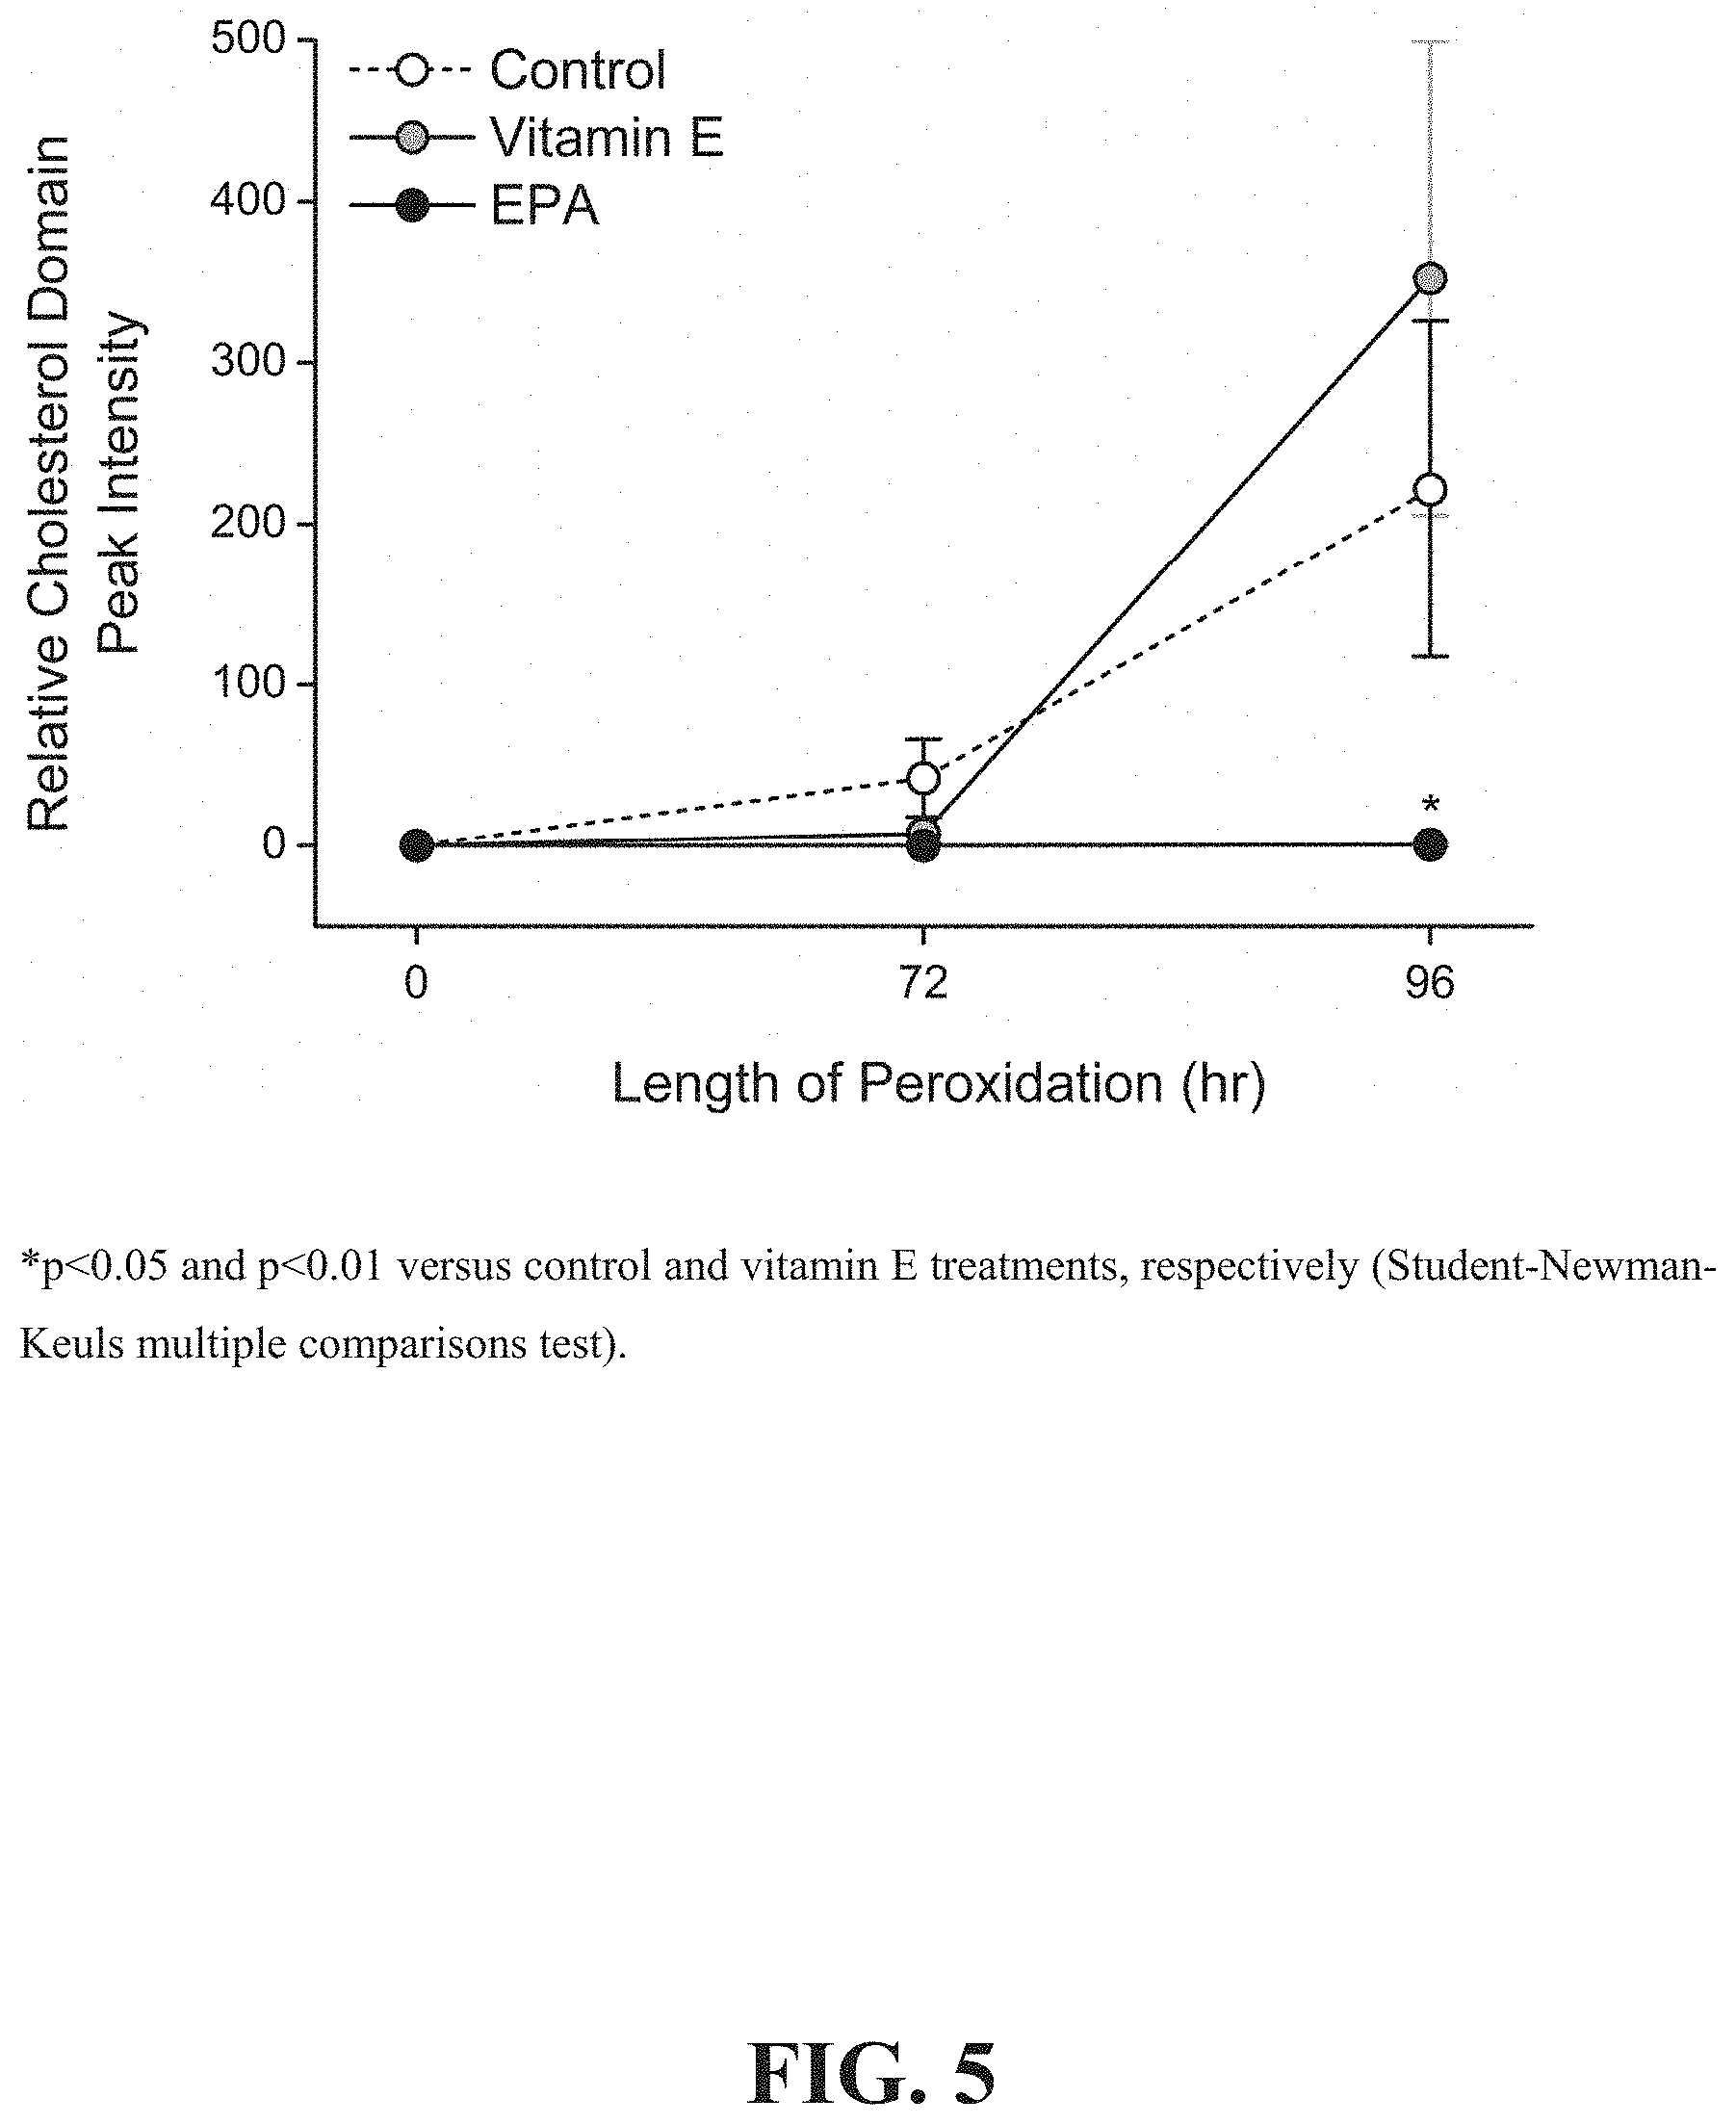
[0010] FIG. 5 depicts the quantitative assessment of the comparative effects of vitamin E and EPA on glucose- and peroxidation-induced cholesterol domain formation.
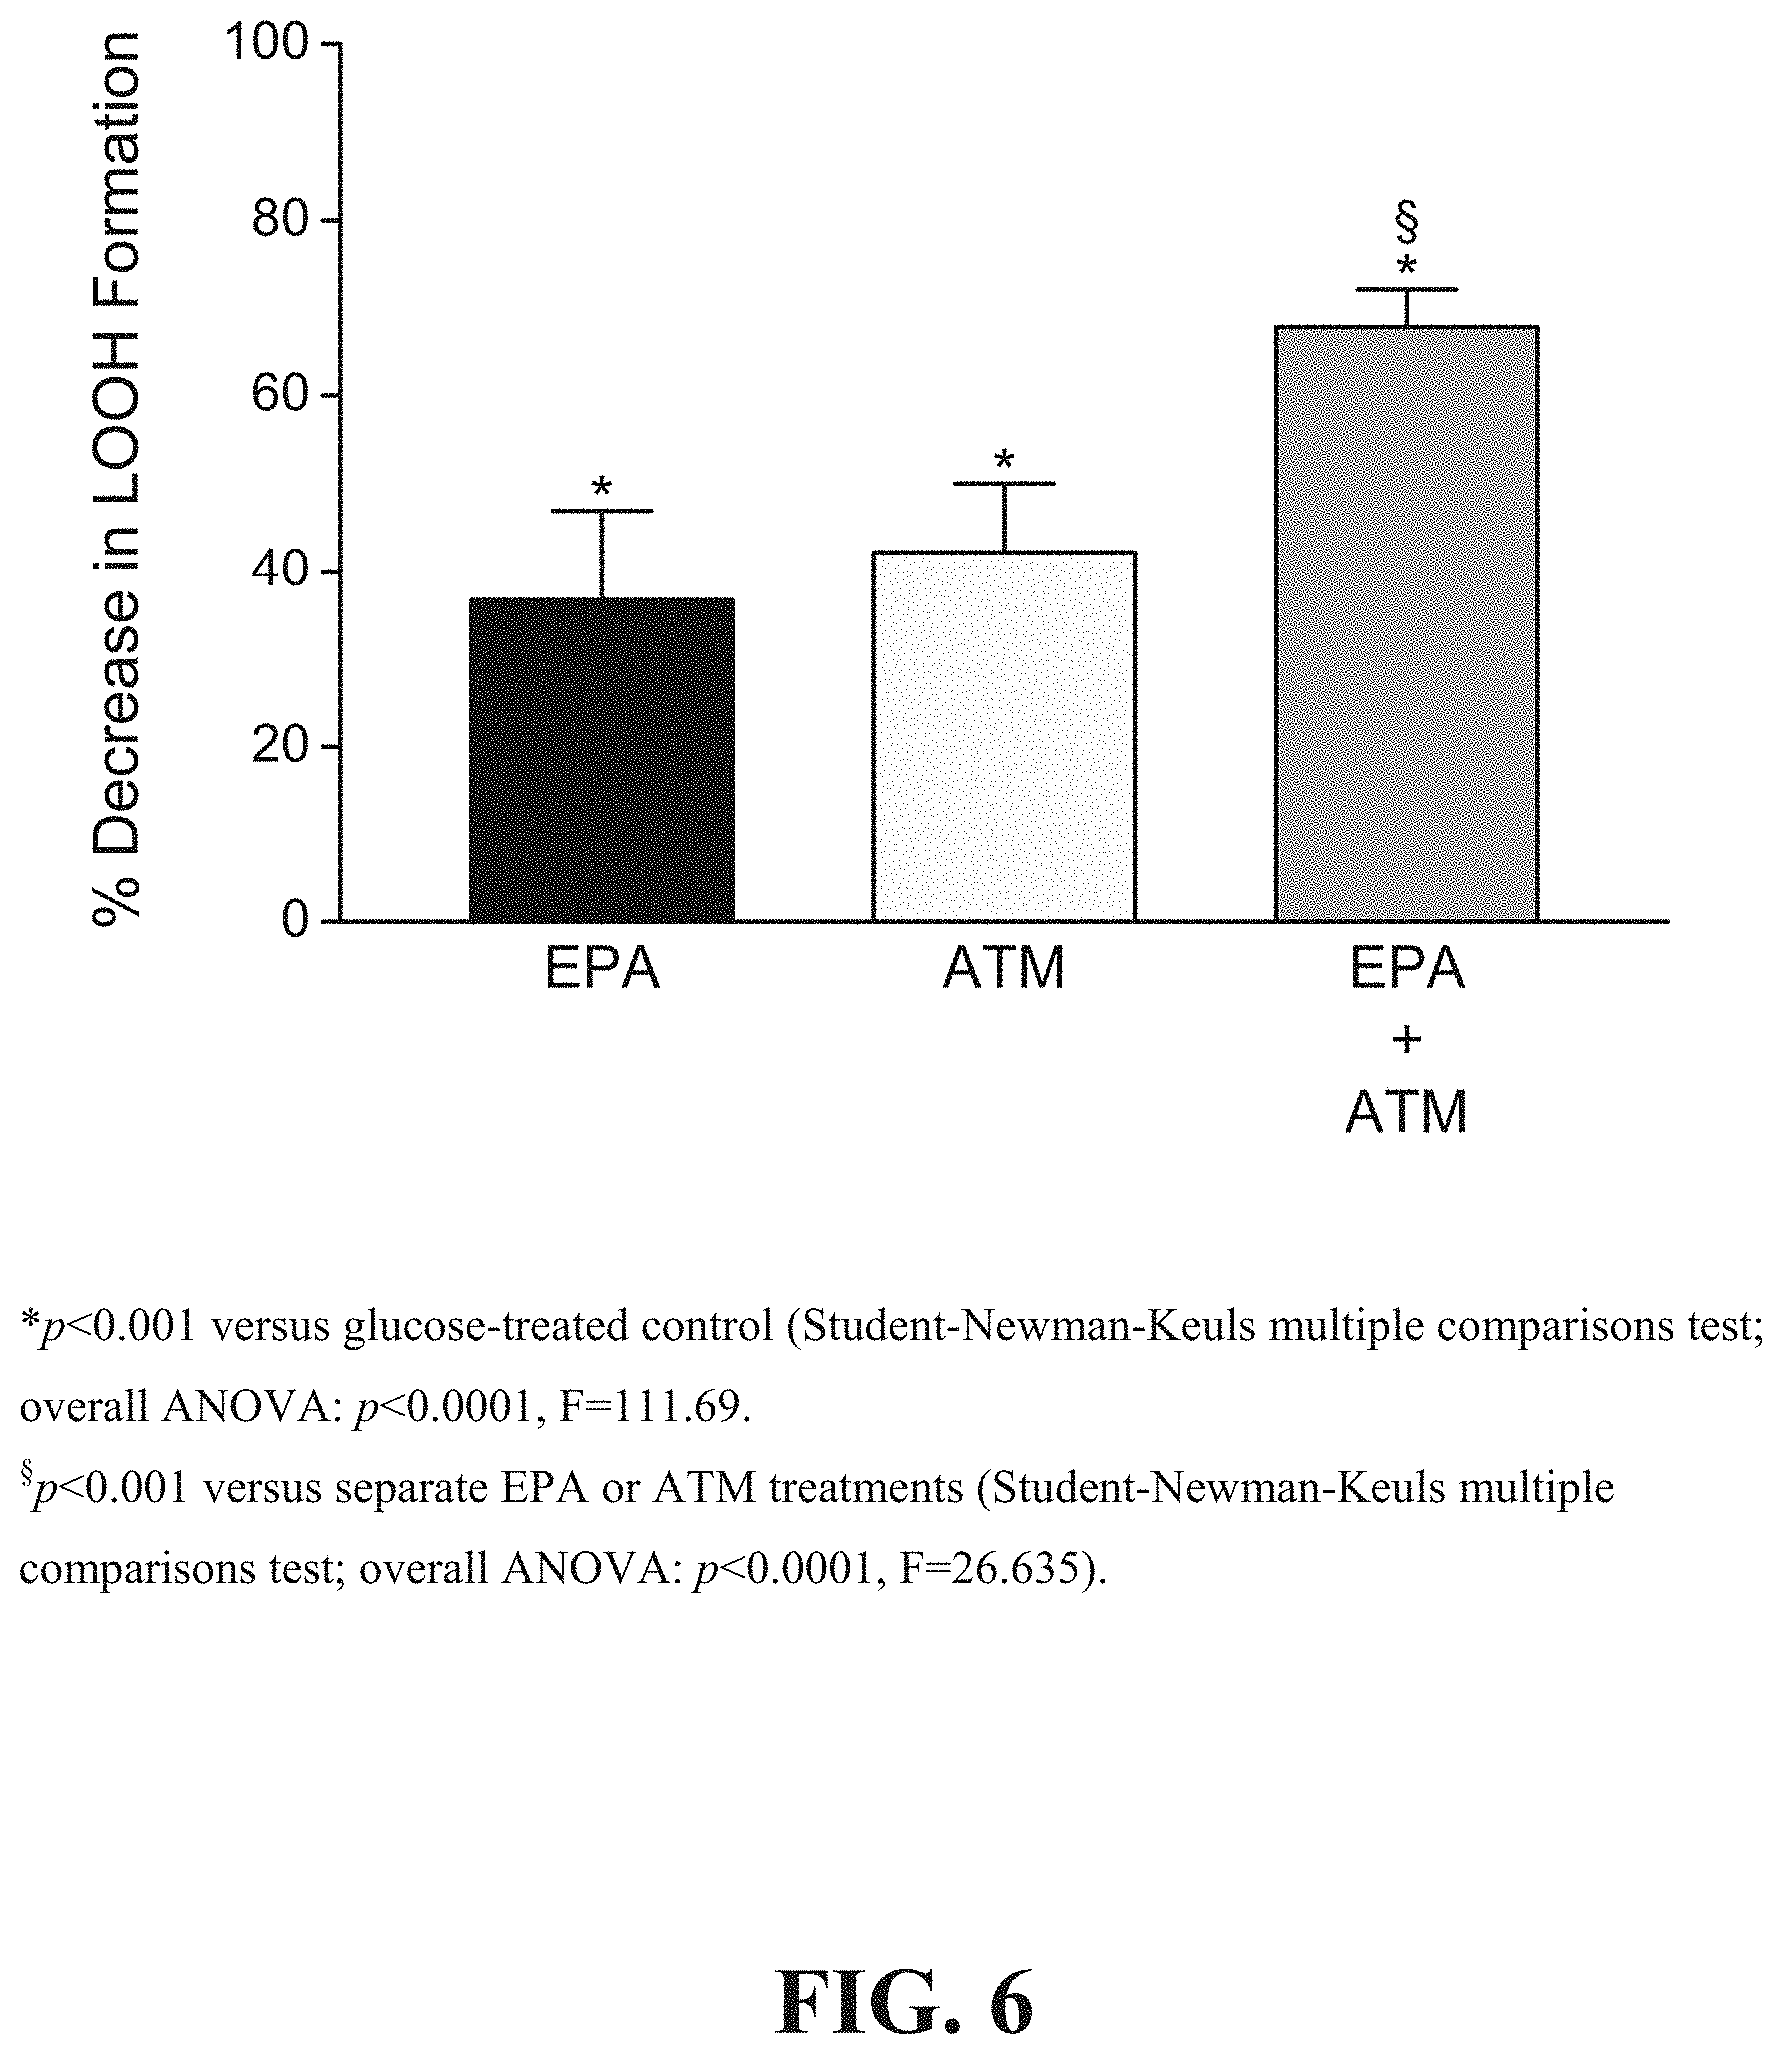
[0011] FIG. 6 shows a comparison of the combined effects of EPA and atorvastatin o-hydroxy (active) metabolite ("ATM") to EPA alone and ATM alone on glucose-induced membrane lipid peroxidation.
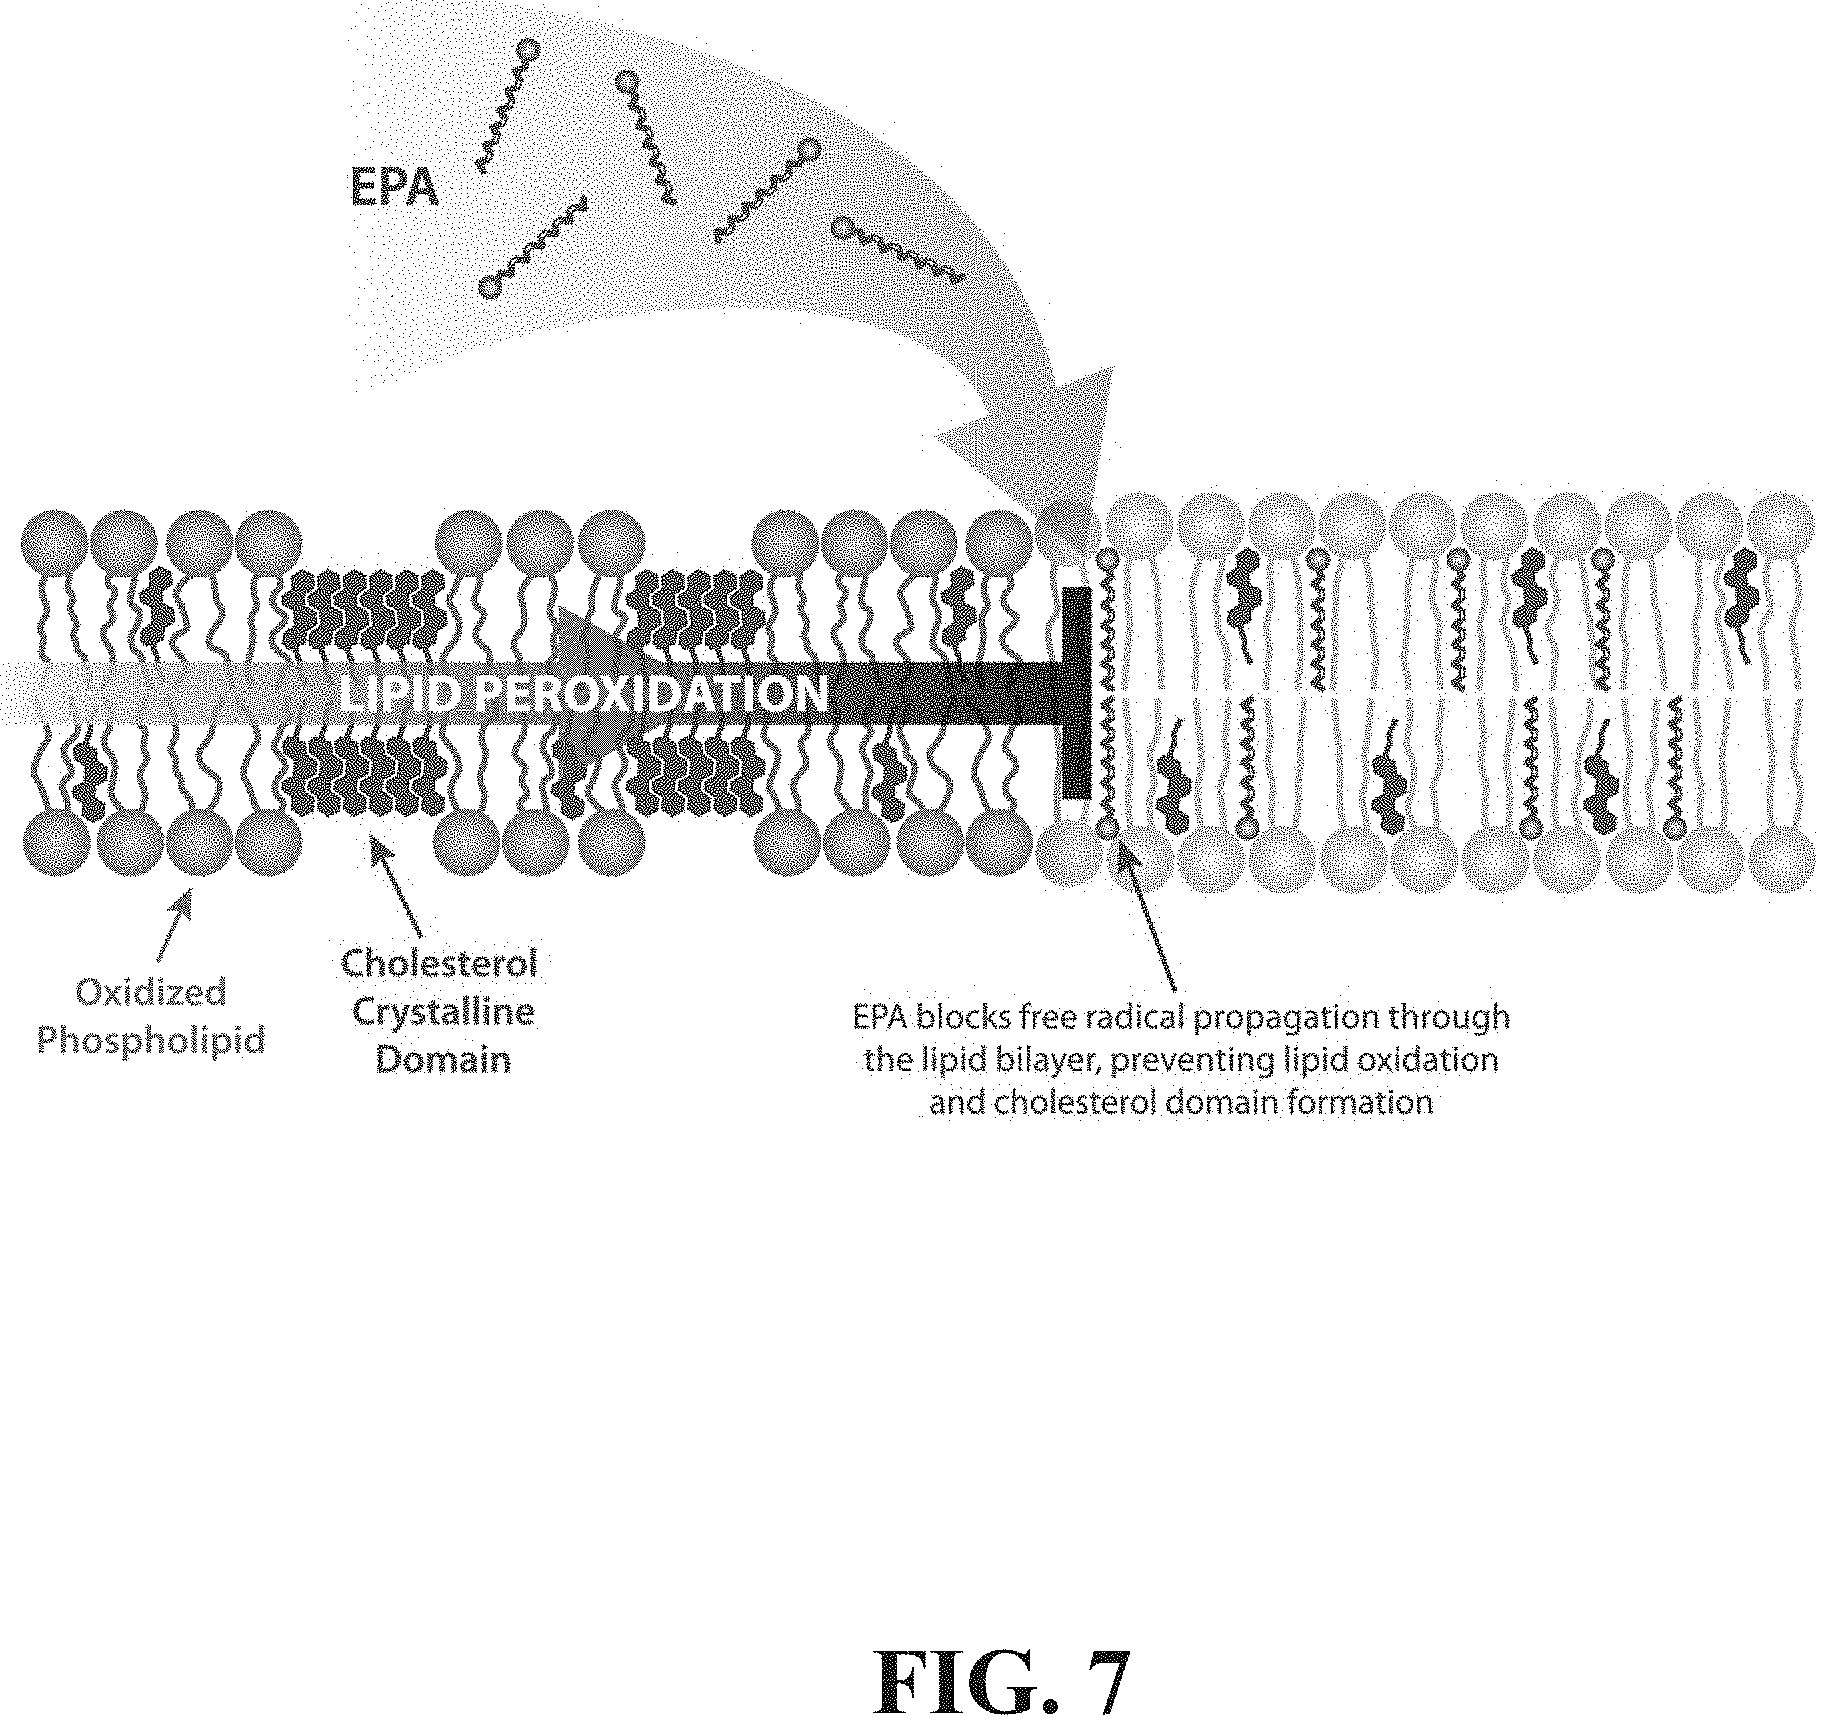
[0012] FIG. 7 depicts a schematic representation of one possible mechanism to explain antioxidant and membrane structural effects of EPA.
[0013] FIG. 8 depicts the effects of glucose with or without any one of EA, ETE or EPA on lipid hydroperoxide formation compared to control.
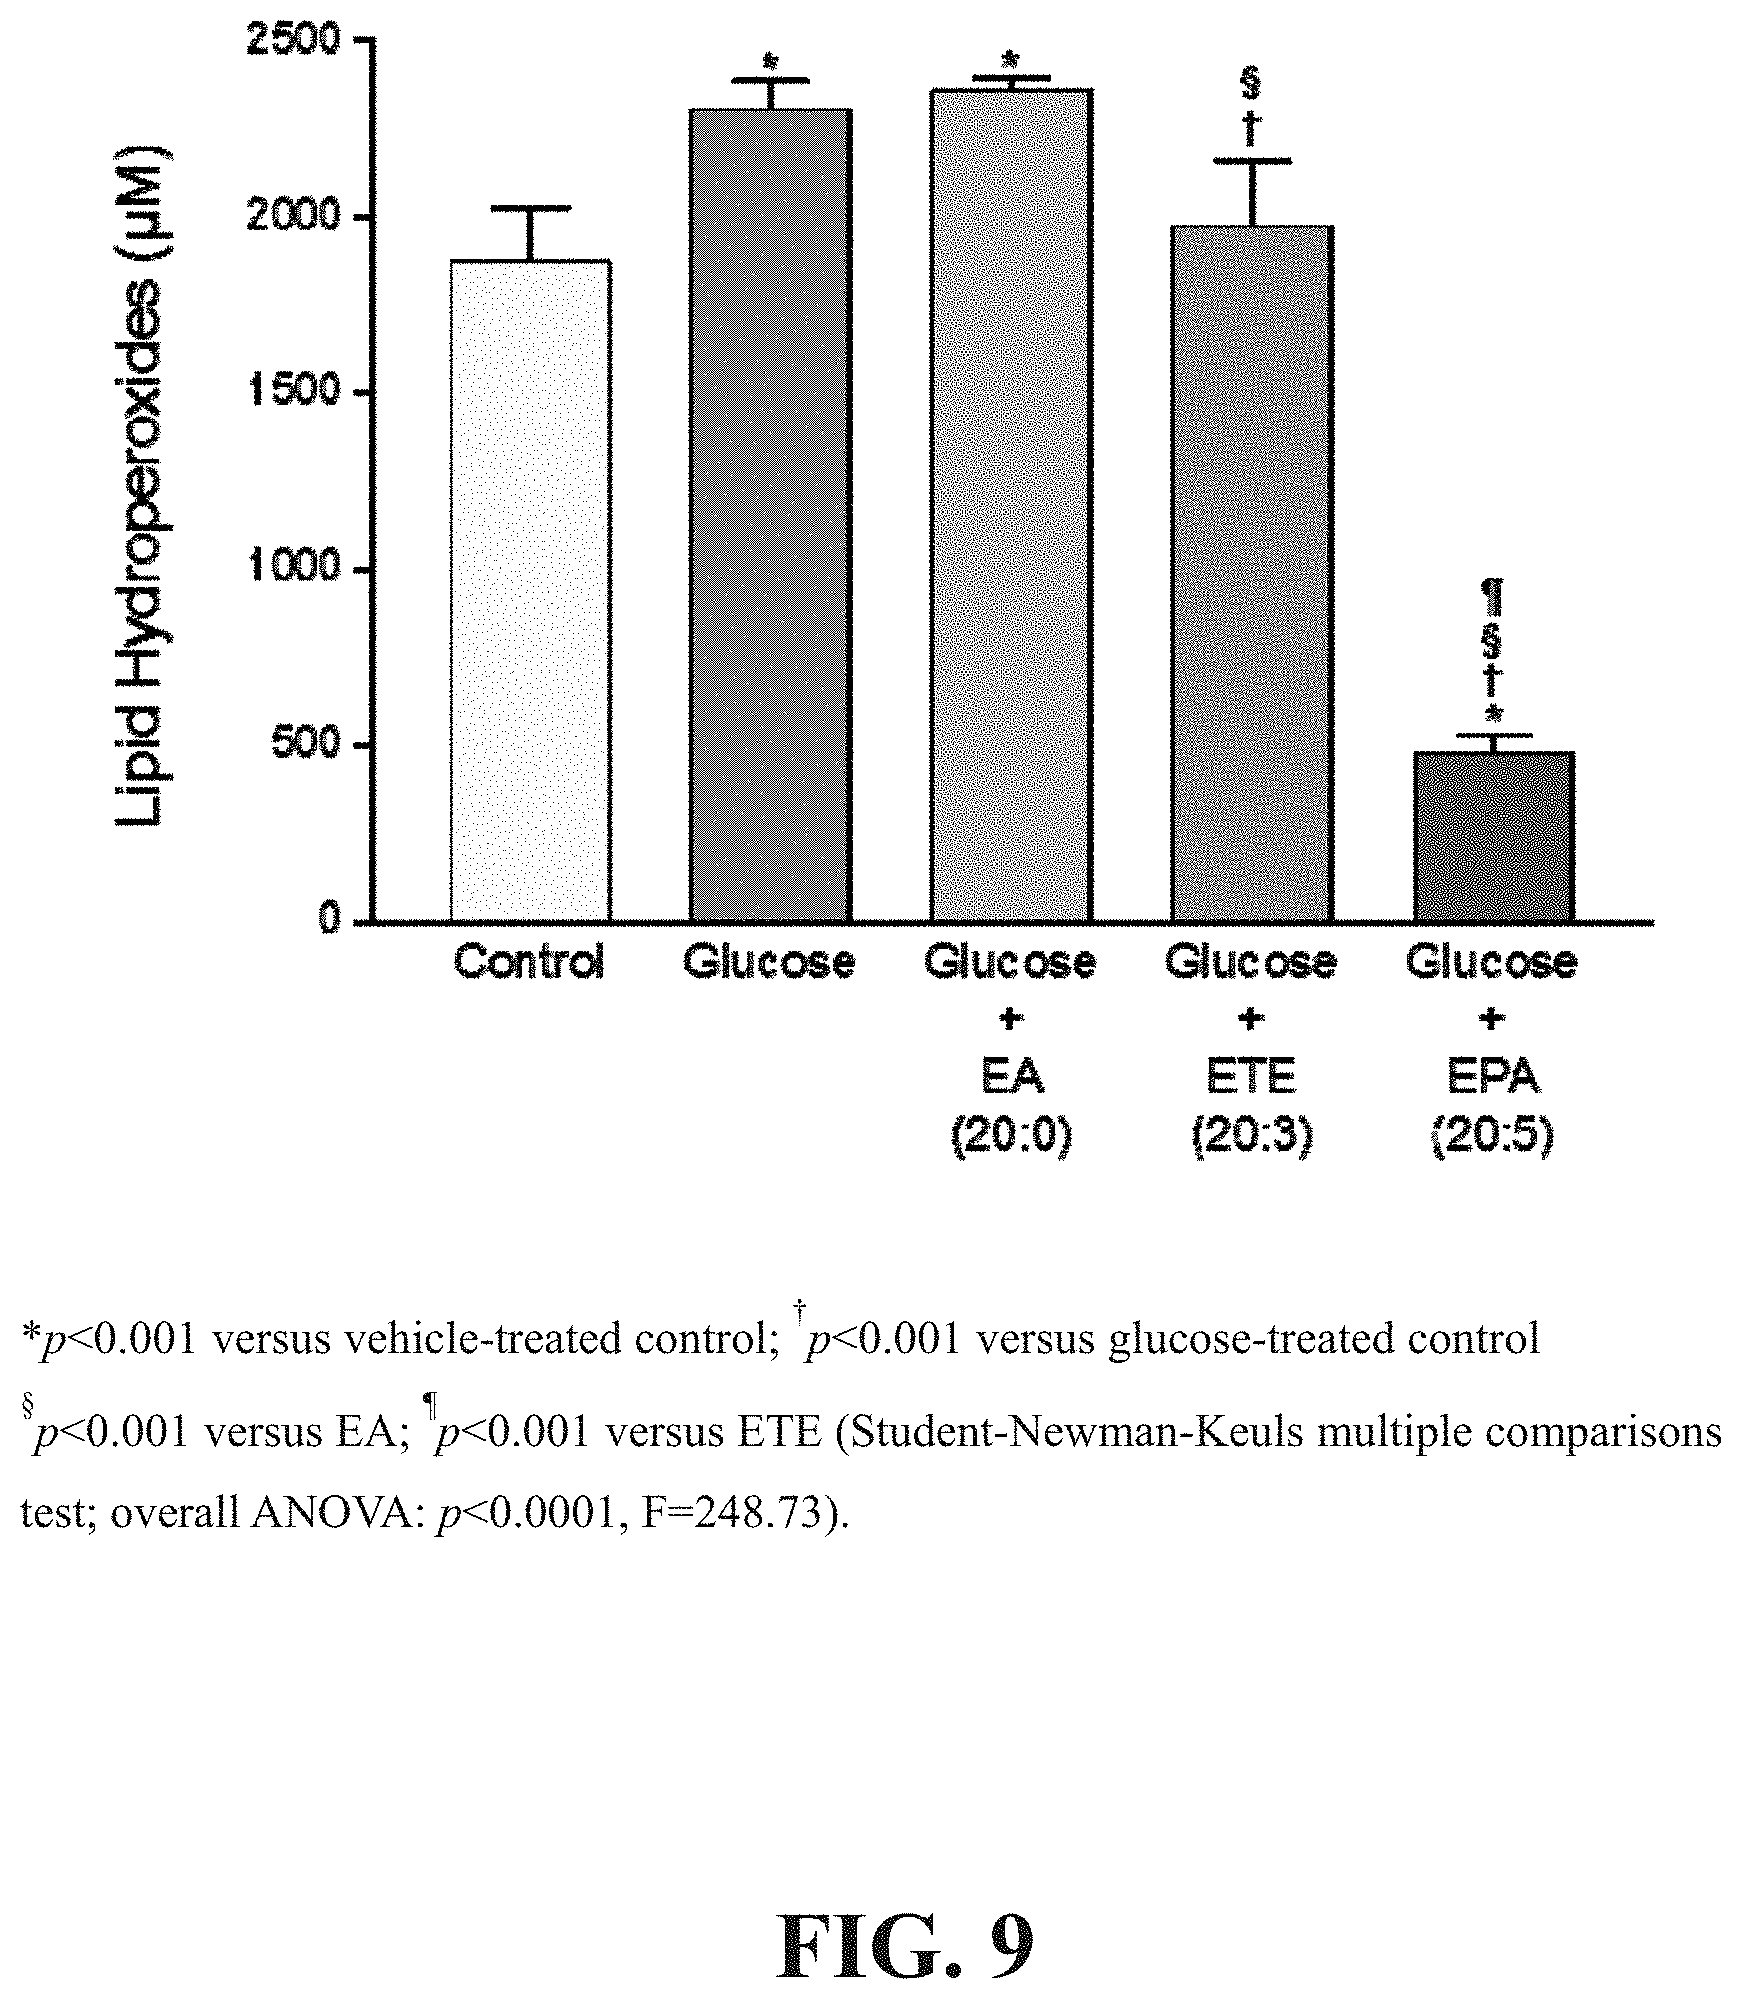
[0014] FIG. 9 depicts the effects of glucose with or without any one of EA, ETE or EPA on lipid hydroperoxide formation compared to control after 96 hours.
[0015] FIG. 10 depicts the dose-dependent effects of EPA and vitamin E on sdLDL oxidation after 2 hours.
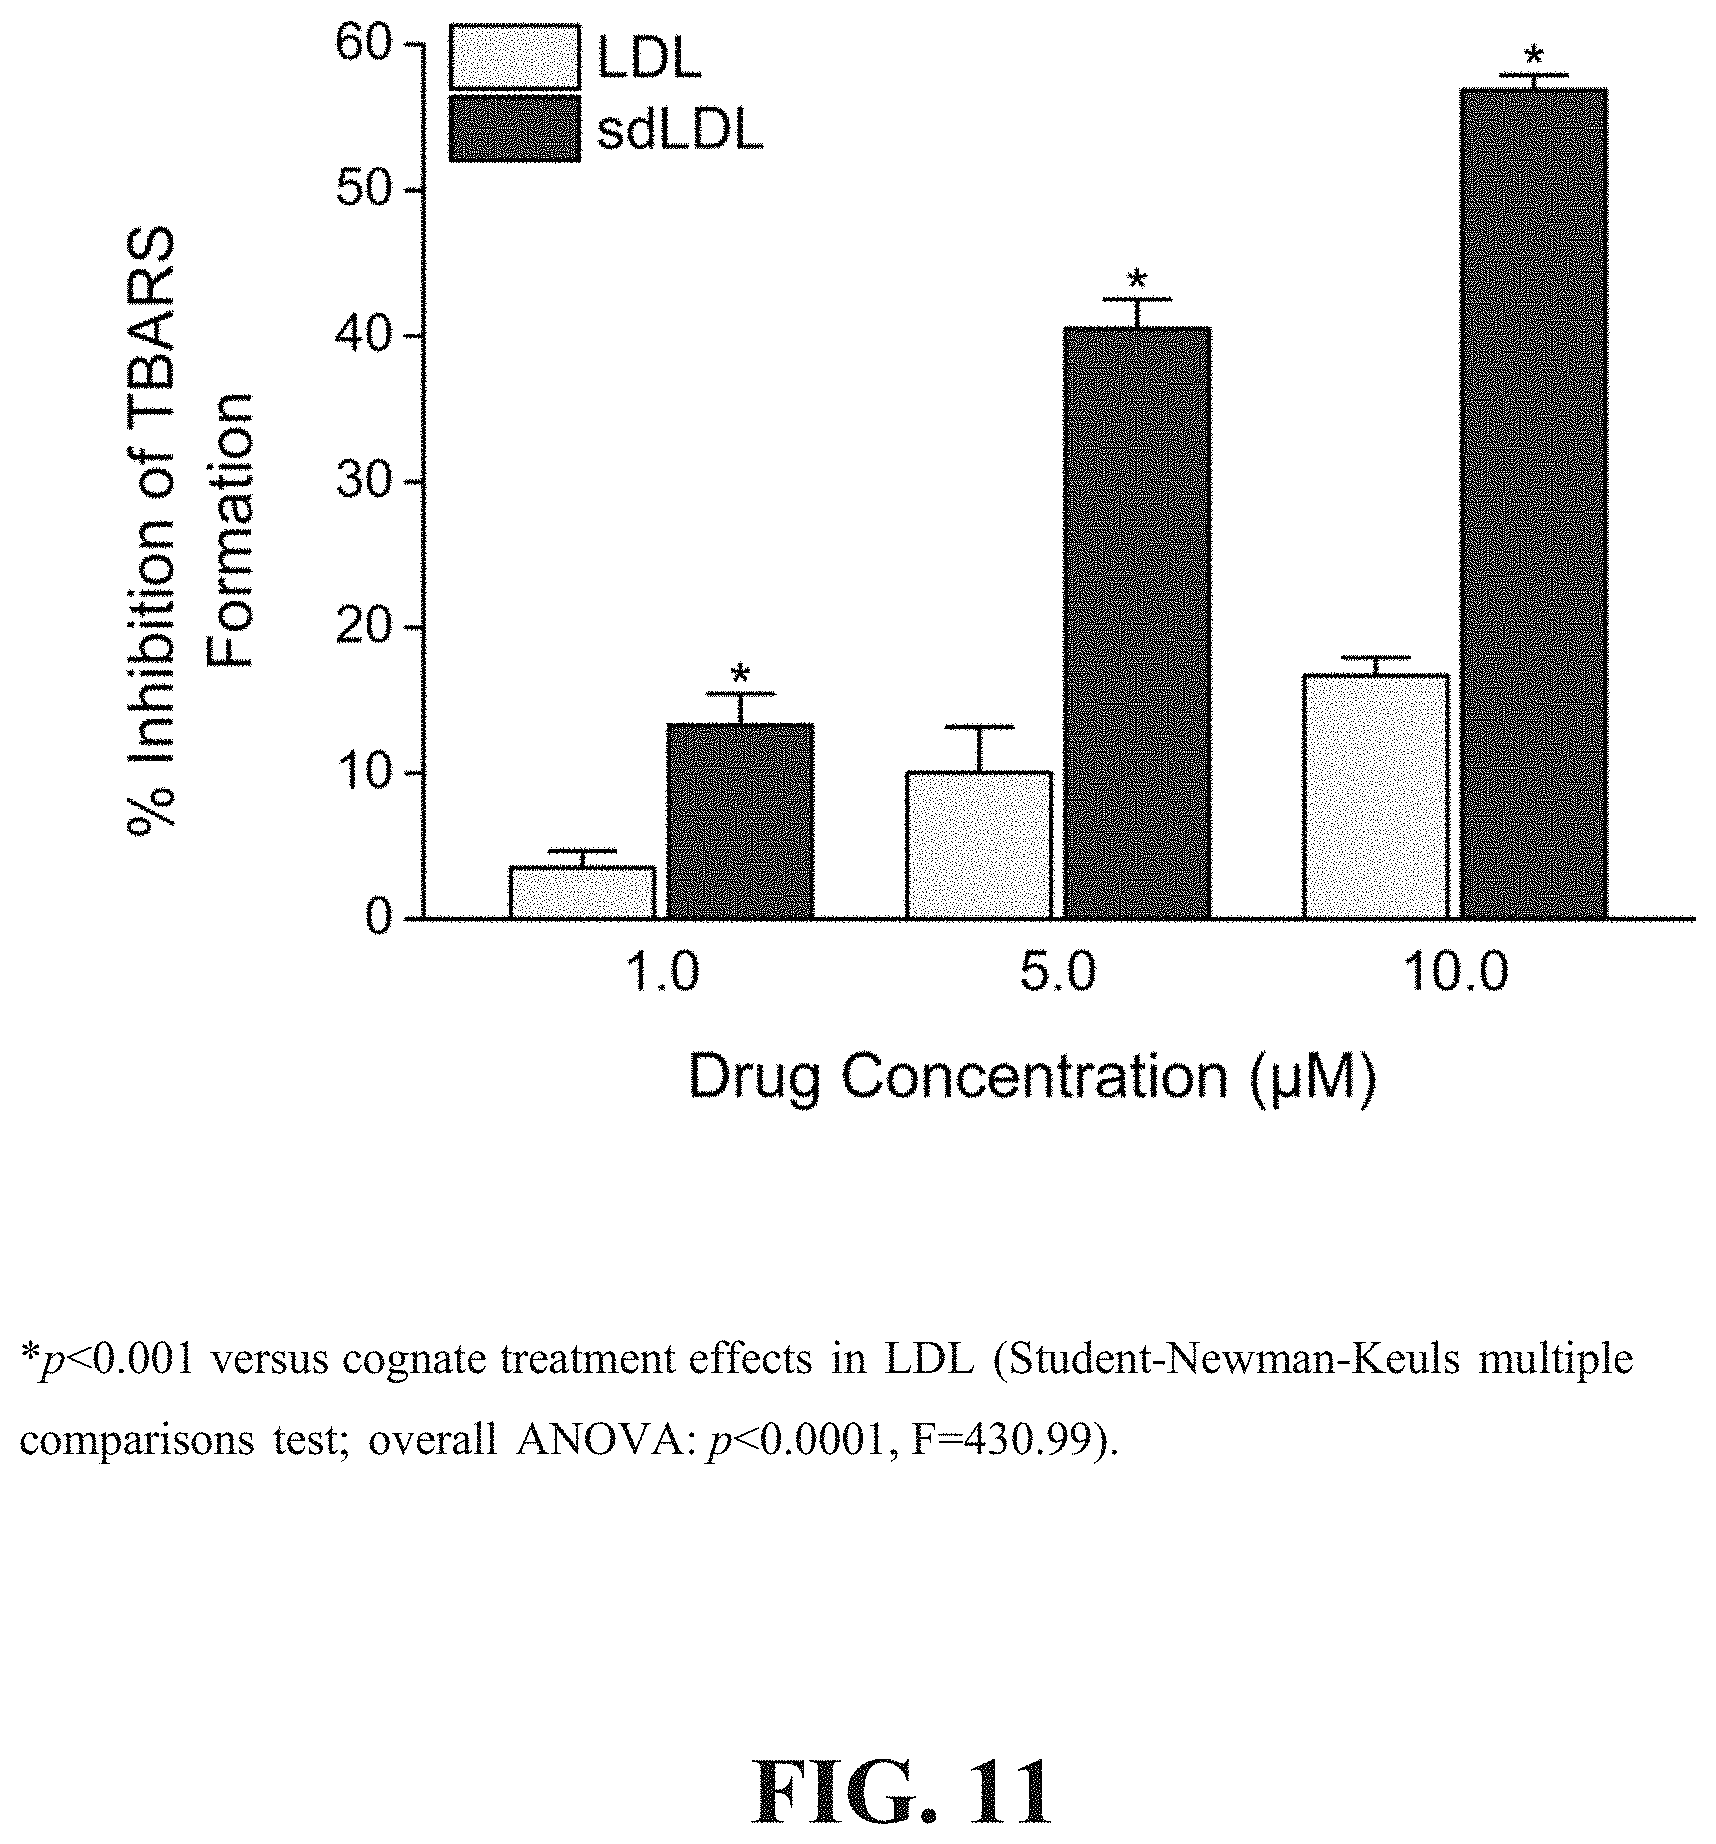
[0016] FIG. 11 depicts the dose-dependent antioxidant effects of EPA in human sdLDL compared to non-fractionated LDL.
DETAILED DESCRIPTION
[0017] While the present invention is capable of being embodied in various forms, the description below of several embodiments is made with the understanding that the present disclosure is to be considered as an exemplification of the invention, and is not intended to limit the invention to the specific embodiments illustrated. Headings are provided for convenience only and are not to be construed to limit the invention in any manner. Embodiments illustrated under any heading may be combined with embodiments illustrated under any other heading.
[0018] The use of numerical values in the various quantitative values specified in this application, unless expressly indicated otherwise, are stated as approximations as though the minimum and maximum values within the stated ranges were both preceded by the word "about." Also, the disclosure of ranges is intended as a continuous range including every value between the minimum and maximum values recited as well as any ranges that can be formed by such values. Also disclosed herein are any and all ratios (and ranges of any such ratios) that can be formed by dividing a disclosed numeric value into any other disclosed numeric value. Accordingly, the skilled person will appreciate that many such ratios, ranges, and ranges of ratios can be unambiguously derived from the numerical values presented herein and in all instances such ratios, ranges, and ranges of ratios represent various embodiments of the present invention.
[0019] In one embodiment, the invention provides a method for treatment and/or prevention of a cardiovascular-related disease. The term "cardiovascular-related disease" herein refers to any disease or disorder of the heart or blood vessels (i.e. arteries and veins) or any symptom thereof. Non-limiting examples of cardiovascular-related disease and disorders include hypertriglyceridemia, hypercholesterolemia, mixed dyslipidemia, coronary heart disease, vascular disease, stroke, atherosclerosis, arrhythmia, hypertension, myocardial infarction, and other cardiovascular events.
[0020] The term "treatment" in relation a given disease or disorder, includes, but is not limited to, inhibiting the disease or disorder, for example, arresting the development of the disease or disorder; relieving the disease or disorder, for example, causing regression of the disease or disorder; or relieving a condition caused by or resulting from the disease or disorder, for example, relieving, preventing or treating symptoms of the disease or disorder. The term "prevention" in relation to a given disease or disorder means: preventing the onset of disease development if none had occurred, preventing the disease or disorder from occurring in a subject that may be predisposed to the disorder or disease but has not yet been diagnosed as having the disorder or disease, and/or preventing further disease/disorder development if already present.
[0021] In one embodiment, the present invention provides a method of reducing or preventing membrane cholesterol domain formation in a subject, the method comprising administering to the subject a pharmaceutical composition comprising eicosapentaenoic acid or a derivative thereof. In one embodiment, the method comprises measuring membrane cholesterol domain formation in the subject prior to and/or after administering to the subject a pharmaceutical composition comprising eicosapentaenoic acid or a derivative thereof. In one embodiment, the method comprises a step of determining a reduction in or absence of an increase in cholesterol domain formation in the subject.
[0022] In another embodiment, the present invention provides a method of reducing or preventing oxidative modification of membrane polyunsaturated fatty acids in a subject, the method comprising administering to the subject a pharmaceutical composition comprising eicosapentaenoic acid or a derivative thereof. In one embodiment, the method comprises comprising a step of measuring oxidative modification of membrane polyunsaturated fatty acids in the subject before and/or after administering to the subject the pharmaceutical composition comprising eicosapentaenoic acid or a derivative thereof. In one embodiment, the method comprises a step of determining a reduction in or absence of an increase in oxidative modification of membrane polyunsaturated fatty acids in the subject.
[0023] In one embodiment, the subject or subject group in need thereof has one or more of: hypercholesterolemia, familial hypercholesterolemia, high LDL-C serum levels, high total cholesterol levels, and/or low HDL-C serum levels.
[0024] In another embodiment, the subject or subject group being treated has a baseline triglyceride level (or median baseline triglyceride level in the case of a subject group), fed or fasting, of at least about 300 mg/dl, at least about 400 mg/dl, at least about 500 mg/dl, at least about 600 mg/dl, at least about 700 mg/dl, at least about 800 mg/dl, at least about 900 mg/dl, at least about 1000 mg/dl, at least about 1100 mg/dl, at least about 1200 mg/dl, at least about 1300 mg/dl, at least about 1400 mg/dl, or at least about 1500 mg/dl, for example about 400 mg/dl to about 2500 mg/dl, about 450 mg/dl to about 2000 mg/dl or about 500 mg/dl to about 1500 mg/dl.
[0025] In one embodiment, the subject or subject group being treated in accordance with methods of the invention has previously been treated with Lovaza.RTM. and has experienced an increase in, or no decrease in, LDL-C levels and/or non-HDL-C levels. In one such embodiment, Lovaza.RTM. therapy is discontinued and replaced by a method of the present invention.
[0026] In another embodiment, the subject or subject group being treated in accordance with methods of the invention exhibits a fasting baseline absolute plasma level of free EPA (or mean thereof in the case of a subject group) not greater than about 0.70 nmol/ml, not greater than about 0.65 nmol/ml, not greater than about 0.60 nmol/ml, not greater than about 0.55 nmol/ml, not greater than about 0.50 nmol/ml, not greater than about 0.45 nmol/ml, or not greater than about 0.40 nmol/ml. In another embodiment, the subject or subject group being treated in accordance with methods of the invention exhibits a baseline fasting plasma level (or mean thereof) of free EPA, expressed as a percentage of total free fatty acid, of not more than about 3%, not more than about 2.5%, not more than about 2%, not more than about 1.5%, not more than about 1%, not more than about 0.75%, not more than about 0.5%, not more than about 0.25%, not more than about 0.2% or not more than about 0.15%. In one such embodiment, free plasma EPA and/or total fatty acid levels are determined prior to initiating therapy.
[0027] In another embodiment, the subject or subject group being treated in accordance with methods of the invention exhibits a fasting baseline absolute plasma level of total fatty acid (or mean thereof) not greater than about 250 nmol/ml, not greater than about 200 nmol/ml, not greater than about 150 nmol/ml, not greater than about 100 nmol/ml, or not greater than about 50 nmol/ml.
[0028] In another embodiment, the subject or subject group being treated in accordance with methods of the invention exhibits a fasting baseline plasma, serum or red blood cell membrane EPA level not greater than about 70 .mu.g/ml, not greater than about 60 .mu.g/ml, not greater than about 50 .mu.g/ml, not greater than about 40 .mu.g/ml, not greater than about 30 .mu.g/ml, or not greater than about 25 .mu.g/ml.
[0029] In another embodiment, methods of the present invention comprise a step of measuring the subject's (or subject group's mean) baseline lipid profile prior to initiating therapy. In another embodiment, methods of the invention comprise the step of identifying a subject or subject group having one or more of the following: baseline non-HDL-C value of about 200 mg/dl to about 400 mg/dl, for example at least about 210 mg/dl, at least about 220 mg/dl, at least about 230 mg/dl, at least about 240 mg/dl, at least about 250 mg/dl, at least about 260 mg/dl, at least about 270 mg/dl, at least about 280 mg/dl, at least about 290 mg/dl, or at least about 300 mg/dl; baseline total cholesterol value of about 250 mg/dl to about 400 mg/dl, for example at least about 260 mg/dl, at least about 270 mg/dl, at least about 280 mg/dl or at least about 290 mg/dl; baseline vLDL-C value of about 140 mg/dl to about 200 mg/dl, for example at least about 150 mg/dl, at least about 160 mg/dl, at least about 170 mg/dl, at least about 180 mg/dl or at least about 190 mg/dl; baseline HDL-C value of about 10 to about 60 mg/dl, for example not more than about 40 mg/dl, not more than about 35 mg/dl, not more than about 30 mg/dl, not more than about 25 mg/dl, not more than about 20 mg/dl, or not more than about 15 mg/dl; and/or baseline LDL-C value of about 50 to about 300 mg/dl, for example not less than about 100 mg/dl, not less than about 90 mg/dl, not less than about 80 mg/dl, not less than about 70 mg/dl, not less than about 60 mg/dl or not less than about 50 mg/dl.
[0030] In a related embodiment, upon treatment in accordance with the present invention, for example over a period of about 1 to about 200 weeks, about 1 to about 100 weeks, about 1 to about 80 weeks, about 1 to about 50 weeks, about 1 to about 40 weeks, about 1 to about 20 weeks, about 1 to about 15 weeks, about 1 to about 12 weeks, about 1 to about 10 weeks, about 1 to about 5 weeks, about 1 to about 2 weeks or about 1 week, the subject or subject group exhibits one or more of the following outcomes:
[0031] (a) reduced triglyceride levels compared to baseline or control;
[0032] (b) reduced Apo B levels compared to baseline or control;
[0033] (c) increased HDL-C levels compared to baseline or control;
[0034] (d) no increase in LDL-C levels compared to baseline or control;
[0035] (e) a reduction in LDL-C levels compared to baseline or control;
[0036] (f) a reduction in non-HDL-C levels compared to baseline or control;
[0037] (g) a reduction in VLDL levels compared to baseline or control;
[0038] (h) an increase in apo A-I levels compared to baseline or control;
[0039] (i) an increase in apo A-I/apo B ratio compared to baseline or control;
[0040] (j) a reduction in lipoprotein A levels compared to baseline or control;
[0041] (k) a reduction in LDL particle number compared to baseline or control;
[0042] (l) an increase in LDL size compared to baseline or control;
[0043] (m) a reduction in remnant-like particle cholesterol compared to baseline or control;
[0044] (n) a reduction in oxidized LDL compared to baseline or control;
[0045] (o) no change or a reduction in fasting plasma glucose (FPG) compared to baseline or control;
[0046] (p) a reduction in hemoglobin A.sub.1c (HbA.sub.1c) compared to baseline or control;
[0047] (q) a reduction in homeostasis model insulin resistance compared to baseline or control;
[0048] (r) a reduction in lipoprotein associated phospholipase A2 compared to baseline or control;
[0049] (s) a reduction in intracellular adhesion molecule-1 compared to baseline or control;
[0050] (t) a reduction in interleukin-6 compared to baseline or control;
[0051] (u) a reduction in plasminogen activator inhibitor-1 compared to baseline or control;
[0052] (v) a reduction in high sensitivity C-reactive protein (hsCRP) compared to baseline or control;
[0053] (w) an increase in serum or plasma EPA compared to baseline or control;
[0054] (x) an increase in red blood cell (RBC) membrane EPA compared to baseline or control;
[0055] (y) a reduction or increase in one or more of serum phospholipid and/or red blood cell content of docosahexaenoic acid (DHA), docosapentaenoic acid (DPA), arachidonic acid (AA), palmitic acid (PA), stearidonic acid (SA) or oleic acid (OA) compared to baseline or control;
[0056] (z) a reduction in or prevention of membrane cholesterol domain formation compared to baseline or control; and/or
[0057] (aa) a reduction in or prevention of oxidative modification of membrane polyunsaturated fatty acids compared to baseline or control.
[0058] In one embodiment, upon administering a composition of the invention to a subject, the subject exhibits a decrease in triglyceride levels, an increase in the concentrations of EPA and DPA (n-3) in red blood cells, and an increase of the ratio of EPA:arachidonic acid in red blood cells. In a related embodiment the subject exhibits substantially no or no increase in RBC DHA.
[0059] In one embodiment, methods of the present invention comprise measuring baseline levels of one or more markers set forth in (a)-(aa) above prior to dosing the subject or subject group. In another embodiment, the methods comprise administering a composition as disclosed herein to the subject after baseline levels of one or more markers set forth in (a)-(aa) are determined, and subsequently taking an additional measurement of said one or more markers.
[0060] In another embodiment, upon treatment with a composition of the present invention, for example over a period of about 1 to about 200 weeks, about 1 to about 100 weeks, about 1 to about 80 weeks, about 1 to about 50 weeks, about 1 to about 40 weeks, about 1 to about 20 weeks, about 1 to about 15 weeks, about 1 to about 12 weeks, about 1 to about 10 weeks, about 1 to about 5 weeks, about 1 to about 2 weeks or about 1 week, the subject or subject group exhibits any 2 or more of, any 3 or more of, any 4 or more of, any 5 or more of, any 6 or more of, any 7 or more of, any 8 or more of, any 9 or more of, any 10 or more of, any 11 or more of, any 12 or more of, any 13 or more of, any 14 or more of, any 15 or more of, any 16 or more of, any 17 or more of, any 18 or more of, any 19 or more of, any 20 or more of, any 21 or more of, any 22 or more of, any 23 or more, any 24 or more, any 25 or more, any 26 or more, or all 27 of outcomes (a)-(aa) described immediately above.
[0061] In another embodiment, upon treatment with a composition of the present invention, the subject or subject group exhibits one or more of the following outcomes:
[0062] (a) a reduction in triglyceride level of at least about 5%, at least about 10%, at least about 15%, at least about 20%, at least about 25%, at least about 30%, at least about 35%, at least about 40%, at least about 45%, at least about 50%, at least about 55% or at least about 75% (actual % change or median % change) as compared to baseline;
[0063] (b) a less than 30% increase, less than 20% increase, less than 10% increase, less than 5% increase or no increase in non-HDL-C levels or a reduction in non-HDL-C levels of at least about 1%, at least about 3%, at least about 5%, at least about 10%, at least about 15%, at least about 20%, at least about 25%, at least about 30%, at least about 35%, at least about 40%, at least about 45%, at least about 50%, at least about 55% or at least about 75% (actual % change or median % change) as compared to baseline;
[0064] (c) substantially no change in HDL-C levels, no change in HDL-C levels, or an increase in HDL-C levels of at least about 5%, at least about 10%, at least about 15%, at least about 20%, at least about 25%, at least about 30%, at least about 35%, at least about 40%, at least about 45%, at least about 50%, at least about 55% or at least about 75% (actual % change or median % change) as compared to baseline;
[0065] (d) a less than 60% increase, a less than 50% increase, a less than 40% increase, a less than 30% increase, less than 20% increase, less than 10% increase, less than 5% increase or no increase in LDL-C levels or a reduction in LDL-C levels of at least about 5%, at least about 10%, at least about 15%, at least about 20%, at least about 25%, at least about 30%, at least about 35%, at least about 40%, at least about 45%, at least about 50%, at least about 55%, at least about 55% or at least about 75% (actual % change or median % change) as compared to baseline;
[0066] (e) a decrease in Apo B levels of at least about 5%, at least about 10%, at least about 15%, at least about 20%, at least about 25%, at least about 30%, at least about 35%, at least about 40%, at least about 45%, at least about 50%, at least about 55% or at least about 75% (actual % change or median % change) as compared to baseline;
[0067] (f) a reduction in vLDL levels of at least about 5%, at least about 10%, at least about 15%, at least about 20%, at least about 25%, at least about 30%, at least about 35%, at least about 40%, at least about 45%, at least about 50%, or at least about 100% (actual % change or median % change) compared to baseline;
[0068] (g) an increase in apo A-I levels of at least about 5%, at least about 10%, at least about 15%, at least about 20%, at least about 25%, at least about 30%, at least about 35%, at least about 40%, at least about 45%, at least about 50%, or at least about 100% (actual % change or median % change) compared to baseline;
[0069] (h) an increase in apo A-I/apo B ratio of at least about 5%, at least about 10%, at least about 15%, at least about 20%, at least about 25%, at least about 30%, at least about 35%, at least about 40%, at least about 45%, at least about 50%, or at least about 100% (actual % change or median % change) compared to baseline;
[0070] (i) a reduction in lipoprotein (a) levels of at least about 5%, at least about 10%, at least about 15%, at least about 20%, at least about 25%, at least about 30%, at least about 35%, at least about 40%, at least about 45%, at least about 50%, or at least about 100% (actual % change or median % change) compared to baseline;
[0071] (j) a reduction in mean LDL particle number of at least about 5%, at least about 10%, at least about 15%, at least about 20%, at least about 25%, at least about 30%, at least about 35%, at least about 40%, at least about 45%, at least about 50%, or at least about 100% (actual % change or median % change) compared to baseline;
[0072] (k) an increase in mean LDL particle size of at least about 5%, at least about 10%, at least about 15%, at least about 20%, at least about 25%, at least about 30%, at least about 35%, at least about 40%, at least about 45%, at least about 50%, or at least about 100% (actual % change or median % change) compared to baseline;
[0073] (l) a reduction in remnant-like particle cholesterol of at least about 5%, at least about 10%, at least about 15%, at least about 20%, at least about 25%, at least about 30%, at least about 35%, at least about 40%, at least about 45%, at least about 50%, or at least about 100% (actual % change or median % change) compared to baseline;
[0074] (m) a reduction in oxidized LDL of at least about 5%, at least about 10%, at least about 15%, at least about 20%, at least about 25%, at least about 30%, at least about 35%, at least about 40%, at least about 45%, at least about 50%, or at least about 100% (actual % change or median % change) compared to baseline;
[0075] (n) substantially no change, no significant change, or a reduction (e.g. in the case of a diabetic subject) in fasting plasma glucose (FPG) of at least about 5%, at least about 10%, at least about 15%, at least about 20%, at least about 25%, at least about 30%, at least about 35%, at least about 40%, at least about 45%, at least about 50%, or at least about 100% (actual % change or median % change) compared to baseline;
[0076] (o) substantially no change, no significant change or a reduction in hemoglobin A.sub.1c (HbA.sub.1c) of at least about 5%, at least about 10%, at least about 15%, at least about 20%, at least about 25%, at least about 30%, at least about 35%, at least about 40%, at least about 45%, or at least about 50% (actual % change or median % change) compared to baseline;
[0077] (p) a reduction in homeostasis model index insulin resistance of at least about 5%, at least about 10%, at least about 15%, at least about 20%, at least about 25%, at least about 30%, at least about 35%, at least about 40%, at least about 45%, at least about 50%, or at least about 100% (actual % change or median % change) compared to baseline;
[0078] (q) a reduction in lipoprotein associated phospholipase A2 of at least about 5%, at least about 10%, at least about 15%, at least about 20%, at least about 25%, at least about 30%, at least about 35%, at least about 40%, at least about 45%, at least about 50%, or at least about 100% (actual % change or median % change) compared to baseline;
[0079] (r) a reduction in intracellular adhesion molecule-1 of at least about 5%, at least about 10%, at least about 15%, at least about 20%, at least about 25%, at least about 30%, at least about 35%, at least about 40%, at least about 45%, at least about 50%, or at least about 100% (actual % change or median % change) compared to baseline;
[0080] (s) a reduction in interleukin-6 of at least about 5%, at least about 10%, at least about 15%, at least about 20%, at least about 25%, at least about 30%, at least about 35%, at least about 40%, at least about 45%, at least about 50%, or at least about 100% (actual % change or median % change) compared to baseline;
[0081] (t) a reduction in plasminogen activator inhibitor-1 of at least about 5%, at least about 10%, at least about 15%, at least about 20%, at least about 25%, at least about 30%, at least about 35%, at least about 40%, at least about 45%, at least about 50%, or at least about 100% (actual % change or median % change) compared to baseline;
[0082] (u) a reduction in high sensitivity C-reactive protein (hsCRP) of at least about 5%, at least about 10%, at least about 15%, at least about 20%, at least about 25%, at least about 30%, at least about 35%, at least about 40%, at least about 45%, at least about 50%, or at least about 100% (actual % change or median % change) compared to baseline;
[0083] (v) an increase in serum, plasma and/or RBC EPA of at least about 5%, at least about 10%, at least about 15%, at least about 20%, at least about 25%, at least about 30%, at least about 35%, at least about 40%, at least about 45%, at least about 50%, at least about 100%, at least about 200% or at least about 400% (actual % change or median % change) compared to baseline;
[0084] (w) an increase in serum phospholipid and/or red blood cell membrane EPA of at least about 5%, at least about 10%, at least about 15%, at least about 20%, at least about 25%, at least about 30%, at least about 35%, at least about 40%, at least about 45%, at least about 50%, at least about 100%, at least about 200%, or at least about 400% (actual % change or median % change) compared to baseline;
[0085] (x) a reduction or increase in one or more of serum phospholipid and/or red blood cell DHA, DPA, AA, PA and/or OA of at least about 5%, at least about 10%, at least about 15%, at least about 20%, at least about 25%, at least about 30%, at least about 35%, at least about 40%, at least about 45%, at least about 50%, at least about 55% or at least about 75% (actual % change or median % change) compared to baseline;
[0086] (y) a reduction in total cholesterol of at least about 5%, at least about 10%, at least about 15%, at least about 20%, at least about 25%, at least about 30%, at least about 35%, at least about 40%, at least about 45%, at least about 50%, at least about 55% or at least about 75% (actual % change or median % change) compared to baseline;
[0087] (z) a reduction in membrane cholesterol domain formation of at least about 10%, at least about 15%, at least about 20%, at least about 25%, at least about 30%, at least about 35%, at least about 40%, at least about 45%, at least about 50%, at least about 55%, at least about 60%, at least about 65%, at least about 70%, at least about 75%, at least about 80%, at least about 85%, at least about 90%, at least about 95%, at least about 98%, at least about 99%, or about 100% (actual % change or median % change) compared to baseline or control; and/or
[0088] (aa) a reduction in oxidative modification of membrane polyunsaturated fatty acids of at least about 10%, at least about 15%, at least about 20%, at least about 25%, at least about 30%, at least about 35%, at least about 40%, at least about 45%, at least about 50%, at least about 55%, at least about 60%, at least about 65%, at least about 70%, at least about 75%, at least about 80%, at least about 85%, at least about 90%, at least about 95%, at least about 98%, at least about 99%, or about 100% (actual % change or median % change) compared to baseline or control.
[0089] In one embodiment, methods of the present invention comprise measuring baseline levels of one or more markers set forth in (a)-(aa) prior to dosing the subject or subject group. In another embodiment, the methods comprise administering a composition as disclosed herein to the subject after baseline levels of one or more markers set forth in (a)-(aa) are determined, and subsequently taking a second measurement of the one or more markers as measured at baseline for comparison thereto.
[0090] In another embodiment, upon treatment with a composition of the present invention, for example over a period of about 1 to about 200 weeks, about 1 to about 100 weeks, about 1 to about 80 weeks, about 1 to about 50 weeks, about 1 to about 40 weeks, about 1 to about 20 weeks, about 1 to about 15 weeks, about 1 to about 12 weeks, about 1 to about 10 weeks, about 1 to about 5 weeks, about 1 to about 2 weeks or about 1 week, the subject or subject group exhibits any 2 or more of, any 3 or more of, any 4 or more of, any 5 or more of, any 6 or more of, any 7 or more of, any 8 or more of, any 9 or more of, any 10 or more of, any 11 or more of, any 12 or more of, any 13 or more of, any 14 or more of, any 15 or more of, any 16 or more of, any 17 or more of, any 18 or more of, any 19 or more of, any 20 or more of, any 21 or more of, any 22 or more of, any 23 or more of, any 24 or more of, any 25 or more of, any 26 or more of, or all 27 of outcomes (a)-(aa) described immediately above.
[0091] Parameters (a)-(y) can be measured in accordance with any clinically acceptable methodology. For example, triglycerides, total cholesterol, HDL-C and fasting blood sugar can be sample from serum and analyzed using standard photometry techniques. VLDL-TG, LDL-C and VLDL-C can be calculated or determined using serum lipoprotein fractionation by preparative ultracentrifugation and subsequent quantitative analysis by refractometry or by analytic ultracentrifugal methodology. Apo A1, Apo B and hsCRP can be determined from serum using standard nephelometry techniques. Lipoprotein (a) can be determined from serum using standard turbidimetric immunoassay techniques. LDL particle number and particle size can be determined using nuclear magnetic resonance (NMR) spectrometry. Remnants lipoproteins and LDL-phospholipase A2 can be determined from EDTA plasma or serum and serum, respectively, using enzymatic immunoseparation techniques. Oxidized LDL, intercellular adhesion molecule-1 and interleukin-6 levels can be determined from serum using standard enzyme immunoassay techniques. These techniques are described in detail in standard textbooks, for example Tietz Fundamentals of Clinical Chemistry, 6.sup.th Ed. (Burtis, Ashwood and Borter Eds.), WB Saunders Company. Parameters (z) and (aa) can be measured in accordance with any clinically acceptable methodology or can be estimated by any suitable in vitro experiment, for example, one similar to that described in Example 3.
[0092] In one embodiment, subjects fast for up to 12 hours prior to blood sample collection, for example about 10 hours.
[0093] In another embodiment, the present invention provides a method of treating or preventing primary hypercholesterolemia and/or mixed dyslipidemia (Fredrickson Types IIa and IIb) in a patient in need thereof, comprising administering to the patient one or more compositions as disclosed herein. In a related embodiment, the present invention provides a method of reducing triglyceride levels in a subject or subjects when treatment with a statin or niacin extended-release monotherapy is considered inadequate (Frederickson type IV hyperlipidemia).
[0094] In another embodiment, the present invention provides a method of treating or preventing risk of recurrent nonfatal myocardial infarction in a patient with a history of myocardial infarction, comprising administering to the patient one or more compositions as disclosed herein.
[0095] In another embodiment, the present invention provides a method of slowing progression of or promoting regression of atherosclerotic disease in a patient in need thereof, comprising administering to a subject in need thereof one or more compositions as disclosed herein.
[0096] In another embodiment, the present invention provides a method of treating or preventing very high serum triglyceride levels (e.g. Types IV and V hyperlipidemia) in a patient in need thereof, comprising administering to the patient one or more compositions as disclosed herein.
[0097] In another embodiment, the present invention provides a method of treating subjects having very high serum triglyceride levels (e.g. greater than 1000 mg/dl or greater than 2000 mg/dl) and that are at risk of developing pancreatitis, comprising administering to the patient one or more compositions as disclosed herein.
[0098] In one embodiment, a composition of the invention is administered to a subject in an amount sufficient to provide a daily dose of eicosapentaenoic acid of about 1 mg to about 10,000 mg, 25 about 5000 mg, about 50 to about 3000 mg, about 75 mg to about 2500 mg, or about 100 mg to about 1000 mg, for example about 75 mg, about 100 mg, about 125 mg, about 150 mg, about 175 mg, about 200 mg, about 225 mg, about 250 mg, about 275 mg, about 300 mg, about 325 mg, about 350 mg, about 375 mg, about 400 mg, about 425 mg, about 450 mg, about 475 mg, about 500 mg, about 525 mg, about 550 mg, about 575 mg, about 600 mg, about 625 mg, about 650 mg, about 675 mg, about 700 mg, about 725 mg, about 750 mg, about 775 mg, about 800 mg, about 825 mg, about 850 mg, about 875 mg, about 900 mg, about 925 mg, about 950 mg, about 975 mg, about 1000 mg, about 1025 mg, about 1050 mg, about 1075 mg, about 1100 mg, about 1025 mg, about 1050 mg, about 1075 mg, about 1200 mg, about 1225 mg, about 1250 mg, about 1275 mg, about 1300 mg, about 1325 mg, about 1350 mg, about 1375 mg, about 1400 mg, about 1425 mg, about 1450 mg, about 1475 mg, about 1500 mg, about 1525 mg, about 1550 mg, about 1575 mg, about 1600 mg, about 1625 mg, about 1650 mg, about 1675 mg, about 1700 mg, about 1725 mg, about 1750 mg, about 1775 mg, about 1800 mg, about 1825 mg, about 1850 mg, about 1875 mg, about 1900 mg, about 1925 mg, about 1950 mg, about 1975 mg, about 2000 mg, about 2025 mg, about 2050 mg, about 2075 mg, about 2100 mg, about 2125 mg, about 2150 mg, about 2175 mg, about 2200 mg, about 2225 mg, about 2250 mg, about 2275 mg, about 2300 mg, about 2325 mg, about 2350 mg, about 2375 mg, about 2400 mg, about 2425 mg, about 2450 mg, about 2475 mg, about 2500 mg, 2525 mg, about 2550 mg, about 2575 mg, about 2600 mg, about 2625 mg, about 2650 mg, about 2675 mg, about 2700 mg, about 2725 mg, about 2750 mg, about 2775 mg, about 2800 mg, about 2825 mg, about 2850 mg, about 2875 mg, about 2900 mg, about 2925 mg, about 2950 mg, about 2975 mg, about 3000 mg, about 3025 mg, about 3050 mg, about 3075 mg, about 3100 mg, about 3125 mg, about 3150 mg, about 3175 mg, about 3200 mg, about 3225 mg, about 3250 mg, about 3275 mg, about 3300 mg, about 3325 mg, about 3350 mg, about 3375 mg, about 3400 mg, about 3425 mg, about 3450 mg, about 3475 mg, about 3500 mg, about 3525 mg, about 3550 mg, about 3575 mg, about 3600 mg, about 3625 mg, about 3650 mg, about 3675 mg, about 3700 mg, about 3725 mg, about 3750 mg, about 3775 mg, about 3800 mg, about 3825 mg, about 3850 mg, about 3875 mg, about 3900 mg, about 3925 mg, about 3950 mg, about 3975 mg, about 4000 mg, about 4025 mg, about 4050 mg, about 4075 mg, about 4100 mg, about 4125 mg, about 4150 mg, about 4175 mg, about 4200 mg, about 4225 mg, about 4250 mg, about 4275 mg, about 4300 mg, about 4325 mg, about 4350 mg, about 4375 mg, about 4400 mg, about 4425 mg, about 4450 mg, about 4475 mg, about 4500 mg, about 4525 mg, about 4550 mg, about 4575 mg, about 4600 mg, about 4625 mg, about 4650 mg, about 4675 mg, about 4700 mg, about 4725 mg, about 4750 mg, about 4775 mg, about 4800 mg, about 4825 mg, about 4850 mg, about 4875 mg, about 4900 mg, about 4925 mg, about 4950 mg, about 4975 mg, about 5000 mg, about 5025 mg, about 5050 mg, about 5075 mg, about 5100 mg, about 5125 mg, about 5150 mg, about 5175 mg, about 5200 mg, about 5225 mg, about 5250 mg, about 5275 mg, about 5300 mg, about 5325 mg, about 5350 mg, about 5375 mg, about 5400 mg, about 5425 mg, about 5450 mg, about 5475 mg, about 5500 mg, about 5525 mg, about 5550 mg, about 5575 mg, about 5600 mg, about 5625 mg, about 5650 mg, about 5675 mg, about 5700 mg, about 5725 mg, about 5750 mg, about 5775 mg, about 5800 mg, about 5825 mg, about 5850 mg, about 5875 mg, about 5900 mg, about 5925 mg, about 5950 mg, about 5975 mg, about 6000 mg, about 6025 mg, about 6050 mg, about 6075 mg, about 6100 mg, about 6125 mg, about 6150 mg, about 6175 mg, about 6200 mg, about 6225 mg, about 6250 mg, about 6275 mg, about 6300 mg, about 6325 mg, about 6350 mg, about 6375 mg, about 6400 mg, about 6425 mg, about 6450 mg, about 6475 mg, about 6500 mg, about 6525 mg, about 6550 mg, about 6575 mg, about 6600 mg, about 6625 mg, about 6650 mg, about 6675 mg, about 6700 mg, about 6725 mg, about 6750 mg, about 6775 mg, about 6800 mg, about 6825 mg, about 6850 mg, about 6875 mg, about 6900 mg, about 6925 mg, about 6950 mg, about 6975 mg, about 7000 mg, about 7025 mg, about 7050 mg, about 7075 mg, about 7100 mg, about 7125 mg, about 7150 mg, about 7175 mg, about 7200 mg, about 7225 mg, about 7250 mg, about 7275 mg, about 7300 mg, about 7325 mg, about 7350 mg, about 7375 mg, about 7400 mg, about 7425 mg, about 7450 mg, about 7475 mg, about 7500 mg, about 7525 mg, about 7550 mg, about 7575 mg, about 7600 mg, about 7625 mg, about 7650 mg, about 7675 mg, about 7700 mg, about 7725 mg, about 7750 mg, about 7775 mg, about 7800 mg, about 7825 mg, about 7850 mg, about 7875 mg, about 7900 mg, about 7925 mg, about 7950 mg, about 7975 mg, about 8000 mg, about 8025 mg, about 8050 mg, about 8075 mg, about 8100 mg, about 8125 mg, about 8150 mg, about 8175 mg, about 8200 mg, about 8225 mg, about 8250 mg, about 8275 mg, about 8300 mg, about 8325 mg, about 8350 mg, about 8375 mg, about 8400 mg, about 8425 mg, about 8450 mg, about 8475 mg, about 8500 mg, about 8525 mg, about 8550 mg, about 8575 mg, about 8600 mg, about 8625 mg, about 8650 mg, about 8675 mg, about 8700 mg, about 8725 mg, about 8750 mg, about 8775 mg, about 8800 mg, about 8825 mg, about 8850 mg, about 8875 mg, about 8900 mg, about 8925 mg, about 8950 mg, about 8975 mg, about 9000 mg, about 9025 mg, about 9050 mg, about 9075 mg, about 9100 mg, about 9125 mg, about 9150 mg, about 9175 mg, about 9200 mg, about 9225 mg, about 9250 mg, about 9275 mg, about 9300 mg, about 9325 mg, about 9350 mg, about 9375 mg, about 9400 mg, about 9425 mg, about 9450 mg, about 9475 mg, about 9500 mg, about 9525 mg, about 9550 mg, about 9575 mg, about 9600 mg, about 9625 mg, about 9650 mg, about 9675 mg, about 9700 mg, about 9725 mg, about 9750 mg, about 9775 mg, about 9800 mg, about 9825 mg, about 9850 mg, about 9875 mg, about 9900 mg, about 9925 mg, about 9950 mg, about 9975 mg, or about 10,000 mg.
[0099] In another embodiment, any of the methods disclosed herein are used in treatment or prevention of a subject or subjects that consume a traditional Western diet. In one embodiment, the methods of the invention include a step of identifying a subject as a Western diet consumer or prudent diet consumer and then treating the subject if the subject is deemed a Western diet consumer. The term "Western diet" herein refers generally to a typical diet consisting of, by percentage of total calories, about 45% to about 50% carbohydrate, about 35% to about 40% fat, and about 10% to about 15% protein. A Western diet may alternately or additionally be characterized by relatively high intakes of red and processed meats, sweets, refined grains, and desserts, for example more than 50%, more than 60% or more or 70% of total calories come from these sources.
[0100] In one embodiment, a composition for use in methods of the invention comprises eicosapentaenoic acid, or a pharmaceutically acceptable ester, derivative, conjugate or salt thereof, or mixtures of any of the foregoing, collectively referred to herein as "EPA." The term "pharmaceutically acceptable" in the present context means that the substance in question does not produce unacceptable toxicity to the subject or interaction with other components of the composition.
[0101] In one embodiment, the EPA comprises all-cis eicosa-5,8,11,14,17-pentaenoic acid. In another embodiment, the EPA comprises an eicosapentaenoic acid ester. In another embodiment, the EPA comprises a C.sub.1-C.sub.5 alkyl ester of eicosapentaenoic acid. In another embodiment, the EPA comprises eicosapentaenoic acid ethyl ester, eicosapentaenoic acid methyl ester, eicosapentaenoic acid propyl ester, or eicosapentaenoic acid butyl ester. In another embodiment, the EPA comprises In one embodiment, the EPA comprises all-cis eicosa-5,8,11,14,17-pentaenoic acid ethyl ester.
[0102] In another embodiment, the EPA is in the form of ethyl-EPA, lithium EPA, mono-, di- or triglyceride EPA or any other ester or salt of EPA, or the free acid form of EPA. The EPA may also be in the form of a 2-substituted derivative or other derivative which slows down its rate of oxidation but does not otherwise change its biological action to any substantial degree.
[0103] In another embodiment, EPA is present in a composition useful in accordance with methods of the invention in an amount of about 50 mg to about 5000 mg, about 75 mg to about 2500 mg, or about 100 mg to about 1000 mg, for example about 75 mg, about 100 mg, about 125 mg, about 150 mg, about 175 mg, about 200 mg, about 225 mg, about 250 mg, about 275 mg, about 300 mg, about 325 mg, about 350 mg, about 375 mg, about 400 mg, about 425 mg, about 450 mg, about 475 mg, about 500 mg, about 525 mg, about 550 mg, about 575 mg, about 600 mg, about 625 mg, about 650 mg, about 675 mg, about 700 mg, about 725 mg, about 750 mg, about 775 mg, about 800 mg, about 825 mg, about 850 mg, about 875 mg, about 900 mg, about 925 mg, about 950 mg, about 975 mg, about 1000 mg, about 1025 mg, about 1050 mg, about 1075 mg, about 1100 mg, about 1025 mg, about 1050 mg, about 1075 mg, about 1200 mg, about 1225 mg, about 1250 mg, about 1275 mg, about 1300 mg, about 1325 mg, about 1350 mg, about 1375 mg, about 1400 mg, about 1425 mg, about 1450 mg, about 1475 mg, about 1500 mg, about 1525 mg, about 1550 mg, about 1575 mg, about 1600 mg, about 1625 mg, about 1650 mg, about 1675 mg, about 1700 mg, about 1725 mg, about 1750 mg, about 1775 mg, about 1800 mg, about 1825 mg, about 1850 mg, about 1875 mg, about 1900 mg, about 1925 mg, about 1950 mg, about 1975 mg, about 2000 mg, about 2025 mg, about 2050 mg, about 2075 mg, about 2100 mg, about 2125 mg, about 2150 mg, about 2175 mg, about 2200 mg, about 2225 mg, about 2250 mg, about 2275 mg, about 2300 mg, about 2325 mg, about 2350 mg, about 2375 mg, about 2400 mg, about 2425 mg, about 2450 mg, about 2475 mg, about 2500 mg, about 2525 mg, about 2550 mg, about 2575 mg, about 2600 mg, about 2625 mg, about 2650 mg, about 2675 mg, about 2700 mg, about 2725 mg, about 2750 mg, about 2775 mg, about 2800 mg, about 2825 mg, about 2850 mg, about 2875 mg, about 2900 mg, about 2925 mg, about 2950 mg, about 2975 mg, about 3000 mg, about 3025 mg, about 3050 mg, about 3075 mg, about 3100 mg, about 3125 mg, about 3150 mg, about 3175 mg, about 3200 mg, about 3225 mg, about 3250 mg, about 3275 mg, about 3300 mg, about 3325 mg, about 3350 mg, about 3375 mg, about 3400 mg, about 3425 mg, about 3450 mg, about 3475 mg, about 3500 mg, about 3525 mg, about 3550 mg, about 3575 mg, about 3600 mg, about 3625 mg, about 3650 mg, about 3675 mg, about 3700 mg, about 3725 mg, about 3750 mg, about 3775 mg, about 3800 mg, about 3825 mg, about 3850 mg, about 3875 mg, about 3900 mg, about 3925 mg, about 3950 mg, about 3975 mg, about 4000 mg, about 4025 mg, about 4050 mg, about 4075 mg, about 4100 mg, about 4125 mg, about 4150 mg, about 4175 mg, about 4200 mg, about 4225 mg, about 4250 mg, about 4275 mg, about 4300 mg, about 4325 mg, about 4350 mg, about 4375 mg, about 4400 mg, about 4425 mg, about 4450 mg, about 4475 mg, about 4500 mg, about 4525 mg, about 4550 mg, about 4575 mg, about 4600 mg, about 4625 mg, about 4650 mg, about 4675 mg, about 4700 mg, about 4725 mg, about 4750 mg, about 4775 mg, about 4800 mg, about 4825 mg, about 4850 mg, about 4875 mg, about 4900 mg, about 4925 mg, about 4950 mg, about 4975 mg, or about 5000 mg
[0104] In another embodiment, a composition useful in accordance with the invention contains not more than about 10%, not more than about 9%, not more than about 8%, not more than about 7%, not more than about 6%, not more than about 5%, not more than about 4%, not more than about 3%, not more than about 2%, not more than about 1%, or not more than about 0.5%, by weight of all fatty acids (and/or derivatives thereof) present, docosahexaenoic acid (DHA), if any. In another embodiment, a composition of the invention contains substantially no docosahexaenoic acid. In still another embodiment, a composition useful in the present invention contains no docosahexaenoic acid and/or derivative thereof.
[0105] In another embodiment, EPA comprises at least 70%, at least 80%, at least 90%, at least 95%, at least 96%, at least 97%, at least 98%, at least 99%, or 100%, by weight of all fatty acids (and/or derivatives thereof) present, in a composition that is useful in methods of the present invention.
[0106] In one embodiment, a composition of the invention comprises ultra-pure EPA. The term "ultra-pure" as used herein with respect to EPA refers to a composition comprising at least 95%, by weight of all fatty acids (and/or derivatives thereof) present, EPA (as the term "EPA" is defined and exemplified herein). Ultra-pure EPA comprises at least 96%, by weight of all fatty acids (and/or derivatives thereof) present, EPA, at least 97%, by weight of all fatty acids (and/or derivatives thereof) present, EPA, or at least 98%, by weight of all fatty acids (and/or derivatives thereof) present, EPA, wherein the EPA is any form of EPA as set forth herein.
[0107] In another embodiment, a composition useful in accordance with methods of the invention contains less than 10%, less than 9%, less than 8%, less than 7%, less than 6%, less than 5%, less than 4%, less than 3%, less than 2%, less than 1%, less than 0.5% or less than 0.25%, by weight of all fatty acids (and/or derivatives thereof) present, of any fatty acid other than EPA. Illustrative examples of a "fatty acid other than EPA" include linolenic acid (LA), arachidonic acid (AA), docosahexaenoic acid (DHA), alpha-linolenic acid (ALA), stearidonic acid (STA), eicosatrienoic acid (ETA) and/or docosapentaenoic acid (DPA). In another embodiment, a composition useful in accordance with methods of the invention contains about 0.1% to about 4%, about 0.5% to about 3%, or about 1% to about 2%, by weight of all fatty acids (and/or derivatives thereof) present, other than EPA and/or DHA.
[0108] In another embodiment, a composition useful in accordance with the invention has one or more of the following features: (a) eicosapentaenoic acid ethyl ester represents at least about 96%, at least about 97%, or at least about 98%, by weight of all fatty acids (and/or derivatives thereof) present, in the composition; (b) the composition contains not more than about 4%, not more than about 3%, or not more than about 2%, by weight of all fatty acids (and/or derivatives thereof) present, other than eicosapentaenoic acid ethyl ester; (c) the composition contains not more than about 0.6%, not more than about 0.5%, or not more than about 0.4%, by weight of all fatty acids (and/or derivatives thereof) present, of any individual fatty acid other than eicosapentaenoic acid ethyl ester; (d) the composition has a refractive index (20.degree. C.) of about 1 to about 2, about 1.2 to about 1.8 or about 1.4 to about 1.5; (e) the composition has a specific gravity (20.degree. C.) of about 0.8 to about 1.0, about 0.85 to about 0.95 or about 0.9 to about 0.92; (e) the composition contains not more than about 20 ppm, not more than about 15 ppm or not more than about 10 ppm heavy metals, (f) the composition contains not more than about 5 ppm, not more than about 4 ppm, not more than about 3 ppm, or not more than about 2 ppm arsenic, and/or (g) the composition has a peroxide value of not more than about 5 meq/kg, not more than about 4 meq/kg, not more than about 3 meq/kg, or not more than about 2 meq/kg.
[0109] In another embodiment, a composition useful in accordance with the invention comprises, consists of or consists essentially of at least 95%, by weight of all fatty acids (and/or derivatives thereof) present, ethyl eicosapentaenoate (EPA-E), about 0.2% to about 0.5%, by weight of all fatty acids (and/or derivatives thereof) present, ethyl octadecatetraenoate (ODTA-E), about 0.05% to about 0.25%, by weight of all fatty acids (and/or derivatives thereof) present, ethyl nonadecapentaenoate (NDPA-E), about 0.2% to about 0.45%, by weight of all fatty acids (and/or derivatives thereof) present, ethyl arachidonate (AA-E), about 0.3% to about 0.5%, by weight of all fatty acids (and/or derivatives thereof) present, ethyl eicosatetraenoate (ETA-E), and about 0.05% to about 0.32%, by weight of all fatty acids (and/or derivatives thereof) present, ethyl heneicosapentaenoate (HPA-E). In another embodiment, the composition is present in a capsule shell.
[0110] In another embodiment, compositions useful in accordance with the invention comprise, consist essential of, or consist of at least 95%, 96% or 97%, by weight of all fatty acids (and/or derivatives thereof) present, ethyl eicosapentaenoate, about 0.2% to about 0.5% by weight ethyl octadecatetraenoate, about 0.05% to about 0.25%, by weight of all fatty acids (and/or derivatives thereof) present, ethyl nonadecapentaenoate, about 0.2% to about 0.45%, by weight of all fatty acids (and/or derivatives thereof) present, ethyl arachidonate, about 0.3% to about 0.5%, by weight of all fatty acids (and/or derivatives thereof) present, ethyl eicosatetraenoate, and about 0.05% to about 0.32%, by weight of all fatty acids (and/or derivatives thereof) present, ethyl heneicosapentaenoate. Optionally, the composition contains not more than about 0.06%, about 0.05%, or about 0.04%, by weight of all fatty acids (and/or derivatives thereof) present, DHA or derivative thereof such as ethyl-DHA. In one embodiment the composition contains substantially no or no amount of DHA or derivative thereof such as ethyl-DHA. The composition further optionally comprises one or more antioxidants (e.g. tocopherol) or other impurities in an amount of not more than about 0.5% or not more than 0.05%. In another embodiment, the composition comprises about 0.05% to about 0.4%, for example about 0.2% by weight tocopherol. In another embodiment, about 500 mg to about 1 g of the composition is provided in a capsule shell.
[0111] In another embodiment, compositions useful in accordance with the invention comprise, consist essential of, or consist of at least 96%, by weight of all fatty acids (and/or derivatives thereof) present, ethyl eicosapentaenoate, about 0.22% to about 0.4%, by weight of all fatty acids (and/or derivatives thereof) present, ethyl octadecatetraenoate, about 0.075% to about 0.20%, by weight of all fatty acids (and/or derivatives thereof) present, ethyl nonadecapentaenoate, about 0.25% to about 0.40%, by weight of all fatty acids (and/or derivatives thereof) present, ethyl arachidonate, about 0.3% to about 0.4%, by weight of all fatty acids (and/or derivatives thereof) present, ethyl eicosatetraenoate and about 0.075% to about 0.25%, by weight of all fatty acids (and/or derivatives thereof) present, ethyl heneicosapentaenoate. Optionally, the composition contains not more than about 0.06%, about 0.05%, or about 0.04%, by weight of all fatty acids (and/or derivatives thereof) present, DHA or derivative thereof such as ethyl-DHA. In one embodiment the composition contains substantially no or no amount of DHA or derivative thereof such as ethyl-DHA. The composition further optionally comprises one or more antioxidants (e.g. tocopherol) or other impurities in an amount of not more than about 0.5% or not more than 0.05%. In another embodiment, the composition comprises about 0.05% to about 0.4%, for example about 0.2% by weight tocopherol. In another embodiment, the invention provides a dosage form comprising about 500 mg to about 1 g of the foregoing composition in a capsule shell. In one embodiment, the dosage form is a gel or liquid capsule and is packaged in blister packages of about 1 to about 20 capsules per sheet.
[0112] In another embodiment, compositions useful in accordance with the invention comprise, consist essential of, or consist of at least 96%, 97% or 98%, by weight of all fatty acids (and/or derivatives thereof) present, ethyl eicosapentaenoate, about 0.25% to about 0.38%, by weight of all fatty acids (and/or derivatives thereof) present, ethyl octadecatetraenoate, about 0.10% to about 0.15%, by weight of all fatty acids (and/or derivatives thereof) present, ethyl nonadecapentaenoate, about 0.25% to about 0.35%, by weight of all fatty acids (and/or derivatives thereof) present, ethyl arachidonate, about 0.31% to about 0.38%, by weight of all fatty acids (and/or derivatives thereof) present, ethyl eicosatetraenoate, and about 0.08% to about 0.20%, by weight of all fatty acids (and/or derivatives thereof) present, ethyl heneicosapentaenoate. Optionally, the composition contains not more than about 0.06%, about 0.05%, or about 0.04%, by weight of all fatty acids (and/or derivatives thereof) present, DHA or derivative thereof such as ethyl-DHA. In one embodiment the composition contains substantially no or no amount of DHA or derivative thereof such as ethyl-DHA. The composition further optionally comprises one or more antioxidants (e.g. tocopherol) or other impurities in an amount of not more than about 0.5% or not more than 0.05%. In another embodiment, the composition comprises about 0.05% to about 0.4%, for example about 0.2% by weight tocopherol. In another embodiment, the invention provides a dosage form comprising about 500 mg to about 1 g of the foregoing composition in a capsule shell.
[0113] In another embodiment, a composition as described herein is administered to a subject once or twice per day. In another embodiment, 1, 2, 3 or 4 capsules, each containing about 1 g of a composition as described herein, are administered to a subject daily. In another embodiment, 1 or 2 capsules, each containing about 1 g of a composition as described herein, are administered to the subject in the morning, for example between about 5 am and about 11 am, and 1 or 2 capsules, each containing about 1 g of a composition as described herein, are administered to the subject in the evening, for example between about 5 pm and about 11 pm.
[0114] In one embodiment, a subject being treated in accordance with methods of the invention is not otherwise on lipid-altering therapy, for example statin, fibrate, niacin and/or ezetimibe therapy.
[0115] In another embodiment, compositions useful in accordance with methods of the invention are orally deliverable. The terms "orally deliverable" or "oral administration" herein include any form of delivery of a therapeutic agent or a composition thereof to a subject wherein the agent or composition is placed in the mouth of the subject, whether or not the agent or composition is swallowed. Thus "oral administration" includes buccal and sublingual as well as esophageal administration. In one embodiment, the composition is present in a capsule, for example a soft gelatin capsule.
[0116] A composition for use in accordance with the invention can be formulated as one or more dosage units. The terms "dose unit" and "dosage unit" herein refer to a portion of a pharmaceutical composition that contains an amount of a therapeutic agent suitable for a single administration to provide a therapeutic effect. Such dosage units may be administered one to a plurality (i.e. 1 to about 10, 1 to 8, 1 to 6, 1 to 4 or 1 to 2) of times per day, or as many times as needed to elicit a therapeutic response.
[0117] In another embodiment, the invention provides use of any composition described herein for treating moderate to severe hypertriglyceridemia in a subject in need thereof, comprising: providing a subject having a fasting baseline triglyceride level of 500 mg/dl to about 1500 mg/dl and administering to the subject a pharmaceutical composition as described herein. In one embodiment, the composition comprises about 1 g to about 4 g of eicosapentaenoic acid ethyl ester, wherein the composition contains substantially no docosahexaenoic acid. In some embodiments, cholesterol domain formation in membranes of the subject is reduced or prevented. In some embodiments, the subject experiences no substantial increase, or no increase, or a reduction, in LDL-C levels.
[0118] In another embodiment, the invention provides use of any composition described herein for treating moderate to severe hypertriglyceridemia in a subject in need thereof, comprising: providing a subject on statin therapy and having a fasting baseline triglyceride level of about 200 mg/dl to 499 mg/dl and administering to the subject a pharmaceutical composition as described herein. In one embodiment, the composition comprises about 1 g to about 4 g of eicosapentaenoic acid ethyl ester, wherein the composition contains substantially no docosahexaenoic acid. In some embodiments, cholesterol domain formation in membranes of the subject is reduced or prevented. In some embodiments, the subject experiences no substantial increase, or no increase, or a reduction, in LDL-C levels.
[0119] In one embodiment, compositions of the invention, upon storage in a closed container maintained at room temperature, refrigerated (e.g. about 5 to about 5-10.degree. C.) temperature, or frozen for a period of about 1, 2, 3, 4, 5, 6, 7, 8, 9, 10, 11, or 12 months, exhibit at least about 90%, at least about 95%, at least about 97.5%, or at least about 99% of the active ingredient(s) originally present therein.
[0120] In one embodiment, the invention provides use of a composition as described herein in manufacture of a medicament for treatment of any of a cardiovascular-related disease. In another embodiment, the subject is diabetic.
[0121] In one embodiment, a composition as set forth herein is packaged together with instructions for using the composition to treat a cardiovascular disorder.
EXAMPLES
Example 1
[0122] A multi-center, placebo-controlled randomized, double-blind, 12-week study with an open-label extension was performed to evaluate the efficacy and safety of AMR101 in patients with fasting triglyceride levels .gtoreq.500 mg/dL. The primary objective of the study was to determine the efficacy of AMR101 2 g daily and 4 g daily, compared to placebo, in lowering fasting TG levels in patients with fasting TG levels .gtoreq.500 mg/dL and .ltoreq.1500 mg/dL (.gtoreq.5.65 mmol/L and .ltoreq.16.94 mmol/L).
[0123] The secondary objectives of this study were the following: [0124] 1. To determine the safety and tolerability of AMR101 2 g daily and 4 g daily; [0125] 2. To determine the effect of AMR101 on lipid and apolipoprotein profiles; [0126] 3. To determine the effect of AMR101 on low-density lipoprotein (LDL) particle number and size; [0127] 4. To determine the effect of AMR101 on oxidized LDL; [0128] 5. To determine the effect of AMR101 on fasting plasma glucose (FPG) and hemoglobin A.sub.1c (HbA.sub.1c); [0129] 6. To determine the effect of AMR101 on insulin resistance; [0130] 7. To determine the effect of AMR101 on high-sensitivity C-reactive protein (hsCRP); [0131] 8. To determine the effects of AMR101 2 g daily and 4 g daily on the incorporation of fatty acids into red blood cell membranes and into plasma phospholipids; [0132] 9. To explore the relationship between baseline fasting TG levels and the reduction in fasting TG levels; and [0133] 10. To explore the relationship between an increase in red blood cell membrane eicosapentaenoic acid (EPA) concentrations and the reduction in fasting TG levels.
[0134] The population for this study was men and women (women of childbearing potential needed to be on contraception or practice abstinence)>18 years of age with a body mass index kg/m.sup.2 who were not on lipid-altering therapy or were not currently on lipid-altering therapy. Patients currently on statin therapy (with or without ezetimibe) were evaluated by the investigator as to whether this therapy could be safely discontinued at screening, or if it should have been continued. If statin therapy (with or without ezetimibe) was to be continued, dose(s) must have been stable for .gtoreq.weeks prior to randomization. Patients taking non-statin, lipid-altering medications (niacin >200 mg/day, fibrates, fish oil, other products containing omega-3 fatty acids, or other herbal products or dietary supplements with potential lipid-altering effects), either alone or in combination with statin therapy (with or without ezetimibe), must have been able to safely discontinue non-statin, lipid-altering therapy at screening.
[0135] Approximately 240 patients were randomized at approximately 50 centers in North America, South America, Central America, Europe, India, and South Africa. The study was a 58- to 60-week, Phase 3, multi-center study consisting of 3 study periods: (1) a 6- to 8-week screening period that included a diet and lifestyle stabilization and washout period and a TG qualifying period; (2) a 12-week, double-blind, randomized, placebo-controlled treatment period; and (3) a 40-week, open-label, extension period.
[0136] During the screening period and double-blind treatment period, all visits were within .+-.3 days of the scheduled time. During the open-label extension period, all visits were within .+-.7 days of the scheduled time. The screening period included a 4- or 6-week diet and lifestyle stabilization period and washout period followed by a 2-week TG qualifying period.
[0137] The screening visit (Visit 1) occurred for all patients at either 6 weeks (for patients not on lipid-altering therapy at screening or for patients who did not need to discontinue their current lipid-altering therapy) or 8 weeks (for patients who required washout of their current lipid-altering therapy at screening) before randomization, as follows:
[0138] Patients who did not require a washout: The screening visit will occur at Visit 1 (Week -6). Eligible patients entered a 4-week diet and lifestyle stabilization period. At the screening visit, all patients received counseling regarding the importance of the National Cholesterol Education Program (NCEP) Therapeutic Lifestyle Changes (TLC) diet and received instructions on how to follow this diet. Patients who required a washout: The screening visit occurred at Visit 1 (Week -8). Eligible patients began a 6-week washout period at the screening visit. Patients received counseling regarding the NCEP TLC diet and received instructions on how to follow this diet. Site personnel contacted patients who did not qualify for participation based on screening laboratory test results to instruct them to resume their prior lipid-altering medications.
[0139] At the end of the 4-week diet and lifestyle stabilization period or the 6-week diet and stabilization and washout period, eligible patients entered the 2-week TG qualifying period and had their fasting TG level measured at Visit 2 (Week -2) and Visit 3 (Week -1). Eligible patients must have had an average fasting TG level .gtoreq.500 mg/dL and .ltoreq.1500 mg/dL (.gtoreq.5.65 mmol/L and .ltoreq.16.94 mmol/L) to enter the 12-week double-blind treatment period. The TG level for qualification was based on the average (arithmetic mean) of the Visit 2 (Week -2) and Visit 3 (Week -1) values. If a patient's average TG level from Visit 2 and Visit 3 fell outside the required range for entry into the study, an additional sample for fasting TG measurement was collected 1 week later at Visit 3.1. If a third sample was collected at Visit 3.1, entry into the study was based on the average (arithmetic mean) of the values from Visit 3 and Visit 3.1.
[0140] After confirmation of qualifying fasting TG values, eligible patients entered a 12-week, randomized, double-blind treatment period. At Visit 4 (Week 0), patients were randomly assigned to one of the following treatment groups: [0141] AMR101 2 g daily, [0142] AMR101 4 g daily, or [0143] Placebo.
[0144] During the double-blind treatment period, patients returned to the site at Visit 5 (Week 4), Visit 6 (Week 11), and Visit 7 (Week 12) for efficacy and safety evaluations.
[0145] Patients who completed the 12-week double-blind treatment period were eligible to enter a 40-week, open-label, extension period at Visit 7 (Week 12). All patients received open-label AMR101 4 g daily. From Visit 8 (Week 16) until the end of the study, changes to the lipid-altering regimen were permitted (e.g., initiating or raising the dose of statin or adding non-statin, lipid-altering medications to the regimen), as guided by standard practice and prescribing information. After Visit 8 (Week 16), patients returned to the site every 12 weeks until the last visit at Visit 11 (Week 52).
[0146] Eligible patients were randomly assigned at Visit 4 (Week 0) to orally receive AMR101 2 g daily, AMR101 4 g daily, or placebo for the 12-week double-blind treatment period. AMR101 was provided in 1 g liquid-filled, oblong, gelatin capsules. The matching placebo capsule was filled with light liquid paraffin and contained 0 g of AMR101. During the double-blind treatment period, patients took 2 capsules (AMR101 or matching placebo) in the morning and 2 in the evening for a total of 4 capsules per day. Patients in the AMR101 2 g/day treatment group received 1 AMR101 1 g capsule and 1 matching placebo capsule in the morning and in the evening. Patients in the AMR101 4 g/day treatment group received 2 AMR101 1 g capsules in the morning and evening.
[0147] Patients in the placebo group received 2 matching placebo capsules in the morning and evening. During the extension period, patients received open-label AMR101 4 g daily. Patients took 2 AMR101 1 g capsules in the morning and 2 in the evening.
[0148] The primary efficacy variable for the double-blind treatment period was percent change in TG from baseline to Week 12 endpoint. The secondary efficacy variables for the double-blind treatment period included the following: [0149] Percent changes in total cholesterol (TC), high-density lipoprotein cholesterol (HDL-C), calculated low-density lipoprotein cholesterol (LDL-C), calculated non-high-density lipoprotein cholesterol (non-HDL-C), and very low-density lipoprotein cholesterol (VLDL-C) from baseline to Week 12 endpoint; [0150] Percent change in very low-density lipoprotein TG from baseline to Week 12; [0151] Percent changes in apolipoprotein A-I (apo A-I), apolipoprotein B (apo B), and apo A-I/apo B ratio from baseline to Week 12; [0152] Percent changes in lipoprotein(a) from baseline to Week 12 (selected sites only); [0153] Percent changes in LDL particle number and size, measured by nuclear magnetic resonance, from baseline to Week 12 (selected sites only); [0154] Percent change in remnant-like particle cholesterol from baseline to Week 12 (selected sites only); [0155] Percent change in oxidized LDL from baseline to Week 12 (selected sites only); [0156] Changes in FPG and HbA.sub.1c from baseline to Week 12; [0157] Change in insulin resistance, as assessed by the homeostasis model index insulin resistance, from baseline to Week 12; [0158] Percent change in lipoprotein associated phospholipase A2 from baseline to Week 12 (selected sites only); [0159] Change in intracellular adhesion molecule-1 from baseline to Week 12 (selected sites only); [0160] Change in interleukin-6 from baseline to Week 12 (selected sites only); [0161] Change in plasminogen activator inhibitor-1 from baseline to Week 12 (selected sites only); [0162] Change in hsCRP from baseline to Week 12 (selected sites only); [0163] Change in serum phospholipid EPA content from baseline to Week 12; [0164] Change in red blood cell membrane EPA content from baseline to Week 12; and [0165] Change in serum phospholipid and red blood cell membrane content in the following fatty acids from baseline to Week 12: docosapentaenoic acid, docosahexaenoic acid, arachidonic acid, palmitic acid, stearic acid, and oleic acid.
[0166] The efficacy variable for the open-label extension period was percent change in fasting TG from extension baseline to end of treatment. Safety assessments included adverse events, clinical laboratory measurements (chemistry, hematology, and urinalysis), 12-lead electrocardiograms (ECGs), vital signs, and physical examinations
[0167] For TG, TC, HDL-C, calculated LDL-C, calculated non-HDL-C, and VLDL-C, baseline was defined as the average of Visit 4 (Week 0) and the preceding lipid qualifying visit (either Visit 3 [Week -1] or if it occurs, Visit 3.1) measurements. Baseline for all other efficacy parameters was the Visit 4 (Week 0) measurement.
[0168] For TC, HDL-C, calculated LDL-C, calculated non-HDL-C, and VLDL-C, Week 12 endpoint was defined as the average of Visit 6 (Week 11) and Visit 7 (Week 12) measurements. Week 12 endpoint for all other efficacy parameters was the Visit 7 (Week 12) measurement.
[0169] The primary efficacy analysis was performed using a 2-way analysis of covariance (ANCOVA) model with treatment as a factor and baseline TG value as a covariate. The least-squares mean, standard error, and 2-tailed 95% confidence interval for each treatment group and for each comparison was estimated. The same 2-way ANCOVA model was used for the analysis of secondary efficacy variables.
[0170] The primary analysis was repeated for the per-protocol population to confirm the robustness of the results for the intent-to-treat population.
[0171] The primary efficacy variable was the percent change in fasting TG levels from baseline to Week 12. A sample size of 69 completed patients per treatment group was expected to provide 90% power to detect a difference of 30% between AMR101 and placebo in percent change from baseline in fasting TG levels, assuming a standard deviation of 45% in TG measurements and a significance level of p<0.01. To accommodate a 15% drop-out rate from randomization to completion of the double-blind treatment period, a total of 240 randomized patients was planned (80 patients per treatment group).
Example 2
[0172] A multi-center, placebo-controlled, randomized, double-blind, 12-week study was performed to evaluate the efficacy and safety of >96% E-EPA in patients with fasting triglyceride levels .gtoreq.200 mg/dl and <500 mg/dl despite statin therapy (the mean of two qualifying entry values needed to be .gtoreq.185 mg/dl and at least one of the values needed to be .gtoreq.200 mg/dl). The primary objective of the study was to determine the efficacy of >96% E-EPA 2 g daily and 4 g daily, compared to placebo, in lowering fasting TG levels in patients with high risk for cardiovascular disease and with fasting TG levels .gtoreq.200 mg/dl and <500 mg/dl, despite treatment to LDL-C goal on statin therapy.
[0173] The secondary objectives of this study were the following: [0174] 1. To determine the safety and tolerability of >96% E-EPA 2 g daily and 4 g daily; [0175] 2. To determine the effect of >96% E-EPA on lipid and apolipoprotein profiles including total cholesterol (TC), non-high-density lipoprotein cholesterol (non-HDL-C), low density lipoprotein cholesterol (LDL-C), high density lipoprotein cholesterol (HDL-C), and very high density lipoprotein cholesterol (VHDL-C); [0176] 3. To determine the effect of >96% E-EPA on lipoprotein associated phospholipase A.sub.2 (Lp-PLA.sub.2) from baseline to week 12; [0177] 4. To determine the effect of >96% E-EPA on low-density lipoprotein (LDL) particle number and size; [0178] 5. To determine the effect of >96% E-EPA on oxidized LDL; [0179] 6. To determine the effect of >96% E-EPA on fasting plasma glucose (FPG) and hemoglobin A.sub.1c (HbA.sub.1c); [0180] 7. To determine the effect of >96% E-EPA on insulin resistance; [0181] 8. To determine the effect of >96% E-EPA on high-sensitivity C-reactive protein (hsCRP); [0182] 9. To determine the effects of >96% E-EPA 2 g daily and 4 g daily on the incorporation of fatty acids into red blood cell membranes and into plasma phospholipids; [0183] 10. To explore the relationship between baseline fasting TG levels and the reduction in fasting TG levels; and [0184] 11. To explore the relationship between changes of fatty acid concentrations in plasma and red blood cell membranes, and the reduction in fasting TG levels.
[0185] The population for this study was men and women >18 years of age with a body mass index .ltoreq.45 kg/m.sup.2 with fasting TG levels greater than or equal to 200 mg/dl and less than 500 mg/dl and on a stable does of statin therapy (with or without ezetimibe). The statin was atorvostatin, rosuvastatin or simvastatin. The dose of statin must have been stable for .gtoreq.4 weeks prior to the LDL-C/TG baseline qualifying measurement for randomization. The statin dose was optimized such that the patients are at their LDL-C goal at the LDL-C/TG baseline qualifying measurements. The same statin at the same dose was continued until the study ended.
[0186] Patients taking any additional non-statin, lipid-altering medications (niacin >200 mg/day, fibrates, fish oil, other products containing omega-3 fatty acids, or other herbal products or dietary supplements with potential lipid-altering effects), either alone or in combination with statin therapy (with or without ezetimibe), must have been able to safely discontinue non-statin, lipid-altering therapy at screening.
[0187] Patients at high risk for CVD, i.e., patients with clinical coronary heart disease (CHD) or clinical CHD risk equivalents (10-year risk >20%) as defined in the National Cholesterol Education Program (NCEP) Adult Treatment Panel III (ATP III) Guidelines were eligible to participate in this study. Those included patients with any of the following criteria: (1) Known CVD, either clinical coronary heart disease (CHD), symptomatic carotid artery disease (CAD), peripheral artery disease (PAD) or abdominal aortic aneurism; or (2) Diabetes Mellitus (Type 1 or 2).
[0188] Approximately 702 patients were randomized at approximately 80 centers in the U.S. The study was a 18- to 20-week, Phase 3, multi-center study consisting of 2 study periods: (1) A 6- to 8-week screening period that included a diet and lifestyle stabilization, a non-statin lipid-altering treatment washout, and an LDL-C and TG qualifying period and (2) A 12-week, double-blind, randomized, placebo-controlled treatment period.
[0189] During the screening period and double-blind treatment period, all visits were within .+-.3 days of the scheduled time. All patients continued to take the statin product (with or without ezetimibe) at the same dose they were taking at screening throughout their participation in the study.
[0190] The 6- to 8-week screening period included a diet and lifestyle stabilization, a non-statin lipid-altering treatment washout, and an LDL-C and TG qualifying period. The screening visit (Visit 1) occurred for all patients at either 6 weeks (for patients on stable statin therapy [with or without ezetimibe] at screening) or 8 weeks (for patients who will require washout of their current non-statin lipid-altering therapy at screening) before randomization, as follows: [0191] Patients who did not require a washout: The screening visit occurred at Visit 1 (Week -6). Eligible patients entered a 4-week diet and lifestyle stabilization period. At the screening visit, all patients received counseling regarding the importance of the National Cholesterol Education Program (NCEP) Therapeutic Lifestyle Changes (TLC) diet and received basic instructions on how to follow this diet. [0192] Patients who required a washout: The screening visit occurred at Visit 1 (Week -8). Eligible patients began a 6-week washout period at the screening visit (i.e. 6 weeks washout before the first LDL-C/TG qualifying visit). Patients received counseling regarding the NCEP TLC diet and received basic instructions on how to follow this diet. Site personnel contacted patients who did not qualify for participation based on screening laboratory test results to instruct them to resume their prior lipid-altering medications.
[0193] At the end of the 4-week diet and lifestyle stabilization period or the 6-week diet and stabilization and washout period, eligible patients entered the 2-week LDL-C and TG qualifying period and had their fasting LDL-C and TG levels measured at Visit 2 (Week -2) and Visit 3 (Week -1). Eligible patients must have had an average fasting LDL-C level .gtoreq.40 mg/dL and <100 mg/dL and an average fasting TG level .gtoreq.200 mg/dL and <500 mg/dL to enter the 12-week double-blind treatment period. The LDL-C and TG levels for qualification were based on the average (arithmetic mean) of the Visit 2 (Week -2) and Visit 3 (Week -1) values. If a patient's average LDL-C and/or TG levels from Visit 2 and Visit 3 fell outside the required range for entry into the study, an additional fasting lipid profile was collected 1 week later at Visit 3.1. If a third sample was collected at Visit 3.1, entry into the study was based on the average (arithmetic mean) of the values from Visit 3 and Visit 3.1.
[0194] After confirmation of qualifying fasting LDL-C and TG values, eligible patients entered a 12-week, randomized, double-blind treatment period. At Visit 4 (Week 0), patients were randomly assigned to 1 of the following treatment groups: [0195] >96% E-EPA 2 g daily, [0196] >96% E-EPA 4 g daily, or [0197] Placebo.
[0198] 226 to 234 patients per treatment group were randomized in this study. Stratification was by type of statin (atorvastatin, rosuvastatin or simvastatin), the presence of diabetes, and gender.
[0199] During the double-blind treatment period, patients returned to the site at Visit 5 (Week 4), Visit 6 (Week 11), and Visit 7 (Week 12) for efficacy and safety evaluations.
[0200] Eligible patients were randomly assigned at Visit 4 (Week 0) to receive orally >96% E-EPA 2 g daily, >96% E-EPA 4 g daily, or placebo.
[0201] >96% E-EPA was provided in 1 g liquid-filled, oblong, gelatin capsules. The matching placebo capsule was filled with light liquid paraffin and contained 0 g of >96% E-EPA. >96% E-EPA capsules were to be taken with food (i.e. with or at the end of a meal).
[0202] During the double-blind treatment period, patients were to take 2 capsules (>96% E-EPA or matching placebo) in the morning and 2 capsules in the evening for a total of 4 capsules per day. [0203] Patients in the >96% E-EPA 2 g/day treatment group received 1>96% E-EPA 1 g capsule and 1 matching placebo capsule in the morning and in the evening. [0204] Patients in the >96% E-EPA 4 g/day treatment group received 2>96% E-EPA 1 g capsules in the morning and evening.
[0205] Patients in the placebo group received 2 matching placebo capsules in the morning and evening.
[0206] The primary efficacy variable for the double-blind treatment period was percent change in TG from baseline to Week 12 endpoint. The secondary efficacy variables for the double-blind treatment period included the following: [0207] Percent changes in total cholesterol (TC), high-density lipoprotein cholesterol (HDL-C),
[0208] LDL-C, calculated non-HDL-C, and very low-density lipoprotein cholesterol (VLDL-C) from baseline to Week 12 endpoint; [0209] Percent change in very low-density lipoprotein TG from baseline to Week 12; [0210] Percent changes in apolipoprotein A-I (apo A-I), apolipoprotein B (apo B), and apo A-I/apo B ratio from baseline to Week 12; [0211] Percent changes in lipoprotein(a) from baseline to Week 12; [0212] Percent changes in LDL particle number and size, measured by nuclear magnetic resonance, from baseline to Week 12; [0213] Percent change in remnant-like particle cholesterol from baseline to Week 12; [0214] Percent change in oxidized LDL from baseline to Week 12; [0215] Changes in FPG and HbA.sub.1c from baseline to Week 12; [0216] Change in insulin resistance, as assessed by the homeostasis model index insulin resistance, from baseline to Week 12; [0217] Percent change in lipoprotein associated phospholipase A2 (Lp-PLA.sub.2) from baseline to Week 12; [0218] Change in intracellular adhesion molecule-1 from baseline to Week 12; [0219] Change in interleukin-2 from baseline to Week 12; [0220] Change in plasminogen activator inhibitor-1 from baseline to Week 12. Note: this parameter will only be collected at sites with proper storage conditions; [0221] Change in hsCRP from baseline to Week 12; and [0222] Change in plasma concentration and red blood cell membrane content of fatty acid from baseline to Week 12 including EPA, docosapentaenoic acid (DPA), docosahexaenoic acid (DHA), arachidonic acid (AA), dihomo-.gamma.-linolenic acid (DGLA), the ratio of EPA/AA, ratio of oleic acid/stearic acid (OA/SA), and the ratio of total omega-3 acids over total omega-6 acids.
[0223] Safety assessments included adverse events, clinical laboratory measurements (chemistry, hematology, and urinalysis), 12-lead electrocardiograms (ECGs), vital signs, and physical examinations.
[0224] For TG, TC, HDL-C, LDL-C, calculated non-HDL-C, and VLDL-C, baseline was defined as the average of Visit 4 (Week 0) and the preceding lipid qualifying visit (either Visit 3 [Week -1] or if it occurs, Visit 3.1) measurements. Baseline for all other efficacy parameters was the Visit 4 (Week 0) measurement.
[0225] For TG, TC, HDL-C, LDL-C, calculated non-HDL-C, and VLDL-C, Week 12 endpoint was defined as the average of Visit 6 (Week 11) and Visit 7 (Week 12) measurements.
[0226] Week 12 endpoint for all other efficacy parameters were the Visit 7 (Week 12) measurement.
[0227] The primary efficacy analysis was performed using a 2-way analysis of covariance (ANCOVA) model with treatment as a factor and baseline TG value as a covariate. The least-squares mean, standard error, and 2-tailed 95% confidence interval for each treatment group and for each comparison were estimated. The same 2-way ANCOVA model was used for the analysis of secondary efficacy variables.
[0228] The primary analysis was repeated for the per-protocol population to confirm the robustness of the results for the intent-to-treat population.
[0229] Non-inferiority tests for percent change from baseline in LDL-C were performed between >96% E-EPA doses and placebo using a non-inferiority margin of 6% and a significant level at 0.05.
[0230] For the following key secondary efficacy parameters, treatment groups were compared using Dunnett's test to control the Type 1 error rate: TC, LDL-C, HDL-C, non-HDL-C, VLDL-C, Lp-PLA.sub.2, and apo B. For the remaining secondary efficacy parameters, Dunnett's test was be used and the ANCOVA output were considered descriptive.
[0231] The evaluation of safety was based primarily on the frequency of adverse events, clinical laboratory assessments, vital signs, and 12-lead ECGs. The primary efficacy variable is the percent change in fasting TG levels from baseline to Week 12. A sample size of 194 completed patients per treatment group provided 90.6% power to detect a difference of 15% between >96% E-EPA and placebo in percent change from baseline in fasting TG levels, assuming a standard deviation of 45% in TG measurements and a significance level of p<0.05.
[0232] Previous data on fasting LDL-C show a difference in percent change from baseline of 2.2%, with a standard deviation of 15%, between study drug and placebo. A sample size of 194 completed patients per treatment group provided 80% power to demonstrate non-inferiority (p<0.05, one-sided) of the LDL-C response between >96% E-EPA 4 g daily and placebo, within a 6% margin. To accommodate a 10% drop-out rate from randomization to completion of the double-blind treatment period, a total of 648 randomized patients was planned (216 patients per treatment group); 702 subjects were randomized, as further described below.
Results
[0233] Of the 702 randomized subjects, 687 were in the intent-to-treat ("ITT") population as follows: [0234] Ultra-pure EPA, 4 g/day: 226 subjects [0235] Ultra-pure EPA, 2 g/day: 234 subjects [0236] Placebo: 227 subjects
[0237] Lipids were extracted from plasma and red blood cell ("RBC") suspensions and converted into fatty acid methyl esters for analysis using a standard validated gas chromatography/flame ionization detection method. Fatty acid parameters were compared between EPA treatment groups and placebo using an ANCOVA model with treatment, gender, type of statin therapy, and presence of diabetes as factors, and the baseline parameter value as a covariate. LSMs, SEs, and 2-tailed 95% confidence intervals for each treatment group and for each comparison were determined.
[0238] Baseline characteristics of the three ITT groups were comparable, with 61.4% of the ITT subjects being male, 96.3% being white, having a mean age of 61.4 years, a weight of 95.7 kg and a BMI of 32.9 kg/m.sup.2. ITT subjects with incomplete fatty acid data at baseline and/or at 12 weeks were excluded from the analyses described below.
Example 3
[0239] An experiment was conducted to test EPA in model membranes enriched with PUFAs and cholesterol at levels that reproduce disease or high CV-risk conditions (i.e., hypercholesterolemia).
[0240] The effects of EPA on lipid peroxide (LOOH) formation were examined at a cholesterol-to-phospholipid (C/P) mole ratio of 0.6:1. Levels of lipid hydroperoxides were also measured in cholesterol-enriched membrane prepared in the absence of EPA as a control.
[0241] 1,2-Dilinoleoyl-3-sn-phosphatidylcholine (DLPC) was obtained from Avanti Polar Lipids (Alabaster, Ala.) and stored in chloroform (25 mg/ml) at -80.degree. C. until use. Cholesterol obtained and stored in chloroform (10 mg/ml) at -20.degree. C. CHOD-iodide color reagent (stock) was prepared according to a procedure modified from El-Saadani et al. (El-Saadani M, Esterbauer H, El-Sayed M, Goher M, Nassar A Y, Jurgens G. A spectrophotometric assay for lipid peroxides in serum lipoproteins using commercially available reagent. J. Lipid. Res. 1989; 30:627-30) consisted of 0.2 M K.sub.2HPO.sub.4, 0.12 M KI, 0.15 mM NaN.sub.3, 10 .mu.M ammonium molybdate, and 0.1 g/L benzalkonium chloride. Prior to experimental use, the CHOD reagent was activated by adding 24 .mu.M ethylenediaminetetraacetic acid (EDTA), 20 .mu.M butylated hydroxytoluene (BHT), and 0.2% Triton X-100. The EPA and lipids were added in a ratio of 1:30 during membrane sample preparation to ensure full incorporation into the lipid bilayers.
[0242] Membrane samples consisting of DLPC.+-.cholesterol were prepared as follows. Component lipids (in chloroform) were transferred to 13.times.100 mm test tubes and shell-dried under a steady stream of nitrogen gas while vortex mixing. The lipid was co-dried with EPA.
[0243] Residual solvent was removed by drying for a minimum of 3 h under vacuum. After desiccation, each membrane sample was resuspended in diffraction buffer (0.5 mM HEPES, 154 mM NaCl, pH 7.3) to yield a final phospholipid concentration of 1.0 mg/mL. Multilamellar vesicles (MLV) were formed by vortex mixing for 3 minutes at ambient temperature. Bangham A D, Standish M M, Watkins J C. Diffusion of univalent ions across the lamellae of swollen phospholipids. J. Mol. Biol. 1965; 13:238-52. Immediately after initial MLV preparation, aliquots of each membrane sample will be taken for baseline (0 h) peroxidation analyses.
[0244] All lipid membrane samples were subjected to time-dependent autoxidation by incubating at 37.degree. C. in an uncovered, shaking water bath for 72 hours. Small aliquots of each sample were removed at 24 h intervals and combined with 1.0 mL of active CHOD-iodide color reagent. To ensure spectrophotometric readings within the optimum absorbance range, sample volumes taken for measurement of lipid peroxide formation were adjusted for length of peroxidation and range between 100 and 10 pt. Test samples were immediately covered with foil and incubated at room temperature for >4 h in the absence of light. Absorbances were measured against a CHOD blank at 365 nm using a Beckman DU-640 spectrophotometer.
[0245] The CHOD colorimetric assay is based on the oxidation of iodide (I.sup.-) by lipid hydroperoxides (LOOH) and proceeds according to the following reaction scheme:
LOOH+2H.sup.++LOH+H.sub.2O+I.sub.3.sup.-
[0246] The quantity of triiodide anion (I.sub.3.sup.-) liberated in this reaction is directly proportional to the amount of lipid hydroperoxides present in the membrane sample. The molar absorptivity value (e) of I.sub.3.sup.- is 2.46.times.10.sup.4 M.sup.-1cm.sup.-1 at 365 nm.
[0247] Cholesterol domain peak intensity was calculated from multiple small angle x-ray diffraction measurements, which are directly proportional to domain levels. After exposure to autoxidation as described above, vehicle-treated controls displayed a cholesterol domain peak intensity of 77.6.+-.58.5, corresponding to an increase in LOOH formation from 89.+-.1 .mu.M to 6616.+-.250 .mu.M (p<0.001). EPA-treated membranes reduced LOOH levels by greater than 90% (728.+-.30 .mu.M) compared to untreated controls (p<0.001).
[0248] This example demonstrates that EPA inhibits cholesterol crystalline domain formation in a manner related to its potent antioxidant effects in PUFA-enriched model membranes. These data suggest that EPA blocks membrane lipid oxidation and structural reorganization through free radical chain-breaking mechanisms.
Example 4
[0249] An experiment was conducted to test the ability of EPA to interfere with the effects of high glucose on membrane lipid peroxidation and organization in vesicles enriched with PUFAs.
[0250] At elevated levels, the aldose sugar glucose produces non-enzymatic chemical modifications to membrane proteins and phospholipids, leading to advanced glycation endproducts (AGEs) and cell injury. Oxidative stress and AGEs have been implicated in both the microvascular and macrovascular complications of diabetes and other metabolic disorders. In membranes enriched with polyunsaturated fatty acids (PUFA), hyperglycemia promotes the formation of free radicals and cholesterol crystalline domains associated with atherosclerosis. The non-enzymatic effects of glucose on cholesterol crystalline domain formation were shown to be enhanced under conditions of high cholesterol and could not be reproduced by mannitol. Oxidative damage to PUFAs with glucose is of particular interest given its role in the propagation of free radicals during vascular injury and insulin resistance. In addition to cellular membranes, oxidation of PUFAs in low-density lipoproteins (LDL) contributes to endothelial dysfunction, inflammation, and atherosclerotic foam cell formation.
[0251] 1,2-Dilinoleoyl-sn-glycero-3-phosphocholine (DLPC) and monomeric cholesterol (isolated from ovine wool) were purchased from Avanti Polar Lipids (Alabaster, Ala.) and solubilized at 25 and 10 mg/mL, respectively. EPA, .alpha.-linolenic acid (ALA; 18:3, n-3) was purchased from Sigma-Aldrich (Saint Louis, Mo.) and solubilized in ethanol to 1 mM under nitrogen atmosphere. Vitamin E (.alpha.-tocopherol) was also purchased from Sigma-Aldrich and prepared in ethanol at 1.0 mM (e=3.06.times.10.sup.4 M.sup.-1 cm.sup.-1 at 294 nm) just prior to experimental use. Atorvastatin ortho- (o-) hydroxy (active) metabolite was purchased from Toronto Research Chemicals (North York, Ontario, Canada) and solubilized in methanol to 1.0 mM. All test compounds were further diluted in ethanol or aqueous buffer as needed. Glucose was prepared in saline buffer (0.5 mM HEPES, 154 mM NaCl, pH 7.3) at 11.0 mM (200 mg/dL).
[0252] CHOD-iodide color reagent (stock) was prepared, with slight modification, as described by from El-Saadani et al. (J. Lipid Res., vol. 30, pages 627-630 (1989)) and consisted of 0.2 M K.sub.2HPO.sub.4, 0.12 M KI, 0.15 mM NaN.sub.3, 10 .mu.M ammonium molybdate, and 0.1 g/L benzalkonium chloride. Prior to experimental use, the CHOD reagent was activated by adding 24 .mu.M ethylenediaminetetraacetic acid (EDTA), 20 .mu.M butylated hydroxytoluene (BHT), and 0.2% Triton X-100.
[0253] Multilamellar vesicles (MLVs) were prepared as binary mixtures of DLPC (1.0 or 2.5 mg total phospholipid per sample) and cholesterol at a fixed cholesterol-to-phospholipid (C/P) mole ratio of 0.6:1. Component lipids (in chloroform) were transferred to 13.times.100 mm borosilicate culture tubes and combined with vehicle (ethanol) or an equal volume of fatty acid, vitamin E, or ATM stock solutions, each adjusted to achieve desired treatment concentrations. Samples were shell-dried under nitrogen gas and placed under vacuum for 1 h to remove residual solvent. After desiccation, each sample was resuspended in 1.0 mL glucose-containing saline to yield final phospholipid concentrations of 1.0 or 2.5 mg/mL (for lipid peroxidation or x-ray diffraction analysis, respectively). Lipid suspensions were then vortexed for 3 min at ambient temperature to form MLVs.
[0254] All MLV samples were subjected to time-dependent autoxidation by incubating at 37.degree. C. in an uncovered, shaking water bath. This method allows lipid peroxidation to occur gradually without requiring the use of exogenous initiators. Small aliquots (5-100 .mu.L) of each sample were removed, immediately following MLV preparation (0 hour) and after exposing samples to oxidative conditions for 72 or 96 hour, and combined with 1.0 mL of activated CHOD-iodide color reagent. Aliquot volume was reduced with each successive time point to ensure that spectrophotometric readings were within the optimal adsorption range. Test samples were covered and incubated in darkness at room temperature for at least 4 hr. Sample absorbances were then measured against a CHOD blank at 365 nm using a Beckman DU-640 spectrophotometer. The CHOD colorimetric assay is based on the oxidation of iodide (I.sup.-) by lipid hydroperoxide (LOOH) to form triiodide (I.sub.3.sup.-), the quantity of which is directly proportional to the amount of LOOH present in the lipid sample. The molar absorptivity (.epsilon.) of I.sub.3.sup.- is 2.46.times.10.sup.4 M.sup.-1 cm.sup.-1 at 365 nm.
[0255] The membrane structural effects of glucose and the various compounds examined in this study were measured at 0, 72, and 96 hour intervals. Membrane lipid vesicles were oriented for x-ray diffraction analysis as described by others (e.g., Herbette et al., Biophys. J., vol. 20(2), pages 245-272 (1977)). Briefly, a 100 .mu.L aliquot (containing 250 .mu.g MLV) was aspirated from each sample and transferred to a Lucite.RTM. sedimentation cell fitted with an aluminum foil substrate upon which a given sample could be collected by centrifugation. Samples were then loaded into a Sorvall AH-629 swinging bucket rotor (DuPont Corp., Wilmington, Del.) and centrifuged at 35,000 g, 5.degree. C., for 90 min.
[0256] After centrifugal orientation, sample supernatants were aspirated and aluminum foil substrates, each supporting a single membrane pellet, were removed from the sedimentation cells. Sample pellets were dried for 5-10 min at ambient conditions, mounted onto curved glass supports, and placed in hermetically-sealed, brass or glass containers (for immediate analysis or temporary storage, respectively). All x-ray diffraction experiments were conducted at 20.degree. C., 74% relative humidity. The latter was established by exposing membrane samples to saturated solutions of L-(+) tartaric acid (K.sub.2C.sub.4H.sub.4O.sub.6.1/2H.sub.2O). Samples were incubated at these conditions for at least 1 hour prior to experimental analysis.
[0257] Oriented membrane samples were aligned at grazing incidence with respect to a collimated, mono-chromatic CuK.sub..alpha. x-ray beam (K.sub..alpha.1 and K.sub..alpha.2 unresolved; .lamda.=1.54 .ANG.) produced by a Rigaku Rotaflex RU-200, high-brilliance microfocus generator (Rigaku-MSC, The Woodlands, Tex.) as previously described (Mason et al., Biophys. J., vol. 55(4), pages 769-778 (1989)). Diffraction data were collected on a one-dimensional, position-sensitive electron detector (Hecus X-ray Systems, Graz, Austria) at a sample-to-detector distance of 150 mm. Detector calibration was performed by the manufacturer and verified using crystalline cholesterol monohydrate.
[0258] The d-space for any given membrane multibilayer is a measurement of the unit cell periodicity of the membrane lipid bilayer (e.g., the distance from the center of one lipid bilayer to the next including surface hydration), and is calculated from Bragg's Law, h.lamda.=2d sin .theta., where h is the diffraction order, .lamda. is the wavelength of the x-ray radiation (1.54 .ANG.), d is the membrane lipid bilayer unit cell periodicity, and .theta. is the Bragg angle equal to one-half the angle between the incident beam and scattered beam.
[0259] The presence of cholesterol domains in a given membrane sample results in the production of distinct Bragg (diffraction) peaks having singular periodicity values of 34 and 17 .ANG. (typically referred to as first- and second-order cholesterol domain peaks). Under the specific temperature and relative humidity conditions established for these experiments, the second-order, 17 .ANG. cholesterol domain peak was well-delineated from other, neighboring cholesterol and phospholipid diffraction peaks and was thus used to quantitate relative cholesterol domain peak intensity. Routines written in Origin 8.6 (OriginLab Corporation, Northampton, Mass.) were used to determine total peak area (associated with all diffraction peaks in a given pattern) against which the second-order cholesterol domain peak was normalized.
[0260] Effects of EPA and Vitamin E on Glucose-Induced Lipid Peroxidation
[0261] The effects of hyperglycemia (200 mg/dL) on LOOH formation in lipid vesicles enriched with PUFAs and cholesterol and prepared in the absence (vehicle only) or presence of EPA or vitamin E (each at a 1:30 drug-to-phospholipid mole ratio) were measured. The concentration of glucose selected was consistent with previous experimental studies of hyperglycemia under controlled laboratory conditions or observed in well-defined animal models of Type II diabetes following a glucose challenge. As shown in FIG. 1, glucose significantly increased LOOH formation in a time-dependent manner as compared to vehicle treatment alone. Values in FIG. 1 are mean.+-.S.D. (N=6). EPA inhibited the peroxidative effects of glucose by 88% and 86% at 72 and 96 hours, respectively, which was highly significant (p<0.001) as compared to glucose treatment alone. LOOH levels measured in samples treated with EPA were also significantly lower (at the 72- and 96-hour time points) as compared to non-glucose-treated controls. Overall ANOVA--0 hour data: p=0.6655, F=0.4185; 72 hour data: p<0.0001, F=428.72; 96 hour data: p<0.0001, F=322.01.
[0262] EPA was also tested at 1.0 and 5.0 .mu.M and found to inhibit membrane LOOH formation in a dose-dependent manner, as shown in FIG. 2. Values in FIG. 2 are mean.+-.S.D. (N=6-8) and represent % difference between treatment and glucose-treated controls. These concentrations are similar to those measured in the plasma of patients with prescribed levels of EPA. Overall ANOVA: p<0.0001, F=99.900.
[0263] Vitamin E was also examined in this assay at the same drug-to-phospholipid mole ratio used for testing the basic antioxidant effects of EPA. As shown in FIG. 3, EPA significantly inhibited LOOH formation at the 72- and 96-hour time points. Values in FIG. 3 are mean.+-.S.D. (N=3). By contrast, vitamin E had no significant effect on lipid peroxidation under identical conditions. Overall ANOVA-0 hour data: p=0.0073, F=12.474; 72 hour data: p=0.0204, F=7.986; 96 hour data: p=0.0008, F=29.764.
Effects of EPA and Vitamin E on Glucose- and Peroxidation-Induced Changes in Membrane Lipid Structural Organization
[0264] Lipid peroxidation is highly disruptive to the structural organization of biological membranes and has been shown, in previous studies by Jacob et al. (J. Biol. Chem., vol. 280, pages 39380-39387 (2005)) and Mason et al. (J. Biol. Chem., vol. 281(1), pages 9337-9345 (2006)), to contribute directly to the formation of cholesterol crystalline domains. Glucose has also been reported to promote similar changes in membrane structural organization by increasing lipid peroxidation (Self-Medlin et al., Biochim. Biophys. Acta, vol. 1788(6), pages 1398-1403 (2009)). In this study, we used small angle x-ray diffraction to characterize the structural properties of model membranes treated with glucose (200 mg/dL) and prepared in the absence or presence of vitamin E or EPA (each at 1:30 drug-to-phospholipid mole ratio), before and after exposure to oxidative conditions (FIG. 4). At the start of this experiment, vitamin E and EPA were observed to have no appreciable effect on membrane structure as compared to control samples (FIG. 4, left column). Scattering data collected from each membrane preparation yielded up to four diffraction orders having an average unit cell periodicity (d-space) of 51.5 .ANG., and consistent with a homogenously-distributed, lipid bilayer phase. Following exposure to oxidative conditions for 72 hours, additional peaks, with an average d-space value of 34 .ANG. and consistent with a cholesterol crystalline domain phase, were observed in control and vitamin E-treated membrane samples (FIG. 4, middle column, highlighted peaks). At 96 hours, cholesterol domains peaks were observed in all experimental samples; however, these peaks were disproportionately greater in control and vitamin E-treated samples (FIG. 4, right column, highlighted peaks).
[0265] Quantitative assessment of cholesterol domain peak intensity (expressed as the quotient of cholesterol- to total lipid-peak area) indicated that vitamin E had no significant effect on cholesterol domain formation as compared to control at any experimental time point (FIG. 5). Values in FIG. 5 are mean.+-.S.D. (N=3). In contrast, EPA inhibited relative cholesterol domain peak intensity by more than 99% at the 96-hour time point, as compared to either vehicle or vitamin E treatments. Overall ANOVA: p=0.0075, F=8.849.
Separate and Combined Effects of EPA and ATM on Glucose-Induced Membrane Lipid Peroxidation
[0266] ATM has been shown in previous studies by Teissier et al. (Circ. Res., vol. 95(12), pages 1174-1182 (2004)) and Mason et al. (Am. J. Cardiol., vol. 96(5A), pages 11F-23F (2005)) to have potent antioxidant properties, as observed in human low density lipoprotein as well as model liposomes. The antioxidant effects of ATM were re-examined, separately and in combination with EPA (each at 1.0 .mu.M), in membrane lipid vesicles treated with glucose at 200 mg/dL and exposed to oxidative conditions for 96 hours. Both EPA and ATM were observed to have separate and potent antioxidant effects under these conditions; however, their combination was even more effective, decreasing LOOH formation by >60% (p<0.001) as compared to either treatment alone (FIG. 6). Values in FIG. 6 are mean.+-.S.D. (N=6) and represent % difference between treatment and glucose-treated controls.
[0267] These data demonstrate that EPA significantly inhibits glucose-induced lipid peroxidation and cholesterol crystalline domain formation in model membrane lipid vesicles. Without wishing to be bound by theory, it is possible that these antioxidant effects are due at least in part to the ability of EPA to quench reactive oxygen species (ROS) associated with the membrane lipid bilayer, thereby preserving normal membrane structure and organization. Following intercalation into the membrane lipid bilayer, the conjugated double bonds associated with EPA may facilitate electron stabilization mechanisms that interfere with free radical propagation (for example, as depicted in FIG. 7). The effects of EPA could not be reproduced with vitamin E, a natural scavenging antioxidant. These findings indicate a potentially preferred intercalation of the EPA molecule into the membrane where it can trap free radicals. The absence of activity for vitamin E under these conditions may be due to its limited lipophilicity and scavenging potential, as previously observed by Mason et al. (J. Biol. Chem., vol. 281(14), pages 9337-9345 (2006)) in membranes enriched with cholesterol. Vitamin E was also unable to interfere with cholesterol crystalline domain development with hyperglycemia. Finally, the antioxidant effects of EPA were enhanced in the presence of ATM which, unlike vitamin E, has been shown by Self-Medlin et al. (Biochim. Biophys. Acta, vol. 1788(6), pages 1398-1403 (2009)) and Mason et al. (J. Biol. Chem., vol. 281(14), pages 9337-9345 (2006)) to have potent free radical scavenging properties and high lipophilicity that reduces the formation of cholesterol crystalline domains following oxidative stress or exposure to hyperglycemic conditions. Mason et al. (J. Biol. Chem., vol. 281(14), pages 9337-9345 (2006)) and Aviram et al. (Atherosclerosis, vol. 138(2), pages 271-280 (1998)) have attributed the chain-breaking antioxidant mechanism of ATM to its phenoxy moiety. Clinical support for an antioxidant benefit with atorvastatin has also been reported from prospective trials by Tsimikas et al. (Circulation, vol. 110(11), pages 1406-1412 (2004)) and Shishehbor et al. (Circulation, vol. 108(4), pages 426-431 (2003)).
[0268] At high levels, glucose promoted the formation of LOOH, prominent intermediates of peroxidative reactions that have been shown by Girotti et al. (J. Lipid Res., vol. 39(8), pages 1529-1542 (1998)) to lead to changes in the organization of membrane lipid components. Lipid peroxidation is well-known to induce changes in membrane fluidity, increased membrane permeability, and changes in membrane protein activity. Oxidative modification of PUFAs is also known to cause a marked reduction in membrane d-space associated with interdigitation of the phospholipid acyl chain terminal methyl segments. These alterations in the intermolecular packing characteristics of membrane phospholipids promote the displacement of cholesterol into discrete domains (d-space of 34 .ANG.) within the phospholipid bilayer environment. Cholesterol crystalline domains have been shown by Ruocco et al. (Biophys. J., vol. 46, pages 695-707 (1984)) to be induced in model membranes by increasing membrane cholesterol to very high levels (>50 mol %). Similar changes in cholesterol domain formation have been observed in models of atherosclerosis, including in model macrophage foam cells (Kellner-Weibel et al., Arterioscler. Thromb. Vasc. Biol., vol. 19(8), pages 1891-1898 (1999)), in rabbit or rat thoracic mesenteric or pericardium membranes (Abela et al., Clin. Cardiol., vol. 28(9), pages 413-420 (2005)), and rabbit smooth muscle cell plasma membranes (Tulenko et al., J. Lipid Res., vol. 39, pages 947-956 (1998)). The formation of these domains in membranes prepared at constant cholesterol levels but exposed to glucose and glucose-induced lipid peroxidation has also been observed by Self-Medlin et al. (Biochim. Biophys. Acta, vol. 1788(6), pages 1398-1403 (2009)). Thus, agents that slow or block the formation of cholesterol into discrete domains and crystals may interfere with mechanisms of atherogenesis associated with hyperglycemia without reductions in cholesterol levels.
[0269] As a reducing monosaccharide, glucose is known to be susceptible to reaction at its anomeric carbon with singlet oxygen or other radical initiators. This redox reaction can generate glucose radicals or other reactive oxygen species that have a pro-oxidant effect in biological membranes. Several reaction mechanisms are believed to be responsible for the formation of glycoxidation and lipoxidation products resulting from the reaction of glucose radicals with proteins or lipids to form sugar-amine adducts. The presence of cholesterol in the membrane also contributes to rates of LOOH formation, allowing more efficient radical penetration and propagation through the bilayer. The steroid nucleus of cholesterol has been explained to induce an ordering effect on adjacent phospholipid molecules, thus reducing the intermolecular distance between adjacent PUFA chains of the lipids and facilitating the exchange of free radicals within the hydrocarbon core. Previous studies by Self-Medlin et al. (Biochim. Biophys. Acta, vol. 1788(6), pages 1398-1403 (2009)) have demonstrated a cholesterol-dependent increase in LOOH formation, which was enhanced by glucose treatment, in similar model membrane preparations. Others including Bertelsen et al. (Diabetologia, vol 44(5), pages 605-613 (2001)) and Cohen et al. (Am. J. Physiol. Endocrin. Metabol., vol. 285(6), pages E1151-1160 (2003)) have suggested that even minor physico-chemical modifications to the cell membrane may lead to the disruption of cholesterol-enriched membrane domains that are critical to many cellular processes (e.g., caveolae) leading to loss in insulin receptor activity and endothelial nitric oxide synthase (eNOS) function.
[0270] Glucose-mediated oxidative stress is known to contribute to inflammatory pathways associated with diabetes and atherosclerosis pathophysiology. Glucose, obesity, and oxidative stress reduce intracellular antioxidant defense mechanisms while activating inflammatory responses from transcription factors and kinases, such as c-Jun N-terminal kinase (JNK), protein kinase C (PKC), and inhibitor of kappa B kinase-.beta. (IKK.beta.). Some inflammatory pathways, such as activation of IKK.beta., have a causative role in the deleterious effects of hyperglycemia on endothelial cell function. Hyperglycemia also stimulates NF-kB, which in turn promotes the overexpression of NADPH, a primary source of cellular superoxide. Overproduction of superoxide, accompanied by increased nitric oxide generation, leads to formation of the highly reactive peroxynitrite molecule. Agents with antioxidant activity at the cellular level including, for example, statins, glitazones, and angiotensin converting enzyme (ACE) inhibitors, have been shown to be beneficial in improving insulin resistance.
[0271] The present Example demonstrates surprisingly that EPA ameliorates the effects of hyperglycemia, likely due to its potent antioxidant properties. In clinical studies performed by others, compositions including EPA reduced CAD-related events in hypercholesterolemic patients receiving statin treatment. In addition to reductions in triglycerides, treatment with highly purified EPA was associated with significant reductions in levels of oxidized LDL, Lp-PLA.sub.2, and hsCRP as compared to placebo. These antioxidant effects are consistent with the presently disclosed findings, which demonstrate EPA to be a potent and direct scavenger of free radicals. ROS and related oxidative damage have been implicated in the pathogenesis of various human chronic diseases. Due to its multiple conjugated double bonds, EPA has higher singlet oxygen quenching ability compared to vitamin E. EPA is expected to fully incorporate into the membrane bilayer, where it can exercise maximum free radical scavenging effects as shown in this study.
[0272] The antioxidant effects of EPA were enhanced in combination with the active metabolite of atorvastatin. According to primary pharmacokinetic studies, atorvastatin (parent) is extensively metabolized by hepatic cytochrome P450 to yield a number of active metabolites, which together reportedly account for approximately 70% of circulating HMG-CoA reductase inhibitory activity. This is in contrast to other statins like pravastatin and rosuvastatin that are not metabolized into active metabolites. Beyond their enzymatic effects on serum LDL-C levels, the active metabolites of atorvastatin may provide benefit by interfering with oxidative stress pathways. In a small study by Shishehbor et al. (Circulation, vol. 108(4), pages 426-431 (2003)) designed to evaluate the effects of atorvastatin therapy on markers of protein oxidation and inflammation, atorvastatin was found to significantly reduce circulating levels of chlorotyrosine, nitrotyrosine, and dityrosine, all of which act as surrogate markers for specific oxidative pathways unregulated in the atheroma. Interestingly, these effects were observed at a relatively low treatment dose (10 mg, administered for just 12 weeks) and were more significant than reductions in other inflammatory markers, including C-reactive protein. In a larger study by Tsimikas et al. (Circulation, vol. 110(11), pages 1406-1412 (2004)) involving 2,341 patients, treatment with a high dose of atorvastatin (80 mg) for 16 weeks caused a significant reduction in levels of oxidized lipids associated with all apoB100-containing lipid particles.
[0273] The ability of EPA to interfere with oxidative stress under conditions of hyperglycemia has important clinical implications. Levels of oxidized lipid, measured using monoclonal antibodies against oxLDL, have been shown by Ehara et al. (Circulation, vol. 103(15), pages 1955-1960 (2001)) to correlate with the severity of acute coronary syndromes and plaque instability. A more recent longitudinal investigation of 634 patients found that patients with baseline levels of thiobarbituric acid reactive substances ("TBARS") in the highest quartile had significantly increased relative risk for major vascular events and procedures (Walter et al., J. Am. Coll. Cardiol., vol. 44(10), pages 1996-2002 (2004)). The predictive effect of TBARS was observed in a multivariate model adjusted for inflammatory markers (C-reactive protein, sICAM-1, IL-6) and other risk factors (age, LDL-C, high density lipoprotein cholesterol (HDL-C), total cholesterol, triglycerides, BMI, and blood pressure). These analyses indicated that TBARS had an independent effect on major vascular events and procedures. Similar predictive value was observed for LOOH in these same subjects in a follow-up study (Walter et al., J. Am. Coll. Cardiol., vol. 51(12), pages 1196-1202 (2008)). More recently, EPA treatment was associated with significant reductions in triglycerides along with reduced levels of markers of inflammation including hsCRP, Lp-PLA.sub.2 and oxidized LDL, as compared to placebo, by Ballantyne et al. (Am. J. Cardiol., vol. 110(7), pages 984-992 (2012)) and Bays et al. (Am. J. Cardiovasc. Drugs, vol. 13(1), pages 37-46 (2013); Am. J. Cardiol., vol. 108(5), pages 682-690 (2011)).
[0274] In sum, pronounced changes in membrane lipid organization were observed with hyperglycemia, including the formation of cholesterol crystalline domains that correlate with an increase in lipid hydroperoxide (LOOH) formation (an intermediate product of oxidative lipid damage). Treatment of membranes with EPA, but not vitamin E, inhibited changes in membrane structure possibly due to potent chain-breaking antioxidant actions of the EPA molecules.
Example 5
[0275] An experiment was conducted to compare the ability of EPA to prevent lipid hydroperoxide formation in model membranes treated with glucose to two other 20-carbon fatty acids: eicosanoic acid ("EA," also referred to as arachidic acid, C20:0) and eicosatrienoic acid ("ETE," C20:3, n-3). All MLV samples were subjected to time-dependent autoxidation by incubating at 37.degree. C. in an uncovered, shaking water bath. This method allows lipid peroxidation to occur gradually without requiring the use of exogenous initiators. Small aliquots (5-100 .mu.L) of each sample were removed, immediately following MLV preparation (0 hr) and after exposing samples to oxidative conditions for 72 or 96 hr, and combined with 1.0 mL of activated CHOD-iodide color reagent. Aliquot volume was reduced with each successive time point to ensure that spectrophotometric readings were within the optimal adsorption range. Test samples were covered and incubated in darkness at room temperature for at least 4 hr. Sample absorbances were then measured against a CHOD blank at 365 nm using a Beckman DU-640 spectrophotometer. The CHOD colorimetric assay is based on the oxidation of iodide (I.sup.-) by lipid hydroperoxide (LOOH) to form triiodide (I.sub.3.sup.-), the quantity of which is directly proportional to the amount of LOOH present in the lipid sample. The molar absorptivity (c) of I.sub.3.sup.- is 2.46.times.10.sup.4 M.sup.-1 cm.sup.-1 at 365 nm.
[0276] As shown in FIG. 8, model membranes treated with EPA had significantly less LOOH formation compared to model membranes treated with vehicle only (control), with glucose only, with glucose and EA, or with glucose and ETE. Values in FIG. 8 are mean.+-.S.D. (N=6). After 96 hours (FIG. 9), the differences between EPA-treated model membranes and model membranes treated with vehicle only (control), with glucose only, with glucose and EA, or with glucose and ETE were even more pronounced. Values in FIG. 8 are mean.+-.S.D. (N=6).
Example 6
[0277] An experiment to study the antioxidant effect of EPA in small dense LDL ("sdLDL") was performed. EPA was purchased from Sigma-Aldrich (Saint Louis, Mo.) and solubilized in ethanol to 1 mM under nitrogen atmosphere. Vitamin E (.alpha.-tocopherol) was purchased from Sigma-Aldrich and prepared in ethanol at 1.0 mM (c=3.06.times.10.sup.4 M.sup.-1 cm.sup.-1 at 294 nm) just prior to experimental use. All test compounds were further diluted in ethanol or aqueous buffer as needed.
[0278] Venous blood was collected from healthy volunteers into vacutainer tubes containing sodium EDTA. Plasma was separated by centrifugation at 3000 g for 25 min at 4.degree. C. and adjusted to a density of 1.020 g/mL with KBr. Triglyceride-rich lipoproteins (TGRL) and LDL fractions were then isolated by sequential centrifugation at 70,000 rpm at 4.degree. C. in a Beckman LE-80 ultracentrifuge using a Beckman 50.4Ti rotor (Beckman Coulter, Inc., Fullerton, Calif.). The TGRL fraction (with a relative density of <1.020) was aspirated from the top of the centrifugate and discarded, leaving an LDL-enriched infranate (with a relative density of 1.020 to 1.063). The plasma LDL fraction was further fractionated into LDL1, LDL2, LDL3, and LDL4 (sdLDL) subfractions with relative densities of 1.020 to 1.035, 1.035 to 1.050, 1.050 to 1.063, and 1.063 to 1.075, respectively. The sdLDL subfraction was retained for additional experimentation. Plasma and lipoprotein fractions were maintained at 4.degree. C. and protected from excessive exposure to light. Prior to oxidation experiments, EDTA was removed from the lipoprotein fraction using PD-10 desalting columns (GE Healthcare, Piscataway N.J.). After equilibration of the column with phosphate buffered saline (PBS), 2.5 mL of the lipoprotein fraction was loaded on the column and the flow-through discarded. The lipoprotein was then eluted with 3 mL of PBS. The LDL fractions were further diluted with PBS to obtain a 100 .mu.g/mL apoB100 concentration.
[0279] LDL and sdLDL subfractions (0.6 mL each) were incubated with either 10 .mu.L vehicle (ethanol) or 10 .mu.L drug stock solution for 30 min to 1 hr at 37.degree. C. Oxidation was initiated by the addition of 10 .mu.M CuSO.sub.4. After 2 hr, 100 .mu.L aliquots were removed from each subfraction and combined with 1.0 mL thiobarbituric acid (0.5%), 10 .mu.L trichloroacetic acid (5%), 10 .mu.L BHT (5 mg/mL in methanol), and 10 .mu.L EDTA (5 mM). Sample aliquots were incubated at 100.degree. C. for 20 min and then assayed for the formation of thiobarbituric acid-reactive substances (TBARS), which have a molar absorptivity (c) value of 1.56.times.10.sup.5M.sup.-1 cm.sup.-1 at 532 nm and are derived principally from the reaction of thiobarbituric acid with malondialdehyde (MDA), a reactive aldehyde produced by LDL oxidation. Sample TBARS concentrations were determined spectrophotometrically by measuring sample absorbances against a standard curve derived from the hydrolysis of 1,1,3,3-tetramethoxypropane.
[0280] Data are presented as mean.+-.S.D. for (N) separate samples or treatment groups. Differences between groups were analyzed using the two-tailed, Student's t-test (for comparisons between only two groups) or ANOVA followed by Dunnett or Student-Newman-Keuls multiple comparisons post-hoc analysis (for comparisons between three or more groups). Only differences with probability values less than 0.05 were considered significant.
[0281] EPA has been shown in previous studies to inhibit lipid oxidation in phospholipid vesicles following exposure to high glucose levels and autoxidation (unpublished results). In this study these analyses were extended to human LDL and sdLDL fractions. As shown in FIG. 10, EPA inhibited sdLDL oxidation over a broad range of concentrations (1.0 .mu.M to 10.0 .mu.M). These concentrations are similar to the level of unesterified EPA measured in the plasma of humans (C.sub.max:1.4 .mu.g/mL, or -5 .mu.M) with normally prescribed levels (e.g., 4 g/day) of EPA. At the lowest dose tested (1.0 .mu.M), EPA reduced TBARS levels by 13% (p<0.001) compared to vehicle-treated controls; this inhibitory effect was dose-dependent and increased to 57% (p<0.001) at 10.0 .mu.M. The comparative effects of vitamin E on sdLDL oxidation were also tested under identical conditions (FIG. 10). In contrast to EPA, vitamin E did not inhibit sdLDL oxidation except at the highest concentration (10.0 .mu.M) where it reduced TBARS levels by 26% (p<0.05). These data indicate different interactions of these lipophilic, chain-breaking antioxidants with respect to sdLDL oxidation. Values in FIG. 10 are mean.+-.S.D. (N=4).
[0282] The antioxidant effects of EPA were further examined in unfractionated LDL particles (FIG. 11). LDL was isolated from human plasma, treated with vehicle, vitamin E, or EPA over a broad range of concentrations (1.0 .mu.M to 10.0 .mu.M) and examined for changes in lipid oxidation rates. EPA was found to generally inhibit LDL oxidation; however, the effects were less evident as compared to those observed for a similar number of sdLDL particles. At each concentration tested, the reduction in TBARS levels was several fold lower in the unfractionated LDL versus sdLDL (p<0.001). At the highest concentration tested (10.0 .mu.M), EPA reduced TBARS levels by 17% and was similar to what was observed at the lowest dose tested (1.0 .mu.M) in sdLDL. By contrast, vitamin E did not inhibit LDL oxidation at any concentration (data not shown). These data suggest that EPA has a disproportionately greater benefit in sdLDL as compared to the larger LDL species. Values in FIG. 11 are mean.+-.S.D. (N=3-4).
[0283] From the foregoing, it will be appreciated that specific embodiments of the invention have been described herein for purposes of illustration, but that various modifications may be made without deviating from the scope of the invention. Accordingly, the invention is not limited except as by the appended claims.
* * * * *
D00001
D00002
D00003
D00004
D00005
D00006
D00007
D00008
D00009
D00010
D00011
P00001
XML
uspto.report is an independent third-party trademark research tool that is not affiliated, endorsed, or sponsored by the United States Patent and Trademark Office (USPTO) or any other governmental organization. The information provided by uspto.report is based on publicly available data at the time of writing and is intended for informational purposes only.
While we strive to provide accurate and up-to-date information, we do not guarantee the accuracy, completeness, reliability, or suitability of the information displayed on this site. The use of this site is at your own risk. Any reliance you place on such information is therefore strictly at your own risk.
All official trademark data, including owner information, should be verified by visiting the official USPTO website at www.uspto.gov. This site is not intended to replace professional legal advice and should not be used as a substitute for consulting with a legal professional who is knowledgeable about trademark law.