Tissue Damage Assessment Method And System
MAKARENKO; VLADIMIR ; et al.
U.S. patent application number 16/245283 was filed with the patent office on 2020-07-16 for tissue damage assessment method and system. This patent application is currently assigned to NOKOMIS, INC.. The applicant listed for this patent is NOKOMIS, INC.. Invention is credited to VLADIMIR MAKARENKO, JAMES ROBERT UPLINGER, II.
| Application Number | 20200221971 16/245283 |
| Document ID | / |
| Family ID | 71516468 |
| Filed Date | 2020-07-16 |


| United States Patent Application | 20200221971 |
| Kind Code | A1 |
| MAKARENKO; VLADIMIR ; et al. | July 16, 2020 |
TISSUE DAMAGE ASSESSMENT METHOD AND SYSTEM
Abstract
A method and system to assess data from a dielectric probe to determine the health of tissue by denoising the data and clustering the data points. The assessment is used to assist medical professionals in the care patients.
| Inventors: | MAKARENKO; VLADIMIR; (McDonald, PA) ; UPLINGER, II; JAMES ROBERT; (Cranberry Township, PA) | ||||||||||
| Applicant: |
|
||||||||||
|---|---|---|---|---|---|---|---|---|---|---|---|
| Assignee: | NOKOMIS, INC. CHARLEROI PA |
||||||||||
| Family ID: | 71516468 | ||||||||||
| Appl. No.: | 16/245283 | ||||||||||
| Filed: | January 11, 2019 |
| Current U.S. Class: | 1/1 |
| Current CPC Class: | G06K 9/6218 20130101; A61B 5/0537 20130101; A61B 5/0538 20130101 |
| International Class: | A61B 5/053 20060101 A61B005/053; G06K 9/62 20060101 G06K009/62 |
Claims
1. A method of de-noising dielectric probe to assess tissue health data comprising: receiving dielectric probe data; identifying one or more tissues types by dielectric response; clustering data according to tissue type; and discarding as noise the data points that are not on the boundary or interior of said clusters.
2. A method of claim 1 where said clustering is by a dimensionless clustering algorithm.
3. A method of claim 1 wherein said clustering is by DBSCAN.
4. A method of claim 1 wherein there is an additional step of mapping said data points onto n-dimensional space.
5. A method of claim 1 wherein there is an additional step of mapping said data points onto at least one of 2 and 3 dimensional space.
6. A method of de-noising dielectric probe tissue health data comprising: receiving dielectric probe data; identifying tissue type by dielectric response; clustering said data by a dimensionless clustering algorithm to create one or more clusters; identifying cluster boundary data points of said one or more clusters; discarding data point not in a cluster or on a boundary of a cluster; mapping said clustered data onto n dimension space; and outputting said mapping.
7. A method of claim 6 where said clustering is by a dimensionless clustering algorithm is DBSCAN.
8. A method of claim 6 wherein said clustering of by said dimensionless clustering algorithm has the additional steps of: selecting a minimum number of data point within a cluster; selecting a maximum distance between data points within a cluster; varying said maximum distance between datapoints within a cluster; and comparing the resulting clusters to maximize compactness and contiguity.
9. A method of claim 6 wherein said clustering by said dimensionless clustering algorithm has the further steps: of selecting maximum distance between datapoints; selecting a minimum number of data point within a cluster; varying said minimum number of datapoints within a cluster; and comparing the resulting clusters for compactness and contiguity.
10. A method of claim 6 wherein said clustering by said dimensionless clustering algorithm has the further steps of: selecting a maximum distance between datapoints; selecting a minimum number of datapoints within a cluster; varying said minimum number of data points within a cluster; varying said maximum distance between datapoints within a cluster; and comparing for each combination of said minimum distance between datapoints and minimum number of data points within a cluster resulting clusters for compactness and contiguity.
11. A method of claim 6 wherein said clustering by said dimensionless clustering algorithm has the further steps of: selecting a maximum distance between datapoints within a cluster; selecting a minimum number of datapoints within a cluster; selecting a number of instances to vary said maximum distance between datapoints within a cluster; selecting a number of instances to vary said maximum distance between datapoints within a cluster; varying said minimum number of data points within a cluster; varying for each of said varied minimum number of data points within a cluster said maximum distance between datapoints within a cluster; and comparing for each combination of said minimum distance between datapoints and minimum number of data points within a cluster resulting clusters for compactness and contiguity.
12. A method of de-noising dielectric probe to assess tissue health data having a training data set, validation data set and a testing data set of permittivity data from a probe comprising: training a clustering algorithm using such training data set; validating said clustering algorithm; receiving a testing data set; processing said test data set with said clustering algorithm; mapping said clusters onto n dimensional space; selecting for said clustering algorithm a parameter of data point distance; selecting for said clustering algorithm a parameter of data point nearness; selecting for said clustering algorithm a value of minimum points for a cluster; varying successively each of said parameters until the algorithm clustering variation is generally stable; discarding non-clustered data points that are classified as noise; and and mapping said clusters onto n dimensional space.
13. A method of claim 12 wherein a further step of mapping said clusters onto one of two dimensional and 3 dimensional space.
14. A method of claim 12 wherein selecting said clustering algorithm measure of data point distance that is one of that is one of rectilinear and polar,
15. A method of claim 12 where said training further comprises: selecting a parameter of data point nearness; selecting a parameter of minimum points for a cluster; varying successively each of said parameters resulting in clustering; comparing said resulting clusters; discarding non-clustered data points that are classified as noise; mapping said tissue health clusters onto n dimensions; and outputting said mapping.
16. A system to de-noise dielectric probe to assess tissue health data comprising: a distance layer that has a distance measure unit and a memory unit; a minimum point layer having a cluster minimum datapoint unit and a memory unit; a nearness layer having a nearness unit and a memory unit; said minimum point layer and nearness layer successively varying the minimum point parameter and nearness parameter to produce clustering; and removing data points that are not within clusters; and outputting the denoised data.
17. A system of claim 16 wherein the distance measure layer applies a distance measure that is one of rectilinear and polar.
18. A system of claim 16 wherein said successive instances varying of minimum point parameter and nearness parameter is a selected.
19. A system of claim 16 wherein said successive varying of minimum point parameter and nearness parameter until clustering occurs.
20. A system of claim 16 wherein said successive varying of minimum point parameter and nearness parameter is a selected number of combinations of minimum point and nearness.
Description
BACKGROUND OF INVENTION
[0001] The assessment of damaged tissue by burn or other cause has been done visually. Surgical intervention and debridement are often the treatment of choice. The visual presentation of tissue obscures the extent and condition of tissue. The underlying condition of damaged tissue whether dead, impaired or healthy is not readily determined visually.
BRIEF SUMMARY OF INVENTION
[0002] The technical problem is to take noisy dielectric data from probes to assess tissue damage. The solution is cluster data preferably using a dimensionless machine learning algorithm. There is no practical way to map such data to show tissue damage in near real time without machine learning.
[0003] The preferred embodiment is to take a density clustering algorithm, such as Density based Spatial Clustering of Application with Noise (DBSCAN), and to train it with data from burn patients. The algorithm clusters the data and determines the boundary of data point clusters. By training the algorithm and adjusting criteria such as distance measure, distance between data points, the minimum data points constituting a cluster and data density. Clusters of healthy tissue and damaged tissue emerges. Data density is also measured by the maximum distance between data points. The algorithm is validated with further validation data. The clusters are then mapped onto two and three dimensions. A map of clustered data can be displayed to guide surgeons and other healthcare professionals in the treatment of damaged tissue.
BRIEF DESCRIPTION OF DRAWINGS
[0004] FIG. 1A is an illustration of well defined and separated data clusters.
[0005] FIG. 1B is an illustration of non-linearly separated data clusters.
[0006] FIG. 1C illustration of clustering of noisy data.
[0007] FIG. 2 is an illustration of the dielectric response of nominal and stressed tissue of a data score against a time scale.
[0008] FIG. 3 is an illustration of the dielectric response of nominal tissue and stressed tissue of data score using a normalized time scale.
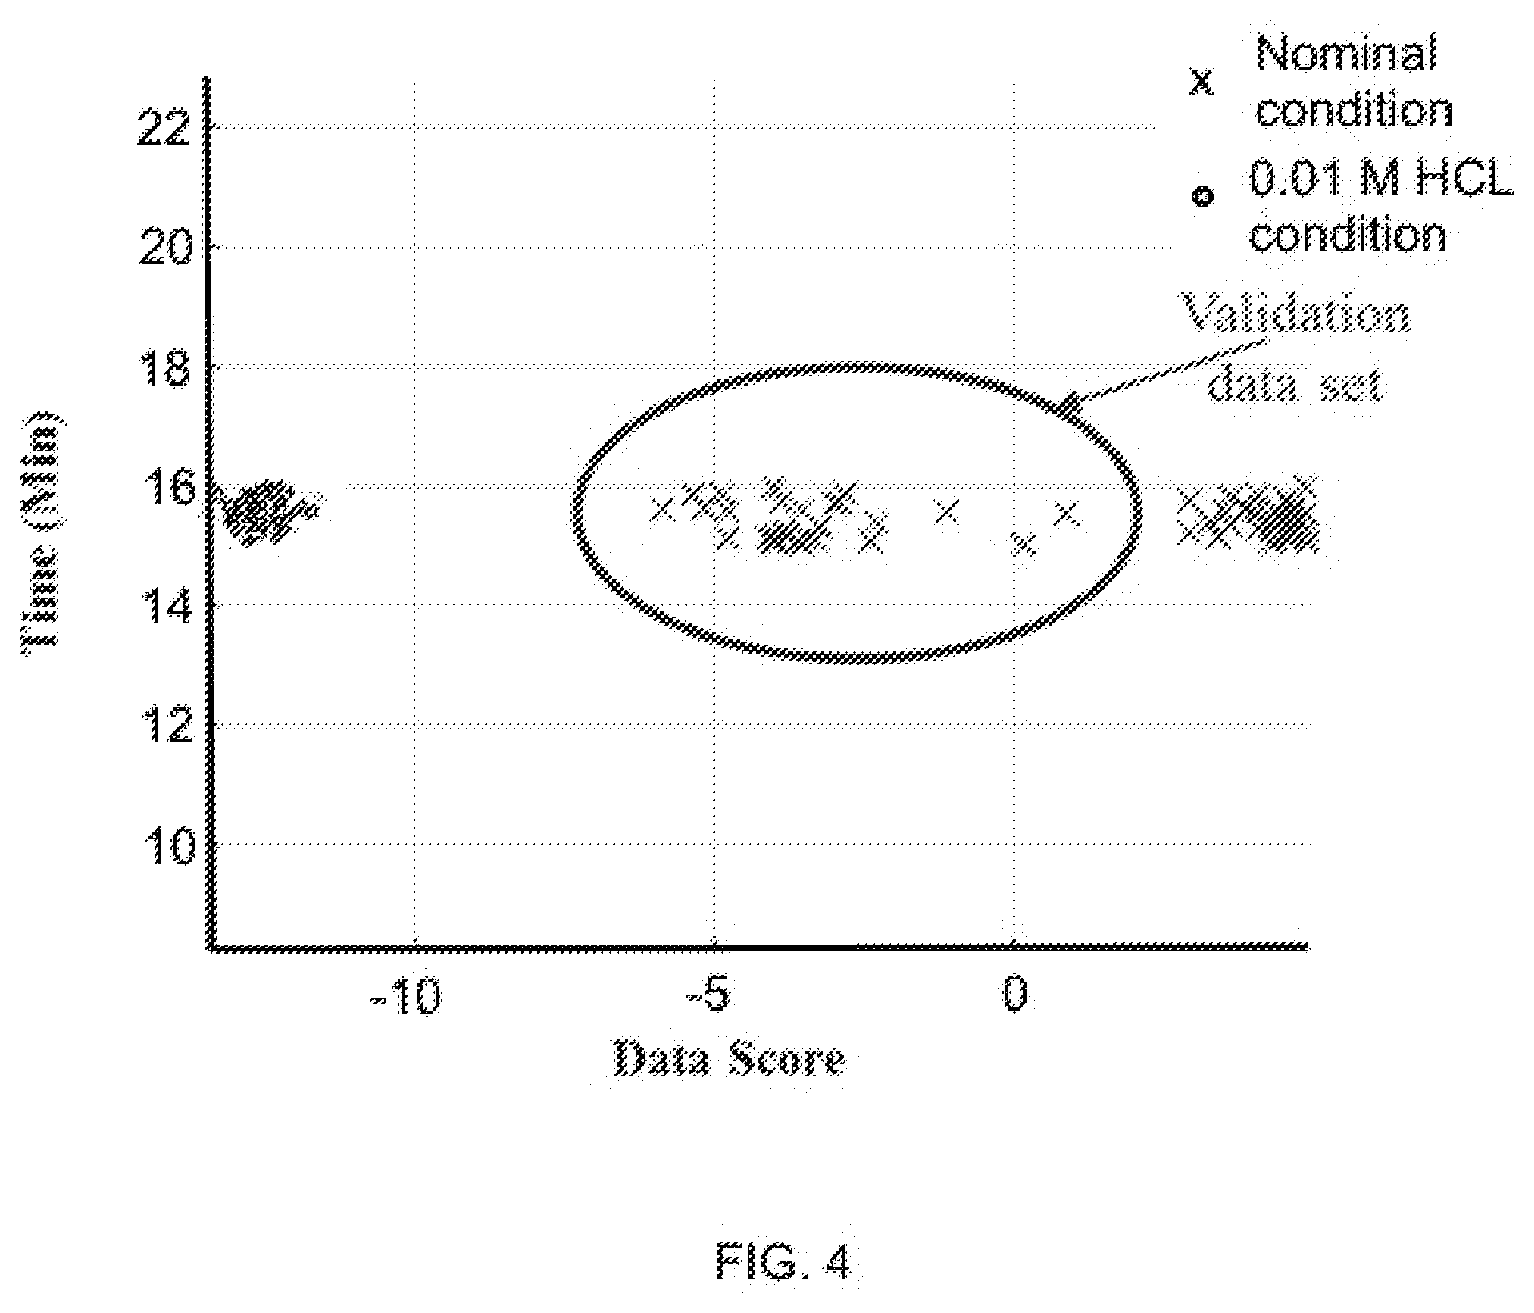
[0009] FIG. 4 is an illustration of the clustering dielectric response with nominal and stressed validation data clusters.
[0010] FIG. 5 is a block diagram of an embodiment of the system.
[0011] FIG. 6 is a flow chart of the method.
DETAILED DESCRIPTION OF INVENTION
[0012] The state of healthy, damaged and dead tissue can be determined from the dielectric response from far field probes. The technical problem is to take noisy permittivity data and identify the state of the tissue mapping it in 2 and 3 dimensions. The technical solution is to use machine learning algorithms to cluster the data points that are relevant to tissue assessment and to ignore the noise datapoints. There are multiple clustering algorithms. The preferred algorithm is a DBSCAN because it does not require knowledge of the number of clusters and is dimensionless. The algorithm Density Based Spatial Clustering of Applications with Noise (DBSCAN) is designed to discover the clusters and noise in a database according to definitions. DBSCAN calculates values by defining the neighborhood of a Point P. A naive approach could require for each point in a cluster that there are at least a minimum number of points (MinPts) the neighborhood of that point. Ideally, the parameters of epsilon (nearness) and MinPts would be known for each cluster and at least one point from the respective cluster. Using these parameters, one could retrieve all points that are density-reachable from the given point using the correct parameters. There is no simple way to know this for all clusters of the data set. However, there is a simple and effective heuristic to determine epsilon and MinPts of the least dense cluster in the data set by using a global value for each parameter for all clusters. The density parameters of the least dense cluster are used for these global parameter values specifying the lowest density which is not considered to be noise.
[0013] Pseudo Code for an implementation of a clustering algorithm is as follows:
TABLE-US-00001 DBSCAN (SetOfPoints, Eps, MinPts) // SetOfPoints is UNCLASSIFIED ClusterId := nextId(NOISE); FOR i FROM 1 TO SetOfPoints.size DO Point := SetOfPoints.get(i); IF Point.CiId = UNCLASSIFIED THEN IF ExpandCluster(SetOfPoints, Point, ClusterId, Eps, MinPts) THEN ClusterId := nextId(ClusterId) END IF END IF END FOR END; // DBSCAN
[0014] Where the SetOfPoints is the set of points of the received dielectric response data, Eps is epsilon, measure of nearness, and MinPts is the minimum number of points in a cluster.
[0015] The most important function used by DBSCAN is ExpandCluster which is presented below:
TABLE-US-00002 ExpandCluster (SetOfPoints, Point, CiId, Eps, MinPts) : Boolean; seeds : =SetOfPoints. regionQuery (Point, Eps ) IF seeds.size<MinPts THEN // no core point SetOfPoint. changeCl Id (Point, NOISE) RETURN False; ELSE // all points in seeds are density- // reachable from Point SetOfPoints. changeCiIds ( seeds, C1 Id) seeds .delete (Point) WHILE seeds <> Empty DO currentP := seeds.first( ) result := setofPoints.regionQuery(currentP, Eps) IF result.size >= MinPts THEN FOR i FROM 1 TO result.size DO resultP := result.get(i) IF resultP. CiId IN (UNCLASSIFIED, NOISE}THEN IF resultP.CiId = UNCLASSIFIED THEN seeds, append (resultP) END IF; SetOfPoints. changeCiId ( resultP, CiId) END IF; // UNCLASSIFIED or NOISE END FOR; END IF; // result.size >= MinPts seeds, delete (currentP) END WHILE; // seeds <> Empty RETURN True; END IF END; // ExpandCluster
[0016] When looking at the sample sets of points depicted in FIG. 1A-1C, unambiguously illustrates clusters of points and noise points not belonging to any of those clusters. As result, it is possible then to separate the noise.
[0017] FIGS. 1A and 1B are illustrations of the data clustering of experimental data in which cultured cells dielectric response is shown for untreated cultures and cultures that are stressed by a 0.01 MHCL solution. The FIG. 1C shows the data with noise. Similarly, FIG. 2 shows a set of data points for a nominal and 0.01 MHCL stressed culture. The dielectric response is separable and consistent over time. Similarly, in FIG. 3 the nominal and 0.01 MHCL data points cluster separately. The separation in a controlled laboratory environment is a basis for denoising a dielectric response of cells that are nominal and stressed. FIG. 4 shows results for clustering of validation data.
[0018] The differing dielectric response identifies differing tissue states (types). In this case the cell health of nominal and stressed cells.
The System
[0019] The system 100, FIG. 5, receives data from a dielectric probe 50. The probe measures the permittivity of tissue. The cell health of the tissue affects the permittivity. Healthy (nominal) cells have a different permittivity than cells that are stressed, damaged or dead. However, the data is noisy and it is difficult to separate the cell conditions. The system 100 is labeled burn assessment system, but it can be used to distinguish any cells that have different permittivity. The system 100 has three (3) layers, a measure layer 110, a minimum points layer 120, and a nearness layer 130. Each layer has a processing portion and a memory portion. The layer portions are referred to as units.
[0020] The distance measure is the manner that distance between data points are measured. Different measures are more appropriate for different tissue geometries. Preferably, the measure is cartesian along a Euclidean line or polar along a curve.
[0021] However, other measures such as hyperbolic curves would be more appropriate for certain geometries.
[0022] The distance measure portion applies the measure to the data and the measure and resulting data point distance are retained in memory and passed on to a minimum points layer 120.
[0023] The minimum points layer 120 has a minimum points measure that defines the minimum number of points that define a cluster. The minimum points measure is applied to the distance measured data points. The minimum points measure, and data points are retained in memory. This is passed to a maximum distance (nearness) layer 130 for define the boundary points of the resulting clusters.
[0024] The system begins with a selected measure, minimum points measure, and maximum distance (nearness) measure. The system varies the minimum points and nearness parameters preferably where the clustering separation is stable. However, the varying of parameters for a selected number of variances, varying only one of the minimum point or nearness parameters or a combination of these would also be within the denoising system.
[0025] The system is embodied vary the minimum points parameter and nearness parameters. The minimum points parameter can be held constant while varying the nearness parameter. The nearness parameter can be held constant while varying the minimum points parameter. Both parameters can be varied as well.
[0026] Once the clustering is completed, the data points not in the clusters are noise and are removed and outputted 60. The data can be mapped onto n-dimensions preferably two or three dimensions.
The Method
[0027] Data is processed by clustering the data according to similar data points. FIG. 6 is a flow chart of the method 200. The method 200, FIG. 6, takes data from a dielectric probe or sensor 210. A distance measure as previously described is selected and the distance between data points is measured. A minimum number of points that define a cluster is selected 230 and a nearness measure that defines the cluster density is selected 240. The minimum points and nearness parameter are preferably successively varied. However, one of the parameters can be held constant and only one varied or a combination of these selections and variance.
[0028] The method is embodied vary the minimum points parameter and nearness parameters. The minimum points parameter can be held constant while varying the nearness parameter. The nearness parameter can be held constant while varying the minimum points parameter. Both parameters can be varied as well. The parameters are varied preferably until the separation between clusters is stable. However, the number of variations of parameters until the separation is maximized or after a selected number of variations.
[0029] The data points that are not within a cluster are defined as noise and are removed 250 and the result is out put as denoised cluster data. The data can be mapped onto n-dimensions preferably two or three dimensions.
[0030] The de-noised data can be used to guide medical treatment of tissue that is not visibly damaged, or the damage is concealed. The damaged or in some way different tissue can be assessed and removed. The clustered data points that are denoised can be displayed for surgeons and medical professional or could be used for robotic surgery.
[0031] Although specific advantages have been enumerated above, various embodiments may include some, none, or all of the enumerated advantages. Other technical advantages may become readily apparent to one of ordinary skill in the art after review of the following figures and description.
[0032] It should be understood at the outset that, although exemplary embodiments are illustrated in the figures and described below, the principles of the present disclosure may be implemented using any number of techniques, whether currently known or not. The present disclosure should in no way be limited to the exemplary implementations and techniques illustrated in the drawings and described below.
[0033] Unless otherwise specifically noted, articles depicted in the drawings are not necessarily drawn to scale.
[0034] Modifications, additions, or omissions may be made to the systems, apparatuses, and methods described herein without departing from the scope of the disclosure. For example, the components of the systems and apparatuses may be integrated or separated. Moreover, the operations of the systems and apparatuses disclosed herein may be performed by more, fewer, or other components and the methods described may include more, fewer, or other steps. Additionally, steps may be performed in any suitable order.
[0035] To aid the Patent Office and any readers of any patent issued on this application in interpreting the claims appended hereto, applicants wish to note that they do not intend any of the appended claims or claim elements to invoke 35 U.S.C. 112(f) unless the words "means for" or "step for" are explicitly used in the particular claim.
* * * * *
D00000
D00001
D00002
D00003
D00004
D00005
D00006
XML
uspto.report is an independent third-party trademark research tool that is not affiliated, endorsed, or sponsored by the United States Patent and Trademark Office (USPTO) or any other governmental organization. The information provided by uspto.report is based on publicly available data at the time of writing and is intended for informational purposes only.
While we strive to provide accurate and up-to-date information, we do not guarantee the accuracy, completeness, reliability, or suitability of the information displayed on this site. The use of this site is at your own risk. Any reliance you place on such information is therefore strictly at your own risk.
All official trademark data, including owner information, should be verified by visiting the official USPTO website at www.uspto.gov. This site is not intended to replace professional legal advice and should not be used as a substitute for consulting with a legal professional who is knowledgeable about trademark law.