Taxonomy And Use Of Bone Marrow Stromal Cell
Baryawno; Ninib ; et al.
U.S. patent application number 16/709710 was filed with the patent office on 2020-07-02 for taxonomy and use of bone marrow stromal cell. The applicant listed for this patent is The Broad Institute, Inc. Massachusetts Institute of Technology The General Hospital Corporation President and Fellows of Harvar. Invention is credited to Ninib Baryawno, Monika Kowalczyk, Dariusz Przybylski, Aviv Regev, David T. Scadden.
| Application Number | 20200208114 16/709710 |
| Document ID | / |
| Family ID | 71122810 |
| Filed Date | 2020-07-02 |


View All Diagrams
| United States Patent Application | 20200208114 |
| Kind Code | A1 |
| Baryawno; Ninib ; et al. | July 2, 2020 |
TAXONOMY AND USE OF BONE MARROW STROMAL CELL
Abstract
Described herein are signatures that characterize a particular stromal cell state, type, and/or subtype. In some embodiments, the signatures can characterize a dysfunctional stromal cell. In some embodiments, the signatures can be used to diagnose, treat, and/or prevent a disease. In some embodiments, the signatures can characterize remodeling in a bone marrow microenvironment. Also described herein are cell populations having a specific signature and modulated cells that can be modulate to have a specific signature.
| Inventors: | Baryawno; Ninib; (Boston, MA) ; Przybylski; Dariusz; (Cambridge, MA) ; Kowalczyk; Monika; (Cambridge, MA) ; Regev; Aviv; (Cambridge, MA) ; Scadden; David T.; (Boston, MA) | ||||||||||
| Applicant: |
|
||||||||||
|---|---|---|---|---|---|---|---|---|---|---|---|
| Family ID: | 71122810 | ||||||||||
| Appl. No.: | 16/709710 | ||||||||||
| Filed: | December 10, 2019 |
Related U.S. Patent Documents
| Application Number | Filing Date | Patent Number | ||
|---|---|---|---|---|
| 62777606 | Dec 10, 2018 | |||
| 62808177 | Feb 20, 2019 | |||
| Current U.S. Class: | 1/1 |
| Current CPC Class: | C12N 15/11 20130101; C12Q 1/6886 20130101; G01N 33/5044 20130101; C12Q 2600/158 20130101; A61K 35/28 20130101; G01N 33/57426 20130101; C12N 2503/02 20130101; G01N 2333/51 20130101; C12N 9/22 20130101; C12N 2310/20 20170501; C12N 2800/80 20130101; C12N 5/0663 20130101; C12N 2510/00 20130101; C12Q 2600/136 20130101 |
| International Class: | C12N 5/0775 20060101 C12N005/0775; G01N 33/50 20060101 G01N033/50; C12N 15/11 20060101 C12N015/11; C12N 9/22 20060101 C12N009/22; A61K 35/28 20060101 A61K035/28; C12Q 1/6886 20060101 C12Q001/6886 |
Goverment Interests
STATEMENT REGARDING FEDERALLY SPONSORED RESEARCH
[0002] This invention was made with government support under Grant No. DK107784 granted by National Institutes of Health. The government has certain rights in the invention.
Claims
1. A method of remodeling a stromal cell landscape comprising: administering a modulating agent to a subject or a cell population that induces a shift in the stromal cell landscape from a disease-associated stromal cell landscape to a homeostatic stromal cell landscape.
2. The method of claim 1, wherein the shift in stromal cells from a disease-associated stromal cell landscape to a homeostatic stromal cell landscape comprises a change in the proportion of preosteoblasts.
3. The method of claim 2, wherein the change in the proportion of preosteoblasts comprises a change in the relative proportion of OLC-1 cells to OLC-2 cells.
4. The method of claim 3, wherein the change in the relative proportion of OLC-1 cells to OLC-2 cells comprises a decrease in OLC-1 cells and an increase in OLC-2 cells.
5. The method of claim 1, wherein the shift in stromal cells from a disease-associated stromal cell landscape to a homeostatic stromal cell landscape comprises a change in the relative proportion of bone marrow derived endothelial cell subtypes.
6. The method of claim 5, wherein the change in the change in the relative proportion of bone marrow derived endothelial cell subtypes comprises an increase in sinusoidal bone marrow derived endothelial cells and a decrease in arterial bone marrow derived endothelial cells.
7. The method of claim 1, wherein the shift in stromal cells from a disease-associated stromal cell landscape to a homeostatic stromal cell landscape comprises a change in the relative proportion of chondrocyte subtypes.
8. The method of claim 7, wherein the change in the relative proportion of chondrocyte subtypes comprises a decrease in chondrocyte hypertrophic cell subtype and an increase in chondrocyte progenitor cell subtype.
9. The method of claim 1, wherein the shift in stromal cells from a disease-associated stromal cell landscape to a homeostatic stromal cell landscape comprises a change in the relative proportion of fibroblast subtypes.
10. The method of claim 9, wherein the change in the relative proportion of fibroblast subtypes comprises an increase in fibroblast subtype-3 and a decrease in fibroblast subtype-4.
11. The method of claim 1, wherein the shift in stromal cells from a disease-associated stromal cell landscape to a homeostatic stromal cell landscape comprises a change in the relative proportion in mesenchymal stem/stromal cell (MSC) subtypes.
12. The method of claim 11, wherein the change in the relative proportion in mesenchymal stem/stromal cell (MSC) sub-types comprises a decrease in MSC-2 subtype and an increase in MSC-3 and MSC-4 subtypes.
13. The method of claim 1, wherein the shift in the stromal cell landscape comprises a change in the distance in gene expression space between OLC-1, OLC-2, bone marrow derived endothelial cell subtypes, chondrocyte subtypes, fibroblast subtypes, mesenchymal stem/stromal cell (MSC) subtypes, or a combination thereof.
14. The method of claim 13, wherein the distance is measured by a Euclidean distance, Pearson coefficient, Spearman coefficient, or a combination thereof.
15. The method of claim 14, wherein the gene expression space comprises 10 or more genes, 20 or more genes, 30 or more genes, 40 or more genes, 50 or more genes, 100 or more genes, 500 or more genes, or 1000 or more genes.
16. The method of claim 15, wherein remodeling the stromal cell landscape comprises increasing or decreasing the expression of one or more genes, gene programs, gene expression cassettes, gene expression signatures, or a combination thereof.
17. The method of claim 16, wherein the change in the gene expression space is characterized by a change in the expression of one or more genes as in any one of Tables 1-8 or a combination thereof or an expression signature derived therefrom.
18. The method of claim 15, wherein identifying differences in stromal cell states in the shift in the stromal cell landscape comprises comparing a gene expression distribution of a stromal cell type or subtype in the diseased stromal cell landscape with a gene expression distribution of the stromal cell type or subtype in the homeostatic stromal cell landscape as determined by single cell RNA-sequencing (scRNA-seq).
19. The method of claim 1, wherein the shift in the stromal cell landscape from a disease-associated stromal cell landscape to a homeostatic stromal cell landscape increases committed MSCs and decreases osteoprogenitor cells.
20. The method of claim 1, wherein the subject suffers from a hematological disease.
21. The method of claim 20, wherein the hematological disease is a blood cancer.
22. The method of claim 21, wherein the blood cancer is a leukemia.
23. The method of claim 20, wherein the blood cancer is acute lymphocytic leukemia, acute myeloid leukemia, chronic lymphocytic leukemia, chronic myeloid leukemia, hairy cell leukemia, myelodysplastic syndromes, acute promyelocytic leukemia, or myeloproliferative neoplasm.
24. The method of claim 1, wherein the cell population comprises a single cell type and/or subtype, a combination of cell types and/or subtypes, a cell-based therapeutic, an explant, or an organoid.
25. The method of claim 24, wherein the cell population is a non-hematopoietic stromal cell or cell population.
26. The method of claim 24, wherein the cell or cell population is a MSC, OLC, bone marrow derived endothelial cell, chondrocyte, or a fibroblast cell or cell population.
27. The method of claim 1, wherein the modulating agent is a therapeutic antibody, antibody fragment, antibody-like protein scaffold, aptamer, polypeptide, protein, genetic modifying agent, small molecule, small molecule degrader, or combination thereof.
28. The method of claim 27, wherein the genetic modifying agent is a CRISPR-Cas system, a TALEN, a Zn-finger nuclease, or a meganuclease.
29. An isolated or engineered stromal cell or cell population prepared by a method as in any one of claims 1-28.
30. An isolated or engineered mesenchymal stem/stromal cell (MSC) or MSC cell population, wherein the MSC or MSC cell population is characterized by a gene signature comprised of one or more genes of Table 1.
31. The isolated or engineered MSC or MSC cell population of claim 30, wherein the MSC or MSC cell population is characterized by a gene signature comprised of one or more of Cebpa, Zeb2, Runx2, Ebf1, Foxc1, Cebpb, Ar, Fos, Id4, Klf6, Irf1, Runx2, Jun, Snaj2, Maf, Zthx4, Id3, Egr1, Junb, Hp, Lpl, Gdpd2, Serping, Dpep1, Grem1, Pappa, Chrdl1, Fbln5, Vcam1, Kng1, H2-Q10, Cdh11, Mme, Tmem176b, Csf1, H2-K1, Serpine2, H2-D1, Tnc, Cdh2, Pdgtra, Esm1, Gas6, Cxcl14, Sfrp4, Wisp2, Agt, Il34, Fst, Fgf7, Il1rn, C2, Igfpb4, Serpina1, Cbln1, Apoe, Ibsp, Igfbp5, Gpx3, Pdzrn4, Rarres2, Vegfa, 1500009L16Rik, Serpina3g, Cyp1b1, Ebt3, Arrdc4, Kng2, Slc26a7, Marc1, Ms4ad4, Wdr86, Serpina3c, Tmem176a, Cldn10, Trt, Gpr88, Nnmt, Gm4951, Cd1d1, Plpp3, or Ackr4.
32. The isolated or engineered MSC or MSC cell population of claim 30, wherein the MSC or MSC cell population does not express one or more of Thy1, Ly6a (Sca-1), NG2 (Cspg4) or Nestin (Nes).
33. The isolated or engineered MSC or MSC cell population of claim 30, wherein the gene signature further comprises one or more of Nte5, Vcam1, Eng, Thy1, Ly6a, Grem1, Cspg4, Nes, Runx2, Col1A1, Erg1, Junb, Fosb, Cebpb, Klf6, Nr4a1, Klf2, Atf3, Klf4, Maff, Nfia, Smad6, Hey1, Sp7, Id1, Ifrd1, Trib1, Rrad, Odc1, Actb, Notch2, AlpI, Mmp13, Raph1, Tnfsf11, Cxc1, Adamts1, Cc17, Serpine1, Cc12, Apod, Cbln1, Pam, Col8a1, Wif1, Olfml3, Gdf10, Cyr61, Nog, Angpt4, Metrn1, Trabd2b, Adamts5, Igfbp4, Cxcl12, Igfbp5, Lepr, Cxcl12, Kit1, Grem1, or Angpt1.
34. An isolated or engineered osteolineage cell (OLC) or OLC population, wherein the isolated or engineered OLC or OLC population is characterized by a gene signature comprising one or more genes of Table 2.
35. The isolated or engineered OLC or OLC population, of claim 34, wherein the OLC or OLC population is characterized by a gene signature comprising one or more of Vdr, Satb2, Sp7, Runx2, Tbx2, Zeb2, Dlx5, Dlx6, Zfhx4, Hey1, Irx5, Id3, Mxd4, Mef2c, Esr1, Maf, Smad6, Sox4, Cebpb, Meis3, Mmp13, Tnc, Cfh, Alp1, Lrp4, Cdh11, Casm1, Cdh2, Slit2, Bmp3, Cdh15, Fat3, Pard6g, Litr, Cp, Ptprd, Olfml3 Fign, Cd63, Fap, Dmp1, Angpt4, Chn1, Ibsp, Wisp1, Wif1, Metrn1, Vldlr, Podnl1, Col22a1, Ndnf, Mmp14, Pgf, Lox11, Mfap2, Srpx2, Agt, Tmem59, Vstm4, Col8a1, Cxcl12, Bglap2, Car3, Kcnk2, Slc36a2, Ifitm5, Hpgd, Limch1, Gm44029, Hvcn1, Tnfrsf19, Col13a1, Fam78b, Gja1, Cnn2, Ppfibp2, Cldn10, Dapk2, Tmp1, Bglap3, or Ramp1.
36. The isolated or engineered OLC or OLC population of claim 34, wherein the OLC or OLC population expresses Bglap and Spp1.
37. The isolated or engineered OLC or OLC population of claim 34, wherein the gene signature further comprises one or more of Runx2, Sp7, Grem1, Lepr, Cxcl12, Kit1, Bglap, Cd200, Spp1, Sox9, Id4, Ebf1, Ebf3, Cebpa, Foxc1, Snai2, Maf, Runx1, Thra, Plagl1, Mafb, Vdr, Cebpb, Tcf712, Bhlhe40, Snai1, Creb311, Zbtb7c, Gm22, Tcf7, Nr4a2, Atf3, Prrx2, Fbln5, H2-K1, H2-D1, Hp, Fstl1, Tmem176b, B2m, Pappa, Dpep1, Islr, Vcam1, Lepr, Mmp13, Cd200, Itgb5, Lifr, Postn, Slit2, Timp1, Lrp4, Tspan6, Ctsc, Cpz, Prss35, Tmem119, Lox, Cryab, Pdzd2, Fyn, Gucala, Rerg, Sema4d, Vcam, Aspn, Slc20a2, Plat, Fmod, Fn1, Aebop1, Angpt12, Prkcdbp, Prelp, Cxcl12, Igfbp4, Cxcl14, Gas6, Apoe, Igfbp7, Col8a1, Serping1, Igfbp5, Igf1, Kit1, Spp1, Serpine2, Fam20c, Bmp8a, Dmp1, Ibsp, Pros1, Srpx2, Mgll, Timp3, Col11a2, Cgref1, Col1a1, Cthrc1, Sparc, Col22a1, Col5a2, Fkbp11, Col3a1, Ptn, Col6a2, Tnn, Npy, Col6a1, Omd, Dcn, Tgfbi, Col6a3, or Acan.
38. The isolated or engineered OLC or OLC population of claim 34, wherein the gene signature further comprises one or more of Runx2, Sp7, Grem1, Bglap, Cxcl12, Kit1, Osr1, Foxd1, Sox5, Osr2, Erg, Nfatc2, Mef2c, Sp7, Zbtb7c, Runx2, Snai2, Zfhx4, Dlx6, Meox1, Prrx1, Scx, Hic1, Peg3, Etv5, Ltbp1, Tspan8, Emb, Slc16a2, Tspan13, Creb5, Scara3, Prg4, Clu, plxdc1, Cdon, Fbln7, Ntn1, Nt5e, Thbd, Pth1r, Alp1, Cadm1, Cd200, Susd5, Rarres1, Ptprz1, Plat, Tnfrsf11b, Lpar3, Cspg4, Postn, S1pr1, Enah, Aspn, Cald1, Wnt5b, Adam12, Tnc, Pak1, Lpl, Mfap4, Cntfr, Fbln2, Fgl2, Gpc3, Ogn, Slc1a3, Spock2, Fbln5, Rgp1, Smoc1, C5ar1, Fzd9, Npr2, Fzd10, Cxcl14, Wif1, Arsi, Col12a1, Mgp, Itgbl1, Igf1, Smoc2, Spon2, Fst, Sbsn, Gas1, Sod3, Mmp3, Cilp, Pla2g2e, Fam213a, Acp5, Col15a1, Bglap2, Bglap3, Ibsp, Thbs4, Frzb, Bmp8a, Dkk1, Scube1, Chad, Spp1, Col11a2, Ptn, Ostn, Tnn, Mmp14, Gpx3, Cthrc1, Cxcl12, Prss12, Rbln1, Penk, Col8a1, Vipr2, Apod, Cpxm2, Rarres2, C4b, Sparcl1, Ly6e, R3hdm1, Mia, Myoc, Nrtn, Pdzrn4, Spp1, Pth1r, Sox9, Acan, or Mmp13.
39. An isolated or engineered pericyte or pericyte population, wherein the isolated or engineered pericyte is characterized by a gene signature comprising one or more genes in Table 3.
40. The isolated or engineered pericyte or pericyte population of claim 39, wherein the gene signature further comprises one or more of Hey1, Nr2f2, Tbx2, Ebf1, Ebf2, Foxsl, Id3, Met2c, Cebpb, Zfxh3, Nr4a1, Klf9, Zeb2, Prrx1, Meox2, Junb, Id4, Zfp467, Irf1, Arid5b, Atp1b2, Aoc3, Sncq, Itga7, Aspn, Steap4, Thy1, Filip1I, Parm1, Agtr1a, Olfml2a, Cald1, Ednra, Col18a1, Serpini1, Bcam, Rrad, Pdgfrb, Col5a3, Pde5a, Notch3, Myl1, Tinagl1, Art3, Ngf, Sparcl1, 116, Rarres2, Vstm4, Pgf, Pdgfa, Col4a2, Igfbp7, Col4a1, Fst, Rtn4lrl1, Adamts1, 1134, Gpc6, Cscll, Bgs5, Tagln, Higd1p, Nrip2, Gucv1a3, H2-M9, Des, Olfr558, Lmod1, Gucy1b3, Kcnk3, Pdlim3, Gm13861, Mrvi1, Pln, Gm13889, Ral11a, or Cygp.
41. The isolated or engineered pericyte or pericyte population of claim 39, wherein the gene signature further comprises one or more of Cspg4, Ngfr, Des, Myh11, Acta2, Rgs5, Thy1, Pdgtfrb, Nes, Lepr, Cdh2, Cxcl12, Kitl. Ebf1, Sox4, Dlx5, Mxd4, Smad6, Hey1, Tcf15, Klf2, Mef2c, Atf3, Meox2, Steap4, Olfml2a, H2-M9, Tspan15, Cd24a, Marcks, Fbn1, Tnfrsf21, Slc12a2, Cfh, Cdh2, Vcam1, Sncg, Rasd1, Bcam, Rrad, Prkcdbp, Susd5, Csrrp1, Ptrf, Lama5, Ppp1r12b, Fhl1, Vim, Sdpr, Vtn, Angpt12, Cd44, Htra1, Mfap5, Anxa2, Procr, Igf1, Mgp, Col5a3, col4a2, Vstm4, Col3a1, Col4a1, Emcn, Gas1, Col6a2, Kit1, Sparcl1, Igfbp5, Ntf3, Inhba, Ccdc3, Fst, Timp3, Col1a1, Nbl1, Nov, Ccl11, Lga1s1, Dpt, Ctsl, Col6a3, Cxcl12, Rgs5, Abcc9, Phlda1, Tgs2, Cygb, Marcksl1, Apbb2, Ifitm3, Tmsb4x, Fam162a, Tagln, Pcp411, Crip1, Myl6, Acta2, Pln, Nrip2, Mustn1, Dstn, Mul9, Myh11, S100a6, Tppp3, Enpp2, S100a10, Cav1, Gstm1, Lysmd2, Myl12a, Nnmt, or S100a11.
42. The isolated or engineered pericyte or pericyte population of claim 39, wherein the gene signature further comprises one or more Acta2, Myh11, Mcam, Jag1, and Il6.
43. An isolated or engineered chondrocyte or chondrocyte population, wherein the isolated or engineered chondrocyte population is characterized by a gene signature comprising one or more genes in Table 4.
44. The isolated or engineered chondrocyte or chondrocyte population of claim 43, wherein the gene signature further comprises one or more of Barx1, Pitx1, Foxd1, Osr2, Tbx18, Runx3, Osr2, Tbx18, Runx3, Peg3, Bhlhe41, Batf3, Plagl1, Sp7, Sox8, Lef1, Shox2, Zbtb20, Foxa3, Mef2c, Egr2, Pax1, Runx2, Prg4, Cpe, Mfi2, Scara3, Cpm, Chst11, Unc5q, Col11a1, Slc2a5, Slc26a2, Cspg4, Prc1, Fgfr3, Nid2, Spon1, Slc40a, Efemp1, Susd5, Fxyd3, Alp1, Corin, Tpd5211, Sema3d, F5, Slc38a3, Cytl1, Rbp4, Vit, Clip, Fam19a5, Col9a3, Col9a1, Col9a2, Matn3, Hapln1, Sfrp5, Notum, Mia, lhh, Mgst2, Rarres1, Gpld1, I17b, Bglap, 1500015010Rik, Itm2a, Crispld1, Meg3, Cenpp, Fxyd2, 3110079O15Rik, Lect1, Papss2, SAyt8, Stmn1, Lockd, Chil1, Calml3, Ncmap, Serpina1d, Serpina 1b, Serpina 1c, Sic6a1, or Serpina1a.
45. The isolated or engineered chondrocyte or chondrocyte population of claim 43, wherein the gene signature further comprises one or more of Sox9, Col11a2, Acan, or Col2a1.
46. The isolated or engineered chondrocyte or chondrocyte population of claim 43, wherein the gene signature further comprises one or more of Runx2, Ihh, Mef2c, or Col10a1.
47. The isolated or engineered chondrocyte or chondrocyte population of claim 43, wherein the gene signature further comprises one or more of Grem1, Runx2, Sp7, Alp1, or Spp1.
48. The isolated or engineered chondrocyte or chondrocyte population of claim 43, wherein the chondrocyte expresses one or more of Ihh, Pth1r, Mef2c, Col10a1, Ibsp, Mmp13, or Grem 1.
49. The isolated or engineered chondrocyte or chondrocyte population of claim 43, wherein the gene signature further comprises one or more of Prg4, Gas1, Clu, Dcn, Cilp, Scara3, Cytl1, Igfbp7, Cilp2, Cpe, Sod3, Cd81, Abi3 bp, Creb5, Gsn, Crip2, Vit, Fhl1, Pam, Cd9, Prrx1, Vim, Col11a2, Col9a1, Col2a1, Col9a2, Col27a1, Col9a3, Hapln1, Acan, Matn3, Col11a1, Pth1r, Mia, Pcolce2, Chst1, Epyc, Serpinh1, Gnb211, Fscn1, Pla2g5, Rcn1, Sox9, Bglap, Sp7, Fn1, Ube2s, Hmgb1, Ckap4, Clec11a, I17b, Ybx1, Tmem97, Rbm3, Slc26a2, C1qtnf3, Fkbp2, Prelp, Apoe, Cst3, Spon1, Olfml3, Wif1, Lef1, Notum, Emb, Col1a2, Sfrp5, Omd, Ctsd, Zbtb20, Islr, B2m, Ly6e, Alp1, Spp1, Chad, Timp3, Mef2c, Sparc, Ihh, Junb, Txnip, Rarres1, Scrg1, Sema3d, Colgalt2, Serinc5, Slc38a2, Ddit41, Egr1, Runx2, or Cxcl12.
50. An isolated or engineered fibroblast or fibroblast population, wherein the isolated or engineered fibroblast or fibroblast population is characterized by a gene signature comprising one or more genes of Table 5.
51. The isolated or engineered fibroblast or fibroblast population of claim 50, wherein the gene signature further comprises one or more of Scx, Barx1, Trps1, Hoxd9, Pitx1, Prrx1, Rora, Prrx2, Meox2, Ebf2, Osr2, Ebf1, Dlx3, Zfhx2, Meox1, Etv4, Mkx, Dcn, Clu, Abi3 bp, Prelp, Lox, Tnxb, Col3a1, Vcan, Vi, Mfap5, Col14a1, Aspn, Pdpn, Pdgfra, F13a1, Clic5, Gpr1, Emilin2, Has1, Mtap4, Gas2, Ntng1, Serpinf1, Postn, Angpt17, Clip2, Clip, Sod3, Slurp1, Spp1, Clec3b, Igfbp6, Thds4, Dpt, Gsn, Fndc1, Pla1a, Adamts15, Figf, Htra4, Rspo2, Mstn, Ptx4, Spock3, Cpxm2, Itgbl1, Anxa8, Fxyd5, Fxyd6, Egln3, Ptgis, I133, Fgf9, Tppp3, Crlp1, Mustn1, Celf2, Tmod2, Ly6a, Fez1, Lysmd2, Pcsk6, 2210407C18Rik, Aldh1a3, Rtn1, Rab37, Lnmd, Chod1, Fam159b, Prph, or Insc.
52. The isolated or engineered fibroblast or fibroblast population of claim 50, wherein the gene signature comprises one or more of Fibronectin-1 (Fn1), Fibroblast Specific Protein-1 (S100a4), Col1a1, Col1a2, Lum, Col22a1, or Twist2.
53. The isolated or engineered fibroblast or fibroblast population of claim 50, wherein the gene signature comprises one or more of Sox9, Acan, and Col2a1.
54. The isolated or engineered fibroblast or fibroblast population of claim 50, wherein the gene signature comprises one or more of Cd34, Ly6a, Pdgfra, Thy1 and Cd44, and not Cdh5, or Acta2.
55. The isolated or engineered fibroblast or fibroblast population of claim 50, wherein the gene signature comprises one or more of Sox-9, Scleraxis (Scx), Spp1, Cspg4, CD73 (Nt5e), or Cartilage Intermediate Layer Protein (Cilp).
56. The isolated or engineered fibroblast or fibroblast population of claim 50, wherein the gene signature further comprises one or more of S1004a, Dcn, Sema3c, or Cxcl12.
57. An isolated or engineered bone marrow derived endothelial cell (BMEC) or BMEC population, wherein the isolated or engineered fibroblast or fibroblast population is characterized by a gene signature comprising one or more genes of Table 6.
58. The isolated or engineered BMEC or BMEC population of claim 57, wherein the gene signature comprises one or more of Mafb, Pparg, Nr2f2, Irf8, Ets1, Sox17, Sox11, Bcl6b, Gata2, Tcf15, Meox1, Sox7, Tshz2, Tfpi, Gpm6a, Ackr1, Mrc1, Stab1, Vcam1, Tek, Flt1, Ramp3, Icam2, Podx1, Cd34, Mcam, Sdpr, Bcam, Tspan13, Fabp5, Vim, Kit1, Lrg1, Dnasel13, Sepp1, Egfl7, Pde2a, Gpihbp1, Sema3g, Ramp2, Cd3001g, C1qtnf9, Sparcl1, Tinagl1, Pdgfb, Ubd, Stab2, Fabp4, Cldn5, Rgs4, Ecscr, Cyyr1, Ly6c1, Magix, Cav1, Gngt2, Myct1, or Tmsb4x.
59. The isolated or engineered BMEC or BMEC population of claim 57, wherein the gene signature comprises one or more of Flt4 (Vegfr-3) and Ly6a (Sca-1), wherein Ly6a expression, when present in the gene signature, is reduced as compared to a suitable control.
60. The isolated or engineered BMEC or BMEC population of claim 57, wherein the gene signature comprises one or more of Pecam1, Cdh5, Cd34, Tek, Lepr, Cxcl12, or Kitl.
61. The isolated or engineered BMEC or BMEC population of claim 57, wherein the gene signature comprises one or more of Flt4, Ly6a, Icam1, or Sele.
62. The isolated or engineered BMEC or BMEC population of claim 57, wherein the gene signature comprises one or more of Mafb, Cebpb, Xbp1, Nr2f2, Irf8, Ybx1, Ebf1, Sox17, Mxd4, Id1, Meox2, Tshz2, Tcf15, Meox1, Tfpi, I116stm Angpt4, Gpm6a, Vcam1, Emp1, Cd34, Gnas, Slc9a3r2, Cald1, Mcam, Tspan13, Vim, Cd9, Ptrf, Crip2, Sepp1, Ctsl, Adamts5, Apoe, Igfbp4, Sparc, Col4a2, Col4a1, Serpinh1, Ppic, Cxcl12, Cst3, Sparcl1, C1qtnf9, Tinagl1, Mgll, Kit1, Stab2, Ubd, Gm1673, Abcc9, Rgs4, Ly6c1, Actg1, Tsc22d1, Glu1, Fxyd5, Crip1, Cav1, S100a6, S100a10, or lfitm2.
63. A method of treating a hematological disease comprising: administering to a subject in need thereof the isolated or engineered cell or cell population as in any one of claims 29-62.
64. A method of screening for one or more agents capable of modulating a stromal cell state, comprising: contacting a stromal cell population having an initial cell state with a test modulating agent or library of modulating agents, wherein the stromal cell population optionally contains leukemia cells; determining one or more fractions of stromal cell states including one or more fraction(s) of a mesenchymal stem/stromal cell (MSC), an OLC, a chondrocyte, a fibroblast, a pericyte, a bone marrow derived endothelial cell (BMEC), or a combination thereof; and selecting modulating agents that shifts the initial stromal cell state to a desired stromal cell state, wherein the desired stromal cell fraction in the stromal cell population is above a set cutoff limit.
65. The method of claim 64, wherein determining one or more fractions of stromal cell states further comprises determining one or more MSC subtype, one or more OLC types, one or more chondrocyte types, one or more fibroblast types, one or more BMEC types, one or more pericyte subtype, or a combination thereof.
66. The method of claim 64 or 65, wherein the stromal cell population is obtained from a subject to be treated.
67. The method of claim 64 or 65, wherein determining one or more fractions of stromal cell states comprises identifying a MSC gene signature, an OLC gene signature, a chondrocyte gene signature, a fibroblast gene signature, a BMEC gene signature, a pericyte gene signature.
68. The method of claim 67, wherein the MSC gene signature comprises: a. one or more genes of Table 1; b. one or more of Cebpa, Zeb2, Runx2, Ebf1, Foxc1, Cebpb, Ar, Fos, Id4, Klf6, Irf1, Runx2, Jun, Snaj2, Maf, Zthx4, Id3, Egr1, Junb, Hp, Lpl, Gdpd2, Serping, Dpep1, Grem1, Pappa, Chrdl1, Fbln5, Vcam1, Kng1, H2-Q10, Cdh11, Mme, Tmem176b, Csf1, H2-K1, Serpine2, H2-D1, Tnc, Cdh2, Pdgtra, Esm1, Gas6, Cxcl14, Sfrp4, Wisp2, Agt, Il34, Fst, Fgf7, Il1rn, C2, Igfpb4, Serpina1, Cbln1, Apoe, Ibsp, Igfbp5, Gpx3, Pdzrn4, Rarres2, Vegfa, 1500009L16Rik, Serpina3g, Cyp1b1, Ebt3, Arrdc4, Kng2, Slc26a7, Marc1, Ms4ad4, Wdr86, Serpina3c, Tmem176a, Cldn10, Trt, Gpr88, Nnmt, Gm4951, Cd1d1, Plpp3, or Ackr4; or c. Nte5, Vcam1, Eng, Thy1, Ly6a, Grem1, Cspg4, Nes, Runx2, Col1A1, Erg1, Junb, Fosb, Cebpb, Klf6, Nr4a1, Klf2, Atf3, Klf4, Maff, Nfia, Smad6, Hey1, Sp7, Id1, Ifrd1, Trib1, Rrad, Odc1, Actb, Notch2, AlpI, Mmp13, Raph1, Tnfsf11, Cxc1, Adamts1, Cc17, Serpine1, Cc12, Apod, Cbln1, Pam, Col8a1, Wif1, Olfml3, Gdf10, Cyr61, Nog, Angpt4, Metrn1, Trabd2b, Adamts5, Igfbp4, Cxcl12, Igfbp5, Lepr, Cxcl12, Kit1, Grem1, or Angpt1, and wherein the MCS optionally does not express one or more of Thy1, Ly6a (Sca-1), NG2 (Cspg4) or Nestin (Nes).
69. The method of claim 67, wherein the OLC gene signature comprises: a. one or more genes of Table 2; b. one or more of Vdr, Satb2, Sp7, Runx2, Tbx2, Zeb2, Dlx5, Dlx6, Zfhx4, Hey1, Irx5, Id3, Mxd4, Mef2c, Esr1, Maf, Smad6, Sox4, Cebpb, Meis3, Mmp13, Tnc, Cfh, Alp1, Lrp4, Cdh11, Casm1, Cdh2, Slit2, Bmp3, Cdh15, Fat3, Pard6g, Litr, Cp, Ptprd, Olfml3 Fign, Cd63, Fap, Dmp1, Angpt4, Chn1, Ibsp, Wisp1, Wif1, Metrn1, Vldlr, Podnl1, Col22a1, Ndnf, Mmp14, Pgf, Lox11, Mfap2, Srpx2, Agt, Tmem59, Vstm4, Col8a1, Cxcl12, Bglap2, Car3, Kcnk2, Slc36a2, Ifitm5, Hpgd, Limch1, Gm44029, Hvcn1, Tnfrsf19, Col13a1, Fam78b, Gja1, Cnn2, Ppfibp2, Cldn10, Dapk2, Tmp1, Bglap3, or Ramp1; c. one or more of Runx2, Sp7, Grem1, Lepr, Cxcl12, Kit1, Bglap, Cd200, Spp1, Sox9, Id4, Ebf1, Ebf3, Cebpa, Foxc1, Snai2, Maf, Runx1, Thra, Plagl1, Mafb, Vdr, Cebpb, Tcf712, Bhlhe40, Snai1, Creb311, Zbtb7c, Gm22, Tcf7, Nr4a2, Atf3, Prrx2, Fbln5, H2-K1, H2-D1, Hp, Fstl1, Tmem176b, B2m, Pappa, Dpep1, Islr, Vcam1, Lepr, Mmp13, Cd200, Itgb5, Lifr, Postn, Slit2, Timp1, Lrp4, Tspan6, Ctsc, Cpz, Prss35, Tmeml19, Lox, Cryab, Pdzd2, Fyn, Gucala, Rerg, Sema4d, Vcam, Aspn, Slc20a2, Plat, Fmod, Fn1, Aebop1, Angpt12, Prkcdbp, Prelp, Cxcl12, Igfbp4, Cxcl14, Gas6, Apoe, Igfbp7, Col8a1, Serping1, Igfbp5, Igf1, Kit1, Spp1, Serpine2, Fam20c, Bmp8a, Dmp1, Ibsp, Pros1, Srpx2, Mgll, Timp3, Col11a2, Cgref1, Col1a1, Cthrc1, Sparc, Col22a1, Col5a2, Fkbp11, Col3a1, Ptn, Col6a2, Tnn, Npy, Col6a1, Omd, Dcn, Tgfbi, Col6a3, or Acan; or d. one or more of Runx2, Sp7, Grem1, Bglap, Cxcl12, Kit1, Osr1, Foxd1, Sox5, Osr2, Erg, Nfatc2, Mef2c, Sp7, Zbtb7c, Runx2, Snai2, Zfhx4, Dlx6, Meox1, Prrx1, Scx, Hic1, Peg3, Etv5, Ltbp1, Tspan8, Emb, Slc16a2, Tspan13, Creb5, Scara3, Prg4, Clu, plxdc1, Cdon, Fbln7, Ntn1, Nt5e, Thbd, Pth1r, Alp1, Cadm1, Cd200, Susd5, Rarres1, Ptprz1, Plat, Tnfrsf11b, Lpar3, Cspg4, Postn, S1pr1, Enah, Aspn, Cald1, Wnt5b, Adam12, Tnc, Pak1, Lpl, Mfap4, Cntfr, Fbln2, Fgl2, Gpc3, Ogn, Slc1a3, Spock2, Fbln5, Rgp1, Smoc1, C5ar1, Fzd9, Npr2, Fzd10, Cxcl14, Wif1, Arsi, Col12a1, Mgp, Itgbl1, Igf1, Smoc2, Spon2, Fst, Sbsn, Gas1, Sod3, Mmp3, Cilp, Pla2g2e, Fam213a, Acp5, Col15a1, Bglap2, Bglap3, Ibsp, Thbs4, Frzb, Bmp8a, Dkk1, Scube1, Chad, Spp1, Col11a2, Ptn, Ostn, Tnn, Mmp14, Gpx3, Cthrc1, Cxcl12, Prss12, Rbln1, Penk, Col8a1, Vipr2, Apod, Cpxm2, Rarres2, C4b, Sparcl1, Ly6e, R3hdml, Mia, Myoc, Nrtn, Pdzrn4, Spp1, Pth1r, Sox9, Acan, or Mmp13, and wherein the OLC optionally expresses Bglap and Spp1.
70. The method of claim 67, wherein the chondrocyte gene signature comprises: a. one or more genes of Table 4; b. one or more of Barx1, Pitx1, Foxd1, Osr2, Tbx18, Runx3, Osr2, Tbx18, Runx3, Peg3, Bhlhe41, Batf3, Plagl1, Sp7, Sox8, Lef1, Shox2, Zbtb20, Foxa3, Mef2c, Egr2, Pax1, Runx2, Prg4, Cpe, Mfi2, Scara3, Cpm, Chst1, Unc5q, Col11a1, Slc2a5, Slc26a2, Cspg4, Prc1, Fgfr3, Nid2, Spon1, Slc40a, Efemp1, Susd5, Fxyd3, Alp1, Corin, Tpd5211, Sema3d, F5, Slc38a3, Cytl1, Rbp4, Vit, Clip, Fam19a5, Col9a3, Col9a1, Col9a2, Matn3, Hapln1, Sfrp5, Notum, Mia, lhh, Mgst2, Rarres1, Gpld1, I17b, Bglap, 1500015010Rik, Itm2a, Crispld1, Meg3, Cenpp, Fxyd2, 3110079O15Rik, Lect1, Papss2, SAyt8, Stmn1, Lockd, Chil1, Calml3, Ncmap, Serpina1d, Serpina 1b, Serpina 1c, Sic6a1, or Serpina1a; c. one or more of Sox9, Col11a2, Acan, or Col2a1; d. one or more of Runx2, Ihh, Mef2c, or Col10a1; e. one or more of Grem, Runx2, Sp7, Alp1, or Spp1; f. one or more of Ihh, Pth1r, Mef2c, Col10a1, Ibsp, Mmp13, Grem 1; or g. one or more of Prg4, Gas1, Clu, Dcn, Cilp, Scara3, Cytl1, Igfbp7, Cilp2, Cpe, Sod3, Cd81, Abi3 bp, Creb5, Gsn, Crip2, Vit, Fhl1, Pam, Cd9, Prrx1, Vim, Col11a2, Col9a1, Col2a1, Col9a2, Col27a1, Col9a3, Hapln1, Acan, Matn3, Col11a1, Pth1r, Mia, Pcolce2, Chst11, Epyc, Serpinh1, Gnb211, Fscn1, Pla2g5, Rcn1, Sox9, Bglap, Sp7, Fn1, Ube2s, Hmgb1, Ckap4, Clec11a, Il17b, Ybx1, Tmem97, Rbm3, Slc26a2, C1qtnf3, Fkbp2, Prelp, Apoe, Cst3, Spon1, Olfml3, Wif1, Lef1, Notum, Emb, Col1a2, Sfrp5, Omd, Ctsd, Zbtb20, Islr, B2m, Ly6e, Alp1, Spp1, Chad, Timp3, Mef2c, Sparc, Ihh, Junb, Txnip, Rarres1, Scrg1, Sema3d, Colgalt2, Serinc5, Slc38a2, Ddit41, Egr1, Runx2, or Cxcl12.
71. The method of claim 67, wherein the fibroblast gene signature comprises: a. one or more genes of Table 5; b. one or more of Scx, Barx1, Trps1, Hoxd9, Pitx1, Prrx1, Rora, Prrx2, Meox2, Ebf2, Osr2, Ebf1, Dlx3, Zfhx2, Meox1, Etv4, Mkx, Dcn, Clu, Abi3 bp, Prelp, Lox, Tnxb, Col3a1, Vcan, Vi, Mfap5, Col14a1, Aspn, Pdpn, Pdgfra, F13a1, Clic5, Gpr1, Emilin2, Has1, Mtap4, Gas2, Ntng1, Serpinf1, Postn, Angpt17, Clip2, Clip, Sod3, Slurp1, Spp1, Clec3b, Igfbp6, Thds4, Dpt, Gsn, Fndc1, Pla1a, Adamts15, Figf, Htra4, Rspo2, Mstn, Ptx4, Spock3, Cpxm2, Itgbl1, Anxa8, Fxyd5, Fxyd6, Egln3, Ptgis, I133, Fgf9, Tppp3, Crlp1, Mustn1, Celf2, Tmod2, Ly6a, Fez1, Lysmd2, Pcsk6, 2210407C18Rik, Aldh1a3, Rtn1, Rab37, Lnmd, Chod1, Fam159b, Prph, or Insc; c. Fibronectin-1 (Fn1), Fibroblast Specific Protein-1 (S100a4), Col1a1, Col1a2, Lum, Col22a1, or Twist2; d. one or more of Sox9, Acan, and Col2a1; e. Cd34, Ly6a, Pdgfra, Thy1 and Cd44, and not Cdh5, or Acta2; f. one or more of Sox-9, Scleraxis (Scx), Spp1, Cspg4, CD73 (Nt5e), and Cartilage Intermediate Layer Protein (Cilp); or g. one or more of S1004a, Dcn, Sema3c, or Cxcl12.
72. The method of claim 67, wherein the BMEC gene signature comprises: a. one or more genes of Table 6; b. one or more of Mafb, Pparg, Nr2f2, Irf8, Ets1, Sox17, Sox11, Bcl6b, Gata2, Tcf15, Meox1, Sox7, Tshz2, Tfpi, Gpm6a, Ackr1, Mrc1, Stab1, Vcam1, Tek, Flt1, Ramp3, Icam2, Podx1, Cd34, Mcam, Sdpr, Bcam, Tspan13, Fabp5, Vim, Kit1, Lrg1, Dnasel13, Sepp1, Egfl7, Pde2a, Gpihbp1, Sema3g, Ramp2, Cd3001g, C1qtnf9, Sparcl1, Tinagl1, Pdgfb, Ubd, Stab2, Fabp4, Cldn5, Rgs4, Ecscr, Cyyr1, Ly6c1, Magix, Cav1, Gngt2, Myct1, or Tmsb4x; c. one or more of Flt4 (Vegfr-3) or Ly6a (Sca-1); d. one or more of Pecam1, Cdh5, Cd34, Tek, Lepr, Cxcl12, or Kitl; e. one or more of Flt4, Ly6a, Icam1, or Sele; f. one or more of Mafb, Cebpb, Xbp1, Nr2f2, Irf8, Ybx1, Ebf1, Sox17, Mxd4, Id1, Meox2, Tshz2, Tcf15, Meox1, Tfpi, I1l6stm Angpt4, Gpm6a, Vcam1, Emp1, Cd34, Gnas, Slc9a3r2, Cald1, Mcam, Tspan13, Vim, Cd9, Ptrf, Crip2, Sepp1, Ctsl, Adamts5, Apoe, Igfbp4, Sparc, Col4a2, Col4a1, Serpinh1, Ppic, Cxcl12, Cst3, Sparcl1, C1qtnf9, Tinagl1, Mgll, Kit1, Stab2, Ubd, Gm1673, Abcc9, Rgs4, Ly6c1, Actg1, Tsc22d1, Glu1, Fxyd5, Crip1, Cav1, S100a6, S100a10, lfitm2; or g. one or more of Mafb, Cebpb, Xbp1, Nr2f2, Irf8, Ybx1, Ebf1, Sox17, Mxd4, Id1, Meox2, Tshz2, Tcf15, Meox1, Tfpi, I1l6stm Angpt4, Gpm6a, Vcam1, Emp1, Cd34, Gnas, Slc9a3r2, Cald1, Mcam, Tspan13, Vim, Cd9, Ptrf, Crip2, Sepp1, Ctsl, Adamts5, Apoe, Igfbp4, Sparc, Col4a2, Col4a1, Serpinh1, Ppic, Cxcl12, Cst3, Sparcl1, C1qtnf9, Tinagl1, Mgll, Kit1, Stab2, Ubd, Gm1673, Abcc9, Rgs4, Ly6c1, Actg1, Tsc22d1, Glu1, Fxyd5, Crip1, Cav1, S100a6, S100a10, or lfitm2.
73. The method of claim 67, wherein the pericyte gene signature comprises: a. one or more genes in Table 3; b. one or more of Hey1, Nr2f2, Tbx2, Ebf1, Ebf2, Foxsl, Id3, Met2c, Cebpb, Zfxh3, Nr4a1, Klf9, Zeb2, Prrx1, Meox2, Junb, Id4, Zfp467, Irf1, Arid5b, Atp1b2, Aoc3, Sncq, Itga7, Aspn, Steap4, Thy1, Filip1I, Parm1, Agtr1a, Olfml2a, Cald1, Ednra, Col18a1, Serpini1, Bcam, Rrad, Pdgfrb, Col5a3, Pde5a, Notch3, Myl1, Tinagl1, Art3, Ngf, Sparcl1, 116, Rarres2, Vstm4, Pgf, Pdgfa, Col4a2, Igfbp7, Col4a1, Fst, Rtn4lrl1, Adamts1, 1134, Gpc6, Cscll, Bgs5, Tagln, Higd1p, Nrip2, Gucv1a3, H2-M9, Des, Olfr558, Lmod1, Gucy1b3, Kcnk3, Pdlim3, Gm13861, Mrvi1, Pln, Gm13889, Ral11a, Cygp; c. one or more of Cspg4, Ngfr, Des, Myh11, Acta2, Rgs5, Thy1, Pdgtfrb, Nes, Lepr, Cdh2, Cxcl12, Kitl. Ebf1, Sox4, Dlx5, Mxd4, Smad6, Hey1, Tcf15, Klf2, Mef2c, Atf3, Meox2, Steap4, Olfml2a, H2-M9, Tspan15, Cd24a, Marcks, Fbn1, Tnfrsf21, Slc12a2, Cfh, Cdh2, Vcam1, Sncg, Rasd1, Bcam, Rrad, Prkcdbp, Susd5, Csrrp1, Ptrf, Lama5, Ppp1r12b, Fhl1, Vim, Sdpr, Vtn, Angpt12, Cd44, Htra1, Mfap5, Anxa2, Procr, Igf1, Mgp, Col5a3, col4a2, Vstm4, Col3a1, Col4a1, Emcn, Gas1, Col6a2, Kit1, Sparcl1, Igfbp5, Ntf3, Inhba, Ccdc3, Fst, Timp3, Col1a1, Nbl1, Nov, Ccl11, Lga1s1, Dpt, Ctsl, Col6a3, Cxcl12, Rgs5, Abcc9, Phlda1, Tgs2, Cygb, Marcksl1, Apbb2, Ifitm3, Tmsb4x, Fam162a, Tagln, Pcp411, Crip1, Myl6, Acta2, Pln, Nrip2, Mustn1, Dstn, Mul9, Myh11, S100a6, Tppp3, Enpp2, S100a10, Cav1, Gstm1, Lysmd2, Myl12a, Nnmt, or S100a11; or d. one or more of Acta2, Myh11, Mcam, Jag1, or Il6.
74. The method of claim 64, wherein the modulating agent that shifts the initial stromal cell state to the desired stromal cell state is capable of remodeling in a hematological disease.
75. A method of screening for one or more agents capable of modulating osteogenic and/or adipogenic differentiation in a hematological disease comprising: contacting a cell population with a test modulating agent, wherein the cell population comprises MSC(s), OLC(s), and leukemia cells; and selecting modulating agents that change the regulation of one or more of Grem1, Bmp4, Sp7, Runx2, Bglap1, Bglap2, Bglap3, Adipoq, Wisp2, Mgp, Igbfp5, Igbfp3, Mmp2, Mmp11, or Mmp13.
76. A method of screening for one or more agents capable of remodeling in a hematological disease comprising: contacting a cell population with a test modulating agent, wherein the cell population comprises MSC(s), OLC(s), and leukemia cells; and selecting one or more modulating agents that a. change the proportion of prerosteoblasts in the cell population; b. change the relative proportion of OLC-1 to OLC-2 in the cell population; c. change the relative proportion of hypertrophic chondrocytes to progenitor chondrocytes in the cell population; d. change the relative proportion of subtype-3 (Cluster 16) fibroblasts to subtype-4 fibroblasts (Cluster 3); or e. a combination thereof.
77. A method of detecting a mesenchymal stem/stromal cell (MSC) from a population of stromal cells comprising: detecting in a sample the expression or activity of a MSC gene expression signature, wherein detection of the MSC gene expression signature indicates MSCs in the sample, and wherein the MSC gene expression signature comprises: a. one or more genes of Table 1; b. one or more of Cebpa, Zeb2, Runx2, Ebf1, Foxc1, Cebpb, Ar, Fos, Id4, Klf6, Irf1, Runx2, Jun, Snaj2, Maf, Zthx4, Id3, Egr1, Junb, Hp, Lpl, Gdpd2, Serping, Dpep1, Grem1, Pappa, Chrdl1, Fbln5, Vcam1, Kng1, H2-Q10, Cdh11, Mme, Tmem176b, Csf1, H2-K1, Serpine2, H2-D1, Tnc, Cdh2, Pdgtra, Esm1, Gas6, Cxcl14, Sfrp4, Wisp2, Agt, Il34, Fst, Fgf7, Il1rn, C2, Igfpb4, Serpina1, Cbln1, Apoe, Ibsp, Igfbp5, Gpx3, Pdzrn4, Rarres2, Vegfa, 1500009L16Rik, Serpina3g, Cyp1b1, Ebt3, Arrdc4, Kng2, Slc26a7, Marc1, Ms4ad4, Wdr86, Serpina3c, Tmem176a, Cldn10, Trt, Gpr88, Nnmt, Gm4951, Cd1d1, Plpp3, or Ackr4; or c. Nte5, Vcam1, Eng, Thy1, Ly6a, Grem1, Cspg4, Nes, Runx2, Col1A1, Erg1, Junb, Fosb, Cebpb, Klf6, Nr4a1, Klf2, Atf3, Klf4, Maff, Nfia, Smad6, Hey1, Sp7, Id1, Ifrd1, Trib1, Rrad, Odc1, Actb, Notch2, AlpI, Mmp13, Raph1, Tnfsf11, Cxc1, Adamts1, Cc17, Serpine1, Cc12, Apod, Cbln1, Pam, Col8a1, Wif1, Olfml3, Gdf10, Cyr61, Nog, Angpt4, Metrn1, Trabd2b, Adamts5, Igfbp4, Cxcl12, Igfbp5, Lepr, Cxcl12, Kit1, Grem1, or Angpt1; and wherein the MCS optionally does not express one or more of Thy1, Ly6a (Sca-1), NG2 (Cspg4) or Nestin (Nes).
78. A method of detecting an osteolineage cell (OLC) from a population of stromal cells comprising: detecting in a sample the expression or activity of an OLC gene expression signature, wherein detection of the OLC gene expression signature indicates OLCs in the sample, and wherein the OLC gene expression signature comprises a. one or more genes of Table 2; b. one or more of Vdr, Satb2, Sp7, Runx2, Tbx2, Zeb2, Dlx5, Dlx6, Zfhx4, Hey1, Irx5, Id3, Mxd4, Mef2c, Esr1, Maf, Smad6, Sox4, Cebpb, Meis3, Mmp13, Tnc, Cfh, Alp1, Lrp4, Cdh11, Casm1, Cdh2, Slit2, Bmp3, Cdh15, Fat3, Pard6g, Litr, Cp, Ptprd, Olfml3 Fign, Cd63, Fap, Dmp1, Angpt4, Chn1, Ibsp, Wisp1, Wif1, Metrn1, Vldlr, Podnl1, Col22a1, Ndnf, Mmp14, Pgf, Lox11, Mfap2, Srpx2, Agt, Tmem59, Vstm4, Col8a1, Cxcl12, Bglap2, Car3, Kcnk2, Slc36a2, Ifitm5, Hpgd, Limch1, Gm44029, Hvcn1, Tnfrsf19, Col13a1, Fam78b, Gja1, Cnn2, Ppfibp2, Cldn10, Dapk2, Tmp1, Bglap3, or Ramp1; c. one or more of Runx2, Sp7, Grem1, Lepr, Cxcl12, Kit1, Bglap, Cd200, Spp1, Sox9, Id4, Ebf1, Ebf3, Cebpa, Foxc1, Snai2, Maf, Runx1, Thra, Plagl1, Mafb, Vdr, Cebpb, Tcf712, Bhlhe40, Snai1, Creb311, Zbtb7c, Gm22, Tcf7, Nr4a2, Atf3, Prrx2, Fbln5, H2-K1, H2-D1, Hp, Fstl1, Tmem176b, B2m, Pappa, Dpep1, Islr, Vcam1, Lepr, Mmp13, Cd200, Itgb5, Lifr, Postn, Slit2, Timp1, Lrp4, Tspan6, Ctsc, Cpz, Prss35, Tmeml19, Lox, Cryab, Pdzd2, Fyn, Gucala, Rerg, Sema4d, Vcam, Aspn, Slc20a2, Plat, Fmod, Fn1, Aebop1, Angpt12, Prkcdbp, Prelp, Cxcl12, Igfbp4, Cxcl14, Gas6, Apoe, Igfbp7, Col8a1, Serping1, Igfbp5, Igf1, Kit1, Spp1, Serpine2, Fam20c, Bmp8a, Dmp1, Ibsp, Pros1, Srpx2, Mgll, Timp3, Col11a2, Cgref1, Col1a1, Cthrc1, Sparc, Col22a1, Col5a2, Fkbp11, Col3a1, Ptn, Col6a2, Tnn, Npy, Col6a1, Omd, Dcn, Tgfbi, Col6a3, or Acan; or d. one or more of Runx2, Sp7, Grem1, Bglap, Cxcl12, Kit1, Osr1, Foxd1, Sox5, Osr2, Erg, Nfatc2, Mef2c, Sp7, Zbtb7c, Runx2, Snai2, Zfhx4, Dlx6, Meox1, Prrx1, Scx, Hic1, Peg3, Etv5, Ltbp1, Tspan8, Emb, Slc16a2, Tspan13, Creb5, Scara3, Prg4, Clu, plxdc1, Cdon, Fbln7, Ntn1, Nt5e, Thbd, Pth1r, Alp1, Cadm1, Cd200, Susd5, Rarres1, Ptprz1, Plat, Tnfrsf11b, Lpar3, Cspg4, Postn, S1pr1, Enah, Aspn, Cald1, Wnt5b, Adam12, Tnc, Pak1, Lpl, Mfap4, Cntfr, Fbln2, Fgl2, Gpc3, Ogn, Slc1a3, Spock2, Fbln5, Rgp1, Smoc1, C5ar1, Fzd9, Npr2, Fzd10, Cxcl14, Wif1, Arsi, Col12a1, Mgp, Itgbl1, Igf1, Smoc2, Spon2, Fst, Sbsn, Gas1, Sod3, Mmp3, Cilp, Pla2g2e, Fam213a, Acp5, Col15a1, Bglap2, Bglap3, Ibsp, Thbs4, Frzb, Bmp8a, Dkk1, Scube1, Chad, Spp1, Col11a2, Ptn, Ostn, Tnn, Mmp14, Gpx3, Cthrc1, Cxcl12, Prss12, Rbln1, Penk, Col8a1, Vipr2, Apod, Cpxm2, Rarres2, C4b, Sparcl1, Ly6e, R3hdml, Mia, Myoc, Nrtn, Pdzrn4, Spp1, Pth1r, Sox9, Acan, or Mmp13; and wherein the OLC optionally expresses Bglap and Spp1.
79. A method of detecting a chondrocyte from a population of stromal cells comprising: detecting in a sample the expression or activity of a chondrocyte gene expression signature, wherein detection of the chondrocyte gene expression signature indicates chondrocytes in the sample, and wherein the chondrocyte gene expression signature comprises a. one or more genes of Table 4; b. one or more of Barx1, Pitx1, Foxd1, Osr2, Tbx18, Runx3, Osr2, Tbx18, Runx3, Peg3, Bhlhe41, Batf3, Plagl1, Sp7, Sox8, Lef1, Shox2, Zbtb20, Foxa3, Mef2c, Egr2, Pax1, Runx2, Prg4, Cpe, Mfi2, Scara3, Cpm, Chst1, Unc5q, Col11a1, Slc2a5, Slc26a2, Cspg4, Prc1, Fgfr3, Nid2, Spon1, Slc40a, Efemp1, Susd5, Fxyd3, Alp1, Corin, Tpd5211, Sema3d, F5, Slc38a3, Cytl1, Rbp4, Vit, Clip, Fam19a5, Col9a3, Col9a1, Col9a2, Matn3, Hapln1, Sfrp5, Notum, Mia, lhh, Mgst2, Rarres1, Gpld1, I17b, Bglap, 1500015010Rik, Itm2a, Crispld1, Meg3, Cenpp, Fxyd2, 3110079O15Rik, Lect1, Papss2, SAyt8, Stmn1, Lockd, Chil1, Calml3, Ncmap, Serpina1d, Serpina 1b, Serpina 1c, Sic6a1, or Serpina1a; c. one or more of Sox9, Col11a2, Acan, or Col2a1; d. one or more of Runx2, Ihh, Mef2c, or Col10a1; e. one or more of Grem, Runx2, Sp7, Alp1, or Spp1; f. one or more of Ihh, Pth1r, Mef2c, Col10a1, Ibsp, Mmp13, or Grem 1; or g. one or more of Prg4, Gas1, Clu, Dcn, Cilp, Scara3, Cytl1, Igfbp7, Cilp2, Cpe, Sod3, Cd81, Abi3 bp, Creb5, Gsn, Crip2, Vit, Fhl1, Pam, Cd9, Prrx1, Vim, Col11a2, Col9a1, Col2a1, Col9a2, Col27a1, Col9a3, Hapln1, Acan, Matn3, Col11a1, Pth1r, Mia, Pcolce2, Chst11, Epyc, Serpinh1, Gnb211, Fscn1, Pla2g5, Rcn1, Sox9, Bglap, Sp7, Fn1, Ube2s, Hmgb1, Ckap4, Clec11a, Il17b, Ybx1, Tmem97, Rbm3, Slc26a2, C1qtnf3, Fkbp2, Prelp, Apoe, Cst3, Spon1, Olfml3, Wif1, Lef1, Notum, Emb, Col1a2, Sfrp5, Omd, Ctsd, Zbtb20, Islr, B2m, Ly6e, Alp1, Spp1, Chad, Timp3, Mef2c, Sparc, Ihh, Junb, Txnip, Rarres1, Scrg1, Sema3d, Colgalt2, Serinc5, Slc38a2, Ddit41, Egr1, Runx2, or Cxcl12.
80. A method of detecting a fibroblast from a population of stromal cells comprising: detecting in a sample the expression or activity of a fibroblast gene expression signature, wherein detection of the fibroblast gene expression signature indicates fibroblasts in the sample, and wherein the fibroblast gene expression signature comprises a. one or more genes of Table 5; b. one or more of Scx, Barx1, Trps1, Hoxd9, Pitx1, Prrx1, Rora, Prrx2, Meox2, Ebf2, Osr2, Ebf1, Dlx3, Zfhx2, Meox1, Etv4, Mkx, Dcn, Clu, Abi3 bp, Prelp, Lox, Tnxb, Col3a1, Vcan, Vi, Mfap5, Col14a1, Aspn, Pdpn, Pdgfra, F13a1, Clic5, Gpr1, Emilin2, Has1, Mtap4, Gas2, Ntng1, Serpinf1, Postn, Angpt17, Clip2, Clip, Sod3, Slurp1, Spp1, Clec3b, Igfbp6, Thds4, Dpt, Gsn, Fndc1, Pla1a, Adamts15, Figf, Htra4, Rspo2, Mstn, Ptx4, Spock3, Cpxm2, Itgbl1, Anxa8, Fxyd5, Fxyd6, Egln3, Ptgis, I133, Fgf9, Tppp3, Crlp1, Mustn1, Celf2, Tmod2, Ly6a, Fez1, Lysmd2, Pcsk6, 2210407C18Rik, Aldh1a3, Rtn1, Rab37, Lnmd, Chod1, Fam159b, Prph, or Insc; c. Fibronectin-1 (Fn1), Fibroblast Specific Protein-1 (S100a4), Col1a1, Col1a2, Lum, Col22a1, or Twist2; d. one or more of Sox9, Acan, and Col2a1; e. Cd34, Ly6a, Pdgfra, Thy1 and Cd44, and not Cdh5, or Acta2; f. one or more of Sox-9, Scleraxis (Scx), Spp1, Cspg4, CD73 (Nt5e), and Cartilage Intermediate Layer Protein (Cilp); or g. one or more of S1004a, Dcn, Sema3c, or Cxcl12.
81. A method of detecting a bone marrow derived endothelial cell (BMEC) from a population of stromal cells comprising: detecting in a sample the expression or activity of a BMEC gene expression signature, wherein detection of the BMEC gene expression signature indicates BMECs in the sample, and wherein the fibroblast gene expression signature comprises a. one or more genes of Table 6; b. one or more of Mafb, Pparg, Nr2f2, Irf8, Ets1, Sox17, Sox11, Bcl6b, Gata2, Tcf15, Meox1, Sox7, Tshz2, Tfpi, Gpm6a, Ackr1, Mrc1, Stab1, Vcam1, Tek, Flt1, Ramp3, Icam2, Podx1, Cd34, Mcam, Sdpr, Bcam, Tspan13, Fabp5, Vim, Kit1, Lrg1, Dnasel13, Sepp1, Egfl7, Pde2a, Gpihbp1, Sema3g, Ramp2, Cd3001g, C1qtnf9, Sparcl1, Tinagl1, Pdgfb, Ubd, Stab2, Fabp4, Cldn5, Rgs4, Ecscr, Cyyr1, Ly6c1, Magix, Cav1, Gngt2, Myct1, or Tmsb4x; c. one or more of Flt4 (Vegfr-3) or Ly6a (Sca-1); d. one or more of Pecam1, Cdh5, Cd34, Tek, Lepr, Cxcl12, or Kitl; e. one or more of Flt4, Ly6a, Icam1, or Sele; f. one or more of Mafb, Cebpb, Xbp1, Nr2f2, Irf8, Ybx1, Ebf1, Sox17, Mxd4, Id1, Meox2, Tshz2, Tcf15, Meox1, Tfpi, I1l6stm Angpt4, Gpm6a, Vcam1, Emp1, Cd34, Gnas, Slc9a3r2, Cald1, Mcam, Tspan13, Vim, Cd9, Ptrf, Crip2, Sepp1, Ctsl, Adamts5, Apoe, Igfbp4, Sparc, Col4a2, Col4a1, Serpinh1, Ppic, Cxcl12, Cst3, Sparcl1, C1qtnf9, Tinagl1, Mgll, Kit1, Stab2, Ubd, Gm1673, Abcc9, Rgs4, Ly6c1, Actg1, Tsc22d1, Glu1, Fxyd5, Crip1, Cav1, S100a6, S100a10, lfitm2; or g. one or more of Mafb, Cebpb, Xbp1, Nr2f2, Irf8, Ybx1, Ebf1, Sox17, Mxd4, Id1, Meox2, Tshz2, Tcf15, Meox1, Tfpi, Il6stm Angpt4, Gpm6a, Vcam1, Emp1, Cd34, Gnas, Slc9a3r2, Cald1, Mcam, Tspan13, Vim, Cd9, Ptrf, Crip2, Sepp1, Ctsl, Adamts5, Apoe, Igfbp4, Sparc, Col4a2, Col4a1, Serpinh1, Ppic, Cxcl12, Cst3, Sparcl1, C1qtnf9, Tinagl1, Mgll, Kit1, Stab2, Ubd, Gm1673, Abcc9, Rgs4, Ly6c1, Actg1, Tsc22d1, Glu1, Fxyd5, Crip1, Cav1, S100a6, S100a10, or lfitm2.
82. A method of detecting a pericyte from a population of stromal cells comprising: detecting in a sample the expression or activity of a pericyte gene expression signature, wherein detection of the pericyte gene expression signature indicates pericyte s in the sample, and wherein the fibroblast gene expression signature comprises a. one or more genes in Table 3; b. one or more of Hey1, Nr2f2, Tbx2, Ebf1, Ebf2, Foxsl, Id3, Met2c, Cebpb, Zfxh3, Nr4a1, Klf9, Zeb2, Prrx1, Meox2, Junb, Id4, Zfp467, Irf1, Arid5b, Atp1b2, Aoc3, Sncq, Itga7, Aspn, Steap4, Thy1, Filip1I, Parm1, Agtr1a, Olfml2a, Cald1, Ednra, Col18a1, Serpini1, Bcam, Rrad, Pdgfrb, Col5a3, Pde5a, Notch3, Myl1, Tinagl1, Art3, Ngf, Sparcl1, 116, Rarres2, Vstm4, Pgf, Pdgfa, Col4a2, Igfbp7, Col4a1, Fst, Rtn4lrl1, Adamts1, 1134, Gpc6, Cscll, Bgs5, Tagln, Higd1p, Nrip2, Gucv1a3, H2-M9, Des, Olfr558, Lmod1, Gucy1b3, Kcnk3, Pdlim3, Gm13861, Mrvi1, Pln, Gm13889, Ral11a, or Cygp; c. one or more of Cspg4, Ngfr, Des, Myh11, Acta2, Rgs5, Thy1, Pdgtfrb, Nes, Lepr, Cdh2, Cxcl12, Kitl, Ebf1, Sox4, Dlx5, Mxd4, Smad6, Hey1, Tcf15, Klf2, Mef2c, Atf3, Meox2, Steap4, Olfml2a, H2-M9, Tspan15, Cd24a, Marcks, Fbn1, Tnfrsf21, Slc12a2, Cfh, Cdh2, Vcam1, Sncg, Rasd1, Bcam, Rrad, Prkcdbp, Susd5, Csrrp1, Ptrf, Lama5, Ppp1r12b, Fhl1, Vim, Sdpr, Vtn, Angpt12, Cd44, Htra1, Mfap5, Anxa2, Procr, Igf1, Mgp, Col5a3, col4a2, Vstm4, Col3a1, Col4a1, Emcn, Gas1, Col6a2, Kit1, Sparcl1, Igfbp5, Ntf3, Inhba, Ccdc3, Fst, Timp3, Col1a1, Nbl1, Nov, Ccl11, Lga1s1, Dpt, Ctsl, Col6a3, Cxcl12, Rgs5, Abcc9, Phlda1, Tgs2, Cygb, Marcksl1, Apbb2, Ifitm3, Tmsb4x, Fam162a, Tagln, Pcp411, Crip1, Myl6, Acta2, Pln, Nrip2, Mustn1, Dstn, Mul9, Myh11, S100a6, Tppp3, Enpp2, S100a10, Cav1, Gstm1, Lysmd2, Myl12a, Nnmt, or S100a11; or d. one or more of Acta2, Myh11, Mcam, Jag1, or Il6.
83. The method of any one of claims 77-82, wherein the sample is obtained from the blood or bone marrow.
84. A method of preparing a mesenchymal stem/stromal cell (MSC) enriched cell population a stromal cell population comprising: enriching the population of stromal cells for cells that have an MSC gene signature, wherein the gene signature comprises a. one or more genes of Table 1; b. one or more of Cebpa, Zeb2, Runx2, Ebf1, Foxc1, Cebpb, Ar, Fos, Id4, Klf6, Irf1, Runx2, Jun, Snaj2, Maf, Zthx4, Id3, Egr1, Junb, Hp, Lpl, Gdpd2, Serping, Dpep1, Grem1, Pappa, Chrdl1, Fbln5, Vcam1, Kng1, H2-Q10, Cdh11, Mme, Tmem176b, Csf1, H2-K1, Serpine2, H2-D1, Tnc, Cdh2, Pdgtra, Esm1, Gas6, Cxcl14, Sfrp4, Wisp2, Agt, Il34, Fst, Fgf7, Il1rn, C2, Igfpb4, Serpina1, Cbln1, Apoe, Ibsp, Igfbp5, Gpx3, Pdzrn4, Rarres2, Vegfa, 1500009L16Rik, Serpina3g, Cyp1b1, Ebt3, Arrdc4, Kng2, Slc26a7, Marc1, Ms4ad4, Wdr86, Serpina3c, Tmem176a, Cldn10, Trt, Gpr88, Nnmt, Gm4951, Cd1d1, Plpp3, or Ackr4; or c. Nte5, Vcam1, Eng, Thy1, Ly6a, Grem1, Cspg4, Nes, Runx2, Col1A1, Erg1, Junb, Fosb, Cebpb, Klf6, Nr4a1, Klf2, Atf3, Klf4, Maff, Nfia, Smad6, Hey1, Sp7, Id1, Ifrd1, Trib1, Rrad, Odc1, Actb, Notch2, AlpI, Mmp13, Raph1, Tnfsf11, Cxc1, Adamts1, Cc17, Serpine1, Cc12, Apod, Cbln1, Pam, Col8a1, Wif1, Olfml3, Gdf10, Cyr61, Nog, Angpt4, Metrn1, Trabd2b, Adamts5, Igfbp4, Cxcl12, Igfbp5, Lepr, Cxcl12, Kit1, Grem1, or Angpt1, and wherein the MCS optionally does not express one or more of Thy1, Ly6a (Sca-1), NG2 (Cspg4) or Nestin (Nes).
85. A method of preparing an osteolineage (OLC) enriched cell population a stromal cell population comprising: enriching the population of stromal cells for cells that have an OLC gene signature, wherein the gene signature comprises a. one or more genes of Table 2; b. one or more of Vdr, Satb2, Sp7, Runx2, Tbx2, Zeb2, Dlx5, Dlx6, Zfhx4, Hey1, Irx5, Id3, Mxd4, Mef2c, Esr1, Maf, Smad6, Sox4, Cebpb, Meis3, Mmp13, Tnc, Cfh, Alp1, Lrp4, Cdh11, Casm1, Cdh2, Slit2, Bmp3, Cdh15, Fat3, Pard6g, Litr, Cp, Ptprd, Olfml3 Fign, Cd63, Fap, Dmp1, Angpt4, Chn1, Ibsp, Wisp1, Wif1, Metrn1, Vldlr, Podnl1, Col22a1, Ndnf, Mmp14, Pgf, Lox11, Mfap2, Srpx2, Agt, Tmem59, Vstm4, Col8a1, Cxcl12, Bglap2, Car3, Kcnk2, Slc36a2, Ifitm5, Hpgd, Limch1, Gm44029, Hvcn1, Tnfrsf19, Col13a1, Fam78b, Gja1, Cnn2, Ppfibp2, Cldn10, Dapk2, Tmp1, Bglap3, or Ramp1; c. one or more of Runx2, Sp7, Grem1, Lepr, Cxcl12, Kit1, Bglap, Cd200, Spp1, Sox9, Id4, Ebf1, Ebf3, Cebpa, Foxc1, Snai2, Maf, Runx1, Thra, Plagl1, Mafb, Vdr, Cebpb, Tcf712, Bhlhe40, Snai1, Creb311, Zbtb7c, Gm22, Tcf7, Nr4a2, Atf3, Prrx2, Fbln5, H2-K1, H2-D1, Hp, Fstl1, Tmem176b, B2m, Pappa, Dpep1, Islr, Vcam1, Lepr, Mmp13, Cd200, Itgb5, Lifr, Postn, Slit2, Timp1, Lrp4, Tspan6, Ctsc, Cpz, Prss35, Tmeml19, Lox, Cryab, Pdzd2, Fyn, Gucala, Rerg, Sema4d, Vcam, Aspn, Slc20a2, Plat, Fmod, Fn1, Aebop1, Angpt12, Prkcdbp, Prelp, Cxcl12, Igfbp4, Cxcl14, Gas6, Apoe, Igfbp7, Col8a1, Serping1, Igfbp5, Igf1, Kit1, Spp1, Serpine2, Fam20c, Bmp8a, Dmp1, Ibsp, Pros1, Srpx2, Mgll, Timp3, Col11a2, Cgref1, Col1a1, Cthrc1, Sparc, Col22a1, Col5a2, Fkbp11, Col3a1, Ptn, Col6a2, Tnn, Npy, Col6a1, Omd, Dcn, Tgfbi, Col6a3, or Acan; or d. one or more of Runx2, Sp7, Grem1, Bglap, Cxcl12, Kit1, Osr1, Foxd1, Sox5, Osr2, Erg, Nfatc2, Mef2c, Sp7, Zbtb7c, Runx2, Snai2, Zfhx4, Dlx6, Meox1, Prrx1, Scx, Hic1, Peg3, Etv5, Ltbp1, Tspan8, Emb, Slc16a2, Tspan13, Creb5, Scara3, Prg4, Clu, plxdc1, Cdon, Fbln7, Ntn1, Nt5e, Thbd, Pth1r, Alp1, Cadm1, Cd200, Susd5, Rarres1, Ptprz1, Plat, Tnfrsf11b, Lpar3, Cspg4, Postn, S1pr1, Enah, Aspn, Cald1, Wnt5b, Adam12, Tnc, Pak1, Lpl, Mfap4, Cntfr, Fbln2, Fgl2, Gpc3, Ogn, Slc1a3, Spock2, Fbln5, Rgp1, Smoc1, C5ar1, Fzd9, Npr2, Fzd10, Cxcl14, Wif1, Arsi, Col12a1, Mgp, Itgbl1, Igf1, Smoc2, Spon2, Fst, Sbsn, Gas1, Sod3, Mmp3, Cilp, Pla2g2e, Fam213a, Acp5, Col15a1, Bglap2, Bglap3, Ibsp, Thbs4, Frzb, Bmp8a, Dkk1, Scube1, Chad, Spp1, Col11a2, Ptn, Ostn, Tnn, Mmp14, Gpx3, Cthrc1, Cxcl12, Prss12, Rbln1, Penk, Col8a1, Vipr2, Apod, Cpxm2, Rarres2, C4b, Sparcl1, Ly6e, R3hdml, Mia, Myoc, Nrtn, Pdzrn4, Spp1, Pth1r, Sox9, Acan, or Mmp13; and wherein the OLC optionally expresses Bglap and Spp1.
86. A method of preparing a chondrocyte enriched cell population a stromal cell population comprising: enriching the population of stromal cells for cells that have a chondrocyte gene signature, wherein the gene signature comprises a. one or more genes of Table 4; b. one or more of Barx1, Pitx1, Foxd1, Osr2, Tbx18, Runx3, Osr2, Tbx18, Runx3, Peg3, Bhlhe41, Batf3, Plagl1, Sp7, Sox8, Lef1, Shox2, Zbtb20, Foxa3, Mef2c, Egr2, Pax1, Runx2, Prg4, Cpe, Mfi2, Scara3, Cpm, Chst11, Unc5q, Col11a1, Slc2a5, Slc26a2, Cspg4, Prc1, Fgfr3, Nid2, Spon1, Slc40a, Efemp1, Susd5, Fxyd3, Alp1, Corin, Tpd5211, Sema3d, F5, Slc38a3, Cytl1, Rbp4, Vit, Clip, Fam19a5, Col9a3, Col9a1, Col9a2, Matn3, Hapln1, Sfrp5, Notum, Mia, lhh, Mgst2, Rarres1, Gpld1, I17b, Bglap, 1500015010Rik, Itm2a, Crispld1, Meg3, Cenpp, Fxyd2, 3110079O15Rik, Lect1, Papss2, SAyt8, Stmn1, Lockd, Chil1, Calml3, Ncmap, Serpina1d, Serpina 1b, Serpina 1c, Sic6a1, or Serpina1a; c. one or more of Sox9, Col11a2, Acan, or Col2a1; d. one or more of Runx2, Ihh, Mef2c, or Col10a1; e. one or more of Grem, Runx2, Sp7, Alp1, or Spp1; f. one or more of Ihh, Pth1r, Mef2c, Col10a1, Ibsp, Mmp13, Grem 1; or g. one or more of Prg4, Gas1, Clu, Dcn, Cilp, Scara3, Cytl1, Igfbp7, Cilp2, Cpe, Sod3, Cd81, Abi3 bp, Creb5, Gsn, Crip2, Vit, Fhl1, Pam, Cd9, Prrx1, Vim, Col11a2, Col9a1, Col2a1, Col9a2, Col27a1, Col9a3, Hapln1, Acan, Matn3, Col11a1, Pth1r, Mia, Pcolce2, Chst11, Epyc, Serpinh1, Gnb211, Fscn1, Pla2g5, Rcn1, Sox9, Bglap, Sp7, Fn1, Ube2s, Hmgb1, Ckap4, Clec11a, Il17b, Ybx1, Tmem97, Rbm3, Slc26a2, C1qtnf3, Fkbp2, Prelp, Apoe, Cst3, Spon1, Olfml3, Wif1, Lef1, Notum, Emb, Col1a2, Sfrp5, Omd, Ctsd, Zbtb20, Islr, B2m, Ly6e, Alp1, Spp1, Chad, Timp3, Mef2c, Sparc, Ihh, Junb, Txnip, Rarres1, Scrg1, Sema3d, Colgalt2, Serinc5, Slc38a2, Ddit41, Egr1, Runx2, or Cxcl12.
87. A method of preparing a fibroblast enriched cell population a stromal cell population comprising: enriching the population of stromal cells for cells that have a fibroblast gene signature, wherein the gene signature comprises a. one or more genes of Table 5; b. one or more of Scx, Barx1, Trps1, Hoxd9, Pitx1, Prrx1, Rora, Prrx2, Meox2, Ebf2, Osr2, Ebf1, Dlx3, Zfhx2, Meox1, Etv4, Mkx, Dcn, Clu, Abi3 bp, Prelp, Lox, Tnxb, Col3a1, Vcan, Vi, Mfap5, Col14a1, Aspn, Pdpn, Pdgfra, F13a1, Clic5, Gpr1, Emilin2, Has1, Mtap4, Gas2, Ntng1, Serpinf1, Postn, Angpt17, Clip2, Clip, Sod3, Slurp1, Spp1, Clec3b, Igfbp6, Thds4, Dpt, Gsn, Fndc1, Pla1a, Adamts15, Figf, Htra4, Rspo2, Mstn, Ptx4, Spock3, Cpxm2, Itgbl1, Anxa8, Fxyd5, Fxyd6, Egln3, Ptgis, I133, Fgf9, Tppp3, Crlp1, Mustn1, Celf2, Tmod2, Ly6a, Fez1, Lysmd2, Pcsk6, 2210407C18Rik, Aldh1a3, Rtn1, Rab37, Lnmd, Chod1, Fam159b, Prph, or Insc; c. Fibronectin-1 (Fn1), Fibroblast Specific Protein-1 (S100a4), Col1a1, Col1a2, Lum, Col22a1, or Twist2; d. one or more of Sox9, Acan, and Col2a1; e. Cd34, Ly6a, Pdgfra, Thy1 and Cd44, and not Cdh5, or Acta2; f. one or more of Sox-9, Scleraxis (Scx), Spp1, Cspg4, CD73 (Nt5e), and Cartilage Intermediate Layer Protein (Cilp); or g. one or more of S1004a, Dcn, Sema3c, or Cxcl12.
88. A method of preparing a bone marrow derived endothelial cell (BMEC) enriched cell population a stromal cell population comprising: enriching the population of stromal cells for cells that have a BMEC gene signature, wherein the gene signature comprises a. one or more genes of Table 6; b. one or more of Mafb, Pparg, Nr2f2, Irf8, Ets1, Sox17, Sox11, Bcl6b, Gata2, Tcf15, Meox1, Sox7, Tshz2, Tfpi, Gpm6a, Ackr1, Mrc1, Stab1, Vcam1, Tek, Flt1, Ramp3, Icam2, Podx1, Cd34, Mcam, Sdpr, Bcam, Tspan13, Fabp5, Vim, Kit1, Lrg1, Dnasel13, Sepp1, Egfl7, Pde2a, Gpihbp1, Sema3g, Ramp2, Cd3001g, C1qtnf9, Sparcl1, Tinagl1, Pdgfb, Ubd, Stab2, Fabp4, Cldn5, Rgs4, Ecscr, Cyyr1, Ly6c1, Magix, Cav1, Gngt2, Myct1, or Tmsb4x; c. one or more of Flt4 (Vegfr-3) or Ly6a (Sca-1); d. one or more of Pecam1, Cdh5, Cd34, Tek, Lepr, Cxcl12, or Kitl; e. one or more of Flt4, Ly6a, Icam1, or Sele; f. one or more of Mafb, Cebpb, Xbp1, Nr2f2, Irf8, Ybx1, Ebf1, Sox17, Mxd4, Id1, Meox2, Tshz2, Tcf15, Meox1, Tfpi, Il6stm Angpt4, Gpm6a, Vcam1, Emp1, Cd34, Gnas, Slc9a3r2, Cald1, Mcam, Tspan13, Vim, Cd9, Ptrf, Crip2, Sepp1, Ctsl, Adamts5, Apoe, Igfbp4, Sparc, Col4a2, Col4a1, Serpinh1, Ppic, Cxcl12, Cst3, Sparcl1, C1qtnf9, Tinagl1, Mgll, Kit1, Stab2, Ubd, Gm1673, Abcc9, Rgs4, Ly6c1, Actg1, Tsc22d1, Glu1, Fxyd5, Crip1, Cav1, S100a6, S100a10, lfitm2; or g. one or more of Mafb, Cebpb, Xbp1, Nr2f2, Irf8, Ybx1, Ebf1, Sox17, Mxd4, Id1, Meox2, Tshz2, Tcf15, Meox1, Tfpi, Il6stm Angpt4, Gpm6a, Vcam1, Emp1, Cd34, Gnas, Slc9a3r2, Cald1, Mcam, Tspan13, Vim, Cd9, Ptrf, Crip2, Sepp1, Ctsl, Adamts5, Apoe, Igfbp4, Sparc, Col4a2, Col4a1, Serpinh1, Ppic, Cxcl12, Cst3, Sparcl1, C1qtnf9, Tinagl1, Mgll, Kit1, Stab2, Ubd, Gm1673, Abcc9, Rgs4, Ly6c1, Actg1, Tsc22d1, Glu1, Fxyd5, Crip1, Cav1, S100a6, S100a10, or lfitm2.
89. A method of preparing a pericyte enriched cell population a stromal cell population comprising: enriching the population of stromal cells for cells that have a pericyte gene signature, wherein the gene signature comprises a. one or more genes in Table 3; b. one or more of Hey1, Nr2f2, Tbx2, Ebf1, Ebf2, Foxsl, Id3, Met2c, Cebpb, Zfxh3, Nr4a1, Klf9, Zeb2, Prrx1, Meox2, Junb, Id4, Zfp467, Irf1, Arid5b, Atp1b2, Aoc3, Sncq, Itga7, Aspn, Steap4, Thy1, Filip1I, Parm1, Agtr1a, Olfml2a, Cald1, Ednra, Col18a1, Serpini1, Bcam, Rrad, Pdgfrb, Col5a3, Pde5a, Notch3, Myl1, Tinagl1, Art3, Ngf, Sparcl1, 116, Rarres2, Vstm4, Pgf, Pdgfa, Col4a2, Igfbp7, Col4a1, Fst, Rtn4lrl1, Adamts1, 1134, Gpc6, Cscll, Bgs5, Tagln, Higd1p, Nrip2, Gucv1a3, H2-M9, Des, Olfr558, Lmod1, Gucy1b3, Kcnk3, Pdlim3, Gm13861, Mrvi1, Pln, Gm13889, Ral11a, or Cygp; c. one or more of Cspg4, Ngfr, Des, Myh11, Acta2, Rgs5, Thy1, Pdgtfrb, Nes, Lepr, Cdh2, Cxcl12, Kitl. Ebf1, Sox4, Dlx5, Mxd4, Smad6, Hey1, Tcf15, Klf2, Mef2c, Atf3, Meox2, Steap4, Olfml2a, H2-M9, Tspan15, Cd24a, Marcks, Fbn1, Tnfrsf21, Slc12a2, Cfh, Cdh2, Vcam1, Sncg, Rasd1, Bcam, Rrad, Prkcdbp, Susd5, Csrrp1, Ptrf, Lama5, Ppp1r12b, Fhl1, Vim, Sdpr, Vtn, Angpt12, Cd44, Htra1, Mfap5, Anxa2, Procr, Igf1, Mgp, Col5a3, col4a2, Vstm4, Col3a1, Col4a1, Emcn, Gas1, Col6a2, Kit1, Sparcl1, Igfbp5, Ntf3, Inhba, Ccdc3, Fst, Timp3, Col1a1, Nbl1, Nov, Ccl11, Lga1s1, Dpt, Ctsl, Col6a3, Cxcl12, Rgs5, Abcc9, Phlda1, Tgs2, Cygb, Marcksl1, Apbb2, Ifitm3, Tmsb4x, Fam162a, Tagln, Pcp411, Crip1, Myl6, Acta2, Pln, Nrip2, Mustn1, Dstn, Mul9, Myh11, S100a6, Tppp3, Enpp2, S100a10, Cav1, Gstm1, Lysmd2, Myl12a, Nnmt, or S100a11; or d. one or more of Acta2, Myh11, Mcam, Jag1, or Il6.
90. The method of any one of claims 84-89, wherein enriching the population of stromal cells comprises determining an MSC, an OLC, a chondrocyte, a BMEC, a fibroblast, a pericyte gene signature, or a combination thereof, wherein the gene signature(s) are determined by single cell RNA sequencing.
91. A method of detecting a hematological disease comprising: a. determining a fraction of: i. OLC-1 cells, ii. OLC-2 cells, iii. bone marrow derived endothelial cells (BMECs); iv. chondrocytes; v. fibroblasts; and b. diagnosing the neurodegenerative disease in the subject when i. the relative proportion of OLC-1 cells to OLC-2 cells is changed as compared to a suitable control; ii. the fraction of OLC-1 cells is increased as compared to a suitable control; iii. the fraction of OLC-2 cells is decreased as compared to a suitable control; iv. the relative proportion of bone marrow derived endothelial fractions is changed as compared to a suitable control; v. a fraction of sinusoidal BMECs is decreased as compared to a suitable control; vi. a fraction of arterial BMECs is increased as compared to a suitable control; vii. the relative proportion of chondrocyte fractions is changed as compared to a suitable control; viii. a chondrocyte hypertorphic cell subtype is increased as compared to a suitable control; ix. a chondrocyte progenitor cell subtype is decreased as compared to a suitable control; x. a fibroblast subtype is changed as compared to a suitable control; xi. a fibroblast subtype-3 is decreased; as compared to a suitable control xii. a fibroblast subtype-4 is increased as compared to a suitable control; xiii. the relative proportion of MSC fractions is changed as compared to a suitable control; ixx. a MSC-2 fraction is increased as compared to a suitable control; xx. a MSC-3 fraction is decreased as compared to a suitable control; xxi. a MSC-4 fraction is decreased as compared to a suitable control; or xxii. a combination thereof.
92. The method of claim 91, wherein the hematological disease is a blood cancer.
93. The method of claim 92, wherein the blood cancer is a leukemia.
94. The method of claim 93, wherein the blood cancer is acute lymphocytic leukemia, acute myeloid leukemia, chronic lymphocytic leukemia, chronic myeloid leukemia, hairy cell leukemia, myelodysplastic syndromes, acute promyelocytic leukemia, or myeloproliferative neoplasm.
95. A method of treating a hematological disease in a subject in need thereof, comprising: detecting a hematological disease as in a subject according a method as in any one of claims 91-94; and administering an effective amount of a hematological disease treatment to the subject.
96. The method of claim 95, wherein the hematological disease treatment comprises an agent selected from the group consisting of: cladribine, brentuximab vedotin, polatuzumab vedotin-piiq, fludarabine, fludarabine phosphate, mitoxantorone, etoposide, 6-thioguanine, hydroxyurea, methotrexate, 6-mercaptopurine, azacytidine, decitabine, daunorubicin, cyclophosphamide, daurismo, dexamethasome, cytarabine, arsenic trioxide, nelarabine, asparginase Erwinia chrysanthemi, calaspargase Pegol-mknl, inotuzumab ozogamicin, blinatumomab, clofarbine, dasatinib, dexamethasone, doxorubicin, imatinib mesylate, ponatinib, tisagenlecleucel, vincristine sulfate liposome, vincristine sulfate, mercaptopurine, methotrexate, pegaspargase, prednisone, hyper-CVAD, glasdegib maleate, enasidenib mesylate, gemtuzumab ozogamicin, gilteritinib fumarate, idarubicin, ivosidenib midostaurin, mitoxantrone, thioguanine, venetoclax, gilteritinib fumarate, tagraxofusp-erzs, acalabrutinib, alemtuzumab, ofatumumab, bendamustine HCl, chlorambucil, duvelisib, ibrutinib, idelalisib, mechlorethamine HCl, obinutuzumab, rituximab, hyaluronidase, idelalisib, bosutinib, hydroxyurea, busulfan, nilotinib, omacetaxine mepesuccinate, interferon alpha-2b, moxetumomab pasudotox-tdfk, bortezomib, romidepsin, belinostat, an immune checkpoint inhibitor (e.g. PD-1 inhibitors (e.g. pembrolizumab, nivolumab, and cemiplimab), PD-L1 inhibitors (e.g. atezolizumab, avelumab, and durvalumab), CTLA-4 targeting agents (e.g. ipilimumab), an immunomodulating agent (e.g. thalidomide and lenalidomide), a chimeric antigen receptor (CAR)-T cell therapy (e.g. axicabtagene ciloleucel and tisagenlecleucel), carboplatin, oxaliplatin, pentostatin, gemcitabine, pralatrexate, bleomycin, campath, acalabrutinib, zanubrutinib, idelalisib, copanlisib, duvelisib, and combinations thereof.
97. The method of claim 96, wherein the hematological disease treatment further comprises a stromal cell or cell population of any one of clusters 1-17 or a subtype thereof.
98. The method of claim 95, wherein the hematological disease treatment further comprises a stromal cell or cell population of any one of clusters 1-17 or a subtype thereof.
Description
CROSS-REFERENCE TO RELATED APPLICATIONS
[0001] This application claims the benefit of U.S. Provisional Application No. 62/777,606 filed Dec. 10, 2018. This application claims the benefit of U.S. Provisional Application No. 62/808,177, filed Feb. 20, 2019. The entire contents of the above-identified applications are hereby fully incorporated herein by reference.
SEQUENCE LISTING
[0003] This application contains a sequence listing filed in electronic form as an ASCII.txt file entitled BROD-4510US_ST25.txt, created on Dec. 4, 2019 and having a file size of 13 KB. The content of the sequence listing is incorporated herein in its entirety.
TECHNICAL FIELD
[0004] The subject matter disclosed herein is generally directed to bone marrow stromal cell populations, gene signatures and profiles of bone marrow stromal cells, characterizing and modulating aspects of bone marrow stromal cell(s), identification of distinct normal and dysfunctional bone marrow stromal cell populations, types, subtypes, gene signatures and profiles, and identification of modifications to bone marrow microenvironment in both health and disease. The subject matter disclosed herein is generally directed to modulation of bone marrow stromal cells to treat disease.
BACKGROUND
[0005] The tissue microenvironment of stem cell niches maintains and regulates stem cell function through cellular interactions and secreted factors (Scadden, 2014; Schofield, 1978). Hematopoiesis provides a paradigm for understanding mammalian stem cells and their niches, with pivotal understanding from numerous in vivo studies on the critical role of several non-hematopoietic niche cells as regulators of hematopoietic stem cell (HSC) function (Calvi et al., 2003; Ding et al., 2012; Kunisaki et al., 2013; Mendez-Ferrer et al., 2010; Zhang et al., 2003).
[0006] One major component are multipotent mesenchymal stem/stromal cells (MSCs), non-hematopoietic cells derived from the mesoderm with potential to differentiate into bone, fat and cartilage in vitro (Kfoury and Scadden, 2015). While MSCs are found in most tissues, their diversity and lineage relationships are incompletely understood. For instance, several subtypes of MSCs have been described in specialized niches that regulate HSC maintenance. Most of these cells are located in the perivascular space and associated with either arteriole or sinusoidal blood vessels, produce key niche factors such as Cxcl12 and Stem Cell Factor (SCF, also known as Kitl) (Morrison and Scadden, 2014), and are identified by Leptin receptor [Lepr-cre] (Ding and Morrison, 2013; Ding et al., 2012), Nestin [Nes-GFP] (Mendez-Ferrer et al., 2010) or Ng2 (Cspg4) [NG2-CreER] (Kunisaki et al., 2013) expression. However, it remains unclear if these markers delineate distinct or overlapping cell populations.
[0007] Other non-hematopoietic cells, including endothelial cells (ECs) and MSC-descendent osteolineage cells (OLCs), also play roles as niche cells. Endothelial cells produce Cxcl12, SCF, and other niche factors and are critical regulators of HSC function (Butler et al., 2010; Ding et al., 2012; Doan et al., 2013; Hooper et al., 2009; Itkin et al., 2016; Kobayashi et al., 2010; Kusumbe et al., 2016). OLCs are critical for HSC homing after lethal irradiation and bone marrow transplantation (Lo Celso et al., 2009), modulate hematopoietic progenitor function and lineage maturation (Ding and Morrison, 2013; Yu et al., 2016; Yu et al., 2015), and dysfunction in some of them has been implicated in myelodysplasia and leukemia development (Dong et al., 2016; Kode et al., 2014; Raaijmakers et al., 2010; Zambetti et al., 2016).
[0008] However, despite extensive studies, the HSC niche remains incompletely defined in terms of its cellular and molecular composition, limiting our ability to prospectively isolate and functionally characterize niche cells. Previous profiling studies of MSCs were performed in bulk and relied on reporter genes to purify cell populations (Morrison and Scadden, 2014), which may either analyze a mixed population (if marker expression is more promiscuous than assumed), only cover a subset (if the marker is overly specific), or fail to detect unknown or transient states.
[0009] Citation or identification of any document in this application is not an admission that such a document is available as prior art to the present invention.
SUMMARY
[0010] In some exemplary embodiments, described herein are methods of remodeling a stromal cell landscape comprising administering a modulating agent to a subject or a cell population that induces a shift in the stromal cell landscape from a disease-associated stromal cell landscape to a homeostatic stromal cell landscape.
[0011] In some exemplary embodiments, the shift in stromal cells from a disease-associated stromal cell landscape to a homeostatic stromal cell landscape comprises a change in the proportion of preosteoblasts. In some exemplary embodiments, the change in the proportion of preosteoblasts comprises a change in the relative proportion of OLC-1 cells to OLC-2 cells. In some exemplary embodiments, the change in the relative proportion of OLC-1 cells to OLC-2 cells comprises a decrease in OLC-1 cells and an increase in OLC-2 cells.
[0012] In some exemplary embodiments, the shift in stromal cells from a disease-associated stromal cell landscape to a homeostatic stromal cell landscape comprises a change in the relative proportion of bone marrow derived endothelial cell subtypes. In some exemplary embodiments, the change in the relative proportion of bone marrow derived endothelial cell subtypes comprises an increase in sinusoidal bone marrow derived endothelial cells and a decrease in arterial bone marrow derived endothelial cells.
[0013] In some exemplary embodiments, the shift in stromal cells from a disease-associated stromal cell landscape to a homeostatic stromal cell landscape comprises a change in the relative proportion of chondrocyte subtypes. In some exemplary embodiments, the change in the relative proportion of chondrocyte subtypes comprises a decrease in chondrocyte hypertrophic cell subtype and an increase in chondrocyte progenitor cell subtype.
[0014] In some exemplary embodiments, the shift in stromal cells from a disease-associated stromal cell landscape to a homeostatic stromal cell landscape comprises a change in the relative proportion of fibroblast subtypes. In some exemplary embodiments, the change in the relative proportion of fibroblast subtypes comprises an increase in fibroblast subtype-3 and a decrease in fibroblast subtype-4.
[0015] In some exemplary embodiments, the shift in stromal cells from a disease-associated stromal cell landscape to a homeostatic stromal cell landscape comprises a change in the relative proportion in mesenchymal stem/stromal cell (MSC) subtypes. In some exemplary embodiments, the change in the relative proportion in mesenchymal stem/stromal cell (MSC) sub-types comprises a decrease in MSC-2 subtype and an increase in MSC-3 and MSC-4 subtypes.
[0016] In some exemplary embodiments, the shift in the stromal cell landscape comprises a change in the distance in gene expression space between OLC-1, OLC-2, bone marrow derived endothelial cell subtypes, chondrocyte subtypes, fibroblast subtypes, mesenchymal stem/stromal cell (MSC) subtypes, or a combination thereof. In some exemplary embodiments, the distance is measured by a Euclidean distance, Pearson coefficient, Spearman coefficient, or a combination thereof. In some exemplary embodiments, the gene expression space comprises 10 or more genes, 20 or more genes, 30 or more genes, 40 or more genes, 50 or more genes, 100 or more genes, 500 or more genes, or 1000 or more genes. In some exemplary embodiments, remodeling the stromal cell landscape comprises increasing or decreasing the expression of one or more genes, gene programs, gene expression cassettes, gene expression signatures, or a combination thereof. In some exemplary embodiments, the change in the gene expression space is characterized by a change in the expression of one or more genes as in any of Tables 1-8 or an expression signature derived therefrom. In some exemplary embodiments, identifying differences in stromal cell states in the shift in the stromal cell landscape comprises comparing a gene expression distribution of a stromal cell type or subtype in the diseased stromal cell landscape with a gene expression distribution of the stromal cell type or subtype in the homeostatic stromal cell landscape as determined by single cell RNA-sequencing (scRNA-seq).
[0017] In some exemplary embodiments, the shift in the stromal cell landscape from a disease-associated stromal cell landscape to a homeostatic stromal cell landscape increases committed MSCs and decreases osteoprogenitor cells.
[0018] In some exemplary embodiments, the subject suffers from a hematological disease. In some exemplary embodiments, the hematological disease is a blood cancer. In some embodiments, the blood cancer is leukemia. In some embodiments, the blood cancer is acute lymphocytic leukemia, acute myeloid leukemia, chronic lymphocytic leukemia, chronic myeloid leukemia, hairy cell leukemia, myelodysplastic syndromes, acute promyelocytic leukemia, or myeloproliferative neoplasm.
[0019] In some exemplary embodiments, the cell population comprises a single cell type and/or subtype, a combination of cell types and/or subtypes, a cell-based therapeutic, an explant, or an organoid. In some exemplary embodiments, the cell population is a non-hematological stromal cell or cell population. In some exemplary embodiments, the cell or cell population is a MSC, OLC, bone marrow derived endothelial cell, chondrocyte, or a fibroblast cell or cell population. In some exemplary embodiments, the modulating agent is a therapeutic antibody, antibody fragment, antibody-like protein scaffold, aptamer, polypeptide, protein, genetic modifying agent, small molecule, small molecule degrader, or combination thereof. In some exemplary embodiments, the genetic modifying agent is a CRISPR-Cas system, a TALEN, a Zn-finger nuclease, or a meganuclease.
[0020] In some exemplary embodiments, described herein is an isolated or engineered mesenchymal stem/stromal cell (MSC) or MSC cell population, wherein the MSC or MSC cell population is characterized by a gene signature comprised of one or more genes of Table 1. In some exemplary embodiments, the MSC or MSC cell population is characterized by a gene signature comprised of one or more of Cebpa, Zeb2, Runx2, Ebf1, Foxc1, Cebpb, Ar, Fos, Id4, Klf6, Irf1, Runx2, Jun, Snaj2, Maf, Zthx4, Id3, Egr1, Junb, Hp, Lpl, Gdpd2, Serping, Dpep1, Grem1, Pappa, Chrdl1, Fbln5, Vcam1, Kng1, H2-Q10, Cdh11, Mme, Tmem176b, Csf1, H2-K1, Serpine2, H2-D1, Tnc, Cdh2, Pdgtra, Esm1, Gas6, Cxcl14, Sfrp4, Wisp2, Agt, Il34, Fst, Fgf7, Il1rn, C2, Igfpb4, Serpina1, Cbln1, Apoe, Ibsp, Igfbp5, Gpx3, Pdzrn4, Rarres2, Vegfa, 1500009L16Rik, Serpina3g, Cyp1b1, Ebt3, Arrdc4, Kng2, Slc26a7, Marc1, Ms4ad4, Wdr86, Serpina3c, Tmem176a, Cldn10, Trt, Gpr88, Nnmt, Gm4951, Cd1d1, Plpp3, or Ackr4. In some exemplary embodiments, the MSC or MSC cell population does not express one or more of Thy1, Ly6a (Sca-1), NG2 (Cspg4) or Nestin (Nes). In some exemplary embodiments, the gene signature comprises one or more of Nte5, Vcam1, Eng, Thy1, Ly6a, Grem1, Cspg4, Nes, Runx2, Col1A1, Erg1, Junb, Fosb, Cebpb, Klf6, Nr4a1, Klf2, Atf3, Klf4, Maff, Nfia, Smad6, Hey1, Sp7, Id1, Ifrd1, Trib1, Rrad, Odc1, Actb, Notch2, AlpI, Mmp13, Raph1, Tnfsf11, Cxcl1, Adamts1, Cc17, Serpine1, Cc12, Apod, Cbln1, Pam, Col8a1, Wif1, Olfml3, Gdf10, Cyr61, Nog, Angpt4, Metrn1, Trabd2b, Adamts5, Igfbp4, Cxcl12, Igfbp5, Lepr, Cxcl12, Kit1, Grem1, or Angpt1.
[0021] In some exemplary embodiments, described herein is an isolated or engeinered osteolineage cell (OLC) or OLC population, where the isolated or engineered OLC or OLC population is characterized by a gene signature comprising one or more genes of Table 2. In some exemplary embodiments, the OLC or OLC population is characterized by a gene signature comprising one or more of Vdr, Satb2, Sp7, Runx2, Tbx2, Zeb2, Dlx5, Dlx6, Zfhx4, Hey1, Irx5, Id3, Mxd4, Mef2c, Esr1, Maf, Smad6, Sox4, Cebpb, Meis3, Mmp13, Tnc, Cfh, Alp1, Lrp4, Cdh11, Casm1, Cdh2, Slit2, Bmp3, Cdh15, Fat3, Pard6g, Litr, Cp, Ptprd, Olfml3 Fign, Cd63, Fap, Dmp1, Angpt4, Chn1, Ibsp, Wisp1, Wif1, Metrn1, Vldlr, Podnl1, Col22a1, Ndnf, Mmp14, Pgf, Lox11, Mfap2, Srpx2, Agt, Tmem59, Vstm4, Col8a1, Cxcl12, Bglap2, Car3, Kcnk2, Slc36a2, Ifitm5, Hpgd, Limch1, Gm44029, Hvcn1, Tnfrsf19, Col13a1, Fam78b, Gja1, Cnn2, Ppfibp2, Cldn10, Dapk2, Tmp1, Bglap3, or Ramp1. In some exemplary embodiments, the OLC or OLC population expresses Bglap and Spp1. In some exemplary embodiments, the gene signature further comprises one or more of Runx2, Sp7, Grem1, Lepr, Cxcl12, Kit1, Bglap, Cd200, Spp1, Sox9, Id4, Ebf1, Ebf3, Cebpa, Foxc1, Snai2, Maf, Runx1, Thra, Plagl1, Mafb, Vdr, Cebpb, Tcf712, Bhlhe40, Snai1, Creb311, Zbtb7c, Gm22, Tcf7, Nr4a2, Atf3, Prrx2, Fbln5, H2-K1, H2-D1, Hp, Fstl1, Tmem176b, B2m, Pappa, Dpep1, Islr, Vcam1, Lepr, Mmp13, Cd200, Itgb5, Lifr, Postn, Slit2, Timp1, Lrp4, Tspan6, Ctsc, Cpz, Prss35, Tmem119, Lox, Cryab, Pdzd2, Fyn, Gucala, Rerg, Sema4d, Vcam, Aspn, Slc20a2, Plat, Fmod, Fn1, Aebop1, Angpt12, Prkcdbp, Pre1p, Cxcl12, Igfbp4, Cxcl14, Gas6, Apoe, Igfbp7, Col8a1, Serping1, Igfbp5, Igf1, Kit1, Spp1, Serpine2, Fam20c, Bmp8a, Dmp1, Ibsp, Pros1, Srpx2, Mgll, Timp3, Col11a2, Cgref1, Col1a1, Cthrc1, Sparc, Col22a1, Col5a2, Fkbpl11, Col3a1, Ptn, Col6a2, Tnn, Npy, Col6a1, Omd, Dcn, Tgfbi, Col6a3, or Acan. In some exemplary embodiments, the gene signature further comprises one or more of Runx2, Sp7, Grem1, Bglap, Cxcl12, Kit1, Osr1, Foxd1, Sox5, Osr2, Erg, Nfatc2, Mef2c, Sp7, Zbtb7c, Runx2, Snai2, Zfhx4, Dlx6, Meox1, Prrx1, Scx, Hic1, Peg3, Etv5, Ltbp1, Tspan8, Emb, Slc16a2, Tspan13, Creb5, Scara3, Prg4, Clu, plxdc1, Cdon, Fbln7, Ntn1, Nt5e, Thbd, Pth1r, Alp1, Cadm1, Cd200, Susd5, Rarres1, Ptprz1, Plat, Tnfrsf11b, Lpar3, Cspg4, Postn, S1pr1, Enah, Aspn, Cald1, Wnt5b, Adam12, Tnc, Pak1, Lpl, Mfap4, Cntfr, Fbln2, Fgl2, Gpc3, Ogn, Slc1a3, Spock2, Fbln5, Rgp1, Smoc1, C5ar1, Fzd9, Npr2, Fzd10, Cxcl14, Wif1, Arsi, Col12a1, Mgp, Itgbl1, Igf1, Smoc2, Spon2, Fst, Sbsn, Gas1, Sod3, Mmp3, Cilp, Pla2g2e, Fam213a, Acp5, Col15a1, Bglap2, Bglap3, Ibsp, Thbs4, Frzb, Bmp8a, Dkk1, Scube1, Chad, Spp1, Col11a2, Ptn, Ostn, Tnn, Mmp14, Gpx3, Cthrc1, Cxcl12, Prss12, Rbln1, Penk, Col8a1, Vipr2, Apod, Cpxm2, Rarres2, C4b, Sparcl1, Ly6e, R3hdml, Mia, Myoc, Nrtn, Pdzrn4, Spp1, Pth1r, Sox9, Acan, or Mmp13.
[0022] In some exemplary embodiments, described herein is an isolated or engineered pericyte or pericyte population, wherein the isolated or engineered pericyte is characterized by a gene signature comprising one or more genes in Table 3. In some exemplary embodiments, the gene signature further comprises one or more of Hey1, Nr2f2, Tbx2, Ebf1, Ebf2, Foxsl, Id3, Met2c, Cebpb, Zfxh3, Nr4a1, Klf9, Zeb2, Prrx1, Meox2, Junb, Id4, Zfp467, Irf1, Arid5b, Atp1b2, Aoc3, Sncq, Itga7, Aspn, Steap4, Thy1, Filip1I, Parm1, Agtr1a, Olfml2a, Cald1, Ednra, Col18a1, Serpini1, Bcam, Rrad, Pdgfrb, Col5a3, Pde5a, Notch3, Myl1, Tinagl1, Art3, Ngf, Sparcl1, Il6, Rarres2, Vstm4, Pgf, Pdgfa, Col4a2, Igfbp7, Col4a1, Fst, Rtn4r11, Adamts1, 1134, Gpc6, Cscll, Bgs5, Tagln, Higd1p, Nrip2, Gucv1a3, H2-M9, Des, Olfr558, Lmod1, Gucy1b3, Kcnk3, Pdlim3, Gm13861, Mrvi1, Pln, Gm13889, Ral11a, or Cygp. In some exemplary embodiments, the gene signature further comprises one or more of Cspg4, Ngfr, Des, Myh11, Acta2, Rgs5, Thy1, Pdgtfrb, Nes, Lepr, Cdh2, Cxcl12, Kitl. Ebf1, Sox4, Dlx5, Mxd4, Smad6, Hey1, Tcf15, Klf2, Mef2c, Atf3, Meox2, Steap4, Olfml2a, H2-M9, Tspan15, Cd24a, Marcks, Fbn1, Tnfrsf21, Slc12a2, Cfh, Cdh2, Vcam1, Sncg, Rasd1, Bcam, Rrad, Prkcdbp, Susd5, Csrrp1, Ptrf, Lama5, Ppp1r12b, Fhl1, Vim, Sdpr, Vtn, Angpt12, Cd44, Htra1, Mfap5, Anxa2, Procr, Igf1, Mgp, Col5a3, col4a2, Vstm4, Col3a1, Col4a1, Emcn, Gas1, Col6a2, Kit1, Sparcl1, Igfbp5, Ntf3, Inhba, Ccdc3, Fst, Timp3, Col1a1, Nbl1, Nov, Ccl11, Lga1s1, Dpt, Ctsl, Col6a3, Cxcl12, Rgs5, Abcc9, Phlda1, Tgs2, Cygb, Marcksl1, Apbb2, Ifitm3, Tmsb4x, Fam162a, Tagln, Pcp411, Crip1, Myl6, Acta2, Pln, Nrip2, Mustn1, Dstn, Mul9, Myh11, S100a6, Tppp3, Enpp2, S100a10, Cav1, Gstm1, Lysmd2, Myl12a, Nnmt, or S100a11. In some exemplary embodiments, the gene signature further comprises one or more Acta2, Myh11, Mcam, Jag1, and Il6.
[0023] In some exemplary embodiments, described herein is an isolated or engineered chondrocyte or chondrocyte population, wherein the isolated or engineered chondrocyte population is characterized by a gene signature comprising one or more genes in Table 4. In some exemplary embodiments, the gene signature comprises one or more of Barx1, Pitx1, Foxd1, Osr2, Tbx18, Runx3, Osr2, Tbx18, Runx3, Peg3, Bhlhe41, Batf3, Plagl1, Sp7, Sox8, Lef1, Shox2, Zbtb20, Foxa3, Mef2c, Egr2, Pax1, Runx2, Prg4, Cpe, Mfi2, Scara3, Cpm, Chst11, Unc5q, Col11a1, Slc2a5, Slc26a2, Cspg4, Prc1, Fgfr3, Nid2, Spon1, Slc40a, Efemp1, Susd5, Fxyd3, Alp1, Corin, Tpd5211, Sema3d, F5, Slc38a3, Cytl1, Rbp4, Vit, Clip, Fam19a5, Col9a3, Col9a1, Col9a2, Matn3, Hapln1, Sfrp5, Notum, Mia, lhh, Mgst2, Rarres1, Gpld1, Il17b, Bglap, 1500015010Rik, Itm2a, Crispld1, Meg3, Cenpp, Fxyd2, 3110079O15Rik, Lect1, Papss2, SAyt8, Stmn1, Lockd, Chil1, Calml3, Ncmap, Serpina1d, Serpina 1b, Serpina 1c, Sic6a1, or Serpina1a. In some exemplary embodiments, the gene signature comprises one or more of Sox9, Col11a2, Acan, or Col2a1. In some exemplary embodiments, the gene signature comprises one or more of Runx2, Ihh, Mef2c, or Col10a1. In some exemplary embodiments, the gene signature further comprises one or more of Grem1, Runx2, Sp7, Alp1, or Spp1. In some exemplary embodiments, the chondrocyte expresses one or more of Ihh, Pth1r, Mef2c, Col10a1, Ibsp, Mmp13, Grem1. In some exemplary embodiments, the gene signature comprises one or more of Prg4, Gas1, Clu, Dcn, Cilp, Scara3, Cytl1, Igfbp7, Cilp2, Cpe, Sod3, Cd81, Abi3 bp, Creb5, Gsn, Crip2, Vit, Fhl1, Pam, Cd9, Prrx1, Vim, Col11a2, Col9a1, Col2a1, Col9a2, Col27a1, Col9a3, Hapln1, Acan, Matn3, Col11a1, Pth1r, Mia, Pcolce2, Chst11, Epyc, Serpinh1, Gnb211, Fscn1, Pla2g5, Rcn1, Sox9, Bglap, Sp7, Fn1, Ube2s, Hmgb1, Ckap4, Clec11a, Il17b, Ybx1, Tmem97, Rbm3, Slc26a2, C1qtnf3, Fkbp2, Prelp, Apoe, Cst3, Spon1, Olfml3, Wif1, Lef1, Notum, Emb, Col1a2, Sfrp5, Omd, Ctsd, Zbtb20, Islr, B2m, Ly6e, Alp1, Spp1, Chad, Timp3, Mef2c, Sparc, Ihh, Junb, Txnip, Rarres1, Scrg1, Sema3d, Colgalt2, Serinc5, Slc38a2, Ddit41, Egr1, Runx2, or Cxcl12.
[0024] In some exemplary embodiments, described herein is an isolated or engineered fibroblast or fibroblast population, wherein the isolated or engineered fibroblast or fibroblast population is characterized by a gene signature comprising one or more genes of Table 5. In some exemplary embodiments, the gene signature further comprises one or more of Scx, Barx1, Trpsl, Hoxd9, Pitx1, Prrx1, Rora, Prrx2, Meox2, Ebf2, Osr2, Ebf1, Dlx3, Zfhx2, Meox1, Etv4, Mkx, Dcn, Clu, Abi3 bp, Prelp, Lox, Tnxb, Col3a1, Vcan, Vi, Mfap5, Col14a1, Aspn, Pdpn, Pdgfra, F13a1, Clic5, Gpr1, Emilin2, Has1, Mtap4, Gas2, Ntng1, Serpinf1, Postn, Angpt17, Clip2, Clip, Sod3, Slurp1, Spp1, Clec3b, Igfbp6, Thds4, Dpt, Gsn, Fndc1, Pla1a, Adamts15, Figf, Htra4, Rspo2, Mstn, Ptx4, Spock3, Cpxm2, Itgb1, Anxa8, Fxyd5, Fxyd6, Egln3, Ptgis, I133, Fgf9, Tppp3, Crlp1, Mustn1, Celf2, Tmod2, Ly6a, Fez1, Lysmd2, Pcsk6, 2210407C18Rik, Aldh1a3, Rtn1, Rab37, Lnmd, Chod1, Fam159b, Prph, or Insc. In some exemplary embodiments, the gene signature comprises one or more of Fibronectin-1 (Fn1), Fibroblast Specific Protein-1 (S100a4), Col1a1, Col1a2, Lum, Col22a1, or Twist2. In some exemplary embodiments, the gene signature comprises one or more of Sox9, Acan, and Col2a1. In some exemplary embodiments, the gene signature comprises one or more of Cd34, Ly6a, Pdgfra, Thy1 and Cd44, and not Cdh5, or Acta2. In some exemplary embodiments, the gene signature comprises one or more of Sox-9, Scleraxis (Scx), Spp1, Cspg4, CD73 (Nt5e), and Cartilage Intermediate Layer Protein (Cilp). In some exemplary embodiments, the gene signature further comprises one or more of S1004a, Dcn, Sema3c, or Cxcl12.
[0025] In some exemplary embodiments, described herein is an isolated or engineered bone marrow derived endothelial cell (BMEC) or BMEC population, wherein the isolated or engineered fibroblast or fibroblast population is characterized by a gene signature comprising one or more genes of Table 6. In some exemplary embodiments, the gene signature comprises one or more of Mafb, Pparg, Nr2f2, Irf8, Ets1, Sox17, Sox11, Bcl6b, Gata2, Tcf15, Meox1, Sox7, Tshz2, Tfpi, Gpm6a, Ackr1, Mrc1, Stab1, Vcam1, Tek, Flt1, Ramp3, Icam2, Podx1, Cd34, Mcam, Sdpr, Bcam, Tspan13, Fabp5, Vim, Kit1, Lrg1, Dnasel13, Sepp1, Egfl7, Pde2a, Gpihbp1, Sema3g, Ramp2, Cd3001g, C1qtnf9, Sparcl1, Tinagl1, Pdgfb, Ubd, Stab2, Fabp4, Cldn5, Rgs4, Ecscr, Cyyr1, Ly6c1, Magix, Cav1, Gngt2, Myct1, or Tmsb4x. In some exemplary embodiments, the gene signature comprises one or more of Flt4 (Vegfr-3) and Ly6a (Sca-1), wherein Ly6a expression, when present in the gene signature, is reduced as compared to a suitable control. In some exemplary embodiments, the gene signature comprises one or more of Pecam1, Cdh5, Cd34, Tek, Lepr, Cxcl12, or Kitl. In some exemplary embodiments the gene signature comprises one or more of Flt4, Ly6a, Icam1, or Sele. In some exemplary embodiments, the gene signature comprises one or more of Mafb, Cebpb, Xbp1, Nr2f2, Irf8, Ybx1, Ebf1, Sox17, Mxd4, Id1, Meox2, Tshz2, Tcf15, Meox1, Tfpi, Il6stm Angpt4, Gpm6a, Vcam1, Emp1, Cd34, Gnas, Slc9a3r2, Cald1, Mcam, Tspan13, Vim, Cd9, Ptrf, Crip2, Sepp1, Ctsl, Adamts5, Apoe, Igfbp4, Sparc, Col4a2, Col4a1, Serpinh1, Ppic, Cxcl12, Cst3, Sparcl1, C1qtnf9, Tinagl1, Mgll, Kit1, Stab2, Ubd, Gm1673, Abcc9, Rgs4, Ly6c1, Actg1, Tsc22d1, Glu1, Fxyd5, Crip1, Cav1, S100a6, S100a10, or lfitm2.
[0026] In some exemplary embodiments, described herein are methods of treating a hematological disease comprising: administering to a subject in need thereof the isolated or engineered cell or cell population as described in greater detail herein.
[0027] In some exemplary embodiments, described herein are methods of screening for one or more agents capable of modulating a stromal cell state, comprising: contacting a stromal cell population having an initial cell state with a test modulating agent or library of modulating agents, wherein the stromal cell population optionally contains leukemia cells; determining one or more fractions of stromal cell states including one or more fraction(s) of a mesenchymal stem/stromal cell (MSC), an OLC, a chondrocyte, a fibroblast, a pericyte, a bone marrow derived endothelial cell (BMEC), or a combination thereof; and selecting modulating agents that shifts the initial stromal cell state to a desired stromal cell state, wherein the desired stromal cell fraction in the stromal cell population is above a set cutoff limit. In some exemplary embodiments, determining one or more fractions of stromal cell states further comprises determining one or more MSC subtype, one or more OLC types, one or more chondrocyte types, one or more fibroblast types, one or more BMEC types, one or more pericyte subtype, or a combination thereof. In some exemplary embodiments, the stromal cell population is obtained from a subject to be treated. In some exemplary embodiments, determining one or more fractions of stromal cell states comprises identifying a MSC gene signature, an OLC gene signature, a chondrocyte gene signature, a fibroblast gene signature, a BMEC gene signature, a pericyte gene signature.
[0028] In some exemplary embodiments, the MSC gene signature comprises:
[0029] a. one or more genes of Table 1;
[0030] b. one or more of Cebpa, Zeb2, Runx2, Ebf1, Foxc1, Cebpb, Ar, Fos, Id4, Klf6, Irf1, Runx2, Jun, Snaj2, Maf, Zthx4, Id3, Egr1, Junb, Hp, Lpl, Gdpd2, Serping, Dpep1, Grem1, Pappa, Chrdl1, Fbln5, Vcam1, Kng1, H2-Q10, Cdh11, Mme, Tmem176b, Csf1, H2-K1, Serpine2, H2-D1, Tnc, Cdh2, Pdgtra, Esm1, Gas6, Cxcl14, Sfrp4, Wisp2, Agt, Il34, Fst, Fgf7, Il1rn, C2, Igfpb4, Serpina1, Cbln1, Apoe, Ibsp, Igfbp5, Gpx3, Pdzrn4, Rarres2, Vegfa, 1500009L16Rik, Serpina3g, Cyp1b1, Ebt3, Arrdc4, Kng2, Slc26a7, Marc1, Ms4ad4, Wdr86, Serpina3c, Tmem176a, Cldn10, Trt, Gpr88, Nnmt, Gm4951, Cd1d1, Plpp3, or Ackr4; or
[0031] c. Nte5, Vcam1, Eng, Thy1, Ly6a, Grem1, Cspg4, Nes, Runx2, Col1A1, Erg1, Junb, Fosb, Cebpb, Klf6, Nr4a1, Klf2, Atf3, Klf4, Maff, Nfia, Smad6, Hey1, Sp7, Id1, Ifrd1, Trib1, Rrad, Odc1, Actb, Notch2, AlpI, Mmp13, Raph1, Tnfsf11, Cxcl1, Adamts1, Cc17, Serpine1, Cc12, Apod, Cbln1, Pam, Col8a1, Wif1, Olfml3, Gdf10, Cyr61, Nog, Angpt4, Metrn1, Trabd2b, Adamts5, Igfbp4, Cxcl12, Igfbp5, Lepr, Cxcl12, Kit1, Grem1, or Angpt1;
[0032] and wherein the MCS optionally does not express one or more of Thy1, Ly6a (Sca-1), NG2 (Cspg4) or Nestin (Nes).
[0033] In some exemplary embodiments, the OLC gene signature comprises:
[0034] a. one or more genes of Table 2;
[0035] b. one or more of Vdr, Satb2, Sp7, Runx2, Tbx2, Zeb2, Dlx5, Dlx6, Zfhx4, Hey1, Irx5, Id3, Mxd4, Mef2c, Esr1, Maf, Smad6, Sox4, Cebpb, Meis3, Mmp13, Tnc, Cfh, Alp1, Lrp4, Cdh11, Casm1, Cdh2, Slit2, Bmp3, Cdh15, Fat3, Pard6g, Litr, Cp, Ptprd, Olfml3 Fign, Cd63, Fap, Dmp1, Angpt4, Chn1, Ibsp, Wisp1, Wif1, Metrn1, Vldlr, Podnl1, Col22a1, Ndnf, Mmp14, Pgf, Lox11, Mfap2, Srpx2, Agt, Tmem59, Vstm4, Col8a1, Cxcl12, Bglap2, Car3, Kcnk2, Slc36a2, Ifitm5, Hpgd, Limch1, Gm44029, Hvcn1, Tnfrsf19, Col13a1, Fam78b, Gja1, Cnn2, Ppfibp2, Cldn10, Dapk2, Tmp1, Bglap3, or Ramp1;
[0036] c. one or more of Runx2, Sp7, Grem1, Lepr, Cxcl12, Kit1, Bglap, Cd200, Spp1, Sox9, Id4, Ebf1, Ebf3, Cebpa, Foxc1, Snai2, Maf, Runx1, Thra, Plagl1, Mafb, Vdr, Cebpb, Tcf712, Bhlhe40, Snai1, Creb311, Zbtb7c, Gm22, Tcf7, Nr4a2, Atf3, Prrx2, Fbln5, H2-K1, H2-D1, Hp, Fstl1, Tmem176b, B2m, Pappa, Dpep1, Islr, Vcam1, Lepr, Mmp13, Cd200, Itgb5, Lifr, Postn, Slit2, Timp1, Lrp4, Tspan6, Ctsc, Cpz, Prss35, Tmeml19, Lox, Cryab, Pdzd2, Fyn, Gucala, Rerg, Sema4d, Vcam, Aspn, Slc20a2, Plat, Fmod, Fn1, Aebop1, Angpt12, Prkcdbp, Prelp, Cxcl12, Igfbp4, Cxcl14, Gas6, Apoe, Igfbp7, Col8a1, Serping1, Igfbp5, Igf1, Kit1, Spp1, Serpine2, Fam20c, Bmp8a, Dmp1, Ibsp, Pros1, Srpx2, Mgll, Timp3, Col11a2, Cgref1, Col1a1, Cthrc1, Sparc, Col22a1, Col5a2, Fkbp11, Col3a1, Ptn, Col6a2, Tnn, Npy, Col6a1, Omd, Dcn, Tgfbi, Col6a3, or Acan;
[0037] d. one or more of Runx2, Sp7, Grem1, Bglap, Cxcl12, Kit1, Osr1, Foxd1, Sox5, Osr2, Erg, Nfatc2, Mef2c, Sp7, Zbtb7c, Runx2, Snai2, Zfhx4, Dlx6, Meox1, Prrx1, Scx, Hic1, Peg3, Etv5, Ltbp1, Tspan8, Emb, Slc16a2, Tspan13, Creb5, Scara3, Prg4, Clu, plxdc1, Cdon, Fbln7, Ntn1, Nt5e, Thbd, Pth1r, Alp1, Cadm1, Cd200, Susd5, Rarres1, Ptprz1, Plat, Tnfrsf11b, Lpar3, Cspg4, Postn, S1pr1, Enah, Aspn, Cald1, Wnt5b, Adam12, Tnc, Pak1, Lpl, Mfap4, Cntfr, Fbln2, Fgl2, Gpc3, Ogn, Slc1a3, Spock2, Fbln5, Rgp1, Smoc1, C5ar1, Fzd9, Npr2, Fzd10, Cxcl14, Wif1, Arsi, Col12a1, Mgp, Itgbl1, Igf1, Smoc2, Spon2, Fst, Sbsn, Gas1, Sod3, Mmp3, Cilp, Pla2g2e, Fam213a, Acp5, Col15a1, Bglap2, Bglap3, Ibsp, Thbs4, Frzb, Bmp8a, Dkk1, Scube1, Chad, Spp1, Col11a2, Ptn, Ostn, Tnn, Mmp14, Gpx3, Cthrc1, Cxcl12, Prss12, Rbln1, Penk, Col8a1, Vipr2, Apod, Cpxm2, Rarres2, C4b, Sparcl1, Ly6e, R3hdml, Mia, Myoc, Nrtn, Pdzrn4, Spp1, Pth1r, Sox9, Acan, or Mmp13;
[0038] and wherein the OLC optionally expresses Bglap and Spp1.
[0039] In some exemplary embodiments, the chondrocyte gene signature comprises:
[0040] a. one or more genes of Table 4;
[0041] b. one or more of Barx1, Pitx1, Foxd1, Osr2, Tbx18, Runx3, Osr2, Tbx18, Runx3, Peg3, Bhlhe41, Batf3, Plagl1, Sp7, Sox8, Lef1, Shox2, Zbtb20, Foxa3, Mef2c, Egr2, Pax1, Runx2, Prg4, Cpe, Mfi2, Scara3, Cpm, Chst1, Unc5q, Col11a1, Slc2a5, Slc26a2, Cspg4, Prc1, Fgfr3, Nid2, Spon1, Slc40a, Efemp1, Susd5, Fxyd3, Alp1, Corin, Tpd5211, Sema3d, F5, Slc38a3, Cytl1, Rbp4, Vit, Clip, Fam19a5, Col9a3, Col9a1, Col9a2, Matn3, Hapln1, Sfrp5, Notum, Mia, lhh, Mgst2, Rarres1, Gpld1, I17b, Bglap, 1500015010Rik, Itm2a, Crispld1, Meg3, Cenpp, Fxyd2, 3110079O15Rik, Lect1, Papss2, SAyt8, Stmn1, Lockd, Chil1, Calml3, Ncmap, Serpina1d, Serpina 1b, Serpina 1c, Sic6a1, or Serpina1a;
[0042] c. one or more of Sox9, Col11a2, Acan, or Col2a1;
[0043] d. one or more of Runx2, Ihh, Mef2c, or Col10a1;
[0044] e. one or more of Grem1, Runx2, Sp7, Alp1, or Spp1;
[0045] f. one or more of Ihh, Pth1r, Mef2c, Col10a1, Ibsp, Mmp13, Grem1; or
[0046] g. one or more of Prg4, Gas1, Clu, Dcn, Cilp, Scara3, Cytl1, Igfbp7, Cilp2, Cpe, Sod3, Cd81, Abi3 bp, Creb5, Gsn, Crip2, Vit, Fhl1, Pam, Cd9, Prrx1, Vim, Col11a2, Col9a1, Col2a1, Col9a2, Col27a1, Col9a3, Hapln1, Acan, Matn3, Col11a1, Pth1r, Mia, Pcolce2, Chst11, Epyc, Serpinh1, Gnb211, Fscn1, Pla2g5, Rcn1, Sox9, Bglap, Sp7, Fn1, Ube2s, Hmgb1, Ckap4, Clec11a, 1117b, Ybx1, Tmem97, Rbm3, Slc26a2, C1qtnf3, Fkbp2, Prelp, Apoe, Cst3, Spon1, Olfml3, Wif1, Lef1, Notum, Emb, Col1a2, Sfrp5, Omd, Ctsd, Zbtb20, Islr, B2m, Ly6e, Alp1, Spp1, Chad, Timp3, Mef2c, Sparc, Ihh, Junb, Txnip, Rarres1, Scrg1, Sema3d, Colgalt2, Serinc5, Slc38a2, Ddit4l, Egr1, Runx2, or Cxcl12.
[0047] the fibroblast gene signature comprises:
[0048] a. one or more genes of Table 5;
[0049] b. one or more of Scx, Barx1, Trps1, Hoxd9, Pitx1, Prrx1, Rora, Prrx2, Meox2, Ebf2, Osr2, Ebf1, Dlx3, Zfhx2, Meox1, Etv4, Mkx, Dcn, Clu, Abi3 bp, Prelp, Lox, Tnxb, Col3a1, Vcan, Vi, Mfap5, Col14a1, Aspn, Pdpn, Pdgfra, F13a1, Clic5, Gpr1, Emilin2, Has1, Mtap4, Gas2, Ntng1, Serpinf1, Postn, Angpt17, Clip2, Clip, Sod3, Slurp1, Spp1, Clec3b, Igfbp6, Thds4, Dpt, Gsn, Fndc1, Pla1a, Adamts15, Figf, Htra4, Rspo2, Mstn, Ptx4, Spock3, Cpxm2, Itgbl1, Anxa8, Fxyd5, Fxyd6, Egln3, Ptgis, I133, Fgf9, Tppp3, Crlp1, Mustn1, Celf2, Tmod2, Ly6a, Fez1, Lysmd2, Pcsk6, 2210407C18Rik, Aldh1a3, Rtn1, Rab37, Lnmd, Chod1, Fam159b, Prph, or Insc;
[0050] c. Fibronectin-1 (Fn1), Fibroblast Specific Protein-1 (S100a4), Col1a1, Col1a2, Lum, Col22a1, or Twist2;
[0051] d. one or more of Sox9, Acan, and Col2a1;
[0052] e. Cd34, Ly6a, Pdgfra, Thy1 and Cd44, and not Cdh5, or Acta2;
[0053] f. one or more of Sox-9, Scleraxis (Scx), Spp1, Cspg4, CD73 (Nt5e), and Cartilage Intermediate Layer Protein (Cilp); or
[0054] g. one or more of S1004a, Dcn, Sema3c, or Cxcl12.
[0055] In some exemplary embodiments, the the BMEC gene signature comprises:
[0056] a. one or more genes of Table 6;
[0057] b. one or more of Mafb, Pparg, Nr2f2, Irf8, Ets1, Sox17, Sox11, Bcl6b, Gata2, Tcf15, Meox1, Sox7, Tshz2, Tfpi, Gpm6a, Ackr1, Mrc1, Stab1, Vcam1, Tek, Flt1, Ramp3, Icam2, Podx1, Cd34, Mcam, Sdpr, Bcam, Tspan13, Fabp5, Vim, Kit1, Lrg1, Dnasel13, Sepp1, Egfl7, Pde2a, Gpihbp1, Sema3g, Ramp2, Cd3001g, C1qtnf9, Sparcl1, Tinagl1, Pdgfb, Ubd, Stab2, Fabp4, Cldn5, Rgs4, Ecscr, Cyyr1, Ly6c1, Magix, Cav1, Gngt2, Myct1, or Tmsb4x;
[0058] c. one or more of Flt4 (Vegfr-3) or Ly6a (Sca-1);
[0059] d. one or more of Pecam1, Cdh5, Cd34, Tek, Lepr, Cxcl12, or Kitl;
[0060] e. one or more of Flt4, Ly6a, Icam1, or Sele;
[0061] f. one or more of Mafb, Cebpb, Xbp1, Nr2f2, Irf8, Ybx1, Ebf1, Sox17, Mxd4, Id1, Meox2, Tshz2, Tcf15, Meox1, Tfpi, Il6stm Angpt4, Gpm6a, Vcam1, Emp1, Cd34, Gnas, Slc9a3r2, Cald1, Mcam, Tspan13, Vim, Cd9, Ptrf, Crip2, Sepp1, Ctsl, Adamts5, Apoe, Igfbp4, Sparc, Col4a2, Col4a1, Serpinh1, Ppic, Cxcl12, Cst3, Sparcl1, C1qtnf9, Tinagl1, Mgll, Kit1, Stab2, Ubd, Gm1673, Abcc9, Rgs4, Ly6c1, Actg1, Tsc22d1, Glu1, Fxyd5, Crip1, Cav1, S100a6, S100a10, lfitm2; or
[0062] g. one or more of Mafb, Cebpb, Xbp1, Nr2f2, Irf8, Ybx1, Ebf1, Sox17, Mxd4, Id1, Meox2, Tshz2, Tcf15, Meox1, Tfpi, Il6stm Angpt4, Gpm6a, Vcam1, Emp1, Cd34, Gnas, Slc9a3r2, Cald1, Mcam, Tspan13, Vim, Cd9, Ptrf, Crip2, Sepp1, Ctsl, Adamts5, Apoe, Igfbp4, Sparc, Col4a2, Col4a1, Serpinh1, Ppic, Cxcl12, Cst3, Sparcl1, C1qtnf9, Tinagl1, Mgll, Kit1, Stab2, Ubd, Gm1673, Abcc9, Rgs4, Ly6c1, Actg1, Tsc22d1, Glu1, Fxyd5, Crip1, Cav1, S100a6, S100a10, or lfitm2.
[0063] In some exemplary embodiments, the pericyte gene signature comprises:
[0064] a. one or more genes in Table 3;
[0065] b. one or more of Hey1, Nr2f2, Tbx2, Ebf1, Ebf2, Foxsl, Id3, Met2c, Cebpb, Zfxh3, Nr4a1, Klf9, Zeb2, Prrx1, Meox2, Junb, Id4, Zfp467, Irf1, Arid5b, Atp1b2, Aoc3, Sncq, Itga7, Aspn, Steap4, Thy1, Filip1I, Parm1, Agtr1a, Olfml2a, Cald1, Ednra, Col18a1, Serpini1, Bcam, Rrad, Pdgfrb, Col5a3, Pde5a, Notch3, Myl1, Tinagl1, Art3, Ngf, Sparcl1, 116, Rarres2, Vstm4, Pgf, Pdgfa, Col4a2, Igfbp7, Col4a1, Fst, Rtn4lrl1, Adamts1, 1134, Gpc6, Cscll, Bgs5, Tagln, Higd1p, Nrip2, Gucv1a3, H2-M9, Des, Olfr558, Lmod1, Gucy1b3, Kcnk3, Pdlim3, Gm13861, Mrvi1, Pln, Gm13889, Ral11a, Cygp;
[0066] c. one or more of Cspg4, Ngfr, Des, Myh11, Acta2, Rgs5, Thy1, Pdgtfrb, Nes, Lepr, Cdh2, Cxcl12, Kitl. Ebf1, Sox4, Dlx5, Mxd4, Smad6, Hey1, Tcf15, Klf2, Mef2c, Atf3, Meox2, Steap4, Olfml2a, H2-M9, Tspan15, Cd24a, Marcks, Fbn1, Tnfrsf21, Slc12a2, Cfh, Cdh2, Vcam1, Sncg, Rasd1, Bcam, Rrad, Prkcdbp, Susd5, Csrrp1, Ptrf, Lama5, Ppp1r12b, Fhl1, Vim, Sdpr, Vtn, Angpt12, Cd44, Htra1, Mfap5, Anxa2, Procr, Igf1, Mgp, Col5a3, col4a2, Vstm4, Col3a1, Col4a1, Emcn, Gas1, Col6a2, Kit1, Sparcl1, Igfbp5, Ntf3, Inhba, Ccdc3, Fst, Timp3, Col1a1, Nbl1, Nov, Ccl11, Lga1s1, Dpt, Ctsl, Col6a3, Cxcl12, Rgs5, Abcc9, Phlda1, Tgs2, Cygb, Marcksl1, Apbb2, Ifitm3, Tmsb4x, Fam162a, Tagln, Pcp411, Crip1, Myl6, Acta2, Pln, Nrip2, Mustn1, Dstn, Mul9, Myh11, S100a6, Tppp3, Enpp2, S100a10, Cav1, Gstm1, Lysmd2, Myl12a, Nnmt, or S100a11; or d. one or more of Acta2, Myh11, Mcam, Jag1, or Il6.
[0067] In some exemplary embodiments, the modulating agent that shifts the initial stromal cell state to the desired stromal cell state is capable of remodeling in a hematological disease.
[0068] In some exemplary embodiments, described herein are methods of screening for one or more agents capable of modulating osteogenic and/or adipogenic differentiation in a hematological disease comprising: contacting a cell population with a test modulating agent, wherein the cell population comprises MSC(s), OLC(s), and leukemia cells; and selecting modulating agents that change the regulation of one or more of Grem1, Bmp4, Sp7, Runx2, Bglap1, Bglap2, Bglap3, Adipoq, Wisp2, Mgp, Igbfp5, Igbfp3, Mmp2, Mmp11, or Mmp13.
[0069] In some exemplary embodiments, described herein are methods of screening for one or more agents capable of remodeling in a hematological disease comprising:
[0070] contacting a cell population with a test modulating agent, wherein the cell population comprises MSC(s), OLC(s), and leukemia cells; and
[0071] selecting modulating agents that
[0072] a. change the proportion of prerosteoblasts in the cell population;
[0073] b. change the relative proportion of OLC-1 to OLC-2 in the cell population;
[0074] c. change the relative proportion of hypertrophic chondrocytes to progenitor chondrocytes in the cell population;
[0075] d. change the relative proportion of subtype-3 (Cluster 16) fibroblasts to subtype-4 fibroblasts (Cluster 3); or
[0076] e. a combination thereof.
[0077] In some exemplary embodiments, described herein are methods of detecting a mesenchymal stem/stromal cell (MSC) from a population of stromal cells comprising:
[0078] detecting in a sample the expression or activity of a MSC gene expression signature,
[0079] wherein detection of the MSC gene expression signature indicates MSCs in the sample, and
[0080] wherein the MSC gene expression signature comprises:
[0081] a. one or more genes of Table 1;
[0082] b. one or more of Cebpa, Zeb2, Runx2, Ebf1, Foxc1, Cebpb, Ar, Fos, Id4, Klf6, Irf1, Runx2, Jun, Snaj2, Maf, Zthx4, Id3, Egr1, Junb, Hp, Lpl, Gdpd2, Serping, Dpep1, Grem1, Pappa, Chrdl1, Fbln5, Vcam1, Kng1, H2-Q10, Cdh11, Mme, Tmem176b, Csf1, H2-K1, Serpine2, H2-D1, Tnc, Cdh2, Pdgtra, Esm1, Gas6, Cxcl14, Sfrp4, Wisp2, Agt, Il34, Fst, Fgf7, Il1rn, C2, Igfpb4, Serpina1, Cbln1, Apoe, Ibsp, Igfbp5, Gpx3, Pdzrn4, Rarres2, Vegfa, 1500009L16Rik, Serpina3g, Cyp1b1, Ebt3, Arrdc4, Kng2, Slc26a7, Marc1, Ms4ad4, Wdr86, Serpina3c, Tmem176a, Cldn10, Trt, Gpr88, Nnmt, Gm4951, Cd1d1, Plpp3, or Ackr4; or
[0083] c. Nte5, Vcam1, Eng, Thy1, Ly6a, Grem1, Cspg4, Nes, Runx2, Col1A1, Erg1, Junb, Fosb, Cebpb, Klf6, Nr4a1, Klf2, Atf3, Klf4, Maff, Nfia, Smad6, Hey1, Sp7, Id1, Ifrd1, Trib1, Rrad, Odc1, Actb, Notch2, AlpI, Mmp13, Raph1, Tnfsf11, Cxcl1, Adamts1, Cc17, Serpine1, Cc12, Apod, Cbln1, Pam, Col8a1, Wif1, Olfml3, Gdf10, Cyr61, Nog, Angpt4, Metrn1, Trabd2b, Adamts5, Igfbp4, Cxcl12, Igfbp5, Lepr, Cxcl12, Kit1, Grem1, or Angpt1;
[0084] and wherein the MCS optionally does not express one or more of Thy1, Ly6a (Sca-1), NG2 (Cspg4) or Nestin (Nes).
[0085] In some exemplary embodiments, described herein are methods of detecting an osteolineage cell (OLC) from a population of stromal cells comprising:
[0086] detecting in a sample the expression or activity of an OLC gene expression signature,
[0087] wherein detection of the OLC gene expression signature indicates OLCs in the sample, and
[0088] wherein the OLC gene expression signature comprises
[0089] a. one or more genes of Table 2;
[0090] b. one or more of Vdr, Satb2, Sp7, Runx2, Tbx2, Zeb2, Dlx5, Dlx6, Zfhx4, Hey1, Irx5, Id3, Mxd4, Mef2c, Esr1, Maf, Smad6, Sox4, Cebpb, Meis3, Mmp13, Tnc, Cfh, Alp1, Lrp4, Cdh11, Casm1, Cdh2, Slit2, Bmp3, Cdh15, Fat3, Pard6g, Litr, Cp, Ptprd, Olfml3 Fign, Cd63, Fap, Dmp1, Angpt4, Chn1, Ibsp, Wisp1, Wif1, Metrn1, Vldlr, Podnl1, Col22a1, Ndnf, Mmp14, Pgf, Lox11, Mfap2, Srpx2, Agt, Tmem59, Vstm4, Col8a1, Cxcl12, Bglap2, Car3, Kcnk2, Slc36a2, Ifitm5, Hpgd, Limch1, Gm44029, Hvcn1, Tnfrsf19, Col13a1, Fam78b, Gja1, Cnn2, Ppfibp2, Cldn10, Dapk2, Tmp1, Bglap3, or Ramp1;
[0091] c. one or more of Runx2, Sp7, Grem1, Lepr, Cxcl12, Kit1, Bglap, Cd200, Spp1, Sox9, Id4, Ebf1, Ebf3, Cebpa, Foxc1, Snai2, Maf, Runx1, Thra, Plagl1, Mafb, Vdr, Cebpb, Tcf712, Bhlhe40, Snai1, Creb311, Zbtb7c, Gm22, Tcf7, Nr4a2, Atf3, Prrx2, Fbln5, H2-K1, H2-D1, Hp, Fstl1, Tmem176b, B2m, Pappa, Dpep1, Islr, Vcam1, Lepr, Mmp13, Cd200, Itgb5, Lifr, Postn, Slit2, Timp1, Lrp4, Tspan6, Ctsc, Cpz, Prss35, Tmeml19, Lox, Cryab, Pdzd2, Fyn, Gucala, Rerg, Sema4d, Vcam, Aspn, Slc20a2, Plat, Fmod, Fn1, Aebop1, Angpt12, Prkcdbp, Prelp, Cxcl12, Igfbp4, Cxcl14, Gas6, Apoe, Igfbp7, Col8a1, Serping1, Igfbp5, Igf1, Kit1, Spp1, Serpine2, Fam20c, Bmp8a, Dmp1, Ibsp, Pros1, Srpx2, Mgll, Timp3, Col11a2, Cgref1, Col1a1, Cthrc1, Sparc, Col22a1, Col5a2, Fkbp11, Col3a1, Ptn, Col6a2, Tnn, Npy, Col6a1, Omd, Dcn, Tgfbi, Col6a3, or Acan;
[0092] d. one or more of Runx2, Sp7, Grem1, Bglap, Cxcl12, Kit1, Osr1, Foxd1, Sox5, Osr2, Erg, Nfatc2, Mef2c, Sp7, Zbtb7c, Runx2, Snai2, Zfhx4, Dlx6, Meox1, Prrx1, Scx, Hic1, Peg3, Etv5, Ltbp1, Tspan8, Emb, Slc16a2, Tspan13, Creb5, Scara3, Prg4, Clu, plxdc1, Cdon, Fbln7, Ntn1, Nt5e, Thbd, Pth1r, Alp1, Cadm1, Cd200, Susd5, Rarres1, Ptprz1, Plat, Tnfrsf11b, Lpar3, Cspg4, Postn, S1pr1, Enah, Aspn, Cald1, Wnt5b, Adam12, Tnc, Pak1, Lpl, Mfap4, Cntfr, Fbln2, Fgl2, Gpc3, Ogn, Slc1a3, Spock2, Fbln5, Rgp1, Smoc1, C5ar1, Fzd9, Npr2, Fzd10, Cxcl14, Wif1, Arsi, Col12a1, Mgp, Itgbl1, Igf1, Smoc2, Spon2, Fst, Sbsn, Gas1, Sod3, Mmp3, Cilp, Pla2g2e, Fam213a, Acp5, Col15a1, Bglap2, Bglap3, Ibsp, Thbs4, Frzb, Bmp8a, Dkk1, Scube1, Chad, Spp1, Col11a2, Ptn, Ostn, Tnn, Mmp14, Gpx3, Cthrc1, Cxcl12, Prss12, Rbln1, Penk, Col8a1, Vipr2, Apod, Cpxm2, Rarres2, C4b, Sparcl1, Ly6e, R3hdml, Mia, Myoc, Nrtn, Pdzrn4, Spp1, Pth1r, Sox9, Acan, or Mmp13];
[0093] and wherein the OLC optionally expresses Bglap and Spp1.
[0094] In some exemplary embodiments, described herein are methods of detecting a chondrocyte from a population of stromal cells comprising:
[0095] detecting in a sample the expression or activity of a chondrocyte gene expression signature,
[0096] wherein detection of the chondrocyte gene expression signature indicates chondrocytes in the sample, and
[0097] wherein the chondrocyte gene expression signature comprises
[0098] a. one or more genes of Table 4;
[0099] b. one or more of Barx1, Pitx1, Foxd1, Osr2, Tbx18, Runx3, Osr2, Tbx18, Runx3, Peg3, Bhlhe41, Batf3, Plagl1, Sp7, Sox8, Lef1, Shox2, Zbtb20, Foxa3, Mef2c, Egr2, Pax1, Runx2, Prg4, Cpe, Mfi2, Scara3, Cpm, Chst1, Unc5q, Col11a1, Slc2a5, Slc26a2, Cspg4, Prc1, Fgfr3, Nid2, Spon1, Slc40a, Efemp1, Susd5, Fxyd3, Alp1, Corin, Tpd5211, Sema3d, F5, Slc38a3, Cytl1, Rbp4, Vit, Clip, Fam19a5, Col9a3, Col9a1, Col9a2, Matn3, Hapln1, Sfrp5, Notum, Mia, lhh, Mgst2, Rarres1, Gpld1, Il17b, Bglap, 1500015010Rik, Itm2a, Crispld1, Meg3, Cenpp, Fxyd2, 3110079O15Rik, Lect1, Papss2, SAyt8, Stmn1, Lockd, Chil1, Calml3, Ncmap, Serpina1d, Serpina 1b, Serpina 1c, Sic6a1, or Serpina1a;
[0100] c. one or more of Sox9, Col11a2, Acan, or Col2a1;
[0101] d. one or more of Runx2, Ihh, Mef2c, or Col10a1;
[0102] e. one or more of Grem1, Runx2, Sp7, Alp1, or Spp1;
[0103] f. one or more of Ihh, Pth1r, Mef2c, Col10a1, Ibsp, Mmp13, Grem1; or
[0104] g. one or more of Prg4, Gas1, Clu, Dcn, Cilp, Scara3, Cytl1, Igfbp7, Cilp2, Cpe, Sod3, Cd81, Abi3 bp, Creb5, Gsn, Crip2, Vit, Fhl1, Pam, Cd9, Prrx1, Vim, Col11a2, Col9a1, Col2a1, Col9a2, Col27a1, Col9a3, Hapln1, Acan, Matn3, Col11a1, Pth1r, Mia, Pcolce2, Chst11, Epyc, Serpinh1, Gnb211, Fscn1, Pla2g5, Rcn1, Sox9, Bglap, Sp7, Fn1, Ube2s, Hmgb1, Ckap4, Clec11a, Il17b, Ybx1, Tmem97, Rbm3, Slc26a2, C1qtnf3, Fkbp2, Prelp, Apoe, Cst3, Spon1, Olfml3, Wif1, Lef1, Notum, Emb, Col1a2, Sfrp5, Omd, Ctsd, Zbtb20, Islr, B2m, Ly6e, Alp1, Spp1, Chad, Timp3, Mef2c, Sparc, Ihh, Junb, Txnip, Rarres1, Scrg1, Sema3d, Colgalt2, Serinc5, Slc38a2, Ddit41, Egr1, Runx2, or Cxcl12.
[0105] In some exemplary embodiments, described herein are methods of detecting a fibroblast from a population of stromal cells comprising:
[0106] detecting in a sample the expression or activity of a fibroblast gene expression signature,
[0107] wherein detection of the fibroblast gene expression signature indicates fibroblasts in the sample, and
[0108] wherein the fibroblast gene expression signature comprises
[0109] a. one or more genes of Table 5;
[0110] b. one or more of Scx, Barx1, Trps1, Hoxd9, Pitx1, Prrx1, Rora, Prrx2, Meox2, Ebf2, Osr2, Ebf1, Dlx3, Zfhx2, Meox1, Etv4, Mkx, Dcn, Clu, Abi3 bp, Prelp, Lox, Tnxb, Col3a1, Vcan, Vi, Mfap5, Col14a1, Aspn, Pdpn, Pdgfra, F13a1, Clic5, Gpr1, Emilin2, Has1, Mtap4, Gas2, Ntng1, Serpinf1, Postn, Angpt17, Clip2, Clip, Sod3, Slurp1, Spp1, Clec3b, Igfbp6, Thds4, Dpt, Gsn, Fndc1, Pla1a, Adamts15, Figf, Htra4, Rspo2, Mstn, Ptx4, Spock3, Cpxm2, Itgbl1, Anxa8, Fxyd5, Fxyd6, Egln3, Ptgis, I133, Fgf9, Tppp3, Crlp1, Mustn1, Celf2, Tmod2, Ly6a, Fez1, Lysmd2, Pcsk6, 2210407C18Rik, Aldh1a3, Rtn1, Rab37, Lnmd, Chod1, Fam159b, Prph, or Insc;
[0111] c. Fibronectin-1 (Fn1), Fibroblast Specific Protein-1 (S100a4), Col1a1, Col1a2, Lum, Col22a1, or Twist2;
[0112] d. one or more of Sox9, Acan, and Col2a1;
[0113] e. Cd34, Ly6a, Pdgfra, Thy1 and Cd44, and not Cdh5, or Acta2;
[0114] f. one or more of Sox-9, Scleraxis (Scx), Spp1, Cspg4, CD73 (Nt5e), and Cartilage Intermediate Layer Protein (Cilp); or
[0115] g. one or more of S1004a, Dcn, Sema3c, or Cxcl12.
[0116] In some exemplary embodiments, described herein are methods of detecting a bone marrow derived endothelial cell (BMEC) from a population of stromal cells comprising:
[0117] detecting in a sample the expression or activity of a BMEC gene expression signature,
[0118] wherein detection of the BMEC gene expression signature indicates BMECs in the sample, and
[0119] wherein the fibroblast gene expression signature comprises
[0120] a. one or more genes of Table 6;
[0121] b. one or more of Mafb, Pparg, Nr2f2, Irf8, Ets1, Sox17, Sox11, Bcl6b, Gata2, Tcf15, Meox1, Sox7, Tshz2, Tfpi, Gpm6a, Ackr1, Mrc1, Stab1, Vcam1, Tek, Flt1, Ramp3, Icam2, Podx1, Cd34, Mcam, Sdpr, Bcam, Tspan13, Fabp5, Vim, Kit1, Lrg1, Dnasel13, Sepp1, Egfl7, Pde2a, Gpihbp1, Sema3g, Ramp2, Cd3001g, C1qtnf9, Sparcl1, Tinagl1, Pdgfb, Ubd, Stab2, Fabp4, Cldn5, Rgs4, Ecscr, Cyyr1, Ly6c1, Magix, Cav1, Gngt2, Myct1, or Tmsb4x;
[0122] c. one or more of Flt4 (Vegfr-3) or Ly6a (Sca-1);
[0123] d. one or more of Pecam1, Cdh5, Cd34, Tek, Lepr, Cxcl12, or Kitl;
[0124] e. one or more of Flt4, Ly6a, Icam1, or Sele;
[0125] f. one or more of Mafb, Cebpb, Xbp1, Nr2f2, Irf8, Ybx1, Ebf1, Sox17, Mxd4, Id1, Meox2, Tshz2, Tcf15, Meox1, Tfpi, Il6stm Angpt4, Gpm6a, Vcam1, Emp1, Cd34, Gnas, Slc9a3r2, Cald1, Mcam, Tspan13, Vim, Cd9, Ptrf, Crip2, Sepp1, Ctsl, Adamts5, Apoe, Igfbp4, Sparc, Col4a2, Col4a1, Serpinh1, Ppic, Cxcl12, Cst3, Sparcl1, C1qtnf9, Tinagl1, Mgll, Kit1, Stab2, Ubd, Gm1673, Abcc9, Rgs4, Ly6c1, Actg1, Tsc22d1, Glu1, Fxyd5, Crip1, Cav1, S100a6, S100a10, lfitm2; or
[0126] g. one or more of Mafb, Cebpb, Xbp1, Nr2f2, Irf8, Ybx1, Ebf1, Sox17, Mxd4, Id1, Meox2, Tshz2, Tcf15, Meox1, Tfpi, Il6stm Angpt4, Gpm6a, Vcam1, Emp1, Cd34, Gnas, Slc9a3r2, Cald1, Mcam, Tspan13, Vim, Cd9, Ptrf, Crip2, Sepp1, Ctsl, Adamts5, Apoe, Igfbp4, Sparc, Col4a2, Col4a1, Serpinh1, Ppic, Cxcl12, Cst3, Sparcl1, C1qtnf9, Tinagl1, Mgll, Kit1, Stab2, Ubd, Gm1673, Abcc9, Rgs4, Ly6c1, Actg1, Tsc22d1, Glu1, Fxyd5, Crip1, Cav1, S100a6, S100a10, or lfitm2.
[0127] In some exemplary embodiments, described herein are methods of detecting a pericyte from a population of stromal cells comprising:
[0128] detecting in a sample the expression or activity of a pericyte gene expression signature,
[0129] wherein detection of the pericyte gene expression signature indicates pericyte s in the sample, and
[0130] wherein the fibroblast gene expression signature comprises
[0131] a. one or more genes in Table 3;
[0132] b. one or more of Hey1, Nr2f2, Tbx2, Ebf1, Ebf2, Foxsl, Id3, Met2c, Cebpb, Zfxh3, Nr4a1, Klf9, Zeb2, Prrx1, Meox2, Junb, Id4, Zfp467, Irf1, Arid5b, Atp1b2, Aoc3, Sncq, Itga7, Aspn, Steap4, Thy1, Filip1I, Parm1, Agtr1a, Olfml2a, Cald1, Ednra, Col18a1, Serpini1, Bcam, Rrad, Pdgfrb, Col5a3, Pde5a, Notch3, Myl1, Tinagl1, Art3, Ngf, Sparcl1, 116, Rarres2, Vstm4, Pgf, Pdgfa, Col4a2, Igfbp7, Col4a1, Fst, Rtn4lrl1, Adamts1, 1134, Gpc6, Cscll, Bgs5, Tagln, Higd1p, Nrip2, Gucv1a3, H2-M9, Des, Olfr558, Lmod1, Gucy1b3, Kcnk3, Pdlim3, Gm13861, Mrvi1, Pln, Gm13889, Ral11a, Cygp;
[0133] c. one or more of Cspg4, Ngfr, Des, Myh11, Acta2, Rgs5, Thy1, Pdgtfrb, Nes, Lepr, Cdh2, Cxcl12, Kitl. Ebf1, Sox4, Dlx5, Mxd4, Smad6, Hey1, Tcf15, Klf2, Mef2c, Atf3, Meox2, Steap4, Olfml2a, H2-M9, Tspan15, Cd24a, Marcks, Fbn1, Tnfrsf21, Slc12a2, Cfh, Cdh2, Vcam1, Sncg, Rasd1, Bcam, Rrad, Prkcdbp, Susd5, Csrrp1, Ptrf, Lama5, Ppp1r12b, Fhl1, Vim, Sdpr, Vtn, Angpt12, Cd44, Htra1, Mfap5, Anxa2, Procr, Igf1, Mgp, Col5a3, col4a2, Vstm4, Col3a1, Col4a1, Emcn, Gas1, Col6a2, Kit1, Sparcl1, Igfbp5, Ntf3, Inhba, Ccdc3, Fst, Timp3, Col1a1, Nbl1, Nov, Ccl11, Lga1s1, Dpt, Ctsl, Col6a3, Cxcl12, Rgs5, Abcc9, Phlda1, Tgs2, Cygb, Marcksl1, Apbb2, Ifitm3, Tmsb4x, Fam162a, Tagln, Pcp411, Crip1, Myl6, Acta2, Pln, Nrip2, Mustn1, Dstn, Mul9, Myh11, S100a6, Tppp3, Enpp2, S100a10, Cav1, Gstm1, Lysmd2, Myl12a, Nnmt, or S100a11; or
[0134] d. one or more of Acta2, Myh11, Mcam, Jag1, or Il6.
[0135] In some exemplary embodiments, the sample is obtained from the blood or bone marrow.
[0136] In some exemplary embodiments, described herein are methods of preparing a mesenchymal stem/stromal cell (MSC) enriched cell population a stromal cell population comprising:
[0137] enriching the population of stromal cells for cells that have an MSC gene signature, wherein the gene signature comprises
[0138] a. one or more genes of Table 1;
[0139] b. one or more of Cebpa, Zeb2, Runx2, Ebf1, Foxc1, Cebpb, Ar, Fos, Id4, Klf6, Irf1, Runx2, Jun, Snaj2, Maf, Zthx4, Id3, Egr1, Junb, Hp, Lpl, Gdpd2, Serping, Dpep1, Grem1, Pappa, Chrdl1, Fbln5, Vcam1, Kng1, H2-Q10, Cdh11, Mme, Tmem176b, Csf1, H2-K1, Serpine2, H2-D1, Tnc, Cdh2, Pdgtra, Esm1, Gas6, Cxcl14, Sfrp4, Wisp2, Agt, Il34, Fst, Fgf7, Il1rn, C2, Igfpb4, Serpina1, Cbln1, Apoe, Ibsp, Igfbp5, Gpx3, Pdzrn4, Rarres2, Vegfa, 1500009L16Rik, Serpina3g, Cyp1b1, Ebt3, Arrdc4, Kng2, Slc26a7, Marc1, Ms4ad4, Wdr86, Serpina3c, Tmem176a, Cldn10, Trt, Gpr88, Nnmt, Gm4951, Cd1d1, Plpp3, or Ackr4; or
[0140] c. Nte5, Vcam1, Eng, Thy1, Ly6a, Grem1, Cspg4, Nes, Runx2, Col1A1, Erg1, Junb, Fosb, Cebpb, Klf6, Nr4a1, Klf2, Atf3, Klf4, Maff, Nfia, Smad6, Hey1, Sp7, Id1, Ifrd1, Trib1, Rrad, Odc1, Actb, Notch2, AlpI, Mmp13, Raph1, Tnfsf11, Cxcl1, Adamts1, Cc17, Serpine1, Cc12, Apod, Cbln1, Pam, Col8a1, Wif1, Olfml3, Gdf10, Cyr61, Nog, Angpt4, Metrn1, Trabd2b, Adamts5, Igfbp4, Cxcl12, Igfbp5, Lepr, Cxcl12, Kit1, Grem1, or Angpt1;
[0141] and wherein the MCS optionally does not express one or more of Thy1, Ly6a (Sca-1), NG2 (Cspg4) or Nestin (Nes).
[0142] In some exemplary embodiments, described herein are methods of preparing an osteolineage (OLC) enriched cell population a stromal cell population comprising:
[0143] enriching the population of stromal cells for cells that have an OLC gene signature, wherein the gene signature comprises
[0144] a. one or more genes of Table 2;
[0145] b. one or more of Vdr, Satb2, Sp7, Runx2, Tbx2, Zeb2, Dlx5, Dlx6, Zfhx4, Hey1, Irx5, Id3, Mxd4, Mef2c, Esr1, Maf, Smad6, Sox4, Cebpb, Meis3, Mmp13, Tnc, Cfh, Alp1, Lrp4, Cdh11, Casm1, Cdh2, Slit2, Bmp3, Cdh15, Fat3, Pard6g, Litr, Cp, Ptprd, Olfml3 Fign, Cd63, Fap, Dmp1, Angpt4, Chn1, Ibsp, Wisp1, Wif1, Metrn1, Vldlr, Podnl1, Col22a1, Ndnf, Mmp14, Pgf, Lox11, Mfap2, Srpx2, Agt, Tmem59, Vstm4, Col8a1, Cxcl12, Bglap2, Car3, Kcnk2, Slc36a2, Ifitm5, Hpgd, Limch1, Gm44029, Hvcn1, Tnfrsf19, Col13a1, Fam78b, Gja1, Cnn2, Ppfibp2, Cldn10, Dapk2, Tmp1, Bglap3, or Ramp1;
[0146] c. one or more of Runx2, Sp7, Grem1, Lepr, Cxcl12, Kit1, Bglap, Cd200, Spp1, Sox9, Id4, Ebf1, Ebf3, Cebpa, Foxc1, Snai2, Maf, Runx1, Thra, Plagl1, Mafb, Vdr, Cebpb, Tcf712, Bhlhe40, Snai1, Creb311, Zbtb7c, Gm22, Tcf7, Nr4a2, Atf3, Prrx2, Fbln5, H2-K1, H2-D1, Hp, Fstl1, Tmem176b, B2m, Pappa, Dpep1, Islr, Vcam1, Lepr, Mmp13, Cd200, Itgb5, Lifr, Postn, Slit2, Timp1, Lrp4, Tspan6, Ctsc, Cpz, Prss35, Tmeml19, Lox, Cryab, Pdzd2, Fyn, Gucala, Rerg, Sema4d, Vcam, Aspn, Slc20a2, Plat, Fmod, Fn1, Aebop1, Angpt12, Prkcdbp, Prelp, Cxcl12, Igfbp4, Cxcl14, Gas6, Apoe, Igfbp7, Col8a1, Serping1, Igfbp5, Igf1, Kit1, Spp1, Serpine2, Fam20c, Bmp8a, Dmp1, Ibsp, Pros1, Srpx2, Mgll, Timp3, Col11a2, Cgref1, Col1a1, Cthrc1, Sparc, Col22a1, Col5a2, Fkbp11, Col3a1, Ptn, Col6a2, Tnn, Npy, Col6a1, Omd, Dcn, Tgfbi, Col6a3, or Acan;
[0147] d. one or more of Runx2, Sp7, Grem1, Bglap, Cxcl12, Kit1, Osr1, Foxd1, Sox5, Osr2, Erg, Nfatc2, Mef2c, Sp7, Zbtb7c, Runx2, Snai2, Zfhx4, Dlx6, Meox1, Prrx1, Scx, Hic1, Peg3, Etv5, Ltbp1, Tspan8, Emb, Slc16a2, Tspan13, Creb5, Scara3, Prg4, Clu, plxdc1, Cdon, Fbln7, Ntn1, Nt5e, Thbd, Pth1r, Alp1, Cadm1, Cd200, Susd5, Rarres1, Ptprz1, Plat, Tnfrsf11b, Lpar3, Cspg4, Postn, S1pr1, Enah, Aspn, Cald1, Wnt5b, Adam12, Tnc, Pak1, Lpl, Mfap4, Cntfr, Fbln2, Fgl2, Gpc3, Ogn, Slc1a3, Spock2, Fbln5, Rgp1, Smoc1, C5ar1, Fzd9, Npr2, Fzd10, Cxcl14, Wif1, Arsi, Col12a1, Mgp, Itgbl1, Igf1, Smoc2, Spon2, Fst, Sbsn, Gas1, Sod3, Mmp3, Cilp, Pla2g2e, Fam213a, Acp5, Col15a1, Bglap2, Bglap3, Ibsp, Thbs4, Frzb, Bmp8a, Dkk1, Scube1, Chad, Spp1, Col11a2, Ptn, Ostn, Tnn, Mmp14, Gpx3, Cthrc1, Cxcl12, Prss12, Rbln1, Penk, Col8a1, Vipr2, Apod, Cpxm2, Rarres2, C4b, Sparcl1, Ly6e, R3hdml, Mia, Myoc, Nrtn, Pdzrn4, Spp1, Pth1r, Sox9, Acan, or Mmp13;
[0148] and wherein the OLC optionally expresses Bglap and Spp1.
[0149] In some exemplary embodiments, described herein are methods of preparing a chondrocyte enriched cell population a stromal cell population comprising:
[0150] enriching the population of stromal cells for cells that have a chondrocyte gene signature, wherein the gene signature comprises
[0151] a. one or more genes of Table 4;
[0152] b. one or more of Barx1, Pitx1, Foxd1, Osr2, Tbx18, Runx3, Osr2, Tbx18, Runx3, Peg3, Bhlhe41, Batf3, Plagl1, Sp7, Sox8, Lef1, Shox2, Zbtb20, Foxa3, Mef2c, Egr2, Pax1, Runx2, Prg4, Cpe, Mfi2, Scara3, Cpm, Chst1, Unc5q, Col11a1, Slc2a5, Slc26a2, Cspg4, Prc1, Fgfr3, Nid2, Spon1, Slc40a, Efemp1, Susd5, Fxyd3, Alp1, Corin, Tpd5211, Sema3d, F5, Slc38a3, Cytl1, Rbp4, Vit, Clip, Fam19a5, Col9a3, Col9a1, Col9a2, Matn3, Hapln1, Sfrp5, Notum, Mia, lhh, Mgst2, Rarres1, Gpld1, Il17b, Bglap, 1500015010Rik, Itm2a, Crispld1, Meg3, Cenpp, Fxyd2, 3110079O15Rik, Lect1, Papss2, SAyt8, Stmn1, Lockd, Chil1, Calml3, Ncmap, Serpina1d, Serpina 1b, Serpina 1c, Sic6a1, or Serpina1a;
[0153] c. one or more of Sox9, Col11a2, Acan, or Col2a1;
[0154] d. one or more of Runx2, Ihh, Mef2c, or Col10a1;
[0155] e. one or more of Grem1, Runx2, Sp7, Alp1, or Spp1;
[0156] f. one or more of Ihh, Pth1r, Mef2c, Col10a1, Ibsp, Mmp13, Grem1; or
[0157] g. one or more of Prg4, Gas1, Clu, Dcn, Cilp, Scara3, Cytl1, Igfbp7, Cilp2, Cpe, Sod3, Cd81, Abi3 bp, Creb5, Gsn, Crip2, Vit, Fhl1, Pam, Cd9, Prrx1, Vim, Col11a2, Col9a1, Col2a1, Col9a2, Col27a1, Col9a3, Hapln1, Acan, Matn3, Col11a1, Pth1r, Mia, Pcolce2, Chst11, Epyc, Serpinh1, Gnb211, Fscn1, Pla2g5, Rcn1, Sox9, Bglap, Sp7, Fn1, Ube2s, Hmgb1, Ckap4, Clec11a, 117b, Ybx1, Tmem97, Rbm3, Slc26a2, C1qtnf3, Fkbp2, Prelp, Apoe, Cst3, Spon1, Olfml3, Wif1, Lef1, Notum, Emb, Col1a2, Sfrp5, Omd, Ctsd, Zbtb20, Islr, B2m, Ly6e, Alp1, Spp1, Chad, Timp3, Mef2c, Sparc, Ihh, Junb, Txnip, Rarres1, Scrg1, Sema3d, Colgalt2, Serinc5, Slc38a2, Ddit41, Egr1, Runx2, or Cxcl12.
[0158] In some exemplary embodiments, described herein are methods of preparing a fibroblast enriched cell population a stromal cell population comprising:
[0159] enriching the population of stromal cells for cells that have a fibroblast gene signature, wherein the gene signature comprises
[0160] a. one or more genes of Table 5;
[0161] b. one or more of Scx, Barx1, Trps1, Hoxd9, Pitx1, Prrx1, Rora, Prrx2, Meox2, Ebf2, Osr2, Ebf1, Dlx3, Zfhx2, Meox1, Etv4, Mkx, Dcn, Clu, Abi3 bp, Prelp, Lox, Tnxb, Col3a1, Vcan, Vi, Mfap5, Col14a1, Aspn, Pdpn, Pdgfra, F13a1, Clic5, Gpr1, Emilin2, Has1, Mtap4, Gas2, Ntng1, Serpinf1, Postn, Angpt17, Clip2, Clip, Sod3, Slurp1, Spp1, Clec3b, Igfbp6, Thds4, Dpt, Gsn, Fndc1, Pla1a, Adamts15, Figf, Htra4, Rspo2, Mstn, Ptx4, Spock3, Cpxm2, Itgbl1, Anxa8, Fxyd5, Fxyd6, Egln3, Ptgis, I133, Fgf9, Tppp3, Crlp1, Mustn1, Celf2, Tmod2, Ly6a, Fez1, Lysmd2, Pcsk6, 2210407C18Rik, Aldh1a3, Rtn1, Rab37, Lnmd, Chod1, Fam159b, Prph, or Insc;
[0162] c. Fibronectin-1 (Fn1), Fibroblast Specific Protein-1 (S100a4), Col1a1, Col1a2, Lum, Col22a1, or Twist2;
[0163] d. one or more of Sox9, Acan, and Col2a1;
[0164] e. Cd34, Ly6a, Pdgfra, Thy1 and Cd44, and not Cdh5, or Acta2;
[0165] f. one or more of Sox-9, Scleraxis (Scx), Spp1, Cspg4, CD73 (Nt5e), and Cartilage Intermediate Layer Protein (Cilp); or
[0166] g. one or more of S1004a, Dcn, Sema3c, or Cxcl12.
[0167] In some exemplary embodiments, described herein are methods of preparing a bone marrow derived endothelial cell (BMEC) enriched cell population a stromal cell population comprising:
[0168] enriching the population of stromal cells for cells that have a BMEC gene signature, wherein the gene signature comprises
[0169] a. one or more genes of Table 6;
[0170] b. one or more of Mafb, Pparg, Nr2f2, Irf8, Ets1, Sox17, Sox11, Bcl6b, Gata2, Tcf15, Meox1, Sox7, Tshz2, Tfpi, Gpm6a, Ackr1, Mrc1, Stab1, Vcam1, Tek, Flt1, Ramp3, Icam2, Podx1, Cd34, Mcam, Sdpr, Bcam, Tspan13, Fabp5, Vim, Kit1, Lrg1, Dnasel13, Sepp1, Egfl7, Pde2a, Gpihbp1, Sema3g, Ramp2, Cd3001g, C1qtnf9, Sparcl1, Tinagl1, Pdgfb, Ubd, Stab2, Fabp4, Cldn5, Rgs4, Ecscr, Cyyr1, Ly6c1, Magix, Cav1, Gngt2, Myct1, or Tmsb4x;
[0171] c. one or more of Flt4 (Vegfr-3) or Ly6a (Sca-1);
[0172] d. one or more of Pecam1, Cdh5, Cd34, Tek, Lepr, Cxcl12, or Kitl;
[0173] e. one or more of Flt4, Ly6a, Icam1, or Sele;
[0174] f. one or more of Mafb, Cebpb, Xbp1, Nr2f2, Irf8, Ybx1, Ebf1, Sox17, Mxd4, Id1, Meox2, Tshz2, Tcf15, Meox1, Tfpi, Il6stm Angpt4, Gpm6a, Vcam1, Emp1, Cd34, Gnas, Slc9a3r2, Cald1, Mcam, Tspan13, Vim, Cd9, Ptrf, Crip2, Sepp1, Ctsl, Adamts5, Apoe, Igfbp4, Sparc, Col4a2, Col4a1, Serpinh1, Ppic, Cxcl12, Cst3, Sparcl1, C1qtnf9, Tinagl1, Mgll, Kit1, Stab2, Ubd, Gm1673, Abcc9, Rgs4, Ly6c1, Actg1, Tsc22d1, Glu1, Fxyd5, Crip1, Cav1, S100a6, S100a10, lfitm2; or
[0175] g. one or more of Mafb, Cebpb, Xbp1, Nr2f2, Irf8, Ybx1, Ebf1, Sox17, Mxd4, Id1, Meox2, Tshz2, Tcf15, Meox1, Tfpi, Il6stm Angpt4, Gpm6a, Vcam1, Emp1, Cd34, Gnas, Slc9a3r2, Cald1, Mcam, Tspan13, Vim, Cd9, Ptrf, Crip2, Sepp1, Ctsl, Adamts5, Apoe, Igfbp4, Sparc, Col4a2, Col4a1, Serpinh1, Ppic, Cxcl12, Cst3, Sparcl1, C1qtnf9, Tinagl1, Mgll, Kit1, Stab2, Ubd, Gm1673, Abcc9, Rgs4, Ly6c1, Actg1, Tsc22d1, Glu1, Fxyd5, Crip1, Cav1, S100a6, S100a10, or lfitm2.
[0176] In some exemplary embodiments, described herein are methods of preparing a pericyte enriched cell population a stromal cell population comprising:
[0177] enriching the population of stromal cells for cells that have a pericyte gene signature, wherein the gene signature comprises
[0178] a. one or more genes in Table 3;
[0179] b. one or more of Hey1, Nr2f2, Tbx2, Ebf1, Ebf2, Foxsl, Id3, Met2c, Cebpb, Zfxh3, Nr4a1, Klf9, Zeb2, Prrx1, Meox2, Junb, Id4, Zfp467, Irf1, Arid5b, Atp1b2, Aoc3, Sncq, Itga7, Aspn, Steap4, Thy1, Filip1I, Parm1, Agtr1a, Olfml2a, Cald1, Ednra, Col18a1, Serpini1, Bcam, Rrad, Pdgfrb, Col5a3, Pde5a, Notch3, Myl1, Tinagl1, Art3, Ngf, Sparcl1, 116, Rarres2, Vstm4, Pgf, Pdgfa, Col4a2, Igfbp7, Col4a1, Fst, Rtn4lrl1, Adamts1, 1134, Gpc6, Cscll, Bgs5, Tagln, Higd1p, Nrip2, Gucv1a3, H2-M9, Des, Olfr558, Lmod1, Gucy1b3, Kcnk3, Pdlim3, Gm13861, Mrvi1, Pln, Gm13889, Ral11a, Cygp;
[0180] c. one or more of Cspg4, Ngfr, Des, Myh11, Acta2, Rgs5, Thy1, Pdgtfrb, Nes, Lepr, Cdh2, Cxcl12, Kitl. Ebf1, Sox4, Dlx5, Mxd4, Smad6, Hey1, Tcf15, Klf2, Mef2c, Atf3, Meox2, Steap4, Olfml2a, H2-M9, Tspan15, Cd24a, Marcks, Fbn1, Tnfrsf21, Slc12a2, Cfh, Cdh2, Vcam1, Sncg, Rasd1, Bcam, Rrad, Prkcdbp, Susd5, Csrrp1, Ptrf, Lama5, Ppp1r12b, Fhl1, Vim, Sdpr, Vtn, Angpt12, Cd44, Htra1, Mfap5, Anxa2, Procr, Igf1, Mgp, Col5a3, Col4a2, Vstm4, Col3a1, Col4a1, Emcn, Gas1, Col6a2, Kit1, Sparcl1, Igfbp5, Ntf3, Inhba, Ccdc3, Fst, Timp3, Col1a1, Nbl1, Nov, Ccl11, Lga1s1, Dpt, Ctsl, Col6a3, Cxcl12, Rgs5, Abcc9, Phlda1, Tgs2, Cygb, Marcksl1, Apbb2, Ifitm3, Tmsb4x, Fam162a, Tagln, Pcp411, Crip1, Myl6, Acta2, Pln, Nrip2, Mustn1, Dstn, Mul9, Myh11, S100a6, Tppp3, Enpp2, S100a10, Cav1, Gstm1, Lysmd2, Myl12a, Nnmt, or S100a11; or
[0181] d. one or more of Acta2, Myh11, Mcam, Jag1, or Il6.
[0182] In some exemplary embodiments, enriching the population of stromal cells comprises determining an MSC, an OLC, a chondrocyte, a BMEC, a fibroblast, a pericyte gene signature, or a combination thereof, wherein the gene signature(s) are determined by single cell RNA sequencing.
[0183] In some exemplary embodiments, described herein are methods of detecting a hematological disease comprising:
[0184] a. determining a fraction of: [0185] i. OLC-1 cells, [0186] ii. OLC-2 cells, [0187] iii. bone marrow derived endothelial cells (BMECs); [0188] iv. chondrocytes; [0189] v. fibroblasts; and
[0190] b. diagnosing the neurodegenerative disease in the subject when [0191] i. the relative proportion of OLC-1 cells to OLC-2 cells is changed as compared to a suitable control; [0192] ii. the fraction of OLC-1 cells is increased as compared to a suitable control; [0193] iii. the fraction of OLC-2 cells is decreased as compared to a suitable control; [0194] iv. the relative proportion of bone marrow derived endothelial fractions is changed as compared to a suitable control; [0195] v. a fraction of sinusoidal BMECs is decreased as compared to a suitable control; [0196] vi. a fraction of arterial BMECs is increased as compared to a suitable control; [0197] vii. the relative proportion of chondrocyte fractions is changed as compared to a suitable control; [0198] viii. a chondrocyte hypertorphic cell subtype is increased as compared to a suitable control; [0199] ix. a chondrocyte progenitor cell subtype is decreased as compared to a suitable control; [0200] x. a fibroblast subtype is changed as compared to a suitable control; [0201] xi. a fibroblast subtype-3 is decreased; as compared to a suitable control [0202] xii. a fibroblast subtype-4 is increased as compared to a suitable control; [0203] xiii. the relative proportion of MSC fractions is changed as compared to a suitable control; [0204] ixx. a MSC-2 fraction is increased as compared to a suitable control; [0205] xx. a MSC-3 fraction is decreased as compared to a suitable control; [0206] xxi. a MSC-4 fraction is decreased as compared to a suitable control; or [0207] xxii. a combination thereof.
[0208] In some exemplary embodiments, the hematological disease is a blood cancer. In some exemplary embodiments, the blood cancer is a leukemia. In some exemplary embodiments, the blood cancer is acute lymphocytic leukemia, acute myeloid leukemia, chronic lymphocytic leukemia, chronic myeloid leukemia, hairy cell leukemia, myelodysplastic syndrome, acute promyelocytic leukemia, or myeloproliferative neoplasm.
[0209] In some exemplary embodiments, described herein are methods of treating a hematological disease in a subject in need thereof, comprising: detecting a hematological disease as in a subject according a method of detecting a hematological disease described herein and administering an effective amount of a hematological disease treatment to the subject.
[0210] These and other aspects, objects, features, and advantages of the example embodiments will become apparent to those having ordinary skill in the art upon consideration of the following detailed description of example embodiments.
BRIEF DESCRIPTION OF THE DRAWINGS
[0211] An understanding of the features and advantages of the present invention will be obtained by reference to the following detailed description that sets forth illustrative embodiments, in which the principles of the invention may be utilized, and the accompanying drawings of which:
[0212] FIGS. 1A-1H--FIG. 1A) Overview of Single Cell analysis. Bone marrow (BM) cells were isolated, hematopoietic cells were filtered out by cell sorting (FACS). Single cell transcriptomes were generated with 10.times. GemCode.TM. platform and analyzed. FIG. 1B) BM stroma cells clusters visualized with t-SNE maps. FIG. 1C) BM stroma maps (as in FIG. 1B) with expression (as shown) of six genes that are broadly characteristic to six major cell types. FIG. 1D) Relative expression of top differential genes in clusters--single cell resolution (largest clusters down-sampled for visibility). Right--characteristic genes. Top bar and vertical lines indicate clusters (FIG. 1B). FIG. 1E) Number of cells in each cluster. FIG. 1F) Correlation (Pearson) of average gene expression among clusters (marked by side bars). FIG. 1G) Cluster graph abstraction (AGA) from Scanpy package. FIG. 1H) Single-cell diffusion map visualization (force-directed layout) of strongly connected clusters (from FIGS. 1G-F)).
[0213] FIGS. 2A-2K--FIG. 2A) Gating strategy for isolation of bone marrow stroma. FIG. 2B) RNA-seq data quality measures (UMI and genes in cells). FIG. 2C) t-SNE map of the bone marrow (BM) cells (hematopoietic and non-hematopoietic) (obtained as in FIG. 2A). FIG. 2D) As in FIG. 2C but with hematopoietic clusters markers avg. expression marked in dark gray. FIG. 2E) As in FIG. 2C but with colors marking samples. FIG. 2F) All cluster single cell diffusion map visualization (force-directed layout, clusters indicated by shades of gray). FIG. 2G) (left) t-SNEs (as in FIG. 1B) of select genes from MSC and EC (gray scale--transcript level in TP10K). (right) corresponding distributions in logarithmic scale. FIG. 2H) Number of cells belonging to major cell types. FIG. 2I) Cell proliferation status marked on t-SNE maps of BM stroma (red--high expression of cell-cycle genes). FIGS. 2J-2K) FACS analysis of MSC and EC clusters.
[0214] FIGS. 3A-3F--FIG. 3A) MSC (cluster-1), location in BM stroma map. FIG. 3B) (left) Expression maps of select MSC genes; (right) Expression distributions in logarithmic scale (violin plots by clusters). FIG. 3C) Top MSC differential genes (relative transcription level, averaged per cluster) in five gene categories: characteristic--Known, transcription factors (TFs), found in cell membrane (Surface), Secreted, and Other. FIG. 3D) MSC sub-clusters on diffusion map (as in FIG. 1H). FIG. 3E) MSC sub-clusters (zoomed-in original t-SNE map. FIG. 3F) Expression distributions of select genes in MSC sub-clusters (linear scale, censored).
[0215] FIGS. 4A-4F--FIG. 4A) t-SNE maps of bone marrow stroma with color coded transcription levels (TP10K) of additional characteristic genes used by various research groups for labeling mesenchymal stem cell populations. FIG. 4B) as in FIG. 4A, additional genes. FIG. 4C) Average expression (ln(TP10K+1)) in all BM stroma clusters of top secreted genes that were also differentially expressed in MSCs (cluster 1). D) MSC sub-clusters diffusion map (2D projection, eigenvectors 1 and 3). FIG. 4E) Top differentially expressed genes among MSC sub-clusters (single cell view, relative expression z-score). FIG. 4F) Expression distributions of select genes in MSC sub-clusters (linear scale, censored).
[0216] FIGS. 5A-5M--FIG. 5A) OLC-1 (cluster 7) and OLC-2 (cluster 8) locations in BM stroma map. FIG. 5B) expression maps of characteristic OLC-1 genes. FIG. 5C) Top OLC-1 differential genes (relative transcription level, averaged per cluster). FIG. 5D) OLC-1,2 sub-clusters on diffusion map (as in FIG. 1H). FIG. 5E) OLC-1,2 sub-clusters (zoomed-in original t-SNE map). FIGS. 5F-5J) Expression distributions of select genes in OLC-1 sub-clusters (linear scale, censored). FIG. 5K) OLC-2 sub-clusters (zoomed-in original t-SNE map). FIGS. 51-5M) Expression distributions of select genes in OLC-2 sub-clusters (linear scale, censored).
[0217] FIGS. 6A-6E--FIG. 6A) Expression distributions of select genes in logarithmic scale (violin plots, clusters identity indicated on x-axis and by color as in main FIG. 1B) FIG. 6B). Expression of select genes marked on t-SNE maps of BM stroma. FIG. 6C) Top differentially expressed genes among OLC (cluster 7) sub-clusters (single cell view, relative expression z-score).
[0218] FIG. 6D) Top differentially expressed genes among cluster 8 sub-clusters (single cell view, relative expression z-score). FIG. 6E) Expression distributions of select genes in cluster 8 sub-clusters (linear scale, censored).
[0219] FIGS. 7A-7G--FIG. 7A) Five chondroid clusters in BM stroma map. FIG. 7B) (left) Expression maps of characteristic chondrocyte genes; (right) expression distributions in logarithmic scale. FIG. 7C) Chondroid clusters on diffusion map. FIG. 7D) Five fibroblastic clusters in BM stroma map. FIG. 7E) (left) Expression maps of fibroblast characteristic genes; (right) expression distributions in logarithmic scale. FIG. 7F) Fibroblastic clusters on diffusion map. FIG. 7G) Expression distribution of Cxcl12 among fibroblastic clusters (logarithmic scale).
[0220] FIGS. 8A-8F--FIG. 8A) Top chondrocyte differential genes (relative transcription level, averaged per cluster) in five categories: known, transcription factors (TFs), cell surface, secreted, and other. FIG. 8B) Expression maps of select chondrocyte related genes. FIG. 8C) Top differentially expressed genes among chondrocyte clusters (single cell view, relative expression z-score). FIG. 8D) As in A but for fibroblast clusters. FIGS. 8E-8F) Expression maps and expression distributions (logarithmic scale) of select genes related to fibroblastic clusters.
[0221] FIGS. 9A-9E--FIG. 9A) Three endothelial cell (EC) clusters in BM stroma map. FIG. 9B) (left) Expression maps of select characteristic EC genes; (right) expression distributions in logarithmic scale. FIG. 9C) Top EC differential genes (relative transcription level, averaged per cluster). FIG. 9D) EC clusters diffusion map on force-directed layout. FIG. 9E) Expression distributions of select genes in EC clusters (linear scale, censored).
[0222] FIGS. 10A-10C--FIG. 10A) (left) expression maps of select characteristic EC genes; (right) expression distributions in logarithmic scale. FIG. 10B). Top differentially expressed genes among three EC clusters (single cell view, relative expression z-score). FIG. 10C) Expression distributions in logarithmic scale of Tek.
[0223] FIGS. 11A-11F--FIG. 11A) Pericyte cluster in BM stroma map. FIG. 11B) (left) Expression maps of characteristic pericyte genes; (right) expression distributions in logarithmic scale. FIG. 11C) Top pericyte differential genes (relative transcription level, averaged per cluster). FIG. 11D) Pericyte sub-clusters (zoomed-in original t-SNE map. FIG. 11E) Average expression (ln(TP10K+1)) of select hematopoietic niche genes. Three pericyte sub-clusters indicated. FIG. 11F) Expression distributions of select genes in pericyte sub-clusters (linear scale, censored).
[0224] FIGS. 12A-12C--FIG. 12A) (left) expression maps of select characteristic pericyte genes; (right) expression distributions in logarithmic scale. FIG. 12B) Top differentially expressed genes among pericyte sub-clusters (single cell view, relative expression z-score). FIG. 12C) As in FIG. 12A, for additional genes.
[0225] FIGS. 13A-13K-Control and Leukemic BM stroma t-SNE map--FIG. 13A) clusters assignment (colors as in FIG. 1B), FIG. 13B) Control (light grey) and Leukemic (dark grey) cells colored. FIG. 13C) Changes of BM stroma relative cluster sizes under leukemia. Bars--average percentage of cells in cluster. Error bars-95% confidence interval of the binomial fit mean. FIG. 13D) As in FIG. 13C but for MSC and OLC sub-clusters. FIG. 13E) Average transcription of Grem1 gene in MSC and OLC sub-clusters. FIG. 13F) Changes in average transcription of BM niche modelling genes (MSC and OLC-1). Error bars for standard errors of mean. FIG. 13G) As in FIG. 13F for but for hypoxia factor Hif-2a (Epasl). FIG. 131H) As in FIG. 13F but for hematopoietic regulators (MSC, OLC-1, sBMEC). I) As in FIG. 13G but comparing changing expression of Cxcl2 and Kitl in sBMEC, aBMEC, progenitor EC (cluster 11) and pericytes. FIG. 13J) As in FIG. 13G but looking at changes of Cxcl12, Kit1, and Angpt1 in MSC-like fibroblasts (cluster 9). FIG. 13K) Summary plot. Each horizontal rectangle corresponds to a cell type. Sub-cluster names next to cell-type symbolic representations. Circles mark expression levels of key niche factors (Kitl and Cxcl12). Dark triangles indicate changes in size of clusters (sub-clusters) under Leukemia. Colored triangles indicate changes in relative expression under leukemia. `C`-mark next to triangles indicate cluster level change (i.e. refers to all cells in a rectangle).
[0226] FIGS. 14A-14J--FIG. 14A) Spleen weight of leukemic mice used for single-cell RNA-sequencing experiments. Spleen weights for matched controls (n=5) and leukemic mice (n=4). (student t-test, *p<0.05). FIG. 14B) Donor chimerism and leukemic blast appearance. FIG. 14C) Frequency of myeloid cells in peripheral blood from control and leukemic mice characterized by FACS analysis (FIG. 14B). FIG. 14D) t-SNE map of leukemic and control data (as in FIGS. 7A-7B), samples colored. FIG. 14E) Relative cluster sizes of leukemic and control samples in log scale. Bars for mean percentage of cells. Error bars for 95% confidence interval of the mean estimate. FIG. 14F) Significant, differentially transcribed, secreted genes (adjusted p-value <0.05) up- (red) and down- (blue) regulated in leukemia). Dot size proportional to absolute value of the base-2 log of fold-change. FIG. 14G) As in F but for cell surface expressed genes. FIG. 14H) As in F but for transcription factor coding genes. FIG. 14I) Average transcription of Wisp2 gene in MSC and OLC sub-clusters. FIG. 14J) Changes in average transcription of Hifla gene in MSC (cluster 1) and OLC-1 (cluster 7). Error bars for standard errors
[0227] The figures herein are for illustrative purposes only and are not necessarily drawn to scale.
DETAILED DESCRIPTION OF THE EXAMPLE EMBODIMENTS
General Definitions
[0228] Unless defined otherwise, technical and scientific terms used herein have the same meaning as commonly understood by one of ordinary skill in the art to which this disclosure pertains. Definitions of common terms and techniques in molecular biology may be found in Molecular Cloning: A Laboratory Manual, 2.sup.nd edition (1989) (Sambrook, Fritsch, and Maniatis); Molecular Cloning: A Laboratory Manual, 4.sup.th edition (2012) (Green and Sambrook); Current Protocols in Molecular Biology (1987) (F. M. Ausubel et al. eds.); the series Methods in Enzymology (Academic Press, Inc.): PCR 2: A Practical Approach (1995) (M. J. MacPherson, B. D. Hames, and G. R. Taylor eds.): Antibodies, A Laboratory Manual (1988) (Harlow and Lane, eds.): Antibodies A Laboraotry Manual, 2.sup.nd edition 2013 (E. A. Greenfield ed.); Animal Cell Culture (1987) (R. I. Freshney, ed.); Benjamin Lewin, Genes IX, published by Jones and Bartlet, 2008 (ISBN 0763752223); Kendrew et al. (eds.), The Encyclopedia of Molecular Biology, published by Blackwell Science Ltd., 1994 (ISBN 0632021829); Robert A. Meyers (ed.), Molecular Biology and Biotechnology: a Comprehensive Desk Reference, published by VCH Publishers, Inc., 1995 (ISBN 9780471185710); Singleton et al., Dictionary of Microbiology and Molecular Biology 2nd ed., J. Wiley & Sons (New York, N.Y. 1994), March, Advanced Organic Chemistry Reactions, Mechanisms and Structure 4th ed., John Wiley & Sons (New York, N.Y. 1992); and Marten H. Hofker and Jan van Deursen, Transgenic Mouse Methods and Protocols, 2.sup.nd edition (2011).
[0229] As used herein, the singular forms "a", "an", and "the" include both singular and plural referents unless the context clearly dictates otherwise.
[0230] The term "optional" or "optionally" means that the subsequent described event, circumstance or substituent may or may not occur, and that the description includes instances where the event or circumstance occurs and instances where it does not.
[0231] The recitation of numerical ranges by endpoints includes all numbers and fractions subsumed within the respective ranges, as well as the recited endpoints.
[0232] The terms "about" or "approximately" as used herein when referring to a measurable value such as a parameter, an amount, a temporal duration, and the like, are meant to encompass variations of and from the specified value, such as variations of +/-20%, +/-10% or less, +/-5% or less, +/-1% or less, and +/-0.1% or less of and from the specified value, insofar such variations are appropriate to perform in the disclosed invention. It is to be understood that the value to which the modifier "about" or "approximately" refers is itself also specifically, and preferably, disclosed.
[0233] As used herein, a "biological sample" may contain whole cells and/or live cells and/or cell debris. The biological sample may contain (or be derived from) a "bodily fluid". The present invention encompasses embodiments wherein the bodily fluid is selected from amniotic fluid, aqueous humour, vitreous humour, bile, blood serum, breast milk, cerebrospinal fluid, cerumen (earwax), chyle, chyme, endolymph, perilymph, exudates, feces, female ejaculate, gastric acid, gastric juice, lymph, mucus (including nasal drainage and phlegm), pericardial fluid, peritoneal fluid, pleural fluid, pus, rheum, saliva, sebum (skin oil), semen, sputum, synovial fluid, sweat, tears, urine, vaginal secretion, vomit and mixtures of one or more thereof. Biological samples include cell cultures, bodily fluids, cell cultures from bodily fluids. Bodily fluids may be obtained from a mammal organism, for example by puncture, or other collecting or sampling procedures.
[0234] The terms "subject," "individual," and "patient" are used interchangeably herein to refer to a vertebrate, preferably a mammal, more preferably a human. Mammals include, but are not limited to, murines, simians, humans, farm animals, sport animals, and pets. Tissues, cells and their progeny of a biological entity obtained in vivo or cultured in vitro are also encompassed.
[0235] As used herein, the singular forms "a", "an", and "the" include both singular and plural referents unless the context clearly dictates otherwise.
[0236] The terms "comprising", "comprises" and "comprised of" as used herein are synonymous with "including", "includes" or "containing", "contains", and are inclusive or open-ended and do not exclude additional, non-recited members, elements or method steps. It will be appreciated that the terms "comprising", "comprises" and "comprised of" as used herein comprise the terms "consisting of", "consists" and "consists of", as well as the terms "consisting essentially of", "consists essentially" and "consists essentially of". It is noted that in this disclosure and particularly in the claims and/or paragraphs, terms such as "comprises", "comprised", "comprising" and the like can have the meaning attributed to it in U. S. Patent law; e.g., they can mean "includes", "included", "including", and the like; and that terms such as "consisting essentially of" and "consists essentially of" have the meaning ascribed to them in U. S. Patent law, e.g., they allow for elements not explicitly recited, but exclude elements that are found in the prior art or that affect a basic or novel characteristic of the invention.
[0237] The recitation of numerical ranges by endpoints includes all numbers and fractions subsumed within the respective ranges, as well as the recited endpoints.
[0238] Whereas the terms "one or more" or "at least one" or "X or more", where X is a number and understand to mean X or increases one by one of X, such as one or more or at least one member(s) or "X or more" of a group of members, is clear per se, by means of further exemplification, the term encompasses inter alia a reference to any one of said members, or to any two or more of said members, such as, e.g., any >3, >4, >5, >6 or >7 etc. of said members, and up to all said members.
[0239] Various embodiments are described hereinafter. It should be noted that the specific embodiments are not intended as an exhaustive description or as a limitation to the broader aspects discussed herein. One aspect described in conjunction with a particular embodiment is not necessarily limited to that embodiment and can be practiced with any other embodiment(s). Reference throughout this specification to "one embodiment", "an embodiment," "an example embodiment," means that a particular feature, structure or characteristic described in connection with the embodiment is included in at least one embodiment of the present invention. Thus, appearances of the phrases "in one embodiment," "in an embodiment," or "an example embodiment" in various places throughout this specification are not necessarily all referring to the same embodiment, but may. Furthermore, the particular features, structures or characteristics may be combined in any suitable manner, as would be apparent to a person skilled in the art from this disclosure, in one or more embodiments. Furthermore, while some embodiments described herein include some but not other features included in other embodiments, combinations of features of different embodiments are meant to be within the scope of the invention. For example, in the appended claims, any of the claimed embodiments can be used in any combination.
[0240] All publications, published patent documents, and patent applications cited herein are hereby incorporated by reference to the same extent as though each individual publication, published patent document, or patent application was specifically and individually indicated as being incorporated by reference.
Overview
[0241] Embodiments disclosed herein provide various signatures, profiles, programs, and/or modules, that can be unique bone marrow stromal cell types, subtypes, states, and remodeling of the bone marrow microenvironment. The various signatures, profiles, programs, and/or modules unique bone marrow stromal cell types, subtypes, states, and remodeling of the bone marrow microenvironment can be used to identify and characterize specific cell populations. Thus, also described herein are bone marrow stromal cell populations that can be uniquely characterized, isolated, enriched for, and/or engineered to have and/or express a cell-state and/or cell type/subtype specific signature, profile, module, and/or program. Also described herein are isolated, enriched, modulated and/or engineered bone marrow stromal cell populations. The modulated and engineered cells can be modulated using a suitable modulating agent to express specific signatures, profiles, programs, and/or modules(s), such as those described here unique to any one of Clusters 1-17, or a subtype thereof, where the initial cell type or state of the cell before modulation or engineering is different than after exposure to the modulating agent.
[0242] Also described herein are methods of detecting the stromal cell signatures, profiles, programs, and/or modules described herein. The methods of detecting the stromal cell signatures can be used in methods of diagnosing and treatment. In some embodiments, the methods can include detecting one or more stromal cell signatures, profiles, programs, and/or modules and treating and/or diagnosing a subject based on the presence, absence, or change in one or more particular stromal cell signature, profile, program, and/or module. Also described herein are methods of treating that include administering a modulating agent to subject. In some embodiments the modulating agent can alter in vivo the type and/or state of a stromal cell. In some embodiments, modulated cells can be generated ex vivo and administered to a subject in need thereof to enhance the presence of a desired cell population in the subject.
[0243] Also described herein are methods of modulating cells and methods of screening modulating agents.
[0244] Other compositions, compounds, methods, features, and advantages of the present disclosure will be or become apparent to one having ordinary skill in the art upon examination of the following drawings, detailed description, and examples. It is intended that all such additional compositions, compounds, methods, features, and advantages be included within this description, and be within the scope of the present disclosure.
Bone Marrow Stromal Cell Populations
[0245] Described herein are bone marrow stromal cells (also referred to herein as simply "stromal cells") that can be uniquely characterized, isolated, enriched for, and/or engineered to have and/or express a cell-state and/or cell type/subtype specific signature, profile, module, and/or program.
[0246] Biomarkers, signatures and molecular targets described herein can be associated with the bone marrow microenvironment, immune cell dysfunction, and/or activation. In some embodiments, some of the biomarkers, signatures, and/or molecular targets described herein correlate with the loss of effector function of the immune cells and are advantageously distinct, separate or uncoupled from, or independent of the immune cell activation status. In some embodiments, one or more of the biomarkers, marker signatures and molecular targets correlate with immune cell activation and are advantageously distinct, separate or uncoupled from, or independent of the immune cell dysfunction status. As described elsewhere herein, gene signatures and/or gene modules that are uniquely associated with cell types and subtypes, including in normal and in dysfunctional cell states, and molecular nodes that control them and can be analyzed and can uniquely identify a particular cell state (e.g. normal or dysfunctional) and/or type. In some embodiments, the biomarkers, signatures, and/or molecular targets described herein can be used to evaluate bone marrow microenvironments and response, such as to specifically evaluate and target a dysfunctional state while leaving normal activation programs intact.
[0247] As used herein, "cell state" is used to describe elements of a cell's identity. Cell state can be thought of as the characteristic profile or phenotype of a cell, which can be transient or permanent. Cell states can arise transiently during a process that can occur over a period of time. Temporal progression from one cell state to another can be unidirectional (e.g., during differentiation, or following an environmental stimulus) or can be in a state of vacillation that is not necessarily unidirectional and in which the cell may return to the origin state. Vacillating processes can be oscillatory (e.g., cell-cycle or circadian rhythm) or can transition between states with no predefined order (e.g., due to stochastic, or environmentally controlled, molecular events). These processes may occur transiently within a stable cell type (such as in a transient environmental response), or may lead to a new, distinct type (such as in differentiation). Wagner et al., 2016. Nat Biotechnol. 34(111): 1145-1160.
Bone Marrow Stromal Cell Signatures
[0248] Described herein are distinct cell populations that can be identified within a bone marrow stromal cell population by the unique signature of the specific bone marrow cell population.
[0249] As used herein a signature may encompass any gene or genes, or protein or proteins, whose expression profile or whose occurrence is associated with a specific cell type, subtype, or cell state of a specific cell type or subtype within a population of cells. Increased or decreased expression or activity or prevalence may be compared between different cells in order to characterize or identify for instance specific cell (sub)populations. A gene signature as used herein, may thus refer to any set of up- and down-regulated genes between different cells or cell (sub)populations derived from a gene-expression profile. For example, a gene signature may comprise a list of genes differentially expressed in a distinction of interest. It is to be understood that also when referring to proteins (e.g. differentially expressed proteins), such may fall within the definition of "gene" signature.
[0250] The signatures as defined herein (being it a gene signature, protein signature or other genetic signature) can be used to indicate the presence of a cell type, a subtype of the cell type, the state of the microenvironment of a population of cells, a particular cell type population or subpopulation, and/or the overall status of the entire cell (sub)population. Furthermore, the signature may be indicative of cells within a population of cells in vivo. The signature may also be used to suggest for instance particular therapies, or to follow up treatment, or to suggest ways to modulate immune systems. The signatures of the present invention may be discovered by analysis of expression profiles of single-cells within a population of cells from isolated samples (e.g. blood samples), thus allowing the discovery of novel cell subtypes or cell states that were previously invisible or unrecognized. The presence of subtypes or cell states may be determined by subtype specific or cell state specific signatures. The presence of these specific cell (sub)types or cell states may be determined by applying the signature genes to bulk sequencing data in a sample. Not being bound by a theory, a combination of cell subtypes having a particular signature may indicate an outcome. Not being bound by a theory, the signatures can be used to deconvolute the network of cells present in a particular pathological condition. Not being bound by a theory the presence of specific cells and cell subtypes are indicative of a particular response to treatment, such as including increased or decreased susceptibility to treatment. The signature may indicate the presence of one particular cell type. In one embodiment, the novel signatures are used to detect multiple cell states or hierarchies that occur in subpopulations of immune cells that are linked to particular pathological condition (e.g. cancer), or linked to a particular outcome or progression of the disease, or linked to a particular response to treatment of the disease.
[0251] The signature according to certain embodiments of the present invention may comprise or consist of one or more genes and/or proteins, such as for instance 1, 2, 3, 4, 5, 6,7, 8, 9, 10, 11, 12, 13, 14, 15, 16, 17, 18, 19, 20, 21, 22, 23, 24, 25, 26, 27, 28, 29, 30, 31, 32,33, 34, 35, 36, 37, 38, 39, 40, 41, 42, 43, 44, 45, 46, 47, 48, 59, or 50 or more. In certain embodiments, the signature may comprise or consist of two or more genes and/or proteins, such as for instance 2, 3, 4, 5, 6, 7, 8, 9, 10, 11, 12, 13, 14, 15, 16, 17, 18, 19, 20, 21, 22, 23,24, 25, 26, 27, 28, 29, 30, 31, 32, 33, 34, 35, 36, 37, 38, 39, 40, 41, 42, 43, 44, 45, 46, 47, 48,59, or 50 or more. In certain embodiments, the signature may comprise or consist of three or more genes and/or proteins, such as for instance 3, 4, 5, 6, 7, 8, 9, 10, 11, 12, 13, 14, 15, 16,17, 18, 19, 20, 21, 22, 23, 24, 25, 26, 27, 28, 29, 30, 31, 32, 33, 34, 35, 36, 37, 38, 39, 40, 41,42, 43, 44, 45, 46, 47, 48, 59, or 50 or more. In certain embodiments, the signature may comprise or consist of four or more genes and/or proteins, such as for instance 4, 5, 6, 7, 8, 9,10, 11, 12, 13, 14, 15, 16, 17, 18, 19, 20, 21, 22, 23, 24, 25, 26, 27, 28, 29, 30, 31, 32, 33, 34,35, 36, 37, 38, 39, 40, 41, 42, 43, 44, 45, 46, 47, 48, 59, or 50 or more. In certain embodiments, the signature may comprise or consist of five or more genes and/or proteins, such as for instance 5, 6, 7, 8, 9, 10, 11, 12, 13, 14, 15, 16, 17, 18, 19, 20, 21, 22, 23, 24, 25,26, 27, 28, 29, 30, 31, 32, 33, 34, 35, 36, 37, 38, 39, 40, 41, 42, 43, 44, 45, 46, 47, 48, 59, or 50 or more. In certain embodiments, the signature may comprise or consist of six or more genes and/or proteins, such as for instance 6, 7, 8, 9, 10, 11, 12, 13, 14, 15, 16, 17, 18, 19, 20,21, 22, 23, 24, 25, 26, 27, 28, 29, 30, 31, 32, 33, 34, 35, 36, 37, 38, 39, 40, 41, 42, 43, 44, 45,46, 47, 48, 59, or 50 or more. In certain embodiments, the signature may comprise or consist of seven or more genes and/or proteins, such as for instance 7, 8, 9, 10, 11, 12, 13, 14, 15, 16,17, 18, 19, 20, 21, 22, 23, 24, 25, 26, 27, 28, 29, 30, 31, 32, 33, 34, 35, 36, 37, 38, 39, 40, 41,42, 43, 44, 45, 46, 47, 48, 59, or 50 or more. In certain embodiments, the signature may comprise or consist of eight or more genes and/or proteins, such as for instance 8, 9, 10 or more. In certain embodiments, the signature may comprise or consist of nine or more genes and/or proteins, such as for instance 9, 10, 11, 12, 13, 14, 15, 16, 17, 18, 19, 20, 21, 22, 23,24, 25, 26, 27, 28, 29, 30, 31, 32, 33, 34, 35, 36, 37, 38, 39, 40, 41, 42, 43, 44, 45, 46, 47, 48,59, or 50 or more. In certain embodiments, the signature may comprise or consist of ten or more genes and/or proteins, such as for instance 10, 11, 12, 13, 14, 15, 16, 17, 18, 19, 20, 21,22, 23, 24, 25, 26, 27, 28, 29, 30, 31, 32, 33, 34, 35, 36, 37, 38, 39, 40, 41, 42, 43, 44, 45, 46,47, 48, 59, or 50 or more.
[0252] Described herein are genes and gene products differentially upregulated or downregulated in stromal cells, which thus provide useful markers, marker signatures and molecular targets specifically for stromal cells. In some embodiments, a signature can include a combination of genes of Table 1, Table 2, Table 3, Table 4, Table 5, Table 6, Table 7, and/or Table 8. It is to be understood that a signature according to the invention can, for instance, also include a combination of genes or proteins.
[0253] It is to be understood that "differentially expressed" genes/proteins include genes/proteins which are up- or down-regulated as well as genes/proteins which are turned on or off. When referring to up- or down-regulation, in certain embodiments, such up- or downregulation is preferably at least two-fold, such as two-fold, three-fold, four-fold, five-fold, or more, such as for instance at least ten-fold, at least 20-fold, at least 30-fold, at least 40-fold, at least 50-fold, or more. Alternatively, or in addition, differential expression may be determined based on common statistical tests, as is known in the art.
[0254] By means of additional guidance, when a cell is said to be positive for or to express or comprise expression of a given marker, such as a given gene or gene product, a skilled person would conclude the presence or evidence of a distinct signal for the marker when carrying out a measurement capable of detecting or quantifying the marker in or on the cell. Suitably, the presence or evidence of the distinct signal for the marker would be concluded based on a comparison of the measurement result obtained for the cell to a result of the same measurement carried out for a negative control (for example, a cell known to not express the marker) and/or a positive control (for example, a cell known to express the marker). Where the measurement method allows for a quantitative assessment of the marker, a positive cell may generate a signal for the marker that is at least 1.5-fold higher than a signal generated for the marker by a negative control cell or than an average signal generated for the marker by a population of negative control cells, e.g., at least 2-fold, at least 4-fold, at least 10-fold, at least 20-fold, at least 30-fold, at least 40-fold, at least 50-fold higher or even higher. Further, a positive cell may generate a signal for the marker that is 3.0 or more standard deviations, e.g., 3.5 or more, 4.0 or more, 4.5 or more, or 5.0 or more standard deviations, higher than an average signal generated for the marker by a population of negative control cells. The upregulation and/or downregulation of gene or gene product, including the amount, may be included as part of the gene signature or expression profile.
[0255] A "deviation" of a first value from a second value may generally encompass any direction (e.g., increase: first value >second value; or decrease: first value <second value) and any extent of alteration.
[0256] For example, a deviation may encompass a decrease in a first value by, without limitation, at least about 10% (about 0.9-fold or less), or by at least about 20% (about 0.8-fold or less), or by at least about 30% (about 0.7-fold or less), or by at least about 40% (about 0.6-fold or less), or by at least about 50% (about 0.5-fold or less), or by at least about 60% (about 0.4-fold or less), or by at least about 70% (about 0.3-fold or less), or by at least about 80% (about 0.2-fold or less), or by at least about 90% (about 0.1-fold or less), relative to a second value with which a comparison is being made.
[0257] For example, a deviation may encompass an increase of a first value by, without limitation, at least about 10% (about 1.1-fold or more), or by at least about 20% (about 1.2-fold or more), or by at least about 30% (about 1.3-fold or more), or by at least about 40% (about 1.4-fold or more), or by at least about 50% (about 1.5-fold or more), or by at least about 60% (about 1.6-fold or more), or by at least about 70% (about 1.7-fold or more), or by at least about 80% (about 1.8-fold or more), or by at least about 90% (about 1.9-fold or more), or by at least about 100% (about 2-fold or more), or by at least about 150% (about 2.5-fold or more), or by at least about 200% (about 3-fold or more), or by at least about 500% (about 6-fold or more), or by at least about 700% (about 8-fold or more), or like, relative to a second value with which a comparison is being made.
[0258] Preferably, a deviation may refer to a statistically significant observed alteration. For example, a deviation may refer to an observed alteration which falls outside of error margins of reference values in a given population (as expressed, for example, by standard deviation or standard error, or by a predetermined multiple thereof, e.g., .+-..times.SD or .+-.2.times.SD or .+-.3.times.SD, or .+-..times.SE or .+-.2.times.SE or .+-.3.times.SE). Deviation may also refer to a value falling outside of a reference range defined by values in a given population (for example, outside of a range which comprises .gtoreq.40%, .gtoreq.50%, .gtoreq.60%, .gtoreq.70%, .gtoreq.75% or .gtoreq.80% or .gtoreq.85% or .gtoreq.90% or .gtoreq.95% or even .gtoreq.100% of values in said population).
[0259] In a further embodiment, a deviation may be concluded if an observed alteration is beyond a given threshold or cut-off. Such threshold or cut-off may be selected as generally known in the art to provide for a chosen sensitivity and/or specificity of the prediction methods, e.g., sensitivity and/or specificity of at least 50%, or at least 60%, or at least 70%, or at least 80%, or at least 85%, or at least 90%, or at least 95%.
[0260] For example, receiver-operating characteristic (ROC) curve analysis can be used to select an optimal cut-off value of the quantity of a given immune cell population, biomarker or gene or gene product signatures, for clinical use of the present diagnostic tests, based on acceptable sensitivity and specificity, or related performance measures which are well-known per se, such as positive predictive value (PPV), negative predictive value (NPV), positive likelihood ratio (LR+), negative likelihood ratio (LR-), Youden index, or similar.
[0261] As discussed herein, differentially expressed genes/proteins may be differentially expressed on a single cell level, or may be differentially expressed on a cell population level. Preferably, the differentially expressed genes/proteins as discussed herein, such as constituting the gene signatures as discussed herein, when as to the cell population level, refer to genes that are differentially expressed in all or substantially all cells of the population (such as at least 80%, preferably at least 90%, such as at least 95% of the individual cells). This allows one to define a particular subpopulation of cells. As referred to herein, a "subpopulation" of cells preferably refers to a particular subset of cells of a particular cell type which can be distinguished or are uniquely identifiable and set apart from other cells of this cell type. The cell subpopulation may be phenotypically characterized, and is preferably characterized by the signature as discussed herein. A cell (sub)population as referred to herein may constitute of a (sub)population of cells of a particular cell type characterized by a specific cell state.
[0262] When referring to induction, or alternatively suppression of a particular signature, preferable is meant induction or alternatively suppression (or upregulation or downregulation) of at least one gene/protein of the signature, such as for instance at least to, at least three, at least four, at least five, at least six, or all genes/proteins of the signature.
[0263] Signatures may be functionally validated as being uniquely associated with a particular immune phenotype. Induction or suppression of a particular signature may consequentially be associated with or causally drive a particular immune phenotype.
[0264] In various embodiments and described in greater detail elsewhere herein signatures (e.g. gene signatures, protein signature, and/or other genetic signature) can be analyzed based on single cell analyses (e.g. single cell RNA sequencing) or alternatively based on cell population analyses, as is defined herein elsewhere.
[0265] As used herein the term "signature gene" used interchangeably with "gene signature" refers to any gene or genes whose expression profile is associated with a specific cell type, subtype, or cell state of a specific cell type or subtype within a population of cells. The signature gene(s) can be used to indicate the presence of a cell type, a subtype of the cell type, the state of the microenvironment of a population of cells, and/or the overall status of the entire cell population. Furthermore, the signature gene(s) can be indicative of cells within a population of cells in vivo. Not being bound by a theory, the signature gene(s) can be used to deconvolute the cells present in a tumor based on comparing them to data from bulk analysis of a tumor sample. The signature gene(s) can indicate the presence of one particular cell type or subtype. In one embodiment, the signature gene(s) can indicate that dysfunctional or activated tumor infiltrating T-cells are present. The presence of cell types within a tumor may indicate that the tumor will be resistant to a treatment. In one embodiment, the signature gene(s) of the present invention are applied to bulk sequencing data from a tumor sample to transform the data into information relating to disease outcome and personalized treatments. In one embodiment, the signature gene(s) can be used to detect multiple cell states that occur in a subpopulation of tumor cells that are linked to resistance to targeted therapies and progressive tumor growth. In some embodiments, immune cell states of tumor infiltrating lymphocytes are detected.
[0266] The signature gene(s) can be detected by immunofluorescence, mass cytometry (CyTOF), FACS, drop-seq, RNA-seq, single cell qPCR, MERFISH (multiplex (in situ) RNA FISH), microarray and/or by in situ hybridization. Other methods including, but not limited to, absorbance assays and colorimetric assays are known in the art and can be used herein. In some embodiments, measuring expression of signature genes can include measuring protein expression levels. Protein expression levels can be measured, for example, by performing a Western blot, an ELISA or binding to an antibody array. In another aspect, measuring expression of said genes comprises measuring RNA expression levels. RNA expression levels may be measured by performing RT-PCR, Northern blot, an array hybridization, or RNA sequencing methods. Methods of detecting a signature, such as a gene signature, are described in greater detail elsewhere herein.
[0267] Signatures may be functionally validated as being uniquely associated with a particular immune phenotype. Induction or suppression of a particular signature may consequentially be associated with or causally drive a particular immune or other desired phenotype.
[0268] Systematic characterization of non-hematopoietic cells of the mouse bone marrow, as demonstrated in the Working Examples and described elsewhere herein, provides for classification into various cell types, six broad cell types with 17 cell subsets, with discrete distinctions, differentiation continuums and HSC niche regulatory function. Each of the subsets is characterized by numerous differentially expressed genes, including but not limited to transcription factors, surface antigens, and secreted products. The differentially expressed genes include certain "known" genes, that is genes whose expression has previously been indicated to be associated with certain cell types, but which are insufficient to draw the distinctions between cell populations demonstrated, described, and provided herein. The cell types comprise mesenchymal stromal cells (MSC), osteolineage cells, chondrocytes, endothelial cells, and pericytes. The following tables provide genes showing the greatest differential expression in the various distinct bone marrow stromal cell clusters and can be used to characterize and identify distinct bone marrow stromal cell types and subtypes. While the expression patterns confirm differential expression of certain "known" genes for certain cell types, those genes may also be differentially expressed in other cell types. That is, for example, while differential expression of certain genes may be associated with MSCs, differential expression of those genes is also observed among clusters other than cluster 1. Further, the Working Examples herein can demonstrate that expression patterns of the differentially expressed genes can be used to uniquely identify distinct bone marrow stromal cell types and subtypes. Unexpected subtypes of cells found within these cell groups include two types of osteoblasts, four chondrocyte populations and three types of endothelial cells.
[0269] The distinct profiles of the cell subsets notably include hematopoietic regulatory genes, indicated participation in hematopoietic regulation, often disrupted by the emergence of leukemia.
TABLE-US-00001 TABLE 1 Differentially expressed genes in cluster 1 (MSCs) "known" Cxcl12, Adipoq, Kitl, Lepr Transcription Cebpa, Zeb2, Runx2, Ebf1, Foxc1, Cebpb, Factors Ar, Fos, Id4, Klf6, Irf1, Runx2, Jun, Snaj2, Maf, Zthx4, Id3, Egr1, Junb Surface Hp, Lpl, Gdpd2, Serping, Dpep1, Grem1, Pappa, Chrdl1, Fbln5, Vcam1, Kng1, H2-Q10, Cdh11, Mme, Tmem176b, Csf1, H2-K1, Serpine2, H2-D1, Tnc, Cdh2, Pdgtra Secreted Esm1, Gas6, Cxcl14, Sfrp4, Wisp2, Agt, Il34, Fst, Fgf7, Il1rn, C2, Igfpb4, Serpina1, Cb1n1, Apoe, Ibsp, Igfbp5, Gpx3, Pdzrn4, Rarres2, Vegfa Other 1500009L16Rik, Serpina3g, Cyp1b1, Ebt3, Arrdc4, Kng2, Slc26a7, Marc1, Ms4ad4, Wdr86, Serpina3c, Tmem176a, Cldn10, Trt, Gpr88, Nnmt, Gm4951, Cd1d1, Plpp3, Ackr4
TABLE-US-00002 TABLE 2 Differentially expressed genes in cluster 7, 8 (OLCs) "known" Bglap, Spp1 Transcription Vdr, Satb2, Sp7, Runx2, Tbx2, Zeb2, Dlx5, Factors Dlx6, Zfhx4, Hey1, Irx5, Id3, Mxd4, Mef2c, Esr1, Maf, Smad6, Sox4, Cebpb, Meis3 Surface Mmp13, Tnc, Cfh, Alp1, Lrp4, Cdh11, Casm1, Cdh2, Slit2, Bmp3, Cdh15, Fat3, Pard6g, Litr, Cp, Ptprd, Olfml3 Fign, Cd63, Fap Secreted Dmp1, Angpt4, Chn1, Ibsp, Wisp1, Wif1, Metrnl, Vldlr, Podnl1, Col22a1, Ndnf, Mmp14, Pgf, Lox11, Mfap2, Srpx2, Ag-t, Tmem59, Vstm4, Col8a1, Cxcl12 Other Bglap2, Car3, Kcnk2, Slc36a2, Ifitm5, Hpgd, Limch1, Gm44029, Hvcn1, Tnfrsf19, Col13al, Fam78b, Gja1, Cnn2, Ppfibp2, Cldn10, Dapk2, Tmp1, Bglap3, Ramp1
TABLE-US-00003 TABLE 3 Differentially expressed genes in cluster 12 (pericytes) "known" Acta2, Myh11, Mcam Transcription Hey1, Nr2f2, Tbx2, Ebf1, Ebf2, Foxs1, Id3, Factors Met2c, Cebpb, Zfxh3, Nr4a1, Klf9, Zeb2, Prrx1, Meox2, Junb, Id4, Zfp467, Irf1, Arid5b Surface Atp1b2, Aoc3, Sncq, Itga7, Aspn, Steap4, Thy1, Filip1I, Parm1, Agtr1a, Olfml2a, Cald1, Ednra, Col18a1, Serpini1, Bcam, Rrad, Pdgfrb, Col5a3, Pde5a Secreted Notch3, Myl1, Tinagl1, Art3, Ngf, Sparcl1, Il6, Rarres2, Vstm4, Pgf, Pdgfa, Col4a2, Igfbp7, Col4a1, Fst, Rtn4lrl1, Adamts1, Il34, Gpc6, Cscl1 Other Bgs5, Tagln, Higd1p, Nrip2, Gucv1a3, H2-M9, Des, Olfr558, Lmod1, Gucy1b3, Kcnk3, Pdlim3, Gm13861, Mrvi1, Pln, Gm13889, Ral11a, Cygp
TABLE-US-00004 TABLE 4 Differentially expressed genes in cluster 2, 10, 13, 17 (chondrocyte lineage) "known" Sox9, Col11a2, Acan, Col2a1 Transcription Barx1, Pitx1, Foxd1, Osr2, Tbx18, Runx3, Osr2, Factors Tbx18, Runx3, Peg3, Bhlhe41, Batf3, Plagl1, Sp7, Sox8, Lef1, Shox2, Zbtb20, Foxa3, Mef2c, Egr2, Pax1, Runx2 Surface Prg4, Cpe, Mfi2, Scara3, Cpm, Chst11, Unc5q, Col11a1, Slc2a5, Slc26a2, Cspg4, Prc1, Fgfr3, Nid2, ,Spon1, Slc40a, Efemp1, Susd5, Fxyd3, Alpl, Corin, Tpd52l1, Sema3d, F5, Slc38a3 Secreted Cytl1, Rbp4, Vit, Clip, Fam19a5, Col9a3, Col9a1, Col9a2, Matn3, Hapln1, Sfrp5, Notum, Mia, lhh, Mgst2, Rarres1, Gpld1, Il17b, Bglap Other 1500015O10Rik, Itm2a, Crispld1, Meg3, Cenpp, Fxyd2, 3110079O15Rik, Lect1, Papss2, SAyt8, Stmn1, Lockd, Chil1, Calml3, Ncmap, Serpina1d, Serpina 1b, Serpina 1c, Sic6a1, Serpina1a
TABLE-US-00005 TABLE 5 Differentially expressed genes in cluster 9, 15, 16 (fibroblasts) "known" S100a4, Fn1, Col1a1, Col1a2, Lum, Col22a1, Twist2 Transcription Scx, Barx1, Trps1, Hoxd9, Pitx1, Prrx1, Rora, Factors Prrx2, Meox2, Ebf2, Osr2, Ebf1, Dlx3, Zfhx2, Meox1, Etv4, Mkx Surface Dcn, Clu, Abi3bp, Prelp, Lox, Tnxb, Col3a1, Vcan, Vi, Mfap5, Col14a1, Aspn, Pdpn, Pdgfra, F13a1, Clic5, Gpr1, Emilin2, Has1, Mtap4, Gas2, Ntng1, Serpinf1, Postn Secreted Angptl7, Clip2, Clip, Sod3, Slurp1, Spp1, Clec3b, Igfbp6, Thds4, Dpt, Gsn, Fndc1, Pla1a, Adamtsl5, Figf, Htra4, Rspo2, Mstn, Ptx4, Spock3, Cpxm2, Itgbl1 Other Anxa8, Fxyd5, Fxyd6, Egln3, Ptgis, Il33, Fgf9, Tppp3, Crlp1, Mustn1, Celf2, Tmod2, Ly6a, Fez1, Lysmd2, Pcsk6, 2210407C18Rik, Aldh1a3, Rtn1, Rab37, Lnmd, Chodl, Fam159b, Prph, Insc
TABLE-US-00006 TABLE 6 Differentially expressed genes in cluster 0, 6, 11 (ECs) "known" Kdr, Cdh5, Thbd, Emcn, Ly6e, Pecam1 Ly6a Transcription Matb, Pparg, Nr2f2, Irf8, Ets1, Sox17, Sox11, Factors Bcl6b, Gata2, Tcf15, Meox1, Sox7, Tshz2 Surface Tfpi, Gpm6a, Ackr1, Mrc1, Stab1, Vcam1, Tek, Flt1, Ramp3, Icam2, Podxl, Cd34, Mcam, Sdpr, Bcam, Tspan13, Fabp5, Vim, Kitl Secreted Lrg1, Dnase1l3, Sepp1, Egfl7, Pde2a, Gpihbp1, Sema3g, Ramp2, Cd3001g, C1qtnf9, Sparcl1, Tinagl1, Pdgfb Other Ubd, Stab2, Fabp4, Cldn5, Rgs4, Ecscr, Cyyr1, Ly6c1, Magix, Cav1, Gngt2, Myct1, Tmsb4x
Gene Modules
[0270] Also described herein are gene modules that are uniquely associated with the dysfunctional stromal cell subsets, including activated and repressed subsets, and key molecular nodes that control them. The present markers, marker signatures and molecular targets thus provide for new ways to evaluate and modulate stromal responses, such as to invading cancers. The gene modules described herein can be associated with a dysfunctional stromal microenvironment.
[0271] Described herein are genes and gene products differentially upregulated in stromal cell subsets, including subsets rendered dysfunctional in a hematological disease, such as leukemia, thus providing useful markers, marker signatures and molecular targets specifically for dysfunction in stromal cells.
Stromal Cells and Cell Populations
[0272] Described herein are stromal cells and cell populations that can be characterized by a signature described elsewhere herein. The stromal cell(s) can be derived from bone marrow. In some embodiments, the stromal cell can have a signature where the signature is unique to a stromal cell type and/or state. Such signatures are described in greater detail elsewhere herein. In some embodiments, the stromal cell population can contain one or more cell types and/or states. Isolated and enriched cell populations can be generated from a mixed cell population to form isolated and enriched stromal cell populations. Isolated and/or enriched cells can be engineered and/or modulated such that they express a specific signature and/or are of a specific cell type and/or state.
[0273] In some exemplary embodiments, described herein is an isolated or engineered mesenchymal stem/stromal cell (MSC) or MSC cell population, wherein the MSC or MSC cell population is characterized by a gene signature comprised of one or more genes of Table 1. In some exemplary embodiments, the MSC or MSC cell population is characterized by a gene signature comprised of one or more of Cebpa, Zeb2, Runx2, Ebf1, Foxc1, Cebpb, Ar, Fos, Id4, Klf6, Irf1, Runx2, Jun, Snaj2, Maf, Zthx4, Id3, Egr1, Junb, Hp, Lpl, Gdpd2, Serping, Dpep1, Grem1, Pappa, Chrdl1, Fbln5, Vcam1, Kng1, H2-Q10, Cdh11, Mme, Tmem176b, Csf1, H2-K1, Serpine2, H2-D1, Tnc, Cdh2, Pdgtra, Esm1, Gas6, Cxcl14, Sfrp4, Wisp2, Agt, Il34, Fst, Fgf7, Il1rn, C2, Igfpb4, Serpina1, Cbln1, Apoe, Ibsp, Igfbp5, Gpx3, Pdzrn4, Rarres2, Vegfa, 1500009L16Rik, Serpina3g, Cyp1b1, Ebt3, Arrdc4, Kng2, Slc26a7, Marc1, Ms4ad4, Wdr86, Serpina3c, Tmem176a, Cldn10, Trt, Gpr88, Nnmt, Gm4951, Cd1d1, Plpp3, or Ackr4. In some exemplary embodiments, the MSC or MSC cell population does not express one or more of Thy1, Ly6a (Sca-1), NG2 (Cspg4) or Nestin (Nes). In some exemplary embodiments, the gene signature comprises one or more of Nte5, Vcam1, Eng, Thy1, Ly6a, Grem1, Cspg4, Nes, Runx2, Col1A1, Erg1, Junb, Fosb, Cebpb, Klf6, Nr4a1, Klf2, Atf3, Klf4, Maff, Nfia, Smad6, Hey1, Sp7, Id1, Ifrd1, Trib1, Rrad, Odc1, Actb, Notch2, AlpI, Mmp13, Raph1, Tnfsf11, Cxcl1, Adamts1, Cc17, Serpine1, Cc12, Apod, Cbln1, Pam, Col8a1, Wif1, Olfml3, Gdf10, Cyr61, Nog, Angpt4, Metrn1, Trabd2b, Adamts5, Igfbp4, Cxcl12, Igfbp5, Lepr, Cxcl12, Kit1, Grem1, or Angpt1.
[0274] In some exemplary embodiments, described herein is an isolated or engeinered osteolineage cell (OLC) or OLC population, where the isolated or engineered OLC or OLC population is characterized by a gene signature comprising one or more genes of Table 2. In some exemplary embodiments, the OLC or OLC population is characterized by a gene signature comprising one or more of Vdr, Satb2, Sp7, Runx2, Tbx2, Zeb2, Dlx5, Dlx6, Zfhx4, Hey1, Irx5, Id3, Mxd4, Mef2c, Esr1, Maf, Smad6, Sox4, Cebpb, Meis3, Mmp13, Tnc, Cfh, Alp1, Lrp4, Cdh11, Casm1, Cdh2, Slit2, Bmp3, Cdh15, Fat3, Pard6g, Litr, Cp, Ptprd, Olfml3 Fign, Cd63, Fap, Dmp1, Angpt4, Chn1, Ibsp, Wisp1, Wif1, Metrn1, Vldlr, Podnl1, Col22a1, Ndnf, Mmp14, Pgf, Lox11, Mfap2, Srpx2, Agt, Tmem59, Vstm4, Col8a1, Cxcl12, Bglap2, Car3, Kcnk2, Slc36a2, Ifitm5, Hpgd, Limch1, Gm44029, Hvcn1, Tnfrsf19, Col13a1, Fam78b, Gja1, Cnn2, Ppfibp2, Cldn10, Dapk2, Tmp1, Bglap3, or Ramp1. In some exemplary embodiments, the OLC or OLC population expresses Bglap and Spp1. In some exemplary embodiments, the gene signature further comprises one or more of Runx2, Sp7, Grem1, Lepr, Cxcl12, Kit1, Bglap, Cd200, Spp1, Sox9, Id4, Ebf1, Ebf3, Cebpa, Foxc1, Snai2, Maf, Runx1, Thra, Plagl1, Mafb, Vdr, Cebpb, Tcf712, Bhlhe40, Snai1, Creb311, Zbtb7c, Gm22, Tcf7, Nr4a2, Atf3, Prrx2, Fbln5, H2-K1, H2-D1, Hp, Fstl1, Tmem176b, B2m, Pappa, Dpep1, Islr, Vcam1, Lepr, Mmp13, Cd200, Itgb5, Lifr, Postn, Slit2, Timp1, Lrp4, Tspan6, Ctsc, Cpz, Prss35, Tmem119, Lox, Cryab, Pdzd2, Fyn, Gucala, Rerg, Sema4d, Vcam, Aspn, Slc20a2, Plat, Fmod, Fn1, Aebop1, Angpt12, Prkcdbp, Prelp, Cxcl12, Igfbp4, Cxcl14, Gas6, Apoe, Igfbp7, Col8a1, Serping1, Igfbp5, Igf1, Kit1, Spp1, Serpine2, Fam20c, Bmp8a, Dmp1, Ibsp, Pros1, Srpx2, Mgll, Timp3, Col11a2, Cgref1, Col1a1, Cthrc1, Sparc, Col22a1, Col5a2, Fkbpl11, Col3a1, Ptn, Col6a2, Tnn, Npy, Col6a1, Omd, Dcn, Tgfbi, Col6a3, or Acan. In some exemplary embodiments, the gene signature further comprises one or more of Runx2, Sp7, Grem1, Bglap, Cxcl12, Kit1, Osr1, Foxd1, Sox5, Osr2, Erg, Nfatc2, Mef2c, Sp7, Zbtb7c, Runx2, Snai2, Zfhx4, Dlx6, Meox1, Prrx1, Scx, Hic1, Peg3, Etv5, Ltbp1, Tspan8, Emb, Slc16a2, Tspan13, Creb5, Scara3, Prg4, Clu, plxdc1, Cdon, Fbln7, Ntn1, Nt5e, Thbd, Pth1r, Alp1, Cadm1, Cd200, Susd5, Rarres1, Ptprz1, Plat, Tnfrsf11b, Lpar3, Cspg4, Postn, S1pr1, Enah, Aspn, Cald1, Wnt5b, Adam12, Tnc, Pak1, Lpl, Mfap4, Cntfr, Fbln2, Fgl2, Gpc3, Ogn, Slc1a3, Spock2, Fbln5, Rgp1, Smoc1, C5ar1, Fzd9, Npr2, Fzd10, Cxcl14, Wif1, Arsi, Col12a1, Mgp, Itgbl1, Igf1, Smoc2, Spon2, Fst, Sbsn, Gas1, Sod3, Mmp3, Cilp, Pla2g2e, Fam213a, Acp5, Col15a1, Bglap2, Bglap3, Ibsp, Thbs4, Frzb, Bmp8a, Dkk1, Scube1, Chad, Spp1, Col11a2, Ptn, Ostn, Tnn, Mmp14, Gpx3, Cthrc1, Cxcl12, Prss12, Rbln1, Penk, Col8a1, Vipr2, Apod, Cpxm2, Rarres2, C4b, Sparcl1, Ly6e, R3hdml, Mia, Myoc, Nrtn, Pdzrn4, Spp1, Pth1r, Sox9, Acan, or Mmp13.
[0275] In some exemplary embodiments, described herein is an isolated or engineered pericyte or pericyte population, wherein the isolated or engineered pericyte is characterized by a gene signature comprising one or more genes in Table 3. In some exemplary embodiments, the gene signature further comprises one or more of Hey1, Nr2f2, Tbx2, Ebf1, Ebf2, Foxsl, Id3, Met2c, Cebpb, Zfxh3, Nr4a1, Klf9, Zeb2, Prrx1, Meox2, Junb, Id4, Zfp467, Irf1, Arid5b, Atp1b2, Aoc3, Sncq, Itga7, Aspn, Steap4, Thy1, Filip1I, Parm1, Agtr1a, Olfml2a, Cald1, Ednra, Col18a1, Serpini1, Bcam, Rrad, Pdgfrb, Col5a3, Pde5a, Notch3, Myl1, Tinagl1, Art3, Ngf, Sparcl1, 116, Rarres2, Vstm4, Pgf, Pdgfa, Col4a2, Igfbp7, Col4a1, Fst, Rtn4lrl1, Adamts1, 1134, Gpc6, Cscll, Bgs5, Tagln, Higd1p, Nrip2, Gucv1a3, H2-M9, Des, Olfr558, Lmod1, Gucy1b3, Kcnk3, Pdlim3, Gm13861, Mrvi1, Pln, Gm13889, Ral11a, or Cygp. In some exemplary embodiments, the gene signature further comprises one or more of Cspg4, Ngfr, Des, Myh11, Acta2, Rgs5, Thy1, Pdgtfrb, Nes, Lepr, Cdh2, Cxcl12, Kitl. Ebf1, Sox4, Dlx5, Mxd4, Smad6, Hey1, Tcf15, Klf2, Mef2c, Atf3, Meox2, Steap4, Olfml2a, H2-M9, Tspan15, Cd24a, Marcks, Fbn1, Tnfrsf21, Slc12a2, Cfh, Cdh2, Vcam1, Sncg, Rasd1, Bcam, Rrad, Prkcdbp, Susd5, Csrrp1, Ptrf, Lama5, Ppp1r12b, Fhl1, Vim, Sdpr, Vtn, Angpt12, Cd44, Htra1, Mfap5, Anxa2, Procr, Igf1, Mgp, Col5a3, col4a2, Vstm4, Col3a1, Col4a1, Emcn, Gas1, Col6a2, Kit1, Sparcl1, Igfbp5, Ntf3, Inhba, Ccdc3, Fst, Timp3, Col1a1, Nbl1, Nov, Ccl11, Lga1s1, Dpt, Ctsl, Col6a3, Cxcl12, Rgs5, Abcc9, Phlda1, Tgs2, Cygb, Marcksl1, Apbb2, Ifitm3, Tmsb4x, Fam162a, Tagln, Pcp411, Crip1, Myl6, Acta2, Pln, Nrip2, Mustn1, Dstn, Mul9, Myh11, S100a6, Tppp3, Enpp2, S100a10, Cav1, Gstm1, Lysmd2, Myl12a, Nnmt, or S100a11. In some exemplary embodiments, the gene signature further comprises one or more Acta2, Myh11, Mcam, Jag1, and Il6.
[0276] In some exemplary embodiments, described herein is an isolated or engineered chondrocyte or chondrocyte population, wherein the isolated or engineered chondrocyte population is characterized by a gene signature comprising one or more genes in Table 4. In some exemplary embodiments, the gene signature comprises one or more of Barx1, Pitx1, Foxd1, Osr2, Tbx18, Runx3, Osr2, Tbx18, Runx3, Peg3, Bhlhe41, Batf3, Plagl1, Sp7, Sox8, Lef1, Shox2, Zbtb20, Foxa3, Mef2c, Egr2, Pax1, Runx2, Prg4, Cpe, Mfi2, Scara3, Cpm, Chst11, Unc5q, Col11a1, Slc2a5, Slc26a2, Cspg4, Prc1, Fgfr3, Nid2, Spon1, Slc40a, Efemp1, Susd5, Fxyd3, Alp1, Corin, Tpd5211, Sema3d, F5, Slc38a3, Cytl1, Rbp4, Vit, Clip, Fam19a5, Col9a3, Col9a1, Col9a2, Matn3, Hapln1, Sfrp5, Notum, Mia, lhh, Mgst2, Rarres1, Gpld1, Il17b, Bglap, 1500015010Rik, Itm2a, Crispld1, Meg3, Cenpp, Fxyd2, 3110079O15Rik, Lect1, Papss2, SAyt8, Stmn1, Lockd, Chil1, Calml3, Ncmap, Serpina1d, Serpina 1b, Serpina 1c, Sic6a1, or Serpina1a. In some exemplary embodiments, the gene signature comprises one or more of Sox9, Col11a2, Acan, or Col2a1. In some exemplary embodiments, the gene signature comprises one or more of Runx2, Ihh, Mef2c, or Col10a1. In some exemplary embodiments, the gene signature further comprises one or more of Grem1, Runx2, Sp7, Alp1, or Spp1. In some exemplary embodiments, the chondrocyte expresses one or more of Ihh, Pth1r, Mef2c, Col10a1, Ibsp, Mmp13, Grem1. In some exemplary embodiments, the gene signature comprises one or more of Prg4, Gas1, Clu, Dcn, Cilp, Scara3, Cytl1, Igfbp7, Cilp2, Cpe, Sod3, Cd81, Abi3 bp, Creb5, Gsn, Crip2, Vit, Fhl1, Pam, Cd9, Prrx1, Vim, Col11a2, Col9a1, Col2a1, Col9a2, Col27a1, Col9a3, Hapln1, Acan, Matn3, Col11a1, Pth1r, Mia, Pcolce2, Chst11, Epyc, Serpinh1, Gnb211, Fscn1, Pla2g5, Rcn1, Sox9, Bglap, Sp7, Fn1, Ube2s, Hmgb1, Ckap4, Clec11a, Il17b, Ybx1, Tmem97, Rbm3, Slc26a2, C1qtnf3, Fkbp2, Prelp, Apoe, Cst3, Spon1, Olfml3, Wif1, Lef1, Notum, Emb, Col1a2, Sfrp5, Omd, Ctsd, Zbtb20, Islr, B2m, Ly6e, Alp1, Spp1, Chad, Timp3, Mef2c, Sparc, Ihh, Junb, Txnip, Rarres1, Scrg1, Sema3d, Colgalt2, Serinc5, Slc38a2, Ddit41, Egr1, Runx2, or Cxcl12.
[0277] In some exemplary embodiments, described herein is an isolated or engineered fibroblast or fibroblast population, wherein the isolated or engineered fibroblast or fibroblast population is characterized by a gene signature comprising one or more genes of Table 5. In some exemplary embodiments, the gene signature further comprises one or more of Scx, Barx1, Trps1, Hoxd9, Pitx1, Prrx1, Rora, Prrx2, Meox2, Ebf2, Osr2, Ebf1, Dlx3, Zfhx2, Meox1, Etv4, Mkx, Dcn, Clu, Abi3 bp, Prelp, Lox, Tnxb, Col3a1, Vcan, Vi, Mfap5, Col14a1, Aspn, Pdpn, Pdgfra, F13a1, Clic5, Gpr1, Emilin2, Has1, Mtap4, Gas2, Ntng1, Serpinf1, Postn, Angpt17, Clip2, Clip, Sod3, Slurp1, Spp1, Clec3b, Igfbp6, Thds4, Dpt, Gsn, Fndc1, Pla1a, Adamts15, Figf, Htra4, Rspo2, Mstn, Ptx4, Spock3, Cpxm2, Itgb1, Anxa8, Fxyd5, Fxyd6, Egln3, Ptgis, I133, Fgf9, Tppp3, Crlp1, Mustn1, Celf2, Tmod2, Ly6a, Fez1, Lysmd2, Pcsk6, 2210407C18Rik, Aldh1a3, Rtn1, Rab37, Lnmd, Chod1, Fam159b, Prph, or Insc. In some exemplary embodiments, the gene signature comprises one or more of Fibronectin-1 (Fn1), Fibroblast Specific Protein-1 (S100a4), Col1a1, Col1a2, Lum, Col22a1, or Twist2. In some exemplary embodiments, the gene signature comprises one or more of Sox9, Acan, and Col2a1. In some exemplary embodiments, the gene signature comprises one or more of Cd34, Ly6a, Pdgfra, Thy1 and Cd44, and not Cdh5, or Acta2. In some exemplary embodiments, the gene signature comprises one or more of Sox-9, Scleraxis (Scx), Spp1, Cspg4, CD73 (Nt5e), and Cartilage Intermediate Layer Protein (Cilp). In some exemplary embodiments, the gene signature further comprises one or more of S1004a, Dcn, Sema3c, or Cxcl12.
[0278] In some exemplary embodiments, described herein is an isolated or engineered bone marrow derived endothelial cell (BMEC) or BMEC population, wherein the isolated or engineered fibroblast or fibroblast population is characterized by a gene signature comprising one or more genes of Table 6. In some exemplary embodiments, the gene signature comprises one or more of Mafb, Pparg, Nr2f2, Irf8, Ets1, Sox17, Sox11, Bcl6b, Gata2, Tcf15, Meox1, Sox7, Tshz2, Tfpi, Gpm6a, Ackr1, Mrc1, Stab1, Vcam1, Tek, Flt1, Ramp3, Icam2, Podx1, Cd34, Mcam, Sdpr, Bcam, Tspan13, Fabp5, Vim, Kit1, Lrg1, Dnasel13, Sepp1, Egfl7, Pde2a, Gpihbp1, Sema3g, Ramp2, Cd3001g, C1qtnf9, Sparcl1, Tinagl1, Pdgfb, Ubd, Stab2, Fabp4, Cldn5, Rgs4, Ecscr, Cyyr1, Ly6c1, Magix, Cav1, Gngt2, Myct1, or Tmsb4x. In some exemplary embodiments, the gene signature comprises one or more of Flt4 (Vegfr-3) and Ly6a (Sca-1), wherein Ly6a expression, when present in the gene signature, is reduced as compared to a suitable control. In some exemplary embodiments, the gene signature comprises one or more of Pecam1, Cdh5, Cd34, Tek, Lepr, Cxcl12, or Kitl. In some exemplary embodiments,
[0279] These and other aspects, objects, features, and advantages of the example embodiments will become apparent to those having ordinary skill in the art upon consideration of the following detailed description of example embodiments. the gene signature comprises one or more of Flt4, Ly6a, Icam1, or Sele. In some exemplary embodiments, the gene signature comprises one or more of Mafb, Cebpb, Xbp1, Nr2f2, Irf8, Ybx1, Ebf1, Sox17, Mxd4, Id1, Meox2, Tshz2, Tcf15, Meox1, Tfpi, Il6stm Angpt4, Gpm6a, Vcam1, Emp1, Cd34, Gnas, Slc9a3r2, Cald1, Mcam, Tspan13, Vim, Cd9, Ptrf, Crip2, Sepp1, Ctsl, Adamts5, Apoe, Igfbp4, Sparc, Col4a2, Col4a1, Serpinh1, Ppic, Cxcl12, Cst3, Sparcl1, C1qtnf9, Tinagl1, Mgll, Kit1, Stab2, Ubd, Gm1673, Abcc9, Rgs4, Ly6c1, Actg1, Tsc22d1, Glu1, Fxyd5, Crip1, Cav1, S100a6, S100a10, or lfitm2.
[0280] In some embodiments, the isolated, enriched, modulated, and/or engineered cell or cell population can be a Cluster 1, 2, 3, 4, 5, 6, 7, 8, 9, 10, 11, 12, 13, 15, 16, 17, or a subtype of any one of said Clusters as further provided and described elsewhere herein, particularly in the Working Examples herein. In some embodiments, the isolated, enriched, modulated, and/or engineered cell or cell population can have the same signature a cell of Cluster 1, 2, 3, 4, 5, 6, 7, 8, 9, 10, 11, 12, 13, 15, 16, 17, or a subtype of any one of said Clusters as further provided and described elsewhere herein, particularly in the Working Examples herein.
Isolated and Enriched Cell Populations
[0281] Single or multiple cells can be isolated from a sample containing a mixture of cell types and/or cell states based on a signature. In some embodiments, the isolated cell population can be substantially pure. As used herein, "substantially pure" can mean an object species is the predominant species present (i.e., on a molar basis it is more abundant than any other individual species in the composition), and preferably a substantially purified fraction is a composition wherein the object species comprises about 50 percent of all species present. Generally, a substantially pure composition will comprise more than about 80 percent of all species present in the composition, more preferably more than about 85%, 90%, 95%, and 99%. Most preferably, the object species is purified to essential homogeneity (contaminant species cannot be detected in the composition by conventional detection methods) wherein the composition consists essentially of a single species.
[0282] In some embodiments, the isolated cell population can contain only a single cell state or cell type and can be said to be substantially free of additional cell states or cell types. As used herein, "substantially free" can mean an object species is present at non-detectable or trace levels so as not to interfere with the properties of a composition or process.
[0283] In some embodiments, isolation of stromal cells of a specific type and/or cells sate can produce an enriched population of cells that is enriched for a particular cell state and/or type. In some embodiments a cell can be enriched for a particular signature or profile. As used herein the term "enriched" can refer to increasing the amount or presence of one species in a mixed population of species relative to its amount prior to enrichment or relative to one or more other species in the mixed population. In some embodiments, an enriched population can be a substantially pure population, but such level of purity is not required to be said to be an enriched population. In some embodiments, a species in a population can be increased 1-100 fold or more in the enriched population. In some embodiments, a species in a population can be increased about 1 to 1,000 percent or more in the enriched population.
[0284] Described herein are embodiments of an isolated stromal cell and isolated stromal cell populations characterised in that the cell comprises the signature of dysfunction as defined above; to a population of said cells; to a composition or pharmaceutical composition comprising said stromal cell or said stromal cell population; and to a method for eliciting a response in a subject comprising administering to the subject said stromal cell or said stromal cell population or said pharmaceutical composition.
[0285] Described herein are isolated stromal cells that can have a specific cell identity, type and/or state. A generally applicable framework that utilizes a cell phenotype analysis technique, e.g. massively parallel single-cell RNA seq, can be used to identify cell identity, type, and/or state of an in vivo system (e.g. a stromal cell in vivo system). In vivo systems identified as having specific identity, type, and/or state can be isolated, maintained, stored, and/or used (e.g. in an ex vivo system or as a treatment that can be administered to a subject in need thereof) as desired and as described elsewhere herein. In some embodiments, the isolated cells can be used to screen for modulating agents. Methods of screening modulating agents are described elsewhere herein. In some embodiments, the specific cell state of interest to be identified can be a homeostatic cell state. In some embodiments, the specific cell state of interest to be identified can be dysfunctional or diseased cell state. In some embodiments, the specific cell type can be any one of the cell types of Clusters 1-17 as described in greater detail in the Working Examples herein. A stromal cell type, subtype, and/or a particular cell state (such as homeostatic or dysfunctional/diseased cell-state) can be identified as described elsewhere herein, such as by a unique signature. In some embodiments, the specific cell state of interest is a diseased or dysfunctional cell state, such as one that is associated with a hematological or hemopoietic disease or dysfunction.
Methods of Preparing Isolated and Enriched Bone Marrow Stromal Cell Populations.
[0286] Isolated and enriched stromal cells and populations thereof can be generated by detecting a signature in one or more of the cells and separating them from a parent or sample population based on that signature. Signatures and methods of measuring and detecting said signatures are described in greater detail elsewhere herein. In some embodiments, the isolated or enriched cell(s) can be further cultured, expanded, manipulated, engineered, modified, and/or modulated. Such methods are described in greater detail elsewhere herein and/or will be appreciated by those of ordinary skill in the art.
[0287] In some exemplary embodiments, described herein are methods of preparing a mesenchymal stem/stromal cell (MSC) enriched cell population a stromal cell population comprising:
[0288] enriching the population of stromal cells for cells that have an MSC gene signature, wherein the gene signature comprises
[0289] a. one or more genes of Table 1;
[0290] b. one or more of Cebpa, Zeb2, Runx2, Ebf1, Foxc1, Cebpb, Ar, Fos, Id4, Klf6, Irf1, Runx2, Jun, Snaj2, Maf, Zthx4, Id3, Egr1, Junb, Hp, Lpl, Gdpd2, Serping, Dpep1, Grem1, Pappa, Chrdl1, Fbln5, Vcam1, Kng1, H2-Q10, Cdh11, Mme, Tmem176b, Csf1, H2-K1, Serpine2, H2-D1, Tnc, Cdh2, Pdgtra, Esm1, Gas6, Cxcl14, Sfrp4, Wisp2, Agt, Il34, Fst, Fgf7, Il1rn, C2, Igfpb4, Serpina1, Cbln1, Apoe, Ibsp, Igfbp5, Gpx3, Pdzrn4, Rarres2, Vegfa, 1500009L16Rik, Serpina3g, Cyp1b1, Ebt3, Arrdc4, Kng2, Slc26a7, Marc1, Ms4ad4, Wdr86, Serpina3c, Tmem176a, Cldn10, Trt, Gpr88, Nnmt, Gm4951, Cd1d1, Plpp3, or Ackr4; or
[0291] c. Nte5, Vcam1, Eng, Thy1, Ly6a, Grem1, Cspg4, Nes, Runx2, Col1A1, Erg1, Junb, Fosb, Cebpb, Klf6, Nr4a1, Klf2, Atf3, Klf4, Maff, Nfia, Smad6, Hey1, Sp7, Id1, Ifrd1, Trib1, Rrad, Odc1, Actb, Notch2, AlpI, Mmp13, Raph1, Tnfsf11, Cxcl1, Adamts1, Cc17, Serpine1, Cc12, Apod, Cbln1, Pam, Col8a1, Wif1, Olfml3, Gdf10, Cyr61, Nog, Angpt4, Metrn1, Trabd2b, Adamts5, Igfbp4, Cxcl12, Igfbp5, Lepr, Cxcl12, Kit1, Grem1, or Angpt1;
[0292] and wherein the MCS optionally does not express one or more of Thy1, Ly6a (Sca-1), NG2 (Cspg4) or Nestin (Nes).
[0293] In some exemplary embodiments, described herein are methods of preparing an osteolineage (OLC) enriched cell population a stromal cell population comprising: enriching the population of stromal cells for cells that have an OLC gene signature, wherein the gene signature comprises
[0294] a. one or more genes of Table 2;
[0295] b. one or more of Vdr, Satb2, Sp7, Runx2, Tbx2, Zeb2, Dlx5, Dlx6, Zfhx4, Hey1, Irx5, Id3, Mxd4, Mef2c, Esr1, Maf, Smad6, Sox4, Cebpb, Meis3, Mmp13, Tnc, Cfh, Alp1, Lrp4, Cdh11, Casm1, Cdh2, Slit2, Bmp3, Cdh15, Fat3, Pard6g, Litr, Cp, Ptprd, Olfml3 Fign, Cd63, Fap, Dmp1, Angpt4, Chn1, Ibsp, Wisp1, Wif1, Metrn1, Vldlr, Podnl1, Col22a1, Ndnf, Mmp14, Pgf, Lox11, Mfap2, Srpx2, Agt, Tmem59, Vstm4, Col8a1, Cxcl12, Bglap2, Car3, Kcnk2, Slc36a2, Ifitm5, Hpgd, Limch1, Gm44029, Hvcn1, Tnfrsf19, Col13a1, Fam78b, Gja1, Cnn2, Ppfibp2, Cldn10, Dapk2, Tmp1, Bglap3, or Ramp1;
[0296] c. one or more of Runx2, Sp7, Grem1, Lepr, Cxcl12, Kit1, Bglap, Cd200, Spp1, Sox9, Id4, Ebf1, Ebf3, Cebpa, Foxc1, Snai2, Maf, Runx1, Thra, Plagl1, Mafb, Vdr, Cebpb, Tcf712, Bhlhe40, Snai1, Creb311, Zbtb7c, Gm22, Tcf7, Nr4a2, Atf3, Prrx2, Fbln5, H2-K1, H2-D1, Hp, Fstl1, Tmem176b, B2m, Pappa, Dpep1, Islr, Vcam1, Lepr, Mmp13, Cd200, Itgb5, Lifr, Postn, Slit2, Timp1, Lrp4, Tspan6, Ctsc, Cpz, Prss35, Tmeml19, Lox, Cryab, Pdzd2, Fyn, Gucala, Rerg, Sema4d, Vcam, Aspn, Slc20a2, Plat, Fmod, Fn1, Aebop1, Angpt12, Prkcdbp, Prelp, Cxcl12, Igfbp4, Cxcl14, Gas6, Apoe, Igfbp7, Col8a1, Serping1, Igfbp5, Igf1, Kit1, Spp1, Serpine2, Fam20c, Bmp8a, Dmp1, Ibsp, Pros1, Srpx2, Mgll, Timp3, Col11a2, Cgref1, Col1a1, Cthrc1, Sparc, Col22a1, Col5a2, Fkbp11, Col3a1, Ptn, Col6a2, Tnn, Npy, Col6a1, Omd, Dcn, Tgfbi, Col6a3, or Acan;
[0297] d. one or more of Runx2, Sp7, Grem1, Bglap, Cxcl12, Kit1, Osr1, Foxd1, Sox5, Osr2, Erg, Nfatc2, Mef2c, Sp7, Zbtb7c, Runx2, Snai2, Zfhx4, Dlx6, Meox1, Prrx1, Scx, Hic1, Peg3, Etv5, Ltbp1, Tspan8, Emb, Slc16a2, Tspan13, Creb5, Scara3, Prg4, Clu, plxdc1, Cdon, Fbln7, Ntn1, Nt5e, Thbd, Pth1r, Alp1, Cadm1, Cd200, Susd5, Rarres1, Ptprz1, Plat, Tnfrsf11b, Lpar3, Cspg4, Postn, S1pr1, Enah, Aspn, Cald1, Wnt5b, Adam12, Tnc, Pak1, Lpl, Mfap4, Cntfr, Fbln2, Fgl2, Gpc3, Ogn, Slc1a3, Spock2, Fbln5, Rgp1, Smoc1, C5ar1, Fzd9, Npr2, Fzd10, Cxcl14, Wif1, Arsi, Col12a1, Mgp, Itgbl1, Igf1, Smoc2, Spon2, Fst, Sbsn, Gas1, Sod3, Mmp3, Cilp, Pla2g2e, Fam213a, Acp5, Col15a1, Bglap2, Bglap3, Ibsp, Thbs4, Frzb, Bmp8a, Dkk1, Scube1, Chad, Spp1, Col11a2, Ptn, Ostn, Tnn, Mmp14, Gpx3, Cthrc1, Cxcl12, Prss12, Rbln1, Penk, Col8a1, Vipr2, Apod, Cpxm2, Rarres2, C4b, Sparcl1, Ly6e, R3hdml, Mia, Myoc, Nrtn, Pdzrn4, Spp1, Pth1r, Sox9, Acan, or Mmp13;
[0298] and wherein the OLC optionally expresses Bglap and Spp1.
[0299] In some exemplary embodiments, described herein are methods of preparing a chondrocyte enriched cell population a stromal cell population comprising:
[0300] enriching the population of stromal cells for cells that have a chondrocyte gene signature, wherein the gene signature comprises
[0301] a. one or more genes of Table 4;
[0302] b. one or more of Barx1, Pitx1, Foxd1, Osr2, Tbx18, Runx3, Osr2, Tbx18, Runx3, Peg3, Bhlhe41, Batf3, Plagl1, Sp7, Sox8, Lef1, Shox2, Zbtb20, Foxa3, Mef2c, Egr2, Pax1, Runx2, Prg4, Cpe, Mfi2, Scara3, Cpm, Chst1, Unc5q, Col11a1, Slc2a5, Slc26a2, Cspg4, Prc1, Fgfr3, Nid2, Spon1, Slc40a, Efemp1, Susd5, Fxyd3, Alp1, Corin, Tpd5211, Sema3d, F5, Slc38a3, Cytl1, Rbp4, Vit, Clip, Fam19a5, Col9a3, Col9a1, Col9a2, Matn3, Hapln1, Sfrp5, Notum, Mia, lhh, Mgst2, Rarres1, Gpld1, Il7b, Bglap, 1500015010Rik, Itm2a, Crispld1, Meg3, Cenpp, Fxyd2, 3110079O15Rik, Lect1, Papss2, SAyt8, Stmn1, Lockd, Chil1, Calml3, Ncmap, Serpina1d, Serpina 1b, Serpina 1c, Sic6a1, or Serpina1a;
[0303] c. one or more of Sox9, Col11a2, Acan, or Col2a1;
[0304] d. one or more of Runx2, Ihh, Mef2c, or Col10a1;
[0305] e. one or more of Grem1, Runx2, Sp7, Alp1, or Spp1;
[0306] f. one or more of Ihh, Pth1r, Mef2c, Col10a1, Ibsp, Mmp13, Grem1; or
[0307] g. one or more of Prg4, Gas1, Clu, Dcn, Cilp, Scara3, Cytl1, Igfbp7, Cilp2, Cpe, Sod3, Cd81, Abi3 bp, Creb5, Gsn, Crip2, Vit, Fhl1, Pam, Cd9, Prrx1, Vim, Col11a2, Col9a1, Col2a1, Col9a2, Col27a1, Col9a3, Hapln1, Acan, Matn3, Col11a1, Pth1r, Mia, Pcolce2, Chst11, Epyc, Serpinh1, Gnb211, Fscn1, Pla2g5, Rcn1, Sox9, Bglap, Sp7, Fn1, Ube2s, Hmgb1, Ckap4, Clec11a, Il7b, Ybx1, Tmem97, Rbm3, Slc26a2, C1qtnf3, Fkbp2, Prelp, Apoe, Cst3, Spon1, Olfml3, Wif1, Lef1, Notum, Emb, Col1a2, Sfrp5, Omd, Ctsd, Zbtb20, Islr, B2m, Ly6e, Alp1, Spp1, Chad, Timp3, Mef2c, Sparc, Ihh, Junb, Txnip, Rarres1, Scrg1, Sema3d, Colgalt2, Serinc5, Slc38a2, Ddit41, Egr1, Runx2, or Cxcl12.
[0308] In some exemplary embodiments, described herein are methods of preparing a fibroblast enriched cell population a stromal cell population comprising:
[0309] enriching the population of stromal cells for cells that have a fibroblast gene signature, wherein the gene signature comprises
[0310] a. one or more genes of Table 5;
[0311] b. one or more of Scx, Barx1, Trps1, Hoxd9, Pitx1, Prrx1, Rora, Prrx2, Meox2, Ebf2, Osr2, Ebf1, Dlx3, Zfhx2, Meox1, Etv4, Mkx, Dcn, Clu, Abi3 bp, Prelp, Lox, Tnxb, Col3a1, Vcan, Vi, Mfap5, Col14a1, Aspn, Pdpn, Pdgfra, F13a1, Clic5, Gpr1, Emilin2, Has1, Mtap4, Gas2, Ntng1, Serpinf1, Postn, Angpt17, Clip2, Clip, Sod3, Slurp1, Spp1, Clec3b, Igfbp6, Thds4, Dpt, Gsn, Fndc1, Pla1a, Adamts15, Figf, Htra4, Rspo2, Mstn, Ptx4, Spock3, Cpxm2, Itgbl1, Anxa8, Fxyd5, Fxyd6, Egln3, Ptgis, I133, Fgf9, Tppp3, Crlp1, Mustn1, Celf2, Tmod2, Ly6a, Fez1, Lysmd2, Pcsk6, 2210407C18Rik, Aldh1a3, Rtn1, Rab37, Lnmd, Chod1, Fam159b, Prph, or Insc;
[0312] c. Fibronectin-1 (Fn1), Fibroblast Specific Protein-1 (S100a4), Col1a1, Col1a2, Lum, Col22a1, or Twist2;
[0313] d. one or more of Sox9, Acan, and Col2a1;
[0314] e. Cd34, Ly6a, Pdgfra, Thy1 and Cd44, and not Cdh5, or Acta2;
[0315] f. one or more of Sox-9, Scleraxis (Scx), Spp1, Cspg4, CD73 (Nt5e), and Cartilage Intermediate Layer Protein (Cilp); or
[0316] g. one or more of S1004a, Dcn, Sema3c, or Cxcl12.
[0317] In some exemplary embodiments, described herein are methods of preparing a bone marrow derived endothelial cell (BMEC) enriched cell population a stromal cell population comprising:
[0318] enriching the population of stromal cells for cells that have a BMEC gene signature, wherein the gene signature comprises
[0319] a. one or more genes of Table 6;
[0320] b. one or more of Mafb, Pparg, Nr2f2, Irf8, Ets1, Sox17, Sox11, Bcl6b, Gata2, Tcf15, Meox1, Sox7, Tshz2, Tfpi, Gpm6a, Ackr1, Mrc1, Stab1, Vcam1, Tek, Flt1, Ramp3, Icam2, Podx1, Cd34, Mcam, Sdpr, Bcam, Tspan13, Fabp5, Vim, Kit1, Lrg1, Dnasel13, Sepp1, Egfl7, Pde2a, Gpihbp1, Sema3g, Ramp2, Cd3001g, C1qtnf9, Sparcl1, Tinagl1, Pdgfb, Ubd, Stab2, Fabp4, Cldn5, Rgs4, Ecscr, Cyyr1, Ly6c1, Magix, Cav1, Gngt2, Myct1, or Tmsb4x;
[0321] c. one or more of Flt4 (Vegfr-3) or Ly6a (Sca-1);
[0322] d. one or more of Pecam1, Cdh5, Cd34, Tek, Lepr, Cxcl12, or Kitl;
[0323] e. one or more of Flt4, Ly6a, Icam1, or Sele;
[0324] f. one or more of Mafb, Cebpb, Xbp1, Nr2f2, Irf8, Ybx1, Ebf1, Sox17, Mxd4, Id1, Meox2, Tshz2, Tcf15, Meox1, Tfpi, Il6stm Angpt4, Gpm6a, Vcam1, Emp1, Cd34, Gnas, Slc9a3r2, Cald1, Mcam, Tspan13, Vim, Cd9, Ptrf, Crip2, Sepp1, Ctsl, Adamts5, Apoe, Igfbp4, Sparc, Col4a2, Col4a1, Serpinh1, Ppic, Cxcl12, Cst3, Sparcl1, C1qtnf9, Tinagl1, Mgll, Kit1, Stab2, Ubd, Gm1673, Abcc9, Rgs4, Ly6c1, Actg1, Tsc22d1, Glu1, Fxyd5, Crip1, Cav1, S100a6, S100a10, lfitm2; or
[0325] g. one or more of Mafb, Cebpb, Xbp1, Nr2f2, Irf8, Ybx1, Ebf1, Sox17, Mxd4, Id1, Meox2, Tshz2, Tcf15, Meox1, Tfpi, Il6stm Angpt4, Gpm6a, Vcam1, Emp1, Cd34, Gnas, Slc9a3r2, Cald1, Mcam, Tspan13, Vim, Cd9, Ptrf, Crip2, Sepp1, Ctsl, Adamts5, Apoe, Igfbp4, Sparc, Col4a2, Col4a1, Serpinh1, Ppic, Cxcl12, Cst3, Sparcl1, C1qtnf9, Tinagl1, Mgll, Kit1, Stab2, Ubd, Gm1673, Abcc9, Rgs4, Ly6c1, Actg1, Tsc22d1, Glu1, Fxyd5, Crip1, Cav1, S100a6, S100a10, or lfitm2.
[0326] In some exemplary embodiments, described herein are methods of preparing a pericyte enriched cell population a stromal cell population comprising:
[0327] enriching the population of stromal cells for cells that have a pericyte gene signature, wherein the gene signature comprises
[0328] a. one or more genes in Table 3;
[0329] b. one or more of Hey1, Nr2f2, Tbx2, Ebf1, Ebf2, Foxsl, Id3, Met2c, Cebpb, Zfxh3, Nr4a1, Klf9, Zeb2, Prrx1, Meox2, Junb, Id4, Zfp467, Irf1, Arid5b, Atp1b2, Aoc3, Sncq, Itga7, Aspn, Steap4, Thy1, Filip1I, Parm1, Agtr1a, Olfml2a, Cald1, Ednra, Col18a1, Serpini1, Bcam, Rrad, Pdgfrb, Col5a3, Pde5a, Notch3, Myl1, Tinagl1, Art3, Ngf, Sparcl1, 116, Rarres2, Vstm4, Pgf, Pdgfa, Col4a2, Igfbp7, Col4a1, Fst, Rtn4lrl1, Adamts1, 1134, Gpc6, Cscll, Bgs5, Tagln, Higd1p, Nrip2, Gucv1a3, H2-M9, Des, Olfr558, Lmod1, Gucy1b3, Kcnk3, Pdlim3, Gm13861, Mrvi1, Pln, Gm13889, Ral11a, Cygp;
[0330] c. one or more of Cspg4, Ngfr, Des, Myh11, Acta2, Rgs5, Thy1, Pdgtfrb, Nes, Lepr, Cdh2, Cxcl12, Kitl. Ebf1, Sox4, Dlx5, Mxd4, Smad6, Hey1, Tcf15, Klf2, Mef2c, Atf3, Meox2, Steap4, Olfml2a, H2-M9, Tspan15, Cd24a, Marcks, Fbn1, Tnfrsf21, Slc12a2, Cfh, Cdh2, Vcam1, Sncg, Rasd1, Bcam, Rrad, Prkcdbp, Susd5, Csrrp1, Ptrf, Lama5, Ppp1r12b, Fhl1, Vim, Sdpr, Vtn, Angpt12, Cd44, Htra1, Mfap5, Anxa2, Procr, Igf1, Mgp, Col5a3, col4a2, Vstm4, Col3a1, Col4a1, Emcn, Gas1, Col6a2, Kit1, Sparcl1, Igfbp5, Ntf3, Inhba, Ccdc3, Fst, Timp3, Col1a1, Nbl1, Nov, Ccl11, Lga1s1, Dpt, Ctsl, Col6a3, Cxcl12, Rgs5, Abcc9, Phlda1, Tgs2, Cygb, Marcksl1, Apbb2, Ifitm3, Tmsb4x, Fam162a, Tagln, Pcp411, Crip1, Myl6, Acta2, Pln, Nrip2, Mustn1, Dstn, Mul9, Myh11, S100a6, Tppp3, Enpp2, S100a10, Cav1, Gstm1, Lysmd2, Myl12a, Nnmt, or S100a11; or
[0331] d. one or more of Acta2, Myh11, Mcam, Jag1, or Il6.
[0332] In some exemplary embodiments, enriching the population of stromal cells comprises determining an MSC, an OLC, a chondrocyte, a BMEC, a fibroblast, a pericyte gene signature, or a combination thereof, wherein the gene signature(s) are determined by single cell RNA sequencing.
Modified/Engineered Stromal Cell Populations
[0333] Described herein are modified and engineered stromal cells that can be engineered/modified to have a specific cell identity, type, and/or state. In some embodiments, cells (e.g. stromal cells) can be exposed to a modulating agent or method that is effective to modulate the identity, type, and/or state of the stromal cell prior to identification and/or isolation. Exposure of the cells to the agent can occur in vitro, ex vivo, or in vivo. In some embodiments, exposure of a stromal to the modulation agent can generate a stromal having a homeostatic cell state. In some embodiments, exposure of a stromal cell to the modulation agent can generate a stromal cell having a dysfunctional cell state. The identity, type, and/or state can be identified via an appropriate method which are described elsewhere herein, such as a method of detecting a signature in the engineered stromal cell. In some embodiments, a generally applicable framework that utilizes a cell phenotype analysis technique, e.g. massively parallel single-cell RNA seq, can be used to identify cell identity, type, and/or state of stromal cells. A homeostatic or activated cell-state in an stromal cell can be identified as described elsewhere herein. Other appropriate methods of analysis are described in greater detail elsewhere herein.
[0334] A gene, signature (e.g. a gene signature), and/or immune cell may be modified ex vivo. A gene, gene signature or immune cell may be modified in vivo. Not being bound by a theory, modifying immune and/or other cells (e.g. other stromal cells) in vivo, such that dysfunctional cells are decreased, can provide a therapeutic effect, including but not limited to enhancing an immune response and/or remodeling the bone marrow stromal cell landscape, and/or remodeling the bone marrow microenvironment in a subject. A gene, gene signature or immune cell may be modified by any suitable modulating agent. Methods of modulating cells, screening and identifying suitable modulating agents, and suitable modulating agents are described in greater detail elsewhere herein.
[0335] Methods of preparing the modified/engineered stromal cells is described in greater detail elsewhere herein.
Cell Culture
[0336] As described elsewhere herein, a stromal cell population can include a single cell type or sub-type, a combination of cell types and/or subtypes, cell-based therapeutic, an explant, or an organoid derived using one or more of the methods disclosed herein. Such methods can include culturing the cells. Populations of cells can contain one or more cell type and/or cell state. Cells can be derived from a subject. The subject can be a human. The subject can be a non-human mammal.
[0337] In certain embodiments, the single cell type or subtype or combination of cell types and/or subtypes comprises a bone marrow stromal cell, an immune cell, intestinal cell, liver cell, kidney cell, lung cell, brain cell, epithelial cell, endoderm cell, neuron, ectoderm cell, islet cell, acinar cell, oocyte, sperm, blood cell, hematopoietic cell, hepatocyte, skin/keratinocyte, melanocyte, bone/osteocyte, hair/dermal papilla cell, cartilage/chondrocyte, fat cell/adipocyte, skeletal muscular cell, endothelium cell, cardiac muscle/cardiomyocyte, trophoblast, tumor cell, tumor microenvironment (TME) cell and combinations thereof.
[0338] In certain embodiments, the single cell type or sub-type is pluripotent, multipotent, and/or or the combination of cell types and/or subtypes comprises one or more stem cells. The one or more stem cells may be selected from the group consisting of lymphoid stem cells, mesenchymal stem cells, myeloid stem cells, neural stem cells, skeletal muscle satellite cells, epithelial stem cells, endodermal and neuroectodermal stem cells, germ cells, extraembryonic and embryonic stem cells, mesenchymal stem cells, intestinal stem cells, embryonic stem cells, and induced pluripotent stem cells (iPSCs).
[0339] As used herein, the term "stem cell" refers to a multipotent cell having the capacity to self-renew and to differentiate into multiple cell lineages.
[0340] As used herein, the term "epithelial stem cell" refers to a multipotent cell which has the potential to become committed to multiple cell lineages, including cell lineages resulting in epithelial cells.
[0341] The tumor microenvironment (TME) is the cellular environment in which the tumor exists, including surrounding blood vessels, immune cells, cancer associated fibroblasts (CAFs), bone marrow-derived inflammatory cells, lymphocytes, signaling molecules and the extracellular matrix (ECM).
[0342] Tumor infiltrating lymphocytes (TILs) are lymphocytes that penetrate a tumor.
[0343] In certain embodiments, a cell-based therapeutic includes engraftment of the cells of the present invention. As used herein, the term "engraft" or "engraftment" refers to the process of cell incorporation into a tissue of interest in vivo through contact with existing cells of the tissue.
[0344] As used herein, a "population" of cells is any number of cells greater than 1, but is preferably at least 1.times.10.sup.3 cells, at least 1.times.10.sup.4 cells, at least at least 1.times.10.sup.5 cells, at least 1.times.10.sup.6 cells, at least 1.times.10.sup.7 cells, at least 1.times.10.sup.8 cells, at least 1.times.10.sup.9 cells, or at least 1.times.10.sup.10 cells.
[0345] As used herein, the term "organoid" or "epithelial organoid" refers to a cell cluster or aggregate that resembles an organ, or part of an organ, and possesses cell types relevant to that particular organ.
[0346] As used herein, a "subject" is a vertebrate, including any member of the class mammalia.
[0347] As used herein, a "mammal" refers to any mammal including but not limited to human, mouse, rat, sheep, monkey, goat, rabbit, hamster, horse, cow or pig.
[0348] A "non-human mammal", as used herein, refers to any mammal that is not a human.
[0349] General techniques useful in the practice of this invention in cell culture and media uses are known in the art (e.g., Large Scale Mammalian Cell Culture (Hu et al. 1997. Curr Opin Biotechnol 8: 148); Serum-free Media (K. Kitano. 1991. Biotechnology 17: 73); or Large Scale Mammalian Cell Culture (Curr Opin Biotechnol 2: 375, 1991). The terms "culturing" or "cell culture" are common in the art and broadly refer to maintenance of cells and potentially expansion (proliferation, propagation) of cells in vitro. Typically, animal cells, such as mammalian cells, such as human cells, are cultured by exposing them to (i.e., contacting them with) a suitable cell culture medium in a vessel or container adequate for the purpose (e.g., a 96-, 24-, or 6-well plate, a T-25, T-75, T-150 or T-225 flask, or a cell factory), at art-known conditions conducive to in vitro cell culture, such as temperature of 37.degree. C., 5% v/v CO.sub.2 and >95% humidity.
[0350] Methods related to stem cells and differentiating stem cells are known in the art (see, e.g., "Teratocarcinomas and embryonic stem cells: A practical approach" (E. J. Robertson, ed., IRL Press Ltd. 1987); "Guide to Techniques in Mouse Development" (P. M. Wasserman et al. eds., Academic Press 1993); "Embryonic Stem Cells: Methods and Protocols" (Kursad Turksen, ed., Humana Press, Totowa N.J., 2001); "Embryonic Stem Cell Differentiation in Vitro" (M. V. Wiles, Meth. Enzymol. 225: 900, 1993); "Properties and uses of Embryonic Stem Cells: Prospects for Application to Human Biology and Gene Therapy" (P. D. Rathjen et al., al., 1993). Differentiation of stem cells is reviewed, e.g., in Robertson. 1997. Meth Cell Biol 75: 173; Roach and McNeish. 2002. Methods Mol Biol 185: 1-16; and Pedersen. 1998. Reprod Fertil Dev 10: 31). For further elaboration of general techniques useful in the practice of this invention, the practitioner can refer to standard textbooks and reviews in cell biology, tissue culture, and embryology (see, e.g., Culture of Human Stem Cells (R. Ian Freshney, Glyn N. Stacey, Jonathan M. Auerbach--2007); Protocols for Neural Cell Culture (Laurie C. Doering--2009); Neural Stem Cell Assays (Navjot Kaur, Mohan C. Vemuri--2015); Working with Stem Cells (Henning Ulrich, Priscilla Davidson Negraes--2016); and Biomaterials as Stem Cell Niche (Krishnendu Roy--2010)).
[0351] Organoid technology has been previously described for example, for bone marrow, brain, retinal, stomach, lung, thyroid, small intestine, colon, liver, kidney, pancreas, prostate, mammary gland, fallopian tube, taste buds, salivary glands, and esophagus (see, e.g., Clevers, Modeling Development and Disease with Organoids, Cell. 2016 Jun. 16; 165(7):1586-1597).
[0352] For further methods of cell culture solutions and systems, see International Patent publication WO2014159356A1.
[0353] The culture methods described herein can be applied in other contexts throughout this specification as will be appreciated by those of ordinary skill in the art.
Methods of Detecting a Bone Marrow Stromal Cell Signature
[0354] Described herein are methods of identifying genes and gene product that are differentially expressed in bone marrow stromal cells and subsets thereof. In certain embodiments, determining expression comprises detecting RNA levels. In certain embodiments, determining expression comprises detecting protein levels. Accordingly, any suitable method can be used, such as but not limited to RNA-Seq, antibodies (for example to detect surface markers) and the like.
[0355] In certain example embodiments, assessing the cell (sub)types and states present in the in sample may comprise analysis of expression matrices from the scRNA-seq expression data, performing dimensionality reduction, graph-based clustering and deriving list of cluster-specific genes in order to identify cell types and/or states present in the in vivo system. These marker genes may then be used throughout to relate one cell state to another. For example, these marker genes can be used to relate stromal cell (sub)types and/or states to the homeostatic and/or active cell (sub(types) and/or states. The same analysis may then be applied to the source material for the sample or a control. From both sets of sc-RNAseq analysis an initial distribution of gene expression data is obtained. In certain embodiments, the distribution may be a count-based metric for the number of transcripts of each gene present in a cell. Further the clustering and gene expression matrix analysis allow for the identification of key genes in the homeostatic cell-state and the stromal cell state, such as differences in the expression of key transcription factors. In certain example embodiments, this may be done conducting differential expression analysis. For example, in the Working Examples below, differential gene expression analysis identified that different stromal cell types and/or cell states have differential gene expression signatures, such as those stromal cells of Clusters 1-17 and subtypes therein and those that are dysfunctional in a diseased state. In some embodiments, the signature, program and/or module can include one or more genes as set forth in any one of Tables 1-8 and combinations thereof. The methods disclosed herein can both identify key markers of different stromal cell types and/or states and potential targets for modulation to shift the expression distribution of the stromal cells from an initial state and/or type to another. Again, turning to the Examples provided herein, the single cell transcriptomic steps of the methods disclosed herein were used to identify that the stromal cells can be of 6 broad classes, 17 types (as identified as Clusters 1-17 in the Working Examples herein) and several sub-types therein and can be present in different cell states (such as dysfunctional and normal) had differential expression of one or more genes as set forth in at least Tables 1-8 or a combination thereof. Modulation of stromal cells is discussed in greater detail elsewhere herein.
[0356] In some aspects, identification of a specific stromal cell type/subtype and/or state can include detecting a shift, such as a statistically significant shift, in the cell-state as indicated by a modulated (e.g. an increased distance) in the gene expression space between a first type/subtype and/or cell state to a second cell type/subtype and/or cell state. In some aspects the first or the second cell state is a dysfunctional or diseased cell state. In some embodiments, the dysfunction or diseased cell state is the result of bone marrow micro environment remodeling by a cancer cell or cell population. In certain embodiments, the distance is measured by a Euclidean distance, Pearson coefficient, Spearman coefficient, or combination thereof.
[0357] In certain embodiments, the gene expression space comprises 10 or more genes, 20 or more genes, 30 or more genes, 40 or more genes, 50 or more genes, 100 or more genes, 500 or more genes, or 1000 or more genes. In certain embodiments, the expression space defines one or more cell pathways. In certain embodiments, the expression space is a transcriptome of the target in vivo system.
[0358] In certain embodiments, the shift in cell type and/or cell states that increases the distance in gene expression space between homeostatic cell-state and/or dysfunctional or diseased is a statistically significant shift in the gene expression distribution of the homeostatic and/or activated cell-state toward that of the dysfunctional or diseased cell state. The statistically significant shift may be at least 10%, at least 15%, at least 20%, at least 25%, at least 30%, at least 35%, at least 40%, at least 45%, at least 50%, at least 55%, at least 60%, at least 65%, at least 70%, at least 75%, at least 80%, at least 85%, at least 90%, at least 95%. The statistical shift may include the overall transcriptional identity or the transcriptional identity of one or more genes, gene expression cassettes, or gene expression signatures of the dysfunctional or diseased cell state compared cell state (i.e., at least 10%, at least 15%, at least 20%, at least 25%, at least 30%, at least 35%, at least 40%, at least 45%, at least 50%, at least 55%, at least 60%, at least 65%, at least 70%, at least 75%, at least 80%, at least 85%, at least 90%, at least 95% of the genes, gene expression cassettes, or gene expression signatures are statistically shifted in a gene expression distribution). A shift of 0% means that there is no difference to the homeostatic and/or activated cell state. A gene distribution may be the average or range of expression of particular genes, gene expression cassettes, or gene expression signatures in the homeostatic and/or dysfunctional or diseased cell-state (e.g., a plurality of a cell of interest from a subject may be sequenced and a distribution is determined for the expression of genes, gene expression cassettes, or gene expression signatures). In certain embodiments, the distribution is a count-based metric for the number of transcripts of each gene present in a cell. A statistical difference between the distributions indicates a shift. The one or more genes, gene expression cassettes, or gene expression signatures may be selected to compare transcriptional identity based on the one or more genes, gene expression cassettes, or gene expression signatures having the most variance as determined by methods of dimension reduction (e.g., tSNE analysis). In certain embodiments, comparing a gene expression distribution comprises comparing the initial cells with the lowest statistically significant shift as compared to the homeostatic and/or dysfunctional or diseased cell state (e.g., determining shifts when comparing only the dysfunctional or diseased cells with a shift of less than 95%, less than 90%, less than 85%, less than 80%, less than 75%, less than 70%, less than 65%, less than 60%, less than 55%, less than 50%, less than 45%, less than 40%, less than 35%, less than 30%, less than 25%, less than 20%, less than 15%, less than 10% to the homeostatic cell state). In certain example embodiments, statistical shifts may be determined by defining a homeostatic, activated, and/or diseased/dysfunctional state score.
[0359] For example, a gene list of key genes enriched in a homeostatic/activated model may be defined. To determine the fractional contribution to a cell's transcriptome to that gene list, the total log (scaled UMI+1) expression values for gene with the list of interest are summed and then divided by the total amount of scaled UMI detected in that cell giving a proportion of a cell's transcriptome dedicated to producing those genes. Thus, statistically significant shifts may be shifts in an initial score for the homeostatic score towards the dysfunctional or diseased score.
[0360] Other methods for assessing differences in the dysfunctional or diseased and homeostatic stromal cells may be employed. In certain example embodiments, an assessment of differences in the dysfunctional or diseased and homeostatic stromal cell proteome may be used to further identify key differences in cell type and sub-types or cells. states. For example, isobaric mass tag labeling and liquid chromatography mass spectroscopy may be used to determine relative protein abundances in the ex vivo and in vivo systems. Description provided elsewhere herein further disclosure on leveraging proteome analysis within the context of the methods disclosed herein.
[0361] Methods of detecting activation of a stromal cell are also described herein. In some embodiments, the method of detecting activation of a stromal cell comprising detection of a gene expression signature of activation selected from the group of:
[0362] a) a signature comprising or consisting of one or more markers selected from the group consisting of Cxcl12, Adipoq, Kit1, Lepr, Cebpa, Zeb2, Runx2, Ebf1, Foxc1, Cebpb, Ar, Fos, Id4, Klf6, Irf1, Runx2, Jun, Snaj2, Maf, Zthx4, Id3, Egr1, Junb, Hp, Lpl, Gdpd2, Serping, Dpep1, Grem1, Pappa, Chrdl1, Fbln5, Vcam1, Kng1, H2-Q10, Cdh11, Mme, Tmem176b, Csf1, H2-K1, Serpine2, H2-D1, Tnc, Cdh2, Pdgtra, Esm1, Gas6, Cxcl14, Sfrp4, Wisp2, Agt, Il34, Fst, Fgf7, Il1rn, C2, Igfpb4, Serpina1, Cbln1, Apoe, Ibsp, Igfbp5, Gpx3, Pdzrn4, Rarres2, Vegfa, 1500009L16Rik, Serpina3g, Cyp1b1, Ebt3, Arrdc4, Kng2, Slc26a7, Marc1, Ms4ad4, Wdr86, Serpina3c, Tmem176a, Cldn10, Trt, Gpr88, Nnmt, Gm4951, Cd1d1, Plpp3, or Ackr4;
[0363] b) a signature comprising or consisting of one or more markers selected from the group consisting of Bglap, Spp1, Vdr, Satb2, Sp7, Runx2, Tbx2, Zeb2, Dlx5, Dlx6, Zfhx4, Hey1, Irx5, Id3, Mxd4, Mef2c, Esr1, Maf, Smad6, Sox4, Cebpb, Meis3, Mmp13, Tnc, Cfh, Alp1, Lrp4, Cdh11, Casm1, Cdh2, Slit2, Bmp3, Cdh15, Fat3, Pard6g, Litr, Cp, Ptprd, Olfml3 Fign, Cd63, Fap, Dmp1, Angpt4, Chn1, Ibsp, Wisp1, Wif1, Metrn1, Vldlr, Podnl1, Col22a1, Ndnf, Mmp14, Pgf, Lox11, Mfap2, Srpx2, Agt, Tmem59, Vstm4, Col8a1, Cxcl12, Bglap2, Car3, Kcnk2, Slc36a2, Ifitm5, Hpgd, Limch1, Gm44029, Hvcn1, Tnfrsf19, Col13a1, Fam78b, Gja1, Cnn2, Ppfibp2, Cldn10, Dapk2, Tmp1, Bglap3, or Ramp1;
[0364] c) a signature comprising or consisting of one or more markers selected from the group consisting of Acta2, Myh11, Mcam, Hey1, Nr2f2, Tbx2, Ebf1, Ebf2, Foxsl, Id3, Met2c, Cebpb, Zfxh3, Nr4a1, Klf9, Zeb2, Prrx1, Meox2, Junb, Id4, Zfp467, Irf1, Arid5b, Atp1b2, Aoc3, Sncq, Itga7, Aspn, Steap4, Thy1, Filip1I, Parm1, Agtr1a, Olfml2a, Cald1, Ednra, Col18a1, Serpini1, Bcam, Rrad, Pdgfrb, Col5a3, Pde5a, Notch3, Myl1, Tinagl1, Art3, Ngf, Sparcl1, 116, Rarres2, Vstm4, Pgf, Pdgfa, Col4a2, Igfbp7, Col4a1, Fst, Rtn41r11, Adamts1, 1134, Gpc6, Cscll, Bgs5, Tagln, Higd1p, Nrip2, Gucv1a3, H2-M9, Des, Olfr558, Lmod1, Gucy1b3, Kcnk3, Pdlim3, Gm13861, Mrvi1, Pln, Gm13889, Ral11a, or Cygp;
[0365] d) a signature comprising or consisting of one or more markers selected from the group consisting of Sox9, Col11a2, Acan, Col2a1, Barx1, Pitx1, Foxd1, Osr2, Tbx18, Runx3, Osr2, Tbx18, Runx3, Peg3, Bhlhe41, Batf3, Plagl1, Sp7, Sox8, Lef1, Shox2, Zbtb20, Foxa3, Mef2c, Egr2, Pax1, Runx2, Prg4, Cpe, Mfi2, Scara3, Cpm, Chst1, Unc5q, Col11a1, Slc2a5, Slc26a2, Cspg4, Prc1, Fgfr3, Nid2, Spon1, Slc40a, Efemp1, Susd5, Fxyd3, Alp1, Corin, Tpd5211, Sema3d, F5, Slc38a3, Cytl1, Rbp4, Vit, Clip, Fam19a5, Col9a3, Col9a1, Col9a2, Matn3, Hapln1, Sfrp5, Notum, Mia, lhh, Mgst2, Rarres1, Gpld1, Il17b, Bglap, 1500015010Rik, Itm2a, Crispld1, Meg3, Cenpp, Fxyd2, 3110079O15Rik, Lect1, Papss2, SAyt8, Stmn1, Lockd, Chil1, Calml3, Ncmap, Serpina1d, Serpina 1b, Serpina 1c, Sic6a1, or Serpina1a;
[0366] e) a signature comprising or consisting of one or more markers selected from the group consisting of S100a4, Fn1, Col1a1, Col1a2, Lum, Col22a1, Twist2, Scx, Barx1, Trps1, Hoxd9, Pitx1, Prrx1, Rora, Prrx2, Meox2, Ebf2, Osr2, Ebf1, DIx3, Zfhx2, Meox1, Etv4, Mkx, Dcn, Clu, Abi3 bp, Prelp, Lox, Tnxb, Col3a1, Vcan, Vi, Mfap5, Col14a1, Aspn, Pdpn, Pdgfra, F13a1, Clic5, Gprl, Emilin2, Has1, Mtap4, Gas2, Ntng1, Serpinf1, Postn, Angpt17, Clip2, Clip, Sod3, Slurp1, Spp1, Clec3b, Igfbp6, Thds4, Dpt, Gsn, Fndc1, Pla1a, Adamts15, Figf, Htra4, Rspo2, Mstn, Ptx4, Spock3, Cpxm2, Itgbl1, Anxa8, Fxyd5, Fxyd6, Egln3, Ptgis, I133, Fgf9, Tppp3, Crlp1, Mustn1, Celf2, Tmod2, Ly6a, Fez1, Lysmd2, Pcsk6, 2210407C18Rik, Aldh1a3, Rtn1, Rab37, Lnmd, Chod1, Fam159b, Prph, or Insc;
[0367] f) a signature comprising or consisting of one or more markers selected from the group consisting of Kdr, Cdh5, Thbd, Emcn, Ly6e, Pecam1 Ly6a, Mafb, Pparg, Nr2f2, Irf8, Ets1, Sox17, Sox11, Bcl6b, Gata2, Tcf15, Meox1, Sox7, Tshz2, Tfpi, Gpm6a, Ackr1, Mrc1, Stab1, Vcam1, Tek, Flt1, Ramp3, Icam2, Podx1, Cd34, Mcam, Sdpr, Bcam, Tspan13, Fabp5, Vim, Kit1, Lrg1, Dnasell3, Sepp1, Egfl7, Pde2a, Gpihbp1, Sema3g, Ramp2, Cd3001g, C1qtnf9, Sparcl1, Tinagl1, Pdgfb, Ubd, Stab2, Fabp4, Cldn5, Rgs4, Ecscr, Cyyr1, Ly6c1, Magix, Cav1, Gngt2, Myct1, or Tmsb4x; or g) a signature comprising or consisting of two or more markers each independently selected from any one of the groups as defined in any one of a) to f).
[0368] In some exemplary embodiments, described herein are methods of detecting a mesenchymal stem/stromal cell (MSC) from a population of stromal cells comprising: detecting in a sample the expression or activity of a MSC gene expression signature, wherein detection of the MSC gene expression signature indicates MSCs in the sample, and wherein the MSC gene expression signature comprises:
[0369] a. one or more genes of Table 1;
[0370] b. one or more of Cebpa, Zeb2, Runx2, Ebf1, Foxc1, Cebpb, Ar, Fos, Id4, Klf6, Irf1, Runx2, Jun, Snaj2, Maf, Zthx4, Id3, Egr1, Junb, Hp, Lpl, Gdpd2, Serping, Dpep1, Grem1, Pappa, Chrdl1, Fbln5, Vcam1, Kng1, H2-Q10, Cdh11, Mme, Tmem176b, Csf1, H2-K1, Serpine2, H2-D1, Tnc, Cdh2, Pdgtra, Esm1, Gas6, Cxcl14, Sfrp4, Wisp2, Agt, Il34, Fst, Fgf7, Il1rn, C2, Igfpb4, Serpina1, Cbln1, Apoe, Ibsp, Igfbp5, Gpx3, Pdzrn4, Rarres2, Vegfa, 1500009L16Rik, Serpina3g, Cyp1b1, Ebt3, Arrdc4, Kng2, Slc26a7, Marc1, Ms4ad4, Wdr86, Serpina3c, Tmem176a, Cldn10, Trt, Gpr88, Nnmt, Gm4951, Cd1d1, Plpp3, or Ackr4; or
[0371] c. Nte5, Vcam1, Eng, Thy1, Ly6a, Grem1, Cspg4, Nes, Runx2, Col1A1, Erg1, Junb, Fosb, Cebpb, Klf6, Nr4a1, Klf2, Atf3, Klf4, Maff, Nfia, Smad6, Hey1, Sp7, Id1, Ifrd1, Trib1, Rrad, Odc1, Actb, Notch2, AlpI, Mmp13, Raph1, Tnfsf11, Cxcl1, Adamts1, Cc17, Serpine1, Cc12, Apod, Cbln1, Pam, Col8a1, Wif1, Olfml3, Gdf10, Cyr61, Nog, Angpt4, Metrn1, Trabd2b, Adamts5, Igfbp4, Cxcl12, Igfbp5, Lepr, Cxcl12, Kit1, Grem1, or Angpt1;
[0372] and wherein the MCS optionally does not express one or more of Thy1, Ly6a (Sca-1), NG2 (Cspg4) or Nestin (Nes).
[0373] In some exemplary embodiments, described herein are methods of detecting an osteolineage cell (OLC) from a population of stromal cells comprising:
[0374] detecting in a sample the expression or activity of an OLC gene expression signature,
[0375] wherein detection of the OLC gene expression signature indicates OLCs in the sample, and
[0376] wherein the OLC gene expression signature comprises
[0377] a. one or more genes of Table 2;
[0378] b. one or more of Vdr, Satb2, Sp7, Runx2, Tbx2, Zeb2, Dlx5, Dlx6, Zfhx4, Hey1, Irx5, Id3, Mxd4, Mef2c, Esr1, Maf, Smad6, Sox4, Cebpb, Meis3, Mmp13, Tnc, Cfh, Alp1, Lrp4, Cdh11, Casm1, Cdh2, Slit2, Bmp3, Cdh15, Fat3, Pard6g, Litr, Cp, Ptprd, Olfml3 Fign, Cd63, Fap, Dmp1, Angpt4, Chn1, Ibsp, Wisp1, Wif1, Metrn1, Vldlr, Podnl1, Col22a1, Ndnf, Mmp14, Pgf, Lox11, Mfap2, Srpx2, Agt, Tmem59, Vstm4, Col8a1, Cxcl12, Bglap2, Car3, Kcnk2, Slc36a2, Ifitm5, Hpgd, Limch1, Gm44029, Hvcn1, Tnfrsf19, Col13a1, Fam78b, Gja1, Cnn2, Ppfibp2, Cldn10, Dapk2, Tmp1, Bglap3, or Ramp1;
[0379] c. one or more of Runx2, Sp7, Grem1, Lepr, Cxcl12, Kit1, Bglap, Cd200, Spp1, Sox9, Id4, Ebf1, Ebf3, Cebpa, Foxc1, Snai2, Maf, Runx1, Thra, Plagl1, Mafb, Vdr, Cebpb, Tcf712, Bhlhe40, Snai1, Creb311, Zbtb7c, Gm22, Tcf7, Nr4a2, Atf3, Prrx2, Fbln5, H2-K1, H2-D1, Hp, Fstl1, Tmem176b, B2m, Pappa, Dpep1, Islr, Vcam1, Lepr, Mmp13, Cd200, Itgb5, Lifr, Postn, Slit2, Timp1, Lrp4, Tspan6, Ctsc, Cpz, Prss35, Tmeml19, Lox, Cryab, Pdzd2, Fyn, Gucala, Rerg, Sema4d, Vcam, Aspn, Slc20a2, Plat, Fmod, Fn1, Aebop1, Angpt12, Prkcdbp, Prelp, Cxcl12, Igfbp4, Cxcl14, Gas6, Apoe, Igfbp7, Col8a1, Serping1, Igfbp5, Igf1, Kit1, Spp1, Serpine2, Fam20c, Bmp8a, Dmp1, Ibsp, Pros1, Srpx2, Mgll, Timp3, Col11a2, Cgref1, Col1a1, Cthrc1, Sparc, Col22a1, Col5a2, Fkbp11, Col3a1, Ptn, Col6a2, Tnn, Npy, Col6a1, Omd, Dcn, Tgfbi, Col6a3, or Acan;
[0380] d. one or more of Runx2, Sp7, Grem1, Bglap, Cxcl12, Kit1, Osr1, Foxd1, Sox5, Osr2, Erg, Nfatc2, Mef2c, Sp7, Zbtb7c, Runx2, Snai2, Zfhx4, Dlx6, Meox1, Prrx1, Scx, Hic1, Peg3, Etv5, Ltbp1, Tspan8, Emb, Slc16a2, Tspan13, Creb5, Scara3, Prg4, Clu, plxdc1, Cdon, Fbln7, Ntn1, Nt5e, Thbd, Pth1r, Alp1, Cadm1, Cd200, Susd5, Rarres1, Ptprz1, Plat, Tnfrsf11b, Lpar3, Cspg4, Postn, S1pr1, Enah, Aspn, Cald1, Wnt5b, Adam12, Tnc, Pak1, Lpl, Mfap4, Cntfr, Fbln2, Fgl2, Gpc3, Ogn, Slc1a3, Spock2, Fbln5, Rgp1, Smoc1, C5ar1, Fzd9, Npr2, Fzd10, Cxcl14, Wif1, Arsi, Col12a1, Mgp, Itgbl1, Igf1, Smoc2, Spon2, Fst, Sbsn, Gas1, Sod3, Mmp3, Cilp, Pla2g2e, Fam213a, Acp5, Col15a1, Bglap2, Bglap3, Ibsp, Thbs4, Frzb, Bmp8a, Dkk1, Scube1, Chad, Spp1, Col11a2, Ptn, Ostn, Tnn, Mmp14, Gpx3, Cthrc1, Cxcl12, Prss12, Rbln1, Penk, Col8a1, Vipr2, Apod, Cpxm2, Rarres2, C4b, Sparcl1, Ly6e, R3hdml, Mia, Myoc, Nrtn, Pdzrn4, Spp1, Pth1r, Sox9, Acan, or Mmp13];
[0381] and wherein the OLC optionally expresses Bglap and Spp1.
[0382] In some exemplary embodiments, described herein are methods of detecting a chondrocyte from a population of stromal cells comprising:
[0383] detecting in a sample the expression or activity of a chondrocyte gene expression signature,
[0384] wherein detection of the chondrocyte gene expression signature indicates chondrocytes in the sample, and
[0385] wherein the chondrocyte gene expression signature comprises
[0386] a. one or more genes of Table 4;
[0387] b. one or more of Barx1, Pitx1, Foxd1, Osr2, Tbx18, Runx3, Osr2, Tbx18, Runx3, Peg3, Bhlhe41, Batf3, Plagl1, Sp7, Sox8, Lef1, Shox2, Zbtb20, Foxa3, Mef2c, Egr2, Pax1, Runx2, Prg4, Cpe, Mfi2, Scara3, Cpm, Chst11, Unc5q, Col11a1, Slc2a5, Slc26a2, Cspg4, Prc1, Fgfr3, Nid2, Spon1, Slc40a, Efemp1, Susd5, Fxyd3, Alp1, Corin, Tpd5211, Sema3d, F5, Slc38a3, Cytl1, Rbp4, Vit, Clip, Fam19a5, Col9a3, Col9a1, Col9a2, Matn3, Hapln1, Sfrp5, Notum, Mia, lhh, Mgst2, Rarres1, Gpld1, Il17b, Bglap, 1500015010Rik, Itm2a, Crispld1, Meg3, Cenpp, Fxyd2, 3110079O15Rik, Lect1, Papss2, SAyt8, Stmn1, Lockd, Chil1, Calml3, Ncmap, Serpina1d, Serpina 1b, Serpina 1c, Sic6a1, or Serpina1a;
[0388] c. one or more of Sox9, Col11a2, Acan, or Col2a1;
[0389] d. one or more of Runx2, Ihh, Mef2c, or Col10a1;
[0390] e. one or more of Grem1, Runx2, Sp7, Alp1, or Spp1;
[0391] f. one or more of Ihh, Pth1r, Mef2c, Col10a1, Ibsp, Mmp13, Grem 1; or
[0392] g. one or more of Prg4, Gas1, Clu, Dcn, Cilp, Scara3, Cytl1, Igfbp7, Cilp2, Cpe, Sod3, Cd81, Abi3 bp, Creb5, Gsn, Crip2, Vit, Fhl1, Pam, Cd9, Prrx1, Vim, Col11a2, Col9a1, Col2a1, Col9a2, Col27a1, Col9a3, Hapln1, Acan, Matn3, Col11a1, Pth1r, Mia, Pcolce2, Chst11, Epyc, Serpinh1, Gnb211, Fscn1, Pla2g5, Rcn1, Sox9, Bglap, Sp7, Fn1, Ube2s, Hmgb1, Ckap4, Clec11a, Il17b, Ybx1, Tmem97, Rbm3, Slc26a2, C1qtnf3, Fkbp2, Prelp, Apoe, Cst3, Spon1, Olfml3, Wif1, Lef1, Notum, Emb, Col1a2, Sfrp5, Omd, Ctsd, Zbtb20, Islr, B2m, Ly6e, Alp1, Spp1, Chad, Timp3, Mef2c, Sparc, Ihh, Junb, Txnip, Rarres1, Scrg1, Sema3d, Colgalt2, Serinc5, Slc38a2, Ddit41, Egr1, Runx2, or Cxcl12.
[0393] In some exemplary embodiments, described herein are methods of detecting a fibroblast from a population of stromal cells comprising:
[0394] detecting in a sample the expression or activity of a fibroblast gene expression signature,
[0395] wherein detection of the fibroblast gene expression signature indicates fibroblasts in the sample, and
[0396] wherein the fibroblast gene expression signature comprises
[0397] a. one or more genes of Table 5;
[0398] b. one or more of Scx, Barx1, Trps1, Hoxd9, Pitx1, Prrx1, Rora, Prrx2, Meox2, Ebf2, Osr2, Ebf1, Dlx3, Zfhx2, Meox1, Etv4, Mkx, Dcn, Clu, Abi3 bp, Prelp, Lox, Tnxb, Col3a1, Vcan, Vi, Mfap5, Col14a1, Aspn, Pdpn, Pdgfra, F13a1, Clic5, Gpr1, Emilin2, Has1, Mtap4, Gas2, Ntng1, Serpinf1, Postn, Angpt17, Clip2, Clip, Sod3, Slurp1, Spp1, Clec3b, Igfbp6, Thds4, Dpt, Gsn, Fndc1, Pla1a, Adamts15, Figf, Htra4, Rspo2, Mstn, Ptx4, Spock3, Cpxm2, Itgbl1, Anxa8, Fxyd5, Fxyd6, Egln3, Ptgis, I133, Fgf9, Tppp3, Crlp1, Mustn1, Celf2, Tmod2, Ly6a, Fez1, Lysmd2, Pcsk6, 2210407C18Rik, Aldh1a3, Rtn1, Rab37, Lnmd, Chod1, Fam159b, Prph, or Insc;
[0399] c. Fibronectin-1 (Fn1), Fibroblast Specific Protein-1 (S100a4), Col1a1, Col1a2, Lum, Col22a1, or Twist2;
[0400] d. one or more of Sox9, Acan, and Col2a1;
[0401] e. Cd34, Ly6a, Pdgfra, Thy1 and Cd44, and not Cdh5, or Acta2;
[0402] f. one or more of Sox-9, Scleraxis (Scx), Spp1, Cspg4, CD73 (Nt5e), and Cartilage Intermediate Layer Protein (Cilp); or
[0403] g. one or more of S1004a, Dcn, Sema3c, or Cxcl12.
[0404] In some exemplary embodiments, described herein are methods of detecting a bone marrow derived endothelial cell (BMEC) from a population of stromal cells comprising: detecting in a sample the expression or activity of a BMEC gene expression signature,
[0405] wherein detection of the BMEC gene expression signature indicates BMECs in the sample, and
[0406] wherein the fibroblast gene expression signature comprises
[0407] a. one or more genes of Table 6;
[0408] b. one or more of Mafb, Pparg, Nr2f2, Irf8, Ets1, Sox17, Sox11, Bcl6b, Gata2, Tcf15, Meox1, Sox7, Tshz2, Tfpi, Gpm6a, Ackr1, Mrc1, Stab1, Vcam1, Tek, Flt1, Ramp3, Icam2, Podx1, Cd34, Mcam, Sdpr, Bcam, Tspan13, Fabp5, Vim, Kit1, Lrg1, Dnasel13, Sepp1, Egfl7, Pde2a, Gpihbp1, Sema3g, Ramp2, Cd3001g, C1qtnf9, Sparcl1, Tinagl1, Pdgfb, Ubd, Stab2, Fabp4, Cldn5, Rgs4, Ecscr, Cyyr1, Ly6c1, Magix, Cav1, Gngt2, Myct1, or Tmsb4x;
[0409] c. one or more of Flt4 (Vegfr-3) or Ly6a (Sca-1);
[0410] d. one or more of Pecam1, Cdh5, Cd34, Tek, Lepr, Cxcl12, or Kitl;
[0411] e. one or more of Flt4, Ly6a, Icam1, or Sele;
[0412] f. one or more of Mafb, Cebpb, Xbp1, Nr2f2, Irf8, Ybx1, Ebf1, Sox17, Mxd4, Id1, Meox2, Tshz2, Tcf15, Meox1, Tfpi, Il6stm Angpt4, Gpm6a, Vcam1, Emp1, Cd34, Gnas, Slc9a3r2, Cald1, Mcam, Tspan13, Vim, Cd9, Ptrf, Crip2, Sepp1, Ctsl, Adamts5, Apoe, Igfbp4, Sparc, Col4a2, Col4a1, Serpinh1, Ppic, Cxcl12, Cst3, Sparcl1, C1qtnf9, Tinagl1, Mgll, Kit1, Stab2, Ubd, Gm1673, Abcc9, Rgs4, Ly6c1, Actg1, Tsc22d1, Glu1, Fxyd5, Crip1, Cav1, S100a6, S100a10, lfitm2; or
[0413] g. one or more of Mafb, Cebpb, Xbp1, Nr2f2, Irf8, Ybx1, Ebf1, Sox17, Mxd4, Id1, Meox2, Tshz2, Tcf15, Meox1, Tfpi, Il6stm Angpt4, Gpm6a, Vcam1, Emp1, Cd34, Gnas, Slc9a3r2, Cald1, Mcam, Tspan13, Vim, Cd9, Ptrf, Crip2, Sepp1, Ctsl, Adamts5, Apoe, Igfbp4, Sparc, Col4a2, Col4a1, Serpinh1, Ppic, Cxcl12, Cst3, Sparcl1, C1qtnf9, Tinagl1, Mgll, Kit1, Stab2, Ubd, Gm1673, Abcc9, Rgs4, Ly6c1, Actg1, Tsc22d1, Glu1, Fxyd5, Crip1, Cav1, S100a6, S100a10, or lfitm2.
[0414] In some exemplary embodiments, described herein are methods of detecting a pericyte from a population of stromal cells comprising:
[0415] detecting in a sample the expression or activity of a pericyte gene expression signature,
[0416] wherein detection of the pericyte gene expression signature indicates pericyte s in the sample, and
[0417] wherein the fibroblast gene expression signature comprises
[0418] a. one or more genes in Table 3;
[0419] b. one or more of Hey1, Nr2f2, Tbx2, Ebf1, Ebf2, Foxsl, Id3, Met2c, Cebpb, Zfxh3, Nr4a1, Klf9, Zeb2, Prrx1, Meox2, Junb, Id4, Zfp467, Irf1, Arid5b, Atp1b2, Aoc3, Sncq, Itga7, Aspn, Steap4, Thy1, Filip1I, Parm1, Agtr1a, Olfml2a, Cald1, Ednra, Col18a1, Serpini1, Bcam, Rrad, Pdgfrb, Col5a3, Pde5a, Notch3, Myl1, Tinagl1, Art3, Ngf, Sparcl1, 116, Rarres2, Vstm4, Pgf, Pdgfa, Col4a2, Igfbp7, Col4a1, Fst, Rtn4lrl1, Adamts1, 1134, Gpc6, Cscll, Bgs5, Tagln, Higd1p, Nrip2, Gucv1a3, H2-M9, Des, Olfr558, Lmod1, Gucy1b3, Kcnk3, Pdlim3, Gm13861, Mrvi1, Pln, Gm13889, Ral11a, Cygp;
[0420] c. one or more of Cspg4, Ngfr, Des, Myh11, Acta2, Rgs5, Thy1, Pdgtfrb, Nes, Lepr, Cdh2, Cxcl12, Kitl. Ebf1, Sox4, Dlx5, Mxd4, Smad6, Hey1, Tcf15, Klf2, Mef2c, Atf3, Meox2, Steap4, Olfml2a, H2-M9, Tspan15, Cd24a, Marcks, Fbn1, Tnfrsf21, Slc12a2, Cfh, Cdh2, Vcam1, Sncg, Rasd1, Bcam, Rrad, Prkcdbp, Susd5, Csrrp1, Ptrf, Lama5, Ppp1r12b, Fhl1, Vim, Sdpr, Vtn, Angpt12, Cd44, Htra1, Mfap5, Anxa2, Procr, Igf1, Mgp, Col5a3, col4a2, Vstm4, Col3a1, Col4a1, Emcn, Gas1, Col6a2, Kit1, Sparcl1, Igfbp5, Ntf3, Inhba, Ccdc3, Fst, Timp3, Col1a1, Nbl1, Nov, Ccl11, Lga1s1, Dpt, Ctsl, Col6a3, Cxcl12, Rgs5, Abcc9, Phlda1, Tgs2, Cygb, Marcksl1, Apbb2, Ifitm3, Tmsb4x, Fam162a, Tagln, Pcp411, Crip1, Myl6, Acta2, Pln, Nrip2, Mustn1, Dstn, Mul9, Myh11, S100a6, Tppp3, Enpp2, S100a10, Cav1, Gstm1, Lysmd2, Myl12a, Nnmt, or S100a11; or
[0421] d. one or more of Acta2, Myh11, Mcam, Jag1, or Il6.
[0422] In some exemplary embodiments, the sample is obtained from the blood or bone marrow.
Gene Expression Space and Expression Signatures
[0423] As is also discussed elsewhere herein a "signature" may encompass any gene or genes, protein or proteins, or epigenetic element(s) whose expression profile or whose occurrence is associated with a specific cell type, subtype, or cell state of a specific cell type or subtype within a population of cells. For ease of discussion, when discussing gene expression, any of gene or genes, protein or proteins, or epigenetic element(s) may be substituted. As used herein, the terms "signature", "expression profile", or "expression program" may be used interchangeably. It is to be understood that also when referring to proteins (e.g. differentially expressed proteins), such may fall within the definition of "gene" signature. Levels of expression or activity or prevalence may be compared between different cells in order to characterize or identify for instance signatures specific for cell (sub)populations. Increased or decreased expression or activity or prevalence of signature genes may be compared between different cells in order to characterize or identify for instance specific cell (sub)populations. The detection of a signature in single cells may be used to identify and quantitate for instance specific cell (sub)populations. A signature may include a gene or genes, protein or proteins, or epigenetic element(s) whose expression or occurrence is specific to a cell (sub)population, such that expression or occurrence is exclusive to the cell (sub)population. A gene signature as used herein, may thus refer to any set of up- and down-regulated genes that are representative of a cell type or subtype. A gene signature as used herein, may also refer to any set of up- and down-regulated genes between different cells or cell (sub)populations derived from a gene-expression profile. For example, a gene signature may comprise a list of genes differentially expressed in a distinction of interest.
[0424] The signature as defined herein (being it a gene signature, protein signature or other genetic or epigenetic signature) can be used to indicate the presence of a cell type, a subtype of the cell type, the state of the microenvironment of a population of cells, a particular cell type population or subpopulation, and/or the overall status of the entire cell (sub)population. Furthermore, the signature may be indicative of cells within a population of cells in vivo. The signature may also be used to suggest for instance particular therapies, or to follow up treatment, or to suggest ways to modulate immune systems. The signatures of the present invention may be detected by analysis of expression profiles of single-cells within a population of cells from isolated samples (e.g. tumor samples), thus allowing the discovery of novel cell subtypes or cell states that were previously invisible or unrecognized. The presence of subtypes or cell states may be determined by subtype specific or cell state specific signatures. The presence of these specific cell (sub)types or cell states may be determined by applying the signature genes to bulk sequencing data in a sample. Not being bound by a theory the signatures of the present invention may be microenvironment specific, such as their expression in a particular spatio-temporal context. Not being bound by a theory, signatures as discussed herein are specific to a particular pathological context. Not being bound by a theory, a combination of cell subtypes having a particular signature may indicate an outcome. Not being bound by a theory, the signatures can be used to deconvolute the network of cells present in a particular pathological condition. Not being bound by a theory the presence of specific cells and cell subtypes are indicative of a particular response to treatment, such as including increased or decreased susceptibility to treatment. The signature may indicate the presence of one particular cell type. In one embodiment, the novel signatures are used to detect multiple cell states or hierarchies that occur in subpopulations of cancer cells that are linked to particular pathological condition (e.g. cancer grade), or linked to a particular outcome or progression of the disease (e.g. metastasis), or linked to a particular response to treatment of the disease.
[0425] The signature according to certain embodiments of the present invention may comprise or consist of one or more genes, proteins and/or epigenetic elements, such as for instance 1, 2, 3, 4, 5, 6, 7, 8, 9, 10 or more. In certain embodiments, the signature may comprise or consist of two or more genes, proteins and/or epigenetic elements, such as for instance 2, 3, 4, 5, 6, 7, 8, 9, 10 or more. In certain embodiments, the signature may comprise or consist of three or more genes, proteins and/or epigenetic elements, such as for instance 3, 4, 5, 6, 7, 8, 9, 10 or more. In certain embodiments, the signature may comprise or consist of four or more genes, proteins and/or epigenetic elements, such as for instance 4, 5, 6, 7, 8, 9, 10 or more. In certain embodiments, the signature may comprise or consist of five or more genes, proteins and/or epigenetic elements, such as for instance 5, 6, 7, 8, 9, 10 or more. In certain embodiments, the signature may comprise or consist of six or more genes, proteins and/or epigenetic elements, such as for instance 6, 7, 8, 9, 10 or more. In certain embodiments, the signature may comprise or consist of seven or more genes, proteins and/or epigenetic elements, such as for instance 7, 8, 9, 10 or more. In certain embodiments, the signature may comprise or consist of eight or more genes, proteins and/or epigenetic elements, such as for instance 8, 9, 10 or more. In certain embodiments, the signature may comprise or consist of nine or more genes, proteins and/or epigenetic elements, such as for instance 9, 10 or more. In certain embodiments, the signature may comprise or consist of ten or more genes, proteins and/or epigenetic elements, such as for instance 10, 11, 12, 13, 14, 15, or more. It is to be understood that a signature according to the invention may for instance also include genes or proteins as well as epigenetic elements combined.
[0426] In certain embodiments, a signature is characterized as being specific for a particular cell or cell (sub)population if it is upregulated or only present, detected or detectable in that particular cell or cell (sub)population, or alternatively is downregulated or only absent, or undetectable in that particular cell or cell (sub)population. In this context, a signature consists of one or more differentially expressed genes/proteins or differential epigenetic elements when comparing different cells or cell (sub)populations, including comparing different tumor cells or tumor cell (sub)populations, as well as comparing tumor cells or tumor cell (sub)populations with non-tumor cells or non-tumor cell (sub)populations. It is to be understood that "differentially expressed" genes/proteins include genes/proteins which are up- or down-regulated as well as genes/proteins which are turned on or off. When referring to up- or down-regulation, in certain embodiments, such up- or down-regulation is preferably at least two-fold, such as two-fold, three-fold, four-fold, five-fold, or more, such as for instance at least ten-fold, at least 20-fold, at least 30-fold, at least 40-fold, at least 50-fold, or more. Alternatively, or in addition, differential expression may be determined based on common statistical tests, as is known in the art.
[0427] As discussed herein, differentially expressed genes/proteins, or differential epigenetic elements may be differentially expressed on a single cell level, or may be differentially expressed on a cell population level. Preferably, the differentially expressed genes/proteins or epigenetic elements as discussed herein, such as constituting the gene signatures as discussed herein, when as to the cell population level, refer to genes that are differentially expressed in all or substantially all cells of the population (such as at least 80%, preferably at least 90%, such as at least 95% of the individual cells). This allows one to define a particular subpopulation of cells. As referred to herein, a "subpopulation" of cells preferably refers to a particular subset of cells of a particular cell type which can be distinguished or are uniquely identifiable and set apart from other cells of this cell type. The cell subpopulation may be phenotypically characterized, and is preferably characterized by the signature as discussed herein. A cell (sub)population as referred to herein may constitute of a (sub)population of cells of a particular cell type characterized by a specific cell state.
[0428] When referring to induction, or alternatively suppression of a particular signature, preferable is meant induction or alternatively suppression (or upregulation or downregulation) of at least one gene/protein and/or epigenetic element of the signature, such as for instance at least to, at least three, at least four, at least five, at least six, or all genes/proteins and/or epigenetic elements of the signature.
[0429] In further aspects, the invention relates to gene signatures, protein signature, and/or other genetic or epigenetic signature of particular stromal cell subpopulations, as defined herein elsewhere.
[0430] scRNA-seq may be obtained from cells using standard techniques known in the art. Some exemplary scRNA-seq techniques are discussed elsewhere herein. As discussed elsewhere herein, a collection of mRNA levels for a single cell can be called an expression profile (or expression signature) and is often represented mathematically by a vector in gene expression space. See e.g. Wagner et al., 2016. Nat. Biotechnol; 34(111): 1145-1160. This is a vector space that has a dimension corresponding to each gene, with the value of the ith coordinate of an expression profile vector representing the number of copies of mRNA for the ith gene. Note that real cells only occupy an integer lattice in gene expression space (because the number of copies of mRNA is an integer), but it is assumed herein that cells can move continuously through a real-valued G dimensional vector space.
[0431] As an individual cell changes the genes it expresses over time, it moves in gene expression space and describes a trajectory. As a population of cells develops and grows, a distribution on gene expression space evolves over time. When a single cell from such a population is measured with single cell RNA sequencing, a noisy estimate of the number of molecules of mRNA for each gene is obtained. The measured expression profile of this single cell is represented as a sample from a probability distribution on gene expression space. This sampling captures both (a) the randomness in the single cell RNA sequencing measurement process (due to sub-sampling reads, technical issues, etc.) and (b) the random selection of a cell from a population. This probability distribution is treated as nonparametric in the sense that it is not specified by any finite list of parameters.
[0432] A precise mathematical notion for a developmental process as a generalization of a stochastic process is provided below. A goal of the methods disclosed herein is to infer the ancestors and descendants of subpopulations evolving according to an unknown developmental, disease, and/or other physiological process and/or corresponding to a specific cell state at the beginning, end, or any point during the developmental process. While not bound by a particular theory, this may be possible over short time scales because it is reasonable to assume that cells don't change too much and therefore it can be inferred which cells go where. It will be appreciated that "developmental" when used in this context is not limited to the "growth/maturity" of an organism/cell, but rather refers to any characteristic that can change temporally and/or spatially such that the characteristic can be said to "develop" over time and/or space through a "developmental process".
[0433] In certain example embodiments, the following definitions to define a precise notion of the developmental trajectory of an individual cell and its descendants are used. It is a continuous path in gene expression that bifurcates with every cell division. Formally, consider a cell x(o).di-elect cons..sup.G. Let k(t).gtoreq.0 specify the number of descendants at time t, where k(0)=1. A single cell developmental trajectory is a continuous function
x : [ 0 , T ) .fwdarw. G .times. G .times. .times. G k ( t ) times . ##EQU00001##
This means that x(t) is a k(t)-tuple of cells, each represented by a vector .sup.G:
x(t)=(x.sub.1(t), . . . ,x.sub.k(t)(t)).
Cells x.sub.1(t), . . . , x.sub.k(t)(t) as the descendants of x(o).
[0434] .sup.G and R.sup.G are used interchangeably.
[0435] Note that the temporal dynamics of an individual cell cannot be directly measured because scRNA-Seq is a destructive measurement process: scRNA-Seq lyses cells so it is only possible to measure the expression profile of a cell at a single point in time. As a result, it is not possible to directly measure the descendants of that cell, and it is (usually) not possible to directly measure which cells share a common ancestor with ordinary scRNA-Seq. Therefore, the full trajectory of a specific cell is unobservable. However, one can learn something about the probable trajectories of individual cells by measuring snapshots from an evolving population.
[0436] Published methods typically represent the aggregate trajectory of a population of cells with a graph. While this recapitulates the branching path traveled by the descendants of an individual cell, it may over-simplify the stochastic nature of developmental processes. Individual cells have the potential to travel through different paths, but in reality any given cell travels one and only one such path. The methods disclosed herein help to describe this potential, which might not be a represented by a graph as a union of one-dimensional paths.
[0437] Instead, a developmental process is defined to be a time-varying distribution on gene expression space. The word distribution is used to refer to an object that assigns mass to regions of .sub.G. Note that a distinction is made between distribution and probability distribution, which necessarily has total mass 1. Distributions are formally defined as generalized functions (such as the delta function .delta..sub.X) that act on test functions. A used herein, a "distribution" is the same as a measure. One simple example of a distribution of cells is that a set of cells x.sub.1, . . . , x.sub.n can be represented by the distribution
= i = 1 n .delta. x i . ##EQU00002##
Similarly, a set of single cell trajectories may be represented x.sub.1(t), . . . , x.sub.n(t) with a distribution over trajectories. A developmental process .sub.t is a time-varying distribution on gene expression space. A developmental process generalizes the definition of stochastic process. A developmental process with total mass 1 for all time is a (continuous time) stochastic process, i.e. an ordered set of random variables with a particular dependence structure. Recall that a stochastic process is determined by its temporal dependence structure, i.e. the coupling between random variables at different time points. The coupling of a pair of random variables refers to the structure of their joint distribution. The notion of coupling for developmental processes is the same as for stochastic processes, except with general distributions replacing probability distributions.
[0438] A coupling of a pair of distributions P, Q on R.sup.G is a distribution .pi. on R.sup.G.times.R.sup.G with the property that .pi. has P and Q as its two marginals. A coupling is also called a transport map.
[0439] As a distribution on the product space R.sup.G.times.R.sup.G, a transport map .pi. assigns a number .pi.(A, B) to any pair of sets A, B .OR right.R.sup.G.
.pi.(A,B)=.intg..sub.x.di-elect cons.A.intg..sub.y.di-elect cons.B.pi.(x,y)dxdy.
When .pi. is the coupling of a developmental process, this number .pi.(A, B) represents the mass transported from A to B by the developmental or other process. This is the amount of mass coming from A and going to B. When a particular destination is note specified, the quantity .pi.(A, ) specifies the full distribution of mass coming from A. This action may be referred to as pushing A through the transport map .pi.. More generally, we can also push a distribution .mu. forward through the transport map .pi. via integration
.mu..intg..pi.(x, )d.mu.(x).
[0440] The reverse operation is referred to as pulling a set B back through .pi.. The resulting distribution .pi.( , B) encodes the mass ending up at B. Distributions can also be pulled back through .pi. in a similar way:
.mu..intg..pi.( ,y)d.mu.(y).
This may also be referred as back-propagating the distribution .mu. (and to pushing .mu. forward as forward propagation).
[0441] Recall that a stochastic process is Markov if the future is independent of the past, given the present. Equivalently, it is fully specified by its couplings between pairs of time points. A general stochastic process can be specified by further higher order couplings. Markov developmental processes, which are defined in the same way:
[0442] A Markov developmental process P.sub.t is a time-varying distribution on R.sup.G that is completely specified by couplings between pairs of time points. It is an interesting question to what extent developmental processes are Markov. On gene expression space, they are likely not Markov because, for example, the history of gene expression can influence chromatin modifications, which may not themselves be reflected in the observed expression profile but could still influence the subsequent evolution of the process. However, it is possible that developmental processes could be considered Markov on some augmented space.
[0443] A definition of descendants and ancestors of subgroups of cells evolving according to a Markov developmental process is now provided. The earlier definition of descendants is extended as follows: Consider a set of cells S.OR right.R.sup.G which live at time t.sub.1 are part of a population of cells evolving according to a Markov developmental process P.sub.t. Let .pi. denote the transport map for P.sub.t from time t.sub.1 to time t.sub.2. The descendants of S at time t.sub.2 are obtained by pushing S through the transport map .pi.. Note that if a developmental process is not Markov, then the descendants of S are not well defined. The descendants would depend on the cells that gave rise to S, which we refer to as the ancestors of S.
[0444] Definition 6 (ancestors in a Markov developmental process). Consider a set of cells S .OR right.R.sup.G which live at time t.sub.2 and are part of a population of cells evolving according to a Markov developmental process P.sub.t. Let .pi. denote the transport map for P.sub.t from time t.sub.2 to time t.sub.1. The ancestors of S at time t.sub.1 are obtained by pushing S through the transport map .pi..
Empirical Developmental Processes
[0445] In certain aspects, a goal of the embodiments disclosed herein is to track the evolution of a developmental process from a scRNA-Seq time course. Suppose we are given input data consisting of a sequence of sets of single cell expression profiles, collected at T different time slices of development. Mathematically, this time series of expression profiles is a sequence of sets S.sub.1, . . . , S.sub.T .OR right.R.sup.G collected at times t.sub.1, . . . , t.sub.T .di-elect cons.R.
[0446] Developmental time series. A developmental time series is a sequence of samples from a developmental process P.sub.t on R.sup.G. This is a sequence of sets S.sub.1, . . . , S.sub.N .OR right.R.sup.G. Each S.sub.i is a set of expression profiles in R.sup.G drawn i.i.d from the probability distribution obtained by normalizing the distribution P.sub.ti tohavetotalmass1. From this input data, we form an empirical version of the developmental process. Specifically, at each time point t.sub.i we form the empirical probability distribution supported on the data x.di-elect cons.S.sub.i is formed. This is summarized inin the following definition:
[0447] Empirical developmental process. An empirical developmental process is a time vary-ing distribution constructed from a developmental time course S.sub.1, . . . , S.sub.N:
t i = 1 S i x .di-elect cons. S i .delta. x . ##EQU00003##
he empirical developmental process is undefined for t .di-elect cons./{t.sub.1, . . . , t.sub.N}.
[0448] Our goal is to recover information about a true, unknown developmental process P.sub.t from the empirical developmental process . The measurement process of single cell RNA-Seq destroys the coupling, and the observed empirical developmental process does not come with an informative coupling between successive time points. Over short time scales, it is reasonable to assume that cells do not change too much and therefore inferences regarding which cells go where and estimate the coupling.
[0449] This may be done with optimal transport: the transport map it that minimizes the total work required for redistributing to is selected. One motivation for minimizing this objective, is a deep relationship between optimal transport and dynamical systems that provides a direct connection to Waddington's landscape: the optimal transport problem can formulated as a least-action advection of one distribution into another according to an unknown velocity field (see Theorem 1 in Section 6 below). At a high level, differentiation follows a velocity field on gene expression space, and the potential inducing this velocity field is in direct correspondence with Waddington's landscape.sup.1.
Optimal Transport for scRNA-Seq Time Series
[0450] A process for how to compute probabilistic flows from a time series of single cell gene expression profiles by using optimal transport (S1) is provided. The embodiments disclosed herein show how to compute an optimal coupling of adjacent time points by solving a convex optimization problem.
[0451] Optimal transport defines a metric between probability distributions; it measures the total distance that mass must be transported to transform one distribution into another. For two measures P and Q on R.sup.G, a transport plan is a measure on the product space R.sup.G.times.R.sup.G that has marginals P and Q. In probability theory, this is also called a coupling. Intuitively, a transport plan .pi.can be interpreted as follows: if one picks a point mass at position x, then .pi.(x, ) gives the distribution over points where x might end up.
[0452] If c(x, y) denotes the cost.sup.2 of transporting a unit mass from x to y, then the expected cost under a transport plan .pi. is given by
.intg..intg.c(x,y).pi.(x,y)dxdy.
The optimal transport plan minimizes the expected cost subject to marginal constraints:
minimize .pi. .intg. .intg. c ( x , y ) .pi. ( x , y ) dxdy subject to .intg. .pi. ( x , .cndot. ) dx = .intg. .pi. ( .cndot. , y ) dy = . ##EQU00004##
[0453] Note that this is a linear program in the variable it because the objective and constraints are both linear in .pi.. Note that the optimal objective value defines the transport distance between P and Q (it is also called the Earthmover's distance or Wasserstein distance). Unlike most other ways to compare distributions (such as KL-divergence or total variation), optimal transport takes the geometry of the underlying space into account. For example, the KL-Divergence is infinite for any two distributions with disjoint support, but the transport distance between two unit masses depends on their separation.
[0454] When the measures P and Q are supported on finite subsets of R.sup.G, the transport plan is a matrix whose entries give transport probabilities and the linear program above is finite dimensional. In this context, empirical distributions are formed from the sets of samples S.sub.1, . . . , S.sub.T:
t i = 1 S i x .di-elect cons. S i .delta. x , ##EQU00005##
were .delta..sub.X denotes the Dirac delta function centered at x .di-elect cons.R.sup.G. These empirical distributions are definitely supported, and so it is possible solve the linear program[1] with P= and Q=
[0455] However, the classical formulation [1] does not allow cells to grow (or die) during transportation (because it was designed to move piles of dirt and conserve mass). When the classical formulation is applied to a time series with two distinct subpopulations proliferating at different rates.sup.3, the transport map will artificially transport mass between the subpopulations to account for the relative proliferation. Therefore, we modify the classical formulation of optimal transport in equation [1] is modified to allow cells to grow at different rates.
[0456] Is it assumed that a cell's measured expression profile x determines its growth rate g(x). This is reasonable because many genes are involved in cell proliferation (e.g. cell cycle genes). It is further assumed g(x) is a known function (based on knowledge of gene expression) representing the exponential increase in mass per unit time, but also note that the growth rate can be allowed to be miss-specified by leveraging techniques from unbalanced transport (S2). In practice, g(x) is defined in terms of the expression levels of genes involved in cell proliferation.
Derivation of Transport with Growth
[0457] For any cell x .di-elect cons.S.sub.i-1, let r(x, y) be the fraction of x that transitions towards y. Then the amount of probability mass from x that ends up at y (after proliferation) is
r(x,y)g(x).sup..DELTA.t,
where .DELTA..sub.t=t.sub.i+1-t.sub.i. The total amount of mass that comes from x can be written two ways:
y .di-elect cons. S i + 1 r ( x , y ) g ( x ) .DELTA. t .apprxeq. g ( x ) .DELTA. t d t i ( x ) . ##EQU00006##
This gives us a first constraint. Similarly, there is also the constraint that the total mass observed at y is equal to the sum of masses coming from each x and ending up at y. In symbols,
d t i + 1 ( y ) x .di-elect cons. S i g ( x ) .DELTA. t .apprxeq. x .di-elect cons. S i r ( x , y ) g ( x ) .DELTA. t for each y .di-elect cons. S i + 1 . ##EQU00007##
The factor x.di-elect cons.S.sub.i g(x).sup..DELTA.t on the left hand side accounts for the overall proliferation of all the cells from S.sub.i. Note that this factor is required so that the constraints are consistent: when one sums up both sides of the first constraint over x, this must equal the result of summing up both sides of the second constraint over y. Finally, for convenience these constraints are rewritten in terms of the optimization variable
.pi.(x,y)=r(x,y)g(x).sup..DELTA..sup.t.
Therefore, to compute the transport map between the empirical distributions of expression profiles observed at time t.sub.i and t.sub.i+1, the following linear program is set up:
minimize .pi. x .di-elect cons. S i y .di-elect cons. S i + 1 c ( x , y ) .pi. ( x , y ) subject to x .di-elect cons. S i .pi. ( x , y ) .apprxeq. d t i + 1 ( y ) x .di-elect cons. S i g ( x ) .DELTA. t y .di-elect cons. S i + 1 .pi. ( x , y ) .apprxeq. d t i ( x ) g ( x ) .DELTA. t ##EQU00008##
Regularization and Algorithmic Considerations
[0458] Fast algorithms have been recently developed to solve an entropically regularized version of the transport linear program (S3). Entropic regularization means adding the entropy H(.pi.)=E.sub..pi. log .pi. to the objective function, which penalizes deterministic transport plans (a purely deterministic transport plan would have only one nonzero entry in each row). Entropic regularization speeds up the computations because it makes the optimization problem strongly convex, and gradient ascent on the dual can be realized by successive diagonal matrix scalings (S3). These are very fast operations. This scaling algorithm has also been extended to work in the setting of unbalanced transport, where equality constraints are relaxed to bounds on KL-divergence (S2). This allows the growth rate function g(x) to be misspecified to some extent.
[0459] Both entropic regularization and unbalanced transport may be used. To compute the transport map between the empirical distributions of expression profiles observed at time t.sub.i and t.sub.i+1, the embodiments disclosed herein solve the following optimization problem:
minimize .pi. x .di-elect cons. S i y .di-elect cons. S i + 1 c ( x , y ) .pi. ( x , y ) - ( .pi. ) subject to KL [ x .di-elect cons. S i .pi. ( x , y ) d t i + 1 ( y ) x .di-elect cons. S i g ( x ) .DELTA. t ] .ltoreq. 1 .lamda. 1 KL [ y .di-elect cons. S i + 1 .pi. ( x , y ) d t i ( x ) g ( x ) .DELTA. t ] .ltoreq. 1 .lamda. 2 ##EQU00009##
where .epsilon., .lamda..sub.1 and .lamda..sub.2 are regularization parameters. This is a convex optimization problem in the matrix variable .pi..di-elect cons.R.sup.N.sup.i.sup..times.N.sup.i+1, where N.sub.i=|S.sub.i| is the number of cells sequenced at time t.sub.i. It takes about 5 seconds to solve this unbalanced transport problem using the scaling algorithm of Chizat et al. 2016 (S2) on a standard laptop with N.sub.i.apprxeq.5000. Note that the densities (on the discrete set S.sub.i) of the empirical distributions specified in equation [2] are simply d(x)=1. However, in principle one could use nonuniform empirical distributions (e.g. i N.sub.i if one wanted to include information about cell quality).
[0460] To summarize: given a sequence of expression profiles S.sub.1, . . . , S.sub.T, the optimization problem [5] for each successive pair of time points S.sub.i, S.sub.i+1 is solved. This gives us a sequence of transport maps.
[0461] To make this more precise, consider a single cell y.di-elect cons.S.sub.i. The column .pi.( , y) of the transport map .pi. from t.sub.i-1 to t.sub.i describes the contributions to y of the cells in S.sub.i-1. This is the origin of y at the time point t.sub.i-1. Similarly, the row r(y, ) of the transition map from t.sub.i to t.sub.i+1 describes the probabilities y would transition to cells in S.sub.i+1. These are the fates of y, i.e. the descendants of y.
[0462] The origin of y further back in time may be computed via matrix multiplication: the contributions to y of cells in S.sub.i-2 are given by a column of the matrix
{tilde over (.pi.)}.sub.[i-2,i]=.pi.[.sub.i-2,i-1].pi..sub.[i-1,i].
[0463] This matrix represents the inferred transport from time point t.sub.i-2 to t.sub.i, and note it with a tilde to distinguish it from the maps computed directly from adjacent time points. Note that, in principle, the transport between any non-consecutive pairs of time points S.sub.i, S.sub.j, may be directly computed but it is not anticipated that the principle of optimal transport to be as reliable over long time gaps.
[0464] Finally, note that expression profiles can be interpolated between pairs of time points by averaging a cell's expression profile at time t.sub.i with its fated expression profiles at time t.sub.i+1.
Transport Maps Encode Regulatory Information
[0465] Transport maps can encode regulatory information, and provided herein are methods on how to set up a regression to fit a regulatory function to our sequence of transport maps. It is assumed that a cell's trajectory is cell-autonomous and, in fact, depends only on its own internal gene expression. This is wrong as it ignores paracrine signaling between cells, and we return to discuss models that include cell-cell communication at the end of this section. However, this assumption is powerful because it exposes the time-dependence of the stochastic process P.sub.t as arising from pushing an initial measure through a differential equation:
{dot over (x)}=f(x).
[0466] Here f is a vector field that prescribes the flow of a particle x. The biological motivation for estimating such a function f is that it encodes information about the regulatory networks that create the equations of motion in gene-expression space.
[0467] It is proposed to set up a regression to learn a regulatory function f that models the fate of a cell at time t.sub.i+1 as a function of its expression profile at time t.sub.i. For motivation that the transport maps might contain information about the underlying regulatory dynamics, we appeal to a classical theorem establishing a dynamical formulation of optimal transport.
[0468] Theorem 1 (Benamou and Brenier, 2001). The optimal objective value of the transport problem [1] is equal to the optimal objective value of the following optimization problem.
minimize .rho. , v .intg. 0 .perp. v ( t , x ) 2 .rho. ( t , x ) dtdx subject to .rho. ( 0 , .cndot. ) = , .rho. ( 1 , .cndot. ) = .gradient. ( .rho. v ) = .differential. .rho. .differential. t . ##EQU00010##
[0469] In this theorem, v is a vector-valued velocity field that advects4 the distribution p from P to Q, and the objective value to be minimized is the kinetic energy of the flow (mass.times.squared velocity). Intuitively, the theorem shows that a transport map .pi. can be seen as a point-to-point summary of a least-action continuous time flow, according to an unknown velocity field. While the optimization problem [8] can be reformulated as a convex optimization problem, and modified to allow for variable growth rates, it is inherently infinite dimensional and therefore difficult to solve numerically.
[0470] It is therefore proposed a tractable approach to learn a static regulatory function f from our sequence of transport maps. This approach involves sampling pairs of points using the couplings from optimal transport, and solving a regression to learn a regulatory function that predicts the fate of a cell at time t.sub.i+1 as a function of its expression profile at time t.sub.i:
Regulatory Network Regression
[0471] For each pair of time points t.sub.i, t.sub.i+1, we consider the pair of random variables X.sub.t, X.sub.t jointly distributed according to r.sub.[t, t], (which we obtained from the i i+1 i i+1 transport map .pi.[t.sub.i, t.sub.i+1] by removing the effect of proliferation as in equation [3]). We set up the following optimization problem over regulatory functions f:
min f .di-elect cons. r X t i - X t i + 1 .DELTA. t - f ( X t i ) 2 . ##EQU00011##
Here F specifies a parametric function class to optimize over.
Cell Non-Autonomous Processes
[0472] This section discusses an approach to cell-cell communication. Note that the gradient flow [8] only makes sense for cell autonomous processes. Otherwise, the rate of change in expression x is not just a function of a cell's own expression vector x(t), but also of other expression vectors from other cells. We can accommodate cell non-autonomous processes by allowing f to also depend on the full distribution P.sub.t
dx dt = f ( x , t ) . ##EQU00012##
Extensions to Continuous Time.
[0473] In this section it is discussed how this method could be improved by going beyond pairs of time points to track the continuous evolution of P.sub.t. It is begun by pointing out a peculiar behavior of the method: whenever we have a time point with few sampled cells, our method is forced through an information bottleneck. As an extreme example--suppose there is a time point with only one cell. Everything would transition through that single cell, which is absurd! In this extreme case, we would be better off ignoring the time point. It is therefore proposed a smoothed approach that shares information between time slices and gracefully improves as data is added.
[0474] The continuous-time formulation is based on locally-weighted averaging, an elementary interpolation technique. Recall that given noisy function evaluations y.sub.i.apprxeq.f(x.sub.i), one can interpolate f by averaging the y.sub.i for all x.sub.i close to a point of interest x:
f ( x ) .apprxeq. i .alpha. i f ( x i ) , ##EQU00013##
where a.sub.i are weights that give more influence to nearby points
[0475] In this setup, it is sought to interpolate a distribution-valued function P.sub.t from the collections of i.i.d. samples S.sub.1, . . . , S.sub.T. We can interpolate a distribution-valued function by computing the barycenter (or centroid) of nearby time points with respect to the optimal transport metric. The transport barycenter of
i = 1 T .alpha. i W 2 ( i , ) , ##EQU00014##
where W (P, Q) denotes the transport distance (or Wasserstein distance) between P and Q. The transport distance is defined by the optimal value of the transport problem [1]. The weights .alpha..sub.i can be chosen to interpolate about time point t by setting, for example,
i = 1 T .alpha. i G 2 ( t i , ) , ##EQU00015##
where G(P, Q) denotes our modified transport distance from equation [5]. To solve this optimization problem, we can fix the support of Q to the samples observed at all time points .orgate.T.sub.i=1S.sub.i. Then we can apply the scaling algorithm for unbalanced bary centers due to Chizat et a1.
[0476] However, fixing the support of the barycenter ahead of time may not be completely satisfactory, and this motivates further research in the computation of transport bary centers: can we design an algorithm to solve for the barycenter Q without fixing the support in advance? Is there a dynamic formulation for bary centers analogous to the Brenier Benamou formula of Theorem 1, and can be leveraged to better learn gene regulatory networks?
[0477] Finally, this section is concluded with the observation that this continuous-time approach could pro-vide a principled approach to sequential experimental design. Optimal time points can be identified for further data collection by examining the loss function (fit of barycenter) across time, and adding data where the fit is poor. Moreover, this continuous time approach can also be used to test the principle of optimal transport by withholding some time points and testing the quality of the interpolation against the held-out truth.
Nucleic Acid Barcode, Barcode, and Unique Molecular Identifier (UMI)
[0478] The term "barcode" as used herein refers to a short sequence of nucleotides (for example, DNA or RNA) that is used as an identifier for an associated molecule, such as a target molecule and/or target nucleic acid, or as an identifier of the source of an associated molecule, such as a cell-of-origin. A barcode may also refer to any unique, non-naturally occurring, nucleic acid sequence that may be used to identify the originating source of a nucleic acid fragment. Although it is not necessary to understand the mechanism of an invention, it is believed that the barcode sequence provides a high-quality individual read of a barcode associated with a single cell, a viral vector, labeling ligand (e.g., an aptamer), protein, shRNA, sgRNA or cDNA such that multiple species can be sequenced together.
[0479] Barcoding may be performed based on any of the compositions or methods disclosed in patent publication WO 2014047561 A1, Compositions and methods for labeling of agents, incorporated herein in its entirety. In certain embodiments barcoding uses an error correcting scheme (T. K. Moon, Error Correction Coding: Mathematical Methods and Algorithms (Wiley, New York, ed. 1, 2005)). Not being bound by a theory, amplified sequences from single cells can be sequenced together and resolved based on the barcode associated with each cell.
[0480] In preferred embodiments, sequencing is performed using unique molecular identifiers (UMI). The term "unique molecular identifiers" (UMI) as used herein refers to a sequencing linker or a subtype of nucleic acid barcode used in a method that uses molecular tags to detect and quantify unique amplified products. A UMI is used to distinguish effects through a single clone from multiple clones. The term "clone" as used herein may refer to a single mRNA or target nucleic acid to be sequenced. The UMI may also be used to determine the number of transcripts that gave rise to an amplified product, or in the case of target barcodes as described herein, the number of binding events. In preferred embodiments, the amplification is by PCR or multiple displacement amplification (MDA).
[0481] In certain embodiments, an UMI with a random sequence of between 4 and 20 base pairs is added to a template, which is amplified and sequenced. In preferred embodiments, the UMI is added to the 5' end of the template. Sequencing allows for high resolution reads, enabling accurate detection of true variants. As used herein, a "true variant" will be present in every amplified product originating from the original clone as identified by aligning all products with a UMI. Each clone amplified will have a different random UMI that will indicate that the amplified product originated from that clone. Background caused by the fidelity of the amplification process can be eliminated because true variants will be present in all amplified products and background representing random error will only be present in single amplification products (See e.g., Islam S. et al., 2014. Nature Methods No:11, 163-166). Not being bound by a theory, the UMI's are designed such that assignment to the original can take place despite up to 4-7 errors during amplification or sequencing. Not being bound by a theory, an UMI may be used to discriminate between true barcode sequences.
[0482] Unique molecular identifiers can be used, for example, to normalize samples for variable amplification efficiency. For example, in various embodiments, featuring a solid or semisolid support (for example a hydrogel bead), to which nucleic acid barcodes (for example a plurality of barcodes sharing the same sequence) are attached, each of the barcodes may be further coupled to a unique molecular identifier, such that every barcode on the particular solid or semisolid support receives a distinct unique molecule identifier. A unique molecular identifier can then be, for example, transferred to a target molecule with the associated barcode, such that the target molecule receives not only a nucleic acid barcode, but also an identifier unique among the identifiers originating from that solid or semisolid support.
[0483] A nucleic acid barcode or UMI can have a length of at least, for example, 4, 5, 6, 7, 8, 9, 10, 11, 12, 13, 14, 15, 16, 17, 18, 19, 20, 21, 22, 23, 24, 25, 26, 27, 28, 29, 30, 35, 40, 45, 50, 60, 70, 80, 90, or 100 nucleotides, and can be in single- or double-stranded form. Target molecule and/or target nucleic acids can be labeled with multiple nucleic acid barcodes in combinatorial fashion, such as a nucleic acid barcode concatemer. Typically, a nucleic acid barcode is used to identify a target molecule and/or target nucleic acid as being from a particular discrete volume, having a particular physical property (for example, affinity, length, sequence, etc.), or having been subject to certain treatment conditions. Target molecule and/or target nucleic acid can be associated with multiple nucleic acid barcodes to provide information about all of these features (and more). Each member of a given population of UMIs, on the other hand, is typically associated with (for example, covalently bound to or a component of the same molecule as) individual members of a particular set of identical, specific (for example, discreet volume-, physical property-, or treatment condition-specific) nucleic acid barcodes. Thus, for example, each member of a set of origin-specific nucleic acid barcodes, or other nucleic acid identifier or connector oligonucleotide, having identical or matched barcode sequences, may be associated with (for example, covalently bound to or a component of the same molecule as) a distinct or different UMI.
[0484] As disclosed herein, unique nucleic acid identifiers are used to label the target molecules and/or target nucleic acids, for example origin-specific barcodes and the like. The nucleic acid identifiers, nucleic acid barcodes, can include a short sequence of nucleotides that can be used as an identifier for an associated molecule, location, or condition. In certain embodiments, the nucleic acid identifier further includes one or more unique molecular identifiers and/or barcode receiving adapters. A nucleic acid identifier can have a length of about, for example, 4, 5, 6, 7, 8, 9, 10, 11, 12, 13, 14, 15, 16, 17, 18, 19, 20, 21, 22, 23, 24, 25, 26, 27, 28, 29, 30, 35, 40, 45, 50, 60, 70, 80, 90, or 100 base pairs (bp) or nucleotides (nt). In certain embodiments, a nucleic acid identifier can be constructed in combinatorial fashion by combining randomly selected indices (for example, about 1, 2, 3, 4, 5, 6, 7, 8, 9, or 10 indexes). Each such index is a short sequence of nucleotides (for example, DNA, RNA, or a combination thereof) having a distinct sequence. An index can have a length of about, for example, 4, 5, 6, 7, 8, 9, 10, 11, 12, 13, 14, 15, 16, 17, 18, 19, 20, 21, 22, 23, 24, or 25 bp or nt. Nucleic acid identifiers can be generated, for example, by split-pool synthesis methods, such as those described, for example, in International Patent Publication Nos. WO 2014/047556 and WO 2014/143158, each of which is incorporated by reference herein in its entirety.
[0485] One or more nucleic acid identifiers (for example a nucleic acid barcode) can be attached, or "tagged," to a target molecule. This attachment can be direct (for example, covalent or noncovalent binding of the nucleic acid identifier to the target molecule) or indirect (for example, via an additional molecule). Such indirect attachments may, for example, include a barcode bound to a specific-binding agent that recognizes a target molecule. In certain embodiments, a barcode is attached to protein G and the target molecule is an antibody or antibody fragment. Attachment of a barcode to target molecules (for example, proteins and other biomolecules) can be performed using standard methods well known in the art. For example, barcodes can be linked via cysteine residues (for example, C-terminal cysteine residues). In other examples, barcodes can be chemically introduced into polypeptides (for example, antibodies) via a variety of functional groups on the polypeptide using appropriate group-specific reagents (see for example www.drmr.com/abcon). In certain embodiments, barcode tagging can occur via a barcode receiving adapter associate with (for example, attached to) a target molecule, as described herein.
[0486] Target molecules can be optionally labeled with multiple barcodes in combinatorial fashion (for example, using multiple barcodes bound to one or more specific binding agents that specifically recognizing the target molecule), thus greatly expanding the number of unique identifiers possible within a particular barcode pool. In certain embodiments, barcodes are added to a growing barcode concatemer attached to a target molecule, for example, one at a time. In other embodiments, multiple barcodes are assembled prior to attachment to a target molecule. Compositions and methods for concatemerization of multiple barcodes are described, for example, in International Patent Publication No. WO 2014/047561, which is incorporated herein by reference in its entirety.
[0487] In some embodiments, a nucleic acid identifier (for example, a nucleic acid barcode) may be attached to sequences that allow for amplification and sequencing (for example, SBS3 and P5 elements for Illumina sequencing). In certain embodiments, a nucleic acid barcode can further include a hybridization site for a primer (for example, a single-stranded DNA primer) attached to the end of the barcode. For example, an origin-specific barcode may be a nucleic acid including a barcode and a hybridization site for a specific primer. In particular embodiments, a set of origin-specific barcodes includes a unique primer specific barcode made, for example, using a randomized oligo type NNNNNNNNNNNN.
[0488] A nucleic acid identifier can further include a unique molecular identifier and/or additional barcodes specific to, for example, a common support to which one or more of the nucleic acid identifiers are attached. Thus, a pool of target molecules can be added, for example, to a discrete volume containing multiple solid or semisolid supports (for example, beads) representing distinct treatment conditions (and/or, for example, one or more additional solid or semisolid support can be added to the discreet volume sequentially after introduction of the target molecule pool), such that the precise combination of conditions to which a given target molecule was exposed can be subsequently determined by sequencing the unique molecular identifiers associated with it.
[0489] Labeled target molecules and/or target nucleic acids associated origin-specific nucleic acid barcodes (optionally in combination with other nucleic acid barcodes as described herein) can be amplified by methods known in the art, such as polymerase chain reaction (PCR). For example, the nucleic acid barcode can contain universal primer recognition sequences that can be bound by a PCR primer for PCR amplification and subsequent high-throughput sequencing. In certain embodiments, the nucleic acid barcode includes or is linked to sequencing adapters (for example, universal primer recognition sequences) such that the barcode and sequencing adapter elements are both coupled to the target molecule. In particular examples, the sequence of the origin specific barcode is amplified, for example using PCR. In some embodiments, an origin-specific barcode further comprises a sequencing adaptor. In some embodiments, an origin-specific barcode further comprises universal priming sites. A nucleic acid barcode (or a concatemer thereof), a target nucleic acid molecule (for example, a DNA or RNA molecule), a nucleic acid encoding a target peptide or polypeptide, and/or a nucleic acid encoding a specific binding agent may be optionally sequenced by any method known in the art, for example, methods of high-throughput sequencing, also known as next generation sequencing or deep sequencing. A nucleic acid target molecule labeled with a barcode (for example, an origin-specific barcode) can be sequenced with the barcode to produce a single read and/or contig containing the sequence, or portions thereof, of both the target molecule and the barcode. Exemplary next generation sequencing technologies include, for example, Illumina sequencing, Ion Torrent sequencing, 454 sequencing, SOLiD sequencing, and nanopore sequencing amongst others. In some embodiments, the sequence of labeled target molecules is determined by non-sequencing based methods. For example, variable length probes or primers can be used to distinguish barcodes (for example, origin-specific barcodes) labeling distinct target molecules by, for example, the length of the barcodes, the length of target nucleic acids, or the length of nucleic acids encoding target polypeptides. In other instances, barcodes can include sequences identifying, for example, the type of molecule for a particular target molecule (for example, polypeptide, nucleic acid, small molecule, or lipid). For example, in a pool of labeled target molecules containing multiple types of target molecules, polypeptide target molecules can receive one identifying sequence, while target nucleic acid molecules can receive a different identifying sequence. Such identifying sequences can be used to selectively amplify barcodes labeling particular types of target molecules, for example, by using PCR primers specific to identifying sequences specific to particular types of target molecules. For example, barcodes labeling polypeptide target molecules can be selectively amplified from a pool, thereby retrieving only the barcodes from the polypeptide subset of the target molecule pool.
[0490] A nucleic acid barcode can be sequenced, for example, after cleavage, to determine the presence, quantity, or other feature of the target molecule. In certain embodiments, a nucleic acid barcode can be further attached to a further nucleic acid barcode. For example, a nucleic acid barcode can be cleaved from a specific-binding agent after the specific-binding agent binds to a target molecule or a tag (for example, an encoded polypeptide identifier element cleaved from a target molecule), and then the nucleic acid barcode can be ligated to an origin-specific barcode. The resultant nucleic acid barcode concatemer can be pooled with other such concatemers and sequenced. The sequencing reads can be used to identify which target molecules were originally present in which discrete volumes.
Barcodes Reversibly Coupled to Solid Substrate
[0491] In some embodiments, the origin-specific barcodes are reversibly coupled to a solid or semisolid substrate. In some embodiments, the origin-specific barcodes further comprise a nucleic acid capture sequence that specifically binds to the target nucleic acids and/or a specific binding agent that specifically binds to the target molecules. In specific embodiments, the origin-specific barcodes include two or more populations of origin-specific barcodes, wherein a first population comprises the nucleic acid capture sequence and a second population comprises the specific binding agent that specifically binds to the target molecules. In some examples, the first population of origin-specific barcodes further comprises a target nucleic acid barcode, wherein the target nucleic acid barcode identifies the population as one that labels nucleic acids. In some examples, the second population of origin-specific barcodes further comprises a target molecule barcode, wherein the target molecule barcode identifies the population as one that labels target molecules.
Barcode with Cleavage Sites
[0492] A nucleic acid barcode may be cleavable from a specific binding agent, for example, after the specific binding agent has bound to a target molecule. In some embodiments, the origin-specific barcode further comprises one or more cleavage sites. In some examples, at least one cleavage site is oriented such that cleavage at that site releases the origin-specific barcode from a substrate, such as a bead, for example a hydrogel bead, to which it is coupled. In some examples, at least one cleavage site is oriented such that the cleavage at the site releases the origin-specific barcode from the target molecule specific binding agent. In some examples, a cleavage site is an enzymatic cleavage site, such an endonuclease site present in a specific nucleic acid sequence. In other embodiments, a cleavage site is a peptide cleavage site, such that a particular enzyme can cleave the amino acid sequence. In still other embodiments, a cleavage site is a site of chemical cleavage.
Barcode Adapters
[0493] In some embodiments, the target molecule is attached to an origin-specific barcode receiving adapter, such as a nucleic acid. In some examples, the origin-specific barcode receiving adapter comprises an overhang and the origin-specific barcode comprises a sequence capable of hybridizing to the overhang. A barcode receiving adapter is a molecule configured to accept or receive a nucleic acid barcode, such as an origin-specific nucleic acid barcode. For example, a barcode receiving adapter can include a single-stranded nucleic acid sequence (for example, an overhang) capable of hybridizing to a given barcode (for example, an origin-specific barcode), for example, via a sequence complementary to a portion or the entirety of the nucleic acid barcode. In certain embodiments, this portion of the barcode is a standard sequence held constant between individual barcodes. The hybridization couples the barcode receiving adapter to the barcode. In some embodiments, the barcode receiving adapter may be associated with (for example, attached to) a target molecule. As such, the barcode receiving adapter may serve as the means through which an origin-specific barcode is attached to a target molecule. A barcode receiving adapter can be attached to a target molecule according to methods known in the art. For example, a barcode receiving adapter can be attached to a polypeptide target molecule at a cysteine residue (for example, a C-terminal cysteine residue). A barcode receiving adapter can be used to identify a particular condition related to one or more target molecules, such as a cell of origin or a discreet volume of origin. For example, a target molecule can be a cell surface protein expressed by a cell, which receives a cell-specific barcode receiving adapter. The barcode receiving adapter can be conjugated to one or more barcodes as the cell is exposed to one or more conditions, such that the original cell of origin for the target molecule, as well as each condition to which the cell was exposed, can be subsequently determined by identifying the sequence of the barcode receiving adapter/barcode concatemer.
Barcode with Capture Moiety
[0494] In some embodiments, an origin-specific barcode further includes a capture moiety, covalently or non-covalently linked. Thus, in some embodiments the origin-specific barcode, and anything bound or attached thereto, that include a capture moiety are captured with a specific binding agent that specifically binds the capture moiety. In some embodiments, the capture moiety is adsorbed or otherwise captured on a surface. In specific embodiments, a targeting probe is labeled with biotin, for instance by incorporation of biotin-16-UTP during in vitro transcription, allowing later capture by streptavidin. Other means for labeling, capturing, and detecting an origin-specific barcode include: incorporation of aminoallyl-labeled nucleotides, incorporation of sulfhydryl-labeled nucleotides, incorporation of allyl- or azide-containing nucleotides, and many other methods described in Bioconjugate Techniques (2.sup.nd Ed), Greg T. Hermanson, Elsevier (2008), which is specifically incorporated herein by reference. In some embodiments, the targeting probes are covalently coupled to a solid support or other capture device prior to contacting the sample, using methods such as incorporation of aminoallyl-labeled nucleotides followed by 1-Ethyl-3-(3-dimethylaminopropyl)carbodiimide (EDC) coupling to a carboxy-activated solid support, or other methods described in Bioconjugate Techniques. In some embodiments, the specific binding agent has been immobilized for example on a solid support, thereby isolating the origin-specific barcode.
Other Barcoding Embodiments
[0495] DNA barcoding is also a taxonomic method that uses a short genetic marker in an organism's DNA to identify it as belonging to a particular species. It differs from molecular phylogeny in that the main goal is not to determine classification but to identify an unknown sample in terms of a known classification. Kress et al., "Use of DNA barcodes to identify flowering plants" Proc. Natl. Acad. Sci. U.S.A. 102(23):8369-8374 (2005). Barcodes are sometimes used in an effort to identify unknown species or assess whether species should be combined or separated. Koch H., "Combining morphology and DNA barcoding resolves the taxonomy of Western Malagasy Liotrigona Moure, 1961" African Invertebrates 51(2): 413-421 (2010); and Seberg et al., "How many loci does it take to DNA barcode a crocus?" PLoS One 4(2):e4598 (2009). Barcoding has been used, for example, for identifying plant leaves even when flowers or fruit are not available, identifying the diet of an animal based on stomach contents or feces, and/or identifying products in commerce (for example, herbal supplements or wood). Soininen et al., "Analysing diet of small herbivores: the efficiency of DNA barcoding coupled with high-throughput pyrosequencing for deciphering the composition of complex plant mixtures" Frontiers in Zoology 6:16 (2009).
[0496] A desirable locus for DNA barcoding can be standardized so that large databases of sequences for that locus can be developed. Most of the taxa of interest have loci that are sequencable without species-specific PCR primers. CBOL Plant Working Group, "A DNA barcode for land plants" PNAS 106(31): 12794-12797 (2009). Further, these putative barcode loci are believed short enough to be easily sequenced with current technology. Kress et al., "DNA barcodes: Genes, genomics, and bioinformatics" PNAS 105(8):2761-2762 (2008). Consequently, these loci would provide a large variation between species in combination with a relatively small amount of variation within a species. Lahaye et al., "DNA barcoding the floras of biodiversity hotspots" Proc Natl Acad Sci USA 105(8):2923-2928 (2008).
[0497] DNA barcoding is based on a relatively simple concept. For example, most eukaryote cells contain mitochondria, and mitochondrial DNA (mtDNA) has a relatively fast mutation rate, which results in significant variation in mtDNA sequences between species and, in principle, a comparatively small variance within species. A 648-bp region of the mitochondrial cytochrome c oxidase subunit 1 (CO1) gene was proposed as a potential `barcode`. As of 2009, databases of CO1 sequences included at least 620,000 specimens from over 58,000 species of animals, larger than databases available for any other gene. Ausubel, J., "A botanical macroscope" Proceedings of the National Academy of Sciences 106(31): 12569 (2009).
[0498] Software for DNA barcoding requires integration of a field information management system (FIMS), laboratory information management system (LIMS), sequence analysis tools, workflow tracking to connect field data and laboratory data, database submission tools and pipeline automation for scaling up to eco-system scale projects. Geneious Pro can be used for the sequence analysis components, and the two plugins made freely available through the Moorea Biocode Project, the Biocode LIMS and Genbank Submission plugins handle integration with the FIMS, the LIMS, workflow tracking and database submission.
[0499] Additionally, other barcoding designs and tools have been described (see e.g., Birrell et al., (2001) Proc. Natl Acad. Sci. USA 98, 12608-12613; Giaever, et al., (2002) Nature 418, 387-391; Winzeler et al., (1999) Science 285, 901-906; and Xu et al., (2009) Proc Natl Acad Sci USA. February 17; 106(7):2289-94).
[0500] Unique Molecular Identifiers are short (usually 4-10 bp) random barcodes added to transcripts during reverse-transcription. They enable sequencing reads to be assigned to individual transcript molecules and thus the removal of amplification noise and biases from RNA-seq data. Since the number of unique barcodes (4N, N--length of UMI) is much smaller than the total number of molecules per cell (.about.106), each barcode will typically be assigned to multiple transcripts. Hence, to identify unique molecules both barcode and mapping location (transcript) must be used. UMI-sequencing typically consists of paired-end reads where one read from each pair captures the cell and UMI barcodes while the other read consists of exonic sequence from the transcript. UMI-sequencing typically consists of paired-end reads where one read from each pair captures the cell and UMI barcodes while the other read consists of exonic sequence from the transcript.
[0501] In some embodiments, the nucleic acids of the library are flanked by switching mechanism at 5' end of RNA templates (SMART). SMART is a technology that allows the efficient incorporation of known sequences at both ends of cDNA during first strand synthesis, without adaptor ligation. The presence of these known sequences is crucial for a number of downstream applications including amplification, RACE, and library construction. While a wide variety of technologies can be employed to take advantage of these known sequences, the simplicity and efficiency of the single-step SMART process permits unparalleled sensitivity and ensures that full-length cDNA is generated and amplified. (see, e.g., Zhu et al., 2001, Biotechniques. 30 (4): 892-7.
[0502] After processing the reads from a UMI experiment, the following conventions are often used: 1. The UMI is added to the read name of the other paired read. 2. Reads are sorted into separate files by cell barcode .degree. For extremely large, shallow datasets, a cell barcode may be added to the read name as well to reduce the number of files. A cell barcode indicates the cell from which mRNA is captured (e.g., Drop-Seq or Seq-Well).
Sequencing Methods.
[0503] In one approach, the present invention relates to a PCR-amplification based approach to derive genetic information from single-cell RNA-seq libraries.
[0504] The method generally involves two PCR steps and size selection. Initially, a library is constructed wherein each sequence comprises a SMART sequence at the 5' end and the 3' end, a genetic region of interest at the 5' end and a UMI and Cell BC at the 3' end, e.g., 5' SMART-genetic region of interest-UMI-Cell BC-SMART 3'.
[0505] A first PCR product is generated by amplifying sequences with a biotinylated 5' primer comprising a binding site for a second PCR product and a sequence complementary to a specific gene of interest and a 3' SMART primer complementary to the SMART sequence at the 3' end of the nucleic acid to generate a first PCR product. The binding site for the second PCR product may be a partial Illumina sequencing primer binding site or an oligomer for sequencing kit, such as a NEBNext.RTM. oligos for Illumina.RTM. sequencing (see, e.g., https://www.neb.com/applications/library-preparation-for-next-generati n-sequencing/illumina-library-preparation/products).
[0506] The 5' primer comprising the binding site for the second PCR product to amplify the first PCR product may further comprise a sequence to bind a flow cell, a sequence allowing multiple sequencing libraries to be sequenced simultaneously and/or a sequence providing an additional primer binding site. The sequence to bind a flow cell may be a P7 sequence and the flow cell may be an Illumina.RTM. flowcell.
[0507] In another embodiment, the SMART primer complementary to the SMART sequence at the 3' end of the nucleic acid to amplify the first PCR product may further comprise a sequence to allow fragments to bind a flowcell. The sequence to allow fragments to bind a flowcell may be a P5 sequence.
[0508] Regardless of the library construction method, submitted libraries may consist of a sequence of interest flanked on either side by adapter constructs. On each end, these adapter constructs may have flow cell binding sites, P5 and P7, which allow the library fragment to attach to the flow cell surface. The P5 and P7 regions of single-stranded library fragments anneal to their complementary oligos on the flowcell surface. The flow cell oligos act as primers and a strand complementary to the library fragment is synthesized. The original strand is washed away, leaving behind fragment copies that are covalently bonded to the flowcell surface in a mixture of orientations. 1,000 copies of each fragment are generated by bridge amplification, creating clusters. For simplification, the diagram shows only one copy (out of 1,000) in each cluster, and only two clusters (out of 30-50 million). The P5 region is cleaved, resulting in clusters containing only fragments which are attached by the P7 region. This ensures that all copies are sequenced in the same direction. The sequencing primer anneals to the P5 end of the fragment, and begins the sequencing by synthesis process. Index reads are only performed when a sample is barcoded. When Read 1 is finished, everything from Read 1 is removed and an index primer is added, which anneals at the P7 end of the fragment and sequences the barcode. Everything is stripped from the template, which forms clusters by bridge amplification as in Read 1. This leaves behind fragment copies that are covalently bonded to the flowcell surface in a mixture of orientations. This time, P7 is cut instead of P5, resulting in clusters containing only fragments which are attached by the P5 region. This ensures that all copies are sequences in the same direction (opposite Read 1). The sequencing primer anneals to the P7 region and sequences the other end of the template.
[0509] In another embodiment, the sequence allowing multiple sequencing libraries to be sequenced simultaneously may be an INDEX sequence. The INDEX allows multiple sequencing libraries to be sequenced simultaneously (and demultiplexed using Illumina's bcl2fastq command). See, e.g., https://support.illumina.com/downloads/illumina-customer-sequence-letter.- html for exemplary INDEX sequences.
[0510] In another embodiment, the 5' primer comprising the binding site for the second PCR product to amplify the first PCR product may further comprise a NEXTERA sequence. See, e.g., https://support.illumina.com/downloads/illumina-customer-sequence-letter.- html and U.S. Pat. Nos. 5,965,443, and 6,437,109 and European Patent No. 0927258, for exemplary NEXTERA sequences.
[0511] In another embodiment, the sequence providing an additional primer binding site may be a custom readl primer binding site (CR1P) for sequencing. CR1P is a Custom Readl Primer binding site that is used for Drop-Seq and Seq-Well library sequencing. CR1P may comprise the sequence: GCCTGTCCGCGGAAGCAGTGGTATCAACGCAGAGTAC (SEQ ID NO: 1) (see e.g., Gierahn et al., Nature Methods 14, 395-398 (2017).
[0512] Biotin-NEXT-GENE-for: Biotinylation enables purification of the desired product following the first PCR reaction. NEXT creates a binding site for the second PCR product as well as a partial primer binding site for standard Illumina sequencing kits. NEXT may be any sequence that allows targeted enrichment and then select addition of sequencing handles. GENE is a sequence complementary to the WTA, designed to amplify a specific region of interest (usually an exon).
[0513] SMART-rev: The SMART sequence is used in Drop-seq and Seq-Well to generate WTA libraries. Because the polyT-unique molecular identifier-unique cellular barcode (polyT-UMI-CB) sequence is followed by the SMART sequence, and the template switching oligo (TSO) also contains the SMART sequence, WTA libraries have the SMART sequence as a PCR binding site on both the 5' and the 3' end.
[0514] P7-INDEX-NEXTERA: The P7 sequence allows fragments to bind the Illumina flowcell. The INDEX allows multiple sequencing libraries to be sequenced simultaneously (and demultiplexed using Illumina's bcl2fastq command). The NEXTERA sequence provides a primer binding site for Illumina's standard Read2 sequencing primer mix.
[0515] SMART-CR1P-P5: The SMART sequence is the same as in SMART-rev. CRIP is a Custom Read1 Primer binding site that is used for Drop-Seq and Seq-Well library sequencing. The P5 sequence allows fragments to bind the Illumina flowcell. Note that the primer design can be easily modified for compatibility with additional single-cell RNA-seq technologies (SMART) or sequencing technologies (NEXTERA, CRIP).
[0516] The method also provides for biotin enrichment of the first PCR product. Biotinylation of the primer to amplify the gene, region or mutation of interest from the library allows for the purification of the PCR product of interest. Because the libraries are flanked with SMART sequences on both ends, the vast majority of the first PCR product would be amplification of the entire library. Without the biotinylated primer, enrichment of the gene, region or mutation of interest would be insufficient to efficiently and confidently call genetic mutations. Biotin enrichment may be accomplished by streptavidin binding of the biotinylated first PCR product. The streptavidin bead kilobaseBINDER kit (Thermo Fisher Cat #60101) allows for isolation of large biotinylated DNA fragments.
[0517] Gene specific primers may be mixed for simultaneous detection of multiple mutations. Libraries may also be mixed for simultaneous detection of mutations in multiple samples. However, mixed primers sometimes may not detect multiple mutations in the same gene as only the shortest fragment will be detected.
[0518] The present method may be adapted to identify any gene, region or mutation of interest and to identify cells containing specific genes, regions or mutations, deletions, insertions, indels, or translocations of interest.
[0519] A gene or groups of genes of interest may be, for example, one or more genes that are part of or make up a homeostatic stromal cell gene expression signature, a dysfunctional stromal cell gene expression signature, or a combination thereof. The gene or groups of genes of interest may be, for example, a hematological disease-related gene of interest. Hematological diseases of interest are described in greater detail else where herein.
Sequencing and Library Construction
[0520] In some embodiments, RNA-seq can be used. As used herein, RNA-seq methods refer to high-throughput single-cell RNA-sequencing protocols. RNA-seq includes, but is not limited to, Drop-seq, Seq-Well, InDrop and 1Cell Bio. RNA-seq methods also include, but are not limited to, smart-seq2, TruSeq, CEL-Seq, STRT, ChIRP-Seq, GRO-Seq, CLIP-Seq, Quartz-Seq, or any other similar method known in the art (see, e.g., "Sequencing Methods Review" Illumina.RTM. Technology, https://www.illumina.com/content/dam/illumina-marketing/documents/product- s/research_reviews/sequencing-methods-review.pdf. See e.g., Wagner et al., 2016. Nat Biotechnol. 34(111): 1145-1160.
[0521] In some embodiments, sequence adapters can be used. As used herein, sequence adapters or sequencing adapters or adapters include primers that may include additional sequences involved in for example, but not limited to, flowcell binding, cluster generation, library generation, sequencing primers, sequences for Seq-Well, and/or custom read sequencing primers. Universal primer recognition sequences
[0522] The present invention may encompass incorporation of SMART sequences into the library. Switching mechanism at 5' end of RNA template (SMART) is a technology that allows the efficient incorporation of known sequences at both ends of cDNA during first strand synthesis, without adaptor ligation. The presence of these known sequences is crucial for a number of downstream applications including amplification, RACE, and library construction. While a wide variety of technologies can be employed to take advantage of these known sequences, the simplicity and efficiency of the single-step SMART process permits unparalleled sensitivity and ensures that full-length cDNA is generated and amplified. (see, e.g., Zhu et al., 2001, Biotechniques. 30 (4): 892-7.
[0523] A pooled set of nucleic acids that are tagged refer to a plurality of nucleic acid molecules that results from incorporating an identifiable sequence tag into a pool of sample-tagged nucleic acids, by any of various methods. In some embodiments, the tag serves instead as a minimal sequence adapter for adding nucleic acids onto sample-tagged nucleic acids, rendering the pool compatible with a particular DNA sequencing platform or amplification strategy.
[0524] In some embodiments, a 3' barcoded single cell RNA library can be generated. The 3' barcoded single cell RNA library includes a plurality of nucleic acids, each nucleic acid including a gene of interest, a unique molecular identifier (UMI) and a cell barcode (cell BC). The cell barcode is located on the 3' end of the transcript. As the single cell RNA library comprises a cell barcode on the 3' end of the transcripts, at least a subset of the library from the 3' barcoded single cell RNA library contains a transcript of interest at least 1 kb away from the 3' end of the transcript. The 5' side of transcripts are typically underrepresented in standard 3' barcoded libraries.
[0525] In a preferred embodiment, each nucleic acid sequence is flanked by switching mechanism at 5' end of RNA template (SMART) sequences at the 5' end and 3' end, that is, in this embodiment, an exemplary nucleic acid in the library would be 5' SMART-genetic region of interest-UMI-Cell BC-SMART 3'.
[0526] Multiple technologies have been described that massively parallelize the generation of single cell RNA seq libraries that can be used in the present disclosure. As used herein, RNA-seq methods refer to high-throughput single-cell RNA-sequencing protocols. RNA-seq includes, but is not limited to, Drop-seq, Seq-Well, InDrop and 1Cell Bio. RNA-seq methods also include, but are not limited to, smart-seq2, TruSeq, CEL-Seq, STRT, ChIRP-Seq, GRO-Seq, CLIP-Seq, Quartz-Seq, or any other similar method known in the art (see, e.g., "Sequencing Methods Review" Illumina.RTM. Technology, Sequencing Methods Review available at illumina.com.
[0527] In certain embodiments, the invention involves plate based single cell RNA sequencing (see, e.g., Picelli, S. et al., 2014, "Full-length RNA-seq from single cells using Smart-seq2" Nature protocols 9, 171-181, doi: 10. 1038/nprot.2014.006).
[0528] In some embodiments, Drop-sequence methods or Drop-seq are contemplated for the present invention and can be used. Cells come in different types, sub-types and activity states, which are classify based on their shape, location, function, or molecular profiles, such as the set of RNAs that they express. RNA profiling is in principle particularly informative, as cells express thousands of different RNAs. Approaches that measure for example the level of every type of RNA have until recently been applied to "homogenized" samples--in which the contents of all the cells are mixed together. Methods to profile the RNA content of tens and hundreds of thousands of individual human cells have been recently developed, including from brain tissues, quickly and inexpensively. To do so, special microfluidic devices have been developed to encapsulate each cell in an individual drop, associate the RNA of each cell with a `cell barcode` unique to that cell/drop, measure the expression level of each RNA with sequencing, and then use the cell barcodes to determine which cell each RNA molecule came from. See, e.g., methods of Macosko et al., 2015, Cell 161, 1202-1214 and Klein et al., 2015, Cell 161, 1187-1201 are contemplated for the present invention.
[0529] In certain embodiments, the invention involves high-throughput single-cell RNA-seq and/or targeted nucleic acid profiling (for example, sequencing, quantitative reverse transcription polymerase chain reaction, and the like) where the RNAs from different cells are tagged individually, allowing a single library to be created while retaining the cell identity of each read. In this regard reference is made to Macosko et al., 2015, "Highly Parallel Genome-wide Expression Profiling of Individual Cells Using Nanoliter Droplets" Cell 161, 1202-1214; International patent application number PCT/US2015/049178, published as WO2016/040476 on Mar. 17, 2016; Klein et al., 2015, "Droplet Barcoding for Single-Cell Transcriptomics Applied to Embryonic Stem Cells" Cell 161, 1187-1201; International patent application number PCT/US2016/027734, published as WO2016168584A1 on Oct. 20, 2016; Zheng, et al., 2016, "Haplotyping germline and cancer genomes with high-throughput linked-read sequencing" Nature Biotechnology 34, 303-311; Zheng, et al., 2017, "Massively parallel digital transcriptional profiling of single cells" Nat. Commun. 8, 14049 doi: 10.1038/ncomms14049; International patent publication number WO2014210353A2; Zilionis, et al., 2017, "Single-cell barcoding and sequencing using droplet microfluidics" Nat Protoc. Jan; 12(1):44-73; Cao et al., 2017, "Comprehensive single cell transcriptional profiling of a multicellular organism by combinatorial indexing" bioRxiv preprint first posted online Feb. 2, 2017, doi: dx.doi.org/10.1101/104844; Rosenberg et al., 2017, "Scaling single cell transcriptomics through split pool barcoding" bioRxiv preprint first posted online Feb. 2, 2017, doi: dx.doi.org/10.1101/105163; Vitak, et al., "Sequencing thousands of single-cell genomes with combinatorial indexing" Nature Methods, 14(3):302-308, 2017; Cao, et al., Comprehensive single-cell transcriptional profiling of a multicellular organism. Science, 357(6352):661-667, 2017; and Gierahn et al., "Seq-Well: portable, low-cost RNA sequencing of single cells at high throughput" Nature Methods 14, 395-398 (2017), all the contents and disclosure of each of which are herein incorporated by reference in their entirety.
[0530] In certain embodiments, the invention involves single nucleus RNA sequencing. In this regard reference is made to Swiech et al., 2014, "In vivo interrogation of gene function in the mammalian brain using CRISPR-Cas9" Nature Biotechnology Vol. 33, pp. 102-106; Habib et al., 2016, "Div-Seq: Single-nucleus RNA-Seq reveals dynamics of rare adult newborn neurons" Science, Vol. 353, Issue 6302, pp. 925-928; Habib et al., 2017, "Massively parallel single-nucleus RNA-seq with DroNc-seq" Nat Methods. 2017 October; 14(10):955-958; and International patent application number PCT/US2016/059239, published as WO2017164936 on Sep. 28, 2017, which are herein incorporated by reference in their entirety.
[0531] Microfluidics involves micro-scale devices that handle small volumes of fluids. Because microfluidics may accurately and reproducibly control and dispense small fluid volumes, in particular volumes less than 1 .mu.l, application of microfluidics provides significant cost-savings. The use of microfluidics technology reduces cycle times, shortens time-to-results, and increases throughput. Furthermore, incorporation of microfluidics technology enhances system integration and automation. Microfluidic reactions are generally conducted in microdroplets or microwells. The ability to conduct reactions in microdroplets depends on being able to merge different sample fluids and different microdroplets. See, e.g., US Patent Publication No. 20120219947. See also international patent application serial no. PCT/US2014/058637 for disclosure regarding a microfluidic laboratory on a chip.
[0532] Droplet/microwell microfluidics offers significant advantages for performing high-throughput screens and sensitive assays. Droplets allow sample volumes to be significantly reduced, leading to concomitant reductions in cost. Manipulation and measurement at kilohertz speeds enable up to 108 discrete biological entities (including, but not limited to, individual cells or organelles) to be screened in a single day. Compartmentalization in droplets increases assay sensitivity by increasing the effective concentration of rare species and decreasing the time required to reach detection thresholds. Droplet microfluidics combines these powerful features to enable currently inaccessible high-throughput screening applications, including single-cell and single-molecule assays. See, e.g., Guo et al., Lab Chip, 2012, 12, 2146-2155.
[0533] Drop-Sequence methods and apparatus provides a high-throughput single-cell RNA-Seq and/or targeted nucleic acid profiling (for example, sequencing, quantitative reverse transcription polymerase chain reaction, and the like) where the RNAs from different cells are tagged individually, allowing a single library to be created while retaining the cell identity of each read. A combination of molecular barcoding and emulsion-based microfluidics to isolate, lyse, barcode, and prepare nucleic acids from individual cells in high-throughput is used. Microfluidic devices (for example, fabricated in polydimethylsiloxane), sub-nanoliter reverse emulsion droplets. These droplets are used to co-encapsulate nucleic acids with a barcoded capture bead. Each bead, for example, is uniquely barcoded so that each drop and its contents are distinguishable. The nucleic acids may come from any source known in the art, such as for example, those which come from a single cell, a pair of cells, a cellular lysate, or a solution. The cell is lysed as it is encapsulated in the droplet. To load single cells and barcoded beads into these droplets with Poisson statistics, 100,000 to 10 million such beads are needed to barcode .about.10,000-100,000 cells.
[0534] InDrop.TM., also known as in-drop seq, involves a high-throughput droplet-microfluidic approach for barcoding the RNA from thousands of individual cells for subsequent analysis by next-generation sequencing (see, e.g., Klein et al., Cell 161(5), pp 1187-1201, 21 May 2015). Specifically, in in-drop seq, one may use a high diversity library of barcoded primers to uniquely tag all DNA that originated from the same single cell. Alternatively, one may perform all steps in drop.
[0535] Well-based biological analysis or Seq-Well is also contemplated for the present invention. The well-based biological analysis platform, also referred to as Seq-well, facilitates the creation of barcoded single-cell sequencing libraries from thousands of single cells using a device that contains 100,000 40-micron wells. Importantly, single beads can be loaded into each microwell with a low frequency of duplicates due to size exclusion (average bead diameter 35..mu.m). By using a microwell array, loading efficiency is greatly increased compared to drop-seq, which requires poisson loading of beads to avoid duplication at the expense of increased cell input requirements. Seq-well, however, is capable of capturing nearly 100% of cells applied to the surface of the device.
[0536] Seq-well is a methodology which allows attachment of a porous membrane to a container in conditions which are benign to living cells. Combined with arrays of picoliter-scale volume containers made, for example, in PDMS, the platform provides the creation of hundreds of thousands of isolated dialysis chambers which can be used for many different applications. The platform also provides single cell lysis procedures for single cell RNA-seq, whole genome amplification or proteome capture; highly multiplexed single cell nucleic acid preparation (about 100.times. increase over current approaches); highly parallel growth of clonal bacterial populations thus providing synthetic biology applications as well as basic recombinant protein expression; selection of bacterial that have increased secretion of a recombinant product possible product could also be small molecule metabolite which could have considerable utility in chemical industry and biofuels; retention of cells during multiple microengraving events; long term capture of secreted products from single cells; and screening of cellular events. Principles of the present methodology allow for addition and subtraction of materials from the containers, which has not previously been available on the present scale in other modalities.
[0537] Seq-Well also enables stable attachment (through multiple established chemistries) of porous membranes to PDMS nanowell devices in conditions that do not affect cells. Based on requirements for downstream assays, amines are functionalized to the PDMS device and oxidized to the membrane with plasma. With regard to general cell culture uses, the PDMS is amine functionalized by air plasma treatment followed by submersion in an aqueous solution of poly(lysine) followed by baking at 80.degree. C. For processes that require robust denaturing conditions, the amine must be covalently linked to the surface. This is accomplished by treating the PDMS with air plasma, followed by submersion in an ethanol solution of amine-silane, followed by baking at 80.degree. C., followed by submersion in 0.2% phenylene diisothiocyanate (PDITC) DMF/pyridine solution, followed by baking, followed by submersion in chitosan or poly(lysine) solution. For functionalization of the membrane for protein capture, membrane can be amine-silanized using vapor deposition and then treated in solution with NHS-biotin or NHS-maleimide to turn the amine groups into the crosslinking species.
[0538] After functionalization, the device is loaded with cells (bacterial, mammalian or yeast) in compatible buffers. The cell-laden device is then brought in contact with the functionalized membrane using a clamping device. A plain glass slide is placed on top of the membrane in the clamp to provide force for bringing the two surfaces together. After an hour incubation, as one hour is a preferred time span, the clamp is opened and the glass slide is removed. The device can then be submerged in any aqueous buffer for days without the membrane detaching, enabling repetitive measurements of the cells without any cell loss. The covalently-linked membrane is stable in many harsh buffers including guanidine hydrochloride which can be used to robustly lyse cells. If the pore size of the membrane is small, the products from the lysed cells will be retained in each well. The lysing buffer can be washed out and replaced with a different buffer which allows binding of biomolecules to probes preloaded in the wells. The membrane can then be removed, enabling addition of enzymes to reverse transcribe or amplify nucleic acids captured in the wells after lysis. Importantly, the chemistry enables removal of one membrane and replacement with a membrane with a different pore size to enable integration of multiple activities on the same array.
[0539] As discussed, while the platform has been optimized for the generation of individually barcoded single-cell sequencing libraries following confinement of cells and mRNA capture beads (Macosko, et al. Cell. 2015 May 21; 161(5): 1202-1214), it is capable of multiple levels of data acquisition. The platform is compatible with other assays and measurements performed with the same array. For example, profiling of human antibody responses by integrated single-cell analysis is discussed with regard to measuring levels of cell surface proteins (Ogunniyi, A. O., B. A. Thomas, T. J. Politano, N. Varadarajan, E. Landais, P. Poignard, B. D. Walker, D. S. Kwon, and J. C. Love, "Profiling Human Antibody Responses by Integrated Single-Cell Analysis" Vaccine, 32(24), 2866-2873.) The authors demonstrate a complete characterization of the antigen-specific B cells induced during infections or following vaccination, which enables and informs one of skill in the art how interventions shape protective humoral responses. Specifically, this disclosure combines single-cell profiling with on-chip image cytometry, microengraving, and single-cell RT-PCR.
[0540] The invention provides a method for creating a single-cell sequencing library comprising: merging one uniquely barcoded mRNA capture microbead with a single-cell in an emulsion droplet having a diameter of 75-125 .mu.m; lysing the cell to make its RNA accessible for capturing by hybridization onto RNA capture microbead; performing a reverse transcription either inside or outside the emulsion droplet to convert the cell's mRNA to a first strand cDNA that is covalently linked to the mRNA capture microbead; pooling the cDNA-attached microbeads from all cells; and preparing and sequencing a single composite RNA-Seq library.
[0541] The invention provides a method for preparing uniquely barcoded mRNA capture microbeads, which has a unique barcode and diameter suitable for microfluidic devices comprising: 1) performing reverse phosphoramidite synthesis on the surface of the bead in a pool-and-split fashion, such that in each cycle of synthesis the beads are split into four reactions with one of the four canonical nucleotides (T, C, G, or A) or unique oligonucleotides of length two or more bases; 2) repeating this process a large number of times, at least two, and optimally more than twelve, such that, in the latter, there are more than 16 million unique barcodes on the surface of each bead in the pool. (See http://www.ncbi.nlm.nih.gov/pmc/articles/PMC206447).
[0542] In another embodiment, the invention encompasses making beads specific to the panel of desired mutations or mutations plus mRNA and a capture of both. In one embodiment, one or more mutation hot spots may be near the 3' end.
[0543] Generally, the invention provides a method for preparing a large number of beads, particles, microbeads, nanoparticles, or the like with unique nucleic acid barcodes comprising performing polynucleotide synthesis on the surface of the beads in a pool-and-split fashion such that in each cycle of synthesis the beads are split into subsets that are subjected to different chemical reactions; and then repeating this split-pool process in two or more cycles, to produce a combinatorially large number of distinct nucleic acid barcodes. Invention further provides performing a polynucleotide synthesis wherein the synthesis may be any type of synthesis known to one of skill in the art for "building" polynucleotide sequences in a step-wise fashion. Examples include, but are not limited to, reverse direction synthesis with phosphoramidite chemistry or forward direction synthesis with phosphoramidite chemistry. Previous and well-known methods synthesize the oligonucleotides separately then "glue" the entire desired sequence onto the bead enzymatically. Applicants present a complexed bead and a novel process for producing these beads where nucleotides are chemically built onto the bead material in a high-throughput manner. Moreover, Applicants generally describe delivering a "packet" of beads which allows one to deliver millions of sequences into separate compartments and then screen all at once.
[0544] The invention further provides an apparatus for creating a single-cell sequencing library via a microfluidic system, comprising: an oil-surfactant inlet comprising a filter and a carrier fluid channel, wherein said carrier fluid channel further comprises a resistor; an inlet for an analyte comprising a filter and a carrier fluid channel, wherein said carrier fluid channel further comprises a resistor; an inlet for mRNA capture microbeads and lysis reagent comprising a filter and a carrier fluid channel, wherein said carrier fluid channel further comprises a resistor; said carrier fluid channels have a carrier fluid flowing therein at an adjustable or predetermined flow rate; wherein each said carrier fluid channels merge at a junction; and said junction being connected to a mixer, which contains an outlet for drops.
[0545] A mixture comprising a plurality of microbeads adorned with combinations of the following elements: bead-specific oligonucleotide barcodes created by the discussed methods; additional oligonucleotide barcode sequences which vary among the oligonucleotides on an individual bead and can therefore be used to differentiate or help identify those individual oligonucleotide molecules; additional oligonucleotide sequences that create substrates for downstream molecular-biological reactions, such as oligo-dT (for reverse transcription of mature mRNAs), specific sequences (for capturing specific portions of the transcriptome, or priming for DNA polymerases and similar enzymes), or random sequences (for priming throughout the transcriptome or genome). In an embodiment, the individual oligonucleotide molecules on the surface of any individual microbead contain all three of these elements, and the third element includes both oligo-dT and a primer sequence.
[0546] Examples of the labeling substance which may be employed include labeling substances known to those skilled in the art, such as fluorescent dyes, enzymes, coenzymes, chemiluminescent substances, and radioactive substances. Specific examples include radioisotopes (e.g., 32P, 14C, 1251, 3H, and 1311), fluorescein, rhodamine, dansyl chloride, umbelliferone, luciferase, peroxidase, alkaline phosphatase, .beta.-galactosidase, .beta.-glucosidase, horseradish peroxidase, glucoamylase, lysozyme, saccharide oxidase, microperoxidase, biotin, and ruthenium. In the case where biotin is employed as a labeling substance, preferably, after addition of a biotin-labeled antibody, streptavidin bound to an enzyme (e.g., peroxidase) is further added.
[0547] Advantageously, the label is a fluorescent label. Examples of fluorescent labels include, but are not limited to, Atto dyes, 4-acetamido-4'-isothiocyanatostilbene-2,2'disulfonic acid; acridine and derivatives: acridine, acridine isothiocyanate; 5-(2'-aminoethyl)aminonaphthalene-1-sulfonic acid (EDANS); 4-amino-N-[3-vinylsulfonyl)phenyl]naphthalimide-3,5 disulfonate; N-(4-anilino-1-naphthyl)maleimide; anthranilamide; BODIPY; Brilliant Yellow; coumarin and derivatives; coumarin, 7-amino-4-methylcoumarin (AMC, Coumarin 120), 7-amino-4-trifluoromethylcouluarin (Coumaran 151); cyanine dyes; cyanosine; 4',6-diaminidino-2-phenylindole (DAPI); 5'5''-dibromopyrogallol-sulfonaphthalein (Bromopyrogallol Red); 7-diethylamino-3-(4'-isothiocyanatophenyl)-4-methylcoumarin; diethylenetriamine pentaacetate; 4,4'-diisothiocyanatodihydro-stilbene-2,2'-disulfonic acid; 4,4'-diisothiocyanatostilbene-2,2'-disulfonic acid; 5-[dimethylamino]naphthalene-1-sulfonyl chloride (DNS, dansylchloride); 4-dimethylaminophenylazophenyl-4'-isothiocyanate (DABITC); eosin and derivatives; eosin, eosin isothiocyanate, erythrosin and derivatives; erythrosin B, erythrosin, isothiocyanate; ethidium; fluorescein and derivatives; 5-carboxyfluorescein (FAM), 5-(4,6-dichlorotriazin-2-yl)aminofluorescein (DTAF), 2',7'-dimethoxy-4'5'-dichloro-6-carboxyfluorescein, fluorescein, fluorescein isothiocyanate, QFITC, (XRITC); fluorescamine; IR144; IR1446; Malachite Green isothiocyanate; 4-methylumbelliferoneortho cresolphthalein; nitrotyrosine; pararosaniline; Phenol Red; B-phycoerythrin; o-phthaldialdehyde; pyrene and derivatives: pyrene, pyrene butyrate, succinimidyl 1-pyrene; butyrate quantum dots; Reactive Red 4 (Cibacron.TM. Brilliant Red 3B-A) rhodamine and derivatives: 6-carboxy-X-rhodamine (ROX), 6-carboxyrhodamine (R6G), lissamine rhodamine B sulfonyl chloride rhodamine (Rhod), rhodamine B, rhodamine 123, rhodamine X isothiocyanate, sulforhodamine B, sulforhodamine 101, sulfonyl chloride derivative of sulforhodamine 101 (Texas Red); N,N,N',N' tetramethyl-6-carboxyrhodamine (TAMRA); tetramethyl rhodamine; tetramethyl rhodamine isothiocyanate (TRITC); riboflavin; rosolic acid; terbium chelate derivatives; Cy3; Cy5; Cy5.5; Cy7; IRD 700; IRD 800; La Jolta Blue; phthalo cyanine; and naphthalo cyanine.
[0548] The fluorescent label may be a fluorescent protein, such as blue fluorescent protein, cyan fluorescent protein, green fluorescent protein, red fluorescent protein, yellow fluorescent protein or any photoconvertible protein. Colormetric labeling, bioluminescent labeling and/or chemiluminescent labeling may further accomplish labeling. Labeling further may include energy transfer between molecules in the hybridization complex by perturbation analysis, quenching, or electron transport between donor and acceptor molecules, the latter of which may be facilitated by double stranded match hybridization complexes. The fluorescent label may be a perylene or a terrylen. In the alternative, the fluorescent label may be a fluorescent bar code.
[0549] In an advantageous embodiment, the label may be light sensitive, wherein the label is light-activated and/or light cleaves the one or more linkers to release the molecular cargo. The light-activated molecular cargo may be a major light-harvesting complex (LHCII). In another embodiment, the fluorescent label may induce free radical formation.
[0550] The invention discussed herein enables high throughput and high-resolution delivery of reagents to individual emulsion droplets that may contain cells, organelles, nucleic acids, proteins, etc. through the use of monodisperse aqueous droplets that are generated by a microfluidic device as a water-in-oil emulsion. The droplets are carried in a flowing oil phase and stabilized by a surfactant. In one aspect single cells or single organelles or single molecules (proteins, RNA, DNA) are encapsulated into uniform droplets from an aqueous solution/dispersion. In a related aspect, multiple cells or multiple molecules may take the place of single cells or single molecules. The aqueous droplets of volume ranging from 1 pL to 10 nL work as individual reactors. Disclosed embodiments provide 10.sup.4 to 10.sup.5 single cells in droplets which can be processed and analyzed in a single run.
[0551] To utilize microdroplets for rapid large-scale chemical screening or complex biological library identification, different species of microdroplets, each containing the specific chemical compounds or biological probes cells or molecular barcodes of interest, have to be generated and combined at the preferred conditions, e.g., mixing ratio, concentration, and order of combination.
[0552] Each species of droplet is introduced at a confluence point in a main microfluidic channel from separate inlet microfluidic channels. Preferably, droplet volumes are chosen by design such that one species is larger than others and moves at a different speed, usually slower than the other species, in the carrier fluid, as disclosed in U.S. Publication No. US 2007/0195127 and International Publication No. WO 2007/089541, each of which are incorporated herein by reference in their entirety. The channel width and length is selected such that faster species of droplets catch up to the slowest species. Size constraints of the channel prevent the faster moving droplets from passing the slower moving droplets resulting in a train of droplets entering a merge zone. Multi-step chemical reactions, biochemical reactions, or assay detection chemistries often require a fixed reaction time before species of different type are added to a reaction. Multi-step reactions are achieved by repeating the process multiple times with a second, third or more confluence points each with a separate merge point. Highly efficient and precise reactions and analysis of reactions are achieved when the frequencies of droplets from the inlet channels are matched to an optimized ratio and the volumes of the species are matched to provide optimized reaction conditions in the combined droplets.
[0553] Fluidic droplets may be screened or sorted within a fluidic system of the invention by altering the flow of the liquid containing the droplets. For instance, in one set of embodiments, a fluidic droplet may be steered or sorted by directing the liquid surrounding the fluidic droplet into a first channel, a second channel, etc. In another set of embodiments, pressure within a fluidic system, for example, within different channels or within different portions of a channel, can be controlled to direct the flow of fluidic droplets. For example, a droplet can be directed toward a channel junction including multiple options for further direction of flow (e.g., directed toward a branch, or fork, in a channel defining optional downstream flow channels). Pressure within one or more of the optional downstream flow channels can be controlled to direct the droplet selectively into one of the channels, and changes in pressure can be affected on the order of the time required for successive droplets to reach the junction, such that the downstream flow path of each successive droplet can be independently controlled. In one arrangement, the expansion and/or contraction of liquid reservoirs may be used to steer or sort a fluidic droplet into a channel, e.g., by causing directed movement of the liquid containing the fluidic droplet. In another embodiment, the expansion and/or contraction of the liquid reservoir may be combined with other flow-controlling devices and methods, e.g., as discussed herein. Non-limiting examples of devices able to cause the expansion and/or contraction of a liquid reservoir include pistons.
[0554] Key elements for using microfluidic channels to process droplets include: (1) producing droplet of the correct volume, (2) producing droplets at the correct frequency and (3) bringing together a first stream of sample droplets with a second stream of sample droplets in such a way that the frequency of the first stream of sample droplets matches the frequency of the second stream of sample droplets. Preferably, bringing together a stream of sample droplets with a stream of premade library droplets in such a way that the frequency of the library droplets matches the frequency of the sample droplets.
[0555] Methods for producing droplets of a uniform volume at a regular frequency are well known in the art. One method is to generate droplets using hydrodynamic focusing of a dispersed phase fluid and immiscible carrier fluid, such as disclosed in U.S. Publication No. US 2005/0172476 and International Publication No. WO 2004/002627. It is desirable for one of the species introduced at the confluence to be a pre-made library of droplets where the library contains a plurality of reaction conditions, e.g., a library may contain plurality of different compounds at a range of concentrations encapsulated as separate library elements for screening their effect on cells or enzymes, alternatively a library could be composed of a plurality of different primer pairs encapsulated as different library elements for targeted amplification of a collection of loci, alternatively a library could contain a plurality of different antibody species encapsulated as different library elements to perform a plurality of binding assays. The introduction of a library of reaction conditions onto a substrate is achieved by pushing a premade collection of library droplets out of a vial with a drive fluid. The drive fluid is a continuous fluid. The drive fluid may comprise the same substance as the carrier fluid (e.g., a fluorocarbon oil). For example, if a library consists of ten pico-liter droplets is driven into an inlet channel on a microfluidic substrate with a drive fluid at a rate of 10,000 pico-liters per second, then nominally the frequency at which the droplets are expected to enter the confluence point is 1000 per second. However, in practice droplets pack with oil between them that slowly drains. Over time the carrier fluid drains from the library droplets and the number density of the droplets (number/mL) increases. Hence, a simple fixed rate of infusion for the drive fluid does not provide a uniform rate of introduction of the droplets into the microfluidic channel in the substrate. Moreover, library-to-library variations in the mean library droplet volume result in a shift in the frequency of droplet introduction at the confluence point. Thus, the lack of uniformity of droplets that results from sample variation and oil drainage provides another problem to be solved. For example, if the nominal droplet volume is expected to be 10 pico-liters in the library, but varies from 9 to 11 pico-liters from library-to-library then a 10,000 pico-liter/second infusion rate will nominally produce a range in frequencies from 900 to 1,100 droplet per second. In short, sample to sample variation in the composition of dispersed phase for droplets made on chip, a tendency for the number density of library droplets to increase over time and library-to-library variations in mean droplet volume severely limit the extent to which frequencies of droplets may be reliably matched at a confluence by simply using fixed infusion rates. In addition, these limitations also have an impact on the extent to which volumes may be reproducibly combined. Combined with typical variations in pump flow rate precision and variations in channel dimensions, systems are severely limited without a means to compensate on a run-to-run basis. The foregoing facts not only illustrate a problem to be solved, but also demonstrate a need for a method of instantaneous regulation of microfluidic control over microdroplets within a microfluidic channel.
[0556] Combinations of surfactant(s) and oils must be developed to facilitate generation, storage, and manipulation of droplets to maintain the unique chemical/biochemical/biological environment within each droplet of a diverse library. Therefore, the surfactant and oil combination must (1) stabilize droplets against uncontrolled coalescence during the drop forming process and subsequent collection and storage, (2) minimize transport of any droplet contents to the oil phase and/or between droplets, and (3) maintain chemical and biological inertness with contents of each droplet (e.g., no adsorption or reaction of encapsulated contents at the oil-water interface, and no adverse effects on biological or chemical constituents in the droplets). In addition to the requirements on the droplet library function and stability, the surfactant-in-oil solution must be coupled with the fluid physics and materials associated with the platform. Specifically, the oil solution must not swell, dissolve, or degrade the materials used to construct the microfluidic chip, and the physical properties of the oil (e.g., viscosity, boiling point, etc.) must be suited for the flow and operating conditions of the platform.
[0557] Droplets formed in oil without surfactant are not stable to permit coalescence, so surfactants must be dissolved in the oil that is used as the continuous phase for the emulsion library. Surfactant molecules are amphiphilic--part of the molecule is oil soluble, and part of the molecule is water soluble. When a water-oil interface is formed at the nozzle of a microfluidic chip for example in the inlet module discussed herein, surfactant molecules that are dissolved in the oil phase adsorb to the interface. The hydrophilic portion of the molecule resides inside the droplet and the fluorophilic portion of the molecule decorates the exterior of the droplet. The surface tension of a droplet is reduced when the interface is populated with surfactant, so the stability of an emulsion is improved. In addition to stabilizing the droplets against coalescence, the surfactant should be inert to the contents of each droplet and the surfactant should not promote transport of encapsulated components to the oil or other droplets.
[0558] A droplet library may be made up of a number of library elements that are pooled together in a single collection (see, e.g., US Patent Publication No. 2010002241). Libraries may vary in complexity from a single library element to 1015 library elements or more. Each library element may be one or more given components at a fixed concentration. The element may be, but is not limited to, cells, organelles, virus, bacteria, yeast, beads, amino acids, proteins, polypeptides, nucleic acids, polynucleotides or small molecule chemical compounds. The element may contain an identifier such as a label. The terms "droplet library" or "droplet libraries" are also referred to herein as an "emulsion library" or "emulsion libraries." These terms are used interchangeably throughout the specification.
[0559] A cell library element may include, but is not limited to, hybridomas, B-cells, primary cells, cultured cell lines, cancer cells, stem cells, cells obtained from tissue, or any other cell type. Cellular library elements are prepared by encapsulating a number of cells from one to hundreds of thousands in individual droplets. The number of cells encapsulated is usually given by Poisson statistics from the number density of cells and volume of the droplet. However, in some cases the number deviates from Poisson statistics as discussed in Edd et al., "Controlled encapsulation of single-cells into monodisperse picolitre drops." Lab Chip, 8(8): 1262-1264, 2008. The discrete nature of cells allows for libraries to be prepared in mass with a plurality of cellular variants all present in a single starting media and then that media is broken up into individual droplet capsules that contain at most one cell. These individual droplets capsules are then combined or pooled to form a library consisting of unique library elements. Cell division subsequent to, or in some embodiments following, encapsulation produces a clonal library element.
[0560] A bead-based library element may contain one or more beads, of a given type and may also contain other reagents, such as antibodies, enzymes or other proteins. In the case where all library elements contain different types of beads, but the same surrounding media, the library elements may all be prepared from a single starting fluid or have a variety of starting fluids. In the case of cellular libraries prepared in mass from a collection of variants, such as genomically modified, yeast or bacteria cells, the library elements will be prepared from a variety of starting fluids.
[0561] Often it is desirable to have exactly one cell per droplet with only a few droplets containing more than one cell when starting with a plurality of cells or yeast or bacteria, engineered to produce variants on a protein. In some cases, variations from Poisson statistics may be achieved to provide an enhanced loading of droplets such that there are more droplets with exactly one cell per droplet and few exceptions of empty droplets or droplets containing more than one cell.
[0562] Examples of droplet libraries are collections of droplets that have different contents, ranging from beads, cells, small molecules, DNA, primers, antibodies. Smaller droplets may be in the order of femtoliter (fL) volume drops, which are especially contemplated with the droplet dispensors. The volume may range from about 5 to about 600 fL. The larger droplets range in size from roughly 0.5 micron to 500 micron in diameter, which corresponds to about 1 pico liter to 1 nano liter. However, droplets may be as small as 5 microns and as large as 500 microns. Preferably, the droplets are at less than 100 microns, about 1 micron to about 100 microns in diameter. The most preferred size is about 20 to 40 microns in diameter (10 to 100 picoliters). The preferred properties examined of droplet libraries include osmotic pressure balance, uniform size, and size ranges.
[0563] The droplets comprised within the emulsion libraries of the present invention may be contained within an immiscible oil which may comprise at least one fluorosurfactant. In some embodiments, the fluorosurfactant comprised within immiscible fluorocarbon oil is a block copolymer consisting of one or more perfluorinated polyether (PFPE) blocks and one or more polyethylene glycol (PEG) blocks. In other embodiments, the fluorosurfactant is a triblock copolymer consisting of a PEG center block covalently bound to two PFPE blocks by amide linking groups. The presence of the fluorosurfactant (similar to uniform size of the droplets in the library) is critical to maintain the stability and integrity of the droplets and is also essential for the subsequent use of the droplets within the library for the various biological and chemical assays discussed herein. Fluids (e.g., aqueous fluids, immiscible oils, etc.) and other surfactants that may be utilized in the droplet libraries of the present invention are discussed in greater detail herein.
[0564] The present invention provides an emulsion library which may comprise a plurality of aqueous droplets within an immiscible oil (e.g., fluorocarbon oil) which may comprise at least one fluorosurfactant, wherein each droplet is uniform in size and may comprise the same aqueous fluid and may comprise a different library element. The present invention also provides a method for forming the emulsion library which may comprise providing a single aqueous fluid which may comprise different library elements, encapsulating each library element into an aqueous droplet within an immiscible fluorocarbon oil which may comprise at least one fluorosurfactant, wherein each droplet is uniform in size and may comprise the same aqueous fluid and may comprise a different library element, and pooling the aqueous droplets within an immiscible fluorocarbon oil which may comprise at least one fluorosurfactant, thereby forming an emulsion library.
[0565] For example, in one type of emulsion library, all different types of elements (e.g., cells or beads), may be pooled in a single source contained in the same medium. After the initial pooling, the cells or beads are then encapsulated in droplets to generate a library of droplets wherein each droplet with a different type of bead or cell is a different library element. The dilution of the initial solution enables the encapsulation process. In some embodiments, the droplets formed will either contain a single cell or bead or will not contain anything, i.e., be empty. In other embodiments, the droplets formed will contain multiple copies of a library element. The cells or beads being encapsulated are generally variants on the same type of cell or bead. In one example, the cells may comprise cancer cells of a tissue biopsy, and each cell type is encapsulated to be screened for genomic data or against different drug therapies. Another example is that 1011 or 1015 different type of bacteria; each having a different plasmid spliced therein, are encapsulated. One example is a bacterial library where each library element grows into a clonal population that secretes a variant on an enzyme.
[0566] In another example, the emulsion library may comprise a plurality of aqueous droplets within an immiscible fluorocarbon oil, wherein a single molecule may be encapsulated, such that there is a single molecule contained within a droplet for every 20-60 droplets produced (e.g., 20, 25, 30, 35, 40, 45, 50, 55, 60 droplets, or any integer in between). Single molecules may be encapsulated by diluting the solution containing the molecules to such a low concentration that the encapsulation of single molecules is enabled. In one specific example, a LacZ plasmid DNA was encapsulated at a concentration of 20 fM after two hours of incubation such that there was about one gene in 40 droplets, where 10 m droplets were made at 10 kHz per second. Formation of these libraries rely on limiting dilutions.
[0567] Methods of the invention involve forming sample droplets. The droplets are aqueous droplets that are surrounded by an immiscible carrier fluid. Methods of forming such droplets are shown for example in Link et al. (U.S. patent application numbers 2008/0014589, 2008/0003142, and 2010/0137163), Stone et al. (U.S. Pat. No. 7,708,949 and U.S. patent application number 2010/0172803), Anderson et al. (U.S. Pat. No. 7,041,481 and which reissued as RE41,780) and European publication number EP2047910 to Raindance Technologies Inc. The content of each of which is incorporated by reference herein in its entirety.
[0568] In certain embodiments, the carrier fluid may contain one or more additives, such as agents which reduce surface tensions (surfactants). Surfactants can include Tween, Span, fluorosurfactants, and other agents that are soluble in oil relative to water. In some applications, performance is improved by adding a second surfactant to the sample fluid. Surfactants can aid in controlling or optimizing droplet size, flow and uniformity, for example by reducing the shear force needed to extrude or inject droplets into an intersecting channel. This can affect droplet volume and periodicity, or the rate or frequency at which droplets break off into an intersecting channel. Furthermore, the surfactant can serve to stabilize aqueous emulsions in fluorinated oils from coalescing.
[0569] In certain embodiments, the droplets may be surrounded by a surfactant which stabilizes the droplets by reducing the surface tension at the aqueous oil interface. Preferred surfactants that may be added to the carrier fluid include, but are not limited to, surfactants such as sorbitan-based carboxylic acid esters (e.g., the "Span" surfactants, Fluka Chemika), including sorbitan monolaurate (Span 20), sorbitan monopalmitate (Span 40), sorbitan monostearate (Span 60) and sorbitan monooleate (Span 80), and perfluorinated polyethers (e.g., DuPont Krytox 157 FSL, FSM, and/or FSH). Other non-limiting examples of non-ionic surfactants which may be used include polyoxyethylenated alkylphenols (for example, nonyl-, p-dodecyl-, and dinonylphenols), polyoxyethylenated straight chain alcohols, polyoxyethylenated polyoxypropylene glycols, polyoxyethylenated mercaptans, long chain carboxylic acid esters (for example, glyceryl and polyglyceryl esters of natural fatty acids, propylene glycol, sorbitol, polyoxyethylenated sorbitol esters, polyoxyethylene glycol esters, etc.) and alkanolamines (e.g., diethanolamine-fatty acid condensates and isopropanolamine-fatty acid condensates).
[0570] By incorporating a plurality of unique tags into the additional droplets and joining the tags to a solid support designed to be specific to the primary droplet, the conditions that the primary droplet is exposed to may be encoded and recorded. For example, nucleic acid tags can be sequentially ligated to create a sequence reflecting conditions and order of same. Alternatively, the tags can be added independently appended to solid support. Non-limiting examples of a dynamic labeling system that may be used to bioninformatically record information can be found at US Provisional Patent Application entitled "Compositions and Methods for Unique Labeling of Agents" filed Sep. 21, 2012 and Nov. 29, 2012. In this way, two or more droplets may be exposed to a variety of different conditions, where each time a droplet is exposed to a condition, a nucleic acid encoding the condition is added to the droplet each ligated together or to a unique solid support associated with the droplet such that, even if the droplets with different histories are later combined, the conditions of each of the droplets are remain available through the different nucleic acids. Non-limiting examples of methods to evaluate response to exposure to a plurality of conditions can be found at US Provisional Patent Application entitled "Systems and Methods for Droplet Tagging" filed Sep. 21, 2012.
[0571] Applications of the disclosed device may include use for the dynamic generation of molecular barcodes (e.g., DNA oligonucleotides, fluorophores, etc.) either independent from or in concert with the controlled delivery of various compounds of interest (drugs, small molecules, siRNA, CRISPR guide RNAs, reagents, etc.). For example, unique molecular barcodes can be created in one array of nozzles while individual compounds or combinations of compounds can be generated by another nozzle array. Barcodes/compounds of interest can then be merged with cell-containing droplets. An electronic record in the form of a computer log file is kept to associate the barcode delivered with the downstream reagent(s) delivered. This methodology makes it possible to efficiently screen a large population of cells for applications such as single-cell drug screening, controlled perturbation of regulatory pathways, etc. The device and techniques of the disclosed invention facilitate efforts to perform studies that require data resolution at the single cell (or single molecule) level and in a cost-effective manner. Disclosed embodiments provide a high throughput and high-resolution delivery of reagents to individual emulsion droplets that may contain cells, nucleic acids, proteins, etc. through the use of monodisperse aqueous droplets that are generated one by one in a microfluidic chip as a water-in-oil emulsion. Hence, the invention proves advantageous over prior art systems by being able to dynamically track individual cells and droplet treatments/combinations during life cycle experiments. Additional advantages of the disclosed invention provide an ability to create a library of emulsion droplets on demand with the further capability of manipulating the droplets through the disclosed process(es). Disclosed embodiments may, thereby, provide dynamic tracking of the droplets and create a history of droplet deployment and application in a single cell-based environment.
[0572] Droplet generation and deployment is produced via a dynamic indexing strategy and in a controlled fashion in accordance with disclosed embodiments of the present invention. Disclosed embodiments of the microfluidic device discussed herein provides the capability of microdroplets that be processed, analyzed and sorted at a highly efficient rate of several thousand droplets per second, providing a powerful platform which allows rapid screening of millions of distinct compounds, biological probes, proteins or cells either in cellular models of biological mechanisms of disease, or in biochemical, or pharmacological assays.
[0573] The term "tagmentation" refers to a step in the Assay for Transposase Accessible Chromatin using sequencing (ATAC-seq) as described. (See, Buenrostro, J. D., Giresi, P. G., Zaba, L. C., Chang, H. Y., Greenleaf, W. J., Transposition of native chromatin for fast and sensitive epigenomic profiling of open chromatin, DNA-binding proteins and nucleosome position. Nature methods 2013; 10 (12): 1213-1218). Specifically, a hyperactive Tn5 transposase loaded in vitro with adapters for high-throughput DNA sequencing, can simultaneously fragment and tag a genome with sequencing adapters. In one embodiment the adapters are compatible with the methods described herein.
[0574] In certain embodiments, tagmentation is used to introduce adaptor sequences to genomic DNA in regions of accessible chromatin (e.g., between individual nucleosomes) (see, e.g., US20160208323A1; US20160060691A1; WO2017156336A1; and Cusanovich, D. A., Daza, R., Adey, A., Pliner, H., Christiansen, L., Gunderson, K. L., Steemers, F. J., Trapnell, C. & Shendure, J. Multiplex single-cell profiling of chromatin accessibility by combinatorial cellular indexing. Science. 2015 May 22; 348(6237):910-4. doi: 10.1126/science.aabl601. Epub 2015 May 7). In certain embodiments, tagmentation is applied to bulk samples or to single cells in discrete volumes.
[0575] The 3' barcoded libraries can be used in the methods as described herein to provide enriched libraries containing transcripts of interest that are not as abundant or accessible in the original single cell RNAseq libraries. Other Seq-Well embodiments that may be used with the current invention are described in PCT Application entitled "Functionalized Solid Support" filed on Oct. 23, 2018, Attorney Docket No. BROD-2840WP.
Transcripts of Interest
[0576] A transcript of interest may also be referred to interchangeably as a gene of interest or target sequence. Target sequence can refer to any polynucleotide, such as DNA or RNA polynucleotides. In some embodiments, a target sequence is derived from the nucleus or cytoplasm of a cell, and may include nucleic acids in or from mitochondrial, organelles, vesicles, liposomes or particles present within the cell and subjected to a single cell sequencing method, retaining identification of the source cell or subcellular organelle.
[0577] A gene of interest may comprise, for example, a mutation, deletion, insertion, translocation, single nucleotide polymorphism (SNP), splice variant or any combination thereof associated with a particular attribute in a gene of interest. In another embodiment, the gene of interest may be a cancer gene. In another embodiment, the gene of interest is a mutated cancer gene, such as a somatic mutation.
[0578] Any gene, region or mutation of interest and to identify cells containing specific genes, regions or mutations, deletions, insertions, indels, or translocations of interest can be included in the libraries. A gene of interest may be, for example, a hematological disease gene, such as a blood cancer gene, an/or a stromal cell state and/or type/subtype gene. Such a gene can have a mutation. In some embodiments, the stromal cell state or type associated gene can be one or more specific to a homeostatic or non-diseased cell state.
[0579] In some instances, the mutation is located anywhere in the gene. In some instances, the desired transcript can be greater than about 1 kb away from the cell barcode of the nucleic acid of the libraries as described here. The gene of interest may comprise a SNP.
[0580] As the methods herein can be designed to distinguish SNPs within a population, the methods may be used to distinguish pathogenic strains that differ by a single SNP or detect certain disease specific SNPs, such as but not limited to, disease associated SNPs, such as without limitation cancer associated SNPs.
[0581] The gene of interest, transcript of interest, in some instances comprises a mutation.
[0582] Mutation within 1 kilobase of the polyA tail of an mRNA in the library.
[0583] In some instances, the library can include a transcript of interest, or desired transcript is in a T cell or a B cell. In some instances, the transcript of interest is in a T cell receptor, a B cell receptor or a CAR-T cell. In some instances, the transcript of interest is in variable regions of a sequence, all variable regions of, for example a T cell receptor c/p.
[0584] The transcript of interest can be derived from a cell. In some embodiments a T cell, or a B cell. In some embodiments a TCR, A BCR, or a CAR-T cell. In some instances, the methods target variable regions of a transcript of interest. In some instances, the gene of interest is in a cancer cell. In some instances, it is a blood cancer cell. In some instances, it is a leukemia cell, sucha as an AML celll. In some instances, the cell can be characterized by the highly expressed genes comprised with in a cell, and may be characterized as a GMP like cell, HSC/progenitor like cell or a myeloid cell.
[0585] In another embodiment, the specific gene of interest may be a tumor protein P53 gene. Specific mutations include, but are not limited to, positions P152R and/or Q144P in the tumor protein P53 gene.
[0586] In some aspects, there is no mutation but regulation changes as a result of a diseased/dysfunctional state and/or remodeling of a bone marrow microenvironment that can be present as a result of a disease agent or cell, which then can result in a change of gene expression by the stromal cell and a shift in cell state or type.
[0587] In some embodiments, the transcript of interest is one corresponding to a gene as in any of Tables 1-8.
Methods of Distinguishing Cells by Genotype
[0588] In an embodiment, the present invention relates to a method of distinguishing cells by genotype by enriching libraries for transcripts of interest which may comprise a PCR-based method, for example: constructing a library comprising a plurality of nucleic acids wherein each nucleic acid may comprise a gene, a unique molecular identifier (UMI) and a cell barcode (cell BC) flanked by switching mechanism at 5' end of RNA template (SMART) sequences at the 5' and 3' end, amplifying each nucleic acid in the library to create a first PCR product using a tagged 5' primer which may comprise a binding site for a second PCR product and a sequence complementary to a specific gene of interest and a 3' SMART primer complementary to the SMART sequence at the 3' end of the nucleic acid thereby generating a first PCR product, selective enrichment of the first PCR product by binding to the tag introduced by the 5' primer or a targeted 3' capture with a bifunctional bead or targeted capture bead, amplifying the tag-enriched first PCR product with a 5' primer which may comprise the binding site for the second PCR product and a 3' SMART primer complementary to the SMART sequence at the 3' end of the nucleic acid thereby generating the second PCR product, size-selecting a final product comprising the specific gene of interest and determining the genotype of the cell by identifying the UMI and cell BC. Specific sequences can be used to uniquely enable Next Generation Sequencing (NGS) or third-generation sequencing can also be performed by using specific sequences to uniquely enable NGS or third-generation sequencing. Advantageously, the methods allow for determination of expressed DNA sequences, such as mutations, translocations, insertions/deletions (indels), etc.
Constructing a Library
[0589] The methods disclosed herein include a first step of constructing a library, the library includes a plurality of nucleic acids, each nucleic acid including a gene of interest, a unique molecular identifier (UMI) and a cell barcode (cell BC). In a preferred embodiment, each nucleic acid sequence is flanked by switching mechanism at 5' end of RNA template (SMART) sequences at the 5' end and 3' end, that is, in this embodiment, an exemplary nucleic acid in the library would be 5' SMART-genetic region of interest-UMI-Cell BC-SMART 3'. The libraries can be constructed preferably from any single cell sequencing technique, in some preferred embodiments, an mRNA sequencing protocol, in some embodiments, SMART-Seq. Any single cell sequencing protocol can be used, as described elsewhere herein, to construct the library. In some preferred embodiments, the protocol provides 3' barcoded nucleic acids that are subjected to further steps in the method embodiments disclosed herein. Additional library construction methods are described elsewhere herein.
Amplification
[0590] Once a library is constructed, an amplifying step is conducted. The amplifying of each nucleic acid in the library can be performed to create first PCR product. In one preferred embodiment, a PCR-amplification based approach is utilized to derive genetic information from single-cell RNA-seq libraries. However, other amplification techniques can be utilized that amplify the library of nucleic acid sequences, with primers designed in accordance with further desired further processing or sequencing techniques, as described herein.
[0591] In one particular embodiment, when the libraries are flanked with SMART sequences on both ends, the vast majority of the first PCR product would be amplification of the entire library.
[0592] Alternatively, or in addition to and prior to a PCR amplification step, a step of reverse transcription can be performed. In some embodiments, amplifying each nucleic acid in the library to create a whole transcriptome amplified (WTA) RNA by reverse transcription with a primer comprising a sequence adapter. In some embodiments, In certain embodiments, the amplified RNA comprises the orientation: 5'-sequencing adapter-cell barcode-UMI-UUUUUUU-mRNA-3'. In some embodiments, PCR amplification is then conducted of the reverse transcribed products with primers that bind both sequence adapters and adding a library barcode and optionally additional sequence adapters, with subsequent determination of the genotype of the cell by the methods described herein. This particular method can further comprise use of PCR amplification with one or more primers binding both sequence adapters, wherein the one or more primers comprise sequences allowing for circularization of a first PCR product and subsequent circularizing and a second polymerase chain reaction amplification with one or more primers, wherein the one or primers comprise a library barcode and/or additional sequencing adapters.
[0593] In some embodiments, any suitable RNA or DNA amplification technique may be used. In certain example embodiments, the RNA or DNA amplification is an isothermal amplification. In certain example embodiments, the isothermal amplification may be nucleic-acid sequenced-based amplification (NASBA), recombinase polymerase amplification (RPA), loop-mediated isothermal amplification (LAMP), strand displacement amplification (SDA), helicase-dependent amplification (HDA), or nicking enzyme amplification reaction (NEAR). In certain example embodiments, non-isothermal amplification methods may be used which include, but are not limited to, PCR, multiple displacement amplification (MDA), rolling circle amplification (RCA), ligase chain reaction (LCR), or ramification amplification method (RAM).
[0594] In specific embodiments, the amplification reaction mixture may further comprise primers, capable of hybridizing to a target nucleic acid strand. The term "hybridization" refers to binding of an oligonucleotide primer to a region of the single-stranded nucleic acid template under the conditions in which primer binds only specifically to its complementary sequence on one of the template strands, not other regions in the template. The specificity of hybridization may be influenced by the length of the oligonucleotide primer, the temperature in which the hybridization reaction is performed, the ionic strength, and the pH. The term "primer" refers to a single stranded nucleic acid capable of binding to a single stranded region on a target nucleic acid to facilitate polymerase dependent replication of the target nucleic acid strand. Nucleic acid(s) that are "complementary" or "complement(s)" are those that are capable of base-pairing according to the standard Watson-Crick, Hoogsteen or reverse Hoogsteen binding complementarity rules.
[0595] "PCR" (polymerase chain reaction) refers to a reaction for the in vitro amplification of specific DNA sequences by the simultaneous primer extension of complementary strands of DNA. In other words, PCR is a reaction for making multiple copies or replicates of a target nucleic acid flanked by primer binding sites, such reaction comprising one or more repetitions of the following steps: (i) denaturing the target nucleic acid, (ii) annealing primers to the primer binding sites, and (iii) extending the primers by a nucleic acid polymerase in the presence of nucleoside triphosphates. Usually, the reaction is cycled through different temperatures optimized for each step in a thermal cycler instrument. Particular temperatures, durations at each step, and rates of change between steps depend on many factors well-known to those of ordinary skill in the art, e.g., exemplified by the references: McPherson et al., editors, PCR: A Practical Approach and PCR2: A Practical Approach (IRL Press, Oxford, 1991 and 1995, respectively). For example, in a conventional PCR using Taq DNA polymerase, a double stranded target nucleic acid may be denatured at a temperature greater than 90.degree. C., primers annealed at a temperature in the range 50-75.degree. C., and primers extended at a temperature in the range 72-78.degree. C.
[0596] PCR encompasses derivative forms of the reaction, including but not limited to, RT-PCR, real-time PCR, nested PCR, quantitative PCR, multiplexed PCR, and the like. Reaction volumes range from a few hundred nanoliters, e.g., 200 nL, to a few hundred microliters, e.g., 200 microliters. "Reverse transcription PCR," or "RT-PCR," means a PCR that is preceded by a reverse transcription reaction that converts a target RNA to a complementary single stranded DNA, which is then amplified, e.g., Tecott et al., U.S. Pat. No. 5,168,038. "Real-time PCR" means a PCR for which the amount of reaction product, i.e., amplicon, is monitored as the reaction proceeds. There are many forms of real-time PCR that differ mainly in the detection chemistries used for monitoring the reaction product, e.g., Gelfand et al., U.S. Pat. No. 5,210,015 ("Taqman"); Wittwer et al., U.S. Pat. Nos. 6,174,670 and 6,569,627 (intercalating dyes); Tyagi et al., U.S. Pat. No. 5,925,517 (molecular beacons). Detection chemistries for real-time PCR are reviewed in Mackay et al., Nucleic Acids Research, 30:1292-1305 (2002). "Nested PCR" means a two-stage PCR wherein the amplicon of a first PCR becomes the sample for a second PCR using a new set of primers, at least one of which binds to an interior location of the first amplicon. As used herein, "initial primers" in reference to a nested amplification reaction mean the primers used to generate a first amplicon, and "secondary primers" mean the one or more primers used to generate a second, or nested, amplicon. "Multiplexed PCR" means a PCR wherein multiple target sequences (or a single target sequence and one or more reference sequences) are simultaneously carried out in the same reaction mixture (see, e.g., Bernard et al., Anal. Biochem., 273:221-228, 1999 (two-color real-time PCR)). Usually, distinct sets of primers are employed for each sequence being amplified. "Quantitative PCR" means a PCR designed to measure the abundance of one or more specific target sequences in a sample or specimen. Quantitative PCR includes both absolute quantitation and relative quantitation of such target sequences. Techniques for quantitative PCR are well-known to those of ordinary skill in the art, as exemplified in the following references: Freeman et a1. (Biotechniques, 26:112-126, 1999; Becker-Andre et al. (Nucleic Acids Research, 17:9437-9447, 1989; Zimmerman et al. (Biotechniques, 21:268-279, 1996; Diviacco et al. (Gene, 122:3013-3020, 1992; Becker-Andre et al., (Nucleic Acids Research, 17:9437-9446, 1989); and the like.
Primers
[0597] "Primer" includes an oligonucleotide, either natural or synthetic, that is capable, upon forming a duplex with a polynucleotide template, of acting as a point of initiation of nucleic acid synthesis and being extended from its 3' end along the template so that an extended duplex is formed. The sequence of nucleotides added during the extension process are determined by the sequence of the template polynucleotide. Usually primers are extended by a DNA polymerase. Primers usually have a length in the range of between 3 to 36 nucleotides, from 5 to 24 nucleotides, or from 14 to 36 nucleotides. In certain aspects, primers are universal primers or non-universal primers. Pairs of primers can flank a sequence of interest or a set of sequences of interest. Primers and probes can be degenerate in sequence. In certain aspects, primers bind adjacent to the target sequence, whether it is the sequence to be captured for analysis, or a tag that it to be copied.
[0598] In specific embodiments, the amplification reaction mixture may further comprise a first primer and optionally second primer. The first and second primer may comprise a portion that is complementary to a first portion of the target nucleic acid and a second primer comprising a portion that is complementary to a second portion of the target nucleic acid. The first and second primer may be referred to as a primer pair. In some embodiments, the first or second primer may comprise an RNA polymerase promoter.
[0599] In specific embodiments, the amplification reaction mixture may further comprise a polymerase. Subsequent to melting and hybridization with a primer, the nucleic acid is subjected to a polymerization step. A DNA polymerase is selected if the nucleic acid to be amplified is DNA. When the initial target is RNA, a reverse transcriptase may first be used to copy the RNA target into a cDNA molecule and the cDNA is then further amplified by a selected DNA polymerase. The DNA polymerase acts on the target nucleic acid to extend the primers hybridized to the nucleic acid templates in the presence of four dNTPs to form primer extension products complementary to the nucleotide sequence on the nucleic acid template.
[0600] In some instances, the primer is tagged, in one preferred embodiment, the tagged primer is a 5' biotinylated primer, typically used with a gene specific sequence in the primer, targeting a gene, mutation, or SNP of interest. In some instances then, a first PCR product is generated by amplifying sequences with a biotinylated 5' primer comprising a binding site for a second PCR product and a sequence complementary to a specific gene of interest and a 3' SMART primer complementary to the SMART sequence at the 3' end of the nucleic acid to generate a first PCR product. The binding site for the second PCR product may be a partial Illumina sequencing primer binding site or an oligomer for sequencing kit, such as a NEBNext.RTM. oligos for Illumina.RTM. sequencing (see, e.g., neb.com For library preparation for next generation sequencing, Illumina library preparation). However, oligomers for other sequencing kits can be used in the methods described herein, allowing for versatile end use products. Advantageously, nanopore sequencing can also be performed with the methods disclosed herein, with binding sites tailored for such end uses.
[0601] The 5' primer comprising the binding site for the second PCR product to amplify the first PCR product may further comprise a sequence to bind a flow cell, a sequence allowing multiple sequencing libraries to be sequenced simultaneously and/or a sequence providing an additional primer binding site. The sequence to bind a flow cell may be a P7 sequence and the flow cell may be an Illumina.RTM. flowcell. In some embodiments where a reverse transcription and subsequent circularization is performed, P5 and P7 are used in primers of a second PCR amplication and size selection. One of skill in the art can adjust the primers based on desired end material when more is needed for example for nanopore sequencing, and for end use, when next generation sequencing is or is not used.
[0602] In another embodiment, the SMART primer complementary to the SMART sequence at the 3' end of the nucleic acid to amplify the first PCR product may further comprise a sequence to allow fragments to bind a flowcell. The sequence to allow fragments to bind a flowcell may be a P5 sequence.
[0603] Regardless of the library construction method, submitted libraries may consist of a sequence of interest flanked on either side by adapter constructs. On each end, these adapter constructs may have flow cell binding sites, P5 and P7, which allow the library fragment to attach to the flow cell surface. The P5 and P7 regions of single-stranded library fragments anneal to their complementary oligos on the flowcell surface. The flow cell oligos act as primers and a strand complementary to the library fragment is synthesized. The original strand is washed away, leaving behind fragment copies that are covalently bonded to the flowcell surface in a mixture of orientations. 1,000 copies of each fragment are generated by bridge amplification, creating clusters. Bridge amplification can be performed by methods known in the art, for example, as described in U.S. Pat. No. 7,972,820 and U.S. application Ser. No. 15/316,470. For simplification, the figures diagramming the methods show only one copy (out of 1,000) in each cluster, and only two clusters (out of 30-50 million). The P5 region is cleaved, resulting in clusters containing only fragments which are attached by the P7 region. This ensures that all copies are sequenced in the same direction. The sequencing primer anneals to the P5 end of the fragment, and begins the sequencing by synthesis process. Index reads are only performed when a sample is barcoded. When Read 1 is finished, everything from Read 1 is removed and an index primer is added, which anneals at the P7 end of the fragment and sequences the barcode. Everything is stripped from the template, which forms clusters by bridge amplification as in Read 1. This leaves behind fragment copies that are covalently bonded to the flowcell surface in a mixture of orientations. This time, P7 is cut instead of P5, resulting in clusters containing only fragments which are attached by the P5 region. This ensures that all copies are sequences in the same direction (opposite Read 1). The sequencing primer anneals to the P7 region and sequences the other end of the template.
[0604] In another embodiment, the sequence allowing multiple sequencing libraries to be sequenced simultaneously may be an INDEX sequence. The INDEX allows multiple sequencing libraries to be sequenced simultaneously (and demultiplexed using Illumina's bcl2fastq command). See, e.g., https://support.illumina.com for exemplary INDEX sequences.
[0605] In another embodiment, the 5' primer comprising the binding site for the second PCR product to amplify the first PCR product may further comprise a NEXTERA sequence. See, support.illumina.com and U.S. Pat. Nos. 5,965,443, and 6,437,109 and European Patent No. 0927258, for exemplary NEXTERA sequences.
[0606] In another embodiment, the sequence providing an additional primer binding site may be a custom readl primer binding site (CR1P) for sequencing. CR1P is a Custom Readl Primer binding site that is used for Drop-Seq and Seq-Well library sequencing. CRIP may comprise the sequence: GCCTGTCCGCGGAAGCAGTGGTATCAACGCAGAGTAC (SEQ ID NO: 1) (see e.g., Gierahn et al., Nature Methods 14, 395-398 (2017).
[0607] Biotin-NEXT-GENE-for: Biotinylation enables purification of the desired product following the first PCR reaction. NEXT creates a binding site for the second PCR product as well as a partial primer binding site for standard Illumina sequencing kits. NEXT may be any sequence that allows targeted enrichment and then select addition of sequencing handles. GENE is a sequence complementary to the WTA, designed to amplify a specific region of interest (in some embodiments, an exon).
[0608] SMART-rev: The SMART sequence is used in Drop-seq and Seq-Well to generate WTA libraries. Because the polyT-unique molecular identifier-unique cellular barcode (polyT-UMI-CB) sequence is followed by the SMART sequence, and the template switching oligo (TSO) also contains the SMART sequence, WTA libraries have the SMART sequence as a PCR binding site on both the 5' and the 3' end.
[0609] P7-INDEX-NEXTERA: The P7 sequence allows fragments to bind the Illumina flowcell. The INDEX allows multiple sequencing libraries to be sequenced simultaneously (and demultiplexed using Illumina's bcl2fastq command). The NEXTERA sequence provides a primer binding site for Illumina's standard Read2 sequencing primer mix.
[0610] SMART-CR1P-P5: The SMART sequence is the same as in SMART-rev. CRIP is a Custom Read1 Primer binding site that is used for Drop-Seq and Seq-Well library sequencing. The P5 sequence allows fragments to bind the Illumina flowcell. Note that the primer design can be easily modified for compatibility with additional single-cell RNA-seq technologies (SMART) or sequencing technologies (NEXTERA, CRIP).
[0611] Gene specific primers may be mixed for simultaneous detection of multiple mutations. Libraries may also be mixed for simultaneous detection of mutations in multiple samples. Mixed primers sometimes may not always detect multiple mutations in the same gene as only the shortest fragment in some instances will be detected. The 5' primer comprising the binding site for the second PCR product to amplify the first PCR product further comprises a sequence allowing multiple sequencing libraries to be sequenced simultaneously.
Enrichment
[0612] Nucleic acid enrichment reduces the complexity of a large nucleic acid sample, such as a genomic DNA sample, cDNA library or mRNA library, to facilitate further processing and genetic analysis. In certain example embodiments, the enrichment step is optional.
[0613] The method also provides for biotin enrichment of the first PCR product. Biotinylation of the primer to amplify the gene, region or mutation of interest from the library allows for the purification of the PCR product of interest. Because the libraries are flanked with SMART sequences on both ends, the vast majority of the first PCR product would be amplification of the entire library. In some embodiments, without the biotinylated primer, enrichment of the gene, region or mutation of interest would be insufficient to efficiently and confidently call genetic mutations. Biotin enrichment may be accomplished by streptavidin binding of the biotinylated first PCR product. The streptavidin bead kilobaseBINDER kit (Thermo Fisher Cat #60101) allows for isolation of large biotinylated DNA fragments. However, as described herein, other embodiments of the methods disclosed herein do not require an enrichment step and may advantageously be used without biotinylated primers.
Second Amplification
[0614] A second step of amplifying may be performed, in a preferred embodiment, a second PCR step is performed. However, in some embodiments, other methods of amplification can be utilized, as discussed herein.
[0615] In one embodiment, amplifying the tag-enriched first PCR product with a 5' primer comprising the binding site for the second PCR product and a 3' SMART primer complementary to the SMART sequence at the 3' end of the nucleic acid thereby generating the second PCR product, the SMART primer complementary to the SMART sequence at the 3' end of the nucleic acid to amplify the first PCR product further comprises a sequence to allow fragments to bind a flowcell. In an embodiment, one of the PCR primers for the second PCR amplification comprises a sequence to allow fragments to bind a flowcell is a P5 sequence, with the second primer comprising a barcoded oiligos that can be used for library indexing. In some instances, the primers comprise a deoxyuracil residue that can be incorporated in the first PCR product such that the first PCR product can be treated with a uracil-specific excision reagent.
[0616] In some embodiment, as discussed herein, comprises treating the first PCR product with a uracil-specific excision reagent ("USER.RTM.") enzyme, circularizing the first PCR product by sticky end ligation, and amplifying the tag-enriched circularized PCR product with a 5' primer complementary to gene of interest and having a sequence adapter and a 3' primer having a polyA tail and another sequence adapter thereby generating the second PCR product.
[0617] Optionally, additional amplification steps can be performed, including a thrif or fourth amplification. In some embodiments, amplification is performed by PCR, and can be utilized when additional material is needed for further manipulation of the libraries, including, for example third generation sequencing. Other amplification methods as described elsewhere herein, can be used with appropriate primers selected according to the amplification methods used, and the final library content desired.
Determining Genotype
[0618] Determining the genotype of the cell may be accomplished by identifying the UMI and cell BC, thereby distinguishing the cells by genotype, or expressed DNA sequences, such as mutations, translocations, insertions/deletions (indels), etc. In one embodiment, the nucleic acids comprise a tag that is a molecule that can be affinity selected such as, but not limited to, a small protein, peptide, nucleic acid. Advantageously, the tag is a biotin tag. The enriched libraries provided by the methods may be further distinguished or manipulated, including by subjecting to sequencing.
[0619] In addition to next-generation sequencing, long read/third-generation sequencing is also contemplated for use in the presently disclosed subject matter. Third-generation sequencing reads nucleotide sequences at the single molecule level. In some embodiments, third-generation sequencing is used when long reads are desired, and can be used, in some instances, instead of next-generation sequencing technologies in desired applications. In particular embodiments, nanopore sequencing or single molecule real time sequencing (SMRT) is used for third-generation sequencing. Nanopore technology libraries are generated by end-repair and sequencing adapter ligation, and, as such, allows for versatility in the sequencing adapters utilized in the PCR reaction. Accordingly, in some instances, when nanopore sequencing is utilized, the `sequencing adapters` in the first PCR reaction is any adapter that allows for a second PCR with common primers. Exemplary nanopore technology that can be used for long reads can be found, for example, using Oxford Nanopore technology, available at nanoporetech.com. Long-read sequencing can also utilize SMRT sequencing which enables single-molecule resolution through the use of nucleotides uniquely labeled with a fluorophore, and observing a single DNA polymerase molecule while synthesizing a complementary DNA in a replication reaction to allow for single molecule resolution. tallows production of a natural DNA strand using the labeled nucleotides. In some instances, when third-generation sequencing will be used, additional amplification can be performed to generate sufficient material.
Distinguishing Cells by Genotype
[0620] A method of distinguishing cells by genotype may, in some embodiments comprise constructing a library as discussed herein that comprises a plurality of nucleic acids wherein each nucleic acid comprises a gene, a unique molecular identifier (UMI) and a cell barcode (cell BC) flanked by sequencing adapters at the 5' and 3' end. In particular embodiments, each nucleic acid comprises the orientation: 5'-sequencing adapter-cell barcode-UMI-UUUUUUU-mRNA-3'. Amplifying each nucleic acid in the library to create a whole transcriptome amplified (WTA) RNA by reverse transcription can be performed with a primer comprising a sequence adapter to provide a reverse transcribed product. The steps provide amplifying the reverse transcribed product by PCR amplification with primers that bind both sequence adapters and adding a library barcode and optionally additional sequence adapters to generate a first PCR product. The genotype of the cell can be performed as discussed elsewhere, including identifying the UMI and library barcode, thereby distinguishing the cells by genotype.
Reverse Transcribing
[0621] In specific embodiments, the amplification reaction mixture may further comprise a polymerase. Subsequent to melting and hybridization with a primer, the nucleic acid is subjected to a polymerization step. A DNA polymerase is selected if the nucleic acid to be amplified is DNA. When the initial target is RNA, a reverse transcriptase may first be used to copy the RNA target into a cDNA molecule and the cDNA is then further amplified by a selected DNA polymerase. The DNA polymerase acts on the target nucleic acid to extend the primers hybridized to the nucleic acid templates in the presence of four dNTPs to form primer extension products complementary to the nucleotide sequence on the nucleic acid template.
Optionally Treating with USER Enzyme and Amplifying
[0622] In some embodiments, the primers for amplifying in in a first PCR amplification comprise USER sequences, and further comprising treating the first PCR product with USER enzyme, thereby generating a circularized product.
[0623] The steps include cleaving the dU residue by addition of a uracil-specific excision reagent ("USER.RTM.") enzyme/T4 ligase to generate long complementary sticky ends to mediate efficient circularization and ligation, which now places the barcode and the 5' edge of the transcript sequence set in the primer extension in close proximity, thereby bringing the cell barcode within 100 bases of any desired sequence in the transcript.
[0624] Following treating with USER enzyme, the step of amplifying the circularized product in a second polymerase chain reaction with one or more primers, wherein the one or primers comprise a library barcode and/or additional sequencing adapters can be conducted.
[0625] In some embodiments, the method can then include more than one PCR steps with transcript specific primers, that can include adaptor sequences, and preferably uses nested PCR reactions where the final PCR reaction sets the 3' edge of the transcript sequence of the final sequencing construct. The final sequencing library can be utilized in several ways, including sequencing of the transcript sequence, or at some desired location in the transcript sequence.
Circularization without Enrichment
[0626] In one embodiment, the methods disclosed herein provide a protocol that eliminates need for enrichment in a scalable process. An exemplary embodiment can provide for amplification of all variable regions of a T-cell receptor. The methods described herein can be advantageously be used for the amplification of regions not well characterized in RNA seq libraries. The steps include providing an RNAseq library, in some preferred embodiments, a SeqWell library. The starting library comprises a plurality of nucleic acids with each nucleic acid comprising a gene, a unique molecular identifier (UMI) and a cell barcode (cell BC) flanked by universal sequences.
[0627] In an embodiment, the method comprises conducting primer extension on a nucleic acid in the library with one or more 5' primers with each primer comprising a sequence complementary to a desired transcript and the universal sequence of the nucleic acid, thereby replicating one or more desired transcripts and setting a 5' edge of one or more desired transcript sequences in one or more final sequencing constructs; amplifying the replicated one or more desired transcript sequences with universal primers having complementary sequences on 5' ends of the universal primers followed by a deoxy-uracil residue to form an amplicon; and ligating the amplicons by reacting the amplicons with a uracil-specific excision reagent enzyme, thereby cleaving the amplicon at the deoxy-uracil residues resulting in sticky ends that mediate circularization.
[0628] Additional steps of amplifying by PCR may be performed. In these instances, primers complementary to a transcript of interest. In some preferred embodiments, at least two PCR steps are performed in a nested PCR using two sets of transcript specific primers complementary to a transcript of interest. As described previously, the primers may comprise adaptor sequences. In one embodiment, at least one set of the two sets of transcript specific primers comprise adaptor sequences, thereby yielding a final sequencing library of final sequencing constructs. In an embodiment, the last PCR step sets a 3' edge of the transcript sequence of the final construct. In some embodiments, the sequencing step utilizes primers complementary to the 3' set and 5' set edges of the final sequencing construct. The sequencing step can utilize a primer binding to a desired location in the final sequencing construct to drive a sequencing read at the desired location in the final sequencing construct, as described elsewhere herein.
[0629] The embodiments disclosed herein method works particularly well for libraries where a subset of the transcripts of interest are more than 1 kb away from the cell barcode. Particularly, variable regions of T-cell receptors can be used in the current methods. Accordingly, the transcript of interest can be in a T cell or a B cell, in some embodiments, in a T cell receptor, a B cell receptor or a CAR-T cell. Advantageously, the embodiment can comprise use of a pool of primers that, in an embodiment targeting variable regions, may target all variable regions. The sequencing method may also determine SNPs in the single cell.
RNA-Seq/Single Cell Sequencing
[0630] As described above, in some embodiments, gene expression can be determined using an RNA-seq-based method. In certain embodiments, the invention involves single cell RNA sequencing (see, e.g., Kalisky, T., Blainey, P. & Quake, S. R. Genomic Analysis at the Single-Cell Level. Annual review of genetics 45, 431-445, (2011); Kalisky, T. & Quake, S. R. Single-cell genomics. Nature Methods 8, 311-314 (2011); Islam, S. et al. Characterization of the single-cell transcriptional landscape by highly multiplex RNA-seq. Genome Research, (2011); Tang, F. et al. RNA-Seq analysis to capture the transcriptome landscape of a single cell. Nature Protocols 5, 516-535, (2010); Tang, F. et al. mRNA-Seq whole-transcriptome analysis of a single cell. Nature Methods 6, 377-382, (2009); Ramskold, D. et al. Full-length mRNA-Seq from single-cell levels of RNA and individual circulating tumor cells. Nature Biotechnology 30, 777-782, (2012); and Hashimshony, T., Wagner, F., Sher, N. & Yanai, I. CEL-Seq: Single-Cell RNA-Seq by Multiplexed Linear Amplification. Cell Reports, Cell Reports, Volume 2, Issue 3, p 666-673, 2012).
[0631] In certain embodiments, the invention involves plate based single cell RNA sequencing (see, e.g., Picelli, S. et al., 2014, "Full-length RNA-seq from single cells using Smart-seq2" Nature protocols 9, 171-181, doi: 10. 1038/nprot.2014.006).
[0632] In certain embodiments, the invention involves high-throughput single-cell RNA-seq. In this regard reference is made to Macosko et al., 2015, "Highly Parallel Genome-wide Expression Profiling of Individual Cells Using Nanoliter Droplets" Cell 161, 1202-1214; International patent application number PCT/US2015/049178, published as WO2016/040476 on Mar. 17, 2016; Klein et al., 2015, "Droplet Barcoding for Single-Cell Transcriptomics Applied to Embryonic Stem Cells" Cell 161, 1187-1201; International patent application number PCT/US2016/027734, published as WO2016168584A1 on Oct. 20, 2016; Zheng, et al., 2016, "Haplotyping germline and cancer genomes with high-throughput linked-read sequencing" Nature Biotechnology 34, 303-311; Zheng, et al., 2017, "Massively parallel digital transcriptional profiling of single cells" Nat. Commun. 8, 14049 doi: 10.1038/ncomms14049; International patent publication number WO2014210353A2; Zilionis, et al., 2017, "Single-cell barcoding and sequencing using droplet microfluidics" Nat Protoc. Jan; 12(1):44-73; Cao et al., 2017, "Comprehensive single cell transcriptional profiling of a multicellular organism by combinatorial indexing" bioRxiv preprint first posted online Feb. 2, 2017, doi: dx.doi.org/10.1101/104844; Rosenberg et al., 2017, "Scaling single cell transcriptomics through split pool barcoding" bioRxiv preprint first posted online Feb. 2, 2017, doi: dx.doi.org/10.1101/105163; Rosenberg et al., "Single-cell profiling of the developing mouse brain and spinal cord with split-pool barcoding" Science 15 Mar. 2018; Vitak, et al., "Sequencing thousands of single-cell genomes with combinatorial indexing" Nature Methods, 14(3):302-308, 2017; Cao, et al., Comprehensive single-cell transcriptional profiling of a multicellular organism. Science, 357(6352):661-667, 2017; and Gierahn et al., "Seq-Well: portable, low-cost RNA sequencing of single cells at high throughput" Nature Methods 14, 395-398 (2017), all the contents and disclosure of each of which are herein incorporated by reference in their entirety.
[0633] In certain embodiments, the invention involves single nucleus RNA sequencing. In this regard reference is made to Swiech et al., 2014, "In vivo interrogation of gene function in the mammalian brain using CRISPR-Cas9" Nature Biotechnology Vol. 33, pp. 102-106; Habib et al., 2016, "Div-Seq: Single-nucleus RNA-Seq reveals dynamics of rare adult newborn neurons" Science, Vol. 353, Issue 6302, pp. 925-928; Habib et al., 2017, "Massively parallel single-nucleus RNA-seq with DroNc-seq" Nat Methods. 2017 October; 14(10):955-958; and International patent application number PCT/US2016/059239, published as WO2017164936 on Sep. 28, 2017, which are herein incorporated by reference in their entirety.
[0634] In certain embodiments, the invention involves the Assay for Transposase Accessible Chromatin using sequencing (ATAC-seq) as described. (see, e.g., Buenrostro, et al., Transposition of native chromatin for fast and sensitive epigenomic profiling of open chromatin, DNA-binding proteins and nucleosome position. Nature methods 2013; 10 (12): 1213-1218; Buenrostro et al., Single-cell chromatin accessibility reveals principles of regulatory variation. Nature 523, 486-490 (2015); Cusanovich, D. A., Daza, R., Adey, A., Pliner, H., Christiansen, L., Gunderson, K. L., Steemers, F. J., Trapnell, C. & Shendure, J. Multiplex single-cell profiling of chromatin accessibility by combinatorial cellular indexing. Science. 2015 May 22; 348(6237):910-4. doi: 10.1126/science.aabl601. Epub 2015 May 7; US20160208323A1; US20160060691A1; and WO2017156336A1).
MS Methods
[0635] Biomarker detection may also be evaluated using mass spectrometry methods. A variety of configurations of mass spectrometers can be used to detect biomarker values. Several types of mass spectrometers are available or can be produced with various configurations. In general, a mass spectrometer has the following major components: a sample inlet, an ion source, a mass analyzer, a detector, a vacuum system, and instrument-control system, and a data system. Difference in the sample inlet, ion source, and mass analyzer generally define the type of instrument and its capabilities. For example, an inlet can be a capillary-column liquid chromatography source or can be a direct probe or stage such as used in matrix-assisted laser desorption. Common ion sources are, for example, electrospray, including nanospray and microspray or matrix-assisted laser desorption. Common mass analyzers include a quadrupole mass filter, ion trap mass analyzer and time-of-flight mass analyzer. Additional mass spectrometry methods are well known in the art (see Burlingame et al., Anal. Chem. 70:647 R-716R (1998); Kinter and Sherman, N.Y. (2000)).
[0636] Protein biomarkers and biomarker values can be detected and measured by any of the following: electrospray ionization mass spectrometry (ESI-MS), ESI-MS/MS, ESI-MS/(MS)n, matrix-assisted laser desorption ionization time-of-flight mass spectrometry (MALDI-TOF-MS), surface-enhanced laser desorption/ionization time-of-flight mass spectrometry (SELDI-TOF-MS), desorption/ionization on silicon (DIOS), secondary ion mass spectrometry (SIMS), quadrupole time-of-flight (Q-TOF), tandem time-of-flight (TOF/TOF) technology, called ultraflex III TOF/TOF, atmospheric pressure chemical ionization mass spectrometry (APCI-MS), APCI-MS/MS, APCI-(MS). sup.N, atmospheric pressure photoionization mass spectrometry (APPI-MS), APPI-MS/MS, and APPI-(MS).sup.N, quadrupole mass spectrometry, Fourier transform mass spectrometry (FTMS), quantitative mass spectrometry, and ion trap mass spectrometry.
[0637] Sample preparation strategies are used to label and enrich samples before mass spectroscopic characterization of protein biomarkers and determination biomarker values. Labeling methods include but are not limited to isobaric tag for relative and absolute quantitation (iTRAQ) and stable isotope labeling with amino acids in cell culture (SILAC). Capture reagents used to selectively enrich samples for candidate biomarker proteins prior to mass spectroscopic analysis include but are not limited to aptamers, antibodies, nucleic acid probes, chimeras, small molecules, an F(ab').sub.2 fragment, a single chain antibody fragment, an Fv fragment, a single chain Fv fragment, a nucleic acid, a lectin, a ligand-binding receptor, affybodies, nanobodies, ankyrins, domain antibodies, alternative antibody scaffolds (e.g. diabodies etc) imprinted polymers, avimers, peptidomimetics, peptoids, peptide nucleic acids, threose nucleic acid, a hormone receptor, a cytokine receptor, and synthetic receptors, and modifications and fragments of these.
Immunoassays
[0638] Immunoassay methods are based on the reaction of an antibody to its corresponding target or analyte and can detect the analyte in a sample depending on the specific assay format. To improve specificity and sensitivity of an assay method based on immunoreactivity, monoclonal antibodies are often used because of their specific epitope recognition. Polyclonal antibodies have also been successfully used in various immunoassays because of their increased affinity for the target as compared to monoclonal antibodies Immunoassays have been designed for use with a wide range of biological sample matrices Immunoassay formats have been designed to provide qualitative, semi-quantitative, and quantitative results.
[0639] Quantitative results may be generated through the use of a standard curve created with known concentrations of the specific analyte to be detected. The response or signal from an unknown sample is plotted onto the standard curve, and a quantity or value corresponding to the target in the unknown sample is established.
[0640] Numerous immunoassay formats have been designed. ELISA or EIA can be quantitative for the detection of an analyte/biomarker. This method relies on attachment of a label to either the analyte or the antibody and the label component includes, either directly or indirectly, an enzyme. ELISA tests may be formatted for direct, indirect, competitive, or sandwich detection of the analyte. Other methods rely on labels such as, for example, radioisotopes (1.sup.125) or fluorescence. Additional techniques include, for example, agglutination, nephelometry, turbidimetry, Western blot, immunoprecipitation, immunocytochemistry, immunohistochemistry, flow cytometry, Luminex assay, and others (see ImmunoAssay: A Practical Guide, edited by Brian Law, published by Taylor & Francis, Ltd., 2005 edition).
[0641] Exemplary assay formats include enzyme-linked immunosorbent assay (ELISA), radioimmunoassay, fluorescent, chemiluminescence, and fluorescence resonance energy transfer (FRET) or time resolved-FRET (TR-FRET) immunoassays. Examples of procedures for detecting biomarkers include biomarker immunoprecipitation followed by quantitative methods that allow size and peptide level discrimination, such as gel electrophoresis, capillary electrophoresis, planar electrochromatography, and the like.
[0642] Methods of detecting and/or quantifying a detectable label or signal generating material depend on the nature of the label. The products of reactions catalyzed by appropriate enzymes (where the detectable label is an enzyme; see above) can be, without limitation, fluorescent, luminescent, or radioactive or they may absorb visible or ultraviolet light. Examples of detectors suitable for detecting such detectable labels include, without limitation, x-ray film, radioactivity counters, scintillation counters, spectrophotometers, colorimeters, fluorometers, luminometers, and densitometers.
[0643] Any of the methods for detection can be performed in any format that allows for any suitable preparation, processing, and analysis of the reactions. This can be, for example, in multi-well assay plates (e.g., 96 wells or 384 wells) or using any suitable array or microarray. Stock solutions for various agents can be made manually or robotically, and all subsequent pipetting, diluting, mixing, distribution, washing, incubating, sample readout, data collection and analysis can be done robotically using commercially available analysis software, robotics, and detection instrumentation capable of detecting a detectable label.
Hybridization Assays
[0644] Such applications are hybridization assays in which a nucleic acid that displays "probe" nucleic acids for each of the genes to be assayed/profiled in the profile to be generated is employed. In these assays, a sample of target nucleic acids is first prepared from the initial nucleic acid sample being assayed, where preparation may include labeling of the target nucleic acids with a label, e.g., a member of a signal producing system. Following target nucleic acid sample preparation, the sample is contacted with the array under hybridization conditions, whereby complexes are formed between target nucleic acids that are complementary to probe sequences attached to the array surface. The presence of hybridized complexes is then detected, either qualitatively or quantitatively. Specific hybridization technology which may be practiced to generate the expression profiles employed in the subject methods includes the technology described in U.S. Pat. Nos. 5,143,854; 5,288,644; 5,324,633; 5,432,049; 5,470,710; 5,492,806; 5,503,980; 5,510,270; 5,525,464; 5,547,839; 5,580,732; 5,661,028; 5,800,992; the disclosures of which are herein incorporated by reference; as well as WO 95/21265; WO 96/31622; WO 97/10365; WO 97/27317; EP 373 203; and EP 785 280. In these methods, an array of "probe" nucleic acids that includes a probe for each of the biomarkers whose expression is being assayed is contacted with target nucleic acids as described above. Contact is carried out under hybridization conditions, e.g., stringent hybridization conditions as described above, and unbound nucleic acid is then removed. The resultant pattern of hybridized nucleic acids provides information regarding expression for each of the biomarkers that have been probed, where the expression information is in terms of whether or not the gene is expressed and, typically, at what level, where the expression data, i.e., expression profile, may be both qualitative and quantitative.
[0645] Optimal hybridization conditions will depend on the length (e.g., oligomer vs. polynucleotide greater than 200 bases) and type (e.g., RNA, DNA, PNA) of labeled probe and immobilized polynucleotide or oligonucleotide. General parameters for specific (i.e., stringent) hybridization conditions for nucleic acids are described in Sambrook et al., supra, and in Ausubel et al., "Current Protocols in Molecular Biology", Greene Publishing and Wiley-interscience, NY (1987), which is incorporated in its entirety for all purposes. When the cDNA microarrays are used, typical hybridization conditions are hybridization in 5.times.SSC plus 0.2% SDS at 65C for 4 hours followed by washes at 25.degree. C. in low stringency wash buffer (1.times.SSC plus 0.2% SDS) followed by 10 minutes at 25.degree. C. in high stringency wash buffer (0.1SSC plus 0.2% SDS) (see Shena et al., Proc. Natl. Acad. Sci. USA, Vol. 93, p. 10614 (1996)). Useful hybridization conditions are also provided in, e.g., Tijessen, Hybridization With Nucleic Acid Probes", Elsevier Science Publishers B.V. (1993) and Kricka, "Nonisotopic DNA Probe Techniques", Academic Press, San Diego, Calif. (1992).
Methods of Modulating and Engineering Bone Marrow Stromal Cells
[0646] Described herein are methods of modulating stromal from one cell state and/or type to another. In some embodiments, the method can include modulating a cell or population thereof that is in a disease-associated cell state to a homeostatic or normal cell state. The methods of modulating stromal cells described herein can be used, for example, to engineer stromal cells having a particular cell state and corresponding characteristics and attributes, to screen and identify agents capable of inducing a particular cell state, and/or for the treatment of disease among others. These and other applications, features, and advantages for/of the methods of modulating stromal cells are described in greater detail elsewhere herein.
Methods of Modulating Bone Marrow Stromal Cell State
[0647] Described elsewhere herein are bone marrow stromal and/or immune cells that can be modified or engineered to express a particular gene, signature (e.g. a gene signature). Such modification and/or engineering can occur ex vivo and/or in vivo. Not being bound by a theory, modifying immune and/or other cells (e.g. other stromal cells) in vivo, such that dysfunctional cells are decreased can provide a therapeutic effect, including but not limited to enhancing an immune response and/or remodeling the bone marrow stromal cell landscape, and/or remodeling the bone marrow microenvironment in a subject. A gene, gene signature, bone marrow stromal cell, or immune cell may be modified by any suitable modulating agent. Methods of modulating cells, screening and identifying suitable modulating agents, and suitable modulating agents are described in greater detail elsewhere herein.
[0648] The invention further relates to agents capable of inducing or suppressing particular stromal cell (sub)populations based on the gene signatures, protein signature, and/or other genetic or epigenetic signature as defined herein, as well as their use for modulating, such as inducing or repressing, a particular gene signature, protein signature, and/or other genetic or epigenetic signature. In one embodiment, genes in one population of cells may be activated or suppressed in order to affect the cells of another population. In related aspects, modulating, such as inducing or repressing, a particular a particular gene signature, protein signature, and/or other genetic or epigenetic signature may modify overall stromal cell composition, such as stromal cell composition (such as in an adoptive cell therapy), such as stromal cell subpopulation composition or distribution, or functionality.
[0649] The terms, "cell landscape", "cellular landscape", are used interchangeably herein to refer to the possible and/or actual profile of cell states and/or cell types present within a defined cell population, such as a tissue, sample, organ, system, and the like. For example, in some embodiments the stromal cell landscape can include cells in various states, such as cell states defined by signatures of Clusters 1-17. Remodeling of the cellular landscape can occur by various methods, such that the relative number of each cell state and/or cell type within the defined cell population is changed. This can occur, for example, by adding and/or removing cells of a specific cell state and/or type from the defined cell population and/or modulating the signatures of one or more cells such that they shift cell state and thus alter the relative number of each cell in the defined population. In some aspects, diseases can result in remodeling a cell landscape such that the cell landscape is pathogenic or supportive of a disease state and/or disease development. In some aspects, a diseased cell landscape can be remodeled such that it is no longer diseased but is like or more like a homeostatic and/or beneficial cell landscape.
[0650] In some embodiments the method of modifying cells states in stromal cells can include administering a modulating agent to a subject or cell population that induces a shift in stromal cells from a disease cell state to a homeostatic or a normal cell state. In some aspects, the stromal cell-state and/or type is characterized by expression of the genes any one of Tables 1-8 or a combination thereof described or as otherwise identified in Clusters 1-17 or a subtype thereof as demonstrated in the Working Examples below or an expression signature derived therefrom. In some aspects, the shift in cell state comprises reducing the distance in gene expression space between the disease-associated cell state and the homeostatic stromal cell state. In some aspects, identifying differences in cell state between the dysfunctional and the homeostatic cell states comprises comparing a gene expression distribution of dysfunctional stromal cells with a gene expression distribution of homeostatic and/or activated as determined by single cell RNA sequencing (scRNA-seq). In some aspects, wherein the gene expression space comprises 10 or more genes, 20 or more genes, 30 or more genes, 40 or more genes, 50 or more genes, 100 or more genes, 500 or more genes, or 1000 or more genes. In some aspects, wherein modulation comprises increasing or decreasing expression of one or more genes, gene expression cassettes, or gene expression signatures.
[0651] In aspects, the cell population can be composed of comprises a single cell type and/or subtype, a combination of cell types and/or subtypes, a cell-based therapeutic, an explant, or an organoid. In some aspects, the cell population comprises bone marrow stromal cells.
[0652] In some aspects, a method of screening for one or more agents capable of modulating stromal cell states, can include: contacting a cell population comprising stromal cells having an initial cell state with a test modulating agent or library of modulating agents; determining a fraction of stromal cell states including a fraction of homeostatic and dysfunctional stromal cells and selecting modulating agents that shift the initial stromal cell state to a desired stromal cell state where the desired stromal fraction in the cell population is above a set cutoff limit.
[0653] In some aspects, the initial cell state is a stromal cell state and the desired cell state is a homeostatic cell state. In some aspects, wherein the cell population is obtained from a subject to be treated.
[0654] Embodiments disclosed herein provide for isolated ex vivo systems that can include one or more cells of a particular cell identity, type, and/or state and formulations thereof. Also provided herein are methods of generating and using the cells, cell-based systems, populations, and formulations thereof. In aspects, the cells and/or ex vivo cell-based systems can recapitulate an in vivo phenotype, which can include a particular cell identity, type, and/or state. As used herein, to "recapitulate an in vivo phenotype" may include increasing the biological fidelity of a cell or population thereof and/or an ex vivo cell-based system to more closely mimic the cell identity, cell type, cell state, physiology and/or structure of a in vivo target or reference cell or system. Mimicking the physiology and/or structure of in vivo target or reference cell or system can include mimicking expression signatures or modules found in vivo target or reference cell or system, mimicking a cell state or states found in the in vivo target or reference cell or system, mimicking the composition of cell types or sub-types found in the in vivo target or reference cell or system, and/or mimicking the a cell identity or identities found in the in vivo target or reference cell or system. In some aspects, the in vivo target or reference cell or system (e.g. stromal cell or system thereof) can have a homeostatic cell state or an activated cell state. Described elsewhere herein, are methods of identifying stromal cells and populations thereof having a specific cell state (e.g. any one of clusters 1-17 or subtypes within a cluster as described elsewhere herein), which can be used to identify the state of the stromal cell. An "ex vivo cell-based system" may be composed of single cells of a particular type, sub-type or state, or a combination of cells of the same or differing type, sub-type, or state. The ex vivo cell-based system may be a model for screening perturbations to better understand the underlying biology or to identify putative targets for treating a disease, or for screening putative therapeutics, and also include models derived ex vivo but further implanted into a living organism, such as a mouse or pig, prior to perturbation of the model. An ex vivo cell-based system may also be a cell-based therapeutic for delivery to an organism to treat disease, or an implant meant to restore or regenerate damaged tissue. Ex vivo cell-based systems can include isolated and/or engineered cells, such as isolated and/or engineered cell-based systems. An "in vivo system" may likewise comprise a single cell or a combination of cells of the same or differing type, sub-type, or state. As used herein ex vivo may include, but not be limited to, in vitro systems, unless otherwise specifically indicated. The "in vivo system" may comprise healthy tissue or cells, or tissues or cells in a homeostatic state, or diseased tissue or cells, or diseased tissue or cells in a non-homeostatic state, or tissues or cells within a viable organism, or diseased tissue or cells within a viable organism. A homeostatic state may include cells or tissues demonstrating a physiology and/or structure typically observed in a healthy living organism. In other embodiments, a homeostatic state may be considered the state that a cell or tissue naturally adopts under a given set of growth conditions and absent further defined genetic, chemical, or environmental perturbations.
[0655] Current in vitro models used to look at biology are not well characterized with reference to in vivo models. The embodiments disclosed herein provide a means for identifying differences in expression at a single cell level and use this information to prioritize how to improve the ex vivo system to more faithfully recapitulate the biological characteristics of the target in vivo system. Particular advantageous uses for ex vivo cell-based systems that faithfully recapitulate an in vivo phenotype of interest include methods for identifying agents capable of inducing or suppressing certain gene signatures or gene expression modules and/or inducing or suppressing certain cell states in the ex vivo cell-based systems. In the context of cell-based therapeutics, the methods disclosed herein may also be used to design ex vivo cell-based systems that based on their programmed gene expression profile or configured cell state can either induce or suppress particular in vivo cell (sub)populations at the site of delivery. In another aspect, the methods disclosed herein provide a method for preparing cell-based therapeutics.
[0656] In certain example embodiments, a method for generating an ex vivo cell-based system that faithfully recapitulates an in vivo phenotype or target system of interest comprises first determining, using single cell RNA sequencing (scRNA-seq) one or more cell (sub)types or one or more cell states in an initial or starting ex vivo cell-based system. It should be noted that the methods disclosed herein may be used to develop an ex vivo cell-based system de novo from a source starting material, or to improve an existing ex vivo cell-based system. Source starting materials may include cultured cell lines or cells or tissues isolated directly from an in vivo source, including explants and biopsies. The source materials may be pluripotent cells including stem cells. Next, differences are identified in the cell (sub)type(s) and/or cell state(s) between the ex vivo cell-based systems a target in vivo system. The cell (sub)type(s) and cell state(s) of the in vivo system may likewise be determined using scRNA-seq or other suitable technique. The scRNA-seq analysis (or other appropriate analysis) may be obtained at the time of running the methods described herein are based on previously archived scRNA-seq analysis. Based on the identified differences, steps to modulate the source material to induce a shift in cell (sub)type(s) and/or cell state(s) that may more closely mimics the target in vivo system may then be selected and applied. Various RNA-seq and other suitable techniques and analyses are described in greater detail elsewhere herein.
[0657] In certain example embodiments, assessing the cell (sub)types and states present in the in vivo system may comprise analysis of expression matrices from the scRNA-seq data, performing dimensionality reduction, graph-based clustering and deriving list of cluster-specific genes in order to identify cell types and/or states present in the in vivo system. These marker genes may then be used throughout to relate the ex vivo system cell (sub)types and states to the in vivo system. The same analysis may then be applied to the source material for the ex vivo cell-based system. From both sets of sc-RNAseq analysis an initial distribution of gene expression data is obtained. In certain embodiments, the distribution may be a count-based metric for the number of transcripts of each gene present in a cell. Further the clustering and gene expression matrix analysis allow for the identification of key genes in the initial ex vivo system and the target in vivo system, such as differences in the expression of key transcription factors. In certain example embodiments, this may be done conducting differential expression analysis.
[0658] For example, in the Working Examples below, differential gene expression analysis identified that stromal cells from bone marrow can be distinguished into 17 types with more subtypes within at least some of the types. Further, some cell states are associated with a diseased state and/or a remodeled bone marrow microenvironment, which can support or facilitate disease development. Thus, the methods disclosed herein can both identify key markers of diseased or dysfunctional stromal cells, as well as different normal or healthy cells sates and types, which can be potential targets for modulation to shift the expression distribution of the ex vivo system towards that of the target in vivo or non-diseased system.
[0659] Other methods for assessing differences in the ex vivo and in vivo systems may be employed. In certain example embodiments, an assessment of differences in the in vivo and ex vivo proteome may be used to further identify key differences in cell type and sub-types or cells. states. For example, isobaric mass tag labeling and liquid chromatography mass spectroscopy may be used to determine relative protein abundances in the ex vivo and in vivo systems. The working examples below provide further disclosure on leveraging proteome analysis within the context of the methods disclosed herein. In certain example embodiments, a statistically significant shift in the initial ex vivo gene expression distribution toward the gene expression distribution of the in vivo systems is sought post-modulation. This is described in greater detail herein with respect to "engineered stromal cells" or "modified stromal cells".
[0660] In certain embodiments, the method may further comprise modulating the initial cell-based system to induce a gain of function in addition to the in vivo phenotype of interest comprising modulating expression of one or more genes, gene expression cassettes, or gene expression signatures associated with the gain of function. In certain embodiments, the method may further comprise modulating the initial cell-based system to induce a loss of function in addition to the in vivo phenotype of interest comprising modulating expression of one or more genes, gene expression cassettes, or gene expression signatures associated with the loss of function.
[0661] In certain embodiments, modulating comprises increasing or decreasing expression of one or more genes, gene expression cassettes, or gene expression signatures. In certain embodiments, modulating includes activating or inhibiting one or more genes, gene expression cassettes, or gene expression signatures (e.g., with an agonist or antagonist). In certain embodiments, modulating the initial cell-based system comprises delivering one or more modulating agents that modify expression of one or more cell types or states in the initial cell-based system, delivering an additional cell type or sub-type to the initial cell-based system, or depleting an existing cell type or sub-type from the initial cell-based system. The one or more modulating agents may comprise one or more cytokines, growth factors, hormones, transcription factors, metabolites or small molecules. The one or more modulating agents may be a genetic modifying agent or an epigenetic modifying agent. The genetic modifying agent may comprise a CRISPR system, a zinc finger nuclease system, a TALEN, or a meganuclease. The epigenetic modifying agent may comprise a DNA methylation inhibitor, HDAC inhibitor, histone acetylation inhibitor, histone methylation inhibitor or histone demethylase inhibitor.
[0662] In certain embodiments, the one or more modulating agents modulate one or more cell-signaling pathways. The one or more pathways may comprise Notch signaling. The one or pathways may comprise Wnt signaling.
[0663] In certain embodiments, the initial cell-based system comprises a single cell type or sub-type, a combination of cell types and/or subtypes, cell-based therapeutic, an explant, or an organoid.
[0664] In certain embodiments, the single cell type or subtype or combination of cell types and/or subtypes comprises an immune cell, intestinal cell, liver cell, kidney cell, lung cell, brain cell, epithelial cell, endoderm cell, neuron, ectoderm cell, islet cell, acinar cell, oocyte, sperm, blood cell, hematopoietic cell, hepatocyte, skin/keratinocyte, melanocyte, bone/osteocyte, hair/dermal papilla cell, cartilage/chondrocyte, fat cell/adipocyte, skeletal muscular cell, endothelium cell, cardiac muscle/cardiomyocyte, neuronal cells, non-neuronal cells, trophoblast, tumor cell, or tumor microenvironment (TME) cell.
[0665] In certain embodiments, the initial cell-based system is derived from a subject with a disease (e.g., to study the disease ex vivo). The disease can be a hematological disease. Such diseases are described in greater detail herein.
[0666] In some embodiments, a method of generating an engineered stromal cell can include first determining, using single cell RNA sequencing (scRNA-seq) one or more cell (sub)types or one or more cell states in an initial or starting ex vivo cell-based system. It should be noted that the methods disclosed herein may be used to develop an ex vivo cell-based system de novo from a source starting material, or to improve an existing ex vivo cell-based system. Source starting materials may include cultured cell lines or cells or tissues isolated directly from an in vivo source, including explants and biopsies. The source materials may be pluripotent cells including stem cells. Next, differences are identified in the cell (sub)type(s) and/or cell state(s) between the ex vivo cell-based systems a target in vivo system. The cell (sub)type(s) and cell state(s) of the in vivo system may likewise be determined using scRNA-seq. The scRNA-seq analysis may be obtained at the time of running the methods described herein are based on previously archived scRNA-seq analysis. Based on the identified differences, steps to modulate the source material to induce a shift in cell (sub)type(s) and/or cell state(s) that may more closely mimics the target in vivo system may then selected and applied.
[0667] In certain embodiments, different methods of single sequencing are better suited for sequencing certain samples (e.g., neurons, rare samples may be more optimally sequenced with a plate-based method or single nuclei sequencing). In certain embodiments, the invention involves plate based single cell RNA sequencing (see, e.g., Picelli, S. et al., 2014, "Full-length RNA-seq from single cells using Smart-seq2" Nature protocols 9, 171-181, doi:10.1038/nprot.2014.006).
[0668] In certain embodiments, the invention involves high-throughput single-cell RNA-seq and/or targeted nucleic acid profiling (for example, sequencing, quantitative reverse transcription polymerase chain reaction, and the like) where the RNAs from different cells are tagged individually, allowing a single library to be created while retaining the cell identity of each read. In this regard reference is made to Macosko et al., 2015, "Highly Parallel Genome-wide Expression Profiling of Individual Cells Using Nanoliter Droplets" Cell 161, 1202-1214; International patent application number PCT/US2015/049178, published as WO2016/040476 on Mar. 17, 2016; Klein et al., 2015, "Droplet Barcoding for Single-Cell Transcriptomics Applied to Embryonic Stem Cells" Cell 161, 1187-1201; International patent application number PCT/US2016/027734, published as WO2016168584A1 on Oct. 20, 2016; Zheng, et al., 2016, "Haplotyping germline and cancer genomes with high-throughput linked-read sequencing" Nature Biotechnology 34, 303-311; Zheng, et al., 2017, "Massively parallel digital transcriptional profiling of single cells" Nat. Commun. 8, 14049 doi: 10.1038/ncomms14049; International patent publication number WO 2014210353 A2; Zilionis, et al., 2017, "Single-cell barcoding and sequencing using droplet microfluidics" Nat Protoc. Jan; 12(1):44-73; Cao et al., 2017, "Comprehensive single cell transcriptional profiling of a multicellular organism by combinatorial indexing" bioRxiv preprint first posted online Feb. 2, 2017, doi: dx.doi.org/10.1101/104844; Rosenberg et al., 2017, "Scaling single cell transcriptomics through split pool barcoding" bioRxiv preprint first posted online Feb. 2, 2017, doi: dx.doi.org/10.1101/105163; Vitak, et al., "Sequencing thousands of single-cell genomes with combinatorial indexing" Nature Methods, 14(3):302-308, 2017; Cao, et al., Comprehensive single-cell transcriptional profiling of a multicellular organism. Science, 357(6352):661-667, 2017; and Gierahn et al., "Seq-Well: portable, low-cost RNA sequencing of single cells at high throughput" Nature Methods 14, 395-398 (2017), all the contents and disclosure of each of which are herein incorporated by reference in their entirety.
[0669] In certain embodiments, the invention involves single nucleus RNA sequencing. In this regard reference is made to Swiech et al., 2014, "In vivo interrogation of gene function in the mammalian brain using CRISPR-Cas9" Nature Biotechnology Vol. 33, pp. 102-106; Habib et al., 2016, "Div-Seq: Single-nucleus RNA-Seq reveals dynamics of rare adult newborn neurons" Science, Vol. 353, Issue 6302, pp. 925-928; Habib et al., 2017, "Massively parallel single-nucleus RNA-seq with DroNc-seq" Nat Methods. 2017 October; 14(10):955-958; and International patent application number PCT/US2016/059239, published as WO2017164936 on Sep. 28, 2017, which are herein incorporated by reference in their entirety.
[0670] In certain example embodiments, assessing the cell (sub)types and states present in the in vivo system may comprise analysis of expression matrices from the scRNA-seq data, performing dimensionality reduction, graph-based clustering and deriving list of cluster-specific genes in order to identify cell types and/or states present in the in vivo system. These marker genes may then be used throughout to relate the ex vivo system cell (sub)types and states to the in vivo system. The same analysis may then be applied to the source material for the ex vivo cell-based system. From both sets of sc-RNAseq analysis an initial distribution of gene expression data is obtained. In certain embodiments, the distribution may be a count-based metric for the number of transcripts of each gene present in a cell. Further the clustering and gene expression matrix analysis allow for the identification of key genes in the initial ex vivo system and the target in vivo system, such as differences in the expression of key transcription factors. In certain example embodiments, this may be done conducting differential expression analysis.
[0671] Other methods for assessing differences in the ex vivo and in vivo systems may be employed. In certain example embodiments, an assessment of differences in the in vivo and ex vivo proteome may be used to further identify key differences in cell type and sub-types or cells. states. For example, isobaric mass tag labeling and liquid chromatography mass spectroscopy may be used to determine relative protein abundances in the ex vivo and in vivo systems. The working examples below provide further disclosure on leveraging proteome analysis within the context of the methods disclosed herein.
[0672] In certain example embodiments, a statistically significant shift in the initial ex vivo gene expression distribution toward the gene expression distribution of the in vivo systems is sought post-modulation. A statistically significant shift in gene expression distribution can be at least 10%, at least 11%, at least 12%, at least 13%, at least 14%, at least 15%, at least 20%, at least 21%, at least 22%, at least 23%, at least 24%, at least 25%, at least 26%, at least 27%, at least 28%, at least 29%, at least 30%, at least 31%, at least 32%, at least 33%, at least 34%, at least 35%, at least 36%, at least 37%, at least 38%, at least 39%, at least 40%, at least 41%, at least 42%, at least 43%, at least 44%, at least 45%, at least 46%, at least 47%, at least 48%, at least 49%, at least 50%, at least 51%, at least 52%, at least 53%, at least 54%, at least 55%, at least 56%, at least 57%, at least 58%, at least 59%, at least 60%, at least 61%, at least 62%, at least 63%, at least 64%, at least 65%, at least 66%, at least 67%, at least 68%, at least 69%, at least 70%, at least 71%, at least 72%, at least 73%, at least 74%, at least 75%, at least 76%, at least 77%, at least 78%, at least 79%, at least 80%, at least 81%, at least 82%, at least 83%, at least 84%, at least 85%, at least 86%, at least 87%, at least 88%, at least 89%, at least 90%, at least 91%, at least 92%, at least 93%, at least 94%, at least 95%, at least 96%, at least 97%, at least 98%, or at least 99%.
[0673] In certain example embodiments, statistical shifts may be determined by defining an in vivo score. For example, a gene list of key genes enriched in the in vivo model may be defined. To determine the fractional contribution to a cell's transcriptome to that gene list, the total log (scaled UMI+1) expression values for gene with the list of interest are summed and then divided by the total amount of scaled UMI detected in that cell giving a proportion of a cell's transcriptome dedicated to producing those genes. Thus, statistically significant shifts may be shifts in an initial score for the ex vivo system after modulation towards the in vivo score or after modulation with an aim of moving in a statistically significant fashion towards the in vivo score.
[0674] Modulation may be monitored in a number of ways. For example, expression of one or more key marker genes identified as described above may be measured at regular levels to assess increases in expression levels. Shifting of the ex vivo system to that of the in vivo system may also be measured phenotypically. For example, imaging an immunocytochemistry for key in vivo markers may be assessed at regular intervals to detect increased expression of the key in vivo markers. Likewise, flow cytometry may be used in a similar manner. In addition, to detecting key in vivo markers, imaging modalities such as those described above may be used to further detect changes in cell morphology of the ex vivo system to more closely resemble the target in vivo system.
[0675] In certain example embodiments, the ex vivo system may be further modulated to not only more faithfully recapitulate a target in vivo system, but the ex vivo system may be further modulated to induce a gain of function. For example, one or more genes, gene expression cassettes (modules), or gene expression signature associated with the gain of function may be induced. Example gain of functions include, but are not limited to, increased anti-apoptotic activity or improved anti-microbial secretion.
[0676] When referring to induction, or alternatively suppression of a particular signature, preferable is meant induction or alternatively suppression (or upregulation or downregulation) of at least one gene/protein and/or epigenetic element of the signature, such as for instance at least to, at least three, at least four, at least five, at least six, or all genes/proteins and/or epigenetic elements of the signature.
[0677] In further aspects, the invention relates to gene signatures, protein signature, and/or other genetic or epigenetic signature of particular bone marrow stromal cell subpopulations, as defined herein elsewhere. The invention hereto also further relates to particular bone marrow stromal cell subpopulations, which may be identified based on the methods according to the invention as discussed herein; as well as methods to obtain such cell (sub)populations and screening methods to identify agents capable of inducing or suppressing particular tumor cell (sub)populations.
[0678] In some exemplary embodiments, described herein are methods of remodeling a stromal cell landscape comprising administering a modulating agent to a subject or a cell population that induces a shift in the stromal cell landscape from a disease-associated stromal cell landscape to a homeostatic stromal cell landscape.
[0679] In some exemplary embodiments, the shift in stromal cells from a disease-associated stromal cell landscape to a homeostatic stromal cell landscape comprises a change in the proportion of preosteoblasts. In some exemplary embodiments, the change in the proportion of preosteoblasts comprises a change in the relative proportion of OLC-1 cells to OLC-2 cells. In some exemplary embodiments, the change in the relative proportion of OLC-1 cells to OLC-2 cells comprises a decrease in OLC-1 cells and an increase in OLC-2 cells.
[0680] In some exemplary embodiments, the shift in stromal cells from a disease-associated stromal cell landscape to a homeostatic stromal cell landscape comprises a change in the relative proportion of bone marrow derived endothelial cell subtypes. In some exemplary embodiments, the change in the relative proportion of bone marrow derived endothelial cell subtypes comprises an increase in sinusoidal bone marrow derived endothelial cells and a decrease in arterial bone marrow derived endothelial cells.
[0681] In some exemplary embodiments, the shift in stromal cells from a disease-associated stromal cell landscape to a homeostatic stromal cell landscape comprises a change in the relative proportion of chondrocyte subtypes. In some exemplary embodiments, the change in the relative proportion of chondrocyte subtypes comprises a decrease in chondrocyte hypertrophic cell subtype and an increase in chondrocyte progenitor cell subtype.
[0682] In some exemplary embodiments, the shift in stromal cells from a disease-associated stromal cell landscape to a homeostatic stromal cell landscape comprises a change in the relative proportion of fibroblast subtypes. In some exemplary embodiments, the change in the relative proportion of fibroblast subtypes comprises an increase in fibroblast subtype-3 and a decrease in fibroblast subtype-4.
[0683] In some exemplary embodiments, the shift in stromal cells from a disease-associated stromal cell landscape to a homeostatic stromal cell landscape comprises a change in the relative proportion in mesenchymal stem/stromal cell (MSC) subtypes. In some exemplary embodiments, the change in the relative proportion in mesenchymal stem/stromal cell (MSC) sub-types comprises a decrease in MSC-2 subtype and an increase in MSC-3 and MSC-4 subtypes.
[0684] In some exemplary embodiments, the shift in the stromal cell landscape comprises a change in the distance in gene expression space between OLC-1, OLC-2, bone marrow derived endothelial cell subtypes, chondrocyte subtypes, fibroblast subtypes, mesenchymal stem/stromal cell (MSC) subtypes, or a combination thereof. In some exemplary embodiments, the distance is measured by a Euclidean distance, Pearson coefficient, Spearman coefficient, or a combination thereof. In some exemplary embodiments, the gene expression space comprises 10 or more genes, 20 or more genes, 30 or more genes, 40 or more genes, 50 or more genes, 100 or more genes, 500 or more genes, or 1000 or more genes. In some exemplary embodiments, remodeling the stromal cell landscape comprises increasing or decreasing the expression of one or more genes, gene programs, gene expression cassettes, gene expression signatures, or a combination thereof. In some exemplary embodiments, the change in the gene expression space is characterized by a change in the expression of one or more genes as in any of Tables 1-8 or an expression signature derived therefrom. In some exemplary embodiments, identifying differences in stromal cell states in the shift in the stromal cell landscape comprises comparing a gene expression distribution of a stromal cell type or subtype in the diseased stromal cell landscape with a gene expression distribution of the stromal cell type or subtype in the homeostatic stromal cell landscape as determined by single cell RNA-sequencing (scRNA-seq).
[0685] In some exemplary embodiments, the shift in the stromal cell landscape from a disease-associated stromal cell landscape to a homeostatic stromal cell landscape increases committed MSCs and decreases osteoprogenitor cells.
[0686] In some exemplary embodiments, the disease is a hematological disease. In some exemplary embodiments, the hematological disease is a hematopoietic disease. In some exemplary embodiments, the hematological disease is a blood cancer. In some embodiments, the blood cancer is leukemia. In some embodiments, the blood cancer is acute lymphocytic leukemia, acute myeloid leukemia, chronic lymphocytic leukemia, chronic myeloid leukemia, hairy cell leukemia, myelodysplastic syndromes, acute promyelocytic leukemia, or myeloproliferative neoplasm.
Modulating Agents
[0687] Modulating agents are any agents that is capable of directly or indirectly modulate the genome, epigenome, gene expression, signature (e.g. a gene signature), gene module, gene product production, or any other phenotype and/or functionality of a cell, such as a bone marrow stromal cell and/or immune cell described herein. Suitable modulating agents include, but are not limited to, biologic molecules, therapeutic antibodies, antibody fragments, antibody-like protein scaffolds, aptamers, polypeptides, genetic modifying agents, small molecule compounds, small molecule degraders, and combinations thereof. Exemplary biologic molecules that can be suitable modulating agents can include, but are not limited to, cytokines, growth factors, hormones, transcription factors, metabolite, and combinations thereof.
[0688] The term "modulate" broadly denotes a qualitative and/or quantitative alteration, change or variation in that which is being modulated. Where modulation can be assessed quantitatively--for example, where modulation comprises or consists of a change in a quantifiable variable such as a quantifiable property of a cell or where a quantifiable variable provides a suitable surrogate for the modulation--modulation specifically encompasses both increase (e.g., activation) or decrease (e.g., inhibition) in the measured variable. The term encompasses any extent of such modulation, e.g., any extent of such increase or decrease, and may more particularly refer to statistically significant increase or decrease in the measured variable. By means of example, modulation may encompass an increase in the value of the measured variable by at least about 10%, e.g., by at least about 20%, preferably by at least about 30%, e.g., by at least about 40%, more preferably by at least about 50%, e.g., by at least about 75%, even more preferably by at least about 100%, e.g., by at least about 150%, 200%, 250%, 300%, 400% or by at least about 500%, compared to a reference situation without said modulation; or modulation may encompass a decrease or reduction in the value of the measured variable by at least about 10%, e.g., by at least about 20%, by at least about 30%, e.g., by at least about 40%, by at least about 50%, e.g., by at least about 60%, by at least about 70%, e.g., by at least about 80%, by at least about 90%, e.g., by at least about 95%, such as by at least about 96%, 97%, 98%, 99% or even by 100%, compared to a reference situation without said modulation. Preferably, modulation may be specific or selective, hence, one or more desired phenotypic aspects of a cell or cell population may be modulated without substantially altering other (unintended, undesired) phenotypic aspect(s).
[0689] The term "agent" broadly encompasses any condition, substance or agent capable of modulating one or more phenotypic aspects of a cell or cell population as disclosed herein. Such conditions, substances or agents may be of physical, chemical, biochemical and/or biological nature. The term "candidate agent" refers to any condition, substance or agent that is being examined for the ability to modulate one or more phenotypic aspects of a cell or cell population as disclosed herein in a method comprising applying the candidate agent to the cell or cell population (e.g., exposing the cell or cell population to the candidate agent or contacting the cell or cell population with the candidate agent) and observing whether the desired modulation takes place. Agents can include any potential class of biologically active conditions, substances or agents, such as for instance antibodies, proteins, peptides, nucleic acids, oligonucleotides, small molecules, or combinations thereof, as described herein.
Genetic/Epigenetic Modifying Agents
[0690] In some embodiments, the modulating agent can be a genetic or epigenetic modifying agent. Suitable genetic modifying agents include, but are not limited to, a CRISPR-Cas system, a zinc finger nuclease system, a TALEN or TALEN system, a meganuclease, an RNAi system, or a combination thereof. Suitable epigenetic modifying agents can include, but are not limited to, a DNA methylation inhibitor, HDAC inhibitor, histone acetylation inhibitor, histone methylation inhibitor or histone demethylase inhibitor.
CRISPR-Cas Systems
[0691] In general, a CRISPR-Cas or CRISPR system as used in herein and in documents, such as WO 2014/093622 (PCT/US2013/074667), refers collectively to transcripts and other elements involved in the expression of or directing the activity of CRISPR-associated ("Cas") genes, including sequences encoding a Cas gene, a tracr (trans-activating CRISPR) sequence (e.g. tracrRNA or an active partial tracrRNA), a tracr-mate sequence (encompassing a "direct repeat" and a tracrRNA-processed partial direct repeat in the context of an endogenous CRISPR system), a guide sequence (also referred to as a "spacer" in the context of an endogenous CRISPR system), or "RNA(s)" as that term is herein used (e.g., RNA(s) to guide Cas, such as Cas9, e.g. CRISPR RNA and transactivating (tracr) RNA or a single guide RNA (sgRNA) (chimeric RNA)) or other sequences and transcripts from a CRISPR locus. In general, a CRISPR system is characterized by elements that promote the formation of a CRISPR complex at the site of a target sequence (also referred to as a protospacer in the context of an endogenous CRISPR system). See, e.g, Shmakov et al. (2015) "Discovery and Functional Characterization of Diverse Class 2 CRISPR-Cas Systems", Molecular Cell, DOI: dx.doi.org/10.1016/j.molcel.2015.10.008.
[0692] In certain embodiments, a protospacer adjacent motif (PAM) or PAM-like motif directs binding of the effector protein complex as disclosed herein to the target locus of interest. In some embodiments, the PAM may be a 5' PAM (i.e., located upstream of the 5' end of the protospacer). In other embodiments, the PAM may be a 3' PAM (i.e., located downstream of the 5' end of the protospacer). The term "PAM" may be used interchangeably with the term "PFS" or "protospacer flanking site" or "protospacer flanking sequence".
[0693] In a preferred embodiment, the CRISPR effector protein may recognize a 3' PAM. In certain embodiments, the CRISPR effector protein may recognize a 3' PAM which is 5'H, wherein His A, CorU.
[0694] In the context of formation of a CRISPR complex, "target sequence" refers to a sequence to which a guide sequence is designed to have complementarity, where hybridization between a target sequence and a guide sequence promotes the formation of a CRISPR complex. A target sequence may comprise RNA polynucleotides. The term "target RNA" refers to a RNA polynucleotide being or comprising the target sequence. In other words, the target RNA may be a RNA polynucleotide or a part of a RNA polynucleotide to which a part of the gRNA, i.e. the guide sequence, is designed to have complementarity and to which the effector function mediated by the complex comprising CRISPR effector protein and a gRNA is to be directed. In some embodiments, a target sequence is located in the nucleus or cytoplasm of a cell.
[0695] In certain example embodiments, the CRISPR effector protein may be delivered using a nucleic acid molecule encoding the CRISPR effector protein. The nucleic acid molecule encoding a CRISPR effector protein, may advantageously be a codon optimized CRISPR effector protein. An example of a codon optimized sequence, is in this instance a sequence optimized for expression in eukaryote, e.g., humans (i.e. being optimized for expression in humans), or for another eukaryote, animal or mammal as herein discussed; see, e.g., SaCas9 human codon optimized sequence in WO 2014/093622 (PCT/US2013/074667). Whilst this is preferred, it will be appreciated that other examples are possible and codon optimization for a host species other than human, or for codon optimization for specific organs is known. In some embodiments, an enzyme coding sequence encoding a CRISPR effector protein is a codon optimized for expression in particular cells, such as eukaryotic cells. The eukaryotic cells may be those of or derived from a particular organism, such as a plant or a mammal, including but not limited to human, or non-human eukaryote or animal or mammal as herein discussed, e.g., mouse, rat, rabbit, dog, livestock, or non-human mammal or primate. In some embodiments, processes for modifying the germ line genetic identity of human beings and/or processes for modifying the genetic identity of animals which are likely to cause them suffering without any substantial medical benefit to man or animal, and also animals resulting from such processes, may be excluded. In general, codon optimization refers to a process of modifying a nucleic acid sequence for enhanced expression in the host cells of interest by replacing at least one codon (e.g. about or more than about 1, 2, 3, 4, 5, 10, 15, 20, 25, 50, or more codons) of the native sequence with codons that are more frequently or most frequently used in the genes of that host cell while maintaining the native amino acid sequence. Various species exhibit particular bias for certain codons of a particular amino acid. Codon bias (differences in codon usage between organisms) often correlates with the efficiency of translation of messenger RNA (mRNA), which is in turn believed to be dependent on, among other things, the properties of the codons being translated and the availability of particular transfer RNA (tRNA) molecules. The predominance of selected tRNAs in a cell is generally a reflection of the codons used most frequently in peptide synthesis. Accordingly, genes can be tailored for optimal gene expression in a given organism based on codon optimization. Codon usage tables are readily available, for example, at the "Codon Usage Database" available at kazusa.orjp/codon/ and these tables can be adapted in a number of ways. See Nakamura, Y., et al. "Codon usage tabulated from the international DNA sequence databases: status for the year 2000" Nucl. Acids Res. 28:292 (2000). Computer algorithms for codon optimizing a particular sequence for expression in a particular host cell are also available, such as Gene Forge (Aptagen; Jacobus, Pa.), are also available. In some embodiments, one or more codons (e.g. 1, 2, 3, 4, 5, 10, 15, 20, 25, 50, or more, or all codons) in a sequence encoding a Cas correspond to the most frequently used codon for a particular amino acid.
[0696] In certain embodiments, the methods as described herein may comprise providing a Cas transgenic cell in which one or more nucleic acids encoding one or more guide RNAs are provided or introduced operably connected in the cell with a regulatory element comprising a promoter of one or more gene of interest. As used herein, the term "Cas transgenic cell" refers to a cell, such as a eukaryotic cell, in which a Cas gene has been genomically integrated. The nature, type, or origin of the cell are not particularly limiting according to the present invention. Also the way the Cas transgene is introduced in the cell may vary and can be any method as is known in the art. In certain embodiments, the Cas transgenic cell is obtained by introducing the Cas transgene in an isolated cell. In certain other embodiments, the Cas transgenic cell is obtained by isolating cells from a Cas transgenic organism. By means of example, and without limitation, the Cas transgenic cell as referred to herein may be derived from a Cas transgenic eukaryote, such as a Cas knock-in eukaryote. Reference is made to WO 2014/093622 (PCT/US13/74667), incorporated herein by reference. Methods of US Patent Publication Nos. 20120017290 and 20110265198 assigned to Sangamo BioSciences, Inc. directed to targeting the Rosa locus may be modified to utilize the CRISPR Cas system of the present invention. Methods of US Patent Publication No. 20130236946 assigned to Cellectis directed to targeting the Rosa locus may also be modified to utilize the CRISPR Cas system of the present invention. By means of further example reference is made to Platt et. a1. (Cell; 159(2):440-455 (2014)), describing a Cas9 knock-in mouse, which is incorporated herein by reference. The Cas transgene can further comprise a Lox-Stop-polyA-Lox(LSL) cassette thereby rendering Cas expression inducible by Cre recombinase. Alternatively, the Cas transgenic cell may be obtained by introducing the Cas transgene in an isolated cell. Delivery systems for transgenes are well known in the art. By means of example, the Cas transgene may be delivered in for instance eukaryotic cell by means of vector (e.g., AAV, adenovirus, lentivirus) and/or particle and/or nanoparticle delivery, as also described herein elsewhere.
[0697] It will be understood by the skilled person that the cell, such as the Cas transgenic cell, as referred to herein may comprise further genomic alterations besides having an integrated Cas gene or the mutations arising from the sequence specific action of Cas when complexed with RNA capable of guiding Cas to a target locus.
[0698] In certain aspects the invention involves vectors, e.g. for delivering or introducing in a cell Cas and/or RNA capable of guiding Cas to a target locus (i.e. guide RNA), but also for propagating these components (e.g. in prokaryotic cells). A used herein, a "vector" is a tool that allows or facilitates the transfer of an entity from one environment to another. It is a replicon, such as a plasmid, phage, or cosmid, into which another DNA segment may be inserted so as to bring about the replication of the inserted segment. Generally, a vector is capable of replication when associated with the proper control elements. In general, the term "vector" refers to a nucleic acid molecule capable of transporting another nucleic acid to which it has been linked. Vectors include, but are not limited to, nucleic acid molecules that are single-stranded, double-stranded, or partially double-stranded; nucleic acid molecules that comprise one or more free ends, no free ends (e.g. circular); nucleic acid molecules that comprise DNA, RNA, or both; and other varieties of polynucleotides known in the art. One type of vector is a "plasmid," which refers to a circular double stranded DNA loop into which additional DNA segments can be inserted, such as by standard molecular cloning techniques. Another type of vector is a viral vector, wherein virally-derived DNA or RNA sequences are present in the vector for packaging into a virus (e.g. retroviruses, replication defective retroviruses, adenoviruses, replication defective adenoviruses, and adeno-associated viruses (AAVs)). Viral vectors also include polynucleotides carried by a virus for transfection into a host cell. Certain vectors are capable of autonomous replication in a host cell into which they are introduced (e.g. bacterial vectors having a bacterial origin of replication and episomal mammalian vectors). Other vectors (e.g., non-episomal mammalian vectors) are integrated into the genome of a host cell upon introduction into the host cell, and thereby are replicated along with the host genome. Moreover, certain vectors are capable of directing the expression of genes to which they are operatively-linked. Such vectors are referred to herein as "expression vectors." Common expression vectors of utility in recombinant DNA techniques are often in the form of plasmids.
[0699] Recombinant expression vectors can comprise a nucleic acid of the invention in a form suitable for expression of the nucleic acid in a host cell, which means that the recombinant expression vectors include one or more regulatory elements, which may be selected on the basis of the host cells to be used for expression, that is operatively-linked to the nucleic acid sequence to be expressed. Within a recombinant expression vector, "operably linked" is intended to mean that the nucleotide sequence of interest is linked to the regulatory element(s) in a manner that allows for expression of the nucleotide sequence (e.g. in an in vitro transcription/translation system or in a host cell when the vector is introduced into the host cell). With regards to recombination and cloning methods, mention is made of U.S. patent application Ser. No. 10/815,730, published Sep. 2, 2004 as US 2004-0171156 A1, the contents of which are herein incorporated by reference in their entirety. Thus, the embodiments disclosed herein may also comprise transgenic cells comprising the CRISPR effector system. In certain example embodiments, the transgenic cell may function as an individual discrete volume. In other words samples comprising a masking construct may be delivered to a cell, for example in a suitable delivery vesicle and if the target is present in the delivery vesicle the CRISPR effector is activated and a detectable signal generated.
[0700] The vector(s) can include the regulatory element(s), e.g., promoter(s). The vector(s) can comprise Cas encoding sequences, and/or a single, but possibly also can comprise at least 3 or 8 or 16 or 32 or 48 or 50 guide RNA(s) (e.g., sgRNAs) encoding sequences, such as 1-2, 1-3, 1-4 1-5, 3-6, 3-7, 3-8, 3-9, 3-10, 3-8, 3-16, 3-30, 3-32, 3-48, 3-50 RNA(s) (e.g., sgRNAs). In a single vector there can be a promoter for each RNA (e.g., sgRNA), advantageously when there are up to about 16 RNA(s); and, when a single vector provides for more than 16 RNA(s), one or more promoter(s) can drive expression of more than one of the RNA(s), e.g., when there are 32 RNA(s), each promoter can drive expression of two RNA(s), and when there are 48 RNA(s), each promoter can drive expression of three RNA(s). By simple arithmetic and well established cloning protocols and the teachings in this disclosure one skilled in the art can readily practice the invention as to the RNA(s) for a suitable exemplary vector such as AAV, and a suitable promoter such as the U6 promoter. For example, the packaging limit of AAV is .about.4.7 kb. The length of a single U6-gRNA (plus restriction sites for cloning) is 361 bp. Therefore, the skilled person can readily fit about 12-16, e.g., 13 U6-gRNA cassettes in a single vector. This can be assembled by any suitable means, such as a golden gate strategy used for TALE assembly (genome-engineering.org/taleffectors/). The skilled person can also use a tandem guide strategy to increase the number of U6-gRNAs by approximately 1.5 times, e.g., to increase from 12-16, e.g., 13 to approximately 18-24, e.g., about 19 U6-gRNAs. Therefore, one skilled in the art can readily reach approximately 18-24, e.g., about 19 promoter-RNAs, e.g., U6-gRNAs in a single vector, e.g., an AAV vector. A further means for increasing the number of promoters and RNAs in a vector is to use a single promoter (e.g., U6) to express an array of RNAs separated by cleavable sequences. And an even further means for increasing the number of promoter-RNAs in a vector, is to express an array of promoter-RNAs separated by cleavable sequences in the intron of a coding sequence or gene; and, in this instance it is advantageous to use a polymerase II promoter, which can have increased expression and enable the transcription of long RNA in a tissue specific manner. (see, e.g., nar. oxfordj ournals.org/content/34/7/e53. short and nature.com/mt/j ournal/v 16/n9/abs/mt2008144a.html). In an advantageous embodiment, AAV may package U6 tandem gRNA targeting up to about 50 genes. Accordingly, from the knowledge in the art and the teachings in this disclosure the skilled person can readily make and use vector(s), e.g., a single vector, expressing multiple RNAs or guides under the control or operatively or functionally linked to one or more promoters-especially as to the numbers of RNAs or guides discussed herein, without any undue experimentation.
[0701] The guide RNA(s) encoding sequences and/or Cas encoding sequences, can be functionally or operatively linked to regulatory element(s) and hence the regulatory element(s) drive expression. The promoter(s) can be constitutive promoter(s) and/or conditional promoter(s) and/or inducible promoter(s) and/or tissue specific promoter(s). The promoter can be selected from the group consisting of RNA polymerases, pol I, pol II, pol III, T7, U6, H1, retroviral Rous sarcoma virus (RSV) LTR promoter, the cytomegalovirus (CMV) promoter, the SV40 promoter, the dihydrofolate reductase promoter, the .beta.-actin promoter, the phosphoglycerol kinase (PGK) promoter, and the EF1.alpha. promoter. An advantageous promoter is the promoter is U6.
[0702] Additional effectors for use according to the invention can be identified by their proximity to casl genes, for example, though not limited to, within the region 20 kb from the start of the casl gene and 20 kb from the end of the casl gene. In certain embodiments, the effector protein comprises at least one HEPN domain and at least 500 amino acids, and wherein the C2c2 effector protein is naturally present in a prokaryotic genome within 20 kb upstream or downstream of a Cas gene or a CRISPR array. Non-limiting examples of Cas proteins include Cas1, Cas1B, Cas2, Cas3, Cas4, Cas5, Cas6, Cas7, Cas8, Cas9 (also known as Csn1 and Csx12), Cas10, Csy1, Csy2, Csy3, Cse1, Cse2, Csc1, Csc2, Csa5, Csn2, Csm2, Csm3, Csm4, Csm5, Csm6, Cmr1, Cmr3, Cmr4, Cmr5, Cmr6, Csb1, Csb2, Csb3, Csx17, Csx14, Csx10, Csx16, CsaX, Csx3, Csx1, Csx15, Csf1, Csf2, Csf3, Csf4, homologues thereof, or modified versions thereof. In certain example embodiments, the C2c2 effector protein is naturally present in a prokaryotic genome within 20 kb upstream or downstream of a Cas 1 gene. The terms "orthologue" (also referred to as "ortholog" herein) and "homologue" (also referred to as "homolog" herein) are well known in the art. By means of further guidance, a "homologue" of a protein as used herein is a protein of the same species which performs the same or a similar function as the protein it is a homologue of. Homologous proteins may but need not be structurally related, or are only partially structurally related. An "orthologue" of a protein as used herein is a protein of a different species which performs the same or a similar function as the protein it is an orthologue of. Orthologous proteins may but need not be structurally related, or are only partially structurally related.
CRISPR RNA-Targeting Effector Proteins
[0703] In some embodiments, the CRISPR system effector protein is an RNA-targeting effector protein. In certain embodiments, the CRISPR system effector protein is a Type VI CRISPR system targeting RNA (e.g., Cas13a, Cas13b, Cas13c or Cas13d). Example RNA-targeting effector proteins include Cas13b and C2c2 (now known as Cas13a). It will be understood that the term "C2c2" herein is used interchangeably with "Cas13a". "C2c2" is now referred to as "Cas13a", and the terms are used interchangeably herein unless indicated otherwise. As used herein, the term "Cas13" refers to any Type VI CRISPR system targeting RNA (e.g., Cas13a, Cas13b, Cas13c or Cas13d). When the CRISPR protein is a C2c2 protein, a tracrRNA is not required. C2c2 has been described in Abudayyeh et al. (2016) "C2c2 is a single-component programmable RNA-guided RNA-targeting CRISPR effector"; Science; DOI: 10.1126/science.aaf5573; and Shmakov et al. (2015) "Discovery and Functional Characterization of Diverse Class 2 CRISPR-Cas Systems", Molecular Cell, DOI: dx.doi.org/10.1016/j.molcel.2015.10.008; which are incorporated herein in their entirety by reference. Cas13b has been described in Smargon et al. (2017) "Cas13b Is a Type VI-B CRISPR-Associated RNA-Guided RNases Differentially Regulated by Accessory Proteins Csx27 and Csx28," Molecular Cell. 65, 1-13; dx.doi.org/10.1016/j.molcel.2016.12.023, which is incorporated herein in its entirety by reference.
[0704] In some embodiments, one or more elements of a nucleic acid-targeting system is derived from a particular organism comprising an endogenous CRISPR RNA-targeting system. In certain example embodiments, the effector protein CRISPR RNA-targeting system comprises at least one HEPN domain, including but not limited to the HEPN domains described herein, HEPN domains known in the art, and domains recognized to be HEPN domains by comparison to consensus sequence motifs. Several such domains are provided herein. In one non-limiting example, a consensus sequence can be derived from the sequences of C2c2 or Cas13b orthologs provided herein. In certain example embodiments, the effector protein comprises a single HEPN domain. In certain other example embodiments, the effector protein comprises two HEPN domains.
[0705] In one example embodiment, the effector protein comprises one or more HEPN domains comprising a RxxxxH motif sequence. The RxxxxH motif sequence can be, without limitation, from a HEPN domain described herein or a HEPN domain known in the art. RxxxxH motif sequences further include motif sequences created by combining portions of two or more HEPN domains. As noted, consensus sequences can be derived from the sequences of the orthologs disclosed in U.S. Provisional Patent Application 62/432,240 entitled "Novel CRISPR Enzymes and Systems," U.S. Provisional Patent Application 62/471,710 entitled "Novel Type VI CRISPR Orthologs and Systems" filed on Mar. 15, 2017, and U.S. Provisional Patent Application entitled "Novel Type VI CRISPR Orthologs and Systems," labeled as attorney docket number 47627-05-2133 and filed on Apr. 12, 2017.
[0706] In certain other example embodiments, the CRISPR system effector protein is a C2c2 nuclease. The activity of C2c2 may depend on the presence of two HEPN domains. These have been shown to be RNase domains, i.e. nuclease (in particular an endonuclease) cutting RNA. C2c2 HEPN may also target DNA, or potentially DNA and/or RNA. On the basis that the HEPN domains of C2c2 are at least capable of binding to and, in their wild-type form, cutting RNA, then it is preferred that the C2c2 effector protein has RNase function. Regarding C2c2 CRISPR systems, reference is made to U.S. Provisional 62/351,662 filed on Jun. 17, 2016 and U.S. Provisional 62/376,377 filed on Aug. 17, 2016. Reference is also made to U.S. Provisional 62/351,803 filed on Jun. 17, 2016. Reference is also made to U.S. Provisional entitled "Novel Crispr Enzymes and Systems" filed Dec. 8, 2016 bearing Broad Institute No. 10035.PA4 and Attorney Docket No. 47627.03.2133. Reference is further made to East-Seletsky et al. "Two distinct RNase activities of CRISPR-C2c2 enable guide-RNA processing and RNA detection" Nature doi:10/1038/naturel9802 and Abudayyeh et al. "C2c2 is a single-component programmable RNA-guided RNA targeting CRISPR effector" bioRxiv doi: 10.1101/054742.
[0707] In certain embodiments, the C2c2 effector protein is from an organism of a genus selected from the group consisting of: Leptotrichia, Listeria, Corynebacter, Sutterella, Legionella, Treponema, Filifactor, Eubacterium, Streptococcus, Lactobacillus, Mycoplasma, Bacteroides, Flaviivola, Flavobacterium, Sphaerochaeta, Azospirillum, Gluconacetobacter, Neisseria, Roseburia, Parvibaculum, Staphylococcus, Nitratifractor, Mycoplasma, Campylobacter, and Lachnospira, or the C2c2 effector protein is an organism selected from the group consisting of: Leptotrichia shahii, Leptotrichia, wadei, Listeria seeligeri, Clostridium aminophilum, Carnobacterium gallinarum, Paludibacter propionicigenes, Listeria weihenstephanensis, or the C2c2 effector protein is a L. wadei F0279 or L. wadei F0279 (Lw2) C2C2 effector protein. In another embodiment, the one or more guide RNAs are designed to detect a single nucleotide polymorphism, splice variant of a transcript, or a frameshift mutation in a target RNA or DNA.
[0708] In certain example embodiments, the RNA-targeting effector protein is a Type VI-B effector protein, such as Cas13b and Group 29 or Group 30 proteins. In certain example embodiments, the RNA-targeting effector protein comprises one or more HEPN domains. In certain example embodiments, the RNA-targeting effector protein comprises a C-terminal HEPN domain, a N-terminal HEPN domain, or both. Regarding example Type VI-B effector proteins that may be used in the context of this invention, reference is made to U.S. application Ser. No. 15/331,792 entitled "Novel CRISPR Enzymes and Systems" and filed Oct. 21, 2016, International Patent Application No. PCT/US2016/058302 entitled "Novel CRISPR Enzymes and Systems", and filed Oct. 21, 2016, and Smargon et al. "Cas13b is a Type VI-B CRISPR-associated RNA-Guided RNase differentially regulated by accessory proteins Csx27 and Csx28" Molecular Cell, 65, 1-13 (2017); dx.doi.org/10.1016/j.molcel.2016.12.023, and U.S. Provisional Application No. to be assigned, entitled "Novel Cas13b Orthologues CRISPR Enzymes and System" filed Mar. 15, 2017. In particular embodiments, the Cas13b enzyme is derived from Bergeyella zoohelcum.
[0709] In certain example embodiments, the RNA-targeting effector protein is a Cas13c effector protein as disclosed in U.S. Provisional Patent Application No. 62/525,165 filed Jun. 26, 2017, and PCT Application No. US 2017/047193 filed Aug. 16, 2017.
[0710] In some embodiments, one or more elements of a nucleic acid-targeting system is derived from a particular organism comprising an endogenous CRISPR RNA-targeting system. In certain embodiments, the CRISPR RNA-targeting system is found in Eubacterium and Ruminococcus. In certain embodiments, the effector protein comprises targeted and collateral ssRNA cleavage activity. In certain embodiments, the effector protein comprises dual HEPN domains. In certain embodiments, the effector protein lacks a counterpart to the Helical-1 domain of Cas13a. In certain embodiments, the effector protein is smaller than previously characterized class 2 CRISPR effectors, with a median size of 928 aa. This median size is 190 aa (17%) less than that of Cas13c, more than 200 aa (18%) less than that of Cas13b, and more than 300 aa (26%) less than that of Cas13a. In certain embodiments, the effector protein has no requirement for a flanking sequence (e.g., PFS, PAM).
[0711] In certain embodiments, the effector protein locus structures include a WYL domain containing accessory protein (so denoted after three amino acids that were conserved in the originally identified group of these domains; see, e.g., WYL domain IPR026881). In certain embodiments, the WYL domain accessory protein comprises at least one helix-turn-helix (HTH) or ribbon-helix-helix (RHH) DNA-binding domain. In certain embodiments, the WYL domain containing accessory protein increases both the targeted and the collateral ssRNA cleavage activity of the RNA-targeting effector protein. In certain embodiments, the WYL domain containing accessory protein comprises an N-terminal RHH domain, as well as a pattern of primarily hydrophobic conserved residues, including an invariant tyrosine-leucine doublet corresponding to the original WYL motif. In certain embodiments, the WYL domain containing accessory protein is WYL1. WYL1 is a single WYL-domain protein associated primarily with Ruminococcus.
[0712] In other example embodiments, the Type VI RNA-targeting Cas enzyme is Cas13d. In certain embodiments, Cas13d is Eubacterium siraeum DSM 15702 (EsCas13d) or Ruminococcus sp. N15. MGS-57 (RspCas13d) (see, e.g., Yan et al., Cas13d Is a Compact RNA-Targeting Type VI CRISPR Effector Positively Modulated by a WYL-Domain-Containing Accessory Protein, Molecular Cell (2018), doi.org/10.1016/j.molcel.2018.02.028). RspCas13d and EsCas13d have no flanking sequence requirements (e.g., PFS, PAM).
[0713] Cas13 RNA Editing
[0714] In one aspect, the invention provides a method of modifying or editing a target transcript in a eukaryotic cell. In some embodiments, the method comprises allowing a CRISPR-Cas effector module complex to bind to the target polynucleotide to effect RNA base editing, wherein the CRISPR-Cas effector module complex comprises a Cas effector module complexed with a guide sequence hybridized to a target sequence within said target polynucleotide, wherein said guide sequence is linked to a direct repeat sequence. In
References
-
drmr.com/abcon
-
neb.com/applications/library-preparation-for-next-generatin-sequencing/illumina-library-preparation/products
-
support.illumina.com/downloads/illumina-customer-sequence-letter.htmlforexemplaryINDEXsequences
-
-
illumina.com/content/dam/illumina-marketing/documents/products/research_reviews/sequencing-methods-review.pdf
-
ncbi.nlm.nih.gov/pmc/articles/PMC206447
-
support.illumina.comforexemplaryINDEXsequences
D00001
D00002
D00003
D00004
D00005
D00006
D00007
D00008
D00009
D00010
D00011
D00012
D00013
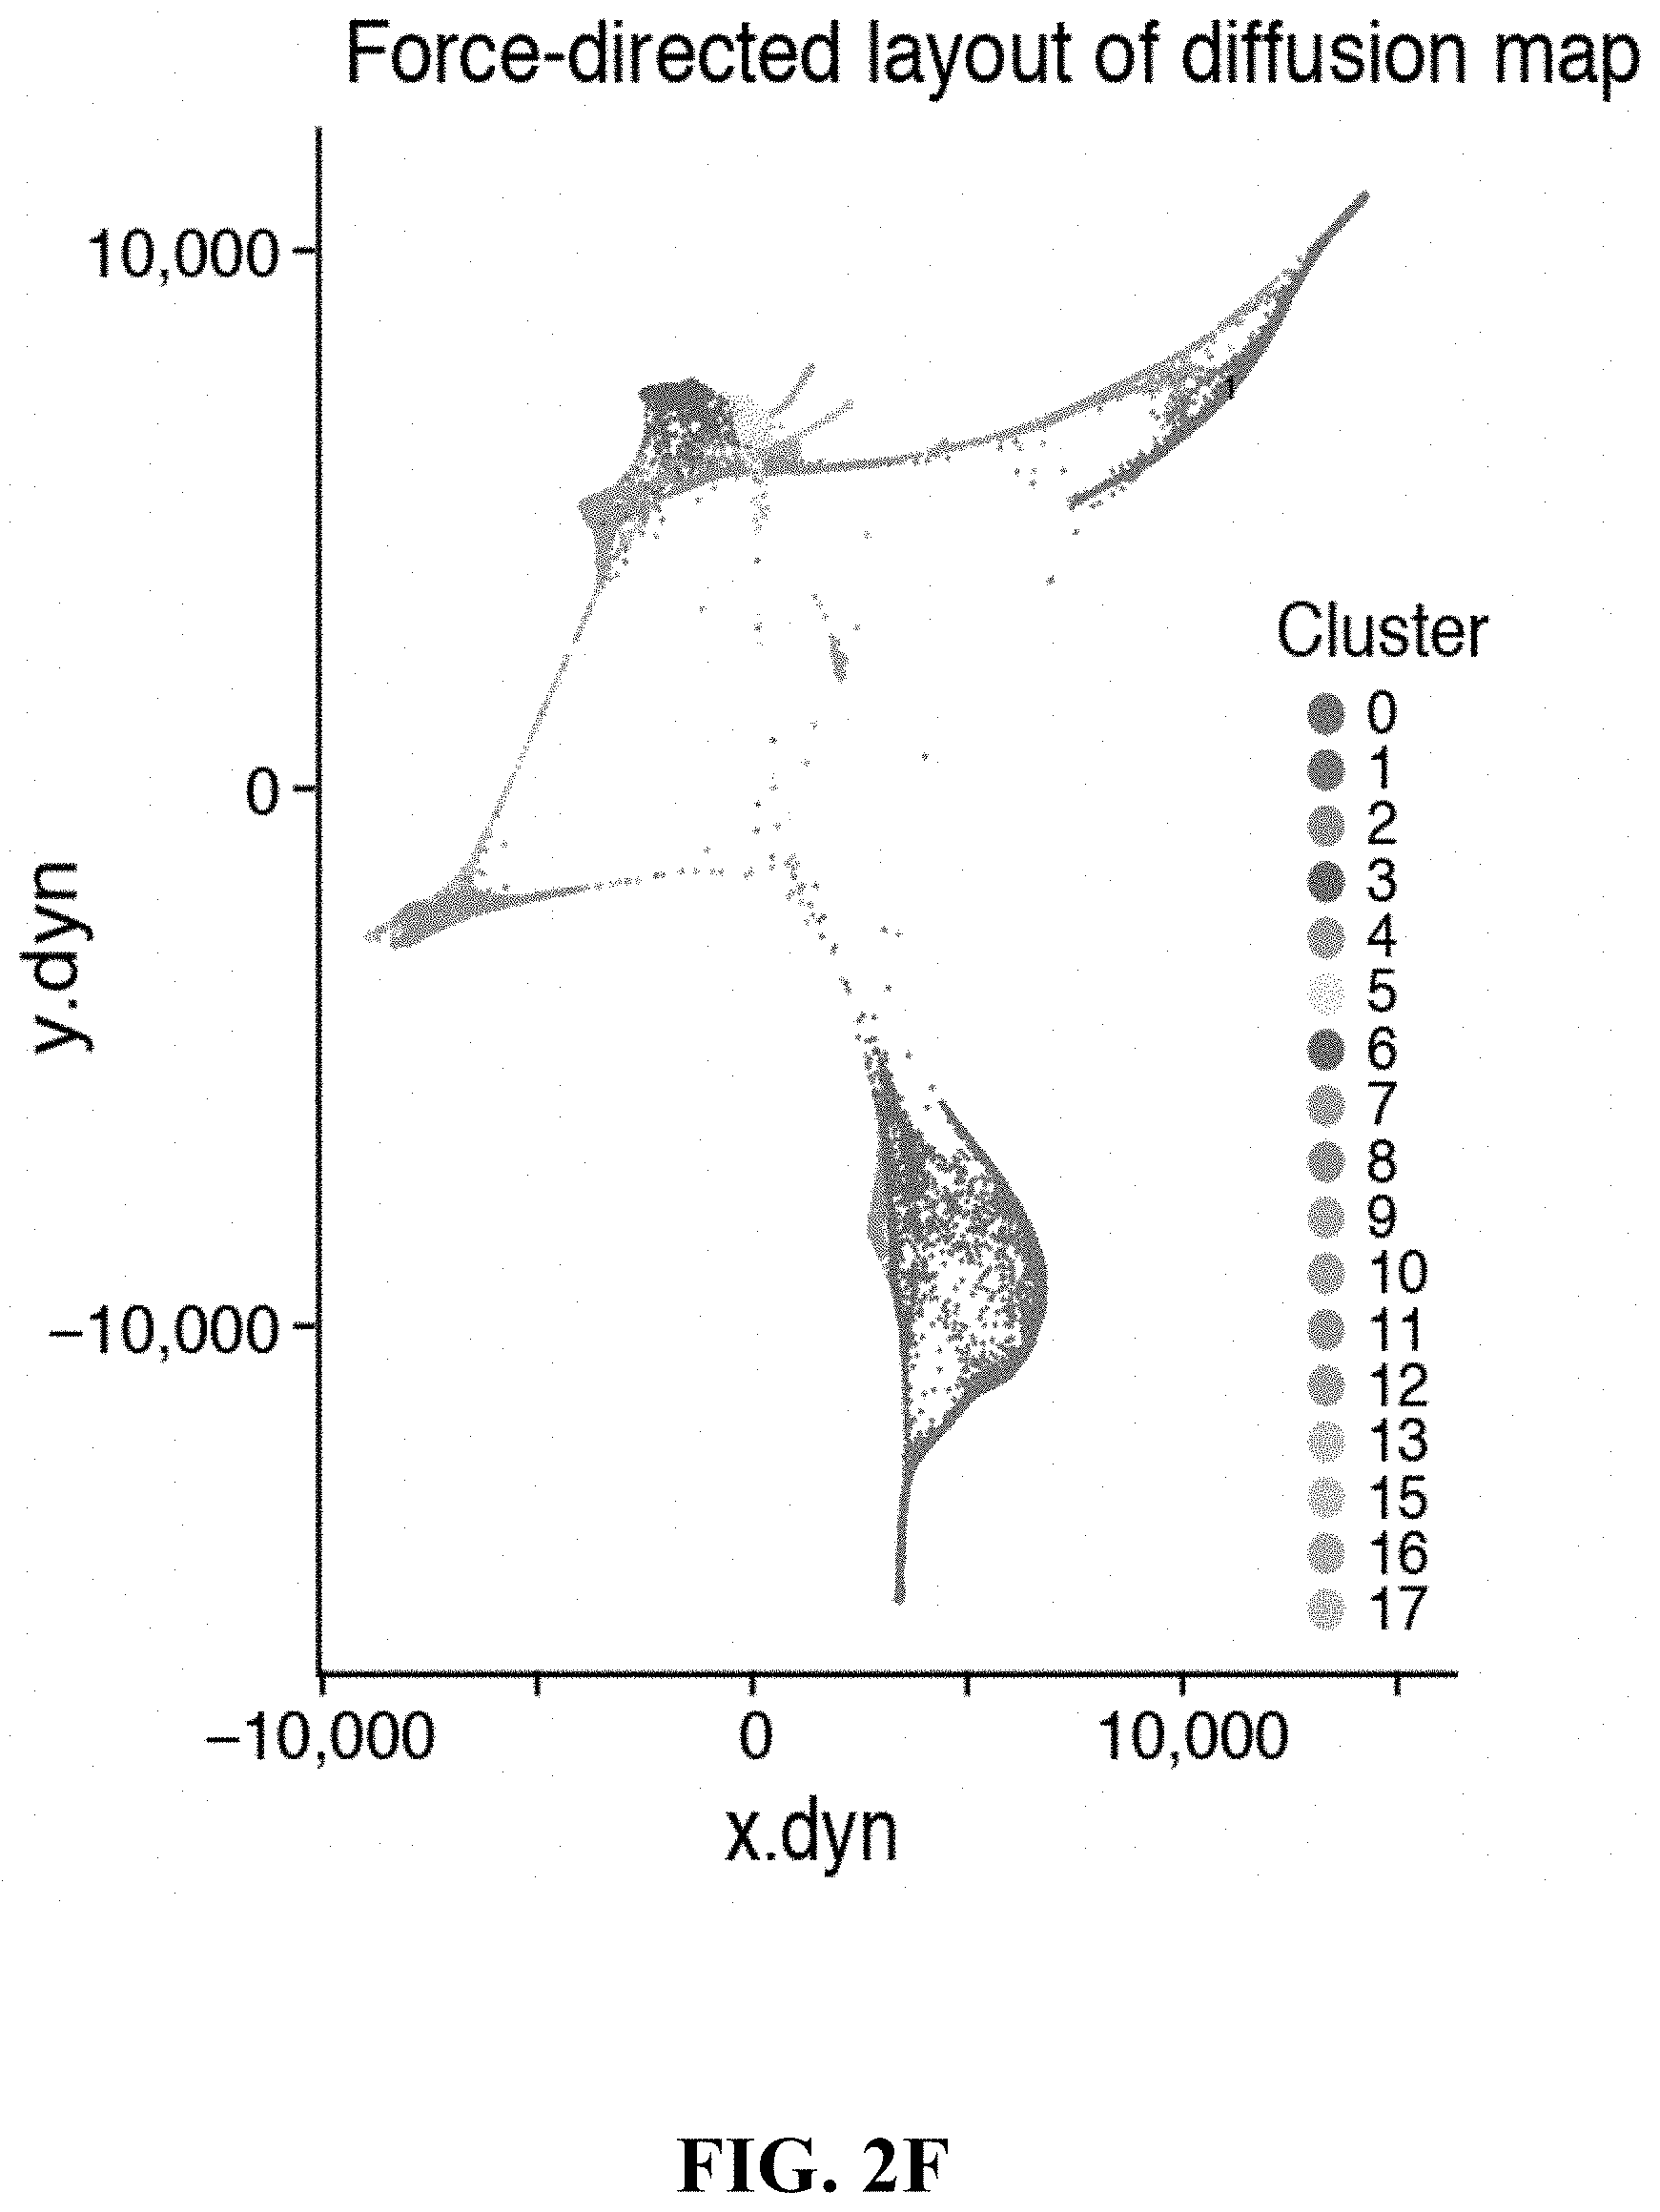
D00014

D00015
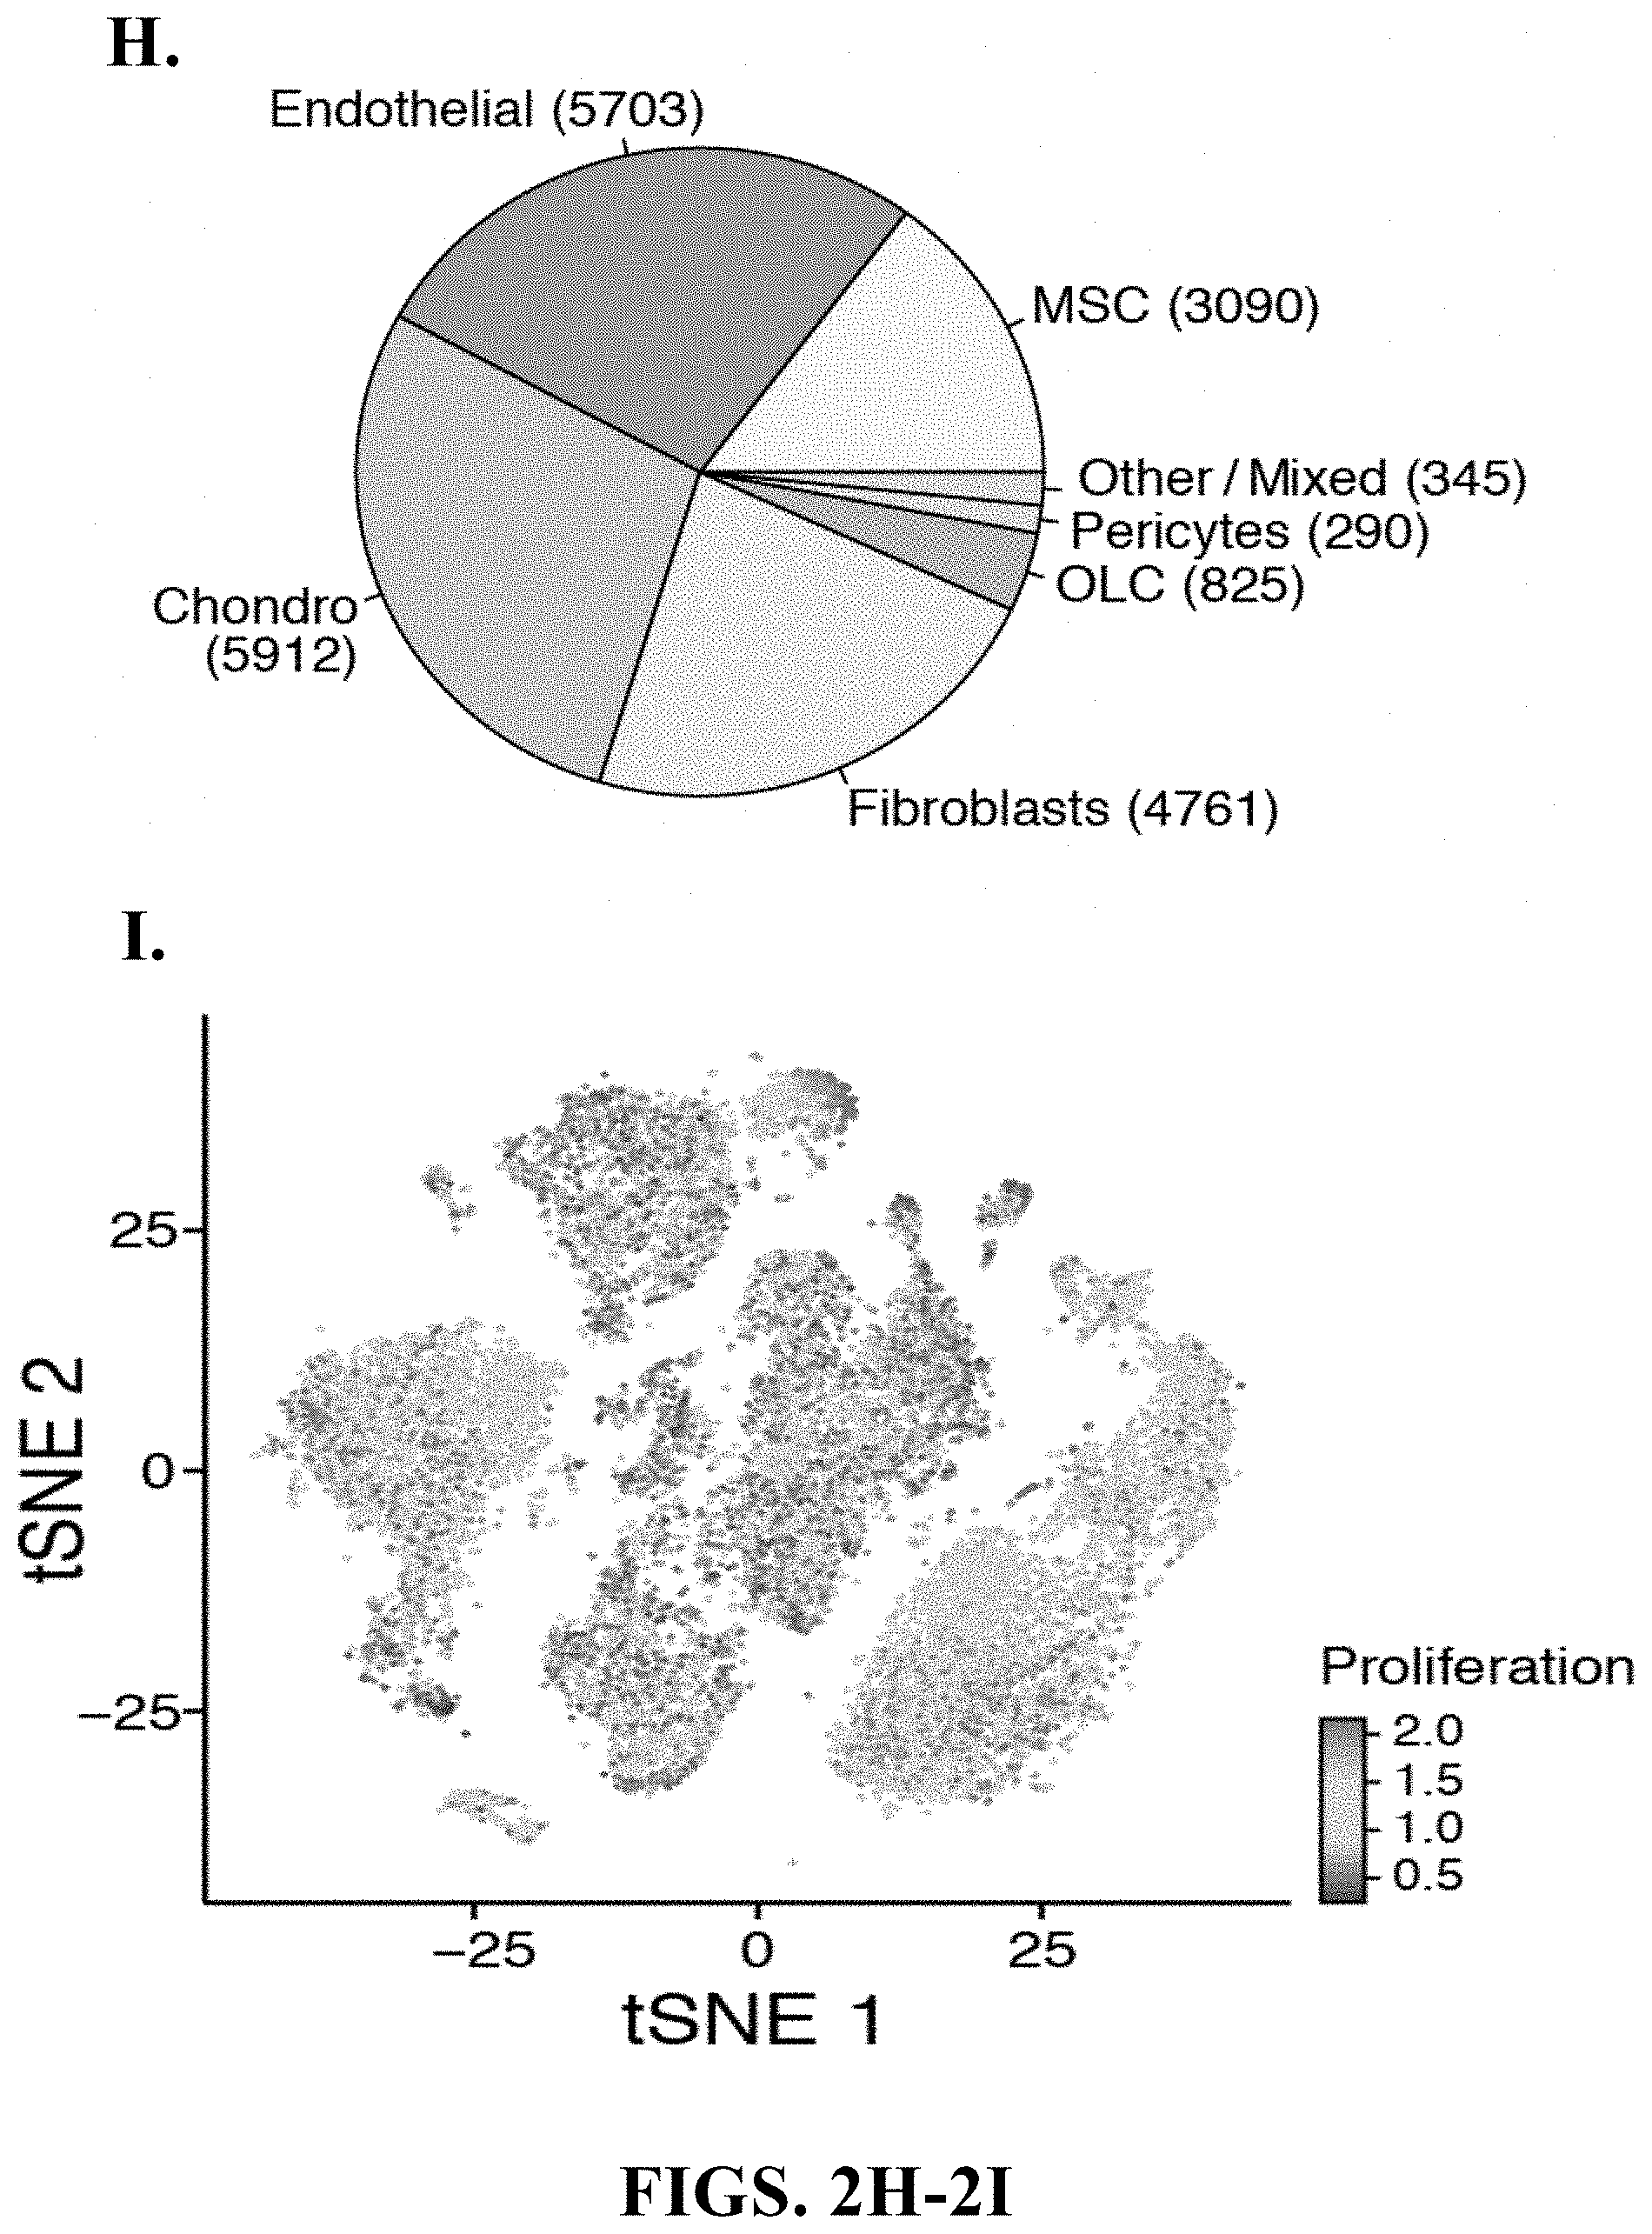
D00016
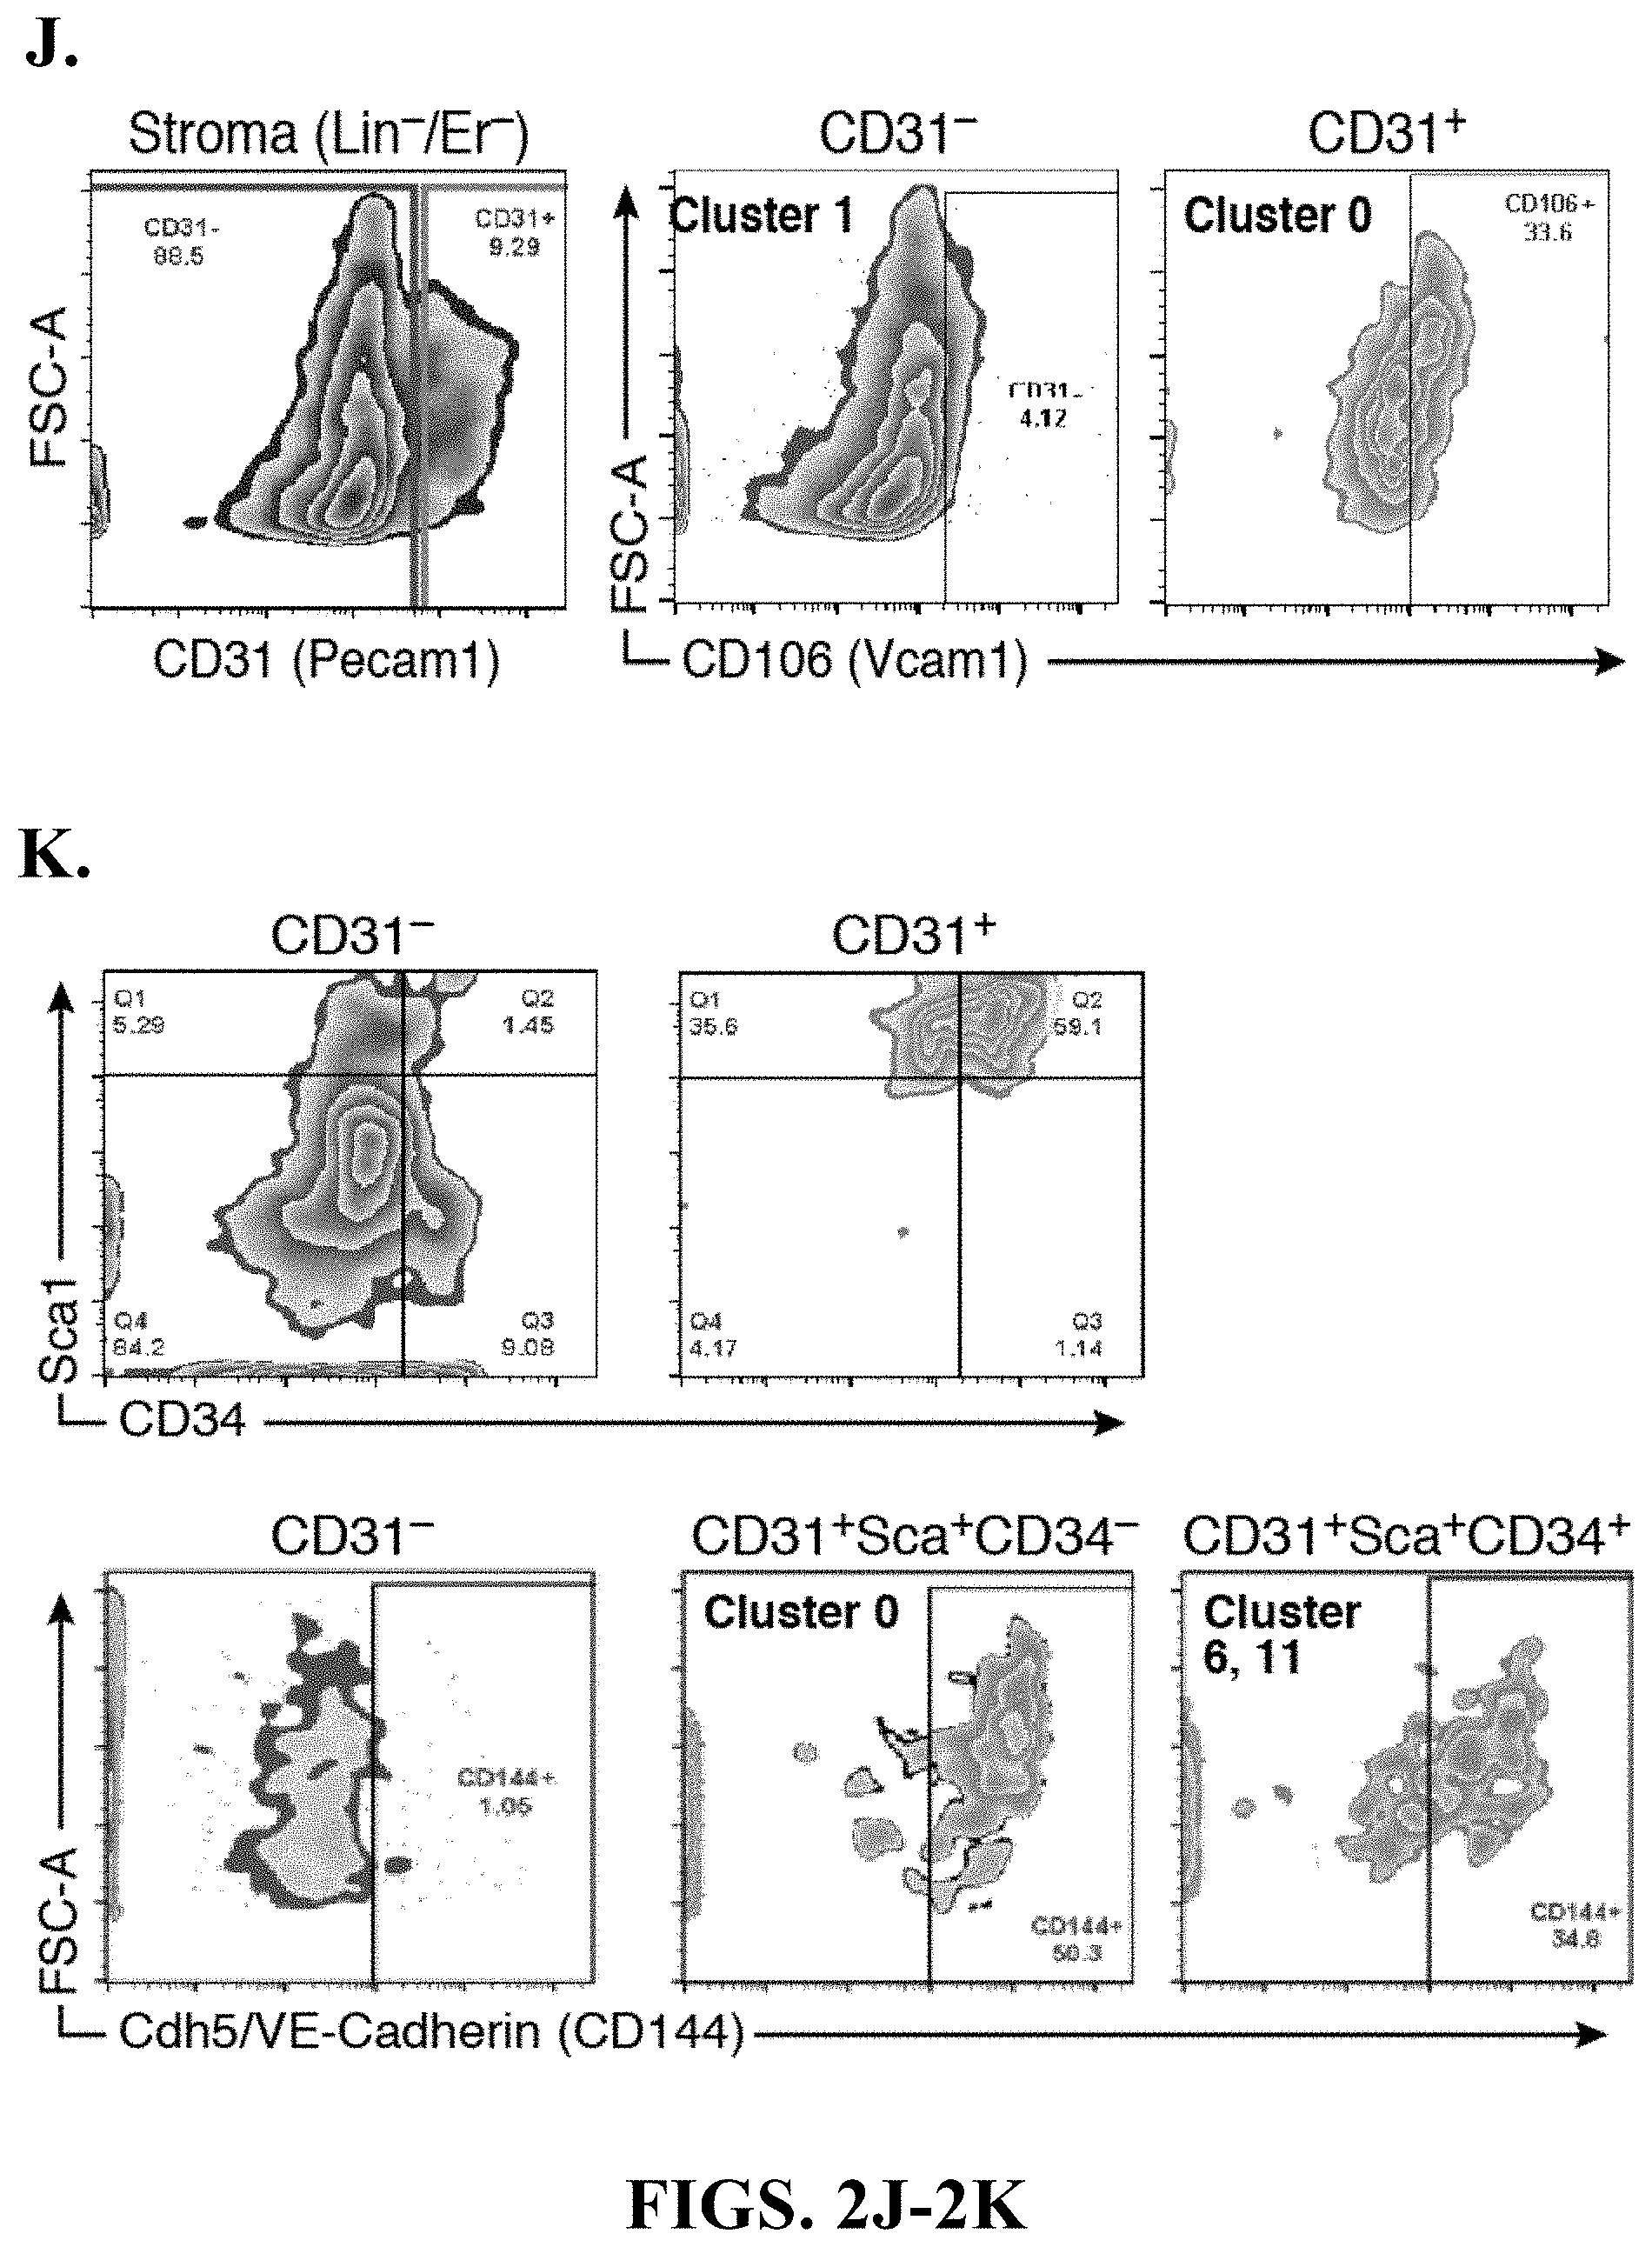
D00017

D00018

D00019

D00020

D00021
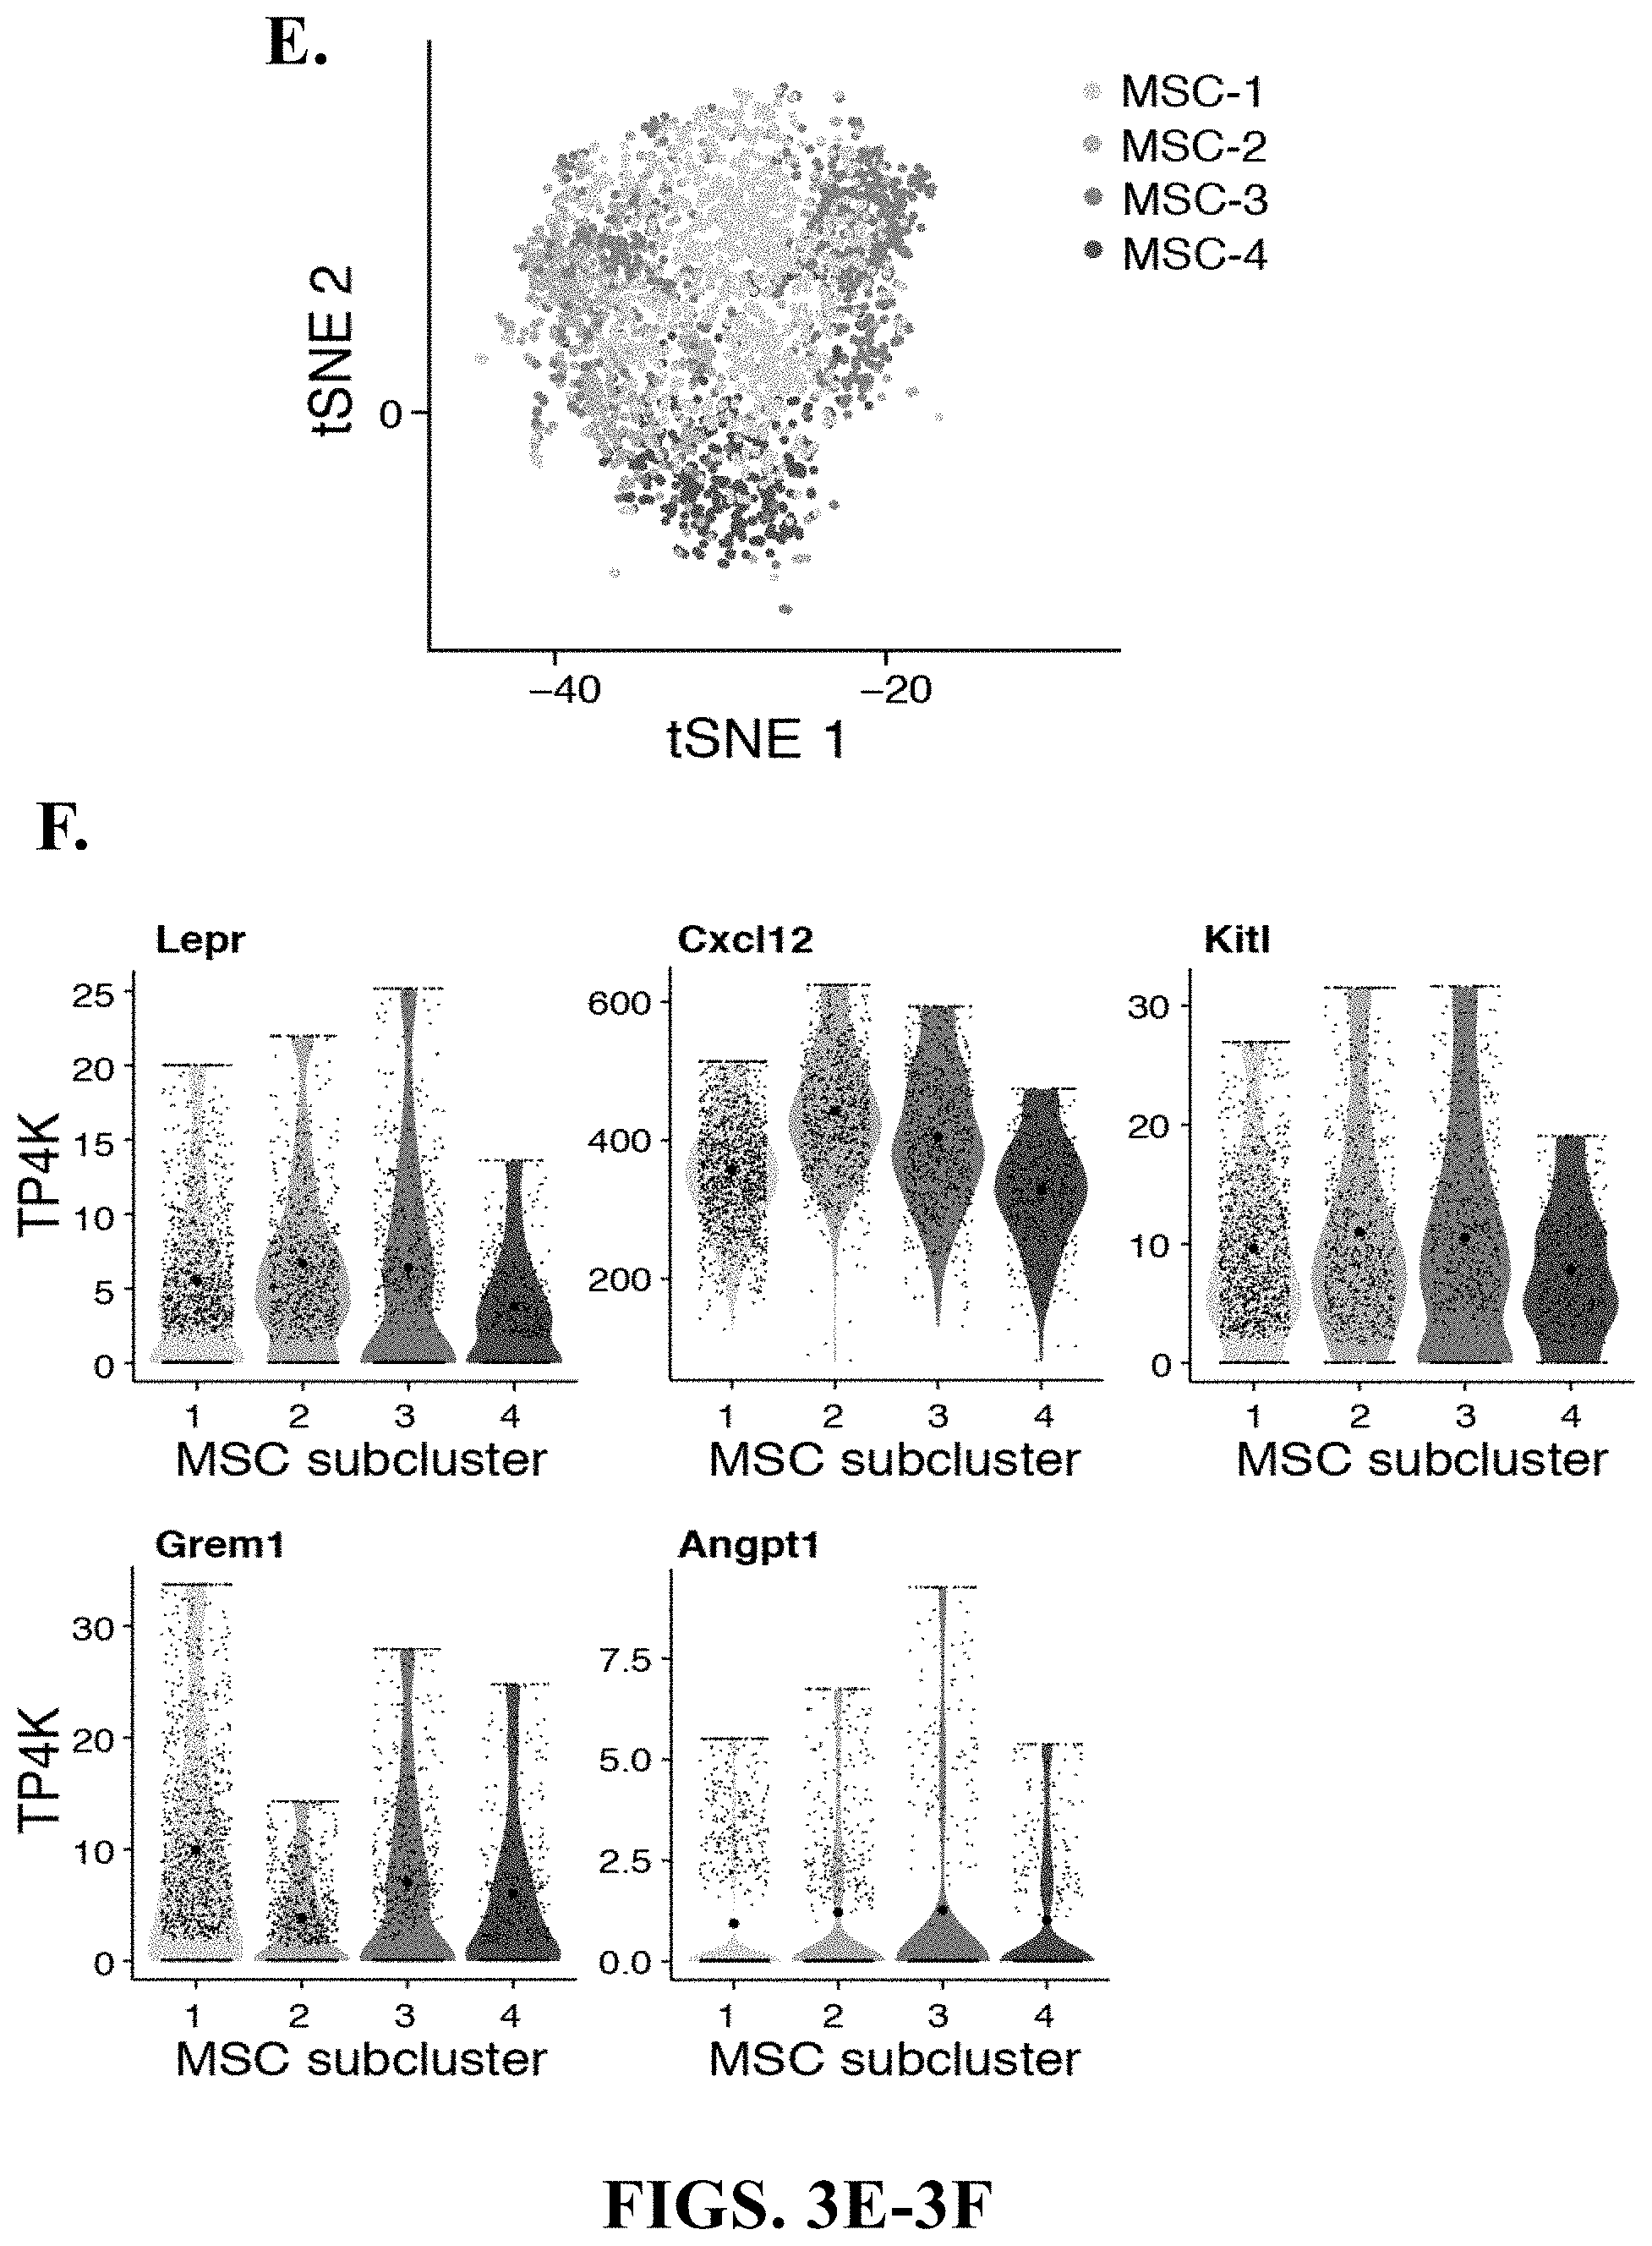
D00022
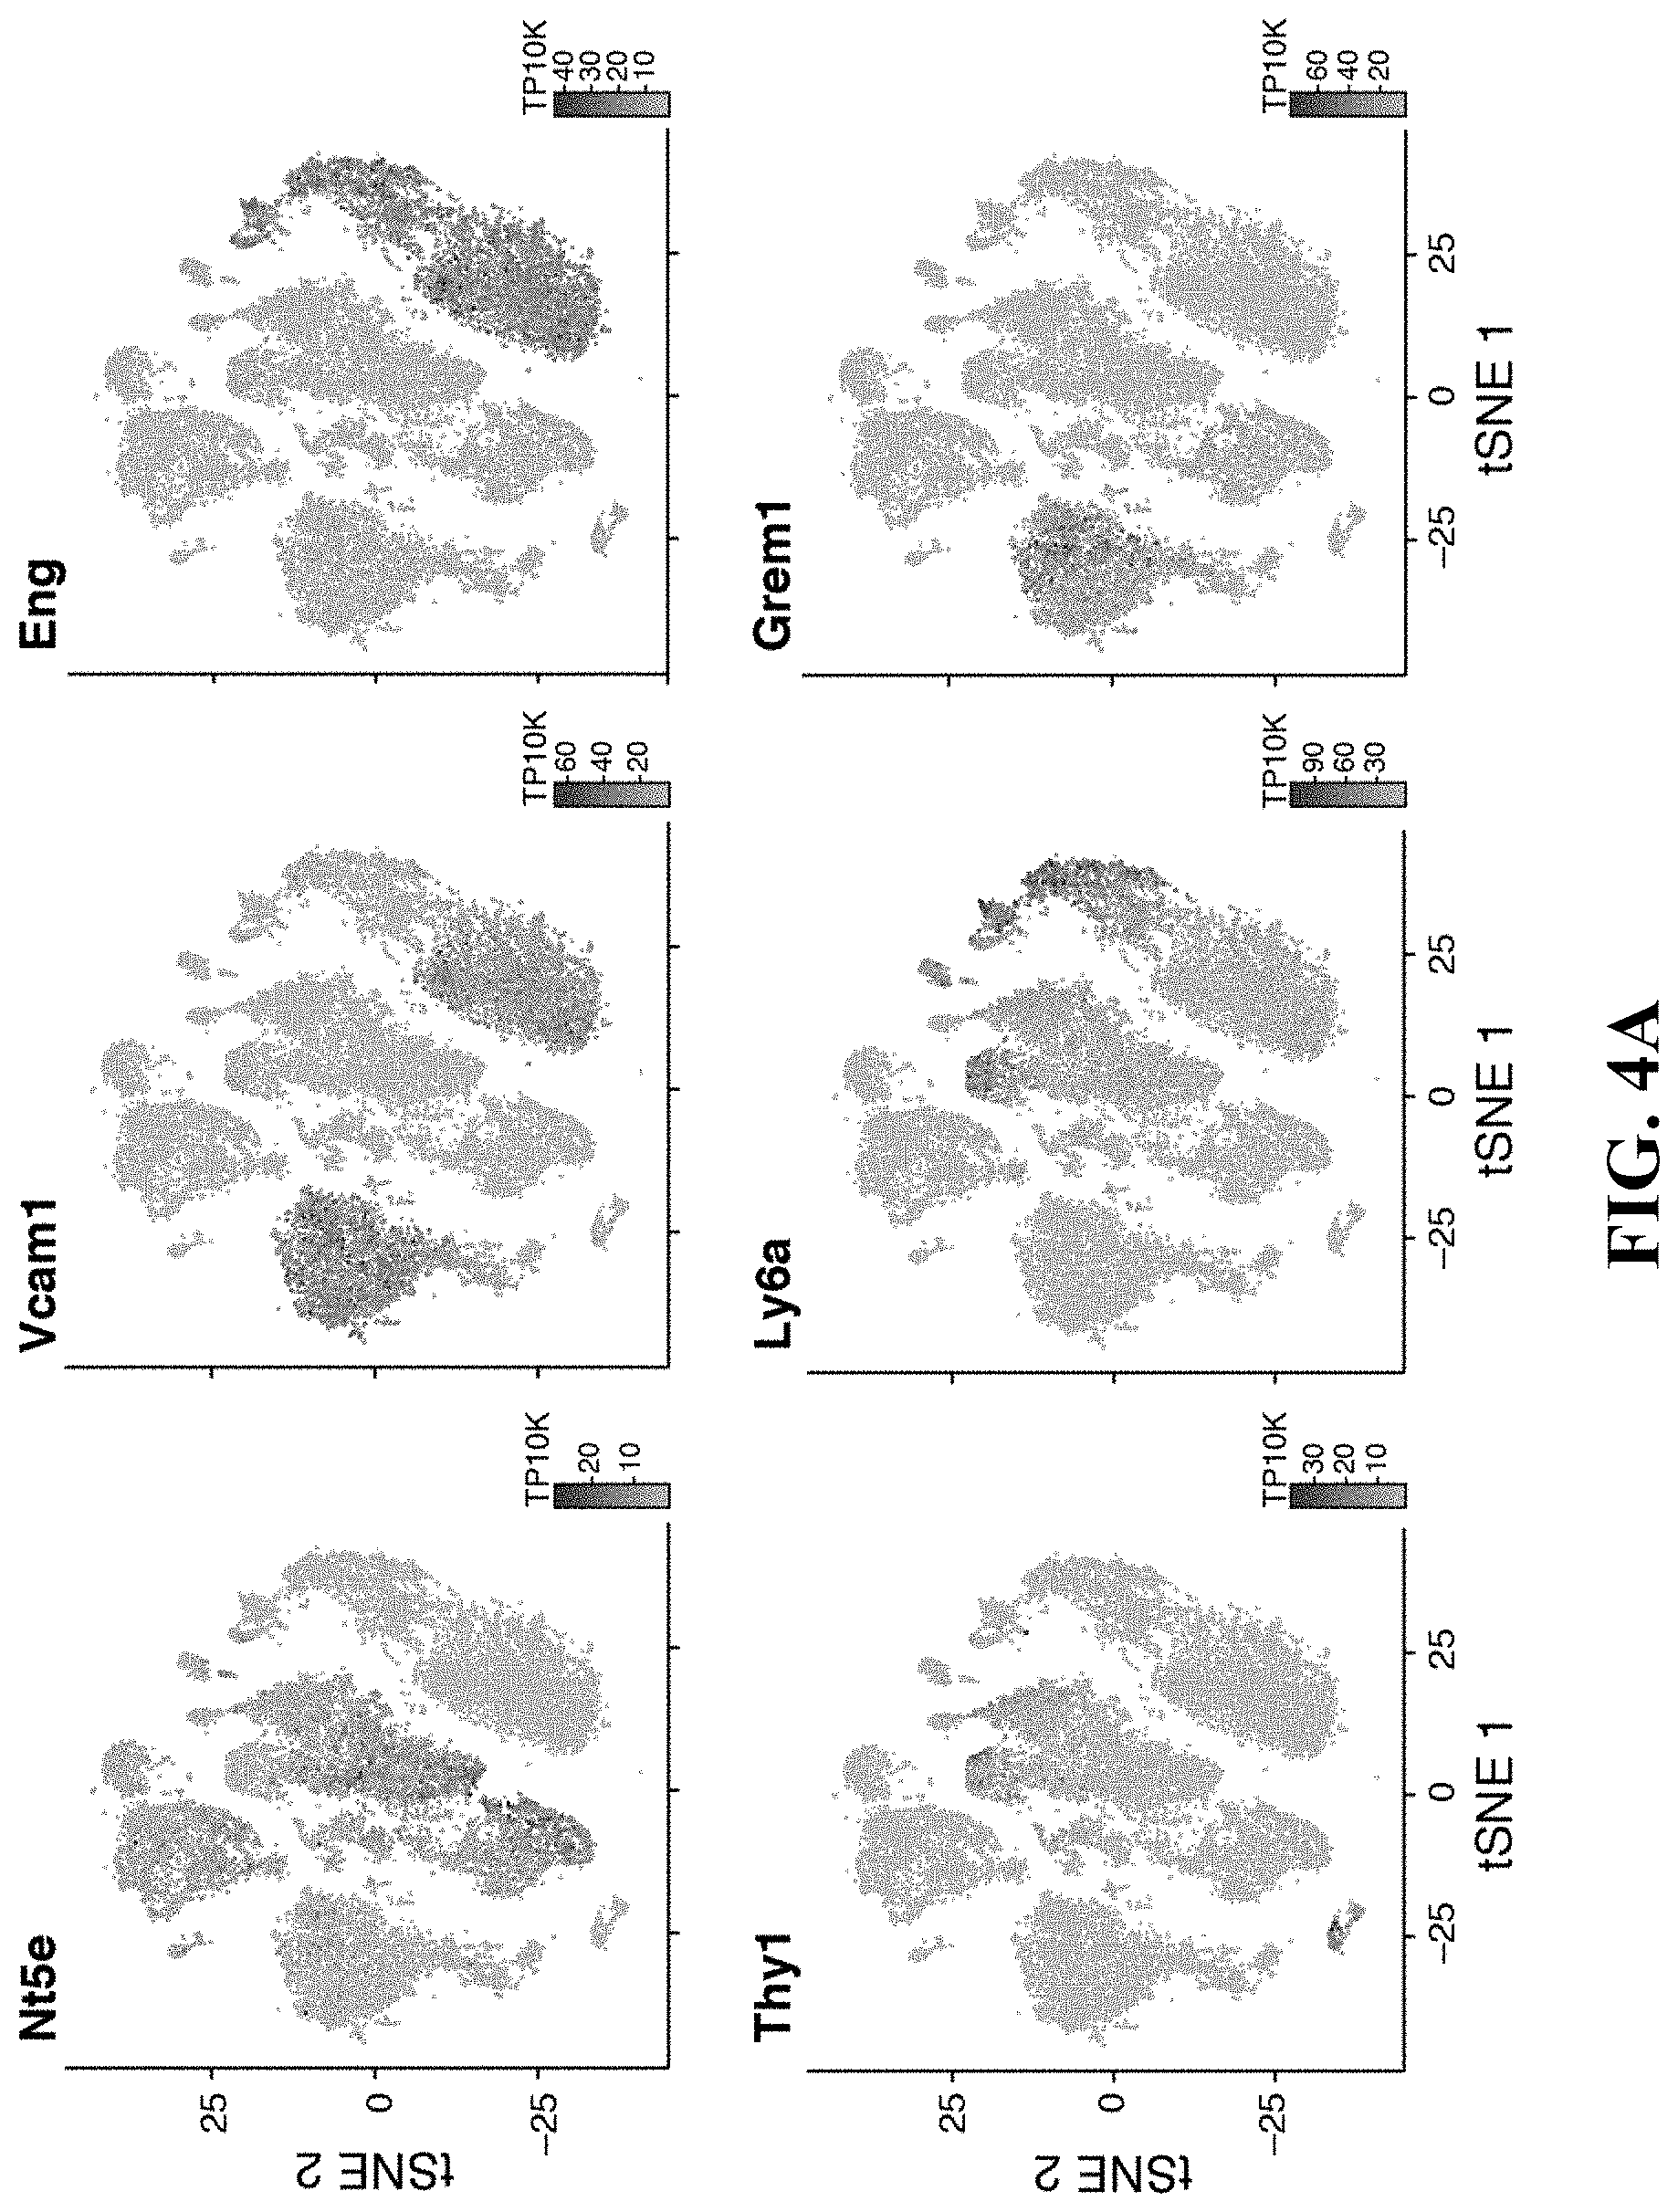
D00023
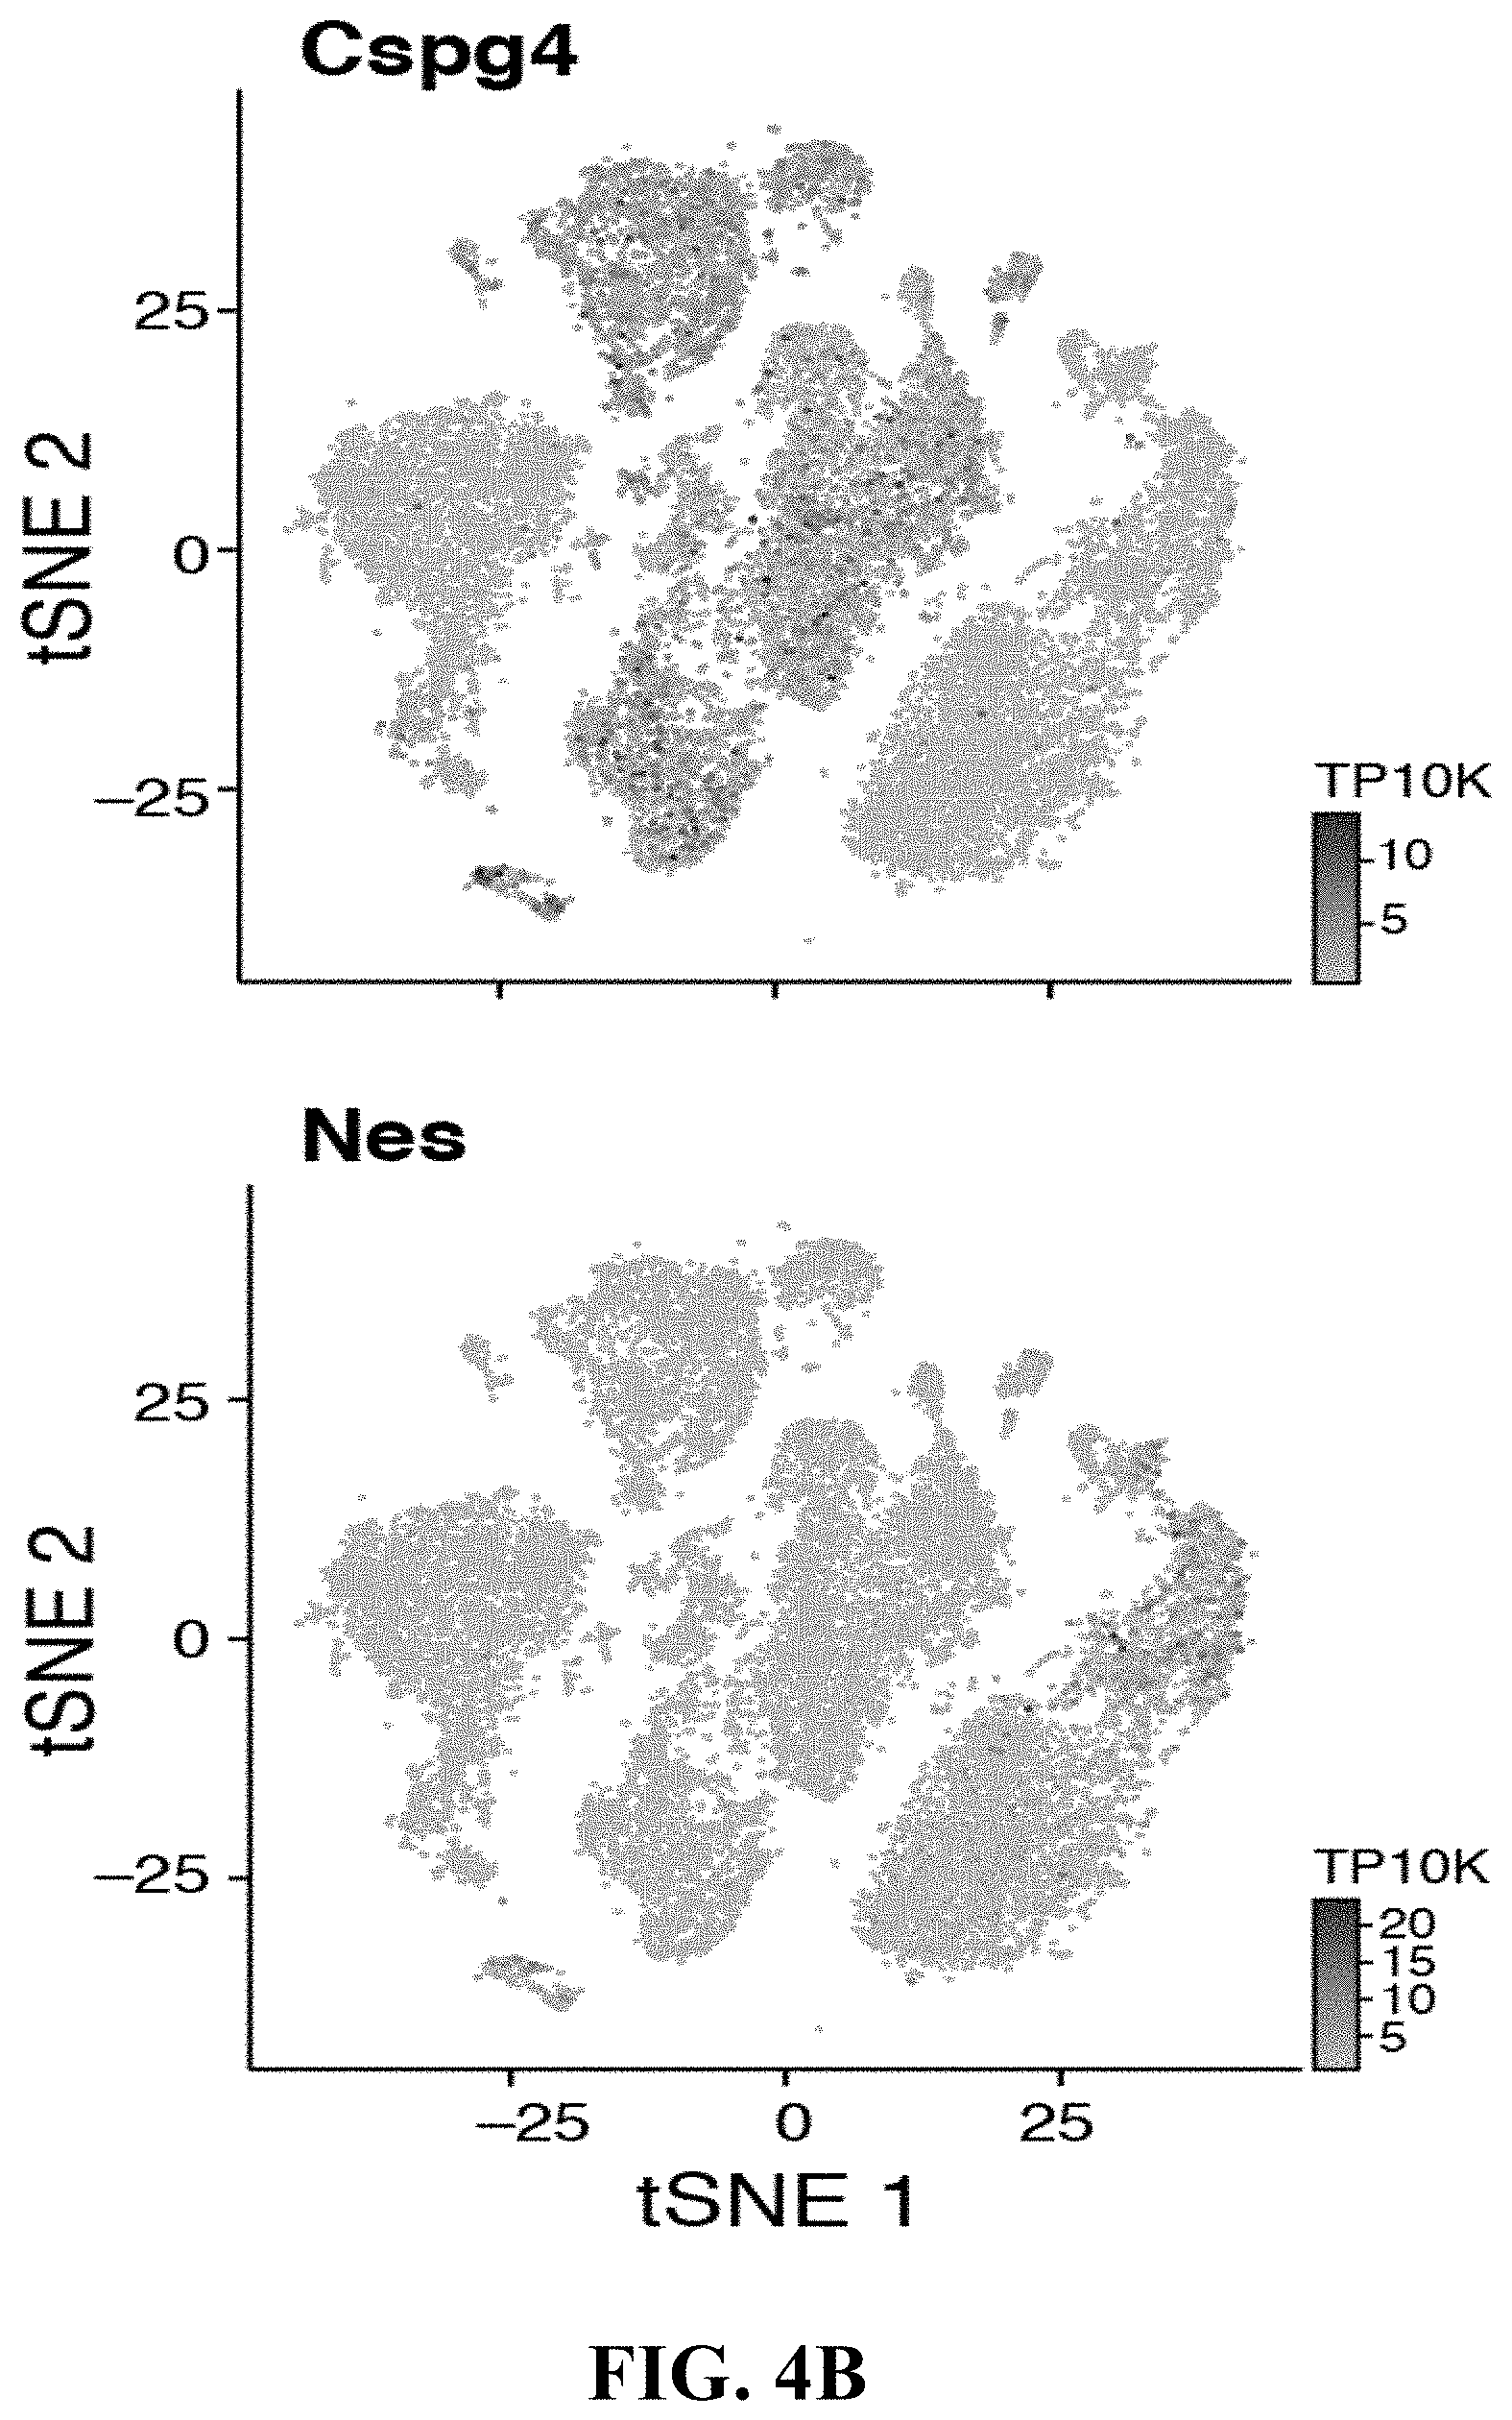
D00024
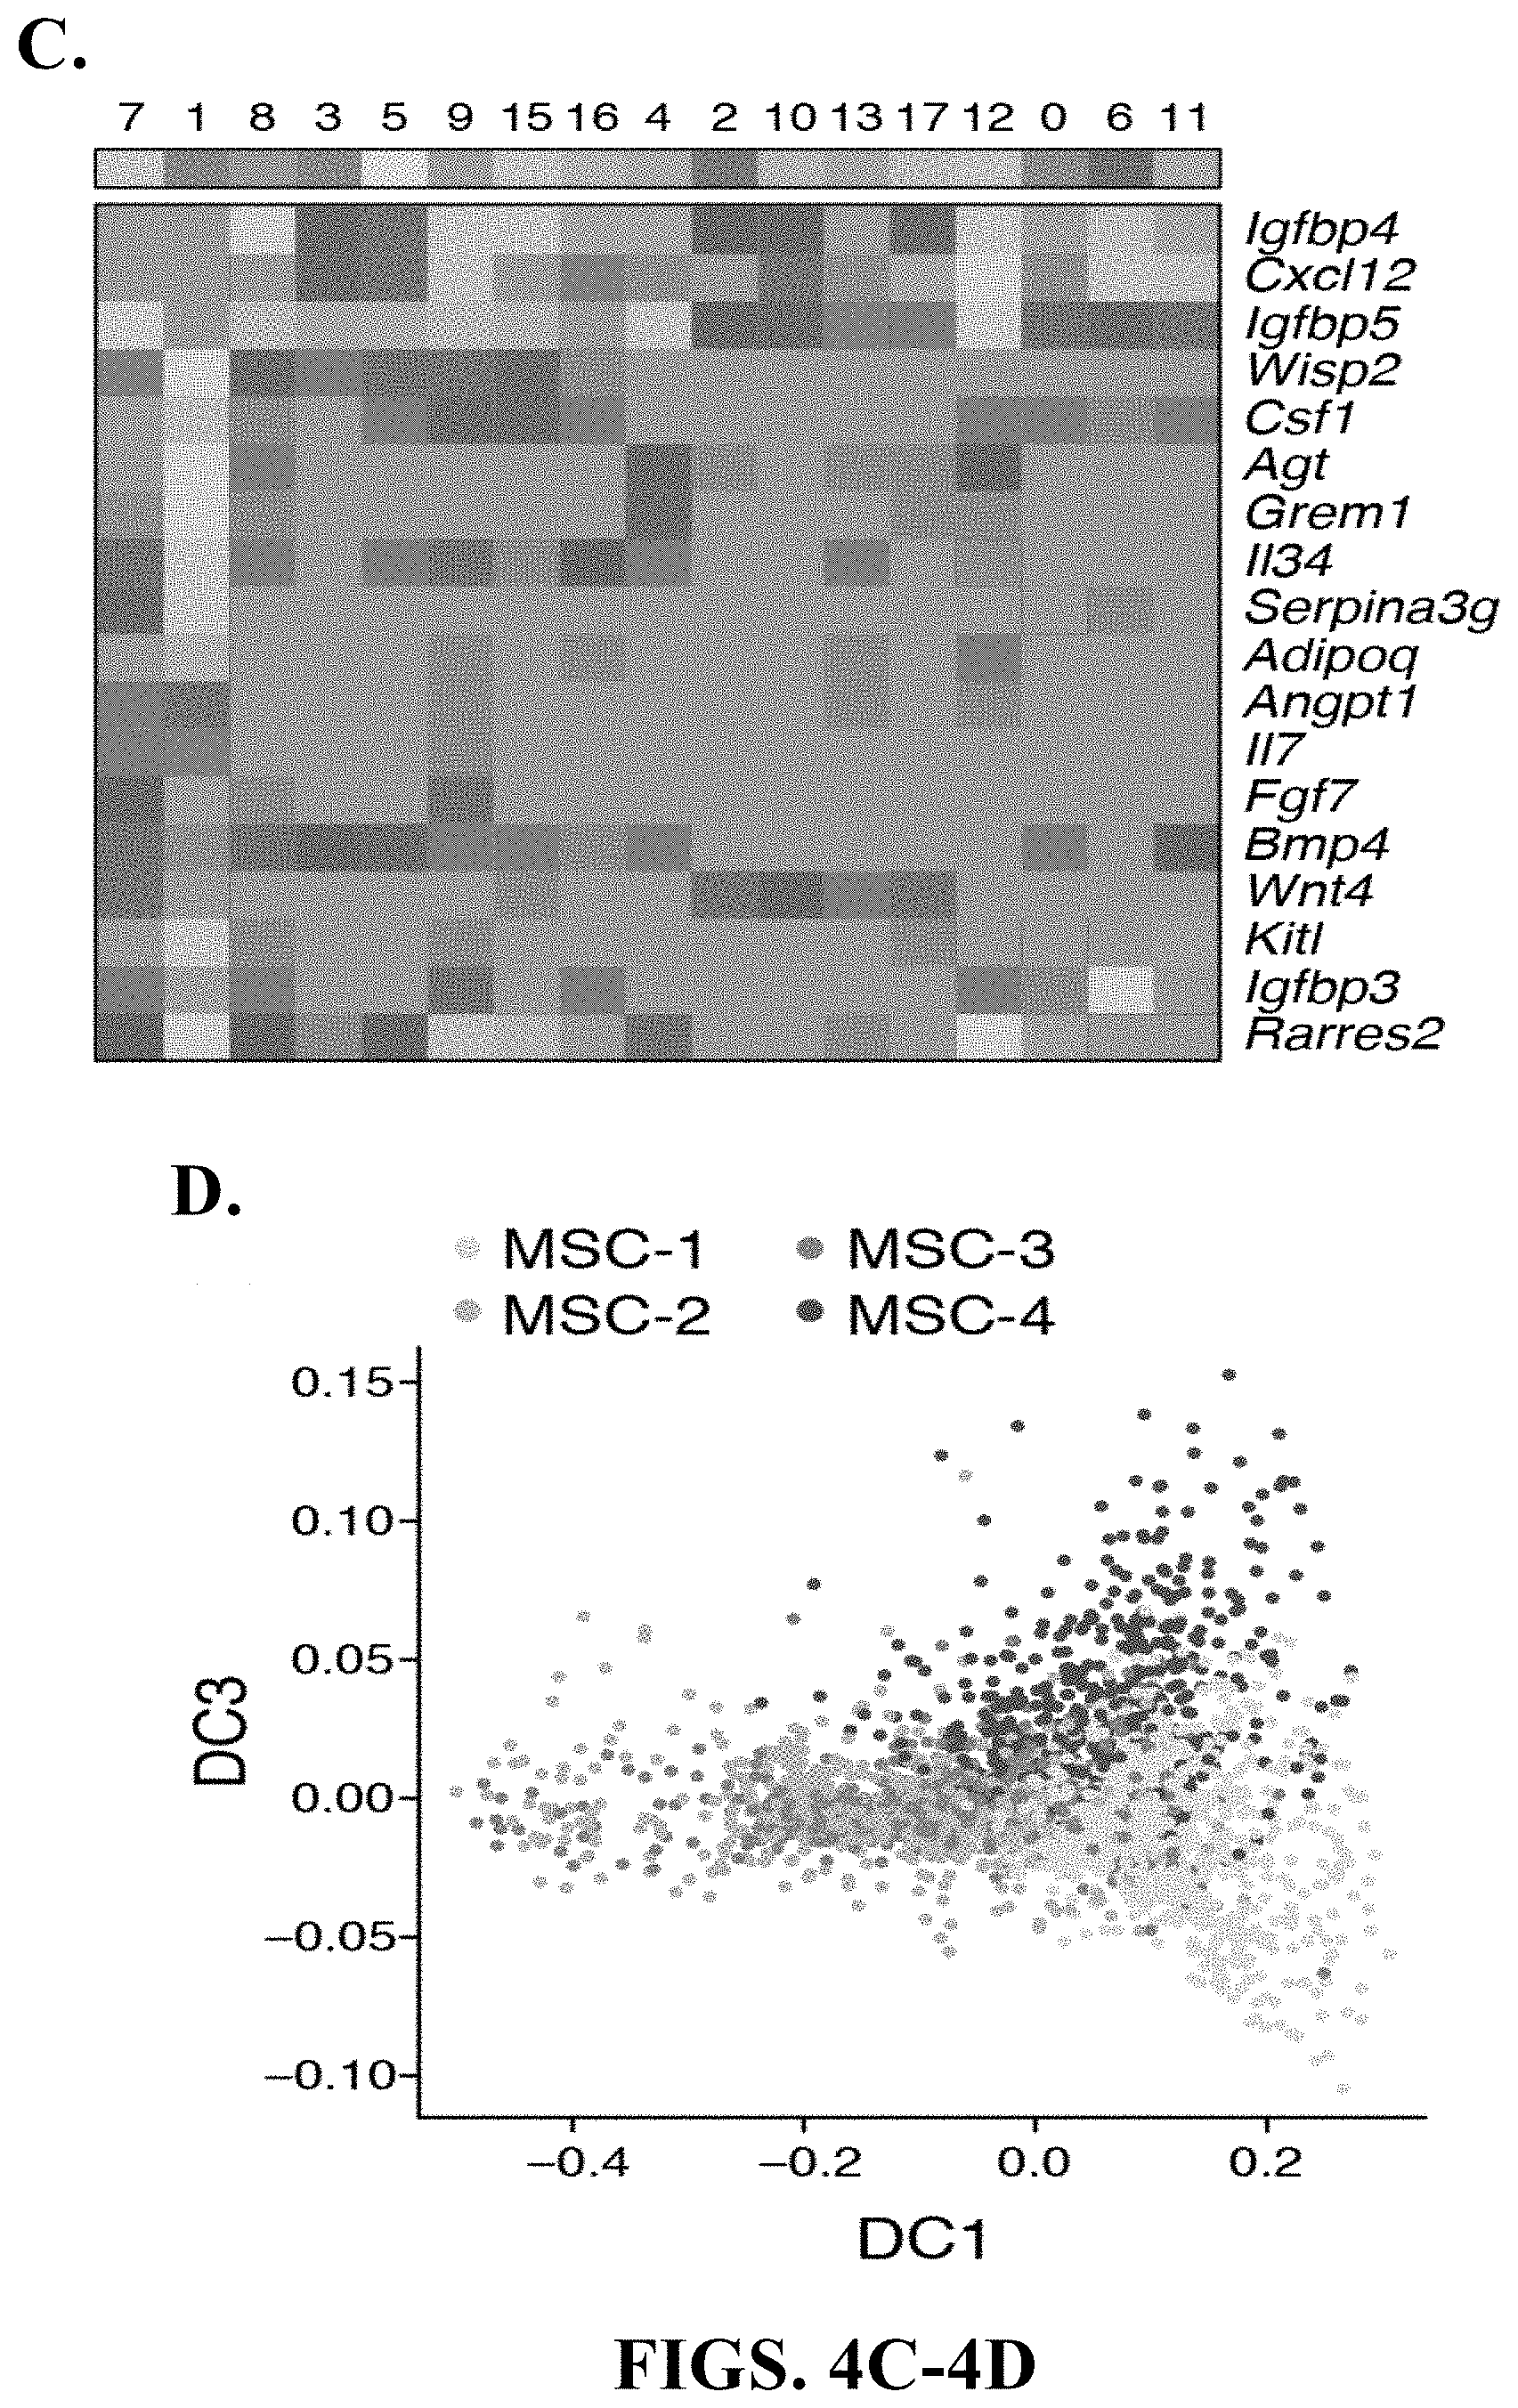
D00025

D00026

D00027
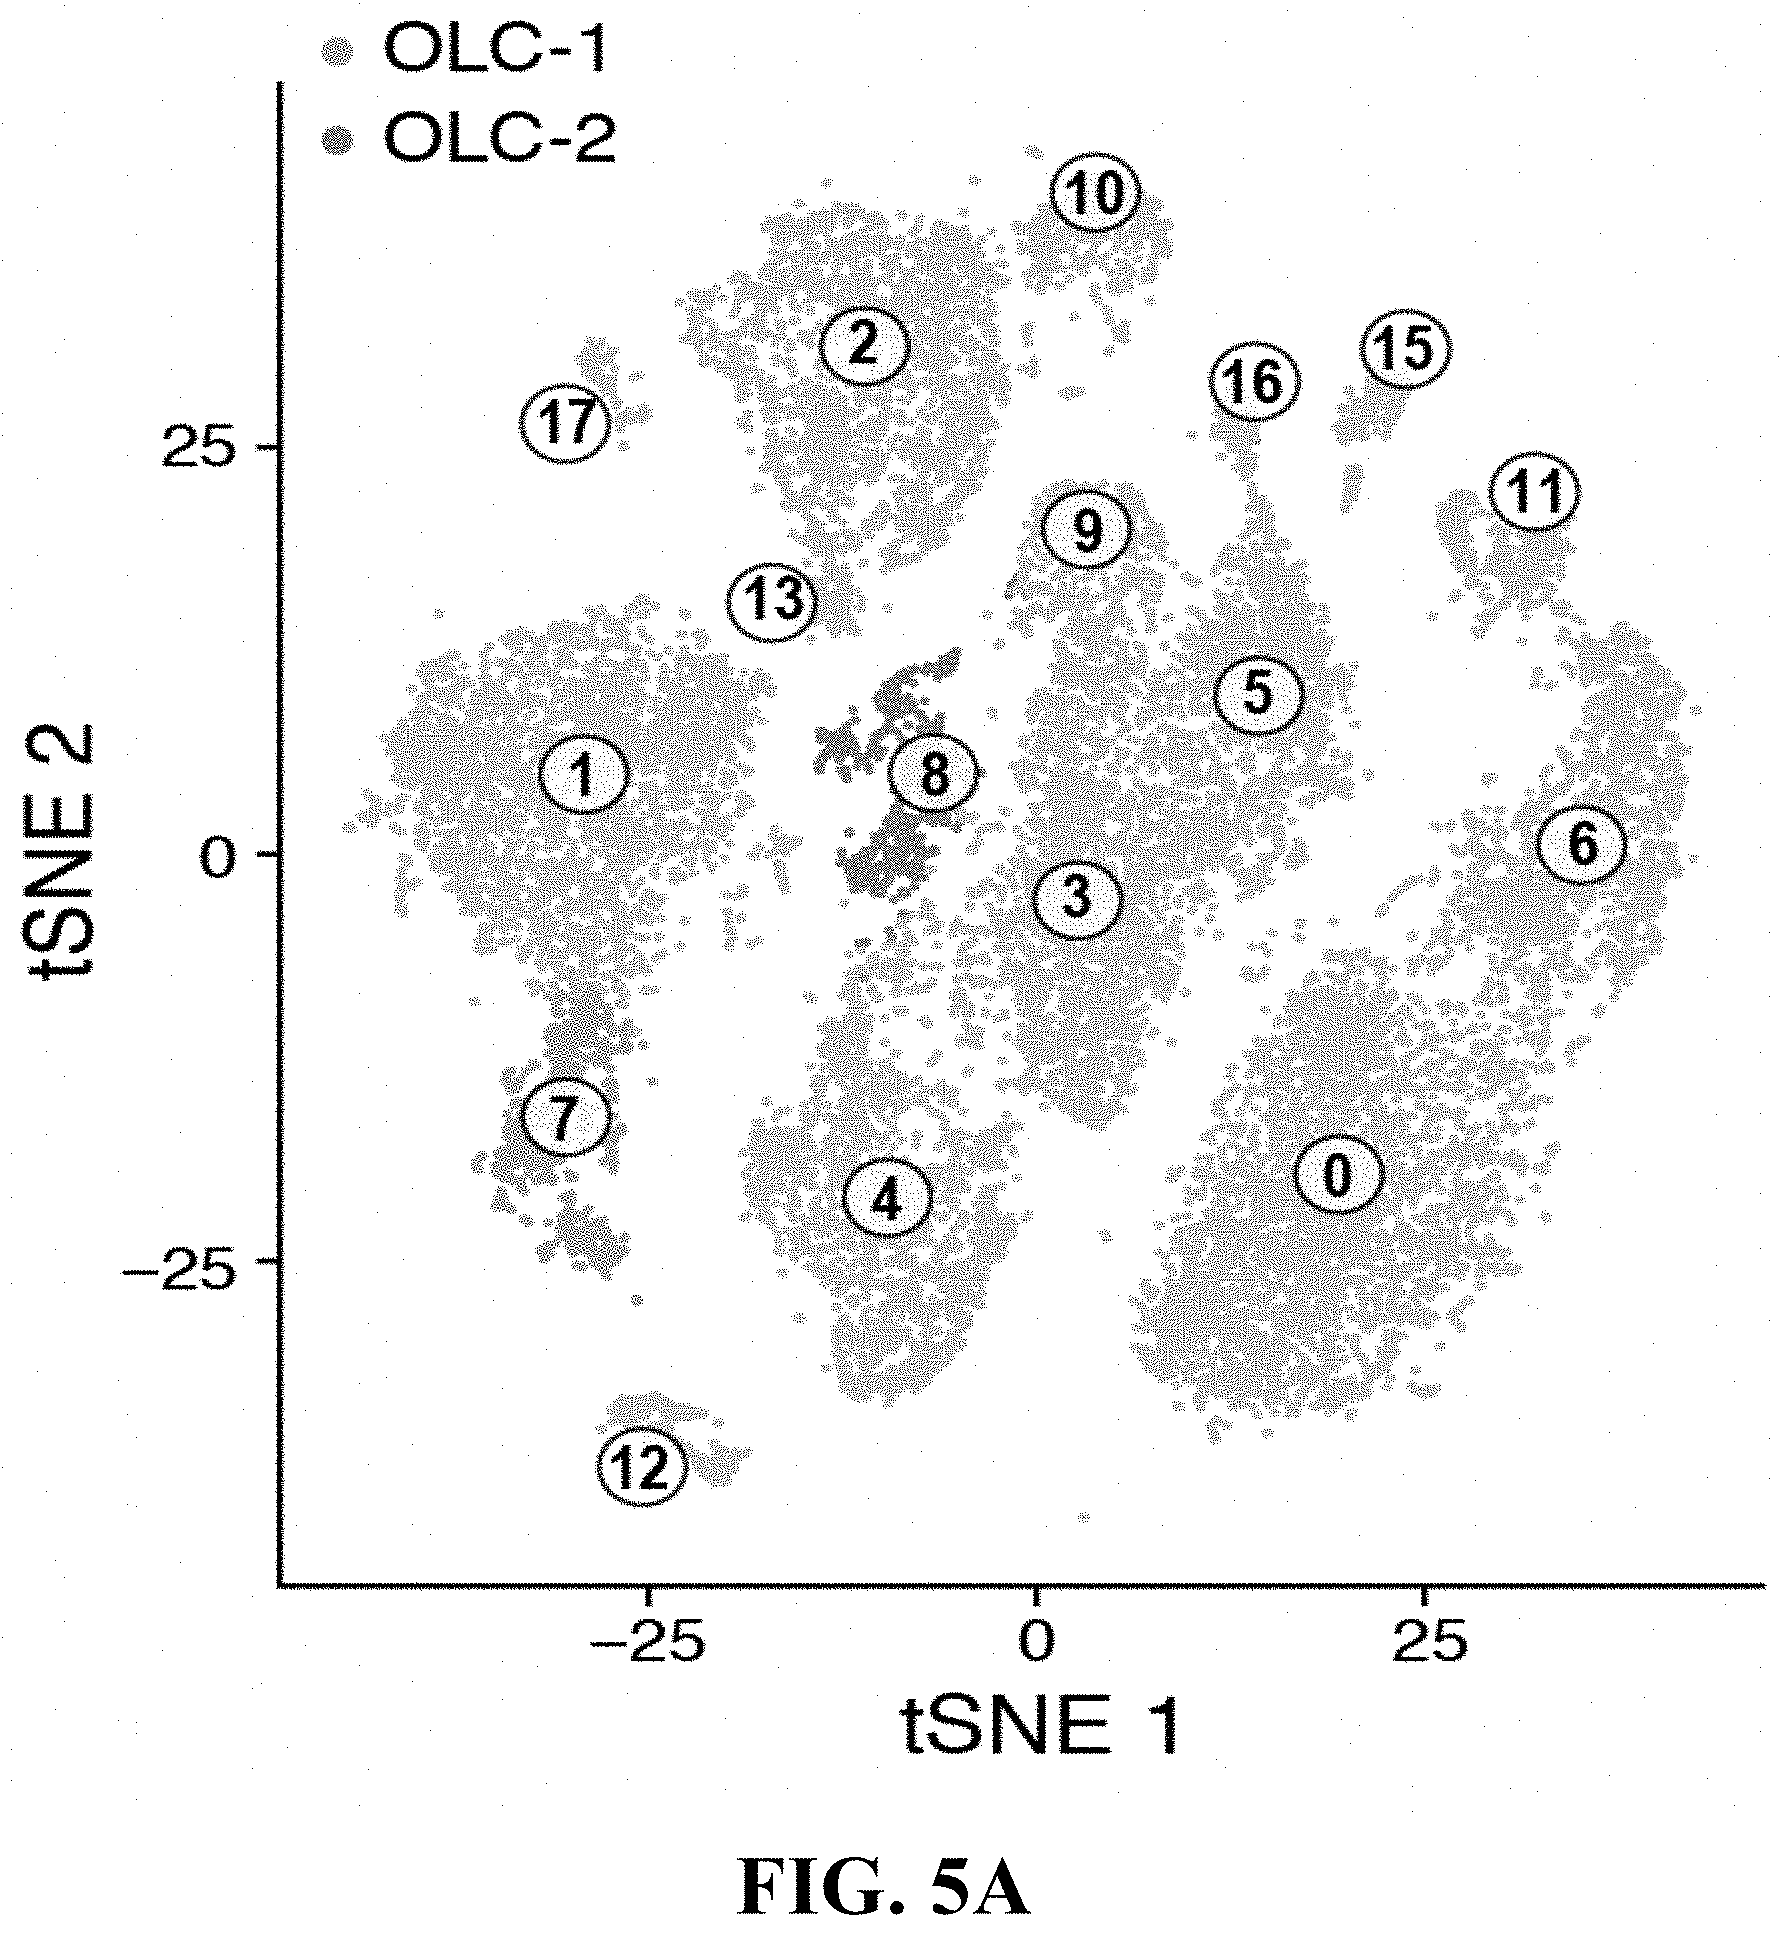
D00028
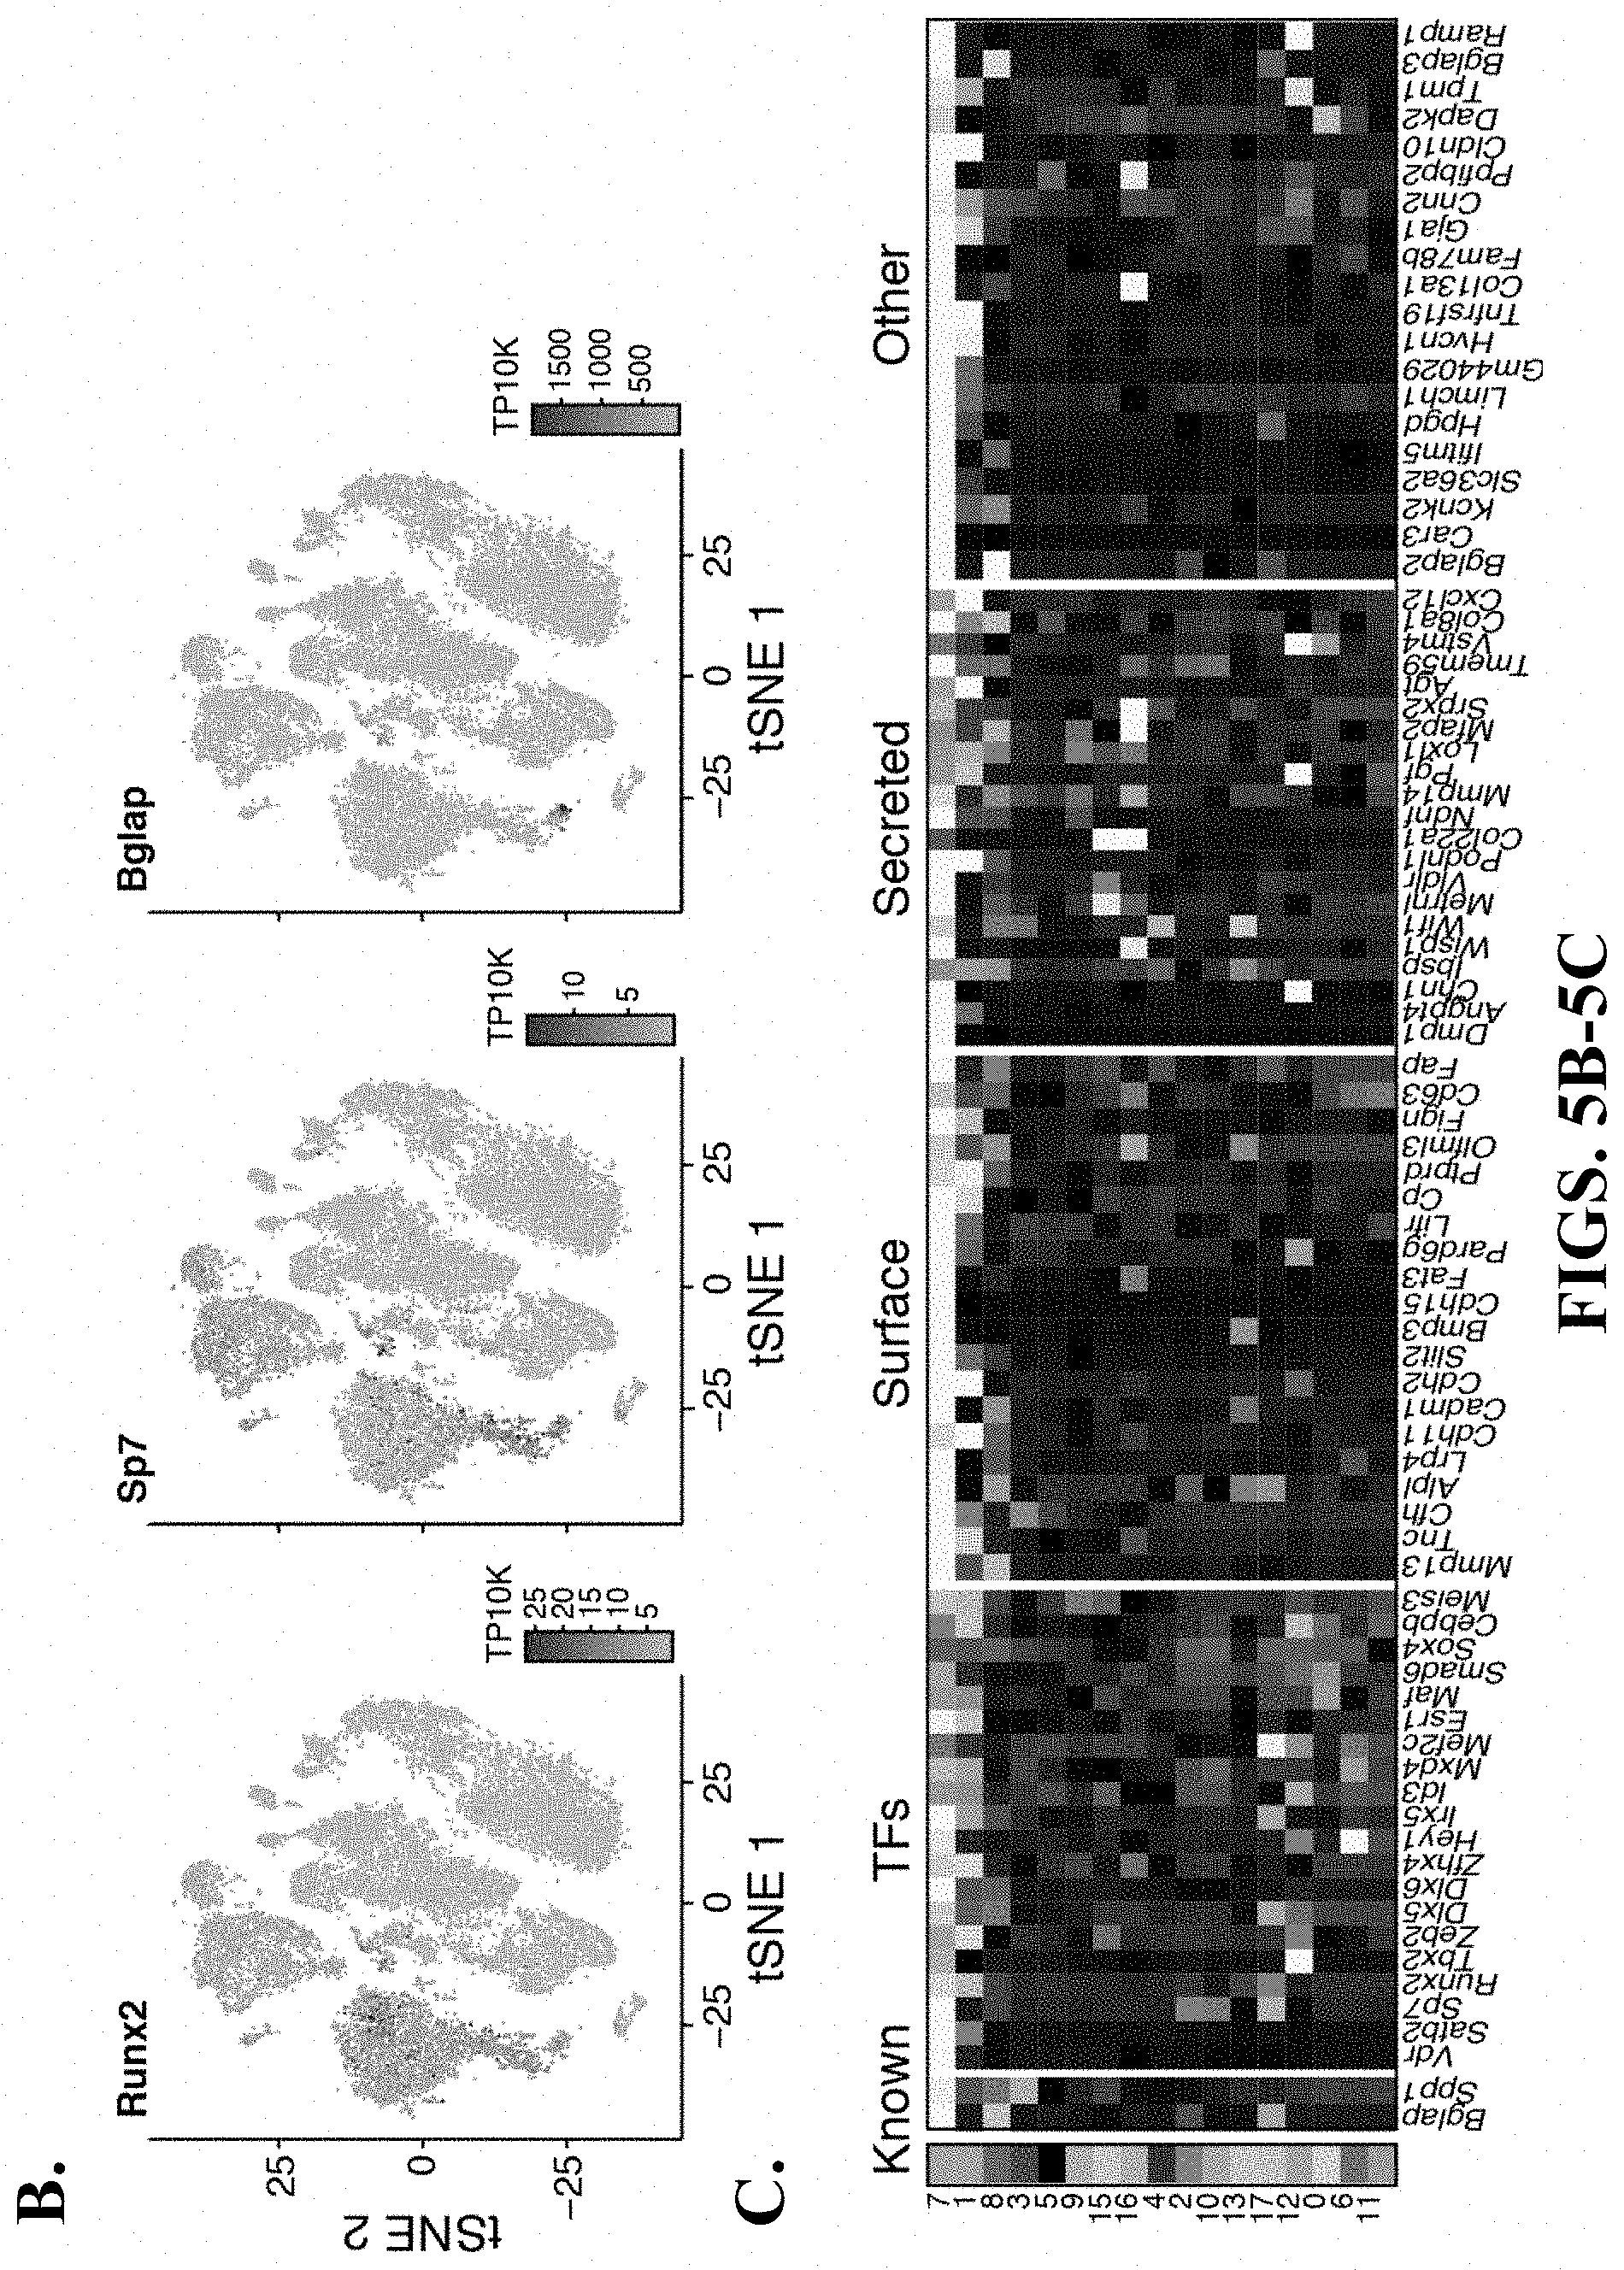
D00029

D00030

D00031

D00032

D00033

D00034

D00035

D00036

D00037

D00038

D00039

D00040

D00041

D00042
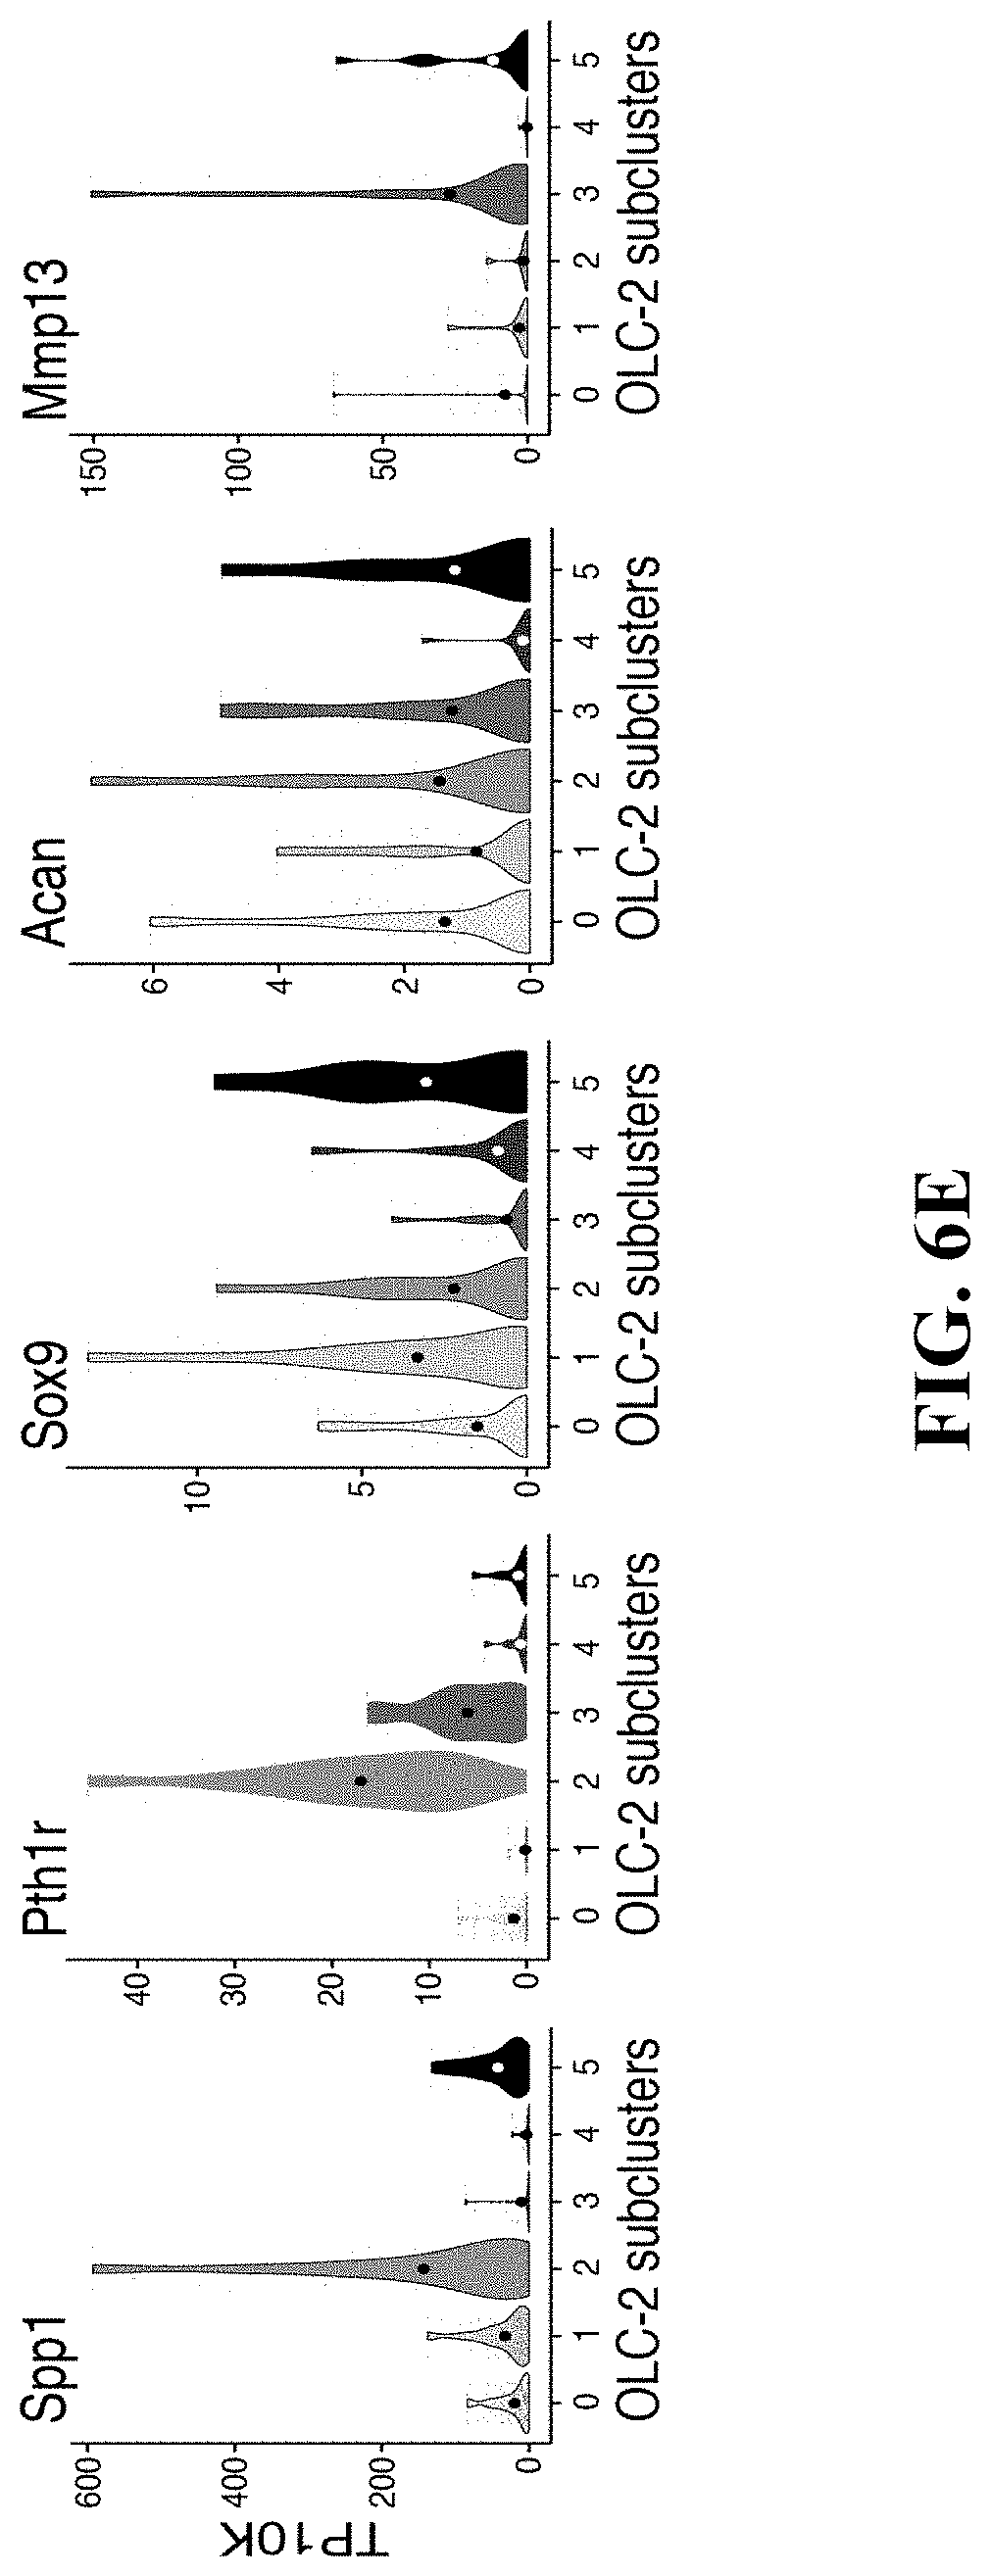
D00043

D00044

D00045

D00046

D00047

D00048

D00049

D00050

D00051

D00052
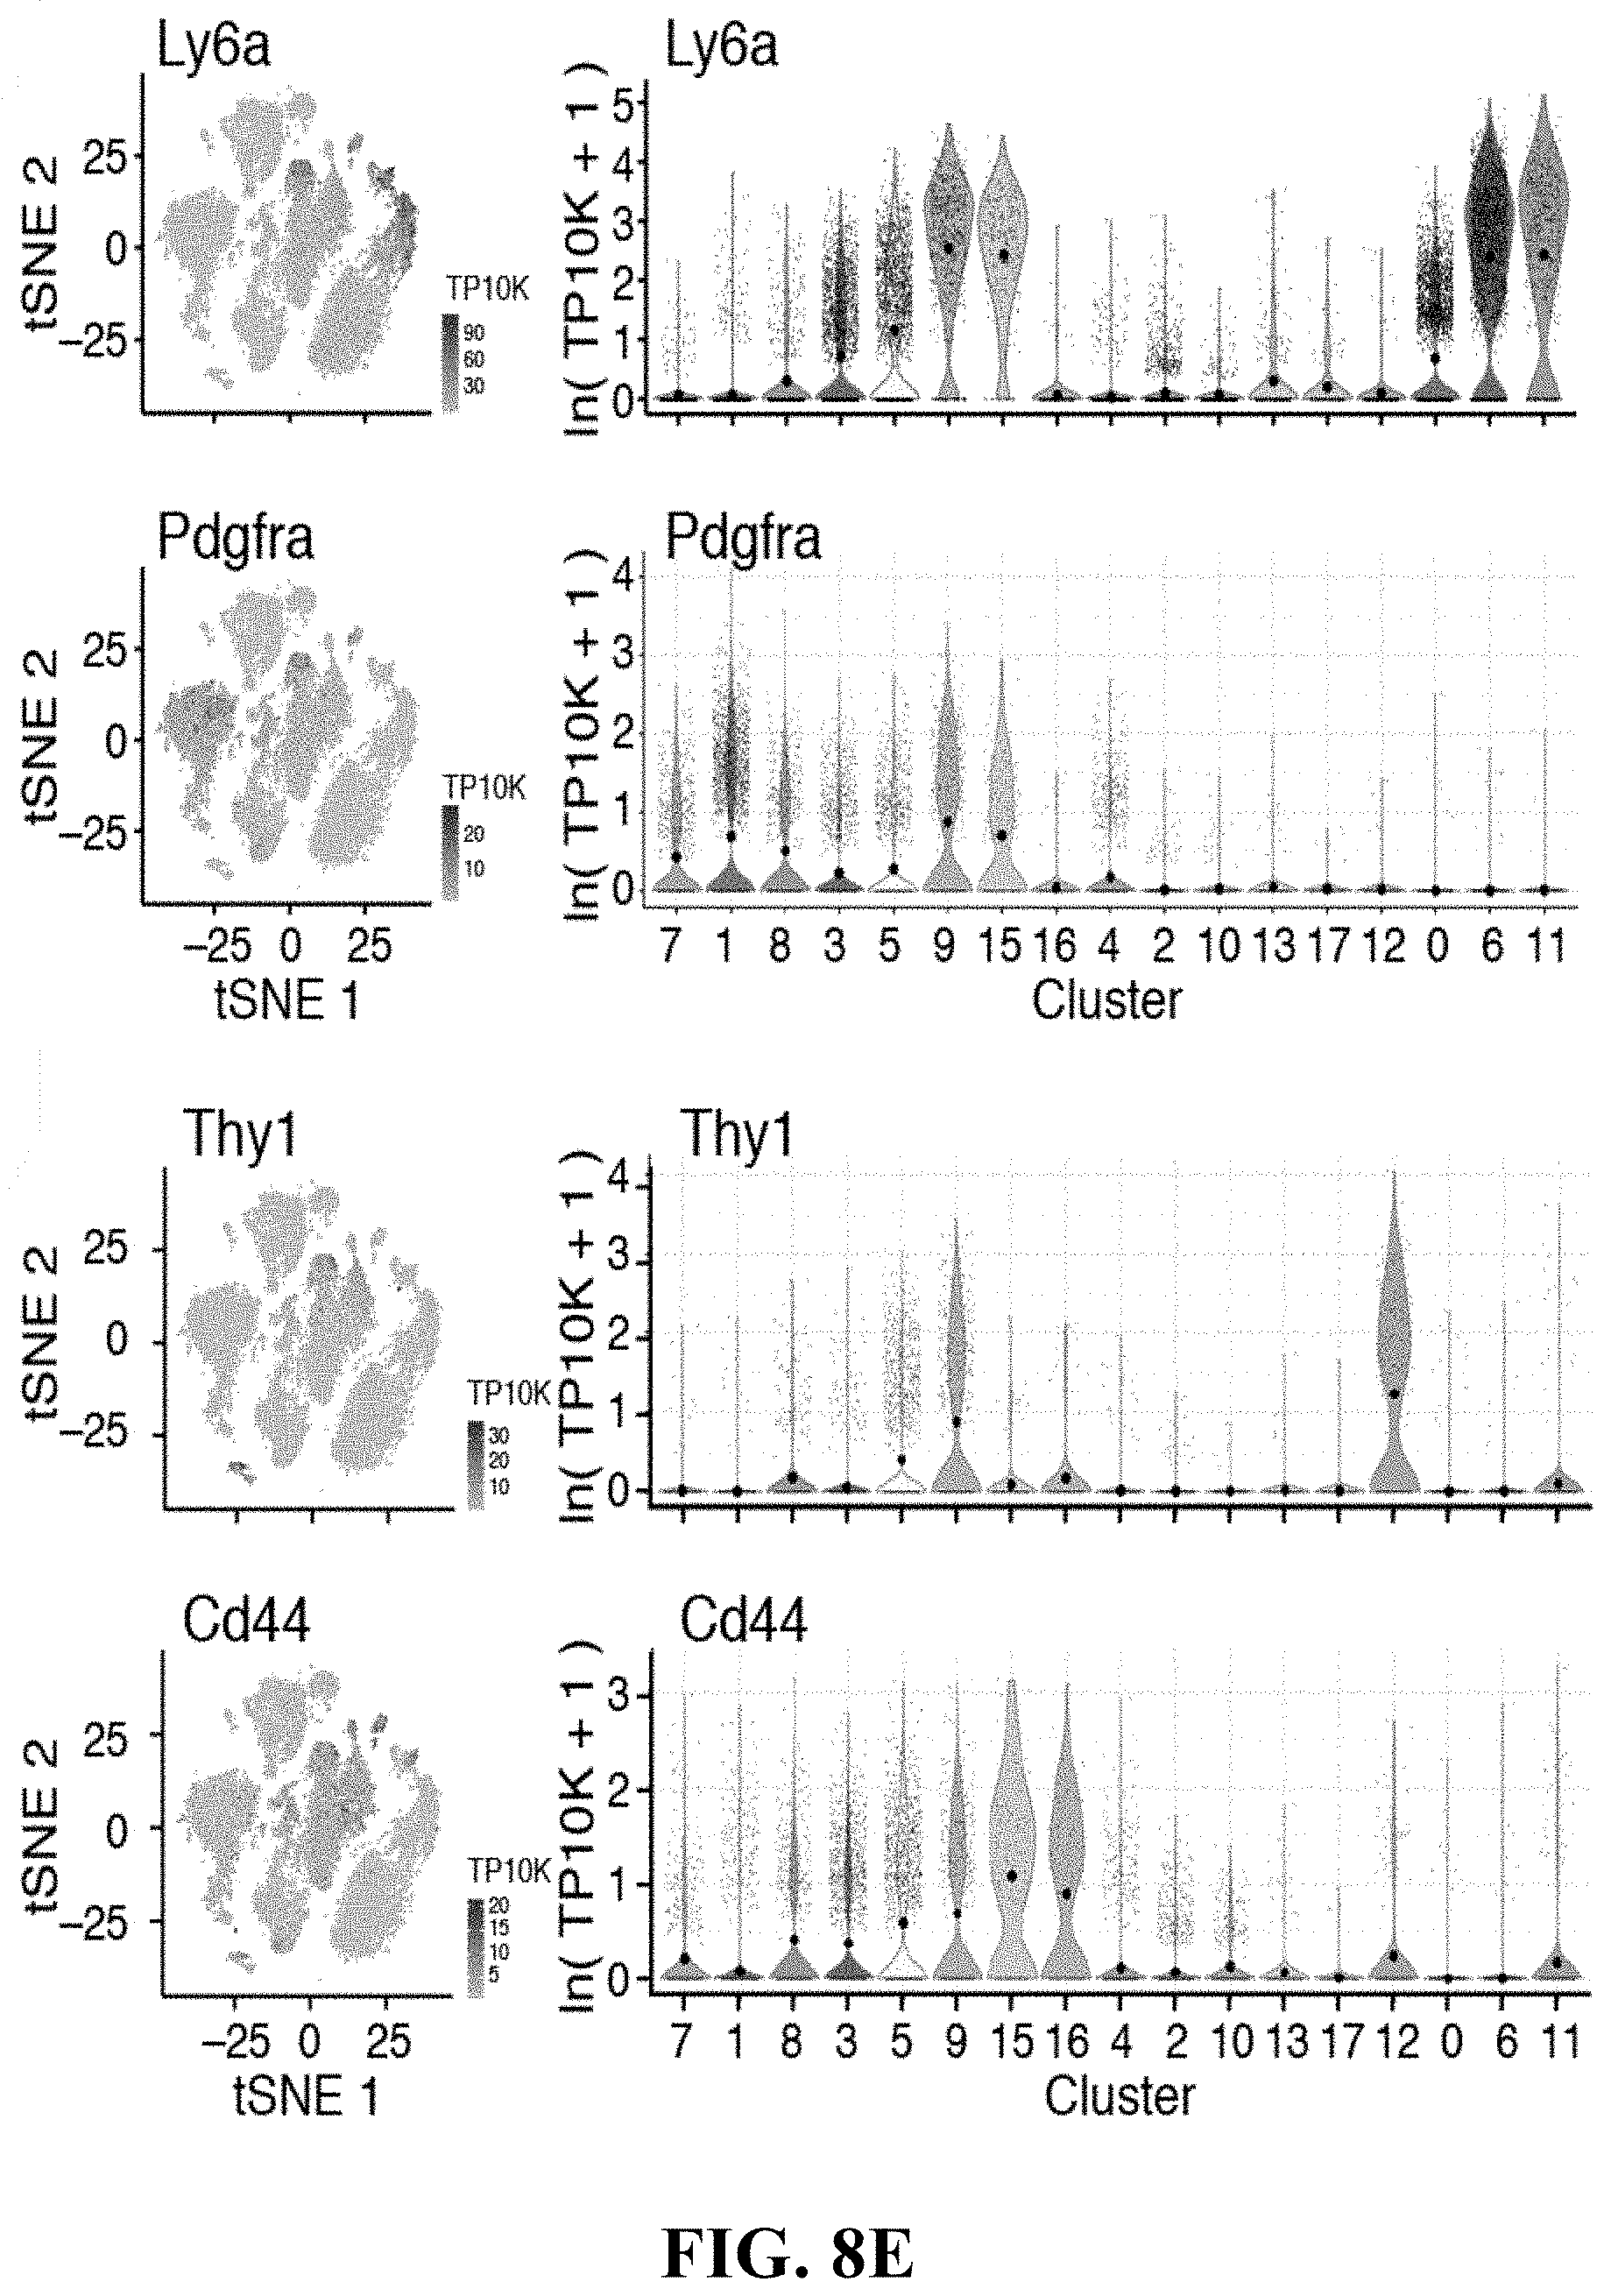
D00053

D00054

D00055
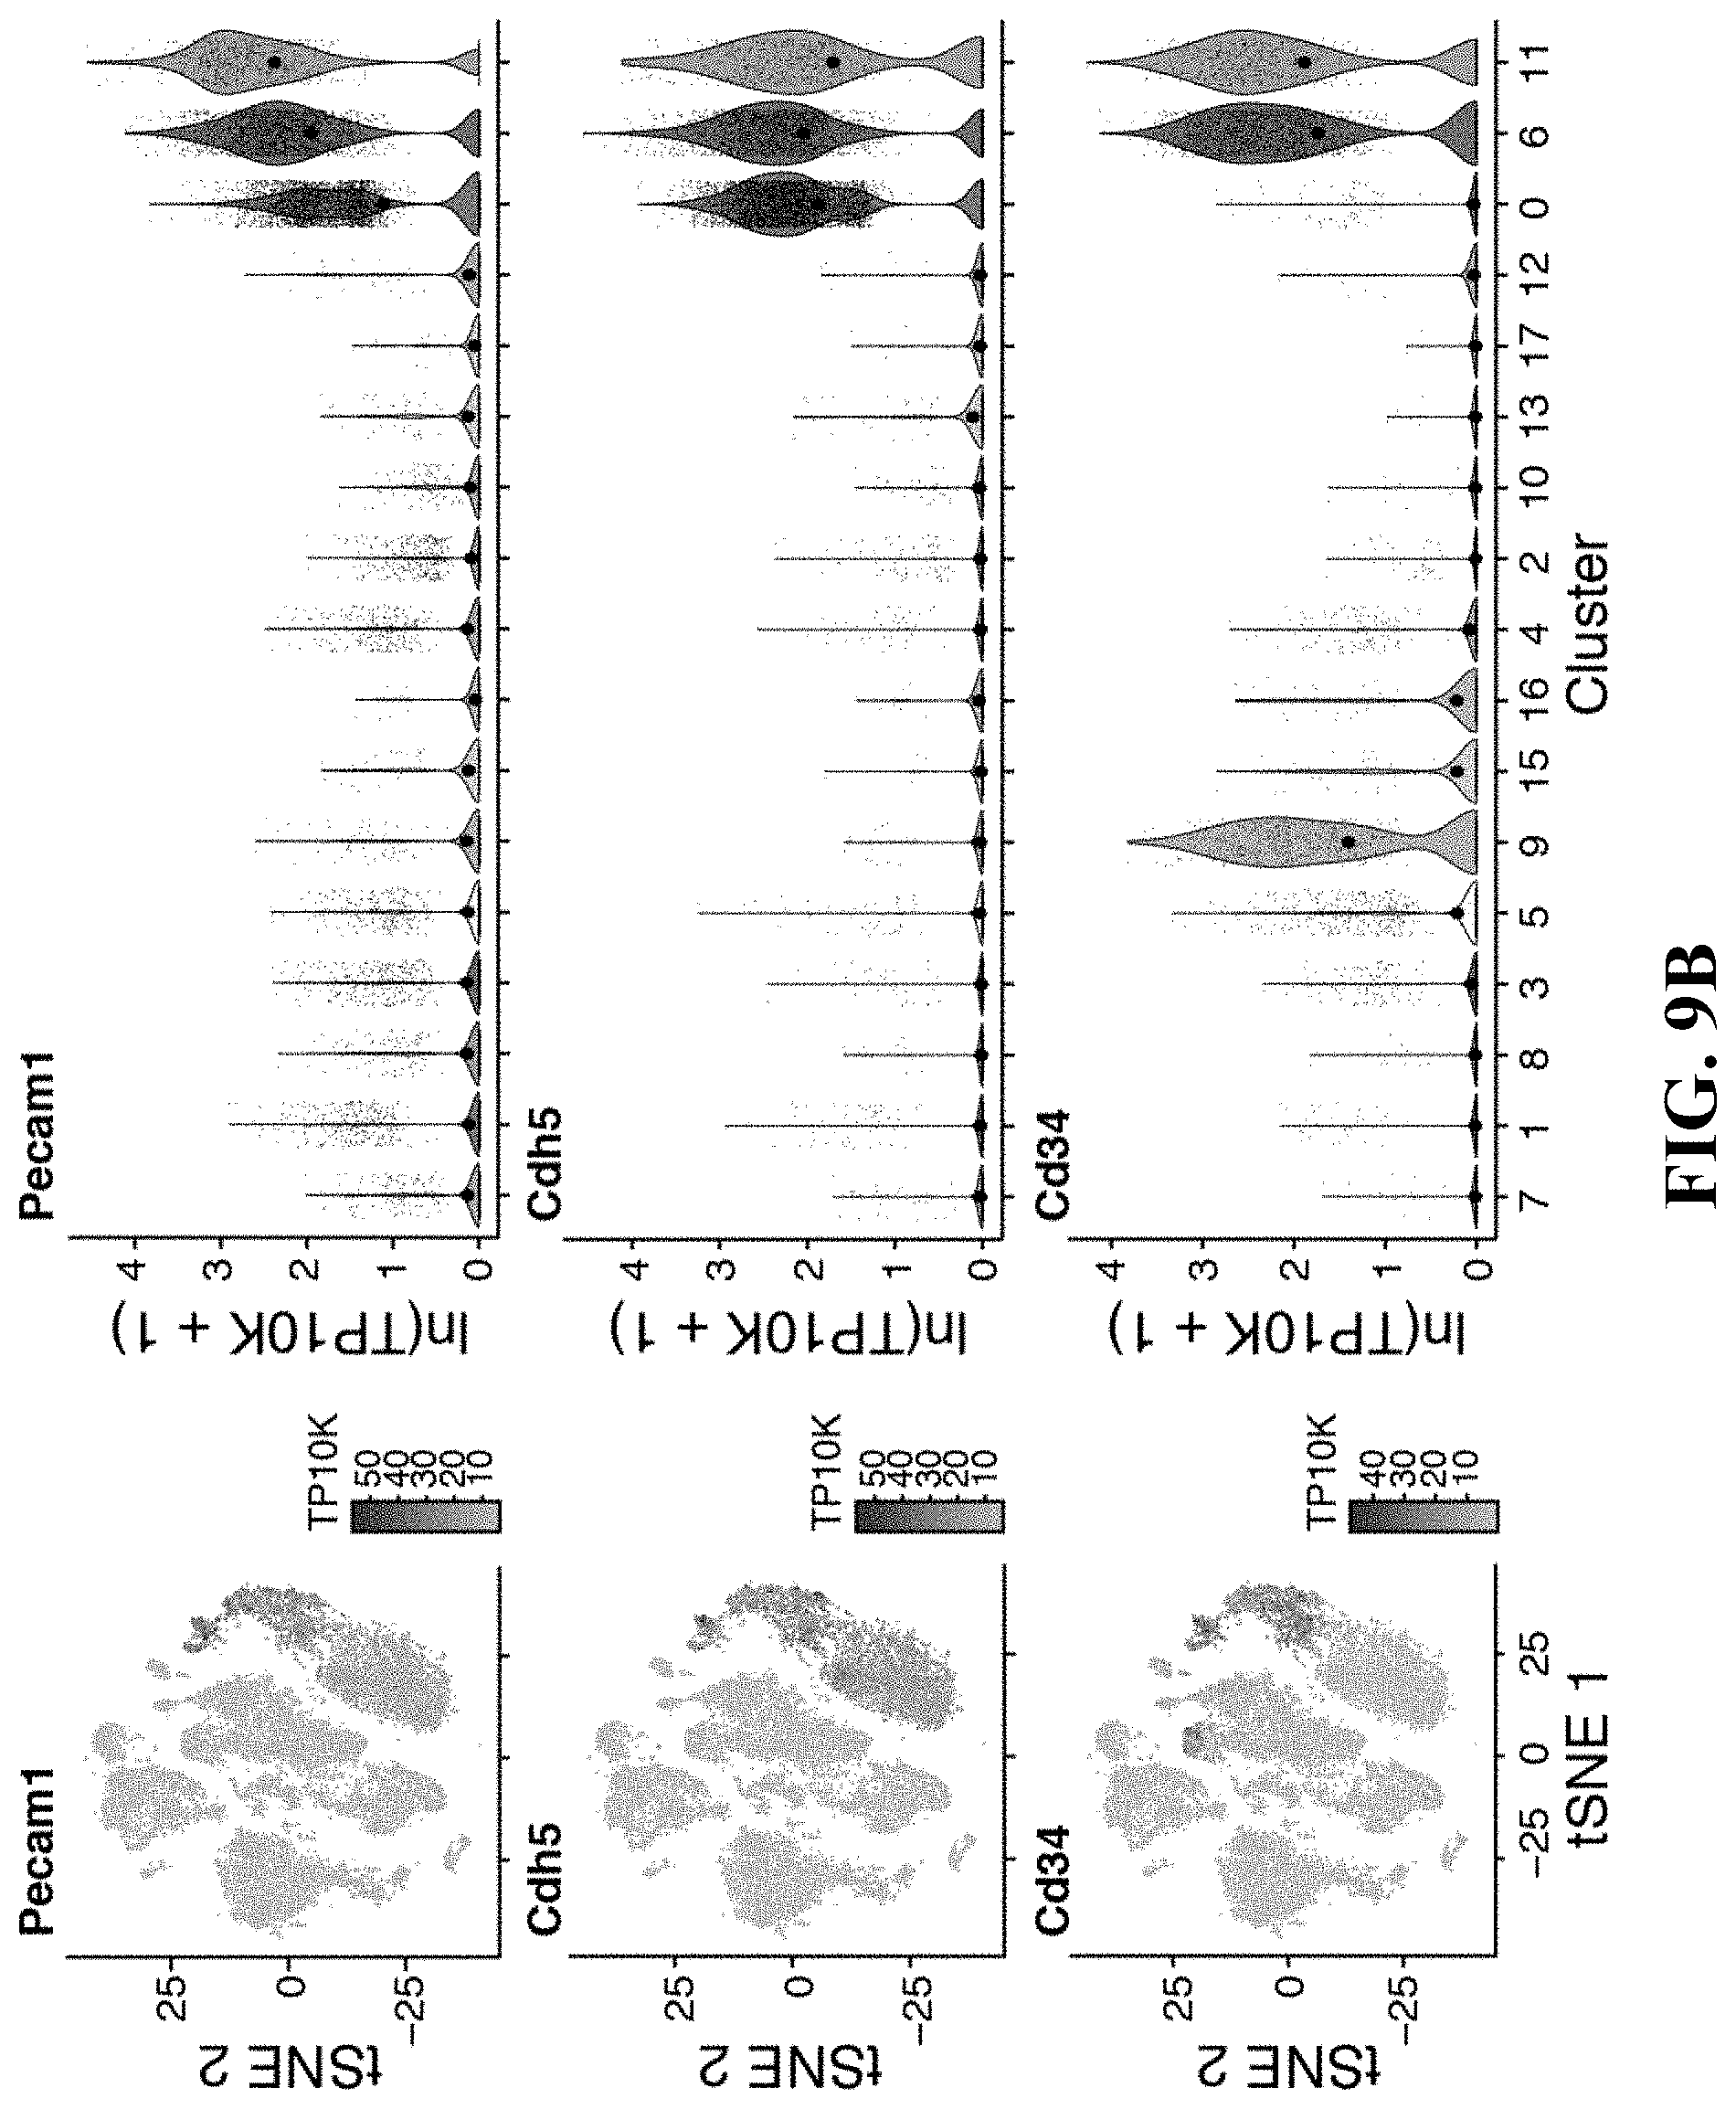
D00056

D00057

D00058
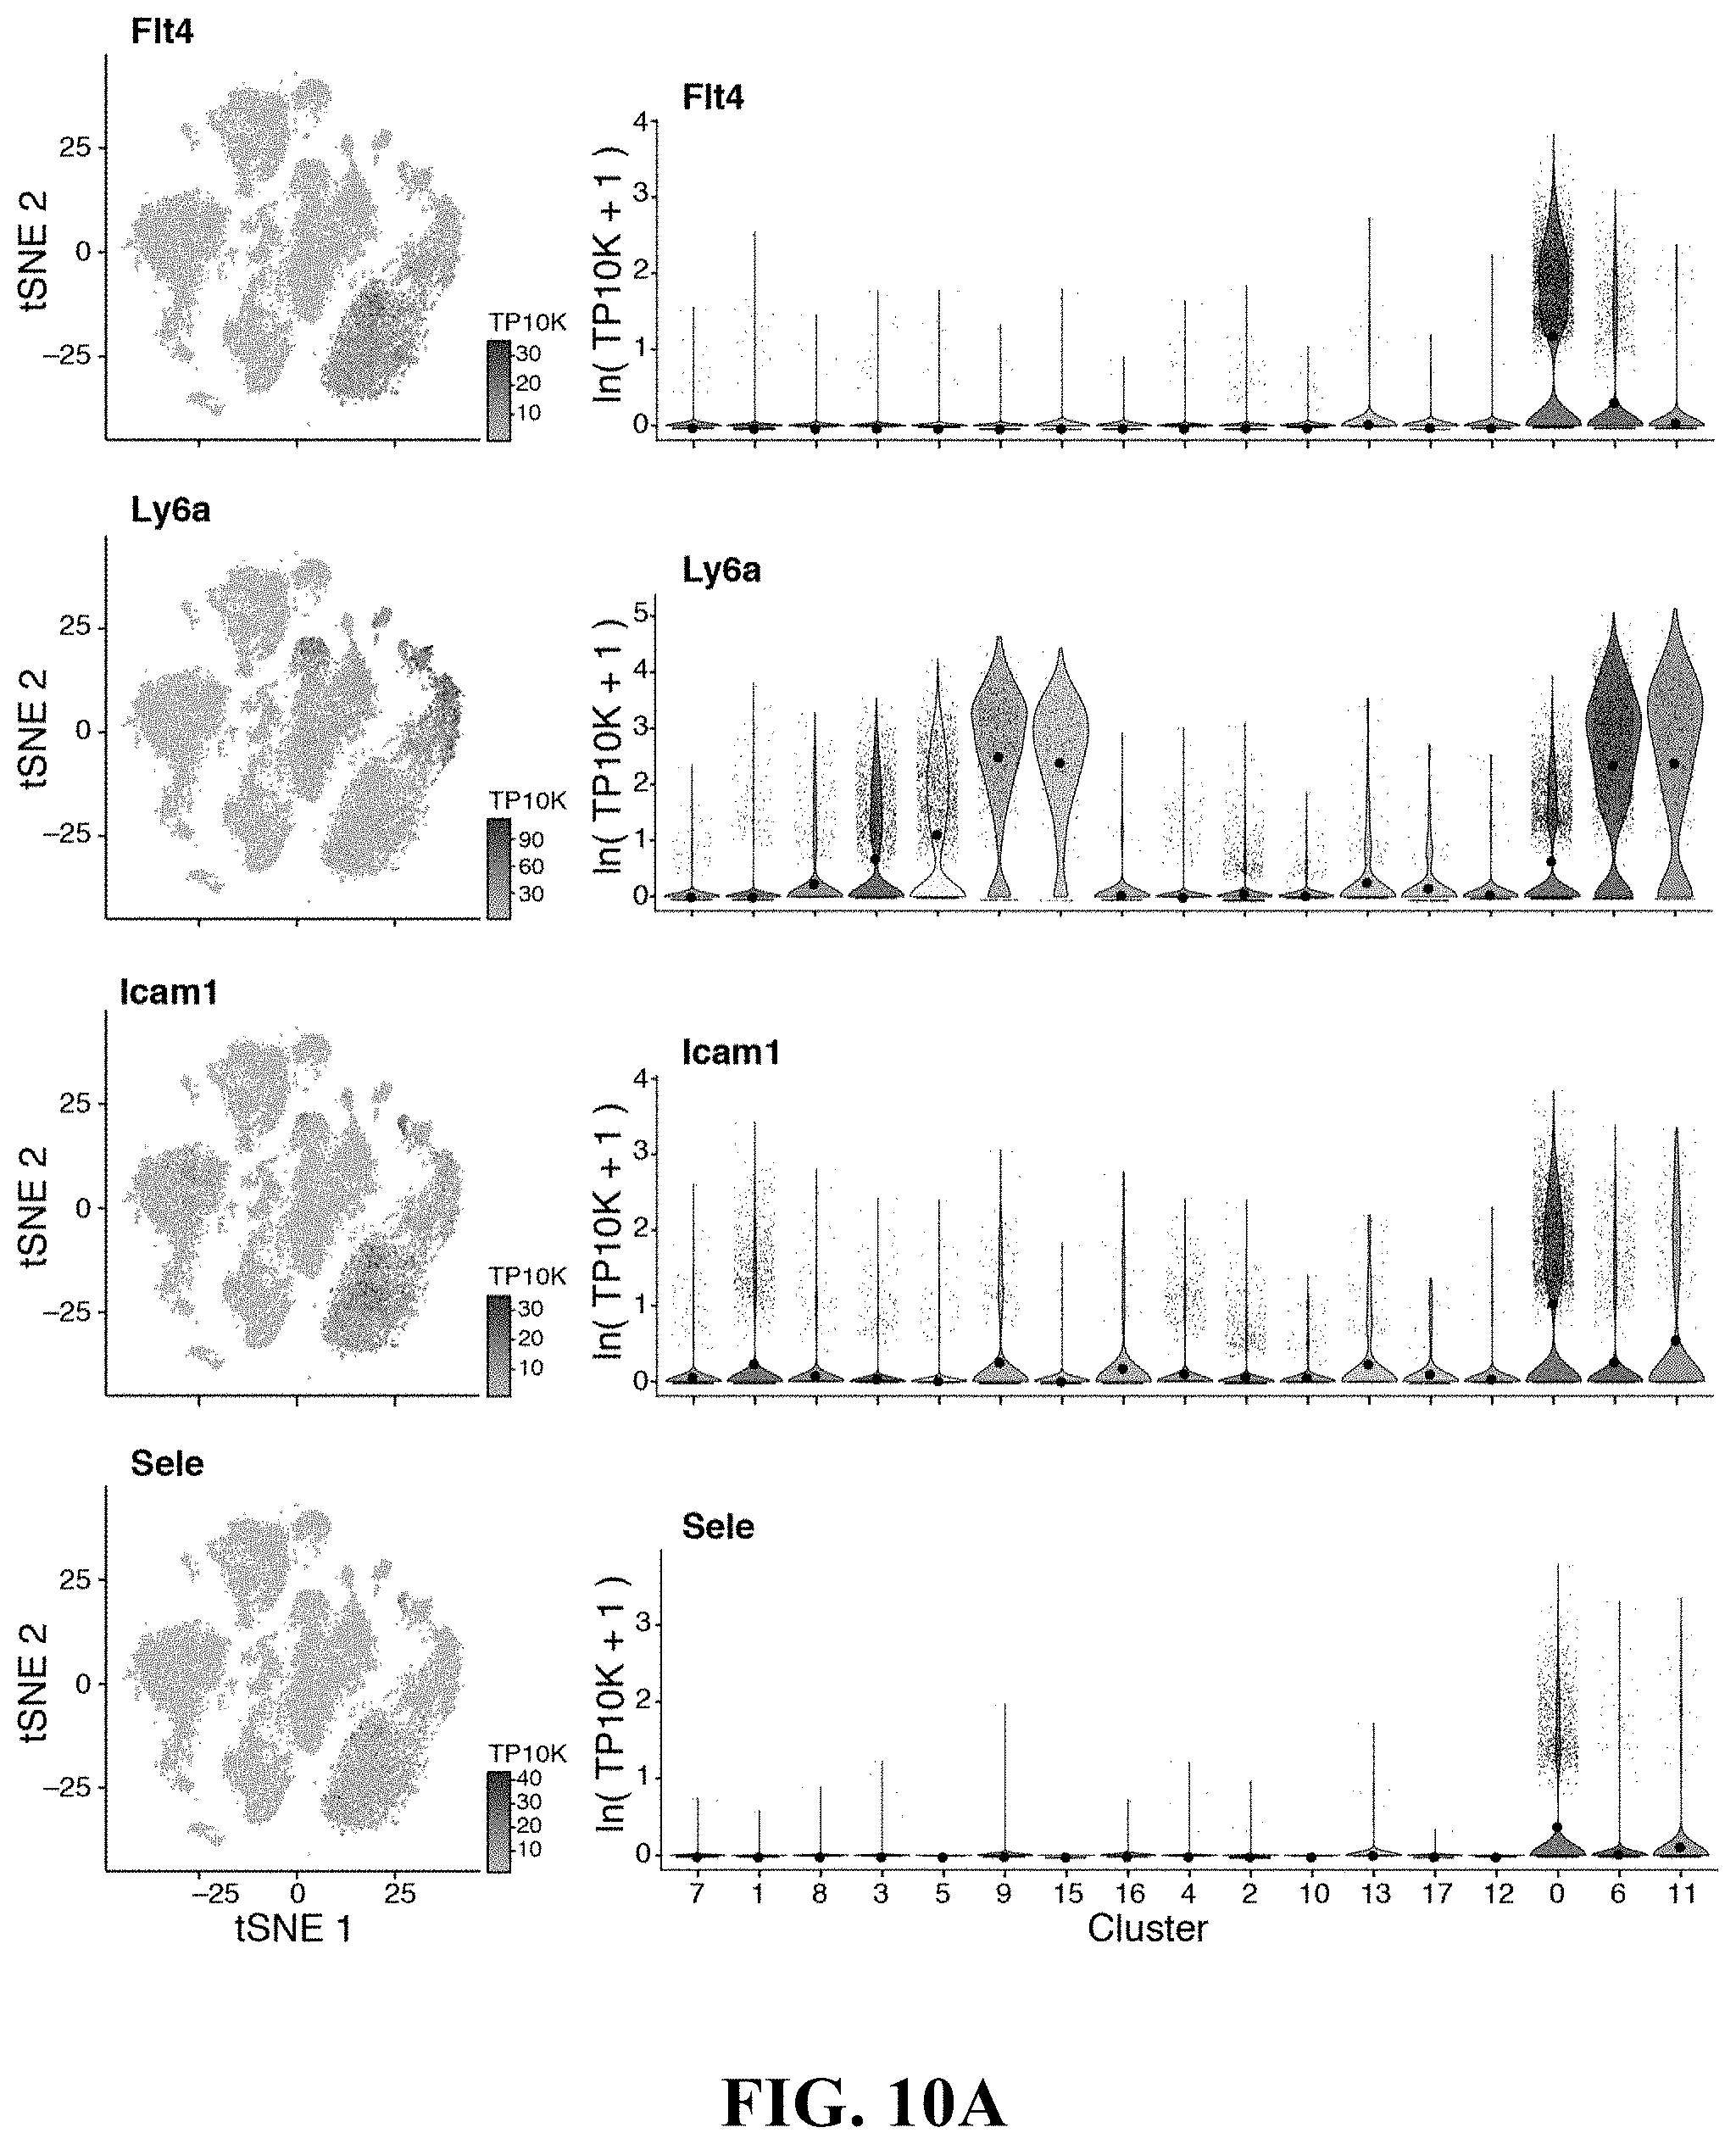
D00059

D00060
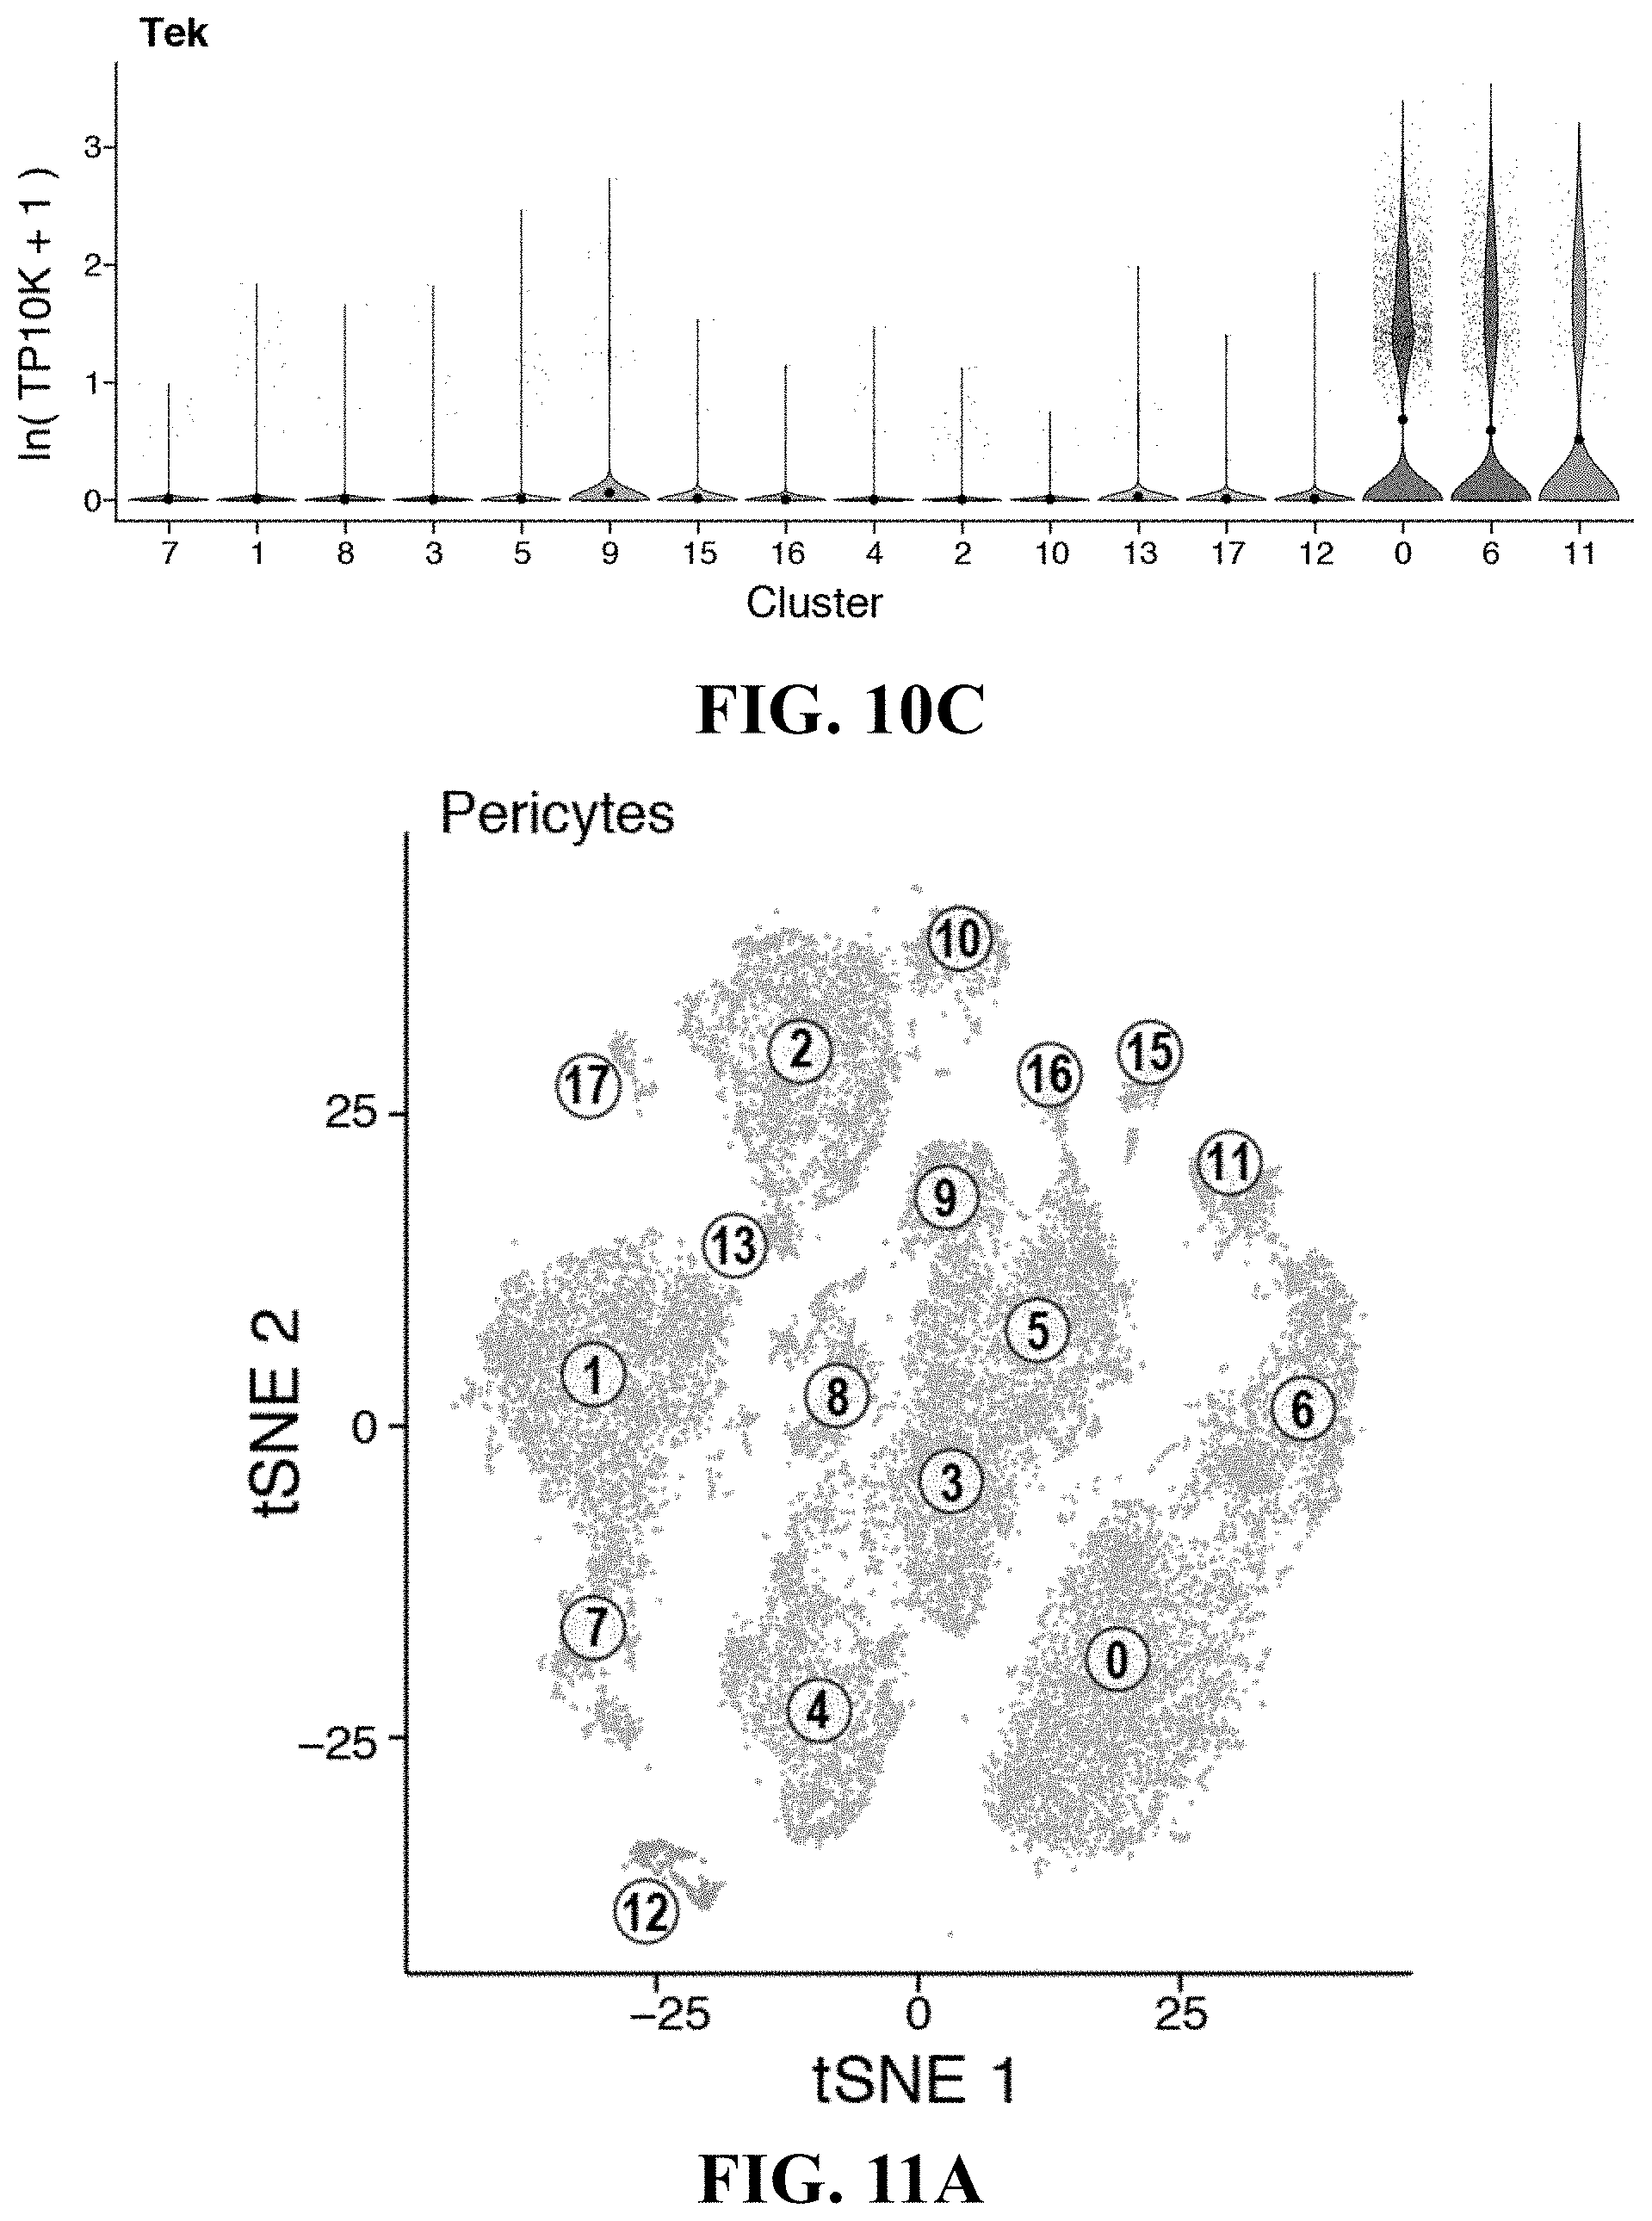
D00061

D00062
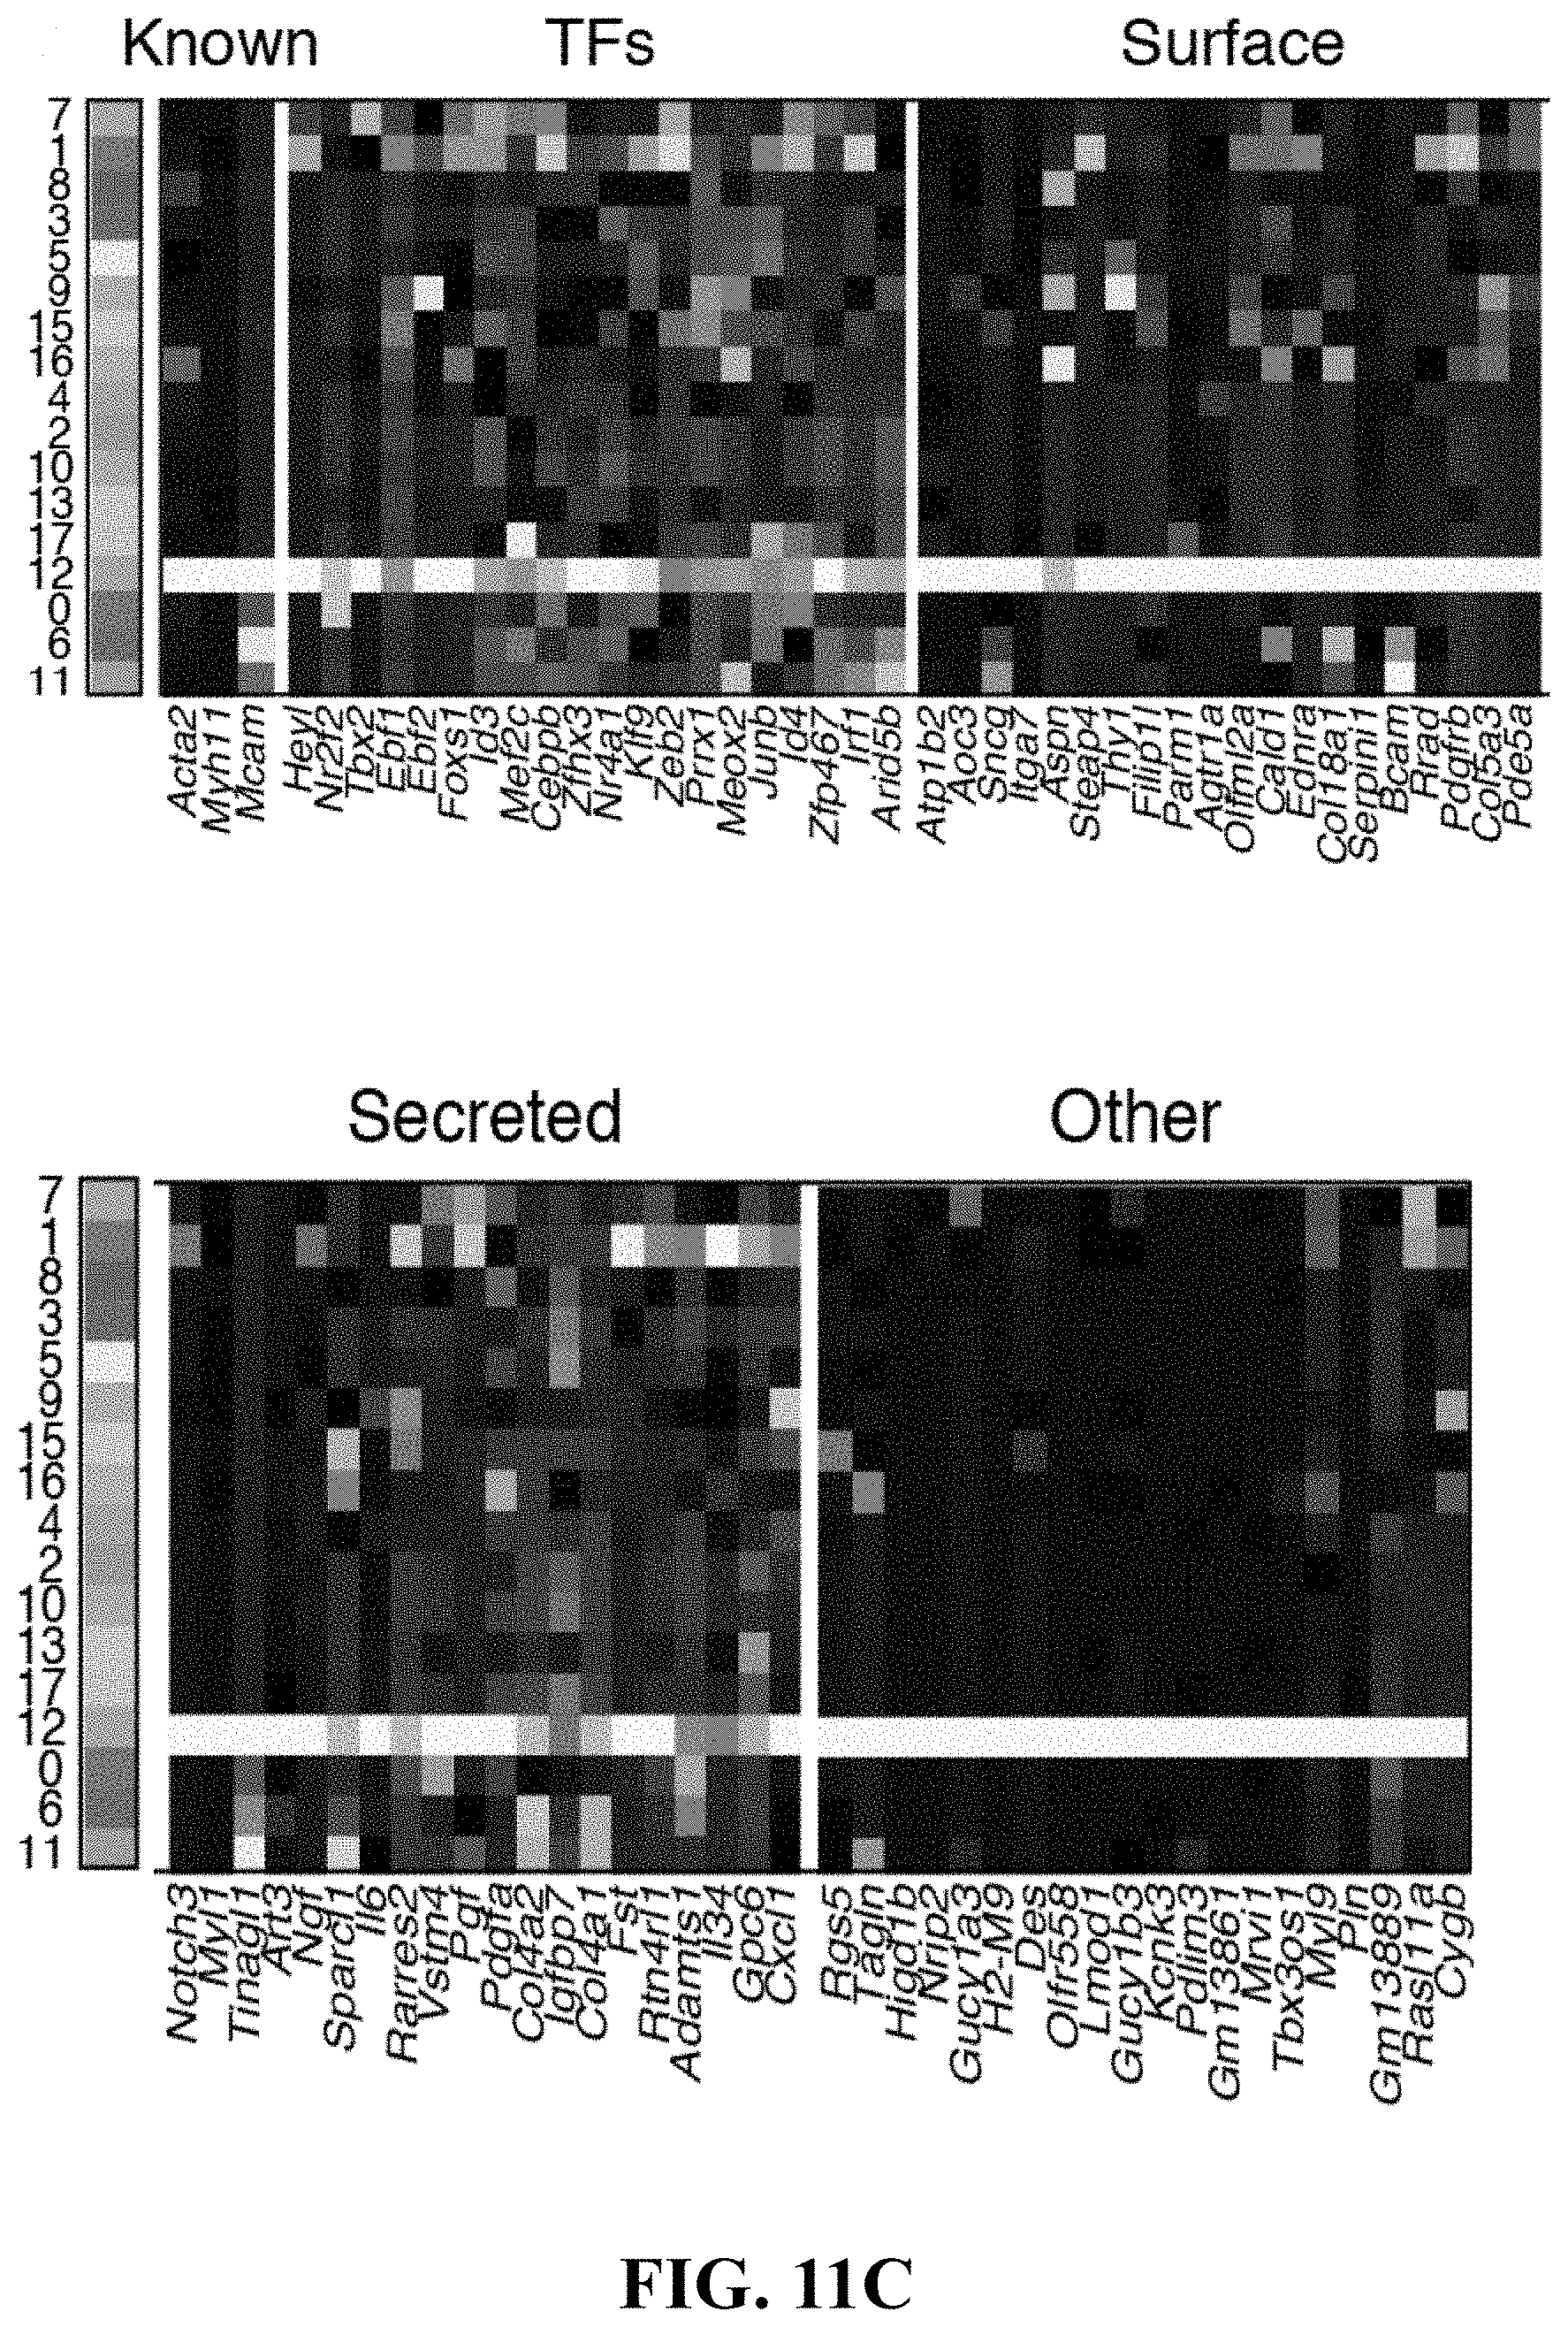
D00063

D00064
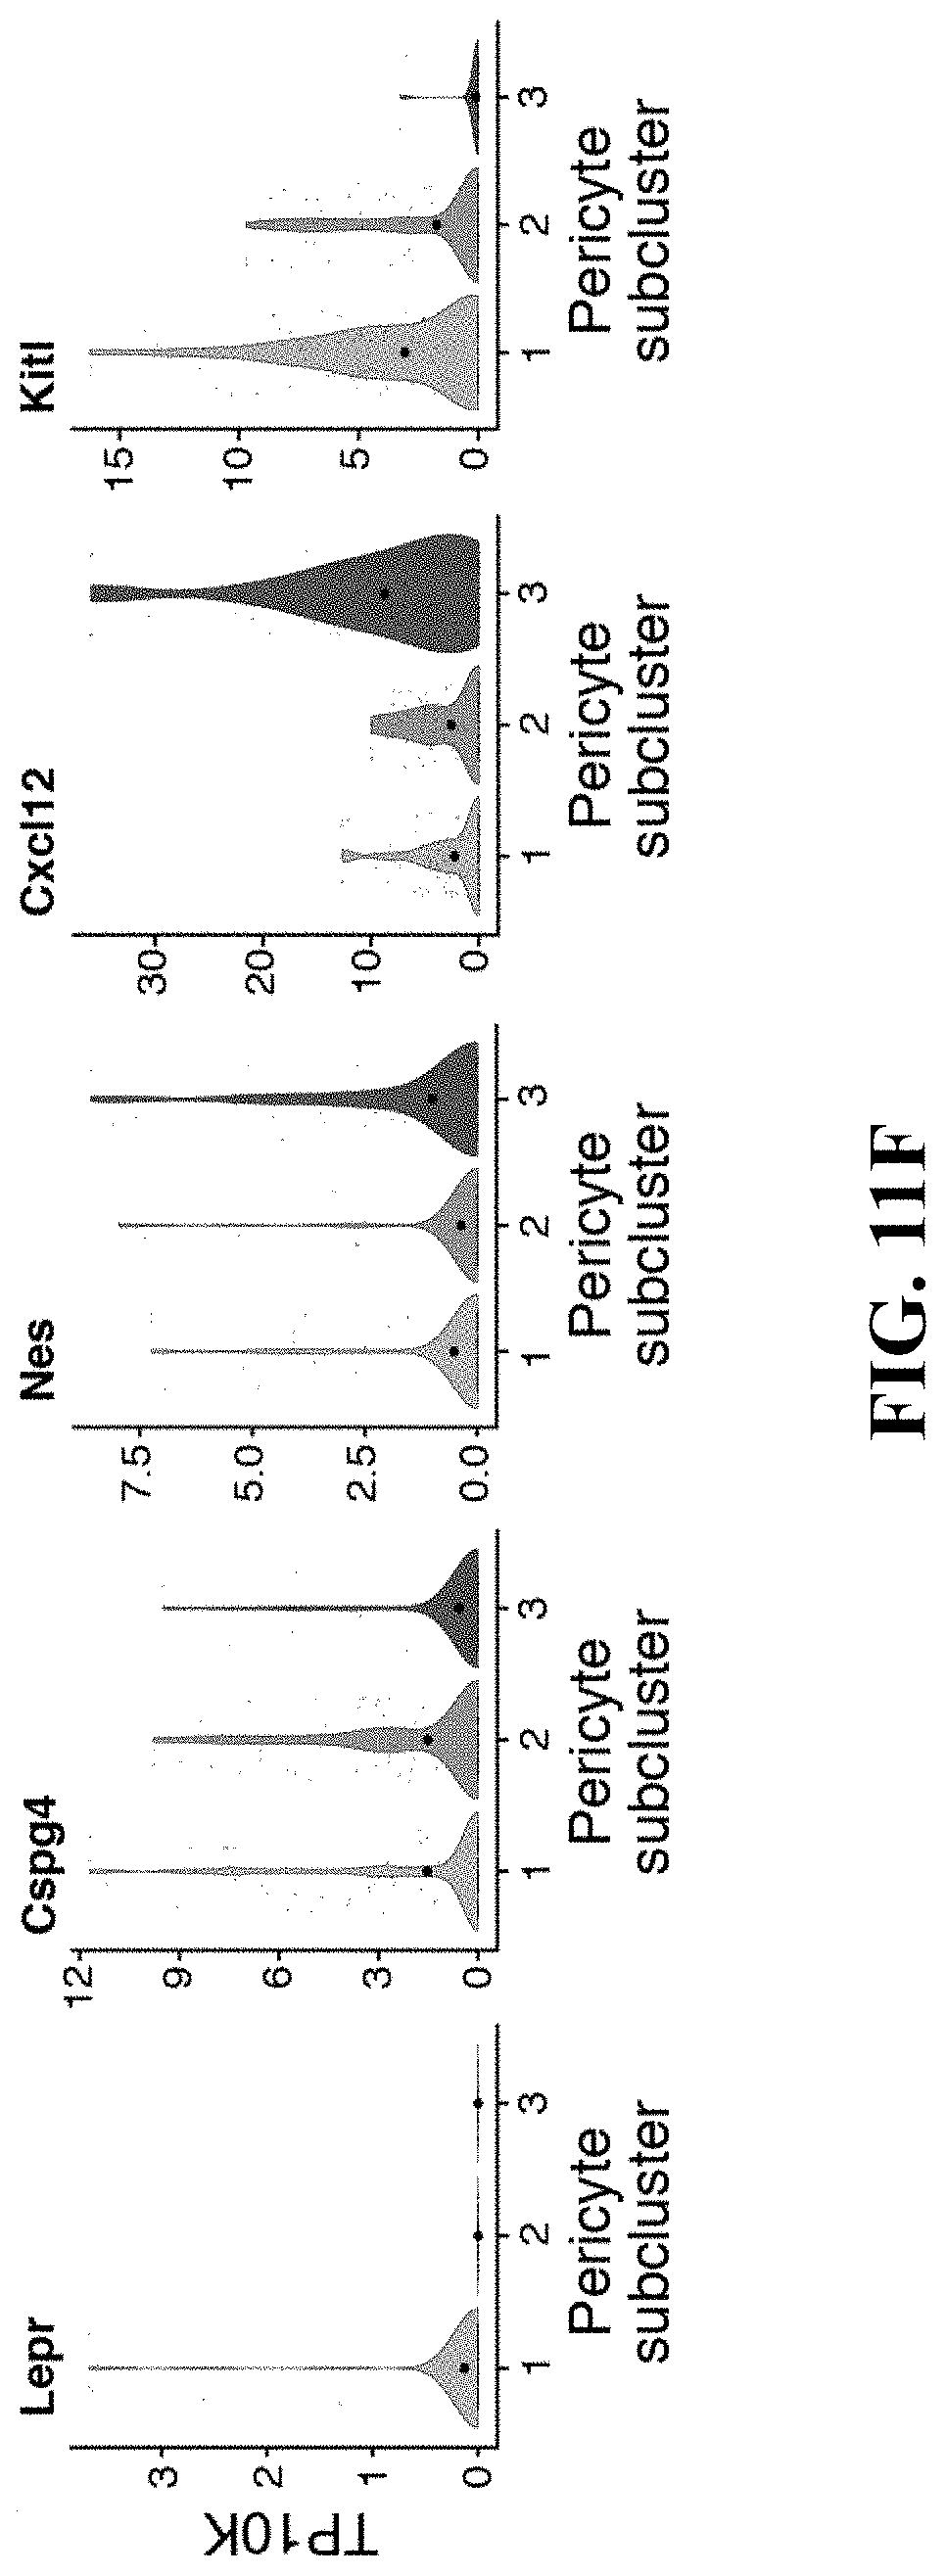
D00065
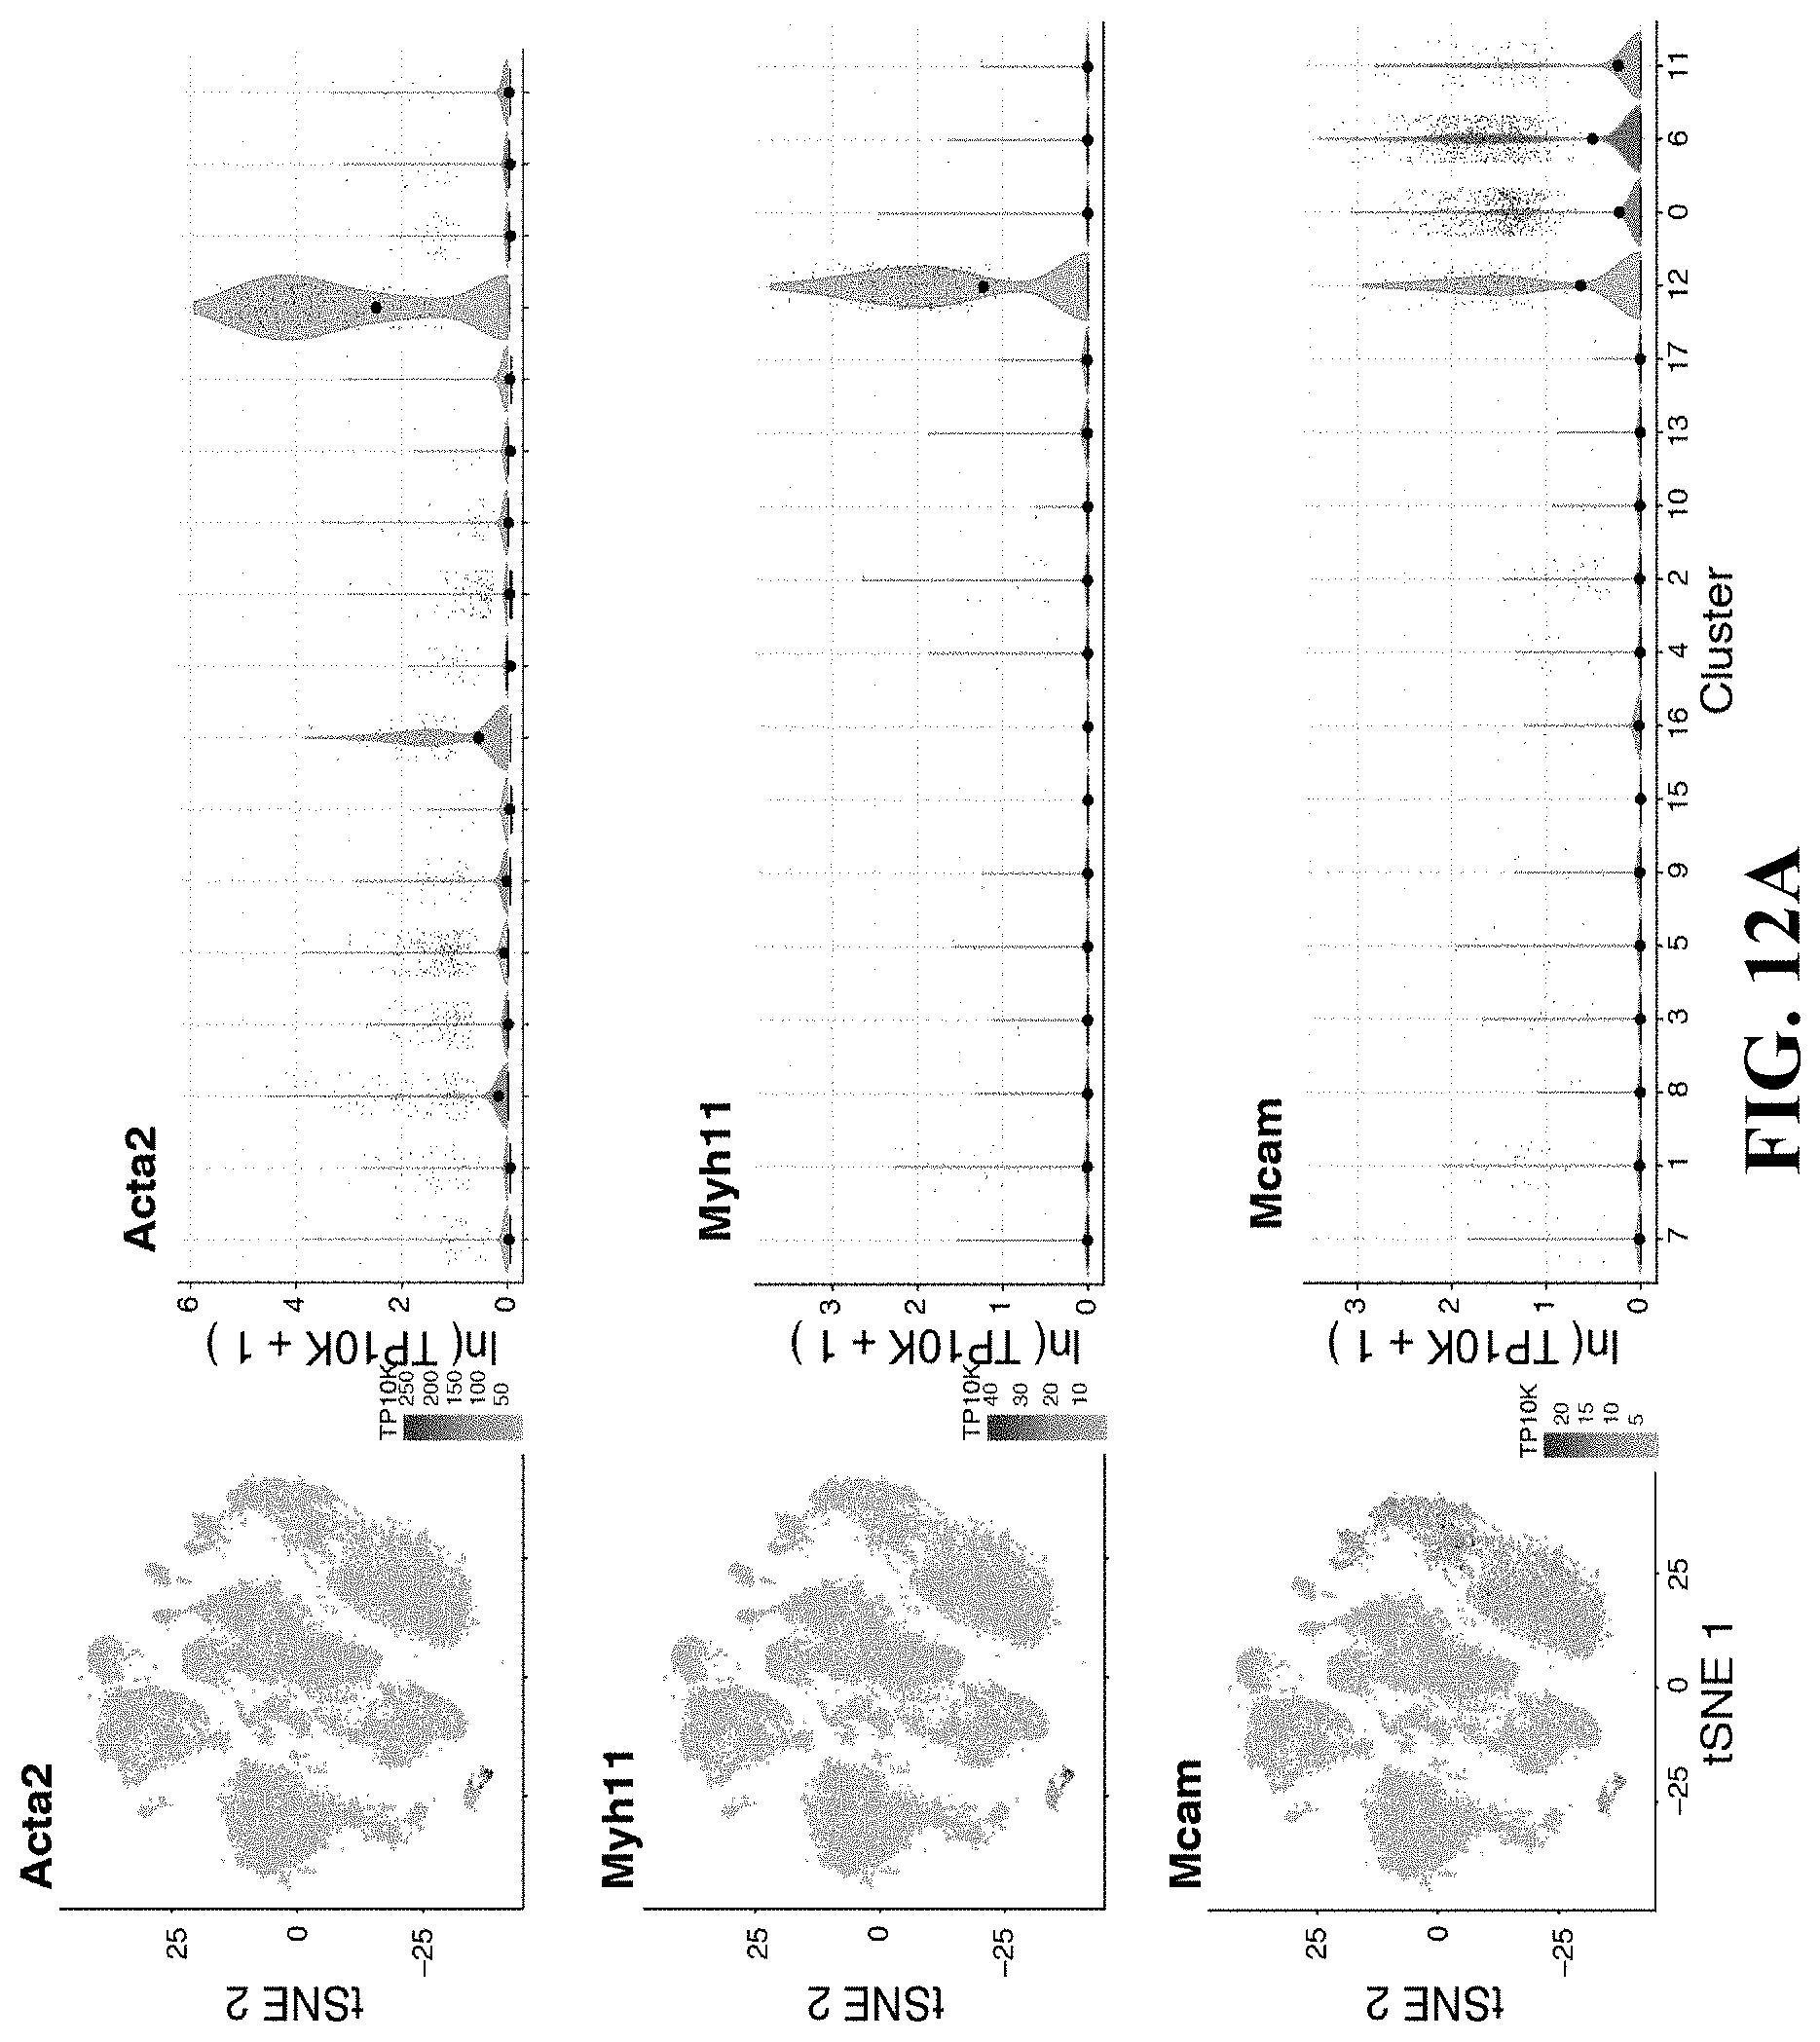
D00066

D00067

D00068
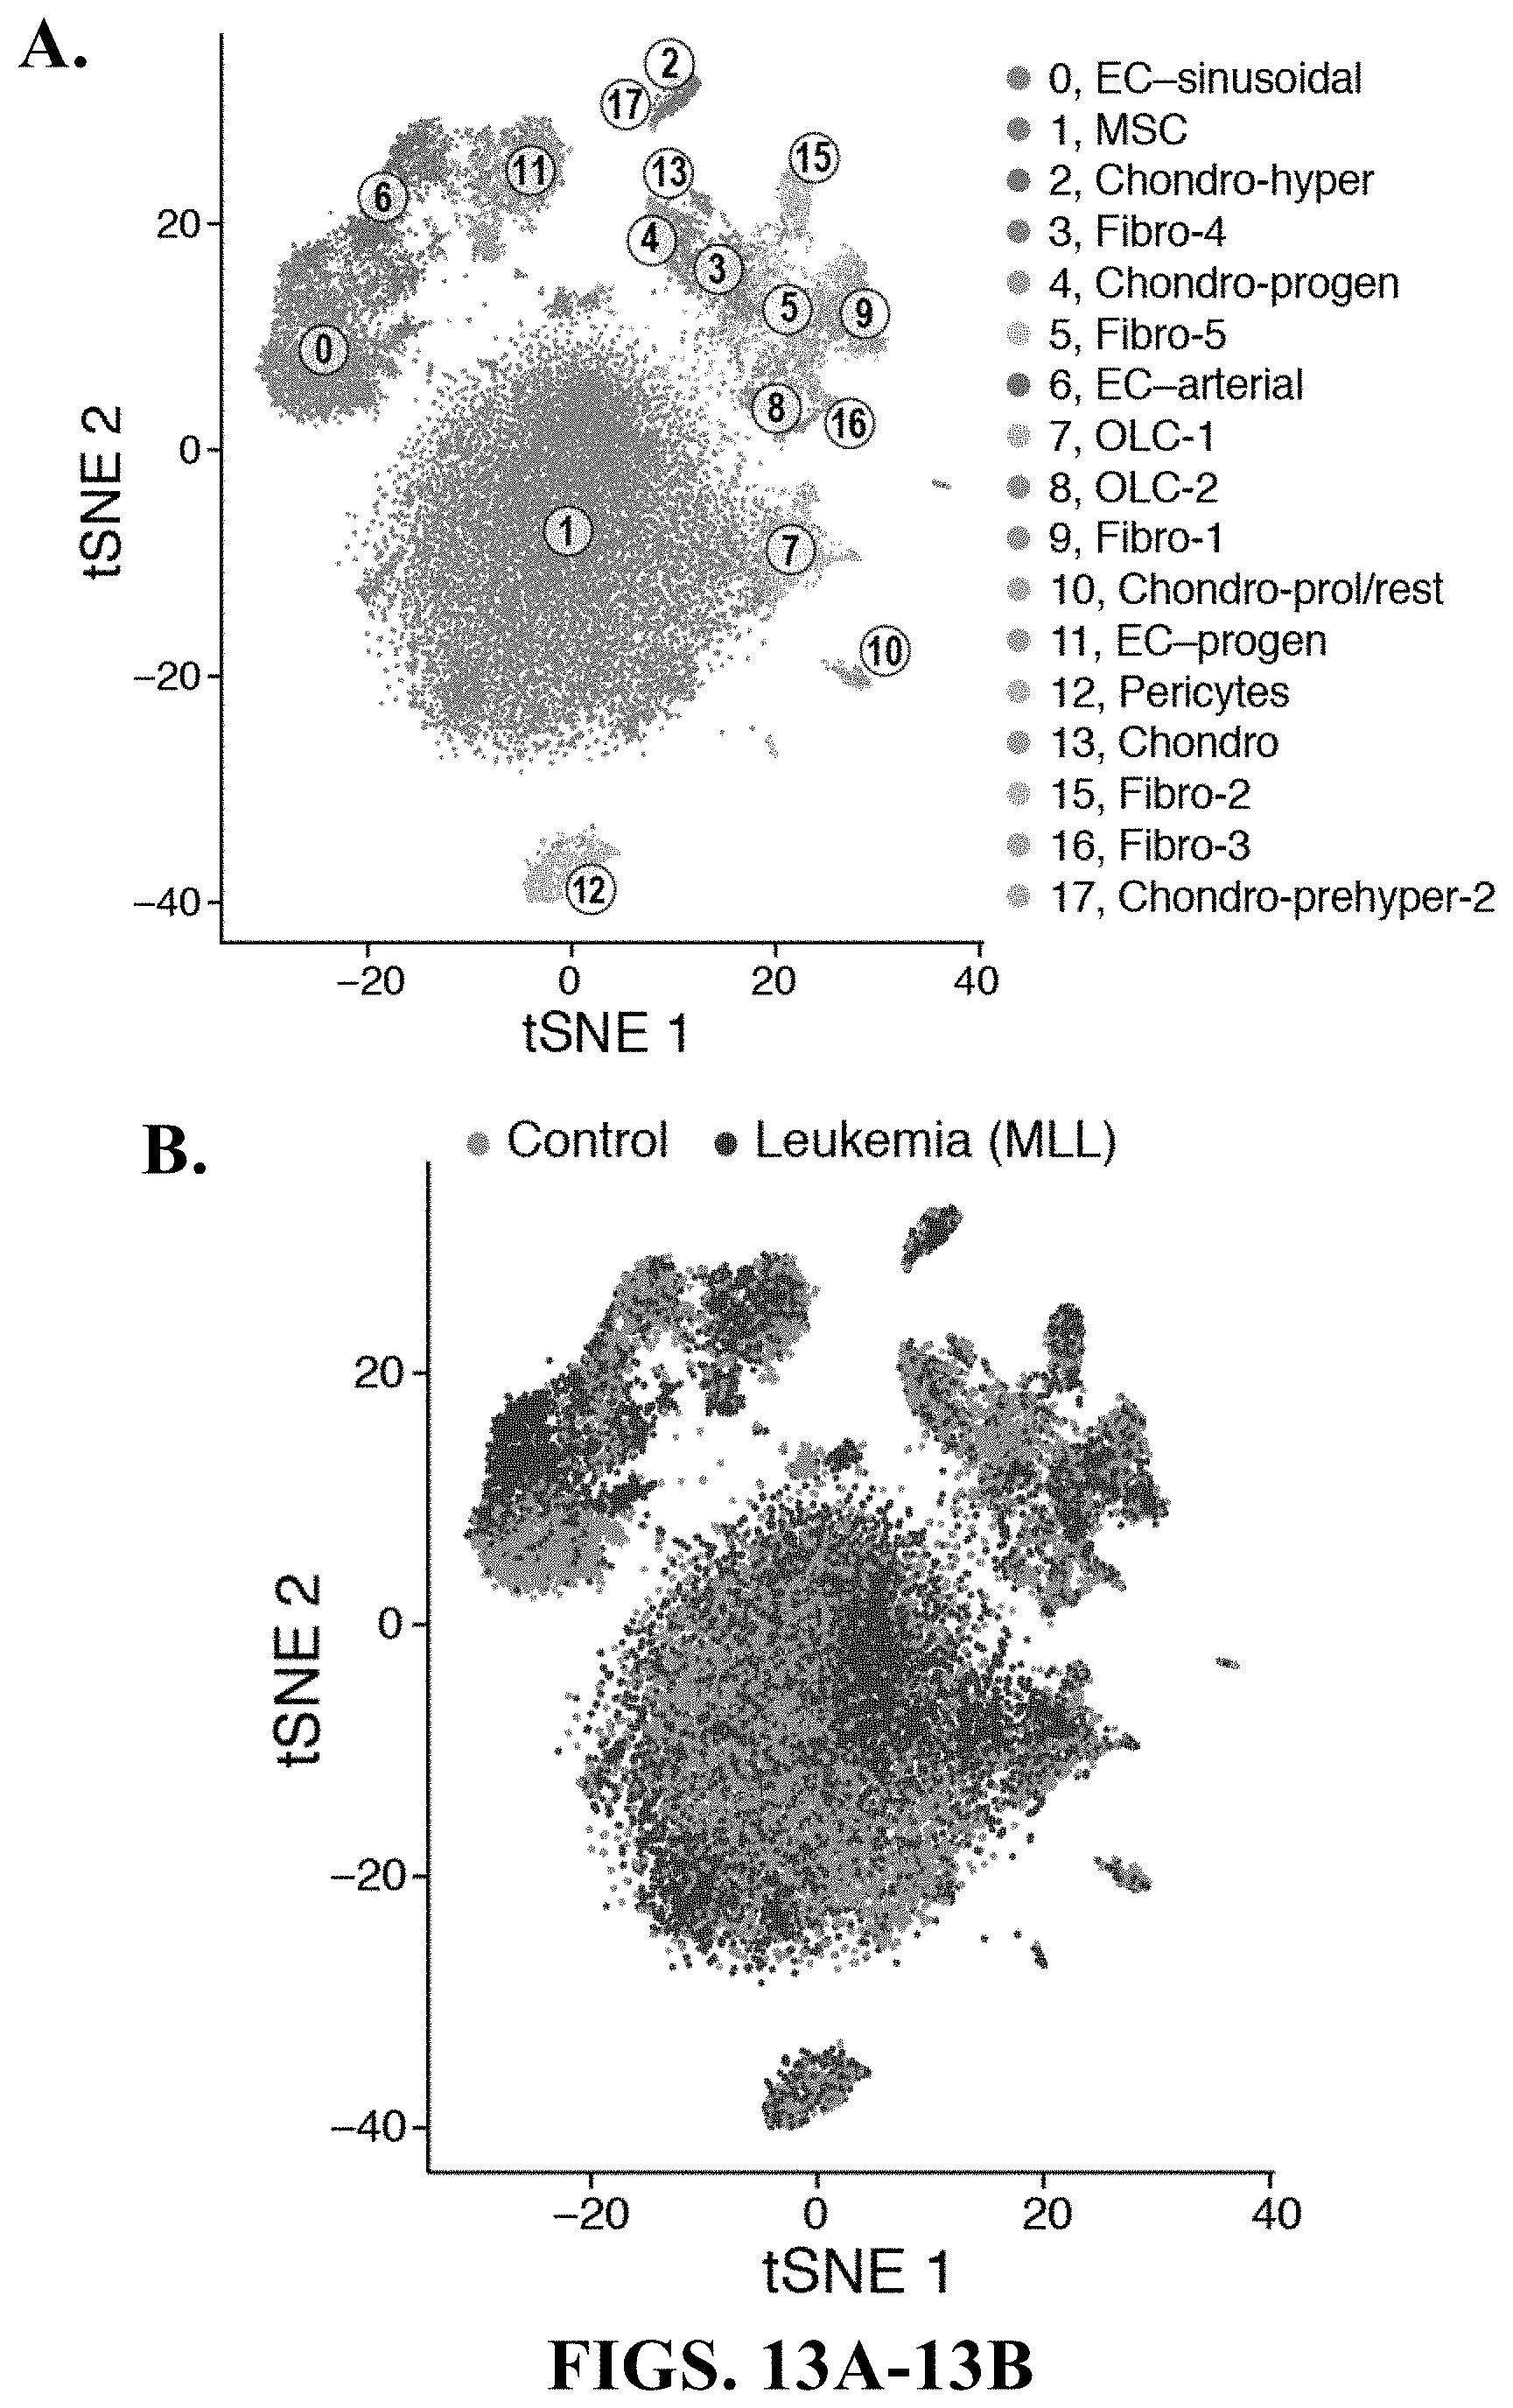
D00069

D00070
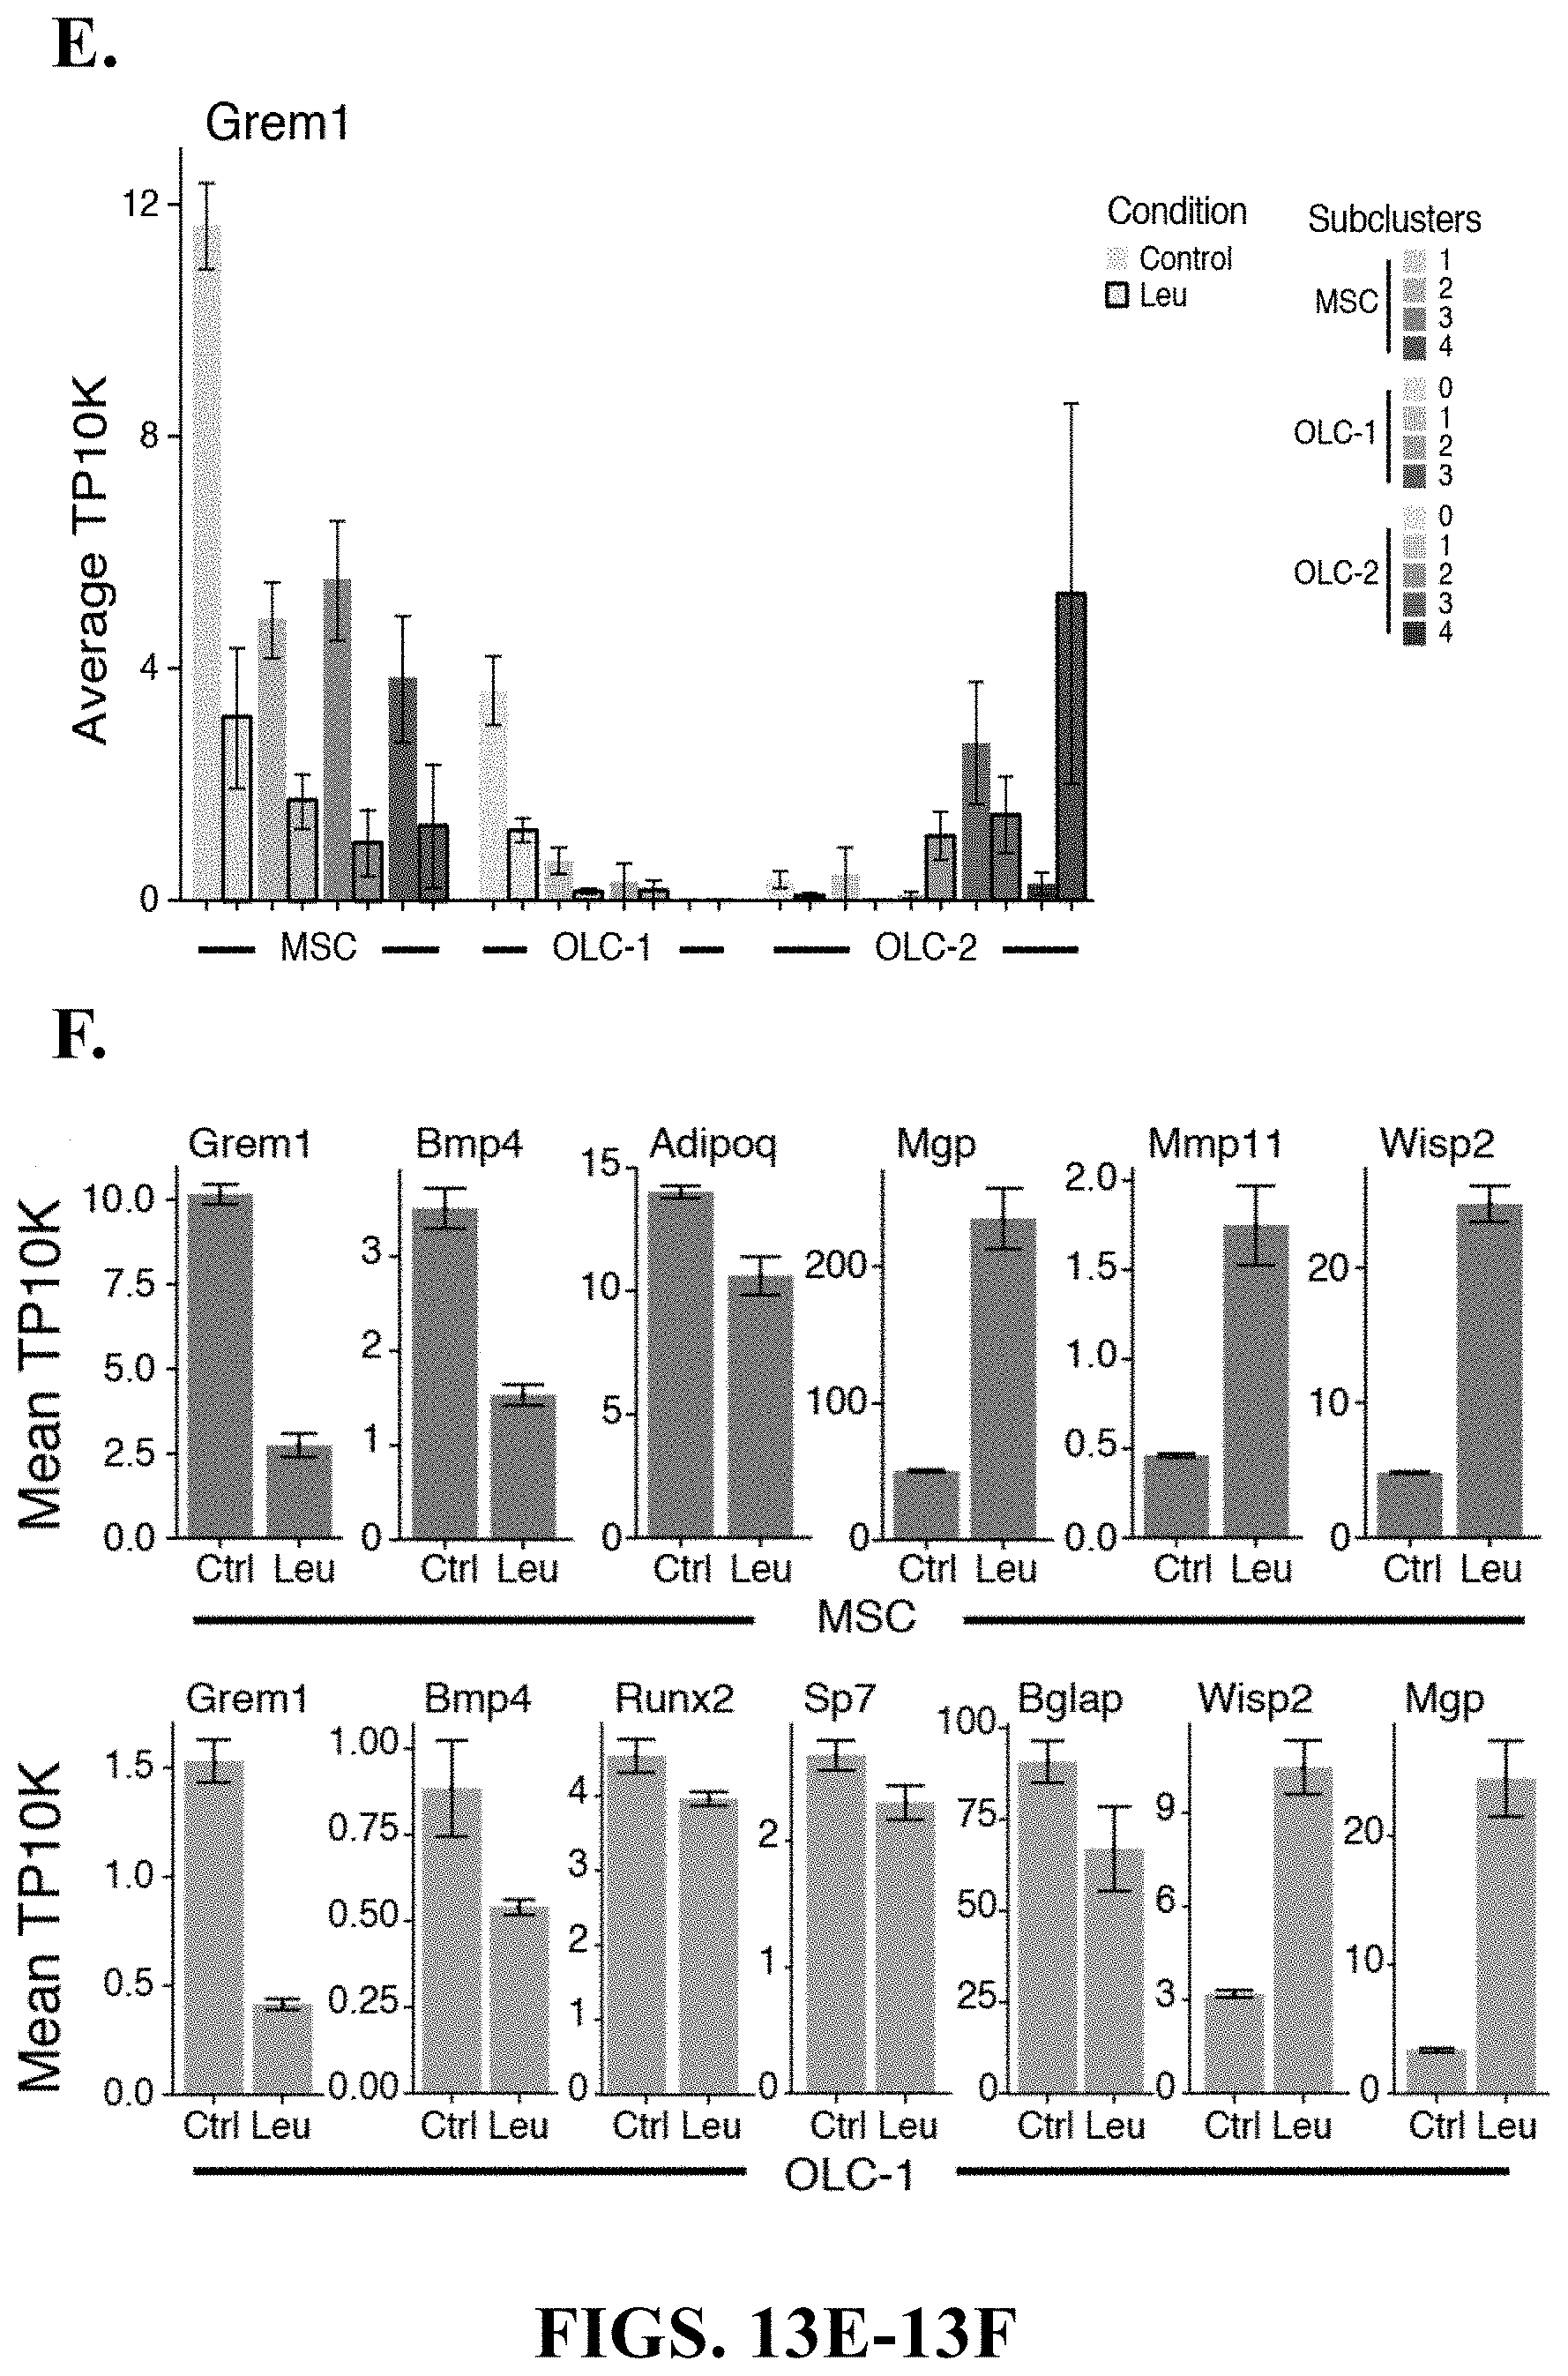
D00071

D00072
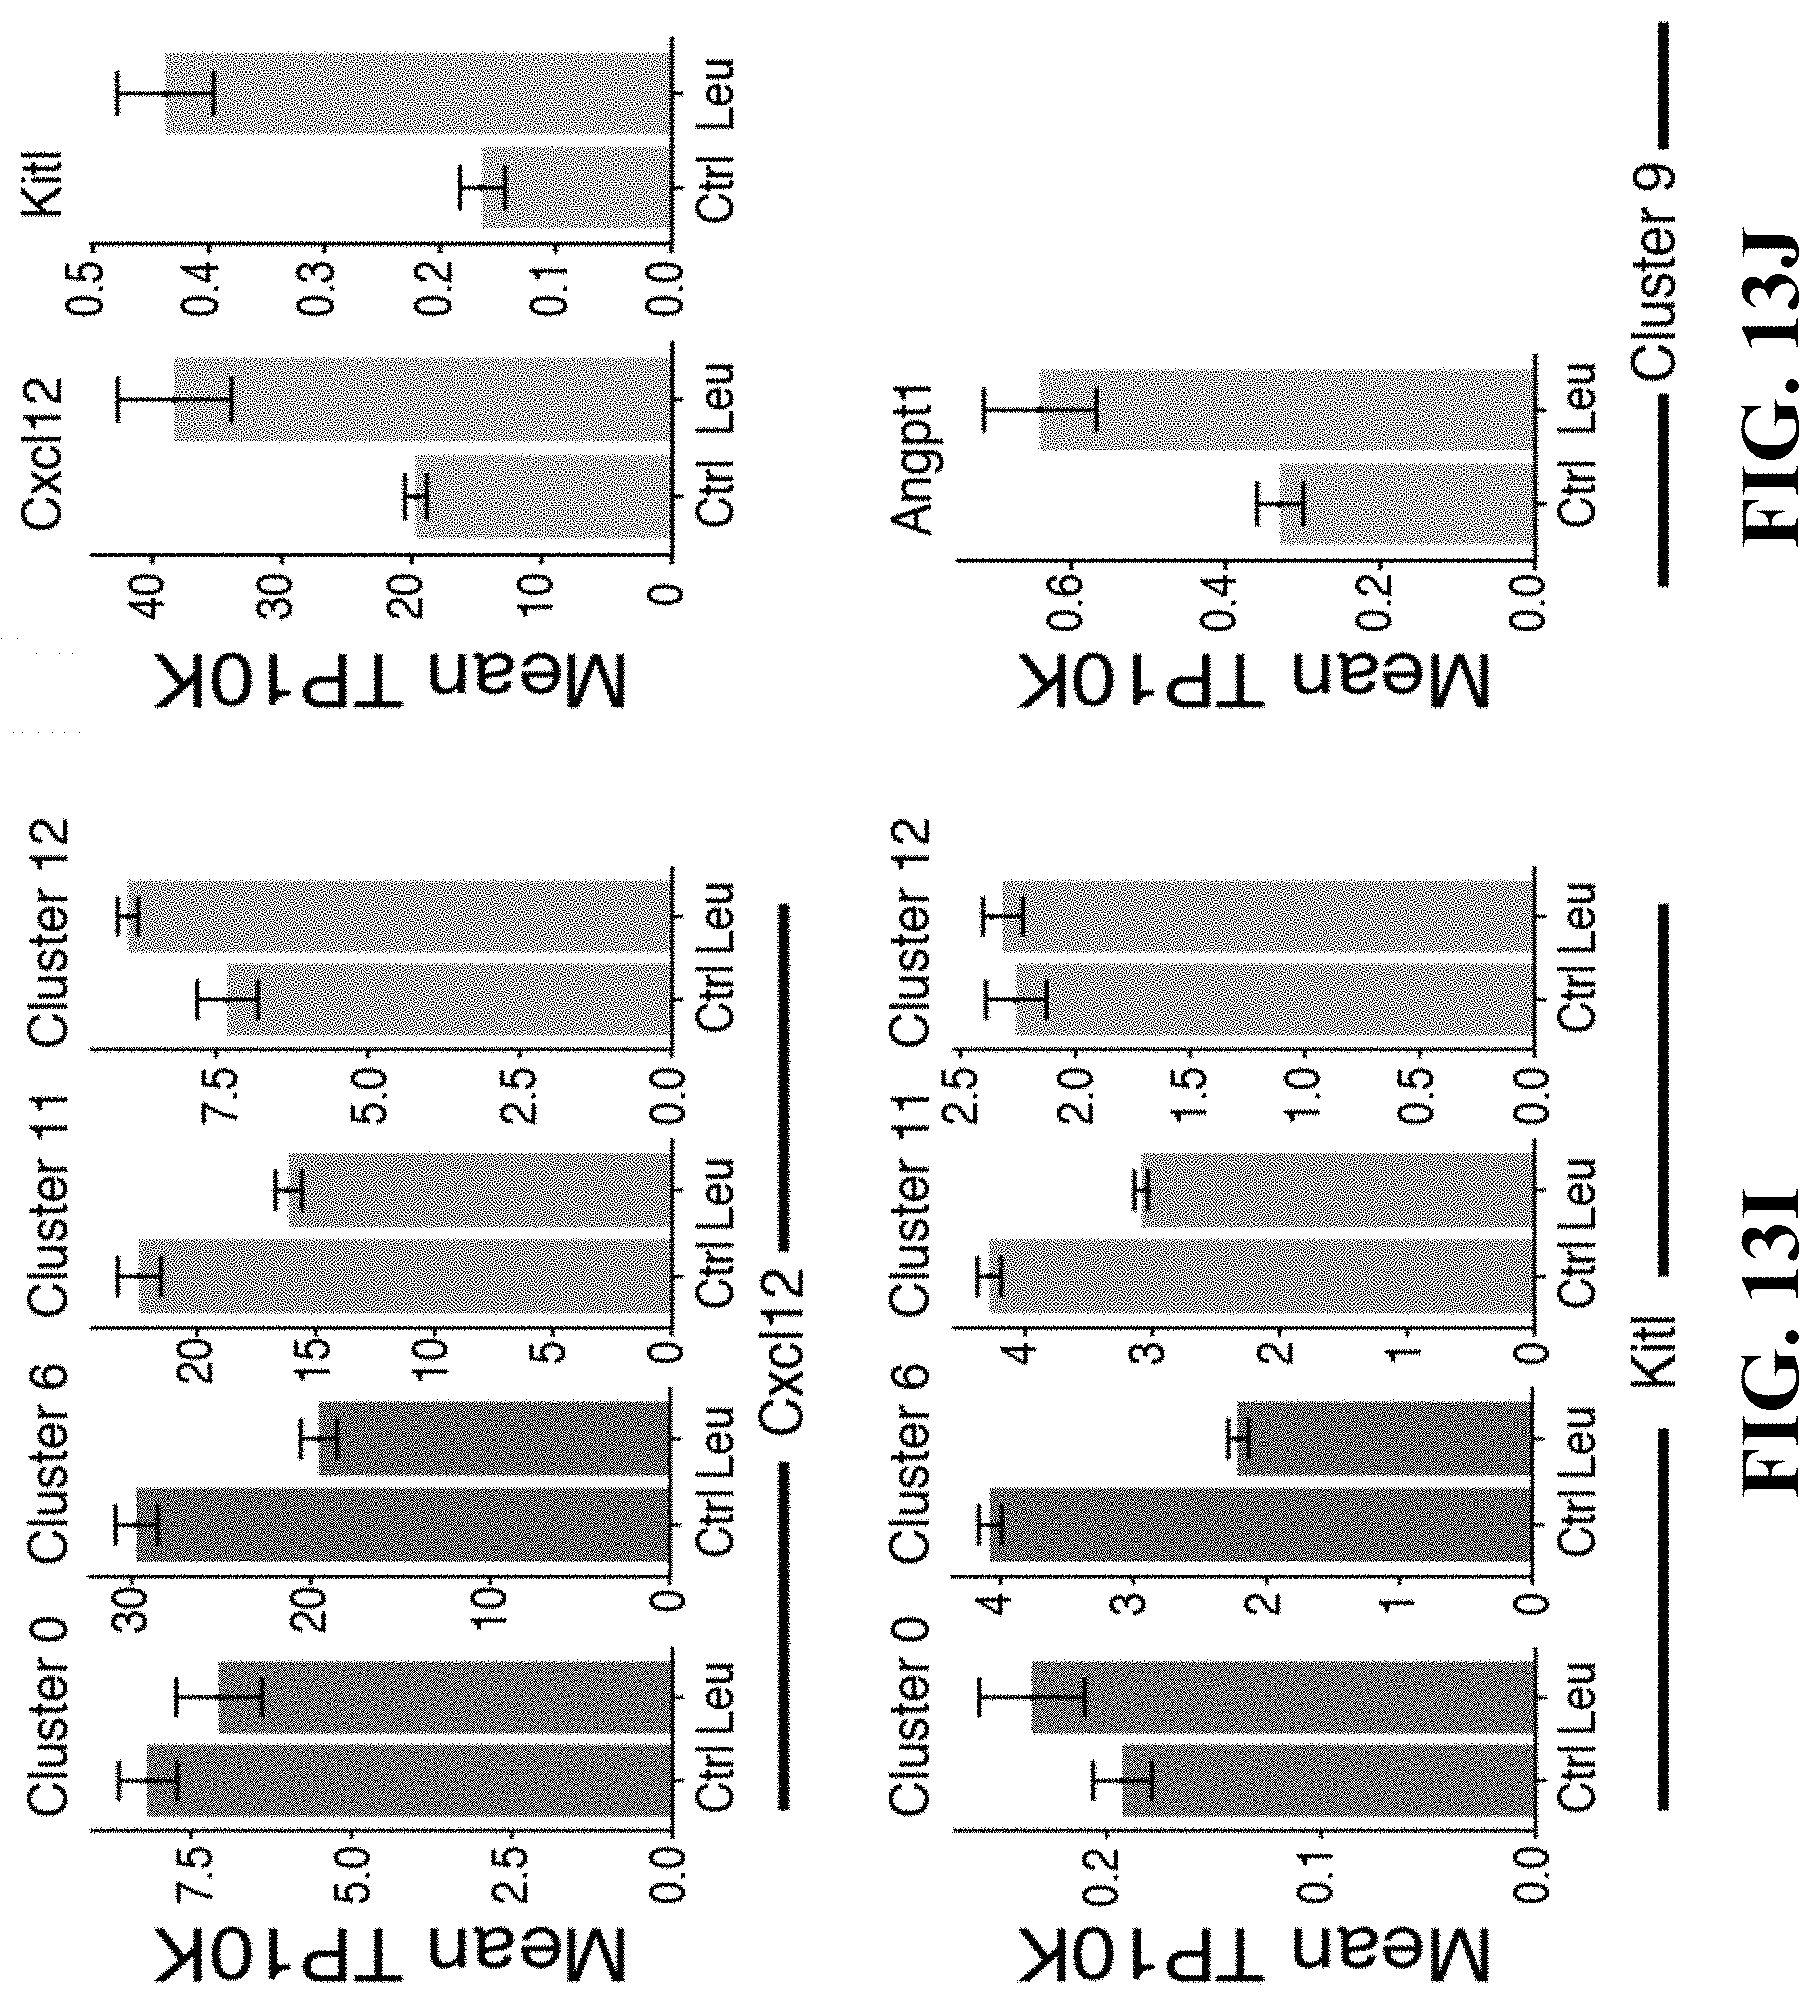
D00073

D00074

D00075

D00076
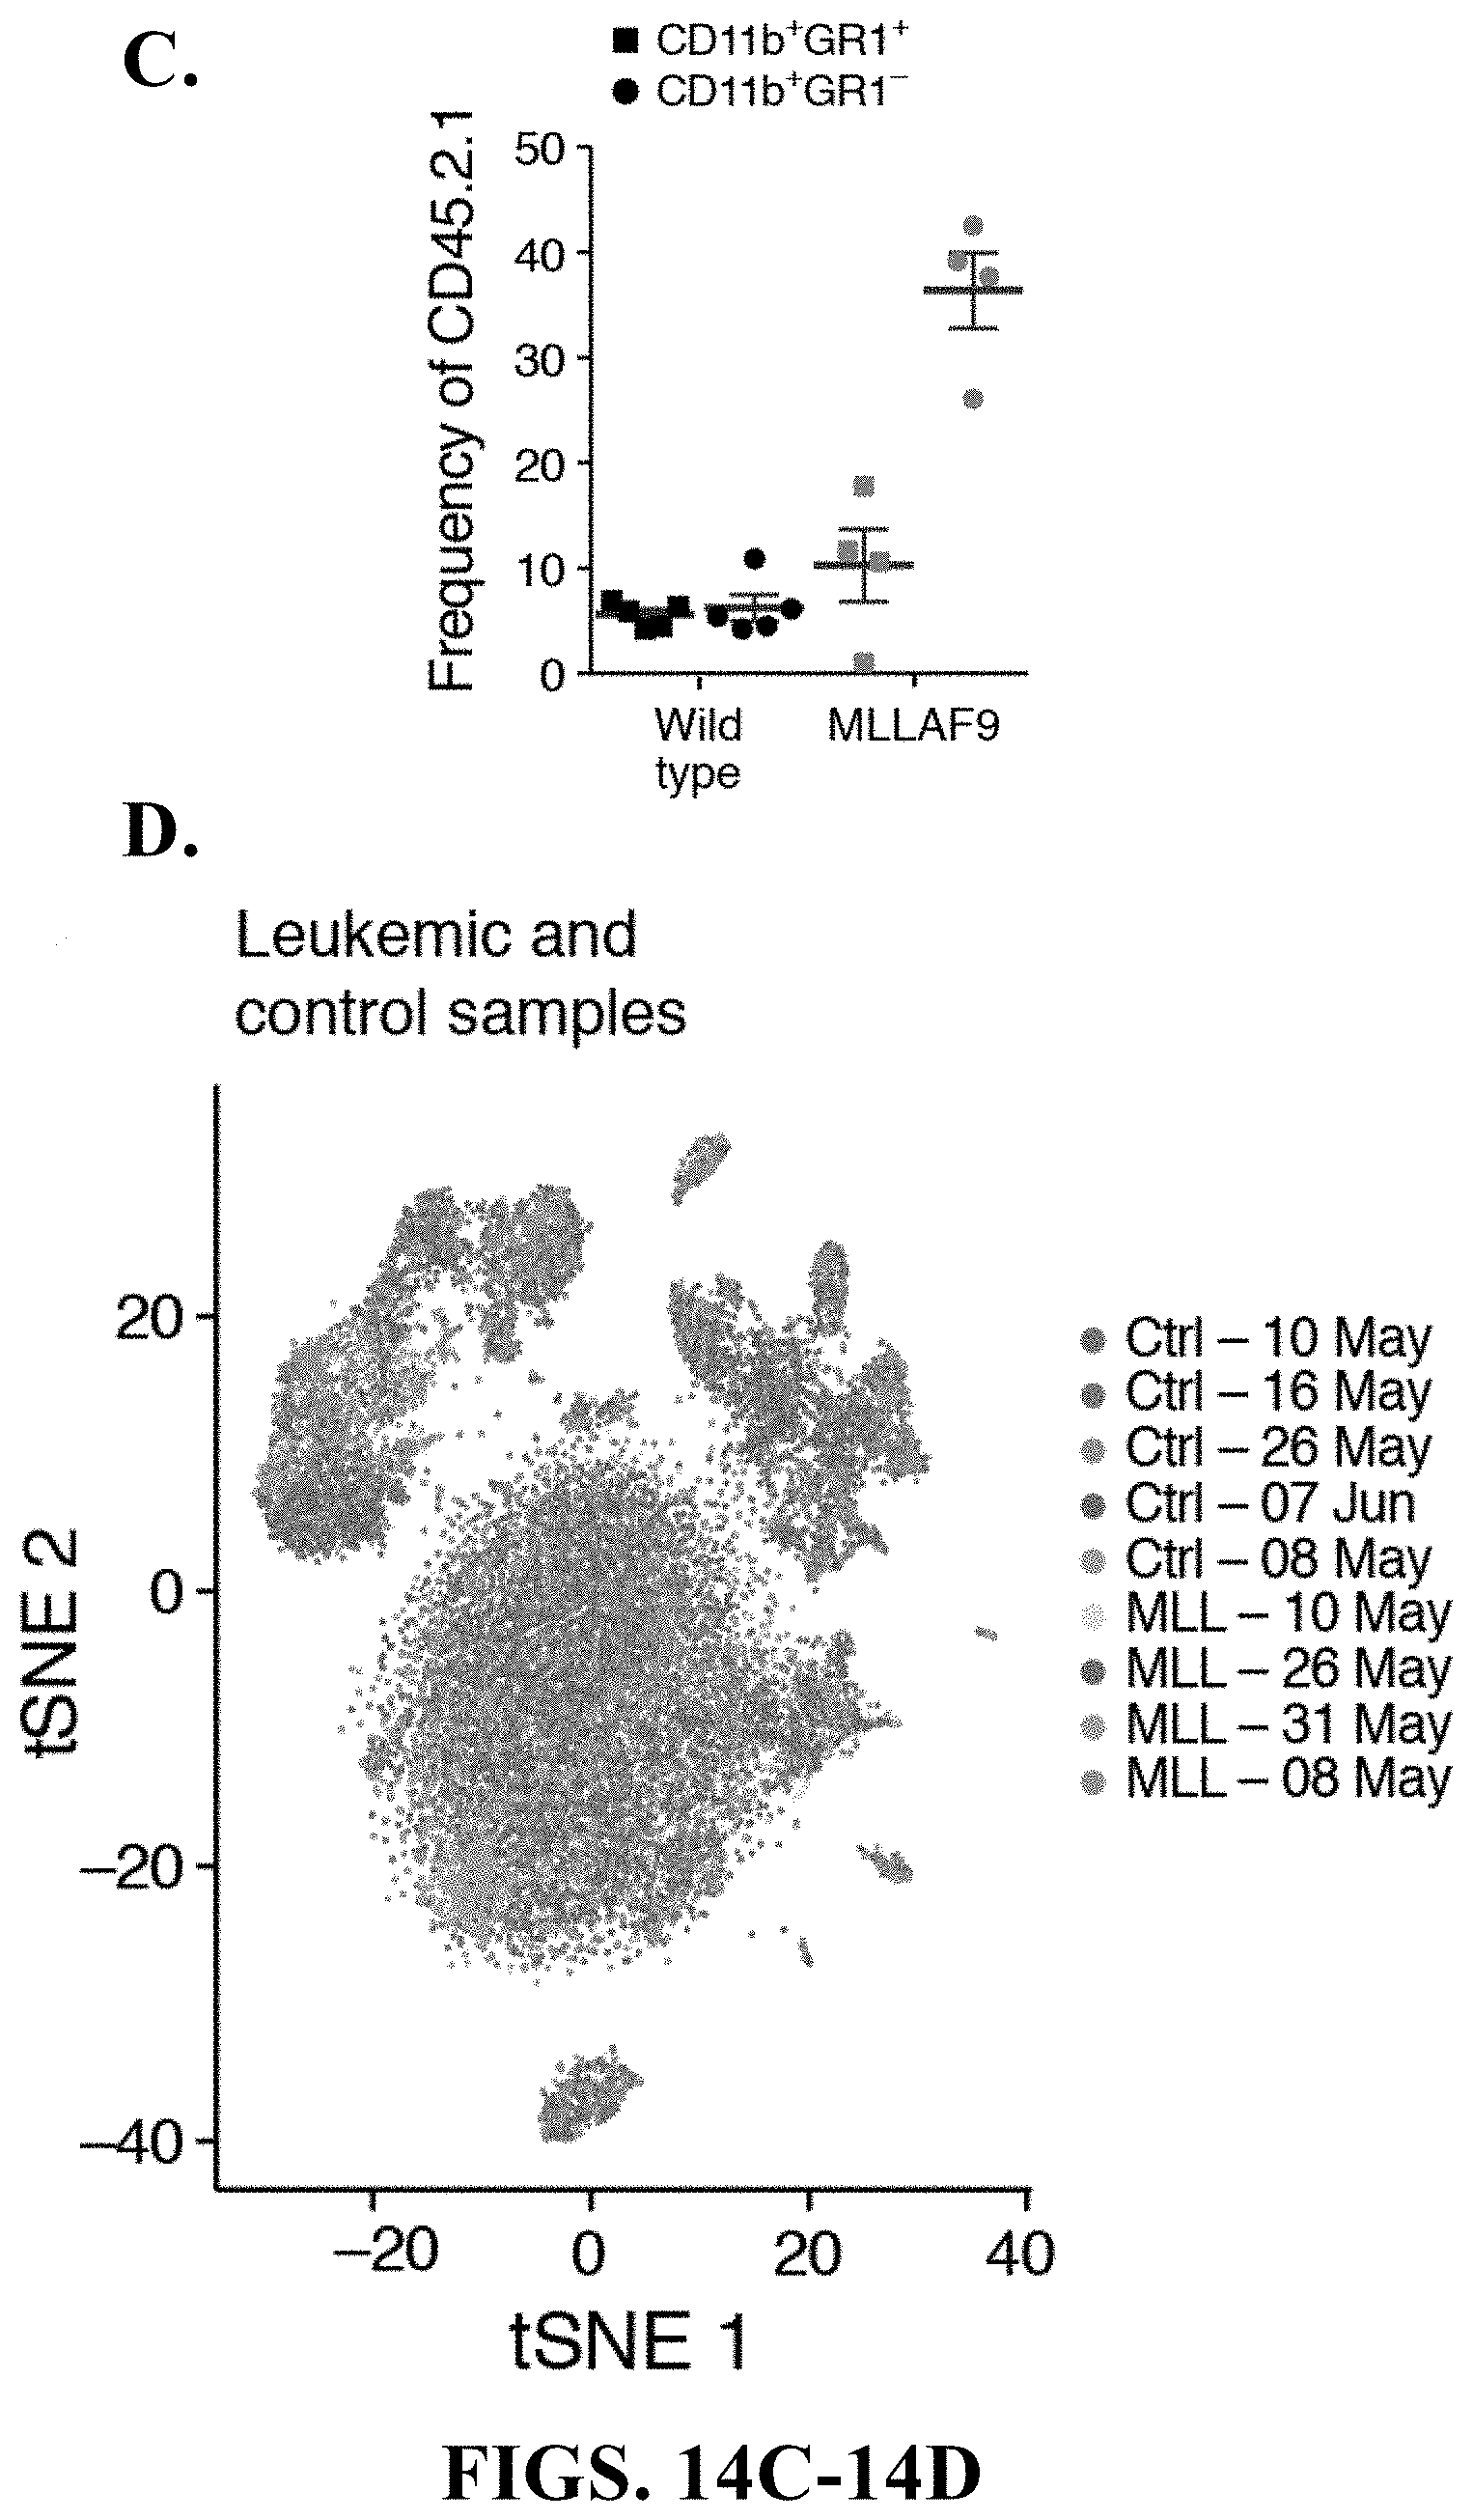
D00077

D00078

D00079

D00080

D00081
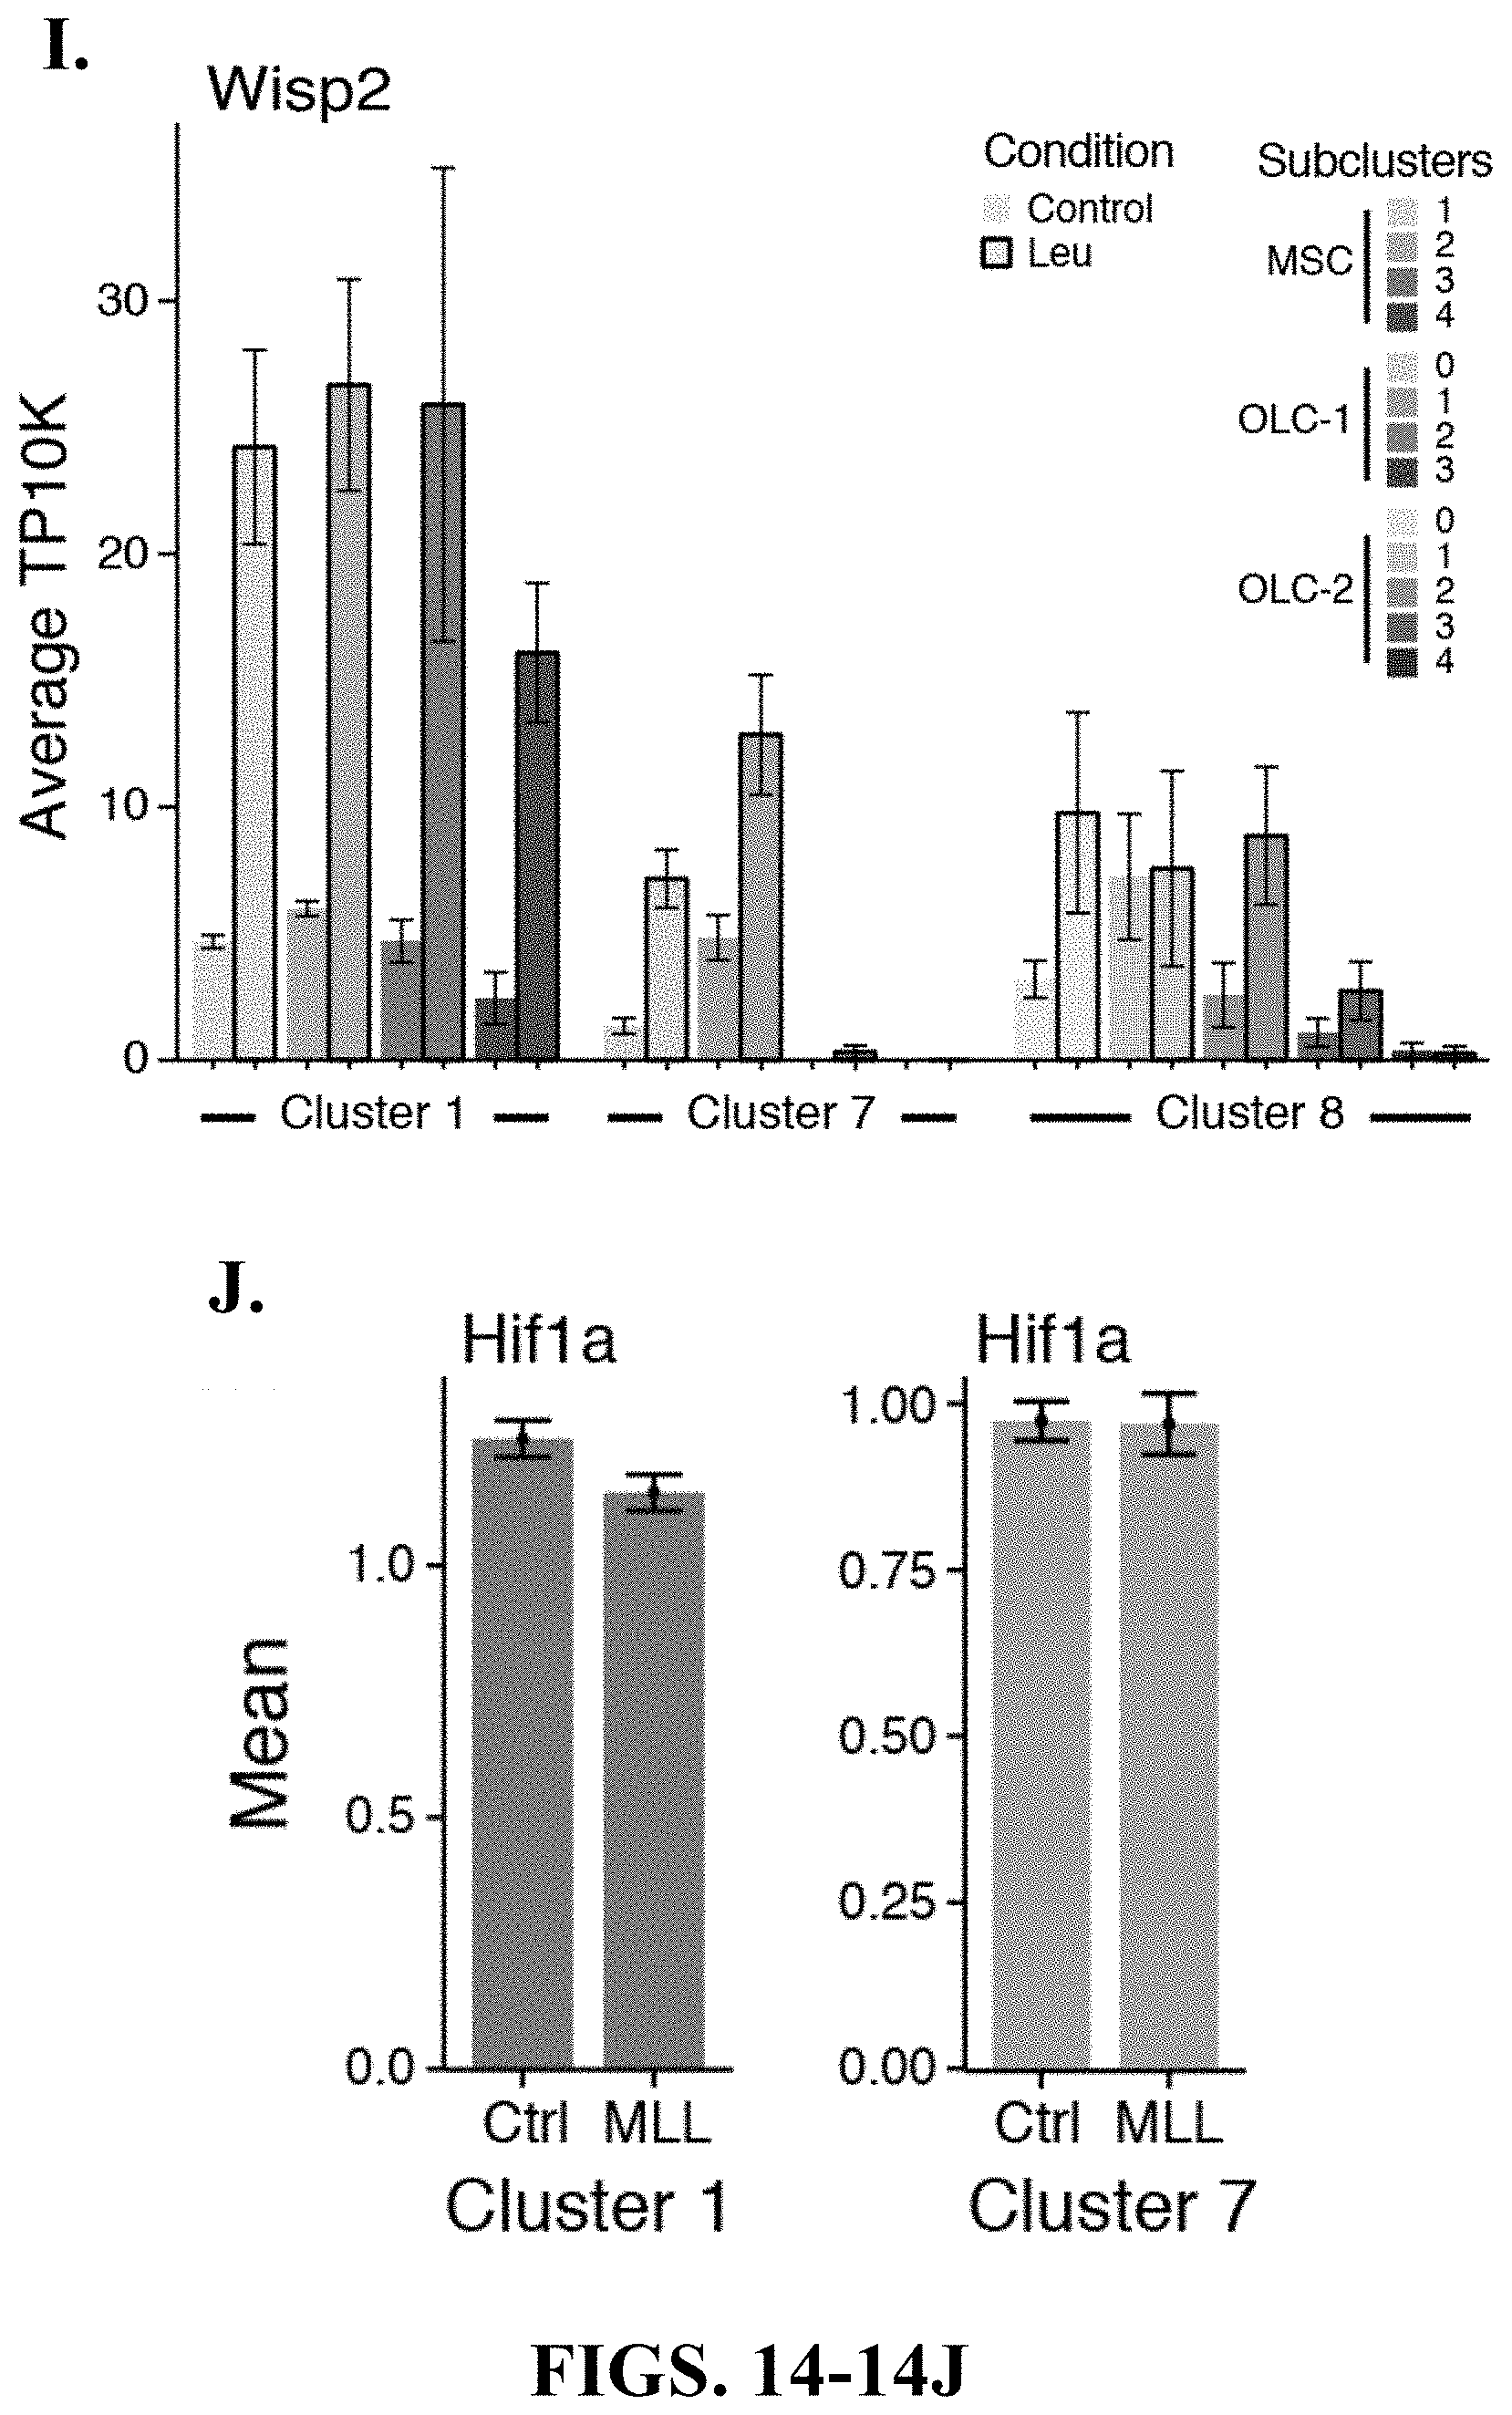


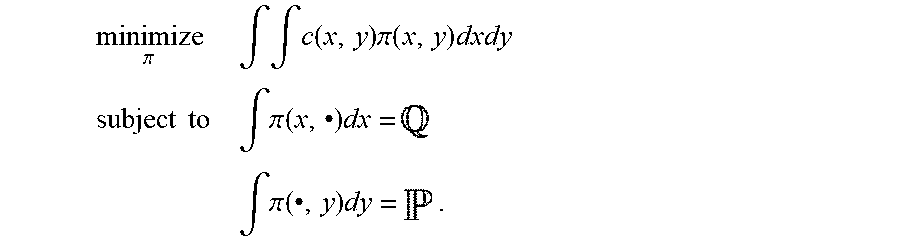


P00001

P00002

P00003

P00004

P00005

P00006

P00007

P00008

P00009

P00010

P00011

P00012

P00013
P00014

P00015

S00001
XML
uspto.report is an independent third-party trademark research tool that is not affiliated, endorsed, or sponsored by the United States Patent and Trademark Office (USPTO) or any other governmental organization. The information provided by uspto.report is based on publicly available data at the time of writing and is intended for informational purposes only.
While we strive to provide accurate and up-to-date information, we do not guarantee the accuracy, completeness, reliability, or suitability of the information displayed on this site. The use of this site is at your own risk. Any reliance you place on such information is therefore strictly at your own risk.
All official trademark data, including owner information, should be verified by visiting the official USPTO website at www.uspto.gov. This site is not intended to replace professional legal advice and should not be used as a substitute for consulting with a legal professional who is knowledgeable about trademark law.