Systems For Indicating Parameters In An Imaging Data Set And Methods Of Use
BEGIN; Elizabeth ; et al.
U.S. patent application number 16/798412 was filed with the patent office on 2020-07-02 for systems for indicating parameters in an imaging data set and methods of use. The applicant listed for this patent is PHILIPS IMAGE GUIDED THERAPY CORPORATION. Invention is credited to Elizabeth BEGIN, Joseph BURNETT, Timothy K. GLYNN, Nathaniel J. KEMP, Anuja NAIR, Jason SPROUL.
| Application Number | 20200205750 16/798412 |
| Document ID | / |
| Family ID | 50433224 |
| Filed Date | 2020-07-02 |


View All Diagrams
| United States Patent Application | 20200205750 |
| Kind Code | A1 |
| BEGIN; Elizabeth ; et al. | July 2, 2020 |
SYSTEMS FOR INDICATING PARAMETERS IN AN IMAGING DATA SET AND METHODS OF USE
Abstract
Systems and methods for aiding users in viewing, assessing and analyzing images, especially images of lumens and medical devices contained within the lumens. Systems and methods for interacting with images of lumens and medical devices, for example through a graphical user interface.
| Inventors: | BEGIN; Elizabeth; (BELLERICA, MA) ; BURNETT; Joseph; (CARLSBAD, CA) ; KEMP; Nathaniel J.; (CONCORD, MA) ; NAIR; Anuja; (SAN DIEGO, CA) ; GLYNN; Timothy K.; (SAN DIEGO, CA) ; SPROUL; Jason; (WATERTOWN, MA) | ||||||||||
| Applicant: |
|
||||||||||
|---|---|---|---|---|---|---|---|---|---|---|---|
| Family ID: | 50433224 | ||||||||||
| Appl. No.: | 16/798412 | ||||||||||
| Filed: | February 23, 2020 |
Related U.S. Patent Documents
| Application Number | Filing Date | Patent Number | ||
|---|---|---|---|---|
| 14044987 | Oct 3, 2013 | 10568586 | ||
| 16798412 | ||||
| 61710419 | Oct 5, 2012 | |||
| Current U.S. Class: | 1/1 |
| Current CPC Class: | A61B 5/021 20130101; G01R 33/5608 20130101; G06T 19/20 20130101; A61B 5/7455 20130101; A61B 8/483 20130101; A61B 5/0095 20130101; A61B 8/14 20130101; A61B 5/7475 20130101; G06T 2210/41 20130101; A61B 8/12 20130101; A61B 5/0066 20130101; A61B 5/0261 20130101; A61B 6/504 20130101; G01R 33/4814 20130101; A61B 8/4416 20130101; A61B 5/743 20130101; A61B 8/465 20130101; A61B 5/02007 20130101; A61B 5/0263 20130101; A61B 5/7435 20130101; A61B 5/746 20130101; A61B 8/0841 20130101; A61B 5/0035 20130101; A61B 5/066 20130101; A61F 2/82 20130101; G06T 2219/2012 20130101; G01R 33/285 20130101; A61B 8/5261 20130101; G16H 50/30 20180101; G06T 11/001 20130101; A61B 5/489 20130101; A61B 6/12 20130101; A61B 8/466 20130101; A61B 8/5223 20130101 |
| International Class: | A61B 5/00 20060101 A61B005/00; A61B 8/12 20060101 A61B008/12; A61B 8/08 20060101 A61B008/08; A61B 6/00 20060101 A61B006/00; G01R 33/28 20060101 G01R033/28; A61B 6/12 20060101 A61B006/12; A61B 5/02 20060101 A61B005/02; A61B 5/021 20060101 A61B005/021; A61F 2/82 20060101 A61F002/82; A61B 5/06 20060101 A61B005/06; A61B 8/00 20060101 A61B008/00; G06T 11/00 20060101 G06T011/00; G06T 19/20 20060101 G06T019/20 |
Claims
1. An intravascular imaging system, comprising: an intravascular imaging catheter configured to be positioned within a lumen of a blood vessel and obtain imaging data of a wall of the blood vessel and a stent surrounding the lumen; and a processor configured to: receive the imaging data obtained by the intravascular imaging catheter; identify a first portion of the imaging data representative of the wall of the blood vessel; identify a second portion of the imaging data representative of the stent; determine, based on the first and second portions of the imaging data, an apposition value of the stent relative to the wall of the blood vessel for each of a plurality of locations of the stent; and output, to a display in communication with the processor, a graphical representation indicating the apposition value for each of the plurality of locations of the stent.
2. The system of claim 1, wherein the intravascular imaging catheter comprises an IVUS imaging catheter.
3. The system of claim 1, wherein the processor is configured to: determine, based on the first portion of the imaging data, a first radial distance of the wall of the lumen; determine, based on the second portion of the imaging data, a second radial distance of a back edge of the stent; determine the apposition value based on a subtraction of the first radial distance from the second radial distance.
4. The system of claim 1, wherein the graphical representation comprises at least one of a callout marker, a gauge, or a numerical indicator.
5. The system of claim 1, wherein the graphical representation includes an image of the stent.
6. The system of claim 5, wherein the image of the stent is a two-dimensional image.
7. The system of claim 5, wherein the image of the stent is a three-dimensional image.
8. The system of claim 5, wherein the image of the stent is representative of the wall of the lumen and the stent positioned on the wall of the lumen.
9. The system of claim 8, wherein different portions of the stent are given different visual characteristics in the image based on a corresponding apposition value for each of the different portions.
10. The system of claim 9, wherein the different visual characteristics comprise different colors.
11. The system of claim 8, wherein the processor is configured to: receive an input from a user interface device indicating an area of the image to be processed to determine the apposition value; and determine the stent apposition for the area based on the received input.
12. The system of claim 11, wherein the input indicates a proximal boundary and a distal boundary of the area of the image to be processed.
13. The system of claim 11, wherein the graphical representation includes an indicator of the area on the image.
Description
STATEMENT OF RELATED APPLICATIONS
[0001] This application is a continuation of U.S. application Ser. No. 14/044,987, filed Oct. 3, 2013, now U.S. Pat. No. 10,568,586, which claims priority to U.S. Provisional Patent Application No. 61/710,419, filed Oct. 5, 2012, each of which is incorporated herein by reference in their entirety.
FIELD OF THE INVENTION
[0002] The invention generally relates to systems for indicating parameters in an imaging data set, for example, an imaging data set relating to a medical device or a biological lumen.
BACKGROUND
[0003] Tomographic imaging is a signal acquisition and processing technology that allows for high-resolution cross-sectional imaging in biological systems. Tomographic imaging systems include, for example, optical coherence tomography systems, ultrasound imaging systems, and computed tomography. Tomographic imaging is particularly well-suited for imaging the subsurface of a vessel or lumen within the body, such as a blood vessel, using probes disposed within a catheter through a minimally invasive procedure.
[0004] Typical tomographic imaging catheters consist of an imaging core that rotates and moves longitudinally through a blood vessel, while recording an image video loop of the vessel. The motion results in a 3D dataset, where each frame provides a 360 degree slice of the vessel at different longitudinal section. These frames provide cardiologists with invaluable information such as the location and severity of the stenosis in a patient, the presence of vulnerable plaques, and changes in cardiovascular disease over time. The information also assists in determining the appropriate treatment plan for the patient, such as drug therapy, stent placement, angioplasty, bypass surgery, valve replacement, etc.
[0005] Generally, to graphically analyze tomographic images, a clinician scrolls through a series of image frames and manually performs various measurements on the anatomical structure of interest. In some instances, a computational algorithm is also used to calculate various anatomical measurements and display their numerical values to an image display screen. While the numerical output provides useful information, it is time consuming to evaluate and compare a large data set of tomographic images by scrolling through frames of images. The extended periods of scrutiny also lead to mental fatigue, and in turn, may lead to observer error.
[0006] In addition to evaluating vasculature, tomographic imagining may also be used to place or evaluate vascular stents. A stent is a small, tube-like structure made of a metal or polymer that is inserted into a blood vessel to hold the vessel open and keep it from occluding blood flow. A stent can also be used to reinforce an area of a vessel where the wall tissues are thin or calcification has formed. Typically, a stent is placed with a balloon catheter after the vessel has been imaged.
[0007] There are several risks associated with stent placement, however. For example, the stent can cause vascular lesions that may later embolize (dislodge and block vasculature). To avoid lesions, the stent should be placed in parallel within the vessel and the stent should uniformly contact the vessel wall during deployment. Additionally, it is critical that there is no dead space between the stent and the vessel wall because of a risk of a subsequent blockage or thrombus because of blood pooling or clotting between the stent and the vessel wall. (A stent that has been placed with gaps between the stent and the vessel wall is said to be in "incomplete apposition.") Therefore, it is critical to verify that the stent is properly placed.
[0008] When tomographic imaging is used to evaluate a stent (or other medical device) many of the same issues arise with respect to overwhelming sets of images and fatigue related to processing the images. In addition, it can be difficult to immediately discern problematic placement of a medical device because of the visual similarity between a properly and improperly placed device when the images are displayed on a computer monitor, for example.
SUMMARY OF THE INVENTION
[0009] The invention generally provides systems and methods for helping health care providers visualize important parameters in a medical image. The user is provided with an enhanced graphical display of images defining biological lumens and/or medical devices resulting from anatomical measurements. A variety of important parameters can be emphasized through the use of visual, audio, or tactile displays or alerts. In some instances, the imaging data sets will have been obtained from optical coherence tomography or ultrasound measurements. For even greater analysis, interaction with the images will prompt the display of additional, relevant images with greater detail. Accordingly, methods of the invention will speed review of the image data sets by allowing a provider to more quickly synthesize the data and focus on areas of concern. Additionally, displaying images with relevant indicators and the use of alerts will reduce the potential for error during clinical evaluation.
[0010] The invention includes systems and methods for aiding a user in analyzing an imaging data set relating to a medical device and a biological structure defining a lumen. The system comprises a monitor to display an image, a central processing unit (CPU), and storage coupled to the CPU for storing instructions to carry out the methods of the invention. Typically, the instructions configure the CPU to analyze the imaging data set for a parameter, assign an indicator to the medical device based on the presence of the parameter, and display the indicator. In some embodiments, the indicator is a color. The parameter may relate to any of a number of conditions or concerns that could be evaluated with the information contained in the imaging data set. For example, the parameter might be diameter of a vessel, area of a vessel lumen, thickness of a vessel lumen wall, plaque burden, vessel remodeling index, tissue type, size of a thrombus, location of a thrombus, blood flow, blood pressure, fluid dynamic measurement, stent type, stent apposition, stent coverage, stent fracture, or stent placement. The medical device may be a stent, a pacemaker, a prosthetic valve, a graft, and implant, a sterilization device, a catheter, or an electrode.
[0011] The invention is applicable to imaging data sets from devices that produce two dimensional data sets from which three dimensional image compositions are derived, for example optical coherence tomography, intravascular ultrasound, co-registered optical coherence tomography and intravascular ultrasound, co-registered optical coherence tomography and angioscopy, co-registered intravascular ultrasound and angioscopy, spectroscopy, photoacoustic tomography, intravascular magnetic resonance imaging, angioscopy, or combinations thereof.
[0012] The invention additionally includes systems and methods to aid a user in assessing an imaging data set relating to a lumen of a biological structure. The system comprises a monitor to display an image, a central processing unit (CPU), and storage coupled to the CPU for storing instructions to carry out the methods of the invention. Typically, the instructions configure the CPU to analyze the imaging data set for a parameter, display an image associated with the imaging data set on the monitor, provide the user with a graphical user interface (GUI) on the monitor, and activate an alert when the user interacts with the displayed image or a portion of the displayed image and the parameter is at or beyond a threshold value. The alert may be a visual alert, an audio alert, a haptic alert, a dynamic gauge indicator alert, or a combination thereof. In some embodiments the visual alert is a color-coded indicator, a pulsating indicator, a color map of the image parameter, an altered-sized image, an altered-sized parameter encoded in an image, a gauge, a callout marker, or combinations thereof. In some embodiments, the user is provided with a dynamic graphical icon based on the parameter.
[0013] In other aspects the instructions may configure the CPU to analyze the imaging data set for a plurality of values of a parameter, display on the monitor a first intraluminal image having indicators corresponding to the values of the parameter, provide the user with a graphical user interface (GUI) on the monitor, and display a value of the parameter when the user interacts with the intraluminal image. Alternatively or additionally, when the user interacts with the first intraluminal image the system may display a second intraluminal image. In an embodiment, the first intraluminal image is a 3D representation of a lumen and the second intraluminal image is a cross-sectional view of the lumen.
BRIEF DESCRIPTION OF FIGURES
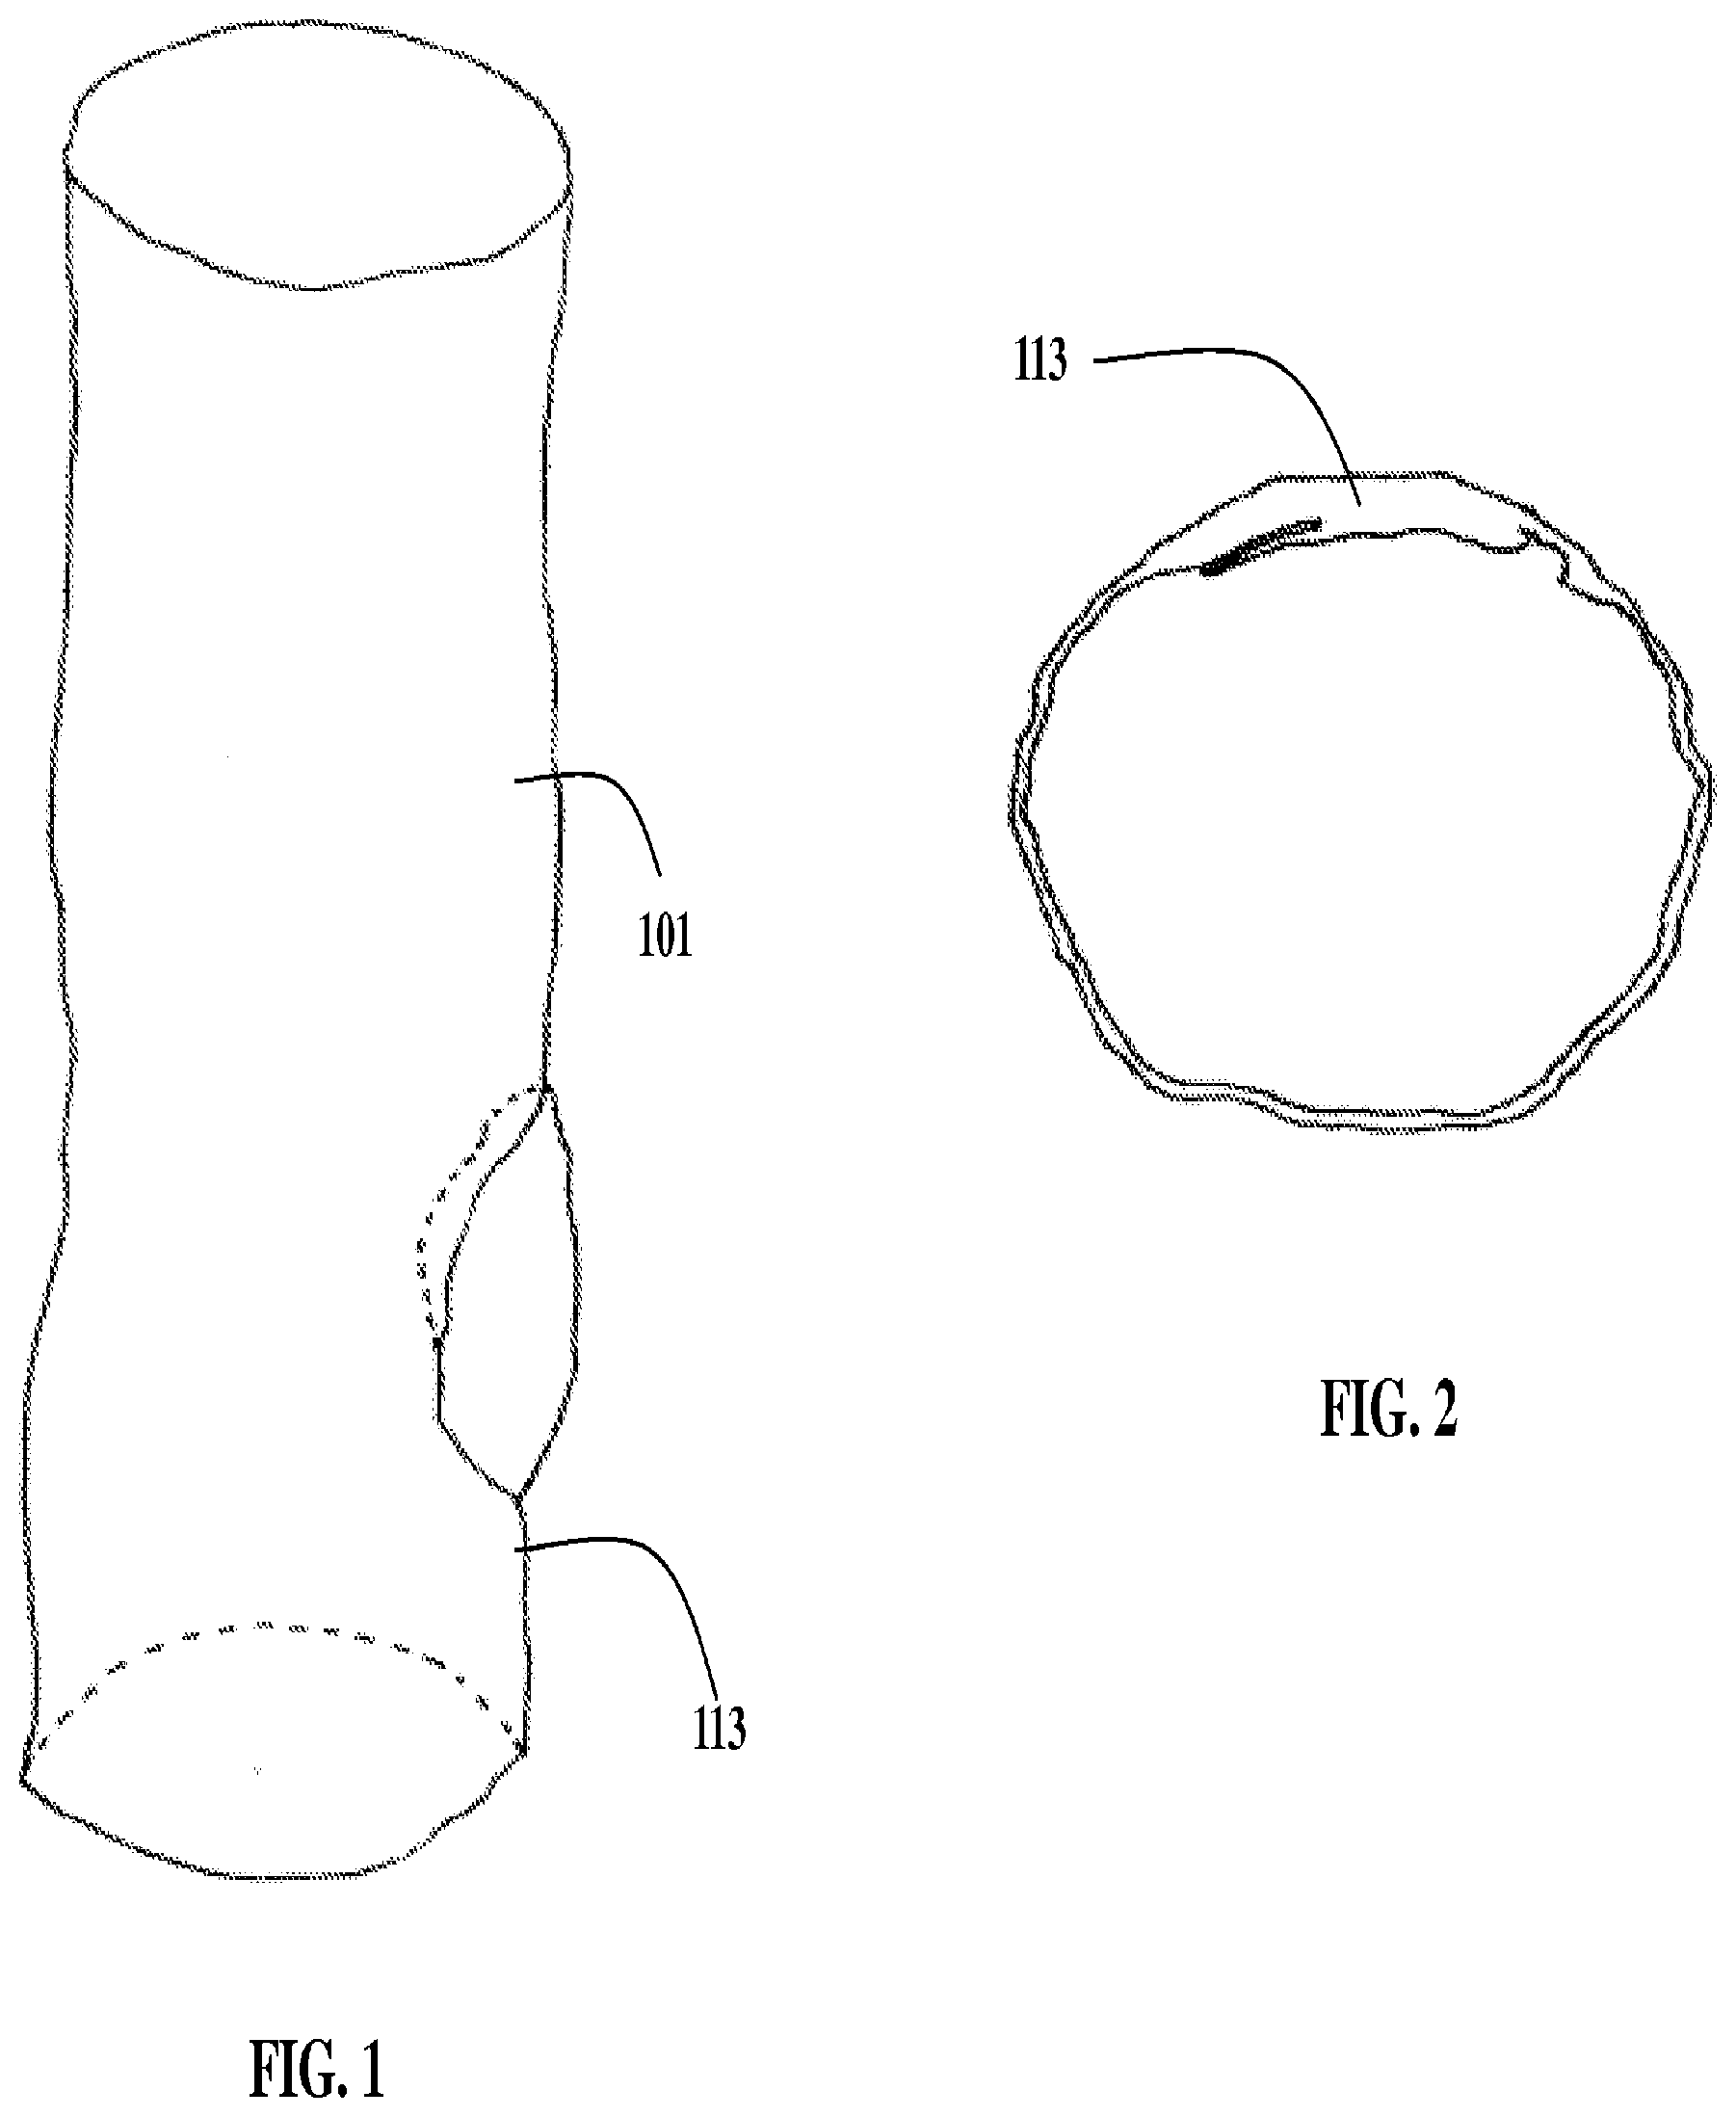
[0014] FIG. 1 is a perspective view of a vessel.
[0015] FIG. 2 is a cross-sectional view of the vessel shown in FIG. 1.
[0016] FIG. 3 is a diagram of components of an optical coherence tomography (OCT) system.
[0017] FIG. 4 is a diagram of the imaging engine shown in FIG. 3.
[0018] FIG. 5 is a diagram of a light path in an OCT system of certain embodiments of the invention.
[0019] FIG. 6 is a patient interface module of an OCT system.
[0020] FIG. 7 is an illustration of the motion of parts of an imaging catheter according to certain embodiments of the invention.
[0021] FIG. 8 shows an array of A-scan lines of a three-dimensional imaging system according to certain embodiments of the invention.
[0022] FIG. 9 shows the positioning of A-scans within a vessel.
[0023] FIG. 10 illustrates a set of A-scans used to compose a B-scan according to certain embodiments of the invention.
[0024] FIG. 11 shows the set of A-scans shown in FIG. 10 within a cross section of a vessel.
[0025] FIG. 12 shows an OCT polar coordinate B-Scan with 660 A-scans.
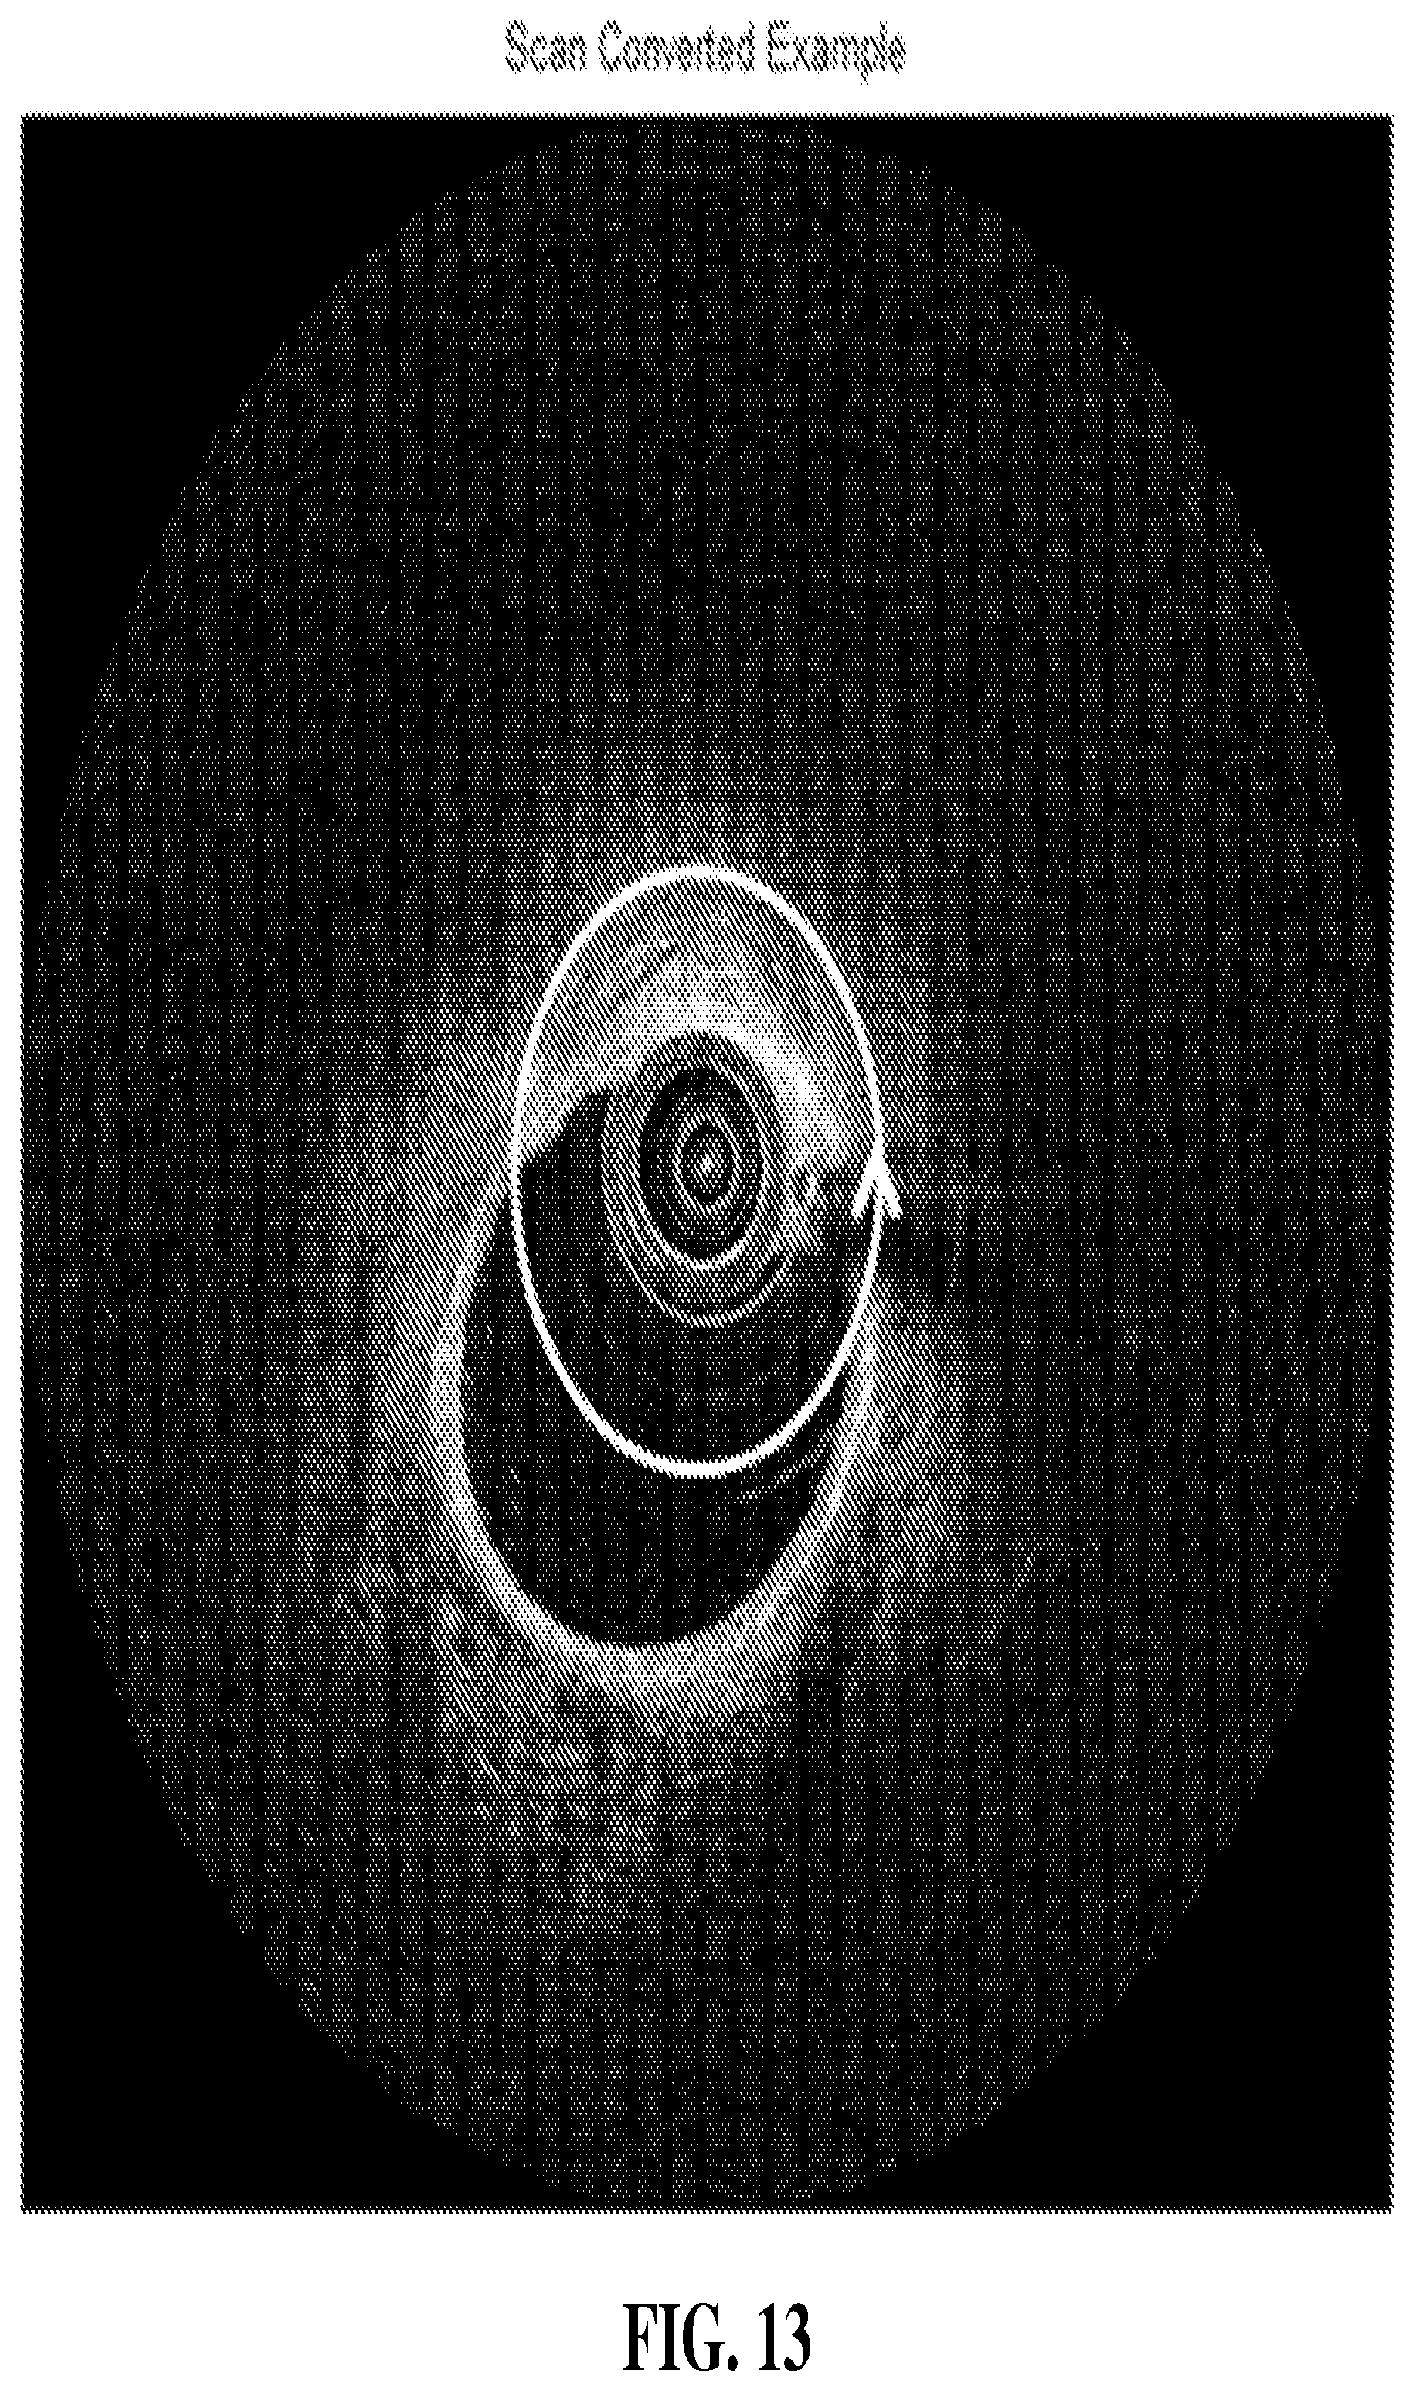
[0026] FIG. 13 shows a scan-converted image of the B-scan in FIG. 12.
[0027] FIG. 14 is a block diagram of a system for producing images that may be processed with systems of the invention.
[0028] FIG. 15 is a block diagram for a system for indicating parameters in an imaging data set.
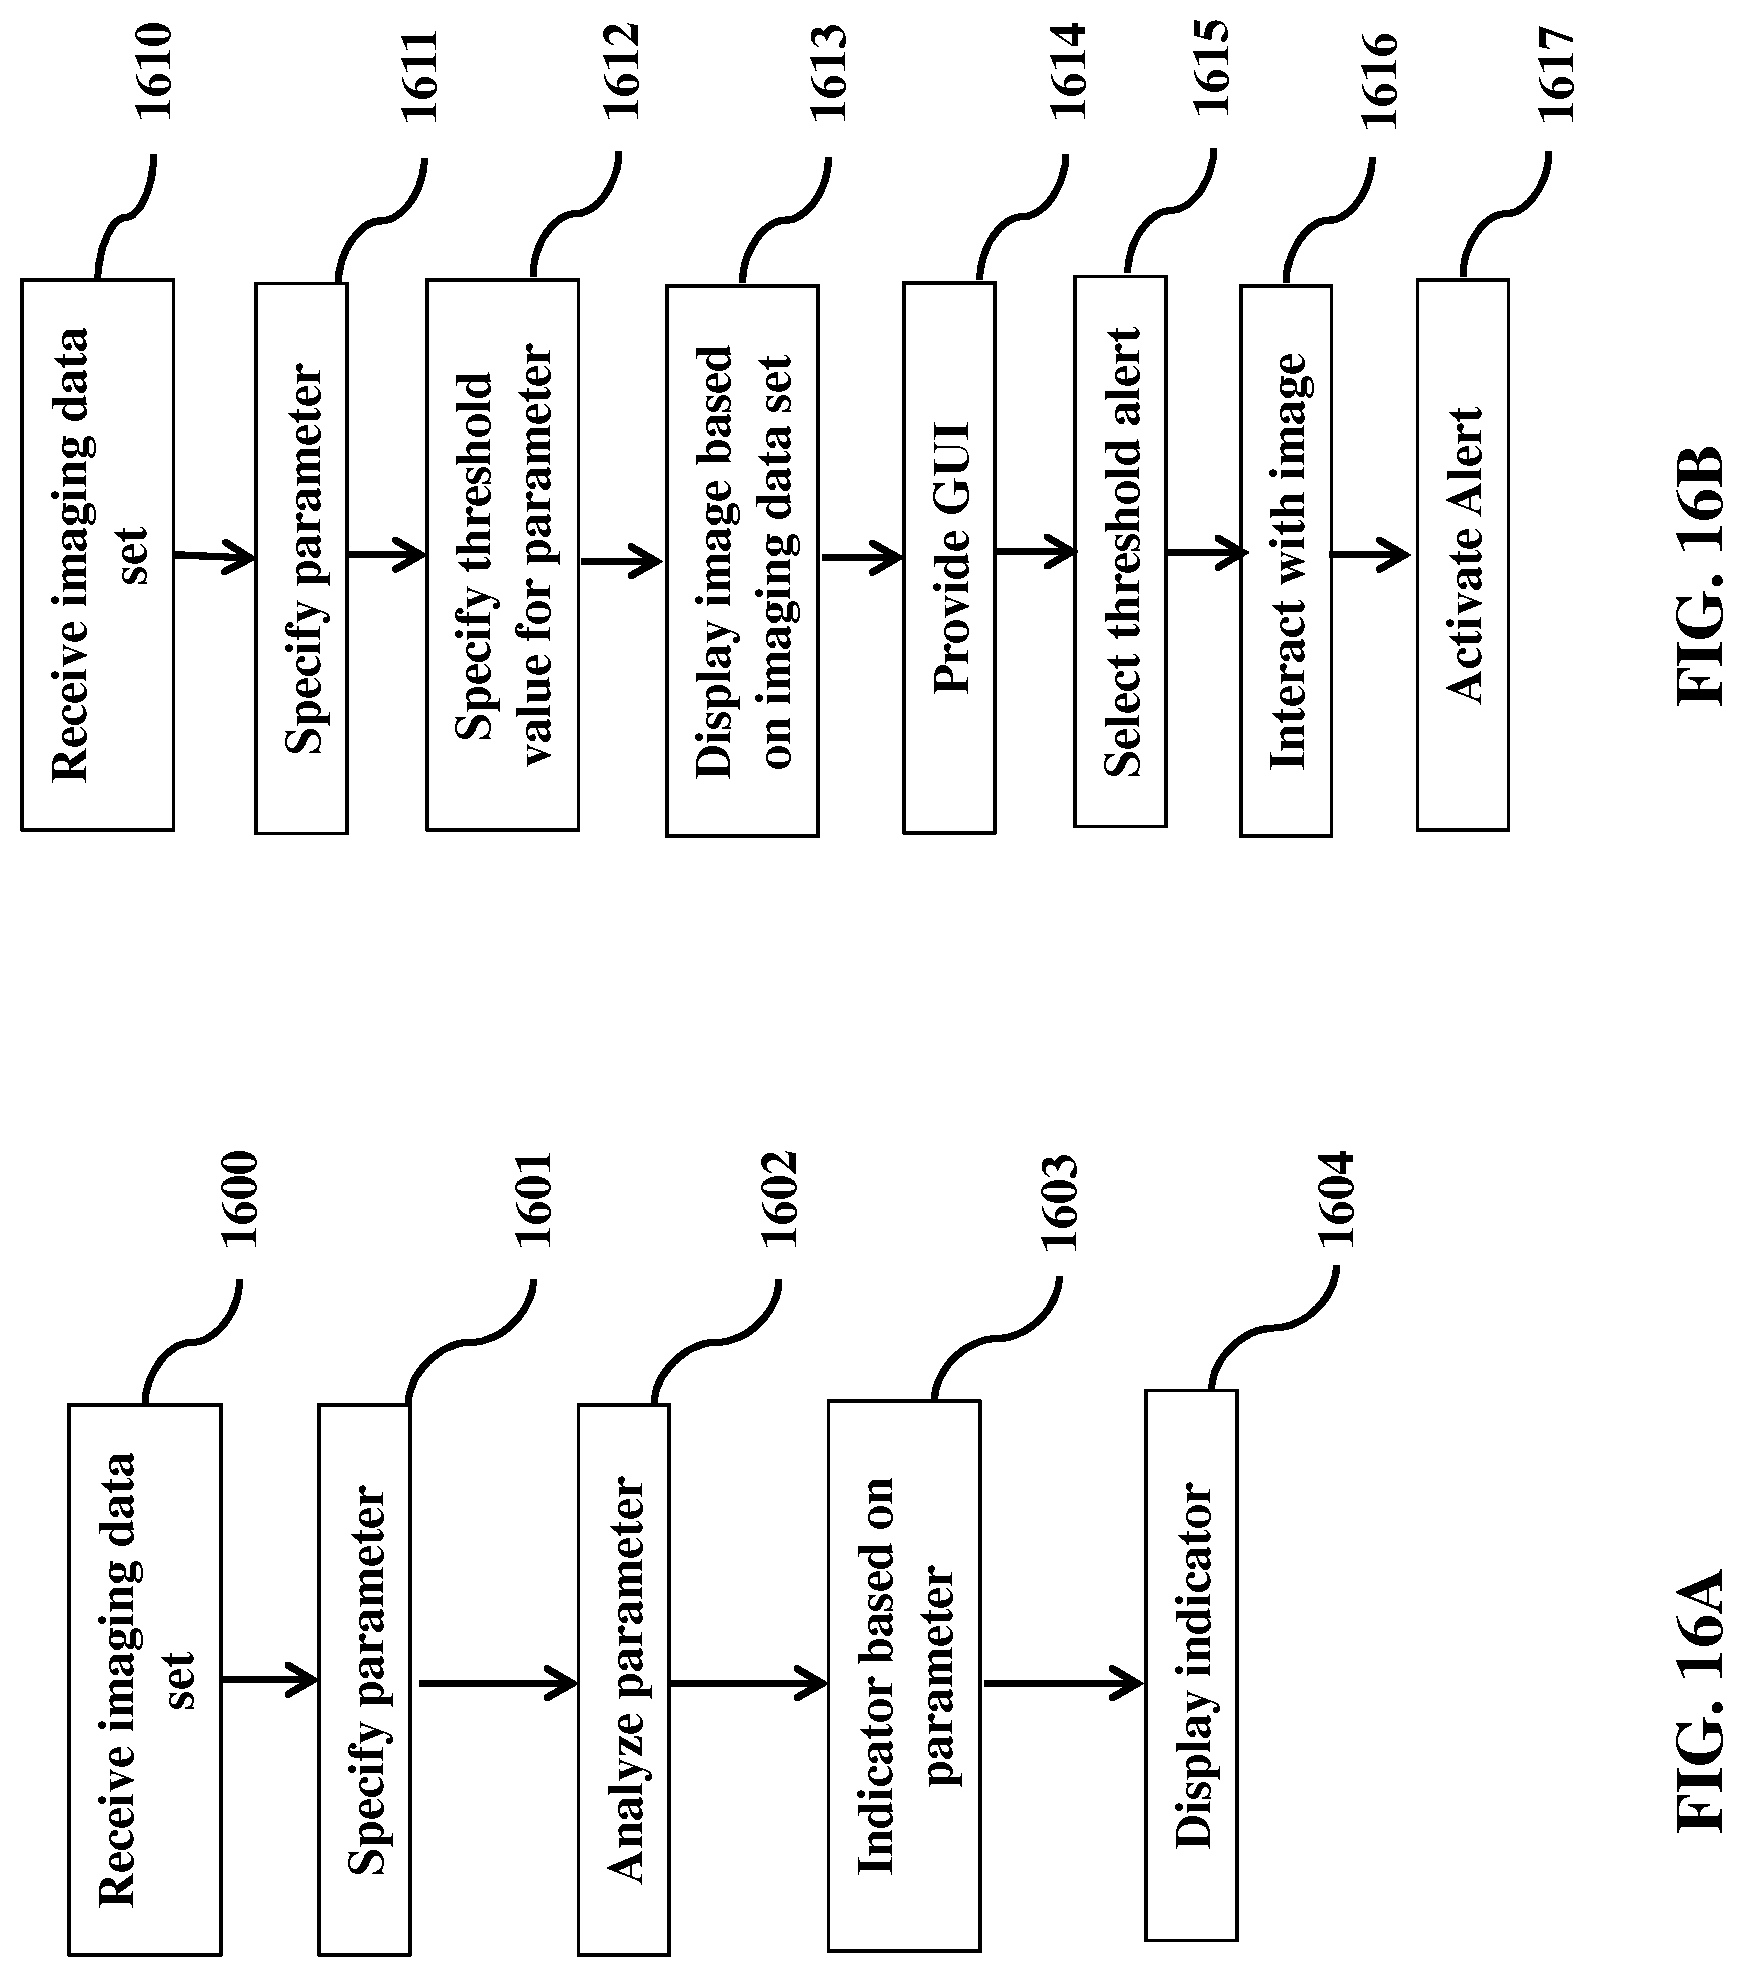
[0029] FIG. 16A shows block diagrams for the procedural steps in color coding a medical device in a medical image.
[0030] FIG. 16B shows block diagrams for assigning a user alert to an image property.
[0031] FIG. 16C shows block diagrams for interacting with an image to display a parameter value.
[0032] FIG. 16D shows block diagrams for interacting with an image to display a secondary image.
[0033] FIG. 17 illustrates a color-coded lumen indicating that the cross sectional area of a vessel lumen is smaller than a predetermined threshold value.
[0034] FIG. 18 illustrates a color-coded lumen indicating that the cross sectional area of a vessel lumen is larger than a predetermined threshold value.
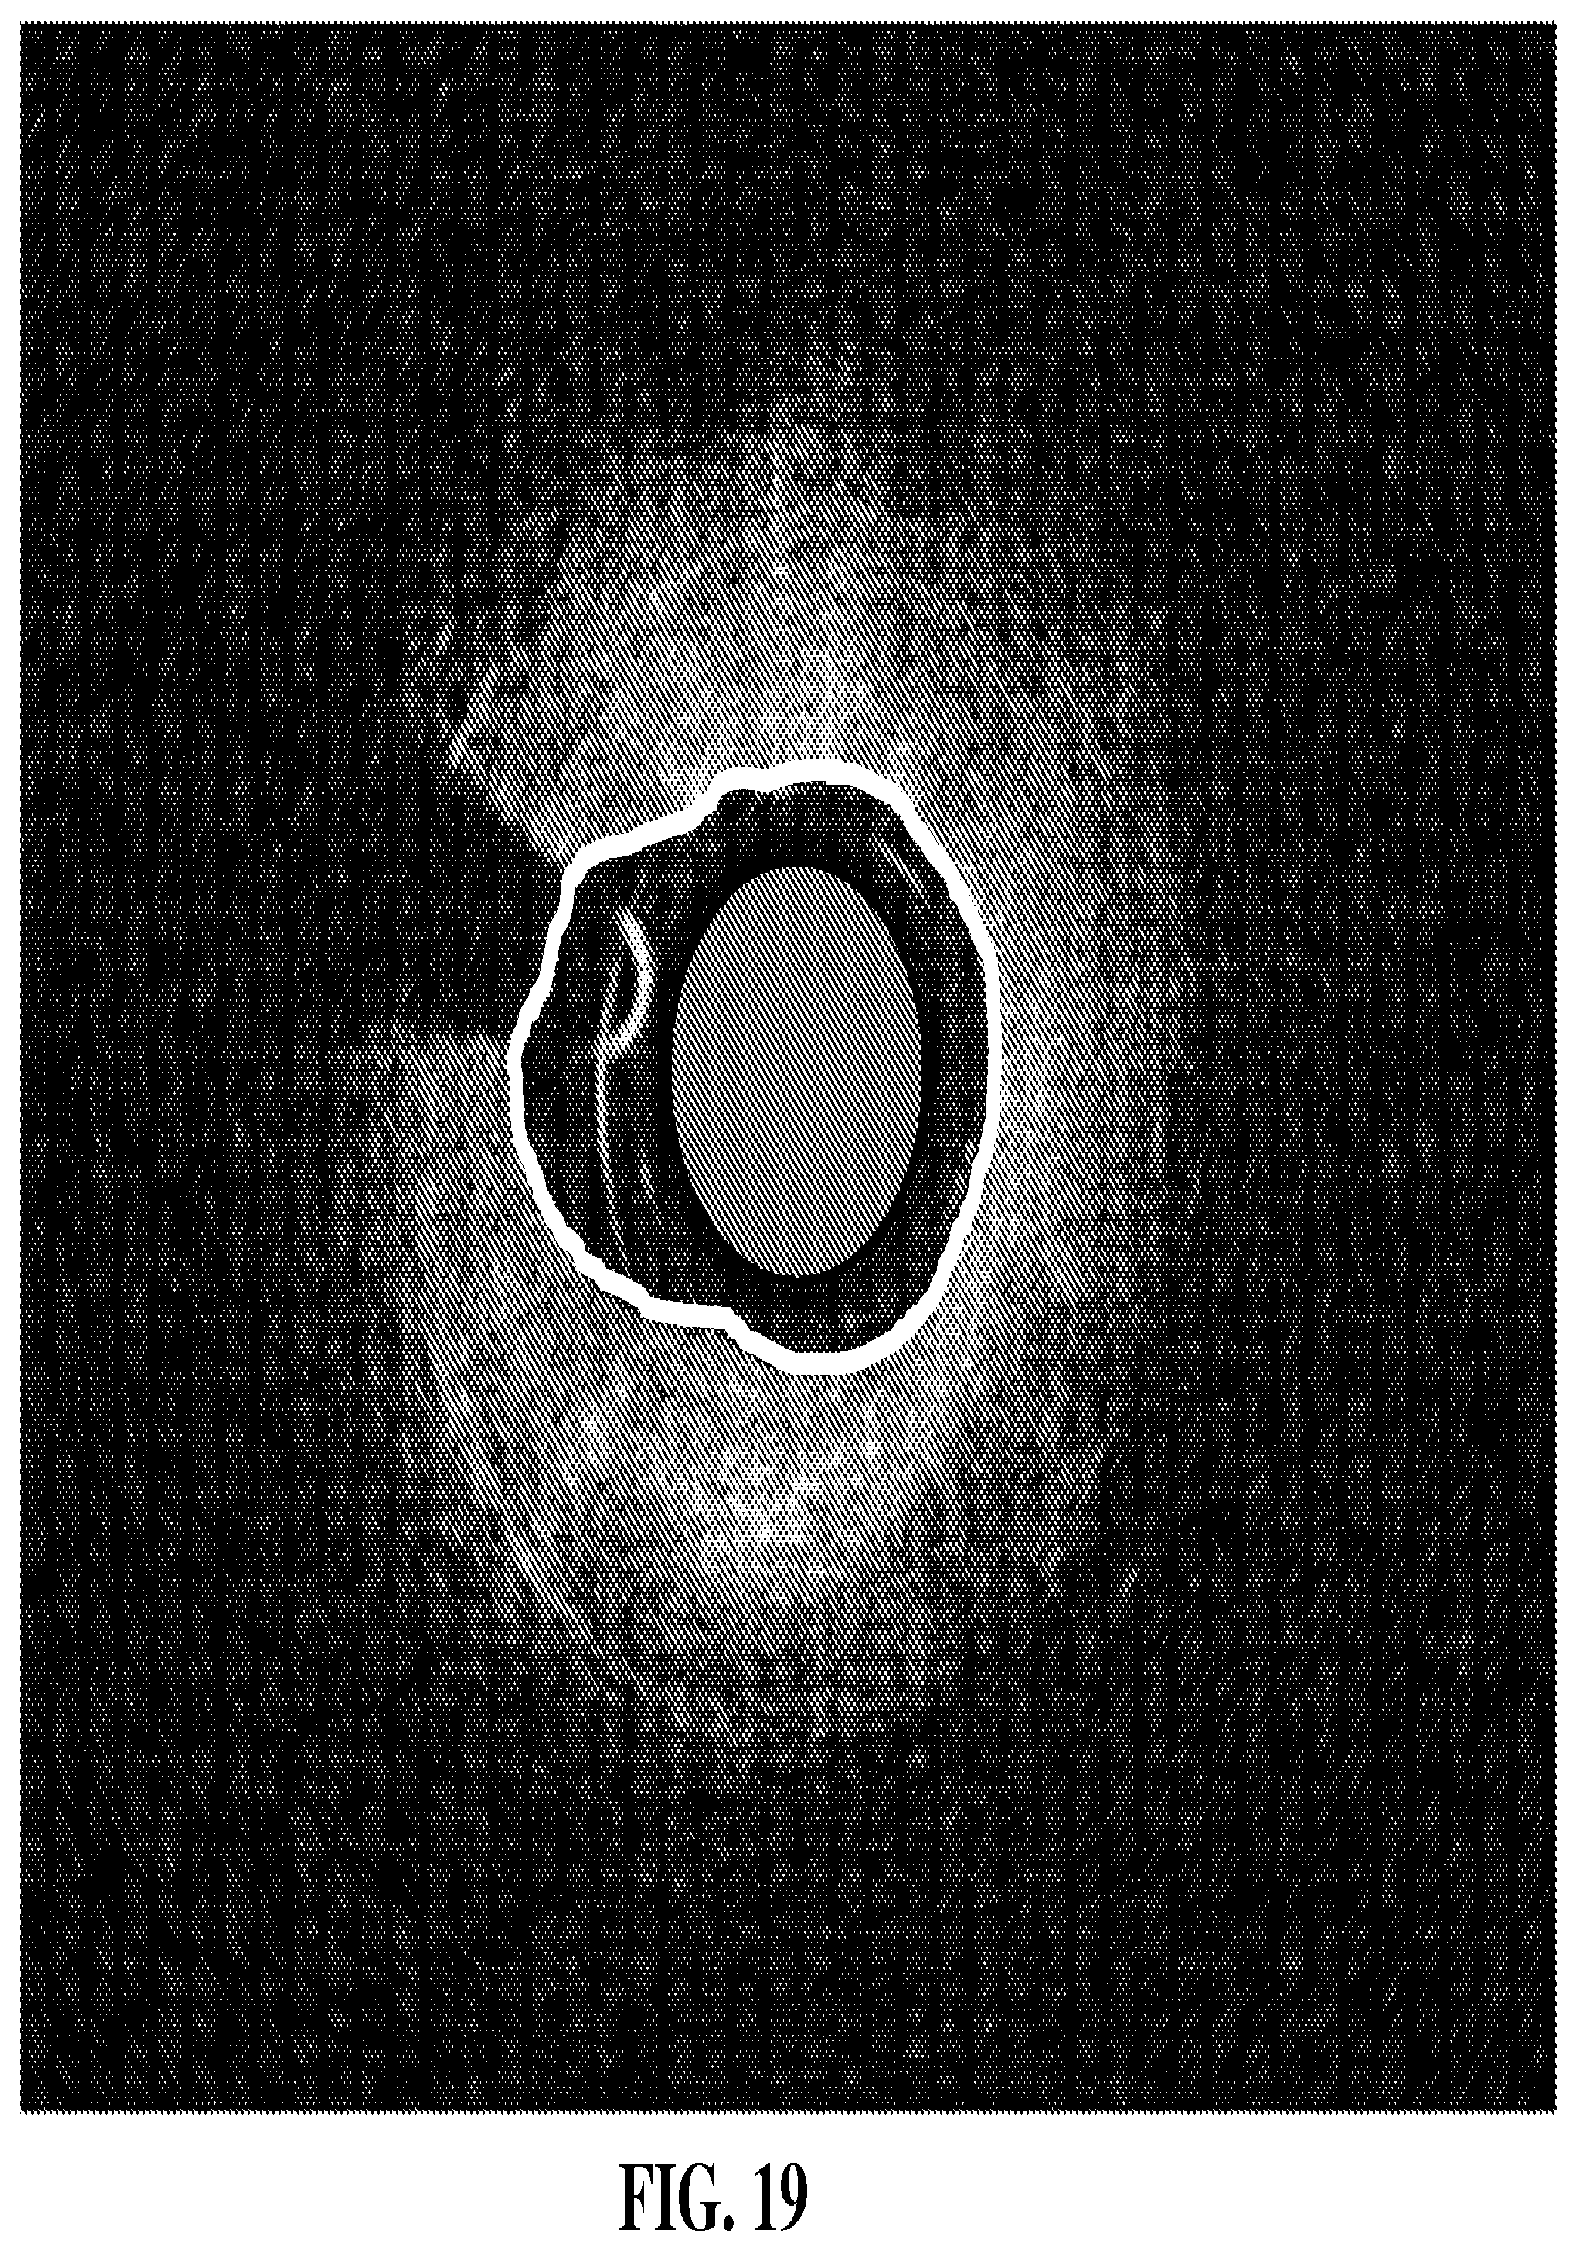
[0035] FIG. 19 illustrates a color-coded lumen as in FIG. 17, with the color coding of the lumen showing transparency.
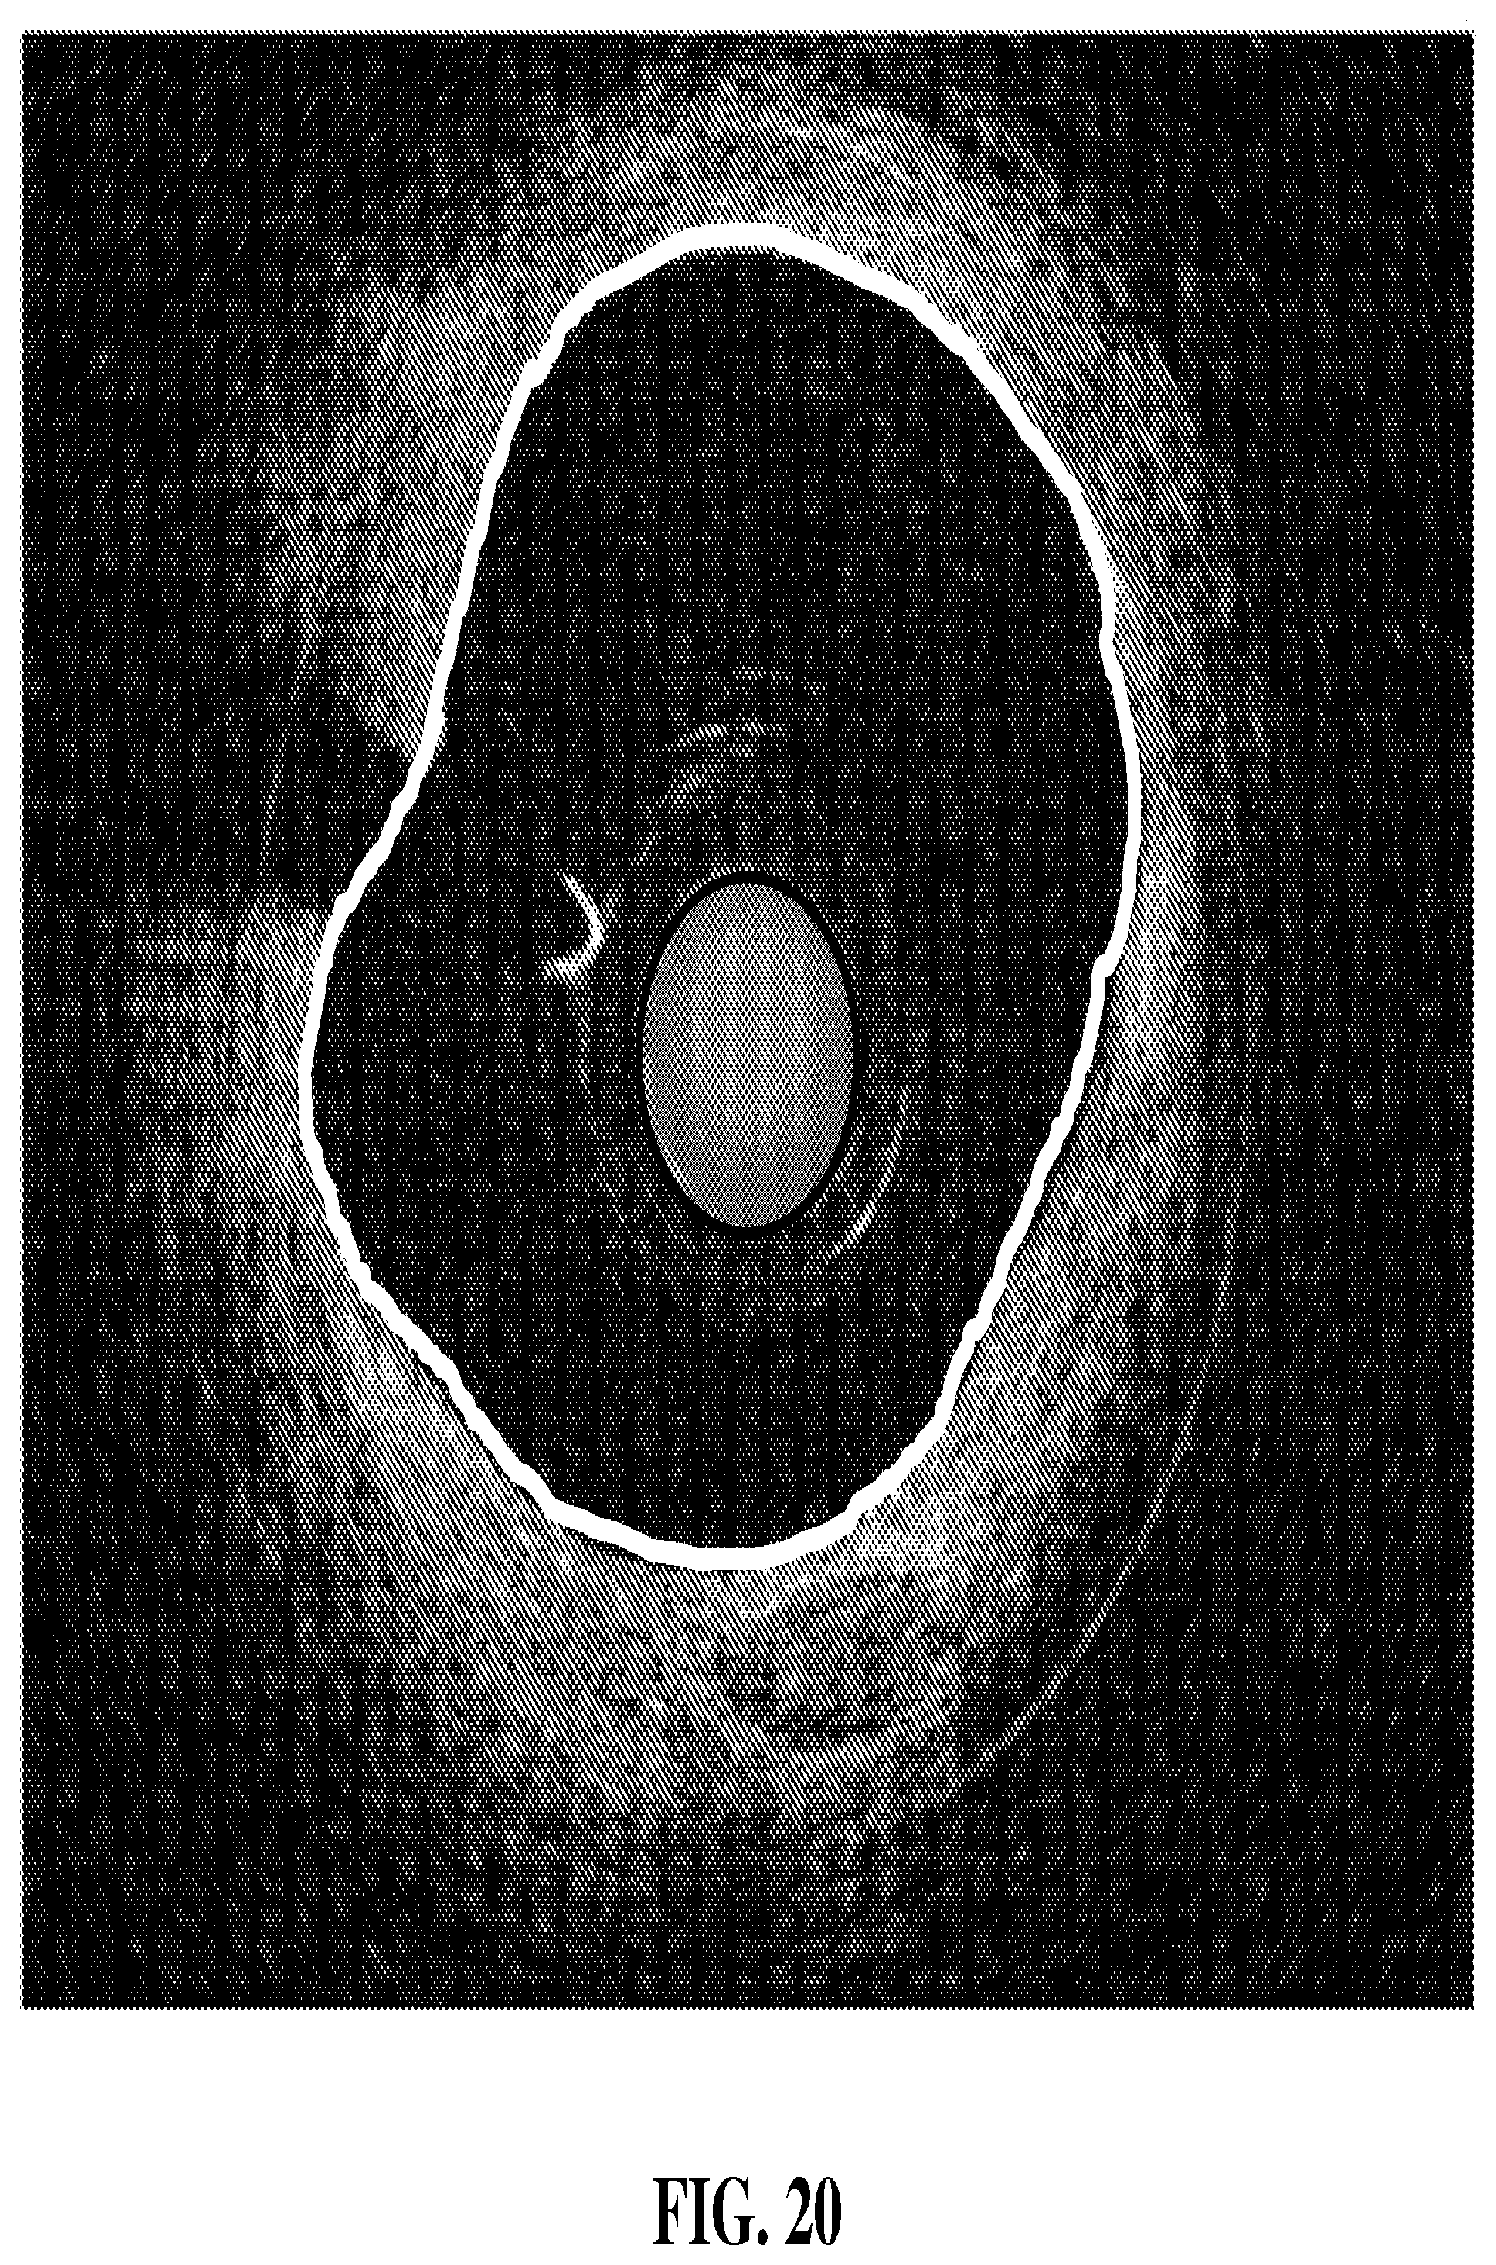
[0036] FIG. 20 illustrates a color-coded lumen as in FIG. 18, with the color coding of the lumen showing transparency.
[0037] FIG. 21A shows exemplary indicators that may be used to indicate values of parameters.
[0038] FIG. 21B shows exemplary indicators that may be used to indicate values of parameters.
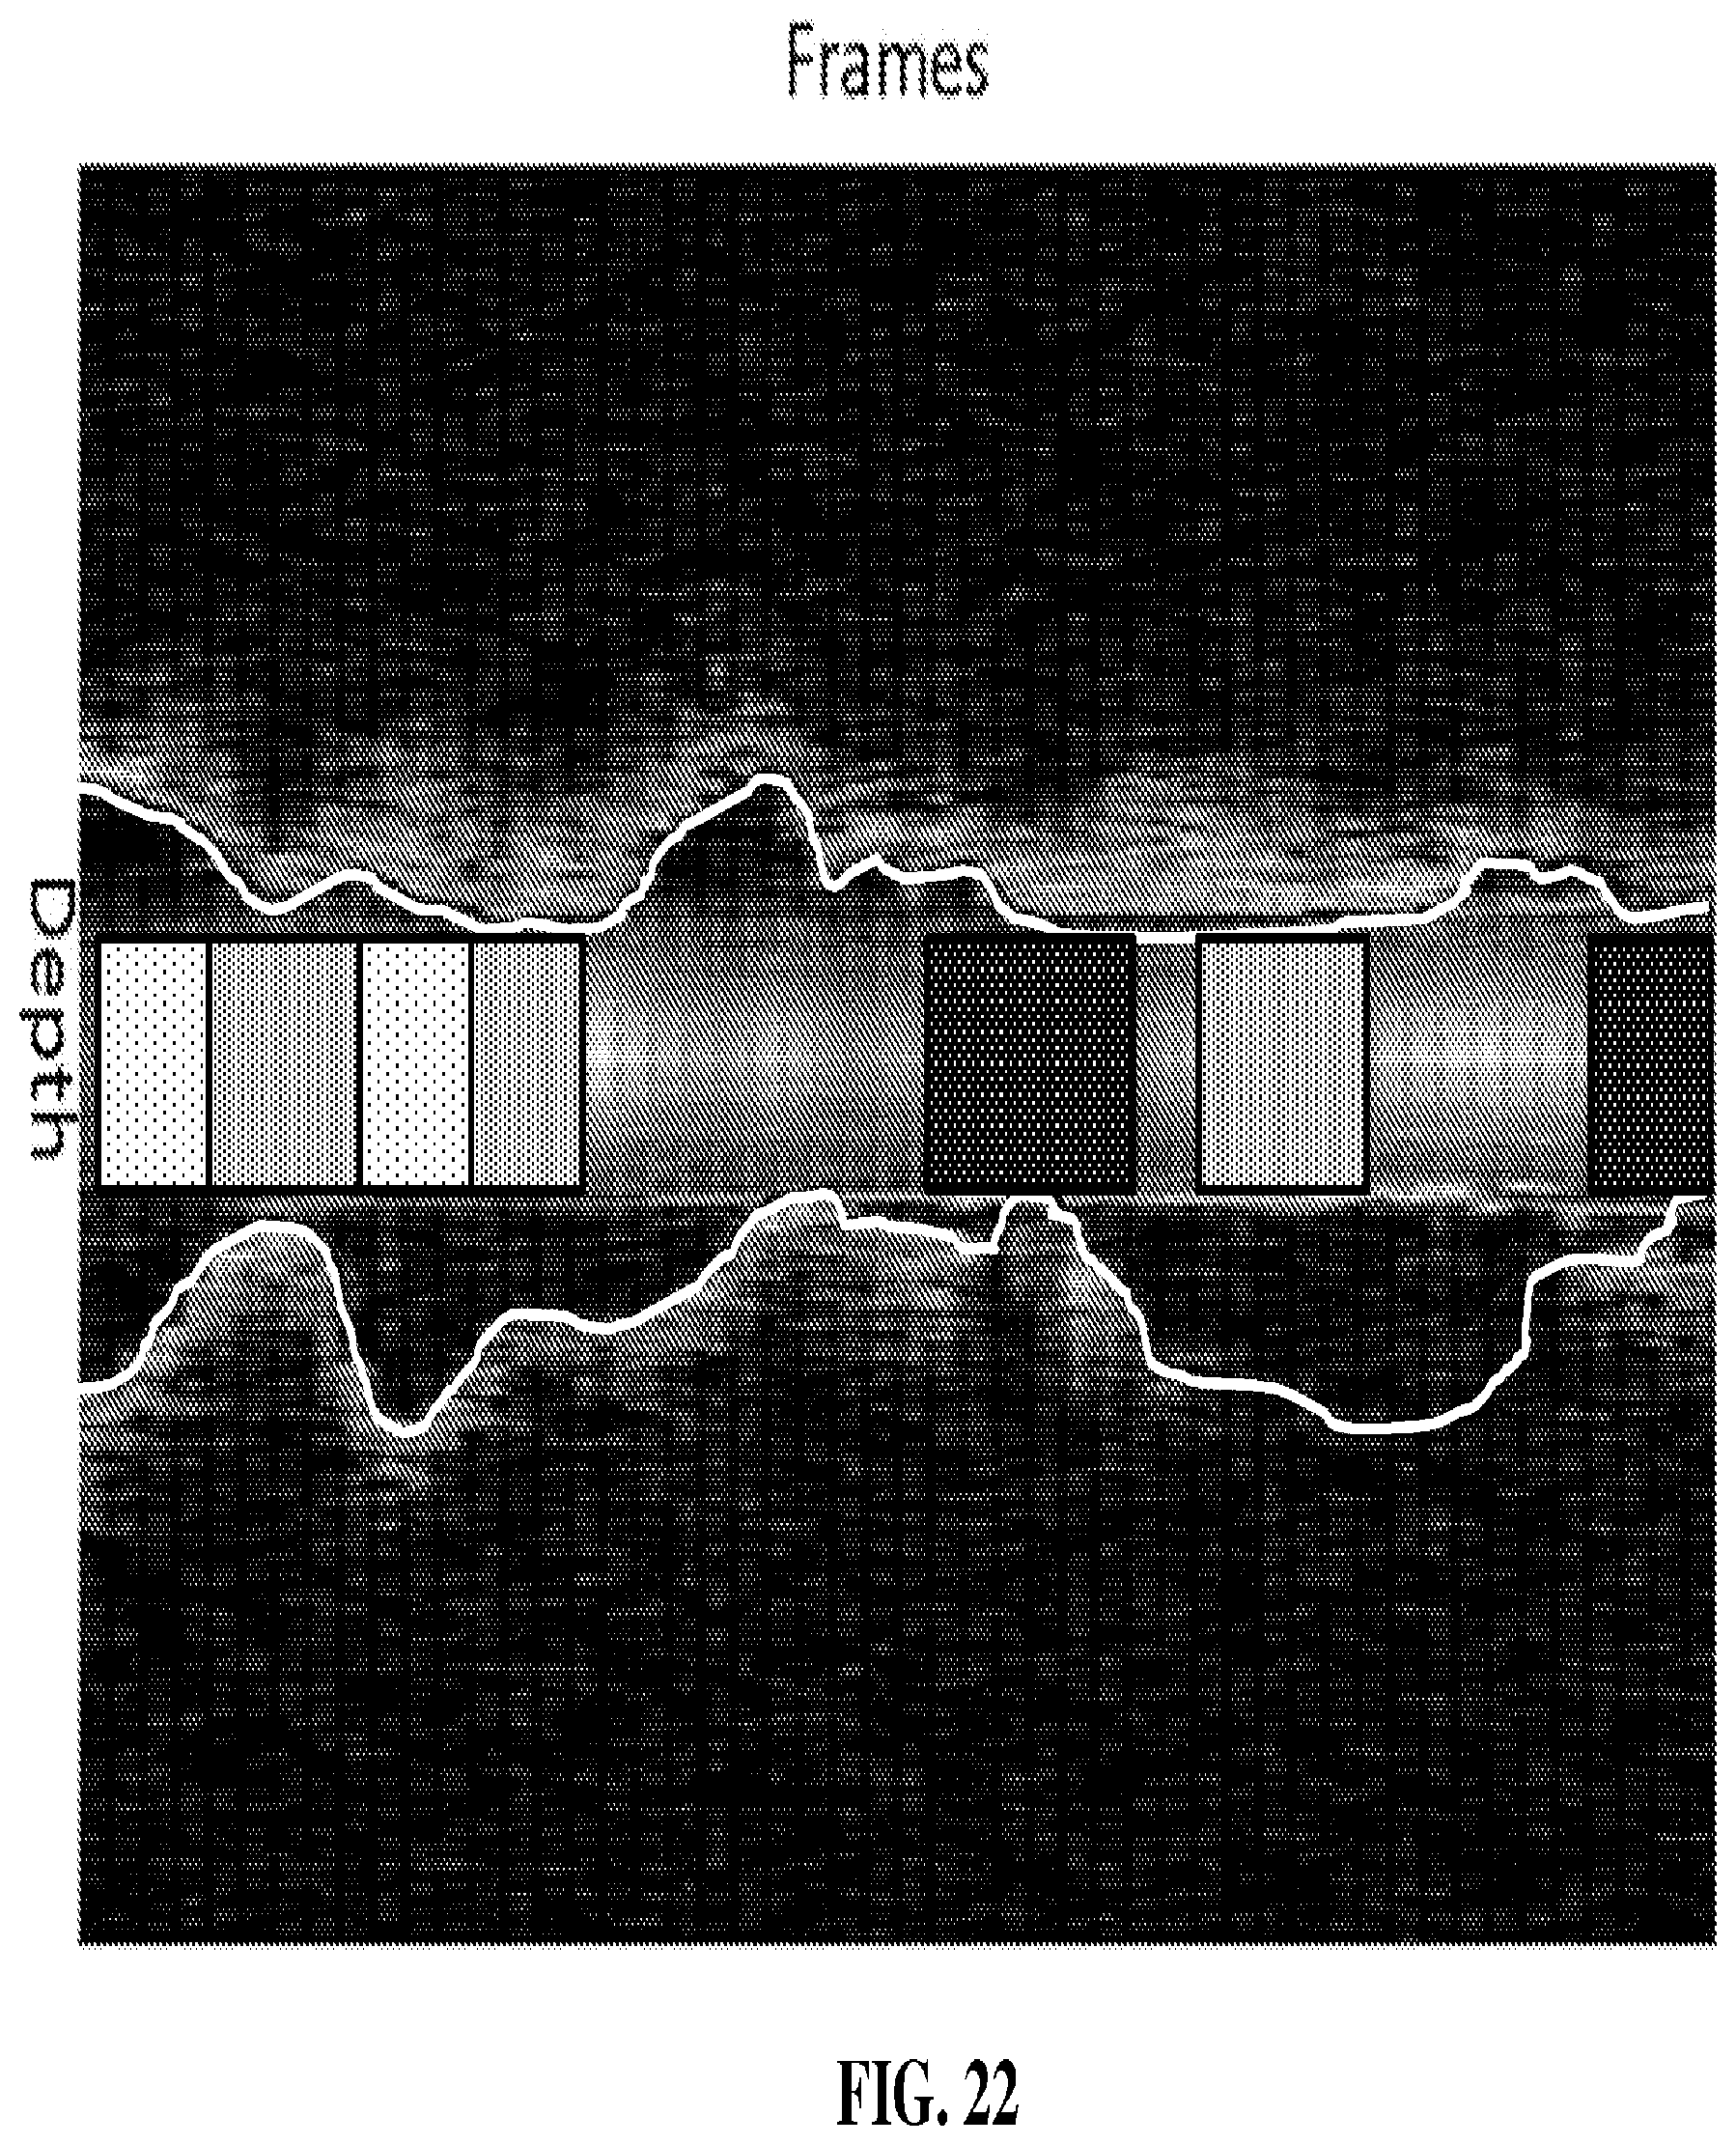
[0039] FIG. 22 illustrates a longitudinal view of a lumen with shading based upon lumen area.
[0040] FIG. 23 illustrates a three-dimensional view of a lumen color-coded to indicate the cross sectional area.
[0041] FIG. 24 illustrates the use of a graphical user interface to interact with an image and to prompt display of a second related image.
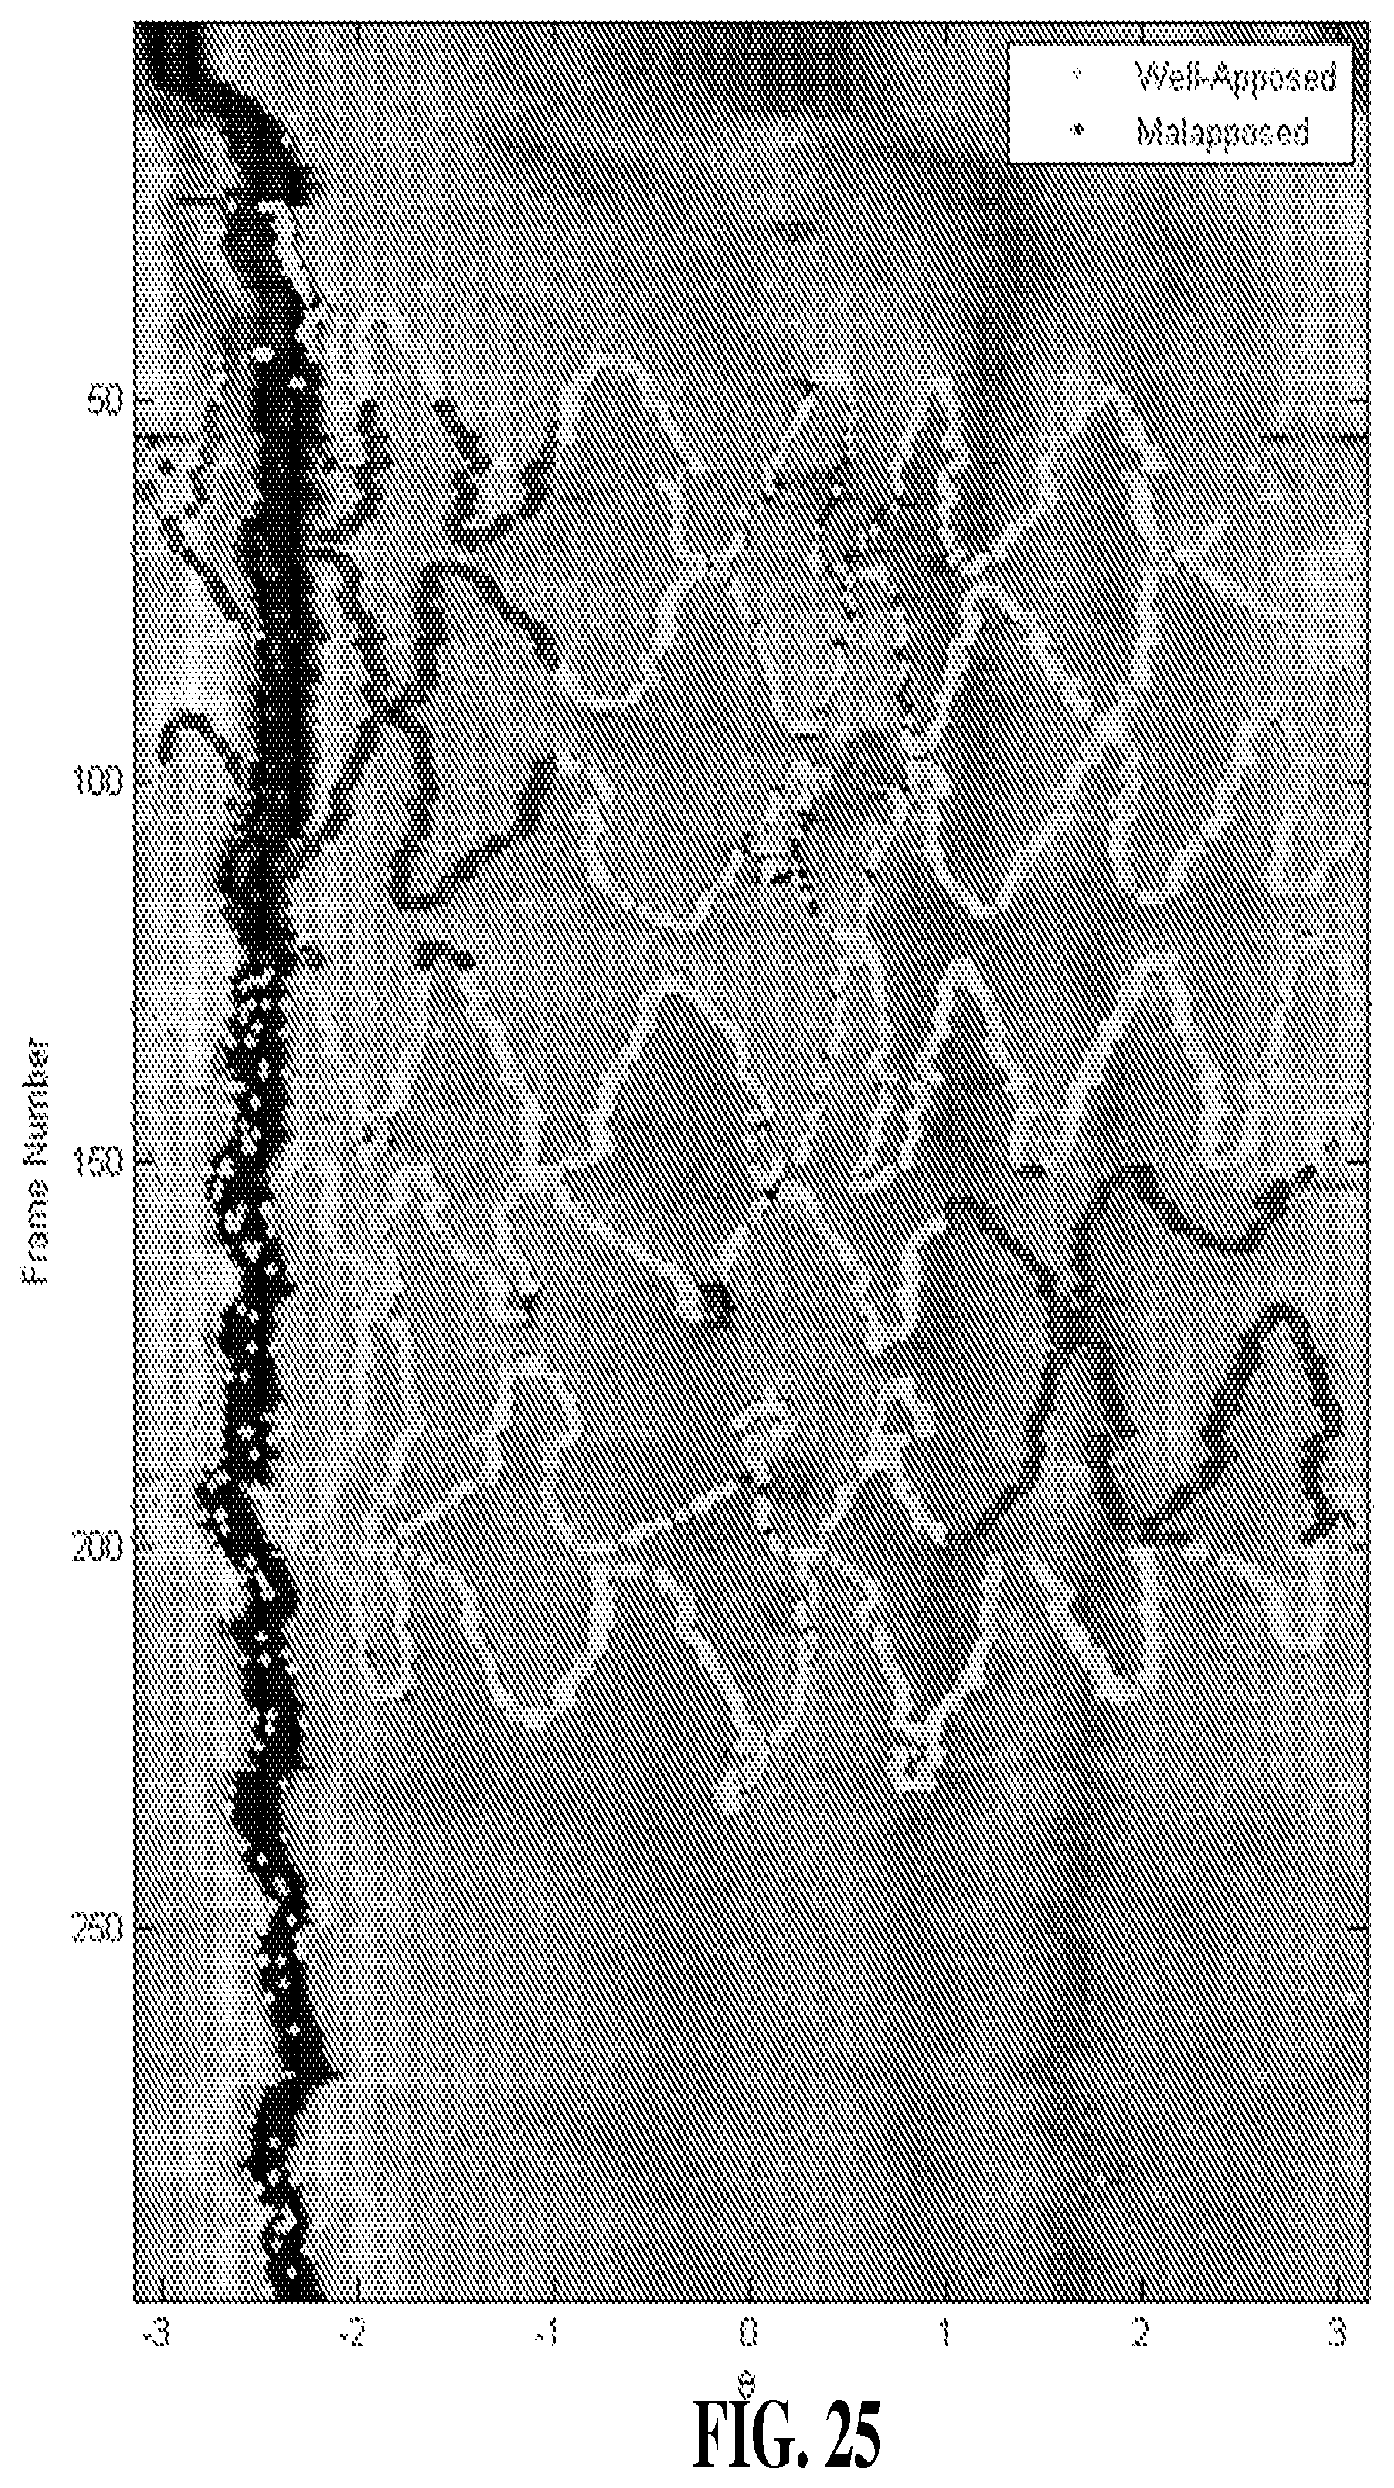
[0042] FIG. 25 illustrates a splayed view of a stent placed within a lumen wherein the stent is color-coded to indicate apposition.
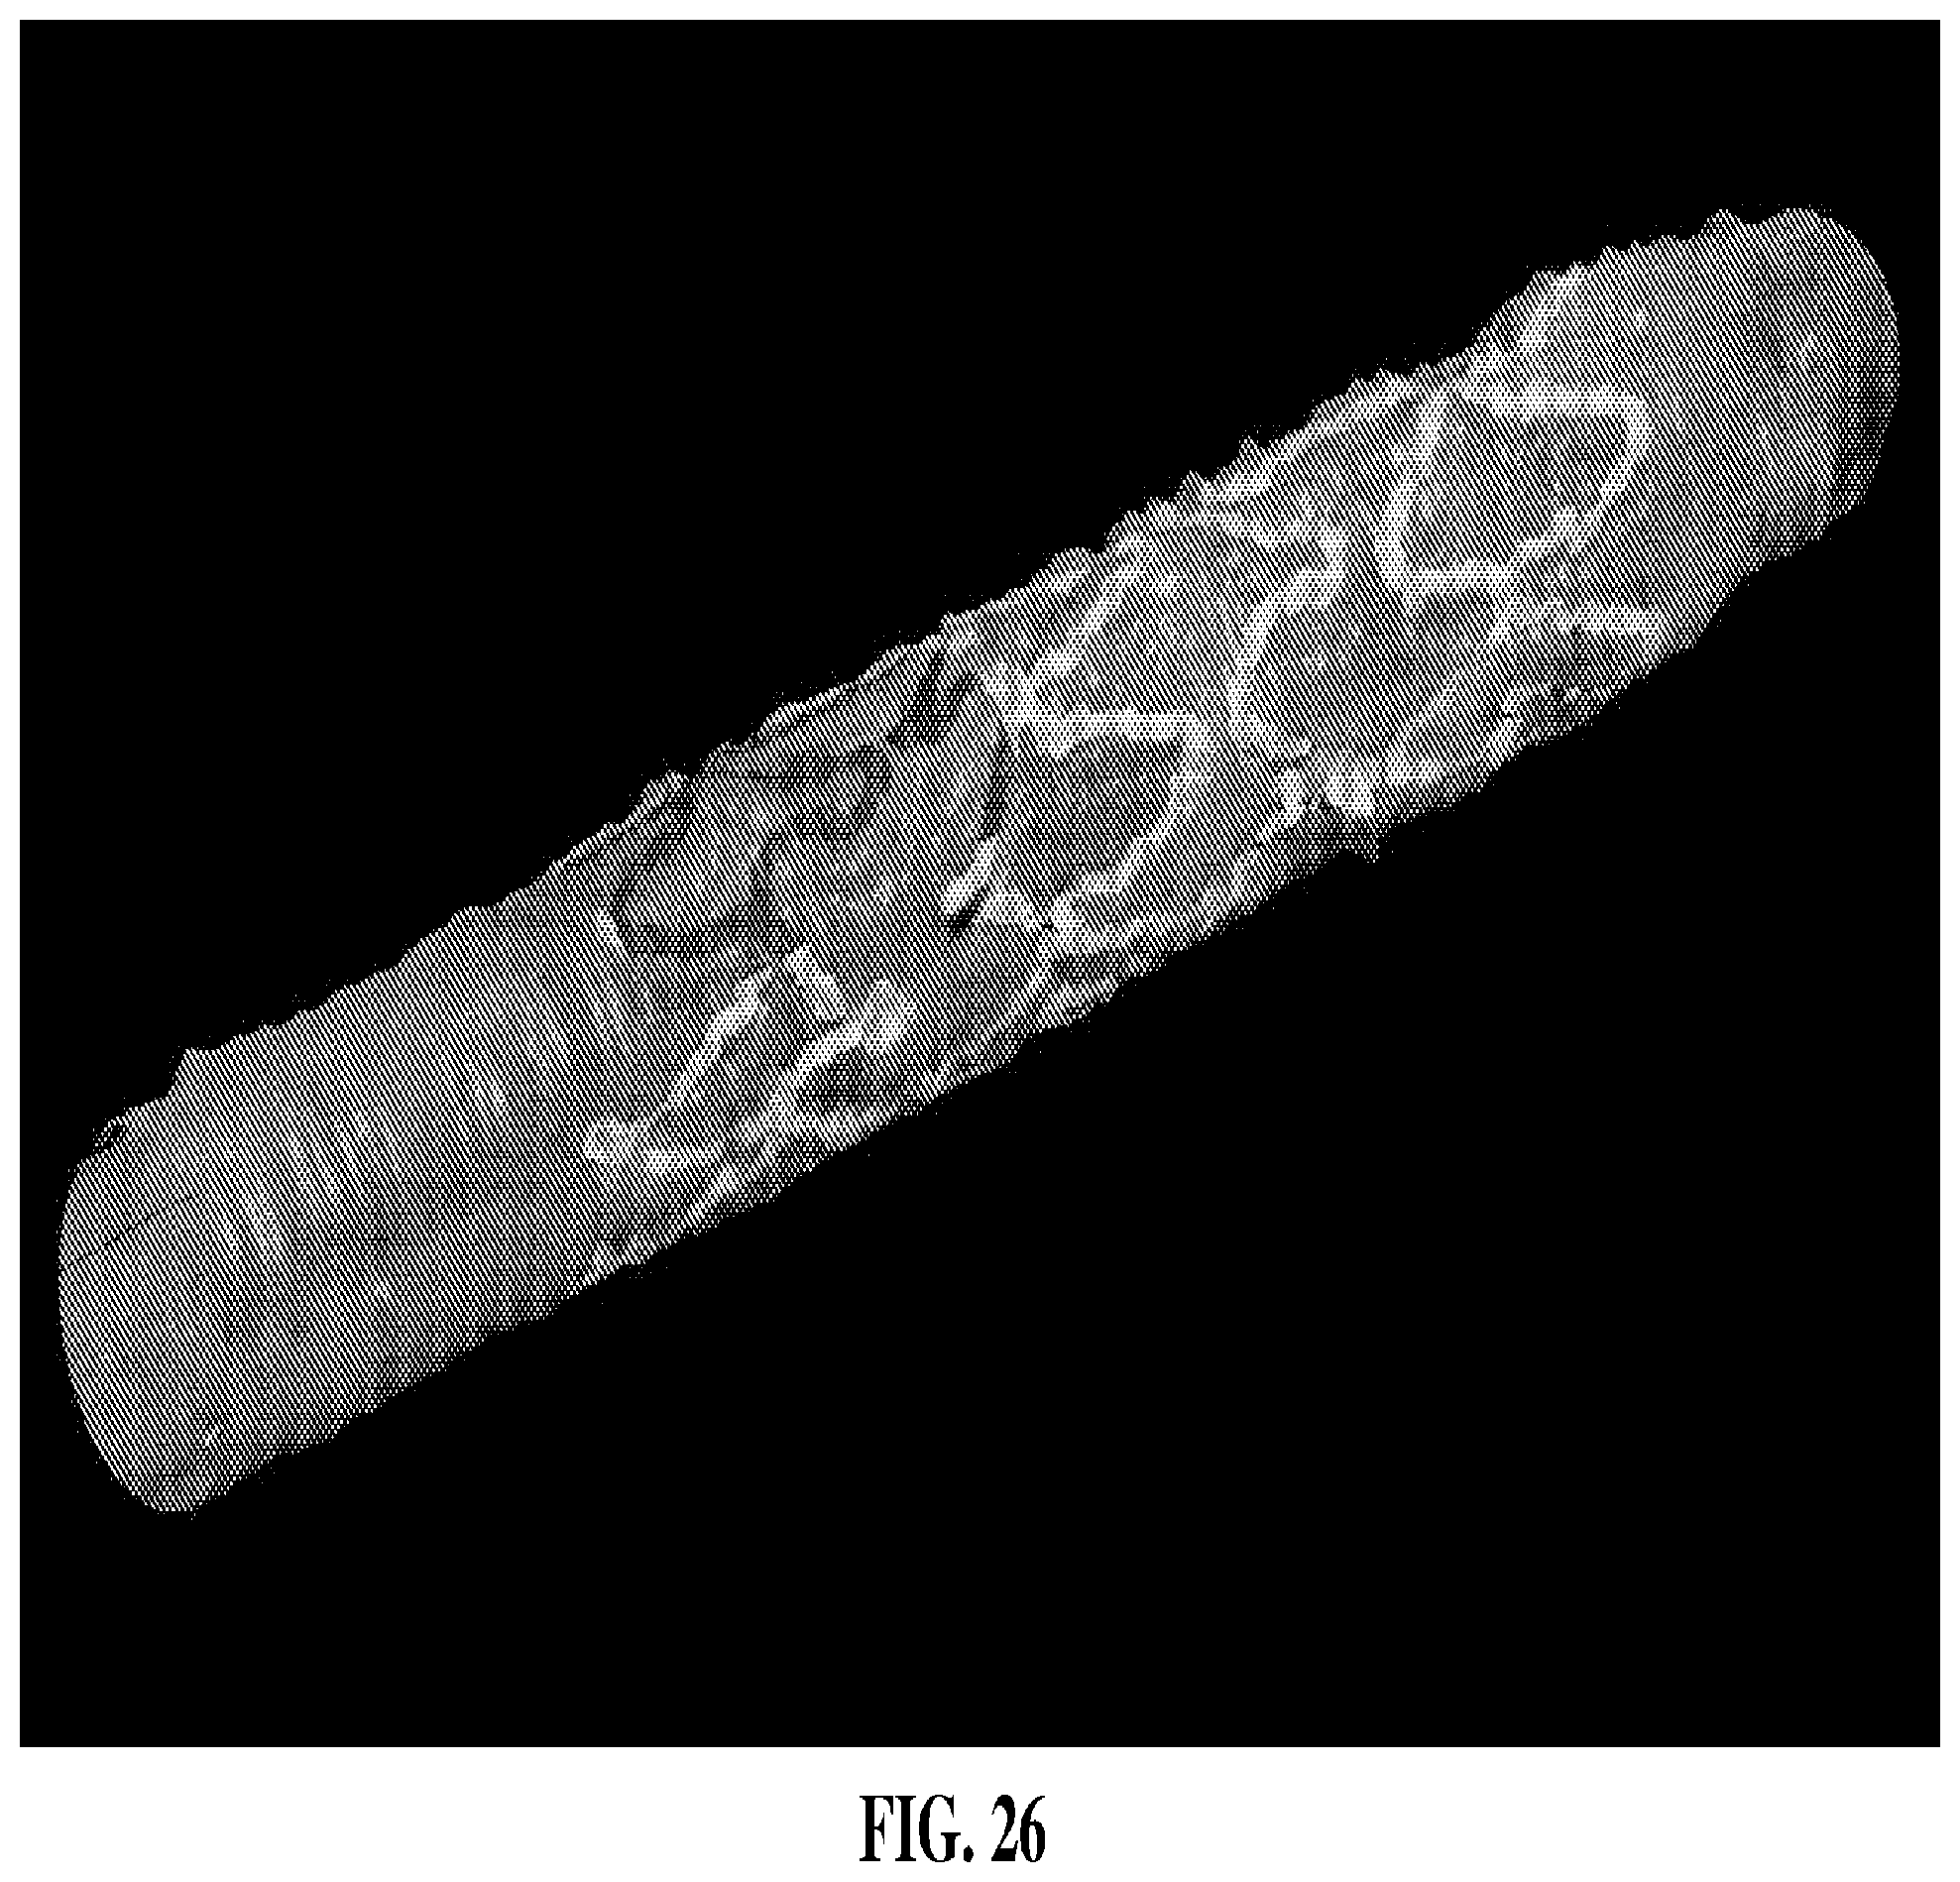
[0043] FIG. 26 illustrates a three-dimensional view of a stent placed within a lumen wherein the stent is color-coded to indicate apposition.
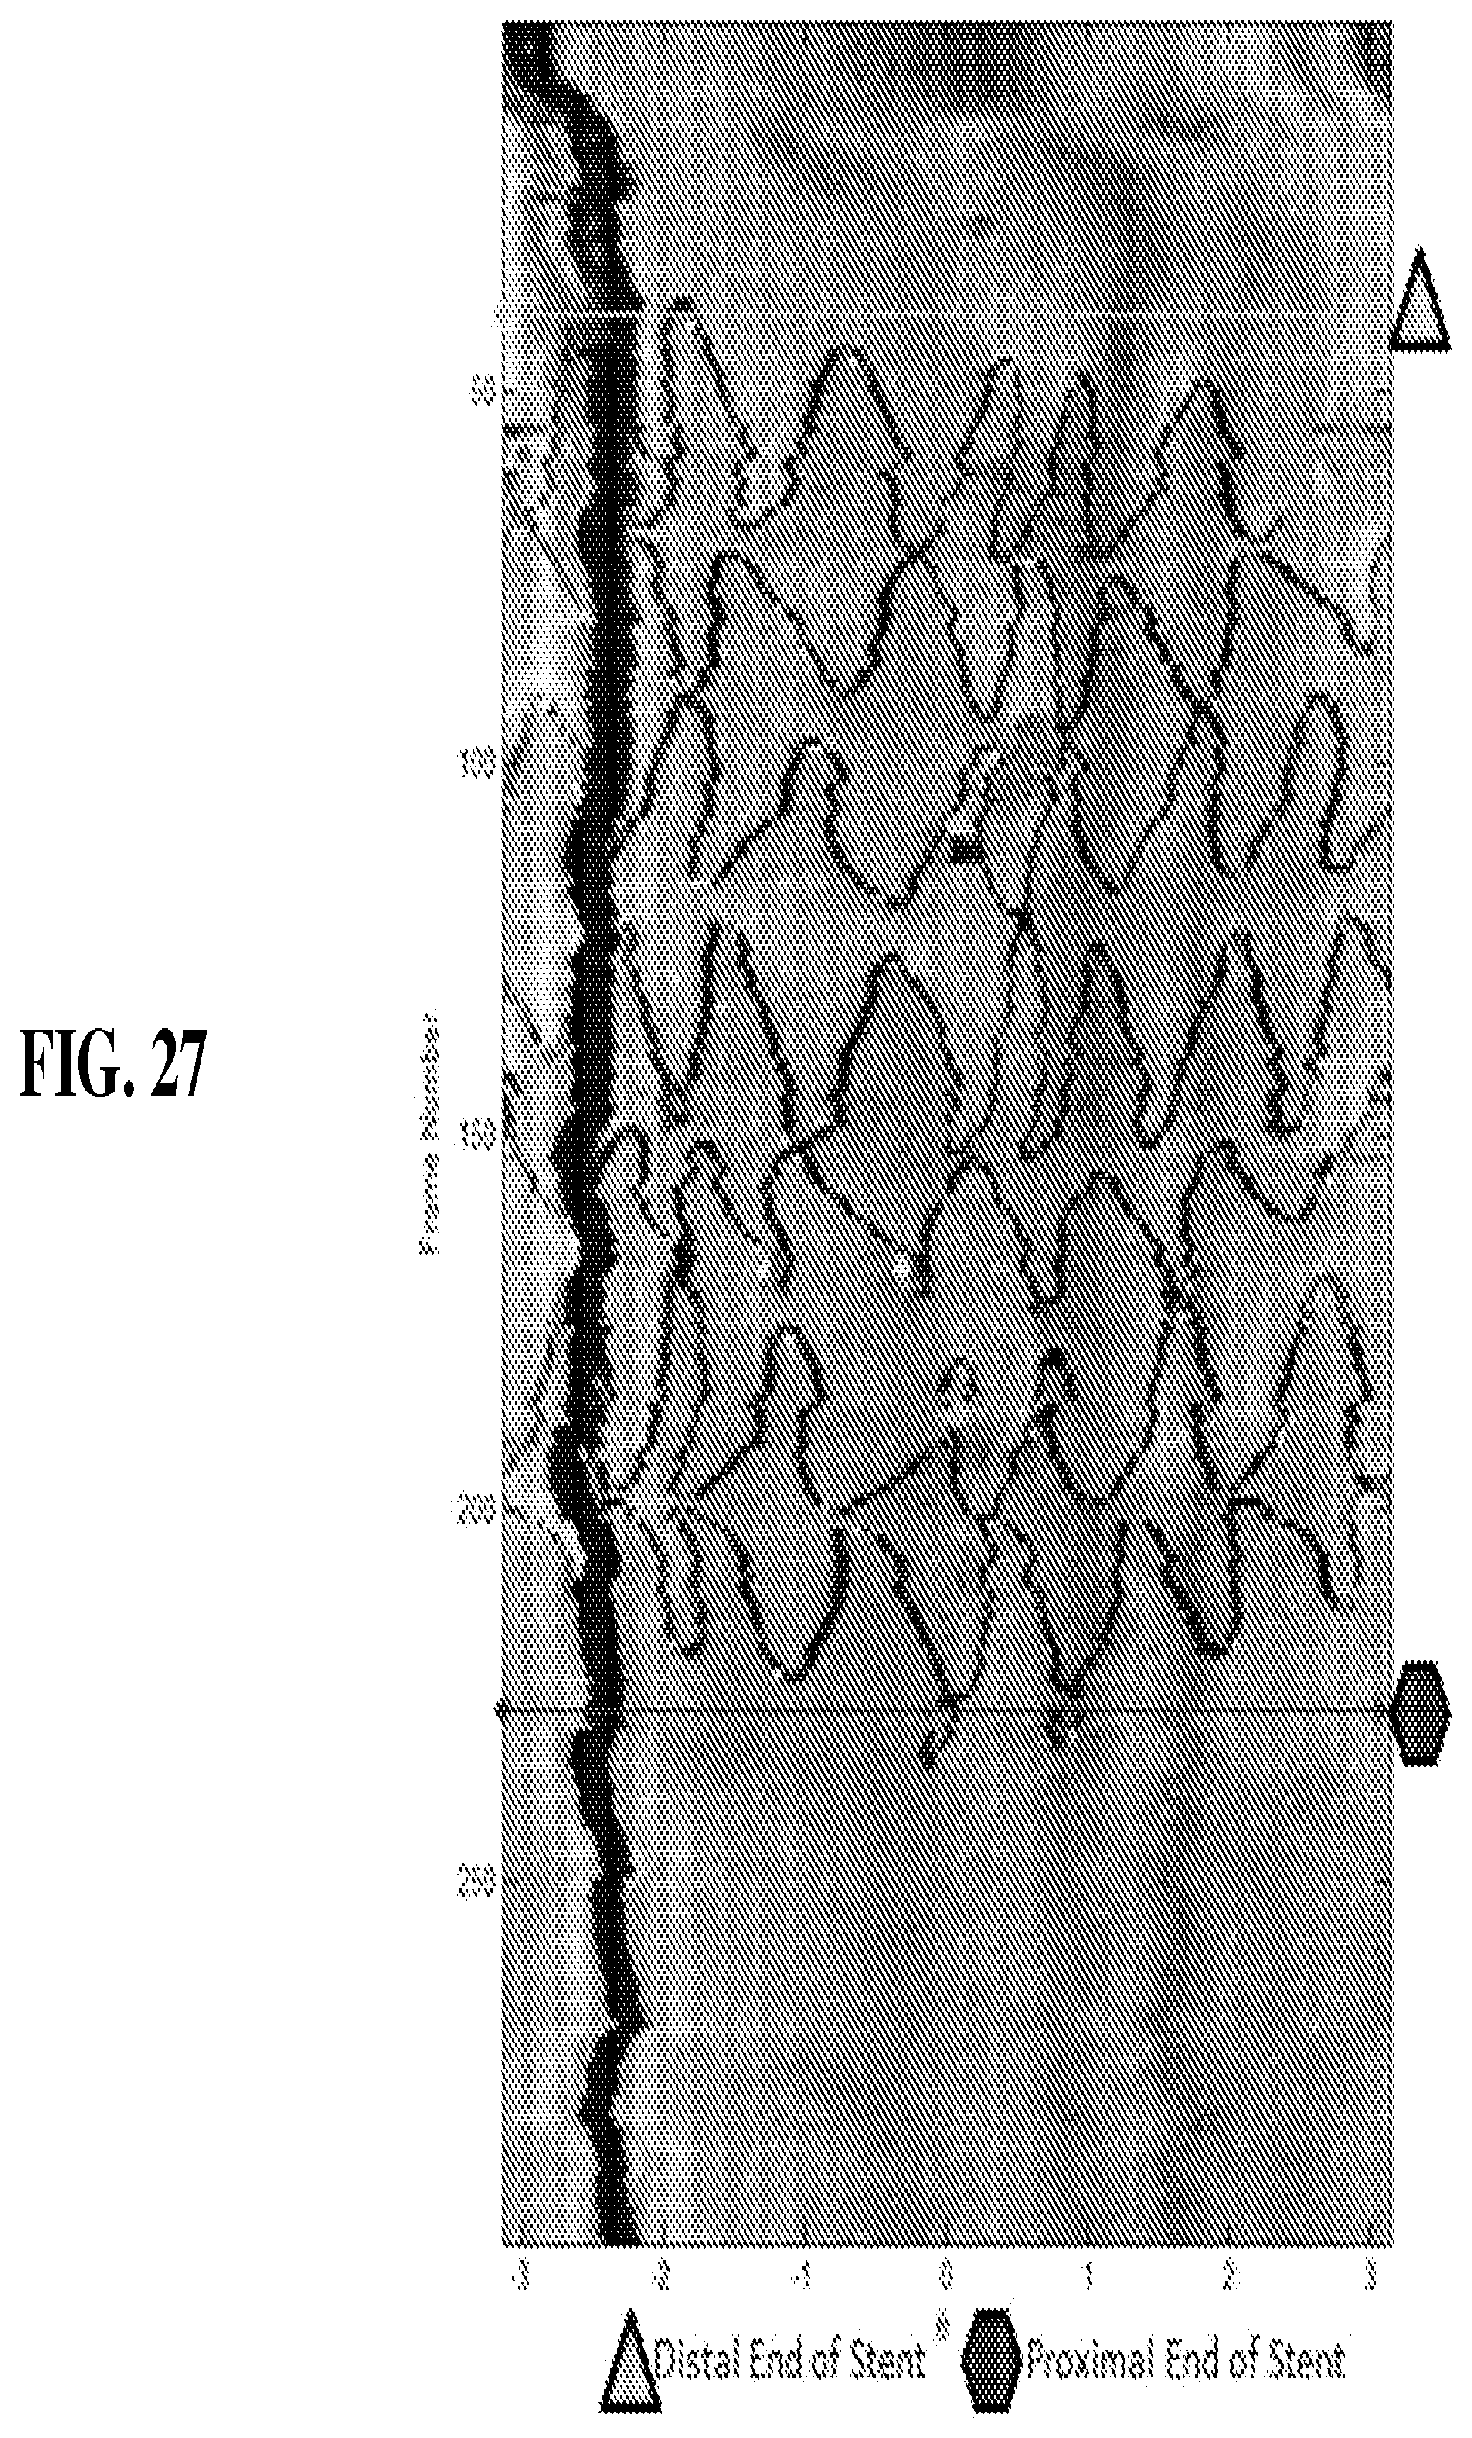
[0044] FIG. 27 illustrates a splayed view of a stent placed within a lumen wherein markers are used to set boundaries for an analysis of the image.
DESCRIPTION OF THE INVENTION
[0045] This invention generally relates to systems for indicating parameters in an imaging data set, for example, an imaging data set relating to a medical device or a biological lumen. Medical imaging is a general technology class in which sectional and multidimensional anatomic images are constructed from acquired data. The data can be collected from a variety of signal acquisition systems including, but not limited to, magnetic resonance imaging (MRI), radiography methods including fluoroscopy, x-ray tomography, computed axial tomography and computed tomography, nuclear medicine techniques such as scintigraphy, positron emission tomography and single photon emission computed tomography, photo acoustic imaging ultrasound devices and methods including, but not limited to, intravascular ultrasound spectroscopy (IVUS), ultrasound modulated optical tomography, ultrasound transmission tomography, other tomographic techniques such as electrical capacitance, magnetic induction, functional MRI, optical projection and thermo-acoustic imaging, combinations thereof and combinations with other medical techniques that produce one-, two- and three-dimensional images. Although the exemplifications described herein are drawn to the invention as applied to OCT, at least all of these techniques are contemplated for use with the systems and methods of the present invention.
[0046] Through the use of the imaging techniques described herein, anatomical structures can be evaluated, visually optimized, or linked to at least one other sensory output when a predetermined threshold is reached, and provided to the user. Corresponding numerical measurements can be provided to the user by these methods in one-, two- or three-dimensional image data sets. User interface graphics also may provide input for other indicators on a monitor interface, for example a color bar associated with percent changes in size, depth, height, width, etc., of an anatomical structure or dynamic graphical indicators displaying a value correlated to a lumen image parameter. The method enhances visual examination each image in image data sets, thereby reducing user error in evaluation and assessment of a clinical condition.
[0047] The methods and systems of the present invention embody various visual, audio, or tactile indicators to emphasize image parameters in medical images. Such indicators include, for example, a color-coded indicator, a pulsating indicator, a color map of the image parameter, an altered-sized lumen image, an altered-sized parameter encoded in a lumen image, a gauge, a callout marker, and combinations thereof. In certain embodiments, the pulsating indicator can be an icon, a lumen image, a lumen image parameter, a color-coded indicator, a color map of the image parameter, and any combination. In other examples, the pulsating of the pulsating indicator occurs at a frequency specific to the image parameter. In some embodiments, a heat map of image parameters may be used, such that a user may quickly assess a plurality of values of a parameter. For example a structure may be coded red to green based upon low to high, or bad to good, or high risk to low risk, to indicate a range of values. Alternatively, structures may also be coded with shading or fill designs (e.g., cross-hatching) to indicate values of parameters.
[0048] Various embodiments of visual indicators can include, for example, a dynamic graphical icon for the image parameter. The dynamic graphical icon can be a callout marker that brackets or otherwise delimits a parameter as a user scrolls through a series of images, or it can be, for example, a needle gauge that adjusts its value to any of a range of values for an image parameter that changes as a user scrolls through a set of images.
[0049] The systems and methods described herein are not limited to the display of a single parameter, however. That is, in some embodiments, multiple parameters are simultaneously displayed. Each parameter may have a corresponding visual, audio, or haptic indicator. In some embodiments, multiple parameters are indicated by multiple color schemes. In some embodiments, multiple parameters are indicated by a mix of visual, audio, and haptic indicators. In some embodiments, a user may toggle between parameters or the user will see a second image indicating a different parameter as the user interacts with the image.
[0050] Other examples of the present invention include an indicator that is activated as a user scrolls over at least one image having a predetermined parameter threshold. A sensory inducing output can include, for example, a visual indicator, an audio indicator, a haptic indicator, a gauge indicator, and combinations thereof. In certain examples, the visual sensory inducing output can include a color-coded indicator, a pulsating indicator, a color map of the image parameter, an altered-sized lumen image, an altered-sized parameter encoded in a lumen image, and combinations thereof. Alternatively, the background of the image could flash, the screen could momentarily show a negative image of the displayed image and then return, or a color image could change to a half-tone image.
[0051] The pulsating indicator may be, for example, an icon, a lumen image, a lumen image parameter, a color-coded indicator, a color map of the image parameter, or any combination thereof. An image may pulsate at a rate related to the parameter of interest. Generally, any indicator can be set to occur once a threshold value of a parameter is reached.
[0052] Audio indicators may include, for example, a sound specific to a parameter. In certain embodiments, the audio indicator can become activated if an image parameter is present in any particular image. In other embodiments, the audio indicator can become activated when, for example, a user scrolls over a lumen image encoding a threshold value of a particular image parameter. The audio indicator may be a tone, beep, music (e.g., musical scale), horn, or a buzz.
[0053] In other examples, a sensory inducing output includes haptic indicators, for example a vibration in a system component at a physical interface between a user and the system component. The system component can include, as non-limiting examples, a computer-aided display control module, hereinafter referred to as a "computer mouse," or a touch-screen monitor that imparts a tactile signal to the user, for example a vibration, as a user scrolls over a lumen image encoding a threshold value of a particular image parameter. In related embodiments, a haptic indicator can be activated if a particular image encodes the desired parameter, or an image parameter threshold is encoded in the image.
[0054] Systems and methods of the invention have application in intravascular imaging methodologies such as intravascular ultrasound (IVUS) and optical coherence tomography (OCT) among others that produce a three-dimensional image of a lumen. A segment of a lumen 101 is shown in FIG. 1 in a 3D-view having a feature 113 of interest. FIG. 2 shows a cross-section of lumen 101 through feature 113. In certain embodiments, intravascular imaging involves positioning an imaging device near feature 113 and collecting data representing a three-dimensional image.
[0055] Various lumens of biological structures may be imaged with the described technologies, including blood vessels, vasculature of the lymphatic and nervous systems, various structures of the gastrointestinal tract including lumen of the small intestine, large intestine, stomach, esophagus, colon, pancreatic duct, bile duct, hepatic duct, lumen of the reproductive tract including the vas deferens, vagina, uterus and fallopian tubes, structures of the urinary tract including urinary collecting ducts, renal tubules, ureter, and bladder, and structures of the head and neck and pulmonary system including sinuses, parotid, trachea, bronchi, and lungs.
[0056] The arteries of the heart are particularly useful to examine with imaging devices such as OCT. OCT imaging of the coronary arteries can determine the amount of plaque built up at any particular point in the coronary artery. The accumulation of plaque within the artery wall over decades is the setup for vulnerable plaque which, in turn, leads to heart attack and stenosis (narrowing) of the artery. OCT is useful in determining both plaque volume within the wall of the artery and/or the degree of stenosis of the artery lumen. It can be especially useful in situations in which angiographic imaging is considered unreliable, such as for the lumen of ostial lesions or where angiographic images do not visualize lumen segments adequately. Example regions include those with multiple overlapping arterial segments. It is also used to assess the effects of treatments of stenosis such as with hydraulic angioplasty expansion of the artery, with or without stents, and the results of medical therapy over time. In an exemplary embodiment, the invention provides a system for capturing a three dimensional image by OCT.
[0057] OCT is a medical imaging methodology using a specially designed catheter with a miniaturized near infrared light-emitting probe attached to the distal end of the catheter. As an optical signal acquisition and processing method, it captures micrometer-resolution, three-dimensional images from within optical scattering media (e.g., biological tissue). Commercially available OCT systems are employed in diverse applications, including art conservation and diagnostic medicine, notably in ophthalmology where it can be used to obtain detailed images from within the retina. The detailed images of the retina allow one to identify several eye diseases and eye trauma. Recently it has also begun to be used in interventional cardiology to help diagnose coronary artery disease. OCT allows the application of interferometric technology to see from inside, for example, blood vessels, visualizing the endothelium (inner wall) of blood vessels in living individuals.
[0058] Other applications of OCT and other signal processing imaging systems for biomedical imaging include use in: dermatology in order to image subsurface structural and blood flow formation; dentistry in order to image the structure of teeth and gum line to identify and track de-mineralization and re-mineralization, tarter, caries, and periodontal disease; gastroenterology in order to image the gastrointestinal tract to detect polyps and inflammation, such as that caused by Crohn's disease and ulcerative colitis; cancer diagnostics in order to discriminate between malignant and normal tissue.
[0059] Generally, an OCT system comprises three components which are 1) an imaging catheter 2) OCT imaging hardware, 3) host application software. When utilized, the components are capable of obtaining OCT data, processing OCT data, and transmitting captured data to a host system. OCT systems and methods are generally described in Milner et al., U.S. Patent Application Publication No. 2011/0152771, Condit et al., U.S. Patent Application Publication No. 2010/0220334, Castella et al., U.S. Patent Application Publication No. 2009/0043191, Milner et al., U.S. Patent Application Publication No. 2008/0291463, and Kemp, N., U.S. Patent Application Publication No. 2008/0180683, the content of each of which is incorporated by reference in its entirety. In certain embodiments, systems and methods of the invention include processing hardware configured to interact with more than one different three dimensional imaging system so that the tissue imaging devices and methods described here in can be alternatively used with OCT, IVUS, or other hardware.
[0060] In OCT, a light source delivers a beam of light to an imaging device to image target tissue. Light sources can be broad spectrum light sources, or provide a more limited spectrum of wavelengths, e.g., near infra-red. The light sources may be pulsed or continuous wave. For example the light source may be a diode (e.g., superluminescent diode), or a diode array, a semiconductor laser, an ultrashort pulsed laser, or supercontinuum light source. Typically the light source is filtered and allows a user to select a wavelength of light to be amplified. Wavelengths commonly used in medical applications include near-infrared light, for example between about 800 nm and about 1700 nm. Methods of the invention apply to image data obtained from obtained from any OCT system, including OCT systems that operate in either the time domain or frequency (high definition) domain.
[0061] In time-domain OCT, an interference spectrum is obtained by moving a scanning optic, such as a reference mirror, longitudinally to change the reference path and match multiple optical paths due to reflections of the light within the sample. The signal giving the reflectivity is sampled over time, and light traveling at a specific distance creates interference in the detector. Moving the scanning mechanism laterally (or rotationally) across the sample produces reflectance distributions of the sample (i.e., an imaging data set) from which two-dimensional and three-dimensional images can be produced.
[0062] In frequency domain OCT, a light source capable of emitting a range of optical frequencies passes through an interferometer, where the interferometer combines the light returned from a sample with a reference beam of light from the same source, and the intensity of the combined light is recorded as a function of optical frequency to form an interference spectrum. A Fourier transform of the interference spectrum provides the reflectance distribution along the depth within the sample.
[0063] Several methods of frequency domain OCT are described in the literature. In spectral-domain OCT (SD-OCT), also sometimes called "Spectral Radar" (Optics Letters, vol. 21, No. 14 (1996) 1087-1089), a grating or prism or other means is used to disperse the output of the interferometer into its optical frequency components. The intensities of these separated components are measured using an array of optical detectors, each detector receiving an optical frequency or a fractional range of optical frequencies. The set of measurements from these optical detectors forms an interference spectrum (Smith, L. M. and C. C. Dobson, Applied Optics vol. 28: (1989) 3339-3342), wherein the distance to a scatterer is determined by the wavelength dependent fringe spacing within the power spectrum. SD-OCT has enabled the determination of distance and scattering intensity of multiple scatters lying along the illumination axis by analyzing the exposure of an array of optical detectors so that no scanning in depth is necessary.
[0064] Alternatively, in swept-source OCT, the interference spectrum is recorded by using a source with adjustable optical frequency, with the optical frequency of the source swept through a range of optical frequencies, and recording the interfered light intensity as a function of time during the sweep. An example of swept-source OCT is described in U.S. Pat. No. 5,321,501.
[0065] Time- and frequency-domain systems can further vary based upon the optical layout of the systems: common beam path systems and differential beam path systems. A common beam path system sends all produced light through a single optical fiber to generate a reference signal and a sample signal whereas a differential beam path system splits the produced light such that a portion of the light is directed to the sample and the other portion is directed to a reference surface. Common beam path systems are described in U.S. Pat. Nos. 7,999,938; 7,995,210; and 7,787,127 and differential beam path systems are described in U.S. Pat. Nos. 7,783,337; 6,134,003; and 6,421,164, the contents of each of which are incorporated by reference herein in their entireties.
[0066] In certain embodiments, the invention provides a differential beam path OCT system with intravascular imaging capability as illustrated in FIG. 3. For intravascular imaging, a light beam is delivered to the vessel lumen via a fiber-optic based imaging catheter 826. The imaging catheter is connected through hardware to software on a host workstation. The hardware includes imagining engine 859 and a handheld patient interface module (PIM) 839 that includes user controls. The proximal end of imaging catheter 826 is connected to PIM 839, which is connected to imaging engine 859 as shown in FIG. 3.
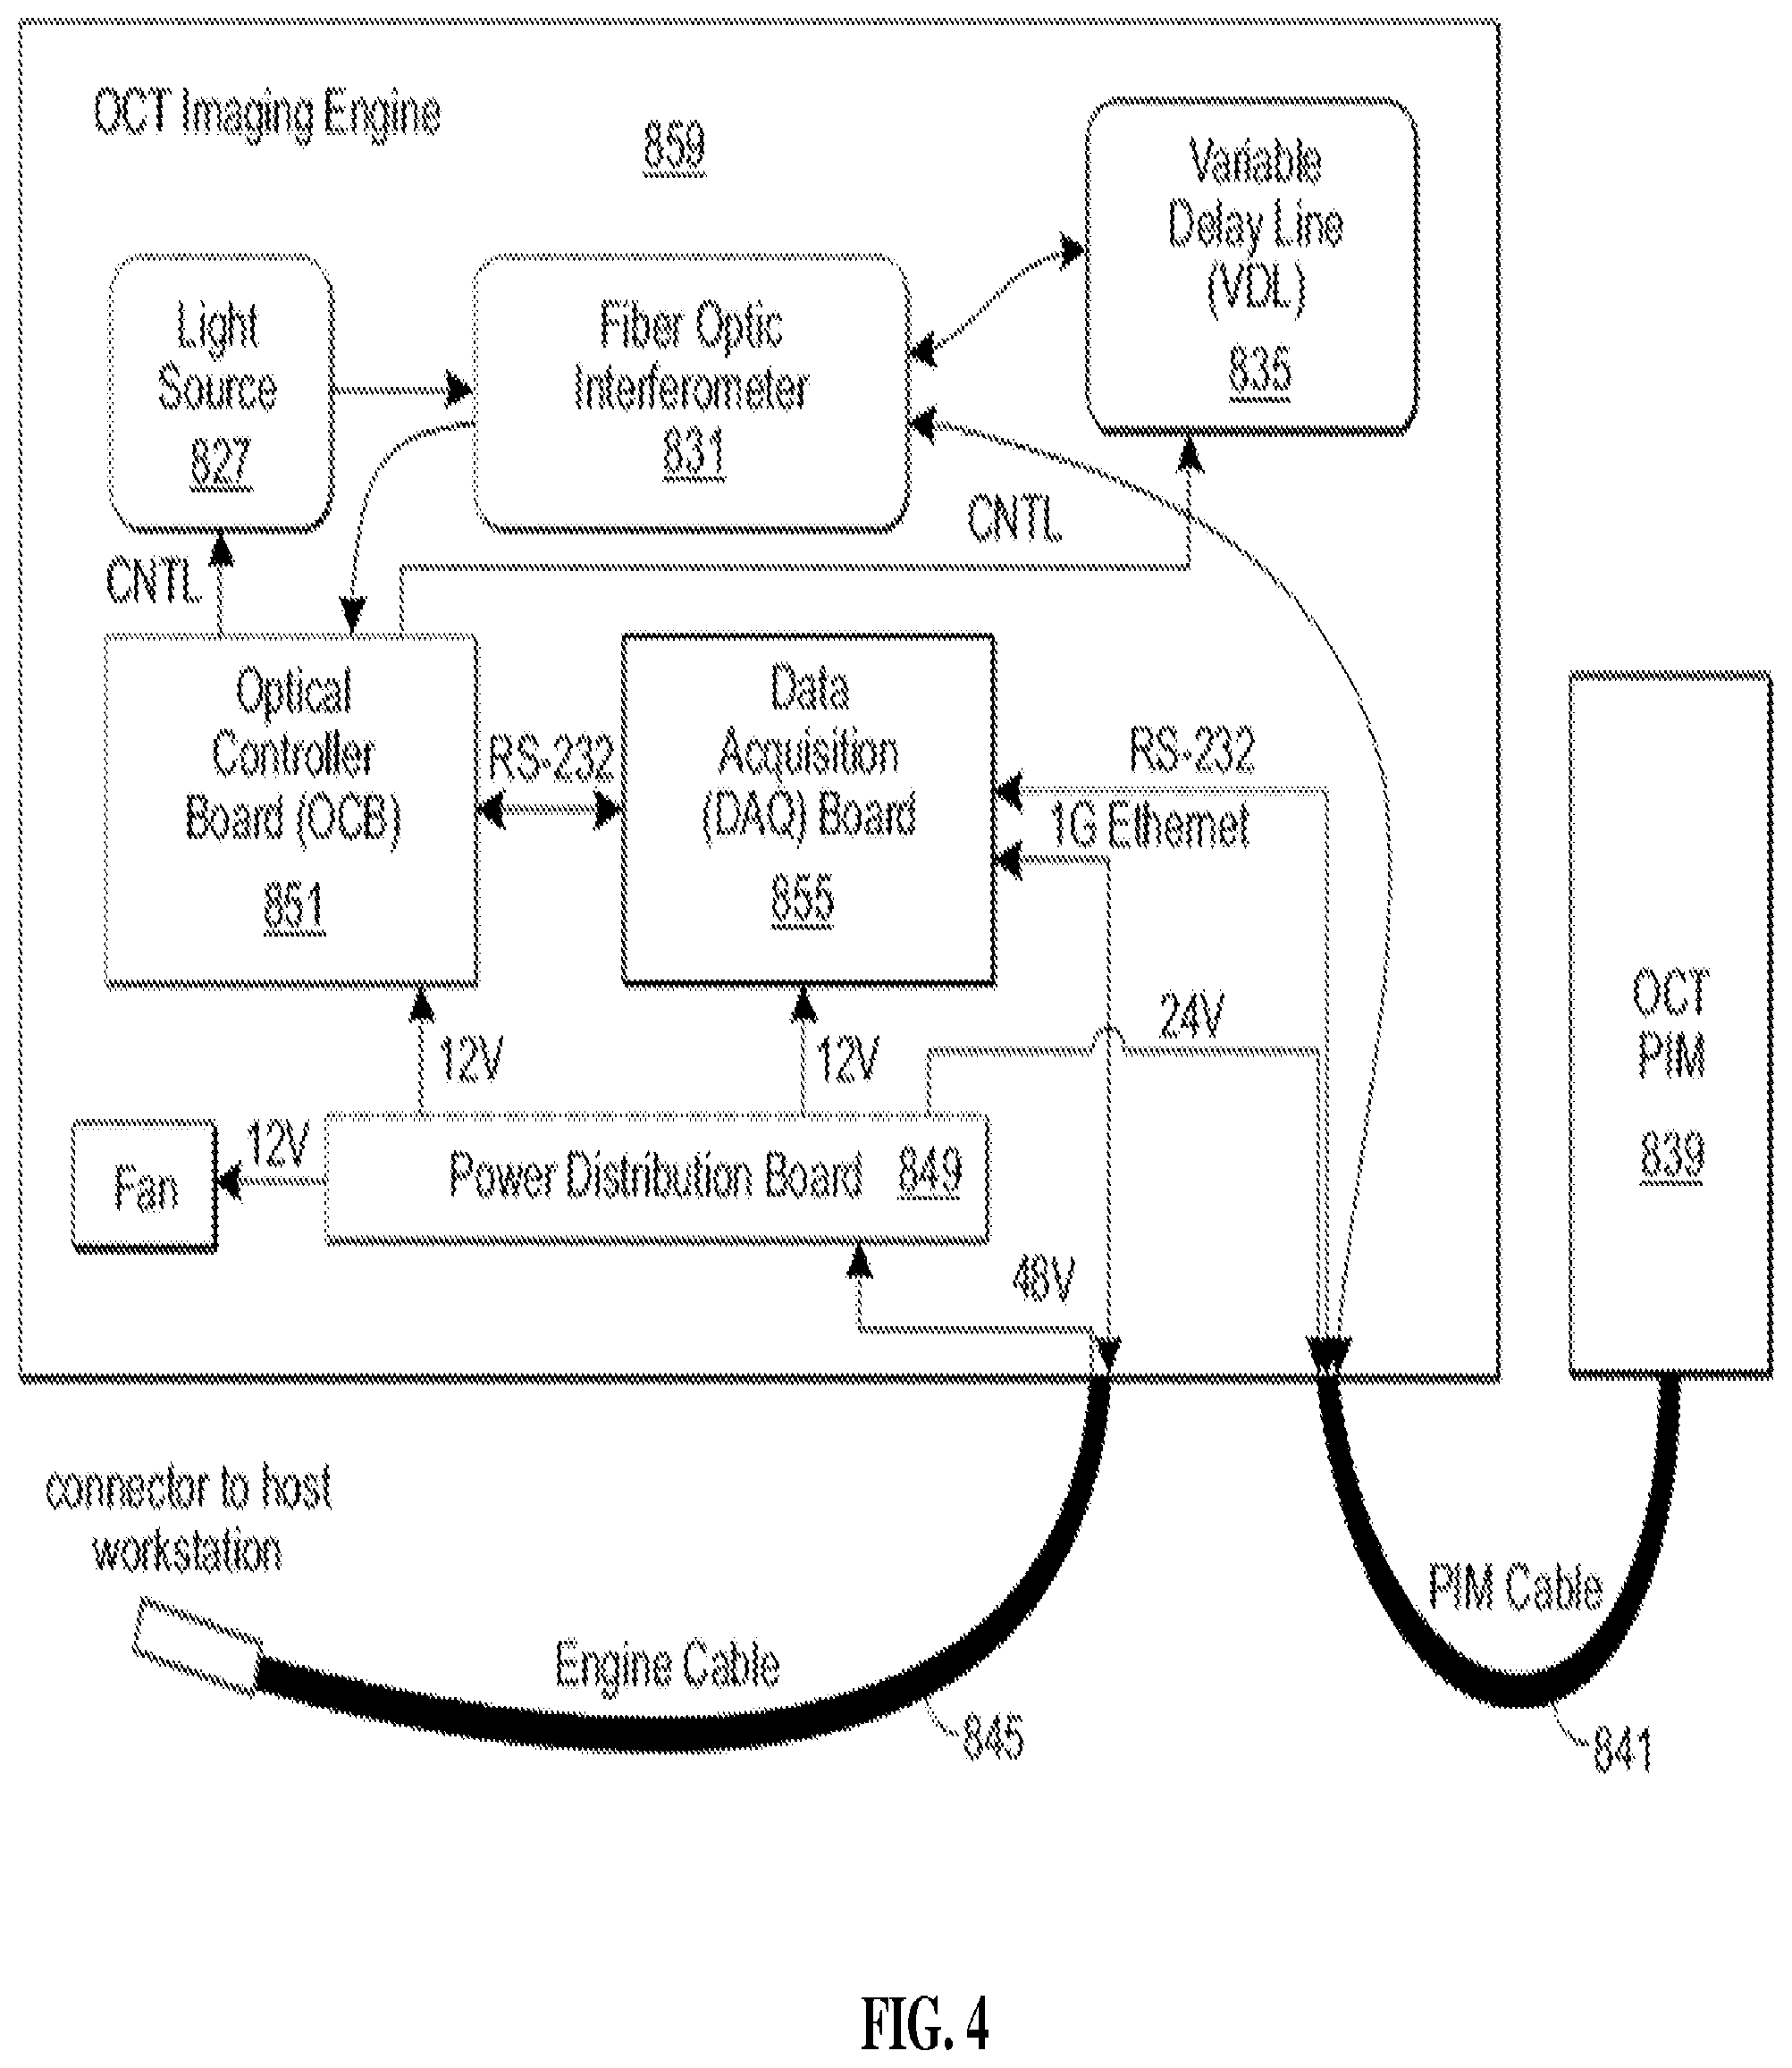
[0067] An embodiment of imaging engine 859 is shown in FIG. 4. Imaging engine 859 (i.e., the bedside unit) houses power distribution board 849, light source 827, interferometer 831, and variable delay line 835 as well as a data acquisition (DAQ) board 855 and optical controller board (OCB) 851. PIM cable 841 connects imagining engine 859 to PIM 839 and engine cable 845 connects imaging engine 859 to the host workstation (not shown).
[0068] FIG. 5 shows an exemplary light path in a differential beam path system which may be used in an OCT system suitable for use with the invention. Light for producing the measurements originates within light source 827. This light is split between main OCT interferometer 905 and auxiliary interferometer 911. In some embodiments, the auxiliary interferometer is referred to as a "clock" interferometer. Light directed to main OCT interferometer 905 is further split by splitter 917 and recombined by splitter 919 with an asymmetric split ratio. The majority of the light from splitter 917 is guided into sample path 913 while the remainder goes into reference path 915. Sample path 917 includes optical fibers running through PIM 839 and imaging catheter core 826 and terminating at the distal end of the imaging catheter, where the sample is measured.
[0069] The reflected light is transmitted along sample path 913 to be recombined with the light from reference path 915 at splitter 919. A variable delay line (VDL) 925 on the reference path uses an adjustable fiber coil to match the length of reference path 915 to the length of sample path 913. The reference path length is adjusted by a stepper motor translating a mirror on a translation stage under the control of firmware or software.
[0070] The combined light from splitter 919 is split into orthogonal polarization states, resulting in RF-band polarization-diverse temporal interference fringe signals. The interference fringe signals are converted to photocurrents using PIN photodiodes 929a, and 929b, on optical controller board (OCB) 851. The interfering, polarization splitting, and detection steps are done by a polarization diversity module (PDM) (not shown) on OCB 851. Signal from OCB 851 is sent to DAQ 855, shown in FIG. 4. DAQ 855 includes a digital signal processing (DSP) microprocessor and a field programmable gate array (FPGA) to digitize signals and communicate with the host workstation and PIM 839. The FPGA converts raw optical interference signals into meaningful reflectivity measurements. DAQ 855 also compresses data as necessary to reduce image transfer bandwidth, e.g., to 1 Gbps, e.g., by compressing frames with a glossy compression JPEG encoder.
[0071] Typical intravascular OCT involves introducing the imaging catheter into a patient's target vessel using standard interventional techniques and tools such as a guide wire, guide catheter, and angiography system. The imaging catheter may be integrated with IVUS by an OCT-IVUS system for concurrent imaging, as described in, for example, Castella et al. U.S. Patent Application Publication No. 2009/0043191 and Dick et al. U.S. Patent Application Publication No. 2009/0018393, both of which are incorporated by reference in their entireties.
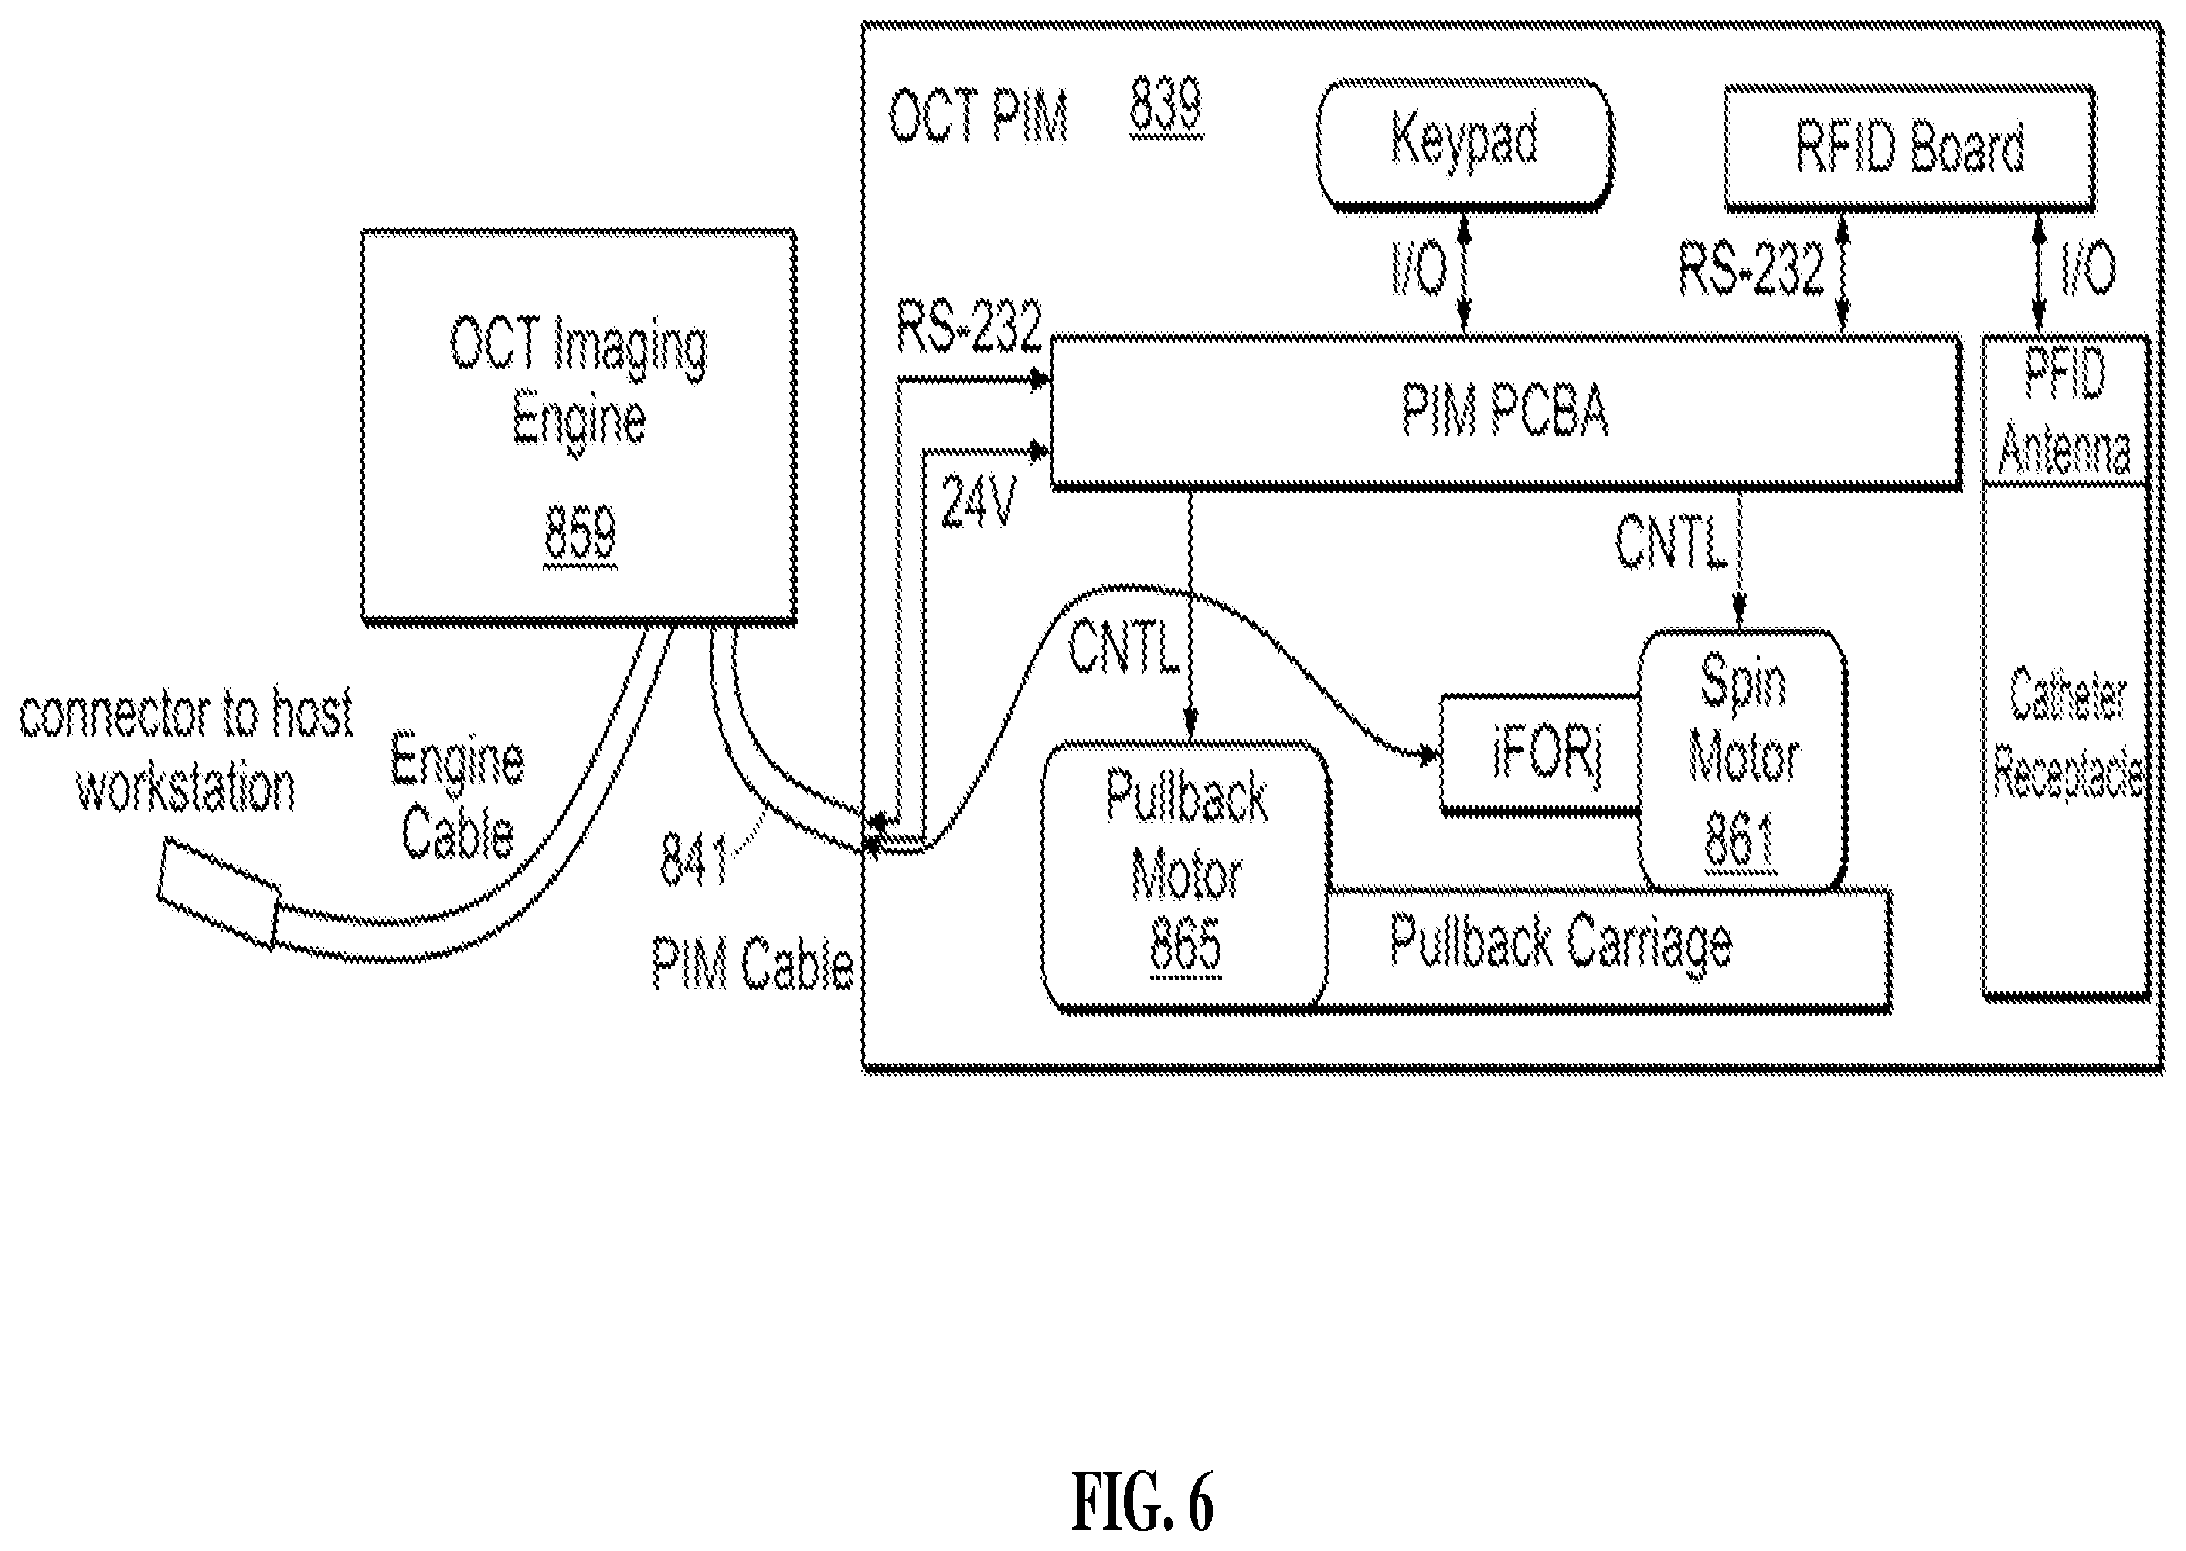
[0072] The details of PIM 839 which control the sample measurements are shown in FIG. 6. Rotation of imaging catheter core 826 is driven by spin motor 861 while proximal translation of imaging catheter core 826 is driven by pullback motor 665. The combination of rotation and translation along axis 117 produces a spiral motion for image illumination and collection, as described by FIG. 7. In many embodiments, blood within the lumen to be imaged is temporarily flushed with a clear solution prior to imaging. The reflected light is received by an inner core of imaging catheter core 826 and optically interacts with light from the reference path, giving rise to an array of reflectance distribution vectors (A-scans) as illustrated schematically in FIG. 8.
[0073] FIG. 9 shows an exemplary schematic of the positioning of A-scans within a lumen, e.g., a vessel. The separation between the A-scan lines has been exaggerated for simplicity. At each place where an A-scan, e.g., A.sub.11, A.sub.12, . . . , A.sub.N, intersects a surface of the lumen (e.g., a vessel wall) sample light illuminates the sample, is reflected, and a portion of the reflected light is captured. The captured reflected light then interacts with reference light and then is detected, as described above. Differences in reflections detected along each A-scan line are associated with features within the imaged lumen. Data is collected from A-scans A.sub.11, A.sub.12, . . . , A.sub.N and stored in a tangible, non-transitory memory. Typically, rotational systems consist of an imaging core which rotates and pulls back (or pushes forward) while recording an image video loop. This motion results in a three dimensional dataset of two dimensional image frames, where each frame provides a 360.degree. slice of the vessel at different longitudinal locations.
[0074] A collective set of A-scans generally corresponding to one rotation of catheter imaging core 826 around axis 117 is used to produce a B-scan. FIG. 10 illustrates a set of A-scans A.sub.11, A.sub.12, . . . , A.sub.18 used to compose a B-scan according to certain embodiments of the invention. These A-scan lines are shown as would be seen looking down axis 117 (i.e., longitudinal distance between them is not shown). While eight A-scan lines are illustrated in FIG. 10, typical OCT applications can include between 300 and 1,000 A-scan lines per B-scan (e.g., about 660).
[0075] The data of all the A-scan lines together can be used to create three-dimensional images of the tissue. First, the A-scans can be used to create a B-scan, which in one embodiment is a cross-sectional image of the lumen sometimes referred to as a tomographic view. For example, FIG. 12 shows a B-scan comprising a set of 660 A-scans collected as described in FIGS. 7-11, i.e., within a cross section of a vessel. Alternatively, the set of A-scans may be transformed by a rotational imaging modality to form a B-scan corresponding to a cross-sectional image, as shown in FIG. 13. The rotational measurement of the catheter in a counter-clockwise fashion is indicated by the circular white arrow in FIG. 13. This sampling motion corresponds to the motion of the white arrow from 0 to 660 in FIG. 12. It should also be noted in FIGS. 12-13 that the imaging catheter was closer to the upper vessel wall, leading to the concentric circles at the 12 o'clock position in FIG. 13 and a lack of symmetry FIG. 12. After B-scans are produced as a function of position along axis 117, the B-scans can be processed to produce longitudinal and three-dimensional views of the lumen, such as shown in FIGS. 22 and 23.
[0076] In order to construct the images, the collected reflectivity measurements are processed with various computer or processor-based systems which compile data from measurements into a pictorial format. For example, the system described in FIG. 14 may be used to construct intraluminal images from OCT probe measurements, and optionally display the images to a user of the OCT system. In some embodiments, a user interacts with a visual interface to view images from the imaging system. Input from a user (e.g., parameters or a selection) are received by a processor in an electronic device. The selection can be rendered into a visible display. An exemplary system including an electronic device is illustrated in FIG. 14. As shown in FIG. 14, imaging engine 859 communicates with host workstation 2433 as well as optionally server 2413 over network 2409. In some embodiments, an operator uses computer 2449 or terminal 2467 to control system 2400 or to receive images. An image may be displayed using an I/O 2454, 2437, or 2471, which may include a monitor. An I/O may include a keyboard, mouse or touchscreen to communicate with any of processor 2421, 2459, 2441, or 2475, for example, to cause data to be stored in any tangible, nontransitory memory 2463, 2445, 2479, or 2429. Server 2413 generally includes an interface module 2425 to effectuate communication over network 2409 or write data to data file 2417.
[0077] System 2400 may be used to execute instructions to display images in an interactive format, e.g., with indicators, as described above. Alternatively, an imaging data set may be assessed, analyzed, and transformed with a system comprising CPU 1510, storage 1520, and monitor 1530. Storage 1520 may contain instructions for carrying out methods of the invention, e.g., to configure CPU 1510 to analyze the imaging data set for a parameter, assign an indicator to the medical device based on the presence of the parameter, and display the indicator on monitor 1530. For example CPU 1510 may direct monitor 1530 to display a longitudinal image of a lumen with a color-coded stent. In some embodiments, a system of the invention will additionally comprise graphical user interface (GUI) 1540, which allows a user to interact with the images. In some embodiments, CPU 1510, storage 1520, and monitor 1530 may be encompassed within system 2400.
[0078] The systems and methods of use described herein can be performed using any type of computing device, such as a computer, that includes a processor or any combination of computing devices where each device performs at least part of the process or method. In some embodiments, systems and methods described herein may be performed with a handheld device, e.g., a smart tablet, or a smart phone, or a specialty device produced for the system.
[0079] In some embodiments, a device of the invention includes an OCT imaging system and obtains a three-dimensional data set through the operation of OCT imaging hardware. In some embodiments, a device of the invention is a computer device such as a laptop, desktop, or tablet computer, and obtains a three-dimensional data set by retrieving it from a tangible storage medium, such as a disk drive on a server using a network or as an email attachment.
[0080] Methods of the invention can be performed using software, hardware, firmware, hardwiring, or combinations of any of these. Features implementing functions can also be physically located at various positions, including being distributed such that portions of functions are implemented at different physical locations (e.g., imaging apparatus in one room and host workstation in another, or in separate buildings, for example, with wireless or wired connections).
[0081] Processors suitable for the execution of computer program include, by way of example, both general and special purpose microprocessors, and any one or more processor of any kind of digital computer. Generally, a processor will receive instructions and data from a read-only memory or a random access memory or both. The essential elements of computer are a processor for executing instructions and one or more memory devices for storing instructions and data. Generally, a computer will also include, or be operatively coupled to receive data from or transfer data to, or both, one or more mass storage devices for storing data, e.g., magnetic, magneto-optical disks, or optical disks. Information carriers suitable for embodying computer program instructions and data include all forms of non-volatile memory, including by way of example semiconductor memory devices, (e.g., EPROM, EEPROM, solid state drive (SSD), and flash memory devices); magnetic disks, (e.g., internal hard disks or removable disks); magneto-optical disks; and optical disks (e.g., CD and DVD disks). The processor and the memory can be supplemented by, or incorporated in, special purpose logic circuitry.
[0082] To provide for interaction with a user, the subject matter described herein can be implemented on a computer having an I/O device, e.g., a CRT, LCD, LED, or projection device for displaying information to the user and an input or output device such as a keyboard and a pointing device, (e.g., a mouse or a trackball), by which the user can provide input to the computer. Other kinds of devices can be used to provide for interaction with a user as well. For example, feedback provided to the user can be any form of sensory feedback, (e.g., visual feedback, auditory feedback, or tactile feedback), and input from the user can be received in any form, including acoustic, speech, or tactile input.
[0083] The subject matter described herein can be implemented in a computing system that includes a back-end component (e.g., a data server), a middleware component (e.g., an application server), or a front-end component (e.g., a client computer having a graphical user interface or a web browser through which a user can interact with an implementation of the subject matter described herein), or any combination of such back-end, middleware, and front-end components. The components of the system can be interconnected through network by any form or medium of digital data communication, e.g., a communication network. Examples of communication networks include cell network (e.g., 3G or 4G), a local area network (LAN), and a wide area network (WAN), e.g., the Internet.
[0084] The subject matter described herein can be implemented as one or more computer program products, such as one or more computer programs tangibly embodied in an information carrier (e.g., in a non-transitory computer-readable medium) for execution by, or to control the operation of, data processing apparatus (e.g., a programmable processor, a computer, or multiple computers). A computer program (also known as a program, software, software application, app, macro, or code) can be written in any form of programming language, including compiled or interpreted languages (e.g., C, C++, Perl), and it can be deployed in any form, including as a stand-alone program or as a module, component, subroutine, or other unit suitable for use in a computing environment. Systems and methods of the invention can include instructions written in any suitable programming language known in the art, including, without limitation, C, C++, Perl, Java, ActiveX, HTML5, Visual Basic, or JavaScript.
[0085] A computer program does not necessarily correspond to a file. A program can be stored in a file or a portion of file that holds other programs or data, in a single file dedicated to the program in question, or in multiple coordinated files (e.g., files that store one or more modules, sub-programs, or portions of code). A computer program can be deployed to be executed on one computer or on multiple computers at one site or distributed across multiple sites and interconnected by a communication network.
[0086] A file can be a digital file, for example, stored on a hard drive, SSD, CD, or other tangible, non-transitory medium. A file can be sent from one device to another over a network (e.g., as packets being sent from a server to a client, for example, through a Network Interface Card, modem, wireless card, or similar).
[0087] Writing a file according to the invention involves transforming a tangible, non-transitory computer-readable medium, for example, by adding, removing, or rearranging particles (e.g., with a net charge or dipole moment into patterns of magnetization by read/write heads), the patterns then representing new collocations of information about objective physical phenomena desired by, and useful to, the user. In some embodiments, writing involves a physical transformation of material in tangible, non-transitory computer readable media (e.g., with certain optical properties so that optical read/write devices can then read the new and useful collocation of information, e.g., burning a CD-ROM). In some embodiments, writing a file includes transforming a physical flash memory apparatus such as NAND flash memory device and storing information by transforming physical elements in an array of memory cells made from floating-gate transistors. Methods of writing a file are well-known in the art and, for example, can be invoked manually or automatically by a program or by a save command from software or a write command from a programming language.
[0088] Suitable computing devices typically include mass memory, at least one graphical user interface, at least one display device, and typically include communication between devices. The mass memory illustrates a type of computer-readable media, namely computer storage media. Computer storage media may include volatile, nonvolatile, removable, and non-removable media implemented in any method or technology for storage of information, such as computer readable instructions, data structures, program modules, or other data. Examples of computer storage media include RAM, ROM, EEPROM, flash memory, or other memory technology, CD-ROM, digital versatile disks (DVD) or other optical storage, magnetic cassettes, magnetic tape, magnetic disk storage or other magnetic storage devices, Radiofrequency Identification tags or chips, or any other medium which can be used to store the desired information and which can be accessed by a computing device.
[0089] Exemplary step-by-step methods are described schematically in FIGS. 16A-D. It will be understood that each block of FIGS. 16A-D, as well as any portion of the systems and methods disclosed herein, can be implemented by computer program instructions. These program instructions may be provided to a processor to produce a machine, such that the instructions, which execute on the processor, create means for implementing the actions specified in the FIGS. 16A-D or described for the systems and methods disclosed herein. The computer program instructions may be executed by a processor to cause a series of operational steps to be performed by the processor to produce a computer implemented process. The computer program instructions may also cause at least some of the operational steps to be performed in parallel. Moreover, some of the steps may also be performed across more than one processor, such as might arise in a multi-processor computer system. In addition, one or more processes may also be performed concurrently with other processes or even in a different sequence than illustrated without departing from the scope or spirit of the invention.
[0090] A basic function of a system of the invention is described in FIG. 16A in which an image data set is received, one or more parameters is specified and analyzed, an indicator is selected, and the indicator is displayed. In some instances, e.g., as shown in FIG. 16B a threshold value of the parameter will be defined by the user, however in other instances this is not necessary. Additionally, as shown in FIG. 16B the user may be provided with a GUI to set a threshold alert and interact with the images, thereby triggering an alert when the threshold value is exceeded. In alternative embodiments, e.g., as shown in FIGS. 16C and 16D, a user may also cause parameter values to be displayed or cause additional images to be displayed by interacting with the GUI.
[0091] Threshold analysis can be completed using algorithms known in the field of image analysis. For example, a value input by a user may be converted into a threshold level which will be applied to one or more pixels of a B-scan image (e.g., FIG. 12). When the level of the measured pixels is greater than the threshold value, the corresponding pixels in the scan converted image (e.g., FIG. 13) will be displayed in green. When the level of the pixels is less than the threshold value, the corresponding pixels in the scan converted image (e.g., FIG. 13) will be displayed in red. The method can be extended to produce multicolored displays by using threshold ranges, i.e., multiband thresholding. In some instances, the threshold levels maybe preset, or the user may select from a list or preset levels, for example, by selecting levels from a pull-down menu in the GUI.
[0092] In other instances, automatic thresholding may be used, wherein an image data set is analyzed to determine a distribution of levels of pixels for a location in the images (e.g., the OCT B-scans), the median of the distribution is set as the threshold, and then pixels of images which fall above and below the threshold may be colored appropriately. In some embodiments, only the pixels that fall outside of a statistical range will be color coded.
[0093] It is also intended that a user could define a threshold which will correspond to an aspect of a scan converted image (e.g., FIG. 13) or a longitudinal or 3D view of a lumen. For example, a user could define a threshold for a minimum lumen area. The system would automatically determine a lumen area for each segment of the lumen based upon an analysis of the B-Scan or the scan converted image, and then compare the threshold for a minimum lumen area to the determined lumen area for each segment. Segments having a lumen area less than the minimum lumen area could be color-coded red, for example.
[0094] Systems and methods of the invention provide images of lumen where parameters are displayed as indicators to assist a user in identifying key features which may be indicative of a disease or disorder. For example, a user may set a threshold value for a diameter of a lumen to be imaged with OCT. When the user views the images of a lumen, an indicator, e.g., a color code, is also displayed atop the image as shown in FIGS. 17 and 18. In the instance of a lumen having a lumen area smaller than the threshold (FIG. 17), the perimeter of the lumen may be colored red or a red dot may be displayed in the center of the image. In the instance of a lumen having a lumen area greater than the threshold (FIG. 18), the perimeter of the lumen may be colored green or a green dot may be displayed in the center of the image. Various other indicators could be used in the image, for example a prominent "X" for the lumen having a lumen area less than the threshold, and a prominent check mark for the lumen having a lumen area greater than the threshold. Combinations of colors and marks would also be suitable. To the extent that the displayed indicators obstructed the view of key image features, the indicators can be made partially transparent, e.g., as shown in FIGS. 19 and 20, where the images of FIGS. 17 and 18 (respectively) are marked with semi-transparent indicators. In other embodiments, the user may be able to toggle the indicators on or off, for example by "right-clicking" on the image and selecting to turn off the indicators. While not shown in the FIGS., it is envisioned that, in some embodiments, a user can call up specific values of a parameter, e.g., a diameter of a lumen, by interacting with the image. Alternatively, interacting with the image may trigger a visual, audio, or haptic alert. In some embodiments, interacting with the image may prompt display of values of a parameter in another visual format, for example as a gauge, such as the gauge displayed in FIG. 21A. Combinations of the above listed indicators and alerts are also possible.
[0095] In other embodiments, it will be advantageous to display measurements of a lumen in a longitudinal format, e.g., as shown in FIG. 22. As shown in FIG. 22, a number of B-scans are laid end-to-end, and a cut away is produced as if looking down into the lumen. Like the cross-sectional views of FIGS. 17-20, the perimeter of the longitudinal image can be color coded to indicate values of a parameter, e.g., with respect to a threshold value or with respect to each other. In some embodiments, the volume of the cut away can be filled with color or other symbols to indicate areas of concern.
[0096] As shown in FIG. 22, sections of the lumen in which the diameter is smaller than a threshold can be shaded with one color, e.g., red, and sections of the lumen in which the diameter is larger than a threshold can be shaded with another color e.g., green. Alternatively, the diameters can be indicated with shaded regions. In FIG. 22, a constricted region is indicated with a darker box while an unconstricted region is indicated with a lighter box. In other embodiments (not shown) a longitudinal view of the lumen may be displayed and a user can call up specific values of a parameter, e.g., a diameter of a lumen, by interacting with the image. Alternatively, interacting with the image may trigger a visual, audio, or haptic alert. For example, the user could drag a mouse pointer along the length of the longitudinal image and receive a haptic alert when the pointer is in a region of occlusion.
[0097] In other embodiments, it will be advantageous to display measurements of a lumen in a three-dimensional format, e.g., as shown in FIG. 23. As shown in FIG. 23, a number of B-scans are laid end-to-end, and a three-dimensional view of the lumen is produced. The three-dimensional view may be color-coded to indicate values of a parameter, e.g., with respect to a threshold value or with respect to each other. As shown in FIG. 23, sections of the lumen in which the diameter is smaller than a threshold can be shaded with one color, e.g., red, and sections of the lumen in which the diameter is larger than a threshold can be shaded with another color, e.g., green. Intermediate regions may be shaded with a third color, e.g., yellow. The image may be scaled with hundreds of colors spanning from red to green. In other embodiments (not shown) a three-dimensional view of the lumen may be displayed and a user can call up specific values of a parameter, e.g., a diameter of a lumen, by interacting with the image. Alternatively, interacting with the image may trigger a visual, audio, or haptic alert. For example the user could drag a mouse pointer along the length of the three-dimensional image and receive a haptic alert when the pointer is in a region of occlusion. In other embodiments, a user can click on a region of interest and bring up an alternative image, e.g., a cross sectional image, as shown in FIG. 24.
[0098] In certain embodiments a user can employ an indicator such as navigation line, a cursor, a callout marker or the like to identify an image plane in an image being viewed. For example, a three-dimensional image of a vessel can be constructed from a set of two-dimensional image frames. A user can scroll over the three-dimensional image with an indicator to identify a particular image frame corresponding to the location of the indicator on the image, as shown in FIG. 24. The particular image frame can be selected and displayed in a two-dimensional format. In certain embodiments, as a user scrolls an indicator over or through a three-dimensional image with one or more image frame having a diagnostic property at a predefined threshold, the user will be alerted by the computer as described herein.
[0099] Using the systems and methods of the invention it is also possible to analyze and display images of medical devices with indicators relating to a parameter. As shown in FIG. 25, a splayed B-scan of a stent within a lumen can be displayed with values of apposition indicated with various colors. (In a splayed B-scan the luminal walls of a three-dimensional construct, i.e., FIG. 23, are unrolled into a two dimensional sheet.) In FIG. 25, the stent is visible as zigzag pattern across the image. Portions of the stent that display incomplete apposition ("malapposed") are shown in a dark color, while portions of the stent that are properly apposed are shown in a lighter color. In alternative embodiments, a user could interact with the image of the stent and trigger an alert, for example, when a portion of the stent displayed incomplete apposition. In other embodiments, a user could call up specific values of a parameter, e.g., apposition of the stent, by interacting with the image. In another embodiment, a user may cause a stent apposition gauge to be displayed, such as shown in FIG. 21B.
[0100] While other methods are known, systems of the invention may use edge detection algorithms to determine the boundaries of the stent and the corresponding overlap (or lack thereof) with the lumen wall. Edges of the stent may be detectable in the A-scans as pronounced changes in reflectivity, i.e., a reflectivity change of more than 10%, more than 30%, more than 50%, or more than 100%, within less than 5 mm, less than 3 mm, less than 2 mm, or less than 1 mm radial distance. A front and back radial edge of the stent can be found by determining the location of two edges in the A-scan. Alternatively, stents may be located in B-scans by determining regions of pronounced change in pixel levels, corresponding to the change in reflectivity of the A-scan discussed above.
[0101] A value for the apposition of a stent may be determined by combining stent edge detection with methods for identifying lumen borders, i.e., lumen walls. The lumen border can be automatically or semi-automatically detected in an image using any method known in the art, such as the techniques disclosed in U.S. Pat. No. 7,978,916, S. Tanimoto, G. Rodriguez-Granillo, P. Barlis, S. deWinter, N. Bruining, R. Hamers, M. Knappen, S. Verheye, P. W. Serruys, and E. Regar, "A novel approach for quantitative analysis of intracoronary optical coherencetomography: High inter-observer agreement with computer-assisted contour detection," Cathet. Cardiovasc. Intervent. 72, 228-235 (2008); K. Sihan, C. Botka, F. Post, S. deWinter, E. Regar, R. Hamers, and N. Bruining, "A novel approach to quantitative analysis of intraluminal optical coherence tomography imaging," Comput. Cardiol. 1089-1092 (2008); J. Canny, "A computational approach to edge detection," IEEE Trans. Pattern Anal. Mach. Intell. 8, 679-698 (1986), all incorporated herein by reference in their entireties.
[0102] In one embodiment, a value for the apposition can be determined by subtracting the radial distance of the front radial edge of the lumen border from the back radial edge of the stent. A positive value indicates a gap or a malapposed stent. A zero value or negative value would indicate that there was no gap, or that tissue had partially covered the stent. In some embodiments, the stent would be color coded to indicate that a portion of the stent was not in contact with the lumen border. In some embodiments, a scan converted image corresponding to a segment of the lumen with a malapposed stent will be color coded, or will be identified with an alert to facilitate identification by a user.
[0103] In an alternative embodiment, as shown in FIG. 26, the stent and the lumen can be shown simultaneously in a three-dimensional view. Portions of the stent that display incomplete apposition are shown in a dark color and portions of the stent that are properly apposed are shown in a lighter color.
[0104] In other embodiments, the user may interact with a portion of an image to set a range for identification of a parameter. For example, as shown in FIG. 27, a user may set the limits of a luminal image to be processed for a parameter, e.g., stent apposition, and the system of the invention will overlay indicators based on the parameter only in the region of interest.
[0105] Systems and methods of the invention include image-processing techniques that provide automatic detection of objects, such as stents, within intraluminal images. Typically, the OCT intraluminal image is an intravascular image taken within a lumen of a blood vessel, but the detection methods described herein can be used to detect objects within other biological lumens, such as the intestine. Although the following description is directed towards detecting objects in OCT images, one skilled in the art would readily recognize that methods and systems of intention can be utilized to detect objects in any intraluminal images obtained from any other imaging technique, such as intravascular ultrasound imaging (IVUS) and combined OCT-IVUS.
INCORPORATION BY REFERENCE
[0106] References and citations to other documents, such as patents, patent applications, patent publications, journals, books, papers, web contents, have been made throughout this disclosure. A.sub.11 such documents are hereby incorporated herein by reference in their entirety for all purposes.
EQUIVALENTS
[0107] The invention may be embodied in other specific forms without departing from the spirit or essential characteristics thereof. The foregoing embodiments are therefore to be considered in all respects illustrative rather than limiting on the invention described herein. Scope of the invention is thus indicated by the appended claims rather than by the foregoing description, and all changes which come within the meaning and range of equivalency of the claims are therefore intended to be embraced therein.
* * * * *
D00000
D00001
D00002
D00003
D00004
D00005
D00006
D00007
D00008
D00009
D00010
D00011
D00012
D00013

D00014

D00015

D00016
D00017
D00018

D00019
D00020

D00021

D00022
D00023
D00024
XML
uspto.report is an independent third-party trademark research tool that is not affiliated, endorsed, or sponsored by the United States Patent and Trademark Office (USPTO) or any other governmental organization. The information provided by uspto.report is based on publicly available data at the time of writing and is intended for informational purposes only.
While we strive to provide accurate and up-to-date information, we do not guarantee the accuracy, completeness, reliability, or suitability of the information displayed on this site. The use of this site is at your own risk. Any reliance you place on such information is therefore strictly at your own risk.
All official trademark data, including owner information, should be verified by visiting the official USPTO website at www.uspto.gov. This site is not intended to replace professional legal advice and should not be used as a substitute for consulting with a legal professional who is knowledgeable about trademark law.