Method For Detecting And Identifying Toxic And Harmful Gases Based On Machine Olfaction
SUN; Yunlong ; et al.
U.S. patent application number 16/804477 was filed with the patent office on 2020-06-25 for method for detecting and identifying toxic and harmful gases based on machine olfaction. The applicant listed for this patent is GUANGDONG UNIVERSITY OF TECHNOLOGY. Invention is credited to Hui LI, Dehan LUO, Yunlong SUN.
| Application Number | 20200200724 16/804477 |
| Document ID | / |
| Family ID | 60603493 |
| Filed Date | 2020-06-25 |


View All Diagrams
| United States Patent Application | 20200200724 |
| Kind Code | A1 |
| SUN; Yunlong ; et al. | June 25, 2020 |
METHOD FOR DETECTING AND IDENTIFYING TOXIC AND HARMFUL GASES BASED ON MACHINE OLFACTION
Abstract
Disclosed is a method for detecting and identifying toxic and harmful gases based on machine olfactory. Information about the toxic and harmful gases is firstly collected through the machine olfactory system and then analyzed through a Selected Linear Discriminate Analysis (SLDA) combined with a Markov two-dimensional distance discriminant method to identify various toxic and harmful gases. The algorithm disclosed in the invention extracts the characteristic information of the sample data, and then fast processes and identifies the information as a linear recognition algorithm does, having wide applications in the field of machine olfaction, especially in detecting and identifying the toxic and harmful gases in real-time based on machine olfaction. The algorithm involves low complexity and high recognition efficiency.
| Inventors: | SUN; Yunlong; (Guangzhou, CN) ; LUO; Dehan; (Guangzhou, CN) ; LI; Hui; (Guangzhou, CN) | ||||||||||
| Applicant: |
|
||||||||||
|---|---|---|---|---|---|---|---|---|---|---|---|
| Family ID: | 60603493 | ||||||||||
| Appl. No.: | 16/804477 | ||||||||||
| Filed: | February 28, 2020 |
Related U.S. Patent Documents
| Application Number | Filing Date | Patent Number | ||
|---|---|---|---|---|
| PCT/CN2017/107087 | Oct 20, 2017 | |||
| 16804477 | ||||
| Current U.S. Class: | 1/1 |
| Current CPC Class: | G01N 27/00 20130101; G01N 33/0062 20130101; G01N 2033/0068 20130101 |
| International Class: | G01N 33/00 20060101 G01N033/00 |
Foreign Application Data
| Date | Code | Application Number |
|---|---|---|
| Aug 30, 2017 | CN | 201710785985.7 |
Claims
1. A method for detecting and identifying toxic and harmful gases based on machine olfaction, comprising: (1) collecting and placing a gas sample in a constant temperature and humidity device; (2) delivering the gas sample to a sensor chamber to contact a sensor array to obtain measurement data, wherein the sensor array integrates multiple types of gas sensors; performing A/D conversion on the measurement data through an A/D acquisition card; and transferring the converted data to a computer and saving the data as S.sub.data; (3) performing data feature extraction on the collected data S.sub.data, and obtaining a recognition feature matrix M.sub.train through a selected linear discriminate analysis; and (4) repeating steps (1)-(3) to obtain a recognition feature matrix M.sub.test of a gas sample; and comparing M.sub.test and M.sub.train by using a two-dimensional distance discriminant method to identify the type of the gas sample.
2. The method of claim 1, wherein step (1) comprises the following steps: collecting and storing the gas sample in a sampling bag through an electric air pump; and then delivering the gas sample in the sampling bag via a gas valve to a gas chamber provided in the constant temperature and humidity device.
3. The method of claim 2, wherein in step (1), a hole diameter of the gas valve is 5 mm; a volume of the sampling bag is 600 ml; a volume of the gas chamber is 600 ml; the gas is delivered to the gas chamber at a flow rate of 5 ml/s; the constant temperature and humidity device is Type ZH-TH-80 with an internal dimension of 400.times.500.times.400 mm and an external dimension of 1050.times.1650.times.980 mm, and is set with a temperature of 30.degree. C., and a relative humidity of 50-60%.
4. The method of claim 1, wherein in step (2), the sensor array consists of 10 metal oxide gas sensors which are uniformly arranged in a circle with a diameter of 10.2 cm; a gas sampling time is 120 s; and the A/D acquisition card is Type AD7705.
5. The method of claim 1, wherein the selected linear discriminate analysis in step (3) comprises the following steps: (1) classifying gas samples into K types each having N gas samples; setting the collected and measured data of single gas sample as S.sub.data1, wherein S.sub.data1.di-elect cons.R.sup.120.times.10, and S.sub.data1 has 120 rows and 10 columns; selecting and saving data from rows 55-69 of S.sub.data1 as S.sub.ij, wherein S.sub.ij.di-elect cons.R.sup.15.times.10, and S.sub.ij has 15 rows and 10 columns; calculating a mathematical characteristic, a mean matrix .mu. for each column of S.sub.ij of the single gas sample according to the following equation; .mu. = 1 q .SIGMA. S ij , .mu. .di-elect cons. R 1 .times. 10 ( 1 ) ##EQU00017## wherein q is the number of rows of S.sub.ij of the single gas sample, and q=15; (2) obtaining mean matrices .mu. of S.sub.ij of all gas samples according to step (1) to form a matrix P of all gas samples, wherein P={X.sub.1.sup.N, X.sub.2.sup.N, .LAMBDA.X.sub.k.sup.N}; X.sub.k.sup.N.di-elect cons.R.sup.N.times.10, and X.sub.k.sup.N has N rows and 10 columns; P.di-elect cons.R.sup.MN.times.10, and the matrix P has MN rows and 10 columns; calculating a mathematical characteristic, a mean matrix .mu..sub.j for columns of X.sub.k.sup.N of a single type of gas samples according to the following equation: .mu. j = 1 N .SIGMA..mu. , .mu. j .di-elect cons. R K .times. 10 , N .di-elect cons. [ 1 , N ] ( 2 ) ##EQU00018## then calculating a mean matrix .mu..sub.k of the matrix P of all gas samples according to the following equation; .mu. k = 1 K .SIGMA..mu. j , 82 k .di-elect cons. R 1 .times. 10 , K .di-elect cons. [ 1 , K ] ( 3 ) ##EQU00019## then calculating a within-class scatter matrix J.sub.W and a between-class scatter matrix J.sub.B of the matrix P of all gas samples according to the following equations; J W = N = 1 N K = 1 K ( .mu. j - X K N ) T ( .mu. j - X K N ) , J W .di-elect cons. R 10 .times. 10 ( 4 ) J B = K = 1 K ( .mu. K - .mu. j ) T ( .mu. K - .mu. j ) , J B .di-elect cons. R 10 .times. 10 ( 5 ) ##EQU00020## and calculating an objective optimization function .PHI.(.omega.) of the matrix P, wherein .PHI.(.omega.) is expressed as .phi. ( .omega. ) = .omega. J B .omega. T .omega. J W .omega. T ( 6 ) ##EQU00021## when .PHI.(.omega.) takes the maximum value, the eigenvalue .omega. satisfies a maximum J.sub.B value and a minimum J.sub.W value, so that conditions for the optimization of the matrix P are satisfied; setting the eigenvalue as .lamda., plugging .omega.J.sub.W.omega..sup.T=1 into the equation (6), as shown in formula (7), { .phi. ( .omega. ) = .omega. J B .omega. T .omega. J W .omega. T .omega. J W .omega. T = 1 ( 7 ) ##EQU00022## thus converting the equation (6) by Lagrange multiplier method to obtain the following equation: .PHI.(.omega.)'=.omega.J.sub.B.omega..sup.T-.lamda.(.omega.J.sub.W.omega.- .sup.T-1) (8) performing derivation on .omega. on both sides of the equation (8) to solve the eigenvalue of the matrix formed from J.sub.B and J.sub.W, as shown in the following equation: d .phi. ( .omega. ) ' d .omega. = 2 J B .omega. - 2 .lamda. J W .omega. = 0 ( 9 ) to obtain .lamda. = J B J W - 1 , .lamda. .di-elect cons. R 10 .times. 10 ; ( 10 ) ##EQU00023## and (3) calculating a recognition feature matrix M.sub.train according to the following equation: M.sub.train=P.times..lamda.,M.sub.train.di-elect cons.R.sup.MN.times.10 (11).
6. The method of claim 1, wherein the two-dimensional distance discriminant method in step (4) comprises the following steps: (1) setting a recognition feature matrix of trained gas samples as M.sub.train, and setting a recognition feature matrix of each type of trained gas samples as M.sub.traink, and calculating a mean matrix A.sub.traink for all columns of M.sub.traink according to the following equation: A traink = i = 1 N M traink , A traink .di-elect cons. R 1 .times. 10 ( 12 ) ##EQU00024## extracting the first two columns of A.sub.traink to obtain A.sub.traink12 which is expressed as A.sub.traink12=(x.sub.i1,x.sub.i2) (13); (2) setting a recognition feature matrix of gas samples to be tested as M.sub.test, and extracting the first two columns of M.sub.test as A.sub.testk12, which is expressed as: A.sub.testk12=(x.sub.j1,x.sub.j2) (14); and (3) calculating a two-dimensional spatial distance d of A.sub.traink12 and A.sub.testk12 according to the following equation: d= {square root over ((x.sub.j1-x.sub.i1).sup.2+(x.sub.j2-x.sub.i2).sup.2)} (15) wherein d being close to 0 indicates a close spatial distance, indicating that the gas sample to be tested and the trained gas sample are identified as the same type of gas.
Description
CROSS-REFERENCE TO RELATED APPLICATIONS
[0001] This application is a continuation of International Patent Application No. PCT/CN2017/107087, filed on Oct. 20, 2017, which claims the benefit of priority from Chinese Application No. 201710785985.7, filed on Aug. 30, 2017. The content of the aforementioned applications, including any intervening amendments thereto, are incorporated herein by reference.
TECHNICAL FIELD
[0002] The present application relates to gas detection and identification, and more particularly to a method for detecting and identifying toxic and harmful gases based on machine olfaction.
BACKGROUND OF THE INVENTION
[0003] Gas leak often occurs in industrial processes and leads to serious hazard to persons and property when leaked gas is toxic, harmful, flammable and explosive gases. For example, on 12 Aug. 2015, a series of explosions occurred in Binhai New Area of Tianjin, China; and on 21 Jul. 2017, gas blast occurred in West Lack District of Hangzhou, China, Therefore, it is of great significance to develop a method for timely detecting and identifying toxic, harmful, flammable and explosive gases.
[0004] Currently, toxic and harmful gases are detected mainly through PH test paper method, photochemical method, as well as devices such as gas chromatographs, gas sensors and related instruments.
[0005] Gao Daqi et al. disclosed "Small-scale automated machine olfactory device and odor analysis method" (Chinese Patent ZL200710036260.4), where the machine olfactory device includes a test box, a thermostatic cup, an automatic sampling lifting device, a computer, a display device, and an oxygen cylinder. The odor analysis method involves the use of head-space sampling manner and 16 gas sensors. 4 thermostatic cups are provided in the machine olfactory device to achieve continuous measurement.
[0006] Li Taixi et al. disclosed "Device and method for judging odor perception" (Chinese Patent Application No. 201510784670.1), where the sensor array includes two or more sensors which are capable of detecting VOCs, H.sub.2S, NH.sub.3, H.sub.2, EtOH, trimethylamine, ethanol, solvent vapor, methane, COCFC's, CO.sub.2, O.sub.3, NO.sub.2, etc.
[0007] These methods list several detection means, but they fail to describe a specific gas detection method and the related process. Therefore, there is an urgent need to realize the real-time detection and identification of toxic and harmful gases.
SUMMARY OF THE INVENTION
[0008] This invention provides a method for detecting and identifying toxic and harmful gases based on machine olfaction to overcome at least one of the drawbacks in the prior art. Information about the toxic and harmful gases is collected through a machine olfactory system and analyzed through a Selected Linear Discriminate Analysis (SLDA) combined with a two-dimensional distance discriminant method to construct an odor information base, thereby identifying various toxic and harmful gases.
[0009] The technical solution of the invention is described as follows.
[0010] A method for detecting and identifying toxic and harmful gases based on machine olfaction, comprising:
[0011] (1) collecting and storing a gas sample in a sampling bag through an electric air pump, and delivering the gas sample in the sampling bag via a gas valve to a gas chamber provided in a constant temperature and humidity device;
[0012] (2) delivering the gas sample to a sensor chamber through a hole of the sampling bag to contact a sensor array to obtain measurement data; performing A/D conversion on the measurement data through an A/D acquisition card; transferring the converted data to a computer and saving the data as S.sub.data;
[0013] (3) performing data feature extraction on the collected data S.sub.data, and obtaining a recognition feature matrix M.sub.train through a selected linear discriminate analysis; and
[0014] (4) repeating steps (1)-(3) to obtain a recognition feature matrix M.sub.test of a gas sample; and comparing M.sub.test and M.sub.train by using a two-dimensional distance discriminant method to identify the type of the gas sample.
[0015] In some embodiments, in step (1), a hole diameter of the gas valve is 5 mm; a volume of the sampling bag is 600 ml; a volume of the gas chamber is 600 ml; the gas is delivered to the gas chamber at a flow rate of 5 ml/s; the constant temperature and humidity device is Type ZH-TH-80 with an internal dimension of 400.times.500.times.400 mm and an external dimension of 1050.times.1650.times.980 mm, and is set with a temperature of 30.degree. C., and a relative humidity of 50-60%.
[0016] In some embodiments, in step (2), the sensor array consists of 10 metal oxide gas sensors which are uniformly arranged in a circle with a diameter of 10.2 cm; a gas sampling time is 120 s; and the A/D acquisition card is Type AD7705.
[0017] In some embodiments, the selected linear discriminate analysis in step (3) comprises the following steps:
[0018] (1) classifying gas samples into K types each having N gas samples; setting the collected and measured data of single gas sample as S.sub.data1, wherein S.sub.data1.di-elect cons.R.sup.120.times.10, and S.sub.data1 has 120 rows and 10 columns; selecting and saving data from rows 55-69 of S.sub.data1 as S.sub.ij, wherein S.sub.ij.di-elect cons.R.sup.15.times.10, and S.sub.ij has 15 rows and 10 columns; calculating a mathematical characteristic, a mean matrix .mu. for each column of S.sub.ij of the single gas sample according to the following equation;
.mu. = 1 q .SIGMA. S ij , .mu. .di-elect cons. R 1 .times. 10 ( 1 ) ##EQU00001##
[0019] wherein q is the number of rows of S.sub.ij of the single gas sample, and q=15;
[0020] (2) obtaining mean matrices .mu. of S.sub.ij of all gas samples according to step (1) to form a matrix P of all gas samples, wherein P={X.sub.1.sup.N, X.sub.2.sup.N, .LAMBDA.X.sub.k.sup.N}; X.sub.k.sup.N.di-elect cons.R.sup.N.times.10, and X.sub.k.sup.N has N rows and 10 columns; P.di-elect cons.R.sup.MN.times.10, and the matrix P has MN rows and 10 columns;
[0021] calculating a mathematical characteristic, a mean matrix .mu..sub.j for columns of X.sub.k.sup.N of a single type of gas samples according to the following equation:
.mu. j = 1 N .SIGMA..mu. , .mu. j .di-elect cons. R K .times. 10 , N .di-elect cons. [ 1 , N ] ( 2 ) ##EQU00002##
[0022] then calculating a mean matrix .mu..sub.k of the matrix P of all gas samples according to the following equation;
.mu. k = 1 K .SIGMA..mu. j , .mu. k .di-elect cons. R 1 .times. 10 , K .di-elect cons. [ 1 , K ] ( 3 ) ##EQU00003##
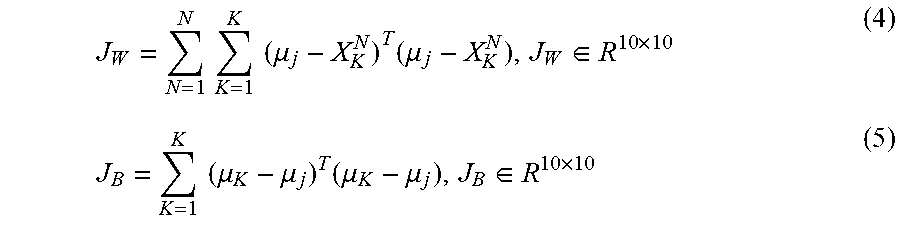
[0023] then calculating a within-class scatter matrix J.sub.W and a between-class scatter matrix J.sub.B of the matrix P of all gas samples according to the following equations;
J W = N = 1 N K = 1 K ( .mu. j - X K N ) T ( .mu. j - X K N ) , J W .di-elect cons. R 10 .times. 10 ( 4 ) J B = K = 1 K ( .mu. K - .mu. j ) T ( .mu. K - .mu. j ) , J B .di-elect cons. R 10 .times. 10 ( 5 ) ##EQU00004##
[0024] and calculating an objective optimization function .PHI.(.omega.) of the matrix P,
[0025] wherein .PHI.(.omega.) is expressed as
.phi. ( .omega. ) = .omega. J B .omega. T .omega. J W .omega. T ( 6 ) ##EQU00005##
[0026] when .PHI.(.omega.) takes the maximum value, the eigenvalue .omega. satisfies a maximum J.sub.B value and a minimum J.sub.W value, so that conditions for the optimization of the matrix P are satisfied;
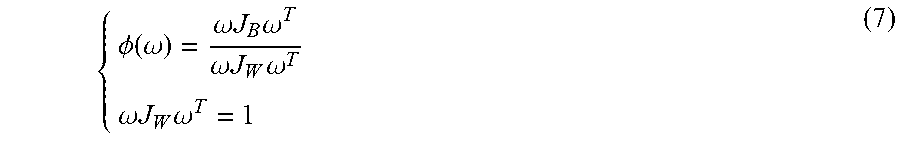
[0027] setting the eigenvalue as .lamda., plugging .omega.J.sub.W.omega..sup.T=1 into the equation (6), as shown in formula (7),
{ .phi. ( .omega. ) = .omega. J B .omega. T .omega. J W .omega. T .omega. J W .omega. T = 1 ( 7 ) ##EQU00006##
[0028] thus converting the equation (6) by Lagrange multiplier method to obtain the following equation:
.PHI.(.omega.)'=.omega.J.sub.B.omega..sup.T-.lamda.(.omega.J.omega..sup.- T-1) (8)
[0029] performing derivation on .omega. on both sides of the equation (8) to solve the eigenvalue of the matrix formed from J.sub.B and J.sub.W, as shown in the following equation:
d .phi. ( .omega. ) ' d .omega. = 2 J B .omega. - 2 .lamda. J W .omega. = 0 ( 9 ) to obtain .lamda. = J B J W - 1 , .lamda. .di-elect cons. R 10 .times. 10 ; ( 10 ) ##EQU00007##
and
[0030] (3) calculating a recognition feature matrix M.sub.train according to the following equation:
M.sub.train=P.times..lamda.,M.sub.train.di-elect cons.R.sup.MN.times.10 (11).
[0031] In some embodiments, the two-dimensional distance discriminant method in step (4) comprises the following steps:
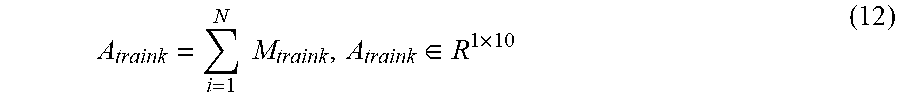
[0032] (1) setting a recognition feature matrix of trained gas samples as M.sub.train, and setting a recognition feature matrix of each type of trained gas samples as M.sub.traink, and calculating a mean matrix A.sub.traink for all columns of M.sub.traink according to the following equation:
A traink = i = 1 N M traink , A traink .di-elect cons. R 1 .times. 10 ( 12 ) ##EQU00008##
[0033] extracting the first two columns of A.sub.traink to obtain A.sub.traink12 which is expressed as
A.sub.traink12=(x.sub.i1,x.sub.i2) (13);
[0034] (2) setting a recognition feature matrix of gas samples to be tested as M.sub.test, and extracting the first two columns of M.sub.test as A.sub.testk12, which is expressed as:
A.sub.testk12=(x.sub.j1,x.sub.j2) (14);
and
[0035] (3) calculating a two-dimensional spatial distance d of A.sub.traink12 and A.sub.testk12 according to the following equation:
d= {square root over ((x.sub.j1-x.sub.i1).sup.2+(x.sub.j2-x.sub.i2).sup.2)} (15);
[0036] wherein d being close to 0 indicates a close spatial distance, indicating that the gas sample to be tested and the trained gas sample are identified as the same type of gas.
[0037] Compared with the prior art, the invention has the following beneficial effects.
[0038] This invention provides a method for detecting and identifying toxic and harmful gases based on machine olfactory, where the information about the toxic and harmful gases is collected through the machine olfactory system and analyzed through the Selected Linear Discriminate Analysis (SLDA) combined with the Markov two-dimensional distance discriminant method to identify various toxic and harmful gases. The algorithm disclosed in the invention extracts the characteristic information of the sample data, and then fast processes and identifies the information as a linear recognition algorithm does, having wide applications in the field of machine olfaction, especially in detecting and identifying the toxic and harmful gases in real-time based on machine olfaction. The algorithm involves low complexity and high recognition efficiency.
BRIEF DESCRIPTION OF THE DRAWINGS
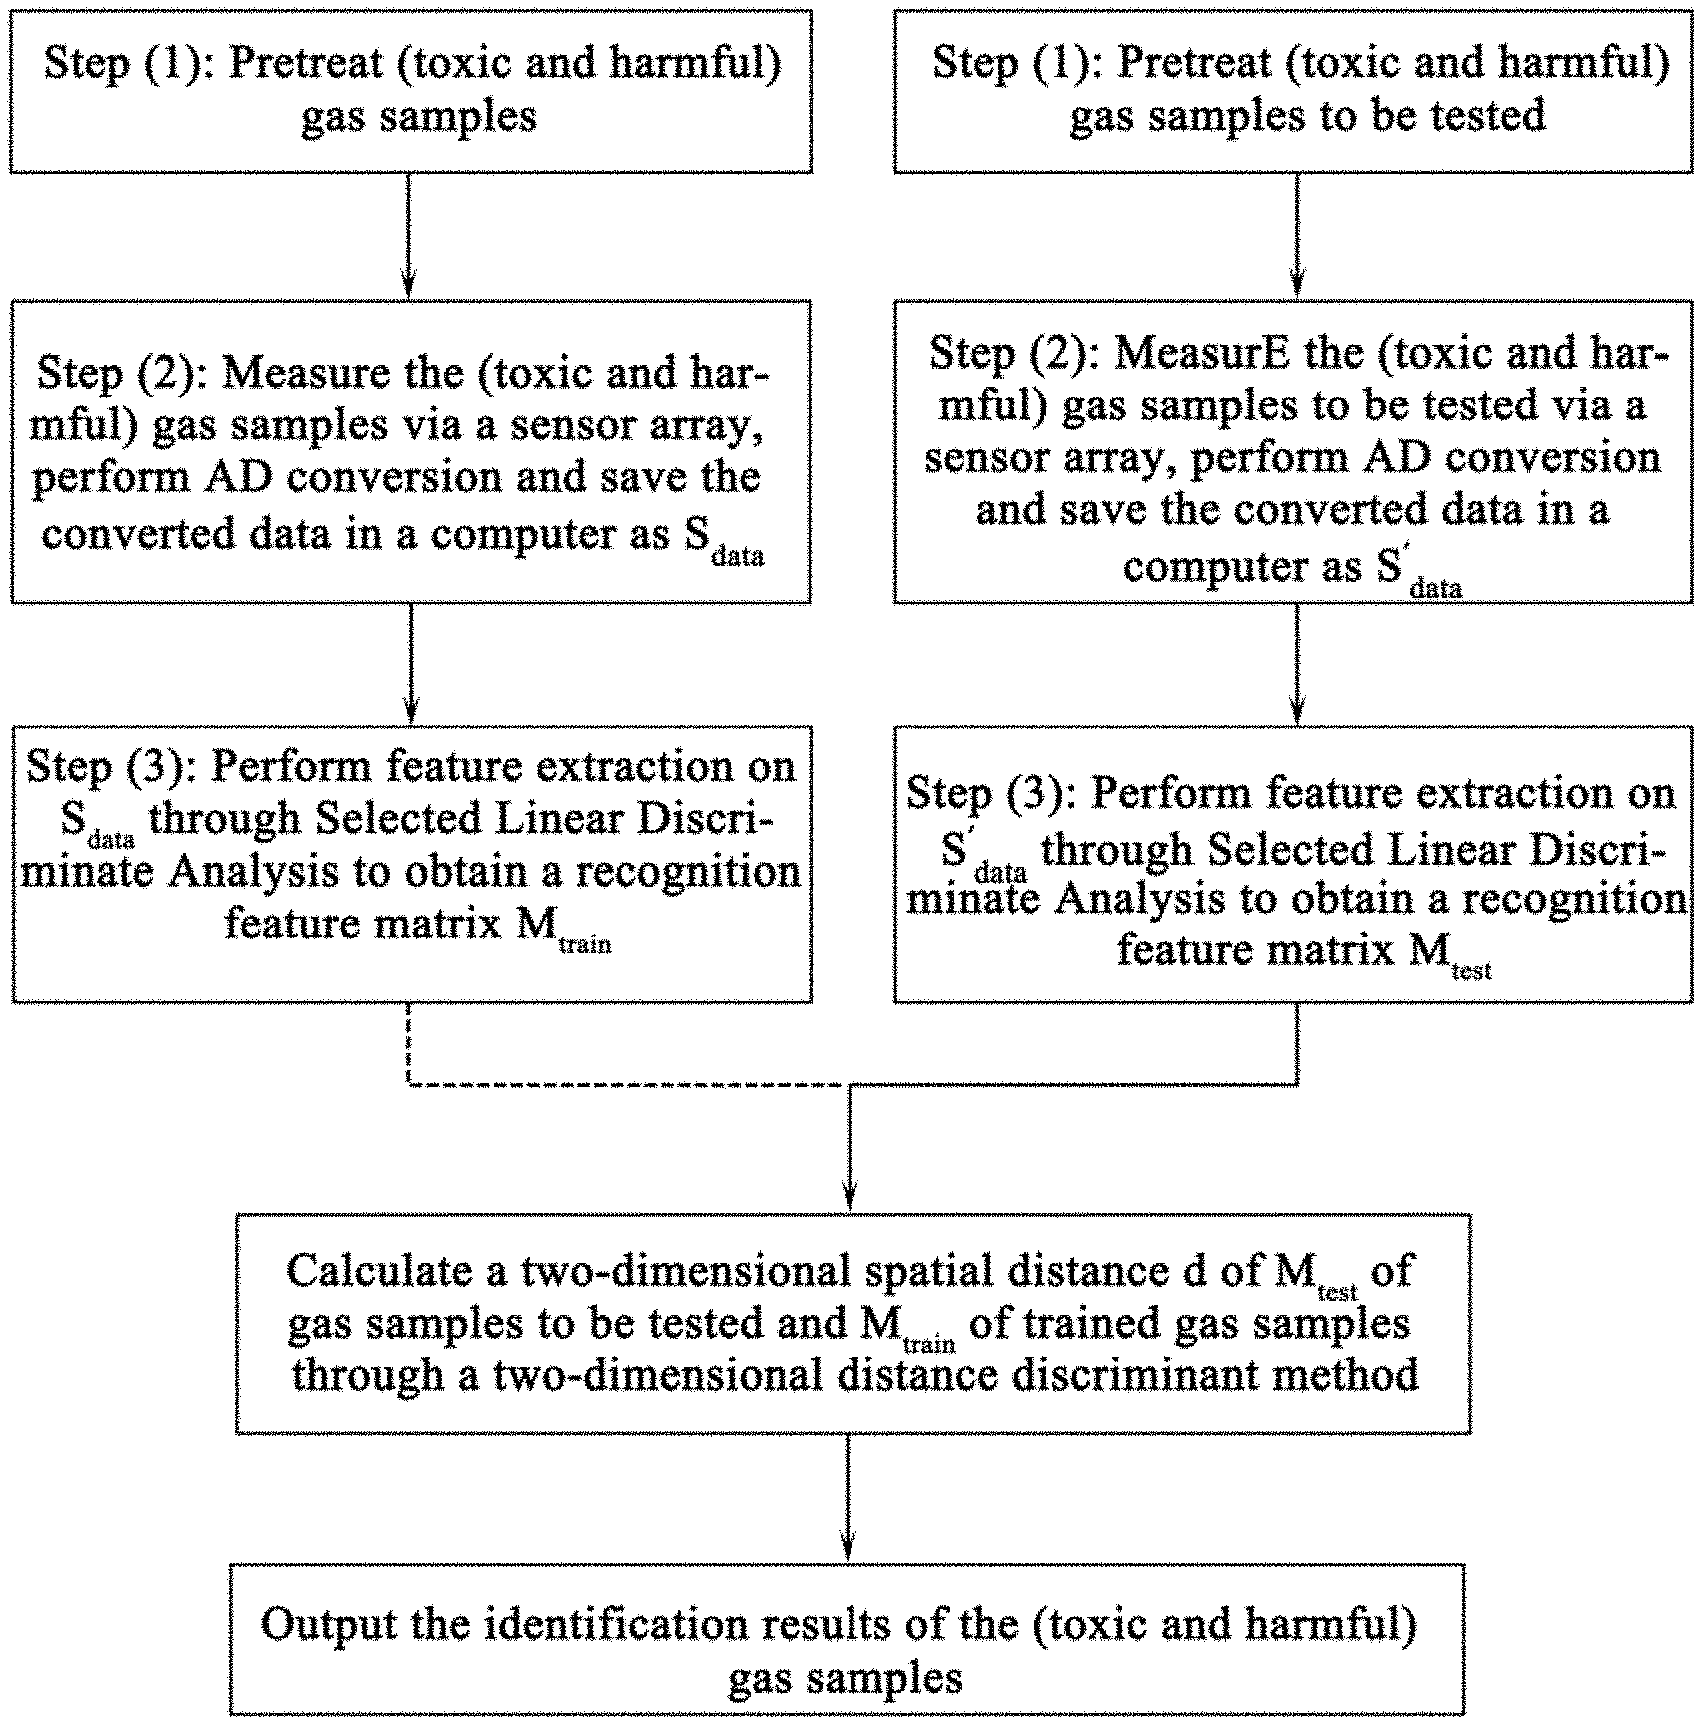
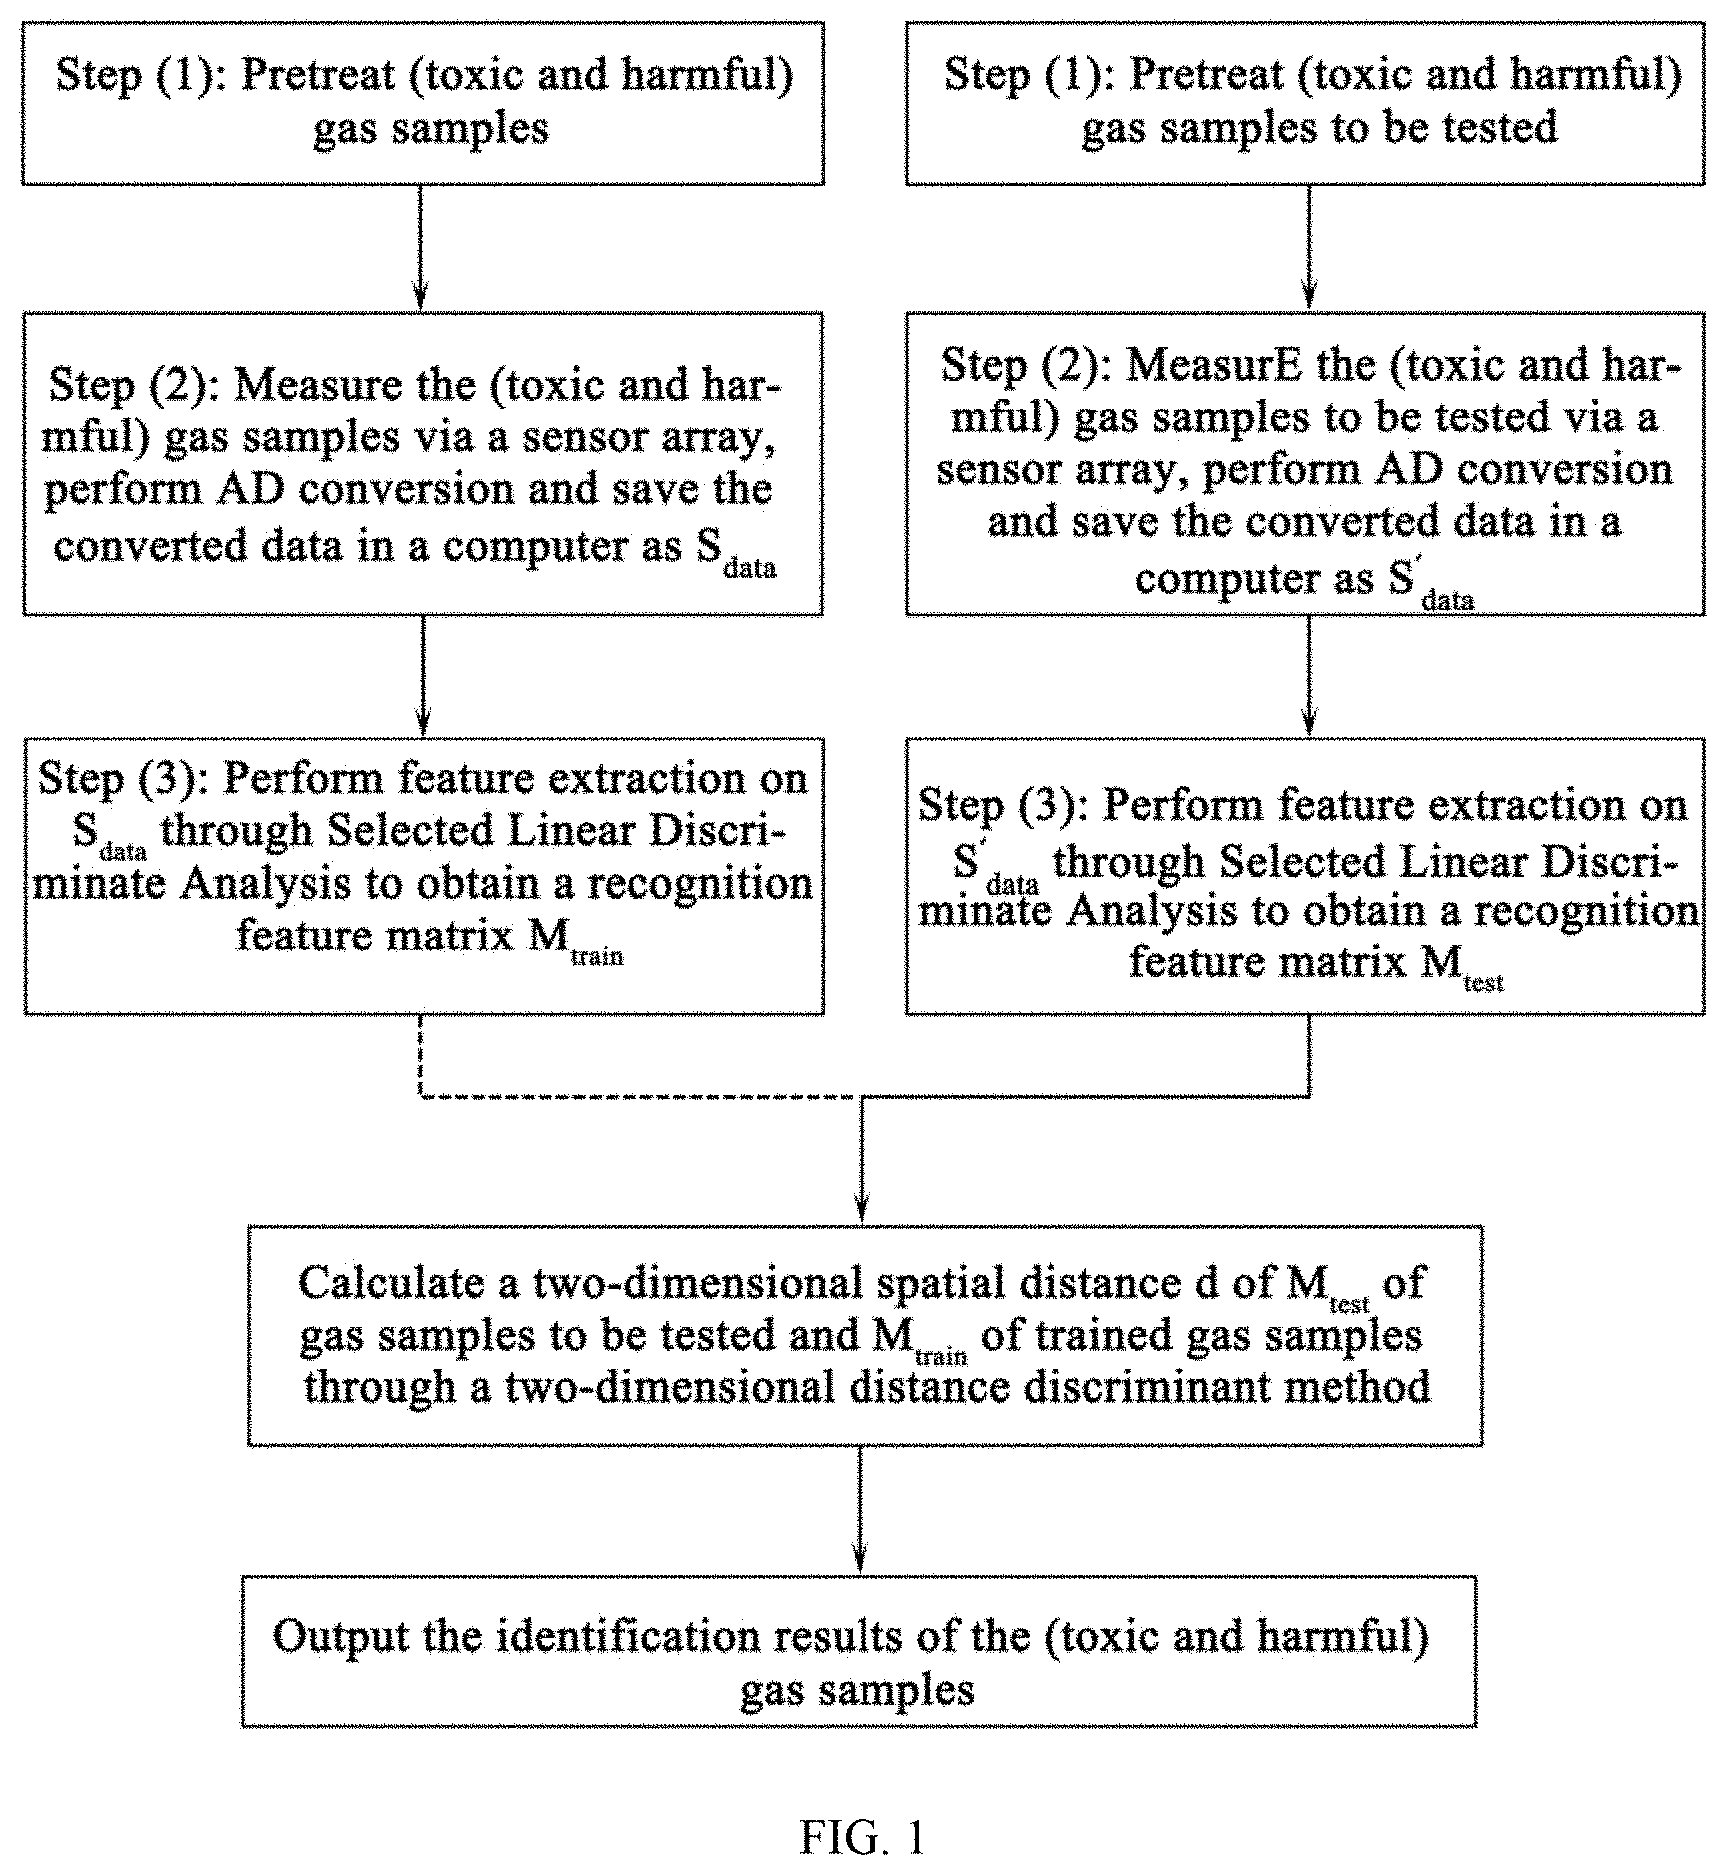
[0039] FIG. 1 is a flowchart of detecting and identifying toxic and harmful gases based on machine olfaction of the present invention.
[0040] FIG. 2 is a flowchart of a selected linear discriminate analysis algorithm.
[0041] FIG. 3 is a flow chart of a two-dimensional distance discriminant method.
[0042] FIG. 4 shows the results of classifying various gases according to an embodiment of the present invention.
[0043] FIG. 5 shows the results of identifying various gases according to an embodiment of the present invention.
DETAILED DESCRIPTION OF EMBODIMENTS
[0044] The accompanying drawings are only for illustration and are not intended to limit the present invention;
[0045] In order to better illustrate the embodiments, some components in the drawings may be omitted, enlarged or reduced, and do not present the actual size of the product.
[0046] It will be understood by those skilled in the art that some well-known structures in the drawings and the descriptions thereof may be omitted.
[0047] The technical solution of the present invention will be further described below with reference to the accompanying drawings and embodiments.
Example 1
[0048] Common toxic and harmful gases such as CO.sub.2, CH.sub.4, NH.sub.3 and VOCs were measured and identified in this embodiment. Each of these 4 types gases had 20 samples, among these 20 samples, 10 samples were chosen for training, and 2 samples were randomly chosen for the measurement. A method for detecting and identifying toxic and harmful gases based on machine olfaction included the following steps, as shown in FIG. 1.
[0049] (1) 4 types of gas samples were collected and stored in a 600 ml gas sampling bag through an electric air pump, and then delivered to a gas chamber via a gas valve at a flow rate of 5 ml/s, where a hole diameter of the gas valve is 5 mm; a volume of the gas chamber is 600 ml, and the gas chamber was provided in a constant temperature and humidity device which was Type ZH-TH-80 with an internal dimension of 400.times.500.times.400 mm and an external dimension of 1050.times.1650.times.980 mm. The constant temperature and humidity device was set with a temperature of 30.degree. C., and a relative humidity of 50-60%.
[0050] (2) The 4 types of gas samples passed through a hole of the gas sampling bag and entered into a sensor chamber to contact a sensor array and obtain measurement data. The sensor array consisted of 10 metal oxide gas sensors which were uniformly arranged in a circle with a diameter of 10.2 cm. A gas sampling time was 120 s. A/D conversion was performed on the measurement data through an A/D acquisition card which was Type AD7705. The converted data were transferred to a computer and saved as S.sub.data.
[0051] (3) Data feature extraction was performed on the collected data S.sub.data, and then a recognition feature matrix M.sub.train was obtained through a selected linear discriminate analysis (SLDA).
[0052] In this embodiment, the selected linear discriminate analysis in Step (3) further included the following steps.
[0053] (1) 4 types of gas samples including CO.sub.2, CH.sub.4, NH.sub.3 and VOCs were collected, and each type had 10 gas samples. A single gas sample was randomly chosen among the 10 gas samples and was measured to obtain data S.sub.data1, where S.sub.data1.di-elect cons.R.sup.120.times.10, and S.sub.data1 had 120 rows and 10 columns, as shown in Table 1.
TABLE-US-00001 TABLE 1 S.sub.data1 of the randomly selected gas sample No. 1 2 3 4 5 6 7 8 9 10 1 0.9604 0.9965 0.9736 0.9942 0.9694 1 0.9599 0.9984 0.9629 0.9962 2 1.0234 0.997 1.0223 0.9959 1.0193 1.0026 1.0008 0.9984 0.9901 0.9976 3 1.0438 1.0048 1.0296 1 1.0343 1.0099 1.0227 1.0021 1.0119 1.0015 4 0.9985 1.046 0.9965 1.001 0.9985 1.0447 1.0054 1.0277 1.0044 1.0003 5 0.9802 1.1038 0.9822 1.0041 0.9835 1.0869 1.0001 1.0597 1.0037 0.9976 6 0.9692 1.1525 0.972 1.0074 0.9746 1.1244 1.001 1.0908 1.005 0.9969 7 0.9591 1.1924 0.9622 1.0124 0.9675 1.1583 1.0036 1.1176 1.0062 0.9958 8 0.9483 1.2244 0.9523 1.0169 0.9596 1.1878 1.0046 1.142 1.0096 0.9945 9 0.9372 1.2496 0.9428 1.0216 0.9525 1.2128 1.0056 1.1647 1.0119 0.9937 10 0.9274 1.2702 0.9338 1.024 0.9459 1.2356 1.0065 1.1833 1.016 0.9926 11 0.9175 1.2874 0.9265 1.0278 0.9397 1.2548 1.009 1.204 1.0185 0.9927 12 0.9086 1.3001 0.9183 1.0312 0.9333 1.2722 1.0105 1.2185 1.0209 0.9928 13 0.9003 1.3131 0.9104 1.0349 0.9274 1.2859 1.012 1.2326 1.0247 0.9912 14 0.892 1.3218 0.9038 1.0382 0.9227 1.2996 1.0147 1.245 1.029 0.9925 15 0.8847 1.3278 0.8976 1.0413 0.9173 1.311 1.0152 1.2586 1.031 0.9922 16 0.8781 1.3359 0.8913 1.0447 0.9129 1.3207 1.0154 1.2688 1.0336 0.9921 17 0.8703 1.3402 0.8854 1.0461 0.9096 1.3302 1.0182 1.2805 1.0361 0.9902 18 0.8657 1.3449 0.8796 1.0482 0.9044 1.3358 1.0196 1.2891 1.0396 0.9912 19 0.8588 1.3505 0.8748 1.051 0.9009 1.3432 1.0206 1.2977 1.0417 0.9912 20 0.8532 1.3549 0.8699 1.0523 0.8971 1.3505 1.0206 1.3066 1.0453 0.9911 21 0.848 1.3588 0.8646 1.0559 0.8936 1.3574 1.0211 1.3109 1.0487 0.9904 22 0.8424 1.36 0.8607 1.0582 0.8902 1.3589 1.0226 1.3161 1.0507 0.9914 23 0.8381 1.361 0.8571 1.0595 0.8871 1.3623 1.024 1.3227 1.0555 0.9918 24 0.8337 1.3612 0.8529 1.0628 0.8837 1.3665 1.0253 1.3282 1.0575 0.9918 25 0.8292 1.3629 0.8491 1.0632 0.8817 1.3699 1.0261 1.3328 1.059 0.9921 26 0.8251 1.3644 0.8455 1.0663 0.8786 1.3722 1.0271 1.3383 1.0623 0.9915 27 0.8219 1.3644 0.8426 1.0685 0.8758 1.3759 1.0294 1.3418 1.0653 0.9914 28 0.8184 1.3661 0.8386 1.0691 0.8735 1.3773 1.0301 1.3484 1.0685 0.9914 29 0.8144 1.3666 0.8358 1.0693 0.8709 1.3788 1.031 1.3513 1.0713 0.9927 30 0.8111 1.3673 0.8327 1.0703 0.8692 1.3795 1.031 1.3528 1.074 0.992 31 0.8083 1.3681 0.8302 1.0716 0.8676 1.3816 1.0348 1.3536 1.076 0.9917 32 0.8057 1.3688 0.8277 1.0728 0.8648 1.3836 1.0359 1.3542 1.0809 0.9924 33 0.8028 1.3661 0.8248 1.0741 0.8627 1.3843 1.0362 1.3577 1.0842 0.9912 34 0.7993 1.3676 0.8226 1.0755 0.8613 1.3847 1.0385 1.3592 1.0847 0.9921 35 0.7958 1.3676 0.8198 1.0765 0.8593 1.3855 1.0397 1.3618 1.0869 0.9911 36 0.7937 1.3661 0.8187 1.0786 0.8577 1.3855 1.0409 1.3618 1.0886 0.9921 37 0.7923 1.3666 0.8163 1.0793 0.8561 1.3857 1.0414 1.3644 1.0919 0.9922 38 0.7902 1.3666 0.8145 1.0804 0.8553 1.3854 1.0414 1.3644 1.0951 0.9922 39 0.7882 1.3661 0.8122 1.0808 0.8535 1.3857 1.0423 1.3676 1.0978 0.9927 40 0.7858 1.3659 0.8101 1.0816 0.8521 1.3854 1.0434 1.3685 1.1 0.9922 41 0.7842 1.3661 0.8082 1.0837 0.8504 1.3854 1.0446 1.3702 1.1019 0.9926 42 0.7817 1.3654 0.8071 1.0856 0.8493 1.3854 1.046 1.3717 1.1046 0.9932 43 0.7803 1.3654 0.8052 1.0863 0.8481 1.3848 1.0468 1.3705 1.1085 0.9925 44 0.779 1.3654 0.804 1.0866 0.8468 1.3843 1.0474 1.372 1.1112 0.9933 45 0.7776 1.3629 0.8021 1.0871 0.8455 1.384 1.0488 1.3726 1.1115 0.9933 46 0.7758 1.3632 0.8009 1.0878 0.8445 1.3836 1.0503 1.3737 1.1138 0.9943 47 0.7744 1.362 0.7995 1.0874 0.8433 1.3826 1.0514 1.3737 1.1165 0.9927 48 0.7721 1.3615 0.798 1.0898 0.8429 1.3826 1.0526 1.3746 1.1188 0.9932 49 0.771 1.3612 0.7967 1.0905 0.8424 1.3821 1.0543 1.3737 1.1209 0.9933 50 0.7695 1.3615 0.7957 1.0914 0.8418 1.3788 1.0553 1.3746 1.1233 0.993 51 0.7684 1.3612 0.7943 1.0922 0.8407 1.379 1.0565 1.3752 1.126 0.9935 52 0.7675 1.361 0.793 1.0923 0.8392 1.3787 1.0572 1.3761 1.1279 0.9935 53 0.7657 1.3602 0.7917 1.0923 0.8384 1.3783 1.058 1.3758 1.1303 0.9925 54 0.765 1.3605 0.7909 1.0928 0.8374 1.3783 1.0597 1.3761 1.1339 0.9927 55 0.6297 1.6385 0.6308 1.0711 0.6822 1.9925 1.0298 2.049 1.1954 0.9899 56 0.6297 1.6363 0.6303 1.0716 0.682 1.9891 1.0304 2.049 1.1994 0.9892 57 0.6296 1.6342 0.6298 1.0723 0.6815 1.9875 1.0307 2.0451 1.2009 0.9904 58 0.6283 1.6297 0.6292 1.072 0.6814 1.986 1.0308 2.0444 1.2021 0.9895 59 0.628 1.6284 0.6293 1.0737 0.681 1.9823 1.0313 2.0415 1.2046 0.99 60 0.6276 1.6253 0.6289 1.0732 0.6812 1.9797 1.0316 2.0402 1.2073 0.9886 61 0.6277 1.6238 0.6293 1.0744 0.6806 1.9759 1.0317 2.0373 1.2095 0.9902 62 0.6277 1.621 0.6292 1.0746 0.6802 1.9721 1.0321 2.034 1.2112 0.9902 63 0.6276 1.62 0.6291 1.0749 0.6801 1.9691 1.0324 2.0321 1.2148 0.9906 64 0.6274 1.6178 0.6291 1.0752 0.6798 1.9651 1.0328 2.0282 1.217 0.9902 65 0.627 1.6165 0.629 1.0758 0.6801 1.9623 1.0329 2.0269 1.2193 0.9902 66 0.6274 1.6142 0.6294 1.0758 0.6794 1.9583 1.0334 2.0218 1.221 0.9914 67 0.6271 1.6089 0.629 1.0758 0.68 1.9545 1.0344 2.0211 1.225 0.9909 68 0.6273 1.6082 0.6292 1.0762 0.6797 1.9506 1.0349 2.0188 1.2254 0.9915 69 0.6269 1.6032 0.6292 1.0759 0.6796 1.9485 1.035 2.0179 1.227 0.9907 70 0.7514 1.35 0.7795 1.0976 0.8286 1.3616 1.0739 1.3723 1.166 0.9937 71 0.7513 1.3497 0.7787 1.0986 0.8282 1.3601 1.0758 1.3732 1.1669 0.9932 72 0.7505 1.3505 0.7781 1.0988 0.8267 1.3592 1.0769 1.3729 1.1682 0.9944 73 0.7505 1.3497 0.7778 1.0988 0.8267 1.3584 1.0777 1.372 1.1701 0.9944 74 0.7501 1.3475 0.7774 1.0986 0.8263 1.3586 1.0782 1.3714 1.1727 0.9928 75 0.7502 1.347 0.7774 1.0994 0.8259 1.3584 1.0788 1.3705 1.1734 0.9937 76 0.749 1.3463 0.7768 1.0995 0.8256 1.3574 1.0802 1.3697 1.1759 0.9933 77 0.7475 1.3458 0.7764 1.1003 0.825 1.3572 1.0822 1.3691 1.1776 0.9934 78 0.7475 1.3456 0.7756 1.1004 0.8242 1.3548 1.0826 1.3673 1.1792 0.9935 79 0.7473 1.3446 0.7757 1.1004 0.824 1.3532 1.0836 1.367 1.1809 0.994 80 0.7473 1.3446 0.7754 1.1006 0.8241 1.3513 1.0834 1.3679 1.183 0.9944 81 0.7467 1.3417 0.7748 1.101 0.8236 1.3506 1.0842 1.3656 1.1849 0.9938 82 0.7467 1.3414 0.7749 1.1016 0.8236 1.3498 1.0841 1.3644 1.1866 0.9937 83 0.7464 1.3412 0.774 1.1022 0.8236 1.3489 1.0853 1.3641 1.1891 0.993 84 0.7464 1.34 0.7741 1.103 0.8235 1.3467 1.0864 1.3627 1.1903 0.994 85 0.7452 1.3405 0.7736 1.1025 0.8235 1.3454 1.0873 1.3632 1.1934 0.9933 86 0.746 1.3405 0.7732 1.103 0.8232 1.3444 1.0881 1.3624 1.1938 0.9938 87 0.7451 1.3395 0.7729 1.1033 0.8227 1.3441 1.0893 1.3606 1.1938 0.9934 88 0.7435 1.3397 0.7735 1.1036 0.8228 1.3429 1.0897 1.3603 1.1948 0.9941 89 0.7437 1.3397 0.7723 1.1036 0.8225 1.3414 1.0904 1.3606 1.1969 0.9937 90 0.7432 1.3385 0.7719 1.1041 0.8224 1.3399 1.0913 1.3595 1.1985 0.9939 91 0.743 1.3376 0.7716 1.1039 0.8217 1.34 1.0927 1.3597 1.2006 0.993 92 0.743 1.3371 0.772 1.1042 0.8213 1.3382 1.0935 1.3577 1.2027 0.9944 93 0.7429 1.3361 0.7712 1.1042 0.8213 1.3375 1.0944 1.3568 1.2039 0.9931 94 0.7424 1.3351 0.7711 1.1041 0.8209 1.3365 1.0951 1.3568 1.2053 0.9938 95 0.7423 1.3351 0.771 1.1041 0.8209 1.3347 1.0963 1.3545 1.2072 0.9937 96 0.7419 1.3351 0.771 1.1044 0.8207 1.3335 1.0982 1.3545 1.2083 0.9935 97 0.7416 1.3337 0.7704 1.1045 0.8206 1.3322 1.0978 1.3545 1.2106 0.9937 98 0.7416 1.3332 0.7703 1.1045 0.8203 1.3318 1.0988 1.3539 1.212 0.9948 99 0.742 1.3317 0.77 1.1044 0.8203 1.3317 1.0998 1.3542 1.2134 0.9932 100 0.7413 1.3315 0.7702 1.1051 0.8201 1.3315 1.1005 1.3534 1.2146 0.9941 101 0.7404 1.3305 0.7699 1.1051 0.8201 1.3315 1.1013 1.3534 1.2162 0.9939 102 0.7402 1.33 0.7705 1.1048 0.8199 1.3315 1.1033 1.3531 1.2169 0.9945 103 0.7401 1.3298 0.77 1.1053 0.8198 1.3305 1.1036 1.3531 1.2192 0.9939 104 0.7407 1.3281 0.7695 1.1057 0.8194 1.33 1.1042 1.3528 1.2218 0.9933 105 0.74 1.3278 0.7694 1.1057 0.8195 1.3297 1.105 1.3531 1.2218 0.9937 106 0.7399 1.3293 0.7694 1.106 0.8191 1.3278 1.1052 1.3522 1.2222 0.9943 107 0.7398 1.3295 0.7696 1.106 0.8189 1.3273 1.1054 1.3522 1.2232 0.9944 108 0.7397 1.3303 0.768 1.1077 0.8192 1.3254 1.1054 1.3525 1.2252 0.9926 109 0.74 1.3295 0.7687 1.1065 0.8183 1.3247 1.1065 1.3525 1.2259 0.9941 110 0.7397 1.3286 0.7685 1.1072 0.8181 1.3249 1.1068 1.3519 1.2264 0.994 111 0.7392 1.3286 0.7687 1.1075 0.818 1.3247 1.1072 1.3513 1.2284 0.9938 112 0.7394 1.3283 0.7682 1.1081 0.8181 1.3234 1.108 1.3513 1.2299 0.9939 113 0.7391 1.3286 0.7676 1.1092 0.818 1.3229 1.109 1.3505 1.2317 0.9938 114 0.7385 1.3264 0.768 1.1092 0.8183 1.3229 1.11 1.3507 1.2333 0.9933 115 0.7388 1.3266 0.768 1.1083 0.8181 1.3199 1.1111 1.3502 1.2344 0.9933 116 0.7387 1.3257 0.7683 1.1092 0.8177 1.3186 1.1117 1.3432 1.2356 0.9943 117 0.7387 1.3257 0.7675 1.1092 0.8177 1.3166 1.1122 1.3473 1.237 0.994 118 0.7387 1.3245 0.7678 1.1095 0.8176 1.3164 1.1126 1.3449 1.2386 0.9935 119 0.7384 1.3232 0.7676 1.1096 0.8176 1.3143 1.1138 1.3426 1.2386 0.9934 120 0.7379 1.323 0.7678 1.1086 0.8177 1.3136 1.1148 1.3415 1.24 0.9935
[0054] Firstly, data from rows 55-69 of S.sub.data1 were selected and saved as S.sub.ij, where S.sub.ij.di-elect cons.R.sup.15.times.10, and S.sub.ij had 15 rows and 10 columns, as shown in Table 2.
TABLE-US-00002 TABLE 2 Feature data S.sub.ij of the randomly selected gas sample (rows 55-69) No. 1 2 3 4 5 6 7 8 9 10 55 0.6297 1.6385 0.6308 1.0711 0.6822 1.9925 1.0298 2.049 1.1954 0.9899 56 0.6297 1.6363 0.6303 1.0716 0.682 1.9891 1.0304 2.049 1.1994 0.9892 57 0.6296 1.6342 0.6298 1.0723 0.6815 1.9875 1.0307 2.0451 1.2009 0.9904 58 0.6283 1.6297 0.6292 1.072 0.6814 1.986 1.0308 2.0444 1.2021 0.9895 59 0.628 1.6284 0.6293 1.0737 0.681 1.9823 1.0313 2.0415 1.2046 0.99 60 0.6276 1.6253 0.6289 1.0732 0.6812 1.9797 1.0316 2.0402 1.2073 0.9886 61 0.6277 1.6238 0.6293 1.0744 0.6806 1.9759 1.0317 2.0373 1.2095 0.9902 62 0.6277 1.621 0.6292 1.0746 0.6802 1.9721 1.0321 2.034 1.2112 0.9902 63 0.6276 1.62 0.6291 1.0749 0.6801 1.9691 1.0324 2.0321 1.2148 0.9906 64 0.6274 1.6178 0.6291 1.0752 0.6798 1.9651 1.0328 2.0282 1.217 0.9902 65 0.627 1.6165 0.629 1.0758 0.6801 1.9623 1.0329 2.0269 1.2193 0.9902 66 0.6274 1.6142 0.6294 1.0758 0.6794 1.9583 1.0334 2.0218 1.221 0.9914 67 0.6271 1.6089 0.629 1.0758 0.68 1.9545 1.0344 2.0211 1.225 0.9909 68 0.6273 1.6082 0.6292 1.0762 0.6797 1.9506 1.0349 2.0188 1.2254 0.9915 69 0.6269 1.6032 0.6292 1.0759 0.6796 1.9485 1.035 2.0179 1.227 0.9907
[0055] A mathematical characteristic, a mean matrix .mu. for each column of S.sub.ij of the single gas sample was calculated according to the following equation;
.mu. = 1 q .SIGMA. S ij , .mu. .di-elect cons. R 1 .times. 10 ( 1 ) ##EQU00009##
[0056] in this embodiment, q was the number of rows of S.sub.ij of the single gas sample, and q=15;
[0057] (2) Mean matrices .mu. of S.sub.ij of all gas samples were obtained according to step (1) to form a matrix P of all gas samples, wherein P={X.sub.1.sup.N, X.sub.2.sup.N, .LAMBDA.X.sub.k.sup.N}; X.sub.k.sup.N.di-elect cons.R.sup.10.times.10, and X.sub.k.sup.N has 10 rows and 10 columns; P.di-elect cons.R.sup.40.times.10, and the matrix P has MN rows (MN=40) and 10 columns, as shown in Table. 3.
TABLE-US-00003 TABLE 3 Matrix P of trained gas samples (4 types of gas samples, 10 gas samples for each type, p R.sup.40.times.10) No. 1 2 3 4 5 6 7 8 9 10 1 X.sub.1.sup.10 0.6452 1.6826 0.6446 1.0625 0.6959 2.0275 1.0211 2.0705 1.1421 0.9891 2 (CO.sub.2) 0.6977 1.5034 0.7154 1.0612 0.7651 1.7297 1.0351 1.7297 1.1244 0.9869 3 0.7266 1.3999 0.7507 1.0609 0.7977 1.5659 1.0459 1.5661 1.1308 0.9832 4 0.7188 1.4277 0.7431 1.0794 0.7930 1.5857 1.0577 1.5869 1.1461 0.9920 5 0.7294 1.4018 0.7568 1.0836 0.8046 1.5262 1.0591 1.5200 1.1466 0.9943 6 0.7364 1.3816 0.7644 1.0887 0.8142 1.4755 1.0620 1.4698 1.1506 0.9989 7 0.7470 1.3783 0.7739 1.0864 0.8214 1.4500 1.0590 1.4506 1.1413 0.9922 8 0.7472 1.3714 0.7745 1.0908 0.8219 1.4237 1.0644 1.4340 1.1494 0.9914 9 0.7461 1.3549 0.7719 1.0978 0.8214 1.4035 1.0730 1.4055 1.1655 0.9943 10 0.7468 1.3587 0.7758 1.1037 0.8247 1.3987 1.0696 1.3937 1.1595 1.0056 11 X.sub.2.sup.10 0.3924 2.5588 0.3480 1.6168 0.3612 2.4611 1.7678 2.6715 3.2760 0.9761 12 (CH.sub.4) 0.4385 2.4131 0.3881 1.6144 0.3977 2.3901 1.5267 2.3956 2.2996 0.9738 13 0.5688 1.5830 0.5321 1.4286 0.5605 1.6954 1.1031 1.6945 1.4743 0.9950 14 0.5076 1.8246 0.4660 1.5436 0.4842 1.9230 1.2536 1.9618 1.8624 0.9900 15 0.5034 1.8587 0.4593 1.5471 0.4754 1.9480 1.2792 1.9738 1.8807 0.9862 16 0.5335 1.7179 0.4915 1.4997 0.5112 1.8023 1.2038 1.8239 1.7048 0.9888 17 0.5157 1.7984 0.4704 1.5304 0.4864 1.8724 1.2619 1.9047 1.8408 0.9856 18 0.5347 1.7054 0.4916 1.4977 0.5107 1.7715 1.2153 1.8029 1.7226 0.9885 19 0.4431 2.3242 0.3924 1.6198 0.3947 2.2695 1.5508 2.3079 2.4276 0.9704 20 0.4521 2.3053 0.3990 1.6160 0.4006 2.2407 1.4555 2.2435 2.2621 0.9700 21 X.sub.3.sup.10 0.7334 4.4494 0.6842 1.3225 0.5755 2.1095 1.2121 1.8233 1.6389 0.9711 22 (NH.sub.3) 0.7775 3.3309 0.7311 1.2630 0.6304 1.8399 1.0892 1.5862 1.2188 0.9746 23 0.7929 2.9502 0.7507 1.2423 0.6491 1.7187 1.0614 1.4957 1.1969 0.9744 24 0.8065 2.6620 0.7707 1.2310 0.6660 1.6161 1.0540 1.4192 1.1917 0.9749 25 0.8079 2.5898 0.7734 1.2338 0.6685 1.5676 1.0585 1.3881 1.2081 0.9753 26 0.8167 2.4470 0.7815 1.2246 0.6787 1.5063 1.0537 1.3430 1.1932 0.9774 27 0.8119 2.5142 0.7756 1.2293 0.6738 1.4930 1.0621 1.3402 1.2154 0.9782 28 0.8195 2.4827 0.7785 1.2116 0.6796 1.4694 1.0505 1.3144 1.1778 0.9781 29 0.8234 2.4173 0.7826 1.2119 0.6854 1.4218 1.0523 1.2809 1.1827 0.9769 30 0.8244 2.3943 0.7839 1.2125 0.6865 1.3963 1.0545 1.2600 1.1877 0.9762 31 X.sub.4.sup.10 0.4764 2.3807 0.5024 1.0420 0.5607 2.1761 1.0587 2.1839 1.3539 1.0062 32 (VOCs) 0.5512 1.8220 0.5663 1.0523 0.6193 1.9041 1.0769 1.8710 1.3159 0.9976 33 0.5818 1.5378 0.5941 1.0523 0.6488 1.7286 1.0883 1.7249 1.3466 0.9978 34 0.5998 1.4691 0.6122 1.0571 0.6654 1.6609 1.0794 1.6712 1.3248 0.9974 35 0.6058 1.4299 0.6181 1.0613 0.6713 1.6274 1.0858 1.6399 1.3314 0.9960 36 0.6032 1.4565 0.6153 1.0828 0.6691 1.6500 1.0883 1.6518 1.3403 1.0141 37 0.6039 1.4387 0.6147 1.0883 0.6698 1.5967 1.1082 1.6139 1.3695 1.0064 38 0.6110 1.4320 0.6187 1.0990 0.6700 1.5616 1.1191 1.5769 1.3767 1.0008 39 0.6135 1.4250 0.6217 1.1037 0.6721 1.5343 1.1213 1.5524 1.3799 0.9974 40 0.6155 1.4214 0.6204 1.1092 0.6725 1.5185 1.1195 1.5344 1.3744 0.9944
[0058] Secondly, a mathematical characteristic, a mean matrix .mu..sub.j for columns of X.sub.k.sup.N of a single type of gas samples was calculated according to the following equation;
.mu. j = 1 N .SIGMA..mu. , .mu. j .di-elect cons. R 4 .times. 10 , N .di-elect cons. [ 1 , N ] ( 2 ) ##EQU00010##
[0059] the mean matrix .mu..sub.j was shown in Table 4.
TABLE-US-00004 TABLE 4 Mean matrix .mu..sub.j of a single type of gas samples (.mu..sub.j R.sup.4.times.10) No. 1 2 3 4 5 6 7 8 9 10 1 .mu..sub.1 0.7241 1.4260 0.7471 1.0815 0.7960 1.5586 1.0547 1.5627 1.1456 0.9928 (CO.sub.2) 2 .mu..sub.2 0.4890 2.0089 0.4438 1.5514 0.4583 2.0374 1.3618 2.0780 2.0751 0.9824 (CH.sub.4) 3 .mu..sub.3 0.8014 2.8238 0.7612 1.2383 0.6594 1.6139 1.0748 1.4251 1.2411 0.9757 (CH.sub.4) 4 .mu..sub.4 0.5862 1.5813 0.5984 1.0748 0.6519 1.6958 1.0946 1.7020 1.3513 1.0008 (CH.sub.4)
[0060] A mean matrix .mu..sub.k of the matrix P of all gas samples was calculated according to the following equation;
.mu. k = 1 K .SIGMA..mu. j , .mu. k .di-elect cons. R 1 .times. 10 , K .di-elect cons. [ 1 , K ] ( 3 ) ##EQU00011##
[0061] the mean matrix .mu..sub.k was shown in Table 5.
TABLE-US-00005 TABLE 5 Mean matrix .mu..sub.k of the matrix P of all gas samples (.mu..sub.k R.sup.1.times.10) No. 1 2 3 4 5 6 7 8 9 10 1 .mu..sub.k 0.6502 1.9600 0.6376 1.2365 0.6414 1.7264 1.1465 1.6920 1.4533 0.9879
[0062] A within-class scatter matrix J.sub.W and a between-class scatter matrix J.sub.B of the matrix P of all gas samples were respectively calculated according to the following equations:
J W = N = 1 N K = 1 K ( .mu. j - X K N ) T ( .mu. j - X K N ) , J W .di-elect cons. R 10 .times. 10 ( 4 ) J B = K = 1 K ( .mu. K - .mu. j ) T ( .mu. K - .mu. j ) , J B .di-elect cons. R 10 .times. 10 ( 5 ) ##EQU00012##
[0063] the matrix J.sub.W was shown in Table 6 and the matrix J.sub.B was shown in Table 7.
TABLE-US-00006 TABLE 6 Within-class scatter matrix J.sub.W of matrix P (J.sub.W R.sup.10.times.10) No. 1 2 3 4 5 6 7 8 9 10 1 0.0600 -0.4773 0.0630 -0.0287 0.0658 -0.3226 -0.1008 -0.3296 -0.2712 0.0046 2 -0.4773 5.7451 -0.5051 0.3304 -0.5340 2.8284 0.8493 2.6514 2.2276 -0.0355 3 0.0630 -0.5051 0.0675 -0.0324 0.0707 -0.3437 -0.1081 -0.3503 -0.2869 0.0054 4 -0.0287 0.3304 -0.0324 0.0559 -0.0380 0.1607 0.1278 0.1607 0.2923 -0.0048 5 0.0658 -0.5340 0.0707 -0.0380 0.0746 -0.3600 -0.1201 -0.3657 -0.3129 0.0061 6 -0.3226 2.8284 -0.3437 0.1607 -0.3600 1.8375 0.5207 1.8191 1.3750 -0.0266 7 -0.1008 0.8493 -0.1081 0.1278 -0.1201 0.5207 0.4069 0.5795 1.0032 -0.0145 8 -0.3296 2.6514 -0.3503 0.1607 -0.3657 1.8191 0.5795 1.8620 1.5601 -0.0271 9 -0.2712 2.2276 -0.2869 0.2923 -0.3129 1.3750 1.0032 1.5601 2.5957 -0.0328 10 0.0046 -0.0355 0.0054 -0.0048 0.0061 -0.0266 -0.0145 -0.0271 -0.0328 0.0015
TABLE-US-00007 TABLE 7 Between-class scatter matrix J.sub.B of matrix P (J.sub.B R.sup.10.times.10) No. 1 2 3 4 5 6 7 8 9 10 1 0.0447 -0.0481 0.0476 -0.0356 0.0344 -0.0739 -0.0276 -0.0893 -0.0920 -0.0015 2 -0.0481 2.8878 -0.1012 0.0525 -0.0803 0.1393 -0.0809 -0.0932 -0.1674 0.0091 3 0.0476 -0.1012 0.0531 -0.0482 0.0426 -0.0868 -0.0329 -0.0986 -0.1089 -0.0010 4 -0.0356 0.0525 -0.0482 0.1030 -0.0620 0.1122 0.0612 0.1235 0.1833 -0.0039 5 0.0344 -0.0803 0.0426 -0.0620 0.0480 -0.0910 -0.0372 -0.0973 -0.1208 0.0015 6 -0.0739 0.1393 -0.0868 0.1122 -0.0910 0.2035 0.0655 0.2220 0.2226 -0.0020 7 -0.0276 -0.0809 -0.0329 0.0612 -0.0372 0.0655 0.0435 0.0849 0.1276 -0.0020 8 -0.0893 -0.0932 -0.0986 0.1235 -0.0973 0.2220 0.0849 0.2686 0.2768 -0.0021 9 -0.0920 -0.1674 -0.1089 0.1833 -0.1208 0.2226 0.1276 0.2768 0.3845 -0.0054 10 -0.0015 0.0091 -0.0010 -0.0039 0.0015 -0.0020 -0.0020 -0.0021 -0.0054 0.0005
[0064] Finally, an objective optimization function .PHI.(.omega.) of the matrix P was calculated, wherein .PHI.(.omega.) was expressed as
.phi. ( .omega. ) = .omega. J B .omega. T .omega. J W .omega. T ( 6 ) ##EQU00013##
[0065] When .PHI.(.omega.) took the maximum value, the eigenvalue .omega. satisfied a maximum J.sub.B value and a minimum J.sub.W value, so that conditions for the optimization of the matrix P were satisfied.
[0066] The eigenvalue was set as .lamda., and .omega.J.sub.W.omega..sup.T=1 was plugged into the equation (6), as shown in formula (7),
{ .phi. ( .omega. ) = .omega. J B .omega. T .omega. J W .omega. T .omega. J W .omega. T = 1 ( 7 ) ##EQU00014##
[0067] Thus, the equation (6) was converted by Lagrange multiplier method to obtain the following equation:
.PHI.(.omega.)'=.omega.J.sub.B.omega..sup.T-.lamda.(.omega.J.sub.W.omega- ..sup.T-1) (8)
[0068] The derivation was performed on .omega. on both sides of the equal sign of the equation (8) to solve the eigenvalue of the matrix formed from J.sub.B and J.sub.W, as shown in the following equation:
d .phi. ( .omega. ) ' d .omega. = 2 J B .omega. - 2 .lamda. J W .omega. = 0 ( 9 ) to obtain .lamda. = J B J W - 1 , .lamda. .di-elect cons. R 10 .times. 10 ; ( 10 ) ##EQU00015##
[0069] The eigenvalue .lamda. of the optimization function was shown in Table 8.
TABLE-US-00008 TABLE 8 Eigenvalue .lamda. of optimization function (.lamda. R.sup.10.times.10) No. 1 2 3 4 5 6 7 8 9 10 1 -0.1195 -0.1542 0.3811 -0.4359 0.6008 -0.1975 -0.1975 0.0631 0.0125 -0.0004 2 -0.0083 -0.0388 0.0078 -0.0392 -0.0191 0.0013 0.0013 0.0127 0.0241 -0.0051 3 -0.6898 0.1441 -0.3584 0.4345 -0.7467 0.1270 0.1270 0.1043 0.0216 0.0995 4 0.0564 0.2378 -0.3123 -0.2586 -0.0708 -0.0921 -0.0921 -0.1140 -0.1233 0.0835 5 0.6801 -0.7214 -0.5732 -0.4477 0.1518 0.1607 0.1607 -0.2709 -0.0010 -0.0680 6 0.0654 0.1836 0.0681 0.2879 0.1120 0.1705 0.1705 -0.0922 -0.1942 0.0002 7 -0.0323 -0.4124 0.0890 -0.0028 0.1353 0.0322 0.0322 0.8005 0.0107 -0.0970 8 -0.0833 -0.2845 -0.1938 -0.3344 -0.1448 -0.1490 -0.1490 0.1447 0.1851 -0.0052 9 0.0197 0.1586 0.0115 0.0658 0.0020 0.0729 0.0729 -0.2918 0.0403 0.0144 10 -0.1776 0.2593 0.4999 0.3915 -0.0345 -0.6134 -0.6134 0.3784 -0.9539 0.9843
[0070] (3) A recognition feature matrix M.sub.train was calculated according to the following equation:
M.sub.train=P.times..lamda.,M.sub.train.di-elect cons.R.sup.MN.times.10 (11).
[0071] The first two columns of the recognition feature matrix M.sub.train were selected for two-dimensional classification purpose, as shown in Table 9. As shown in FIG. 4, Principal Axis 1 was the first column of M.sub.train and Principal Axis 2 was the second column of M.sub.train.
TABLE-US-00009 TABLE 9 Recognition feature matrix M.sub.train (4 types of gas samples, 10 gas samples for each type, M.sub.train R.sup.40.times.10) 1 2 Principal Principal No. Axis 1 Axis 2 3 4 5 6 7 8 9 10 1 X.sub.1.sup.10 -2.2838 -5.2148 -3.6742 -3.0252 -0.6182 -4.8262 -4.8262 7.9090 -9.6611 9.7734 2 (CO.sub.2) -2.2652 -5.2954 -3.6774 -2.9211 -0.5119 -4.7247 -4.7247 7.7438 -9.7188 9.7840 3 -2.2797 -5.3643 -3.6905 -2.9334 -0.4630 -4.6904 -4.6904 7.6658 -9.6783 9.7641 4 -2.2626 -5.3205 -3.6922 -2.9385 -0.4733 -4.7451 -4.7451 7.7431 -9.7734 9.8502 5 -2.2740 -5.2987 -3.6807 -2.9161 -0.4610 -4.7492 -4.7492 7.7010 -9.8106 9.8854 6 -2.2646 -5.2918 -3.6650 -2.9194 -0.4426 -4.7790 -4.7790 7.6820 -9.8558 9.9373 7 -2.2845 -5.3626 -3.7104 -2.9908 -0.4393 -4.7557 -4.7557 7.6548 -9.7766 9.8766 8 -2.2845 -5.3651 -3.7129 -3.0181 -0.4413 -4.7662 -4.7662 7.6650 -9.7517 9.8697 9 -2.2576 -5.2989 -3.6626 -2.9751 -0.4015 -4.7701 -4.7701 7.6631 -9.7988 9.8982 10 -2.2734 -5.2471 -3.6386 -2.9267 -0.4232 -4.8320 -4.8320 7.6728 -9.9274 10.0188 11 X.sub.2.sup.10 -1.9870 -2.5021 -3.3437 -2.9186 -0.3170 -4.0205 -4.0205 7.9982 -8.8918 9.5503 12 (CH.sub.4) -1.9869 -2.6335 -3.3765 -2.9723 -0.2798 -4.4869 -4.4869 8.5306 -9.6796 9.6552 13 -1.9984 -2.7095 -3.2939 -2.9418 -0.3947 -5.1477 -5.1477 7.1514 -10.1338 10.1101 14 -1.9805 -2.3408 -3.4027 -3.0195 -0.4312 -4.9842 -4.9842 7.3807 -9.9655 10.0274 15 -1.9815 -2.3600 -3.3528 -2.9851 -0.3819 -4.9317 -4.9317 7.5267 -9.9435 9.9678 16 -1.9965 -2.4788 -3.3047 -2.9806 -0.3792 -5.0445 -5.0445 7.3553 -10.0069 10.0238 17 -1.9955 -2.3944 -3.3019 -2.9876 -0.3594 -4.9666 -4.9666 7.4729 -9.9269 9.9690 18 -2.0045 -2.4936 -3.2619 -2.9813 -0.3578 -5.0486 -5.0486 7.3952 -9.9751 10.0127 19 -2.0144 -2.4427 -3.2741 -2.9230 -0.2473 -4.4546 -4.4546 8.3195 -9.5478 9.6365 20 -1.9974 -2.2315 -3.2874 -2.9182 -0.2984 -4.5533 -4.5533 7.9699 -9.6815 9.7048 21 X.sub.3.sup.10 -3.2374 -4.0720 -2.7133 -3.1410 -0.5558 -4.3038 -4.3038 7.9642 -9.5175 9.6933 22 (NH.sub.3) -3.2088 -4.1474 -2.7940 -3.0259 -0.4362 -4.6769 -4.6769 7.9788 -9.8301 9.8145 23 -3.2141 -4.0652 -2.8133 -2.9497 -0.4169 -4.7339 -4.7339 7.7550 -9.8326 9.8495 24 -3.2387 -4.0416 -2.8436 -2.8964 -0.4101 -4.7718 -4.7718 7.6567 -9.8324 9.8782 25 -3.2392 -4.0154 -2.8415 -2.9043 -0.4092 -4.7961 -4.7961 7.6306 -9.8127 9.8887 26 -3.2371 -4.0401 -2.8278 -2.9005 -0.3784 -4.8428 -4.8428 7.6136 -9.8241 9.9148 27 -3.2331 -4.0345 -2.7959 -2.9332 -0.3861 -4.8567 -4.8567 7.6346 -9.7926 9.9158 28 -3.2276 -4.0957 -2.7389 -2.9281 -0.3402 -4.8751 -4.8751 7.6437 -9.7943 9.9077 29 -3.2162 -4.1065 -2.7494 -2.9549 -0.3282 -4.8892 -4.8892 7.6171 -9.7651 9.9002 30 -3.2143 -4.0941 -2.7381 -2.9541 -0.3212 -4.8923 -4.8923 7.6061 -9.7512 9.8951 31 X.sub.4.sup.10 -2.0885 -4.3279 -2.8894 -2.2685 -0.8433 -4.7165 -4.7165 7.9071 -9.6702 9.8287 32 (VOCs) -2.0832 -4.2999 -2.8553 -2.1830 -0.5073 -4.6724 -4.6724 7.8015 -9.7776 9.7971 33 -2.0784 -4.3141 -2.8514 -2.2123 -0.4009 -4.7106 -4.7106 7.6866 -9.7547 9.8217 34 -2.1037 -4.3680 -2.9176 -2.3030 -0.4034 -4.7536 -4.7536 7.6332 -9.7450 9.8400 35 -2.1000 -4.3781 -2.9286 -2.3185 -0.3808 -4.7479 -4.7479 7.6297 -9.7339 9.8299 36 -2.1089 -4.2631 -2.8949 -2.2736 -0.3938 -4.8522 -4.8522 7.6689 -9.9455 10.0217 37 -2.0866 -4.2959 -2.8929 -2.3278 -0.3592 -4.8180 -4.8180 7.6975 -9.8360 9.9371 38 -2.0990 -4.2817 -2.8850 -2.3621 -0.3213 -4.7981 -4.7981 7.7164 -9.7919 9.8874 39 -2.0967 -4.2758 -2.8992 -2.3867 -0.3184 -4.7865 -4.7865 7.6943 -9.7568 9.8593 40 -2.0745 -4.2560 -2.8998 -2.4163 -0.2924 -4.7828 -4.7828 7.6652 -9.7410 9.8348
[0072] (4) Each type of gas samples remained 10 gas samples. Among these 10 gas samples, 2 gas samples were randomly selected for test purpose, thus there were 4 types of gas samples to be tested, and each type had 2 samples. A recognition feature matrix M.sub.test of the gas samples to be tested was obtained by repeating steps (1)-(3) of the selected linear discriminate analysis. By using a two-dimensional distance discriminant method and comparing M.sub.test and M.sub.train, the type of the gas samples to be tested was identified.
[0073] In this embodiment, the two-dimensional distance discriminant method in step (4) further included the following steps.
[0074] (1) A recognition feature matrix of trained gas samples was set as M.sub.train, and a recognition feature matrix of each type of trained gas samples was set as M.sub.traink, and then a mean matrix A.sub.traink for all columns of M.sub.traink were calculated according to the following equation:
A traink = i = 1 N M traink , A traink .di-elect cons. R 1 .times. 10 ( 12 ) ##EQU00016##
[0075] the first two columns of A.sub.traink were extracted and saved as A.sub.traink12 which was expressed as
A.sub.traink12=(x.sub.i1,x.sub.i2) (13);
[0076] The matrix A.sub.train12 was shown in Table 10.
TABLE-US-00010 TABLE 10 Recognition matrix A.sub.train12 of trained gas samples (extracted from the first two columns of A.sub.traink) 1 2 No. X.sub.i1 X.sub.i2 3 4 5 6 7 8 9 10 1 A.sub.train1 -2.2729 -5.3059 -3.6804 -2.9564 -0.4675 -4.7638 -4.7638 -7.7100 -9.7753 9.8657 (CO.sub.2) 2 A.sub.train2 -1.9942 -2.4587 -3.3199 -2.9627 -0.3446 -4.7638 -4.7638 -7.7100 -9.7753 9.8657 (CH.sub.4) 3 A.sub.train3 -3.2266 -4.0712 -2.7855 -2.9558 -0.3983 -4.7638 -4.7638 -7.7100 -9.7753 9.8657 (NH.sub.3) 4 A.sub.train4 -2.0919 -4.3060 -2.8914 -2.3052 -0.4201 -4.7638 -4.7638 -7.7100 -9.7753 9.8657 (VOCs)
[0077] (2) A recognition feature matrix of gas samples to be tested was set as M.sub.test, and the first two columns of M.sub.test were saved as A.sub.testk12 which was expressed as the following equation:
A.sub.testk12=(x.sub.j1,x.sub.j2) (14);
[0078] The matrix M.sub.testk was shown in Table 11.
TABLE-US-00011 TABLE 11 Recognition feature matrix M.sub.testk (4 types of gas samples, 2 samples for each type, M.sub.test R.sup.8.times.10) 1 2 No. X.sub.j1 X.sub.j2 3 4 5 6 7 8 9 10 1 A.sub.test1 -2.0827 -4.2206 -2.8834 -2.4072 -0.2898 -4.7768 -4.7768 7.6581 -9.7348 9.8294 2 -2.0803 -4.2121 -2.8953 -2.4236 -0.2877 -4.7769 -4.7769 7.6095 -9.7308 9.8258 3 A.sub.test2 -1.9973 -2.1485 -3.2804 -2.9078 -0.3129 -4.5743 -4.5743 7.8599 -9.6980 9.7244 4 -1.9974 -2.1078 -3.2656 -2.9107 -0.3130 -4.6006 -4.6006 7.7979 -9.7074 9.7415 5 A.sub.test3 -3.2170 -4.1286 -2.7121 -2.9509 -0.3017 -4.9078 -4.9078 7.5987 -9.7413 9.8926 6 -3.2355 -4.0775 -2.7273 -2.9425 -0.3138 -4.9163 -4.9163 7.5828 -9.7246 9.9027 7 A.sub.test4 -2.2714 -5.3311 -3.6646 -3.0084 -0.4102 -4.7877 -4.7877 7.6737 -9.7731 9.9010 8 -2.2804 -5.3646 -3.6856 -3.0382 -0.4024 -4.7800 -4.7800 7.6316 -9.7455 9.8844
[0079] (3) A two-dimensional spatial distance d of A.sub.traink12 and A.sub.testk12 was calculated according to the following equation:
d= {square root over ((x.sub.j1-x.sub.i1).sup.2+(x.sub.j2-x.sub.i2).sup.2)} (15);
[0080] and d values and identification results were shown in table 12.
TABLE-US-00012 TABLE 12 Two-dimensional spatial distance d values and identification results identi- 1 2 1 2 fication No. X.sub.j1 X.sub.j2 No. X.sub.i1 X.sub.i2 d.sub.test1 d.sub.test2 d.sub.test3 d.sub.test4 results 1 A.sub.test1 -2.0827 -4.2206 A.sub.train4 -2.0919 -4.3060 0.0859 1.7641 1.1536 1.1102 VOCs 2 -2.0803 -4.2121 (VOCs) 0.0946 1.7555 1.1549 1.1106 VOCs 3 A.sub.test2 -1.9973 -2.1485 A.sub.train2 -1.9942 -2.4587 2.1596 0.3102 2.3164 3.1694 CH.sub.4 4 -1.9974 -2.1078 (CH.sub.4) 2.2002 0.3509 0.0582 3.2099 CH.sub.4 5 A.sub.test3 -3.2170 -4.1286 A.sub.train3 -3.2266 -4.0712 1.1390 2.0697 0.0109 1.5091 NH.sub.3 6 -3.2355 -4.0775 (NH.sub.3) 1.1662 2.0399 0.0109 1.5606 NH.sub.3 7 A.sub.test4 -2.2714 -5.3311 A.sub.train1 -2.2729 -5.3059 1.0407 2.8857 1.5811 0.0252 CO.sub.2 8 -2.2804 -5.3646 (CO.sub.2) 1.0753 2.9200 1.6026 0.0592 CO.sub.2
[0081] In this embodiment, two-dimensional spatial distances d of the matrix A.sub.testk of the gas samples to be test and the matrix A.sub.traink of the trained gas samples were respectively calculated, where d being close to 0 indicated that the gas sample to be tested and the trained gas sample are identified as the same type of gas. It can be seen from Table 12, the first type of the gas samples to be tested was VOCs, and the second type of the gas samples to be tested was CH.sub.4, the third type of the gas samples to be tested was NH.sub.3, and the fourth type of the gas samples to be tested was CO.sub.2. In FIG. 5, (X.sub.j1,X.sub.j2) was a center point of each type of the trained gas samples, and X.sub.j1 was the abscissa data, X.sub.j2 was the ordinate data; and (X.sub.i1,X.sub.i2) was the classification point of respective gas samples to be tested, and X.sub.i1 was the abscissa data, and X.sub.i2 was the ordinate data.
[0082] The same or similar reference numerals correspond to the same or similar parts.
[0083] The terms for describing the positional relationship in the drawings are illustrative only, and are not intended to limit the present invention;
[0084] Obviously, the above are some exemplary embodiments of the invention, which are merely for the purpose of illustration, and are not intended to limit the present invention. Other modifications or variations can be made by those skilled in the art based on the above descriptions. All these modifications, equivalent replacements and improvements made within the spirit and principle of the present invention shall fall within the scope of the appended claims of the present invention.
* * * * *
D00000
D00001
D00002
D00003
D00004
D00005


XML
uspto.report is an independent third-party trademark research tool that is not affiliated, endorsed, or sponsored by the United States Patent and Trademark Office (USPTO) or any other governmental organization. The information provided by uspto.report is based on publicly available data at the time of writing and is intended for informational purposes only.
While we strive to provide accurate and up-to-date information, we do not guarantee the accuracy, completeness, reliability, or suitability of the information displayed on this site. The use of this site is at your own risk. Any reliance you place on such information is therefore strictly at your own risk.
All official trademark data, including owner information, should be verified by visiting the official USPTO website at www.uspto.gov. This site is not intended to replace professional legal advice and should not be used as a substitute for consulting with a legal professional who is knowledgeable about trademark law.