Flourescent Protein Composition For Dna Sequence Analysis And Method For Dna Sequence Analysis Using Same
JO; Kyubong ; et al.
U.S. patent application number 16/427438 was filed with the patent office on 2020-06-18 for flourescent protein composition for dna sequence analysis and method for dna sequence analysis using same. The applicant listed for this patent is SOGANG UNIVERSITY RESEARCH FOUNDATION. Invention is credited to Kyubong JO, Seonghyun LEE, Jihyun PARK, Eunji SHIN.
| Application Number | 20200190580 16/427438 |
| Document ID | / |
| Family ID | 71072483 |
| Filed Date | 2020-06-18 |


| United States Patent Application | 20200190580 |
| Kind Code | A1 |
| JO; Kyubong ; et al. | June 18, 2020 |
FLOURESCENT PROTEIN COMPOSITION FOR DNA SEQUENCE ANALYSIS AND METHOD FOR DNA SEQUENCE ANALYSIS USING SAME
Abstract
The present invention relates to a composition for DNA sequence analysis and a method for DNA sequence analysis, the method comprising treating a sample with the composition. The composition of the present invention can attain efficient optical identification at a single-DNA molecule level by linking both an A/T-specific DNA-binder agent and an A/T-non-specific complementary DNA-binder agent to DNA, and thus can be helpfully used in studying chromosomal organization of genomes, protein immunolocalization, and the like.
| Inventors: | JO; Kyubong; (Seoul, KR) ; LEE; Seonghyun; (Seoul, KR) ; PARK; Jihyun; (Gyeonggi-Do, KR) ; SHIN; Eunji; (Seoul, KR) | ||||||||||
| Applicant: |
|
||||||||||
|---|---|---|---|---|---|---|---|---|---|---|---|
| Family ID: | 71072483 | ||||||||||
| Appl. No.: | 16/427438 | ||||||||||
| Filed: | May 31, 2019 |
| Current U.S. Class: | 1/1 |
| Current CPC Class: | C12Q 1/6886 20130101; C12Q 1/6869 20130101; C12Q 1/6876 20130101; C12Q 1/6869 20130101; C12Q 2565/107 20130101; C12Q 2565/531 20130101 |
| International Class: | C12Q 1/6876 20060101 C12Q001/6876 |
Foreign Application Data
| Date | Code | Application Number |
|---|---|---|
| Dec 13, 2018 | KR | 10-2018-0161115 |
Claims
1. A composition for DNA sequence analysis, the composition comprising: an adenine/thymine (A/T)-specific DNA binding protein linked with a first fluorescent protein; and an NT-non-specific DNA binding protein linked with a second fluorescent protein.
2. The composition of claim 1, wherein the first fluorescent protein and the second fluorescent protein exhibit different colors.
3. The composition of claim 1, wherein the first fluorescent protein is mCherry.
4. The composition of claim 2, wherein the first fluorescent protein is mCherry.
5. The composition of claim 1, wherein the second fluorescent protein is enhanced green fluorescent protein (eGCP).
6. The composition of claim 2, wherein the second fluorescent protein is enhanced green fluorescent protein (eGCP).
7. The composition of claim 1, wherein the NT-specific DNA binding protein is a histone-like nucleoid-structuring (H-NS) protein or a high mobility group (HMG).
8. The composition of claim 1, wherein the NT-non-specific DNA binding protein is a breast cancer 1 (BRCA1) protein or a protein having a structure of Chemical Formula 1 below: (XY).sub.n, [Chemical Formula 1] wherein X and Y each are independently any amino acid independently selected from lysine (K), tryptophane (W), or derivatives thereof; and wherein n is an integer of 1 to 5.
9. A method for DNA sequence analysis, the method comprising treating a sample with the composition of claim 1.
10. The method of claim 9, further comprising comparing the adenine/thymine (A/T) frequency of the entire genome of an analysis target and the NT frequency of the sample treated with the composition.
11. The method of claim 9, wherein the sample is a single DNA molecule.
Description
CROSS-REFERENCE TO RELATED APPLICATION
[0001] This application claims priority to Korean Patent Application No. 10-2018-0161115, filed on Dec. 13, 2018, the entire contents of which are incorporated herein by reference.
FIELD
[0002] The present disclosure relates to a composition for DNA sequence analysis and a method for DNA sequence analysis using the same and, specifically, to a composition containing a DNA-binding fluorescent protein and a method for DNA sequence analysis, the method comprising treating a sample with the same.
BACKGROUND
[0003] Direct visualization of individual DNA molecules is very important because it allows for understanding biochemical events within the context of DNA sequences. Although sequencing technology at the single nucleotide level has advanced, biological problems still remain unsolved, which are limited by short read length and information loss within a large genome.
[0004] The ultimate goal of DNA analysis would be to acquire nucleotide sequences and epigenetic information directly from chromosomal DNA without fragmentation or amplification. Given these concerns, single DNA molecules are a promising platform to overcome limitations of current sequencing technology.
[0005] In this regard, optical mapping, which is a technique for gaining genetic information by visualizing a large DNA molecule, has been continually developed. This technique is a method to make barcode-like patterns from a single DNA molecule for visualization.
[0006] Meanwhile, conventional analysis methods using sequence-specific restriction enzymes retain the fundamental problem of DNA cleavage. Analysis methods using sequence-specific substances for A/T base pairs (Netropsin, etc.) and fluorescent dye markers raises the problem that YOYO-1, used as the fluorescent dye, causes light-induced DNA cleavage.
[0007] There is therefore a need for the development of a substance that can bind in a sequence-specific manner and fluoresce alone without causing DNA cleavage.
SUMMARY
Technical Problem
[0008] The present inventors endeavored to develop a substances capable of obtaining images of genome-specific molecules at a single-DNA molecule level. As a result, the present inventors confirmed that the use of both an NT-specific DNA binding protein and an A/T-non-specific complementary DNA binding protein can create a sequence-specific DNA map for efficient optical identification of a single DNA molecule even without separate sequencing, and then completed the present invention.
[0009] Therefore, a purpose of the present disclosure is to provide a composition for DNA sequence analysis.
[0010] Another purpose of the present disclosure is to provide a method for DNA sequence analysis.
Technical Solution
[0011] The present inventors endeavored to develop a substances capable of obtaining images of genome-specific molecules at a single-DNA molecule level. As a result, the present inventors confirmed that the use of both an NT-specific DNA binding protein and an A/T-non-specific complementary DNA binding protein can create a sequence-specific DNA map for efficient optical identification of a single DNA molecule even without separate sequencing.
[0012] The present invention is directed to a composition for DNA sequence analysis and a method for DNA sequence analysis using the same.
[0013] Hereinafter, the present invention will be described in detail.
[0014] In accordance with an aspect of the present invention, there is provided a composition for DNA sequence analysis, the composition containing: an adenine/thymine (A/T)-specific DNA binding protein linked with a first fluorescent protein; and an NT-non-specific DNA binding protein linked with a second fluorescent protein.
[0015] The first fluorescent protein and the second fluorescent protein may exhibit different colors differentiated from each other.
[0016] Specifically, the first fluorescent protein may exhibit red and the second fluorescent protein may exhibit green; the first fluorescent protein green and the second fluorescent blue; or the first fluorescent protein yellow and the second fluorescent protein sky blue.
[0017] The first fluorescent protein may be mCherry, DsRed2, mScarlet, mStrawberry, tdTomato, TagRFP, TagRFP-T, mApple, mRuby, mPlum, mKate2, mNeptune, or TagRFP657, but is not limited thereto.
[0018] The second fluorescent protein may be enhanced green fluorescent protein (eGFP), Emerald, Superfolder GFP, TagGFP2, mClover2, mClover3, mEos2, or mEos3.2, but is not limited thereto.
[0019] The adenine/thymine (A/T)-specific DNA binding protein may bind to DNA specifically to A/T nucleotide pair (W).
[0020] The A/T-specific DNA binding protein is a histone-like nucleoid-structuring (H-NS) protein or a high mobility group (HMG), but is not limited thereto.
[0021] The amino acid sequence of the histone-like nucleoid-structuring protein is represented by SEQ ID NO: 17.
[0022] The amino acid sequence of the high mobility group is represented by SEQ ID NO: 18.
[0023] The NT-non-specific DNA binding protein may bind to DNA non-specifically to NT nucleotide pair (W).
[0024] The NT-non-specific DNA binding protein is, but not limited to, a breast cancer 1 (BRCA1) protein or a protein having a structure of chemical formula 1 below:
(XY).sub.n, [Chemical Formula 1]
[0025] wherein X and Y each may be independently any amino acid independently selected from lysine (K), tryptophane (W), or derivatives thereof; and
[0026] wherein n may be an integer of 1 to 5.
[0027] The amino acid sequence of the BRCA1 protein is represented by SEQ ID O: 19.
[0028] The fluorescent protein (first or second fluorescent protein) and the DNA binding protein (NT-specific or NT-non-specific DNA binding protein) may be linked with to each other via a linker. Various kinds of linkers that can link a DNA binding protein and a fluorescent protein may be used according to the kind of fluorescent protein.
[0029] The linker may be a peptide linker comprising at least two amino acids selected from the group consisting of glycine (G), serine (S), lysine (K), and alanine (A).
[0030] The linker sequence may be, for example, GGSGG, but is not limited thereto.
[0031] The first fluorescent protein (or the second fluorescent protein) may be located at the N-terminal or C-terminal of the A/T-specific DNA binding protein (or NT-non-specific DNA binding protein), or may be located at both the N-terminal and C-terminal thereof.
[0032] The NT-specific DNA binding protein linked with the first fluorescent protein and the NT-non-specific DNA binding protein linked with the second fluorescent protein may be contained at a concentration ratio of 1:1-20, 1:1-10, 1:2-10, 1:3-10, 1:4-10, 1:5-10, 1:1-9, 1:1-8, 1:1-7, 1:1-6, 1:1-5, 1:1, 1:2, 1:3, 1:4, 1:5, 1:6, 1:7, 1:8, 1:9, 1:10, 1:11, 1:12, 1:13, 1:14, 1:15, 1:16, 1:17, 1:18, 1:19, or 1:20.
[0033] The DNA may be for example, a single DNA molecule, oligo DNA, a chromosome, a polytenechromosome, and a chromatin fiber, but is not limited thereto.
[0034] In the composition, the A/T-specific DNA binding protein linked with the first fluorescent protein preferentially binds to an NT-rich region of DNA, so that efficient optical identification of a single DNA molecule can be attained by linking both an NT-specific DNA binder agent and a A/T-non-specific complementary DNA binder agent to DNA.
[0035] Furthermore, the composition can analyze chemically modified or damaged DNA backbone, unlike conventional sequencing, and thus can be helpfully used at a single-DNA molecule level.
[0036] In accordance with another aspect of the present invention, there is provided a method for DNA sequence analysis, the method including treating a sample with a composition for DNA sequence analysis, the composition containing: an adenine/thymine (A/T)-specific DNA binding protein linked with a first fluorescent protein; and an NT-non-specific DNA binding protein linked with a second fluorescent protein.
[0037] The method may further include comparing the adenine/thymine (A/T) frequency of the entire genome of an analysis target and the NT frequency of the sample treated with the composition.
[0038] The sample may be, for example, a single DNA molecule, oligo DNA, a chromosome, a polytenechromosome, and a chromatin fiber, but is not limited thereto.
[0039] In the method, the DNA sequence of the analysis target can be analyzed by scanning the entire genomic NT frequency of the analysis target in silico map using a Python program and searching the most suitable alignment position between an image of the sample treated with the composition for DNA sequence analysis and the scanned entire genome NT frequency.
[0040] The overlapping description of the composition is omitted considering the complexity of the present specification.
Advantageous Effects
[0041] The present invention is directed to a composition for DNA sequence analysis and a method for DNA sequence analysis, the method comprising treating a sample with the composition. The composition of the present invention can attain efficient optical identification at a single-DNA molecule level by linking both an NT-specific DNA-binder agent and an NT-non-specific complementary DNA-binder agent to DNA, and thus can be helpfully used in studying chromosomal organization of genomes, protein immunolocalization, and the like.
[0042] Especially when the composition is a fluorescent protein having DNA binding ability, the composition facilitates production and induces mutations after the construction of genes, and thus has an advantage that various new properties can be imparted.
BRIEF DESCRIPTION OF THE DRAWINGS
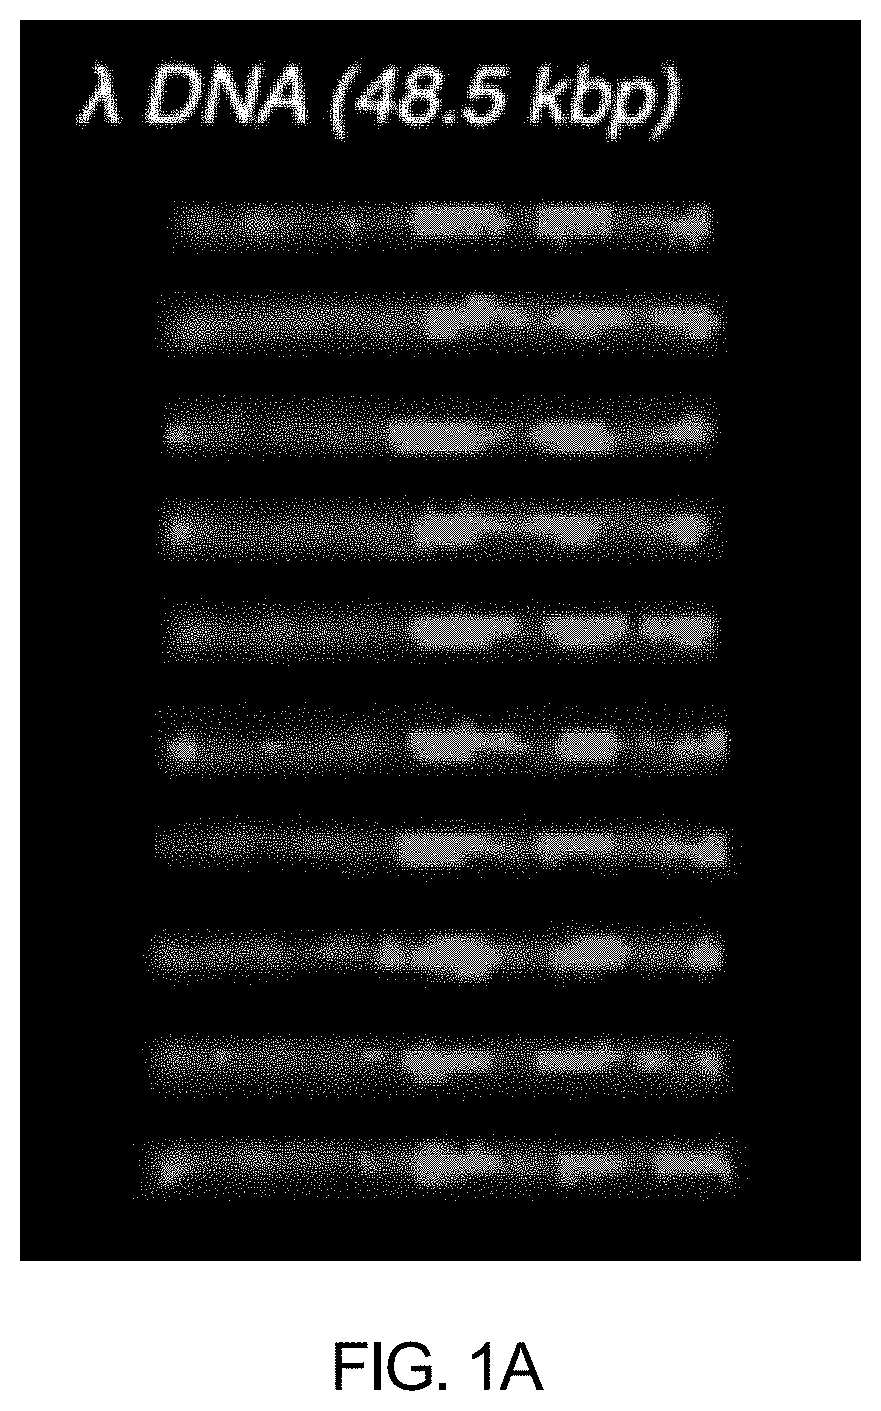
[0043] FIG. 1A schematically shows stained DNA molecules according to an embodiment of the present invention, and specifically, .lamda. DNA molecules stained with H-NS-mCherry and BRCA1-eGFP.
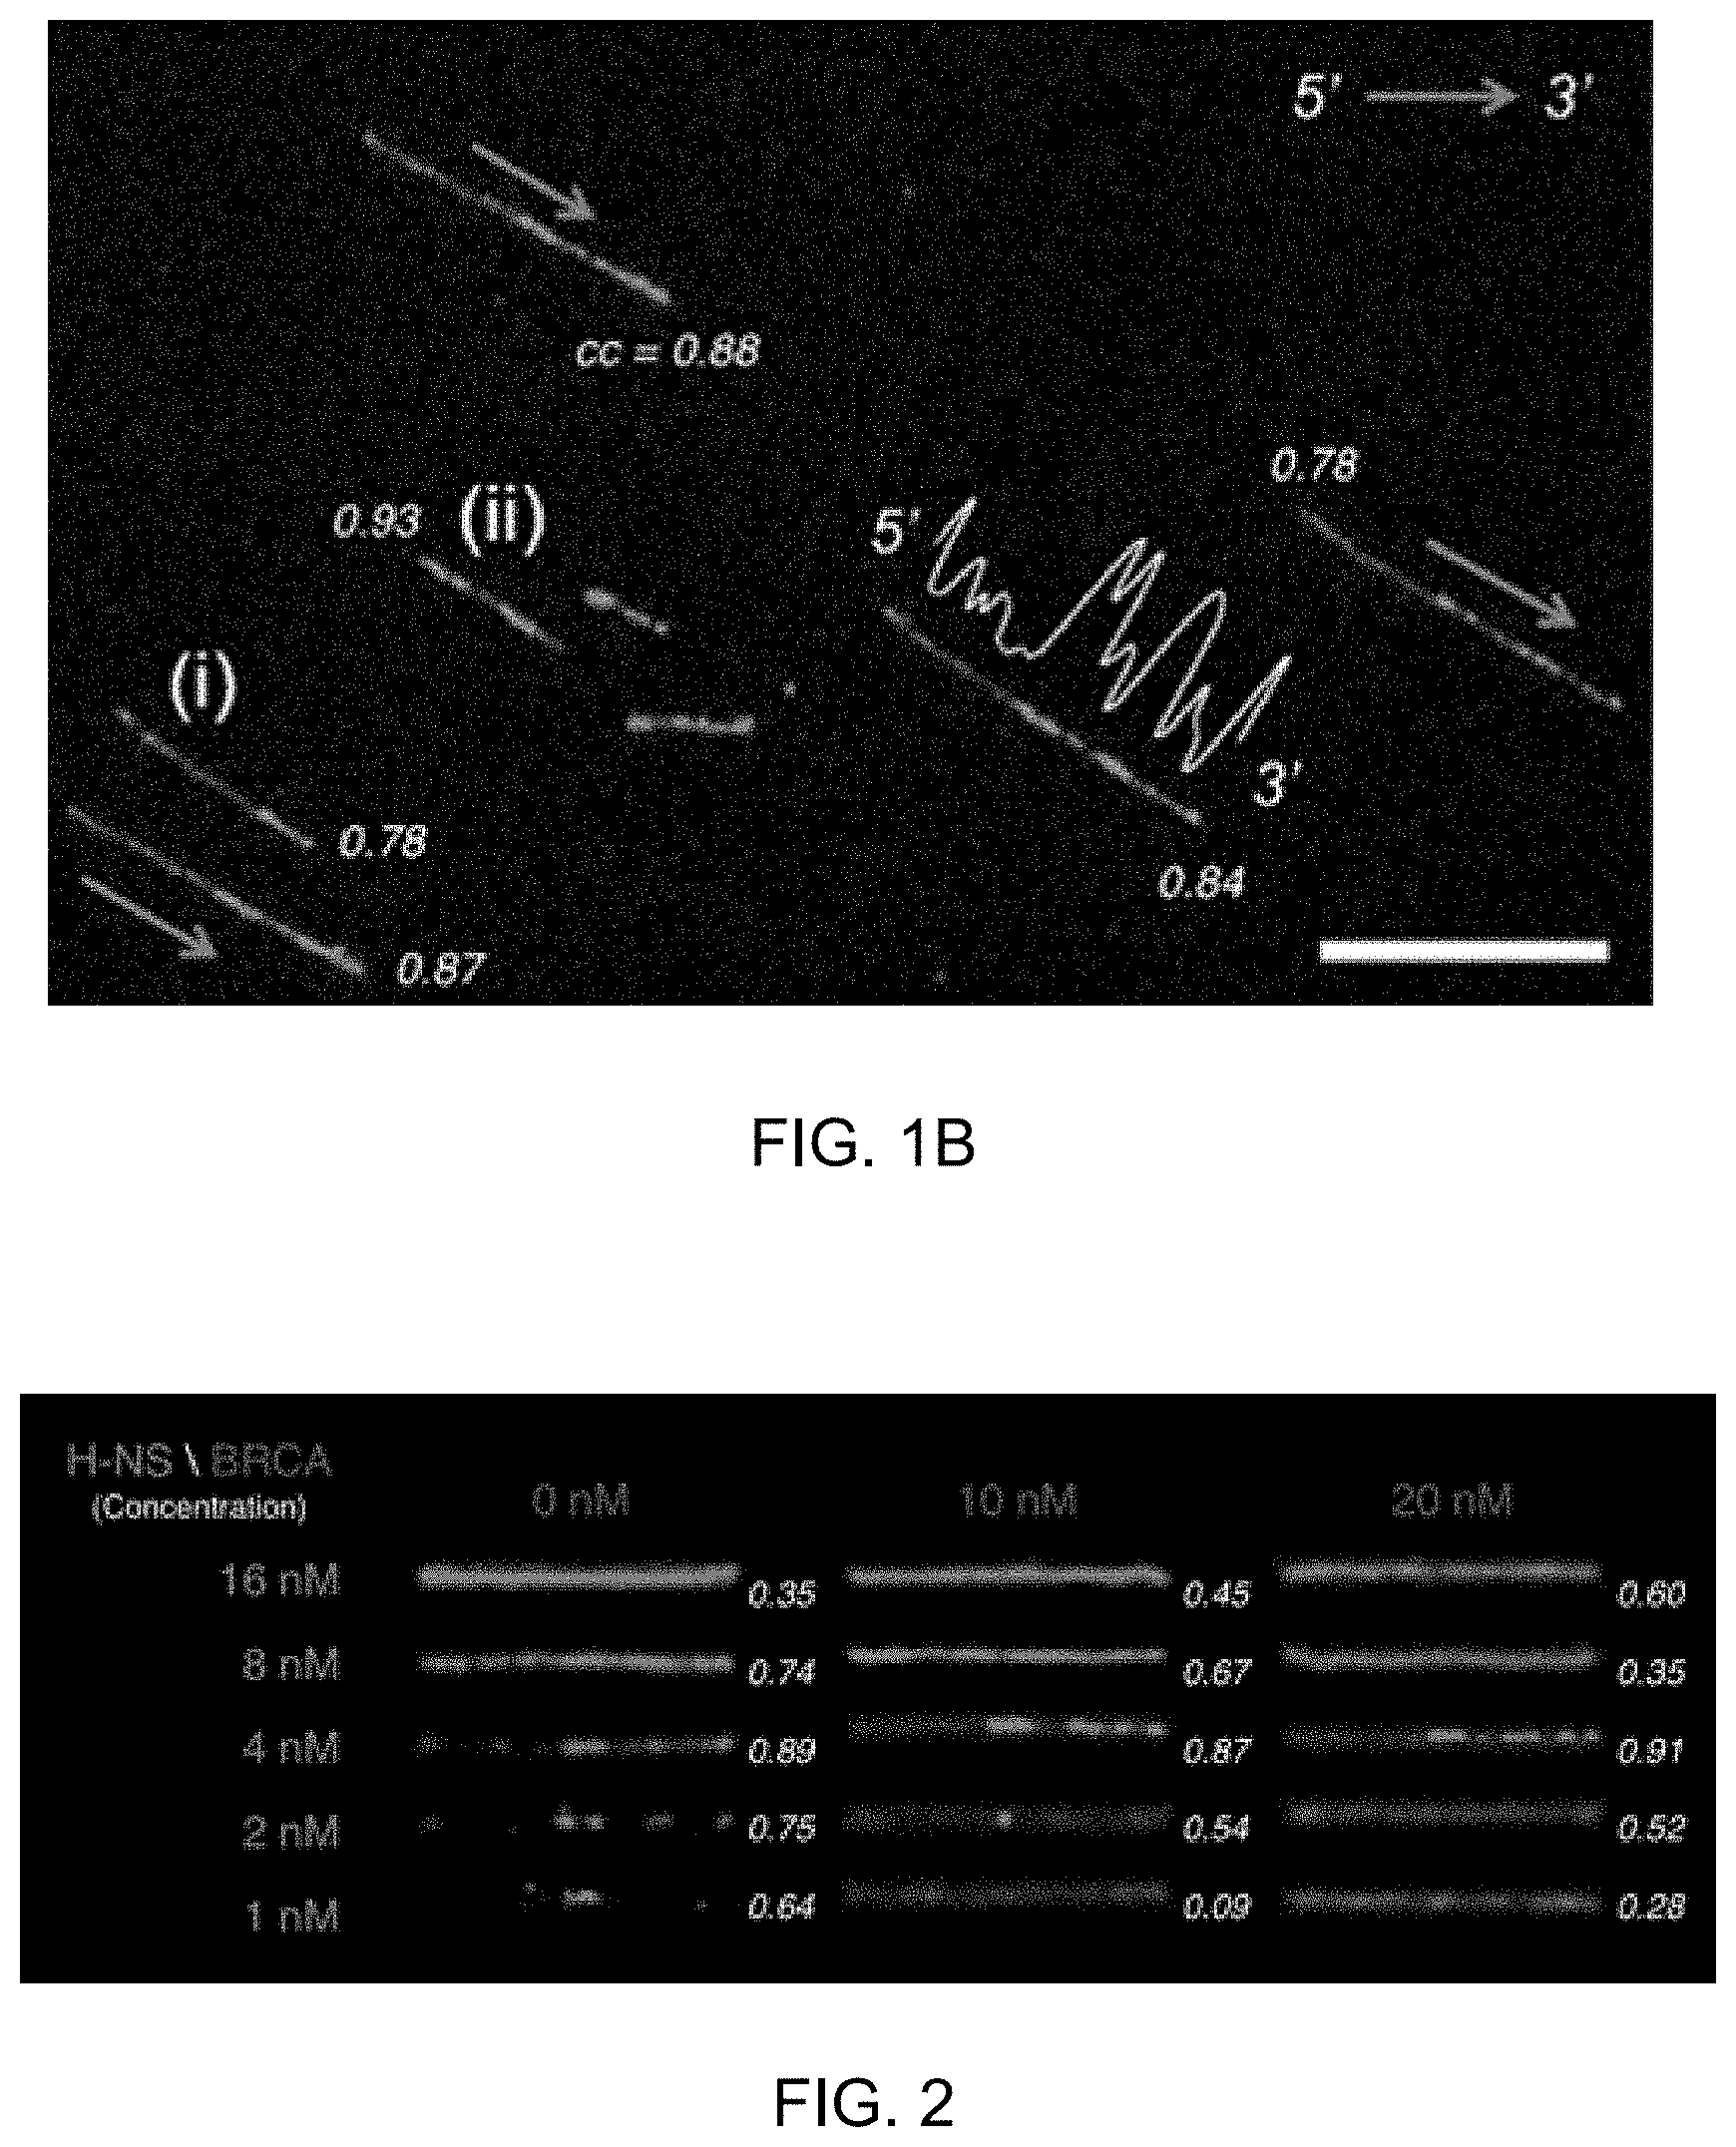
[0044] FIG. 1B shows stained DNA molecules according to an embodiment of the present invention. The arrows indicate molecular orientations of 5' to 3'; the white profile indicates the A/T frequency of .lamda. DNA (scale bar: 10 .mu.m), and respective numerical values indicate cross-correlation values (cc).
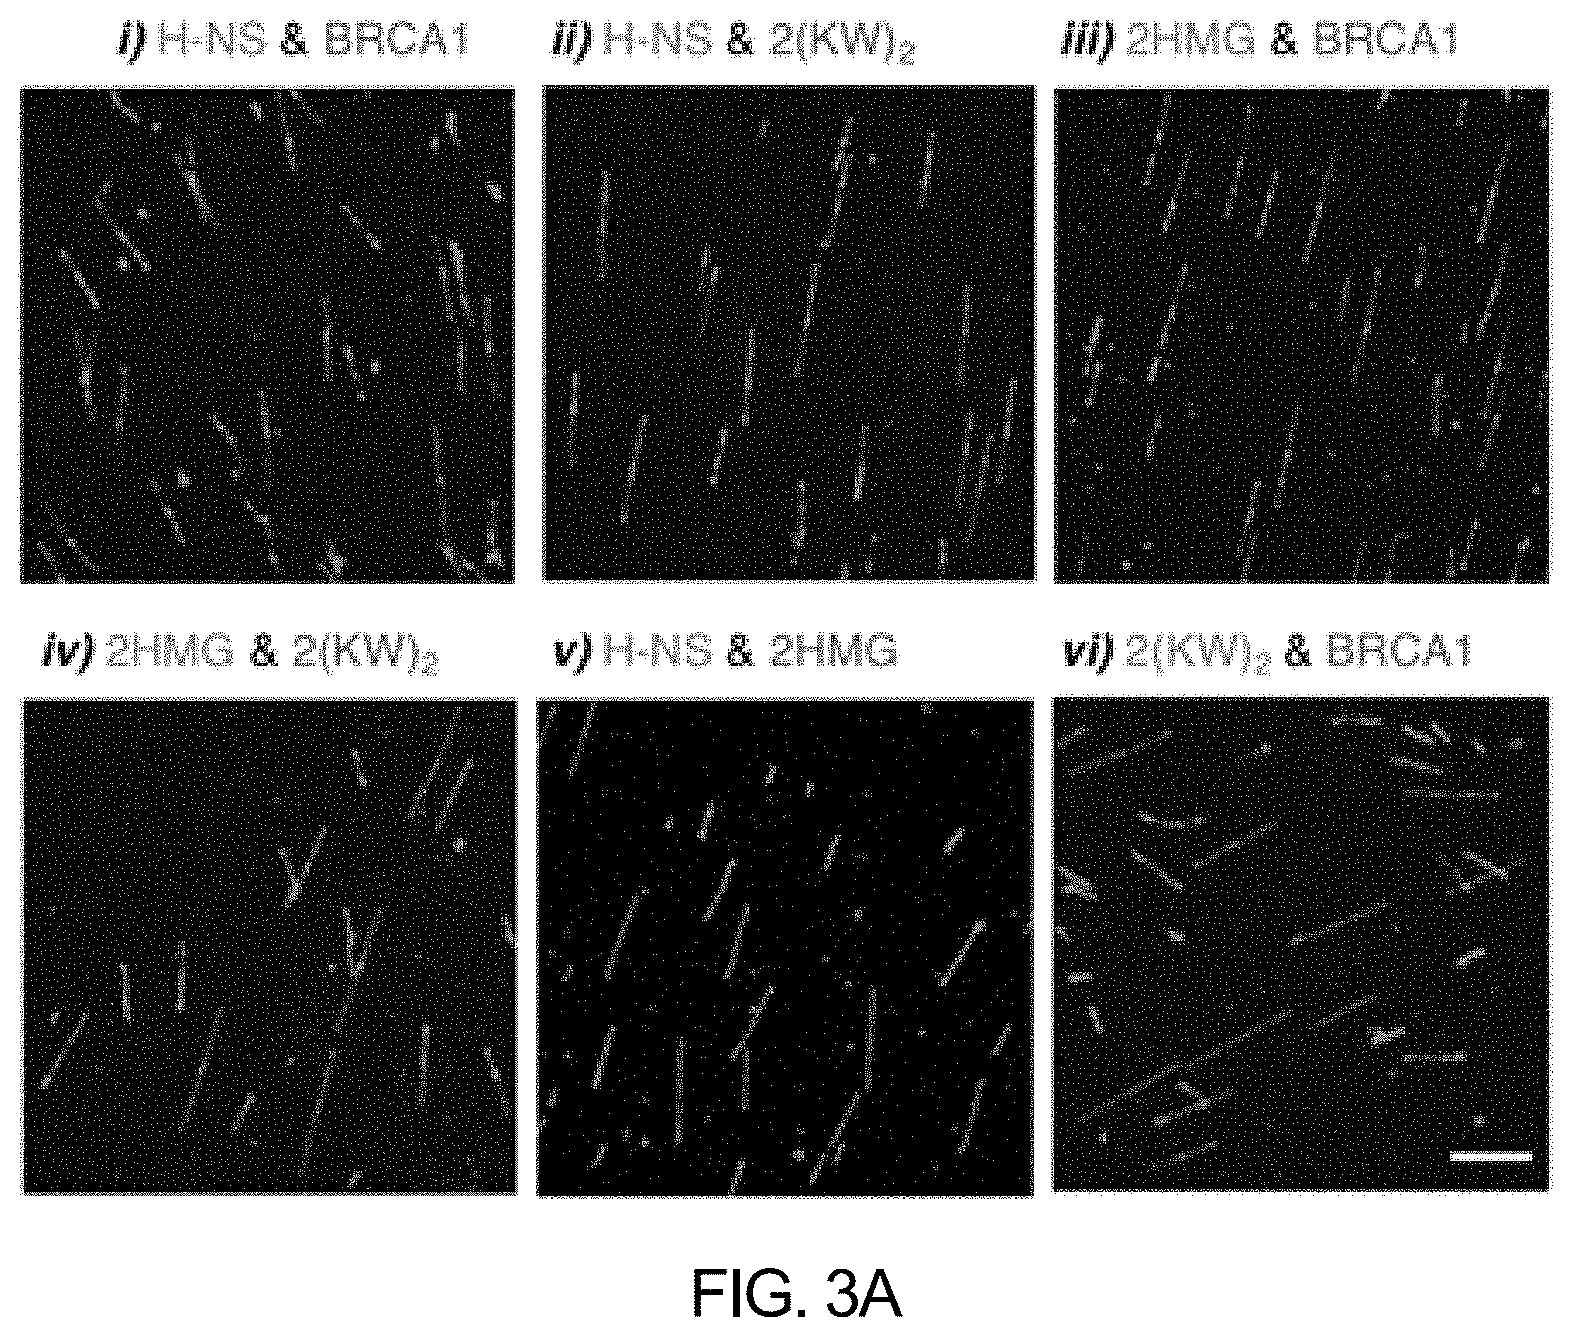
[0045] FIG. 2 shows .lamda. DNA molecules stained with H-NS-mCherry and BRCA1-eGFP at various concentrations according to an embodiment of the present invention. Respective numerical values indicate cross-correlation values (cc).
[0046] FIG. 3A shows .lamda. DNA molecules stained with various combinations of fluorescent protein-DNA binding protein according to an embodiment of the present invention. The respective combinations are shown below (scale bar: 10 .mu.m):
[0047] i) H-NS-mCherry and BRCA1-eGFP, ii) H-NS-mCherry and 2(KW).sub.2-eGFP, iii) 2HMG-mCherry and BRCA1-eGFP, iv) 2HMG-mCherry and 2(KW).sub.2-eGFP, v) H-NS-mCherry and 2HMG-eGFP, and vi) 2(KW).sub.2-mCherry and BRCA1-eGFP.
[0048] FIG. 3B shows .lamda. DNA molecules stained with various combinations of fluorescent protein-DNA binding protein according to an embodiment of the present invention. The respective combinations are shown below (scale bar: 10 .mu.m):
[0049] i) H-NS-mCherry and BRCA1-eGFP, ii) H-NS-mCherry and 2(KW).sub.2-eGFP, iii) 2HMG-mCherry and BRCA1-eGFP, and iv) 2HMG-mCherry and 2(KW).sub.2-eGFP.
[0050] FIG. 3C is a graph showing cross-correlation values of .lamda. DNA molecules stained with various combinations of fluorescent protein-DNA binding protein according to an embodiment of the present invention (Random: 0.55.+-.0.14, is 0.84.+-.0.10, 0.87.+-.0.05, iii: 0.84.+-.0.04, iv: 0.86.+-.0.03, v: 0.61.+-.0.15, and vi: 0.59.+-.0.11) (*p<0.02, **p<0.005).
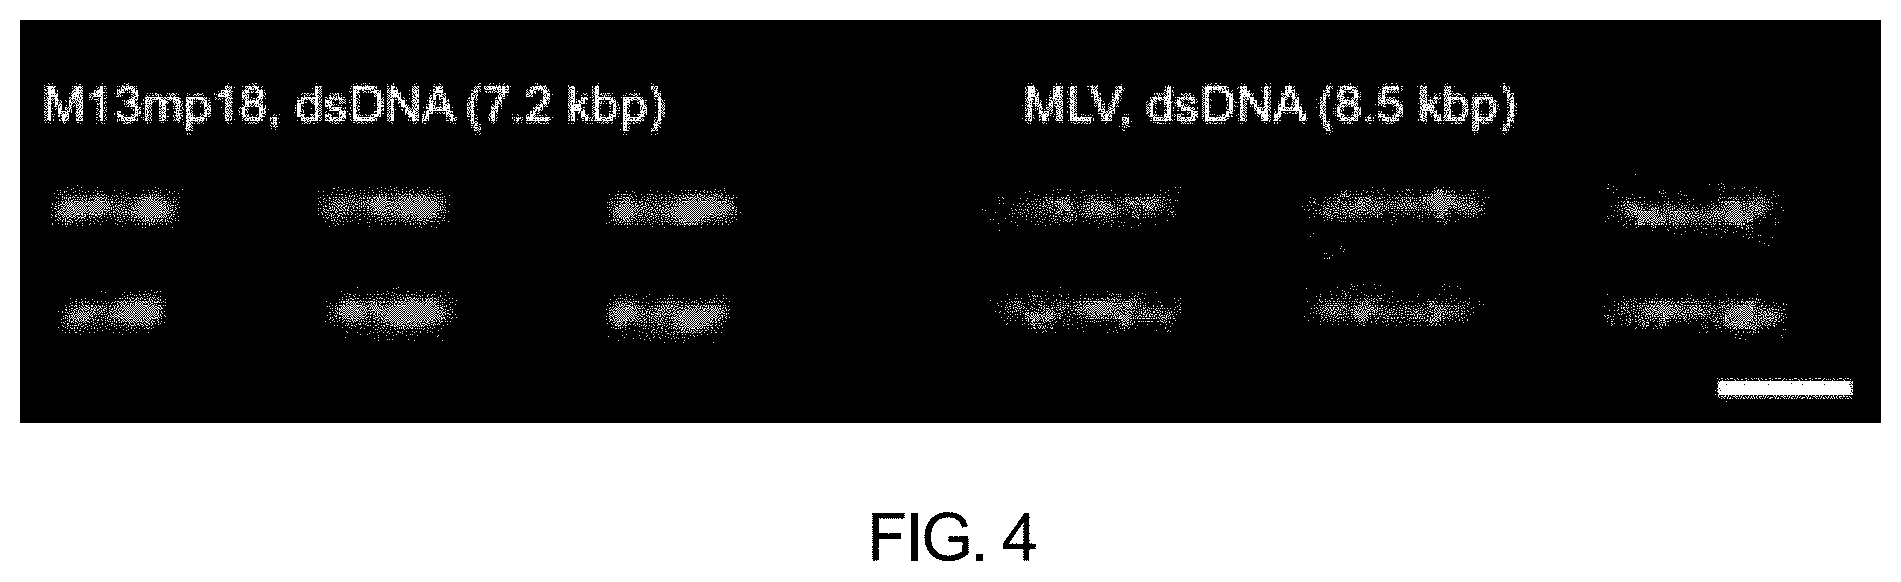
[0051] FIG. 4 schematically shows viral genomic DNA molecules stained with H-NS-mCherry and BRCA1-eGFP according to an embodiment of the present invention (scale bar: 5 .mu.m).
DETAILED DESCRIPTION
[0052] Hereinafter, the present invention will be described in more detail with reference to examples. These examples are only for illustrating the present invention more specifically, and it will be apparent to those skilled in the art that the scope of the present invention is not limited by these examples.
[0053] Test Materials and Reagents
[0054] DNA primers were purchased from Cosmogenetech (Korea). Biotin-labeled DNA oligomers were purchased from Bioneer (Korea). E. coli BL21 (DE3) strain was purchased from Yeastern (Taiwan). .lamda. DNA(NC_001416.1, 48,502 bp) and single-stranded M13mp18 (7,249 bp) were purchased from New England Biolabs (US). Epoxy was purchased from Devcon (US). N-trimethoxymethyl silyl propyl-N,N,N-trimethyl ammonium chloride (50% methanol) was purchased from Gelest (Morrisville, US). Ni-NTA agarose resin and column were purchased from Qiagen (Venlo, Netherlands). Unless note, all enzymes were purchased from NEB, and all reagents were purchased from Sigma-Aldrich.
[0055] Fluorescence Microscopy and DNA Visualization
[0056] An inverted optical microscope (Olympus IX70, Japan) was equipped with 60.times. and 100.times. Olympus UPlanSApo oil immersion objectives, and a LED light source (SOLA SM II light engine, Lumencor, US) was used. The light was condensed through corresponding filter sets (Semrock, US) to set excitation and emission wavelengths.
[0057] Fluorescence microscopic images were stored in a 16-bit TIFF format through an electron-multiplying charge-coupled device (EMCCD) digital camera device (Evolve EMCCD, Roper Scientific, US), and the software Micro-manager was used. For image processing and analysis, the Java plug-in and python programs developed by the present inventors and ImageJ software were used.
[0058] Python Program [0059] imageCompare.py: a library of functions. [0060] seq2map.py: converts a FASTA sequence file in silico map into an image with high frequency portions in white and low frequency portions in black. [0061] insilicoMapFolder.py: scans and compares the in silico image file and the DNA image obtained from experiments for all images in a folder, and returns the position and value of a point with the highest cross-correlation coefficient, which are then stored in a new record file. [0062] sortView.py: reads the record file obtained by insilicoMapFolder.py to visualize signal comparison, cross-correlation coefficient search, and image comparison and create the same in a new window. [0063] randomtiff.py: creates tiff images having random brightness values.
[0064] Preparation of Fluorescent Protein-DNA Binding Protein
[0065] Plasmids necessary for protein production were constructed by overlap extension polymerase chain reaction (OE-PCR), which links a fluorescent protein to the C-terminal of DNA binding protein. The GGSGG linker containing glycine and serine was used, and respective primer sequences are shown in Table 1.
[0066] HNS-mCherry:
[0067] H-NS DNA was amplified using forward primer P1-HNS and reverse primer P2-HNS while DNA plug of E. coli MG1655 strain was used as template. mCherry DNA was amplified using the forward primer P3-mCherry and the reverse primer P4-mCherry. Then, H--NS and mCherry were linked with each other by overlap polymerase chain reaction.
[0068] BRCA1-eGFP:
[0069] BRCA1-DNA binding domain was amplified using the forward primer P5-BRCA and the reverse primer P6-BRCA while partial BRCA1 (Addgene plasmid #71116) including 452-1079 residues was used as a template. eGFP DNA was amplified using the forward primer P7-eGFP and the reverse primer P8-eGFP. Then, BRCA1 DNA binding domain and eGFP were linked with each other by overlap polymerase chain reaction.
[0070] 2HMG-mCherry:
[0071] 2HMG-mCherry was constructed by tagging DNA binding sites to each terminal of mCherry while the forward primer P9-HMG-mCherry and the reverse primer P10-HMG-mCherry were used.
[0072] 2(KW).sub.2-mCherry:
[0073] 2(KW).sub.2-mCherry was constructed by tagging DNA binding sites to each terminal of mCherry while the forward primer P11-(KW).sub.2-mCherry and the reverse primer P12-(KW).sub.2-mCherry were used.
[0074] 2(KW).sub.2-eGFP:
[0075] 2(KW).sub.2-eGFP was constructed by tagging DNA binding sites to each terminal of eGFP while the forward primer P13-(KW).sub.2-eGFP and the reverse primer P14-(KW).sub.2-eGFP were used.
[0076] 2HMG-eGFP:
[0077] 2HMG-eGFP was constructed by tagging DNA binding sites to each terminal of eGFP while the forward primer P15-HMG-eGFP and the reverse primer P16-HMG-eGFP were used.
TABLE-US-00001 TABLE 1 SEQ ID NO Name Sequence (5'-3') 1 P1-HNS ACTTCACATATGATGAGCGAAGCACTTAAAATTCTG 2 P2-HNS GCCACCAGAACCACCTTGCTTGATCAGGAAATCGTCG 3 P3-mCherry CAAGCAAGGTGGTTCTGGTGGCATGGTGAGCAAGGG CGAGGAG 4 P4-mCherry ATTTCAGGATCCCTACTTGTACAGCTCGTCCATGCC 5 P5-BRCA TATGCACATATGGTAGAGAGTAATATTGAAGACAAAAT ATTTGGG 6 P6-BRCA GCTCACCATACCGCCGCTGCCACCTTTTGGCCCTCTG TTTCTACCTAG 7 P7-eGFP GGTGGCAGCGGCGGTATGGTGAGCAAGGGCGAGGA G 8 P8-eGFP TATGCAGGATCCTTACGCCTTGTACAGCTCGTCCATG 9 P9-HMG-mCherry ATATTGCATATGACCCCGAAACGCCCGCGCGGCCGCC CGAAAAAAGGCGGCAGCGGCGGC/ATGGTGAGCAAG GGCGAGGAG 10 P10-HMG-mCherry ATATTGGGATCCTTAGCCGCCGCTGCCGCCTTTTTTC GGGCGGCCGCGCGGGCGTTTCGGGGT/CTTGTACAG CTCGTCCATGCC 11 P11-(KW).sub.2-mCherry ATGTTGCATATGAAATGGAAATGGAAAAAAGCGATGGT GAGCAAGGGCGAGGAG 12 P12-(KW).sub.2-mCherry ATGTTGGGATCCTTATTTCCATTTCCATTTTTTCGCCTT GTACAGCTCGTCCATGCC 13 P13-(KW).sub.2-eGFP ATGTTGCATATGAAATGGAAATGGAAAAAAGCGATGC GTGAGCAAGGGCGAGGAGC 14 P14-(KW).sub.2-eGFP ATGTTGGGATCCTTATTTCCATTTCCATTTTTTCGCCTT GTACAGCTCGTCCATGCC 15 P15-HMG-eGFP ATATTGCATATGACCCCGAAACGCCCGCGCGGCCGCC CGAAAAAAGGCGGCAGCGGCGGCATGCGTGAGCAAG GGCGAGGAGC 16 P16-HMG-eGFP ATATTGGGATCCTTAGCCGCCGCTGCCGCCTTTTTTC GGGCGGCCGCGCGGGCGTTTCGGGGTCTTGTACAGC TCGTCCATGCC
[0078] Molecular Cloning
[0079] Using standard subcloning procedures, fluorescent protein-DNA binding protein sequences were inserted into the pET-15b vector and transformed into the E. coli BL21 (DE3) strains by using NdeI and BamHI. A single colony of the transformed cells was inoculated in fresh LB media containing ampicillin and incubated for 1 h.
[0080] After transformed cells were saturated, the cells were incubated to an optical density of about 0.8 at 37.degree. C. with corresponding antibiotics. Fluorescent tagging proteins were overexpressed overnight with a final concentration of 1 mM for IPTG on a shaker at 20.degree. C. and 250 rpm.
[0081] Cells for protein purification were harvested by centrifugation at 12,000.times.g, for 10 min (following centrifugations were all performed under similar conditions), and the residual media was washed with the cell lysis buffer (50 mM Na2HPO4, 300 mM NaCl, 10 mM Imidazole, pH 8.0). The cells were lysed by ultrasonication for 30 min and cell debris were centrifuged at 13,000 rpm for 10 min at 4.degree. C. His-tagged FP-DNA binding proteins were purified using affinity chromatography with Ni-NTA agarose resin.
[0082] The mixture of cell protein and resin was kept on a shaking platform at 4.degree. C. for 1 h. The lysate containing proteins bound Ni-NTA agarose resin was loaded onto the column for gravity chromatography and was washed several times using the protein washing buffer (50 mM Na2HPO4, 300 mM NaCl, 20 mM Imidazole, pH 8.0). Especially for H-NS-mCherry, a washing buffer containing 35 mM Imidazole (50 mM Na2HPO4, 300 mM NaCl, 35 mM Imidazole, pH 8.0) was used.
[0083] Finally, the bound proteins were eluted using a protein elution buffer (50 mM Na2HPO4, 300 mM NaCl, 250 mM imidazole, pH 8.0). All proteins were diluted (10 .mu.g/mL) using 50% w/w glycerol/1.times.TE buffer (Tris 10 mM, EDTA 1 mM, pH 8.0).
[0084] Preparation of Coverslips and Modified Surfaces
[0085] Glass coverslips were inserted into the Teflon rack, and soaked in piranha etching solution (30:70 v/v H.sub.2O.sub.2/H.sub.2SO.sub.4) for 2 h, and then washed with deionized water until the pH reached the neutral (pH 7).
[0086] For positively-charged glass surfaces, 350 .mu.L of N-trimethoxymethylsilylpropyl-N,N,N-trimethyl ammonium chloride dissolved in 50% methanol was mixed with 200 mL of deionized water.
[0087] To prepare glass surface for DNA tethering, 2 mL of N-[3-(trimethoxysilyl)propyl] ethylenediamine was added to 200 mL of methanol and 10 mL of glacial acetic acid to add primary amino groups. The glass coverslips were incubated in the solution for 30 min, sonicated for 15 min, and then incubated for 12 h at room temperature. Then, the coverslips were washed with methanol and ethanol.
[0088] Preparation of Microfluidic Devices
[0089] To investigate DNA elongation and deposition on positively charged surfaces, polydimethylsiloxane (PDMS) microfluidic devices were manufactured employing a standard rapid phototyping method.
[0090] More specifically, the patterns on a silicon wafer for microchannels (4 .mu.m high and 100 .mu.m wide) were fabricated using SU-8 2005 photoresist (Microchem, US). The PDMS pre-polymer mixed with a curing agent (10:1 weight ratio) was cast on the patterned wafer and cured at 65.degree. C. for 4 h or longer. The cured PDMS was peeled off from the patterned wafer, and the PDMS devices were treated in an air plasma generator for 1 min with 100 W (Femto Science Cute Basic, Korea) to make PDMS surface hydrophilic. The PDMS devices were stored in water and air-dried before use.
Experimental Example 1: Confirmation of DNA Staining at Single-Molecule Level
[0091] A composition for DNA sequence analysis was prepared by mixing 50 .mu.L of 8 nM H-NS-mCherry and 50 .mu.L of 40 nM BRCA1-eGFP at a ratio of 1:1.
[0092] First, 10 .mu.L of a solution obtained by diluting .lamda. DNA to 15 ng/.mu.L with 1.times.TE (10 mM Tris, 1 mM EDTA, pH 8) was mixed with 10 .mu.L of the composition for DNA sequence analysis. After incubation at room temperature for a while, the mixture was diluted with 1.times.TE solution to 1/10-1/20, and then loaded at the entrance of a structure with a positively charged glass surface and a PDMS microchannel (100 .mu.m.times.4 .mu.m). Thereafter, DNA molecules were imaged on the microscope.
[0093] As can be confirmed in FIG. 1A, as a result of staining of .lamda. DNA using H-NS-mCherry and BRCA1-eGFP, .lamda. DNA molecules could be aligned based on three distinct red spots on a green DNA backbone.
[0094] Next, 3 .mu.L of a solution obtained by diluting .lamda. DNA to 1/10-1/20 with the 1.times.TE solution was dropped on the positively charged glass surface, which was then brought in contact with a slide glass to spread the solution, and imaged by a fluorescence microscope.
[0095] As can be confirmed in FIG. 1B, .lamda. DNA molecules were deposited on the positively charged surface. The alignment orientations of the randomly aligned DNA molecules can be obtained, and even in the case of the middle-broken DNA molecules but not the full molecule, the position information of corresponding fragments can be obtained.
Experimental Example 2: Confirmation of Optimal Concentration of Fluorescent Protein--DNA Binding Protein
[0096] H-NS-mCherry at various concentrations (1, 2, 4, 8, or 16 nM) was mixed with BRCA1-eGFP (0, 10, or 20 nM) to prepare compositions for DNA sequence analysis, and .lamda. DNA was visualized using PDMS microchannels by the method in Experimental Example 1''.
[0097] As can be confirmed in FIG. 2, the stained DNA color pattern was varied according to the concentration of the fluorescent protein-DNA binding protein.
[0098] More specifically, the use of 1 nM H-NS-mCherry and 20 nM BRCA1-eGFP generated a full green DNA molecule, but in contrast, the use of 16 nM H-NS-mCherry and 10 nM BRCA1-eGFP generated a full red DNA molecule. The optimal concentration was shown at the ratio of 4 nM H-NS-mCherry and 20 nM BRCA1-eGFP (the cc value is 0.91: the cross-correlation coefficient (hereinafter, cc) was evaluated by using the following equation).
cc = i = 1 n ( x i - x _ ) ( y i - y _ ) i = 1 n ( x i - x _ ) 2 i = 1 n ( y i - y _ ) 2 ##EQU00001##
[0099] (n=number of samples; x.sub.i, y.sub.i=value at each point; and x, y=average of samples)
[0100] Meanwhile, the use of only H-NS-mCherry generated nucleotide sequence (A/T)-specific color patterns at 4 nM or lower. These results indicate that H-NS-mCherry stains NT-rich regions and BRCA1-eGFP complementarily stains the parts of DNA, which were not stained by H-NS-mCherry.
Experimental Example 3: Confirmation of Various Combinations of Fluorescent Protein-DNA Binding Protein
[0101] On the basis of mCherry and eGFP fluorescent proteins, various combinations of fluorescent protein-DNA binding protein (H-NS-mCherry, BRCA1-eGFP, 2HMG-mCherry, 2(KW).sub.2-mCherry, 2(KW).sub.2-eGFP, 2HMG-eGFP) were used to produce compositions for DNA sequence analysis. .lamda. DNA was visualized using positively charged glass surface by the method in Experimental Example 1.
[0102] As can be confirmed in FIGS. 3A and 3B, four (I, ii, iii, and iv) out of six combinations generated NT-specific .lamda. genome patterns. On the contrary, random patterns (cc=0.61) were generated when both of the DNA binding proteins employ A/T-specific DNA binding proteins (H-NS and 2HMG) (v), and random patterns (cc=0.59) were also generated when both of the DNA binding proteins employ A/T-non-specific DNA binding proteins (BRCA1 and 2(KW).sub.2) (vi).
Experimental Example 4. Confirmation of DNA Staining at Short-DNA Fragment Level
[0103] It was further investigated with reference to the above example results whether the composition of the present invention was applicable in short DNA fragments, such as M13, a bacteriophage that infects bacteria, and murine leukemia virus (MLV), a retrovirus that infects mice.
[0104] More specifically, as for the M13 phage genome, the double-stranded M13mp18 was synthesized from single-stranded circular DNA by Top polymerase reaction with a primer (GGAAACCGA GGAAACGCAATAATAACGGAATACCC). After the polymerase reaction, the double-stranded circular DNA was linearized by PstI. The double-stranded retroviral genomic DNA was synthesized from murine leukemia virus genome. After the reaction, the circular dsDNA was linearized by BmtI.
[0105] Each viral DNA was visualized, by the method in Experimental example 1, using the composition for DNA sequence analysis in which 50 .mu.L of 8 nM H-NS-mCherry and 50 .mu.L of 40 nM BRCA1-eGFP were mixed at a ratio of 1:1.
[0106] As can be confirmed in FIG. 4, the linearized DNA molecules were two-color stained to generate genome-specific patterns. It was confirmed that M13 DNA and MLV DNA could be differentiated from each other based on such image patterns.
CONCLUSION
[0107] From the integration of the description, it could be confirmed that, by using a combination of two complementary color fusion proteins, the composition of the present invention specifically stains DNA AT-rich regions, and shows an AT-rich sequence-specific fluorescence intensity pattern on the DNA backbone when binding to DNA. The use of such sequence-specific patterns, when the full sequences are provided, can determine DNA sequences from microscopic images of stained DNA, and therefore, the composition of the present invention can be helpfully used in the high-rate and high-efficiency analysis of giant single DNA molecules.
[0108] This application contains references to amino acid sequences and/or nucleic acid sequences which have been submitted herewith as the sequence listing text file. The aforementioned sequence listing is hereby incorporated by reference in its entirety pursuant to 37 C.F.R. .sctn. 1.52(e).
Sequence CWU 1
1
19136DNAArtificial SequenceP1-HNS 1acttcacata tgatgagcga agcacttaaa
attctg 36237DNAArtificial SequenceP2-HNS 2gccaccagaa ccaccttgct
tgatcaggaa atcgtcg 37343DNAArtificial SequenceP3-mCherry
3caagcaaggt ggttctggtg gcatggtgag caagggcgag gag 43436DNAArtificial
SequenceP4-mCherry 4atttcaggat ccctacttgt acagctcgtc catgcc
36545DNAArtificial SequenceP5-BRCA 5tatgcacata tggtagagag
taatattgaa gacaaaatat ttggg 45648DNAArtificial SequenceP6-BRCA
6gctcaccata ccgccgctgc caccttttgg ccctctgttt ctacctag
48736DNAArtificial SequenceP7-eGFP 7ggtggcagcg gcggtatggt
gagcaagggc gaggag 36837DNAArtificial SequenceP8-eGFP 8tatgcaggat
ccttacgcct tgtacagctc gtccatg 37981DNAArtificial
SequenceP9-HMG-mCherry 9atattgcata tgaccccgaa acgcccgcgc ggccgcccga
aaaaaggcgg cagcggcggc 60atggtgagca agggcgagga g 811084DNAArtificial
SequenceP10-HMG-mCherry 10atattgggat ccttagccgc cgctgccgcc
ttttttcggg cggccgcgcg ggcgtttcgg 60ggtcttgtac agctcgtcca tgcc
841154DNAArtificial SequenceP11-(KW)2-mCherry 11atgttgcata
tgaaatggaa atggaaaaaa gcgatggtga gcaagggcga ggag
541257DNAArtificial SequenceP12-(KW)2-mCherry 12atgttgggat
ccttatttcc atttccattt tttcgccttg tacagctcgt ccatgcc
571356DNAArtificial SequenceP13-(KW)2-eGFP 13atgttgcata tgaaatggaa
atggaaaaaa gcgatgcgtg agcaagggcg aggagc 561457DNAArtificial
SequenceP14-(KW)2-eGFP 14atgttgggat ccttatttcc atttccattt
tttcgccttg tacagctcgt ccatgcc 571583DNAArtificial
SequenceP15-HMG-eGFP 15atattgcata tgaccccgaa acgcccgcgc ggccgcccga
aaaaaggcgg cagcggcggc 60atgcgtgagc aagggcgagg agc
831684DNAArtificial SequenceP16-HMG-eGFP 16atattgggat ccttagccgc
cgctgccgcc ttttttcggg cggccgcgcg ggcgtttcgg 60ggtcttgtac agctcgtcca
tgcc 8417139PRTUnknownhistone-like nucleoid-structuring 17His Met
Met Ser Glu Ala Leu Lys Ile Leu Asn Asn Ile Arg Thr Leu1 5 10 15Arg
Ala Gln Ala Arg Glu Cys Thr Leu Glu Thr Leu Glu Glu Met Leu 20 25
30Glu Lys Leu Glu Val Val Val Asn Glu Arg Arg Glu Glu Glu Ser Ala
35 40 45Ala Ala Ala Glu Val Glu Glu Arg Thr Arg Lys Leu Gln Gln Tyr
Arg 50 55 60Glu Met Leu Ile Ala Asp Gly Ile Asp Pro Asn Glu Leu Leu
Asn Ser65 70 75 80Leu Ala Ala Val Lys Ser Gly Thr Lys Ala Lys Arg
Ala Gln Arg Pro 85 90 95Ala Lys Tyr Ser Tyr Val Asp Glu Asn Gly Glu
Thr Lys Thr Trp Thr 100 105 110Gly Gln Gly Arg Thr Pro Ala Val Ile
Lys Lys Ala Met Asp Glu Gln 115 120 125Gly Lys Ser Leu Asp Asp Phe
Leu Ile Lys Gln 130 1351811PRTUnknownhigh mobility group 18Thr Pro
Lys Arg Pro Arg Gly Arg Pro Lys Lys1 5 1019628PRTUnknownbreast
cancer 1 19Val Glu Ser Asn Ile Glu Asp Lys Ile Phe Gly Lys Thr Tyr
Arg Lys1 5 10 15Lys Ala Ser Leu Pro Asn Leu Ser His Val Thr Glu Asn
Leu Ile Ile 20 25 30Gly Ala Phe Val Thr Glu Pro Gln Ile Ile Gln Glu
Arg Pro Leu Thr 35 40 45Asn Lys Leu Lys Arg Lys Arg Arg Pro Thr Ser
Gly Leu His Pro Glu 50 55 60Asp Phe Ile Lys Lys Ala Asp Leu Ala Val
Gln Lys Thr Pro Glu Met65 70 75 80Ile Asn Gln Gly Thr Asn Gln Thr
Glu Gln Asn Gly Gln Val Met Asn 85 90 95Ile Thr Asn Ser Gly His Glu
Asn Lys Thr Lys Gly Asp Ser Ile Gln 100 105 110Asn Glu Lys Asn Pro
Asn Pro Ile Glu Ser Leu Glu Lys Glu Ser Ala 115 120 125Phe Lys Thr
Lys Ala Glu Pro Ile Ser Ser Ser Ile Ser Asn Met Glu 130 135 140Leu
Glu Leu Asn Ile His Asn Ser Lys Ala Pro Lys Lys Asn Arg Leu145 150
155 160Arg Arg Lys Ser Ser Thr Arg His Ile His Ala Leu Glu Leu Val
Val 165 170 175Ser Arg Asn Leu Ser Pro Pro Asn Cys Thr Glu Leu Gln
Ile Asp Ser 180 185 190Cys Ser Ser Ser Glu Glu Ile Lys Lys Lys Lys
Tyr Asn Gln Met Pro 195 200 205Val Arg His Ser Arg Asn Leu Gln Leu
Met Glu Gly Lys Glu Pro Ala 210 215 220Thr Gly Ala Lys Lys Ser Asn
Lys Pro Asn Glu Gln Thr Ser Lys Arg225 230 235 240His Asp Ser Asp
Thr Phe Pro Glu Leu Lys Leu Thr Asn Ala Pro Gly 245 250 255Ser Phe
Thr Lys Cys Ser Asn Thr Ser Glu Leu Lys Glu Phe Val Asn 260 265
270Pro Ser Leu Pro Arg Glu Glu Lys Glu Glu Lys Leu Glu Thr Val Lys
275 280 285Val Ser Asn Asn Ala Glu Asp Pro Lys Asp Leu Met Leu Ser
Gly Glu 290 295 300Arg Val Leu Gln Thr Glu Arg Ser Val Glu Ser Ser
Ser Ile Ser Leu305 310 315 320Val Pro Gly Thr Asp Tyr Gly Thr Gln
Glu Ser Ile Ser Leu Leu Glu 325 330 335Val Ser Thr Leu Gly Lys Ala
Lys Thr Glu Pro Asn Lys Cys Val Ser 340 345 350Gln Cys Ala Ala Phe
Glu Asn Pro Lys Gly Leu Ile His Gly Cys Ser 355 360 365Lys Asp Asn
Arg Asn Asp Thr Glu Gly Phe Lys Tyr Pro Leu Gly His 370 375 380Glu
Val Asn His Ser Arg Glu Thr Ser Ile Glu Met Glu Glu Ser Glu385 390
395 400Leu Asp Ala Gln Tyr Leu Gln Asn Thr Phe Lys Val Ser Lys Arg
Gln 405 410 415Ser Phe Ala Pro Phe Ser Asn Pro Gly Asn Ala Glu Glu
Glu Cys Ala 420 425 430Thr Phe Ser Ala His Ser Gly Ser Leu Lys Lys
Gln Ser Pro Lys Val 435 440 445Thr Phe Glu Cys Glu Gln Lys Glu Glu
Asn Gln Gly Lys Asn Glu Ser 450 455 460Asn Ile Lys Pro Val Gln Thr
Val Asn Ile Thr Ala Gly Phe Pro Val465 470 475 480Val Gly Gln Lys
Asp Lys Pro Val Asp Asn Ala Lys Cys Ser Ile Lys 485 490 495Gly Gly
Ser Arg Phe Cys Leu Ser Ser Gln Phe Arg Gly Asn Glu Thr 500 505
510Gly Leu Ile Thr Pro Asn Lys His Gly Leu Leu Gln Asn Pro Tyr Arg
515 520 525Ile Pro Pro Leu Phe Pro Ile Lys Ser Phe Val Lys Thr Lys
Cys Lys 530 535 540Lys Asn Leu Leu Glu Glu Asn Phe Glu Glu His Ser
Met Ser Pro Glu545 550 555 560Arg Glu Met Gly Asn Glu Asn Ile Pro
Ser Thr Val Ser Thr Ile Ser 565 570 575Arg Asn Asn Ile Arg Glu Asn
Val Phe Lys Glu Ala Ser Ser Ser Asn 580 585 590Ile Asn Glu Val Gly
Ser Ser Thr Asn Glu Val Gly Ser Ser Ile Asn 595 600 605Glu Ile Gly
Ser Ser Asp Glu Asn Ile Gln Ala Glu Leu Gly Arg Asn 610 615 620Arg
Gly Pro Lys625
uspto.report is an independent third-party trademark research tool that is not affiliated, endorsed, or sponsored by the United States Patent and Trademark Office (USPTO) or any other governmental organization. The information provided by uspto.report is based on publicly available data at the time of writing and is intended for informational purposes only.
While we strive to provide accurate and up-to-date information, we do not guarantee the accuracy, completeness, reliability, or suitability of the information displayed on this site. The use of this site is at your own risk. Any reliance you place on such information is therefore strictly at your own risk.
All official trademark data, including owner information, should be verified by visiting the official USPTO website at www.uspto.gov. This site is not intended to replace professional legal advice and should not be used as a substitute for consulting with a legal professional who is knowledgeable about trademark law.