Methods For The Detection And Treatment Of Pancreatic Ductal Adenocarcinoma
HANASH; Samir ; et al.
U.S. patent application number 16/469065 was filed with the patent office on 2020-06-11 for methods for the detection and treatment of pancreatic ductal adenocarcinoma. The applicant listed for this patent is Board of Regents, The University of Texas System. Invention is credited to Michela CAPELLO, Ziding FENG, Samir HANASH, Ayumu TAGUCHI.
| Application Number | 20200182876 16/469065 |
| Document ID | / |
| Family ID | 62559366 |
| Filed Date | 2020-06-11 |


View All Diagrams
| United States Patent Application | 20200182876 |
| Kind Code | A1 |
| HANASH; Samir ; et al. | June 11, 2020 |
METHODS FOR THE DETECTION AND TREATMENT OF PANCREATIC DUCTAL ADENOCARCINOMA
Abstract
Provided are methods and related kits for detection of early stage pancreatic ductal adenocarcinoma. Also provided are methods for treating a patient susceptible, or suspected of being susceptible, to pancreatic ductal adenocarcinoma.
| Inventors: | HANASH; Samir; (Houston, TX) ; CAPELLO; Michela; (Austin, TX) ; TAGUCHI; Ayumu; (Houtson, TX) ; FENG; Ziding; (Houston, TX) | ||||||||||
| Applicant: |
|
||||||||||
|---|---|---|---|---|---|---|---|---|---|---|---|
| Family ID: | 62559366 | ||||||||||
| Appl. No.: | 16/469065 | ||||||||||
| Filed: | December 15, 2017 | ||||||||||
| PCT Filed: | December 15, 2017 | ||||||||||
| PCT NO: | PCT/US2017/066851 | ||||||||||
| 371 Date: | June 12, 2019 |
Related U.S. Patent Documents
| Application Number | Filing Date | Patent Number | ||
|---|---|---|---|---|
| 62435020 | Dec 15, 2016 | |||
| 62435024 | Dec 15, 2016 | |||
| Current U.S. Class: | 1/1 |
| Current CPC Class: | G01N 2333/8146 20130101; G01N 2400/00 20130101; G01N 2333/4716 20130101; H01J 49/0027 20130101; G01N 2333/705 20130101; G01N 2800/50 20130101; G01N 30/7233 20130101; G01N 33/57438 20130101; G01N 2405/04 20130101 |
| International Class: | G01N 33/574 20060101 G01N033/574; H01J 49/00 20060101 H01J049/00 |
Goverment Interests
STATEMENT REGARDING FEDERALLY SPONSORED RESEARCH OR DEVELOPMENT
[0002] This invention was made with government support under grant number CA124550, awarded by the National Institutes of Health. The government has certain rights in the invention.
Claims
1. A method of determining susceptibility to pancreatic ductal adenocarcinoma (PDAC) comprising, in a biological sample obtained from a patient: measuring the level of CA19-9 antigen in the biological sample; measuring the level of TIMP1 antigen in the biological sample; and/or measuring the level of LRG1 antigen in the biological sample; wherein the amount of CA19-9 antigen, TIMP1 antigen, and LRG1 antigen classifies the patient as being susceptible to pancreatic ductal adenocarcinoma or not susceptible to pancreatic ductal adenocarcinoma.
2-23. (canceled)
24. The method as recited in claim 1, wherein determination of CA19-9, LRG1, and TIMP1 levels is made at substantially the same time or in a stepwise manner; and/or wherein the method comprises inclusion of patient history information into the assignment of having pancreatic ductal adenocarcinoma or not having pancreatic ductal adenocarcinoma; and/or wherein the method comprises administering at least one alternate diagnostic test for a patient assigned as having pancreatic ductal adenocarcinoma.
25-27. (canceled)
28. The method as recited in claim 24, wherein the at least one alternate diagnostic test comprises an assay or sequencing of at least one ctDNA.
29-34. (canceled)
35. The method of claim 1, further comprising: measuring the level of (N1/N8)-acetylspermidine (AcSperm) in the biological sample; measuring the level of diacetylspermine (DAS) in the biological sample; measuring the level of lysophosphatidylcholine (LPC) (18:0) in the biological sample; measuring the level of lysophosphatidylcholine (LPC) (20:3) in the biological sample; and/or measuring the level of an indole-derivative in the biological sample; wherein the amount of (N1/N8)-acetylspermidine (AcSperm), diacetylspermine (DAS), lysophosphatidylcholine (LPC) (18:0), lysophosphatidylcholine (LPC) (20:3), and/or the indole-derivative classifies the patient as being susceptible to pancreatic ductal adenocarcinoma or not susceptible to pancreatic ductal adenocarcinoma.
36. A method of determining susceptibility to pancreatic ductal adenocarcinoma comprising, in a biological sample obtained from a patient: measuring the level of (N1/N8)-acetylspermidine (AcSperm) in the biological sample; measuring the level of diacetylspermine (DAS) in the biological sample; measuring the level of lysophosphatidylcholine (LPC) (18:0) in the biological sample; measuring the level of lysophosphatidylcholine (LPC) (20:3) in the biological sample; and/or measuring the level of an indole-derivative in the biological sample; wherein the amount of (N1/N8)-acetylspermidine (AcSperm), diacetylspermine (DAS), lysophosphatidylcholine (LPC) (18:0), lysophosphatidylcholine (LPC) (20:3), and/or the indole-derivative classifies the patient as being susceptible to pancreatic ductal adenocarcinoma or not susceptible to pancreatic ductal adenocarcinoma.
37. A method of determining susceptibility to pancreatic ductal adenocarcinoma in a biological sample obtained from a patient, comprising assaying a plasma-derived biomarker panel and a protein marker panel: wherein the plasma-derived biomarker panel comprises (N1/N8)-acetylspermidine (AcSperm), diacetylspermine (DAS), lysophosphatidylcholine (LPC) (18:0), lysophosphatidylcholine (LPC) (20:3), and/or an indole-derivative; wherein the protein biomarker panel comprises CA19-9, LRG1, and/or TIMP1; wherein the method comprises: measuring the levels of the plasma-derived biomarkers and the protein biomarkers in the biological sample; wherein the amount of the plasma-derived biomarkers and the protein biomarkers classifies the patient as being susceptible to pancreatic ductal adenocarcinoma or not susceptible to pancreatic ductal adenocarcinoma.
38. The method of claim 37, further comprising: contacting the sample with a first reporter molecule that binds CA19-9 antigen; contacting the sample with a second reporter molecule that binds TIMP1 antigen; and/or contacting the sample with a third reporter molecule that binds LRG1 antigen; and determining the levels of the one or more biomarkers, wherein the one or more biomarkers is selected from the group consisting of (N1/N8)-acetylspermidine (AcSperm), diacetylspermine (DAS), lysophosphatidylcholine (LPC) (18:0), lysophosphatidylcholine (LPC) (20:3), and/or an indole-derivative; wherein the amount of the first reporter molecule, the second reporter molecule, the third reporter molecule, and/or the one or more biomarkers classifies the patient as being susceptible to pancreatic ductal adenocarcinoma or not susceptible to pancreatic ductal adenocarcinoma.
39. (canceled)
40. A method of treating a patient suspected of susceptibility to pancreatic ductal adenocarcinoma, comprising: analyzing the patient for susceptibility to pancreatic ductal adenocarcinoma with a method as recited in any one of claims 36-38; administering a therapeutically effective amount of a treatment for the adenocarcinoma.
41. The method of treating as recited in claim 40, wherein the treatment is surgery, chemotherapy, radiation therapy, targeted therapy, or a combination thereof.
42. The method as recited in any one of claims 36-38, comprising assaying at least one receptor molecule that selectively binds to an antigen selected from the group consisting of CA19-9, TIMP1, and LRG1; or wherein detection of the amount of CA19-9, TIMP1, LRG, (N1/N8)-acetvlspermidine (AcSperm), diacetylspermine (DAS), lysophosphatidylcholine (LPC) (18:0), lysophosphatidylcholine (LPC) (20:3), and/or the indole-derivative comprises the use of a solid particle; or wherein at least one of the reporter molecules is linked to an enzyme; or wherein at least one of the protein or metabolite markers generates a detectable signal; or wherein the method comprises inclusion of patient history information into the assignment of having pancreatic ductal adenocarcinoma or not having pancreatic ductal adenocarcinoma; and/or wherein the method comprises at least one alternate diagnostic test for a patient assigned as having pancreatic ductal adenocarcinoma.
43. (canceled)
44. The method as recited in claim 42, wherein the solid particle is a bead; or wherein the detectable signal is detectable by a spectrometric method; or wherein the at least one alternate diagnostic test comprises an assay or sequencing of at least one ctDNA.
45-47. (canceled)
48. The method as recited in claim 44, wherein the spectrometric method is mass spectrometry.
49-57. (canceled)
58. A method of treatment or prevention of progression of pancreatic ductal adenocarcinoma (PDAC) in a patient in whom the levels of CA19-9 antigen, TIMP1 antigen, and/or LRG1 antigen classifies the patient as having or being susceptible to PDAC comprising one or more of: i. administering a chemotherapeutic drug to the patient with PDAC; ii. administering therapeutic radiation to the patient with PDAC; and/or iii. surgery for partial or complete surgical removal of cancerous tissue in the patient with PDAC.
59. The method as recited in claim 58 wherein the levels of CA19-9 antigen, TIMP1 antigen, and/or LRG1 antigen are elevated relative to a reference patient or group that does not have PDAC.
60-61. (canceled)
62. The method as recited in claim 58 wherein the AUC (95% CI) is at least 0.850, or wherein the AUC (95% CI) is at least 0.900.
63-64. (canceled)
65. The method as recited in claim 58 wherein the levels of CA19-9 antigen, TIMP1 antigen, and/or LRG1 antigen are elevated in comparison to the levels of CA19-9 antigen, TIMP1 antigen, and/or LRG1 antigen in a reference patient or group that has chronic pancreatitis or benign pancreatic disease.
66-69. (canceled)
70. The method as recited in claim 58 wherein the PDAC is diagnosed at or before the borderline resectable stage or at the resectable stage.
71-72. (canceled)
73. The method as recited in claim 58 wherein the levels of CA19-9 antigen, TIMP1 antigen, and/or LRG1 antigen are elevated in comparison to the levels of CA19-9 antigen, TIMP1 antigen, and/or LRG1 antigen in a reference patient or group that does not have PDAC, or in comparison to the levels of CA19-9 antigen, TIMP1 antigen, and/or LRG1 antigen in a reference patient or group that has chronic pancreatitis, or in comparison to the levels of CA19-9 antigen, TIMP1 antigen, and/or LRG1 antigen in a reference patient or group that has benign pancreatic disease.
74-77. (canceled)
78. The method as recited in claim 58 wherein the patient is at high-risk of PDAC.
79. The method as recited in claim 58, wherein the patient is over age 50 years with new-onset diabetes mellitus, has chronic pancreatitis, has been incidentally diagnosed with mucin-secreting cysts of the pancreas, or is asymptomatic kindred of one of these high-risk groups.
80-81. (canceled)
Description
CROSS REFERENCE TO RELATED APPLICATIONS
[0001] This application claims the benefit of U.S. Provisional Application No. 62/435,024, and U.S. Provisional Application No. 62/435,020, both of which were filed Dec. 15, 2016, the disclosure of which is hereby incorporated by reference in its entirety.
BACKGROUND
[0003] Pancreatic ductal adenocarcinoma (PDAC) is one of the most lethal types of cancer with a 5-year survival rate of only 8% and a mortality rate closely approaching the incidence rate. Although resectable PDAC is associated with better survival, only 15-20% of PDAC patients present with localized disease. Imaging modalities, notably endoscopic ultrasound and magnetic resonance cholangiopancreatography, are currently used in the work up of subjects with suspected PDAC or at high risk for the disease. However, known risk factors have only a modest effect on PDAC incidence.
[0004] Cancer Antigen 19-9 (CA19-9) is currently in clinical use as a PDAC biomarker. CA19-9 has shown potential as a diagnostic biomarker for both preclinical and early-stage PDAC (Riker et al., Surgical Oncology 6:157-69, 1998). However, CA19-9 alone has limited performance as a biomarker for early-stage disease: less than 75% of pancreatic cancer patients present with elevated CA19-9, and many benign disorders can lead to elevated CA19-9 levels. Moreover, CA19-9 is not detectable in 5-10% of patients with fucosyltransferase deficiency and inability to synthesize antigens of the Lewis blood group. As such, the proportions of individuals incorrectly identified as having PDAC, as well as those incorrectly identified as not having PDAC, is unacceptably high for reliance on CA19-9 alone as a diagnostic tool.
[0005] Due to late diagnosis, growing incidence, and limited avenues of treatment, PDAC is set to become a leading cause of cancer-related death. Given the disease is generally diagnosed in an advanced stage in most patients, and use of CA19-9 as a standalone biomarker is clearly inadequate, there is a need to develop a test for the detection of pancreatic cancer at an early stage.
SUMMARY
[0006] The present disclosure provides methods and kits for the early detection of pancreatic cancer. The methods and kits use multiple assays of biomarkers contained within a biological sample obtained from a subject. The combined analysis of at least three biomarkers: carbohydrate antigen 19-9 (CA19-9), TIMP metallopeptidase inhibitor 1 (TIMP1), and leucine-rich alpha-2-glycoprotein 1 (LRG1), provides high-accuracy diagnosis of PDAC when screened against cohorts with known status.
[0007] In some embodiments, the analysis of biomarkers CA19-9, TIMP1, and LRG1, can be combined with analysis of additional biomarkers. In some embodiments, the additional biomarkers can be protein biomarkers. In some embodiments, the additional protein biomarkers can be selected from the group consisting of ALCAM, CHI3L1, COL18A1, IGFBP2, LCN2, LYZ, PARK7, REG3A, SLPI, THBS1, TNFRSF1A, WFDC2, and any combination thereof. In some embodiments, the additional biomarkers can be non-protein biomarkers. In some embodiments, the non-protein biomarkers can be circulating tumor DNA (ctDNA). In some embodiments, a method as described herein may further comprise: measuring the level of (N1/N8)-acetylspermidine (AcSperm) in the biological sample; measuring the level of diacetylspermine (DAS) in the biological sample; measuring the level of lysophosphatidylcholine (LPC) (18:0) in the biological sample; measuring the level of lysophosphatidylcholine (LPC) (20:3) in the biological sample; and measuring the level of an indole-derivative in the biological sample; wherein the amount of (N1/N8)-acetylspermidine (AcSperm), diacetylspermine (DAS), lysophosphatidylcholine (LPC) (18:0), lysophosphatidylcholine (LPC) (20:3), and the indole-derivative classifies the patient as being susceptible to pancreatic ductal adenocarcinoma or not susceptible to pancreatic ductal adenocarcinoma.
[0008] A regression model was identified that can predict the PDAC status for a subject based on levels of CA19-9, TIMP1, and LRG1 found in a biological sample from the subject.
[0009] In some embodiments, biomarkers are measured in blood samples drawn from patients. In some embodiments, the presence or absence of biomarkers in a biological sample can be determined. In some embodiments, the level of biomarkers in a biological sample can be quantified.
[0010] In some embodiments, a surface is provided to analyze a biological sample. In some embodiments, biomarkers of interest adsorb nonspecifically onto this surface. In some embodiments, receptors specific for biomarkers of interest are incorporated onto this surface.
[0011] In some embodiments, the surface is associated with a particle, for example, a bead. In some embodiments, the surface is contained in a multi-well plate to facilitate simultaneous measurements.
[0012] In some embodiments, multiple surfaces are provided for parallel assessment of biomarkers. In some embodiments, the multiple surfaces are provided on a single device, for example a 96-well plate. In some embodiments, the multiple surfaces enable simultaneous measurement of biomarkers. In some embodiments, a single biological sample can be applied sequentially to a plurality of surfaces. In some embodiments, a biological sample is divided for simultaneous application to a plurality of surfaces.
[0013] In some embodiments, the biomarker binds to a particular receptor molecule, and the presence or absence of the biomarker-receptor complex can be determined. In some embodiments, the amount of biomarker-receptor complex can be quantified. In some embodiments, the receptor molecule is linked to an enzyme to facilitate detection and quantification.
[0014] In some embodiments, the biomarker binds to a particular relay molecule, and the biomarker-relay molecule complex in turn binds to a receptor molecule. In some embodiments, the presence or absence of the biomarker-relay-receptor complex can be determined. In some embodiments, the amount of biomarker-relay-receptor complex can be quantified. In some embodiments, the receptor molecule is linked to an enzyme to facilitate detection and quantification. In some embodiments, the enzyme is horseradish peroxidase or alkaline phosphatase.
[0015] In some embodiments, a biological sample is analyzed sequentially for individual biomarkers. In some embodiments, a biological sample is divided into separate portions to allow for simultaneous analysis for multiple biomarkers. In some embodiments, a biological sample is analyzed in a single process for multiple biomarkers.
[0016] In some embodiments, the absence or presence of biomarker can be determined by visual inspection. In some embodiments, the quantity of biomarker can be determined by use of a spectroscopic technique. In some embodiments, the spectroscopic technique is mass spectrometry. In some embodiments, the spectroscopic technique is UV/V is spectrometry. In some embodiments, the spectroscopic technique is an excitation/emission technique such as fluorescence spectrometry.
[0017] In some embodiments, a kit is provided for analysis of a biological sample. In some embodiments, the kit can contain chemicals and reagents required to perform the analysis. In some embodiments, the kit contains a means for manipulating biological samples in order to minimize the required operator intervention.
[0018] In another aspect, the disclosure provides a method of determining susceptibility of a patient to pancreatic ductal adenocarcinoma, comprising obtaining a biological sample from the patient; measuring the level of (N1/N8)-acetylspermidine (AcSperm) in the biological sample; measuring the level of diacetylspermine (DAS) in the biological sample; measuring the level of lysophosphatidylcholine (LPC) (18:0) in the biological sample; measuring the level of lysophosphatidylcholine (LPC) (20:3) in the biological sample; and measuring the level of an indole-derivative in the biological sample; wherein the amount of (N1/N8)-acetylspermidine (AcSperm), diacetylspermine (DAS), lysophosphatidylcholine (LPC) (18:0), lysophosphatidylcholine (LPC) (20:3), and the indole-derivative classifies the patient as being susceptible to pancreatic ductal adenocarcinoma or not susceptible to pancreatic ductal adenocarcinoma.
[0019] In another aspect, the disclosure provides a method of determining susceptibility of a patient to pancreatic ductal adenocarcinoma, comprising a plasma-derived biomarker panel and a protein marker panel: wherein the plasma-derived biomarker panel comprises (N1/N8)-acetylspermidine (AcSperm), diacetylspermine (DAS), lysophosphatidylcholine (LPC) (18:0), lysophosphatidylcholine (LPC) (20:3), and an indole-derivative; wherein the protein biomarker panel comprises CA19-9, LRG1, and TIMP1; wherein the method comprises: obtaining a biological sample from the patient; measuring the levels of the plasma-derived biomarkers and the protein biomarkers in the biological sample; wherein the amount of the plasma-derived biomarkers and the protein biomarkers classifies the patient as being susceptible to pancreatic ductal adenocarcinoma or not susceptible to pancreatic ductal adenocarcinoma.
[0020] In another aspect, the disclosure provides a method of determining susceptibility of a patient to pancreatic ductal adenocarcinoma, comprising determining the levels of one or more protein biomarkers and one or more metabolite markers, said method comprising: obtaining a biological sample from the patient; contacting the sample with a first reporter molecule that binds CA19-9 antigen; contacting the sample with a second reporter molecule that binds TIMP1 antigen; contacting the sample with a third reporter molecule that binds LRG1 antigen; and determining the levels of the one or more biomarkers, wherein the one or more biomarkers is selected from the group consisting of (N1/N8)-acetylspermidine (AcSperm), diacetylspermine (DAS), lysophosphatidylcholine (LPC) (18:0), lysophosphatidylcholine (LPC) (20:3), and an indole-derivative; wherein the amount of the first reporter molecule, the second reporter molecule, the third reporter molecule, and the one or more biomarkers classifies the patient as being susceptible to pancreatic ductal adenocarcinoma or not susceptible to pancreatic ductal adenocarcinoma.
[0021] In another aspect, the disclosure provides a method of determining susceptibility of a patient to pancreatic ductal adenocarcinoma, comprising obtaining a biological sample from the patient; measuring the levels of CA19-9, TIMP1, and LRG1 antigens in the biological sample; and measuring the levels of one or more metabolite markers selected from the group consisting of (N1/N8)-acetylspermidine (AcSperm), diacetylspermine (DAS), lysophosphatidylcholine (LPC) (18:0), lysophosphatidylcholine (LPC) (20:3), and an indole-derivative in the biological sample; assigning the condition of the patient as either susceptible to pancreatic ductal adenocarcinoma or not susceptible to pancreatic ductal adenocarcinoma, as determined by statistical analysis of the levels of CA19-9 antigen, TIMP1 antigen, LRG1 antigen, (N1/N8)-acetylspermidine (AcSperm), diacetylspermine (DAS), lysophosphatidylcholine (LPC) (18:0), lysophosphatidylcholine (LPC) (20:3), and the indole-derivative in the biological sample.
[0022] In another aspect, the disclosure provides a method of treating a patient suspected of susceptibility to pancreatic ductal adenocarcinoma, comprising: analyzing the patient for susceptibility to pancreatic ductal adenocarcinoma with a method as recited in any one of claims 38-41; administering a therapeutically effective amount of a treatment for the adenocarcinoma. In one embodiment, the treatment is surgery, chemotherapy, radiation therapy, targeted therapy, or a combination thereof.
[0023] In one embodiment, a method as described herein comprises at least one receptor molecule that selectively binds to an antigen selected from the group consisting of CA19-9, TIMP1, and LRG1.
[0024] In one embodiment, detection of the amount of CA19-9, TIMP1, LRG, (N1/N8)-acetylspermidine (AcSperm), diacetylspermine (DAS), lysophosphatidylcholine (LPC) (18:0), lysophosphatidylcholine (LPC) (20:3), or the indole-derivative comprises the use of a solid particle. In another embodiment, the solid particle is a bead.
[0025] In one embodiment, at least one of the reporter molecules is linked to an enzyme.
[0026] In one embodiment, at least one of the protein or metabolite markers generates a detectable signal. In another embodiment, the detectable signal is detectable by a spectrometric method. In another embodiment, the spectrometric method is mass spectrometry.
[0027] In one embodiment, a method as described herein comprises inclusion of patient history information into the assignment of having pancreatic ductal adenocarcinoma or not having pancreatic ductal adenocarcinoma.
[0028] In one embodiment, a method as described herein comprises administering at least one alternate diagnostic test for a patient assigned as having pancreatic ductal adenocarcinoma. In another embodiment, the at least one alternate diagnostic test comprises an assay or sequencing of at least one ctDNA.
[0029] In another aspect, the disclosure provides a kit for a method as described herein, comprising: a reagent solution that comprises a first solute for detection of CA19-9 antigen; a second solute for detection of LRG1 antigen; a third solute for detection of TIMP1 antigen; a fourth solute for detection of (N1/N8)-acetylspermidine (AcSperm); a fifth solute for detection of diacetylspermine (DAS); a sixth solute for detection of lysophosphatidylcholine (LPC) (18:0); a seventh solute for detection of lysophosphatidylcholine (LPC) (20:3); and an eighth solute for detection of the indole-derivative.
[0030] In one embodiment, such a kit may comprise a first reagent solution that comprises a first solute for detection of CA19-9 antigen; a second reagent solution that comprises a second solute for detection of LRG1 antigen; a third reagent solution that comprises a third solute for detection of TIMP1 antigen; a fourth reagent solution that comprises a fourth solute for detection of (N1/N8)-acetylspermidine (AcSperm); a fifth reagent solution that comprises a fifth solute for detection of diacetylspermine (DAS); a sixth reagent solution that comprises a sixth solute for detection of lysophosphatidylcholine (LPC) (18:0); a seventh reagent solution that comprises a seventh solute for detection of lysophosphatidylcholine (LPC) (20:3); and an eighth reagent solution that comprises an eighth solute for detection of the indole-derivative.
[0031] In one embodiment, a kit as described herein may comprise a device for contacting the reagent solutions with a biological sample. In another embodiment, such a kit may comprise at least one surface with means for binding at least one antigen. In another embodiment, the at least one antigen is selected from the group consisting of CA19-9, LRG1, and TIMP1. In another embodiment, the at least one surface comprises a means for binding ctDNA.
[0032] In another aspect, the disclosure provides such a method as described herein wherein the method further comprises: measuring the level of (N1/N8)-acetylspermidine (AcSperm) in the biological sample; measuring the level of diacetylspermine (DAS) in the biological sample; measuring the level of lysophosphatidylcholine (LPC) (18:0) in the biological sample; measuring the level of lysophosphatidylcholine (LPC) (20:3) in the biological sample; and measuring the level of an indole-derivative in the biological sample; wherein the amount of (N1/N8)-acetylspermidine (AcSperm), diacetylspermine (DAS), lysophosphatidylcholine (LPC) (18:0), lysophosphatidylcholine (LPC) (20:3), and the indole-derivative classifies the patient as being susceptible to pancreatic ductal adenocarcinoma or not susceptible to pancreatic ductal adenocarcinoma.
[0033] In another aspect, the disclosure provides a method of determining susceptibility of a patient to pancreatic ductal adenocarcinoma, comprising obtaining a biological sample from the patient; measuring the level of (N1/N8)-acetylspermidine (AcSperm) in the biological sample; measuring the level of diacetylspermine (DAS) in the biological sample; measuring the level of lysophosphatidylcholine (LPC) (18:0) in the biological sample; measuring the level of lysophosphatidylcholine (LPC) (20:3) in the biological sample; and measuring the level of an indole-derivative in the biological sample; wherein the amount of (N1/N8)-acetylspermidine (AcSperm), diacetylspermine (DAS), lysophosphatidylcholine (LPC) (18:0), lysophosphatidylcholine (LPC) (20:3), and the indole-derivative classifies the patient as being susceptible to pancreatic ductal adenocarcinoma or not susceptible to pancreatic ductal adenocarcinoma.
[0034] In another aspect, the disclosure provides a method of determining susceptibility of a patient to pancreatic ductal adenocarcinoma, comprising a plasma-derived biomarker panel and a protein marker panel: wherein the plasma-derived biomarker panel comprises (N1/N8)-acetylspermidine (AcSperm), diacetylspermine (DAS), lysophosphatidylcholine (LPC) (18:0), lysophosphatidylcholine (LPC) (20:3), and an indole-derivative; wherein the protein biomarker panel comprises CA19-9, LRG1, and TIMP1; wherein the method comprises: obtaining a biological sample from the patient; measuring the levels of the plasma-derived biomarkers and the protein biomarkers in the biological sample; wherein the amount of the plasma-derived biomarkers and the protein biomarkers classifies the patient as being susceptible to pancreatic ductal adenocarcinoma or not susceptible to pancreatic ductal adenocarcinoma.
[0035] In another aspect, the disclosure provides a method of determining susceptibility of a patient to pancreatic ductal adenocarcinoma, comprising determining the levels of one or more protein biomarkers and one or more metabolite markers, said method comprising: obtaining a biological sample from the patient; contacting the sample with a first reporter molecule that binds CA19-9 antigen; contacting the sample with a second reporter molecule that binds TIMP1 antigen; contacting the sample with a third reporter molecule that binds LRG1 antigen; and determining the levels of the one or more biomarkers, wherein the one or more biomarkers is selected from the group consisting of (N1/N8)-acetylspermidine (AcSperm), diacetylspermine (DAS), lysophosphatidylcholine (LPC) (18:0), lysophosphatidylcholine (LPC) (20:3), and an indole-derivative; wherein the amount of the first reporter molecule, the second reporter molecule, the third reporter molecule, and the one or more biomarkers classifies the patient as being susceptible to pancreatic ductal adenocarcinoma or not susceptible to pancreatic ductal adenocarcinoma.
[0036] In another aspect, the disclosure provides a method of determining susceptibility of a patient to pancreatic ductal adenocarcinoma, comprising obtaining a biological sample from the patient; measuring the levels of CA19-9, TIMP1, and LRG1 antigens in the biological sample; and measuring the levels of one or more metabolite markers selected from the group consisting of (N1/N8)-acetylspermidine (AcSperm), diacetylspermine (DAS), lysophosphatidylcholine (LPC) (18:0), lysophosphatidylcholine (LPC) (20:3), and an indole-derivative in the biological sample; assigning the condition of the patient as either susceptible to pancreatic ductal adenocarcinoma or not susceptible to pancreatic ductal adenocarcinoma, as determined by statistical analysis of the levels of CA19-9 antigen, TIMP1 antigen, LRG1 antigen, (N1/N8)-acetylspermidine (AcSperm), diacetylspermine (DAS), lysophosphatidylcholine (LPC) (18:0), lysophosphatidylcholine (LPC) (20:3), and the indole-derivative in the biological sample.
[0037] In another aspect, the disclosure provides a method of treating a patient suspected of susceptibility to pancreatic ductal adenocarcinoma, comprising: analyzing the patient for susceptibility to pancreatic ductal adenocarcinoma with a method as recited in any one of claims 36-39; administering a therapeutically effective amount of a treatment for the adenocarcinoma. In one embodiment, the treatment is surgery, chemotherapy, radiation therapy, targeted therapy, or a combination thereof. In another embodiment, such a method comprises at least one receptor molecule that selectively binds to an antigen selected from the group consisting of CA19-9, TIMP1, and LRG1. In another embodiment, detection of the amount of CA19-9, TIMP1, LRG, (N1/N8)-acetylspermidine (AcSperm), diacetylspermine (DAS), lysophosphatidylcholine (LPC) (18:0), lysophosphatidylcholine (LPC) (20:3), or the indole-derivative comprises the use of a solid particle. In another embodiment, the solid particle is a bead. In another embodiment, at least one of the reporter molecules is linked to an enzyme. In another embodiment, at least one of the protein or metabolite markers generates a detectable signal. In another embodiment, the detectable signal is detectable by a spectrometric method. In another embodiment, the spectrometric method is mass spectrometry. In another embodiment, such a method comprises inclusion of patient history information into the assignment of having pancreatic ductal adenocarcinoma or not having pancreatic ductal adenocarcinoma. In another embodiment, such a method comprises administering at least one alternate diagnostic test for a patient assigned as having pancreatic ductal adenocarcinoma. In another embodiment, the at least one alternate diagnostic test comprises an assay or sequencing of at least one ctDNA.
[0038] In another aspect, the disclosure provides a kit for the method as recited in any one of claims 36-40, comprising: a reagent solution that comprises a first solute for detection of CA19-9 antigen; a second solute for detection of LRG1 antigen; a third solute for detection of TIMP1 antigen; a fourth solute for detection of (N1/N8)-acetylspermidine (AcSperm); a fifth solute for detection of diacetylspermine (DAS); a sixth solute for detection of lysophosphatidylcholine (LPC) (18:0); a seventh solute for detection of lysophosphatidylcholine (LPC) (20:3); and an eighth solute for detection of the indole-derivative. In another embodiment, a kit as disclosed herein comprises a first reagent solution that comprises a first solute for detection of CA19-9 antigen; a second reagent solution that comprises a second solute for detection of LRG1 antigen; a third reagent solution that comprises a third solute for detection of TIMP1 antigen; a fourth reagent solution that comprises a fourth solute for detection of (N1/N8)-acetylspermidine (AcSperm); a fifth reagent solution that comprises a fifth solute for detection of diacetylspermine (DAS); a sixth reagent solution that comprises a sixth solute for detection of lysophosphatidylcholine (LPC) (18:0); a seventh reagent solution that comprises a seventh solute for detection of lysophosphatidylcholine (LPC) (20:3); and an eighth reagent solution that comprises an eighth solute for detection of the indole-derivative. In one embodiment, such a kit comprises a device for contacting the reagent solutions with a biological sample. In another embodiment, such a kit comprises at least one surface with means for binding at least one antigen. In another embodiment, the at least one antigen is selected from the group consisting of CA19-9, LRG1, and TIMP1. In another embodiment, the at least one surface comprises a means for binding ctDNA.
[0039] In another aspect, the disclosure provides a method of treatment or prevention of progression of pancreatic ductal adenocarcinoma (PDAC) in a patient in whom the levels of CA19-9 antigen, TIMP1 antigen, and LRG1 antigen classifies the patient as having or being susceptible to PDAC comprising one or more of: administering a chemotherapeutic drug to the patient with PDAC; administering therapeutic radiation to the patient with PDAC; and surgery for partial or complete surgical removal of cancerous tissue in the patient with PDAC. In ne embodiment, the levels of CA19-9 antigen, TIMP1 antigen, and LRG1 antigen are elevated. In another embodiment, the levels of CA19-9 antigen, TIMP1 antigen, and LRG1 antigen are elevated in comparison to the levels of CA19-9 antigen, TIMP1 antigen, and LRG1 antigen in a reference patient or group that does not have PDAC. In another embodiment, the reference patient or group is healthy. In another embodiment, the AUC (95% CI) is at least 0.850. In another embodiment, the AUC (95% CI) is at least 0.900. In another embodiment, the classification of the patient as having PDAC has a sensitivity of 0.849 and 0.658 at 95% and 99% specificity, respectively. In another embodiment, the levels of CA19-9 antigen, TIMP1 antigen, and LRG1 antigen are elevated in comparison to the levels of CA19-9 antigen, TIMP1 antigen, and LRG1 antigen in a reference patient or group that has chronic pancreatitis. In another embodiment, the levels of CA19-9 antigen, TIMP1 antigen, and LRG1 antigen are elevated in comparison to the levels of CA19-9 antigen, TIMP1 antigen, and LRG1 antigen in a reference patient or group that has benign pancreatic disease. In another embodiment, the AUC (95% CI) is at least 0.850. In another embodiment, the AUC (95% CI) is at least 0.900. In another embodiment, the classification of the patient as having PDAC has a sensitivity of 0.849 and 0.658 at 95% and 99% specificity, respectively. In another embodiment, the PDAC is diagnosed at or before the borderline resectable stage. In another embodiment, the PDAC is diagnosed at the resectable stage.
[0040] In another aspect, the disclosure provides a method of treatment or prevention of progression of pancreatic ductal adenocarcinoma (PDAC) in a patient in whom the levels of CA19-9 antigen, TIMP1 antigen, LRG1, N1/N8)-acetylspermidine (AcSperm), diacetylspermine (DAS), lysophosphatidylcholine (LPC) (18:0), lysophosphatidylcholine (LPC) (20:3), and an indole-derivative classifies the patient as having or being susceptible to PDAC comprising one or more of: administering a chemotherapeutic drug to the patient with PDAC; administering therapeutic radiation to the patient with PDAC; and surgery for partial or complete surgical removal of cancerous tissue in the patient with PDAC. In another embodiment, the levels of CA19-9 antigen, TIMP1 antigen, and LRG1 antigen are elevated. In another embodiment, the levels of CA19-9 antigen, TIMP1 antigen, and LRG1 antigen are elevated in comparison to the levels of CA19-9 antigen, TIMP1 antigen, and LRG1 antigen in a reference patient or group that does not have PDAC. In another embodiment, the reference patient or group is healthy. In another embodiment, the levels of CA19-9 antigen, TIMP1 antigen, and LRG1 antigen are elevated in comparison to the levels of CA19-9 antigen, TIMP1 antigen, and LRG1 antigen in a reference patient or group that has chronic pancreatitis. In another embodiment, the levels of CA19-9 antigen, TIMP1 antigen, and LRG1 antigen are elevated in comparison to the levels of CA19-9 antigen, TIMP1 antigen, and LRG1 antigen in a reference patient or group that has benign pancreatic disease. In another embodiment, the patient is at high-risk of PDAC. In another embodiment, the patient is over age 50 years with new-onset diabetes mellitus, has chronic pancreatitis, has been incidentally diagnosed with mucin-secreting cysts of the pancreas, or is asymptomatic kindred of one of these high-risk groups.
[0041] In another aspect, the disclosure provides a method of treating a patient suspected of susceptibility to pancreatic ductal adenocarcinoma, comprising analyzing the patient for susceptibility to pancreatic ductal adenocarcinoma with a method as described herein; administering a therapeutically effective amount of a treatment for the adenocarcinoma. In another embodiment, the treatment is surgery, chemotherapy, radiation therapy, targeted therapy, or a combination thereof.
BRIEF DESCRIPTION OF THE DRAWINGS
[0042] FIG. 1 depicts a flow chart for discovery of the validated biomarker model.
[0043] FIG. 2A and FIG. 2B depict biomarker candidates with significantly higher levels in PDAC than healthy controls in the triage set. Performance of the biomarker candidates in the comparison of (FIG. 2A) PDAC (n=75) versus healthy controls (n=27) and (FIG. 2B) PDAC versus chronic pancreatitis patients (n=19) in the triage set. Bars indicate AUC (95% CI). *Indicates that the reverse ordering was used. AUC, area under the curve.
[0044] FIG. 3A and FIG. 3B depict performance of the biomarker panel based on TIMP1+LRG1+CA19-9 in the combined validation set. ROC analysis of the biomarker panel developed for (FIG. 3A) PDAC versus healthy control and (FIG. 3B) PDAC versus benign pancreatic disease ("OR" rule combination). Upper line shows the model, and lower line shows CA19-9. AUC, area under the curve.
[0045] FIG. 4 depicts a correlation analysis between the biomarker panel (TIMP1, LRG1, and CA19-9) based scores and tumor size values in validation set #2. The underlying linear regression model yields intercept and slope of 3.7329 and -0.2646, respectively (slope 95% CI=-0.745-0.216; Wald-based two-sided p-value=0.27). Tumor size refers to the larger of the two measurements assessed by CT/MRI/EUS.
[0046] FIG. 5 depicts performance of the biomarker model based on TIMP1+LRG1+CA19-9 in the test set. ROC analysis of the combination model with fixed coefficients, which was developed in combined validation sets, for PDAC versus healthy control. Upper line shows the model, and lower line shows CA19-9. AUC, area under the curve.
[0047] FIG. 6 depicts a schematic of study design and filtering strategy.
[0048] FIG. 7 depicts individual AUCs for detected lysophosphatidylcholines, sphingomyelins and ceramides in the discovery cohort. Abbrev: LPC: lysophosphatidycholine; SM: sphingomyelins.
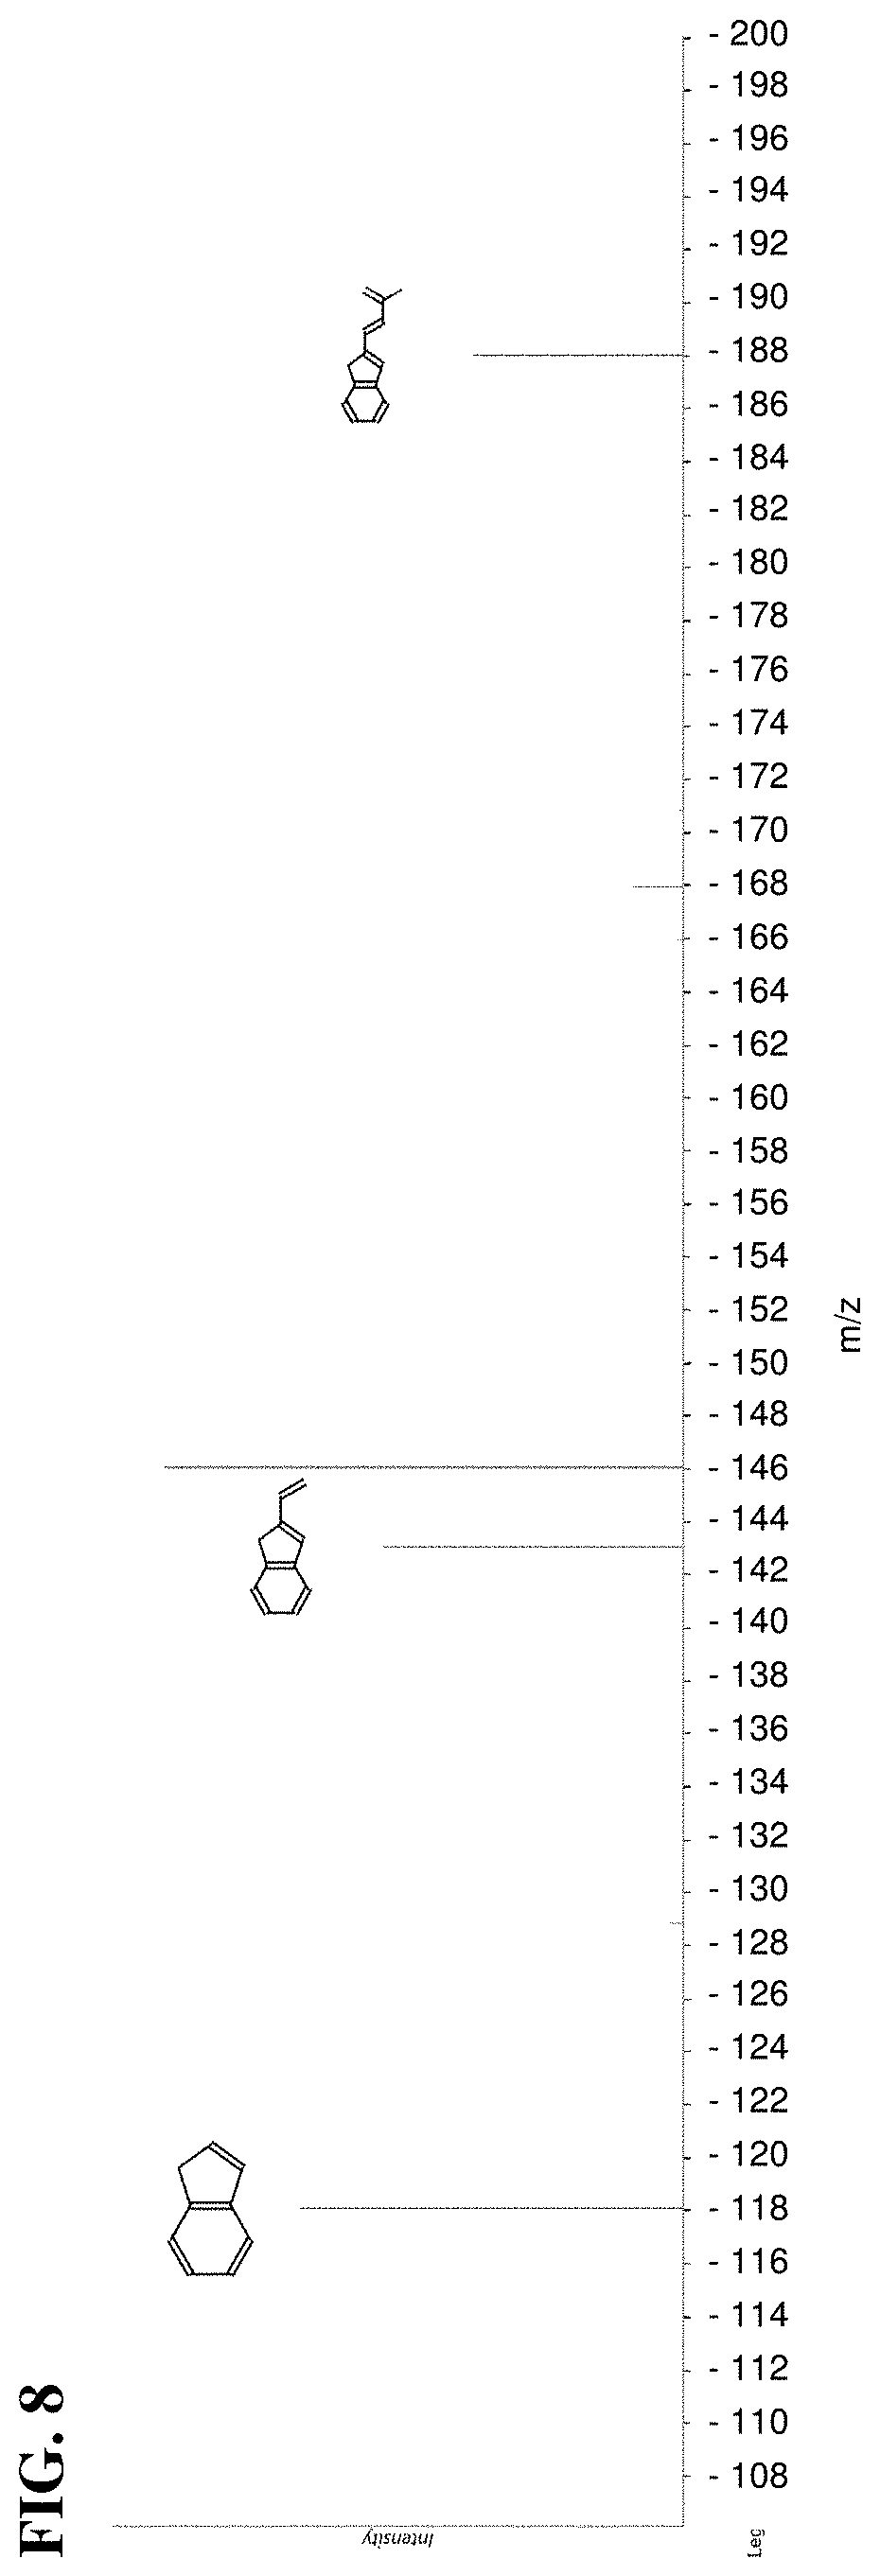
[0049] FIG. 8 depicts MSMS spectra for indole-derivative; matched fragments occur at about 118, about 148, and about 188 m/z.
[0050] FIG. 9A and FIG. 9B depict AUC curves of individual metabolites and 5-marker metabolite panel in the Training Sets. Performances are based on the combined discovery and `confirmatory` cohort. (FIG. 9A) Receiver operating characteristic (ROC) curves for individual metabolites and the 5-marker metabolite panel for distinguishing PDAC (n=29) from healthy subjects (n=10). (FIG. 9B) ROC curves for individual metabolites and the 5-marker metabolite panel comparing PDAC (n=29) relative to subjects diagnosed with benign pancreatic disease (chronic pancreatitis (n=10) and low-grade cysts (n=50)).
[0051] FIG. 10A and FIG. 10B depict validation of individual metabolites and the 5-marker metabolite panel in Test Sets. (FIG. 10A) Receiver operating characteristic (ROC) curves for individual metabolites and the 5-marker metabolite panel for distinguishing resectable PDAC (n=39) from healthy subjects (n=82) (Test Set #1). (FIG. 10B) ROC curves for individual metabolites and the 5-marker metabolite panel comparing resectable PDAC (n=20) relative to subjects diagnosed with benign pancreatic disease (low-grade cysts (n=102)) (Test Set #2).
[0052] FIG. 11A and FIG. 11B depict a hyper-panel consisting of a metabolite-panel and a protein-panel improves classification as compared to protein-panel alone. (FIG. 11A-B) ROC Curves for hyper-panel and protein-panel only in the Training Set (29 PDAC vs 10 healthy subjects) and independent validation cohort (Test Set #1; 39 PDAC vs 82 healthy subjects).
[0053] FIG. 12A-FIG. 12C depict pancreatic ductal adenocarcinomas catabolize extracellular lysophospholipids. (FIG. 12A) Percentage (%) change in serum-containing media composition of lysophosphatidylcholine (18:0), lysophosphatidylcholine (20:3), and glycerophosphocholine in PANC1 and SU8686 PDAC cell lines following 24, 48, and 72 hours of culturing. (FIG. 12B) Schematic illustrating enzymes involved in catabolism of phosphatidylcholines and lysophosphatidylcholines. (FIG. 12C) mRNA expression+/-SEM of PLA2G10, LYPLA1, and ENPP2 in PDAC and adjacent control tissue. Statistical significance was determined by paired t-test (p: **<0.01, ****<0.001). mRNA expression data was obtained from Oncomine and is based on the Badea dataset.
[0054] FIG. 13 depicts composition of lipid species in conditioned media. Heatmap depicting % change in composition of lipid species in 24, 48, and 72-hour conditioned serum-containing media from PDAC cell lines PANC-1 and SU8686 as compared to media blank. Abbrev: PC: phosphatidylcholine; PE: phosphatidylethanolamine; LPC: lysophosphatidycholine; LPE: lysophosphatidylethanolamine; Plas: Plasmalogen.
[0055] FIG. 14A-FIG. 14C depict pancreatic ductal adenocarcinomas exhibit elevated catabolism of polyamines. (FIG. 14A) Abundances (area units+/-stdev) of N1/N8-acetylspermidine or diacetylspermine in cell lysates of 5 PDAC cell lines (CFPAC-1, MiaPaCa, SU8686, PANC03-27, and SW1990). (FIG. 14B) Abundance (area units+/-stdev) of N1/N8-acetylspermidine or diacetylspermine in serum free media collected 1, 2, 4, and 6 hours post conditioning from 5 PDAC cell lines (CFPAC-1, MiaPaCa, SU8686, PANC03-27, and SW1990). (FIG. 14C) Network displaying enzymes involved in the biosynthesis of polyamines and their acetylated derivatives. Node shade (light gray=decreased; dark gray=increased) and size depicts direction and magnitude of change in mRNA expression of respective enzymes between PDAC and adjacent control tissue. Thickened node border illustrates statistical significance (paired t-test<0.05). Box and whisker plots illustrate distribution of mRNA expression for the respective enzyme between PDAC and adjacent control tissue. mRNA expression data was obtained from Oncomine and is based on the Badea dataset.
DETAILED DESCRIPTION
[0056] Provided are methods for identifying pancreatic cancer in a human subject, the methods generally comprising:
[0057] (a) applying a blood sample obtained from the subject to an assay for analysis of at least three biomarkers: CA19-9, TIMP1, and LRG1;
[0058] (b) quantifying the amount of the at least three biomarkers present in the blood sample; and
[0059] (c) applying statistical analysis based on the amount of biomarkers present to determine a biomarker score with respect to corresponding pancreatic cancer, thereby classifying a subject as either positive or negative for pancreatic cancer.
[0060] The methods herein enable screening of high-risk subjects, for example, those with a family history of pancreatic cancer, or patients with other risk factors such as chronic pancreatitis, obesity, heavy smoking, and possibly diabetes. The logistic regression model provided herein can incorporate these factors into a classification method.
[0061] For subjects that are classified as PDAC-positive, further methods can be provided to clarify PDAC status. Classification as PDAC-positive can be followed by methods including, but not limited to, computed tomography (CT), endoscopic ultrasound (EUS), or endoscopic retrograde cholangiopancreatography (ERCP).
[0062] Detection of CA19-9 can be accomplished by contact with the CA19-9 antigen, which is a carbohydrate structure called sialyl-Lewis A (part of the Lewis family of blood group antigens) with the sequence Neu5Ac.alpha.2,3Gal.beta.1,3(Fuc.alpha..alpha.1,4)GlcNAc. Sialyl-Lewis A is synthesized by glycosyltransferases that sequentially link the monosaccharide precursors onto both N-linked and O-linked glycans. It is attached to many different proteins, including mucins, carcinoembryonic antigen, and circulating apolipoproteins. In the standard CA19-9 clinical assay, a monoclonal antibody captures and detects the CA19-9 antigen in a sandwich ELISA format, which measures the CA19-9 antigen on many different carrier proteins (Partyka et al., Proteomics 12(13):2213-20, 2012).
[0063] Detection of TIMP1 (SEQ ID NO:1; UniProtKB: P01033) can be accomplished by contact with a reporter molecule that specifically binds to TIMP1.
TABLE-US-00001 SEQ ID NO: 1: 10 20 30 40 MAPFEPLASG ILLLLWLIAP SRACTCVPPH PQTAFCNSDL 50 60 70 80 VIRAKFVGTP EVNQTTLYQR YEIKMTKMYK GFQALGDAAD 90 100 110 120 IRFVYTPAME SVCGYFHRSH NRSEEFLIAG KLQDGLLHIT 130 140 150 160 TCSFVAPWNS LSLAQRRGFT KTYTVGCEEC TVFPCLSIPC 170 180 190 200 KLQSGTHCLW TDQLLQGSEK GFQSRHLACL PREPGLCTWQ
[0064] Detection of LRG1 (SEQ ID NO:2; UniProtKB: P02750) can be accomplished by contact with a reporter molecule that specifically binds to LRG1.
TABLE-US-00002 SEQ ID NO: 2: 10 20 30 40 MSSWSRQRPK SPGGIQPHVS RTLFLLLLLA ASAWGVTLSP 50 60 70 80 KDCQVFRSDH GSSISCQPPA EIPGYLPADT VHLAVEFFNL 90 100 110 120 THLPANLLQG ASKLQELHLS SNGLESLSPE FLRPVPQLRV 130 140 150 160 LDLTRNALTG LPPGLFQASA TLDTLVLKEN QLEVLEVSWL 170 180 190 200 HGLKALGHLD LSGNRLRKLP PGLLANFTLL RTLDLGENQL 210 220 230 240 ETLPPDLLRG PLQLERLHLE GNKLQVLGKD LLLPQPDLRY 250 260 270 280 LFLNGNKLAR VAAGAFQGLR QLDMLDLSNN SLASVPEGLW 290 300 310 320 ASLGQPNWDM RDGFDISGNP WICDQNLSDL YRWLQAQKDK 330 340 MFSQNDTRCA GPEAVKGQTL LAVAKSQ
[0065] A combination of at least the three biomarkers CA19-9, TIMP1, and LRG1 can afford a previously unseen, highly reliable PDAC predictive power. When applied to a blind test set composed of plasma samples from 39 resectable PDAC cases and 82 matched healthy controls, the methods described herein yielded an AUC (95% CI) of 0.887 (0.817-0.957) with a sensitivity of 0.667 at 95% specificity in discriminating early-stage PDAC versus healthy controls. The performance of the biomarker panel demonstrated high accuracy detection of early stage pancreatic cancer and a statistically-significant improvement as compared to CA19-9 alone (p=0.008, test set).
[0066] With regard to the detection of the biomarkers detailed herein, the disclosure is not limited to the specific biomolecules reported herein. In some embodiments, other biomolecules can be chosen for the detection and analysis of the disclosed biomarkers including, but not limited to, biomolecules based on proteins, antibodies, nucleic acids, aptamers, and synthetic organic compounds. Other molecules may demonstrate advantages in terms of sensitivity, efficiency, speed of assay, cost, safety, or ease of manufacture or storage. In this regard, those of ordinary skill in the art will appreciate that the predictive and diagnostic power of the biomarkers disclosed herein may extend to the analysis of not just the protein form of these biomarkers, but other representations of the biomarkers as well (e.g., nucleic acid). Further, those of ordinary skill in the art will appreciate that the predictive and diagnostic power of the biomarkers disclosed herein can also be used in combination with an analysis of other biomarkers associated with PDAC. In some embodiments, other biomarkers associated with PDAC can be protein-based biomarkers. In some embodiments, other biomarkers associated with PDAC can be non-protein-based biomarkers, such as, for instance, ctDNA.
[0067] TIMP1 and LRG1 complement CA19-9 performance in the validation studies that are disclosed herein. Increased gene expression and/or secretion of TIMP1 has been previously observed in PDAC and found to induce tumor cell proliferation. Although elevated circulating TIMP1 levels have been associated with PDAC, increased levels have also been found in other epithelial tumor types. A role for LRG1 has been suggested in promoting angiogenesis through activation of the TGF-.beta. pathway. Besides PDAC, increased LRG1 plasma levels have also been found in other cancer types.
[0068] The performance of the three marker panel demonstrated a statistically-significant improvement over CA19-9 alone in distinguishing early-stage PDAC from matched healthy subject or benign pancreatic disease controls. The three marker panel permits assessment of PDAC among subjects at increased risk, namely those with family history, cystic lesions, chronic pancreatitis or subjects who present with adult-onset type II diabetes, as opposed to screening of asymptomatic subjects of average risk.
[0069] Disclosed herein is the first proteomics-based study, performed using both human prediagnostic and mouse early-stage PDAC plasma samples, to conduct sequential validation of identified biomarker candidates in multiple independent sets of samples from resectable PDAC patients and matched controls.
[0070] In some embodiments, levels of CA19-9, TIMP1, and LRG1 in a biological sample are measured. In some embodiments, CA19-9, TIMP1, and LRG1 are contacted with reporter molecules, and the levels of respective reporter molecules are measured. In some embodiments, three reporter molecules are provided that specifically bind CA19-9, TIMP1, and LRG1, respectively. Use of reporter molecules can provide gains in convenience and sensitivity for the assay.
[0071] In some embodiments, CA19-9, TIMP1, and LRG1 are adsorbed onto a surface that is provided in a kit. In some embodiments, reporter molecules bind to surface-adsorbed CA19-9, TIMP1, and LRG1. Adsorption of biomarkers can be nonselective or selective. In some embodiments, the surface comprises a receptor functionality for increasing selectivity towards adsorption of one or more biomarkers.
[0072] In some embodiments, CA19-9, TIMP1, and LRG1 are adsorbed onto three surfaces that are selective for one or more of the biomarkers. A reporter molecule or multiple reporter molecules can then bind to surface-adsorbed biomarkers, and the level of reporter molecule(s) associated with a particular surface can allow facile quantification of the particular biomarker present on that surface.
[0073] In some embodiments, CA19-9, TIMP1, and LRG1 are adsorbed onto a surface provided in a kit; relay molecules specific for one or more of these biomarkers can bind to surface-adsorbed biomarkers; and receptor molecules specific for one or more relay molecules can bind to relay molecules. Relay molecules can provide specificity for certain biomarkers, and receptor molecules can enable detection.
[0074] In some embodiments, three relay molecules are provided that specifically bind CA19-9, TIMP1, and LRG1, respectively. Relay molecules can be designed for specificity towards a biomarker, or can be selected from a pool of candidates due to their binding properties. Relay molecules can be antibodies generated to bind the biomarkers.
[0075] In some embodiments, CA19-9, TIMP1, and LRG1 are adsorbed onto three discrete surfaces provided in a kit; relay molecules specific for one or more of these biomarkers can bind to surface-adsorbed biomarkers; and receptor molecules can bind to relay molecules. Analysis of the surfaces can be accomplished in a stepwise or concurrent fashion.
[0076] In some embodiments, the reporter molecule is linked to an enzyme, facilitating quantification of the reporter molecule. In some embodiments, quantification can be achieved by catalytic production of a substance with desirable spectroscopic properties.
[0077] In some embodiments, the amount of biomarker is determined using spectroscopy. In some embodiments, the spectroscopy is UV/visible spectroscopy. In some embodiments, the amount of biomarker is determined using mass spectrometry.
[0078] The quantity of biomarker(s) found in a particular assay can be directly reported to an operator, or alternately it can be stored digitally and readily made available for mathematical processing. A system can be provided for performing mathematical analysis, and can further report classification as PDAC-positive or PDAC-negative to an operator.
[0079] In some embodiments, additional assays known to those of ordinary skill in the art can function within the scope of the present disclosure. Examples of other assays include, but are not limited to, assays utilizing mass-spectrometry, immunoaffinity LC-MS/MS, surface plasmon resonance, chromatography, electrochemistry, acoustic waves, immunohistochemistry, and array technologies.
[0080] Also provided herein are methods of treatment for subjects who are classified as PDAC-positive. Treatment for PDAC-positive patients can include, but is not limited to, surgery, chemotherapy, radiation therapy, targeted therapy, or a combination thereof.
[0081] The foregoing has outlined rather broadly the features and technical benefits of the disclosure in order that the detailed description may be better understood. It should be appreciated by those skilled in the art that the specific embodiments disclosed may be readily utilized as a basis for modifying or designing other structures or processes for carrying out the same purposes of the disclosure. It is to be understood that the present disclosure is not limited to the particular embodiments described, as variations of the particular embodiments may be made and still fall within the scope of the appended claims.
Definitions
[0082] As used herein, the term "pancreatic cancer" means a malignant neoplasm of the pancreas characterized by the abnormal proliferation of cells, the growth of which cells exceeds and is uncoordinated with that of the normal tissues around it.
[0083] As used herein, the term "PDAC" refers to pancreatic ductal adenocarcinoma, which is pancreatic cancer that can originate in the ducts of the pancreas.
[0084] As used herein, the term "PDAC-positive" refers to classification of a subject as having PDAC.
[0085] As used herein, the term "PDAC-negative" refers to classification of a subject as not having PDAC.
[0086] As used herein, the term "pancreatitis" refers to an inflammation of the pancreas. Pancreatitis is not generally classified as a cancer, although it may advance to pancreatic cancer.
[0087] As used herein, the term "subject" or "patient" as used herein refers to a mammal, preferably a human, for whom a classification as PDAC-positive or PDAC-negative is desired, and for whom further treatment can be provided.
[0088] As used herein, a "reference patient" or "reference group" refers to a group of patients or subjects to which a test sample from a patient suspected of having or being susceptible to PDAC may be compared. In some embodiments, such a comparison may be used to determine whether the test subject has PDAC. A reference patient or group may serve as a control for testing or diagnostic purposes. As described herein, a reference patient or group may be a sample obtained from a single patient, or may represent a group of samples, such as a pooled group of samples.
[0089] As used herein, "healthy" refers to an individual having a healthy pancreas, or normal, non-compromised pancreatic function. A healthy patient or subject has no symptoms of PDAC or other pancreatic disease. In some embodiments, a healthy patient or subject may be used as a reference patient for comparison to diseased or suspected diseased samples for determination of PDAC in a patient or a group of patients.
[0090] The term "treatment" or "treating" as used herein refers to the administration of medicine or the performance of medical procedures with respect to a subject, for either prophylaxis (prevention) or to cure or reduce the extent of or likelihood of occurrence or recurrence of the infirmity or malady or condition or event in the instance where the subject or patient is afflicted. As related to the present disclosure, the term may also mean the administration of pharmacological substances or formulations, or the performance of non-pharmacological methods including, but not limited to, radiation therapy and surgery. Pharmacological substances as used herein may include, but are not limited to, chemotherapeutics that are established in the art, such as Gemcitabine (GEMZAR), 5-fluorouracil (5-FU), irinotecan (CAMPTOSAR), oxaliplatin (ELOXATIN), albumin-bound paclitaxel (ABRAXANE), capecitabine (XELODA), cisplatin, paclitaxel (TAXOL), docetaxel (TAXOTERE), and irinotecan liposome (ONIVYDE). Pharmacological substances may include substances used in immunotherapy, such as checkpoint inhibitors. Treatment may include a multiplicity of pharmacological substances, or a multiplicity of treatment methods, including, but not limited to, surgery and chemotherapy.
[0091] As used herein, the term "ELISA" refers to enzyme-linked immunosorbent assay. This assay generally involves contacting a fluorescently tagged sample of proteins with antibodies having specific affinity for those proteins. Detection of these proteins can be accomplished with a variety of means, including but not limited to laser fluorimetry.
[0092] As used herein, the term "regression" refers to a statistical method that can assign a predictive value for an underlying characteristic of a sample based on an observable trait (or set of observable traits) of said sample. In some embodiments, the characteristic is not directly observable. For example, the regression methods used herein can link a qualitative or quantitative outcome of a particular biomarker test, or set of biomarker tests, on a certain subject, to a probability that said subject is for PDAC-positive.
[0093] As used herein, the term "logistic regression" refers to a regression method in which the assignment of a prediction from the model can have one of several allowed discrete values. For example, the logistic regression models used herein can assign a prediction, for a certain subject, of either PDAC-positive or PDAC-negative.
[0094] As used herein, the term "biomarker score" refers to a numerical score for a particular subject that is calculated by inputting the particular biomarker levels for said subject to a statistical method.
[0095] As used herein, the term "cutoff point" refers to a mathematical value associated with a specific statistical method that can be used to assign a classification of PDAC-positive of PDAC-negative to a subject, based on said subject's biomarker score.
[0096] As used herein, the term "classification" refers to the assignment of a subject as either PDAC-positive or PDAC-negative, based on the result of the biomarker score that is obtained for said subject.
[0097] As used herein, the term "PDAC-positive" refers to an indication that a subject is predicted as susceptible to PDAC, based on the results of the outcome of the methods of the disclosure.
[0098] As used herein, the term "PDAC-negative" refers to an indication that a subject is predicted as not susceptible to PDAC, based on the results of the outcome of the methods of the disclosure.
[0099] As used herein, the term "Wilcoxon rank sum test," also known as the Mann-Whitney U test, Mann-Whitney-Wilcoxon test, or Wilcoxon-Mann-Whitney test, refers to a specific statistical method used for comparison of two populations. For example, the test can be used herein to link an observable trait, in particular a biomarker level, to the absence or presence of PDAC in subjects of a certain population.
[0100] As used herein, the term "true positive rate" refers to the probability that a given subject classified as positive by a certain method is truly positive.
[0101] As used herein, the term "false positive rate" refers to the probability that a given subject classified as positive by a certain method is truly negative.
[0102] As used herein, the term "ROC" refers to receiver operating characteristic, which is a graphical plot used herein to gauge the performance of a certain diagnostic method at various cutoff points. A ROC plot can be constructed from the fraction of true positives and false positives at various cutoff points.
[0103] As used herein, the term "AUC" refers to the area under the curve of the ROC plot. AUC can be used to estimate the predictive power of a certain diagnostic test. Generally, a larger AUC corresponds to increasing predictive power, with decreasing frequency of prediction errors. Possible values of AUC range from 0.5 to 1.0, with the latter value being characteristic of an error-free prediction method.
[0104] As used herein, the term "p-value" or "p" refers to the probability that the distributions of biomarker scores for positive-PDAC and non-positive-PDAC subjects are identical in the context of a Wilcoxon rank sum test. Generally, a p-value close to zero indicates that a particular statistical method will have high predictive power in classifying a subject.
[0105] As used herein, the term "CI" refers to a confidence interval, i.e., an interval in which a certain value can be predicted to lie with a certain level of confidence. As used herein, the term "95% CI" refers to an interval in which a certain value can be predicted to lie with a 95% level of confidence.
[0106] As used herein, the term "sensitivity" refers to, in the context of various biochemical assays, the ability of an assay to correctly identify those with a disease (i.e., the true positive rate). By comparison, as used herein, the term "specificity" refers to, in the context of various biochemical assays, the ability of an assay to correctly identify those without the disease (i.e., the true negative rate). Sensitivity and specificity are statistical measures of the performance of a binary classification test (i.e., classification function). Sensitivity quantifies the avoiding of false negatives, and specificity does the same for false positives.
[0107] As used herein, the term "ALCAM" refers to activated leukocyte cell adhesion molecule.
[0108] As used herein, the term "CHI3L1" refers to chitinase-3-like-1.
[0109] As used herein, the term "COL18A1" refers to collagen type XVIII alpha 1.
[0110] As used herein, the term "IGBFP2" refers to insulin-like growth factor binding protein 2.
[0111] As used herein, the term "LCN2" refers to lipocalin 2.
[0112] As used herein, the term "LRG1" refers to leucine-rich alpha-2-glycoprotein 1.
[0113] As used herein, the term "LYZ" refers to lysozyme 2.
[0114] As used herein, the term "PARK7," refers to protein deglycase DJ-1.
[0115] As used herein, the term "REG3A" refers to regenerating family member 3 alpha.
[0116] As used herein, the term "SLPI" refers to secretory leukocyte protease inhibitor, also known in the art as antileukoproteinase.
[0117] As used herein, the term "pro-CTSS" refers to pro-cathepsin S.
[0118] As used herein, the term "total-CTSS" refers to total cathepsin S.
[0119] As used herein, the term "THBS1" refers to thrombospondin 1.
[0120] As used herein, the term "TIMP1" refers to TIMP metallopeptidase inhibitor 1, also known in the art as metalloproteinase inhibitor 1.
[0121] As used herein, the term "TNFRSF1A" refers to tumor necrosis factor receptor superfamily member 1A.
[0122] As used herein, the term "WFDC2" refers to WAP four-disulfide core domain 2.
[0123] As used herein, the term "CA19-9" refers to carbohydrate antigen 19-9, and is also known in the art as cancer antigen 19-9 and sialylated Lewis.sup.a antigen.
[0124] As used herein, the term "ctDNA" refers to cell-free or circulating tumor DNA. ctDNA is tumor DNA found circulating freely in the blood of a cancer patient. Without being limited by theory, ctDNA is thought to originate from dying tumor cells and can be present in a wide range of cancers but at varying levels and mutant allele fractions. Generally, ctDNA carry unique somatic mutations formed in the originating tumor cell and not found in the host's healthy cells. As such, the ctDNA somatic mutations can act as cancer-specific biomarkers.
[0125] As used herein, a "metabolite" refers to small molecules that are intermediates and/or products of cellular metabolism. Metabolites may perform a variety of functions in a cell, for example, structural, signaling, stimulatory and/or inhibitory effects on enzymes. In some embodiments, a metabolite may be a non-protein, plasma-derived metabolite marker, such as including, but not limited to, acetylspermidine, diacetylspermine, lysophosphatidylcholine (18:0), lysophosphatidylcholine (20:3) and an indole-derivative.
[0126] As used herein, an "indole-derivative" refers to compounds that are derived from indole. Indole is an aromatic heterocyclic organic compound with formula C.sub.8H.sub.7N. It has a bicyclic structure, consisting of a six-membered benzene ring fused to a five-membered nitrogen-containing pyrrole ring. An indole-derivative as described herein may be any derivative of indole. Representative examples include, but are not limited to, tryptophan, indole-3-ethanol, 10,11-Methylenedioxy-20(S)-CPT, 9-Methyl-20(S)-CPT, 9-Amino-10,11-methylenedioxy-20(S)-CPT, 9-Chloro-10,11-methylenedioxy-20(S)-CPT, 9-Chloro-20(S)-CPT, 10-Hydroxy-20(S)-CPT, 9-Amino-20(S)-CPT, 10-Amino-20(S)-CPT, 10-Chloro-20(S)-CPT, 10-Nitro-20(S)-CPT, 20(S)-CPT, 9-hydroxy-20(S)-CPT, (SR)-Indoline-2-carboxylic acid, IAA, IAA-L-Ile, IAA-L-Leu, IBA, ICA-OEt, ICA, Indole-3-acrylic acid, Indole-3-carboxylic acid methyl ester, Indole-3-carboxylic acid, Indole-4-carboxylic acid methyl ester, Boc-L-Igl-OH.
Diagnosis, Staging, and Treatment of Pancreatic Cancer.
[0127] The most common way to classify pancreatic cancer is to divide it into 4 categories based on whether it can be removed with surgery and where it has spread: resectable, borderline resectable, locally advanced, or metastatic. Resectable pancreatic cancer can be surgically removed. The tumor may be located only in the pancreas or extends beyond it, but it has not grown into important arteries or veins in the area. There is no evidence that the tumor has spread to areas outside of the pancreas. Using standard methods common in the medical industry today, only about 10% to 15% of patients are diagnosed with this stage. Borderline resectable describes a tumor that may be difficult, or not possible, to remove surgically when it is first diagnosed, but if chemotherapy and/or radiation therapy is able to shrink the tumor first, it may be able to be removed later with negative margins. A negative margin means that no visible cancer cells are left behind. Locally advanced pancreatic cancer is still located only in the area around the pancreas, but it cannot be surgically removed because it has grown into nearby arteries or veins or to nearby organs. However, there are no signs that it has spread to any distant parts of the body. Using standard methods common in the medical industry today, approximately 35% to 40% of patients are diagnosed with this stage. Metastatic means the cancer has spread beyond the area of the pancreas and to other organs, such as the liver or distant areas of the abdomen. Using standard methods common in the medical industry today, approximately 45% to 55% of patients are diagnosed with this stage. Alternatively, the TNM Staging System, commonly used for other cancers, may be used (but is not common in pancreatic cancer). This system is based on tumor size (T), spread to lymph nodes (N), and metastasis (M).
[0128] Options for treatment of pancreatic cancer include surgery for partial or complete surgical removal of cancerous tissue (for example a Whipple procedure, distal pancreatectomy, or total pancreatectomy), administering one or more chemotherapeutic drugs, and administering therapeutic radiation to the affected tissue (e.g., conventional/standard fraction radiation therapy stereotactic body radiation (SBRT)). Chemotherapeutic drugs approved for treatment of pancreatic cancer include, but are not limited to, capecitabine (Xeloda), erlotinib (Tarceva), fluorouracil (5-FU), gemcitabine (Gemzar), irinotecan (Camptosar), leucovorin (Wellcovorin), nab-paclitaxel (Abraxane), nanoliposomal irinotecan (Onivyde), and oxaliplatin (Eloxatin).
[0129] Pancreatic cancer is treated most effectively when diagnosed early, preferably at or before the borderline resectable stage and more preferably at the resectable stage.
EXAMPLES
[0130] The following examples are included to demonstrate embodiments of the disclosure. The following examples are presented only by way of illustration and to assist one of ordinary skill in using the disclosure. The examples are not intended in any way to otherwise limit the scope of the disclosure. Those of ordinary skill in the art should, in light of the present disclosure, appreciate that many changes can be made in the specific embodiments which are disclosed and still obtain a like or similar result without departing from the spirit and scope of the disclosure.
Example 1: Mass Spectrometric Methods
[0131] Quantitative mass spectrometry (MS) analysis of human plasma samples was done as previously described (Faca et al., PLoS Med. 5(6):e123, 2008). One pool consisting of pancreatic cases whose blood was collected before onset of symptoms and diagnosis was labeled with heavy 1,2,3-.sup.13C-acrylamide isotope while a control pool was labeled with light acrylamide prior to mixing of the pools. Proteins were separated by an automated online 2D-HPLC system controlled by Workstation Class-VP 7.4 (Shimadzu Corporation). Separation consisted of anion exchange chromatography followed by reversed-phase chromatography. Each fraction was lyophilized, in-solution digested, and analyzed by MS using an LTQ-Orbitrap (Thermo) mass spectrometer coupled with a NanoLC-1D (Eksigent).
[0132] Acquired LC-MS/MS data were processed by the Computational Proteomics Analysis System (CPAS) pipeline (Rauch et al., J. Proteome Res. 5(1):112-21, 2006). X!Tandem, with the custom scoring-plugin Comet, was used as the search engine against the database of human International Protein Index (IPI) version 3.13. Search algorithm parameters were set for trypsin specificity and a maximum of two missed cleavages. Mass tolerance was 1.5 Da for precursor ions and 0.5 Da for fragment ions. Cysteine alkylation with [.sup.12C] acrylamide (+71.03657) was set as a fixed modification, and [.sup.13C] acrylamide (+3.01006) and oxidation of methionine (+15.99491) as variable modifications. Identified peptides were further validated through PeptideProphet (Keller et al., Anal. Chem. 74(20):5383-92, 2002) and proteins inferred via ProteinProphet (Nesvizhskii et al., Anal. Chem. 75(17):4646-58, 2003). Protein identifications were filtered with a 5% error rate based on the ProteinProphet evaluation. Protein quantitative information was extracted with a designated tool Q3 to quantify each pair of peptides containing cysteine residues identified by MS/MS (Faca et al., J. Proteome Res. 5(8):2009-18, 2006). Only peptides with a minimum of 0.75 PeptideProphet score, and maximum of 20 ppm fractional delta mass were selected for quantitation. Ratios of [.sup.13C] acrylamide-labeled to [.sup.12C] acrylamide-labeled peptides were plotted on a histogram (log 2 scale), and the median of the distribution was centered at zero. All normalized peptide ratios for a specific protein were averaged to compute an overall protein ratio.
[0133] The analysis resulted in the identification of 1,732 proteins using ProteinProphet scores of 0.8 or higher, with an error rate less than 5%. Results also included quantification of 395 proteins with at least two quantified peptides used for downstream analysis.
Example 2: ELISA Methods
[0134] For all ELISA experiments, each sample was assayed in duplicate, and the absorbance or chemiluminescence was measured with a SpectraMax M5 microplate reader (Molecular Devices). An internal control sample was run in every plate and each value of the samples was divided by the mean value of the internal control in the same plate to correct inter-plate variability.
NPC2
[0135] Murine monoclonal antibodies (#635 and #675) against recombinant NPC2 (aa 20-151; SEQ ID NO:3; UniProtKB: P61916) were generated and used in a sandwich ELISA.
TABLE-US-00003 SEQ ID NO: 3: 10 20 30 40 MRFLAATFLL LALSTAAQAE PVQFKDCGSV DGVIKEVNVS 50 60 70 80 PCPTQPCQLS KGQSYSVNVT FTSNIQSKSS KAVVHGILMG 90 100 110 120 VPVPFPIPEP DGCKSGINCP IQKDKTYSYL NKLPVKSEYP 130 140 150 SIKLVVEWQL QDDKNQSLFC WEIPVQIVSH L
[0136] Ninety-six well polystyrene plates (Corning, Canton, N.Y., USA) were coated with 1 .mu.g/mL of anti-NPC2 mouse monoclonal antibody (#635) as capture antibody, followed by blocking with Reagent Diluent (R&D Systems). Plasma samples were diluted 1:200 and serial dilution of recombinant protein was applied to develop a standard curve. Biotinylated anti-NPC2 murine monoclonal antibody (#675) at 1:4000 dilutions was used for detection. After washing, each well was incubated with Streptavidin-HRP followed by incubation of color reagents and stop solution (R&D Systems).
Example 3: Blood Sample Sets
[0137] Independent multiple blood sample cohorts were drawn from a pool consisting of PDAC cases (n=187), benign pancreatic disease (n=93), and healthy controls (n=169). All human blood samples were obtained following Institutional Review Board (University of Michigan Comprehensive Cancer Center, Evanston Hospital, University of Utah, University of Texas MD Anderson Cancer Center and International Agency for Research on Cancer) approval and informed consent.
Initial Discovery Set
[0138] For studies using in-depth quantitative MS, a pool of plasma was constituted from 6 pre-diagnostic PDAC cases (sex, male; median age, 66.5 years; range, 62-76 years) and 6 matched controls (sex, male; median age, 67.0 years, range: 61-76 years). These samples were collected from subjects that were subsequently diagnosed with stage IA (N=1), IB (N=2), and IIB (N=3) PDAC an average of 9.3 months (range, 8-12 months) after sample collection as part of the Carotene and Retinol Efficacy Trial and from 6 controls from the same cohort that were matched for age, sex, and smoking history and that were not diagnosed with cancer over a 4-year follow-up period.
Triage Set
[0139] Plasma samples obtained from the University of Michigan Comprehensive Cancer Center under the auspices of the Early Detection Research Network, consisting of 75 PDAC cases, 27 healthy controls, and 19 chronic pancreatitis cases, were used for initial validation and biomarker selection (triage set).
Validation Sets
[0140] An additional set of plasma samples from 73 patients with early-stage PDAC, 60 healthy controls, 60 patients with chronic pancreatitis, and 14 patients with benign pancreatic cysts, were used for biomarker sequential validation and panel development. All chronic pancreatitis samples were collected in an elective setting in the clinic in the absence of an acute flare-up.
[0141] Validation set #1, from Evanston Hospital, consisted of stages IB to IIB PDAC cases (n=10), healthy controls (n=10), and chronic pancreatitis cases (n=10); validation set #2, the University of Utah, consisted of early-stage (IA to IIA) PDAC cases (n=42), healthy controls (n=50), and chronic pancreatitis cases (n=50); and validation set #3, the University of Texas MD Anderson Cancer Center, consisted of resectable PDAC cases (n=21) and benign pancreatic cyst cases (n=14).
[0142] Demographics for the three validation sets are presented in Table 1.
Test Set
[0143] An additional independent plasma sample set for testing the combined biomarker panel was obtained from the International Agency for Research on Cancer, consisting of 39 early-stage PDAC and 82 healthy controls. Demographics for the test set are presented in Table 2.
TABLE-US-00004 TABLE 1 Subject demographics in the three validation sets. Validation set #1 Validation set #2 Validation set #3 Pancreatic Healthy Chronic Pancreatic Healthy Chronic Pancreatic Pancreatic cancer controls pancreatitis cancer controls pancreatitis cancer cyst Total (n) 10 10 10 42 50 50 21 14 Gender (n) Male 4 4 6 26 31 31 11 3 Female 6 6 4 16 19 19 10 11 Age (mean (SD)) 74.2 (8.6) 60.2 (10.4) 61.6 (13.3) 64.4 (12.0) 68.6 (8.3) 57.9 (14.2) 64.3 (6.4) 67.4 (18.0) Stage (n) IA -- -- -- 3 -- -- -- -- IB 2 -- -- 9 -- -- -- -- IIA 1 -- -- 30 -- -- -- -- IIB 7 -- -- -- -- -- -- -- Clinical Potentially Stage (n) Resectable -- -- -- -- -- -- 18 -- Borderline -- -- -- -- -- -- 3 -- Resectable Tumor dimension in -- -- -- 3.2 (1.9) -- -- -- -- cm (mean (SD))* *Tumor dimension was available only for validation set #2 and indicates the larger of the two measurements evaluated by computed tomography (CT)/magnetic resonance imaging (MRI)/endoscopic ultrasound (EUS).
TABLE-US-00005 TABLE 2 Subject characteristics in the test set. Pancreatic Healthy cancer controls Total (n) 39 82 Gender (n) Male 21 43 Female 18 39 Age (mean (SD)) 62.0 (11.0) 62.8 (10.0) Tobacco smoking Never 16 41 Ex-smoker 12 24 Current smoker 11 17 Alcohol drinking Never 23 41 Ex-drinker 9 8 Current drinker 7 32 Missing -- 1 Stage (n) IA 6 -- IB 10 -- Resectable 23 -- (No TNM data)
Example 4: Statistical Methods
[0144] Raw assay data were log 2-transformed, after imputation of the lowest detected value for each assay, to the values below limit of detection. A one-sided Wilcoxon rank sum test was used to compute p values comparing PDAC cases with healthy controls, chronic pancreatitis cases, and pancreatic cyst cases. The applied test was one-sided as aimed to test the null hypothesis of AUC=0.50 versus the alternative hypothesis AUC>0.50. Receiver operating characteristic (ROC) curve analysis was performed to assess the performance of biomarkers in distinguishing PDAC cases from healthy controls, chronic pancreatitis cases, and pancreatic cyst cases. Owing to the small sample size of each set, validation sets #1, #2, and #3 were merged for model development by standardizing the data such that the mean was 0 and standard deviation was 1 for healthy controls. Because validation set #3 did not include healthy controls, the results were standardized such that the benign pancreatic cyst samples had the same mean and standard deviation as chronic pancreatitis samples. Statistical analyses were performed using MATLAB R2014b and SAS version 9.3. p<0.05 was considered statistically significant in all the analyses.
[0145] All possible combinations of seven validated biomarker candidates were explored to select a logistic regression model to discriminate pancreatic cancer from healthy control, chronic pancreatitis and pancreatic cyst based on the Akaike information criterion (AIC). A total of 127 logistic regression models were fitted. Standard errors, confidence intervals, and p values were obtained by 1000 times bootstrap taking into account the variability of the coefficients. The p values for comparing the biomarker panel and CA19-9 alone were calculated by 1000 times bootstrap and refers to the null hypothesis of AUC(panel)=AUC(CA19-9) versus the alternative AUC(panel)>AUC(CA19-9). Likelihood ratio test was also applied to compare the goodness of fit of the biomarker panel to CA19-9 alone. The LeaveMOut cross-validation technique was applied to validate the obtained logistic regression models. Data were split into a training and a test set, which corresponded to 2/3 and 1/3 of the original data, respectively. The models were validated by 1000 repetitions of such a splitting scheme and averaging the obtained 1000 AUCs from the test sets. A modified design covariate matrix was applied to build a logistic regression model with OR rule able to discriminate pancreatic cancer from chronic pancreatitis and benign pancreatic cysts patients: [I(Ca19-9>=a) Ca19-9*I(Ca19-9>=a) I(Ca19-9<a) TIMP1*I(Ca19-9<a) LRG1*I(Ca19-9<a) CA19-9*I(Ca19-9<a)]. All possible values of the CA19-9 threshold "a" were scanned to attain the highest possible AUC by 1000 times bootstrap. The measurements that were not initially selected by the bootstrap were used to generate the predicted scores and evaluate the AUC. The procedure was repeated 1000 times and two-tailed p-values were calculated on the obtained 1000 AUCs. The highest AUC was obtained with "a"=1.6.
[0146] To avoid over-fitting in the development in the test set of a logistic regression model which included covariates (represented by recruiting center, gender, age, smoking status, and alcohol drinking) together with the three biomarkers TIMP1, LRG1, CA19-9 a two-step strategy was followed. First a covariate-based score was generated by fitting a logistic regression model which included covariates only, and then the covariate-based score was added to the three-biomarker logistic regression model as a single covariate.
Example 5: Selection of Biomarker Panel Candidates
[0147] The NPC2 assay, as described above, was utilized for this study. At least 17 additional biomarker panel candidates are listed in Table 3.
TABLE-US-00006 TABLE 3 Exemplary additional biomarker panel candidates. Marker Vendor Catalog # Plasma Dilution ALCAM R&D Systems DY656 1:500 CHI3L1 Quidel 8020 1:4 COL18A1 R&D Systems DY1098 1:300 IGFBP2 R&D Systems DY674 1:250 LCN2 BioPorto KIT 036 1:1500 LRG1 IBL-America 27769 1:1000 LYZ ALPCO K6900 1:250 PARK7 R&D Systems DY3995 1:50 REG3A DynaBio PancrePAP 1:100 SLPI R&D Systems DPI00 1:20 pro-CTSS R&D Systems DY2227 1:100 total-CTSS R&D Systems DY1183 1:50 THBS1 R&D Systems DY3074 1:1500 TIMP1 R&D Systems DY970-05 1:500 TNFRSF1A R&D Systems DY225-05 1:10 WFDC2 IBL-America 404-10US 1:10 CA19-9 Alpha Diagnostic 1840 1:5
Example 6: Discovery of Biomarker Panel Composition
Triage
[0148] A flow diagram for the study is presented in FIG. 1. Briefly, the pool of 18 biomarker candidates was trimmed by screening against the triage set. The levels of 12 biomarkers were higher to a statistically-significant degree in PDAC compared to healthy controls, each with an area under the curve (AUC)>0.60 and p<0.05 (Wilcoxon rank sum test) (FIG. 2A). The levels of seven of these biomarkers (IGFBP2, LRG1, CA19-9, REG3A, COL18A1, TIMP1, and TNFRSF1A) were also higher to a statistically-significant degree in PDAC cases compared to chronic pancreatitis cases (p<0.05, Wilcoxon rank sum test) with >0.60 of AUC (FIG. 2B). These 7 biomarker candidates were chosen as a triage panel for further evaluation against validation sets #1, #2 and #3.
Validation
[0149] The 7 biomarker candidates in the triage panel were then subjected to analysis with the three validation sets described above. AUC values for all 7 biomarkers selected in the triage set indicate that their plasma levels were consistently elevated in PDAC patients compared with matched controls in validation set #1, #2 and #3 (Tables 4, 5, and 6). The AUCs for these 7 markers, except for IGFBP2 in the comparison of PDAC versus chronic pancreatitis cases in validation set #2, were >0.60 in discriminating PDAC cases from healthy controls as well as chronic pancreatitis cases in both validation set #1 and #2. In addition, 4 biomarkers (CA19-9, TIMP1, LRG1, and IGFBP2) also yielded AUCs>0.60 in plasma samples from PDAC cases compared with benign pancreatic cyst cases in validation set #3 (Table 6).
TABLE-US-00007 TABLE 4 Performance of triage panel against validation set #1. Validation set #1 Pancreatic cancer vs. Healthy control Pancreatic cancer vs. Chronic pancreatitis Sensitivity Specificity Sensitivity Specificity at 95% at 95% at 95% at 95% Marker p AUC 95% CI specificity sensitivity p AUC 95% CI specificity sensitivity LRG1 <0.001 0.940 0.841-1.000 0.600 0.700 0.01 0.800 0.600-1.000 0.300 0.500 IGFBP2 0.001 0.890 0.722-1.000 0.600 0.200 0.03 0.750 0.525-0.975 0.400 0.200 REG3A 0.006 0.840 0.650-1.000 0.200 0.500 0.10 0.675 0.399-0.951 0.000 0.450 TIMP1 0.007 0.820 0.629-1.000 0.500 0.400 0.08 0.690 0.447-0.933 0.300 0.200 CA19-9 0.04 0.740 0.476-1.000 0.600 0.000 0.10 0.680 0.426-0.934 0.400 0.100 COL18A1 0.08 0.690 0.437-0.943 0.300 0.000 0.14 0.650 0.393-0.907 0.300 0.000 TNFRSF1A 0.09 0.685 0.430-0.940 0.200 0.000 0.09 0.685 0.428-0.942 0.100 0.000
TABLE-US-00008 TABLE 5 Performance of triage panel against validation set #2. Validation set #2 Pancreatic cancer vs. Healthy control Pancreatic cancer vs. Chronic pancreatitis Sensitivity Specificity Sensitivity Specificity at 95% at 95% at 95% at 95% Marker p AUC 95% CI specificity sensitivity p AUC 95% CI specificity sensitivity LRG1 <0.001 0.843 0.761-0.925 0.381 0.260 0.002 0.675 0.563-0.788 0.095 0.100 IGFBP2 <0.001 0.787 0.695-0.878 0.357 0.440 0.08 0.587 0.469-0.705 0.143 0.180 REG3A <0.001 0.854 0.773-0.934 0.476 0.342 <0.001 0.694 0.586-0.802 0.262 0.180 TIMP1 <0.001 0.886 0.821-0.952 0.381 0.560 <0.001 0.746 0.647-0.845 0.190 0.360 CA19-9 <0.001 0.885 0.808-0.962 0.690 0.210 <0.001 0.853 0.770-0.937 0.500 0.224 COL18A1 <0.001 0.812 0.723-0.901 0.333 0.260 0.001 0.686 0.575-0.796 0.071 0.140 TNFRSF1A <0.001 0.745 0.646-0.845 0.262 0.280 <0.001 0.698 0.591-0.805 0.119 0.240
TABLE-US-00009 TABLE 6 Performance of triage panel against validation set #3. Validation set #3 Pancreatic cancer vs. Cyst Sensitivity Specificity at 95% at 95% Marker p AUC 95% CI specificity sensitivity LRG1 0.09 0.639 0.445-0.834 0.048 0.214 IGFBP2 0.07 0.653 0.460-0.847 0.048 0.286 REG3A 0.18 0.594 0.399-0.788 0.190 0.071 TIMP1 0.002 0.798 0.637-0.958 0.095 0.432 CA19-9 <0.001 0.920 0.827-1.000 0.810 0.643 COL18A1 0.36 0.537 0.335-0.740 0.143 0.071 TNFRSF1A 0.33 0.548 0.346-0.749 0.000 0.071
Panel Construction
[0150] To develop a biomarker panel for early-stage PDAC, the results of validation sets #1, #2, and #3 were standardized and combined. In the combined validation set the levels of all 7 biomarkers were higher to a statistically-significant degree (AUC>0.60; p<0.05, Wilcoxon rank-sum test) in PDAC cases than in healthy controls and benign pancreatic disease cases (chronic pancreatitis and benign pancreatic cyst cases combined) (Table 7). Next, a biomarker panel for early-stage PDAC based on a logistic regression model was developed.
[0151] The resulting regression model can be:
log it(p)=-1.97+1.7005.times.log TIMP1+0.93856.times.log LRG1+0.60639.times.log CA19.9
where p denotes the probability of being a case in the given sample. This model is a regular logistic regression model that makes use of the log it link function. The binary disease status is playing the role of the response and the markers play the role of the covariates. The algorithm for fitting such regression models is a standard one and is based on an iterative re-weighted procedure which is described in detail in standard textbooks of generalized linear models (McCullogh et al., Generalized Linear and Mixed Models (2008); Wiley Series in Probability and Statistics, John Wiley & Sons, Inc., Hoboken, N.J.). However, even though this standard approach applies for model fitting it cannot provide inference for the underlying AUC. To provide p-values and confidence intervals that refer to the AUC, a bootstrap scheme was employed in which re-estimation of the coefficients was done within each bootstrap sample (1000 in total) in order to be able to take into account the variability of the estimated coefficients.
[0152] The LeaveMOut cross-validation technique was applied to validate the resulting logistic regression model. In the comparison of PDAC cases with healthy controls, the resulting panel consisted of TIMP1, LRG1, and CA19-9 yielding an AUC (95% CI) of 0.949 (0.917-0.981) and a cross-validation related average AUC of 0.936, which was greater to a statistically-significant degree than the AUC of CA19-9 alone (AUC (95% CI)=0.882 (0.809-0.956); p=0.003, bootstrap; p<0.001, likelihood ratio test; Table 8 and FIG. 3A). The panel yielded a sensitivity of 0.849 and 0.658 at 95% and 99% specificity, respectively, whereas sensitivity at 95% and 99% specificity for CA19-9 alone was 0.726 and 0.411, respectively. A significant improvement over CA19-9 alone in the comparison of PDAC cases with healthy controls was also observed when a model based on the same biomarker combination (TIMP1, LRG1, and CA19-9) was trained in validation set #2 and tested with fixed coefficients in validation set #1 (p=0.04, bootstrap in training set; p=0.02, bootstrap in test set; (Table 9). The results also indicate that in validation set #2, for which tumor size was available, the panel-based biomarker score was not correlated with statistical significance to tumor size. Without being limited by theory, this suggests the ability of the biomarker combination to detect tumors of small dimension (FIG. 4).
[0153] A logistic regression model based on the same biomarker combination (TIMP1, LRG1, and CA19-9) was developed to discriminate PDAC from benign pancreatic disease cases (AUC (95% CI)=0.846 (0.781-0.911) and a cross-validation related average AUC=0.830, Table 8). Whether an "OR" rule-based linear regression model, whereby either CA19-9 alone or the combination of all three markers, would enable discrimination between PDAC and benign pancreatic disease cases was also explored. The "OR" rule combination of TIMP1, LRG1, and CA19-9 yielded an AUC (95% CI) of 0.890 (0.802-0.978), which was greater to a statistically-significant degree than that of CA19-9 alone (AUC (95% CI)=0.831 (0.754-0.907); p<0.001 bootstrap; p<0.001, likelihood ratio test; Table 8 and FIG. 3B).
[0154] The regression model for discrimination of PDAC from benign pancreatic disease can be:
log it(p)=-1.2497+0.50306.times.log TIMP1+0.25355.times.log LRG1+0.51564.times.log CA19.9
where log refers to the logarithm with base 2. This was obtained by fitting a regular logistic regression model by employing the log it link function and using the binary disease status as the response and the markers as the covariates. The algorithm for fitting such regression models is a standard one and is based on an iterative re-weighted procedure which is described in detail in standard textbooks of generalized linear models (McCullogh et al., supra). An OR rule was further considered in which a tradeoff between the CA19-9 alone and the three marker panel was considered based on a decision value that was varied through a grid search. Namely a regular logistic regression model was considered for which the design matrix was contributing either only through the CA19-9 or through all three markers. Based on a fine grid of points of the threshold that would determine this contribution, an exemplary AUC was extracted that could be derived after repeatedly fitting all models for every point of the grid.
[0155] The panel yielded a sensitivity of 0.452 at 95% specificity, which represents an improvement over a sensitivity of 0.288 at 95% specificity for CA19-9 alone. The "OR" rule combination of TIMP1, LRG1, and CA19-9 resulted in high diagnostic accuracy when applied to the comparison of PDAC patients versus healthy controls yielding an AUC (95% CI) of 0.955 (0.890-1) (p vs. CA19-9: p<0.001 bootstrap; p<0.001, likelihood ratio test; Table 8).
[0156] Odds ratios at the Youden index-based optimal cut-off points was estimated. For the model for early-stage PDAC cases versus healthy controls, log (odds ratio) was 4.67 (95% CI=3.29-6.05) at the cut-off point with sensitivity of 0.849 and specificity of 0.950. For the model for early-stage PDAC cases versus benign pancreatic disease cases, log (odds ratio) was 2.98 (95% CI=2.04-3.91) at the cut-off point with sensitivity of 0.863 and specificity of 0.757.
TABLE-US-00010 TABLE 7 Performance of biomarkers in combined validation set. Sensitivity at Specificity at Marker p AUC 95% CI 95% specificity 95% sensitivity Pancreatic CA19-9 <0.001 0.882 0.809-0.956 0.726 0.228 cancer TIMP1 <0.001 0.880 0.805-0.956 0.411 0.500 vs. LRG1 <0.001 0.847 0.768-0.926 0.425 0.250 Healthy REG3A <0.001 0.819 0.735-0.903 0.452 0.094 control IGFBP2 <0.001 0.800 0.715-0.885 0.425 0.333 COL18A1 <0.001 0.749 0.660-0.837 0.329 0.233 TNFRSF1A <0.001 0.692 0.597-0.788 0.206 0.150 Pancreatic CA19-9 <0.001 0.819 0.743-0.895 0.288 0.243 cancer TIMP1 <0.001 0.732 0.644-0.821 0.219 0.333 vs. LRG1 <0.001 0.682 0.592-0.771 0.110 0.117 Chronic REG3A <0.001 0.656 0.563-0.749 0.219 0.094 pancreatitis IGFBP2 0.005 0.624 0.529-0.719 0.274 0.167 COL18A1 0.005 0.628 0.531-0.725 0.082 0.133 TNFRSF1A 0.002 0.643 0.548-0.738 0.096 0.100 Pancreatic CA19-9 <0.001 0.831 0.754-0.907 0.288 0.259 cancer TIMP1 <0.001 0.742 0.657-0.828 0.206 0.324 vs. LRG1 <0.001 0.679 0.580-0.772 0.110 0.135 Benign REG3A <0.001 0.651 0.560-0.743 0.192 0.090 pancreatic IGFBP2 0.002 0.632 0.542-0.722 0.219 0.189 disease* COL18A1 0.004 0.627 0.534-0.719 0.082 0.149 TNFRSF1A 0.001 0.643 0.551-0.736 0.082 0.122 *Benign pancreatic disease (chronic pancreatitis cases and benign pancreatic cyst cases).
TABLE-US-00011 TABLE 8 Performance of biomarker panel in the combined validation set. Sensitivity Sensitivity Specificity Specificity p (vs. CA19-9) at 95% at 99% at 95% at 99% CV- Likelihood Model AUC 95% CI specificity specificity sensitivity sensitivity AUC (SD) Bootstrap ratio test Pancreatic cancer vs. Healthy Control TIMP1 + LRG1 + CA19-9 0.949 0.917-0.981 0.849 0.658 0.633 0.367 0.936 0.003 <0.001 (linear) (0.030) TIMP1 + LRG1 + CA19-9 0.955 0.890-1 0.849 0.575 0.667 0.389 0.968 <0.001 <0.001 ("OR" rule) (0.022) Pancreatic cancer vs. Benign pancreatic disease* TIMP1 + LRG1 + CA19-9 0.846 0.781-0.911 0.356 0.110 0.351 0.108 0.830 0.18 0.02 (linear) (0.049) TIMP1 + LRG1 + CA19-9 0.890 0.802-0.978 0.452 0.123 0.541 0.282 0.887 <0.001 <0.001 ("OR" rule) (0.041) *Benign pancreatic disease (chronic pancreatitis cases and benign pancreatic cyst cases). CV-AUC: cross-validation related average AUC.
TABLE-US-00012 TABLE 9 Performance of biomarker panel in the validation set #1 and #2. Sensitivity Sensitivity Specificity Specificity p (vs. CA19-9)* at 95% at 99% at 95% at 99% CA19-9 Likelihood AUC 95% CI specificity specificity sensitivity sensitivity AUC Bootstrap ratio test Training Validation set #2 0.937 0.892-0.983 0.762 0.619 0.680 0.460 0.885 0.04 <0.001 Testing Validation set #1 0.930 0.826-1 0.800 0.800 0.600 0.600 0.740 -0.02 -- *Statistical tests were one-sided.
Example 7: Evaluation of Biomarker Panel
[0157] Further blinded validation of the panel of three biomarkers TIMP1, LRG1, and CA19-9 was performed using the test set. The levels of all 3 biomarkers were significantly higher in PDAC cases than in healthy controls with AUC (95% CI) of 0.821 (0.736-0.906) for CA19-9, 0.730 (0.626-0.834) for TIMP1, and 0.832 (0.755-0.909) for LRG1 (Table 10). A linear combination of the three markers yielded an AUC (95% CI) of 0.903 (0.838-0.967), which was greater to a statistically-significant degree than the AUC of CA19-9 alone (p=0.001, bootstrap; p<0.001, likelihood ratio test; Table 11). Moreover, the linear combination of TIMP1, LRG1, CA19-9 and covariates (represented by recruiting center, gender, age, smoking status, and alcohol consumption) yielded an AUC (95% CI) of 0.929 (0.878-0.980), which represents a statistically-significant improvement over CA19-9 and covariates combination alone (AUC (95% CI)=0.848 (0.778-0.920); p=0.01, bootstrap; p<0.001, likelihood ratio test; Table 11). Inclusion of covariates resulted in a statistically-significant improvement in performance as compared to the three biomarker panel alone (p=0.03, bootstrap; p=0.004, likelihood ratio test; Table 11).
[0158] Of note, the logistic regression model of CA19-9, TIMP1 and LRG1 with fixed coefficients which was developed in the combined validation sets for PDAC versus healthy controls yielded an AUC of 0.887, also with statistically-significant improved performance compared to CA19-9 alone (p=0.008, likelihood ratio test; Table 10 and FIG. 5). The model yielded a sensitivity of 0.667 and 0.410 at 95% and 99% specificity, respectively, whereas sensitivity at 95% and 99% specificity for CA19-9 alone was 0.538 and 0.462, respectively. Log-transformed odds ratios at the Youden index-based optimal cut-off points was 3.19 (95% CI=2.11-4.26) at the cut-off point with sensitivity of 0.872 and specificity of 0.780.
Example 8: Specificity and Sensitivity in the Range of Regression Model Diagnostic Scores
[0159] It will be appreciated by those of ordinary skill in the art that different methods or assays of biomarker detection, quantitation, and analysis, which can include using different reagents, will produce different results which may require modification of the regression model. In particular, different assays can produce results expressed, for example, in different units. Further, duplicate reactions in duplicate assays of the same samples can also produce different raw results. However, it is the combined detection, quantitation, and analysis of at least the three biomarkers TIMP1, LRG1, and CA19-9 that, when incorporated into a regression model as disclosed herein, produce a definitive diagnosis of PDAC.
[0160] A range in the results reported for each particular assay used to detect, quantify, and analyze the three biomarkers will have a range in the resulting PDAC-predictive score that depends, in part, on the degree of sensitivity or specificity (Table 12; where the preferred cutoff based on the Youden Index is 0.8805 with a specificity of 0.95 and sensitivity of 0.8493). The regression model used to generate the PDAC-predictive score can depend on the specific assays utilized to test the markers. As understood by those of skill in the art, different assays can target different epitopes of the three biomarkers or have different affinities and sensitivities. As such, the regression model algorithm used to generate the PDAC-predictive score can be modified to take these assay variations into consideration.
Example 9: Assaying Samples and PDAC-Patient Diagnosis
[0161] In one example, a patient being screened for PDAC-based on the three-biomarker panel disclosed herein--has a blood sample drawn (or other fluid or tissue biopsy) and assayed by ELISA (or other assay) to quantitate the levels of TIMP1, LRG1, and CA19-9 in the patient. Normalized values for at least these biomarkers that take into account the specific assay used (e.g., ELISA; Table 3) could be, for example, TIMP1=0.6528 ng/mL; LRG1=2.0498 ng/mL; and CA19-9=1.8160 U/mL. Raw assay data are then log 2-transformed, computing the mean and standard deviation for the healthy samples in each cohort. The data is then standardized so that healthy samples have a mean of 0 and a standard deviation of 1: where (Read.sub.j-mean.sub.healthy)/(std.sub.healthy), where j is the jth sample.
[0162] When analyzed using the following regression model:
log it(p)=-1.97+1.7005.times.log TIMP1+0.93856.times.log LRG1+0.60639.times.log CA19.9
the above patient would have a combined score of 2.1653. In view of the preferred cutoff for consideration of both specificity and sensitivity (Table 12), a patient with such a combined score would have PDAC with near certainty and consequently be directed for follow-up testing and treatment for PDAC using other modalities discussed herein and known to those of skill in the art. Using the regression model described herein, the more positive the combined PDAC-predictive score, the more certainty the patient has PDAC. Conversely, the more negative the combined PDAC-predictive score, the more certainty the patient does not have PDAC.
[0163] By contrast, in another example, normalized values for biomarkers TIMP1, LRG1, and CA19-9 that take into account the specific assay used could be, for example, TIMP1=-2.0370 ng/mL; LRG1=-1.5792 ng/mL; and CA19-9=1.0712 U/mL. When analyzed using the same regression model as above, such a patient would have a combined score of -6.2666. In view of the preferred cutoff for consideration of both specificity and sensitivity (Table 12), a patient with such a combined score would, with near certainty, not have PDAC and, therefore, would or would not need to be followed for additional testing based on the strength of any other clinical conditions.
TABLE-US-00013 TABLE 10 Performance of biomarker model in the test set. Sensitivity Sensitivity Specificity Specificity at 95% at 99% at 95% at 99% Marker AUC p 95% CI specificity specificity sensitivity sensitivity p (vs. CA19-9)* CA19-9 0.821 <0.001 0.736-0.906 0.538 0.462 0.286 0.067 -- TIMP1 0.730 <0.001 0.626-0.834 0.359 0.333 0.085 0.000 -- LRG1 0.832 <0.001 0.755-0.909 0.462 0.179 0.366 0.220 -- Model (fixed coefficients): 0.887 <0.001 0.817-0.957 0.667 0.410 0.220 0.207 0.008 TIMP1 + LRG1 + CA19-9
TABLE-US-00014 TABLE 11 Performance of biomarker panel in the test set. Sensitivity Sensitivity Specificity Specificity p (vs. CA19-9) at 95% at 99% at 95% at 99% Likelihood Marker AUC P* 95% CI specificity specificity sensitivity sensitivity Bootstrap ratio test CA19-9 0.821 <0.001 0.736-0.906 0.538 0.462 0.286 0.067 -- -- CA19-9 + Covariates.sup..dagger. 0.848 <0.001 0.778-0.920 0.513 0.308 0.407 0.321 0.02 0.007 Panel: TIMP1 + 0.903 <0.001 0.838-0.967 0.692 0.282 0.247 0.247 0.001 <0.001 LRG1 + CA19-9 Panel + Covariates.sup..dagger. 0.929 <0.001 0.878-0.980 0.821 0.077 0.481 0.407 0.01.sup..dagger-dbl. <0.001.sup..dagger-dbl. 0.03.sup..sctn. 0.004.sup..sctn. *p values were calculated using a one-sided Wilcoxon rank sum test. .sup..dagger.Covariates: recruiting center, gender, age (continuous), smoking status (current, ex-, never smoker), and alcohol drinking (current, ex-, never drinker). One healthy control subject with missing alcohol consumption information was not included in this analysis. .sup..dagger-dbl.p versus CA19-9 + Covariates .sup..sctn.p versus Panel
TABLE-US-00015 TABLE 12 Sensitivity and specificity at different cutoffs of the biomarker panel-based (TIMP1, LRG1, and CA19-9) scores in the combination validation set. Cutoff Specificity Sensitivity -15.0 0.000 1.000 -14.5 0.000 1.000 -14.0 0.000 1.000 -13.5 0.000 1.000 -13.0 0.000 1.000 -12.5 0.000 1.000 -12.0 0.000 1.000 -11.5 0.017 1.000 -11.0 0.017 1.000 -10.5 0.017 1.000 -10.0 0.017 1.000 -9.5 0.017 1.000 -9.0 0.017 1.000 -8.5 0.017 1.000 -8.0 0.017 1.000 -7.5 0.017 1.000 -7.0 0.033 1.000 -6.5 0.050 1.000 -6.0 0.067 1.000 -5.5 0.083 1.000 -5.0 0.100 1.000 -4.5 0.117 1.000 -4.0 0.183 1.000 -3.5 0.267 1.000 -3.0 0.367 0.986 -2.5 0.467 0.986 -2.0 0.567 0.973 -1.5 0.633 0.945 -1.0 0.733 0.932 -0.5 0.800 0.890 0.0 0.850 0.877 0.5 0.883 0.849 1.0 0.950 0.836 1.5 0.967 0.767 2.0 1.000 0.658 2.5 1.000 0.521 3.0 1.000 0.507 3.5 1.000 0.411 4.0 1.000 0.274 4.5 1.000 0.247 5.0 1.000 0.205 5.5 1.000 0.178 6.0 1.000 0.164 6.5 1.000 0.151 7.0 1.000 0.151 7.5 1.000 0.151 8.0 1.000 0.137 8.5 1.000 0.096 9.0 1.000 0.096 9.5 1.000 0.055 10.0 1.000 0.041 10.5 1.000 0.041 11.0 1.000 0.041 11.5 1.000 0.027 12.0 1.000 0.027 12.5 1.000 0.027 13.0 1.000 0.027 13.5 1.000 0.027 14.0 1.000 0.027 14.5 1.000 0.027 15.0 1.000 0.014 15.5 1.000 0.014 16.0 1.000 0.014 16.5 1.000 0.014 17.0 1.000 0.014 17.5 1.000 0.014 18.0 1.000 0.014 18.5 1.000 0.014 19.0 1.000 0.014 19.5 1.000 0.014 20.0 1.000 0.014 20.5 1.000 0.014 21.0 1.000 0.000 21.5 1.000 0.000 22.0 1.000 0.000 22.5 1.000 0.000 23.0 1.000 0.000 23.5 1.000 0.000 24.0 1.000 0.000 24.5 1.000 0.000 25.0 1.000 0.000
Example 10: A Panel Combining Plasma Metabolite and Protein Markers for the Detection of Early Stage Pancreatic Cancer
[0164] Using an untargeted metabolomics approach, a plasma-derived metabolite biomarker panel was developed for resectable pancreatic ductal adenocarcinoma (PDAC). A multi-assay metabolomics approach using liquid chromatography/mass spectrometry was applied on plasmas collected from 20 (10 early and 10 late stage) PDAC cases and 20 matched controls (10 healthy subjects; 10 subjects with chronic pancreatitis) to identify candidate metabolite markers for PDAC; candidate markers were narrowed based on a second `confirmatory` cohort consisting of 9 PDACs and 50 subjects with benign pancreatic disease (BPD). Blinded validation was performed in an independent cohort consisting of 39 resectable PDAC cases and 82 matched controls. Five metabolites, including acetylspermidine, diacetylspermine, lysophosphatidylcholine (18:0), lysophosphatidylcholine (20:3) and an indole-derivative, were identified in discovery and `confirmatory` cohorts as candidate biomarkers markers for PDAC. A metabolite panel was developed based on logistic regression models and evaluated for its ability to distinguish PDAC from healthy controls in the combined discovery and `confirmatory` cohort. The resulting panel yielded an area under the curve (AUC) of 0.90 (95% C.I.: 0.818-0.989). Blinded validation of the metabolite panel yielded an AUC of 0.89 (95% C.I.: 0.828-0.956) in the independent validation cohort. Importantly evaluation of the metabolite markers in combination with our previously identified protein markers (CA19-9, TIMP1 and LRG1) yielded an AUC of 0.92 in the validation cohort, which was statistically significantly greater than the protein panel alone (AUC=0.86; p-value: 0.024), highlighting the complementary nature of the metabolite panel when combined with a three-protein marker panel.
[0165] Pancreatic ductal adenocarcinoma (PDAC) is the third leading cause of cancer-related mortality in both men and women in the United States, with an overall 5-year survival rate of only .about.8%. Unfortunately, diagnosis of PDAC at an early stage is uncommon and usually incidental in the majority of patients (.about.85%) presenting with locally advanced or metastatic disease.
[0166] Currently, no clinical marker(s) exist that display desired performance characteristics for early stage PDAC in asymptomatic individuals. The current use of CA19-9 as a screen biomarker is limited by its variable accuracy, reduced performance in pre-diagnostic stages of the disease, and its inability to be detected in .about.10% of subjects with fucosyltransferase deficiency. Consequently, there is a critical need for additional markers that display collectively higher sensitivity and specificity for reliable detection of low volume PDAC in asymptomatic individuals. In this context, blood-based biomarker(s) are ideal and represent a relatively non-invasive and cost-effective method for detecting disease at early stages.
[0167] Recently, development and sequential validation of a protein-based biomarker panel for detecting early-stage PDAC, capable of complementing CA19-9 was performed. Although classification performance improved relative to CA19-9 alone, room for improvement remained. Thus, there is a need to test the relative contribution of different types of biomarkers, such as metabolites, to enable the development of an optimal biomarker combination model for this challenging application.
[0168] In the present study, an untargeted metabolomics approach was applied to develop a plasma-derived metabolite biomarker panel for PDAC. The fixed biomarker panel was subsequently blindly validated in an independent test cohort consisting of 39 resectable PDAC cases and 82 matched healthy controls in addition to being compared against a previously identified protein panel. The performance of the metabolite panel was additionally tested to distinguish PDAC cases from subjects diagnosed with benign pancreatic cysts.
Study Population
[0169] All human blood samples were obtained following Institutional Review Board approval and informed consent. For initial metabolite discovery studies, plasma samples from 20 patients with PDAC, including 10 early-stage and 10 late stage PDAC, 10 healthy controls, and 10 patients with chronic pancreatitis were obtained from the Evanston Hospital (discovery set). All chronic pancreatitis samples were collected in an elective setting in the clinic in the absence of an acute flare-up. Plasma samples obtained from the Indiana University School of Medicine, consisting of 50 patients with low dysplastic grade pancreatic cyst and 9 patients with invasive IPMN (5 early-stage and 4 late-stage adenocarcinoma) were used for biomarker sequential selection and initial validation (confirmation set). All patients underwent surgical resection of their cystic lesion, and plasma samples were collected prior to surgery. Dysplastic grade was histopathology confirmed after surgical resection and determined according to WHO criteria. An additional independent plasma sample set for testing the combined biomarker panel was obtained from the International Agency for Research on Cancer, consisting of 39 early-stage PDAC and 82 healthy controls (Test Set #1). A second sample set from the Indiana University School of Medicine, consisting of 102 patients with low dysplastic grade pancreatic cyst, 12 patients with resectable invasive IPMN, and resectable 8 PDAC patients with IPMN was applied as a Test Set #2. Study flow diagram and clinical characteristics of the patients in the validation sets and test set are presented in FIG. 6 and Tables 13 and 14.
TABLE-US-00016 TABLE 13 Subject Characteristics in the Discovery Sets. Discovery Cohort (Set #1) Pancreatic Healthy Chronic cancer controls pancreatitis Total (n) 20 10 10 Gender (n) Male 10 4 6 Female 10 6 4 Age (mean (SD)) 70.4 (10.0) 60.2 (10.4) 61.6 (13.3) Stage (n) IB 2 -- -- IIA 1 -- -- IIB 7 -- -- IV 10 -- -- `Confirmatory` Cohort (Set #2) Pancreatic Low grade cancer pancreatic cyst Total (n) 9 50 Gender (n) Male 3 18 Female 6 32 Age (mean (SD)) 73.1 (8.1) 62.5 (17.5) Tobacco Never 5 22 smoking Ex-smoker 3 16 Current 1 11 smoker Missing -- 1 Type 2 diabetes Yes 4 34 No 5 16 Alcohol drinking Never 6 31 Ex-drinker -- 8 Current drinker 3 9 Missing -- 2 Cystic lesion IPMN 9 34 MCN -- 11 SCN -- 5 Stage (n) IA 1 -- IIA 2 -- IIB 2 -- IV 4 --
TABLE-US-00017 TABLE 14 Subject Characteristics in the Test Sets. Test Set #1 Pancreatic Healthy cancer controls Total (n) 39 82 Gender (n) Male 21 43 Female 18 39 Age (mean (SD)) 62.0 (11.0) 62.8 (10.0) Tobacco Never 16 41 smoking Ex-smoker 12 24 Current smoker 11 17 Alcohol Never 23 41 drinking Ex-drinker 9 8 Current drinker 7 32 Missing -- 1 Stage (n) IA 6 -- IB 10 -- Resectable (No TNM data) 23 -- Test Set #2 Pancreatic Low grade cancer pancreatic cyst Total (n) 20 102 Gender (n) Male 12 43 Female 8 59 Age (mean (SD)) 69.6 (11.4) 64.5 (12.6) Tobacco Never 9 51 smoking Ex-smoker 7 22 Current smoker 4 29 Type 2 Yes 7 20 diabetes No 13 78 Missing -- 4 Alcohol Never 8 66 drinking Ex-drinker 2 9 Current drinker 9 27 Missing 1 -- Cystic IPMN 12 92 lesion MCN -- 7 SCN -- 3 Adenocarcinoma 8 -- with IPMN Stage (n) IA 6 -- IIA 4 -- IIB 10 --
Cell Line Metabolomic Experiments
[0170] PDAC cell lines (CFPAC, MiaPaCa, SU8686, BxPC3, CAPAN2, PANC03.27 and SW1990) were grown in RPMI-1640 with 10% FBS. The identity of each cell line was confirmed by DNA fingerprinting via short tandem repeats at the time of mRNA and total protein lysate preparation using the PowerPlex 1.2 kit (Promega). Fingerprinting results were compared with reference fingerprints maintained by the primary source of the cell line. Cells were seeded in 6-cm dishes (Thermo Scientific) to reach a 70% (50-80%) confluency, 24 hours post initial seeding. Post 24 hours, cell lysates were washed 2.times. with pre-chilled 0.9% NaCl followed by addition of 1 mL of pre-chilled extraction buffer (3:1 isopropanol:ultrapure water) to quench and remove cell media. Cells were then scraped using a 25-cm Cell Scraper (Sarstedt) in extraction solvent and transferred to a 1.5-mL Eppendorf tube. After vortexing briefly, the extracted cell lysates were centrifuged at 4.degree. C. for 10 min at 2,000.times.g. Thereafter, 1 mL of the supernatant containing the extracted metabolites were transferred to 1.5-mL Eppendorf tubes and stored in -20.degree. C. until needed for metabolomic analysis.
Exometabolome Experiments
[0171] Cells were grown in 1 ml of RPMI 1640+10% FBS in 12-well dishes (Costar) to reach a 70% (50-80%) confluency, 24 hours post initial seeding. On the day of the experiment, the cells were washed 2 times with 500 .mu.L serum-free RPMI (Fisher Scientific) containing 5 mM glucose and 0.5 mM glutamine. Serum-free RPMI (300 .mu.L) containing 5 mM glucose and 0.5 mM glutamine was then added to each well and the cells were incubated. After a predetermined incubation time (1, 2, 4, and 6 hours) 250 .mu.L of the conditioned media was collected. For baseline (T0), 250 .mu.L of media was collected directly after the addition of 300 .mu.L. All time points were performed in triplicates or quadruplicates. Blank samples containing media only were included and collected at T0 and T6. The 6-hour samples were used to count cell numbers for data normalization. Once all the media samples were collected, the tubes were centrifuged at 2000.times.g for 10 min to remove residual debris and the supernatants transferred to 1.5-mL Eppendorf tubes and stored at -80.degree. C. until used for metabolomics analysis.
Primary Metabolites and Biogenic Amines
[0172] Plasma metabolites were extracted from pre-aliquoted EDTA plasma (10 .mu.L) with 30 .mu.L of LCMS grade methanol (ThermoFisher) in a 96-well microplate (Eppendorf). Plates were heat sealed, vortexed for 5 min at 750 rpm, and centrifuged at 2000.times.g for 10 minutes at room temperature. The supernatant (10 .mu.L) was carefully transferred to a 96-well plate, leaving behind the precipitated protein. The supernatant was further diluted with 10 .mu.L of 100 mM ammonium formate, pH 3. For Hydrophilic Interaction Liquid Chromatography (HILIC) analysis, the samples were diluted with 60 .mu.L LCMS grade acetonitrile (ThermoFisher), whereas samples for C18 analysis were diluted with 60 .mu.L water (GenPure ultrapure water system, ThermoFisher). Each sample solution was transferred to 384-well microplate (Eppendorf) for LCMS analysis.
[0173] For cell lysates, 100 .mu.L (3:1 isopropanol:ultrapure water) was aliquoted into two 300 .mu.L, 96-well plates (Eppendorf) and evaporated to dryness under vacuum. The samples were then reconstituted as follows: for the HILIC assays, the dried samples were dissolved in 65 .mu.L of ACN (Fisher Scientific): 100 mM Ammonium Formate pH 3 (9:1), whereas for the reverse phase C18 assays, the dried samples were dissolved in 65 .mu.L of H.sub.2O: 100 mM Ammonium Formate pH 3 (9:1). The samples were then spun down to remove any insoluble materials and transferred to a 384-well plate for high throughput analysis using LCMS.
[0174] Frozen media samples were thawed on ice and 30 al transferred to a 96-well microplate (Eppendorf) containing 30 .mu.L of 100 mM ammonium formate, pH 3.0. The microplates were heat sealed, vortexed for 5 min at 750 rpm, and centrifuged at 2000.times.g for 10 minutes at room temperature. For Hydrophilic Interaction Liquid Chromatography (HILIC) analysis, 25 .mu.L of sample was transferred to a new 96-well microplate containing 75 .mu.L acetonitrile, whereas samples for C18 analysis were transferred to a new 96-well microplate containing 75 .mu.L water (GenPure ultrapure water system, ThermoFisher). Each sample solution was transferred to 384-well microplate (Eppendorf) for LCMS analysis.
[0175] For each batch, samples were randomized and matrix-matched reference quality controls and batch-specific pooled quality controls were included.
Complex Lipids
[0176] Pre-aliquoted EDTA plasma samples (10 .mu.L) were extracted with 30 .mu.L of LCMS grade 2-propanol (ThermoFisher) in a 96-well microplate (Eppendorf). Plates were heat-sealed, vortexed for 5 min at 750 rpm, and centrifuged at 2000.times.g for 10 minutes at room temperature. The supernatant (10 .mu.L) was carefully transferred to a 96-well plate, leaving behind the precipitated protein. The supernatant was further diluted with 90 .mu.L of 1:3:2 100 mM ammonium formate, pH 3 (Fischer Scientific): acetonitrile: 2-propanol and transferred to a 384-well microplate (Eppendorf) for lipids analysis using LCMS.
[0177] For cell lysates, in a 300 .mu.L, 96-well plate, 10 .mu.L supernatant (3:1 isopropanol:ultrapure water) of the extracted cell lysate metabolites was diluted with 90 .mu.L of 1:3:2 100 mM ammonium formate, pH 3: acetonitrile: 2-propanol (Fisher Scientific) and transferred to a 384-well microplate (Eppendorf) for analysis using LCMS.
[0178] For each batch, samples were randomized and matrix-matched reference quality controls and batch-specific pooled quality controls were included.
Untargeted Analysis of Primary Metabolites and Biogenic Amines
[0179] Untargeted metabolomics analysis was conducted on Waters Acquity.TM. UPLC system with 2D column regeneration configuration (I-class and H-class) coupled to a Xevo G2-XS quadrupole time-of-flight (qTOF) mass spectrometer. Chromatographic separation was performed using HILIC (Acquity.TM. UPLC BEH amide, 100 .ANG., 1.7 .mu.m 2.1.times.100 mm, Waters Corporation, Milford, U.S.A) and C18 (Acquity.TM. UPLC HSS T3, 100 .ANG., 1.8 .mu.m, 2.1.times.100 mm, Water Corporation, Milford, U.S.A) columns at 45.degree. C.
[0180] Quaternary solvent system mobile phases were (A) 0.1% formic acid in water, (B) 0.1% formic acid in acetonitrile and (D) 100 mM ammonium formate, pH 3. Samples were separated using the following gradient profile: for the HILIC separation a starting gradient of 95% B and 5% D was increase linearly to 70% A, 25% B and 5% D over a 5-min period at 0.4 mL/min flow rate, followed by 1 min isocratic gradient at 100% A at 0.4 mL/min flow rate. For C18 separation, a chromatography gradient was as follows: starting conditions, 100% A, with a linear increase to final conditions of 5% A, 95% B, followed by isocratic gradient at 95% B, 5% D for 1 min.
[0181] A binary pump was used for column regeneration and equilibration. The solvent system mobile phases were (A1) 100 mM ammonium formate, pH 3, (A2) 0.1% formic in 2-propanol and (B1) 0.1% formic acid in acetonitrile. The HILIC column was stripped using 90% A2 for 5 min followed by 2 min equilibration using 100% B1 at 0.3 mL/min flowrate. Reverse phase C18 column regeneration was performed using 95% A1, 5% B1 for 2 min followed by column equilibration using 5% A1, 95% B1 for 5 min.
Untargeted Analysis of Complex Lipids
[0182] For the lipidomic assay, untargeted metabolomics analysis was conducted on a Waters Acquity.TM. UPLC system with 2D column regeneration configuration (I-class and H-class) coupled to a Xevo G2-XS quadrupole time-of-flight (qTOF) mass spectrometer. Chromatographic separation was performed using a C18 (Acquity.TM. UPLC HSS T3, 100 .ANG., 1.8 am, 2.1.times.100 mm, Water Corporation, Milford, U.S.A) column at 55.degree. C. The mobile phases were (A) water, (B) Acetonitrile, (C) 2-propanol and (D) 500 mM ammonium formate, pH 3. A starting elution gradient of 20% A, 30% B, 49% C, and 1% D was increased linearly to 10% B, 89% C and 1% D for 5.5 min, followed by isocratic elution at 10% B, 89% C and 1% D for 1.5 min and column equilibration with initial conditions for 1 min.
Mass Spectrometry Data Acquisition
[0183] Mass spectrometry data was acquired in sensitivity, positive and negative electrospray ionization mode within 50-1200 Da range for primary metabolites and 100-2000 Da for complex lipids. For the electrospray acquisition, the capillary voltage was set at 1.5 kV (positive), 3.0 kV (negative), sample cone voltage of 30 V, source temperature of 120.degree. C., cone gas flow of 50 L/h, and desolvation gas flow rate of 800 L/h with scan time of 0.5 sec in continuum mode. Leucine Enkephalin; 556.2771 Da (positive) and 554.2615 Da (negative) for lockspray correction and scans were performed at 0.5 min. The injection volume for each sample was 3 .mu.L, unless otherwise specified. The acquisition was carried out with instrument auto gain control to optimize instrument sensitivity over the sample acquisition time.
[0184] Pooled quality control samples were analyzed after a defined number of samples to assess replicate precision and allow LOESS correction by injection order. Additional data was captured using the MSe function for pooled quality control samples.
Data Processing
[0185] Peak picking and retention time alignment of LC-MS and MSe data were performed using Progenesis QI (Nonlinear, Waters). Data processing and peak annotations were performed using an in-house automated pipeline. Annotations were determined by matching accurate mass and retention times using customized libraries created from authentic standards and/or by matching experimental tandem mass spectrometry data against the NIST MSMS, LipidBlast or HMDB v3 theoretical fragmentations. To correct for injection order drift, each feature was normalized using data from repeat injections of quality control samples collected every 10 injections throughout the run sequence. Measurement data were smoothed by Locally Weighted Scatterplot Smoothing (LOESS) signal correction (QC-RLSC) as previously described (1). Only detected features exhibiting a relative standard deviation (RSD) less than 30 in quality control samples were considered for further statistical analysis. To reduce data matrix complexity, annotated features with multiple adducts or acquisition mode repeats were collapsed to one representative unique feature. Features were selected based on replicate precision (RSD<30), intensity and best isotope similarity matching to theoretical isotope distributions. Values are reported as ratios relative to the median of historical quality control reference samples ran with every analytical batch for the given analyte.
Enzyme-Linked Immunosorbent Assay
[0186] Plasma protein concentrations for CA19-9, LRG1, and TIMP1 were determined as previously described (Capello et al., 2017). For all ELISA experiments, each sample was assayed in duplicate and the absorbance or chemiluminescence measured with a SpectraMax M5 microplate reader (Molecular Devices, Sunnyvale, Calif.). An internal control sample was run in every plate and each value of the samples was divided by the mean value of the internal control in the same plate to correct for interpolate variability.
Gene Expression Data and Networks
[0187] Gene expression for the Badea dataset was downloaded from oncomine database. Networks were visualized using cytoscape.
Statistical Analyses
[0188] Receiver operating characteristic (ROC) curve analysis was performed to assess the performance of biomarkers in distinguishing PDAC cases from healthy controls and subjects diagnosed with benign pancreatic disease (chronic pancreatitis or pancreatic cysts).
[0189] The AUC that corresponds to the individual performance of all biomarkers is estimated using the area under the empirical estimator of the receiver operating characteristic curve (ROC). The standard error (S.E.) and the corresponding 95% confidence intervals presented for the individual performance of each biomarker were based on the bootstrap procedure in which re-sampling was performed with replacement separately for the controls and the diseased 1000 bootstrap samples. It was noted that for markers LPC (18:0), LPC (20:3), and indole-3-lactate, the inverse directionality was taken into account, since these markers tend to exhibit higher measurements for the controls compared to the ones that correspond to the cancer related samples. The model building was based on a logistic regression model using the log it link function. The estimated AUC of the proposed metabolite panel (0.9034) was derived by using the empirical estimator of the linear combination that corresponds to the model. The 95% confidence interval reported for the metabolite panel based AUC (0.8180-0.9889) takes into account the fact that the coefficients of the underlying logistic regression model were estimated, and hence exhibit variability, by using the bootstrap with 1000 iterations, for which in every bootstrap iteration the coefficients of the model are re-estimated in order to provide proper inference. The hyper-panel, i.e. the panel that refers to the combination of the two underlying panels--one for the proteins and one for the metabolites--has been developed using those two panels as two composite markers, considering their respective coefficients fixed (one composite marker for the proteins and one for the metabolites). The hyper-panel was developed by combining those two underlying composite markers using a logistic regression model in which we considered the log it link function.
Results
Identification of Pancreatic Cancer Metabolite Biomarkers
[0190] Untargeted metabolomics analysis was conducted on a discovery cohort (Set #1) consisting of 20 PDAC cases (10 early and 10 late stage) and 20 matched controls (10 healthy subjects and 10 subjects with chronic pancreatitis (CP) (FIG. 6). Candidate biomarkers were initially selected based on significant ROC AUCs (two-tailed Wilcox rank-sum Test<0.05) resulting in 91 metabolites (Table 15). To further narrow the candidate list, metabolomic analyses were conducted on an independent `confirmatory` cohort (Set #2) consisting of 9 PDAC (5 early and 4 late stage) and 50 subjects with benign pancreatic disease (BPD) (benign pancreatic cysts). Of the 91 original features, 16 retained significant AUCs and maintained the same relative direction of change (increase/decrease) as observed in Set #1 (Table 16). Candidate metabolites were additionally refined to exclude (1) metabolites that exhibited similar levels between early-stage PDAC and subjects with CP (one-tailed Mann-Whitney U test p<0.1) and (2) metabolites that differed between CP and healthy controls (one-tailed Mann-Whitney U test p<0.1) (Table 16). In the case of individual lipid species, to mitigate non-specificity due to external factors such as dietary patterns, emphasis was given to those lipids that showed uniformity in the performance characteristics amongst the entire lipid class (i.e. >80% of the detected individual lipids in a given lipid class exhibited concordant increases/decreases in cases relative to controls (FIG. 7). A total of 5 metabolites were selected that met the aforementioned criteria. These five metabolites were (N1/N8)-acetylspermidine (AcSperm), diacetylspermine (DAS), lysophosphatidylcholine (LPC) (18:0), LPC (20:3), and an indole-derivative (FIG. 8 and Table 17).
TABLE-US-00018 TABLE 15 Ninety-two selected candidate metabolites based on discovery cohort. Healthy' Chronic Retention Subjects Pancreatitis Ionization time (Mean +/- (Mean +/- Index CmpID Adduct(s) Mode Assay m/z (min) StDev) StDev 5 1.2-DIDECANOYL-SN- [M - H2O + H]+ ESIpos HA 548.3685 0.9182 3.28 +/- 0.89 3.43 +/- 0.57 GLYCERO-3- PHOSPHOCHOLINE 23 3-(4-Hydroxyphenyl)propionic acid [M - H2O + H] + ESIpos HA 149.0608 3.1457 0.54 +/- 0.05 0.58 +/- 0.04 25 3-cis-Hydroxy-b,e-Caroten-3'-one [M + NH4] + ESIpos HA 568.4561 0.7124 0.71 +/- 0.16 0.54 +/- 0.05 32 4-AMINOBENZOATE [2M - H] - ESIneg CA 273.0843 3.2229 0.98 +/- 0.17 0.99 +/- 0.28 47 7-oxo-cholesterol [M + FA - H] - ESIneg HA 445.3313 0.678 1.11 +/- 0.7 0.51 +/- 0.2 48 Acetylcarnitine [M + H] + ESIpos HA 204.1242 3.1886 0.13 +/- 0.16 0.15 +/- 0.1 50 Acylcarnitine(C14:0) [M + H] + ESIpos Lipids 372.3114 0.7895 0.83 +/- 0.55 0.78 +/- 0.29 56 ADENOSINE 5'- [M + H] + ESIpos CA 348.0701 0.9267 0.14 +/- 0.16 0.08 +/- 0.02 MONOPHOSPHATE;AMP 57 ADIPIC ACID [M + H] + ESIpos HA 147.0653 0.7467 4.16 +/- 0.43 4.01 +/- 0.34 61 ALPHA-D-GLUCOSE [M + Na] ESIpos HA 203.0538 3.4849 1 +/- 0.35 1.63 +/- 1.26 62 Alpha-N-Phenylacetyl-L-glutamine [M + H] + ESIpos HA 265.1193 2.8151 0.45 +/- 0.36 0.93 +/- 0.87 70 BILIVERDIN [M + H] + ESIpos CA 583.2509 4.3042 0.77 +/- 0.17 0.66 +/- 0.19 79 Cer(18:0_16:0) [M + Na] + ESIpos Lipids 562.517 3.987 0.59 +/- 0.12 0.81 +/- 0.24 83 Cer(34:1) [M - H2O + H] + ESIpos Lipids 520.5052 3.845 0.85 +/- 0.23 1.04 +/- 0.25 84 Cer(40:0) [M + Na] ESIpos HA 646.6123 0.618 2.21 +/- 0.33 1.64 +/- 0.41 85 Cer(40:1) [M - H2O + H] + ESIpos HA 604.5978 0.618 2.48 +/- 0.89 1.99 +/- 0.83 88 Cer(42:0) [M + Na] + ESIpos Lipids 674.6387 5.377 0.79 +/- 0.29 0.78 +/- 0.23 89 Cer(42:1) [M - H2O + H] + ESIpos Lipids 632.6314 5.2913 0.79 +/- 0.32 0.9 +/- 0.36 91 Cer(42:2) [M - H2O + H] + ESIpos HA 630.6156 0.618 2.77 +/- 0.89 2.02 +/- 0.5 93 Chavicol O-beta-glucopyranoside [M - H2O + H] + ESIpos HA 279.1192 0.6781 1.41 +/- 0.21 1.24 +/- 0.11 114 D-(+)-GALACTOSAMINE; [M + H] + ESIpos CA 162.0747 0.5104 1.28 +/- 0.22 1.45 +/- 0.77 D-(+)-GLUCOSAMINE; D-MANNOSAMINE; N-METHYL-L-GLUTAMATE 118 DEOXYCORTICOSTERONE [M + H] + ESIpos HA 373.2351 0.7381 6.06 +/- 0.85 6.51 +/- 0.49 ACETATE 119 D-FRUCTOSE 6-PHOSPHATE [M - H] - ESIneg CB 259.0212 0.4418 1 +/- 0.11 1.07 +/- 0.1 121 DG(34:0) [M + Na] + ESIpos Lipids 619.5229 4.9092 0.69 +/- 0.09 0.76 +/- 0.18 124 DG(35:1) [M + NH4] + ESIpos Lipids 626.5788 4.4891 0.91 +/- 0.17 0.9 +/- 0.22 131 DIACETYLSPERMINE [M + H] + ESIpos HA 287.244 3.7164 0.85 +/- 0.13 0.93 +/- 0.15 138 FA (20:4) (arachidonic acid) [M - H] - ESIneg Lipids 303.2323 1.4974 0.67 +/- 0.21 0.69 +/- 0.34 143 GALACTITOL [M + Na] ESIpos HA 205.0684 3.4372 0.9 +/- 0.1 1.03 +/- 0.12 154 GLUTATHIONE [M + H] + ESIpos CA 308.0898 0.9696 6.8 +/- 2.67 6.94 +/- 2.98 155 GLYCERALDEHYDE [2M - H] - ESIneg CA 179.0558 0.5323 0.71 +/- 0.17 1.02 +/- 0.61 156 GLYCEROL 2-PHOSPHATE [M - H2O + H] + ESIpos CA 155.0121 0.6266 1.11 +/- 0.14 1.12 +/- 0.15 161 GUANOSINE 3'.5'-CYCLIC [M + H] + ESIpos HA 346.0572 3.7936 0.84 +/- 0.05 0.87 +/- 0.06 MONOPHOSPHATE 164 Hexanoylcarnitine [M + H] + ESIpos HA 260.1856 2.4978 0.72 +/- 0.22 0.9 +/- 0.43 168 HOMOCYSTINE [M - H2O + H] + ESIpos HA 251.0539 4.2614 1.7 +/- 0.67 1.25 +/- 0.14 170 Hydroxybutyrylcarnitine [M + H] + ESIpos HA 248.1494 3.3086 1.21 +/- 0.97 0.84 +/- 0.29 172 HYPOTAURINE [2M - H] - ESIneg CA 217.0298 0.5237 0.6 +/- 0.13 0.78 +/- 0.51 174 INDOLE [M + H] + ESIpos HA 118.0661 0.6781 2.09 +/- 0.53 1.55 +/- 0.18 177 INDOLE-3 -ETHANOL [M - H2O + H] + ESIpos HA 144.0812 0.6781 2.14 +/- 0.61 1.6 +/- 0.22 178 Indole-derivative [M - H2O + H] + ESIpos HA 188.0715 2.7208 0.65 +/- 0.9 0.78 +/- 1.18 182 INOSINE 5'-DIPHOSPHATE [M - H] - ESIneg CB 427.0055 0.4504 1.01 +/- 0.17 0.79 +/- 0.12 183 INOSINE 5'-MONOPHOSPHATE [M - H2O - H] - ESIneg CA 329.0323 0.781 0.77 +/- 0.13 0.74 +/- 0.09 184 LacCer(30:1);PC(38:6) [M + H] + ESIpos Lipids 806.5696 3.1714 0.99 +/- 0.4 0.82 +/- 0.31 192 L-ARGININE [M + H] + ESIpos HA 175.1199 4.1328 0.84 +/- 0.3 0.89 +/- 0.3 198 L-CYSTINE [M + H] + ESIpos HA 241.0311 4.39 1.69 +/- 0.5 1.93 +/- 0.49 201 L-GLUTAMIC ACID [M - H] - ESIneg CA 146.0462 0.5104 0.27 +/- 0.13 0.34 +/- 0.23 209 L-KYNURENINE [M + FA - H] - ESIneg CB 253.0814 1.4974 0.85 +/- 0.15 1.05 +/- 0.13 215 LPC(14:0) [M + H] + ESIpos HA 468.3106 2.6779 0.28 +/- 0.11 0.45 +/- 0.22 223 LPC(18:0) [M + H] + ESIpos Lipids 524.3702 1.3088 0.38 +/- 0.17 0.44 +/- 0.23 226 LPC(18:3) [M + H] + ESIpos Lipids 518.3221 0.8324 0.41 +/- 0.21 0.44 +/- 0.25 227 LPC(20:0) [M + H] + ESIpos HA 552.4014 2.6007 0.36 +/- 0.11 0.59 +/- 0.41 230 LPC(20:3) [M + H] + ESIpos CA 546.355 5.2741 0.46 +/- 0.29 0.54 +/- 0.33 235 LPC(26:0) [M + H] + ESIpos HA 636.4901 2.5493 0.79 +/- 0.16 0.77 +/- 0.21 237 LPC(P-16:0) [M + H] + ESIpos Lipids 480.3433 1.1287 0.37 +/- 0.13 0.36 +/- 0.14 246 LPE(22:6) [M - H] - ESIneg CA 524.2764 5.0598 0.69 +/- 0.44 0.45 +/- 0.26 250 L-PHENYLALANINE [M + H] + ESIpos CA 166.0865 1.8966 0.44 +/- 0.15 0.56 +/- 0.17 256 MALTOSE;MELIBIOSE;SUCROSE [M + Na] ESIpos HA 365.1056 3.7678 0.48 +/- 0.09 0.73 +/- 0.23 261 MELIBIOSE [M + K] + ESIpos HA 381.0796 3.9136 0.73 +/- 0.2 1.16 +/- 0.22 267 N8-ACETYLSPERMIDINE [M + H] + ESIpos HA 188.1761 3.8793 0.98 +/- 0.28 0.93 +/- 0.34 272 N-ACETYL-D-TRYPTOPHAN [2M - H] - ESIneg HB 491.1899 0.6952 0.84 +/- 0.22 0.92 +/- 0.08 278 N-acetyllactosamine [M + Na] ESIpos HA 406.1332 3.7335 0.6 +/- 0.14 0.73 +/- 0.14 283 NeuAc?2-3Gal?1-4Glc?- [M + H] + ESIpos Lipids 1153.719 2.4502 0.83 +/- 0.28 0.86 +/- 0.18 Cer(d18:1/16:0) 289 NG, NG-dimethyl-L-arginine [M + H] + ESIpos HA 203.1507 3.905 0.74 +/- 0.12 0.81 +/- 0.13 294 NICOTINAMIDE [M + H] + ESIpos CA 123.0552 1.0601 0.75 +/- 0.5 0.47 +/- 0.1 300 NICOTINAMIDE [M - H2O + H] + ESIpos CA 317.0567 0.5495 1.43 +/- 0.1 1.35 +/- 0.31 MONONUCLEOTIDE 305 N-METHYL-L-GLUTAMATE [M - H2O + H] + ESIpos CA 144.0658 0.5104 1.23 +/- 0.21 1.35 +/- 0.67 311 Octanoylcarnitine [M + H] + ESIpos HA 288.2182 2.3216 0.62 +/- 0.33 0.79 +/- 0.46 316 PC(32:0) [M + H] + ESIpos Lipids 734.5666 3.6221 0.78 +/- 0.22 0.96 +/- 0.29 322 PC(33:5) [M + H] + ESIpos Lipids 738.4968 3.4935 0.65 +/- 0.14 0.92 +/- 0.23 327 PC(36:3) [M + K] + ESIpos Lipids 822.5412 3.4849 0.95 +/- 0.11 1.02 +/- 0.1 333 PC(40:5) [M + Na] + ESIpos Lipids 858.5907 3.8965 1.08 +/- 0.36 1.14 +/- 0.3 338 PC(o-42:5) or PC(p-42:4) [M - H2O + H] + ESIpos Lipids 832.6594 4.5491 0.81 +/- 0.22 0.72 +/- 0.29 344 PE(37:4) [M + H] + ESIpos HA 754.5378 2.03 0.53 +/- 0.14 0.53 +/- 0.27 349 PE(41:3) [M + FA - H] - ESIneg Lipids 856.6023 3.9307 0.57 +/- 0.32 0.51 +/- 0.29 355 PE(o-36:5) or PE(p-36:4) [M + H] + ESIpos Lipids 724.5217 3.6564 0.73 +/- 0.29 0.67 +/- 0.49 360 PE(o-38:5) or PE(p-38:4) [M + H] + ESIpos Lipids 752.5541 4.0727 0.9 +/- 0.35 0.66 +/- 0.36 366 PHOSPHOCREATINE [M + H] + ESIpos CA 212.041 0.5237 0.64 +/- 0.1 0.53 +/- 0.19 371 PI(38:4) [M + K] + ESIpos HA 925.5194 2.7293 1.37 +/- 0.5 1.65 +/- 0.44 377 PS(o-18:0_22:6) [M + Cl] - ESIneg Lipids 856.5214 3.9307 0.58 +/- 0.32 0.49 +/- 0.27 382 PYRIDOXINE [M - H2O - H] - ESIneg HA 150.054 1.1887 0.72 +/- 0.27 0.99 +/- 1.26 388 SM(42:1) [M + H] + ESIpos Lipids 815.6967 4.8321 0.81 +/- 0.24 0.73 +/- 0.27 393 SM(42:2) [M + H] + ESIpos Lipids 813.6804 4.4414 0.84 +/- 0.28 0.74 +/- 0.16 399 SM(44:2) [M + H] + ESIpos Lipids 841.7163 4.8235 0.95 +/- 0.19 0.87 +/- 0.21 404 TG(46:0) [M + NH4] + ESIpos Lipids 796.7389 6.2526 0.5 +/- 0.24 0.76 +/- 0.46 410 TG(47:0) [M + NH4] + ESIpos Lipids 810.7538 6.3212 0.88 +/- 0.07 1.06 +/- 0.43 415 TG(48:2) [M + Na] + ESIpos Lipids 825.6948 6.0811 0.52 +/- 0.26 0.96 +/- 0.33 421 TG(58:9) [M + K] + ESIpos Lipids 967.7151 6.0297 1.02 +/- 0.34 0.76 +/- 0.22 426 THEOBROMINE [M + H] + ESIpos CA 181.0723 2.0129 0.45 +/- 0.49 0.61 +/- 0.49 432 THYROXINE [M + Na] ESIpos HA 799.6671 2.4759 1.99 +/- 0.32 1.31 +/- 0.39 437 toluene [M + H] + ESIpos HA 93.0699 3.1543 0.26 +/- 0.09 0.32 +/- 0.07 443 TRIGONELLINE [M + H] + ESIpos CA 138.0554 0.5666 0.15 +/- 0.09 0.85 +/- 1.13 448 TYRAMINE [M - H2O + H] + ESIpos CA 120.0814 1.8966 0.47 +/- 0.14 0.57 +/- 0.17 Early Late Stage Stage Fold PDAC PDAC Change FDR- (Mean (Mean (PDAC/ Mann- adjusted +/- +/- Controls) Whitney p- Wilcox AUC Index CmpID Stdev Stdev * U test** value*** AUC** T** (Positive) 5 1.2-DIDECANOYL-SN- 3.68 +/- 1.11 3.92 +/- 0.53 1.14 0.0491 0.2444 0.6825 0.0491 0.6825 GLYCERO-3-PHOSPHOCHOLINE 23 3-(4-Hydroxyphenyl)propionic acid 0.63 +/- 0.06 0.59 +/- 0.05 1.08 0.0167 0.1389 0.7200 0.0167 0.7200 25 3-cis-Hydroxy-b,e-Caroten-3'-one 0.52 +/- 0.08 0.53 +/- 0.06 0.84 0.0132 0.1178 0.2725 0.0132 0.7275 32 4-AMINOBENZOATE 38.85 +/- 89.38 1.78 +/- 1.7 20.00 0.0167 0.1389 0.7200 0.0167 0.7200 47 7-oxo-cholesterol 0.32 +/- 0.14 0.46 +/- 0.33 0.48 0.0016 0.0377 0.2150 0.0016 0.7850 48 Acetylcarnitine 0.3 +/- 0.13 0.2 +/- 0.16 1.79 0.0211 0.1558 0.7125 0.0211 0.7125 50 Acylcarnitine(C14:0) 1.21 +/- 0.65 0.95 +/- 0.51 1.35 0.0491 0.2444 0.6825 0.0491 0.6825 56 ADENOSINE 5'- 0.04 +/- 0.02 0.07 +/- 0.05 0.50 0.0095 0.1068 0.2625 0.0095 0.7375 MONOPHOSPHATE;AMP 57 ADIPIC ACID 4.5 +/- 0.61 4.35 +/- 0.39 1.09 0.0350 0.2020 0.6950 0.0350 0.6950 61 ALPHA-D-GLUCOSE 1.59 +/- 0.31 2.22 +/- 1.22 1.45 0.0003 0.0156 0.8200 0.0003 0.8200 62 Alpha-N-Phenylacetyl-L-glutamine 1.12 +/- 1.31 1.36 +/- 0.51 1.82 0.0245 0.1653 0.7075 0.0245 0.7075 70 BILIVERDIN 1.85 +/- 1.97 1.27 +/- 1.17 2.17 0.0024 0.0515 0.7750 0.0024 0.7750 79 Cer(18:0_16:0) 2.04 +/- 2.87 0.92 +/- 0.33 2.13 0.0087 0.1068 0.7400 0.0087 0.7400 83 Cer(34:1) 2.41 +/- 2.81 1.25 +/- 0.48 1.92 0.0227 0.1653 0.7100 0.0227 0.7100 84 Cer(40:0) 2.38 +/- 2.62 1.37 +/- 0.4 0.97 0.0039 0.0613 0.2375 0.0039 0.7625 85 Cer(40:1) 2.68 +/- 4.42 0.95 +/- 0.27 0.81 0.0002 0.0092 0.1650 0.0002 0.8350 88 Cer(42:0) 0.66 +/- 0.42 0.51 +/- 0.24 0.74 0.0029 0.0584 0.2300 0.0029 0.7700 89 Cer(42:1) 0.66 +/- 0.31 0.53 +/- 0.24 0.70 0.0167 0.1389 0.2800 0.0167 0.7200 91 Cer(42:2) 3.71 +/- 5.85 1.47 +/- 0.43 1.08 0.0012 0.0323 0.2075 0.0012 0.7925
93 Chavicol O-beta-glucopyranoside 1.17 +/- 0.11 1.08 +/- 0.1 0.85 0.0001 0.0081 0.1550 0.0001 0.8450 114 D-(+)-GALACTOSAMINE; 1.58 +/- 0.3 1.99 +/- 0.85 1.32 0.0014 0.0357 0.7875 0.0014 0.7875 D-(+)-GLUCOSAMINE; D-MANNOSAMINE; N-METHYL-L-GLUTAMATE 118 DEOXYCORTICOSTERONE 6.58 +/- 0.72 7.19 +/- 0.61 1.10 0.0103 0.1109 0.7350 0.0103 0.7350 ACETATE 119 D-FRUCTOSE 6-PHOSPHATE 0.68 +/- 0.41 0.75 +/- 0.37 0.69 0.0014 0.0357 0.2125 0.0014 0.7875 121 DG(34:0) 0.62 +/- 0.13 0.57 +/- 0.1 0.82 0.0009 0.0294 0.2025 0.0009 0.7975 124 DG(35:1) 0.76 +/- 0.16 0.77 +/- 0.11 0.85 0.0103 0.1109 0.2650 0.0103 0.7350 131 DIACETYLSPERMINE 1.18 +/- 0.43 1 +/- 0.24 1.23 0.0112 0.1128 0.7325 0.0112 0.7325 138 FA (20:4) (arachidonic acid) 0.82 +/- 0.38 0.98 +/- 0.3 1.33 0.0375 0.2040 0.6925 0.0375 0.6925 143 GALACTITOL 1.01 +/- 0.07 1.06 +/- 0.12 1.08 0.0402 0.2159 0.6900 0.0402 0.6900 154 GLUTATHIONE 5.56 +/- 3.2 4.09 +/- 2 0.70 0.0073 0.0963 0.2550 0.0073 0.7450 155 GLYCERALDEHYDE 0.89 +/- 0.23 1.18 +/- 0.36 1.19 0.0073 0.0963 0.7450 0.0073 0.7450 156 GLYCEROL 2-PHOSPHATE 0.98 +/- 0.12 1.02 +/- 0.15 0.90 0.0263 0.1706 0.2950 0.0263 0.7050 161 GUANOSINE 3'.5'-CYCLIC 0.53 +/- 0.37 0.64 +/- 0.38 0.68 0.0112 0.1128 0.2675 0.0112 0.7325 MONOPHOSPHATE 164 Hexanoylcarnitine 1.52 +/- 0.75 1.28 +/- 0.88 1.72 0.0122 0.1174 0.7300 0.0122 0.7300 168 HOMOCYSTINE 1.17 +/- 0.17 1.27 +/- 0.21 0.83 0.0491 0.2444 0.3175 0.0491 0.6825 170 Hydroxybutyrylcarnitine 2.08 +/- 1.95 2.38 +/- 2.39 2.17 0.0132 0.1178 0.7275 0.0132 0.7275 172 HYPOTAURINE 0.77 +/- 0.15 0.98 +/- 0.34 1.27 0.0039 0.0613 0.7625 0.0039 0.7625 174 INDOLE 1.34 +/- 0.15 1.21 +/- 0.21 0.70 0.0000 0.0004 0.0925 0.0000 0.9075 177 INDOLE-3-ETHANOL 1.37 +/- 0.18 1.23 +/- 0.2 0.69 0.0000 0.0015 0.1175 0.0000 0.8825 178 Indole-derivative 0.21 +/- 0.23 0.42 +/- 0.85 0.44 0.0283 0.1762 0.2975 0.0283 0.7025 182 INOSINE 5'-DIPHOSPHATE 0.57 +/- 0.35 0.66 +/- 0.37 0.68 0.0181 0.1426 0.2825 0.0181 0.7175 183 INOSINE 5'-MONOPHOSPHATE 0.57 +/- 0.35 0.55 +/- 0.27 0.74 0.0211 0.1558 0.2875 0.0211 0.7125 184 LacCer(30:1);PC(38:6) 1.26 +/- 0.65 1.11 +/- 0.31 1.30 0.0245 0.1653 0.7075 0.0245 0.7075 192 L-ARGININE 1.16 +/- 0.54 1.19 +/- 0.46 1.35 0.0245 0.1653 0.7075 0.0245 0.7075 198 L-CYSTINE 2.4 +/- 0.59 2.6 +/- 0.88 1.39 0.0012 0.0323 0.7925 0.0012 0.7925 201 L-GLUTAMIC ACID 0.5 +/- 0.41 0.45 +/- 0.23 1.56 0.0304 0.1844 0.7000 0.0304 0.7000 209 L-KYNURENINE 1.1 +/- 0.22 1.09 +/- 0.19 1.15 0.0304 0.1844 0.7000 0.0304 0.7000 215 LPC(14:0) 0.23 +/- 0.1 0.23 +/- 0.13 0.63 0.0155 0.1356 0.2775 0.0155 0.7225 223 LPC(18:0) 0.24 +/- 0.11 0.26 +/- 0.1 0.62 0.0132 0.1178 0.2725 0.0132 0.7275 226 LPC(18:3) 0.27 +/- 0.14 0.28 +/- 0.12 0.65 0.0375 0.2040 0.3075 0.0375 0.6925 227 LPC(20:0) 0.35 +/- 0.3 0.32 +/- 0.12 0.70 0.0350 0.2020 0.3050 0.0350 0.6950 230 LPC(20:3) 0.32 +/- 0.14 0.32 +/- 0.17 0.64 0.0430 0.2259 0.3125 0.0430 0.6875 235 LPC(26:0) 0.59 +/- 0.14 0.57 +/- 0.13 0.75 0.0009 0.0294 0.2025 0.0009 0.7975 237 LPC(P-16:0) 0.24 +/- 0.11 0.3 +/- 0.14 0.74 0.0263 0.1706 0.2950 0.0263 0.7050 246 LPE(22:6) 1 +/- 0.45 0.92 +/- 0.8 1.67 0.0087 0.1068 0.7400 0.0087 0.7400 250 L-PHENYLALANINE 0.65 +/- 0.25 0.62 +/- 0.13 1.28 0.0181 0.1426 0.7175 0.0181 0.7175 256 MALTOSE;MELIBIOSE;SUCROSE 7.54 +/- 21.42 0.85 +/- 0.51 7.14 0.0283 0.1762 0.7025 0.0283 0.7025 261 MELIBIOSE 3.39 +/- 4.54 2.52 +/- 3.11 3.13 0.0001 0.0081 0.8450 0.0001 0.8450 267 N8-ACETYLSPERMIDINE 1.76 +/- 1.04 1.59 +/- 0.7 1.75 0.0043 0.0631 0.7600 0.0043 0.7600 272 N-ACETYL-D-TRYPTOPHAN 1.18 +/- 0.35 1.11 +/- 0.43 1.30 0.0263 0.1706 0.7050 0.0263 0.7050 278 N-acetyllactosamine 0.89 +/- 0.26 0.74 +/- 0.16 1.22 0.0375 0.2040 0.6925 0.0375 0.6925 283 NeuAc?+02-3Ga1?+01-4G1c?+0- 1.39 +/- 0.8 1.32 +/- 0.59 1.61 0.0032 0.0584 0.7675 0.0032 0.7675 Cer(d18:1/16:0) 289 NG, NG-dimethyl-L-arginine 1.09 +/- 0.45 0.94 +/- 0.25 1.32 0.0073 0.0963 0.7450 0.0073 0.7450 294 NICOTINAMIDE 0.37 +/- 0.12 0.35 +/- 0.13 0.60 0.0006 0.0217 0.1925 0.0006 0.8075 300 NICOTINAMIDE 0.84 +/- 0.73 0.95 +/- 0.65 0.65 0.0181 0.1426 0.2825 0.0181 0.7175 MONONUCLEOTIDE 305 N-METHYL-L-GLUTAMATE 1.56 +/- 0.28 1.89 +/- 0.78 1.33 0.0001 0.0081 0.8400 0.0001 0.8400 311 Octanoylcarnitine 1.23 +/- 0.76 1.52 +/- 1.72 1.96 0.0350 0.2020 0.6950 0.0350 0.6950 316 PC(32:0) 2.03 +/- 2.24 1.11 +/- 0.38 1.82 0.0375 0.2040 0.6925 0.0375 0.6925 322 PC(33:5) 1.33 +/- 0.84 1.13 +/- 0.37 1.56 0.0043 0.0631 0.7600 0.0043 0.7600 327 PC(36:3) 0.9 +/- 0.12 0.94 +/- 0.07 0.93 0.0245 0.1653 0.2925 0.0245 0.7075 333 PC(40:5) 0.9 +/- 0.28 0.76 +/- 0.25 0.75 0.0035 0.0613 0.2350 0.0035 0.7650 338 PC(o-42:5) or PC(p-42:4) 1.36 +/- 0.72 1.25 +/- 0.62 1.69 0.0024 0.0515 0.7750 0.0024 0.7750 344 PE(37:4) 0.36 +/- 0.15 0.38 +/- 0.19 0.69 0.0132 0.1178 0.2725 0.0132 0.7275 349 PE(41:3) 0.72 +/- 0.32 0.84 +/- 0.38 1.45 0.0122 0.1174 0.7300 0.0122 0.7300 355 PE(o-36:5) or PE(p-36:4) 0.41 +/- 0.3 0.48 +/- 0.19 0.63 0.0095 0.1068 0.2625 0.0095 0.7375 360 PE(o-38:5) or PE(p-38:4) 0.43 +/- 0.3 0.52 +/- 0.21 0.61 0.0095 0.1068 0.2625 0.0095 0.7375 366 PHOSPHOCREATINE 0.39 +/- 0.18 0.44 +/- 0.15 0.70 0.0039 0.0613 0.2375 0.0039 0.7625 371 P1(38:4) 1.04 +/- 0.4 0.87 +/- 0.2 0.63 0.0005 0.0186 0.1875 0.0005 0.8125 377 PS(o-18:0_22:6) 0.69 +/- 0.31 0.83 +/- 0.43 1.43 0.0195 0.1515 0.7150 0.0195 0.7150 382 PYRIDOXINE 2.3 +/- 3.89 4.85 +/- 5.78 4.17 0.0067 0.0962 0.7475 0.0067 0.7475 388 SM(42:1) 0.54 +/- 0.18 0.59 +/- 0.16 0.72 0.0032 0.0584 0.2325 0.0032 0.7675 393 SM(42:2) 1.03 +/- 0.47 1.12 +/- 0.47 1.37 0.0283 0.1762 0.7025 0.0283 0.7025 399 SM(44:2) 1.04 +/- 0.28 1.14 +/- 0.35 1.19 0.0491 0.2444 0.6825 0.0491 0.6825 404 TG(46:0) 0.4 +/- 0.08 0.45 +/- 0.22 0.68 0.0375 0.2040 0.3075 0.0375 0.6925 410 TG(47 :0) 0.83 +/- 0.08 0.89 +/- 0.17 0.88 0.0350 0.2020 0.3050 0.0350 0.6950 415 TG(48:2) 0.54 +/- 0.26 0.38 +/- 0.14 0.62 0.0245 0.1653 0.2925 0.0245 0.7075 421 TG(58:9) 1.26 +/- 0.46 1.4 +/- 0.5 1.49 0.0032 0.0584 0.7675 0.0032 0.7675 426 THEOBROMINE 0.12 +/- 0.13 0.26 +/- 0.39 0.36 0.0112 0.1128 0.2675 0.0112 0.7325 432 THYROXINE 1 +/- 0.31 1.17 +/- 0.19 0.66 0.0002 0.0120 0.1725 0.0002 0.8275 437 toluene 0.38 +/- 0.11 0.34 +/- 0.09 1.22 0.0460 0.2389 0.6850 0.0460 0.6850 443 TRIGONELLINE 0.71 +/- 0.84 1.34 +/- 2.15 2.04 0.0430 0.2259 0.6875 0.0430 0.6875 448 TYRAMINE 0.66 +/- 0.25 0.64 +/- 0.13 1.25 0.0211 0.1558 0.7125 0.0211 0.7125
TABLE-US-00019 TABLE 16 Sixteen candidate metabolites that indicated significant AUCs in both the discovery cohort and `confirmatory` cohort. Set #1 AUC Healthy' Chronic Early Stage Direction Subjects Pancreatitis PDAC Set #1 Wilcox Set #2 (Set #1 vs (Mean +/- (Mean +/- (Mean +/- CmpID AUC** T** AUC** Wilcox T** Set #2) StDev) StDev) Stdev) ALPHA-D-GLUCOSE 0.8200 0.0003 0.7178 0.0398 same 1 +/- 0.35 1.63 +/- 1.26 1.59 +/- 0.31 Alpha-N-Phenylacetyl- 0.7075 0.0245 0.7844 0.0072 same 0.45 +/- 0.36 0.93 +/- 0.87 1.12 +/- 1.31 L-glutamine Cer(40:1) 0.1650 0.0002 0.2778 0.0359 same 2.48 +/- 0.89 1.99 +/- 0.83 2.68 +/- 4.42 Cer(42:0) 0.2300 0.0029 0.1867 0.0031 same 0.79 +/- 0.29 0.78 +/- 0.23 0.66 +/- 0.42 Cer(42:1) 0.2800 0.0167 0.2578 0.0222 same 0.79 +/- 0.32 0.9 +/- 0.36 0.66 +/- 0.31 Cer(42:2) 0.2075 0.0012 0.2600 0.0234 same 2.77 +/- 0.89 2.02 +/- 0.5 3.71 +/- 5.85 DG(35:1) 0.2650 0.0103 0.1422 0.0007 same 0.91 +/- 0.17 0.9 +/- 0.22 0.76 +/- 0.16 INDOLE 0.0925 0.0000 0.2800 0.0378 same 2.09 +/- 0.53 1.55 +/- 0.18 1.34 +/- 0.15 Indole-derivative 0.2975 0.0283 0.2622 0.0248 same 0.65 +/- 0.9 0.78 +/- 1.18 0.21 +/- 0.23 LPC(18:0) 0.2725 0.0132 0.2489 0.0177 same 0.38 +/- 0.17 0.44 +/- 0.23 0.24 +/- 0.11 LPC(20:3) 0.3125 0.0430 0.1756 0.0022 same 0.46 +/- 0.29 0.54 +/- 0.33 0.32 +/- 0.14 N8-ACETYLSPERMIDINE 0.7600 0.0043 0.7133 0.0441 same 0.98 +/- 0.28 0.93 +/- 0.34 1.76 +/- 1.04 N-acetyllactosamine 0.6925 0.0375 0.7244 0.0341 same 0.6 +/- 0.14 0.73 +/- 0.14 0.89 +/- 0.26 SM(42:1) 0.2325 0.0032 0.2111 0.0063 same 0.81 +/- 0.24 0.73 +/- 0.27 0.54 +/- 0.18 THYROXINE 0.1725 0.0002 0.2867 0.0441 same 1.99 +/- 0.32 1.31 +/- 0.39 1 +/- 0.31 DIACETYLSPERMINE 0.7325 0.0112 0.7843 0.0069 same 0.85 +/- 0.13 0.93 +/- 0.15 1.18 +/- 0.43 2-sided 1-sided Fold 2-sided 1-sided Late Stage Fold Change Mann- Mann- Change Mann- Mann- Set #1 PDAC Mean (early stage Whitney U Whitney U (CP vs Whitney U Whitney U CmpID Stdev PDAC vs CP) Test Test Healthy) Test Test Selected ALPHA-D-GLUCOSE 2.22 +/- 1.22 0.97 0.1431 0.0716 1.63 0.0887 0.0444 Excluded Alpha-N-Phenylacetyl- 1.36 +/- 0.51 1.21 0.9118 0.4559 2.08 0.2150 0.1075 Excluded L-glutamine Cer(40:1) 0.95 +/- 0.27 1.35 0.1903 0.0952 0.80 0.3104 0.1552 Excluded Cer(42:0) 0.51 +/- 0.24 0.84 0.1051 0.0526 0.99 0.7796 0.3898 Excluded Cer(42:1) 0.53 +/- 0.24 0.74 0.1230 0.0615 1.14 0.4285 0.2143 Excluded Cer(42:2) 1.47 +/- 0.43 1.83 0.1903 0.0952 0.73 0.0288 0.0144 Excluded DG(35:1) 0.77 +/- 0.11 0.84 0.1431 0.0716 0.99 0.7796 0.3898 Excluded INDOLE 1.21 +/- 0.21 0.87 0.0232 0.0116 0.74 0.0068 0.0034 Excluded Indole-derivative 0.42 +/- 0.85 0.27 0.0753 0.0376 1.19 0.8928 0.4464 Included LPC(18:0) 0.26 +/- 0.1 0.55 0.0355 0.0177 1.16 0.4727 0.2364 Included LPC(20:3) 0.32 +/- 0.17 0.59 0.1230 0.0615 1.18 0.5678 0.2839 Included N8-ACETYLSPERMIDINE 1.59 +/- 0.7 1.89 0.0630 0.0315 0.95 0.5678 0.2839 Included N-acetyllactosamine 0.74 +/- 0.16 1.22 0.1903 0.0952 1.22 0.0627 0.0314 Excluded SM(42:1) 0.59 +/- 0.16 0.73 0.0630 0.0315 0.90 0.8928 0.4464 Excluded THYROXINE 1.17 +/- 0.19 0.76 0.0892 0.0446 0.66 0.0007 0.0004 Excluded DIACETYLSPERMINE 1 +/- 0.24 1.89 0.0627 0.0314 1.10 0.1220 0.0610 Included
TABLE-US-00020 TABLE 17 Selected metabolite marker performance in discovery and confirmatory cohorts. Discovery Set Confirmatory Set Combined Set Metabolite FC.sup.1 AUC p-value.sup.& FC.sup.2 AUC p-value.sup.& FC.sup.3 AUC p-value.sup.& Indole-derivative.sup.# 0.44 0.7 0.0142 0.46 0.74 0.0124 0.54 0.61 0.1596 LPC (18:0).sup.# 0.62 0.73 0.0066 0.63 0.75 0.0089 0.59 0.76 0.0014 LPC (20:3).sup.# 0.64 0.69 0.0215 0.56 0.82 0.0011 0.65 0.68 0.0453 ACETYLSPERMIDINE 1.75 0.76 0.0022 1.38 0.71 0.0221 1.81 0.79 <0.001 DIACETYLSPERMINE 1.23 0.73 0.0056 1.06 0.78 0.0035 1.25 0.8 <0.001 .sup.1fold change depicting PDAC (n = 20) relative to controls (10 healthy subjects; 10 subjects with chronic pancreatitis) .sup.2fold change depicting PDAC (n = 9) relative to BPD (n = 50) .sup.3fold change depicting PDAC (n = 29) relative to Healthy subjects (n = 10) .sup.#AUCs <0.5 are flipped .sup.&one-tailed p-values, specify test Abbrev. LPC: lysophosphatidylcholine
[0191] Next, a biomarker panel for PDAC was developed based on a logistic regression model. PDAC cases (n=29) from Set #1 and #2 were combined and evaluated against healthy subjects (n=10) from Set #1 (FIG. 7). Estimated coefficients as obtained by a logistic regression model that incorporates a log it link function are provided in Table 18. Individual performances of the 5 metabolite markers for the combined dataset are provided in Table 17. In comparison of PDAC with healthy subjects, the resulting panel of AcSperm+DAS+LPC (18:0)+LPC (20:3)+indole-derivative yielded an AUC of 0.90 (95% C.I.=0.818-0.989), exhibiting 69% sensitivity at 99% specificity (FIG. 9A). Performance of the metabolite panel for differentiating PDAC from BPD (chronic pancreatitis and low-grade cysts) yielded an AUC of 0.69 (95% C.I.=0.557-0.819) with 41% sensitivity at 95% specificity; however, the greatest achieved AUC was obtained with the indole-derivative alone (AUC=0.833) (FIG. 9B).
Testing of Metabolite Biomarker Panel in Two Independent Sets of Resectable PDAC Plasma Samples
[0192] Blinded validation of the 5 metabolites individually and as a panel was performed in an independent set of plasma samples consisting of 39 resectable PDAC cases and 82 matched healthy controls (Test Set #1). All 5 biomarkers were significantly different (one-tailed p<0.001) in PDAC cases as compared to healthy controls with individual AUCs ranging from 0.73 to 0.84 Table 19). All 5 metabolites indicated the same direction of change (increased/decreased) as observed in the initial cohorts. The logistic regression model for the five-metabolite panel yielded an AUC of 0.89 (95% C.I.=0.828-0.956); exhibiting 67% sensitivity at 95% specificity (FIG. 10 and Table 19).
TABLE-US-00021 TABLE 18 Estimated coefficients for the 5-metabolite biomarker panel. Coefficients were obtained by a logistic regression model incorporating the logit link function. Estimated Coefficients: Estimate SE tStat pValue (Intercept) -2.2078 3.5256 -0.6262 0.53118 N8 2.1722 1.3954 1.5566 0.11955 lysoPC180 -6.768 5.9629 -1.135 0.25637 lysoPC203 -1.4483 4.148 -0.34916 0.72697 indole3 0.17042 -0.58436 -0.29163 0.77057 DAS 3.5449 3.3304 1.0644 0.28715 39 observations; 33 error degrees of freedom Dispersion: 1 Chi.sup.2-statistic vs. constant model: 18.2, p-value = 0.00266
TABLE-US-00022 TABLE 19 Performance of individual metabolite markers and metabolite-panel in validation cohorts. Test Set #1 95% p- 95% p- Test Set #2 Metabolite AUC# C.I.# values.sup.& Specificity* Sensitivity** AUC# C.I.# values.sup.& Specificity* Sensitivity** Indole-derivative 0.73 0.631-0.822 <0.001 11 23 0.70 0.587-0.816 <0.001 19 15 LPC (18:0) 0.84 0.764-0.920 <0.001 26 51 0.69 0.561-0.815 0.002 9 0 LPC (20:3) 0.84 0.757-0.925 <0.001 11 49 0.73 0.622-0.841 <0.001 31 10 ACETYLSPERMIDINE 0.76 0.659-0.852 <0.001 28 33 0.60 0.460-0.735 0.083 1 5 DIACETYLSPERMINE 0.80 0.712-0.890 <0.001 28 51 0.60 0.445-0.754 0.104 0 5 5-Marker Panel 0.89 0.828-0.996 <0.001 43 67 0.70 0.573-0.833 0.001 19 10 #AUCs <0.5 are flipped *% specificity at 95% sensitivity **% sensitivity at 95% specificity .sup.&one-tailed p-values for corresponding AUCs Abbrev. LPC: lysophosphatidylcholine
[0193] The ability of the individual metabolites and panel to distinguish PDAC from BPD (low grade cysts) was tested in a second cohort (Test Set #2) consisting of 20 resectable PDAC and 102 subjects diagnosed with BPD derived from the same study as the confirmatory set (Set #2) but analyzed separately. Individual classification performances ranged from 0.60-0.73 (Table 2). The fixed logistic regression model for the five-metabolite panel yielded an AUC of 0.70 (95% C.I.=0.573-0.833); exhibiting 15% sensitivity at 95% specificity (FIG. 10B and Table 19).
Combination of Metabolite- and Protein-Markers Improves Classification Performances
[0194] Previously, a protein-derived biomarker panel for early-stage PDAC was developed, which was validated in the same independent cohort (Test Set #1) described herein. It was therefore interrogated whether a hyper-panel consisting of the metabolite- and protein-panel would improve classification performance as compared to the protein-panel alone. The AUC of hyper-panel in the training set (29 PDAC versus 10 healthy controls) yielded an AUC of 0.97 with 95% CI (0.9278-1.000). The sensitivity of the metabolite panel alone for FPR values of 1% is estimated to be 0.6897. This estimate is improved statistically significantly to 0.8621 when considering the hyper-panel in the training set (corresponding one-tailed p-value=0.0390). Comparison of the protein panel (AUC=0.95) and the hyper-panel (AUC=0.97) in terms of AUCs in the training set, yielding a p-value of 0.1074 (FIG. 11A). The corresponding estimates during blinded validation (Test Set #1) for the protein panel yielded an AUC of 0.86 whereas the hyper-panel yielded an AUC of 0.92 with a corresponding one-tailed p-value for comparison equal to 0.0236 (FIG. 11B). This demonstrates an overall statistically significant improvement of the performance of the hyper-panel compared to the protein panel, indicating that the metabolite panel and the protein panel are complementary.
PDAC Secrete Acetylated Polyamines
[0195] To determine whether elevations in plasma AcSperm and DAS were associated with disease status, cell lysates and serum-free conditioned media from 5 PDAC cell lines (CFPAC-1, MiaPaCa, SU8686, PANC03-27 and SW1990) were analyzed. Metabolomic analysis of cell lysates revealed detectable levels of AcSperm and DAS in all 5 cell lines. Analysis of conditioned media indicated positive rates of AcSperm accumulation in all 5 cell lines whereas positive rates of DAS accumulation were observed in 3 of the 5 cell lines (FIG. 12A). Exploration of mRNA expression of polyamine-related enzymes in the Badea dataset indicated significant (paired T-test) PDAC-associated elevations in spermine synthase (SMS) and spermidine/spermine acetyltransferase (SAT1) as compared to adjacent control tissue whereas spermidine synthase (SRM), polyamine oxidase (PAOX) and spermine oxidase (SMOX) were significantly reduced (FIG. 11B), collectively suggesting increased acetylation of polyamines and subsequent secretion rather than their oxidation.
PDAC Catabolize Extracellular Lysophosphatidylcholines
[0196] To determine whether PDAC cells catabolize/scavenge extracellular lipids, the lipid composition of serum-containing media from PANC1 and Su8686 cells was examined at 24, 48, and 72 hours post conditioning. The analysis indicated time-dependent reductions in several lysophospholipids (FIG. 13) including LPC (18:0) and LPC (20:3) (FIG. 12A). Concomitantly, glycerophosphocholine, a degradation product of LPCs, exhibited a time-dependent increase in conditioned media (FIG. 12B) collectively implicating active catabolism of extracellular LPCs. Evaluation of mRNA expression for enzymes involved in the catabolism of phospholipids and lysophospholipids (FIG. 12C) indicated significant (2-tailed Mann-Whitney U-test) PDAC-associated elevations in soluble phospholipase A2-X (PLA2G10), autotaxin (ENPP2) and lysophospholipase LYPLA1 relative to adjacent control tissue in the Badea dataset (FIG. 12D).
Discussion
[0197] The primary objective of this study was to identify and validate a plasma metabolite-derived biomarker panel for resectable PDAC. Using an untargeted metabolomics approach, a 5-marker metabolite biomarker panel was identified and validated that is capable of distinguishing resectable PDAC cases from healthy individuals yielding an AUC of 0.89 in the validation cohort (Test Set #1). It was equally demonstrated that a hyper-panel consisting of the metabolite- and previously identified protein-panel significantly improves classification performances compared to the protein-panel alone (AUC: 0.92 vs 0.86; p: 0.024; Test Set #1) highlighting the complementary nature of the metabolite panel.
[0198] Given the low prevalence of PDAC, the multi-marker signature would be best suited for screening programs targeting high-risk subjects rather than the average risk population. These include individuals over age 50 years with new-onset diabetes mellitus, asymptomatic kindred of high-risk families, subjects with chronic pancreatitis, and patients incidentally diagnosed with mucin-secreting cysts of the pancreas. The metabolite-biomarker panel was able to significantly differentiate PDAC from low-grade pancreatic cyst in two separate sample sets, yielding AUC equal to 0.69 and 0.70 in the confirmation set and in test set #2, respectively.
[0199] Notably, no differences in plasma branched-chain amino acids (BCAA) were observed between cases and respective controls in contrast to previous findings. However, it should be noted that the predictive value of BCAAs were most prominent 2-5 years prior to diagnosis with levels returning towards baseline 0-2 years prior to diagnosis, consistent with observations of no differences in plasma BCAAs in samples taken at the time of diagnosis.
[0200] Altered polyamine metabolism has long been linked to tumorigenesis and hyper-proliferative disorders, being intimately involved in cell cycle progression. Polyamine synthesis is regulated by the rate-limiting enzymes ODC1 and AMD1 whereas their catabolism is regulated by SAT1. Previous findings indicated increased abundances of putrescine and AcSperm in pancreatic carcinomas as compared to histologically unaffected pancreas. Conversely, it was previously found that many polyamines including AcSperm were elevated in serum of cases as compared to healthy controls. These findings are in concordance with elevated mRNA expression of SAT1 in PDAC relative to adjacent control tissue in the Badea dataset and detection of AcSperm and DAS in cell lysates and their concurrent accumulation in conditioned media (FIG. 11). The findings described in this study, and those of others, indicate amplification of polyamine catabolism, a notion that is reflected in plasmas of subjects with PDAC. Notably, the elevation of DAS is not uniquely attributed to pancreatic cancer, inherently suggesting a more general role in its broader utility as a screening marker for cancer.
[0201] Previous studies indicated that plasma LPCs are significantly lower in PDAC relative to healthy controls or subjects with chronic pancreatitis, consistent with the findings of this study. The cell line data indicated that PDAC cells catabolize lysophospholipids, a notion that is supported by gene expression data in the Badea dataset (FIG. 12), thereby providing plausibility for the observed reduction in plasma LPCs in PDAC subjects. Despite this, PDAC alone cannot explain the reduction in plasma LPC levels entirely, particularly in early stages of disease. Metastases to the liver, a crucial organ that regulates lipid metabolism, have been shown to occur at early stages of pancreatic cancer. Thus, it is plausible that reductions in plasma LPCs may be a reflection of both increased catabolism by cancerous cells as well as altered liver function that co-occurs with disease, a concept that will require additional investigation independent of the current study.
[0202] In conclusion, a metabolite-derived biomarker panel for early-stage PDAC was developed and validated that complements the previously identified protein-based biomarker panel.
Other Embodiments
[0203] The detailed description set-forth above is provided to aid those skilled in the art in practicing the present disclosure. However, the disclosure described and claimed herein is not to be limited in scope by the specific embodiments disclosed herein because these embodiments are intended as illustration of several aspects of the disclosure. Any equivalent embodiments are intended to be within the scope of this disclosure. Indeed, various modifications of the disclosure in addition to those shown and described herein will become apparent to those skilled in the art from the foregoing description, which do not depart from the spirit or scope of the present inventive discovery. Such modifications are also intended to fall within the scope of the appended claims.
Sequence CWU 1
1
31200PRTHomo sapiens 1Met Ala Pro Phe Glu Pro Leu Ala Ser Gly Ile
Leu Leu Leu Leu Trp1 5 10 15Leu Ile Ala Pro Ser Arg Ala Cys Thr Cys
Val Pro Pro His Pro Gln 20 25 30Thr Ala Phe Cys Asn Ser Asp Leu Val
Ile Arg Ala Lys Phe Val Gly 35 40 45Thr Pro Glu Val Asn Gln Thr Thr
Leu Tyr Gln Arg Tyr Glu Ile Lys 50 55 60Met Thr Lys Met Tyr Lys Gly
Phe Gln Ala Leu Gly Asp Ala Ala Asp65 70 75 80Ile Arg Phe Val Tyr
Thr Pro Ala Met Glu Ser Val Cys Gly Tyr Phe 85 90 95His Arg Ser His
Asn Arg Ser Glu Glu Phe Leu Ile Ala Gly Lys Leu 100 105 110Gln Asp
Gly Leu Leu His Ile Thr Thr Cys Ser Phe Val Ala Pro Trp 115 120
125Asn Ser Leu Ser Leu Ala Gln Arg Arg Gly Phe Thr Lys Thr Tyr Thr
130 135 140Val Gly Cys Glu Glu Cys Thr Val Phe Pro Cys Leu Ser Ile
Pro Cys145 150 155 160Lys Leu Gln Ser Gly Thr His Cys Leu Trp Thr
Asp Gln Leu Leu Gln 165 170 175Gly Ser Glu Lys Gly Phe Gln Ser Arg
His Leu Ala Cys Leu Pro Arg 180 185 190Glu Pro Gly Leu Cys Thr Trp
Gln 195 2002347PRTHomo sapiens 2Met Ser Ser Trp Ser Arg Gln Arg Pro
Lys Ser Pro Gly Gly Ile Gln1 5 10 15Pro His Val Ser Arg Thr Leu Phe
Leu Leu Leu Leu Leu Ala Ala Ser 20 25 30Ala Trp Gly Val Thr Leu Ser
Pro Lys Asp Cys Gln Val Phe Arg Ser 35 40 45Asp His Gly Ser Ser Ile
Ser Cys Gln Pro Pro Ala Glu Ile Pro Gly 50 55 60Tyr Leu Pro Ala Asp
Thr Val His Leu Ala Val Glu Phe Phe Asn Leu65 70 75 80Thr His Leu
Pro Ala Asn Leu Leu Gln Gly Ala Ser Lys Leu Gln Glu 85 90 95Leu His
Leu Ser Ser Asn Gly Leu Glu Ser Leu Ser Pro Glu Phe Leu 100 105
110Arg Pro Val Pro Gln Leu Arg Val Leu Asp Leu Thr Arg Asn Ala Leu
115 120 125Thr Gly Leu Pro Pro Gly Leu Phe Gln Ala Ser Ala Thr Leu
Asp Thr 130 135 140Leu Val Leu Lys Glu Asn Gln Leu Glu Val Leu Glu
Val Ser Trp Leu145 150 155 160His Gly Leu Lys Ala Leu Gly His Leu
Asp Leu Ser Gly Asn Arg Leu 165 170 175Arg Lys Leu Pro Pro Gly Leu
Leu Ala Asn Phe Thr Leu Leu Arg Thr 180 185 190Leu Asp Leu Gly Glu
Asn Gln Leu Glu Thr Leu Pro Pro Asp Leu Leu 195 200 205Arg Gly Pro
Leu Gln Leu Glu Arg Leu His Leu Glu Gly Asn Lys Leu 210 215 220Gln
Val Leu Gly Lys Asp Leu Leu Leu Pro Gln Pro Asp Leu Arg Tyr225 230
235 240Leu Phe Leu Asn Gly Asn Lys Leu Ala Arg Val Ala Ala Gly Ala
Phe 245 250 255Gln Gly Leu Arg Gln Leu Asp Met Leu Asp Leu Ser Asn
Asn Ser Leu 260 265 270Ala Ser Val Pro Glu Gly Leu Trp Ala Ser Leu
Gly Gln Pro Asn Trp 275 280 285Asp Met Arg Asp Gly Phe Asp Ile Ser
Gly Asn Pro Trp Ile Cys Asp 290 295 300Gln Asn Leu Ser Asp Leu Tyr
Arg Trp Leu Gln Ala Gln Lys Asp Lys305 310 315 320Met Phe Ser Gln
Asn Asp Thr Arg Cys Ala Gly Pro Glu Ala Val Lys 325 330 335Gly Gln
Thr Leu Leu Ala Val Ala Lys Ser Gln 340 3453151PRTHomo sapiens 3Met
Arg Phe Leu Ala Ala Thr Phe Leu Leu Leu Ala Leu Ser Thr Ala1 5 10
15Ala Gln Ala Glu Pro Val Gln Phe Lys Asp Cys Gly Ser Val Asp Gly
20 25 30Val Ile Lys Glu Val Asn Val Ser Pro Cys Pro Thr Gln Pro Cys
Gln 35 40 45Leu Ser Lys Gly Gln Ser Tyr Ser Val Asn Val Thr Phe Thr
Ser Asn 50 55 60Ile Gln Ser Lys Ser Ser Lys Ala Val Val His Gly Ile
Leu Met Gly65 70 75 80Val Pro Val Pro Phe Pro Ile Pro Glu Pro Asp
Gly Cys Lys Ser Gly 85 90 95Ile Asn Cys Pro Ile Gln Lys Asp Lys Thr
Tyr Ser Tyr Leu Asn Lys 100 105 110Leu Pro Val Lys Ser Glu Tyr Pro
Ser Ile Lys Leu Val Val Glu Trp 115 120 125Gln Leu Gln Asp Asp Lys
Asn Gln Ser Leu Phe Cys Trp Glu Ile Pro 130 135 140Val Gln Ile Val
Ser His Leu145 150
D00001
D00002
D00003
D00004
D00005
D00006
D00007
D00008
D00009
D00010
D00011
D00012
D00013

D00014

D00015

D00016

D00017
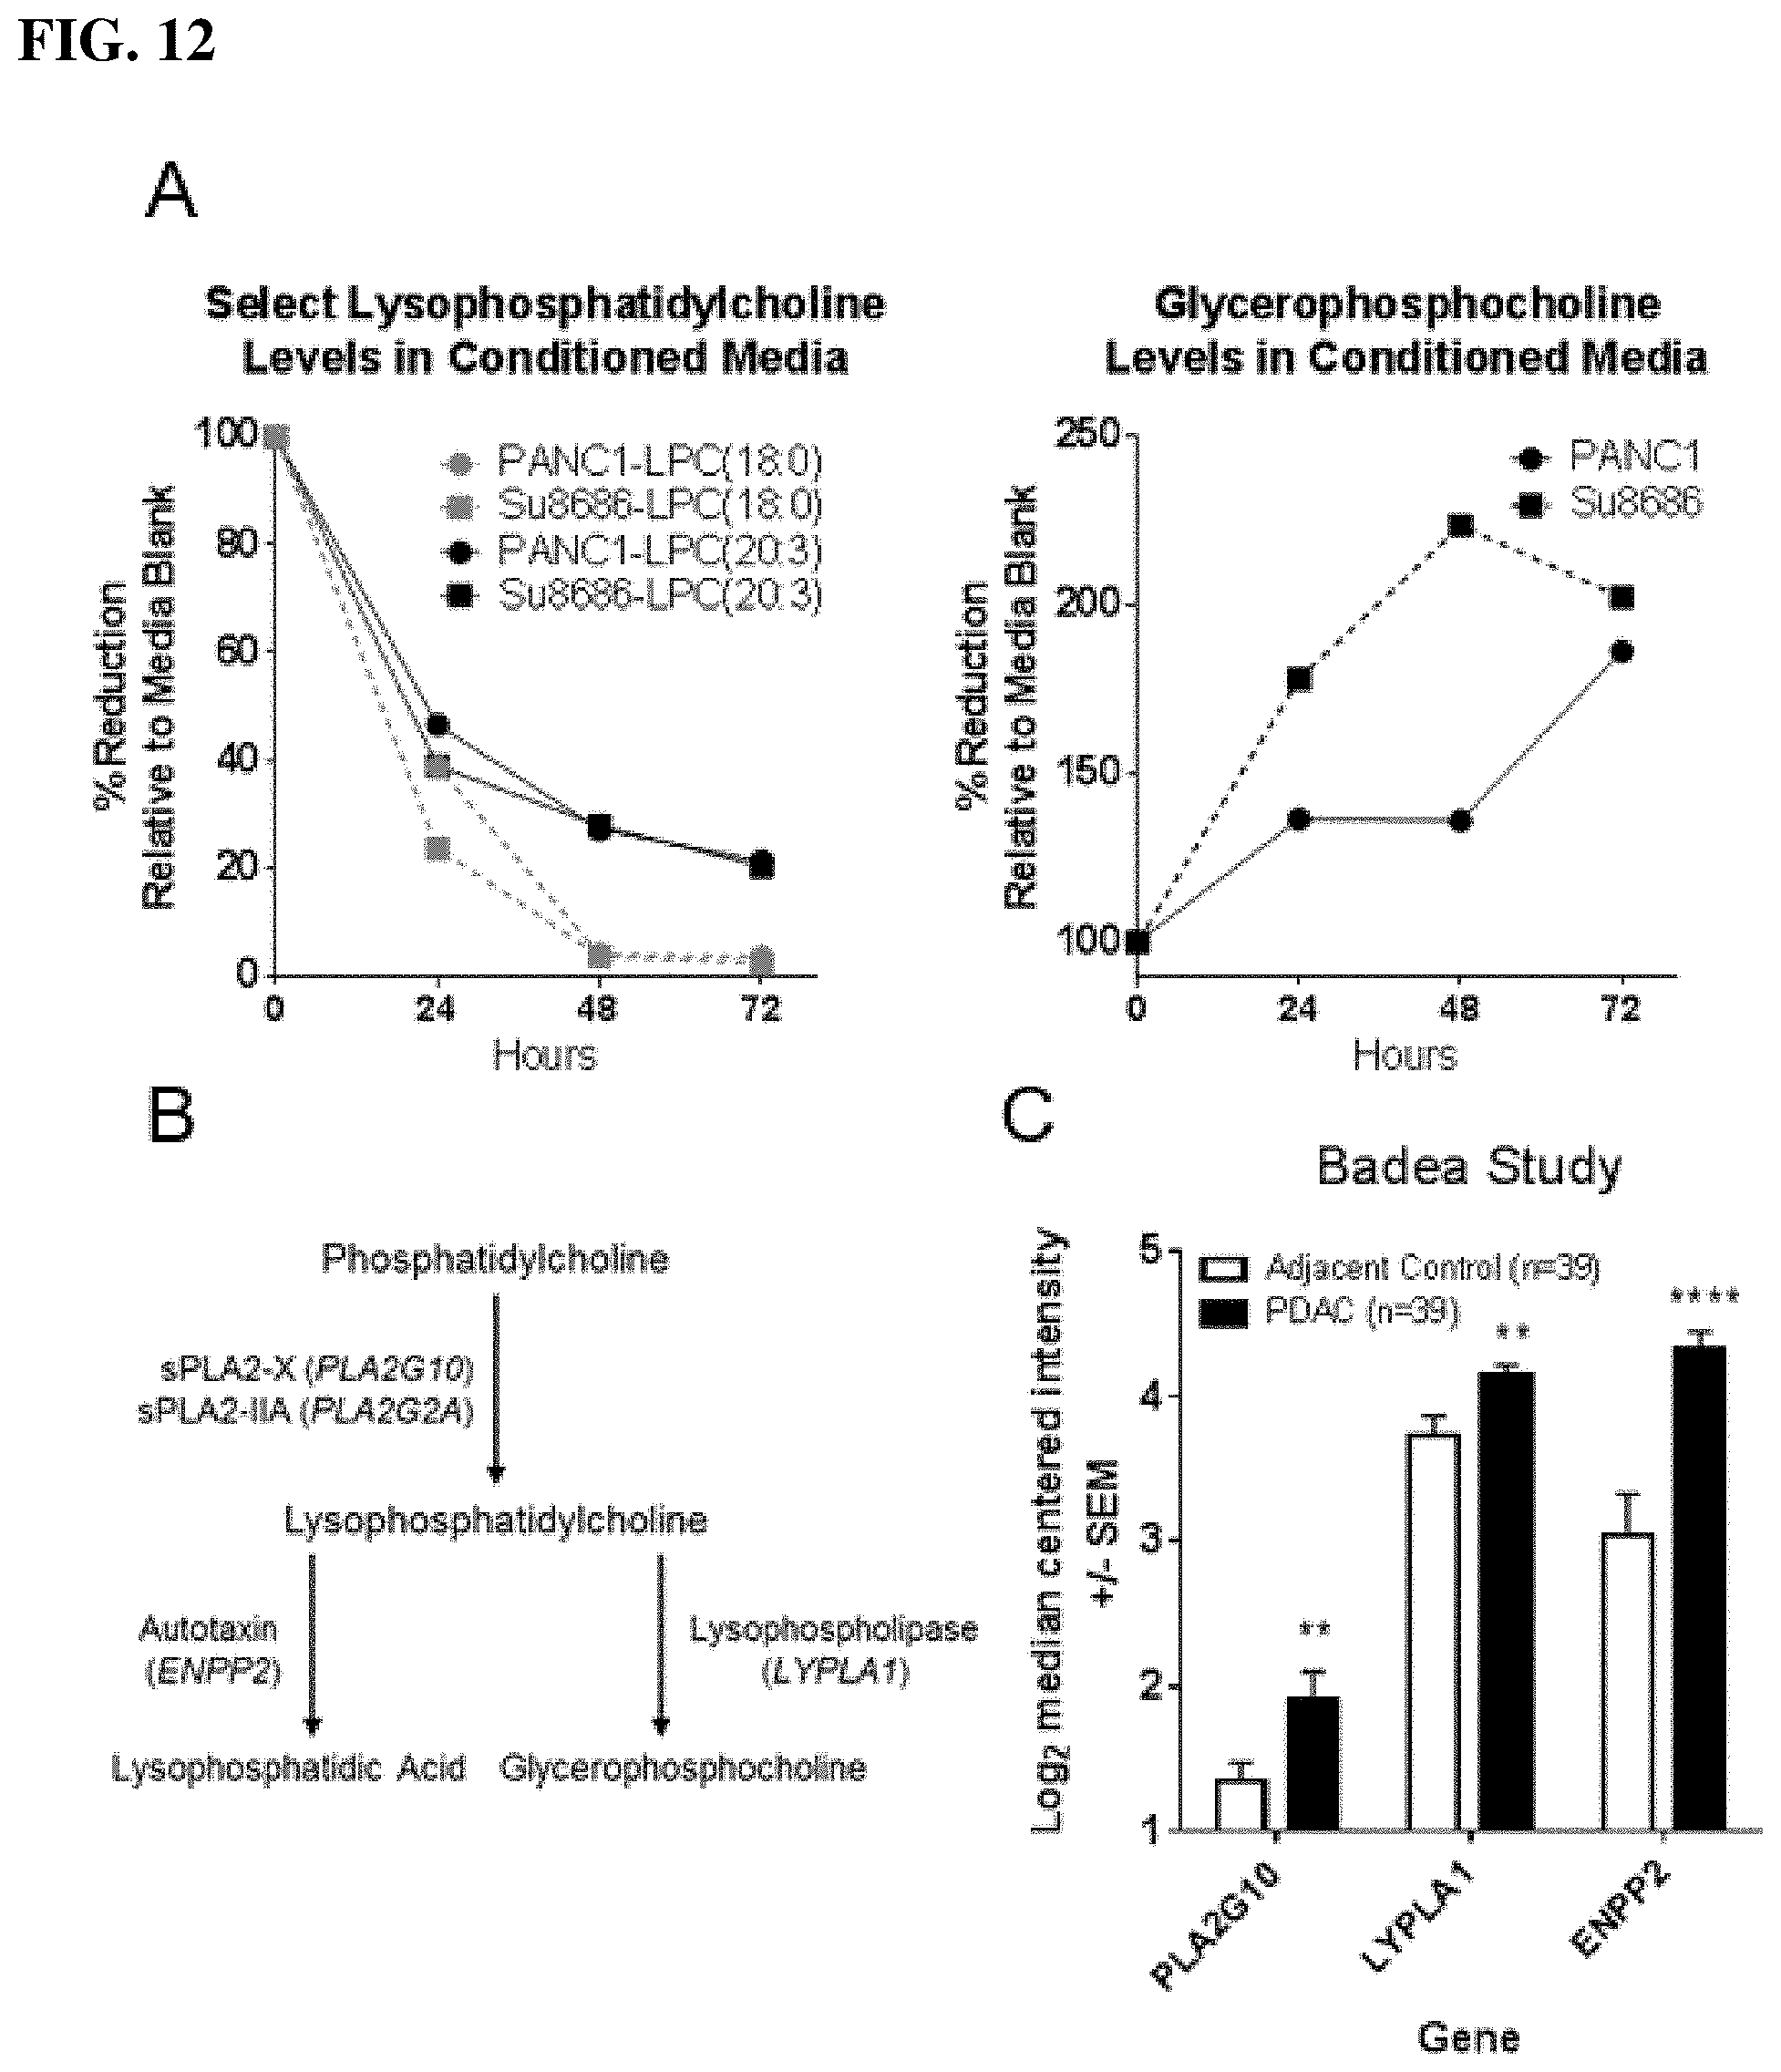
D00018

D00019

S00001
XML
uspto.report is an independent third-party trademark research tool that is not affiliated, endorsed, or sponsored by the United States Patent and Trademark Office (USPTO) or any other governmental organization. The information provided by uspto.report is based on publicly available data at the time of writing and is intended for informational purposes only.
While we strive to provide accurate and up-to-date information, we do not guarantee the accuracy, completeness, reliability, or suitability of the information displayed on this site. The use of this site is at your own risk. Any reliance you place on such information is therefore strictly at your own risk.
All official trademark data, including owner information, should be verified by visiting the official USPTO website at www.uspto.gov. This site is not intended to replace professional legal advice and should not be used as a substitute for consulting with a legal professional who is knowledgeable about trademark law.