Method For Predicting The Outcome Of A Treatment With Aflibercept Of A Patient Suspected To Suffer From A Cancer
CHIRON-BLONDEL; Marielle ; et al.
U.S. patent application number 16/663000 was filed with the patent office on 2020-05-21 for method for predicting the outcome of a treatment with aflibercept of a patient suspected to suffer from a cancer. The applicant listed for this patent is SANOFI. Invention is credited to Marielle CHIRON-BLONDEL, Diether LAMBRECHTS, Emmanuelle MAGHERINI, Vincent THUILLIER.
| Application Number | 20200157181 16/663000 |
| Document ID | / |
| Family ID | 51220534 |
| Filed Date | 2020-05-21 |
| United States Patent Application | 20200157181 |
| Kind Code | A1 |
| CHIRON-BLONDEL; Marielle ; et al. | May 21, 2020 |
METHOD FOR PREDICTING THE OUTCOME OF A TREATMENT WITH AFLIBERCEPT OF A PATIENT SUSPECTED TO SUFFER FROM A CANCER
Abstract
The present invention concerns the use of interleukin-8 (IL-8) as a biomarker for predicting the outcome of the treatment with aflibercept, or ziv-aflibercept of a patient suspected to suffer from a cancer.
| Inventors: | CHIRON-BLONDEL; Marielle; (Paris, FR) ; LAMBRECHTS; Diether; (Leuven, BE) ; MAGHERINI; Emmanuelle; (Ris Orangis, FR) ; THUILLIER; Vincent; (Bures sur Yvette, FR) | ||||||||||
| Applicant: |
|
||||||||||
|---|---|---|---|---|---|---|---|---|---|---|---|
| Family ID: | 51220534 | ||||||||||
| Appl. No.: | 16/663000 | ||||||||||
| Filed: | October 24, 2019 |
Related U.S. Patent Documents
| Application Number | Filing Date | Patent Number | ||
|---|---|---|---|---|
| 15408827 | Jan 18, 2017 | 10501523 | ||
| 16663000 | ||||
| PCT/EP2015/066262 | Jul 16, 2015 | |||
| 15408827 | ||||
| Current U.S. Class: | 1/1 |
| Current CPC Class: | G01N 2333/5421 20130101; A61P 35/00 20180101; A61P 1/00 20180101; G01N 2800/52 20130101; A61P 35/04 20180101; A61K 31/513 20130101; G01N 33/57419 20130101; A61K 38/00 20130101; A61K 9/0019 20130101; A61K 31/4745 20130101; C07K 14/71 20130101; C07K 2319/30 20130101; A61K 31/519 20130101; A61K 31/282 20130101 |
| International Class: | C07K 14/71 20060101 C07K014/71; A61K 31/519 20060101 A61K031/519; A61K 31/513 20060101 A61K031/513; A61K 31/4745 20060101 A61K031/4745; A61K 31/282 20060101 A61K031/282; A61K 9/00 20060101 A61K009/00; G01N 33/574 20060101 G01N033/574 |
Foreign Application Data
| Date | Code | Application Number |
|---|---|---|
| Jul 18, 2014 | EP | 14306172.9 |
Claims
1-25. (canceled)
26. A method of determining IL-8 expression level that is indicative of therapeutic efficacy in a patient with cancer, comprising subjecting a biological sample from the patient to at least one assay to measure the IL-8 expression level in the biological sample, and comparing the measured IL-8 expression level to a reference level of IL-8, wherein if the measured IL-8 expression level is lower than the reference level, then the IL-8 expression level of the patient with cancer is indicative of therapeutic efficacy.
27. The method of claim 26, wherein the patient has colon cancer, colorectal cancer, or rectal cancer.
28. The method of claim 27, wherein the colon cancer is metastatic colon cancer.
29. The method of claim 27, wherein the colorectal cancer is metastatic colorectal cancer.
30. The method of claim 27, wherein the rectal cancer is metastatic rectal cancer.
31. The method of claim 26, wherein the reference level of IL-8 is between about 10 and about 30 pg/mL.
32. The method of claim 26, wherein the reference level of IL-8 is about 19 pg/mL.
33. The method of claim 26, wherein the biological sample is selected from the group consisting of blood, serum and plasma.
34. The method of claim 26, wherein the IL-8 level is a circulating level.
35. The method of claim 26, wherein the patient has previously been treated with oxaliplatin or bevacizumab.
36. A method of determining IL-8 expression level in a patient with cancer, comprising subjecting a biological sample from the patient to at least one assay to measure the IL-8 expression level in the biological sample, and comparing the measured IL-8 expression level to a reference level of IL-8.
37. The method of claim 36, wherein the patient has colon cancer, colorectal cancer, or rectal cancer.
38. The method of claim 37, wherein the colon cancer is metastatic colon cancer.
39. The method of claim 37, wherein the colorectal cancer is metastatic colorectal cancer.
40. The method of claim 37, wherein the rectal cancer is metastatic rectal cancer.
41. The method of claim 36, wherein the reference level of IL-8 is between about 10 and about 30 pg/mL.
42. The method of claim 36, wherein the reference level of IL-8 is about 19 pg/mL.
43. The method of claim 36, wherein the biological sample is selected from the group consisting of blood, serum and plasma.
44. The method of claim 36, wherein the IL-8 level is a circulating level.
45. The method of claim 36, wherein the patient has previously been treated with oxaliplatin or bevacizumab.
46. The method of claim 36, wherein the reference level of IL-8 is the expression level of IL-8 in a subject without cancer.
Description
CROSS-REFERENCE TO RELATED APPLICATIONS
[0001] This application is a continuation of U.S. patent application Ser. No. 15/408,827, which is a continuation of International Patent Application No. PCT/EP2015/066262, filed Jul. 16, 2015, which claims priority to European Patent Application No. 14306172.9, filed Jul. 18, 2014, the entire disclosures of which are hereby incorporated herein by reference.
BACKGROUND OF THE INVENTION
Field of the Invention
[0002] The present invention concerns the use of interleukin 8 (IL8) as a biomarker for predicting the outcome of the treatment with aflibercept, or ziv-aflibercept, of a patient suspected to suffer from cancer.
[0003] Aflibercept, or ziv-aflibercept, also referred to as VEGFR1R2-Fc.DELTA.C1 Flt1D2.Flk1D3.Fc.DELTA.C1 or AVE0005, is a homo dimer protein, with each dimer comprising two identical monomers, each of which is a fusion protein comprising the signal sequence of VEGFR1 fused to the D2 Ig domain of the VEGFR1 receptor, itself fused to the D3 Ig domain of the VEGFR2 receptor, in turn fused to the Fc domain of IgG1.
[0004] The protein chain is glycosylated, with N-acetyl-glucosamine, fucose, galactose, mannose and sialic acids contributing to the carbohydrate structures. The N-linked oligosaccharides consist of mainly bi-antennary structures with zero, one or two terminal sialic acids. The monomer has the amino acid sequence SEQ ID No 1.
[0005] The U.S. Food and Drug Administration (FDA) already approved aflibercept under the trade name EYLEA.RTM. for the treatment of patients with neovascular (wet) age-related macular degeneration (AMD). In particular, EYLEA.RTM. is the trade name for aflibercept as generated, processed and formulated for intravitreal injection.
[0006] At the time of registration of aflibercept (zaltraP) for cancer indication, and In light of aflibercept's approved use in treating AMD, the FDA requested that a different name (ziv-aflibercept) be given for the compound's use in the treatment of cancer. Thus, ziv-aflibercept is the United States Adopted Name (USAN) accepted by FDA to designate a pharmaceutical composition comprising aflibercept as generated, processed and formulated for injection via intravenous infusion. Ziv-aflibercept has been approved by the FDA for sale under the tradename ZALTRAP.RTM. for the treatment of metastatic colorectal cancer (mCRC).
[0007] The European Medicines Agency (EMA) approved zaltrap as well however did not request separate names for the compound. Thus, in the European Union the name "aflibercept" is used regardless of the indication.
[0008] ZALTRAP.RTM. and EYLEA.RTM. are obtained by slightly different processes. They both contain aflibercept or ziv-aflibercept, but the ratio of aggregates of aflibercept or ziv-aflibercept is slightly different in ZALTRAP.RTM. and EYLEA.RTM..
[0009] ZALTRAP.RTM. approval was based on data obtained from the VELOUR trial--a multicenter, randomized, placebo-controlled phase III trial, which compared the efficacy of aflibercept versus placebo in combination with the FOLFIRI regimen for patients with mCRC previously treated with an oxaliplatin containing regimen.
[0010] AFFIRM, an open-label, non-comparative, phase II study, was conducted to assess the combination of aflibercept and modified FOLFOX6 (mFOLFOX6) given as first-line therapy in patients with mCRC. The primary endpoint was 12-month progression-free survival (PFS) whereas exploration of biomarkers was among the secondary objectives.
[0011] In an attempt to understand the key factors associated with aflibercept efficacy and safety, an investigation assessing biomarkers for aflibercept treatment in prospectively collected, tumor tissues and serially sampled plasma from patients participating in the AFFIRM study was conducted.
[0012] Plasma proteins and genetic variants, representing either single nucleotide polymorphisms (SNPs) in angiogenicpathway genes or somatic mutations in key oncogenic drivers of mCRC, were analyzed to assess if they could predict response to aflibercept with respect to PFS. Subsequently, one also assessed whether any of these markers correlated with anti-angiogenic drug-induced AEs, such as gastrointestinal perforation, thrombosis, hypertension and proteinuria.
[0013] Despites the efficacy and the safety of the treatment of cancer by aflibercept it remains a goal to better identify patients who should benefit more from the treatment.
[0014] It has now been discovered that high IL8 levels at baseline correlated with shorter survival times, and patients with increasing levels of IL8 during treatment were more likely to progress. This suggests that patients with high IL8 levels, at baseline or during treatment, are at increased risk of disease progression during aflibercept therapy.
[0015] The role of IL8-in tumor development and progression is suggested in the prior art
[0016] In a phase II trial hepatocellular carcinoma patients received bevacizumab (Boige V, Malka D, Bourredjem A et al. Efficacy, safety, and biomarkers of single-agent bevacizumab therapy in patients with advanced hepatocellular carcinoma. Oncologist 2012; 17: 1063-1072). Circulating endothelial cells (CECs) and plasma cytokines and angiogenic factors (CAFs) were measured at baseline and throughout treatment.
[0017] This study showed that elevated baseline IL-8 (above 80 pg/ml) and IL-6 levels were correlated with both a shorter progression-free survival (PFS) interval and a shorter overall survival (OS) time.
[0018] However the authors cite another study with sorafenib wherein conversely, IL-8 was the only serum cytokine not correlated with the PFS outcome.
[0019] In another phase II trial metastatic colorectal cancer (mCRC) patients received bevacizumab (Kopetz S, Hoff P M, Morris J S et al. Phase II trial of infusional fluorouracil, irinotecan, and bevacizumab for metastatic colorectal cancer: efficacy and circulating angiogenic biomarkers associated with therapeutic resistance. J Clin Oncol 2010; 28: 453-459).
[0020] Levels of 37 CAFs were assessed at baseline, during treatment, and at the time of progressive disease (PD).
[0021] The authors conclude that elevated baseline IL8 above the median value of 3.7 pg/ml was associated with shorter PFS times.
[0022] These results were obtained with bevacizumab which is an antibody. Aflibercept is not an antibody but a fusion protein and thus has a different mode of action.
[0023] It is not possible to predict the effect of a biomarker on the efficiency of cancer treatment by a given drug from results obtained with another drug.
[0024] A fortiori the threshold above or under which a patient is considered as a candidate for treatment cannot be extrapolated between two different drugs.
BRIEF SUMMARY OF THE INVENTION
[0025] The invention relates to the use of interleukin-8 (IL-8) as a biomarker for predicting the outcome of the treatment with aflibercept, or ziv-aflibercept of a patient suspected to suffer from a cancer.
[0026] In one aspect, the present invention provides a method of determining whether a patient suspected to suffer from cancer is a candidate for aflibercept, or ziv-aflibercept therapy for the said cancer comprising the step of subjecting a patient's biological sample to at least one assay to measure at baseline the IL-8 level, wherein when the biological sample IL-8 level is low relative to a reference level of expression of IL-8, the patient is identified as a candidate for therapy for cancer.
[0027] In another aspect, the present invention provides a method of determining whether a patient suspected to suffer from cancer is a candidate for aflibercept, or ziv-aflibercept therapy for the said cancer comprising the step of subjecting a patient's biological sample to at least one assay to measure at baseline the IL-8 level, wherein when the biological sample IL-8 level is high relative to a reference level of expression of IL-8, the patient is identified as not being a candidate for therapy for cancer.
[0028] In an embodiment the reference level of expression of IL-8 is comprised between around 10 and around 30 pg/ml.
[0029] In a further embodiment the reference level of expression of IL-8 is comprised between around 15 and around 25 pg/ml or around 17 and around 21 pg/ml.
[0030] In a further embodiment the reference level of expression of IL-8 is around 18 pg/ml, around 19 pg/ml or around 20 pg/ml.
[0031] The invention relates also to a method for treating a patient with a cancer with aflibercept, or ziv-aflibercept, comprising administering a therapeutically effective amount of aflibercept, or ziv-aflibercept to the patient, wherein the IL-8 level in the patient's biological sample is low relative to a reference level of expression of IL-8.
[0032] The invention further relates to a method of optimizing therapeutic efficacy for treatment of a cancer, comprising the steps of: [0033] a) administering aflibercept, or ziv-aflibercept to a patient suspected to suffer from a cancer; and [0034] b) determining the level of interleukin-8 (IL-8) in patient's biological sample, wherein an increase of the interleukin-8 (IL-8) level indicates the need to decrease the amount of aflibercept, or ziv-aflibercept in subsequent administrations.
[0035] A further object of the invention is a method of managing the risk to allow a safe use of aflibercept, or ziv-aflibercept in the treatment of a patient suspected to suffer from a cancer, said method comprising the following steps: [0036] a) before beginning of the treatment with aflibercept, or ziv-aflibercept, determining the interleukin-8 (IL-8) level in a biological sample from the patient; [0037] b) along the treatment determining the interleukin-8 (IL-8) level in a biological sample from the patient [0038] c) comparing the interleukin-8 (IL-8) level determined in step (b) with the level determined in step (a), whereby a higher interleukin-8 (IL-8) level in the sample of step (b) compared to that of level in the sample of step (a) indicates that the patient should be closely monitored.
[0039] In an embodiment of one of the methods described above the biological sample is chosen from the group consisting of blood, serum and plasma.
[0040] In an embodiment of one of the methods described above the cancer is a colon cancer, a colorectal cancer or a rectal cancer.
[0041] In a further embodiment of one of the the colorectal cancer is a metastatic colorectal cancer.
[0042] In another embodiment of the invention, the subject is treated with aflibercept and further undergoes a chemotherapeutic treatment with oxaliplatin, 5-fluorouracil (5-FU) and folinic acid (i.e. the FOLFOX treatment), folinic acid, 5-fluorouracil and irinotecan (i.e. the FOLFIRI treatment), or 5-fluorouracil and folinic acid (i.e. the FUFOL or LV5FU2 treatment).
[0043] The chemotherapeutic treatment may combine at least 2, 3, 4, 5, 6, 7, 8, 9, 10 or at most 10, 9, 8, 7, 6, 5, 4, 3, 2 agents, such as e.g. a combination of oxaliplatin, 5-fluorouracil (5-FU) and folinic acid (i.e. the FOLFOX treatment or the modified FOLFOX6 treatment as described in the example below), a combination of folinic acid, 5-fluorouracil and irinotecan (i.e. the FOLFIRI treatment), or a combination of 5-fluorouracil and folinic acid (i.e. the FUFOL or LV5FU2 treatment).
[0044] In this regard the application WO2012146610 relates to a method of treatment of the mCRC by aflibercept, or ziv-aflibercept in combination with FOLFIRI. The content of this application is incorporated by reference.
[0045] In an embodiment of one of the methods described above therapeutically effective amounts of aflibercept, or ziv-aflibercept, oxaliplatin, 5-fluorouracil (5-FU) and folinic acid are administered to said patient.
[0046] In an embodiment of one of the methods described above therapeutically effective amounts of aflibercept, or ziv-aflibercept, folinic acid, 5-fluorouracil (5-FU) and irinotecan are administered to said patient.
[0047] In a further embodiment of one of the methods described above folinic acid at a dosage comprised between about 200 mg/m.sup.2 and about 600 mg/m.sup.2, 5-fluorouracil (5-FU) at a dosage comprised between about 2000 mg/m.sup.2 and about 4000 mg/m.sup.2, irinotecan at a dosage comprised between about 100 mg/m.sup.2 and about 300 mg/m.sup.2 and aflibercept at a dosage comprised between about 1 mg/kg and about 10 mg/kg are administered to patient.
[0048] In a further embodiment of one of the methods described above folinic acid at a dosage of about 400 mg/m.sup.2, 5-fluorouracil (5-FU) at a dosage of about 2800 mg/m.sup.2, irinotecan at a dosage of about 180 mg/m.sup.2 and aflibercept at a dosage of about 4 mg/kg are administered to patient.
[0049] In a further embodiment of one of the methods described above folinic acid is administered intravenously at a dosage of about 400 mg/m.sup.2, 5-fluorouracil (5-FU) is administered intravenously at a dosage of about 2800 mg/m.sup.2, irinotecan is administered intravenously at a dosage of about 180 mg/m.sup.2 and aflibercept is administered intravenously at a dosage of about 4 mg/kg and wherein the combination is administered every two weeks.
[0050] In a further embodiment of one of the methods described above folinic acid, 5-fluorouracil (5-FU), irinotecan and aflibercept are administered intravenously every two weeks for a period comprised between 9 and 18 weeks.
[0051] In a further embodiment of one of the methods described above folinic acid is administered intravenously immediately after aflibercept administration. It can be also administered intravenously immediately after aflibercept administration over a period of about 2 hours.
[0052] In a further embodiment of one of the methods described above irinotecan is administered intravenously immediately after aflibercept administration. It can be also administered intravenously immediately after aflibercept administration over a period of about 90 minutes.
[0053] In a further embodiment of one of the methods described above 5-fluorouracil (5-FU) is administered immediately after aflibercept administration.
[0054] In a further embodiment of one of the methods described above a first quantity of 5-fluorouracil (5-FU) is administered intravenously immediately after aflibercept administration and a second quantity of 5-FU is administered intravenously after the first quantity in continuous infusion.
[0055] In a further embodiment of one of the methods described above about 400 mg/m.sup.2 of 5-fluorouracil (5-FU) is administered intravenously over a period of 2 to 4 minutes after aflibercept administration and wherein 2400 mg/m.sup.2 of 5-FU is administered intravenously over around 46 hours after the administration of the 400 mg/m.sup.2 in continuous infusion.
[0056] In an embodiment said patient has previously been treated with therapy based on oxaliplatin or on bevacizumab.
[0057] In another embodiment said patient has failed with chemotherapy, radiotherapy or surgery.
[0058] The invention relates also to aflibercept, or ziv-aflibercept for treating a patient suspected to suffer from cancer, wherein the IL-8 level in the patient's biological sample is lower than between around 15 and around 50 pg/ml.
[0059] The invention further relates to a kit for predicting whether a patient suspected to suffer from cancer is a candidate for aflibercept, or ziv-aflibercept therapy, which kit comprises: [0060] a) means for measuring the interleukin-8 (IL-8) level; and [0061] b) Optionally, a label giving instructions for the use of said kit in predicting whether a patient suspected to suffer from cancer is a candidate for aflibercept, or ziv-aflibercept therapy.
[0062] Another aspect of the invention further relates to an article of manufacture comprising: [0063] a) a packaging material; [0064] b) means for measuring the interleukin-8 (IL-8) level; and [0065] c) a label giving instructions for the use of said kit in predicting whether a patient suspected to suffer from cancer is a candidate for aflibercept, or ziv-aflibercept therapy.
[0066] The above methods and use of the invention may be, for instance, in vitro or ex vivo methods and use.
[0067] Means for measuring the expression level of IL8 protein are well-known in the art and include immunoassay such as ELISA assay. The means for measuring IL8 protein include antibodies specifically binding to IL8. Such means can be labeled with detectable compound such as fluorophores or radioactive compounds. For example, the probe or the antibody specifically binding to IL8 may be labeled with a detectable compound. Alternatively, when the kit comprises an antibody, the kit may further comprise a secondary antibody, labeled with a detectable compound, which binds to an unlabeled antibody specifically binding to IL8.
[0068] The means for measuring the expression level of IL8 may also include reagents such as e.g. reaction and/or washing buffers. The means may be present, e.g., in vials or microtiter plates, or be attached to a solid support such as a microarray as can be the case for primers and probes.
[0069] Aflibercept, or ziv-aflibercept is provided in a formulation which is not prejudicial to the patient to be treated.
[0070] In an embodiment aflibercept, or ziv-aflibercept is provided in a formulation with sucrose and polysorbate 20 (stabilisers), sodium chloride, citrate buffer, and sodium phosphate buffer, adjusted to final pH.
[0071] In another embodiment aflibercept, or ziv-aflibercept, is supplied in two drug product presentations: [0072] a presentation at 100 mg aflibercept, or ziv-aflibercept/4.0 mL (nominal concentration). [0073] a second presentation at 200 mg aflibercept, or ziv-aflibercept/8.0 mL (nominal concentration).
[0074] Both presentations are manufactured from the same bulk sterile solution at 25 mg/mL of aflibercept, or ziv-aflibercept.
[0075] Prior to infusion to the patient, the concentrate solution is diluted with 0.9% sodium chloride solution or 5% dextrose.
[0076] The anti-cancer agents used in the above recited method or use are provided in a pharmaceutically acceptable carrier, excipient or diluent which is not prejudicial to the patient to be treated.
[0077] Pharmaceutically acceptable carriers and excipient that may be used in the compositions of this invention include, but are not limited to, ion exchangers, alumina, aluminium stearate, lecithin, self-emulsifying drug delivery systems (SEDDS) such as d-a-tocopherol polyethyleneglycol 1000 succinate, surfactants used in pharmaceutical dosage forms such as Tweens or other similar polymeric delivery matrices, serum proteins, such as human serum albumin, buffer substances such as phosphates, glycine, sorbic acid, potassium sorbate, partial glyceride mixtures of saturated vegetable fatty acids, water, salts or electrolytes, such as protamine sulfate, disodium hydrogen phosphate, potassium hydrogen phosphate, sodium chloride, zinc salts, colloidal silica, magnesium trisilicate, polyvinyl pyrrolidone, cellulose-based substances, polyethylene glycol, sodium carboxymethylcellulose, polyacrylates, waxes, polyethylene-polyoxypropylene-block polymers, polyethylene glycol and wool fat.
[0078] As appreciated by skilled artisans, compositions are suitably formulated to be compatible with the intended route of administration. Examples of suitable routes of administration include parenteral route, including for instance intramuscular, subcutaneous, intravenous, intraperitoneal or local intratumoral injections. The oral route can also be used, provided that the composition is in a form suitable for oral administration, able to protect the active principle from the gastric and intestinal enzymes.
[0079] The terms "Therapy", "therapeutic", "treatment" and "treating" are used herein to characterize a therapeutic method or process that is aimed at (1) slowing down or stopping the progression, aggravation, or deterioration of the symptoms of the disease state or condition to which such term applies; (2) alleviating or bringing about ameliorations of the symptoms of the disease state or condition to which such term applies; and/or (3) reversing or curing the disease state or condition to which such term applies.
[0080] As used herein, the terms "interleukin-8" and "IL-8" are used interchangeably and refer to all of the naturally-occurring isoforms, including alternative splice variants, allelic variants and include naturally occurring variants, SNPs (single nucleotide polymorphisms), and truncated or secreted forms of IL-8 protein.
[0081] In particular, the terms "interleukin 8" refers to the polypeptide comprising or consisting of the amino acid sequence corresponding to the UniProtKB/Swiss-Prot accession number P10145 (SEQ ID NO: 2) and/or [0082] a) a polypeptide corresponding to the mature isoform of the polypeptide of (a) (i.e. obtained after cleavage of the signal peptide); and/or [0083] b) an allelic variant of the polypeptide of (a) or (b); and/or [0084] c) a splice variant of a polypeptide of (a), (b) or (c); and/or [0085] d) a constitutively active mutant of a polypeptide of (a), (b), (c) or (d). [0086] e) an isoform obtained by proteolytic processing of a polypeptide of (a), (b), (c), (d) or (e).
[0087] By "isoform of a polypeptide" is meant a polypeptide that has at least about 50%, 55%, 60%, 65%, 70%, 71%, 72%, 73%, 74%, 75%, 76%, 77%, 78%, 79%, 80%, 81%, 82%, 83%, 84%, 85%, 86%, 87%, 88%, 89%, 90%, 91%, 92%, 93%, 94%, 95%, 96%, 97%, 98%, or 99% amino acid sequence identity to a full-length polypeptide reference sequence and has the same biological activity. In the context of the present application, the percentage of identity is calculated using a global alignment (i.e. the two sequences are compared over their entire length). Methods for comparing the identity of two or more sequences are well known in the art. The needle program, which uses the Needleman-Wunsch global alignment algorithm (Needleman and Wunsch, 1970 J. Mol. Biol. 48:443-453) to find the optimum alignment (including gaps) of two sequences when considering their entire length, may for example be used. The needle program is for example available on the ebi.ac.uk World Wide Web site. The percentage of identity in accordance with the invention can be calculated using the EMBOSS::needle (global) program with a "Gap Open" parameter equal to 10.0, a "Gap Extend" parameter equal to 0.5, and a Blosum62 matrix.
[0088] "Isoform" also refers to all post-translationally modified forms of IL8 protein. Post-translationally modified isoforms may include acetylated, formylated, lipoylated, myristoylated, palmitoylated, alkylated, methylated, amidated, glycosylated, hyrdroxylated, nitrosylated, phosphorylated, sulphated, polysialylated and sialylated forms.
[0089] The "reference level of expression of IL-8" may be determined as a single value or a range of values which is determined based on the expression level of IL-8 measured, for instance, in a population of healthy subjects or in a population of subjects in need of an aflibercept therapy.
[0090] In an embodiment the reference level of expression of IL-8 is determined based on the expression level of IL-8 measured in a population of subjects in need of a aflibercept therapy.
[0091] Typically, the analysed population could be divided into percentiles based on the measured level of expression of IL-8. The reference level could be defined as the percentile that provides the best separation between patients suffering from a cancer on which the treatment with aflibercept is efficient and patients suffering from a cancer on which the treatment with aflibercept is not efficient enough to cure it.
[0092] In the study reported in Example 1 below, the reference level of expression of IL-8 was 19 pg/ml (77th percentile).
[0093] However, the reference level of expression of IL-8 may vary i) according to the size of the studied population, and ii) depending on the method used for measuring the IL-8 expression.
[0094] The level of interleukin 8 protein may be, for instance, determined using immunological detection methods such as an ELISA assay. The methods involve an antibody which binds to interleukin 8 protein, for example a monoclonal or polyclonal antibody, an antibody variant or fragments such as a single chain antibody, a diabody, a minibody, a single chain Fv fragment (sc(Fv)), a Sc(Fv)2 antibody, a Fab fragment or a F(ab')2 fragment, or a single domain antibody. Such antibodies are well known in the art and are commercially available. They may also notably be obtained by immunization of animals (for example rabbits, rats or mice) with interleukin 8 protein. Antibodies may be used to determine protein expression in a range of immunological assays including competitive and non-competitive assay systems using techniques such as western blotting, immunohistochemistry/ immunofluorescence (i.e protein detection on fixed cells or tissues), radioimmunoassay such as RIA (radio-linked immunoassay), ELISA (enzyme linked immunosorbent assay), "sandwich" immunoassays, immunoprecipitation assays, immunodiffusion assays, agglutination assays, complement-fixation assays, immunoradiometric assays, fluorescent immunoassays, e.g. FIA (fluorescence-linked immunoassay), chemiluminescence immunoassays, ECLIA (electrochemiluminescence immunoassay) and protein A immunoassays. Such assays are routine and well known to the person skilled in the art (Ausubel et al (1994) Current Protocols in Molecular Biology, Vol. 1, John Wiley & Sons, Inc., New York).
[0095] Protein expression of interleukin 8 may also be determined by proteomic method such as mass spectrometry assays (LC-MS or LC-MS/MS). Qualitative and quantitative mass spectrometric techniques are known and used in the art. To this aim, target peptides specific for marker proteins are selected and quantified based on calibration curves established with synthetic peptides labeled with stable isotopes. Enzymatic digests, spiked with a defined amount of isotope labeled target peptides, are analyzed by liquid chromatography coupled with mass spectrometry. The ratio between labeled and non-labeled target peptides is measured to assess target peptide concentrations and therefore protein marker concentration.
[0096] The expression "circulating IL8" is intended to mean the IL8 proteins present in blood, serum and plasma.
[0097] A "subject" or a "patient" may be a human or a non-human mammal, such as monkeys, dogs, cats, guinea pigs, hamsters, rabbits, cows, horses, goats and sheep.
BRIEF DESCRIPTION OF THE SEVERAL VIEWS OF THE DRAWINGS
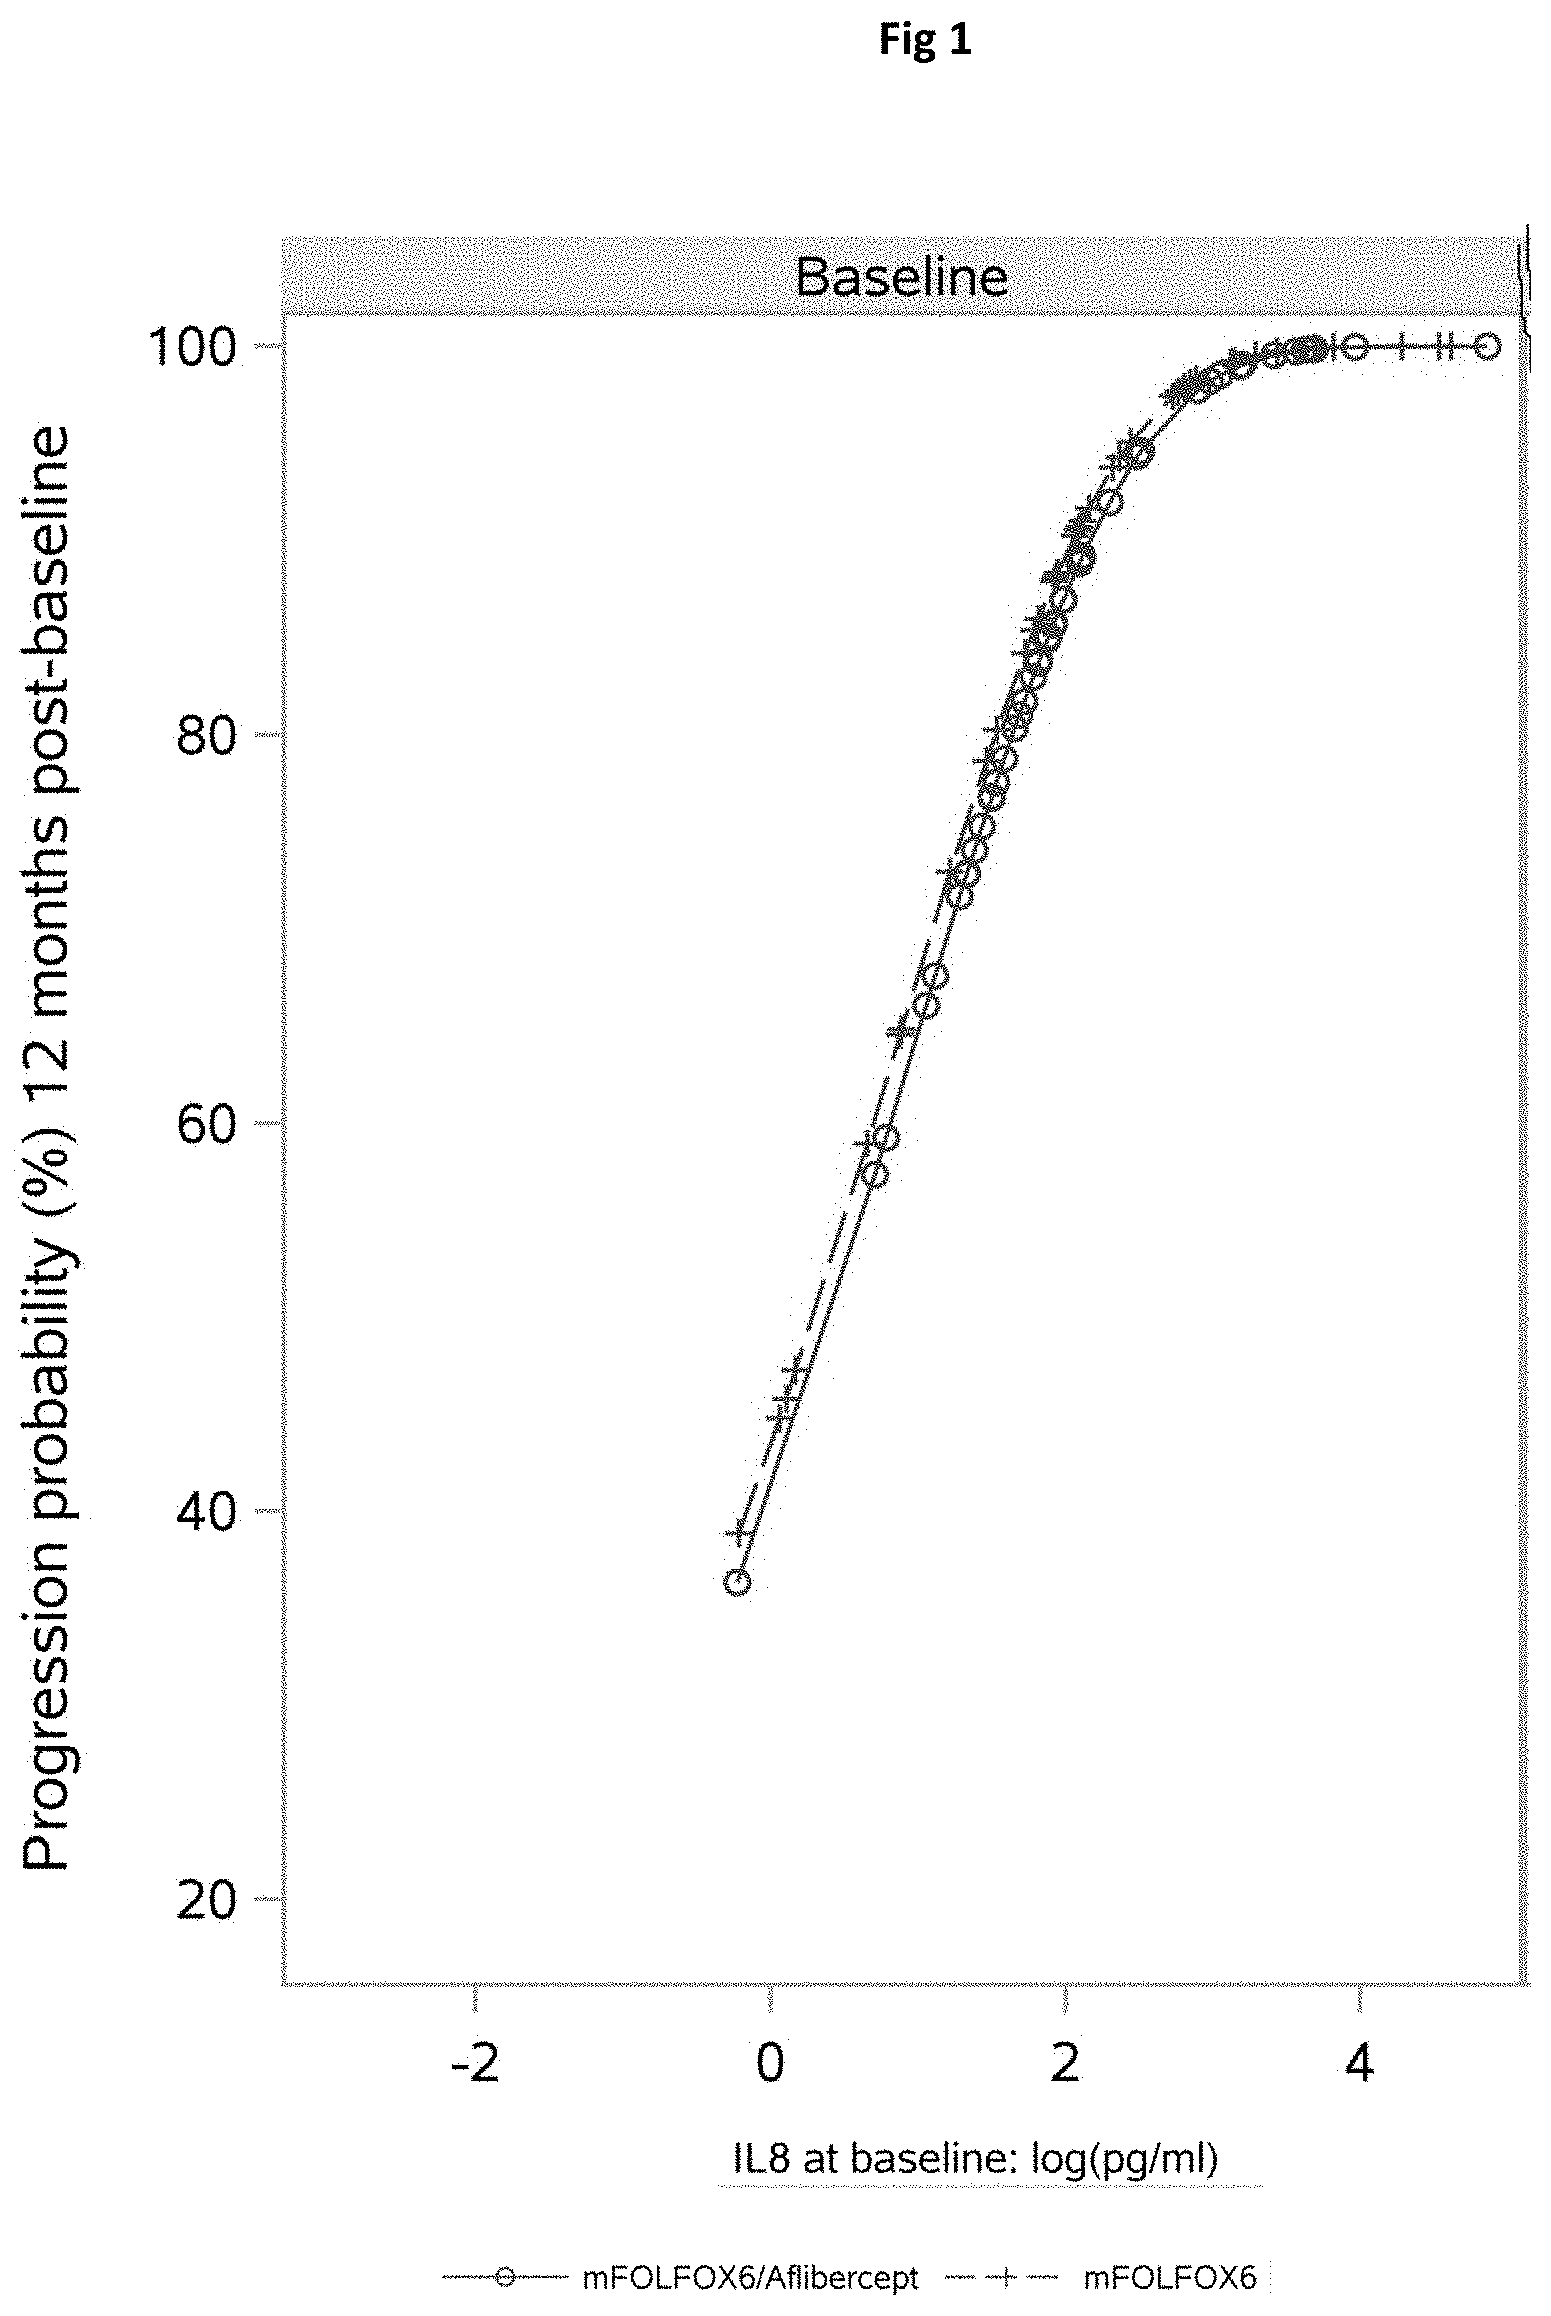
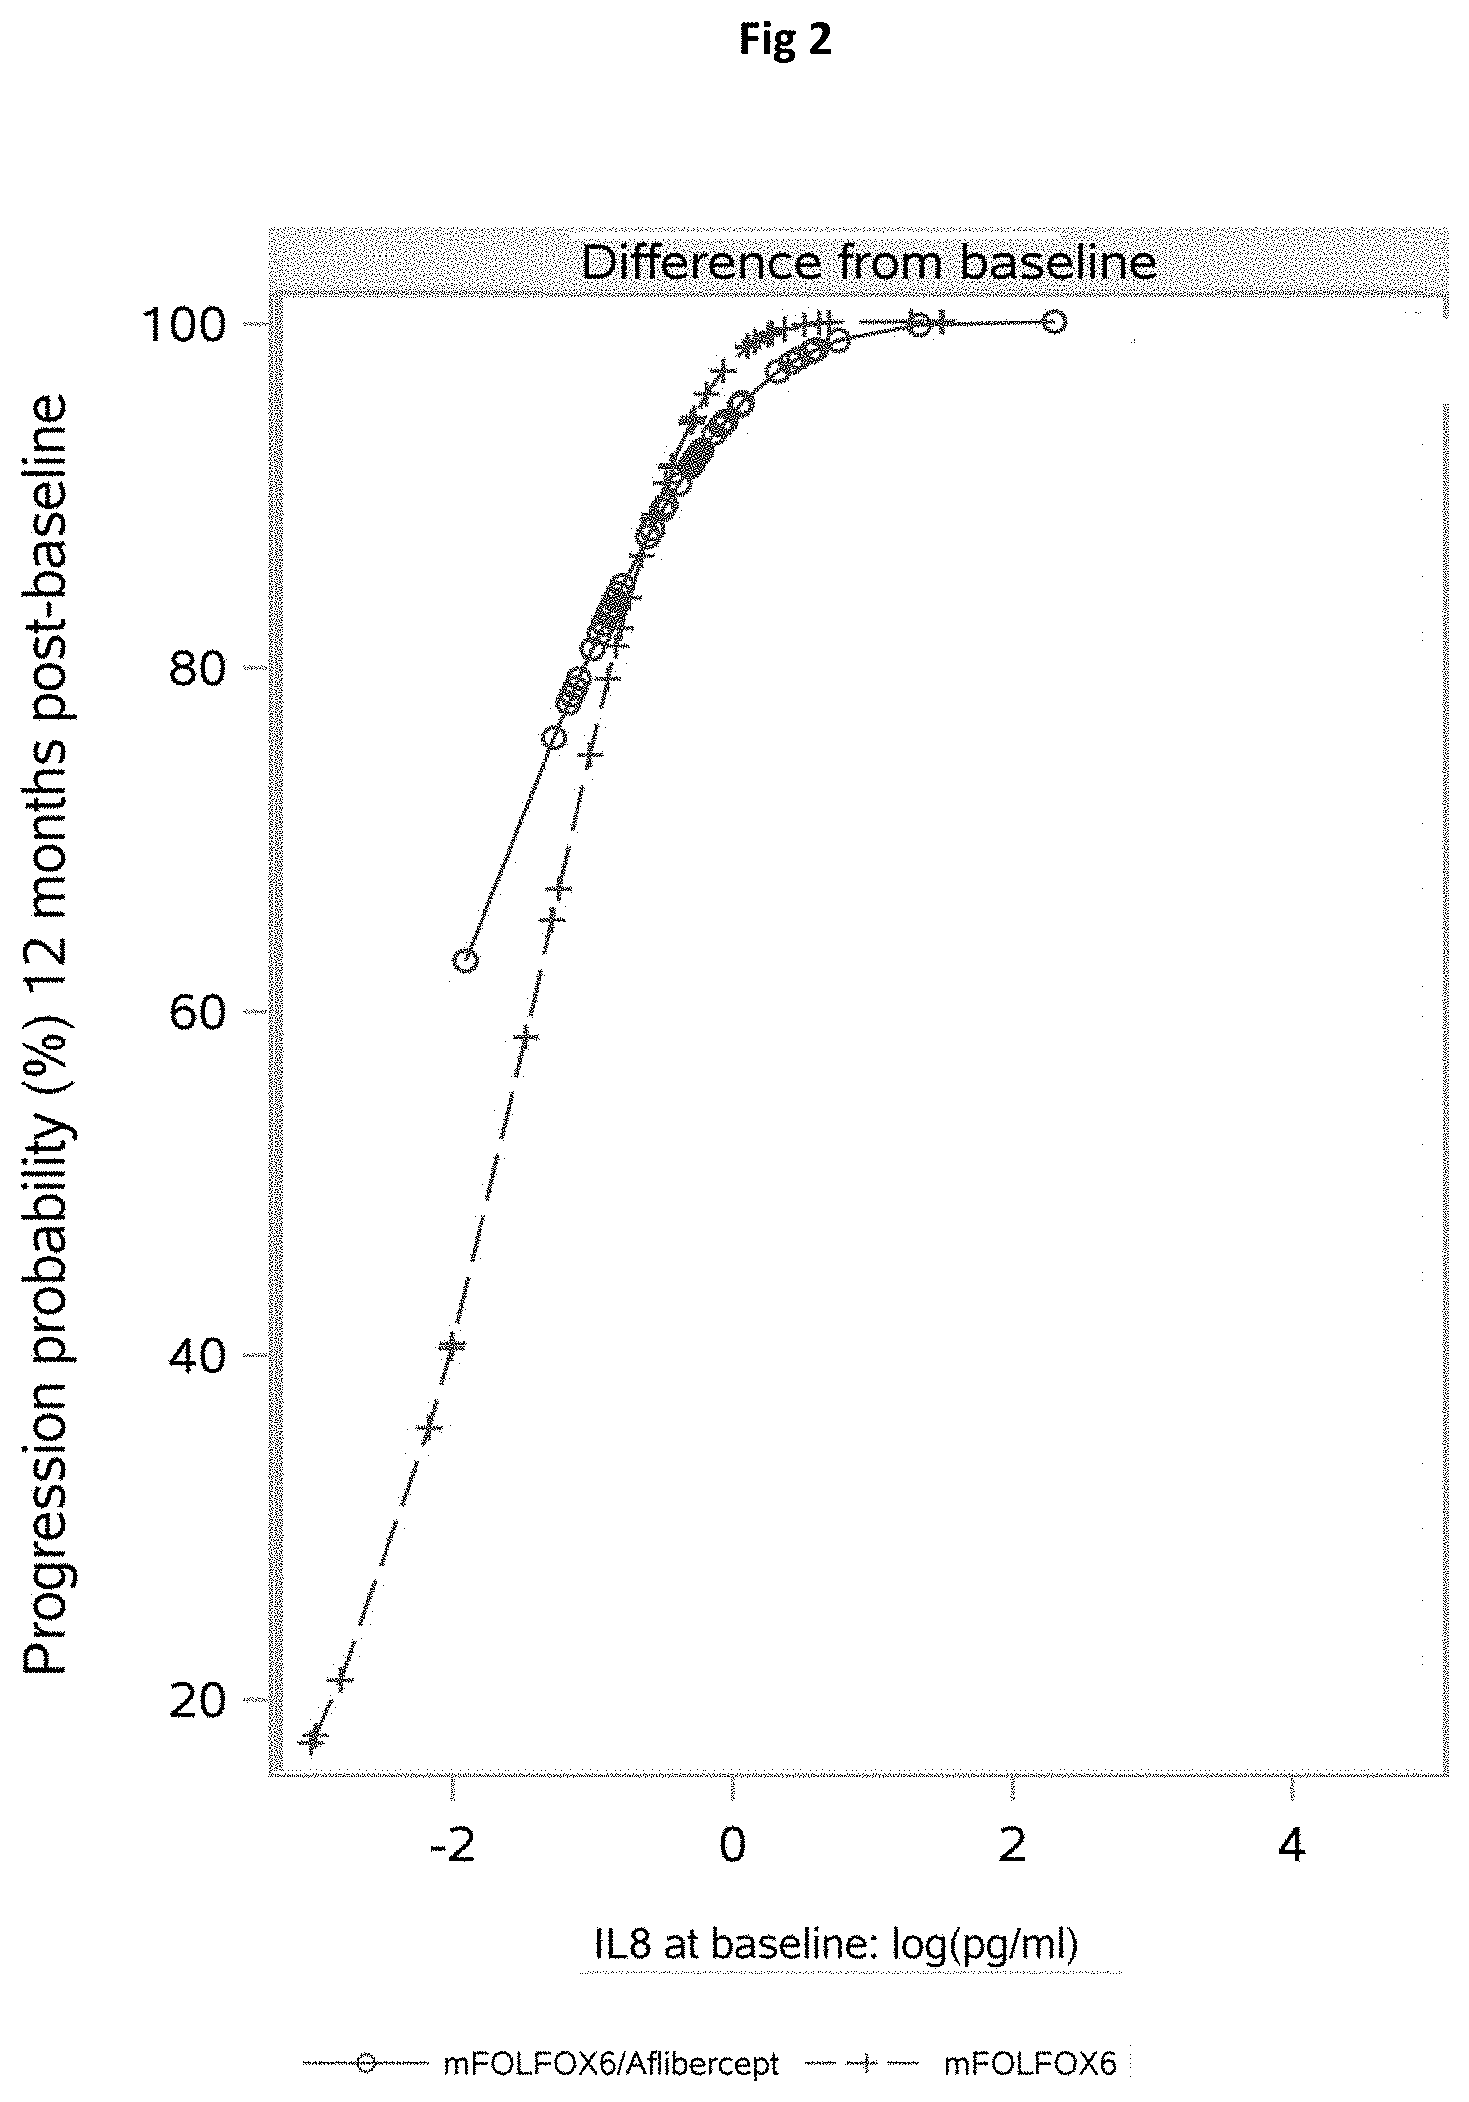
[0098] FIGS. 1 and 2 illustrate the relation between IL8 levels and the probability of disease progression. Depicted is the probability of disease progression after 12 months in relation to IL-8 plasma levels at baseline (FIG. 1) and the difference between IL8 plasma levels at baseline and the last measurement point before disease progression (FIG. 2). Briefly, FIG. 1 shows that high IL8 levels correlate with increased probability for disease progression and that this effect is slightly more pronounced in aflibercept versus FOLFOX treated patients. On the other hand, FIG. 2 shows that the increase in IL8 relative to baseline also corresponds to disease progression. Since increases in IL8 are plotted on a logarithmic scale, values between -3 and 0 correspond to an increase in IL8<1 pg/mL, whereas values between 0 and 3 represent increases>1 pg/mL. Data thus show that even small increases in IL8 relative to baseline already correspond to an increased probability of disease progression in the aflibercept arm.
DETAILED DESCRIPTION OF THE INVENTION
Example: Effect of Interleukin 8 on PFS in the AFFIRM Study
Study ECF10668 (AFFIRM)
[0099] EFC10668 was designed as a randomized, multinational, study comparing the adverse effects occurrence in patient with metastatic colorectal cancer (MCRC) treated with:
[0100] i) a modified FOLFOX6 (a combination of oxaliplatin, 5-fluorouracil (5-FU) and folinic acid) given intravenously every 2 weeks as first-line treatment (arm A); or
[0101] ii) aflibercept at 4 mg/kg combined with a modified FOLFOX6 given intravenously every 2 weeks as first-line treatment; or
Schedule of Administration
[0102] Patients were administered intravenously either with aflibercept immediately followed by oxaliplatin, 5-fluorouracil (5-FU) and folinic acid (modified FOLFOX6 regimen) or modified FOLFOX6 alone , depending on arm to which they were assigned,
[0103] This treatment was repeated every 2 weeks until progression (or unacceptable toxicity, or consent withdrawal).
Dosage
[0104] The patients randomized in the aflibercept arm received 4 mg/kg IV every 2 weeks.
[0105] The following were administered to patients in both treatment groups: [0106] Oxaliplatin (Eloxatin.RTM.) [0107] Folinic acid (also known as leucovorin) [0108] 5-fluorouracil
[0109] Formulations of oxaliplatin, 5-fluorouracil, and folinic acid: [0110] Products used were those available in the hospital/clinic pharmacy [0111] Route of administration: IV
[0112] Dose: Oxaliplatin, folinic acid, and 5-fluorouracil were administered according to an mFOLFOX6 regimen, as follows: [0113] Oxaliplatin 85 mg/m.sup.2 as a 2-hour IV infusion on day 1 [0114] Folinic acid 350 mg/m.sup.2 as a 2-hour IV infusion on day 1 [0115] 5-fluorouracil 400 mg/m.sup.2 as an IV bolus on day 1, and then 2400 mg/m.sup.2 as a 46-hour continuous IV infusion starting on day 1
[0116] In case of body surface area>2.0 m.sup.2, the actual doses of oxaliplatin and of 5-FU were to be adjusted to a maximum BSA of 2.0 m.sup.2 for safety reasons. Dose reduction and/or treatment delay and/or treatment discontinuation were planned in case of severe toxicity. The modified FOLFOX6 regimen was administered after administration of aflibercept.
Duration of Treatment
[0117] Treatment for an individual patient was administered up until progression or until unacceptable toxicity occurred or the patient withdrew consent.
[0118] Treatment duration was estimated to be approximately 12 months.
Demographics and Baseline Characteristics
[0119] Table 1 below compares demographics and patient characteristics at baseline between biomarkers evaluable and non-evaluable populations.
[0120] The "biomarkers evaluable population" is defined as the population of patients who provided a blood/tumor sample for biomarker assessment; while the "biomarkers non evaluable population" corresponds to patients who did not provide blood/tumor sample for biomarker assessment (e.g. patients who did not consent to biomarker study).
[0121] All characteristics are similar between populations, except for the region of origin of the patients: Eastern Europe tends to be over-represented and other countries tend to be under-represented in the biomarkers evaluable population compared to the biomarker non evaluable population.
TABLE-US-00001 TABLE 1 Summary of patient demographics and patient characteristics at baseline-Evaluable population Biomarkers non Biomarkers evaluable evaluable population population Aflibercept/ Aflibercept/ mFolfox6 mFolfox6 mFolfox6 mFolfox6 (N = 57) (N = 49) (N = 60) (N = 70) p-value Gender 1.0000.sup.a [n(%)] Number 57 49 60 70 Male 32 33 36 43 (56.1%) (67.3%) (60.0%) (61.4%) Female 25 16 24 27 (43.9%) (32.7%) (40.0%) (38.6%) Age (Years) 0.2811.sup.b Number 57 49 60 70 Median 66.0 62.0 62.0 62.5 Mean 63.7 61.8 61.3 61.7 (SD) (10.0) (9.5) (9.4) (8.7) Min:Max 44:87 29:75 37:81 41:79 Age class 0.2421.sup.a [n(%)] Number 57 49 60 70 <65 27 28 38 42 (47.4%) (57.1%) (63.3%) (60.0%) .gtoreq.65 but 23 20 20 25 <75 (40.4%) (40.8%) (33.3%) (35.7%) .gtoreq.75 7 (12.3%) 1 (2.0%) 2 (3.3%) 3 (4.3%) Race [n(%)] 0.0640.sup.a Number 57 49 60 70 Caucasian/ 41 37 49 60 White (71.9%) (75.5%) (81.7%) (85.7%) Black 0 0 0 1 (1.4%) Asian/ 16 11 11 9 Oriental (28.1%) (22.4%) (18.3%) (12.9%) Other 0 1 (2.0%) 0 0 Region 0.0029.sup.a Number 57 49 60 70 Western 37 30 37 45 Europe (64.9%) (61.2%) (61.7%) (64.3%) Eastern 3 (5.3%) 3 (6.1%) 12 12 Europe (20.0%) (17.1%) Other 17 16 11 13 countries (29.8%) (32.7%) (18.3%) (18.6%) BSA (m2) 0.1091.sup.b Number 57 49 60 70 Median 1.8 1.8 1.8 1.8 Mean 1.7 (0.2) 1.8 (0.2) 1.8 (0.2) 1.8 (0.2) (SD) Min:Max 1:2 1:2 1:2 1:2 Weight (kg) 0.0838.sup.b Number 57 49 60 70 Median 67.6 70.0 73.2 71.4 Mean 67.3 71.1 74.0 71.5 (SD) (14.1) (16.6) (17.0) (15.6) Min:Max 40:107 40:115 48:134 40:117 .sup.acomparing frequency distribution based on Fisher's exact test-2-sided. .sup.bUsing ANOVA (type 3) with factors: BIOPOP, BIOPOP. Records with missing values for factors or response were excluded from statistical analyses. Frequency distribution of covariates is compared between evaluable and non-evaluable populations Note: Western Europe = Germany, Italy, Spain, United Kingdom; Eastern Europe = Russian Federation; Other countries = Australia, Korea
Disease Characteristics at Baseline
[0122] Disease characteristics at baseline were similar in the two populations (see Tables 2 and 3 below).
TABLE-US-00002 TABLE 2 Summary of disease characteristics at initial diagnosis Biomarkers Biomarkers non evaluable evaluable population population Aflibercept/ Aflibercept/ mFolfox6 mFolfox6 mFolfox6 mFolfox6 (N = 57) (N = 49) (N = 60) (N = 70) p-value Primary site 0.7045.sup.a [n(%)] Number 57 49 60 70 Colon 27 26 (53.1%) 31 33 (47.1%) (47.4%) (51.7%) Recto 9 15 (30.6%) 16 19 (27.1%) sigmoid (15.8%) (26.7%) Rectum 21 8 (16.3%) 13 18 (25.7%) (36.8%) (21.7%) Histology type [n(%)] Number 57 49 60 70 Adeno- 57 49 60 70 (100%) carcinoma (100%) (100%) (100%) Staging at 0.2297.sup.a diagnosis [n(%)] Number 56 48 57 68 Stage I 1 (1.8%) 0 2 (3.5%) 2 (2.9%) Stage II 2 (3.6%) 1 (2.1%) 6 4 (5.9%) (10.5%) Stage III 5 (8.9%) 3 (6.3%) 3 (5.3%) 4 (5.9%) Stage IV 48 44 46 58 (85.7%) (91.7%) (80.7%) (85.3%) Time from 0.6620.sup.b diagnosis to random- ization (months)* Number 57 49 60 69 Median 1.4 1.8 1.6 1.7 Mean (SD) 12.6 9.2 (16.9) 9.8 9.7 (17.5) (30.9) (19.8) Min:Max 0:149 0:80 0:84 0:80 .sup.acomparing frequency distribution based on Fisher's exact test-2-sided. .sup.bUsing ANOVA (type 3) with factors: BIOPOP, BIOPOP. Records with missing values for factors or response were excluded from statistical analyses. Frequency distribution of covariates is compared between evaluable and non-evaluable populations *If the day of initial date of diagnosis is missing, it is considered as the first day of the month
TABLE-US-00003 TABLE 3 Summary of organs involved at baseline Biomarkers Biomarkers non evaluable evaluable population population Aflibercept/ Aflibercept/ mFolfox6 mFolfox6 mFolfox6 mFolfox6 (N = 57) (N = 49) (N = 60) (N = 70) p-value Number of 0.1711.sup.a metastatic organs involved at baseline (excluding primary site) [n(%)] Number 57 49 60 70 0 0 0 1 (1.7%) 0 1 16 (28.1%) 15 (30.6%) 15 12 (17.1%) (25.0%) >1 41(71.9%) 34 (69.4%) 44 58 (82.9%) (73.3%) Metastatic 57 (100%) 49 (100%) 59 70 (100%) organs (98.3%) involved at baseline (excluding primary site) [n(%)]* Liver 44 (77.2%) 42 (85.7%) 47 57 (81.4%) (78.3%) Lung 27 (47.4%) 18 (36.7%) 25 28 (40.0%) (41.7%) Lymph nodes 26 (45.6%) 25 (51.0%) 30 38 (54.3%) (50.0%) Muscle/ 9 (15.8%) 6 (12.2%) 14 10 (14.3%) soft tissue (23.3%) Peritoneum 8 (14.0%) 7 (14.3%) 8 16 (22.9%) (13.3%) Pleura 5 (8.8%) 7 (14.3%) 2 (3.3%) 1 (1.4%) Adrenal 2 (3.5%) 0 1 (1.7%) 1 (1.4%) Bone 2 (3.5%) 1 (2.0%) 4 (6.7%) 4 (5.7%) Kidneys 1 (1.8%) 0 0 0 Spleen 1 (1.8%) 1 (2.0%) 1 (1.7%) 1 (1.4%) Bladder 0 0 1 (1.7%) 1 (1.4%) Metastatic 0.3536.sup.a organs involved at baseline class (excluding primary site) [n(%)] Number 57 49 60 70 No liver 49 (86.0%) 39 (79.6%) 51 63 (90.0%) metastasis, (85.0%) or liver and other metastases Liver 8 (14.0%) 10 (20.4%) 9 7 (10.0%) metastasis (15.0%) only .sup.acomparing frequency distribution based on Fisher's exact test-2-sided. Records with missing values for factors or response were excluded from statistical analyses. Frequency distribution of covariates is compared between evaluable and non-evaluable populations *Percentages are not additive (sum greater than 100%)
Safety Evaluation
A. Extent of Exposure
[0123] Table 4 below shows that patients in the biomarkers evaluable population were exposed slightly longer to treatment than patients in the biomarkers non-evaluable population (median number of cycles: 12 versus 9 or 10).
[0124] There was no difference in exposure between treatment arms in the biomarkers evaluable population.
TABLE-US-00004 TABLE 4 Summary of overall study treatment exposure Biomarkers non Biomarkers evaluable evaluable population population Aflibercept/ Aflibercept/ mFolfox6 mFolfox6 mFolfox6 mFolfox6 (N = 56) (N = 49) (N = 60) (N = 70) Number of cycles received by patient Sum 614 572 770.0 865.0 Mean (SD) 11.0 (7.0) 11.7 (9.5) 12.8 (7.0) 12.4 (7.9) Median 10.0 9.0 12.0 12.0 Min:Max 1:43 1:44 3:33 1:42 Number of cycles received by patient 1 2 (3.6%) 3 (6.1%) 0 2 (2.9%) 2 2 (3.6%) 2 (4.1%) 0 2 (2.9%) 3 3 (5.4%) 1 (2.0%) 2 (3.3%) 2 (2.9%) 4 3 (5.4%) 4 (8.2%) 5 (8.3%) 8 (11.4%) 5 1 (1.8%) 0 1 (1.7%) 2 (2.9%) 6 1 (1.8%) 6 (12.2%) 0 4 (5.7%) 7 1 (1.8%) 5 (10.2%) 1 (1.7%) 3 (4.3%) 8 6 (10.7%) 1 (2.0%) 11 (18.3%) 2 (2.9%) 9 6 (10.7%) 3 (6.1%) 0 5 (7.1%) 10 5 (8.9%) 2 (4.1%) 4 (6.7%) 3 (4.3%) 11-15 16 (28.6%) 11 (22.4%) 21 (35.0%) 13 (18.6%) 16-20 7 (12.5%) 4 (8.2%) 6 (10.0%) 14 (20.0%) 21-25 1 (1.8%) 3 (6.1%) 5 (8.3%) 6 (8.6%) >25 2 (3.6%) 4 (8.2%) 4 (6.7%) 4 (5.7%) Duration of exposure (weeks) Number 56 49 60 70 Mean (SD) 25.2 (16.0) 27.5 (22.4) 29.5 (16.4) 28.7 (18.7) Median 24.1 23.1 27.3 25.4 Min:Max 2:95 2:106 6:77 2:88 Duration of exposure = ((First date of last cycle + 14)-First date of first cycle)/7 SD: standard deviation
B. Plasma Profiling
[0125] The plasma concentration of 27 cytokines, growth factors or soluble receptors was determined by enzyme-linked immunosorbent assays (ELISA) using two Fluorokine.RTM. MAP kits (the human angiogenesis panel A and the human high sensitivity cytokine panel; R&D Systems). Competition experiments were conducted to test interference of aflibercept with the detection of VEGF-A, VEGF-D and placental growth factor (PIGF). Angiopoietin-2 (ANGPT2), SDF1-.alpha., HGF, VEGF-C, soluble VEGF receptor 3 (sFLT4, sVEGFR3) and sVEGFR2 were assessed by single ELISA (R&D Systems). Plasma markers were analyzed at baseline, at 30 and 60 days after the first study treatment infusion and 30 days after the last aflibercept infusion.
Statistical Analysis
[0126] Differences between patients with evaluable biomarkers and patients without evaluable biomarkers were assessed using a two-sided Fisher's exact test for categorical variables and ANOVA for continuous variables. Biomarkers were analyzed as quantitative variables, by coding the absence or presence of a somatic mutation as 0 or 1, and SNP genotypes as 0, 1 or 2 depending on the number of minor alleles present. The linear effects of baseline biomarkers on PFS were assessed using a Cox proportional hazard model with the following co-variates: Eastern Cooperative Oncology Group (ECOG) performance status (0-1 versus 2), liver-only metastases (yes/no), and the number of distant metastasis organs (1 versus >1), a treatment effect, a biomarker effect and a biomarker-treatment interaction effect. The significance of the latter two effects was jointly tested by a two-degrees-of-freedom Wald test. Extended statistical methods are described in supplementary methods.
Results
[0127] Of the 236 patients in the ITT population of the AFFIRM trial 227 (96%) were evaluable for response. Of these, 130 (57%) provided at least one biological sample, 60 (46%) and 70 (54%) of which participated in the mFOLFOX6 and mFOLFOX6 plus aflibercept arms, respectively. There was no major difference at a false discovery rate (FDR)-adjusted P-value of 0.05 between patients who provided a biological sample and those who did not in terms of patient biometrics, ethnicity, and disease characteristics at baseline, or at efficacy and safety endpoints (Table 1). Of those who provided at least one biological sample, 51 (39%) provided samples for each of the 3 biomarker types, with 88 (68%) and 97 (74%) patients providing samples for 2 or 1 of the biomarker types respectively. Each biomarker type was analyzed separately, to avoid patient groups that were too small for sub-analyses.
Profiling of Plasma Markers for Efficacy
[0128] Plasma levels of 27 markers were measured at different time points (i.e., at baseline [87 patients]; 30 and 60 days after start of treatment [82 and 73 patients]; and 30 days after the last treatment [56 patients] as indicated on Table 5.
TABLE-US-00005 TABLE 5 Number of observations per time point-total, below limit of quantification (LOQ) and of detection (LOD) EOT + 30 Baseline Day 30 Day 60 Days Total <LOQ <LOD Total <LOQ <LOD Total <LOQ <LOD Total <LOQ <LOD ANGPT1 87 1 1 80 1 0 73 0 0 56 0 0 ANGPT2 86 1 82 1 72 0 55 1 CSF2 84 28 17 80 38 16 72 32 17 54 25 16 CXCL12 86 0 0 82 2 2 72 0 0 55 0 0 FGF1 87 14 14 80 16 16 73 18 18 56 8 8 Endostatin 87 80 73 56 FGF2 87 19 11 80 20 15 73 19 11 56 10 5 FIGF 87 12 12 80 4 4 73 1 1 56 1 1 HGF 86 0 0 82 7 7 72 1 1 55 1 1 IFNG 84 6 4 80 8 3 72 6 2 54 11 8 IL10 84 0 0 80 1 1 72 2 2 54 0 0 IL12 84 3 3 80 1 1 72 3 3 54 8 7 IL1B 84 1 1 80 0 0 72 1 1 54 4 4 IL2 84 3 2 80 3 1 72 1 1 54 8 6 IL4 84 2 2 80 1 1 72 2 2 54 7 7 IL5 84 2 1 80 3 0 72 1 0 54 1 1 IL6 84 0 0 80 2 1 72 0 0 54 1 1 IL8 84 0 0 80 1 1 72 0 0 54 0 0 PGF 87 8 8 80 6 6 73 2 2 56 1 1 TNF 84 2 1 80 2 1 72 1 0 54 2 1 PDGFA 87 80 73 56 VEGFA 84 6 1 80 4 1 72 2 0 54 4 0 PDGFB 87 80 73 56 VEGFC 86 1 1 82 0 0 72 0 0 55 1 0 sFLT4 86 0 0 82 7 7 72 1 1 55 1 1 THBS2 87 80 73 56 sKDR 86 0 0 82 7 7 72 1 1 55 1 1
[0129] All cytokines were measured in pg/ml, but some transformations were applied when necessary to obtain a symmetric distribution or smaller numerical values (ng/ml) for the association models, as depicted in table 6.
TABLE-US-00006 TABLE 6 Selected transformations of original plasma cytokine levels (pg/ml) Cytokine Transformation ANGPT1 log ANGPT2 log CSF2 square root CXCL12 ng/ml FGF1 cubic root Endostatin log FGF2 square root FIGF cubic root HGF Log IFNG square root IL10 cubic root IL12 None IL1B cubic root IL2 square root IL4 None IL5 Log IL6 Log IL8 Log PGF ng/ml TNF square root PDGFA log VEGFA Log PDGFB log VEGFC Log sFLT4 square root(ng/ml) THBS2 log sKDR square root(ng/ml)
[0130] We assessed the association of each plasma marker at baseline with PFS, while allowing for an interaction with treatment (Table 7). The lowest P-value was obtained for IL8 (P=0.0211; FDR=0.596 and P=0.0218 for interaction).
TABLE-US-00007 TABLE 7 Effect of baseline plasma biomarkers on PFS. The P-values associated to the joint effect, the FDR-corrected joint effect, the plasma biomarker and the biomarker with treatment interaction effect are shown. P-values FDR- Plasma Treatment corrected level by plasma Protein Joint effect joint effect effect level effect IL8 0.0221 0.5962 0.6701 0.0218 THBS2 0.1408 0.6523 0.0545 0.2234 CXCL12 0.1610 0.6523 0.0573 0.1640 IL10 0.1669 0.6523 0.0647 0.1311 Ang1 0.1768 0.6523 0.0724 0.0831 FIGF 0.1974 0.6523 0.6826 0.1704 FGF2 0.2063 0.6523 0.1722 0.0768 sVEGFR2 0.2171 0.6523 0.1616 0.0812 PDGFA 0.2474 0.6523 0.1155 0.1052 IL6 0.2689 0.6523 0.1061 0.1838 FGF1 0.3185 0.6523 0.4759 0.1536 VEGF-A 0.3202 0.6523 0.2549 0.7133 CSF2 0.3272 0.6523 0.4278 0.1679 IL12 0.3587 0.6523 0.3664 0.1808 IFNg 0.3855 0.6523 0.8662 0.2984 IL4 0.3866 0.6523 0.7326 0.4796 PIGF 0.5008 0.7955 0.3018 0.2595 PDGFB 0.5442 0.8163 0.4795 0.2963 IL1B 0.6025 0.8439 0.3183 0.3595 HGF 0.6286 0.8439 0.3369 0.5093 IL2 0.6564 0.8439 0.7696 0.4093 Endostatin 0.9021 0.9783 0.7429 0.9824 sFLT4 0.9063 0.9783 0.6849 0.8668 TNF 0.9461 0.9783 0.8736 0.7442 Ang2 0.9698 0.9783 0.9279 0.9747 VEGF-C 0.9772 0.9783 0.8375 0.8307 IL5 0.9783 0.9783 0.8813 0.8501
[0131] The Cox model assumes a linear relationship between the plasma marker and the log of the PFS hazard function, but since this hypothesis may be violated when analyzing continuous markers that vary considerably, a threshold effect may be more relevant. We explored this possibility by searching for the optimal cut-off level that maximizes the interaction with the treatment and the plasma marker. For IL8, the optimal cut-off was at 19 pg/ml (77.sup.th percentile). A model, in which IL8 was analyzed as a binary variable with this threshold, fitted better than a model with continuous IL8 levels (AIC of 469.3 versus 477.6). Patients with low IL8 levels (.gtoreq.19 pg/ml, 77% of patients) exhibited a longer PFS in the aflibercept/mFLOFOX6 arm than in the mFOLFOX6 arm (Table 8).
TABLE-US-00008 TABLE 8 Kaplan-Meier estimates of effect of biomarkers on months of PFS. Aflibercept plus mFOLFOX6 mFOLFOX6 Hazard Ratio Median Median vs mFOLFOX6 (99% CI) (99% CI) (99% CI) Plasma protein markers All patients 8.8 (6.57-10.02) 8.5 (6.67-10.05) 0.979 (0.505-1.897) IL8 .ltoreq. 19 pg/mL 8.8 (5.62-10.91) 9.3 (7.52-11.10) 0.764 (0.363-1.607) IL8 > 19 pg/mL 8.8 (5.09-15.64) 4.1 (2.33-8.54) 2.71 (0.735-9.984) CI, confidence interval; mt, mutant; wt, wild-type.
[0132] We also analyzed whether treatment-related changes in plasma markers could predict aflibercept treatment outcome. The Cox model included the effect of baseline plasma levels and the difference in expression measured at baseline and the last time point before discontinuation, disease progression or death (i.e., at 30 days or 60 days of treatment), while allowing for interaction with the treatment arm. IL8 was the only marker with a significant effect of change from baseline on PFS (P=0.0018; FDR=0.0478; Table 9). This effect did not differ between treatment arms (P=0.2028). High baseline or post-baseline increased IL8 levels corresponded to a higher probability of disease progression at 12 months (FIGS. 1 and 2).
TABLE-US-00009 TABLE 9 Effect of plasma marker changes from baseline on PFS. P-values (and FDR) of the joint effects of plasma marker and treatment by plasma marker interactions are shown. P-values for the change from baseline and the interaction are also presented. P-values Treatment by Joint effect Change from Change from Protein Joint effect FDR-corrected baseline effect baseline effect IL8 0.0018 0.0478 0.0006 0.2028 IL10 0.0342 0.4525 0.5214 0.8204 VEGFA 0.0619 0.4525 0.0189 0.0704 CXCL12 0.0670 0.4525 0.1714 0.0318 CSF2 0.0855 0.4619 0.0266 0.1682 VEGFC 0.1127 0.5072 0.0742 0.9355 IL5 0.1886 0.7275 0.0684 0.1657 Endostatin 0.2418 0.7882 0.9988 0.2668 PDGFA 0.3092 0.7882 0.1508 0.9922 TNF 0.3209 0.7882 0.1770 0.1554 IL4 0.3211 0.7882 0.1938 0.7631 FGF2 0.3851 0.8191 0.6468 0.3957 sFLT4 0.3944 0.8191 0.2533 0.1729 THBS2 0.4677 0.8426 0.2387 0.6683 FGF1 0.4770 0.8426 0.4669 0.2242 PGF 0.4993 0.8426 0.2501 0.2755 ANGPT2 0.5638 0.8924 0.3373 0.8394 IL1B 0.6261 0.8924 0.3345 0.5414 PDGFB 0.6583 0.8924 0.3730 0.6009 IL12 0.6611 0.8924 0.7934 0.7744 IL2 0.7984 0.9482 0.9352 0.6027 sKDR 0.8375 0.9482 0.6009 0.5613 HGF 0.8383 0.9482 0.5804 0.5665 IFNG 0.8559 0.9482 0.6923 0.9101 ANGPT1 0.8814 0.9482 0.6269 0.8538 FIGF 0.9131 0.9482 0.6838 0.7528 IL6 0.9963 0.9963 0.9893 0.9594
[0133] When plasma biomarkers were measured at baseline only, IL8 had the most prominent effect on PFS, which was best described as a threshold effect with high circulating IL8 (IL8>19 pg/mL) associated with a shorter PFS in the aflibercept-treated patients.
[0134] When plasma biomarkers were measured at baseline and during treatment, high levels of circulating IL8 at baseline together with increased levels of IL8 measured during treatment were significantly associated with reduced PFS (FDR=0.0478).
Conclusions
[0135] We identified that high IL8 levels at baseline correlated with shorter survival times, and patients with increasing levels of IL8 during treatment were more likely to progress.
[0136] This suggests that patients with high IL8 levels, at baseline or during treatment, are at increased risk of disease progression during aflibercept therapy.
Sequence CWU 1
1
21431PRTArtificial SequenceAflibercept 1Ser Asp Thr Gly Arg Pro Phe
Val Glu Met Tyr Ser Glu Ile Pro Glu1 5 10 15Ile Ile His Met Thr Glu
Gly Arg Glu Leu Val Ile Pro Cys Arg Val 20 25 30Thr Ser Pro Asn Ile
Thr Val Thr Leu Lys Lys Phe Pro Leu Asp Thr 35 40 45Leu Ile Pro Asp
Gly Lys Arg Ile Ile Trp Asp Ser Arg Lys Gly Phe 50 55 60Ile Ile Ser
Asn Ala Thr Tyr Lys Glu Ile Gly Leu Leu Thr Cys Glu65 70 75 80Ala
Thr Val Asn Gly His Leu Tyr Lys Thr Asn Tyr Leu Thr His Arg 85 90
95Gln Thr Asn Thr Ile Ile Asp Val Val Leu Ser Pro Ser His Gly Ile
100 105 110Glu Leu Ser Val Gly Glu Lys Leu Val Leu Asn Cys Thr Ala
Arg Thr 115 120 125Glu Leu Asn Val Gly Ile Asp Phe Asn Trp Glu Tyr
Pro Ser Ser Lys 130 135 140His Gln His Lys Lys Leu Val Asn Arg Asp
Leu Lys Thr Gln Ser Gly145 150 155 160Ser Glu Met Lys Lys Phe Leu
Ser Thr Leu Thr Ile Asp Gly Val Thr 165 170 175Arg Ser Asp Gln Gly
Leu Tyr Thr Cys Ala Ala Ser Ser Gly Leu Met 180 185 190Thr Lys Lys
Asn Ser Thr Phe Val Arg Val His Glu Lys Asp Lys Thr 195 200 205His
Thr Cys Pro Pro Cys Pro Ala Pro Glu Leu Leu Gly Gly Pro Ser 210 215
220Val Phe Leu Phe Pro Pro Lys Pro Lys Asp Thr Leu Met Ile Ser
Arg225 230 235 240Thr Pro Glu Val Thr Cys Val Val Val Asp Val Ser
His Glu Asp Pro 245 250 255Glu Val Lys Phe Asn Trp Tyr Val Asp Gly
Val Glu Val His Asn Ala 260 265 270Lys Thr Lys Pro Arg Glu Glu Gln
Tyr Asn Ser Thr Tyr Arg Val Val 275 280 285Ser Val Leu Thr Val Leu
His Gln Asp Trp Leu Asn Gly Lys Glu Tyr 290 295 300Lys Cys Lys Val
Ser Asn Lys Ala Leu Pro Ala Pro Ile Glu Lys Thr305 310 315 320Ile
Ser Lys Ala Lys Gly Gln Pro Arg Glu Pro Gln Val Tyr Thr Leu 325 330
335Pro Pro Ser Arg Asp Glu Leu Thr Lys Asn Gln Val Ser Leu Thr Cys
340 345 350Leu Val Lys Gly Phe Tyr Pro Ser Asp Ile Ala Val Glu Trp
Glu Ser 355 360 365Asn Gly Gln Pro Glu Asn Asn Tyr Lys Thr Thr Pro
Pro Val Leu Asp 370 375 380Ser Asp Gly Ser Phe Phe Leu Tyr Ser Lys
Leu Thr Val Asp Lys Ser385 390 395 400Arg Trp Gln Gln Gly Asn Val
Phe Ser Cys Ser Val Met His Glu Ala 405 410 415Leu His Asn His Tyr
Thr Gln Lys Ser Leu Ser Leu Ser Pro Gly 420 425 430299PRTHomo
sapiens 2Met Thr Ser Lys Leu Ala Val Ala Leu Leu Ala Ala Phe Leu
Ile Ser1 5 10 15Ala Ala Leu Cys Glu Gly Ala Val Leu Pro Arg Ser Ala
Lys Glu Leu 20 25 30Arg Cys Gln Cys Ile Lys Thr Tyr Ser Lys Pro Phe
His Pro Lys Phe 35 40 45Ile Lys Glu Leu Arg Val Ile Glu Ser Gly Pro
His Cys Ala Asn Thr 50 55 60Glu Ile Ile Val Lys Leu Ser Asp Gly Arg
Glu Leu Cys Leu Asp Pro65 70 75 80Lys Glu Asn Trp Val Gln Arg Val
Val Glu Lys Phe Leu Lys Arg Ala 85 90 95Glu Asn Ser
D00001
D00002
S00001
XML
uspto.report is an independent third-party trademark research tool that is not affiliated, endorsed, or sponsored by the United States Patent and Trademark Office (USPTO) or any other governmental organization. The information provided by uspto.report is based on publicly available data at the time of writing and is intended for informational purposes only.
While we strive to provide accurate and up-to-date information, we do not guarantee the accuracy, completeness, reliability, or suitability of the information displayed on this site. The use of this site is at your own risk. Any reliance you place on such information is therefore strictly at your own risk.
All official trademark data, including owner information, should be verified by visiting the official USPTO website at www.uspto.gov. This site is not intended to replace professional legal advice and should not be used as a substitute for consulting with a legal professional who is knowledgeable about trademark law.