Method For Creating Hyperpolarization At Microtesla Magnetic Fields
Chekmenev; Eduard Y. ; et al.
U.S. patent application number 16/607701 was filed with the patent office on 2020-04-30 for method for creating hyperpolarization at microtesla magnetic fields. The applicant listed for this patent is Vanderbilt University Duke University The Board of Trustees of Southern Illinois University. Invention is credited to Danila A. Barskiy, Eduard Y. Chekmenev, Boyd Goodson, Roman V. Shchepin, Thomas Theis, Warren S. Warren.
| Application Number | 20200132788 16/607701 |
| Document ID | / |
| Family ID | 64105642 |
| Filed Date | 2020-04-30 |


View All Diagrams
| United States Patent Application | 20200132788 |
| Kind Code | A1 |
| Chekmenev; Eduard Y. ; et al. | April 30, 2020 |
METHOD FOR CREATING HYPERPOLARIZATION AT MICROTESLA MAGNETIC FIELDS
Abstract
Provided are methods for nuclear spin polarization enhancement via signal amplification by reversible exchange at very low magnetic fields. The spin polarization is hyperpolarization of isotopically enriched heteronuclei by using a catalyst and parahydrogen to create a complex using iridium and applying magnetic fields in the microtesia range to transfer the spin order from parahydrogen to the complex.
| Inventors: | Chekmenev; Eduard Y.; (Brentwood, TN) ; Barskiy; Danila A.; (Nashville, TN) ; Shchepin; Roman V.; (Nashville, TN) ; Warren; Warren S.; (Durham, NC) ; Theis; Thomas; (Durham, NC) ; Goodson; Boyd; (Carbondale, IL) | ||||||||||
| Applicant: |
|
||||||||||
|---|---|---|---|---|---|---|---|---|---|---|---|
| Family ID: | 64105642 | ||||||||||
| Appl. No.: | 16/607701 | ||||||||||
| Filed: | May 12, 2018 | ||||||||||
| PCT Filed: | May 12, 2018 | ||||||||||
| PCT NO: | PCT/US2018/032485 | ||||||||||
| 371 Date: | October 23, 2019 |
Related U.S. Patent Documents
| Application Number | Filing Date | Patent Number | ||
|---|---|---|---|---|
| 62505721 | May 12, 2017 | |||
| Current U.S. Class: | 1/1 |
| Current CPC Class: | G01R 33/282 20130101; A61K 49/10 20130101; G01R 33/445 20130101 |
| International Class: | G01R 33/28 20060101 G01R033/28; G01R 33/44 20060101 G01R033/44 |
Goverment Interests
STATEMENT OF GOVERNMENT INTEREST
[0002] This invention was made with government support under Awards Nos. CHE-1058727, CHE-1363008, CHE-1416268 and CHE-1416432, each awarded by the National Science Foundation, Award Nos. 1R21EB018014, 1R21EB020323, and 1R21CA220137, each awarded by the National Institutes of Health, and Award Nos. W81XWH-12-1-0159IBC 112431, W81 XWH-15-1-0271 and W81XWH-15-1-0272, each awarded by the Department of Defense. The Government has certain rights in the invention.
Claims
1. A method of hyperpolarizing heteronuclei, the method comprising: (a) combining a plurality of molecules of parahydrogen, a plurality of molecules of a catalyst, and a plurality of molecules of a compound, where the compound includes a heteronucleus and another atom that exists naturally as either a quadrupolar or a non-quadrupolar isotope, where the heteronucleus in at least 50% of the plurality of molecules of the compound is a hyperpolarizable heteronucleus, and where the plurality of molecules of the compound have been modified so as to isotopically enrich the other atom with the non-quadrupolar isotope, and where the parahydrogen, the compound and the catalyst associate to form a complex; and (b) applying a magnetic field with a strength of less than 50 .mu.T to the complex, thereby transferring the spin order from the parahydrogen to the hyperpolarizable heteronucleus associated with the complex.
2. The method of claim 1, where the other atom is a nitrogen atom, and the plurality of molecules of the compound have been modified so as to isotopically enrich the nitrogen atom with .sup.15N.
3. The method of either of claim 1 or claim 2, where the other atom is a hydrogen atom, and the plurality of molecules of the compound have been modified so as to isotopically enrich the hydrogen atom with .sup.1H.
4. The method of any of claims 1-3, where the hyperpolarizable heteronucleus is .sup.13C.
5. The method of any of claims 1-3, where the hyperpolarizable heteronucleus is .sup.19F.
6. The method of any of claims 1-3, where the hyperpolarizable heteronucleus is .sup.15N, .sup.29Si, .sup.31P, .sup.129Xe, .sup.7Li, .sup.89Y, .sup.107Ag or .sup.109Ag.
7. The method of any of claims 1-6, where the spin order is transferred during a temporary association of parahydrogen, the compound, and the catalyst while maintaining the chemical identity of the compound.
8. The method of any of claims 1-7, where the magnetic field is determined by matching the resonance frequency of parahydrogen with the resonance frequency of at least one hyperpolarizable nucleus of the compound.
9. The method of any of claims 1-8, where the magnetic field has a strength of less than 20 .mu.T.
10. The method of any of claims 1-9, where the magnetic field has a strength of about 0.1 to about 1 .mu.T.
11. The method of any of claims 1-10, where the catalyst is a heterogeneous catalyst.
12. The method of any of claims 1-10, where the catalyst is a homogeneous catalyst.
13. The method of any of claims 1-12 where the catalyst comprises a transition metal.
14. The method of claim 13, where the transition metal in the complex coordinates with the other atom.
15. The method of either of claim 13 or claim 14, wherein the transition metal is iridium.
16. The method of any of claims 1-15, where the catalyst is activated prior to forming the complex, and the pre-activation catalyst is [IrCl(COD)(IMes)].
17. The method of any of claims 1-10 and 13-16, where the catalyst is a homogeneous or heterogeneous catalyst, wherein the catalyst accommodates the simultaneous exchange of para-H.sub.2 and heteronuclear spin center(s), and wherein the condition of spin-spin (weak or strong J) coupling between para-H.sub.2 derived protons and heteronuclear spin center(s) is maintained.
18. The method of any of claims 1-17, where the compound is a contrast agent for an in vivo imaging technique.
19. The method of any of claims 1-18, where the heteronucleus is a first heteronucleus and the compound further includes a second heteronucleus, where the second heteronucleus in at least 50% of the plurality of molecules of the compound is a hyperpolarizable heteronucleus, wherein when the first and second heteronuclei are both hyperpolarizable, the first and second heteronuclei are a J-coupled pair; wherein upon applying the magnetic field with a strength of less than 50 .mu.T to the complex, the spin order from the parahydrogen is transferred to the J-coupled pair, thereby inducing a hyperpolarized long-lived spin state.
Description
CROSS REFERENCE TO RELATED APPLICATIONS
[0001] This application claims priority to U.S. Provisional Application No. 62/505,721, filed May 12, 2017, which is herein incorporated by reference in its entirety.
TECHNICAL FIELD
[0003] The present disclosure relates to methods for nuclear spin polarization enhancement at very low magnetic fields (e.g., significantly lower than magnetic field of Earth of .about.50 microTesla) via signal amplification by reversible exchange.
BACKGROUND
[0004] Nuclear magnetic resonance (NMR) and magnetic resonance imaging (MRI) sensitivity can be enhanced through hyperpolarization by temporarily increasing the relatively low nuclear spin polarization (P=10.sup.-6-10.sup.-5)--in some cases approaching unity--effectively providing 10.sup.4-10.sup.5-fold NMR signal enhancement. Despite the short-lived nature of hyperpolarized (HP) spin states, with typical lifetimes on the order of seconds for .sup.1H or minutes for heteronuclei (e.g., .sup.15N, .sup.13C), the considerable sensitivity gain has led to many biomedical applications where a given HP compound serves as injectable or inhalable contrast agent.
[0005] Current hyperpolarization methods for preparation of HP contrast agents include dissolution dynamic nuclear polarization (d-DNP). However, d-DNP is expensive, complex and not easily scalable. Another route to address the NMR/MRI sensitivity problem is the use of parahydrogen (abbreviated here as p-H.sub.2 or para-H.sub.2) as the hyperpolarization source, as is done in a family of techniques referred to collectively as Parahydrogen-Induced Polarization (PHIP). In traditional PHIP, molecular precursors with unsaturated chemical bonds are hydrogenated via molecular addition of para-H.sub.2, thereby transferring the nuclear spin order to the molecular products. HP .sup.13C molecules produced by this approach have been efficiently used as HP contrast agents in vivo.
[0006] In a more recent technique known as Signal Amplification by Reversible Exchange (SABRE), spin order may be transferred from para-H.sub.2 to target molecules during the lifetime of transient molecular complexes without permanent chemical change. SABRE generally uses an organometallic catalyst to transiently co-locate para-H.sub.2 and the target substrate molecule in a low-symmetry complex in solution. In low field (e.g., 5-7 mT), net spin order can be transferred from the para-H.sub.2 to the spins of the substrate via scalar couplings. SABRE derived proton hyperpolarization can be transferred to heteronuclei, but the associated efficiency is low. Accordingly, there exists a need for improved methods of hyperpolarization of heteronuclei.
SUMMARY
[0007] The present disclosure provides methods of hyperpolarizing heteronuclei, comprising: (a) combining a plurality of molecules of parahydrogen, a plurality of molecules of a catalyst, and a plurality of molecules of a compound, where the compound includes a heteronucleus and another atom that exists naturally as either a quadrupolar or a non-quadrupolar isotope, where the heteronucleus in at least 50% of the plurality of molecules of the compound is a hyperpolarizable heteronucleus, and where the plurality of molecules of the compound have been modified so as to isotopically enrich the other atom with the non-quadrupolar isotope, and where the parahydrogen, the compound and the catalyst associate to form a complex; and (b) applying a magnetic field with a strength of less than 50 .mu.T to the complex, thereby transferring the spin order from the parahydrogen to the hyperpolarizable heteronucleus associated with the complex.
[0008] Other aspects of the present disclosure include methods of performing NMR experiments, methods of obtaining MRI images, and other methods of in vivo imaging.
BRIEF DESCRIPTION OF THE DRAWINGS
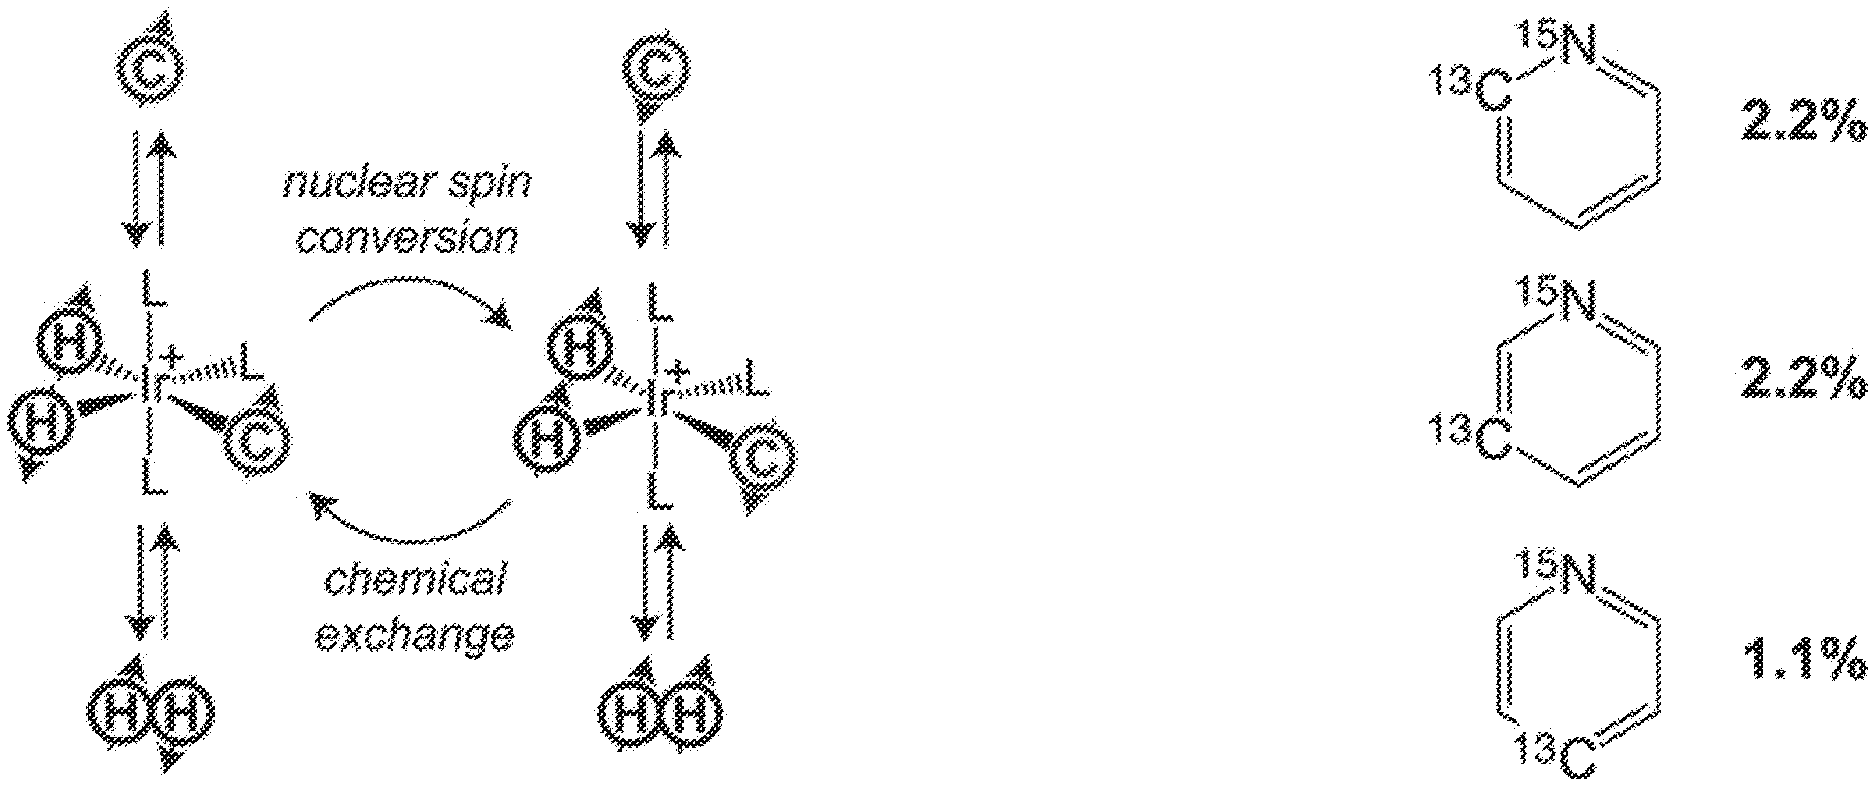
[0009] FIG. 1A: Schematic diagram of the SABRE process: coherent transfer of spin order from parahydrogen-derived hydride protons to .sup.13C heteronuclei. FIG. 1B: Molecular structure of .sup.15N-labeled pyridine with naturally abundant .sup.13C (percentage of .sup.13C in the corresponding position is shown). FIG. 1C: Most-probable .sup.15N-pyridine-bound structures of the complex with relevant AA'B spin systems responsible for the polarization transfer. L denotes ligand, and C denotes a HP .sup.13C spin within a ligand.
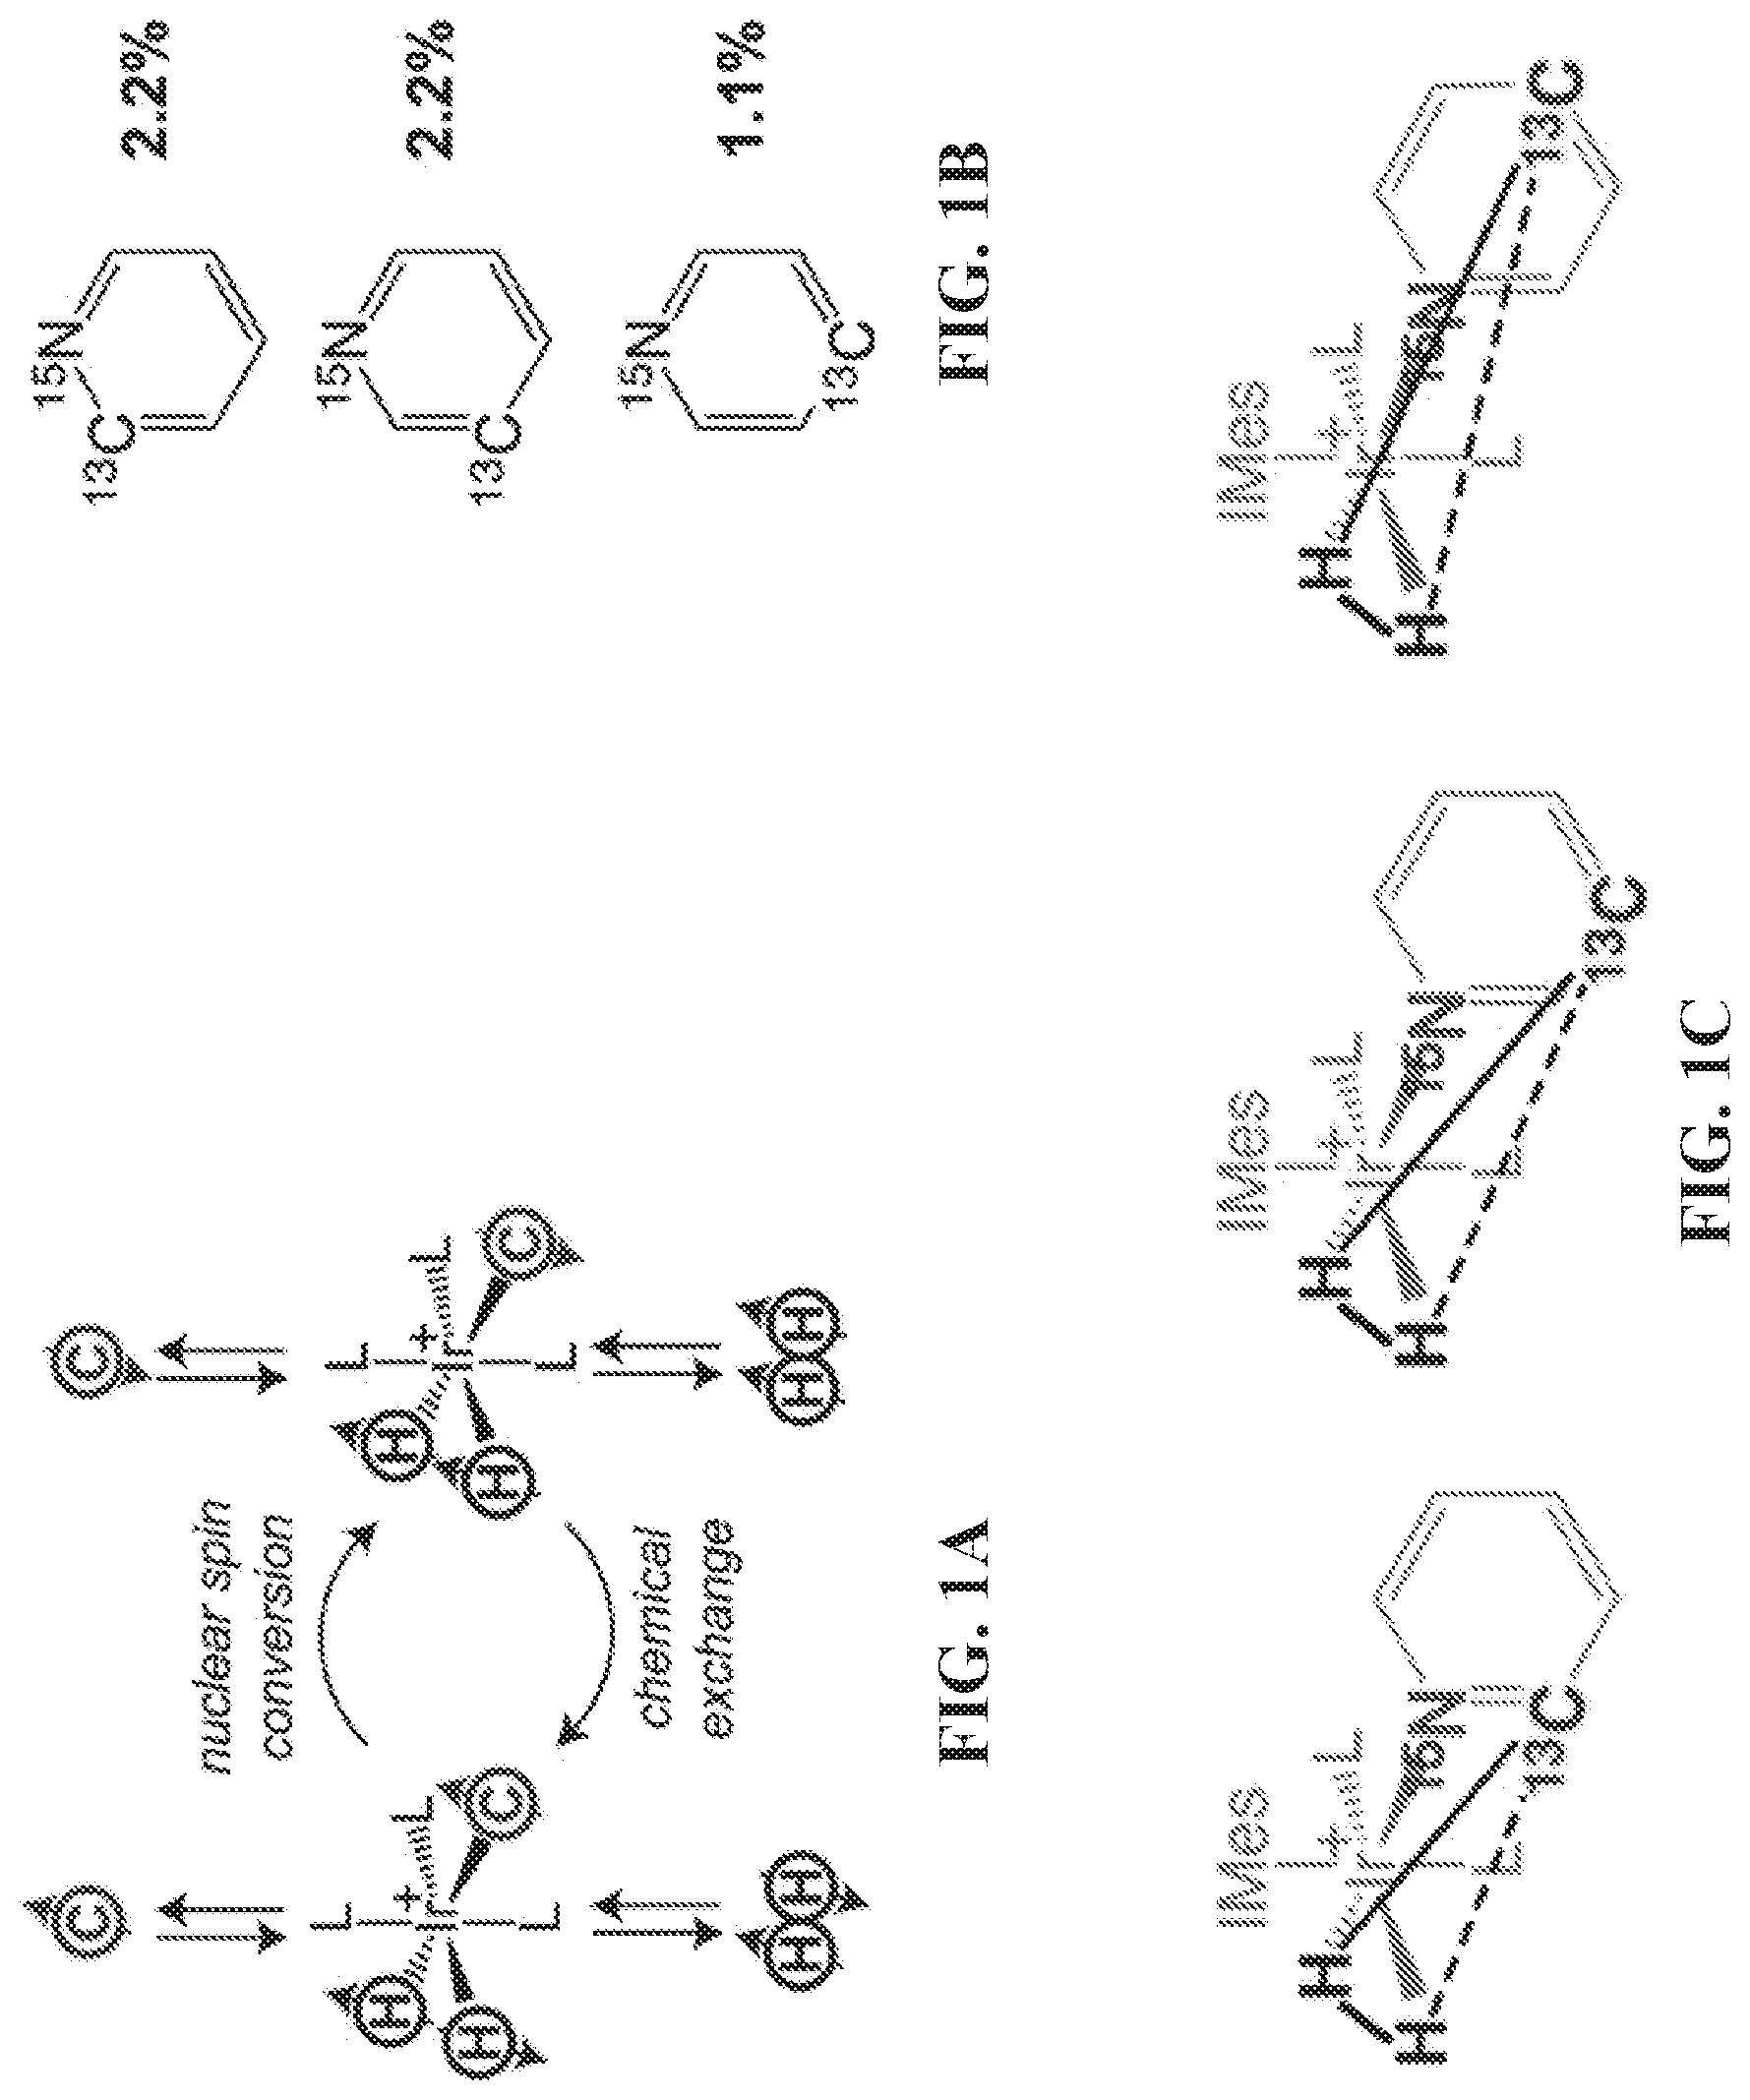
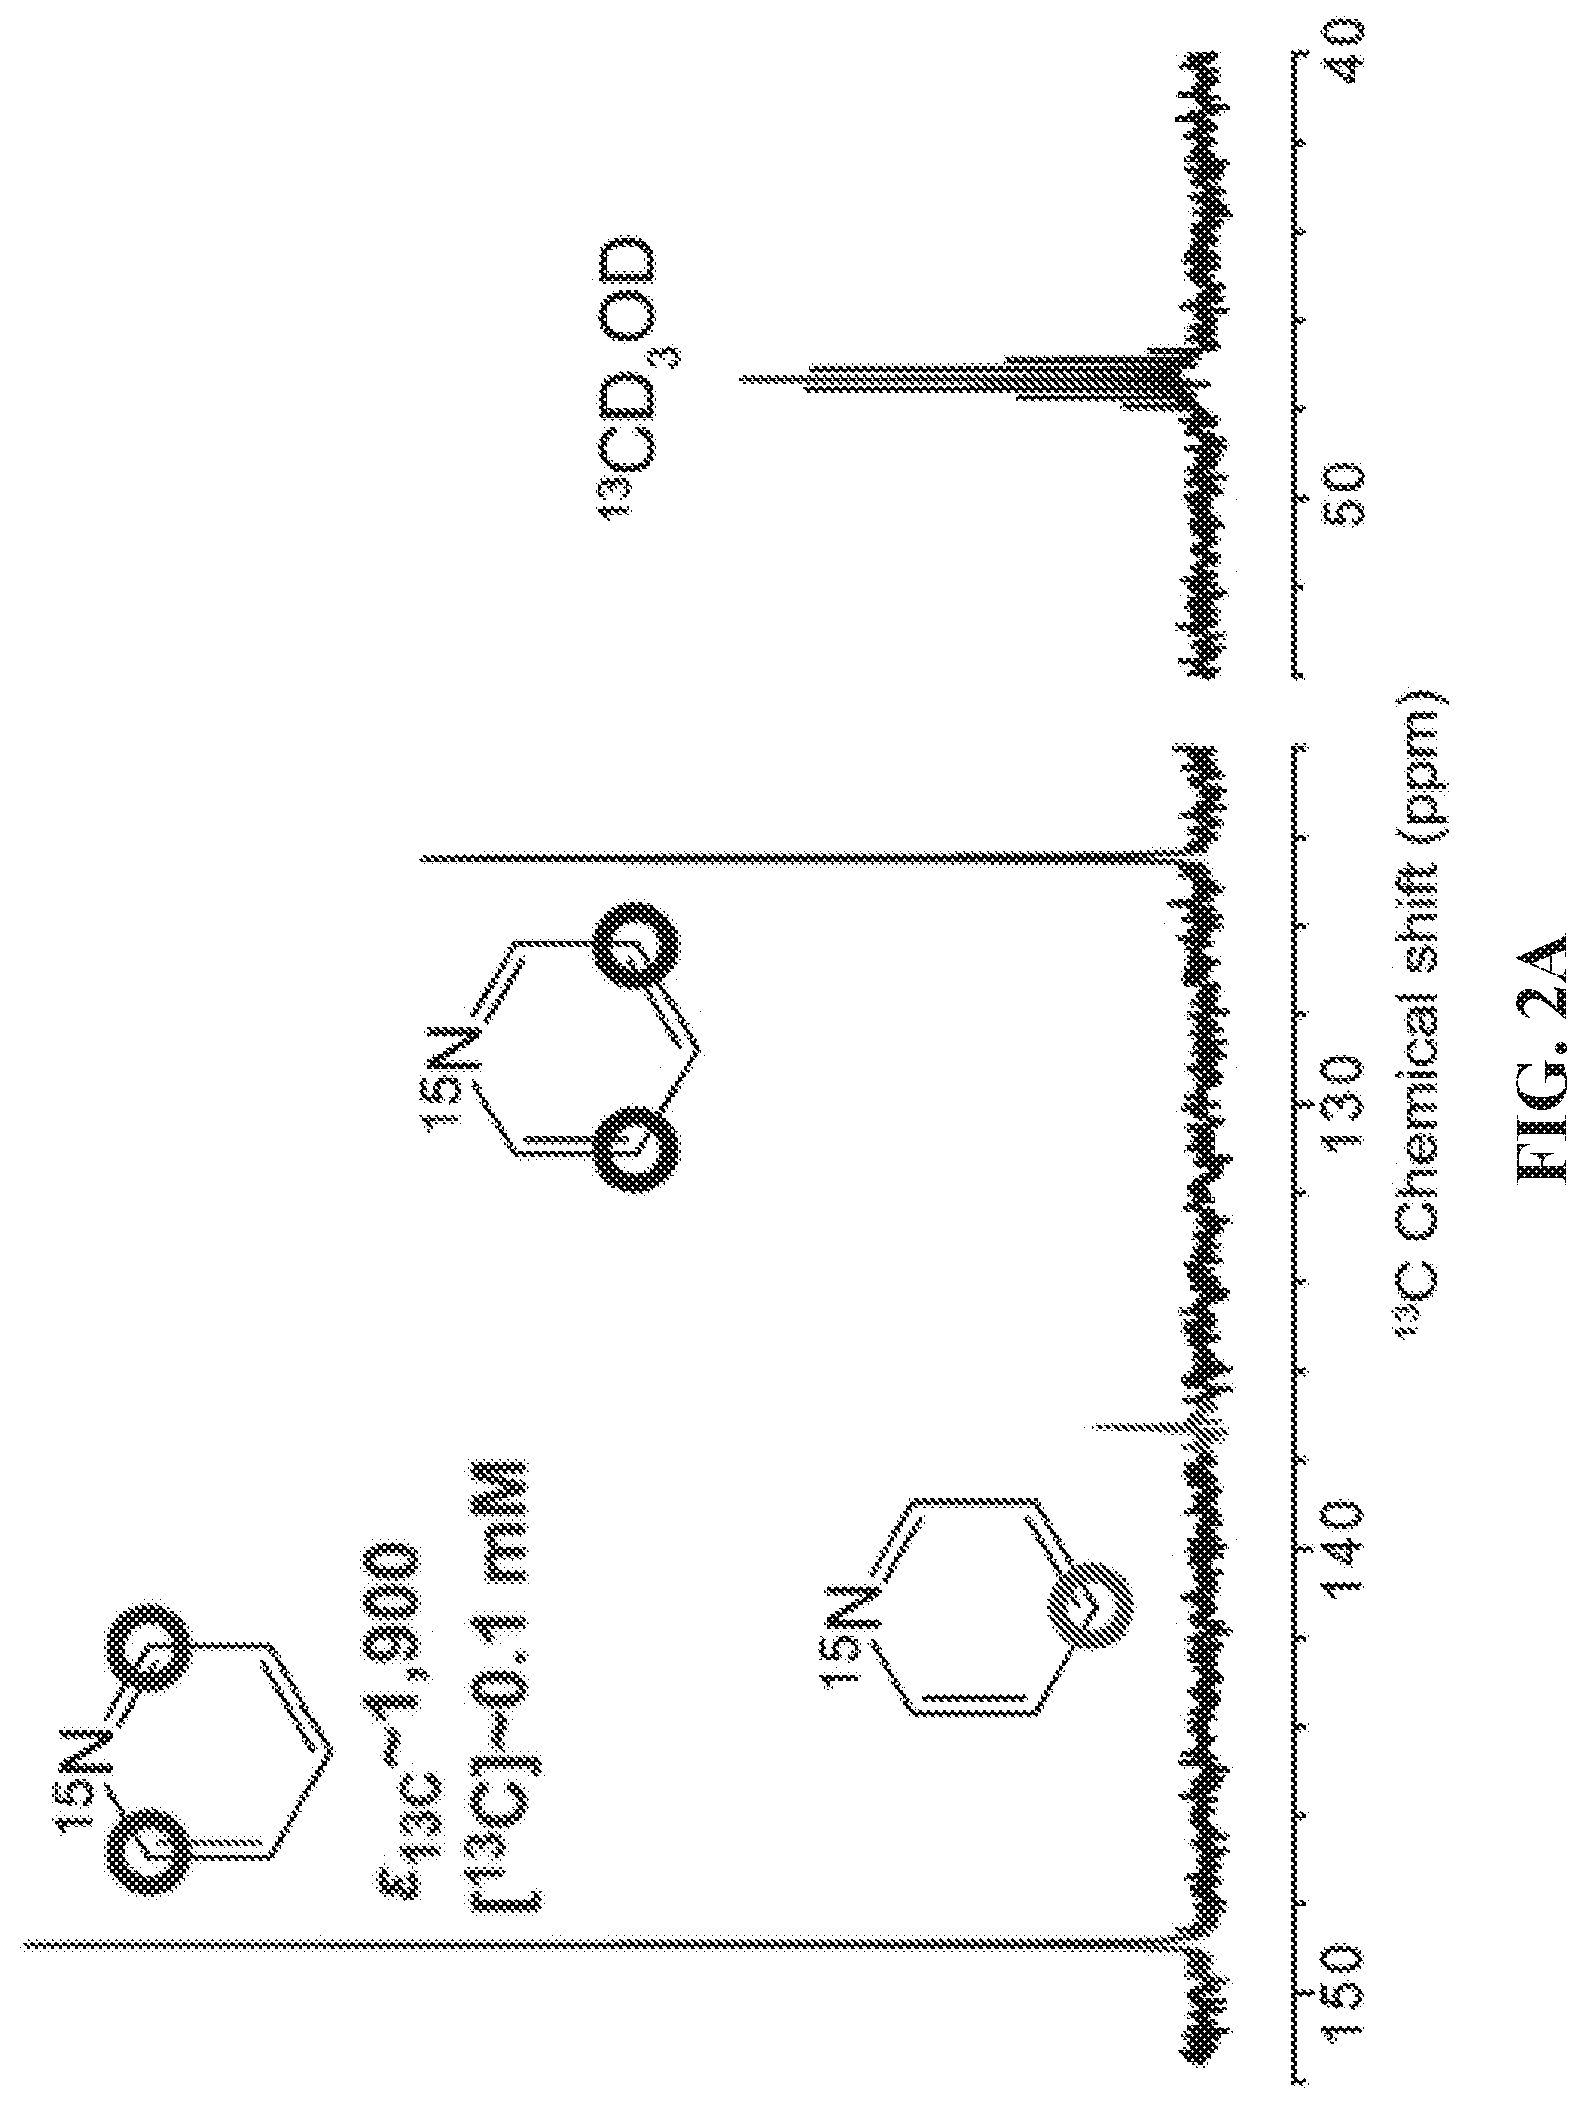
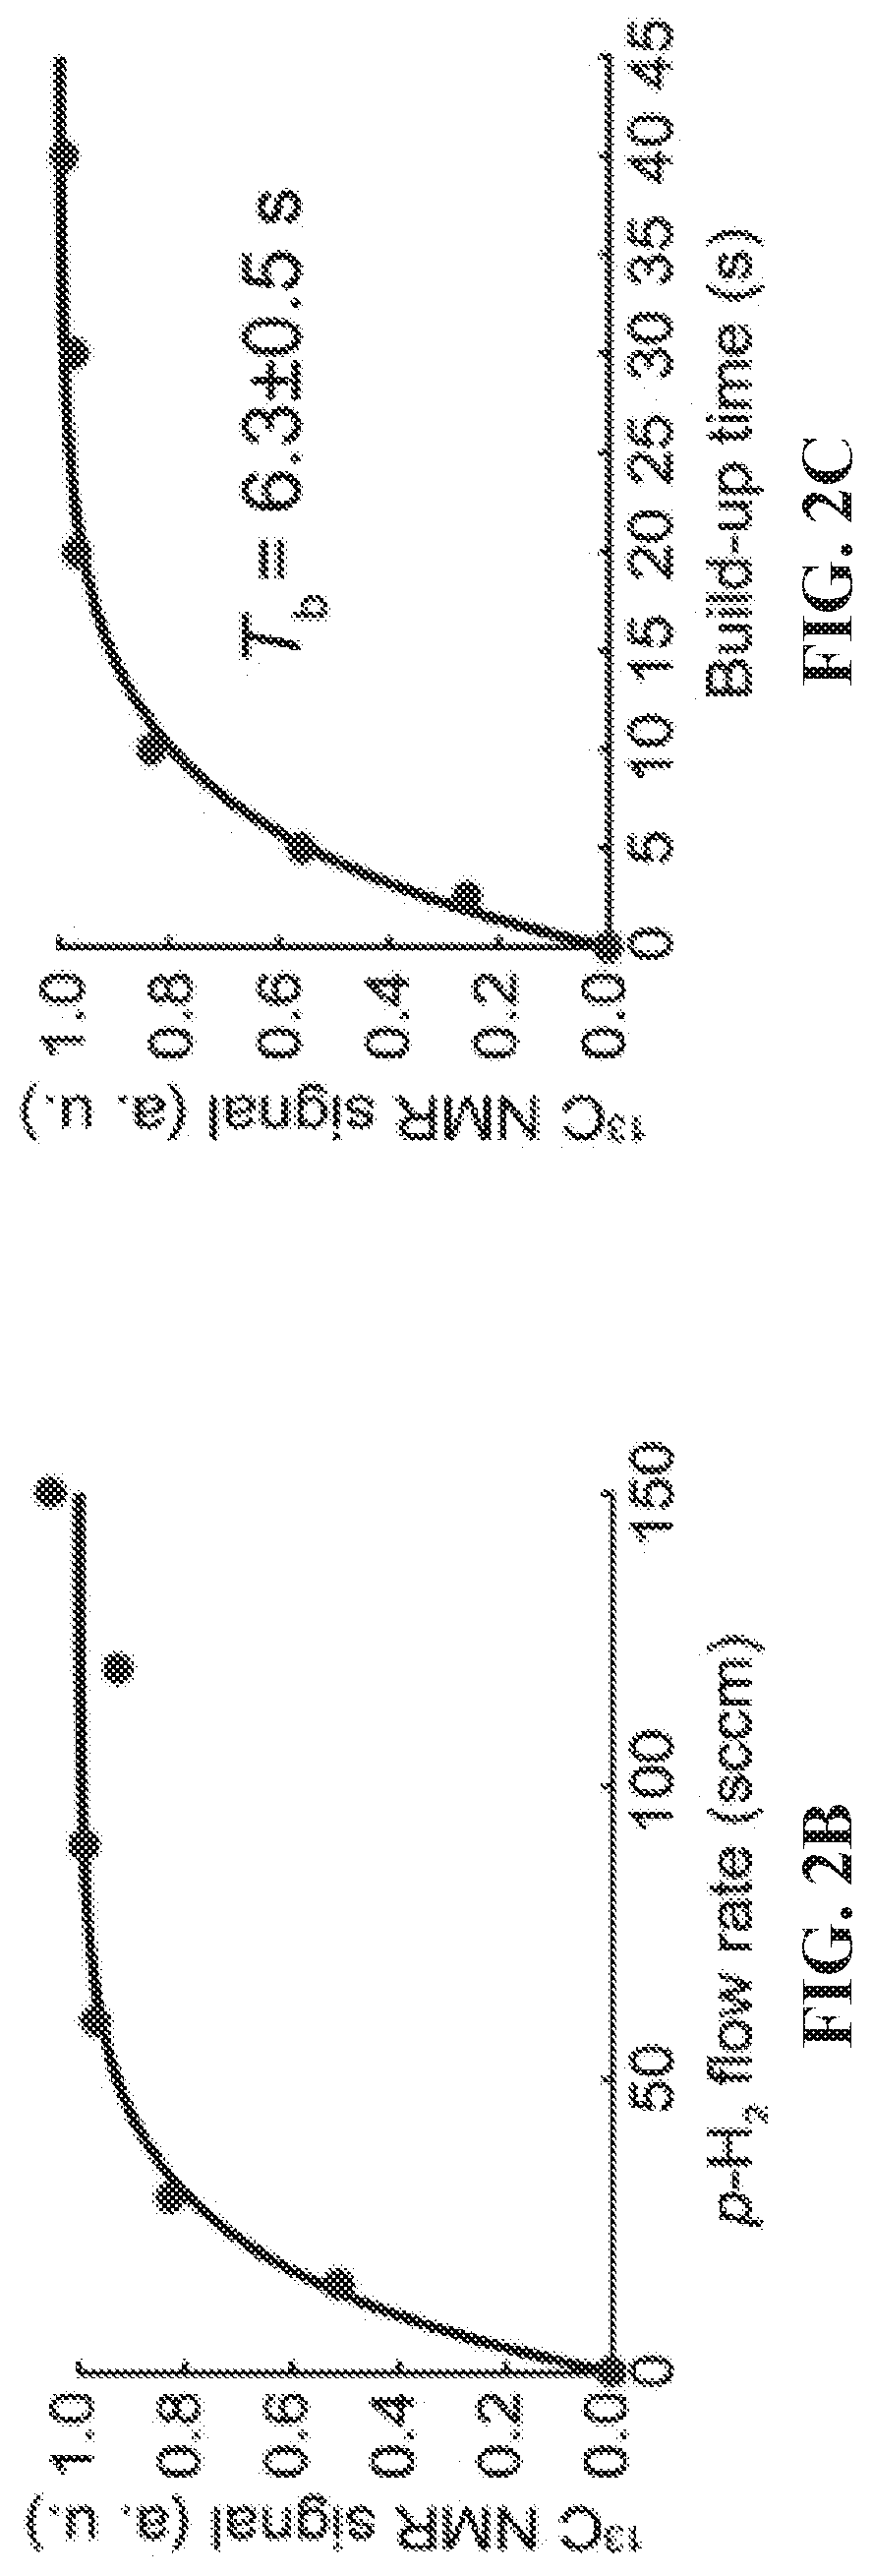
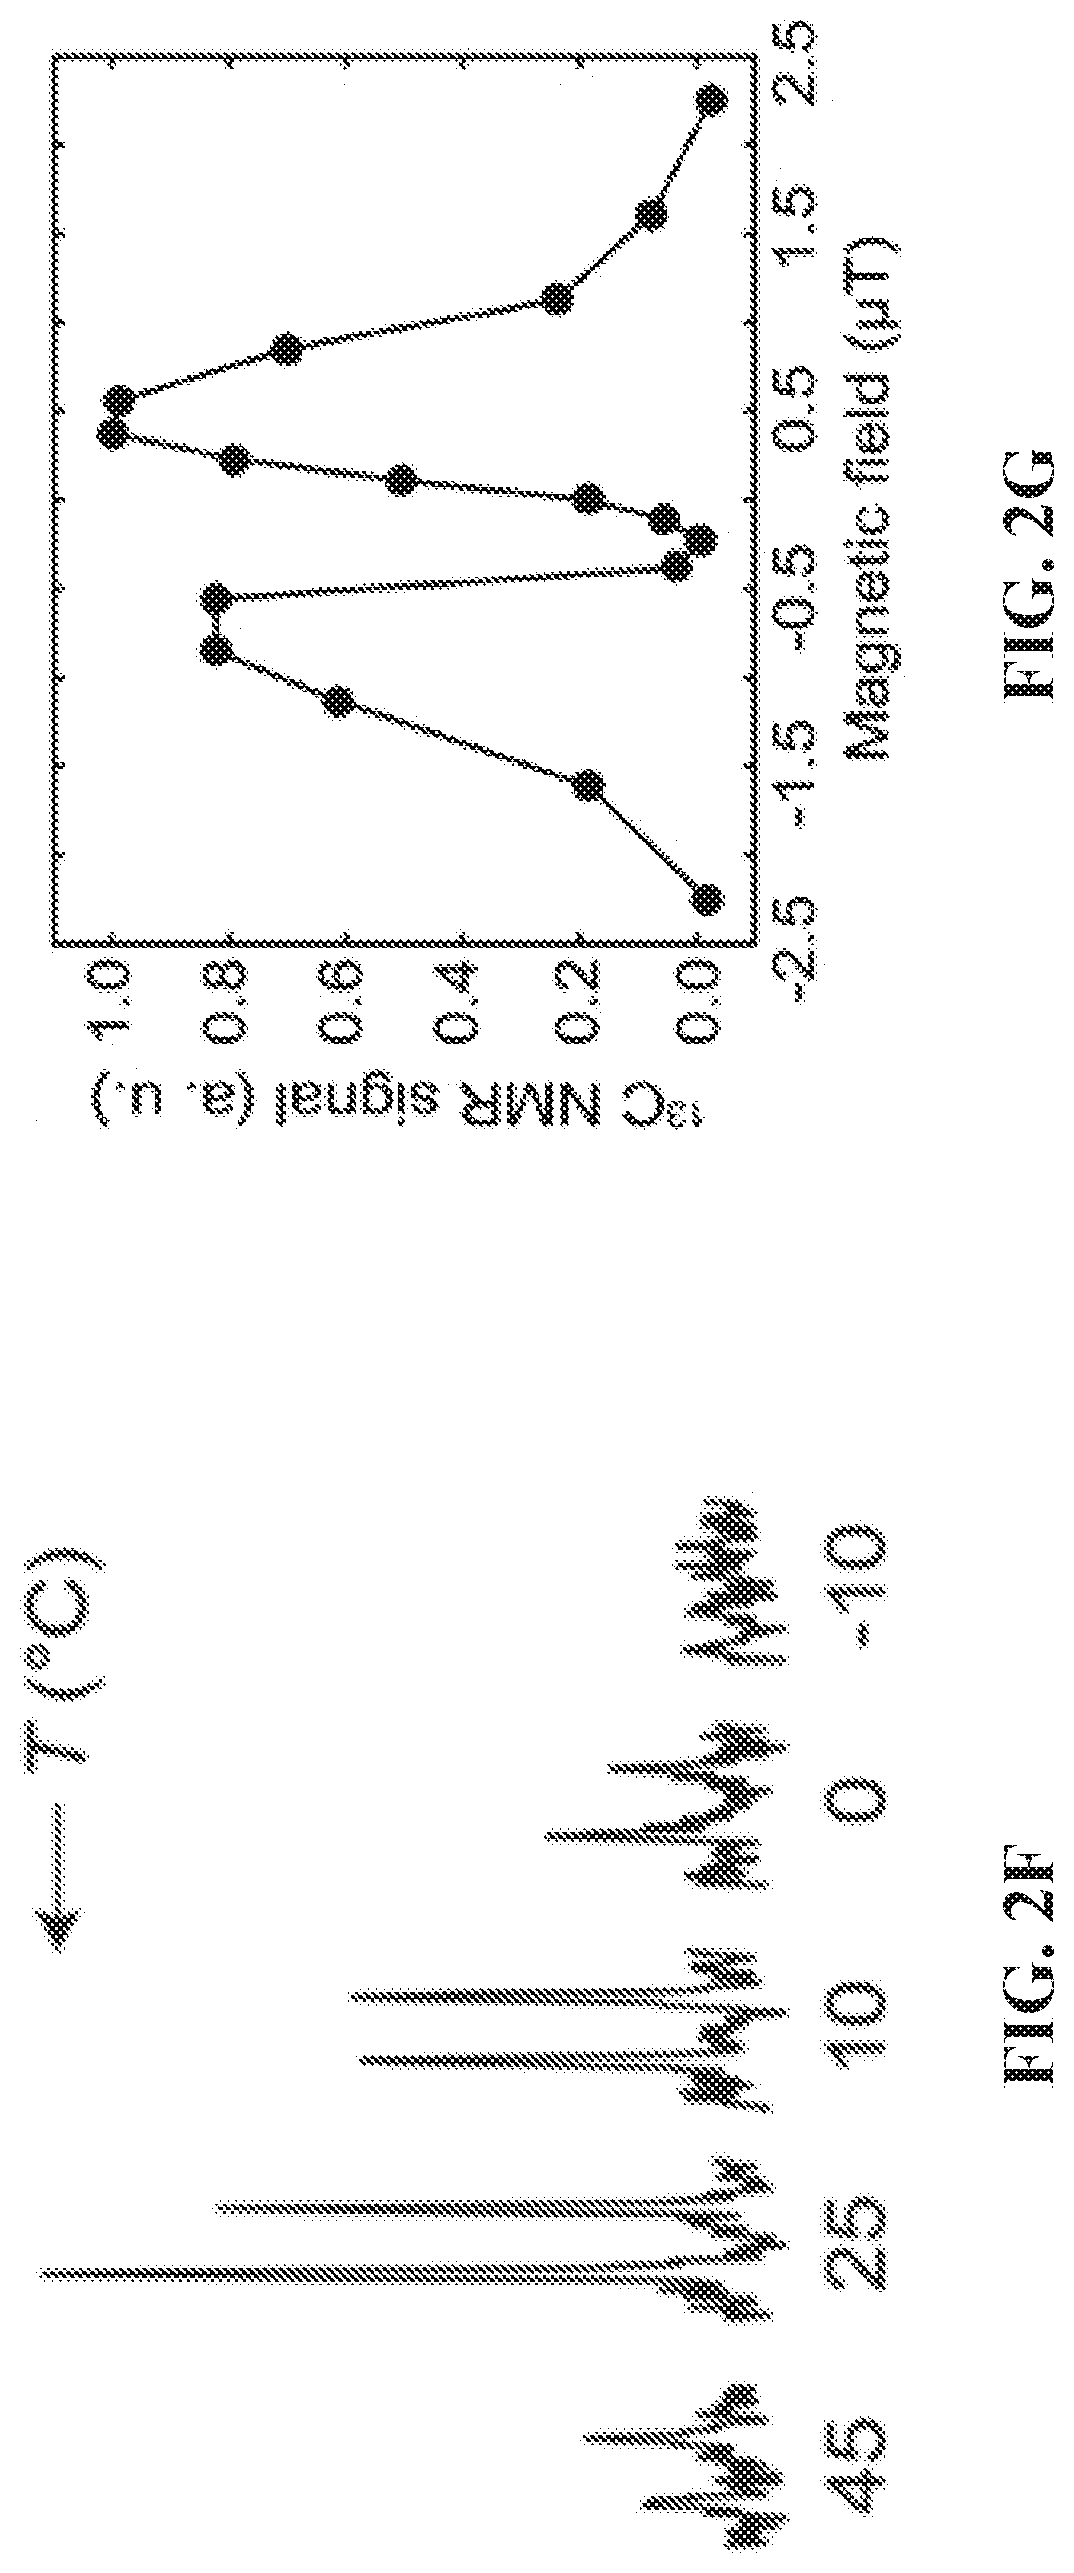
[0010] FIG. 2A: Proton-decoupled .sup.13C NMR spectrum of SABRE-hyperpolarized 5 mM .sup.15N-pyridine (left) at .sup.13C natural abundance; a .sup.13C NMR spectrum of thermally polarized CD.sub.3OD is shown (right) for comparison. FIG. 2B: .sup.13C NMR signal dependence as a function of p-H.sub.2 flow rate using a constant duration of p-H.sub.2 bubbling of 30 s. FIG. 2C: .sup.13C signal build-up curve at .about.0.4 .mu.T showing the .sup.13C NMR signal dependence on the p-H.sub.2 bubbling time. FIG. 2D: HP .sup.13C T.sub.1 relaxation measurement in the Earth's magnetic field (see SI for details). FIG. 2E: HP .sup.13C T.sub.1 relaxation measurement at high magnetic field (9.4 T) (see SI for details); FIG. 2F: Temperature dependence of the proton-coupled .sup.13C SABRE-SHEATH NMR signal of ortho-.sup.13C spins of Py-.sup.15N. FIG. 24G: Magnetic field dependence of the .sup.13C SABRE-SHEATH NMR signal (note that absorptive .sup.13C signals are observed in all cases).
[0011] FIG. 3: Proton-coupled .sup.13C NMR spectra of SABRE-SHEATH hyperpolarized Py samples with Py-.sup.14N and Py-.sup.15N at various static transfer magnetic fields.
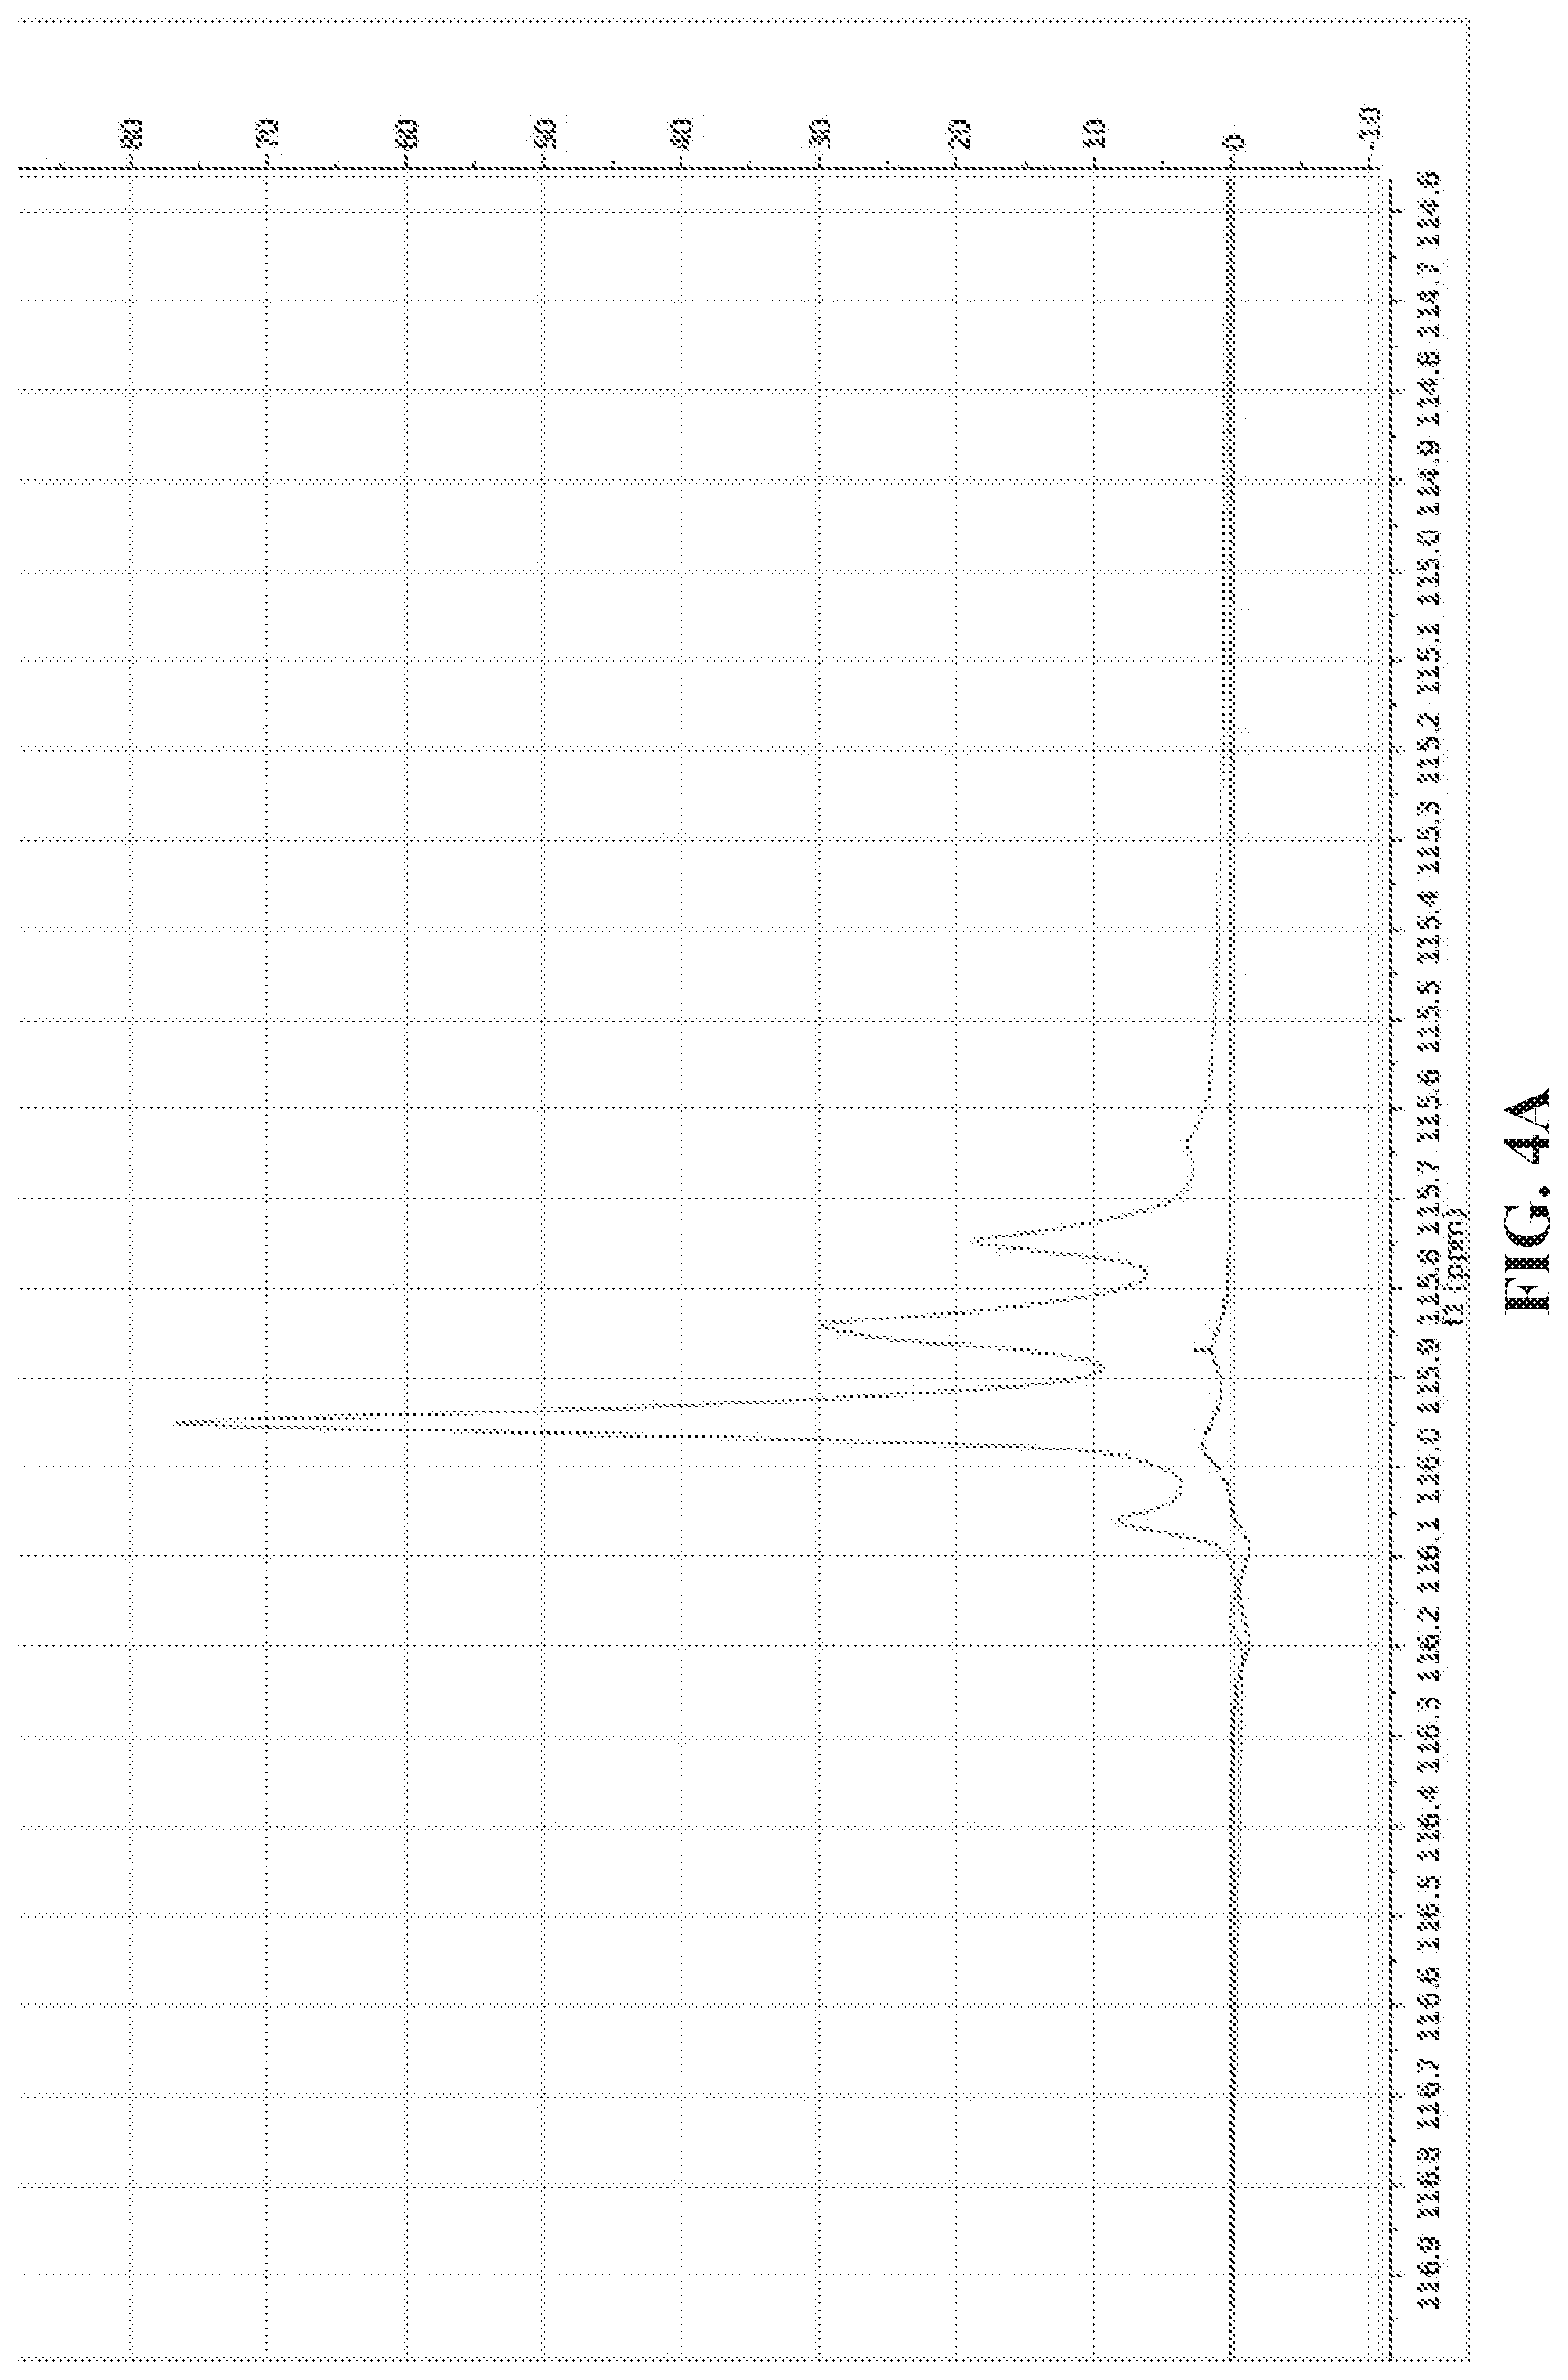
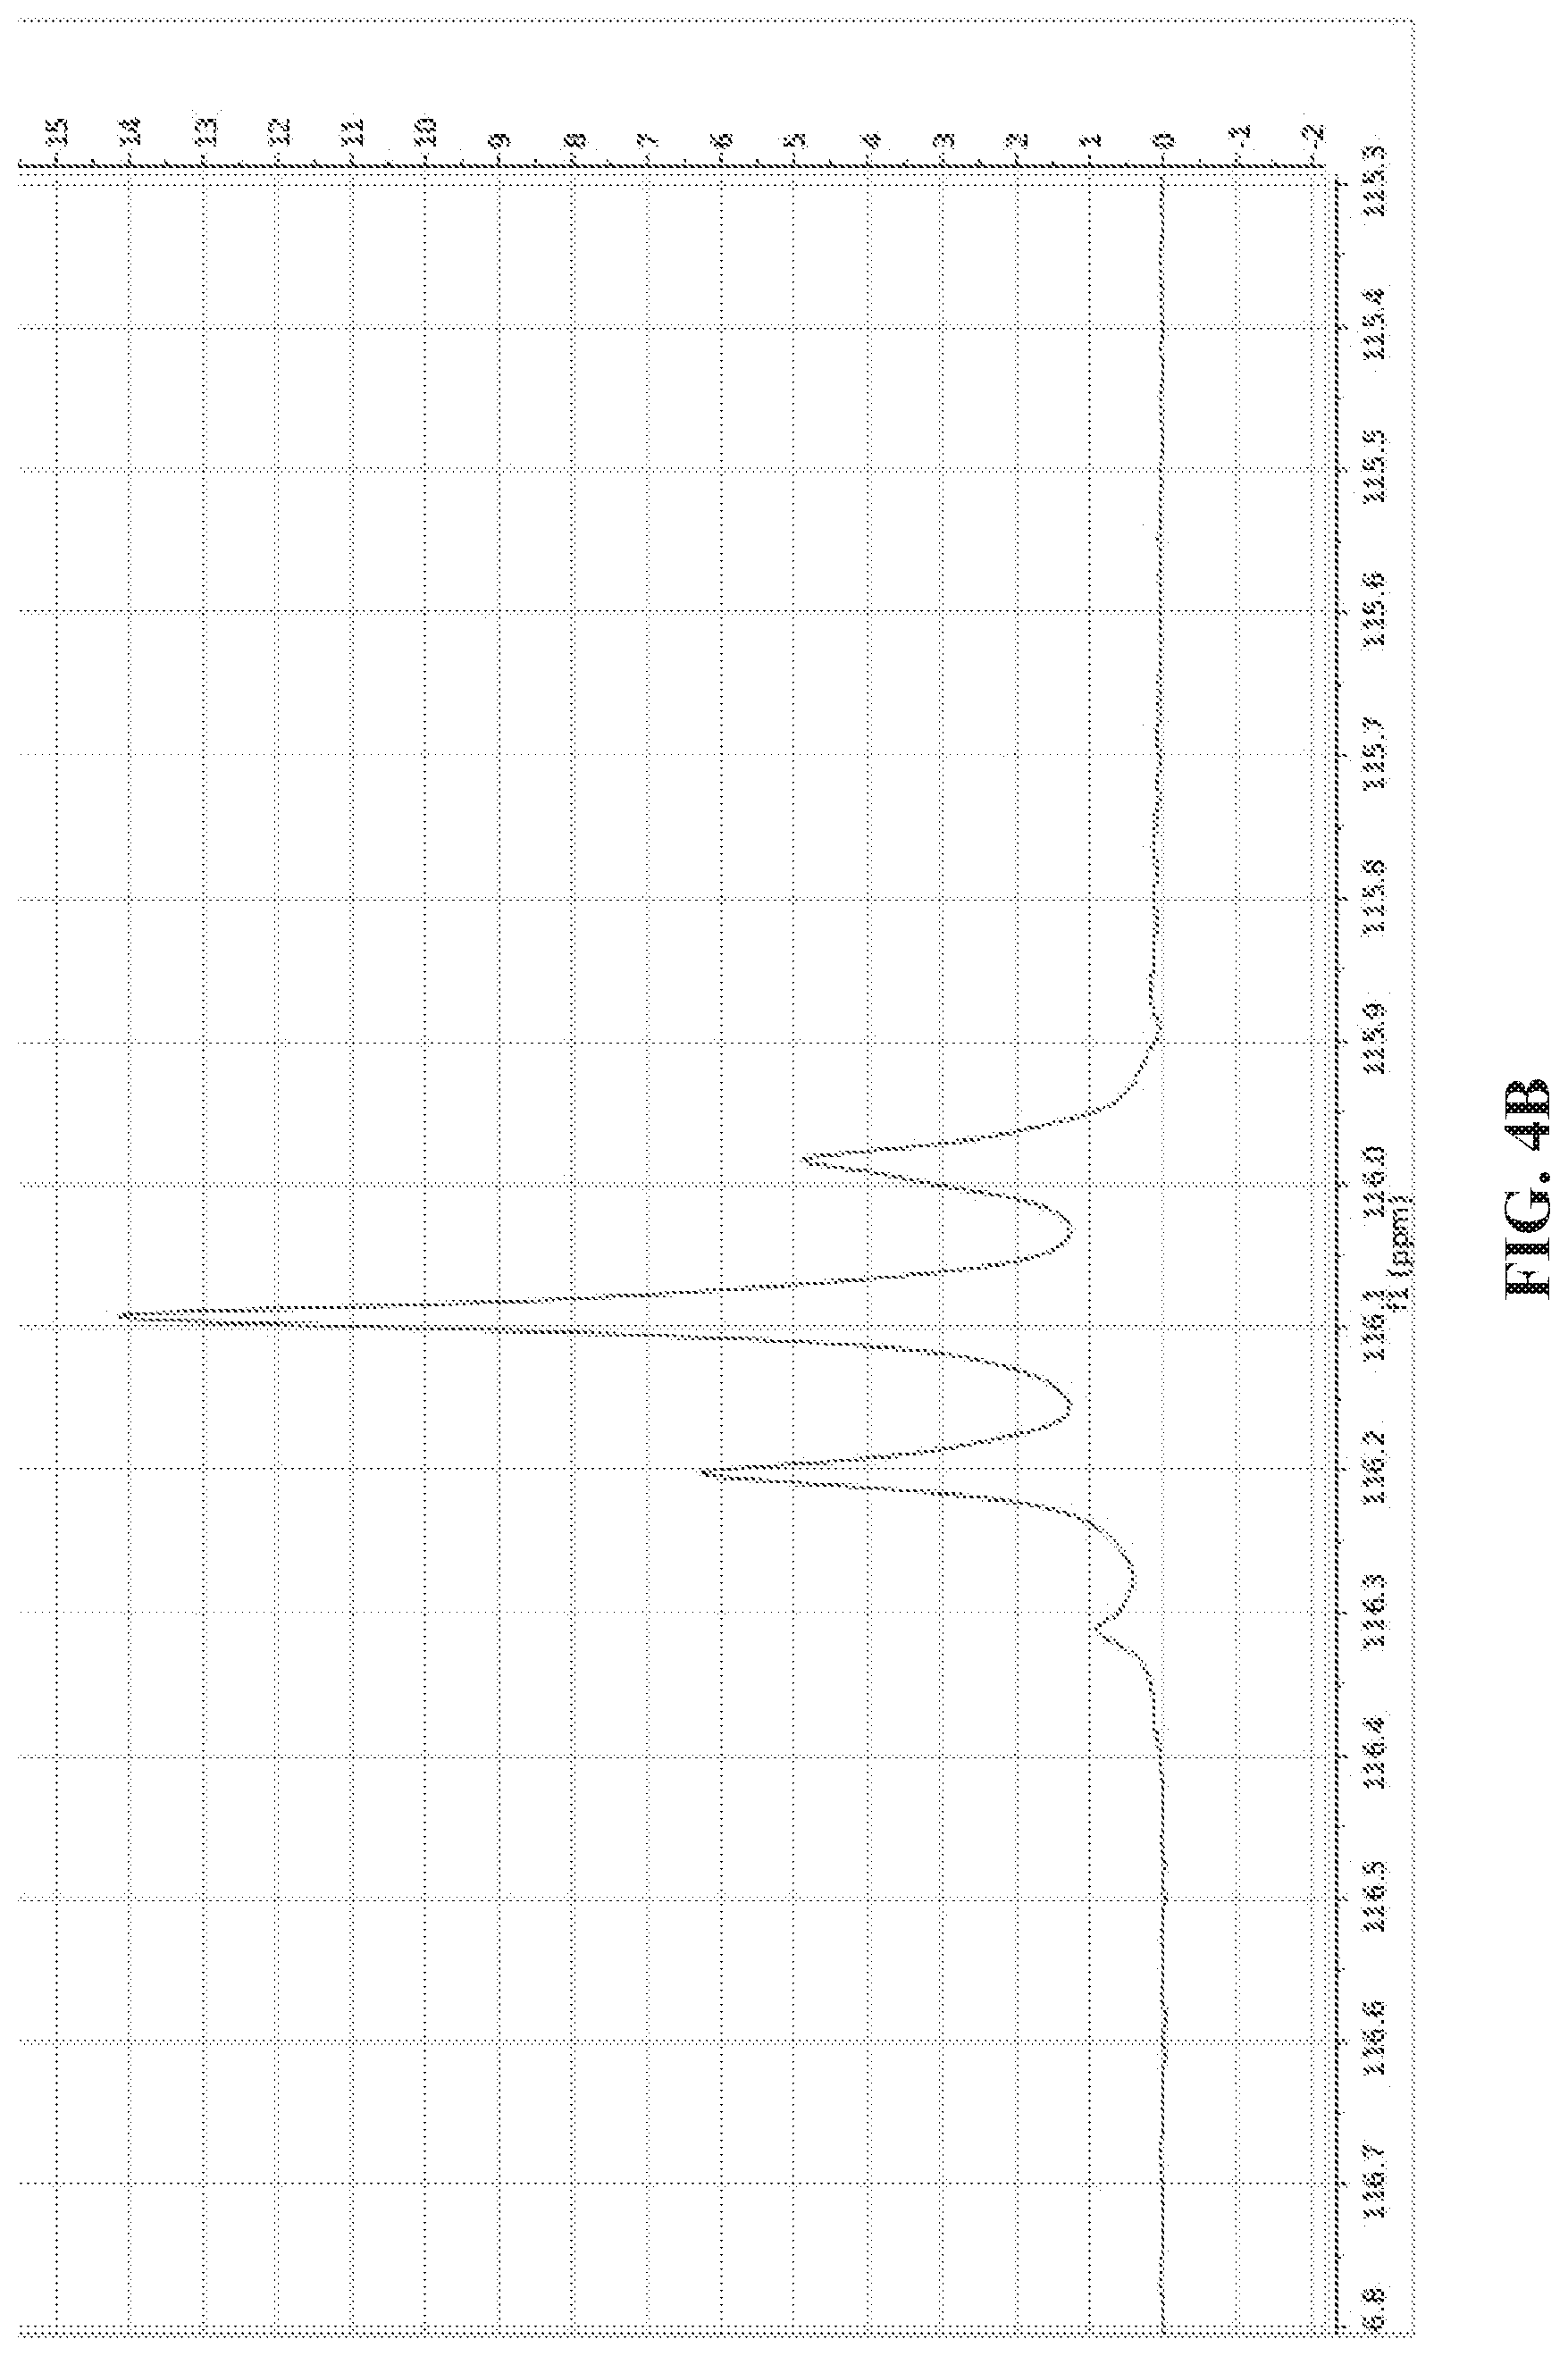
[0012] FIGS. 4A and 4B show .sup.13C NMR single-scan spectra of acetonitrile-1-.sup.13C,.sup.14N and acetonitrile-1-.sup.13C,.sup.15N hyperpolarized using SABRE-SHEATH and measured at 8.45 T. FIG. 4A: A comparison of acetonitrile-1-.sup.13C,.sup.14N (red) and acetonitrile-1-.sup.13C,.sup.15N (blue) using the same experimental conditions (100 mM of acetonitrile, 5 mM of catalyst, 30 mM of pyridine used as a co-substrate). FIG. 4B: .sup.13C NMR spectrum of hyperpolarized acetonitrile-1-.sup.13C,.sup.15N (sample composition--0.6 mM of acetonitrile-1-.sup.13C, .sup.15N.sub.1 0.2 mM of catalyst, 0.4 mM of pyridine used as a co-substrate).
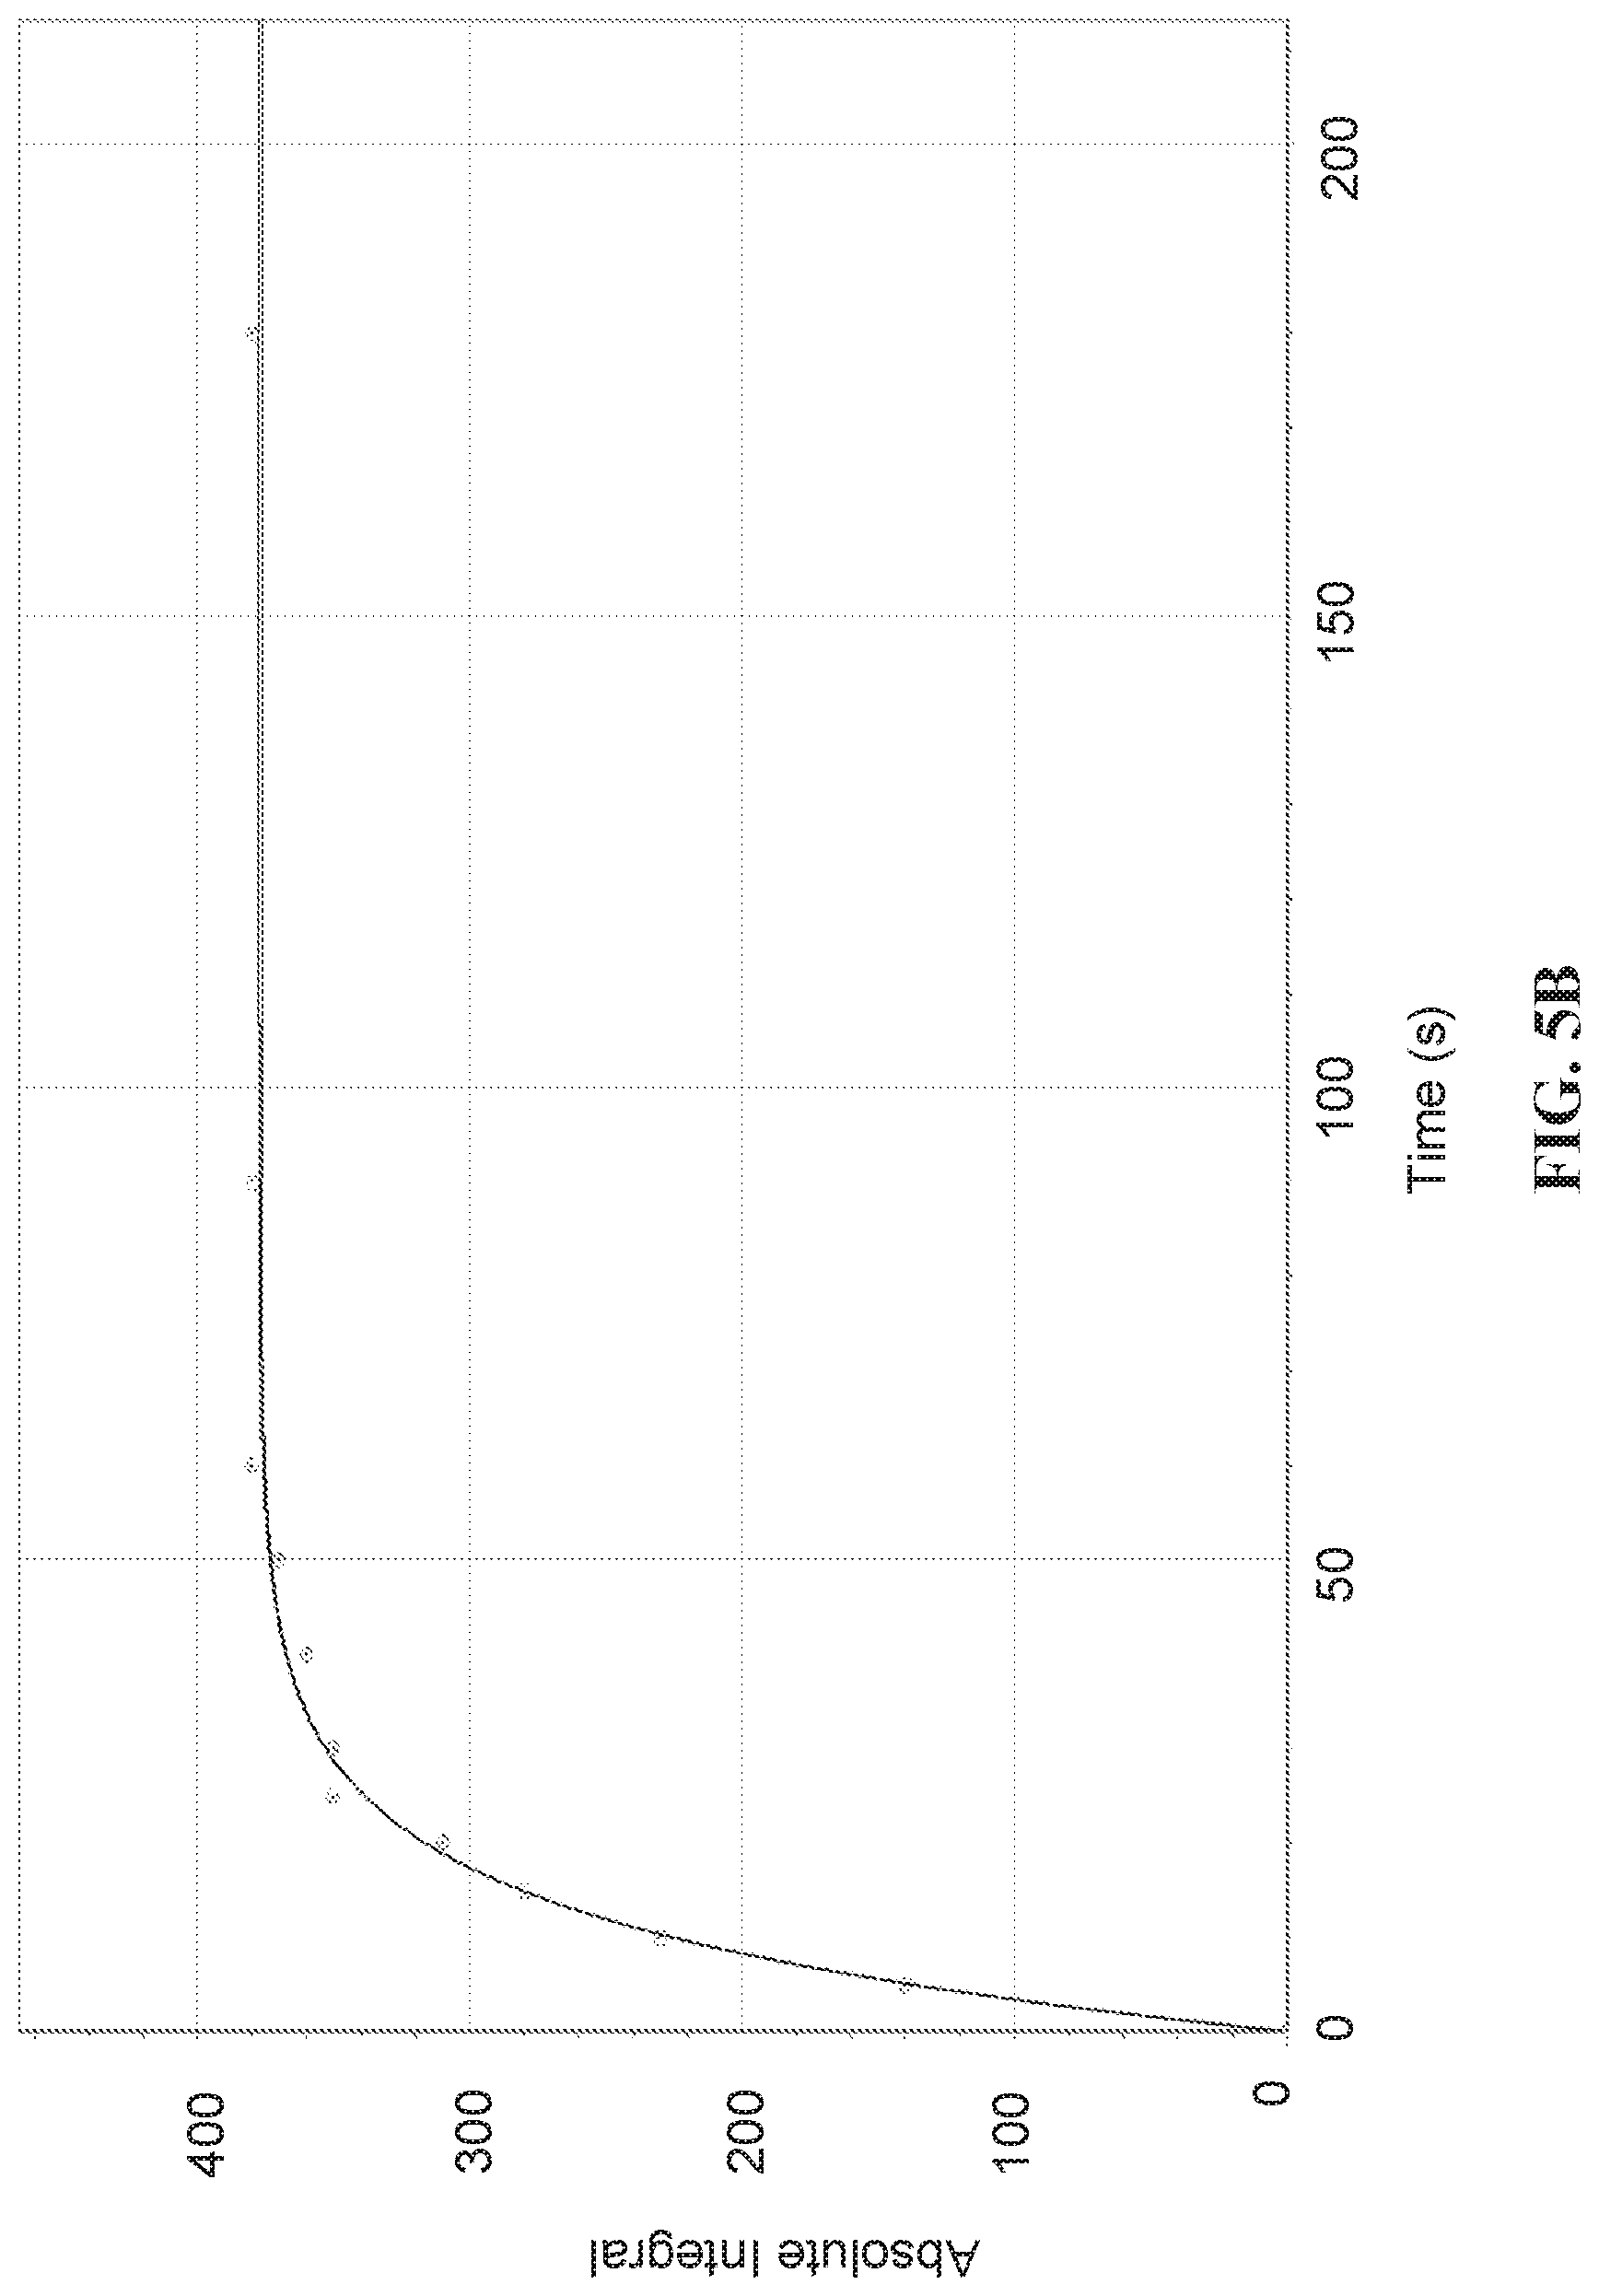
[0013] FIG. 5A: .sup.13C NMR spectrum of signal reference sample (neat CD.sub.3OD) recorded at 8.45 T, 8 scans, thermally polarized sample. FIG. 5B: .sup.13C SABRE-SHEATH hyperpolarization build-up of acetonitrile-1-.sup.13C,.sup.15N (sample composition 0.05 mM catalyst, 12 mM pyridine, 4 mM acetonitrile-.sup.13C,.sup.15N; pyridine used as a co-substrate) at .about.0.74 .mu.T static magnetic field. The effective build-up constant is .about.11 s.
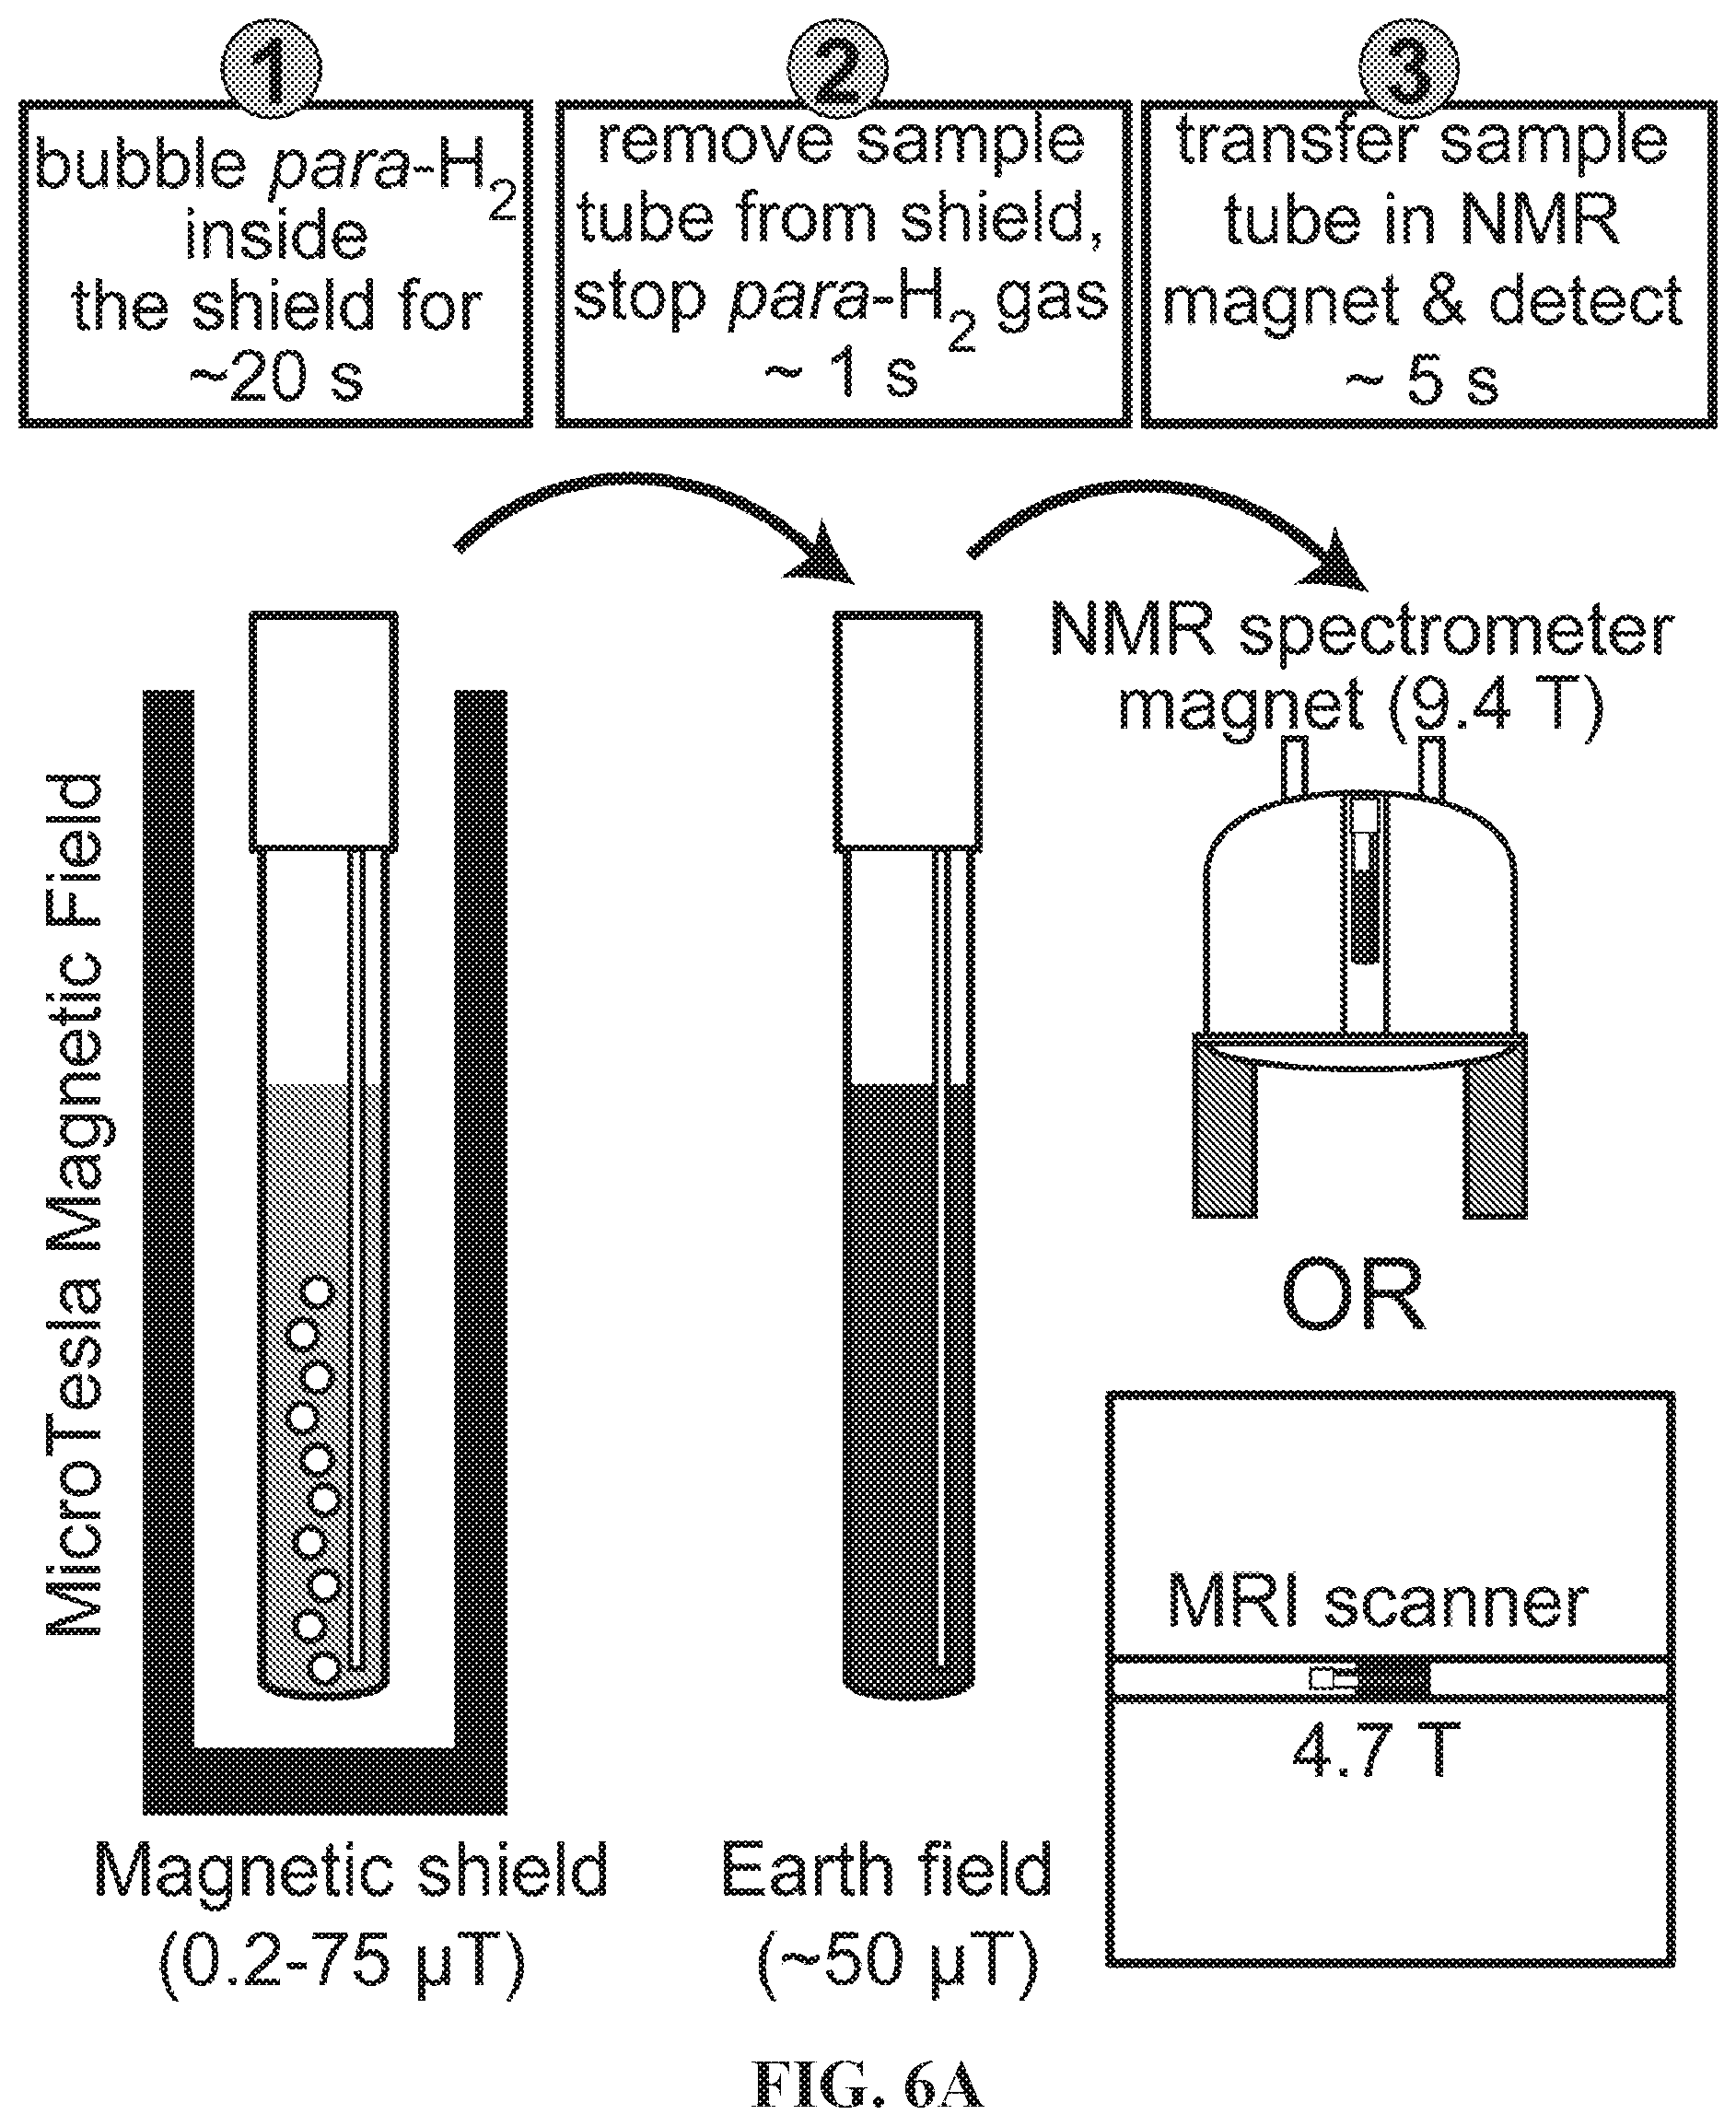
[0014] FIG. 6A: Diagram of the .sup.19F SABRE-SHEATH hyperpolarization process. The solenoid coil inside the mu-metal shield allows creating magnetic fields between 0.2 and 75 .mu.T; FIG. 6B: diagram showing para-H.sub.2 and 3-.sup.19F-Py exchange between the solvent and the IrIMes hexacoordinate complex, facilitating coherent polarization transfer; FIG. 6C: the relevant four-spin system (AA'BB') and heteronuclear spin-spin couplings relevant to the SABRE-SHEATH polarization transfer. Axial 3-.sup.19F-Py spin-spin couplings are neglected because they are significantly weaker.
[0015] FIG. 7A: .sup.19F spectrum of .about.100 mM hyperpolarized (HP) 3-.sup.19F-Py produced via SABRE-SHEATH approach at .about.5 .mu.T and .about.25.degree. C.: FIG. 7B: corresponding .sup.19F spectrum produced via conventional SABRE at .about.6 mT and .about.25.degree. C.; FIG. 7C: corresponding .sup.19F spectrum obtained with thermally polarized substrate; FIG. 7D: corresponding .sup.19F spectrum of 3-.sup.19F-Py hyperpolarized in the Earth's magnetic field (ca. 50 .mu.T). FIG. 7E: T.sub.1 decay of HP .sup.19F signal at 9.4 T; FIG. 7F: corresponding curve reflecting T.sub.1 decay of the HP .sup.19F signal occurring in the Earth's magnetic field (ca. 50 .mu.T). FIG. 7G: Build-up of .sup.19F polarization at .about.5 .mu.T using the SABRE-SHEATH hyperpolarization protocol (FIG. 1). FIG. 7H: .sup.19F HP signal dependence on magnetic field during SABRE-SHEATH hyperpolarization at .about.25.degree. C. FIG. 7I: .sup.19F HP signal dependence on temperature during SABRE-SHEATH hyperpolarization at .about.5 .mu.T. All spectra are acquired in CD.sub.3OD at 9.4 T magnetic field using a Bruker Avance III NMR spectrometer and 50% parahydrogen (para-H.sub.2).
[0016] FIGS. 8A-8D show feasibility demonstrations of hyperpolarized .sup.19F biomedical applications using HP 3-.sup.19F-Py as a model agent. FIG. 8A: .sup.19F 2D gradient echo (GRE) imaging using .about.100 mM HP substrate; FIG. 8B: corresponding .sup.19F 2D GRE image using .about.100 mM thermally polarized substrate; FIG. 8C: schematic of experimental MRI setup; both images were acquired using a 4.7 T small-animal .about.30 cm bore MRI scanner (proton channel) equipped with a surface RF coil tuned to .about.188.4 MHz and the following acquisition parameters: field of view (FOV): 128.times.128 mm.sup.2; imaging matrix: 256.times.256 pixels; TR/TE=12/6 ms; scan time: .about.3 s; frequency encoding bandwidth=50 kHz. FIG. 8D: HP .sup.19F MR spectra demonstrating pH sensing, before (red) and after (blue) addition of concentrated HCl to .about.100 mM HP substrate.
[0017] FIGS. 9A and 9B show .sup.1H NMR spectra of 3-.sup.19F-Py during (FIG. 9A) and after (FIG. 9B) SABRE catalyst precursor activation. All spectra were acquired in CD.sub.3OD with .about.50 sccm parahydrogen flow (.about.50% para-fraction, .about.6 atm) using a 9.4 T high-resolution Bruker Avance III NMR spectrometer. Note the appearance of characteristic hyperpolarized hydride intermediates at ca. (-)12 ppm and ca. (-)18 ppm. Once the catalyst is fully activated (i.e. converted into the hexacoordinate complex shown in FIG. 6B, the NMR peaks corresponding to intermediates disappear, and only the main hydride peaks ca. (-)23 ppm are present, corresponding to the SABRE-active hyperpolarized hydride resonance lines.
[0018] FIG. 10 .sup.1H NMR spectra of hyperpolarized (top, red trace) and thermally polarized (bottom, blue trace) 3-.sup.19F-Py after SABRE catalyst activation. The spectrum of the thermally polarized substrate serves as a signal reference for determining the signal enhancement .epsilon.. All spectra were acquired in CD.sub.3OD with .about.100 sccm parahydrogen flow (.about.50% para-fraction, .about.6 atm) using a 9.4 T high-resolution Bruker Avance III NMR spectrometer. For the SABRE hyperpolarized spectrum (top, red trace), the sample was first bubbled at B.sub.0 of .about.6 mT (magnet fringe field) and then quickly (<4 s) inserted into the bore of the 9.4 T NMR spectrometer for NMR spectrum acquisition.
[0019] FIG. 11A: The overall schematic of SABRE hyperpolarization of .sup.15N. Spin order is transferred from para-H.sub.2 and mediated by scalar spin-spin couplings within a reversibly-formed Ir-IMes hexacoordinate complex. Direct SABRE of short-range .sup.15N sites is accomplished via 2-bond couplings between .sup.15N and hydride protons. FIG. 11B: the molecular framework (note axial ligand of polarization transfer from hydride protons via short- and long-range spin-spin (J) couplings.
[0020] FIG. 12A: the schematic of SABRE polarization experiments for .sup.1H hyperpolarization studies. FIG. 12B: the schematic of SABRE re-polarization experiments for .sup.1H hyperpolarization studies.
[0021] FIG. 13A: the schematic of SABRE-SHEATH polarization experiments for .sup.15N and .sup.13C hyperpolarization studies. FIG. 13B: the schematic of SABRE-SHEATH re-polarization experiments for .sup.15N and .sup.13C hyperpolarization studies.
[0022] FIGS. 14A-14D: .sup.1H NMR spectra of SABRE-hyperpolarized .about.100 mM pyridine solutions in methanol-d.sub.4. All NMR spectra were recorded using Bruker Avance III 9.4 T NMR spectrometer. FIG. 14A: Thermally polarized spectrum provided for signal referencing. FIG. 14B: NMR spectrum of SABRE-hyperpolarized solution (at .about.6 mT) after cessation of para-H.sub.2 bubbling (FIG. 12A). FIG. 14C: NMR spectrum of SABRE-hyperpolarized (at .about.6 mT) solution after frequency-selective RF irradiation leading to selective destruction of Ha hyperpolarization; FIG. 14D: the corresponding NMR spectrum after the sample prepared in c) was re-hyperpolarized at .about.6 mT without para-H.sub.2 bubbling (FIG. 12B). The overall signal intensity of the spectrum shown in FIG. 14D decreased compared to that in spectrum FIG. 14C due to relaxation processes leading to polarization decay during the additional .about.6 s required for sample shuttling. The total shuttling time (after cessation of para-H.sub.2 bubbling) for spectrum d is >10 s, i.e. more than 3*T.sub.1 of hydrides, and significantly shorter than T.sub.1 of aromatic protons (19.+-.1 s), and therefore, it was concluded that the residual polarization of hydrides cannot serve as a source of re-polarization in spectrum in spectrum d.
[0023] FIG. 15 shows a schematic of the SABRE-SHEATH hyperpolarization process of metronidazole-.sup.15N.sub.2-.sup.13C.sub.2 using transfer of spin order from para-H.sub.2 on an Ir-IMes hexacoordinate complex. SABRE-SHEATH is accomplished via spin-spin couplings between para-H.sub.2-derived hydride protons and nuclear spins of the equatorial exchangeable ligands. The axial ligands are not exchangeable.
[0024] FIGS. 16A-16G show NMR spectra of metronidazole-.sup.15N.sub.2-.sup.13C.sub.2 hyperpolarized using SABRE-SHEATH setup (FIG. 13A). FIG. 16A: HP .sup.15N NMR spectrum, FIG. 16B: .sup.15N spectrum from a thermally polarized reference sample, FIG. 16C: HP .sup.13C NMR spectrum, FIG. 16D: .sup.13C spectrum from a thermally polarized reference sample, FIG. 16E: HP .sup.1H NMR spectrum (polarization at .about.6 mT), FIG. 16F: .sup.1H spectrum from a thermally-polarized sample, FIG. 16G: HP .sup.1H NMR spectrum (polarization at <1 .mu.T), All spectra were recorded using Bruker Avance III 9.4 T NMR spectrometer.
[0025] FIG. 17 shows the relevant spin-spin coupling schemes for three .sup.15N sites at natural abundance of .sup.15N and .sup.13C (FIGS. 17A, 17B, and 17C) and the network for labeled metronidazole-.sup.15N.sub.2-.sup.13C.sub.2(FIG. 17D). Only two-bond heteronuclear couplings are shown in FIG. 17D. FIGS. 17E and 17F: SABRE relevant spin-spin couplings for direct polarization transfer.
[0026] FIG. 18 shows .sup.15N NMR spectra of HP metronidazole-.sup.15N.sub.2-.sup.13C.sub.2. FIG. 18A: after SABRE-SHEATH hyperpolarization at .mu.T field, cessation of para-H.sub.2 bubbling, and HP sample transfer to the 9.4 T NMR spectrometer followed by frequency-selective polarization destruction of .sup.15N.sub.3 site. FIG. 18B: the spectrum obtained via the procedure described in FIG. 18A followed by magnetic field cycling (MFC) to the Earth's magnetic field and then back to the 9.4 T NMR spectrometer; FIG. 18C: after SABRE hyperpolarization at the Earth's magnetic field, cessation of para-H.sub.2 bubbling, and HP sample transfer to the 9.4 T NMR spectrometer; FIG. 18D: the spectrum obtained by the procedure described in FIG. 18A followed by 180.degree. phase inversion of the .sup.15N polarization; and FIG. 18E: the spectrum attained by the procedure described in FIG. 18D, followed by magnetic field cycling (MFC) to the Earth's magnetic field and then returned to the 9.4 T NMR spectrometer. See FIG. 13B for details. All NMR spectra are acquired using 90.degree. excitation RF pulse after the respective manipulations.
[0027] FIG. 19 shows .sup.15N NMR spectra of HP metronidazole-.sup.15N.sub.2-.sup.13C.sub.2. FIG. 19A: after SABRE-SHEATH hyperpolarization at .mu.T magnetic field, cessation of para-H.sub.2 bubbling, and HP sample transfer into 9.4 T NMR spectrometer followed by frequency-selective polarization destruction of .sup.15N.sub.1 site; FIG. 19B: the sample produced by the procedure described in FIG. 19A followed by the magnetic field cycling (MFC) to the Earth's magnetic field (ca. 50 .mu.T) and then back in the 9.4 T NMR spectrometer; FIG. 19C: the sample produced by the procedure described in FIG. 19A followed by 180.degree. phase inversion of .sup.15N polarization; FIG. 19D: the sample produced by the procedure described in FIG. 19C followed by the magnetic field cycling (MFC) to the Earth's magnetic field (ca. 50 .mu.T) and then back in the 9.4 T NMR spectrometer. All NMR spectra are acquired using 90.degree. excitation RF pulse after the respective manipulations.
[0028] FIG. 20 shows .sup.13C NMR spectra of HP metronidazole-.sup.15N.sub.2-.sup.13C.sub.2. FIG. 20A: spectrum obtained After SABRE-SHEATH hyperpolarization at .mu.T magnetic field, followed by cessation of para-H.sub.2 bubbling, and sample transfer to the 9.4 T NMR spectrometer, followed by .sup.1H and .sup.13C polarization destruction (via applying a series of 90.degree. RF pulses to .sup.13C spins and .sup.1H decoupling to .sup.1H spins); FIG. 20B: the spectrum obtained by the procedure described in FIG. 42A but followed by magnetic field cycling (MFC) to the .mu.T regime (i.e. within a magnetic shield) and then after the sample was returned to the 9.4 T NMR spectrometer. FIG. 20C: the spectrum obtained by the procedure described in FIG. 20A but followed by magnetic field cycling (MFC) to the Earth's magnetic field prior to return to the 9.4 T NMR spectrometer. All NMR spectra shown were acquired using a 90.degree. excitation RF pulse after the respective manipulations described herein.
[0029] FIG. 21 shows .sup.1H NMR spectra of SABRE-hyperpolarized .about.100 mM pyridine solutions in methanol-d.sub.4. FIG. 21A: NMR spectrum of SABRE-hyperpolarized solution after cessation of para-H.sub.2 bubbling. FIG. 21B: Thermally polarized spectrum provided for signal referencing. FIG. 21C: NMR spectrum of SABRE-hyperpolarized (at .about.6 mT) solution after frequency-selective RF irradiation leading to selective destruction of Hc hyperpolarization; FIG. 21D: the corresponding NMR spectrum after the sample prepared in FIG. 21C was re-hyperpolarized at .about.6 mT without para-H.sub.2 bubbling. FIG. 21E: NMR spectrum of SABRE-hyperpolarized (at .about.6 mT) solution after frequency-selective RF irradiation leading to selective destruction of Hb hyperpolarization. FIG. 21F: the corresponding NMR spectrum after the sample was re-hyperpolarized at .about.6 mT without para-H.sub.2 bubbling.
[0030] FIG. 22 shows .sup.15N NMR spectra of HP metronidazole-.sup.15N.sub.2-.sup.13C.sub.2: FIG. 22A: after SABRE-SHEATH hyperpolarization at .mu.T field, cessation of para-H.sub.2 bubbling, and the HP sample transfer in 9.4 T NMR spectrometer followed by frequency-selective polarization destruction of .sup.15N.sub.3 site; FIG. 22B: the sample produced by the procedure described in (a) followed by the magnetic field cycling (MFC) to the fringe field of .about.6 mT and then back in the 9.4 T NMR spectrometer; FIG. 22C: the sample produced by the procedure described in FIG. 44A followed by the magnetic field cycling (MFC) to the Earth's magnetic field and then back in the 9.4 T NMR spectrometer; FIG. 22D: after SABRE hyperpolarization at the Earth's magnetic field, cessation of para-H.sub.2 bubbling, and the HP sample transfer in 9.4 T NMR spectrometer; FIG. 22E: the sample produced by the procedure described in FIG. 22A followed by the magnetic field cycling (MFC) to .mu.T field and then back in the 9.4 T NMR spectrometer; FIG. 22F: the sample produced by the procedure described in FIG. 22A followed by 180.degree. phase inversion of .sup.15N polarization; FIG. 22G: the sample produced by the procedure described in FIG. 22F followed by the magnetic field cycling (MFC) to the Earth's magnetic field and then back in the 9.4 T NMR spectrometer. All NMR spectra are acquired using 90.degree. excitation RF pulse after the manipulation described herein.
[0031] FIG. 23 shows .sup.13C spectra of naturally abundant (FIGS. 23A and 23B) and .sup.13C labelled (FIGS. 23C and 23D) substrates used in experiments. FIGS. 23A and 23C show results for the symmetrically substituted 1,2-2 pyridyl acetylene. FIGS. 23B and 23D are from the asymmetrically substituted 1-phenyl-2-(4-pyridyl) acetylene. For the naturally abundant substrates the bridge carbons on the pyridyl rings (3, 4 in FIG. 23A, 3 in FIG. 23B) show significant enhancement, while the one on the benzene ring (4 in FIG. 23B) is only slightly hyperpolarized. The .sup.13C-.sup.13C coupling, J.sub.CC, read from the line-splitting in panel D is 185 Hz.
[0032] FIG. 24 shows two possible polarization transfer catalysts (PTC's). Top: 3D models obtained after energy minimization in the all electron code FHI-aims. Bottom: Structural formulas of the PTCs for clarity. FIG. 24A shows the substrate is bound to all Ir binding sites via nitrogen. FIG. 24B shows one of the molecules' triple bond binds to the iridium catalyst, which has a higher energy than the structure in FIG. 24A. DFT calculations reveal that the energy difference between the two proposed complexes is relatively small (0.09 eV).
[0033] FIG. 25 shows field dependent hyperpolarization for the two substrates. FIG. 25A shows (1) a hyperpolarized magnetization spectrum hyperpolarized at 0.17 .mu.T (and acquired at 8.45 T) for the symmetric substrate and (2) its field dependence in the .mu.T range. FIG. 25B shows the experimental and simulated results of creating magnetization and singlet order for the asymmetric substrate, as function of magnetic field; (1) Magnetization spectrum hyperpolarized at 0.28 .mu.T. (2) Experimental and (3) simulated field dependence for magnetization. (4) Singlet spectrum hyperpolarized at 6.2 .mu.T. (5) Experimental and (6) simulated field dependence for singlet order. In FIG. 25B panels (3) and (6), the highlighted points are the local maxima for polarization transfer labeled by analytically derived resonance conditions from careful inspection of the nuclear-spin Hamiltonian.
[0034] FIG. 26 shows T.sub.1 and T.sub.S measurements of 1-phenyl-2-(4-pyridyl) acetylene. For all measurements, the sample was first hyperpolarized in the shield using 0.4 .mu.T (polarize magnetization)/6 .mu.T (polarize singlet order) then positioned at 0.3 mT or 50 mT. After varying delay times the sample was transferred to the magnet quickly to measure the remaining signal. The data points were sampled randomly to eliminate the effect of the slow triple bond hydrogenation, and the lifetime constants were obtained using single exponential fit.
[0035] FIGS. 27A and 27B show hydrogenation of the acetylenic triple bond (FIG. 27A) and spectrum of .sup.13C hyperpolarization in the shield at 62 mG (FIG. 27B). On the right part of the spectrum around 90 ppm, is the SABRE hyperpolarized singlet of the original substrate. However, a fraction of the substrate (.about.10%) is hydrogenated and generates the polarization induced by para-H.sub.2 addition. Here the ALTADENA effect is observed at the chemical shift of .sup.13C around 130 ppm.
[0036] FIG. 28A shows thermal .sup.1H spectrum of the asymmetric molecule and its peak assignment, note that protons on position 2 and 3 overlap. (Position 3 protons have slightly higher chemical shift than protons in position 2). FIG. 28B shows hyperpolarized (SABRE) .sup.1H spectrum. para-H.sub.2 is bubbled through the sample at 6.5 mT, a .about.57 fold enhancement of positions 1 and 2 protons is obtained. However, positions 3, 4 and 5 are not enhanced. FIG. 28C shows spectrum acquired using 45.degree. pulse immediately after stopping bubbling inside the magnet. The hydrides are observed and there are two major resonances with chemical shift difference around 0.2 ppm, as well as clear indications of minor species.
[0037] FIG. 29A shows thermal spectrum of the asymmetric molecule with concentration of 160 mM after one scan. FIG. 29B shows hyperpolarized .sup.13C spectrum. para-H.sub.2 is bubbled through the sample at 0.28 .mu.T, achieving .about.37 fold enhancement of the doubly labeled acetylenic carbons. FIG. 29C shows the .sup.13C-.sup.13C J-coupling, J.sub.CC, and the nearby .sup.13C-.sup.1H J-coupling, could be determined using the hyperpolarized spectrum. The critical parameter for the polarization transfer, J.sub.CC, is 185 Hz; and J.sub.CH is around 5 Hz. By ab-initio calculations J.sub.CC values were found that are very close to this experimental value for the free species and for the N-bound substrate. Whereas, in the substrate bound via C.ident.C triple bond the J-coupling is reduced to .about.120 Hz because of the reduction in triple-bond character upon binding. This would result in a strong shift in the magnetic field at which SABRE hyperpolarization occurs, which however was not observed, suggesting that the N-binding species in solution are primarily responsible for the observed SABRE-SHEATH effect.
[0038] FIG. 30 shows the four-spin system of two .sup.1H and two .sup.13C spins, the iridium metal atom in the middle is omitted. On the left is the rearranging terms for .DELTA.J.sub.near, .DELTA.J.sub.far, .SIGMA.J.sub.near and .SIGMA.J.sub.far. Approximation of the J-coupling values (from both calculation and experimental results) are also shown.
[0039] FIGS. 31A and 31B show a simulation of the polarization transfer of magnetization (FIG. 31A) and singlet (FIG. 32B), with the magnetic field ranging from -12 to 12 .mu.T. Highlighted points are all the resonance conditions where the polarization transfer is maximized.
[0040] FIGS. 32A and 32B show Matlab simulation using the Spinach package, for the indirect polarization transfer (FIG. 32A, where there are 8 spins in the system) and the direct polarization transfer (FIG. 32B, where there are 4 spins in the system). Simulation shows similar pattern of the magnetization and singlet for indirect or direct polarization transfer. On the other hand, the magnetic field position at which the singlet peak appears is closely related with the J.sub.CC coupling: the stronger this coupling is, the further away the singlet peak will appear.
[0041] FIG. 33 shows DFT calculation of the activation process and equilibria and energies of interest. During activation, the COD (cyclooctadiene) will disassociate from the iridium core, then H.sub.2 and the substrate will bind with the iridium, either with three N or the .sup.13C triple bond.
DETAILED DESCRIPTION
[0042] The present disclosure relates to methods of directly transferring para-H.sub.2 polarization to heteronuclei without the need of rf irradiation or pulses. This hyperpolarization strategy may be referred to as SABRE-SHEATH (SABRE in SHield Enables Alignment Transfer to Heteronuclei). Various aspects of the SABRE-SHEATH methods are described in U.S. patent application Ser. No. 14/925,507 to Warren et al. ("METHOD FOR CREATING HYPERPOLARIZATION AT MICROTESLA MAGNETIC FIELDS," filed Oct. 28, 2015, Attorney Docket No. 093386-9100-US01), which is herein incorporated by reference in its entirety.
[0043] In some aspects, the present disclosure provides improvements over existing methods of hyperpolarization of heteronuclei. For example, the disclosed methods demonstrate that the absence of quadrupolar nuclei may facilitate efficient .sup.13C hyperpolarization via reversible exchange with parahydrogen, and that spin relays may enable efficient long-range heteronuclear signal amplification by reversible exchange.
[0044] The advantages of the disclosed method promote the broad applicability of SABRE-SHEATH in biophysical and biomedical imaging experiments, allowing this technique to be useful, for example, in minimally invasive biomedical applications.
1. DEFINITIONS
[0045] Unless otherwise defined, all technical and scientific terms used herein have the same meaning as commonly understood by one of ordinary skill in the art. In case of conflict, the present document, including definitions, will control. Preferred methods and materials are described below, although methods and materials similar or equivalent to those described herein can be used in practice or testing of the present invention. All publications, patent applications, patents and other references mentioned herein are incorporated by reference in their entirety. The materials, methods, and examples disclosed herein are illustrative only and not intended to be limiting.
[0046] The terms "comprise(s)," "include(s)," "having," "has," "can," "contain(s)," and variants thereof, as used herein, are intended to be open-ended transitional phrases, terms, or words that do not preclude the possibility of additional acts or structures. The singular forms "a," "an" and "the" include plural references unless the context clearly dictates otherwise. The present disclosure also contemplates other embodiments "comprising," "consisting of" and "consisting essentially of," the embodiments or elements presented herein, whether explicitly set forth or not.
[0047] The conjunctive term "or" includes any and all combinations of one or more listed elements associated by the conjunctive term. For example, the phrase "an apparatus comprising A or B" may refer to an apparatus including A where B is not present, an apparatus including B where A is not present, or an apparatus where both A and B are present. The phrases "at least one of A, B, . . . and N" or "at least one of A, B, . . . N, or combinations thereof" are defined in the broadest sense to mean one or more elements selected from the group comprising A, B, . . . and N, that is to say, any combination of one or more of the elements A, B, . . . or N including any one element alone or in combination with one or more of the other elements which may also include, in combination, additional elements not listed.
[0048] Recitation of ranges of values herein are merely intended to serve as a shorthand method of referring individually to each separate value falling within the range, unless otherwise indicated herein, and each separate value is incorporated into the specification as if it were individually recited herein. For example, if a concentration range is stated as 1% to 50%, it is intended that values such as 2% to 40%, 10% to 30%, or 1% to 3%, etc., are expressly enumerated in this specification. These are only examples of what is specifically intended, and all possible combinations of numerical values between and including the lowest value and the highest value enumerated are to be considered to be expressly stated in this application.
[0049] The modifier "about" used in connection with a quantity is inclusive of the stated value and has the meaning dictated by the context (for example, it includes at least the degree of error associated with the measurement of the particular quantity). The modifier "about" should also be considered as disclosing the range defined by the absolute values of the two endpoints. For example, the expression "from about 2 to about 4" also discloses the range "from 2 to 4." The term "about" may refer to plus or minus 10% of the indicated number. For example, "about 10%" may indicate a range of 9% to 11%, and "about 1" may mean from 0.9-1.1. Other meanings of "about" may be apparent from the context, such as rounding off, so, for example "about 1" may also mean from 0.5 to 1.4.
[0050] The term "heterogeneous catalyst," as used herein, means a catalyst that is in a separate phase from the reactants. For example, the heterogeneous catalyst used in the methods described herein may be a heterogeneous catalyst in U.S. patent application Ser. No. 14/801,541, the contents of which are incorporated herein in their entirety. The heterogeneous transition metal catalyst described herein may also be in U.S. patent application Ser. No. 14/801,541.
[0051] The term "homogeneous catalyst," as used herein, means a catalyst that is in the same phase as the reactants. For example, the homogeneous catalyst used in the methods described herein may be a homogeneous catalyst in U.S. patent application Ser. No. 14/801,554, the contents of which are incorporated herein in their entirety. The homogeneous transition metal catalyst described herein may also be in U.S. patent application Ser. No. 14/801,554.
[0052] The term "isotopically enriched," as used herein with reference to any particular isotope of any particular atom of a compound, means that in a composition comprising a plurality of molecules of the compound, the amount (e.g., fraction, ration or percentage) of the plurality of molecules having the particular isotope at the particular atom is substantially greater than the natural abundance of the particular isotope, due to synthetic enrichment of the particular atom with the particular isotope. For example, a composition comprising a compound with an isotopically enriched .sup.15N atom at a particular location includes a plurality of molecules of the compound where, as a result of synthetic enrichment, the percentage of the plurality of molecules having .sup.15N at that location is greater than about 1% (the natural abundance of .sup.15N is substantially less than 1%), and in many cases is substantially greater than about 1%. Similarly, a composition comprising a compound with an isotopically enriched deuterium (D) atom at one or more particular locations includes a plurality of molecules of the compound, where as a result of synthetic enrichment, the percentage of the plurality of molecules having D at each of the one or more particular locations is greater than about 1% (the natural abundance of D is substantially less than 1%), and in many cases is substantially greater than about 1%. In some cases, a composition comprising a compound with an isotopically enriched atom at a particular location may include a plurality of molecules of the compound, where the amount of the plurality of molecules having the isotope at the location may be at least about two-or-more-fold greater than the natural abundance of the isotope, including but not limited to at least about two-fold, at least about three-fold, at least about four-fold, at least about five-fold, at least about 10-fold, at least about 20-fold, at least about 30-fold, at least about 40-fold, at least about 50-fold, at least about 60-fold, at least about 70-fold, at least about 80-fold, at least about 90-fold, at least about 100-fold, and at least about 200-fold, among others. In some cases, a composition comprising a compound with an isotopically enriched atom at a particular location also may include a plurality of molecules of the compound where, as a result of synthetic enrichment, at least about 1%, at least about 5%, at least about 10%, at least about 15%, at least about 20%, at least about 25%, at least about 30%, at least about 35%, at least about 40%, at least about 45%, at least about 50%, at least about 55%, at least about 60%, at least about 65%, at least about 70%, at least about 75%, at least about 80%, at least about 85%, at least about 90%, or at least about 95%, of the plurality of molecules have the isotope at the location.
[0053] The term "natural abundance," as used herein with reference to any particular isotope of an element, refers to the abundance of the isotope as naturally found on the planet Earth. For example, the natural abundance of .sup.15N on the planet Earth is generally regarded to be about 0.37% (i.e., substantially less than about 1%), while the natural abundance of deuterium (D) on the planet Earth is generally regarded to be about 0.015% (i.e., substantially less than about 1%).
2. METHODS OF HYPERPOLARIZING HETERONUCLEI
[0054] In some aspects, the present disclosure provides methods of hyperpolarizing heteronuclei, comprising:
[0055] (a) combining a plurality of molecules of parahydrogen, a plurality of molecules of a catalyst, and a plurality of molecules of a compound, where the compound includes a heteronucleus and another atom that exists naturally as either a quadrupolar or a non-quadrupolar isotope, where the heteronucleus in at least 50% of the plurality of molecules of the compound is a hyperpolarizable heteronucleus, and where the plurality of molecules of the compound have been modified so as to isotopically enrich the other atom with the non-quadrupolar isotope, and where the parahydrogen, the compound and the catalyst associate to form a complex: and
[0056] (b) applying a magnetic field with a strength of less than 50 .mu.T to the complex, thereby transferring the spin order from the parahydrogen to the hyperpolarizable heteronucleus associated with the complex.
[0057] In general, the present methods may be used to hyperpolarize the heteronuclei of a plurality of molecules of a compound, in order to enhance the NMR measurements of such heteronuclei in the compound. The compound may include a heteronucleus and another atom. Typically in the present method, the parahydrogen, the compound, and the catalyst are mixed, such that they associate to form a complex. In some embodiments, as a result of the forming a complex, the parahydrogen, the heteronucleus, and the other atom are in the same hyperpolarization/coupling network within the complex.
[0058] In some embodiments, the compound is a contrast agent for an in vivo imaging technique. Example of suitable contrast agents may include, but are not limited to, metronidazole, other nitroimidazole-based antibiotics and synthetic derivatives, imidazole as a pH sensor, nicotinamide, DNA bases, synthetic DNA bases and their derivatives, polypeptides and proteins.
[0059] Suitable hyperpolarizable heteronuclei may include, but are not limited to .sup.13C, .sup.15N, .sup.19F, .sup.9Si, .sup.31P, .sup.129Xe, .sup.7Li, .sup.89Y, .sup.107Ag, and .sup.109Ag. In some embodiments, the hyperpolarizable heteronucleus is .sup.13C. In some embodiments, the hyperpolarizable heteronucleus is .sup.19F. In some embodiments, the hyperpolarizable heteronucleus is .sup.15N, .sup.29Si, .sup.31P, .sup.129Xe, .sup.7Li, .sup.89Y, .sup.107Ag or .sup.109Ag.
[0060] In some embodiments, the heteronucleus in at least 50% of the plurality of molecules of the compound is a hyperpolarizable heteronucleus. For example, in some embodiments, the heteronucleus in at least 55%, at least 60%, at least 65%, at least 70%, at least 75%, at least 80%, at least 85%, at least 90%, at least 95%, at least 97%, at least 98%, or even at least 99% of the plurality of molecules of the compound is a hyperpolarizable heteronucleus.
[0061] The other atom may exist naturally as either a quadrupolar or a non-quadrupolar isotope. In some embodiments, the methods of the present disclosure may include modifying the plurality of molecules of the compound so as to isotopically enrich the other atom with the non-quadrupolar isotope. In some embodiments, the non-quadrupolar isotope of the other atom has a nuclear spin of 0 or 1/2. In some embodiments, the other atom is a nitrogen atom, and the plurality of molecules of the compound have been modified so as to isotopically enrich the nitrogen atom with .sup.15N.
[0062] In some embodiments, the other atom is a hydrogen atom, and the plurality of molecules of the compound have been modified so as to isotopically enrich the hydrogen atom with .sup.1H.
[0063] In some embodiments, the spin order is transferred during a temporary association of parahydrogen, the compound, and the catalyst while maintaining the chemical identity of the compound.
[0064] In some embodiments, the magnetic field is determined by matching the resonance frequency of parahydrogen with the resonance frequency of at least one hyperpolarizable nucleus of the compound.
[0065] In some embodiments, the magnetic field has a strength of from about 0.1 to about 20 IT, including but not limited to a range from about 0.1 to about 15 .mu.T, from about 0.1 to about 10 .mu.T, from about 0.1 to about 5 .mu.T, from about 0.1 to about 2 .mu.T, from about 0.1 to about 1 .mu.T, or from about 0.1 to about 0.5 .mu.T. In some embodiments, the magnetic field has a strength of less than 20 .mu.T. In some embodiments, the magnetic field has a strength of about 0.1 to about 1 .mu.T.
[0066] The catalyst used in the present method may be a heterogeneous or a homogeneous catalyst. In some embodiments, the catalyst is a heterogeneous catalyst. In some embodiments, the catalyst is a homogeneous catalyst. In some embodiments, the catalyst comprises a transition metal. For example, in some embodiments, the catalyst comprises a transition metal, and the transition metal in the complex coordinates with the other atom. In particular embodiments, the transition metal is iridium.
[0067] The catalyst may be activated prior to forming the complex. For example, the pre-activation catalyst may be selected from the group consisting of [IrCl(COD)(IMes)], [IrCl(IDEG)(COD)], [IrCl(CODDA)-IMes], [IrCl(COD)(SIMes)], among others.
[0068] The catalyst may be homogeneous or heterogeneous, wherein the catalyst accommodates the simultaneous exchange of para-H.sub.2 and heteronuclear spin center(s), and wherein the condition of spin-spin (weak or strong J) coupling between para-H.sub.2 derived protons and heteronuclear spin center(s) is maintained.
[0069] The heteronucleus may be a first heteronucleus and the compound further may include a second heteronucleus, where the second heteronucleus in at least 50% of the plurality of molecules of the compound is a hyperpolarizable heteronucleus, wherein when the first and second heteronuclei are both hyperpolarizable, the first and second heteronuclei are a J-coupled pair; wherein upon applying the magnetic field with a strength of less than 50 .mu.T to the complex, the spin order from the parahydrogen is transferred to the J-coupled pair, thereby inducing a hyperpolarized long-lived spin state.
3. EXAMPLES
[0070] Various experimental procedures for SABRE studies and measurements may be carried out as described in U.S. patent application Ser. No. 14/925,507 (incorporated herein by reference in its entirety), including: SABRE catalyst and sample preparation, experimental SABRE setup (for example, at 9.4 T), calculations of NMR polarization enhancements (for example, at 9.4 T), and SABRE-SHEATH neat liquid experiments.
Example 1. The Absence of Quadrupolar Nuclei Facilitates Efficient .sup.13C Hyperpolarization Via Reversible Exchange with Parahydrogen
[0071] Nuclear spin hyperpolarization techniques are revolutionizing the field of .sup.13C molecular MRI. While dissolution Dynamic Nuclear Polarization (d-DNP) is currently the leading technique, it is generally slow (requiring .about.1 h) and costly (.about.$USD10.sup.6). As a consequence of carbon's central place in biochemistry, tremendous progress using .sup.13C d-DNP bioimaging has been demonstrated to date including a number of clinical trials. Despite numerous attempts to develop alternatives to d-DNP, the competing methods have faced significant translational challenges. Efficient hyperpolarization of .sup.15N, .sup.31P, and other heteronuclei using Signal Amplification By Reversible Exchange (SABRE) has been reported in 2015, but extension of this technique to .sup.13C has proven to be challenging. In some embodiments, disclosed herein is efficient hyperpolarization of .sup.13C nuclei using micro-Tesla SABRE. Up to ca. 6,700-fold enhancement of nuclear spin polarization at 8.45 T is achieved in seconds, corresponding to P.sub.13C.about.4.4% using 50% parahydrogen (P.sub.13C>14% would be feasible using more potent .about.100% parahydrogen). Importantly, the .sup.13C polarization achieved via SABRE strongly depends not only upon spin-lattice relaxation, but also upon the presence of .sup.15N (I=1/2) versus quadrupolar .sup.14N (I=1) spins in the site binding the hexacoordinate Ir atom of the catalytic complex. It is shown that different .sup.13C nuclei in the test molecular frameworks--pyridine & acetonitrile--can be hyperpolarized, including .sup.13C sites up to 5 chemical bonds away from the exchangeable hydrides. The presented approach is highly scalable, and can be applied to a rapidly growing number of biomolecules amendable to micro-Tesla SABRE.
[0072] Hyperpolarization techniques temporarily increase nuclear spin polarization (typically .about.10.sup.-5-10.sup.-6 at equilibrium Boltzmann distribution even when using high-field magnets) up to the order of unity. This dramatic enhancement of nuclear spin polarization and resulting magnetic resonance signals opens new horizons for NMR spectroscopy and MRI imaging. Importantly, hyperpolarization technologies have enabled a wide range of new biomedical applications, which are now key drivers of hyperpolarization technique developments. Most importantly, in vivo molecular imaging of .sup.13C metabolites at millimolar concentrations is now possible. Carbon has an undisputable central role in biochemistry, and .sup.13C-based hyperpolarized (HP) contrast agents have been successfully employed for metabolic imaging during health and disease-including detection of abnormal metabolism of cancer and monitoring treatment response. This field has rapidly progressed from proof-of-principle studies to the first clinical trials.
[0073] Dissolution Dynamic Nuclear Polarization (d-DNP) is currently the leading hyperpolarization technique for production of a wide range of HP .sup.13C contrast agents. However, this technique has several shortcomings for widespread biomedical use. In particular, the clinical-scale device is costly, and has sophisticated siting requirements. Moreover, d-DNP hyperpolarization takes .about.1 h, although recent progress enables acceleration of the process.
[0074] Several alternative techniques for .sup.13C hyperpolarization have been developed that address the shortcomings of d-DNP. So far, only parahydrogen-induced polarization (PHIP) has demonstrated the ability to produce HP .sup.13C contrast agents for in vivo use, but PHIP is restricted to a handful of molecular frameworks (requiring sophisticated spin labeling strategies, e.g. deuteration, in addition to .sup.13C enrichment) of unsaturated precursors for parahydrogen addition.
[0075] A PHIP variant that lifts these restrictions is Signal Amplification by Reversible Exchange (SABRE). SABRE was first introduced by Duckett and Green in 2009. It relies on the reversible exchange of parahydrogen (p-H.sub.2) and the to-be-hyperpolarized substrate on a metal complex. Generally, following hyperpolarization of p-H.sub.2-nascent proton spins, polarization transfer can be employed to heteronuclear low-gamma (e.g. .sup.13C and .sup.15N) sites using radio-frequency (RF) pulse sequences. Storing polarization on heteronuclear sites carries advantages of significantly longer lifetime with relaxation decay time constants of up to 20 minutes. However, coherent polarization transfer without RF pulses, i.e. using the matching static magnetic field, has proven to be significantly more efficient, and significantly less instrumentationally demanding. Indeed, the original .sup.1H SABRE demonstration has led to achieving P.sub.H in excess of 10% at matching fields on the order of a few milliTesla. The matching static magnetic field for heteronuclei (e.g. .sup.15N and .sup.31P) that yields maximal SABRE enhancement is in the micro-Tesla range. This approach (termed SABRE in SHield Enables Alignment Transfer to Heteronuclei or SABRE-SHEATH) is very efficient; it has already achieved P.sub.15N in excess of 20% within a minute, and has been expanded to pH and hypoxia sensors, among others. .sup.15N SABRE-SHEATH employs long-range .sup.1H-.sup.15N spin-spin couplings between p-H.sub.2-derived hydride protons and the .sup.15N spins of the target substrate, enabling coherent transfer of spin order in micro-Tesla magnetic fields. While .sup.15N-based HP contrast agents will likely find their use in biomedical applications, efficient and direct .sup.13C SABRE hyperpolarization has not been demonstrated to date despite multiple efforts and significant interest.
[0076] In some embodiments, disclosed herein is efficient .sup.13C hyperpolarization of pyridine (Py) using the SABRE-SHEATH approach (FIG. 1), where polarization coherently transfers from nascent p-H.sub.2 protons to .sup.13C nuclei at matching micro-Tesla magnetic fields. Py was chosen for the present work given that it is the most studied model compound for SABRE. .sup.13C SABRE-SHEATH experiments were performed using the most efficient SABRE catalyst Ir-IMes (using the established Ir catalyst precursor [IrCl(COD)(IMes)]; IMes=1,3-bis(2,4,6-trimethylphenyl)-imidazol-2-ylidene; COD=cyclooctadiene), and the corresponding active hexacoordinate complex is shown in FIG. 1A. .sup.15N-labeled pyridine (Py-.sup.15N) was employed, providing a convenient means of studying hyperpolarization of three .sup.13C sites at the natural abundance level of .sup.13C (FIG. 1B). FIG. 1C shows the chemical structures of the most probable complexes relevant for coherent SABRE-SHEATH polarization transfer in the three-spin system described by us previously in the context of .sup.15N SABRE-SHEATH. This approach allowed us to probe .sup.13C SABRE-SHEATH polarization transfer via 3-, 4-, and 5-bond spin-spin couplings J.sub.1H-13C, respectively.
[0077] Indeed, proton-decoupled .sup.13C spectra (FIG. 2A) of HP Py-.sup.15N exhibit .sup.13C signal enhancements up to .about.1,900 fold at 9.4 T, corresponding to P.sub.13C.about.1.5%. Qualitatively, the .sup.13C signal enhancement was the most efficient for the ortho-position, followed by the meta- and para-.sup.13C positions-corresponding to 3-, 4-, and 5-bond .sup.1H-.sup.13C spin-spin couplings, respectively. This trend is in qualitative agreement with previous .sup.15N SABRE-SHEATH studies, which have shown that the polarization efficiency was better when spin order was transferred via two-bond heteronuclear spin-spin coupling compared to that for four- and five-bond heteronuclear spin-spin couplings. We note that the .sup.13C enhancement (reflecting the efficiency of .sup.13C SABRE-SHEATH) was maximized with respect to the flow rate of p-H.sub.2 at .about.7 atm p-H.sub.2 pressure (FIG. 2B), and optimized with respect to temperature and micro-Tesla magnetic field of SABRE-SHEATH polarization transfer, FIGS. 2F and 2G, respectively. While these feasibility results are promising, the achieved P.sub.13C value is roughly 3-fold lower than the corresponding P.sub.15N value obtained via .sup.15N SABRE-SHEATH under similar conditions. This difference can be explained in part by very short HP .sup.13C T.sub.1's at both the Earth's field and high (9.4 T) magnetic field of 5-8 s (FIGS. 2D and 2E), values that are approximately 3-5-fold lower than those of .sup.15N sites at similar conditions. Consequently, the P.sub.13C losses during the .about.6-second-long sample transfer (from the SABRE-SHEATH shield into the detection coil of the 9.4 T NMR magnet) are significant compared to the relatively small P.sub.15N relaxation losses during sample transfer. If these losses were mitigated by hyperpolarization of longer-lived .sup.13C sites, the observable P.sub.13C would likely be increased by several folds. We emphasize that the .sup.13C T.sub.1's in the studied system are likely limited due (i) to the strong (ca. 160-180 Hz) .sup.1J.sub.1H-13C couplings (Table 1) and (ii) dipolar interactions with directly bound protons (and potentially large .sup.13C CSA at high magnetic field), rather than being limited by the interactions with the catalyst, as in the case of .sup.15N.
[0078] Finally, and most importantly, it was found that the efficiency of .sup.13C SABRE-SHEATH hyperpolarization is heavily modulated by the presence of .sup.15N versus .sup.14N nuclei at the nitrogen sites. FIG. 3 clearly demonstrates that the presence of a quadrupolar nucleus .sup.14N (with I=1, as opposed to the spin I=1/2 .sup.15N nucleus) leads to significantly reduced efficiency of .sup.13C SABRE-SHEATH. We note that the simple tuning of the micro-Tesla field could not improve the lost efficiency of SABRE-SHEATH hyperpolarization when .sup.14N is present (FIG. 3). Moreover, the intensity of the HP .sup.13C NMR signal in ortho-positions is reduced the most. Since the ortho-position is the nearest to the N atom, we conclude that the quadrupolar .sup.14N relaxation effectively acts as an efficient hyperpolarization sink in case of molecules containing .sup.14N nuclei. We point out that this efficient quadrupolar relaxation, i.e., scalar relaxation of the second kind, is likely limited to the micro-Tesla hyperpolarization regime, because the corresponding efforts to perform .sup.13C SABRE in the milli-Tesla regime using Py-.sup.15N and Py-.sup.14N (natural abundance material) do not exhibit a disproportionate P.sub.13C drop for ortho-carbon position compared to the that of para- and meta-carbon positions. However, .sup.13C SABRE hyperpolarization in milli-Tesla range is less efficient than SABRE-SHEATH in the micro-Tesla regime, and the produced HP .sup.13C resonances are anti-phase--a feature that is disadvantageous in the context of most imaging applications. These conclusions are further substantiated by the additional series of experiments performed using acetonitrile-1-.sup.13C, .sup.14N and acetonitrile-1-.sup.13C, .sup.15N as SABRE substrates (SI). These experiments show the same trends: (i) significantly lower P.sub.13C when .sup.14N-labeled substrate is employed (FIG. 4), and (ii) when .sup.13C sites have longer T.sub.1, P.sub.13C can be significantly increased. Specifically, FIG. 4 shows a spectrum of .sup.13C hyperpolarized acetonitrile-1-.sup.13C,.sup.15N with P.sub.13C.about.4.8% using 50% p-H.sub.2. If near 100% p-H.sub.2 is employed, the polarization yields could be effectively tripled to P.sub.13C.about.14.4%.
[0079] Although we have previously reported .sup.13C SABRE-SHEATH hyperpolarization, the pioneering work yielded very low .sup.13C signal enhancement (<100 at 9.4 T) and P.sub.13C (<0.1%) compared to those reported here for the following reasons: (i) hyperpolarization at sub-optimal .mu.T field (FIG. 2G), (ii) non-optimized temperature, (iii) the use of very high (and sub-optimal) substrate and catalyst concentrations.
[0080] To summarize, efficient .sup.13C hyperpolarization using SABRE-SHEATH is described herein, which relies on p-H.sub.2 in chemical exchange as the source of spin order. P.sub.13C values of up to .about.1.5% are produced in seconds, and significantly greater P.sub.13C can be potentially obtained for .sup.13C sites with greater T.sub.1 values (typically the case for .sup.13C sites without directly attached protons). The presence of spin-1/2 .sup.15N nuclei (to eliminate .sup.13C polarization losses due to efficient .sup.14N quadrupolar relaxation of the second kind) is required for efficient .sup.13C hyperpolarization for Py. Recent demonstrations of heterogeneous and aqueous SABRE hyperpolarization are highly synergistic with the results reported here, as they potentially pave the way to ultra-fast production of pure and aqueous HP .sup.13C contrast agents for biomedical use.
[0081] Ir-IMes catalyst was synthesized as previously described. Pyridine-.sup.15N (Py-.sup.15N) (Sigma-Aldrich-Isotec, 486183) was used as received to prepare a series of Py-.sup.15N solutions (or Py-.sup.14N for control experiments) in CD.sub.3OD. An initial solution containing .about.100 mM substrate and .about.5 mM catalyst precursor was used for magnetic field and temperature studies (FIGS. 2F and 2G) as well as for a comparison of Py-.sup.15N with Py-.sup.14N (FIG. 3). Otherwise, a diluted solution containing 5 mM substrate and 0.25 mM catalyst was used. The details of the experimental setup and catalyst activation protocols have been previously described in great detail. P--H.sub.2 with .about.80% para-fraction was produced using a home-built p-H.sub.2 generator, and .about.7 atm p-H.sub.2 pressure was employed for the .sup.13C SABRE-SHEATH experiments. A 9.4 T Bruker Avance III NMR spectrometer was used for all NMR spectra acquisitions. The values for .sup.13C signal enhancement and P.sub.13C were calculated by comparison of HP signals of Py and a thermally polarized NMR signal reference from the solvent.
[0082] Experimental Procedures
[0083] To an Eppendorf safe-lock tube, pyridine-.sup.15N (or pyridine-.sup.14N) (0.10 M final concentration) and non-activated iridium catalyst ([IrCl(COD)(IMes)], 0.005 M final concentration) and methanol-d.sub.4 were added. The tube with stock solution was flushed with Argon and vortexed. In order to achieve lower tracer and catalyst concentration, a part of the stock solution was transferred via Ranin XLS pipet to another Argon-flushed Eppendorf safe-lock tube and methanol-d.sub.4 was added. Two subsequent dilutions were performed, respectively resulting in a solution with 5 times lower concentrations (20 mM substrate and 1 mM catalyst) and 20 times lower concentrations (5 mM substrate and 0.25 mM catalyst) compared to those of the initial solution.
[0084] The stock solution was transferred via a Ranin XLS pipet into an Argon-filled medium-walled NMR sample tube (5 mm medium wall precision, 3.43 mm ID, 9 in. long, Wilmad Glass, P/N 503-PS-9) equipped with the Teflon tube extension (0.25 in. OD, 3/16 in. ID), which was approximately 7 cm long. The tube was attached to the previously described setup through a Wye push-to-connect adapter. The SABRE sample was activated by bubbling parahydrogen at 20 sccm for .about.30 min, slowly building the pressure from 1 atm to .about.7 atm of parahydrogen (.about.50% para-fraction or .about.80% para-fraction). The parahydrogen flow rate was controlled by a mass flow controller (Sierra Instruments, Monterey, Calif., model number C100L-DD-OV1-SV1-PV2-V1-S0-C0).
[0085] The SABRE-SHEATH hyperpolarization procedure was conducted similarly to that described earlier. The sample solution was bubbled with parahydrogen (.about.50% or 80% para-fraction) at 90 sccm for .about.30 s, at .about.7 atm inside the magnetic shield. The Earth's magnetic field was attenuated using a three-layered mu-metal shield (6 in. ID & 15 in. in length, part number ZG-206, Magnetic Shield Corp., Bensenville, L), which was degaussed before use. The magnetic field was created using a custom-built solenoid coil and a power supply (GPRS series, GW INSTEK). After stopping parahydrogen bubbling the sample was quickly transferred from the shield to the Earth's magnetic field followed by sample insertion in the bore of 9.4 T magnet and acquisition of the proton-decoupled .sup.13C NMR spectrum. Typical sample transfer time (from cessation of p-H.sub.2 gas to .sup.13C detection in 9.4 T magnet) was approximately 6 seconds. The .sup.13C NMR peaks' integrals were normalized with respect to a .sup.13C NMR signal of the solvent CD.sub.3OD.
[0086] .sup.13C SABRE-SHEATH Enhancement Factor Calculation
[0087] The .sup.13C SABRE-SHEATH signal enhancement for the data in FIG. 2A was calculated by comparing the integral signal intensities of the corresponding .sup.13C NMR peaks of the spectra of the hyperpolarized sample with the thermally polarized .sup.13C NMR peak of the solvent (CD.sub.3OD). The .sup.13C SABRE-SHEATH enhancement was calculated by comparing the integrated signal intensity of the hyperpolarized NMR peak of the .sup.13C site in the ortho-position obtained from the hyperpolarized sample in a 5-mm medium-walled NMR tube at 5 mM concentration of pyridine-.sup.15N, and referencing it to the .sup.13C NMR signal from a thermally polarized solvent, CD.sub.3OD (.about.24.6 M). The following formula was used for calculation of .sup.13C signal enhancements:
.epsilon.=(S.sub.HP/S.sub.REF).times.([REF]/[HP]),
where S.sub.HP is the absolute integral calculated for the hyperpolarized signal, S.sub.REF is the corresponding integrated signal from the reference compound, and [REF] and [HP] are respectively the concentrations of the reference (.about.24.6 M) and hyperpolarized (0.005 M) samples (taking into account the .sup.13C natural abundance factor). For the data presented in FIG. 2B, the .sup.13C signal enhancement was calculated as follows (where 2 is the number of equivalent carbons for ortho-position of pyridine):
.epsilon.=(0.77)/(1).times.(24.62/(2.times.0.005).about.1,900.
[0088] The .sup.13C polarization percentage (% P) was calculated as follows (where % P.sub.thermal=8.1.times.10.sup.-4% is the equilibrium thermal .sup.13C polarization at room temperature and 9.4 TP:
% P=.epsilon..times.% P.sub.thermal=1,900.times.8.1.times.10.sup.-4%.apprxeq.1.5%
[0089] .sup.13C spin-lattice relaxation exponential decay constant of .sup.15N- and .sup.14N-Py forms
TABLE-US-00001 TABLE 1 .sup.13C T.sub.1 relaxation time constants measured at 9.4 T using an inversion-recovery sequence for 300 mM substrate solutions in CD.sub.3OD (in the absence of SABRE catalyst). .sup.13C site position Pyridine-.sup.15N Pyridine-.sup.14N Ortho 14.4 .+-. 0.5 s 10.2 .+-. 0.6 s Meta 13.2 .+-. 0.4 s 11.5 .+-. 0.5 s Para 5.8 .+-. 0.8 s 5.4 .+-. 0.9 s
[0090] Hyperpolarized .sup.13C NMR Signal Build-Up and Decay Measurements
[0091] .sup.13C NMR signal build-up curve (FIG. 2C) was measured by varying p-H.sub.2 bubbling time through the NMR tube containing catalyst and substrate solution in the magnetic shield. The signal was recorded in 9.4 T NMR spectrometer for each experiment (for each timing of hyperpolarization) corresponding to an individual data point. Following a time period of hyperpolarization, p-H.sub.2 flow was ceased, the sample was quickly removed from the magnetic shield chamber and inserted inside 9.4 T NMR spectrometer for .sup.13C detection using .about.90-degree excitation pulse.
[0092] Earth's field T.sub.1 of .sup.13C nuclei of pyridine-.sup.15N (FIG. 2D) was measured using the following procedure. p-H.sub.2 was bubbled through the solution in the magnetic shield for 30 s. Then the flow rate was stopped and the NMR tube was stored for a varied amount of time in the Earth's field. Then the sample was quickly (.about.5 s) transferred to the high magnetic field (9.4 T) for a .sup.13C signal detection. One data point was acquired for each experiment, and the data was plotted as a .sup.13C signal dependence on the decay delay at the Earth's magnetic field.
[0093] .sup.13C T.sub.1 at high field, 9.4 T (FIG. 2E), was measured on a single HP sample, by using a series of .sup.13C NMR acquisitions employing a small angle (.about.10.degree.) excitation RF pulses after polarization build-up and sample transfer to the high field (9.4 T).
[0094] Additional SABRE-SHEATH experiments with acetonitrile-1-.sup.13C,.sup.14N and acetonitrile-1-.sup.13C,.sup.15N.
[0095] SABRE-SHEATH experiments performed with acetonitrile-1-.sup.13C,.sup.14N and acetonitrile-1-.sup.13C,.sup.15N showed the same trends as experiments with pyridine-.sup.14N and pyridine-.sup.15N. Namely, signal enhancement was significantly higher for doubly labeled substrate acetonitrile-1-.sup.13C, .sup.15N (.epsilon..about.230) than that for acetonitrile-.sup.13C,.sup.14N (.epsilon..about.20), see FIG. 4A, when using 50% parahydrogen. Furthermore, a subsequent dilution and optimization of the sample composition allowed us to achieve much higher .sup.13C NMR signal enhancements (.epsilon..about.6,700, corresponding to P.sub.13C of .about.4.8% when using 50% parahydrogen), see FIG. 4B. This is mostly due to longer .sup.13C relaxation time at micro-Tesla magnetic field corresponding to the signal build-up time of .about.11 s (measured using the same experimental protocol as described in chapter 4 at .about.0.74 .mu.T, FIG. 5). T.sub.1 of .sup.13C site in acetonitrile-1-.sup.13C,.sup.15N is .about.39 s at 8.45 T (vs. .sup.13C T.sub.1 of .about.14 s in pyridine-.sup.15N at similar magnetic field of 9.4 T), which is also in line with much higher signal enhancements obtained for acetonitrile compared to those for pyridine (FIG. 4B). The T.sub.1 of .sup.15N site in acetonitrile-1-.sup.13C,.sup.15N is 97 s.
Example 2 Toward Hyperpolarized .sup.19F Molecular Imaging Via Reversible Exchange with Parahydrogen
[0096] Fluorine-19 has high NMR detection sensitivity-similar to that of protons, owing to its large gyromagnetic ratio and high natural abundance (100%). Unlike protons, however, fluorine-19 (.sup.19F) has a negligible occurrence in biological objects, as well as a more sensitive chemical shift. As a result, in vivo .sup.19F NMR spectroscopy and MR imaging offer advantages of negligible background signal and sensitive reporting of the local molecular environment. In some embodiments, disclosed herein is NMR hyperpolarization of .sup.19F nuclei using reversible exchange reactions with parahydrogen gas as the source of nuclear spin order. NMR signals of 3-fluoropyridine were enhanced by .about.100 fold, corresponding to 0.3% .sup.19F nuclear spin polarization (at 9.4 T) using ca. 50% parahydrogen. While future optimization efforts will likely significantly increase the hyperpolarization levels, the utility of .sup.19F hyperpolarization for high-resolution hyperpolarized .sup.19F imaging and hyperpolarized F pH sensing is already demonstrated.
[0097] The .sup.19F nucleus has a gyromagnetic ratio of 94% of that of proton, and a natural abundance of 100%. As a result, .sup.19F NMR has a detection sensitivity that is comparable to that of protons, which is the highest among stable isotopes. However, .sup.19F has almost no biological occurrence, giving rise to negligible background MR signal. Moreover, the .sup.19F chemical shift can be exquisitely sensitive to the local molecular environment, and unlike the case for low-frequency heteronuclei, it can be relatively easy to adapt clinical scanners for .sup.19F detection in commercial MR scanners. The use of .sup.19F exogenous contrast agents has recently fueled the development of a wide range of biomedical applications, including inhalable perfluorinated carbon compounds for pulmonary imaging, perfluoropolyether for stem cell tracking, and others. .sup.19F detection of thermally spin-polarized contrast agents at millimolar levels is feasible. These detection limits can be further reduced by 3 to 5 orders of magnitude using hyperpolarization. Biomedical applications of HP contrast agents and their potential to revolutionize molecular imaging are the primary drivers of the hyperpolarization technique development. So far, most approaches have focused on hyperpolarization of low-gamma nuclei (e.g., .sup.13C, .sup.129Xe, .sup.15N, etc.). These hyperpolarized (HP) compounds can be used to probe metabolism (e.g. elevated lactate metabolism in cancer using HP .sup.13C-pyruvate, pH, etc.), function (e.g. lung ventilation and diffusion), and others.
[0098] Hyperpolarization of high-gamma nuclei including .sup.1H and .sup.19F has seen a modest interest in the context of biomedical MR applications, because fluorine and proton sites frequently have short spin-lattice relaxation times (T.sub.1) and correspondingly short lifetimes of the HP state. .sup.19F nuclei (with T.sub.1.about.4.2 s-4.6 s) of perfluorinated compounds were hyperpolarized by parahydrogen induced polarization technique by Plaumann and co-workers. However, recent developments in the field of long-lived spin states have the potential to significantly extend the lifetime of HP states in general--including HP states of high-gamma nuclei. Therefore, HP fluorine contrast agents may offer the best of many worlds: naturally high detection sensitivity, enhanced with NMR hyperpolarization, potentially enabling highly spectrally-sensitive detection at sub-millimolar range--all without interference from background signals.
[0099] It was demonstrated that Signal Amplification By Reversible Exchange (SABRE) can be extended to hyperpolarization of heteronuclei (e.g. .sup.15N) by performing SABRE in micro-Tesla magnetic fields. This was introduced as SABRE in SHield Enables Alignment Transfer to Heteronuclei (SABRE-SHEATH). SABRE-SHEATH has since been applied to a wide range of .sup.15N labeled molecules including an array with high biological relevance. The hyperpolarization process is efficient, allowing one to achieve .sup.15N polarization (P.sub.15N) values exceeding 20% in less than a minute. This technique employs chemical exchange of a to-be-hyperpolarized compound and parahydrogen gas (para-H.sub.2). In the transient polarization transfer complexes nuclear spin order is transferred spontaneously from para-H.sub.2 to spins in the target molecule when the static magnetic field is chosen appropriately. A metal catalyst is used to drive this reversible process. To date, Iridium hexacoordinate complexes with equatorial exchangeable ligands (FIG. 6) are the most efficient SABRE and SABRE-SHEATH catalysts.
[0100] In some embodiments, disclosed herein is the hyperpolarization of .sup.19F, extending SABRE-SHEATH hyperpolarization to other heteronuclei. In addition, the present disclosure demonstrates the feasibility and utility of .sup.19F SABRE-SHEATH for molecular imaging as well as .sup.19F pH sensing.
[0101] All experiments were performed using a previously developed SABRE hyperpolarization setup employing a mass-flow-controller (MFC) and medium-wall 5 mm NMR tubes (FIG. 6A) enabling systematic studies at up to 7 atm of para-H.sub.2. Samples were prepared with .about.5 mM of the pre-activated catalyst [IrCl(cod)(IMes), where IMes=1,3-bis(2,4,6-trimethylphenyl)imidazol-2-ylidene; cod=cyclooctadiene] and .about.100 mM 3-.sup.19F-pyridine (3-.sup.19F-Py) in a CD.sub.3OD solution (.about.0.6 mL, Isotec-Sigma-Aldrich), FIG. 6. The NMR tube was inserted into 1/4 in. OD/ 3/16 in. ID Teflon tubing, which allowed for convenient connection to a 1/4 in. push-to-connect port of the high-pressure setup for para-H.sub.2 bubbling via 1/16 in. OD/ 1/32 in. ID tubing inserted all the way to the bottom of the NMR tube. The catalyst activation by para-H.sub.2 was monitored by in situ .sup.1H NMR spectroscopy at 400 MHz by detecting the formation of HP intermediate hydride species and the signatures of HP hydride peaks of the hexacoordinate complex shown in FIG. 6B (expected at (-)10-(-)27 ppm range). The corresponding .sup.1H NMR spectra of the activating and fully activated catalyst with this substrate are shown FIGS. 9A and 9B. The formation of this complex was also confirmed by performing .sup.1H SABRE hyperpolarization at .about.6 mT, and the maximum signal enhancement C.sub.H was found to be .about.215-fold, corresponding to P.sub.H.about.0.7% using 50% para-H.sub.2 (FIG. 10).
[0102] Once the SABRE catalyst is activated, it forms a hexacoordinate complex corresponding to four-spin system (AA'BB') with heteronuclear spin-spin couplings mediating spontaneous SABRE-SHEATH polarization transfer (FIG. 6). Finally, .sup.19F SABRE-SHEATH experiments were performed using a magnetic shield, as outlined in FIG. 6A. FIG. 7A shows a .sup.19F NMR spectrum of 3-.sup.19F-Py hyperpolarized via SABRE-SHEATH. The maximum signal enhancements were .epsilon..sub.F.about.93-fold and .about.98-fold for free and catalyst-bound .sup.19F NMR resonances, respectively, corresponding to .sup.19F polarization (P.sub.F) of .about.0.28% using .about.50% para-H.sub.2. If .about.100% para-H.sub.2 would be employed the P.sub.F would be effectively tripled to .about.0.85%. While representing a significant improvement in sensitivity, this number is still several-fold lower than corresponding values achieved via .sup.1H SABRE conducted in the milli-Tesla regime (see above and also previous reports), as well as values previously achieved for .sup.15N polarization using the SABRE-SHEATH approach. The likely explanation for this trend is several fold lower .sup.19F T.sub.1 values at high and low magnetic fields (FIGS. 7E and 7F) under otherwise similar experimental conditions (as will be discussed in greater detail below), which likely resulted in disproportionately greater polarization loss during the .about.6 s long sample transfer from the magnetic shield into the 9.4 T NMR spectrometer.
[0103] It should be noted that .about.(-)122.8 ppm resonance seen in thermal spectrum (FIG. 7C) corresponding to axial 3-.sup.19F-Py is not significantly hyperpolarized (FIG. 7A), because the corresponding spin-spin coupling between hydride protons and .sup.19F are significantly weaker those in equatorial plane.
[0104] The .sup.19F SABRE-SHEATH build-up time constant T.sub.b (1.3.+-.0.3 s, FIG. 7G) is relatively short compared to 47, of .sup.1H spins in the milli-Tesla regime (21.+-.2 s), likely due to interactions with .sup.14N (i.e. within the 3-.sup.19F-Py framework) acting as an efficient quadrupolar relaxation center in the micro-Tesla regime, i.e., via scalar relaxation of the second kind. Indeed, this explanation is additionally supported by the observing that the SABRE-SHEATH .sup.19F signal as a function of the field (FIG. 7H) exhibits no clear maximum compared to the well-defined maximum typically observed in the case of .sup.15N SABRE-SHEATH. Moreover, It was recently shown that relaxation problems caused by quadrupolar neighbors could be greatly mitigated for the hyperpolarization of more distant .sup.13C spins by replacing .sup.14N (I=1) with .sup.15N (I=1/2) in the target substrate--an approach which should improve .sup.19F hyperpolarization as well.
[0105] While performing .sup.19F SABRE experiments at the Earth's magnetic field (ca. 50-80 .mu.T) yielded expected anti-phase HP lines (FIG. 7D), .sup.19F SABRE hyperpolarization in the milli-Tesla range (ca. 6 mT, FIG. 7B) yielded in-phase HP resonances with .epsilon..sub.F.about.27 fold and .epsilon..sub.F.about.24 fold for free and catalyst-bound .sup.19F NMR resonances, respectively. Not surprisingly, the .sup.19F SABRE hyperpolarization efficiency in the milli-Tesla range is significantly lower than that in the micro-Tesla range of SABRE-SHEATH, despite more favorable relaxation properties (e.g. scalar relaxation of the second kind should be suppressed in the milli-Tesla magnetic field regime). Notably, .sup.19F HP signals produced in both milli-Tesla and micro-Tesla field regimes are in-phase (i.e. more suitable for MRI), and are absorptive (i.e., they have the same phase as the thermally .sup.19F polarized signals, FIG. 7C). Similarly to .sup.1H SABRE and .sup.15N SABRE-SHEATH, .sup.19F SABRE-SHEATH signals exhibited a clear maximum when measured as a function of temperature (FIG. 7I).
[0106] Experiments with 2-.sup.19F-pyridine and 2,3,4,5,6-.sup.19F-pyridine did not yield any HP hydride signatures or .sup.1H/.sup.19F HP substrate resonances, likely owing to the effects of steric hindrance; therefore, further studies exploring the feasibility of applications were performed with HP 3-.sup.19F-Py. First, FIG. 8A demonstrates the feasibility of .sup.19F HP MRI imaging using SABRE-SHEATH. The obtained HP .sup.19F MR image is from a tilted 5 mm NMR tube with 0.5.times.0.5 mm.sup.2 in-plane spatial resolution, and was obtained with a .sup.1H surface coil (conveniently re-tuned to .sup.19F resonance frequency) placed underneath the NMR tube containing the HP solution. Note that the tube contains 1/32 in. ID tubing ( 1/64 in. (.about.0.4 mm) wall thickness) inserted all the way to the bottom of the NMR tube, which is resolved in this image as two narrow bands with depressed signal. The corresponding image from a thermally polarized sample (FIG. 8B) yielded only noise.
[0107] Next, the feasibility of hyperpolarized pH sensing with HP .sup.19F was also demonstrated (FIG. 8D). First, 3-.sup.19F-Py was hyperpolarized at pH>>pKa in the deprotonated form (red resonance). The HP solution was then spiked with .about.0.3 mL of concentrated HCl, and the corresponding HP NMR signal of the protonated form (blue resonance) was frequency shifted by .about.10.5 ppm (note that the level of hyperpolarization of the protonated form is lower than that of the deprotonated form due to polarization relaxation because of an additional >10 s-long sample handling time). While the corresponding frequency shift of .sup.15N sites is .about.90 ppm for pH sensing applications (i.e. appearing to be .about.9 times greater on the ppm scale), it is noted that on the Hz frequency scale, these nuclei actually provide near-equal dynamic range, because the .sup.19F spin has a >9-fold greater gyromagnetic ratio compared to that of .sup.15N. It is also noted that the absolute spectral sensitivity of .sup.19F to changes in pH is >30 times greater than that of similar proton sites.
[0108] .sup.19F has negligible natural occurrence in biology, which provides a benefit virtually zero background signal for in vivo .sup.19F spectroscopic and imaging applications. Naturally, the .sup.19F SABRE-SHEATH hyperpolarization demonstrated here could be exploited for many biomedical applications, including in vivo pH sensing. Moreover, approximately 200% of drugs contain .sup.19F in their structures, some of which can be potentially suitable for .sup.19F SABRE-SHEATH hyperpolarization in the context of theranostic applications (e.g. following biodistribution of 5-fluorouracil in cancer, which has a molecular framework potentially amenable to already-existing SABRE catalysts). Furthermore, because of the relatively high sensitivity of .sup.19F (endowed by its large gyromagnetic ratio and 100% natural abundance) and strong spectral sensitivity to the molecular environment, combined with the near-zero background signal and the possibility of using the available .sup.1H channel in clinical MRI scanners (vs. the need for dedicated X-nucleus channels for .sup.13C and .sup.15N imaging), it is speculated that HP .sup.19F (enabled by SABRE-SHEATH) can potentially become a game-changing technology for molecular imaging. The relatively short .sup.19F T.sub.1 value of the agent employed here is of potential concern in the context of potential biomedical translation, and contrast agents with longer .sup.19F in vivo T.sub.1 need to be developed for future in vivo translation of the presented work. It is noted however that pH sensing using non-hyperpolarized .sup.19F injectable agents has been shown successful previously.
[0109] In summary, the present disclosure demonstrates the feasibility of .sup.19F hyperpolarization via SABRE-SHEATH, achieving signal enhancements of the order of .about.100-fold at 9.4 T (P.sub.F.about.0.28%). It is likely that the degree of hyperpolarization can be improved through the optimization of conditions, similarly to recent reports of P.sub.15N>20% and P.sub.H>50%. The presented method may also be combined with recent reports of heterogeneous and aqueous SABRE hyperpolarization, likely required for future biomedical translation for pH imaging, theranostics, and other envisioned applications.
[0110] Experimental Procedures
[0111] 3-.sup.19F-pyridine (0.10 M final concentration) and pre-activated iridium catalyst ([IrCl(COD)(IMes)], 0.005 M final concentration) and methanol-d.sub.4 were added to an Eppendorf safe-lock tube. The stock solution was then flushed with Argon and vortexed. In order to achieve lower tracer and catalyst concentration, the stock solution was diluted.
[0112] The stock solution was transferred into an Argon-filled medium-walled NMR sample tube (5 mm medium wall precision, 3.43 mm ID, 9 in. long, Wilmad Glass, P/N 503-PS-9) equipped with a Teflon tube extension: 0.25 in. OD, 3/16 in. ID. The Teflon extension was approximately 7 cm in length. The tube was connected to the previously described setup using a Wye push-to-connect adapter. The SABRE sample was activated by bubbling parahydrogen at 20-50 sccm for .about.20 minutes using .about.50% parahydrogen. The parahydrogen flow rate was controlled using a mass flow controller (Sierra Instruments, Monterey, Calif., model number C100L-DD-OV1-SV1-PV2-V1-S0-C0).
[0113] The SABRE-SHEATH hyperpolarization procedure was performed using the approach described previously. The sample solution was bubbled with .about.50% parahydrogen at 100 sccm for .about.30 s (and at .about.6 atm) inside the magnetic shield. More specifically, the magnetic field in the lab was attenuated using a three-layered mu-metal shield (6 in. ID & 15 in. in length, part number ZG-206, Magnetic Shield Corp., Bensenville, Ill.); tunability of the residual micro-Tesla magnetic field was attained using a custom-built solenoid coil and a power supply (GPRS series, GW INSTEK) with an in-series variable-resistor bank. After cessation of parahydrogen bubbling, the sample was quickly transferred from the shield to the Earth's magnetic field, followed by rapid sample insertion into the bore of a 9.4 T magnet and immediate acquisition of the .sup.19F NMR spectrum. Typical sample transfer time (from cessation of para-H.sub.2 gas to .sup.19F detection in the 9.4 T magnet) was approximately 6 seconds. The .sup.19F NMR signal enhancements were calculated by comparison of the intensity of thermally polarized .sup.19F NMR spectra and the corresponding hyperpolarized .sup.19F NMR spectra.
[0114] .sup.19F SABRE and SABRE-SHEATH Enhancement Factor Calculation
[0115] The .sup.19F SABRE-SHEATH signal enhancements were calculated by comparing the integral signal intensities of the .sup.19F NMR peaks of the spectrum from a given hyperpolarized sample with the corresponding thermally polarized .sup.19F NMR peaks of the same sample.
.epsilon.=S.sub.HP/S.sub.THERMAL,
where S.sub.HP is the integral calculated for the hyperpolarized signal and S.sub.THERMAL is the corresponding integrated signal from the same sample under conditions of equilibrium thermal polarization at 9.4 T.
[0116] The .sup.19F polarization percentage (% P) was calculated as follows (where % P.sub.thermal=3.0.times.10.sup.-3% is the equilibrium thermal .sup.19F polarization at 9.4 T and room temperature):
% P=.epsilon..times.% P.sub.thermal=93.times.3.0.times.10.sup.-3%.apprxeq.0.3%
[0117] Hyperpolarized .sup.19F NMR Signal Build-Up and Decay Measurements
[0118] The .sup.19F NMR signal build-up curve (FIG. 7G) was measured by varying the parahydrogen bubbling time (for the parahydrogen bubbling through the NMR tube containing the catalyst and substrate solution) in the magnetic shield at .about.5 micro-Tesla. The signal (for each timing of hyperpolarization) was recorded inside the 400 MHz NMR spectrometer (i.e. at 9.4 T) after rapid sample transfer, with each experiment corresponding to an individual data point. Following a time period of hyperpolarization, parahydrogen flow was terminated, the HP sample was quickly removed from the magnetic shield chamber and transported into 9.4 T NMR spectrometer for .sup.19F detection.
[0119] The Earth's field .sup.19F T.sub.1 of 3-.sup.19F-pyridine (FIG. 7F) was measured using the following procedure: Parahydrogen was bubbled through the solution in the mu-metal magnetic shield for approximately 30 s. When parahydrogen flow was stopped, the NMR tube was transferred to the Earth's field, and it was stored there for a variable period of time. Then the sample was quickly (.about.5 s) transferred to the high magnetic field (9.4 T) for recording the .sup.19F NMR signal. One data point was acquired for each experiment. The decay data was then plotted as a .sup.19F signal dependence upon the decay time at the Earth's magnetic field.
[0120] The .sup.19F T.sub.1 at high field (400 MHz, FIG. 7E), was measured on a single .sup.19F hyperpolarized sample by employing a series of .sup.19F NMR acquisitions using small tipping-angle (<8.degree.) excitation RF pulses after the sample transfer to the high magnetic field of the 9.4 T/400 MHz NMR spectrometer. The decay time constant was not corrected for the minimal polarization losses caused by the RF observation pulses.
Example 3 Spin Relays Enable Efficient Long-Range Heteronuclear Signal Amplification by Reversible Exchange
[0121] A systematic experimental study is reported on the polarization transfer to distant spins, which do not directly bind to the polarization transfer complexes employed in Signal Amplification By Reversible Exchange (SABRE) experiments. Both, long-range transfer to protons and long-range transfer to heteronuclei i.e. .sup.13C and .sup.15N are examined. Selective destruction of hyperpolarization on .sup.1H, .sup.13C, and .sup.15N sites is employed, followed by their re-hyperpolarization from neighboring spins within the molecules of interest (pyridine for .sup.1H studies and metronidazole-.sup.15N.sub.2-.sup.13C.sub.2 for .sup.13C and .sup.15N studies). It is concluded that long-range sites can be efficiently hyperpolarized when a network of spin-1/2 nuclei enables relayed polarization transfer (i.e. via short-range interactions between sites). In case of proton SABRE in the milli-Tesla regime, a relay network consisting of protons only is sufficient. However, in case .sup.13C and .sup.15N are targeted (i.e. via SABRE in SHield Enables Alignment Transfer to Heteronuclei or SABRE-SHEATH experiment), the presence of a heteronuclear network (e.g. consisting of .sup.15N) enables a relay mechanism that is significantly more efficient than the direct transfer of spin order from para-H.sub.2-derived hydrides.
[0122] Introduction
[0123] Hyperpolarization techniques transiently increase nuclear spin polarization (P) by several orders of magnitude, resulting in corresponding gains in NMR signals. These techniques enable new applications including in vivo molecular imaging, which relies on preparation, administration, and MRI of exogenous hyperpolarized (HP) contrast agents. Several technologies have been developed to produce HP states of low-gamma spin 1/2 nuclei (e.g. .sup.13C and .sup.15N), which retain HP state significantly longer than protons in biomolecular motifs.
[0124] Signal Amplification by Reversible Exchange (SABRE) is the hyperpolarization method, which employs parahydrogen (para-H.sub.2) as the source of spin order. SABRE relies on spontaneous polarization transfer from para-H.sub.2-derived hydrides to a substrate on polarization transfer catalysts. The SABRE polarization transfer is primarily accomplished via spin-spin interactions (i.e. J-couplings). While other interactions may contribute, they are generally orders of magnitude less efficient. When polarization transfer is performed in milli-Tesla (mT) magnetic fields, the polarization from para-H.sub.2-derived hydrides is spontaneously transferred to proton sites in substrates, enabling .sup.1H polarization values (% P.sub.H) of up to 500%. In this case, proton-proton spin-spin couplings (J.sub.H-H) enable SABRE polarization transfer. Another variant of this technique dubbed SABRE in SHield Enables Alignment Transfer to Heteronuclei (SABRE-SHEATH) is an efficient process for hyperpolarizing .sup.15N sites, in one example providing more than 20% polarization in 1 minute. .sup.15N-hyperpolarization is of particular interest, because it enables long hyperpolarization lifetimes and exponential decay constants. In some cases, .sup.15N exponential decay constant can exceed 20 minutes. SABRE-SHEATH is accomplished at micro-Tesla (.mu.T) magnetic fields, enabling spontaneous polarization transfer from para-H.sub.2-derived hydrides to heteronuclei, as illustrated in FIG. 11A. In case of .sup.15N SABRE-SHEATH proton-nitrogen-15 spin-spin couplings (J.sub.H-15N) enable the spontaneous polarization transfer. While polarization transfer between nuclear spins in the same molecule in solution is an extremely well documented area, the case is less clear for SABRE and SABRE-SHEATH, which occur within a complex with finite lifetime, and which involves several changes of the external magnetic field.
[0125] Previously, this approach has been bolstered by a series of advancements from proof-of-principle demonstrations in organic solvents (including "neat" substrates) all the way to demonstrations of SABRE-SHEATH enhancement under heterogeneous catalytic conditions and catalysis in aqueous media, which in principle will enable the preparation of pure aqueous .sup.15N HP compounds for potential in vivo use. Moreover, the scope of amendable bio-structures has been expanded from N-heterocycles to Schiff bases, diazirines, and nitriles.
[0126] However, despite these successes, to date SABRE-SHEATH has been primarily employed for hyperpolarization of .sup.15N sites that bind directly to metal centers via two-bond spin-spin couplings (i.e. short-range couplings to substrate .sup.15N sites directly binding to catalysts like Ir-IMes [IMes=1,3-bis(2,4,6-trimethylphenyl)imidazole-2-ylidene], FIG. 11A). Efforts to hyperpolarize long-range .sup.15N sites (i.e. more than 2 chemical bonds away from para-H.sub.2-hydrides) showed that polarization efficiency is reduced by more than an order of magnitude-presenting a clear obstacle for expanding SABRE hyperpolarization technology to broader classes of substrates. Moreover, recent studies of direct .sup.13C and .sup.19F hyperpolarization via SABRE indicated that the problem can be mitigated if the nitrogen sites binding the iridium metal centers are labeled with .sup.15N nuclei as opposed to naturally occurring quadrupolar .sup.14N spins. However, the obvious question regarding the mechanism of polarization transfer (and more importantly its limitations) was unanswered. Specifically: "Is SABRE of distant heteronuclei accomplished directly via long-range J-couplings, or does it work indirectly via relay through a network of spins (FIG. 11B)?
[0127] In some embodiments, disclosed herein is experimental evidence that SABRE of long-range .sup.15N and .sup.13C sites is efficient in the presence of a relay network connected by close-range spin-spin couplings. While the data presented does not rule out a direct mechanism via weak long-range J-couplings, the indirect mechanism is significantly more efficient than the direct polarization transfer (i.e., the enhancements observed cannot be fully explained by long-range transfer; although long-range transfer is possible, it leads to weaker enhancements). The presented disclosure enables techniques for efficient SABRE-SHEATH hyperpolarization of remote heteronuclear sites.
[0128] Methods
[0129] All NMR spectra were recorded using a 9.4 T Bruker Avance III high-resolution NMR spectrometer equipped with a broadband dual-channel NMR probe. All SABRE experiments were performed using .about.50% para-H.sub.2. All sample manipulations related to the sample transfer between magnetic fields (i.e. the Magnetic Field Cycling (MFC) procedures) were performed manually (FIGS. 12A-12B and FIGS. 13A-13B). The NMR spectra from metronidazole-.sup.15N.sub.2-.sup.13C.sub.2(Millipore-Sigma P/N 32744-10MG) samples were recorded in medium-wall 5 mm NMR tubes, whereas the spectra from signal reference samples were recorded using standard 5 mm NMR tubes.
[0130] Preparation of solutions. Previously synthesized IrIMes catalyst was used for the described studies. Metronidazole-.sup.15N.sub.2-.sup.13C.sub.2 (.about.20 mM final concentration) and pre-activated iridium catalyst ([IrCl(COD)(IMes)], .about.1.0 mM final concentration) and methanol-d.sub.4 were prepared from stock solutions of Metronidazole-.sup.15N.sub.2-.sup.13C.sub.2 (40 mM) and ([IrCl(COD)(IMes)], 2.0 mM). Both solutions were flushed with Argon and vortexed (at least three times) in an Eppendorf safe-lock tube and Duran bottle (10 mL GL25) correspondently. While Metronidazole-.sup.15N.sub.2-.sup.13C.sub.2 solution was used over a period of several days (stored at .about.6 C.degree.), ([IrCl(COD)(IMes)] was prepared fresh each day and stored for <10 hours in a refrigerator (.about.6 C.degree.). A portion (.about.0.3 mL) of each stock solutions was transferred into an Argon-filled medium-walled 5 mm NMR sample tube: 9 in.-long, 3.43-mm inner diameter (ID) (Wilmad Glass, P/N 503-PS-9) equipped with a Teflon tube extension: 0.25 in. outer diameter (OD), 3/16 in. ID. The Teflon extension was approximately 3-in. long. The tube was connected to the previously described setup. The best results were obtained by SABRE sample activation by bubbling para-H.sub.2 for .about.3 minutes (at 90 sccm & 65 psi) and leaving sample for .about.1 hour under para-H.sub.2 at 65 psi.
[0131] SABRE hyperpolarization. For SABRE experiments, the para-H.sub.2 flow rate (50 sccm, .about.1 minute of bubbling) was controlled using a mass flow controller (Sierra Instruments, Monterey, Calif., P/N C100L-DD-OV1-SV1-PV2-V1-S0-C0). The schematic of SABRE experimental setup is shown in FIG. 12A, and the corresponding sequence of the events is shown in FIG. 12B. Micro-Tesla magnetic field was created by attenuating the Earth's magnetic field using a three-layered mu-metal shield (Magnetic Shield Corp., Bensenville, Ill., P/N ZG-206). The tuning of SABRE-SHEATH magnetic field was achieved by custom-built solenoid coil (>90% homogeneity over >15 cm length) and a power supply (GW INSTEK, GPRS series) with variable-resistor bank connected in series with the magnet coil. When para-H.sub.2 bubbling was stopped, the sample was transferred from the shield to the Earth's magnetic field (ca. 50 .mu.T), followed by rapid sample transfer into a 9.4 T magnet of the NMR spectrometer for data acquisition or further manipulations as described in the main text. Typical sample transfer time (from cessation of para-H.sub.2 gas to .sup.15N/.sup.13C/.sup.1H signal detection) was 4-7 seconds. The schematic of SABRE-SHEATH experimental setup is shown in FIG. 13A, and the corresponding sequence of the events is shown in FIG. 13B.
[0132] In certain embodiments, disclosed is the use of magnetic field cycling (MFC) to the Earth's magnetic field, ca. 50 .mu.T, (SABRE-SHEATH, FIG. 13B) for .sup.15N re-polarization, whereas .sup.1H re-polarization (SABRE, FIG. 12B) employs MFC to the fringe field, ca. 6 mT, due to the difference in the matching conditions for efficient .sup.15N.fwdarw..sup.15N or .sup.1H.fwdarw..sup.1H re-polarization respectively.
[0133] Computation of NMR signal and nuclear spin polarization enhancements. The signal enhancements were computed as the following. .sup.1H enhancements were computed by diving the HP signal magnitude by the magnitude of thermally polarized signals. In case of .sup.15N and .sup.13C, the thermally polarized signals were generally very low, and therefore, external signal reference was employed. The enhancements were computed as follows:
? = S HP S REF .times. C REF C HP .times. A REF A HP .times. N REF N HP ##EQU00001## ? indicates text missing or illegible when filed ##EQU00001.2##
where S.sub.HP and S.sub.REF are NMR signals for HP state and thermally polarized signal reference samples respectively, C.sub.REF and C.sub.HP are the effective isotope concentrations of thermally polarized signal reference and HP samples respectively, A.sub.REF and A.sub.HP are the solution cross-sections in the NMR tube of thermally polarized signal reference and HP samples respectively, and Na.sub.REF and H.sub.HP are the numbers of symmetrical sites per molecule for the thermally polarized signal reference and HP samples respectively (A.sub.REF/A.sub.HP was .about.1.85 as described earlier). Percentage polarization was computed by multiplying signal enhancement .epsilon. by the equilibrium nuclear spin polarization of a given spin at 9.4 T and 298K: 3.2.times.10.sup.-3% (.sup.1H), 8.1.times.10.sup.-4% (.sup.13C), 3.3.times.10.sup.-4% (.sup.15N).
[0134] Results and Discussion
[0135] General Consideration. Briefly, the reader is reminded that in case of traditional SABRE (i.e. hyperpolarization of proton sites), the matching condition for J-coupling (.sup.1H-.sup.1H) mediated polarization transfer occurs at a few mT magnetic field. In case of SABRE-SHEATH (i.e. hyperpolarization of heteronuclear sites, e.g. .sup.15N and .sup.13C), the matching condition for J-coupling (e.g., .sup.1H-.sup.15N) mediated polarization transfer occurs at .mu.T magnetic field. Detailed theory is provided in earlier works of Duckett et al. and Theis at al.
[0136] SABRE hyperpolarization of pyridine proton sites. The first reports of SABRE demonstrated that proton sites at least six-bonds away can be efficiently hyperpolarized. The theoretical basis for SABRE indicated that polarization transfer from para-H.sub.2-hydrides to substrate protons is accomplished via a networks of proton-proton couplings, although the recent study by Eshuis and co-workers determined the values of these four-, five-, and six-bond spin-spin couplings, and postulated that these long-range couplings may also enable the canonical SABRE effect via the direct transfer of spin order.
[0137] In certain embodiments, disclosed is an approach for studying .sup.1H SABRE, which includes selective spin destruction of HP resonances of ortho-pyridine protons (denoted as Ha in FIG. 36A) after the sample is hyperpolarized at magnetic field of .about.6 mT and para-H.sub.2 bubbling is stopped (FIG. 36B). After destroying the Ha polarization with a frequency-selective pulse (FIG. 14C), the sample was moved back into the .about.6 mT field, and finally, the sample was returned to the 9.4 T NMR spectrometer for detection (this procedure effectively represents magnetic field cycling or MFC--the details of the experimental setup and the involved steps are shown in FIGS. 12A-12B of the Methods section). The resulting spectrum shown in FIG. 14D indeed shows that the Ha HP state is successfully re-created using the meta- and para-(Hb and Hc) protons as hyperpolarization reservoirs. Corresponding datasets showing HP state destruction and re-creation for the Hb and He protons are shown in FIG. 21.
[0138] All-in-all, the experimental results shown in FIGS. 14A, 14B, 14C, 14D and FIG. 21 are clearly consistent with the canonical (i.e. .sup.1H) SABRE effect in the mT regime may indeed rely on the network of proton-proton couplings, in agreement with pioneering studies by Duckett and co-workers.
[0139] SABRE hyperpolarization of metronidazole-.sup.15N.sub.2-.sup.13C.sub.2 in micro-Tesla (.mu.T) magnetic fields (SABRE-SHEATH). Hyperpolarization in .mu.T magnetic fields was performed using a .mu.-metal magnetic shield that attenuates the Earth's magnetic field (ca. 50 .mu.T) down to the sub-.mu.T regime (FIG. 13A). The structure of the activated complex and the schematic of SABRE-SHEATH process are shown in FIG. 15. Efficient .sup.15N and .sup.13C SABRE-SHEATH hyperpolarization has been demonstrated previously, and no significant effort was made to optimize polarization parameters (e.g., temperature and .mu.T field) for the present study.
[0140] The following polarization levels were achieved for .about.20 mM metronidazole-.sup.15N.sub.2-.sup.13C.sub.2 solutions in methanol-d.sub.4 using 50% para-H.sub.2: .epsilon..sub.15N1.about.4,000 (% P.sub.15N1.about.1.3%), .epsilon..sub.115N3.about.4,700 (% P.sub.15N1.about.1.5%), FIGS. 16A and 16B, .epsilon..sub.13C2.about.310 (% P.sub.13C2.about.0.3%), .epsilon..sub.13CH3.about.230 (% P.sub.13CH3.about.0.2%), FIGS. 16C and 16D, .epsilon..sub.H.about.14 (% P.sub.H.about.0.04%), FIGS. 16E, 16F, and 16G. If near 100%/para-H.sub.2 were employed, the polarization values would be effectively tripled. % P.sub.15N values are within the expected ranges for the employed concentration regime. % P.sub.13C values are several times lower than % P.sub.15N, because initial micro-Tesla field optimization was performed for .sup.15N spins, and the optimization of polarization efficiency was outside the scope of the presented mechanistic study. % P.sub.H values are significantly lower than % P.sub.15N and % P.sub.13C values, because .mu.T fields are not optimal for proton SABRE.
[0141] SABRE-SHEATH hyperpolarization of long-range .sup.15N sites. .sup.15N hyperpolarization of metronidazole at natural abundance of .sup.15N (.about.0.3%) and .sup.13C (.about.1.1%) isotopes was recently shown. In that work, the efficiency of SABRE-SHEATH hyperpolarization (gauged as % P.sub.15N) of .sup.15N.sub.1 and -.sup.15NO.sub.2 sites was significantly lower (by more than an order of magnitude) than that of the .sup.15N.sub.3 site. Low natural .sup.13C/.sup.15N abundance results in simplification of the spin system (participating in SABRE-SHEATH), effectively reducing it to a three-spin system (FIG. 17), because the statistical probability of the simultaneous presence of two spins (e.g. .sup.15N and .sup.15N or .sup.15N and .sup.13C) is two orders of magnitude lower than the statistical probability of the structures shown in FIG. 17A-17C (SABRE relevant spin-spin couplings for direct polarization transfer are shown in FIGS. 17E and 17F).
[0142] The .sup.15N SABRE-SHEATH polarization of metronidazole-.sup.15N.sub.2-.sup.13C.sub.2 shows that polarization efficiency of .sup.15N.sub.1 site is 85% of that of the .sup.15N.sub.3 site (FIG. 16A), which is markedly different from the previously reported corresponding value of 2%. This more than 40-fold improvement of hyperpolarization at .sup.15N.sub.1 can be rationalized by the presence of .sup.15N.sub.3 and .sup.13C sites in this labeled molecule, which provides a J-coupling network enabling relayed SABRE-SHEATH polarization transfer (instead of direct H.fwdarw..sup.15N.sub.1 transfer). In the relayed case, two-bond couplings (.sup.2J.sub.H-15N3 and .sup.2J.sub.H-15N3) enable hyperpolarization of the .sup.15N.sub.3 site, and .sup.15N hyperpolarization is then propagated to other .sup.13C and .sup.15N sites via the heteronuclear coupling network.
[0143] Additional experimental evidence for the relayed nature of such polarization transfer is provided in FIG. 18 and FIG. 19. For these experiments the HP sample was inserted in the 9.4 T NMR spectrometer and the .sup.15N.sub.3 hyperpolarization was destroyed using frequency-selective RF pulses (note that the .sup.15N.sub.1 polarization was preserved in this case, FIG. 18A). The relevant setup and sample manipulation steps are shown in FIG. 13B. Following this selective polarization-destruction procedure, the sample was transferred into the Earth's magnetic field (ca. 50 .mu.T) to enable `re-mixing` of heteronuclear polarization (no bubbling of fresh para-H.sub.2 is performed). Lastly, the sample was returned into the NMR spectrometer for read-out. After this magnetic field cycling (MFC), the polarization of .sup.15N.sub.3 is recovered to nearly the same level as the one for the .sup.15N.sub.1 site, as shown in FIG. 18B. It is noted that the T.sub.1 of .sup.15N sites is typically on the order of 1 minute or greater, and a significant fraction of hyperpolarization can be retained after 10-30 seconds of manipulation time required in such experiments. It is also noted that para-H.sub.2 bubbling employed in the initial SABRE-SHEATH procedure was stopped before the sample left the magnetic shield for the first time. It is also noted that even when the SABRE hyperpolarization experiment was performed at the (higher) Earth's magnetic field (control experiment), the achieved polarization on .sup.15N.sub.1 and .sup.15N.sub.3 sites (FIG. 18C) was lower than the one achieved in FIG. 18B. When combined, this evidence supports the conclusion that in the MFC procedure, the .sup.15N.sub.3 site was re-hyperpolarized using the hyperpolarization pool of the .sup.15N.sub.1 site. While some polarization transfer from .sup.13C is also potentially possible, it is less likely because HP .sup.13C sites depolarize more quickly and the initial polarization levels of .sup.13C sites were significantly lower than those of .sup.15N sites (FIG. 16A). Moreover, in a separate experiment, .sup.15N magnetization of the HP .sup.15N.sub.1 site was inverted (using a 180.degree. RF pulse) (FIG. 18D) prior to the second MFC procedure. As a result of the spin inversion of the .sup.15N.sub.1 site, the resulting polarization on the .sup.15N.sub.3 site followed this inversion (FIG. 18E) after MFC. Furthermore, additional experiments (FIG. 22B) shows that MFC to the fringe field of .about.6 mT was not sufficient to achieve this effect, and re-hyperpolarization was less efficient.
[0144] The re-hyperpolarization mechanism requires mixing of spin states from .sup.15N.sub.3 and .sup.15N.sub.1 sites. At the Earth's field (ca. 50 .mu.T) the chemical shift difference of the two sites (ca. 100 ppm away) is only .about.0.02 Hz, which is significantly less than their J-coupling (which we estimate to be on the order of a Hertz or less). At 6 mT the frequency difference of the two sites is .about.2.6 Hz, which is apparently still too large for efficient level anti-crossing. Accordingly, MFC to the Earth's field (ca. 50 .mu.T) is required. It is also noted that performing the MFC procedure from the 9.4 T to the magnetic shield (and therefore passing the Earth's field condition twice) also leads to the .sup.15N re-polarization (data not shown), but the effect is significantly reduced, which is likely due to additional polarization leaks (e.g. to .sup.13C and .sup.1H sites).
[0145] FIG. 19 provides additional experimental evidence for polarization transfer from .sup.15N.sub.3 site to .sup.15N.sub.1 site. Instead of applying the frequency-selective irradiation on .sup.15N.sub.3, it was applied to .sup.15N.sub.1 (FIG. 19A). Exactly analogous results are obtained. The MFC to Earth's field (ca. 50 .mu.T) enables re-hyperpolarization of .sup.15N.sub.1 using the polarization of HP .sup.15N.sub.3(FIG. 19B). The corresponding spin inversion experiments (FIGS. 19C and 19D) prove that .sup.15N.sub.1 site was indeed re-hyperpolarized from magnetization of HP .sup.15N.sub.3 site.
[0146] While the possibility of polarization transfer between spin 1/2 nuclei is predictable, e.g. between two .sup.15N spins as shown here), demonstrating this phenomenon in the context of SABRE/SABRE-SHEATH repolarization is critical for understanding and proving the mechanism of relayed polarization transfer in weak magnetic fields. Taken together, the above evidence supports the model of relayed .sup.15N SABRE-SHEATH polarization of long range sites, explaining the efficient polarization of a distant .sup.15N.sub.1 site that is four bonds away from the para-H.sub.2-derived metal hydrides (FIG. 17D).
[0147] SABRE-SHEATH hyperpolarization of long-range .sup.13C sites. FIG. 16C demonstrates the efficient SABRE-SHEATH hyperpolarization of .sup.13C sites three and four bonds away from para-H.sub.2-derived hydrides. Importantly, the efficiency of .sup.13C hyperpolarization of the-.sup.13CH.sub.3 group was .about.75% of that of .sup.13C.sub.2 site: it is noted however, that--.sup.13CH.sub.3 sites may have lost disproportionately more polarization during sample transfer from .mu.T field to 9.4 T of NMR spectrometer, because the .sup.13C T.sub.1 in methyl groups is typically significantly shorter than T.sub.1 values of .sup.13C sites without directly attached protons (e.g. the .sup.13C.sub.2 site). Therefore, the actual efficiency (at the end of the SABRE-SHEATH procedure prior to the HP sample transfer) might have been better than 75%. It was recently demonstrated that the presence of a .sup.15N nucleus in pyridine and other similar compounds is essential for efficient polarization (i.e. large % P.sub.13C values) of .sup.13C sites that are three (ortho-position) and four (meta-position, FIG. 14) chemical bonds away from hydride protons (FIG. 11). That previous proof-of-principle work did not address the reasons for low heteronuclear polarization efficiency in the case of .sup.14N spins that would otherwise be present in such compounds. One part of the explanation is enhanced scalar relaxation of the second kind suffered by the target spins within the micro-Tesla regime, induced by quadrupolar .sup.14N sites within the scalar coupling network. A second explanation is the absence of a close spin 1/2 J-coupling network. All-in-all, the data presented in FIG. 20 supports the importance of J-coupling networks for hyperpolarization of .sup.13C spins too (in addition to the .sup.15N sites discussed as the primary topic of this work).
[0148] In FIG. 20, additional evidence is provided supporting the need for polarization relays in such strongly coupled networks. First, a metronidazole-.sup.15N.sub.2-.sup.13C.sub.2 sample was hyperpolarized via SABRE-SHEATH and para-H.sub.2 bubbling was stopped. Next, the sample was rapidly transferred into the 9.4 T NMR spectrometer, and hyperpolarization on the `C and`H sites was immediately destroyed (by applying a series of 90.degree. RF pulses to .sup.13C spins and .sup.1H decoupling to .sup.1H spins) and a proton-decoupled .sup.13C spectrum was acquired (FIG. 20A). In a separate experiment (instead of recording .sup.13C spectrum), the sample was additionally transferred back into the .mu.T field created by the magnetic shield (employed for SABRE-SHEATH polarization in the first step-here employed to re-enable heteronuclear polarization transfer), and .sup.13C hyperpolarization was indeed re-created (FIG. 20B). Since all .sup.13C and .sup.1H sites were depolarized (by broadband irradiation), it is concluded that the only remaining source of polarization for such .sup.13C re-hyperpolarization is the hyperpolarization pool of .sup.15N sites. Moreover, the efforts to re-polarize this sample by MFC to the Earth's magnetic field (FIG. 20C) were unsuccessful in comparison to re-hyperpolarization at .mu.T field (FIG. 20B)--further indicating that the source of polarization must be from non-carbon spins.
[0149] Broader relevance. Metronidazole is an important potential contrast agent (because high % P.sub.15N can be achieved, and it is possible to administer high (.about.2 g) dose of this potent antibiotic) that can be potentially employed for hypoxia imaging in a manner similar to fluoromisonidazole (FMISO) and other radiolabeled nitroimidazole derivatives used in position emission tomography (PET) imaging. Therefore, this work will certainly be useful for future development and optimization of SABRE-SHEATH hyperpolarization of this and other .sup.15N and .sup.13C HP imaging probes.
[0150] More generally, the systematic studies presented in this work provide clear experimental evidence that heteronuclear J-coupling spin-1/2 networks serve as the underlying fundamental basis for efficient relayed polarization transfer from para-H.sub.2-derived metal hydrides (FIG. 15) to substrate heteronuclei that do not directly bind to the Iridium complex. Here, we show that efficient hyperpolarization of long-range .sup.13C and .sup.15N sites is achieved in SABRE when a network of heteronuclear J-couplings is present. The presence of this network translates to efficient hyperpolarization of many heteronuclei, including .sup.13C, .sup.15N, .sup.31P, .sup.19F, etc. Most importantly, the nitrogen site directly interacting with the iridium hexacoordinate complex should be labeled to create a relay of spin 1/2 nuclei for efficient polarization transmission deeper within the intramolecular space. Therefore, it is believed that this relayed mechanism opens new opportunities for efficient SABRE hyperpolarization of new biomolecular targets, and informs the rational design of nuclear spin coupling networks in labeled agents for a wide variety of potential biomedical applications. Of note, .sup.13C labeling did not significantly affect .sup.15N T.sub.1 relaxation: T.sub.1 (.sup.15N.sub.3) is ca. 36 s with (data not shown) and without .sup.13C spin labeling.sup.14, which is relevant for production of HP contrast agents with long-lived HP states in the context of biomedical applications. As another example, uniformly (or backbone-).sup.13C/.sup.15N labeled peptides and proteins can potentially act as efficient networks of SABRE hyperpolarization, and it may be possible to hyperpolarize isotopically labeled peptides and proteins using this approach. It is also envisioned that isotopically labeled DNA, RNA, and other structures can be hyperpolarized via this SABRE-SHEATH approach. The general concept of relayed polarization transfer through a close J-coupling network will also potentially translate to LIGHT-SABRE and RF-SABRE sequences that create hyperpolarization directly in the magnet and avoid the need for sample transfer.
[0151] In the context of SABRE hyperpolarization of proton sites, this work provides experimental evidence in support of relayed polarization transfer. As a result, it would be potentially possible to hyperpolarize long-range proton sites too. While proton-hyperpolarized compounds are rarely used for contrast agents for HP MRI, potential SABRE applications most likely would include analysis of complex mixtures at low concentrations with potential detection of nitrogen- and sulfur-containing heterocycles in oil or refined petroleum products.
[0152] Conclusion
[0153] Efficient SABRE hyperpolarization of long-range .sup.13C and .sup.15N sites was demonstrated in metronidazole-.sup.15N.sub.2-.sup.13C.sub.2 in the .mu.T field regime. The present disclosure shows that long range .sup.13C and .sup.15N sites (i.e. three and four chemical bonds away from para-H.sub.2-derived hydrides) can be hyperpolarized much more efficiently via a mechanism of relayed spin-polarization transfer than via weak long-range J-couplings. Specifically, the short-range .sup.15N site, directly bound to Iridium, is hyperpolarized first and hyperpolarization is then transferred/relayed to other intramolecular sites via a network of short-range J-couplings involving further spins. The presented evidence opens new opportunities for SABRE-based hyperpolarization of long range spin-1/2 nuclei in a wide range of applications ranging from biomedical contrast agents, to analysis of complex mixtures, to structural biology.
[0154] Experimental Details
[0155] In case of .sup.15N and .sup.13C, the thermally polarized signals were generally very low, and therefore, external signal reference was employed. The enhancements were computed as follows:
? = S HP S REF .times. C REF C HP .times. A REF A HP .times. N REF N HP ##EQU00002## ? indicates text missing or illegible when filed ##EQU00002.2##
where S.sub.HP and S.sub.REF are NMR signals for HP state and thermally polarized signal reference samples respectively, C.sub.REF and C.sub.HP are the effective isotope concentrations of thermally polarized signal reference and HP samples respectively, A.sub.REF and A.sub.HP are the solution cross-section in the NMR tube, and N.sub.REF and H.sub.HP are the number of symmetrical sites per molecule for the thermally polarized signal reference and HP samples respectively (A.sub.REF/A.sub.HP was .about.1.85 as described earlier). Percentage polarization was computed by multiplying signal enhancement .epsilon. by the equilibrium nuclear spin polarization of a given spin at 9.4 T and 298K: 3.2.times.10.sup.-3% (.sup.1H), 8.1.times.10.sup.-3% (.sup.13C), 3.3.times.10.sup.-4% (.sup.15N).
[0156] Calculation of SABRE Polarization Enhancement Factors
TABLE-US-00002 TABLE 2 Calculations of .sup.15N signal enhancements and polarization levels (% P). (N.sub.REF/N.sub.HP = 2), (A.sub.REF/A.sub.HP = 1.85) Imidazole- FIG. 14A .sup.15N.sub.2 .sup.15N.sub.3 (250 ppm) .sup.15N.sub.1 (165 ppm) Thermal integral 5488627.17 HP integral -225970.77 -4915547.71 Thermal concen- 8.65 tration (M) HP concen- 0.017 0.017 tration (M) Signal enhancement 77.5 1686.1 % P.sub.15N (actual, ~0.026 ~0.56 50% p-H.sub.2)
TABLE-US-00003 TABLE 3 Calculations of .sup.15N signal enhancements and polarization levels (% P). (N.sub.REF/N.sub.HP = 2), (A.sub.REF/A.sub.HP = 1.85) Imidazole- FIG. 14B .sup.15N.sub.2 .sup.15N.sub.3 (250 ppm) .sup.15N.sub.1 (165 ppm) Thermal integral 5488627.17 HP integral -2355921.23 -2941133.33 Thermal concen- 8.65 tration (M) HP concen- 0.017 0.017 tration (M) Signal enhancement 808.1 1008.8 % P.sub.15N (actual, ~0.27 ~0.33 50% p-H.sub.2)
TABLE-US-00004 TABLE 4 Calculations of .sup.15N signal enhancements and polarization levels (% P). (N.sub.REF/N.sub.HP = 2), (A.sub.REF/A.sub.HP = 1.85) Imidazole- FIG. 14C .sup.15N.sub.2 .sup.15N.sub.3 (250 ppm) .sup.15N.sub.1 (165 ppm) Thermal integral 5488627.17 HP integral -659067.25 -437363.88 Thermal concen- 8.65 tration (M) HP concen- 0.017 0.017 tration (M) Signal enhancement 226.1 150.0 % P.sub.15N (actual, ~0.074 ~0.049 50% p-H.sub.2)
TABLE-US-00005 TABLE 5 Calculations of .sup.15N signal enhancements and polarization levels (% P). (N.sub.REF/N.sub.HP = 2), (A.sub.REF/A.sub.HP = 1.85) Imidazole- FIG. 14D .sup.15N.sub.2 .sup.15N.sub.3 (250 ppm) .sup.15N.sub.1 (165 ppm) Thermal integral 5488627.17 HP integral N/A 3967289.48 Thermal concen- 8.65 tration (M) HP concentration (M) N/A 0.017 Signal enhancement N/A 1360.8 % P.sub.15N (actual, N/A ~0.45 50% p-H.sub.2)
TABLE-US-00006 TABLE 6 Calculations of .sup.15N signal enhancements and polarization levels (% P). (N.sub.REF/N.sub.HP = 2), (A.sub.REF/A.sub.HP = 1.85) Imidazole- FIG. 14E .sup.15N.sub.2 .sup.15N.sub.3 (250 ppm) .sup.15N.sub.1 (165 ppm) Thermal integral 5488627.17 HP integral 1348548.76 2050438.36 Thermal concen- 8.65 tration (M) HP concen- 0.017 0.017 tration (M) Signal enhancement 462.6 703.3 % P.sub.15N (actual, ~0.15 ~0.23 50% p-H.sub.2)
TABLE-US-00007 TABLE 7 Calculations of .sup.15N signal enhancements and polarization levels (% P). (N.sub.REF/N.sub.HP = 2), (A.sub.REF/A.sub.HP = 1.85) Imidazole- FIG. 16A .sup.15N.sub.2 .sup.15N.sub.3 (250 ppm) .sup.15N.sub.1 (165 ppm) Thermal integral 5488627.17 HP integral -6084201.09 -83444.91 Thermal concen- 8.65 tration (M) HP concen- 0.017 0.017 tration (M) Signal enhancement 2086.9 28.6 % P.sub.15N (actual, ~0.69 ~0.0095 50% p-H.sub.2)
TABLE-US-00008 TABLE 8 Calculations of .sup.15N signal enhancements and polarization levels (% P). (N.sub.REF/N.sub.HP = 2), (A.sub.REF/A.sub.HP = 1.85) Imidazole- FIG. 16B .sup.15N.sub.2 .sup.15N.sub.3 (250 ppm) .sup.15N.sub.1 (165 ppm) Thermal integral 5488627.17 HP integral -3249591.01 -2621929.88 Thermal concen- 8.65 tration (M) HP concen- 0.017 0.017 tration (M) Signal enhancement 1114.6 899.3 % P.sub.15N (actual, ~0.37 ~0.30 50% p-H.sub.2)
TABLE-US-00009 TABLE 9 Calculations of .sup.15N signal enhancements and polarization levels (% P). (N.sub.REF/N.sub.HP = 2), (A.sub.REF/A.sub.HP = 1.85) Imidazole- FIG. 16C .sup.15N.sub.2 .sup.15N.sub.3 (250 ppm) .sup.15N.sub.1 (165 ppm) Thermal integral 5488627.17 HP integral 3767501.13 N/A Thermal concen- 8.65 tration (M) HP concen- 0.017 0.017 tration (M) Signal enhancement 1292.3 N/A % P.sub.15N (actual, ~0.42 N/A 50% p-H.sub.2)
TABLE-US-00010 TABLE 10 Calculations of .sup.15N signal enhancements and polarization levels (% P). (N.sub.REF/N.sub.HP = 2), (A.sub.REF/A.sub.HP = 1.85) Imidazole- FIG. 16D .sup.15N.sub.2 .sup.15N.sub.3 (250 ppm) .sup.15N.sub.1 (165 ppm) Thermal integral 5488627.17 HP integral 2055713.90 1510532.96 Thermal concen- 8.65 tration (M) HP concen- 0.017 0.017 tration (M) Signal enhancement 705.1 518.1 % P.sub.15N (actual, ~0.23 ~0.17 50% p-H.sub.2)
TABLE-US-00011 TABLE 11 Calculations of .sup.13C signal enhancements and polarization levels (% P). (N.sub.REF/N.sub.HP = 1), (A.sub.REF/A.sub.HP = 1.85) Sodium FIG. 18A Acetate-1-.sup.13C .sup.13C (150 ppm) .sup.13C (12 ppm) Thermal integral 68630977.57 HP integral 142039.83 1306385.89 Thermal concentration (M) 2.03 HP concentration (M) 0.017 0.017 Signal enhancement N/A N/A % P.sub.13C (actual, 50% p-H.sub.2) N/A N/A
TABLE-US-00012 TABLE 12 Calculations of .sup.13C signal enhancements and polarization levels (% P). (N.sub.REF/N.sub.HP = 1), (A.sub.REF/A.sub.HP = 1.85) Sodium FIG. 18B Acetate-1-.sup.13C .sup.13C (150 ppm) .sup.13C (12 ppm) Thermal integral 68630977.57 HP integral 96323096.62 76051902.66 Thermal concentration (M) 2.03 HP concentration (M) 0.017 0.017 Signal enhancement 311.7 246.1 % P.sub.13C (actual, 50% p-H.sub.2) ~0.252 ~0.20
TABLE-US-00013 TABLE 13 Calculations of .sup.13C signal enhancements and polarization levels (% P). (N.sub.REF/N.sub.HP = 1), (A.sub.REF/A.sub.HP = 1.85) Sodium FIG. 18C Acetate-1-.sup.13C .sup.13C (150 ppm) .sup.13C (12 ppm) Thermal integral 68630977.57 HP integral -4944073.97 785712.82 Thermal concentration (M) 2.03 HP concentration (M) 0.017 0.017 Signal enhancement 16.0 2.5 % P.sub.13C (actual, 50% p-H.sub.2) ~0.0129 ~0.0020
Example 4 Long-Lived .sup.13C.sub.2 Nuclear Spin States Hyperpolarized by Parahydrogen in Reversible Exchange at Micro-Tesla Fields
[0157] Parahydrogen is an inexpensive and readily available source of hyperpolarization used to enhance magnetic resonance signals by up to 4 orders of magnitude above thermal signals obtained at .about.10 T. A significant challenge for applications is fast signal decay after hyperpolarization. In some embodiments, parahydrogen based polarization transfer catalysis at micro-Tesla fields (first introduced as SABRE-SHEATH) is used to hyperpolarize .sup.13C.sub.2 spin pairs and find decay time constants of 12 s for magnetization at 0.3 mT, which are extended to 2 minutes at that same field, when long-lived singlet states are hyperpolarized instead. Enhancements over thermal at 8.5 T are between 30 and 170 fold (0.02% to 0.12% polarization). The present method may include controlling the spin dynamics of polarization transfer by choice of .mu.T field allowing for deliberate hyperpolarization of either magnetization or long-lived singlet states. Density functional theory (DFT) calculations and experimental evidence identify two energetically close mechanisms for polarization transfer: first, a model that involves direct binding of the .sup.13C.sub.2 pair to the polarization transfer catalyst (PTC), and second, a model transferring polarization through auxiliary protons in substrates.
[0158] Nuclear spin hyperpolarization is an intriguing research area, because of its ability to enhance nuclear magnetic resonance (NMR) and magnetic resonance imaging (MRI) signals by multiple orders of magnitude. Hyperpolarization methods are particularly useful if they can enhance signals from heteronuclei such as .sup.13C or .sup.15N because they can be installed in a wide range of biomolecules, and they retain hyperpolarization on extended timescales. At the same time, hyperpolarization of protons also has particular advantages, which stem from higher sensitivity and 100% natural abundance. A particularly simple hyperpolarization technique is para-H.sub.2 induced polarization (PHIP). Especially, when implemented as Signal Amplification By Reversible Exchange (SABRE) it allows for continuous and rapid hyperpolarization directly in solutions. In the SABRE procedure, para-H.sub.2 and the target (i.e. to-be-hyperpolarized) molecules bind reversibly with an iridium-based hexacoordinate catalyst. At specific magnetic fields, polarization will transfer from para-H.sub.2 to spins on the target molecule driven by J-coupling interactions, for example .about.6.5 mT is ideal to hyperpolarize proton spins. On the other hand, heteronuclei (e.g. .sup.15N, .sup.31P, .sup.13C) are best magnetized in microTesla fields established in magnetically shielded environments, an approach that was coined SABRE-SHEATH (SABRE in Shield Enable Alignment Transfer to Heteronuclei).
[0159] However, if the goal is to hyperpolarize long-lived singlet states, the picture changes slightly because the conditions for the transfer of scalar order have a different field dependence. For example, it has been shown that the singlet state of the .sup.15N.sub.2 spin pair of diazirines is hyperpolarized over a relatively wide range of magnetic fields between a few .mu.T to about 100 mT. These hyperpolarized nuclear spin singlet states of .sup.15N.sub.2 diazirines display relaxation time constants of above 20 minutes. Similarly, SABRE was used to hyperpolarize long-lived singlet states on .sup.1H.sub.2-pairs, where polarization decay time constants of above 4 min were observed. Such long hyperpolarization lifetime promises biomolecular tracking and imaging of low concentration analytes on significantly extended timescales. In this article, we use SABRE-SHEATH, to hyperpolarize magnetization as well as long-lived nuclear singlet states in carbon-13 spin pairs and find lifetime T.sub.1 of 12 s for magnetization and T.sub.S of 2 min for long-lived singlet states at 0.3 mT. Here it is important to note, that the current record of a long-lived singlet state is held by a .sup.13C.sub.2 spin pair (hyperpolarized by DNP, not SABRE) with lifetime, T.sub.S, of more than one hour.
[0160] In some embodiments, for the presented experiments, two molecules with various isotopic labeling schemes are designed. For example, 1,2-(4-pyridyl) acetylene (with symmetric structure) and 1-phenyl-2-(4-pyridyl) acetylene (with asymmetric structure) are synthesized herein. For both, the present method may include isotopomers with naturally abundant .sup.13C, as well as doubly .sup.13C labeled substrates at the triple bond. The results presented in FIG. 23 indicate that the acetylene carbon spins as well as the aromatic bridge carbon spins are hyperpolarized. The enhancements are between 30 to 170 fold (0.02% to 0.12% polarization), when compared to thermal signals acquired at 8.45 T. The molecules with .sup.13C at natural abundance show 2-3 times higher enhancements compared to .sup.13C enriched sites. This is likely due to faster T.sub.1 relaxation in .sup.13C.sub.2 pairs as opposed to T.sub.1 of isolated .sup.13C spins. An additional cause may simply be the higher ratio of polarization source (p-H.sub.2) to target spins in the naturally abundant case.
[0161] The hyperpolarization transfer from para-H.sub.2 to these substrates occurs via iridium based polarization transfer catalysts (PTC's). In some embodiments, the standard precatalyst [IrCl(IMes)(COD)], (IMes=1,3-bis(2,4,6-trimethylphenyl)imidazole-2-ylidene; COD=cyclooctadiene) may be used. The present method may be carried out using substrate concentrations of 30 mM or 160 mM, and catalyst concentrations of 2 mM or 10 mM for the symmetric and asymmetric compounds respectively. The solvent was methanol-d.sub.4, and the precatalyst was activated by bubbling para-H.sub.2 through the sample for 15 minutes at a pressure of 7 bar and a fractional parahydrogen enrichment of .about.85%. Thereafter, hyperpolarization was performed according to the SABRE-SHEATH procedure: the sample is exposed to para-H.sub.2 in a magnetically shielded environment outfitted with a small solenoid coil to obtain a controllable .mu.T magnetic field. One minute of exposure to para-H.sub.2 is sufficient to equilibrate polarization. Subsequently, the sample is transferred manually as quickly as possible (.about.8 s) to a Bruker 360 MHz (8.45 T) magnet for read out. The manual transfer time of 8 s is relatively consistent, with variations of .about.1 s.
[0162] The polarization transfer occurs in catalytically active PTC's. Two possible, energetically low PTC species are depicted in FIG. 24. The ground state energies were determined by density functional theory calculations using the all-electron FHI-aims code. The geometries were optimized using the PBE parameterization of exchange and correlation with a van der Waals correction and the tier 2 basis sets. Scalar relativity was handled in the atomic ZORA approximation. Additional possible configurations and the corresponding PTC-energy landscape are provided. Furthermore, also provided are .sup.1H-NMR spectra of the hyperpolarized hydrides bound to the Iridium center demonstrating the presence of at least two catalytic species. In this first study, hyperpolarized .sup.13C signals from molecules bound to the Iridium molecules were not detected. Therefore, more indirect evidence coupled with ab initio calculations are used to determine likely PTC structures.
[0163] In the first PTC model (FIG. 24A), all substrate molecules bind to the Ir center via nitrogen. This is the energetically lowest PTC species identified by us. Here, polarization transfers from para-H.sub.2 to the pyridyl protons first and finally arrives at the acetylenic carbons. In the second PTC model (FIG. 24B), the catalyst binds with the triple bond and polarization is transferred directly to .sup.13C sites.
[0164] The spectra displayed in FIG. 23 could quickly lead to the conclusion, that the active PTC must be the directly binding model (FIG. 24B), because hyperpolarization from the ring carbons are not observed, other than from those in the bridge to the acetylene bond. Moreover, hydrogenation is observed, which most certainly requires binding of the triple bond to the iridium center. Hydrogenation rates depend on the ratio of substrate to catalyst: at 3:1 hydrogenation completes in less than 30 minutes, however at above 15:1, hydrogenation takes more than 12 h. In a single SABRE experiment (with 1 min of bubbling) it was estimated that significantly less than 1% hydrogenation at the 15:1 ratio may occur, which was used for most experiments. Hyperpolarized hydrogenation products are observed, which display typical ALTADENA type enhancements due to incorporation of para-H.sub.2 (spectra provided in the SI). Still, it is hypothesized that that the spectra displayed in FIG. 23 all result from SABRE as they are uniquely associated with the intact, non-hydrogenated substrates.
[0165] Additional observations are made. First, the PTC on of FIG. 24A is energetically lower. Furthermore, all non-detected .sup.13C spins are directly bound to protons. This leads to much faster .sup.13C relaxation (a typical T.sub.1 relaxation time for aromatic .sup.13C directly bound to a proton is .about.5 s, whereas T.sub.1 relaxation constants of the bridge carbons are found to be 11(1) s and T.sub.1 of the acetylenic carbons is 12(0.5) s at low fields) with two important consequences. First, the hyperpolarization buildup at these .sup.13C sites will be much less efficient, and second, a small amount of hyperpolarization may quickly relax during the .about.8 s sample transfer from polarization region into the magnet. In addition, SABRE under optimized condition for .sup.1H polarization transfer at 6.5 mT was performed, which resulted in strong enhancement of the pyridyl ring protons, while enhancement of .sup.13C were negligible and .sup.1H enhancements on the distant phenyl ring were much smaller. Though bound species were not observed from the .sup.13C spectra, the hydride peaks were observed. For example, a small chemical shift difference of the hydride peaks was observed (.about.0.2 ppm, which would be much larger for the binding mode in FIG. 24B based on DFT calculation). Finally, hyperpolarization of diphenyl-.sup.13C.sub.2-acetylene (no ring nitrogens) in the SABRE-SHEATH mode was tested and did not result in measurable enhancements. All these considerations point to a strong contribution of the PTC shown in FIG. 24A.
[0166] To investigate this in more detail, a careful characterization of hyperpolarization transfer as function of micro-Tesla field was performed using the doubly .sup.13C labeled molecules. As depicted in FIG. 25, the magnetic field was varied between -12 and +12 .mu.T, accompanied by simulations of the hyperpolarization transfer process.
[0167] Importantly, the present method allows one to directly choose to polarize different states of the .sup.13C pair: magnetization or singlet, which are easily distinguishable by their spectra. Magnetization is easily detected from both molecules (FIG. 25A panel (1), FIG. 25B panel (1)), whereas singlet-order can only be detected immediately from the asymmetric 1-phenyl-2-(4-pyridyl) acetylene because the acetylenic carbons have a chemical shift difference (FIG. 23C). For this asymmetric compound, the acetylenic carbons are strongly coupled at low fields (J.sub.CC is .about.185 Hz, whereas their chemical shift difference .DELTA.v.sub.C is less than 0.5 mHz). Upon transfer to the high field in the magnet (8.45 T) for read out, the chemical shift difference becomes significantly larger than the J.sub.CC coupling (.DELTA.v.sub.C.about.770 Hz), the carbons are now weakly coupled, and the singlet state is no longer an eigenstate. The sample transfer from low to high field transforms I.sub.1I.sub.2 singlet order into detectable (I.sub.1z-I.sub.2z) which gives antiphase signals in a pulse acquire experiment, as shown in FIG. 25B panel (4). However, for the symmetric molecule, since the two carbons will remain symmetric at high field, the singlet state cannot be accessed immediately. In principle, access to the singlet can be accomplished by specialized pulse sequences such as singlet-to-magnetization (S2M) or SLIC.
[0168] In order to understand the polarization transfer dynamics at micro-Tesla fields in detail, resonance conditions dictated by the Hamiltonian of the doubly .sup.13C labeled molecule are considered. At low fields of <0.6 .mu.T, we encounter a resonance condition to polarize magnetization, given as
|v.sub.H-v.sub.C|=.+-.J.sub.HH, (Eq.1)
where v.sub.H and v.sub.C are the frequencies of protons and carbons and J.sub.HH is the J-coupling between the two para-H.sub.2 derived hydrides on the iridium. When solved for the magnetic field using v=-.gamma.B the magnetization transfer field is obtained as
B.sub.trans=.+-.J.sub.HH/(.gamma..sub.H-.gamma..sub.C), (Eq. 2)
where .gamma..sub.H=42.577 Hz/.mu.T and .gamma..sub.C=10.705 Hz/.mu.T. When the field is increased to a few .mu.T, additional resonance conditions to create magnetization and/or singlet are encountered. The Hamiltonian reveals overlapping conditions to create magnetization and singlet given as
|v.sub.H-v.sub.C|=.+-.(J.sub.CC.+-.J.sub.HH), (Eq. 3)
where J.sub.CC is the acetylenic .sup.13C J-coupling. Again, solving for the transfer field the following is obtained:
B.sub.trans=.+-.(J.sub.CC.+-.J.sub.HH)/(.gamma..sub.H-.gamma..sub.C) (Eq. 4)
[0169] Equations (1,2) and (3,4) fully encompass the behavior observed in FIG. 25. In the low field region, maximum magnetization transfer is observed at .about..+-.0.34(0.1) .mu.T, whereas there is negligible singlet buildup. At slightly elevated fields, both magnetization and singlet have local maxima/minima at .about..+-.5.6(0.2) .mu.T and .about..+-.6.4(0.2) .mu.T (see FIG. 25B). These values are consistent with J.sub.HH.about.10(3) Hz, and J.sub.CC.about.190(5) Hz. J.sub.CC can also be estimated from the hyperpolarized NMR spectrum of the free form where we find J.sub.CC=185 Hz (see FIG. 23D).
[0170] By numerical simulations of the spin dynamics we confirm that the general behavior is largely independent of the polarization transfer mechanism (direct to .sup.13C.sub.2(FIG. 24B) vs. indirect via auxiliary protons (FIG. 24A)). However, the numerical value of J.sub.CC strongly depends on the exact nature of the PTC. First principles calculations of the relevant J-couplings are performed using the FHI-aims code. The PBE parameterization for exchange and correlation and the fully uncontracted cc-Pv5Z basis sets (tier 2 for iridium) are used. The ab initio calculations predict a J.sub.CC of .about.191 Hz for substrate bound via nitrogen (FIG. 24A) vs. a J.sub.CC of 120 Hz for substrate bound directly via the acetylenic bond. Based on the measurements shown in FIG. 25, it is concluded with more confidence that the primary PTC is the energetically favored species shown in FIG. 24A because for the PTC in FIG. 24B we would expect efficient hyperpolarization at significantly lower fields of 3.5.+-.0.3 .mu.T, which is not observed.
[0171] Finally, since the asymmetric molecule allows for easy read out of, both, singlet state and magnetization, their lifetimes T.sub.S or T.sub.1 can be measured. As displayed in FIG. 26, T.sub.S is measured at 0.3 mT and 50 mT, and is fit with exponential decay constants of 117(7) s and 69(4) s respectively. For comparison, T.sub.1 is measured at the field where it has longer T.sub.S (0.3 mT), and it is found that magnetization decays much more rapidly with exponential decay constant T.sub.1 of 12(0.5) s. The T.sub.1 lifetime of the .sup.13C.sub.2 pair at 8.45 T is measured as 8(0.4) s.
[0172] In conclusion, it is demonstrated that, both magnetization and long-lived singlet order can be induced on .sup.13C.sub.2 using SABRE-SHEATH. Hyperpolarization lifetime is extended to .about.2 minutes, or 10 times T.sub.1. Furthermore, also disclosed herein is direct hyperpolarization of long-lived singlet order by SABRE-SHEATH when the J-coupling in the targeted spin pair is much larger than the J.sub.HH coupling between the hydrides. This is in contrast to the first demonstration, of heteronuclear (.sup.15N.sub.2) long-lived states hyperpolarized by SABRE, where J.sub.N and J.sub.HH were comparable in size leading to a resonance condition that is matched at a broad range of fields, raising the question if long-lived states could be hyperpolarized when J.sub.NN or J.sub.CC are much larger. It has been shown herein that specific .mu.T-fields work in that case. Hyperpolarization levels and enhancements remained relatively low in this first demonstration. It is hypothesized that the quadrupolar .sup.14N nuclei are the cause of the observed low hyperpolarization level, in view of the finding that quadrupoles act as highly efficient polarization sinks at .mu.T fields. Therefore, hyperpolarization may be boosted, for example, by additional .sup.15N labeling of the substrates and other strategies detailed in the literature. Overall, the presented results illustrate an avenue towards simple and fast hyperpolarization of long-lived .sup.13C hyperpolarization with potential applications in biomolecular MRI or the observation of slower processes by hyperpolarized NMR. The presented advances can be translated to biomolecules already shown to be amenable to heteronuclear SABRE hyperpolarization including nicotinamide, in vivo pH sensor imidazole, hypoxia sensor metronidazole and others. While the current work was performed in methanol solutions, recent advances in heterogeneous and water-soluble SABRE catalysis may lead to in vivo translation of the presented approach for fast hyperpolarization of long-lived .sup.13C molecular probes.
[0173] Experimental Details
[0174] Synthesis of the Substrate Molecules
[0175] All reactions were performed under a dry argon atmosphere. Tetrahydrofuran (THF) and Diisopropylamine (DIPA) were degassed under reduced pressure. Iodobenzene, Copper iodide, TMS-acetylene-.sup.13C.sub.2, TMS-acetylene, TBAF 1M in THF were purchased from Sigma Aldrich, Bis(triphenylphosphine)palladium(II) dichloride was purchased from Acros and 4-iodopyridine was purchased from AK Scientific. All purchased chemicals were used without further purification. Reactions were monitored by TLC on silica gel aluminum-backed plates.
[0176] Bis(triphenylphosphine)palladium(II) dichloride (14.4 mg, 0.0206 mmol), copper iodide (8.86 mg, 0.0465 mmol) and 4-iodopyridine (0.15490 g, 0.7178 mmol) were added into a 25 mL glass tube and degassed for 1 h under reduced pressure. Then, THP-DIPA (2:1 v/v, 7 mL) was added to dissolve them and TMS-acetylene-.sup.13C.sub.2(107.5 .mu.L, 0.7084 mmol) was slowly added. The mixture was stirred at 50.degree. C. for 24 h. After cooling reaction mixture at room temperature, TBAF 1M in THF (1 mL, 1 mmol) was added and stirred at room temperature for 10 min. Next, iodobenzene (0.4 mL, 3.574 mmol) was added and the mixture was stirred at 50.degree. C. for 26 h. The mixture was concentrated and the residue was isolated by extractive work-up with CH.sub.2Cl.sub.2-brine. The combined organic phase was dried using anhydrous Na.sub.2SO.sub.4 and concentrated. Flash column chromatography was performed using 100% ethyl acetate and yielded 4-(phenylethynyl-1,2-.sup.13C.sub.2)pyridine (0.1172 g, 0.6468 mmol, 91.3%).
[0177] Bis(triphenylphosphine)palladium(II) dichloride (8.62 mg, 0.01228 mmol), copper iodide (11.89 mg, 0.0624 mmol) and 4-iodopyridine (0.4032 g, 1.967 mmol) were added into a 10 mL glass tube and degassed for 1 h under reduced pressure. Then, THP-DIPA (4:1 v/v, 4.5 mL) was added to dissolve them and TMS-acetylene-.sup.13C.sub.2(110 .mu.L, 0.7124 mmol) was slowly added. The mixture was stirred at 70.degree. C. for 23 h. After cooling reaction mixture at room temperature, TBAF 1M in THF (1 mL, 1 mmol) was added and the mixture was stirred at 70.degree. C. for 20 h. Extractive work-up (CH.sub.2Cl.sub.2-brine) was followed by concentration. The combined organic phase was dried using anhydrous Na.sub.2SO.sub.4 and concentrated. Flash column chromatography was performed using 100% ethyl acetate and yielded 1,2-di(pyridin-4-yl)ethyne-1,2-.sup.13C.sub.2(0.1054 g, 0.578 mmol, 81.2%).
[0178] Polarization of the .sup.13C Due to Hydrogenation
[0179] Though the substrates are relatively stable during the SABRE-SHEATH experiments, after long time of para-H.sub.2 bubbling, hydrogenation happens for the acetylenic triple bond and para-H.sub.2 induced polarization (PHIP) is observed. In our case, since the para-H.sub.2 is bubbled at a low field in the magnetic shield (62 mG), the hydrogenated .sup.13C spin pair will remain in its singlet state until transferred to the magnet for read out. This polarization effect particularly matches the ALTADENA (Adiabatic Longitudinal Transport After Dissociation Engenders Net Alignment) phenomenon, the spectrum is shown FIG. 27.
[0180] Thermal and Hyperpolarized .sup.1H Spectra Including the Hydride Region
[0181] Thermal and hyperpolarized .sup.1H spectra shown in FIG. 28 were measured to help determine the polarization transfer complex. We used asymmetric substrate with .sup.13C at natural abundance, bubble para-H.sub.2 through the hyperpolarization mixture inside the magnet at 8.45 T. A 45.degree. pulse is applied for read out right after stopping the bubbling. The classical PASADENA effect is expected on the hydrides, which is best observed using a 45.degree. pulse.
[0182] The .sup.1H spectra assist in the structure determination of the PTC species. As shown in FIG. 28B, only the protons on the pyridyl ring are significantly hyperpolarized with enhanced .sup.1H signal. Clearly identifying a strong contribution of the N-binding model. The hydride region shows that in addition to a principle species, additional complexes exist in solution consistent with the fact that we observe SABRE as well as PHIP via hydrogenation.
[0183] Thermal and Hyperpolarized .sup.13C Spectra
[0184] Thermal and hyperpolarized .sup.13C spectra are analyzed to obtain the important parameters such as the .sup.13C-.sup.13C J-coupling, J.sub.CC. Other J-coupling parameters could also be distinguished from the hyperpolarized spectrum (FIG. 29).
[0185] Measurements of the Lifetime
[0186] The magnetization is created in the shield with magnetic field of 0.28 .mu.T, then the sample is positioned at 0.3 mT for relaxation, followed by transport to the magnet for read out. By positioning the sample for different time delays at 0.3 mT, its T.sub.1 lifetime is measured. A similar procedure is used for singlet lifetime measurement. The singlet states are first created in the shield with 6.2 .mu.T then positioned at 0.3 or 50 mT for varying time delays, after which the sample is transferred to the 8.45 T for read out of the antiphase peaks.
[0187] Analysis of the Polarization Transfer
[0188] First, we consider a four-spin system consisting of two parahydrogen derived hydrides and two .sup.13C spins of the acetylenic bond as depicted in FIG. 30. This represents the direct model, where the substrate is bound to Iridium via the acetylenic bond.
[0189] Then its Hamiltonian of this system can be expressed as:
H = v H ( I 1 H z + I 2 H z ) + v C ( I Cz + I 2 Cz ) + J HH I .fwdarw. 1 H I .fwdarw. 2 H + J CC I .fwdarw. 1 C I .fwdarw. 2 C + J CH _ near I .fwdarw. 1 H I .fwdarw. 1 C + J CH _ near ' I .fwdarw. 2 H I .fwdarw. 1 C + J CH _ far I .fwdarw. 1 H I .fwdarw. 2 C + J CH _ far ' I .fwdarw. 2 H I .fwdarw. 2 C ( S1 ) ##EQU00003##
[0190] Introducing the CH-J-coupling terms (also illustrated in FIG. 28), the sum and the difference of the near and far J.sub.CH couplings can be written as:
.SIGMA.J.sub.near=J.sub.CH_near+J'.sub.CH_near
.DELTA.J.sub.near=J.sub.CH_near-J'.sub.CH_near
.SIGMA.J.sub.far=J.sub.CH_far+J'.sub.CH_far
.DELTA.J.sub.far=J.sub.CH_far-J'.sub.CH_far (S2)
[0191] Using these definitions, the Hamiltonian is rearranged as:
H = v H ( I 1 H z + I 2 H z ) + v C ( I 1 Cz + I 2 Cz ) + J HH I .fwdarw. 1 H I .fwdarw. 2 H + J CC I .fwdarw. 1 C I .fwdarw. 2 C + .SIGMA. J near 2 ( I .fwdarw. 1 H I .fwdarw. 1 C + I .fwdarw. 2 H I .fwdarw. 1 C ) + .DELTA. J near 2 ( I .fwdarw. 1 H I .fwdarw. 1 C - I .fwdarw. 2 H I .fwdarw. 1 C ) + .SIGMA. J far 2 ( I .fwdarw. 1 H I .fwdarw. 2 C + I .fwdarw. 2 H I .fwdarw. 2 C ) + .DELTA. J far 2 ( I .fwdarw. 1 H I .fwdarw. 2 C - I .fwdarw. 2 H I .fwdarw. 2 C ) ( S3 ) ##EQU00004##
[0192] To better understand the Hamiltonian, a matrix representation will be more helpful, which requires to expression the Hamiltonian in the basis that containing its eigenvectors. The most adequate basis at hand is the singlet-triplet basis, which is:
S 0 = 1 2 ( .alpha. .beta. - .beta. .alpha. ) T + = .alpha..alpha. , T 0 = 1 2 ( .alpha. .beta. - .beta. .alpha. ) , T - = .beta..beta. ( S4 ) ##EQU00005##
[0193] Using this singlet-triplet basis for both the hydride (from para-H.sub.2) and the .sup.13C pair, we can identify all possible 16 combinations of .sup.1H and .sup.13C states, which can be sorted in two groups in terms of their symmetry, they are: 10 symmetric states with respect of exchanging H.sub.1 with H.sub.2 and C.sub.1 with C.sub.2:
S.sub.0.sup.HS.sub.0.sup.C,T.sub.0.sup.HT.sub.0.sup.C
T.sub.+.sup.HT.sub.-.sup.C,T.sub.-.sup.HT.sub.+.sup.C
T.sub.+.sup.HT.sub.+.sup.C,T.sub.-.sup.HT.sub.-.sup.C
T.sub.0.sup.HT.sub.+.sup.C,T.sub.+.sup.HT.sub.0.sup.C
T.sub.0.sup.HT.sub.-.sup.C,T.sub.-.sup.HT.sub.0.sup.C
and 6 antisymmetric states with respect of exchanging H.sub.1 with H.sub.2 and C.sub.1 with C.sub.2:
S.sub.0.sup.HT.sub.0.sup.C,T.sub.0.sup.HS.sub.0.sup.C
S.sub.0.sup.HT.sub.+.sup.C,T.sub.+.sup.HS.sub.0.sup.C
S.sub.0.sup.HT.sub.-.sup.C,T.sub.-.sup.HS.sub.0.sup.C
[0194] Having represented the Hamiltonian in the matrix form using the singlet-triple basis (the full matrix is listed at the end of this document), we can see that there are no elements in the matrix that connects the groups with different symmetry. However, within the individual groups, the states are connected and the Hamiltonian can drive the hyperpolarization from the hydride singlet (S.sub.0.sup.H) to other states that generate either hyperpolarized .sup.13C-magnetization by affecting population in the T.sub.+.sup.C, T.sub.-.sup.C states, or .sup.13C.sub.2-singlet by affecting the S.sub.0.sup.C population.
[0195] The initial state is the para-H.sub.2 derived singlet on the hydride proton pair and all other states are close to 0 population, thus the initial states have the following populations:
p ( S 0 H S 0 C ) = p ( S 0 H T + C ) = p ( S 0 H T 0 C ) = p ( S 0 H T - C ) = 0.25 p ( other states ) = 0 ( S5 ) ##EQU00006##
[0196] Choosing subsets of the connected states from the full Hamiltonian, we can see that magnetization and singlet are hyperpolarized in the shield with different magnetic field. For example, the S.sub.0.sup.HT.sub.-.sup.C and T.sub.-.sup.HT.sub.0.sup.C states are connected:
S 0 H T - C T - H T 0 C S 0 H T - C - v C - J HH - .DELTA. J far - .DELTA. J near 4 T - H T 0 C - .DELTA. J far - .DELTA. J near 4 - v H ( S6 ) ##EQU00007##
[0197] At specific magnetic field when the difference of the diagonal elements is made very small, the off-diagonal element will drive the population transferred from S.sub.0.sup.HT.sub.-.sup.C to T.sub.-.sup.HT.sub.0.sup.C, thus reducing population in T.sub.-.sup.C state of carbon and creating hyperpolarized T.sub.+.sup.C state. The corresponding resonance condition, obtained by demanding the diagonal elements be equal, is
v.sub.H-v.sub.C=J.sub.HH (S7)
[0198] Since the chemical shift frequency v=.gamma.B.sub.0, the magnetic field to match this resonance condition is:
B 0 = v H - v C .gamma. H - .gamma. C = J HH .gamma. H - .gamma. C ( S8 ) ##EQU00008##
[0199] Using J.sub.HH.apprxeq.9 Hz, .gamma..sub.H=42.576 Hz/.mu.T, .gamma..sub.C=10.705 Hz/.mu.T, we can now estimate the magnetic field would be around 3 mG, which matches our experimental results.
[0200] In addition, magnetization of the .sup.13C pair could also be polarized at relatively higher field in the shield, for example, the subset matrix is:
S 0 H S 0 C T + H T - C T - H T + C S 0 H S 0 C - ( J CC + J HH ) .DELTA. J far - .DELTA. J near 4 .DELTA. J far - .DELTA. J near 4 T + H T - C .DELTA. J far - .DELTA. J near 4 v H - v C - .SIGMA. J near + .SIGMA. J far 4 0 T - H T + C .DELTA. J far - .DELTA. J near 4 0 v C - v H + .SIGMA. J near + .SIGMA. J far 4 ( S9 ) ##EQU00009##
[0201] Changing the magnetic field by adjusting the current in the coil, once again the diagonal elements could be made equal, and the off-diagonal element will drive the population from |S.sub.0.sup.HS.sub.0.sup.C to either |T.sub.+.sup.HT.sub.-.sup.C or |T.sub.-.sup.HT.sub.+.sup.C, polarizing the |T.sub.-.sup.C or |T.sub.+.sup.H state of the carbons. The corresponding resonance condition is:
v H - v C = - ( J CC + J HH ) + .SIGMA. J near + .SIGMA. J far 4 or ( S10a ) v H - v C = ( J CC + J HH ) + .SIGMA. J near + .SIGMA. J far 4 ( S10b ) ##EQU00010##
[0202] In the spin system, since
.SIGMA. J near + .SIGMA. J far 4 .apprxeq. 7 + 0 4 = 1.75 Hz , ##EQU00011##
which is much smaller than the J.sub.CC+J.sub.HH.apprxeq.185+9=194 Hz, the sum of the J-coupling term could be dropped and the resonance condition could be simplified as:
v.sub.H-v.sub.C=.+-.(J.sub.CC+J.sub.HH) (S10)
[0203] The negative sign corresponds to turning the magnetic field in the shield to the other direction. Also, since now the matching condition is around 194 Hz, which is much larger than the previous condition, using this number and equation S8 again, the magnetic field is around 60 mG, which is also consistent with our experimental results.
[0204] On the other hand, we can establish the singlet polarization condition by examining the Hamiltonian matrix subset that connects the hydride singlet and singlet on carbons, one example is:
S 0 H T + C T + H S 0 C S 0 H T + C - J HH + v C .DELTA. J near - .DELTA. J far 4 T + H S 0 C .DELTA. J near - .DELTA. J far 4 - J CC + v H ( S11 ) ##EQU00012##
and the resonance condition to polarize S.sub.0.sup.C state on carbon is:
v.sub.H-v.sub.C=J.sub.CC-J.sub.HH (S12)
[0205] Accordingly, that is a 176 Hz difference and the matching magnetic field would be around 50 mG, which is similar to the second magnetization polarization condition and matches with experiments.
[0206] The direct binding model may only have a small contribution to the observed SABRE spectra and we conclude that the hyperpolarization transfer is more likely through a larger spin system of additional protons in the pyridine rings. In this case, iridium of the catalyst binds with the nitrogen of the pyridyl ring, thus forming an eight-spin system (2 para-H.sub.2 protons, 4 pyridyl protons and 2 carbon-13 s). In the following section we find by numerical simulation that the general behavior of the two models is surprisingly similar. At the end, we can use the relative positions of the resonances to distinguish the two models as described in the following.
[0207] Spin Dynamics of Low to High Field Sample Transfer
[0208] Hyperpolarization of both magnetization and singlet order, which are generated at low field, are detected in the 8.45 T high field inside the magnet. The transfer process of the sample is highly adiabatic, indicating that the population will stay at eigenstates of the system during transfer.
[0209] Since magnetization is represented as I.sub.1z+I.sub.2z, which is associated with population difference between the .alpha..alpha. and .beta..beta. states, they are eigenstates at both low and high fields. Therefore magnetization remains unchanged during the transfer process. When a 90.degree. pulse is applied in the magnet, we will obtain an in-phase spectrum, as shown in the main article in FIG. 25B, panel (1).
[0210] The singlet order, however, is only an eigenstate at low magnetic field and is not detectable. It is converted into a detectable state during transfer from low to high field if a chemical shift difference between the two .sup.13C spins exists. To enable this transformation, we designed the asymmetric molecule 1-phenyl-2-(4-pyridyl) acetylene, with the chemical shift difference of the two acetylenic .sup.13C spins of 9 ppm. At low magnetic field, e.g. 100 G and below, the chemical shift difference (.DELTA..delta..ltoreq.1 Hz) is much smaller than their J-coupling (J.sub.CC=185 Hz), so the system is strongly coupled and the singlet order is eigenstate, that is well protected from coherent evolution and subsequent relaxation.
[0211] The singlet will not be an eigenstate at high magnetic fields. We calculated the associated eigenstate as function of magnetic field, (or rather, the frequency difference between the .sup.13C spins, .DELTA.v, which is proportional the magnetic field):
eigenstate ( .DELTA. v ) = .DELTA. v 2 + J CC 2 - .DELTA. v J CC .alpha. .beta. - .beta. .alpha. ( S13 ) ##EQU00013##
[0212] Accordingly, the field dependent density matrix is:
.rho.(.DELTA.v)=|eigenstate(.DELTA.v)eigenstate(.DELTA.v)| (S14)
[0213] The initial density matrix of the singlet when .DELTA.v=0 is:
.rho..sub.0=1/4{circumflex over (1)}-(I.sub.1zI.sub.2z+I.sub.1xI.sub.2x+I.sub.1yI.sub.2y) (S15)
[0214] By raising the magnet field this density matrix becomes:
.rho. ( .DELTA. v ) = 1 4 1 ^ - I 1 z I 2 z - J CC .DELTA. v 2 + J CC 2 ( I 1 x I 2 x + I 1 y I 2 y ) - .DELTA. v .DELTA. v 2 + J CC 2 1 2 ( I 1 z - I 2 z ) ( S16 ) ##EQU00014##
[0215] When .rho.(.DELTA.v) is probed with a 90.degree. pulse at 8.45 T (.DELTA.v=815 Hz), only the I.sub.1z-I.sub.2z component yields signal in two anti-phase doublets, and plugging in the numbers we would have 98% singlet detected, compared with a infinite high detection magnetic field case (where .DELTA.v=.infin. and the density matrix corresponds to .rho..sub.0=1/4{circumflex over (1)}-I.sub.1zI.sub.2z-1/2(I.sub.1z-I.sub.2x), which is a pure population of the .beta..alpha. state).
[0216] Numerical Simulation
[0217] Full Range Simulation of the 4 Spin System
[0218] To better illustrate the mechanism of the polarization transfer, we used the Matlab package, Spinach, to simulate the magnetization and singlet polarization of .sup.13C as a function of the magnetic field. The full range simulation from negative to positive magnetic field, as well as all the resonance conditions are shown in FIG. 31.
[0219] For the magnetization simulation, the low field polarization around 0.3 .mu.T matches well with the experiment and our derivation. However, at around 6 .mu.T, there is splitting between the magnetization polarizations of about 2J.sub.HH. The experimental magnetization data also indicates that behavior, however not as clearly as the simulations. We believe that magnetization can be strongly affected by the sample transfer from inside the shield to the magnet. Specifically, crossing strong magnetic field gradients or magnetic field inversion points may cause non-adiabatic evolution of the magnetization, which causes broader features in the experiment.
[0220] The singlet simulation shows great consistency with our experiment. There is no singlet polarized at extremely low field. The singlet is only polarized at around 6 .mu.T, and the splitting of around 2J.sub.HH is clearly observed in the experiment, which could be due to the immunity of singlet to magnetic fields. Furthermore, the polarization level of the singlet is quite high at 6 .mu.T, indicating that polarization of the singlet is efficient; this is also consistent with the experimental results.
[0221] Comparison Between the Simulation of Direct and Indirect Polarization Transfer
[0222] Since the nature of the binding mode in the real system was in question, we use simulation to detect if there are differences of the polarization transfer transitions between the two modes. We simulate the direct and indirect model and vary parameter of the J-coupling terms used in the simulation. As illustrated in FIG. 32, we find that the direct and indirect polarization transfer spin systems tend to give quite similar transfer patterns for comparable J-coupling constants in the source (J.sub.HH) and the final target (J.sub.CC).
[0223] As apparent from FIG. 32 in combination with the analytical expressions provided in the main manuscript for the resonance conditions, the polarization profile is determined by two critical J-coupling parameters, J.sub.HH and J.sub.CC. J.sub.HH determines the position of the first resonance condition for forming magnetization. J.sub.HH also controls the distance between the two resonance conditions at higher fields. Finally, J.sub.CC dictates the overall position of the higher field resonances. This is true irrespective of the hyperpolarization transfer pathway (direct or indirect).
[0224] Simulation at the Optimal .sup.1H Hyperpolarization Field (6.5 mT)
[0225] In addition to the simulation of the polarization transfer at low field (from -12 to 12 6 .mu.T), simulations at higher field (6.5 mT) where .sup.1H hyperpolarization works best are also performed. However, all of the simulations give 0 transfer to .sup.13C, which is as expected because at such field there is no energy level crossing between .sup.1H and .sup.13C spins. Although polarization transferred to .sup.1H, there is still no energy level crossing between the auxiliary .sup.1H's and .sup.13C's. This is also consistent with the experimental results, the .sup.13C hyperpolarization is negligible when bubbling at 6.5 mT.
[0226] DFT Calculation of PTC Complexes.
[0227] In addition to the spin dynamics simulations, the binding mode was also investigated with DFT calculations using the all-electron FHI-aims code. The tight settings were used for the integration grids and basis sets. We used the PBE exchange-correlation functional plus Tkatchenko-Scheffler vdW correction. In FIG. 33, the total energy of each configuration is taken as a sum of its isolated components (e.g., separate calculations were performed for Cl.sup.-, H.sub.2, etc.). In the article we showed two major binding complexes. Here we displayed the full process of catalyst activation and energy differences of all possible PTC's. The geometries were first built by hand and minimized in Jmol and then relaxed with FHI-aims. No extensive conformational search was performed. The geometries are shown in Table 15. Here we compare the ground state energies only and do not consider other energy contributions (vibrations, solvent effects, etc.). We conclude that the indirect transfer should be the main polarization process. In case the acetylenic bond is complexed to the Iridium, the calculated C--C J-coupling is only 120 Hz, whereas for the substrate bound via nitrogen, J.sub.CC is calculated to be on the order of 191 Hz, more in line with the experimental data. The J-couplings were calculated nonrelativistically with FHI-aims. Table 14 presents a basis set convergence study for the J-coupling of the PTC of FIG. 24A. We have taken the Dunning cc-pVnZ basis sets and uncontracted all the s-functions, which we denote u-cc-pVnZ. Uncontraction is necessary since it gives the basis sets extra flexibility in the core region, which is necessary to converge the difficult Fermi contact (FC) contribution of the J-coupling. Using the regular contracted cc-pVnZ basis sets would lead to poor convergence of FC and therefore the total J-coupling. After doing a convergence study with the u-cc-pVnZ for the PTC of FIG. 24A, we used a fully uncontracted cc-pV5Z to calculate the final J-couplings for both PTC. Using u-cc-pV5Z we estimate the basis set error to be within a few percent.
TABLE-US-00014 TABLE 14 Basis set convergence study for the PTC of FIG. 24A. u-cc-pVnZ refers to the regular cc-pVnZ basis sets with the s functions uncontracted. A fully uncontracted cc-pV5Z basis set yields 190.7 Hz, showing that the dominant contribution to the J-couplings comes from the core s orbitals. u-cc-pVDZ 176.8 Hz u-cc-pVTZ 179.3 Hz u-cc-pVQZ 187.0 Hz u-cc-pV5Z 190.8 Hz
TABLE-US-00015 TABLE 15 Geometries of the configurations in the format of FHI-aims geometry files. PTC 1-0.0 eV: atom 13.11576225 4.94961535 7.18532949 C atom 10.90718940 5.47963132 6.85291789 C atom 11.47867245 6.52825957 7.49109625 C atom 13.73656820 7.13837865 8.26564473 C atom 14.41196785 8.02519222 7.41016670 C atom 15.28193896 8.95307567 7.98311527 C atom 15.47771165 9.02469659 9.36751890 C atom 14.76147947 8.14515954 10.18374824 C atom 13.87871018 7.19330295 9.65882410 C atom 14.19776584 7.98473277 5.92222996 C atom 14.24930779 6.95811679 5.53669221 H atom 14.95020238 8.58894345 5.40340215 H atom 13.20584477 8.37443915 5.64943669 H atom 16.44951408 10.01544547 9.94878491 C atom 17.46306466 9.85240963 9.55327997 H atom 16.49435821 9.94318002 11.04180964 H atom 16.16969660 11.04646569 9.69063548 H atom 13.10904365 6.26970502 10.56161419 C atom 12.02561003 6.44137593 10.48541652 H atom 13.39811557 6.41838943 11.60800079 H atom 13.28581529 5.21809630 10.29678203 H atom 11.67568783 3.32767005 5.90964002 C atom 11.40460462 2.12517189 6.57955236 C atom 11.28029114 0.96645168 5.80449083 C atom 11.37664748 0.99009336 4.41018012 C atom 11.54856933 2.22673153 3.78020939 C atom 11.68908387 3.41072433 4.50650871 C atom 11.19350971 2.08110944 8.06831118 C atom 12.01192681 2.56369192 8.61634427 H atom 11.10673072 1.04571190 8.41674333 H atom 10.26511343 2.60415039 8.34254830 H atom 11.28763047 -0.27243964 3.59636759 C atom 10.40839546 -0.26094057 2.93662754 H atom 11.21639643 -1.16107249 4.23443107 H atom 12.16935925 -0.38553156 2.94848281 H atom 11.79750749 4.73018374 3.78961395 C atom 10.81918011 5.23248131 3.75122691 H atom 12.13090905 4.58438764 2.75596623 H atom 12.48764385 5.42493518 4.28275111 H atom 16.95811952 5.99229109 6.29031123 C atom 17.98024545 6.92497578 6.34177254 C atom 18.46842923 7.35540373 7.59179129 C atom 17.89096363 6.75629235 8.72910975 C atom 16.86627071 5.84058229 8.58125159 C atom 14.93389243 1.82651014 5.14176875 C atom 14.91551377 1.24189173 3.89027166 C atom 14.90897423 2.05079145 2.73520301 C atom 14.95176730 3.44360981 2.94561313 C atom 14.96206111 3.94123496 4.23704649 C atom 16.30377590 1.79933763 9.04368020 C atom 17.31615797 0.94878141 9.44500898 C atom 18.51276774 0.87012459 8.69927659 C atom 18.59222207 1.68966833 7.55461605 C atom 17.53182749 2.51318319 7.22079698 C atom 14.78760665 3.87659582 7.42070051 Ir atom 14.60858277 4.21550582 8.96247465 H atom 13.79560641 2.66926846 7.62093925 H atom 16.36717449 5.45894172 7.38164240 N atom 14.94912183 3.16701654 5.34394014 N atom 16.38737450 2.58889230 7.94293289 N atom 12.81453293 6.20219498 7.68431021 N atom 11.90142723 4.53070682 6.66395394 N atom 9.89418198 5.31698638 6.51059995 H atom 11.07089240 7.47246738 7.82609062 H atom 11.58926603 2.27161782 2.69022347 H atom 11.09481601 0.01753499 6.31098530 H atom 15.82986061 9.63406119 7.32932181 H atom 14.89135110 8.19578464 11.26633671 H atom 14.82203317 1.49247192 1.44488593 C atom 14.59229049 0.42063372 -0.95256762 C atom 14.52163586 -0.98109332 -1.10178607 C atom 14.39624795 -1.54295173 -2.36751520 C atom 14.33945345 -0.72402847 -3.49875070 C atom 14.40912916 0.66514280 -3.36132348 C atom 14.53467885 1.23892698 -2.10095175 C atom 14.93524934 5.01600160 4.40650229 H atom 14.94552207 4.12913432 2.10074609 H atom 14.90337849 1.21543978 6.04069680 H atom 14.87811532 0.15829841 3.80228655 H atom 14.71658881 0.99718304 0.33349706 C atom 14.59026484 2.32042353 -1.98613174 H atom 14.24128021 -1.16890500 -4.48840612 H atom 14.36551022 1.30344860 -4.24314454 H atom 14.56779066 -1.61276333 -0.21585924 H atom 14.34278249 -2.62583486 -2.47457130 H atom 19.46123099 8.34876397 7.70725824 C #magnetic response atom 20.29829876 9.22970430 7.82834190 C #magnetic response atom 21.26462681 10.25298674 7.97397694 C atom 21.67740689 10.66490635 9.25928735 C atom 22.62447716 11.67347278 9.39864814 C atom 23.17333686 12.28468615 8.26786776 C atom 21.82491638 10.87604062 6.83848026 C atom 22.77147643 11.88324688 6.99080452 C atom 19.56805485 0.01920746 9.08048118 C atom 20.48074501 -0.71872793 9.41816032 C atom 21.53683251 -1.57355742 9.81208383 C atom 21.41260125 -2.37513308 10.96721003 C atom 22.45395340 -3.21290233 11.35069034 C atom 23.62889782 -3.26646296 10.59553817 C atom 23.76140099 -2.47663601 9.44999682 C atom 22.72715020 -1.63483743 9.05615344 C atom 22.82297921 -1.01629766 8.16504164 H atom 24.44212494 -3.92445254 10.90009173 H atom 24.67728476 -2.51846488 8.86144919 H atom 20.49420771 -2.32776452 11.55042646 H atom 22.35061734 -3.82853529 12.24359171 H atom 15.37606197 1.87734315 9.60476810 H atom 17.18639962 0.34290464 10.33918630 H atom 19.48378205 1.67942524 6.93126700 H atom 17.58342333 3.14781127 6.33868523 H atom 16.58353244 5.65743937 5.32595868 H atom 18.39417299 7.32780198 5.41959766 H atom 18.22578748 7.03337947 9.72618201 H atom 16.38773286 5.39371278 9.44866032 H atom 21.50729609 10.55764463 5.84670330 H atom 23.91539528 13.07419038 8.38197572 H atom 23.19987151 12.35919509 6.10937507 H atom 21.24651038 10.18270892 10.13557218 H atom 22.93829256 11.98560693 10.39416959 H PTC 2-0.09 eV: atom 12.61994096 4.68725628 7.21135120 C atom 10.39359377 4.97555886 6.74583996 C atom 10.78144088 6.01607156 7.51784122 C atom 12.83583669 6.81681346 8.57386436 C atom 13.44288772 7.88917444 7.90028382 C atom 14.05440229 8.87552444 8.67437741 C atom 14.05243718 8.82495592 10.07527131 C atom 13.40424405 7.75899460 10.69996801 C atom 12.78026552 6.74093539 9.97102203 C atom 13.40868356 7.97821802 6.39979965 C atom 13.83947757 7.08123482 5.93456690 H atom 13.97364496 8.84637643 6.04428548 H atom 12.37805455 8.07080900 6.02712158 H atom 14.74133759 9.89269743 10.87904577 C atom 15.81377106 9.93331279 10.64062641 H atom 14.64531327 9.70981898 11.95529194 H atom 14.32473420 10.88659030 10.66330188 H atom 12.06440256 5.62019575 10.67196358 C atom 10.97281770 5.75088889 10.62302095 H atom 12.34865838 5.58321848 11.72924630 H atom 12.29198044 4.64629636 10.22009118 H atom 11.44275568 2.99647050 5.73587139 C atom 11.29025601 1.73241155 6.32274907 C atom 11.29126795 0.61844294 5.47207251 C atom 11.39484656 0.74071615 4.08597318 C atom 11.44960872 2.02804136 3.53833210 C atom 11.46457958 3.16985416 4.33838210 C atom 11.06202760 1.54001401 7.79870911 C atom 11.21278879 2.45788421 8.37368
D00000
D00001
D00002
D00003
D00004
D00005
D00006
D00007
D00008
D00009
D00010
D00011
D00012
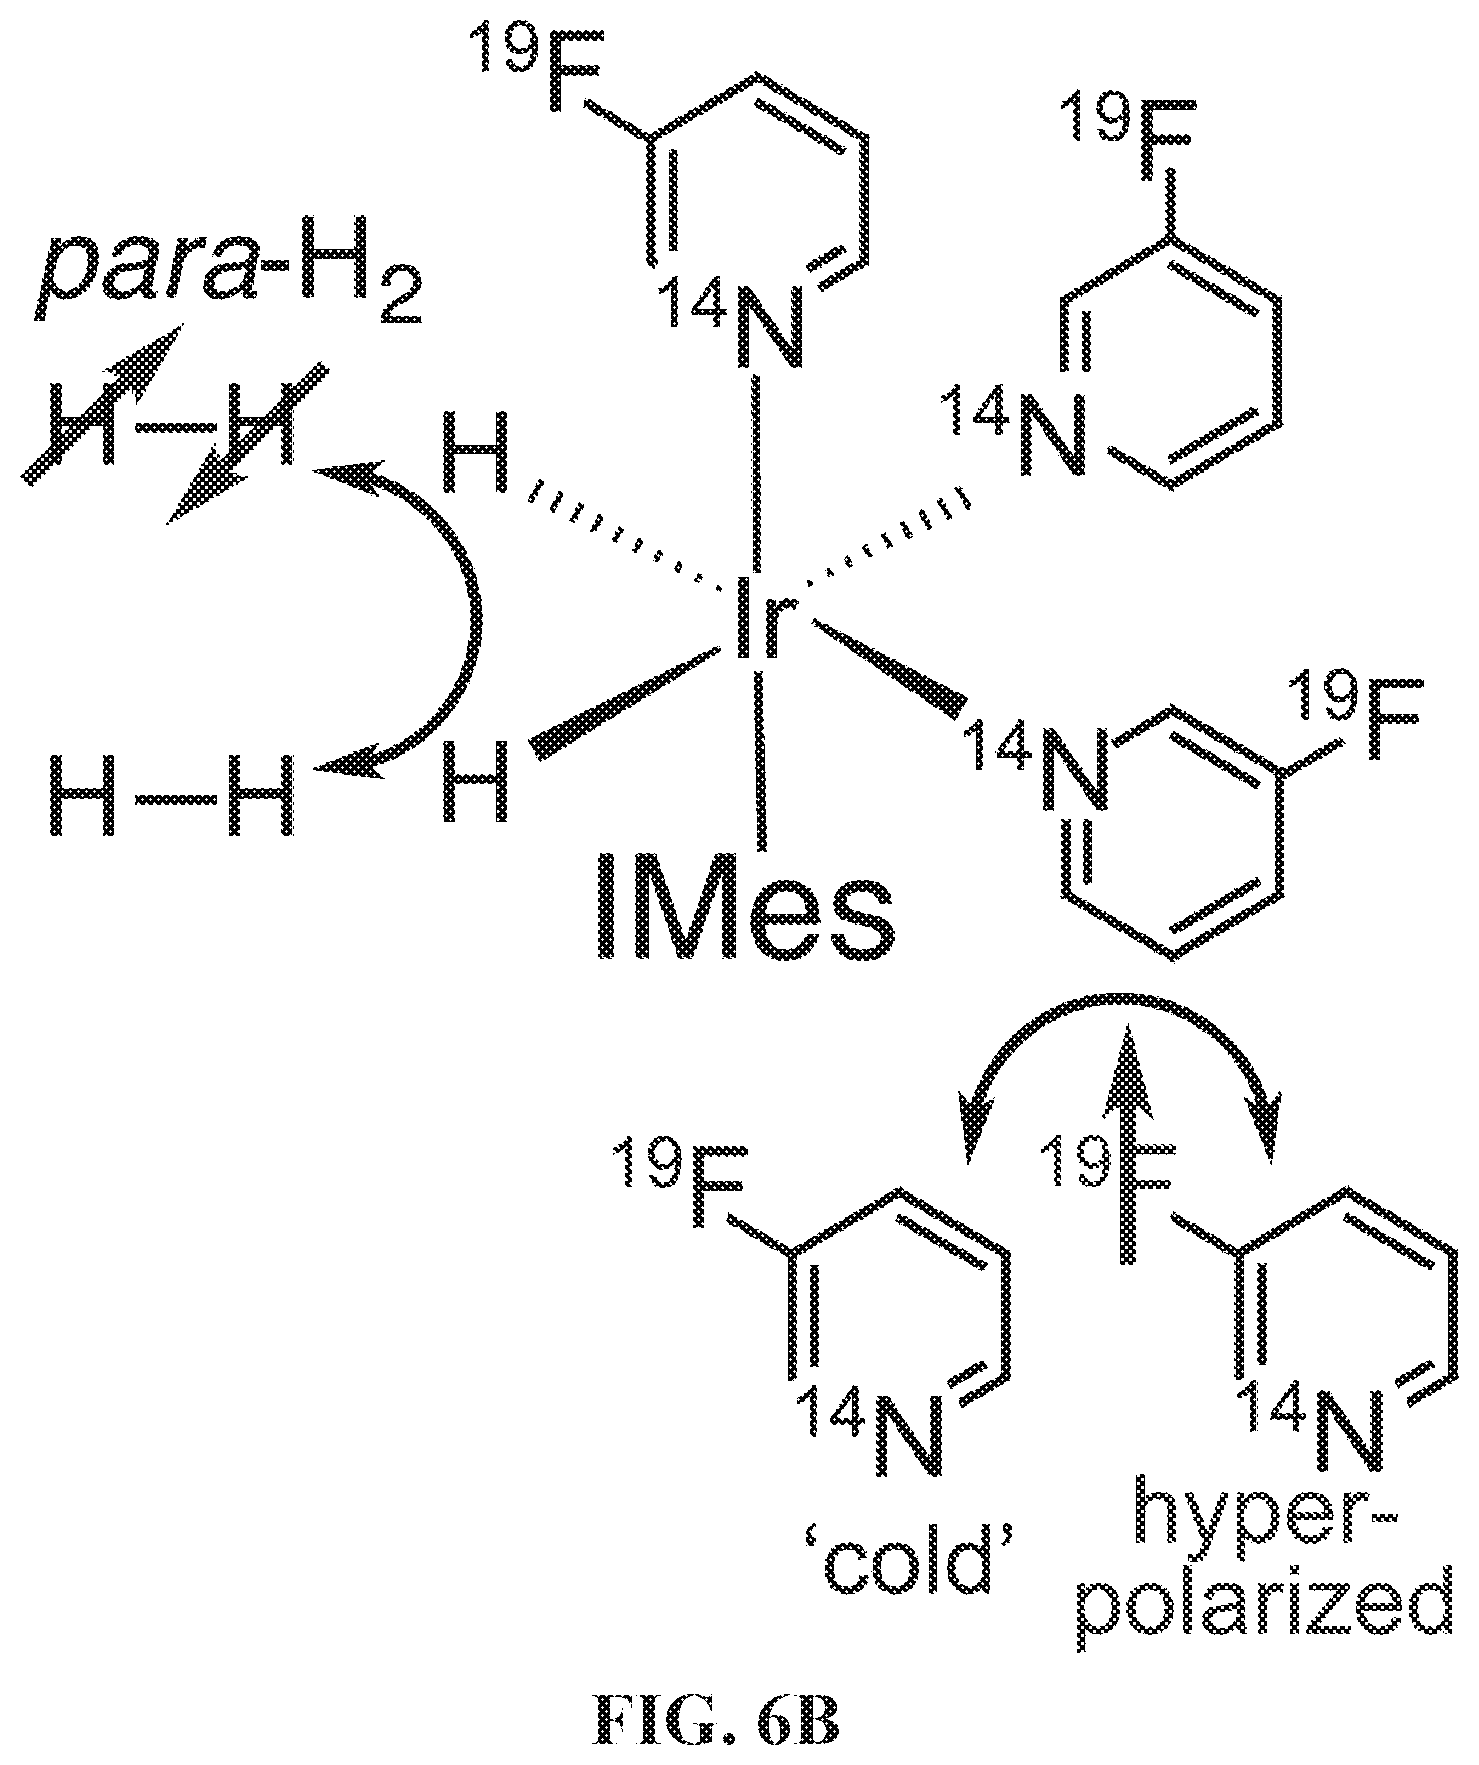
D00013
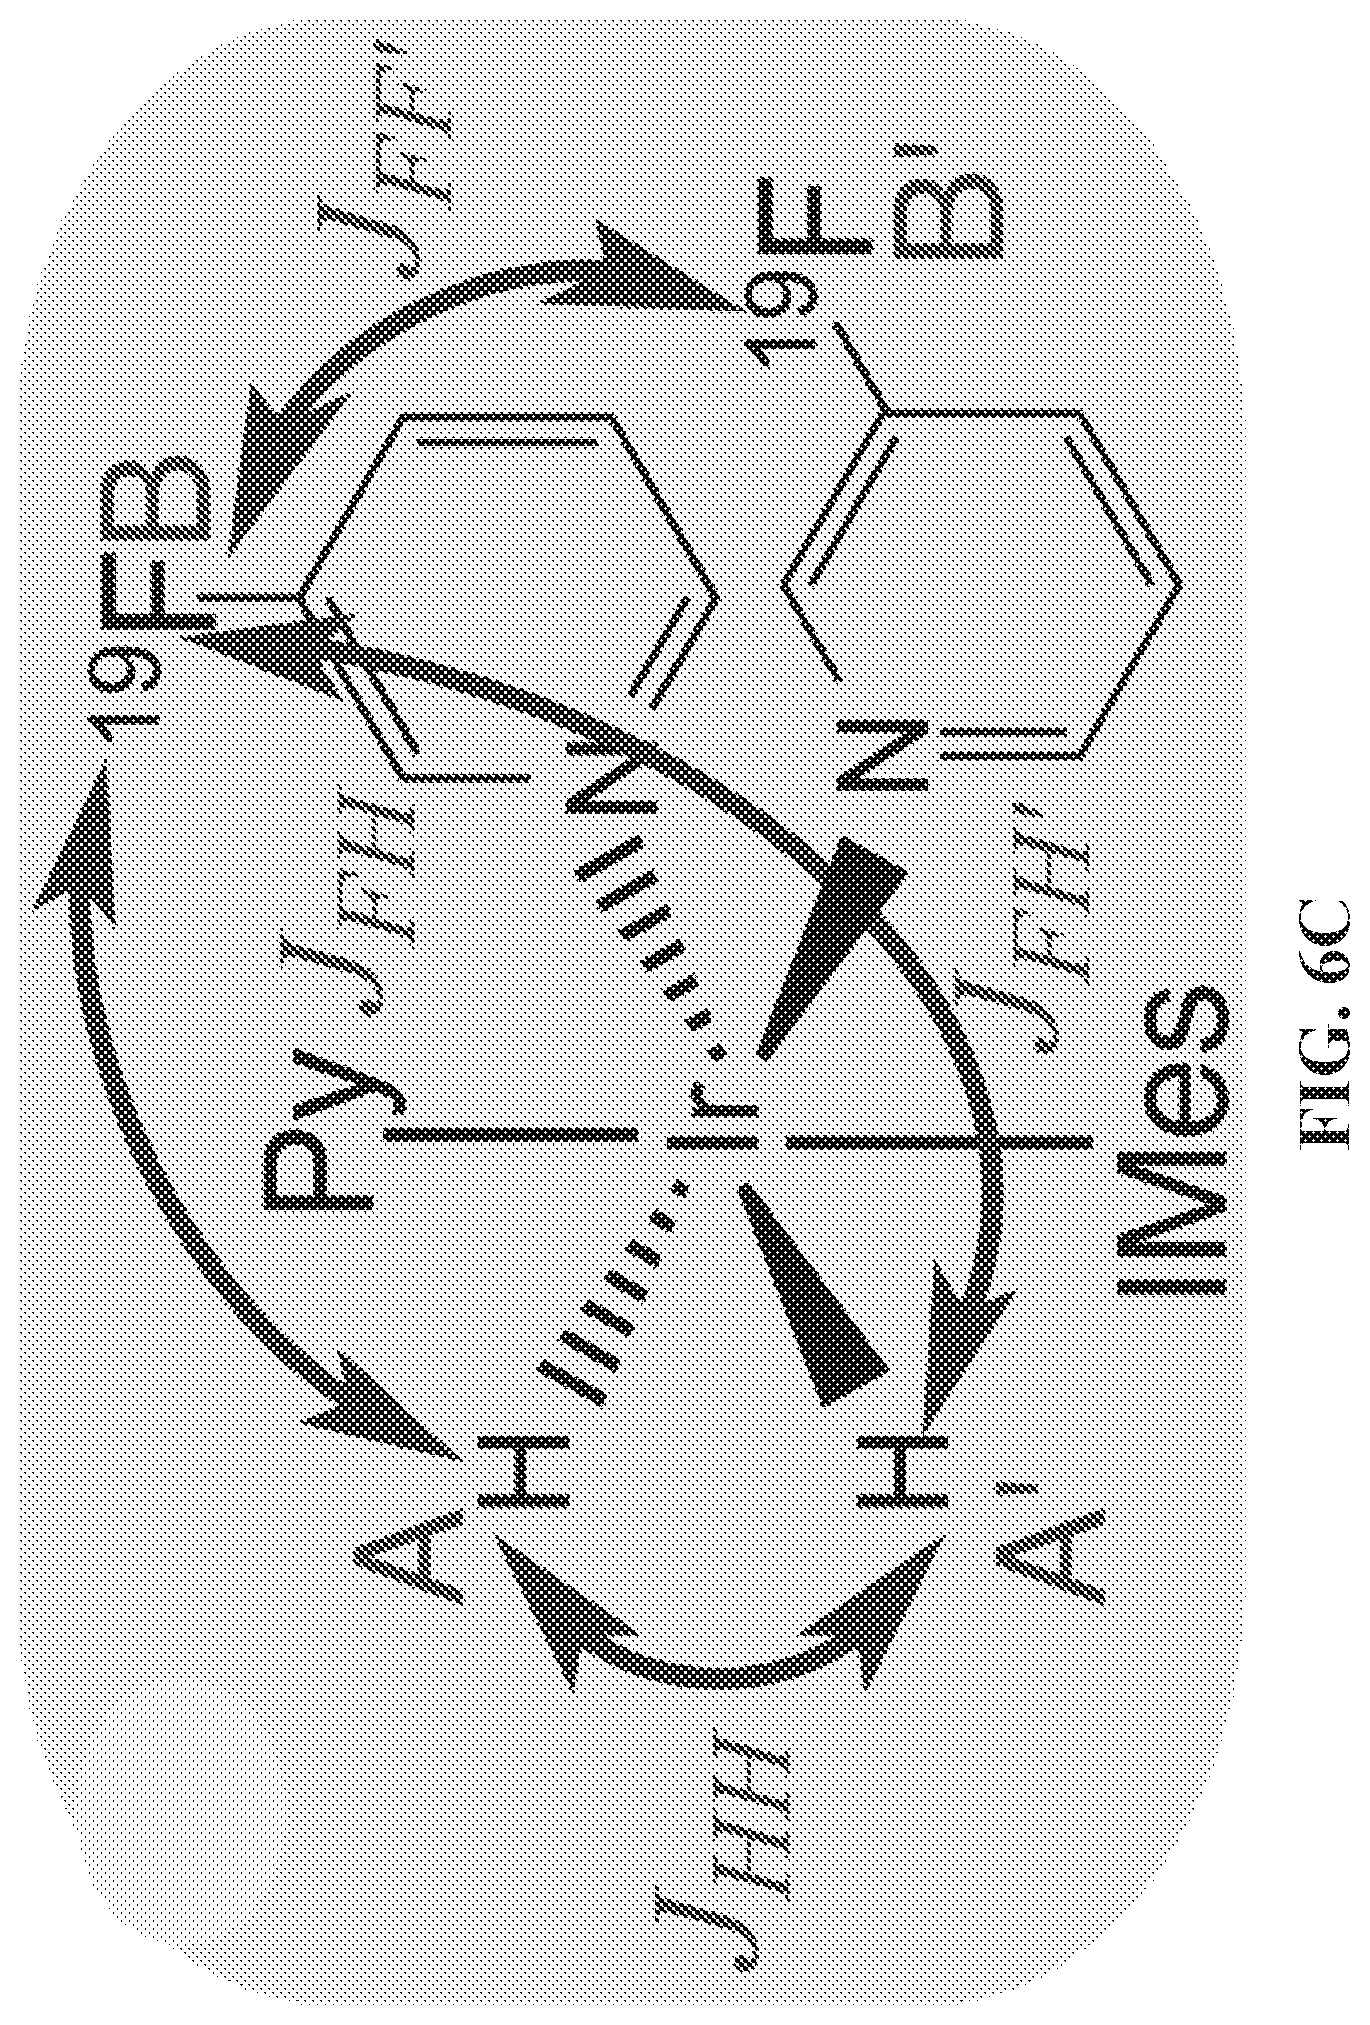
D00014
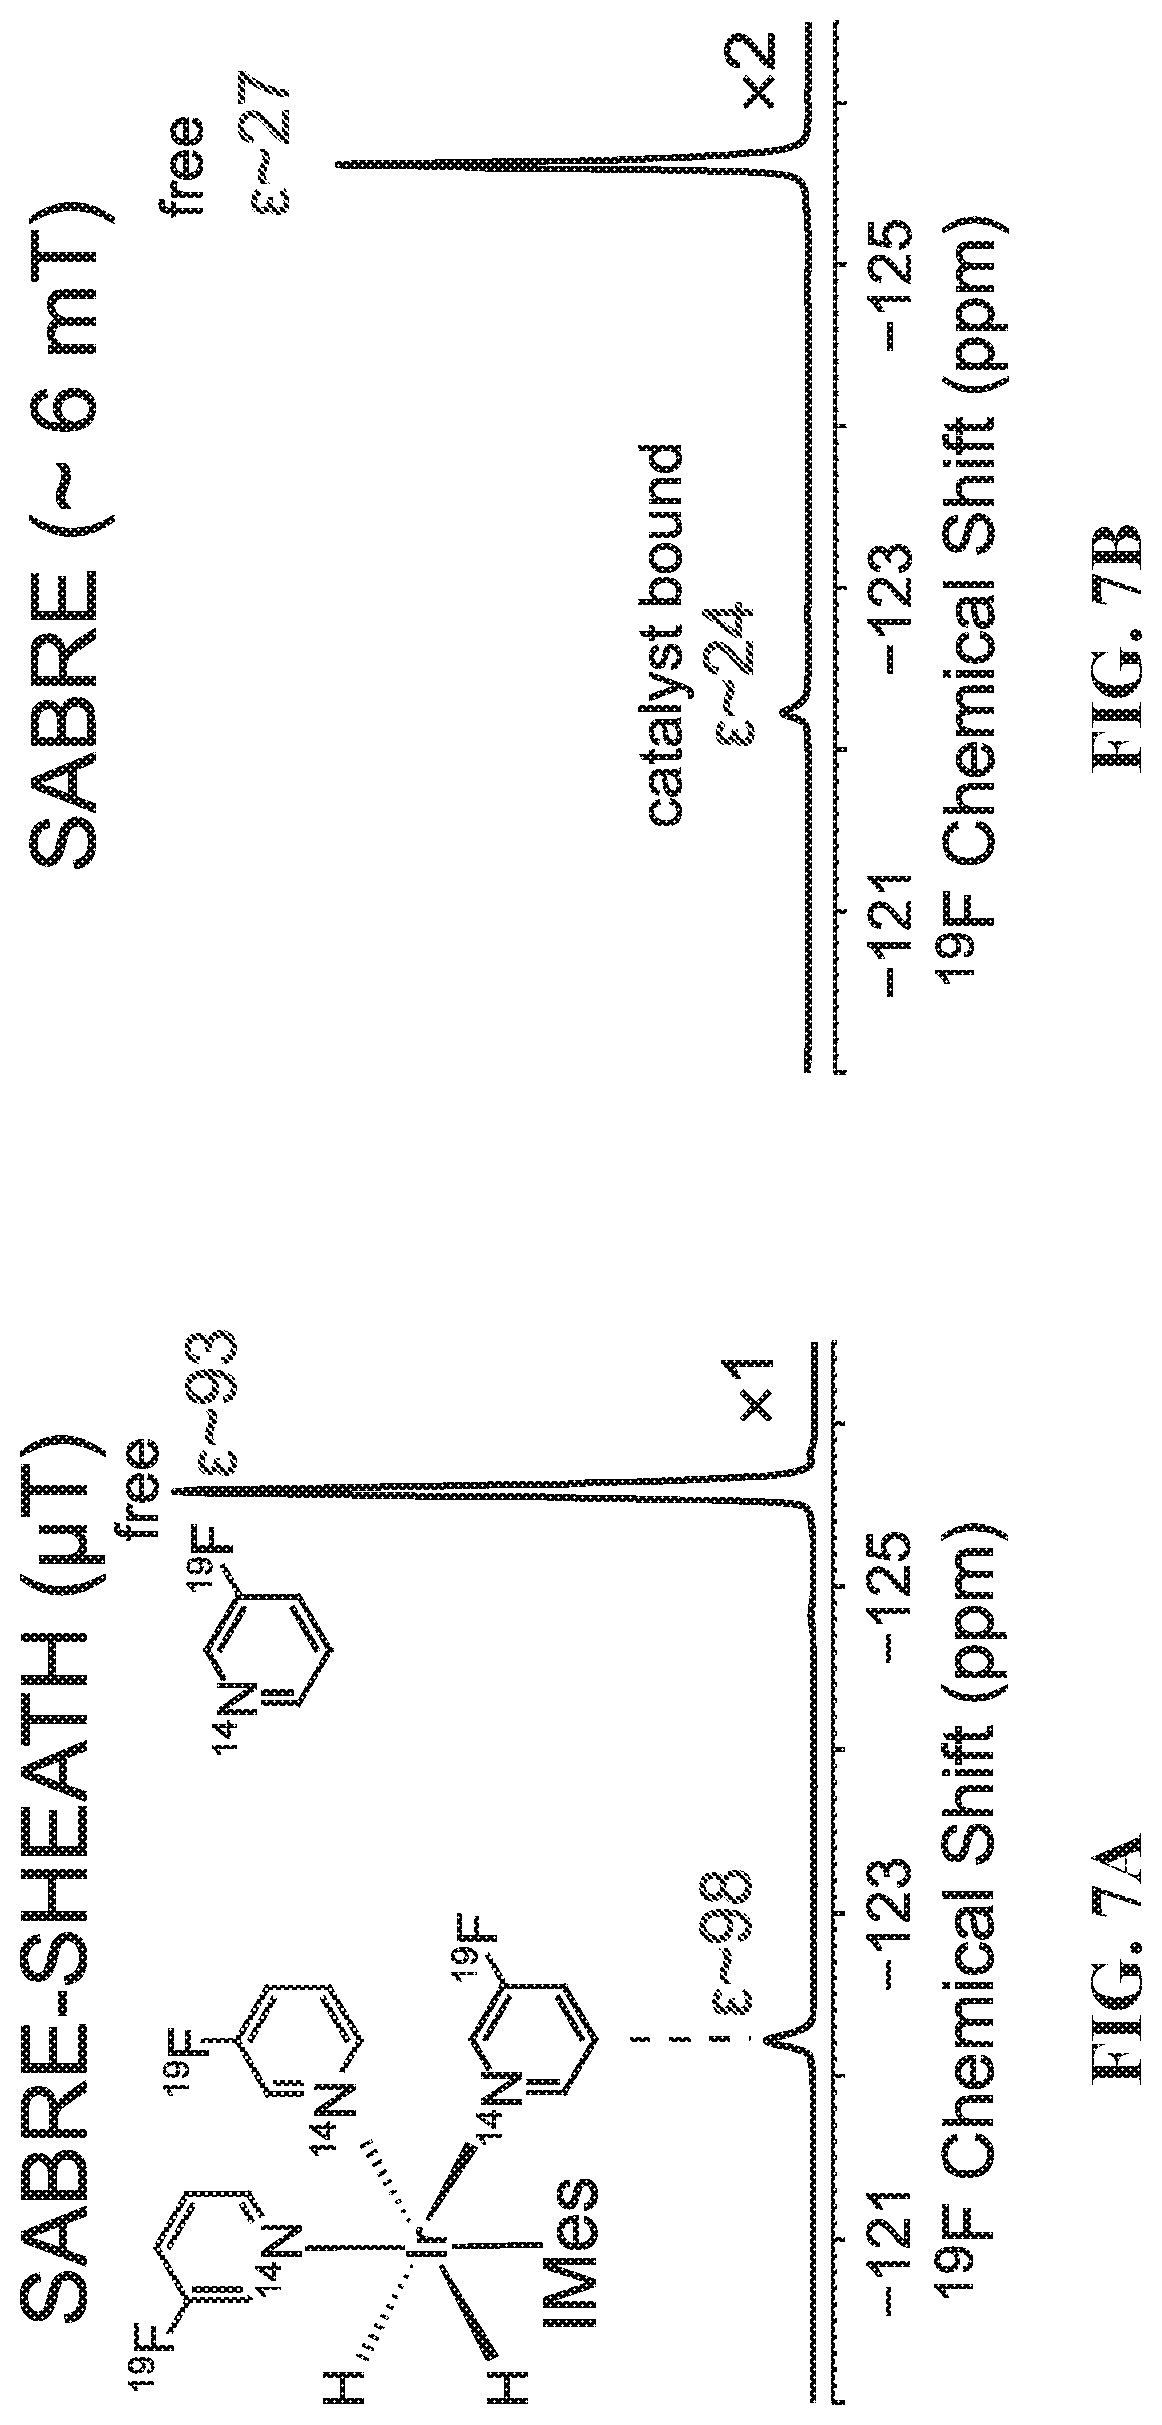
D00015

D00016
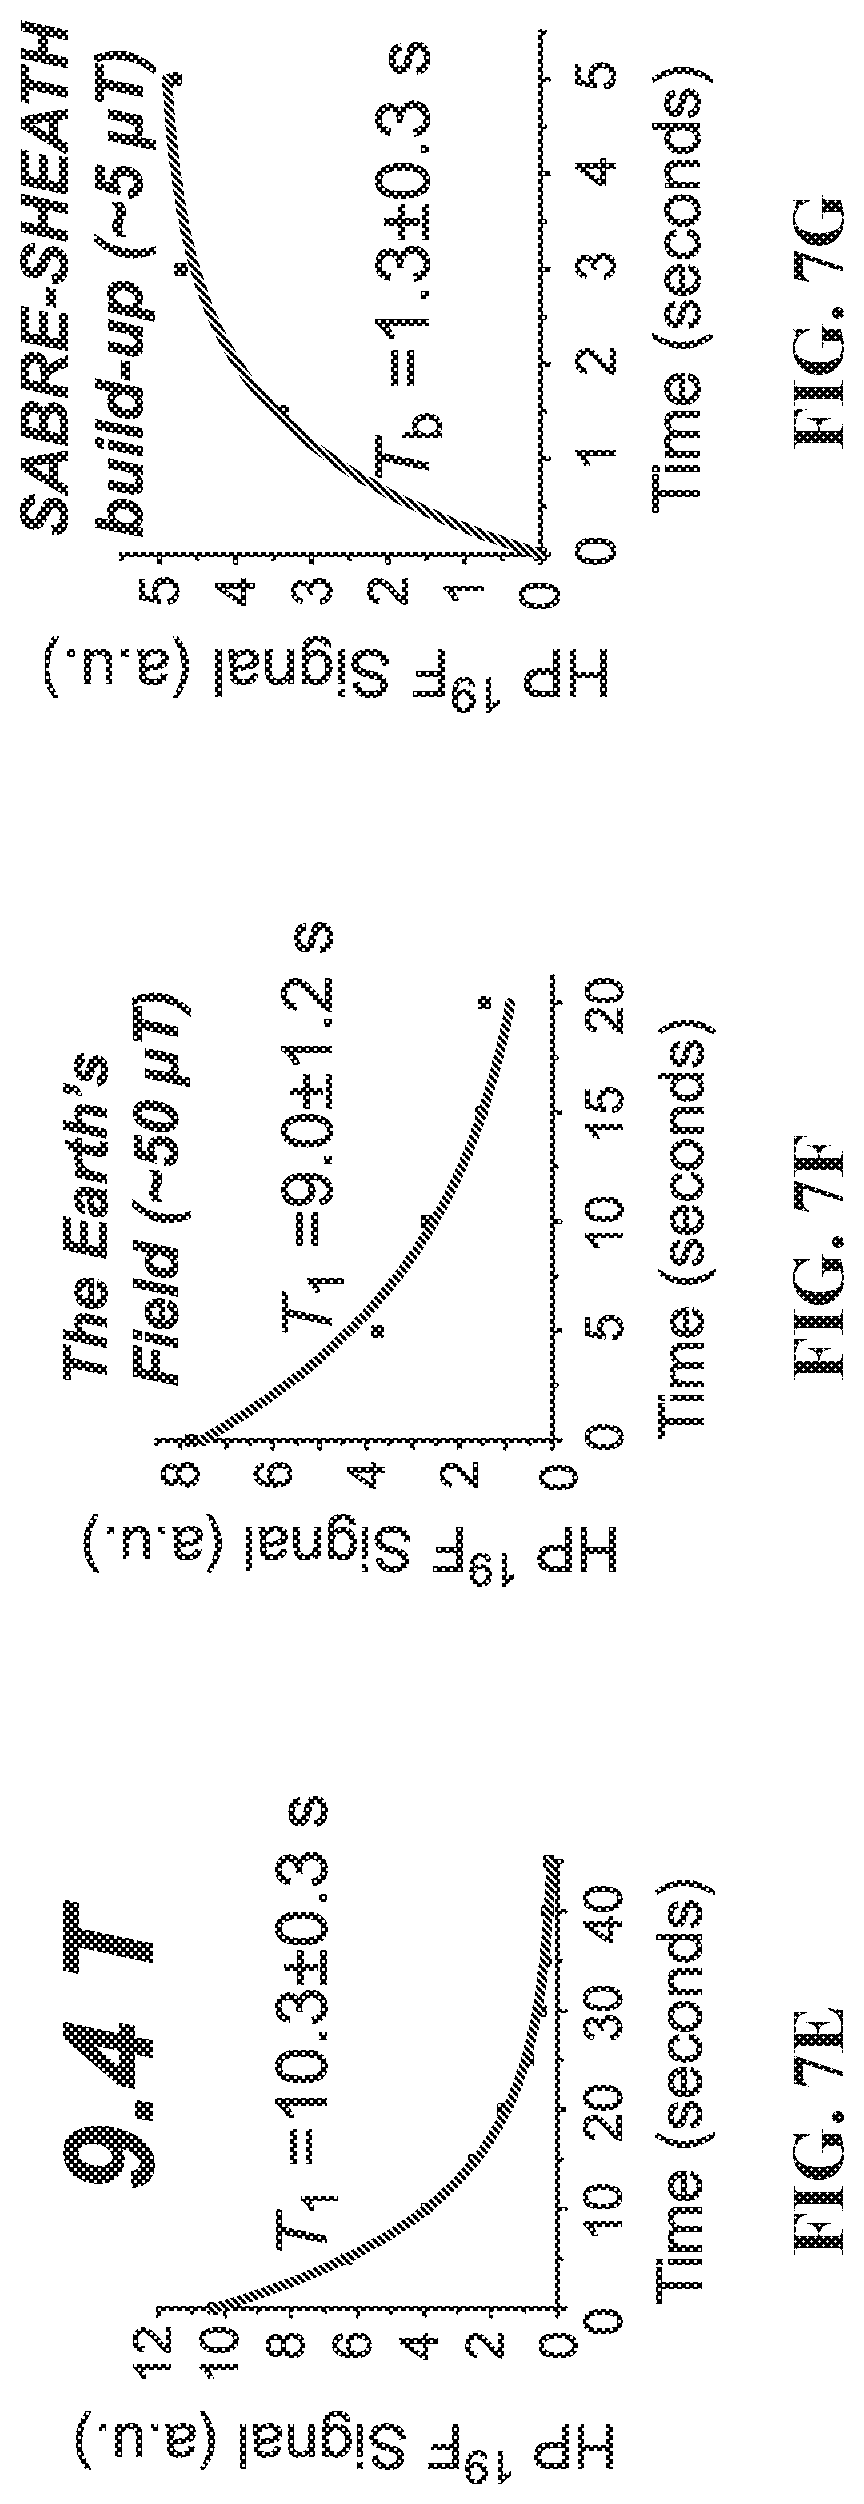
D00017
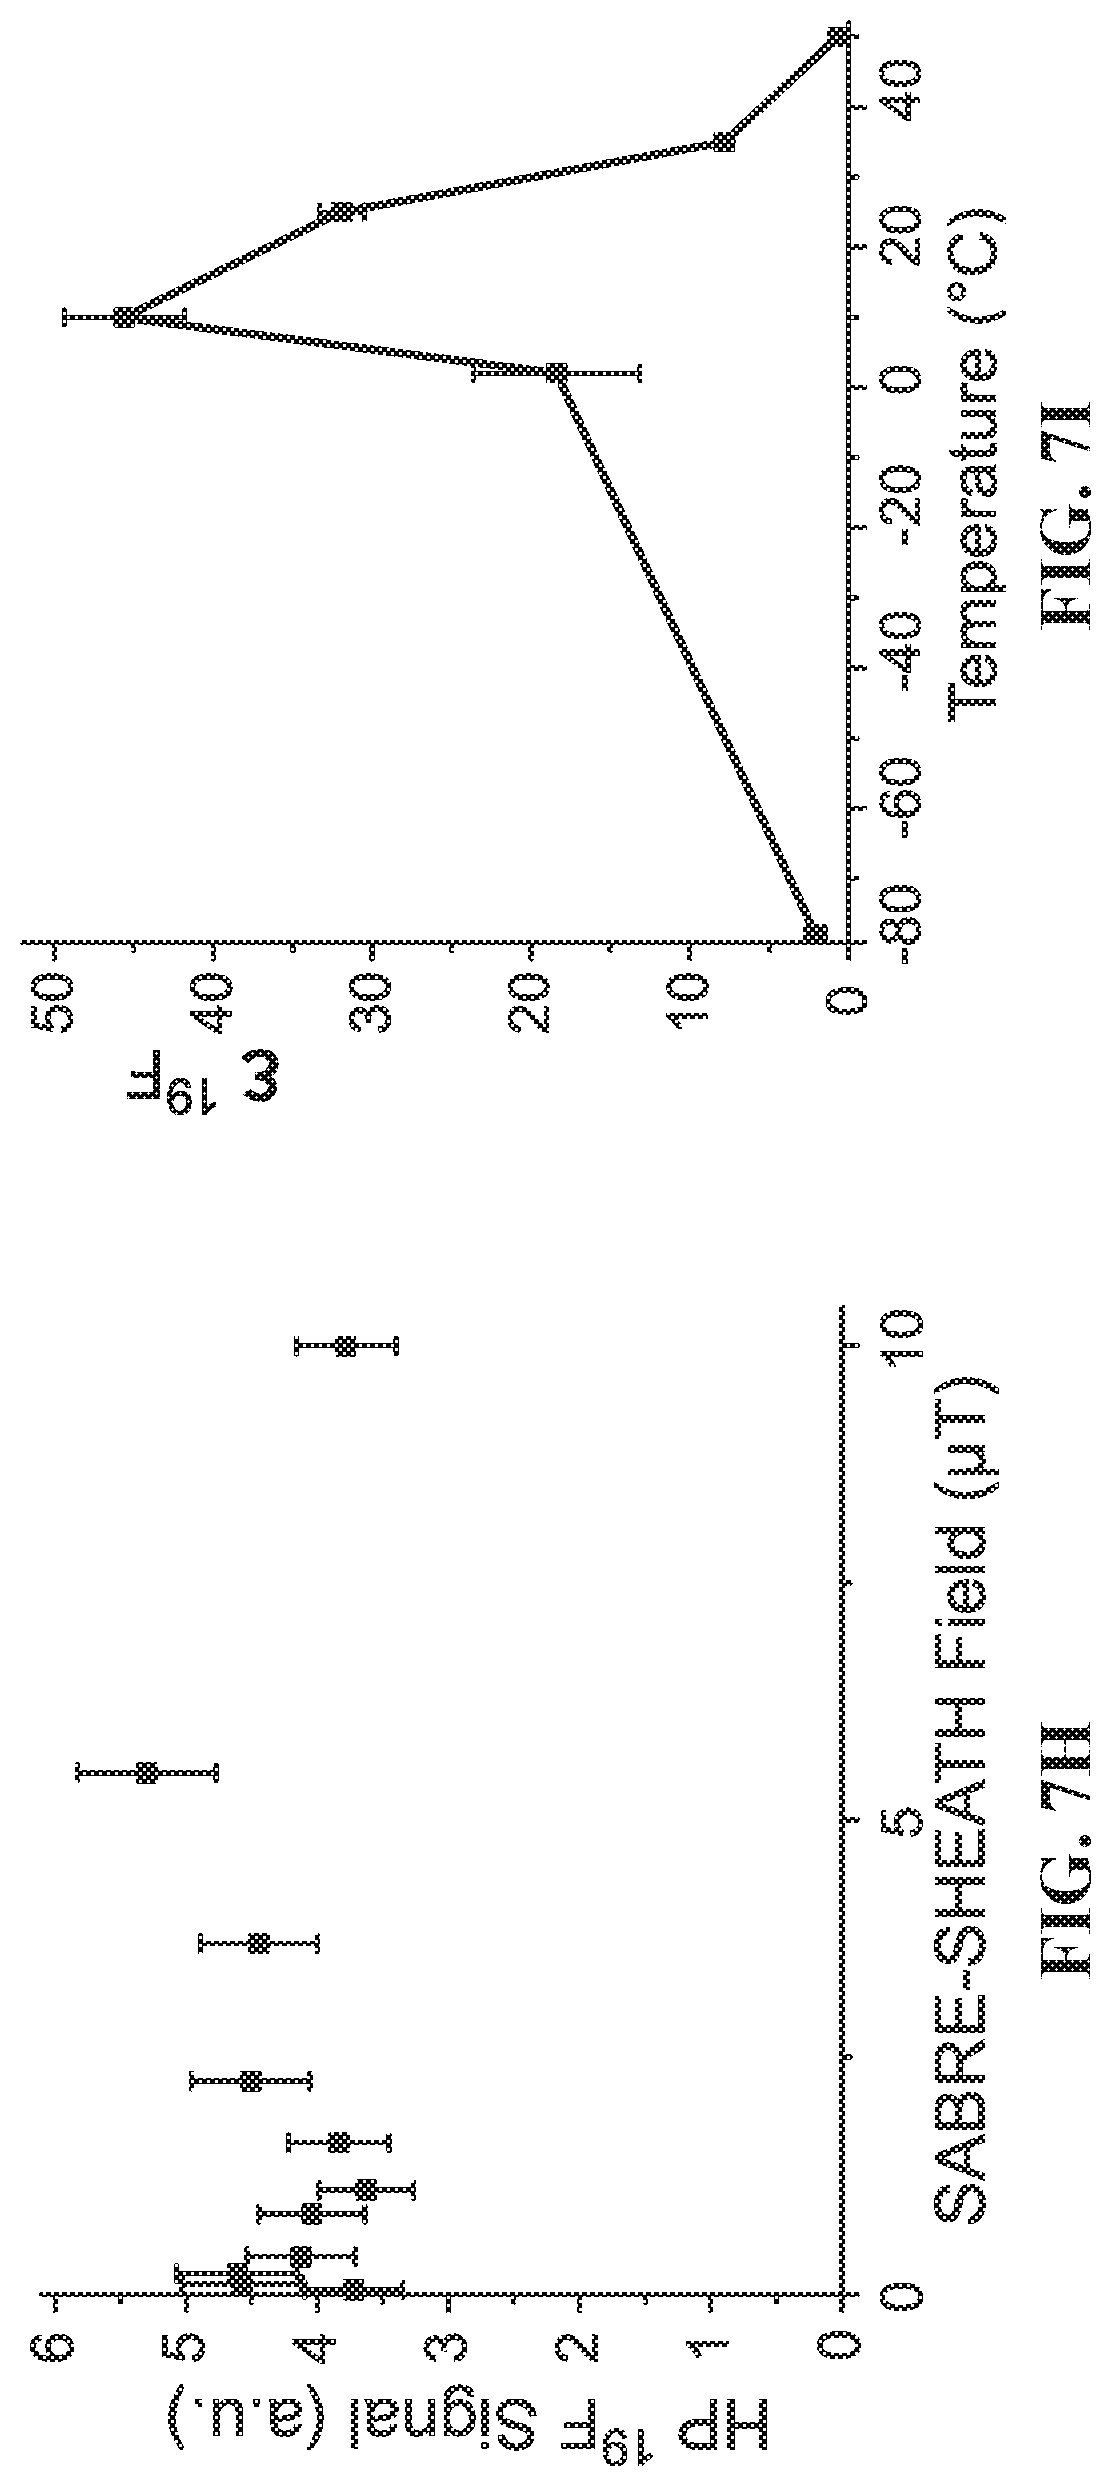
D00018
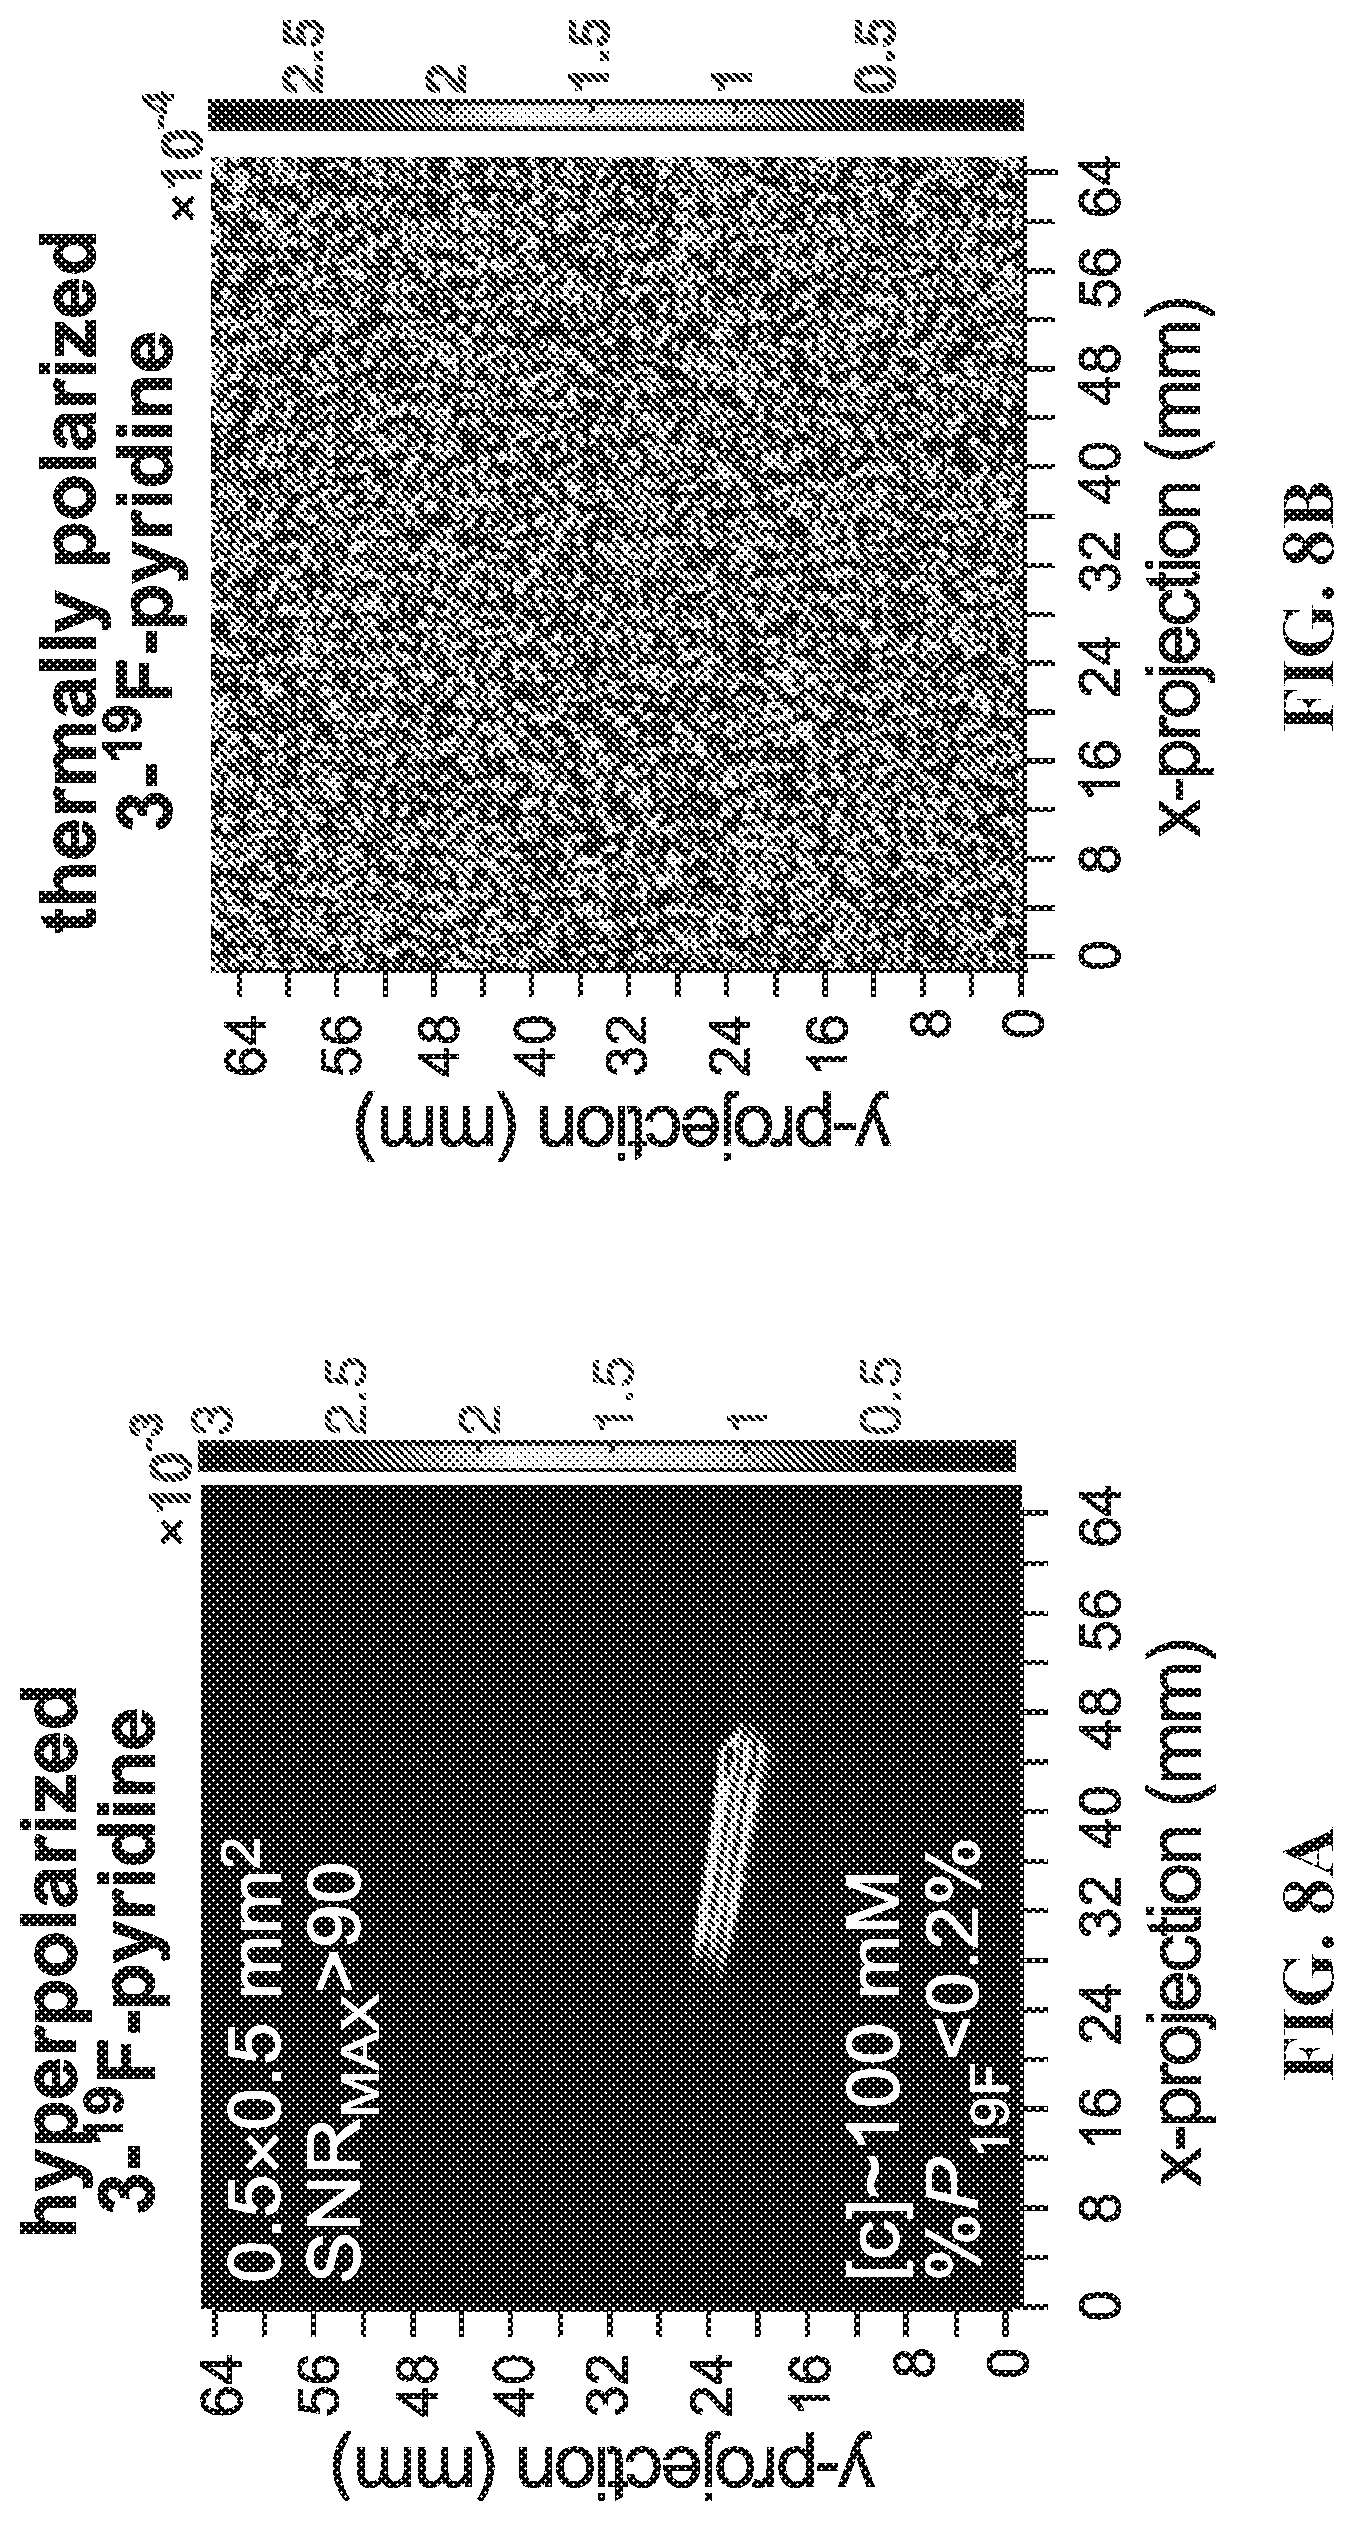
D00019

D00020

D00021

D00022
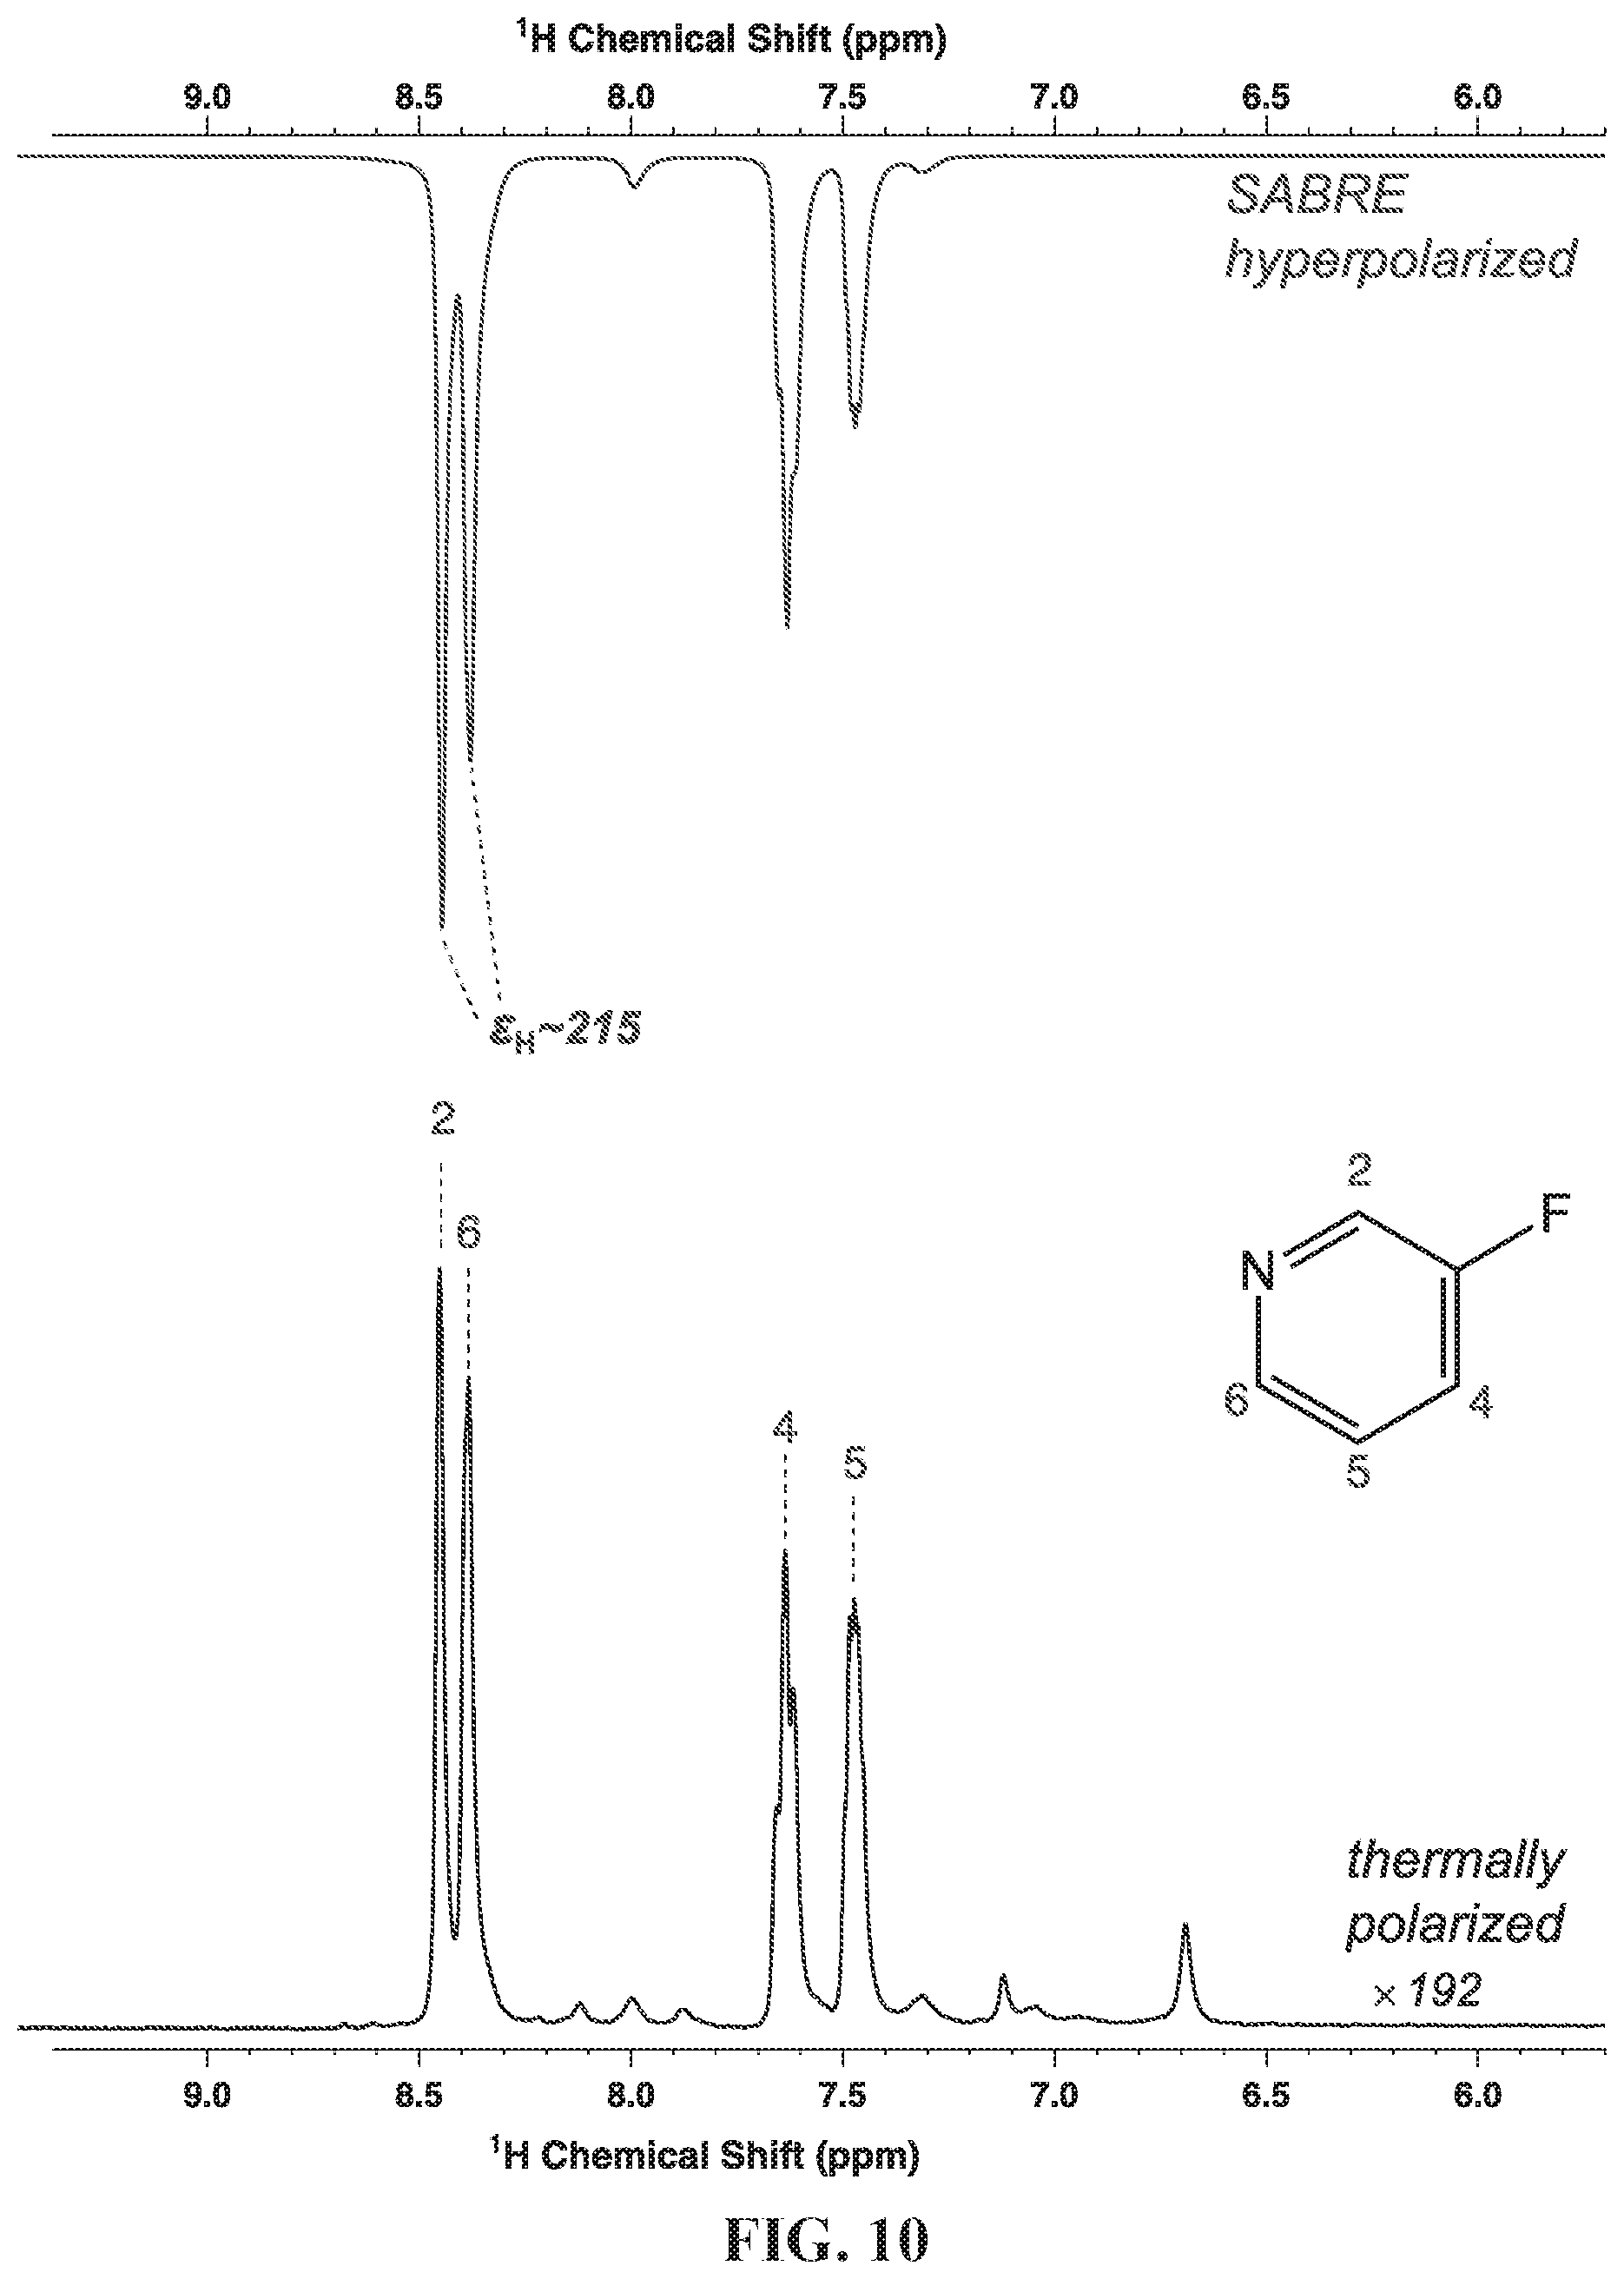
D00023
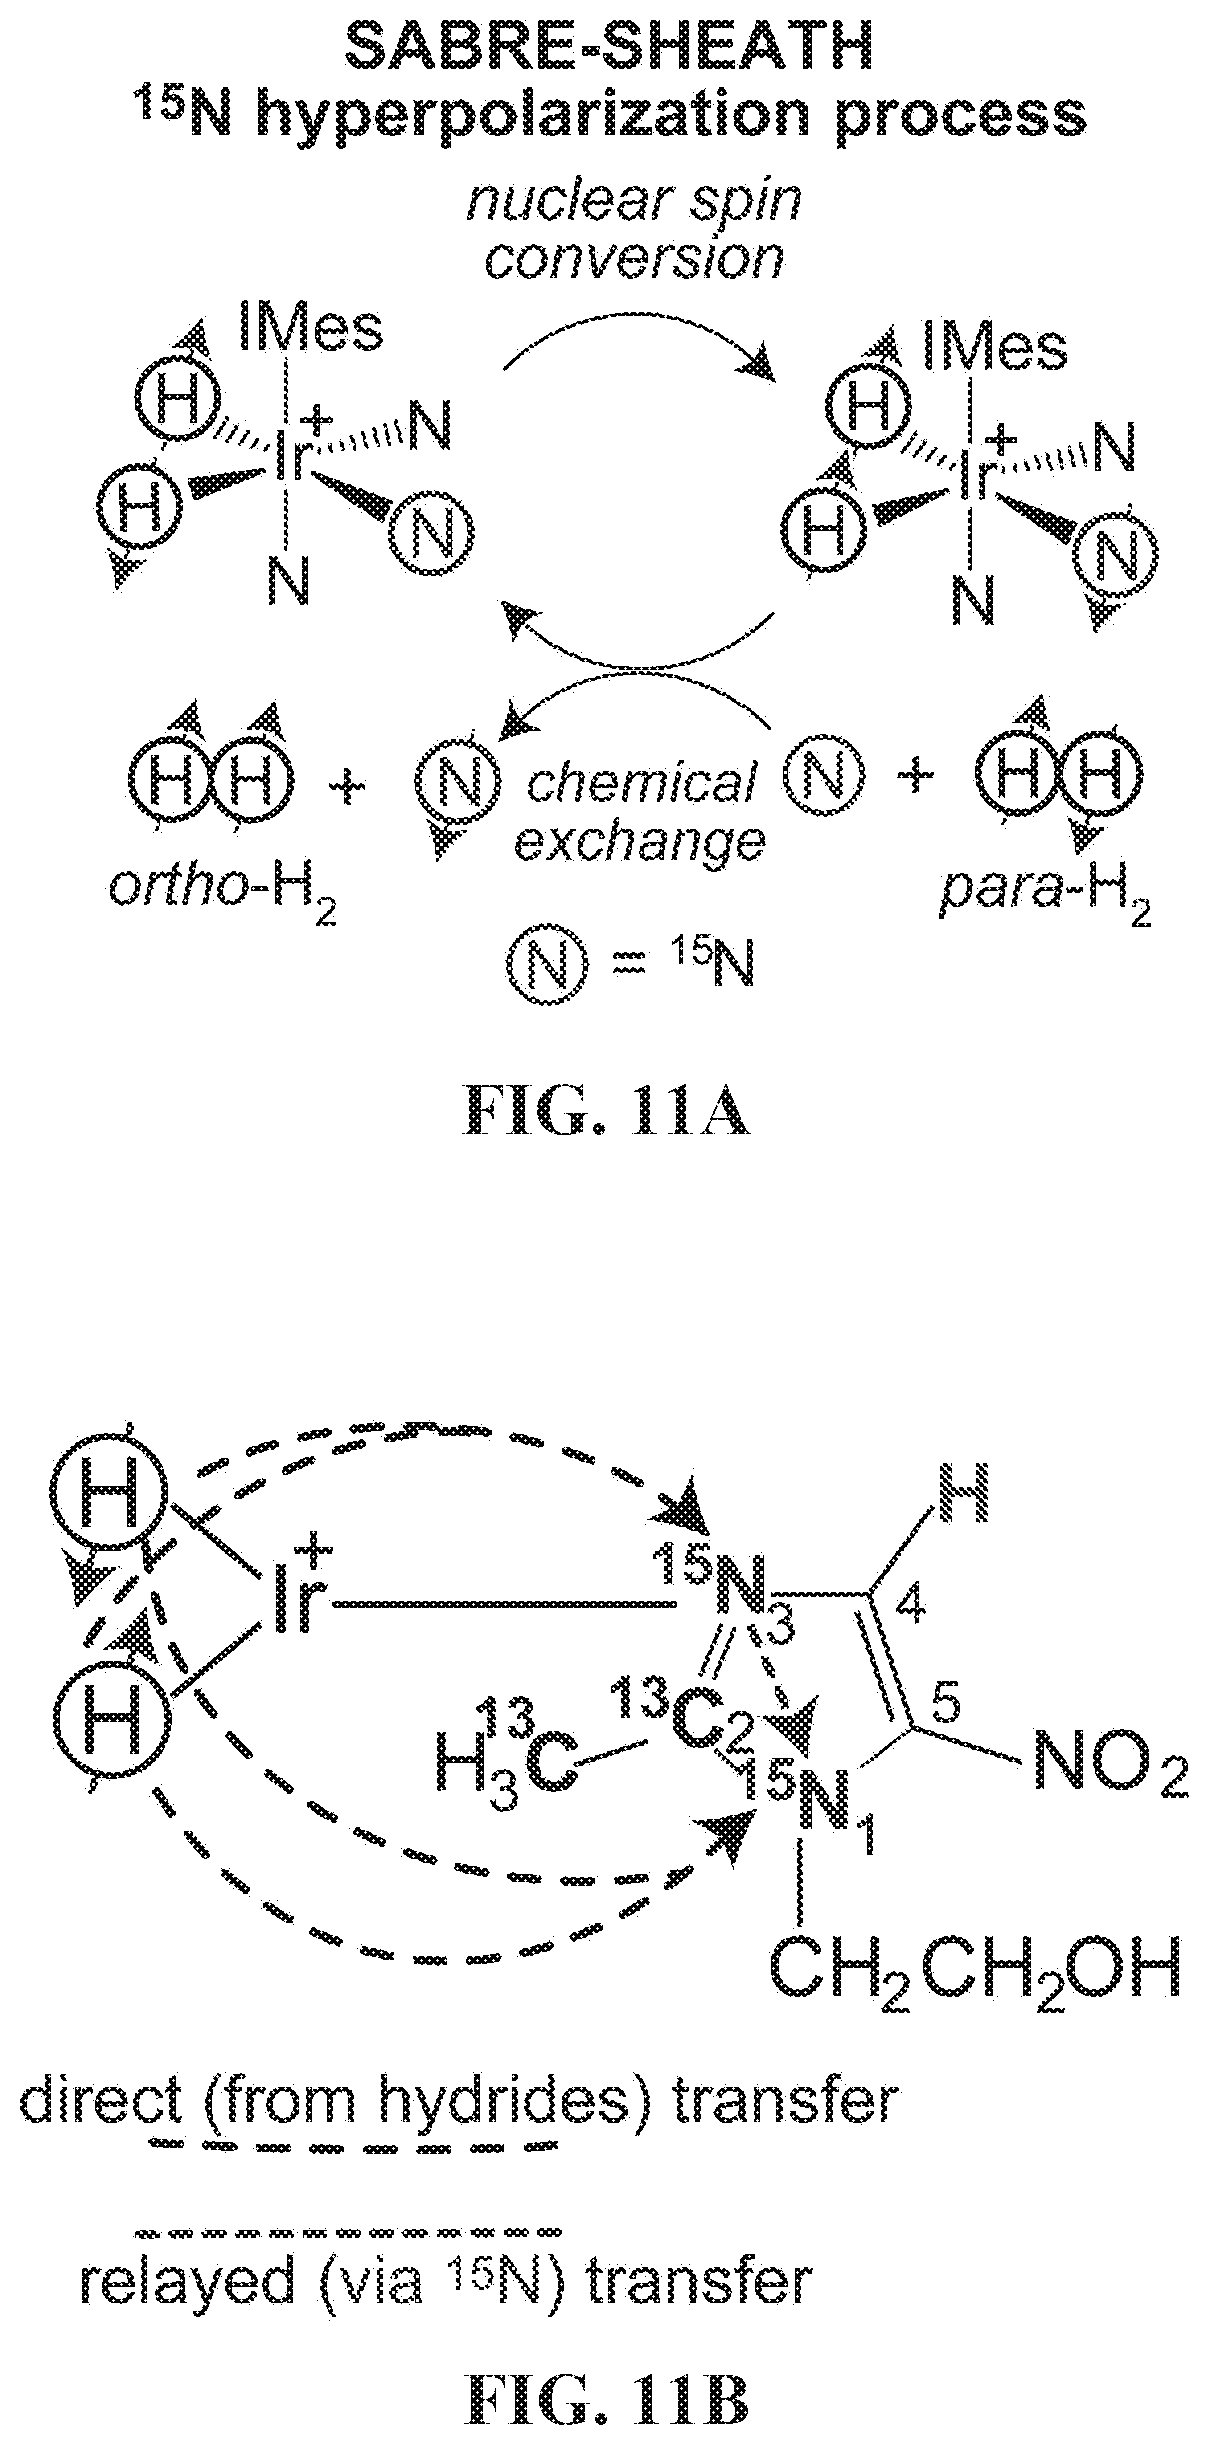
D00024

D00025

D00026
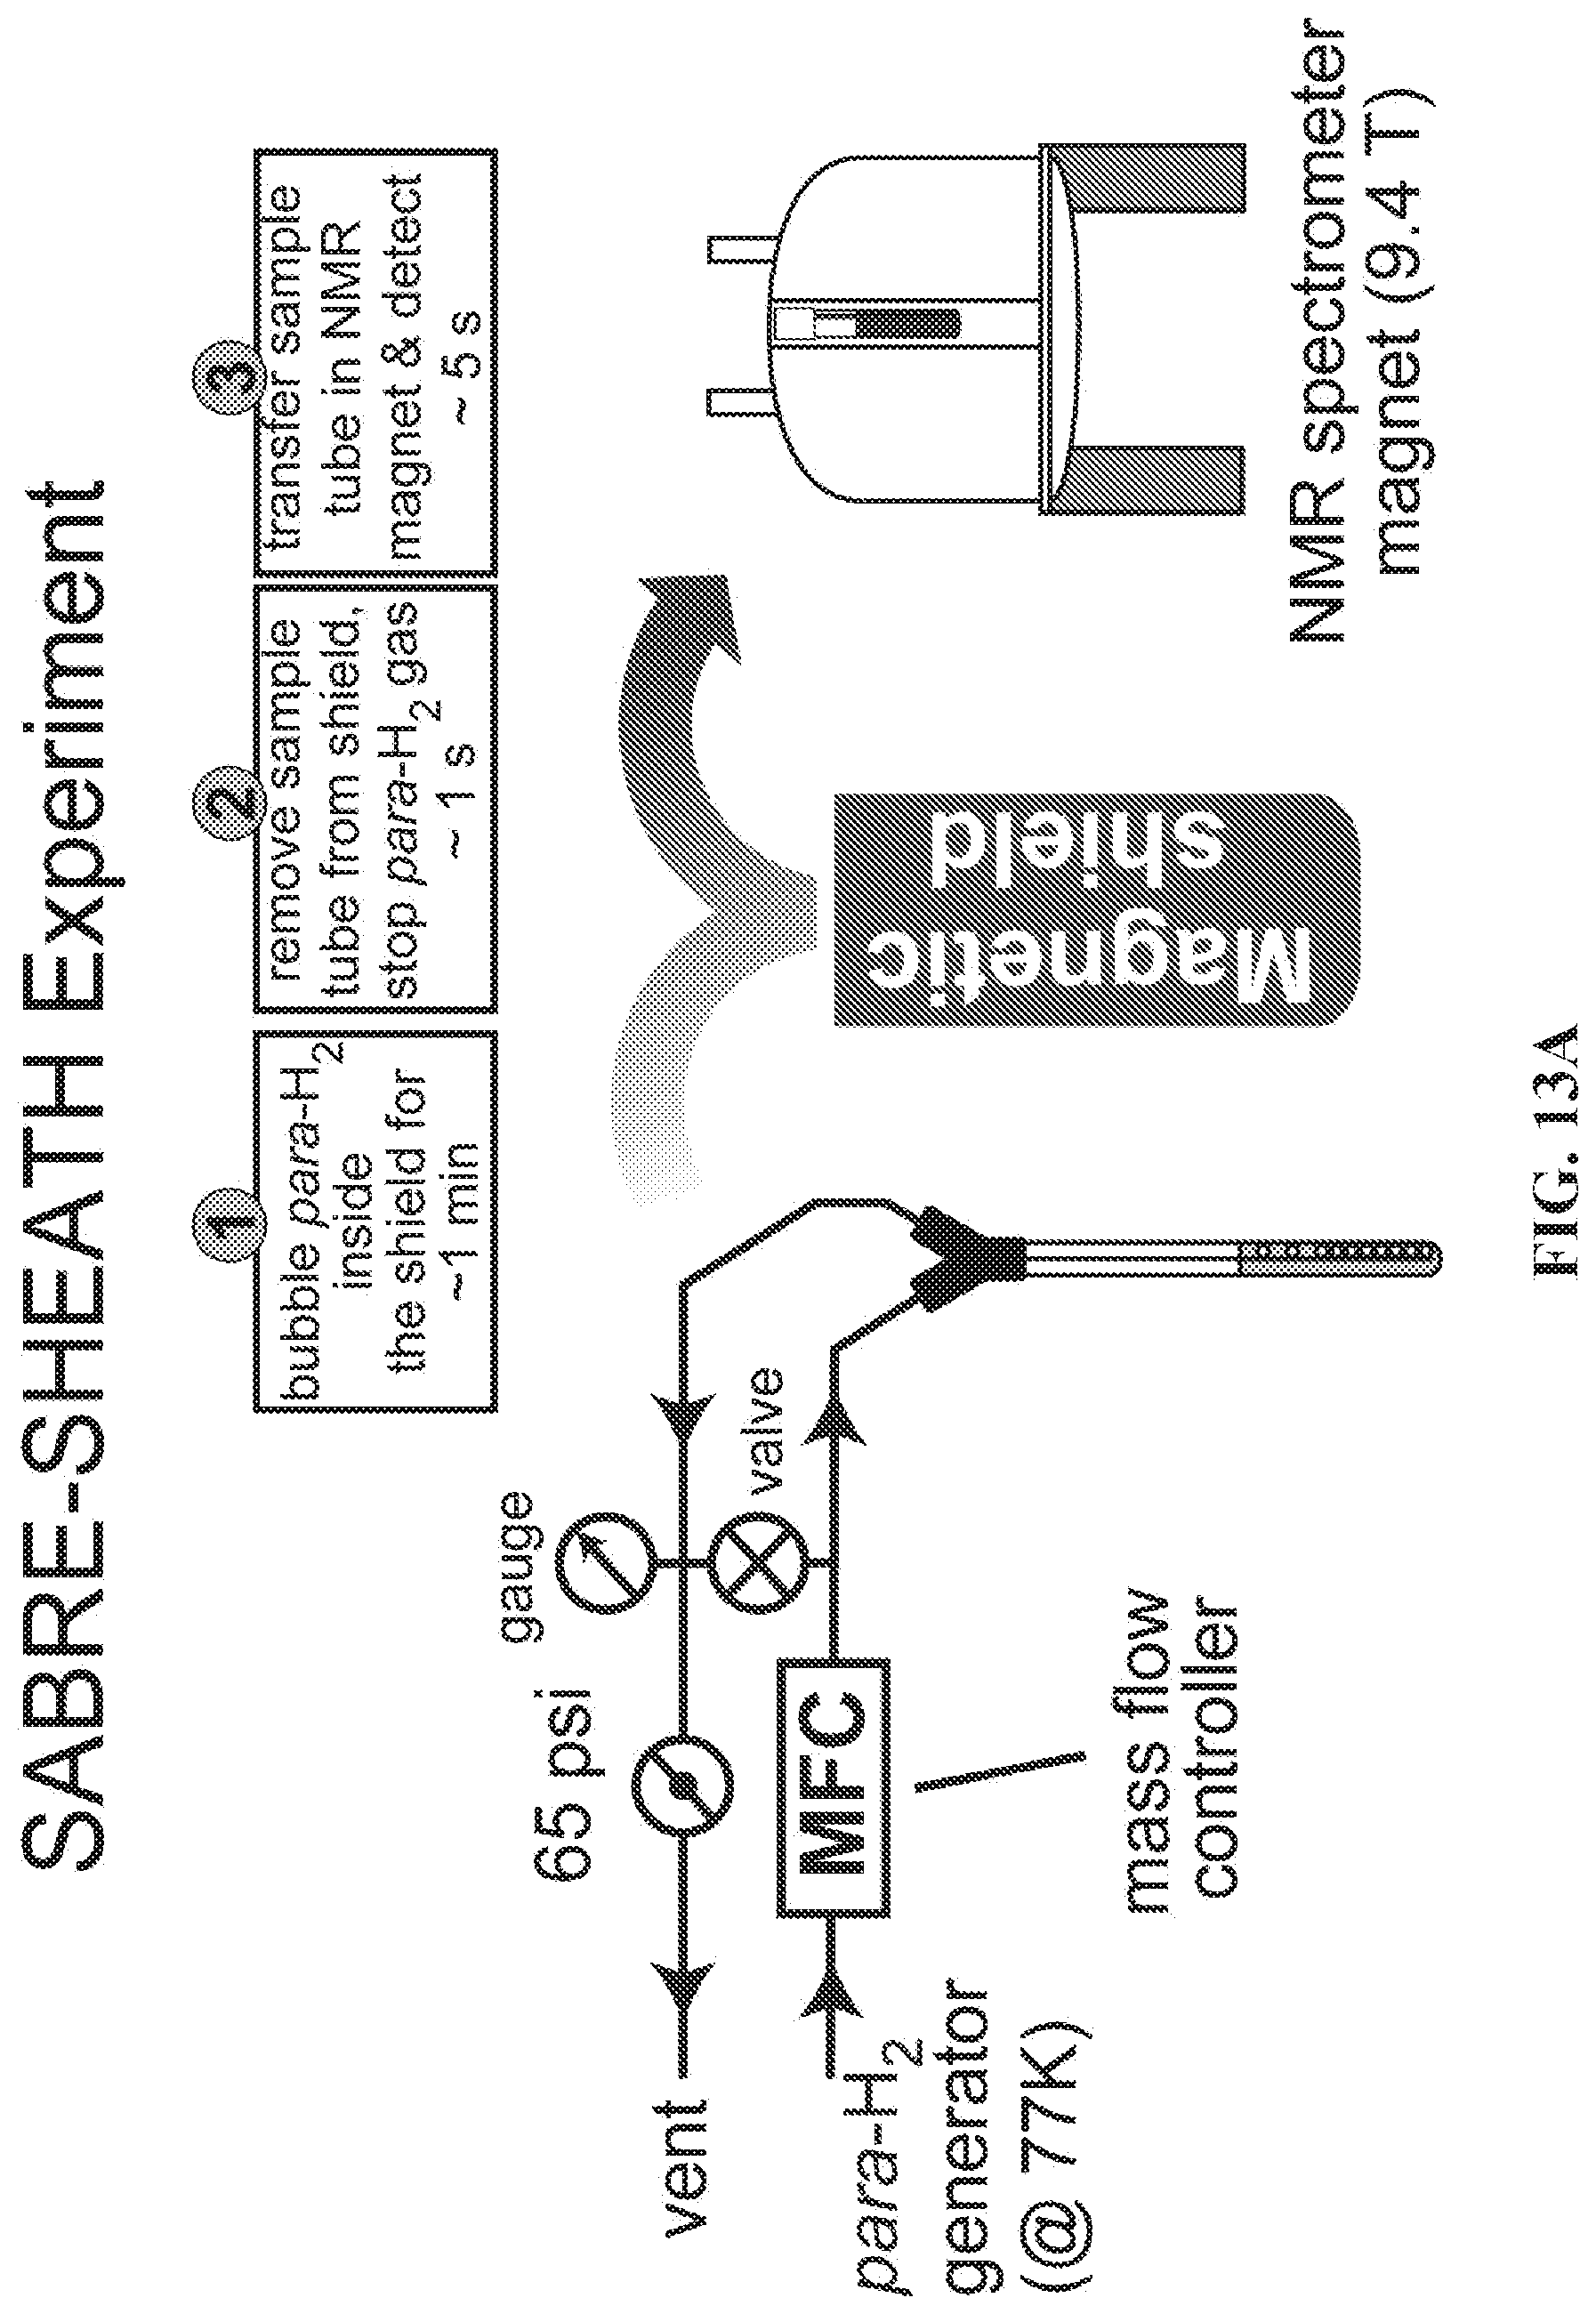
D00027

D00028
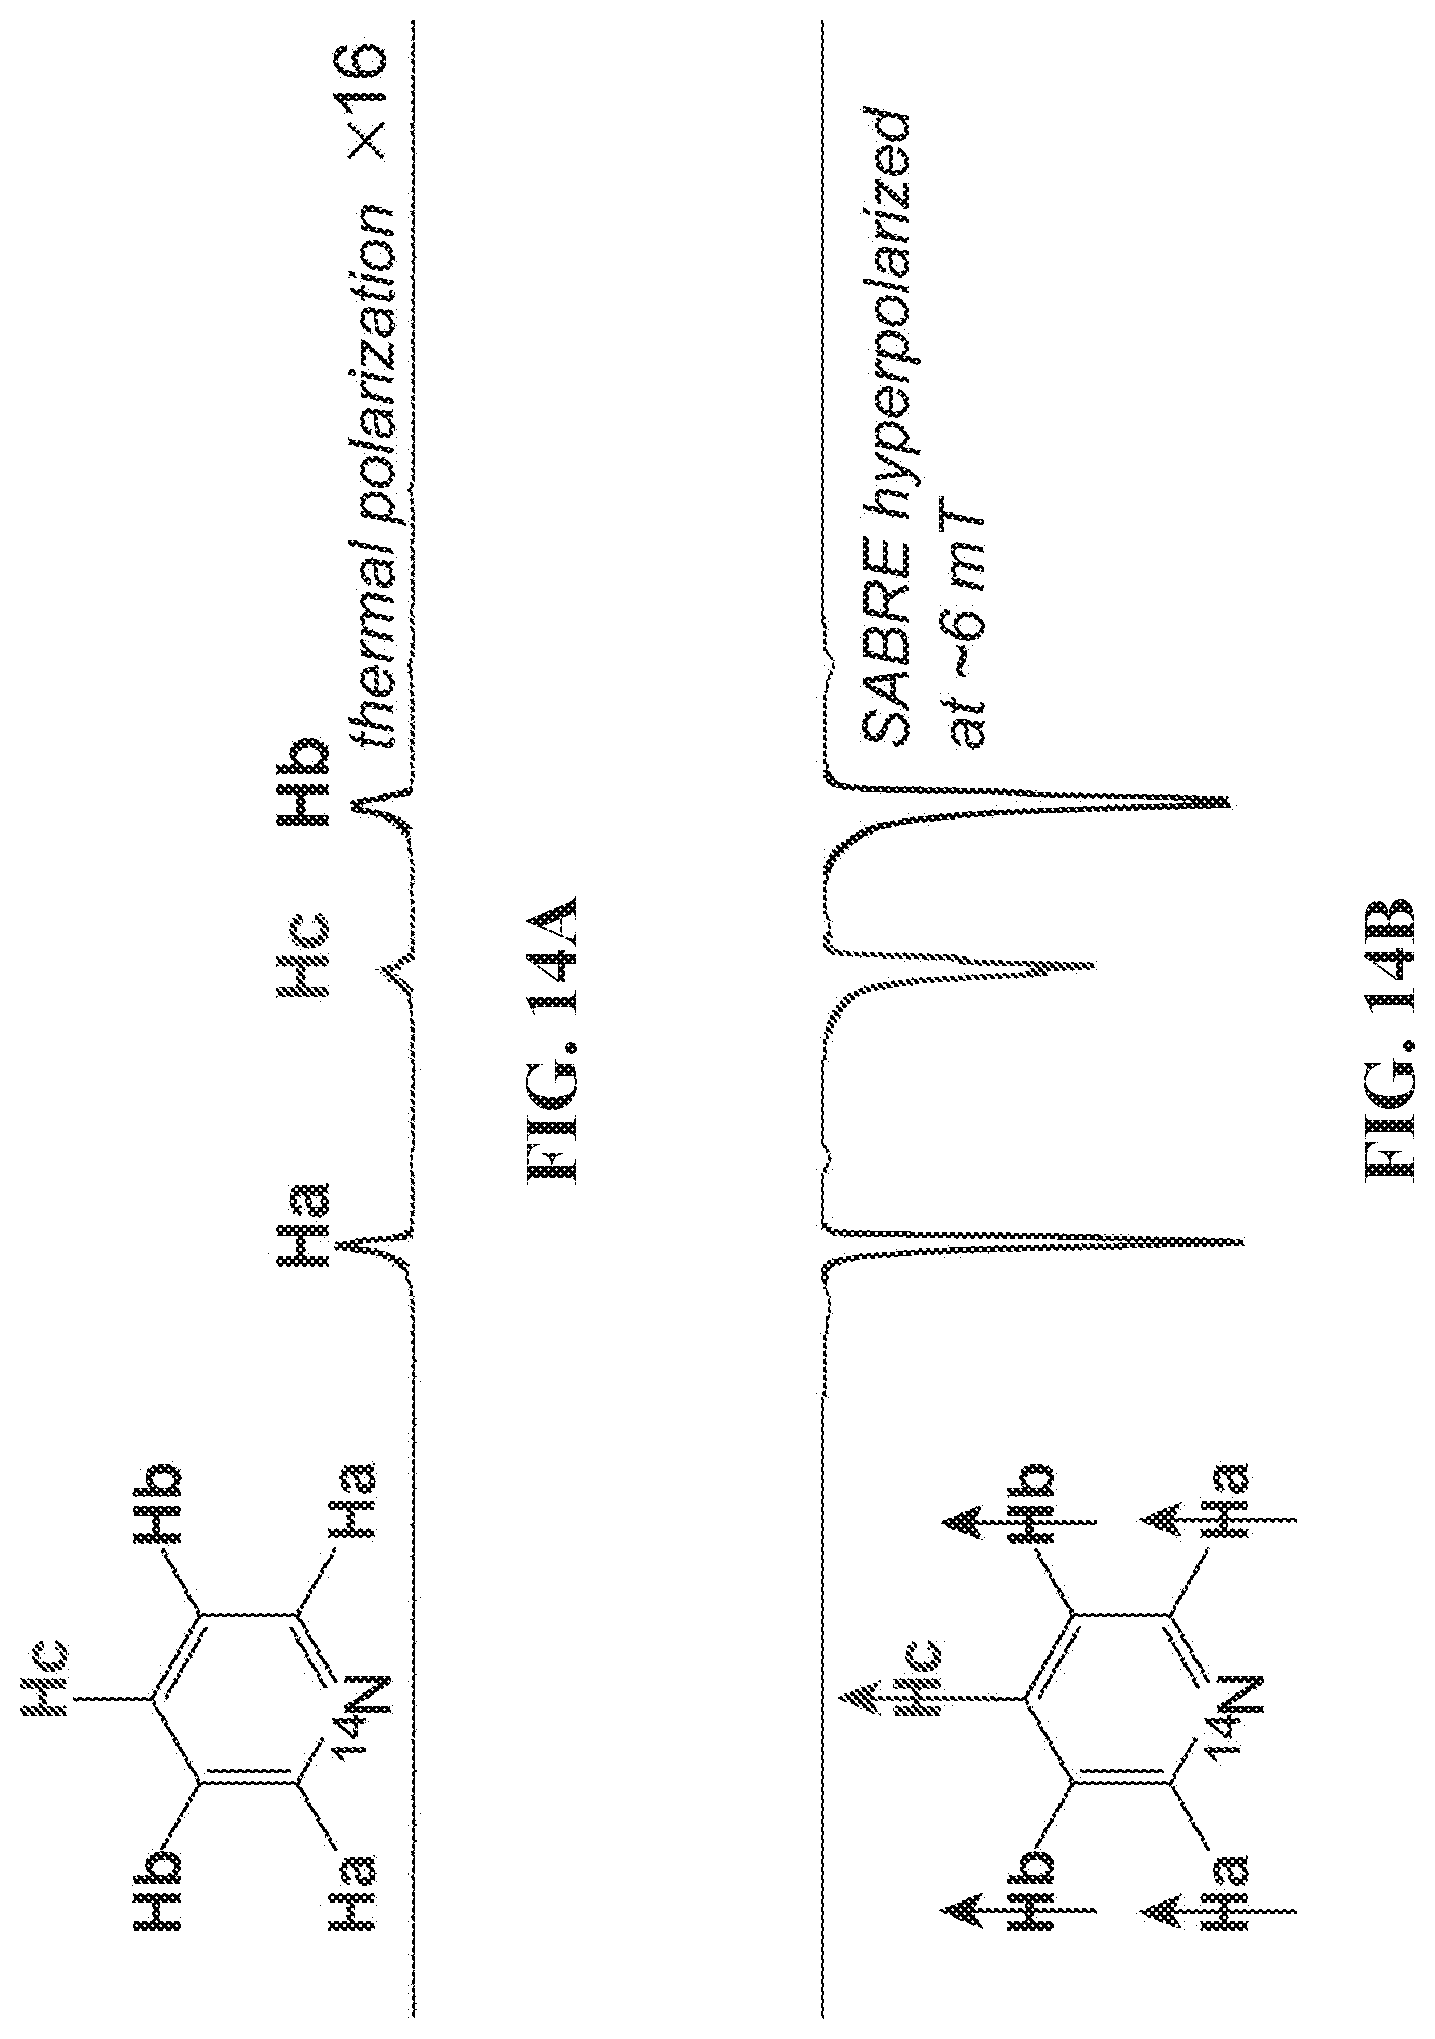
D00029
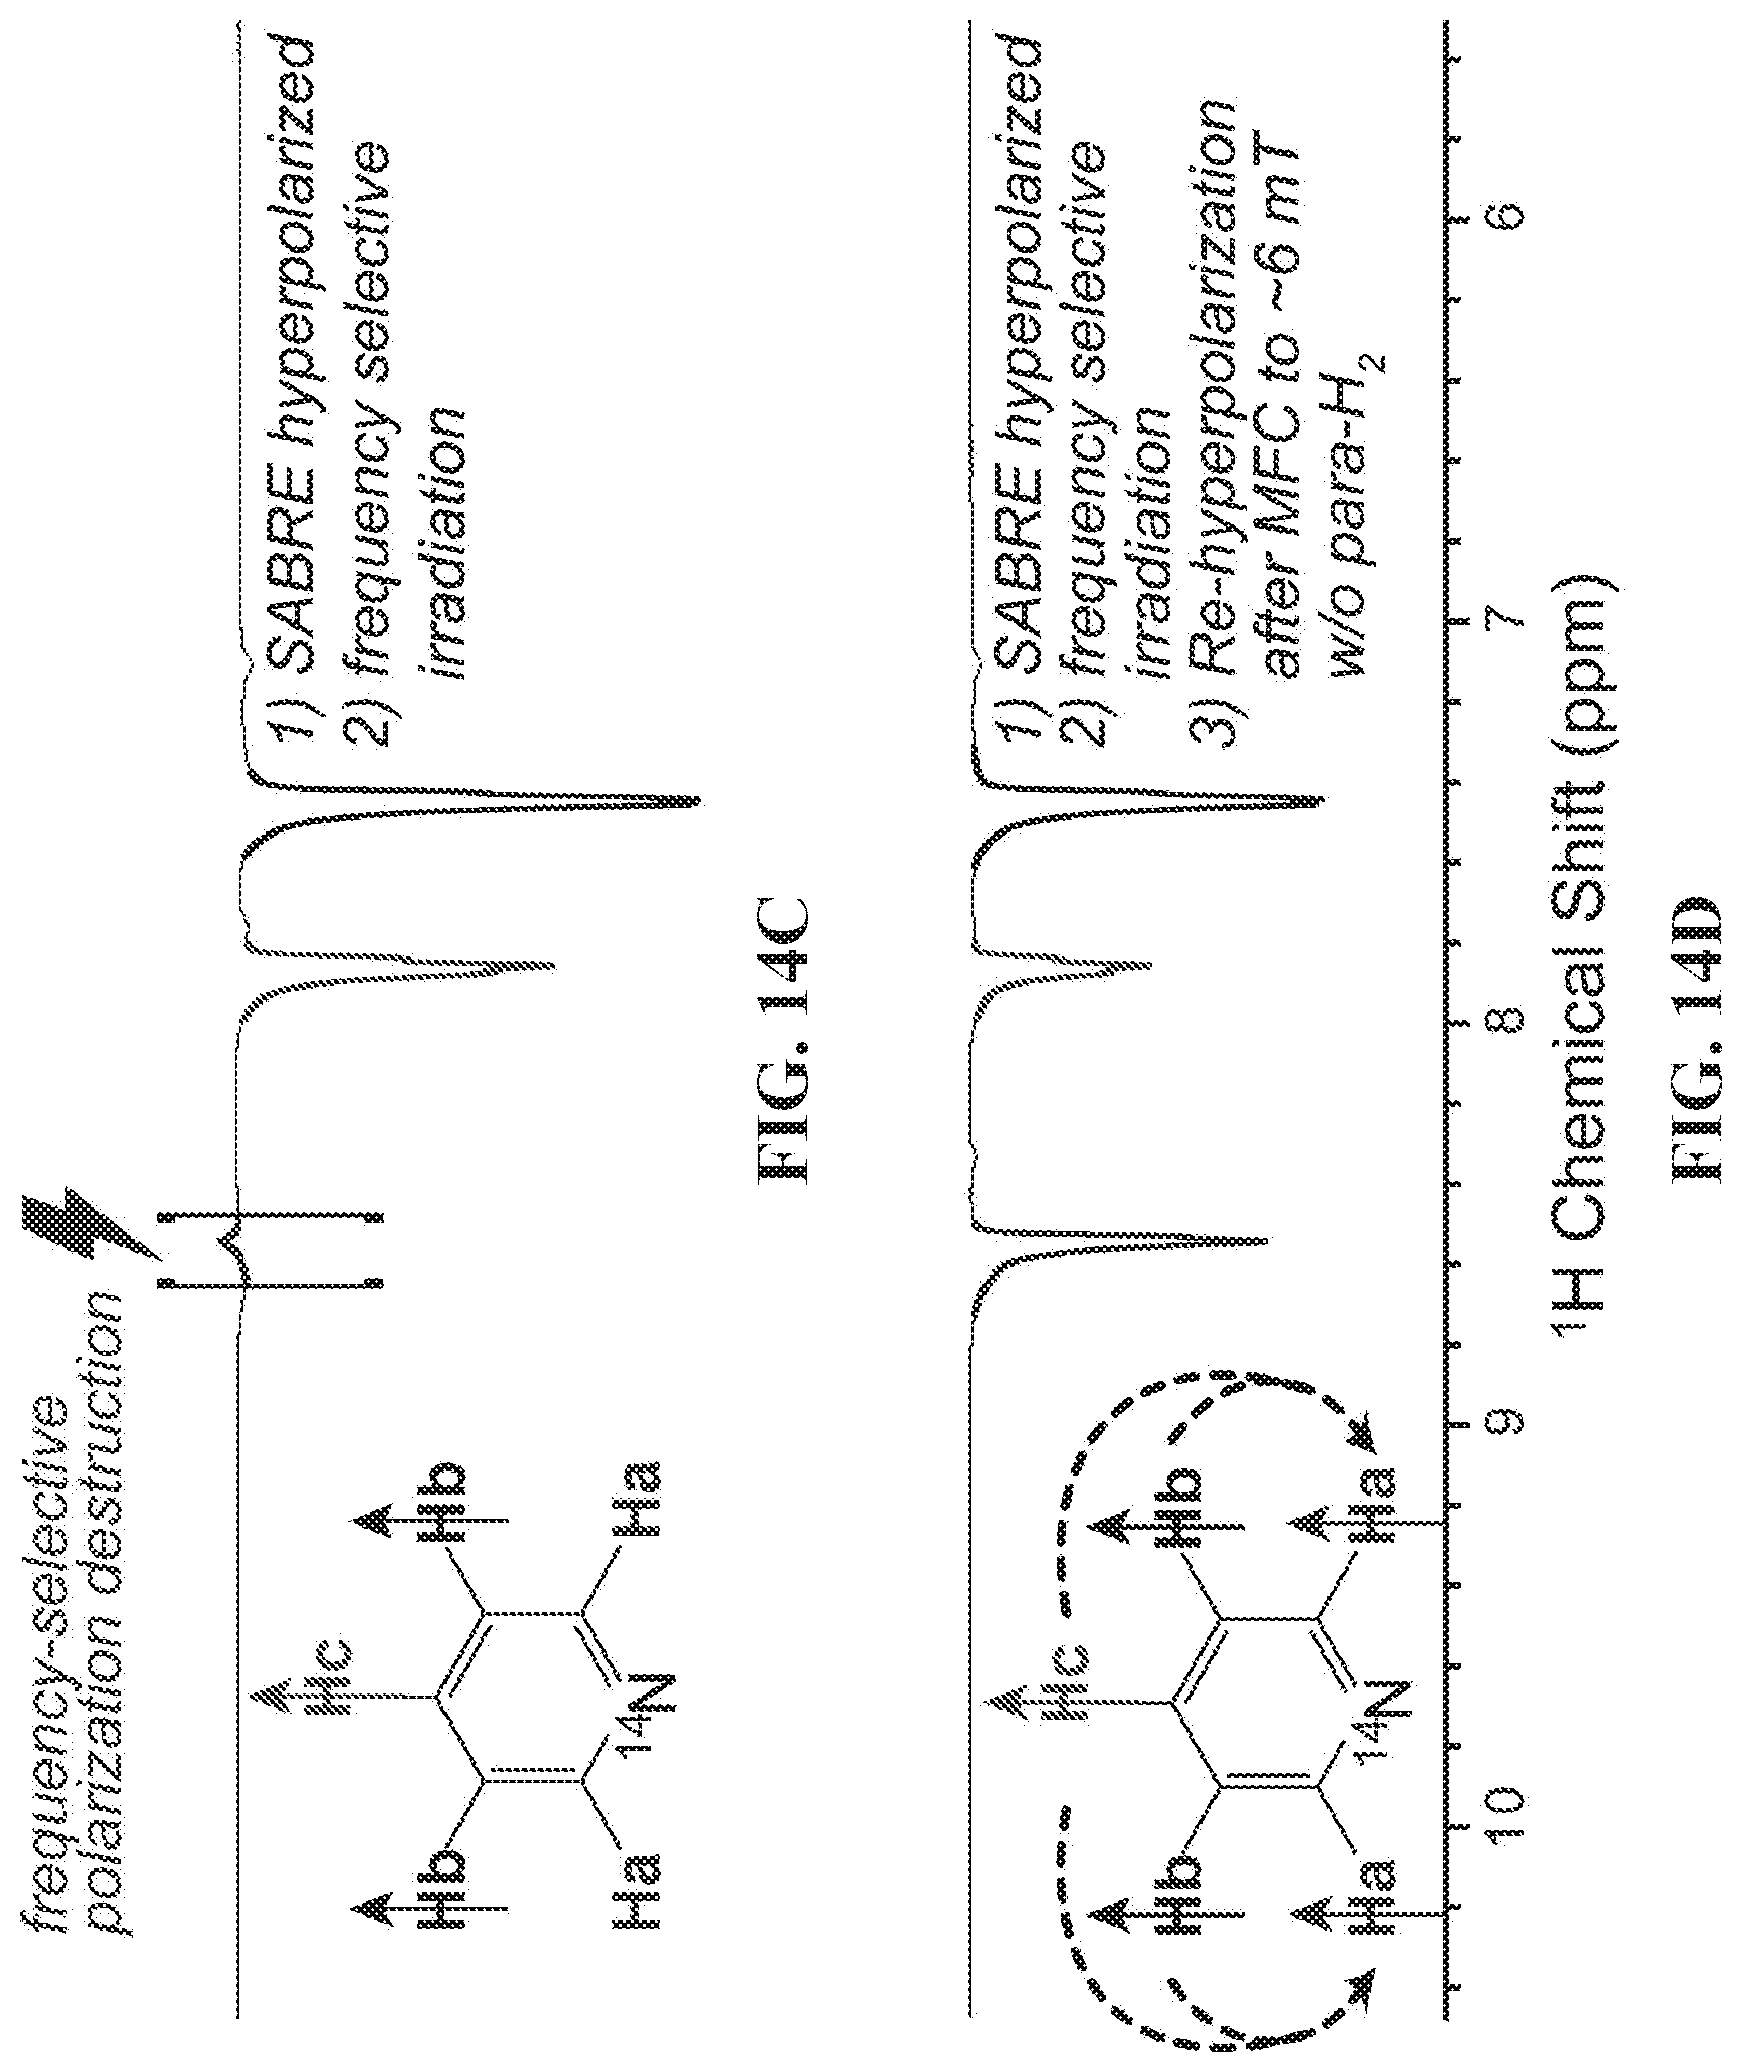
D00030
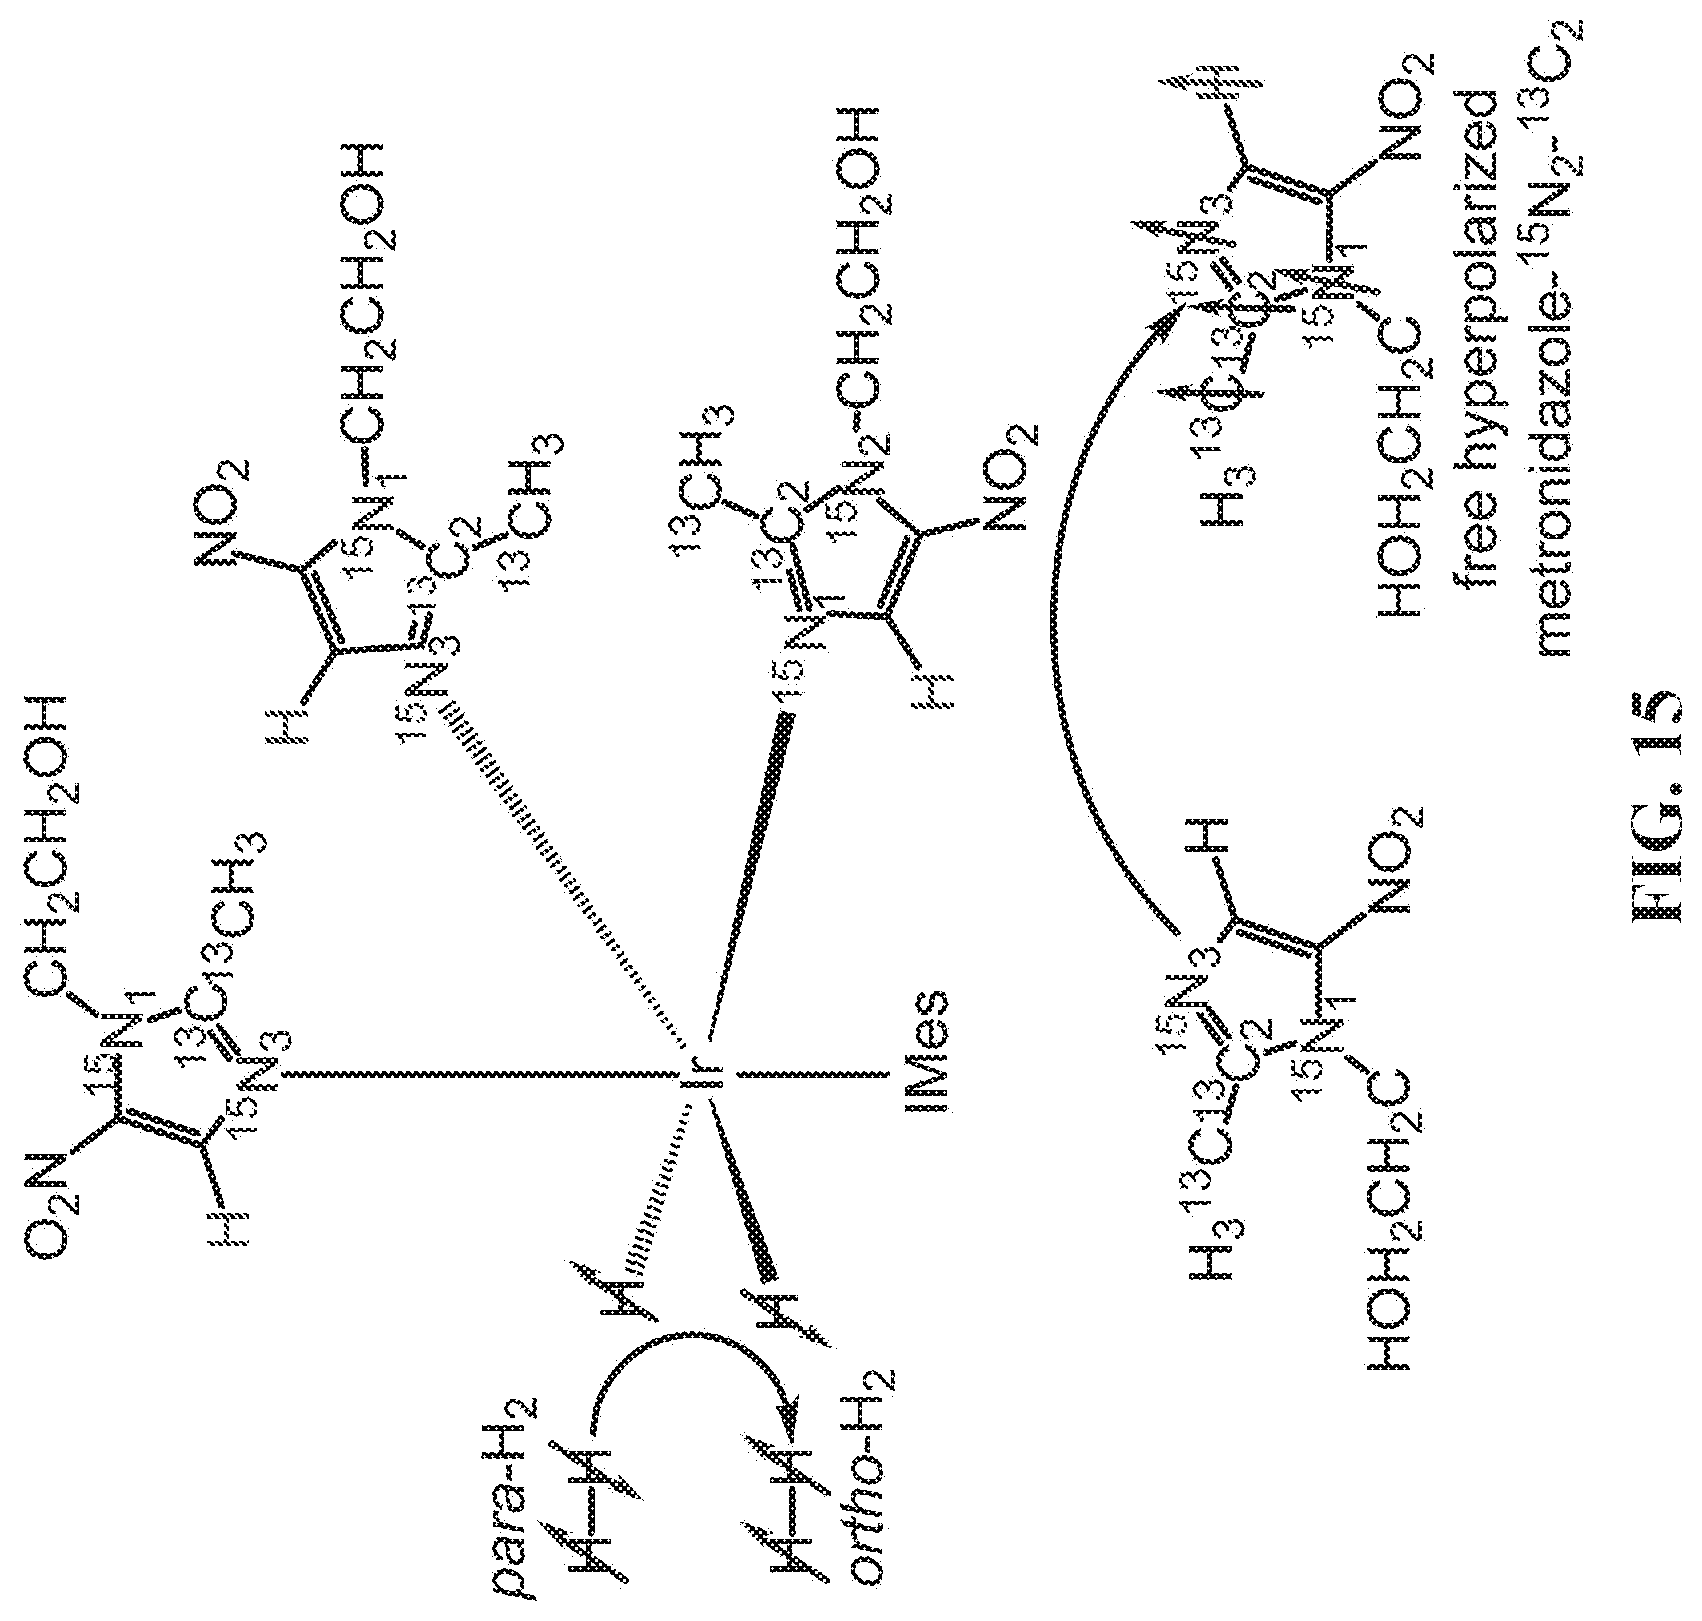
D00031
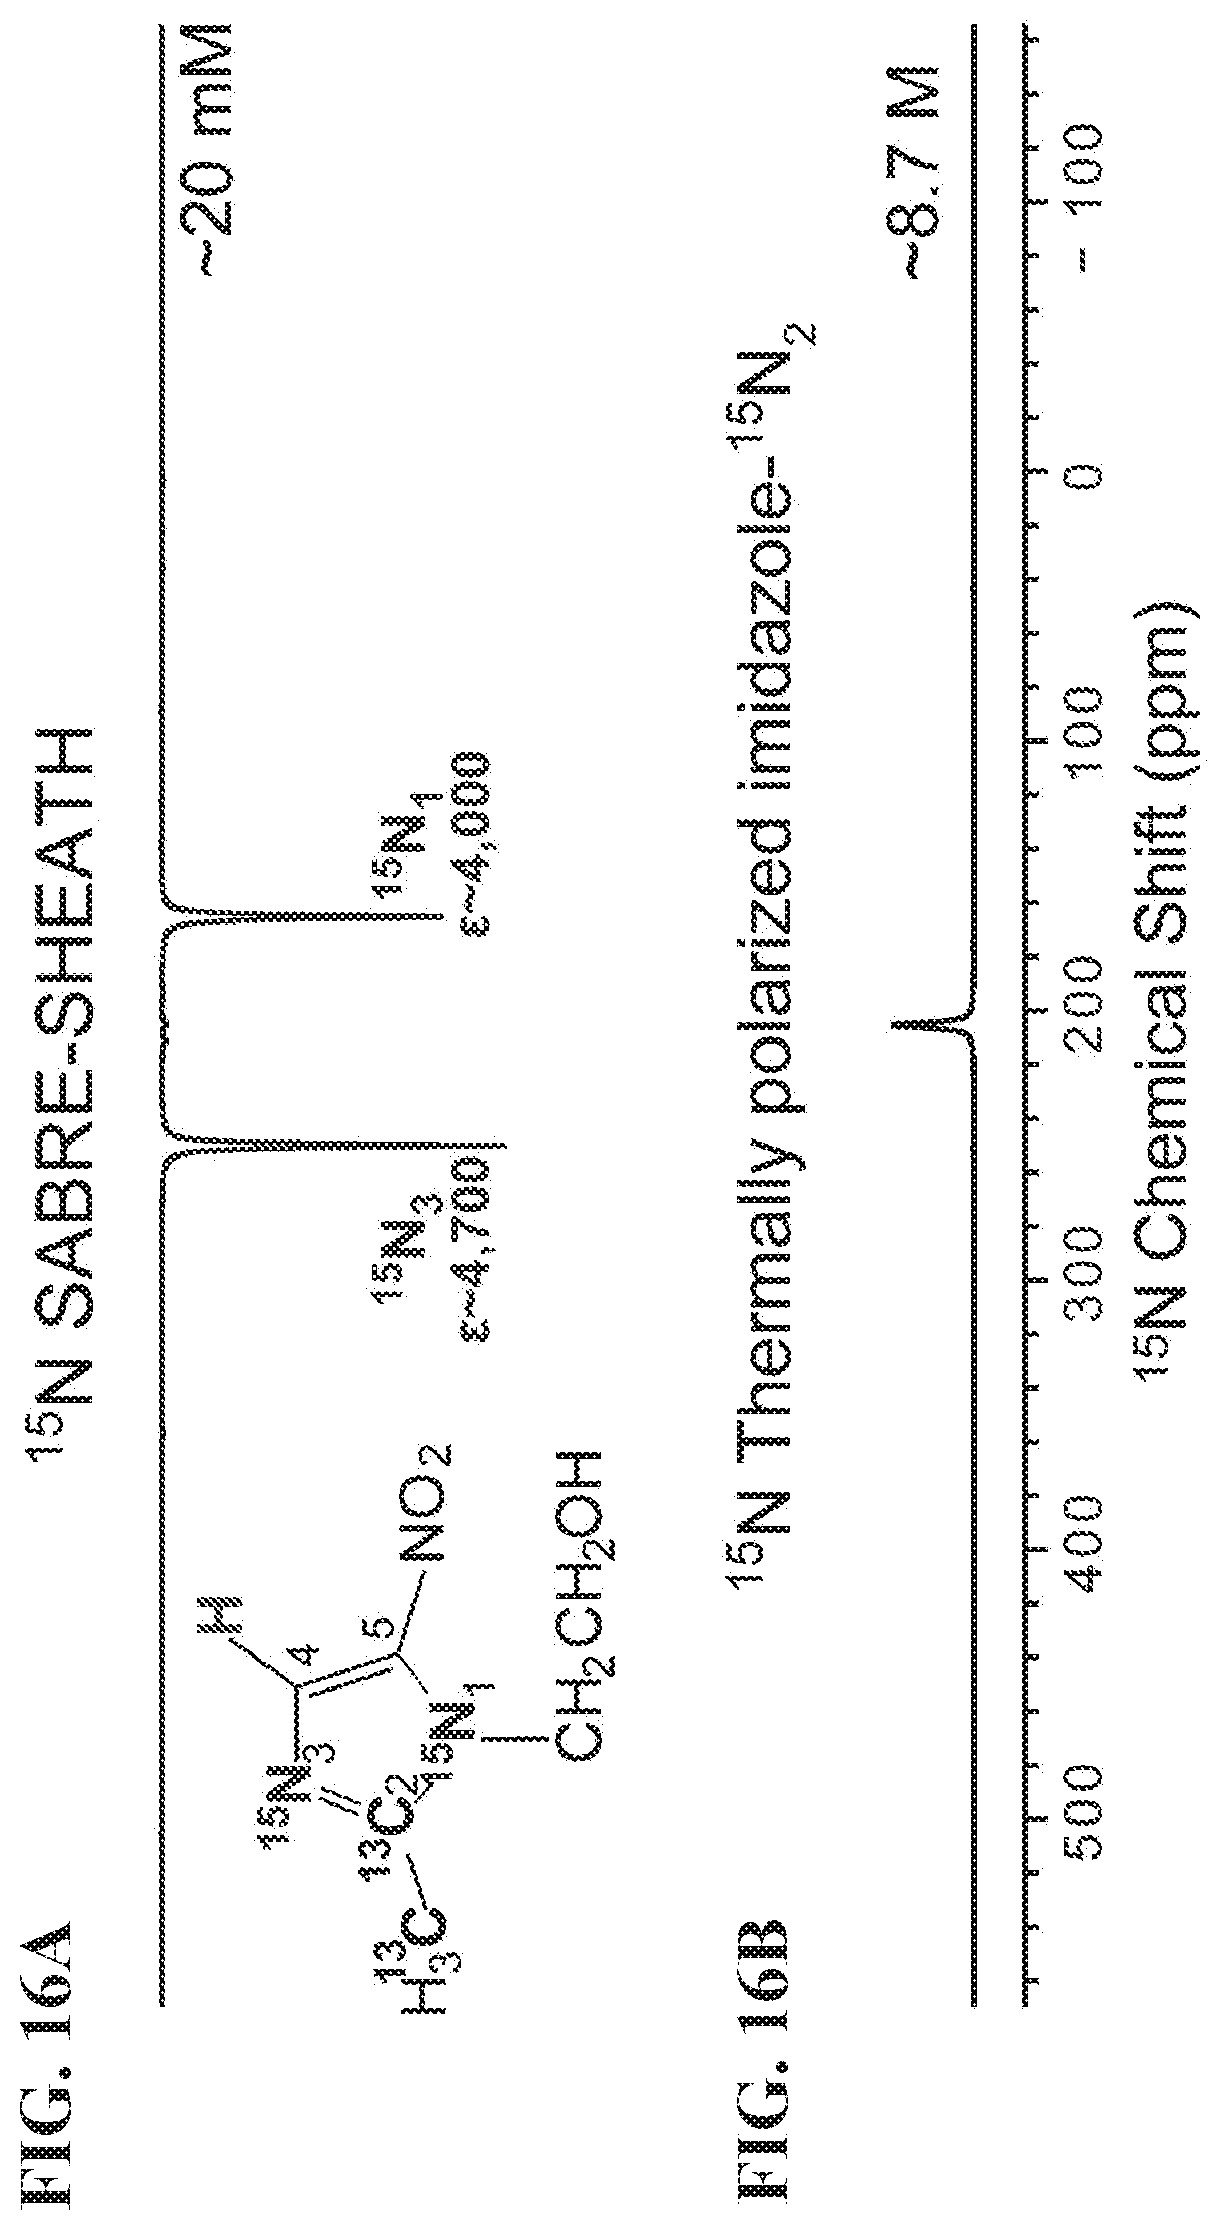
D00032
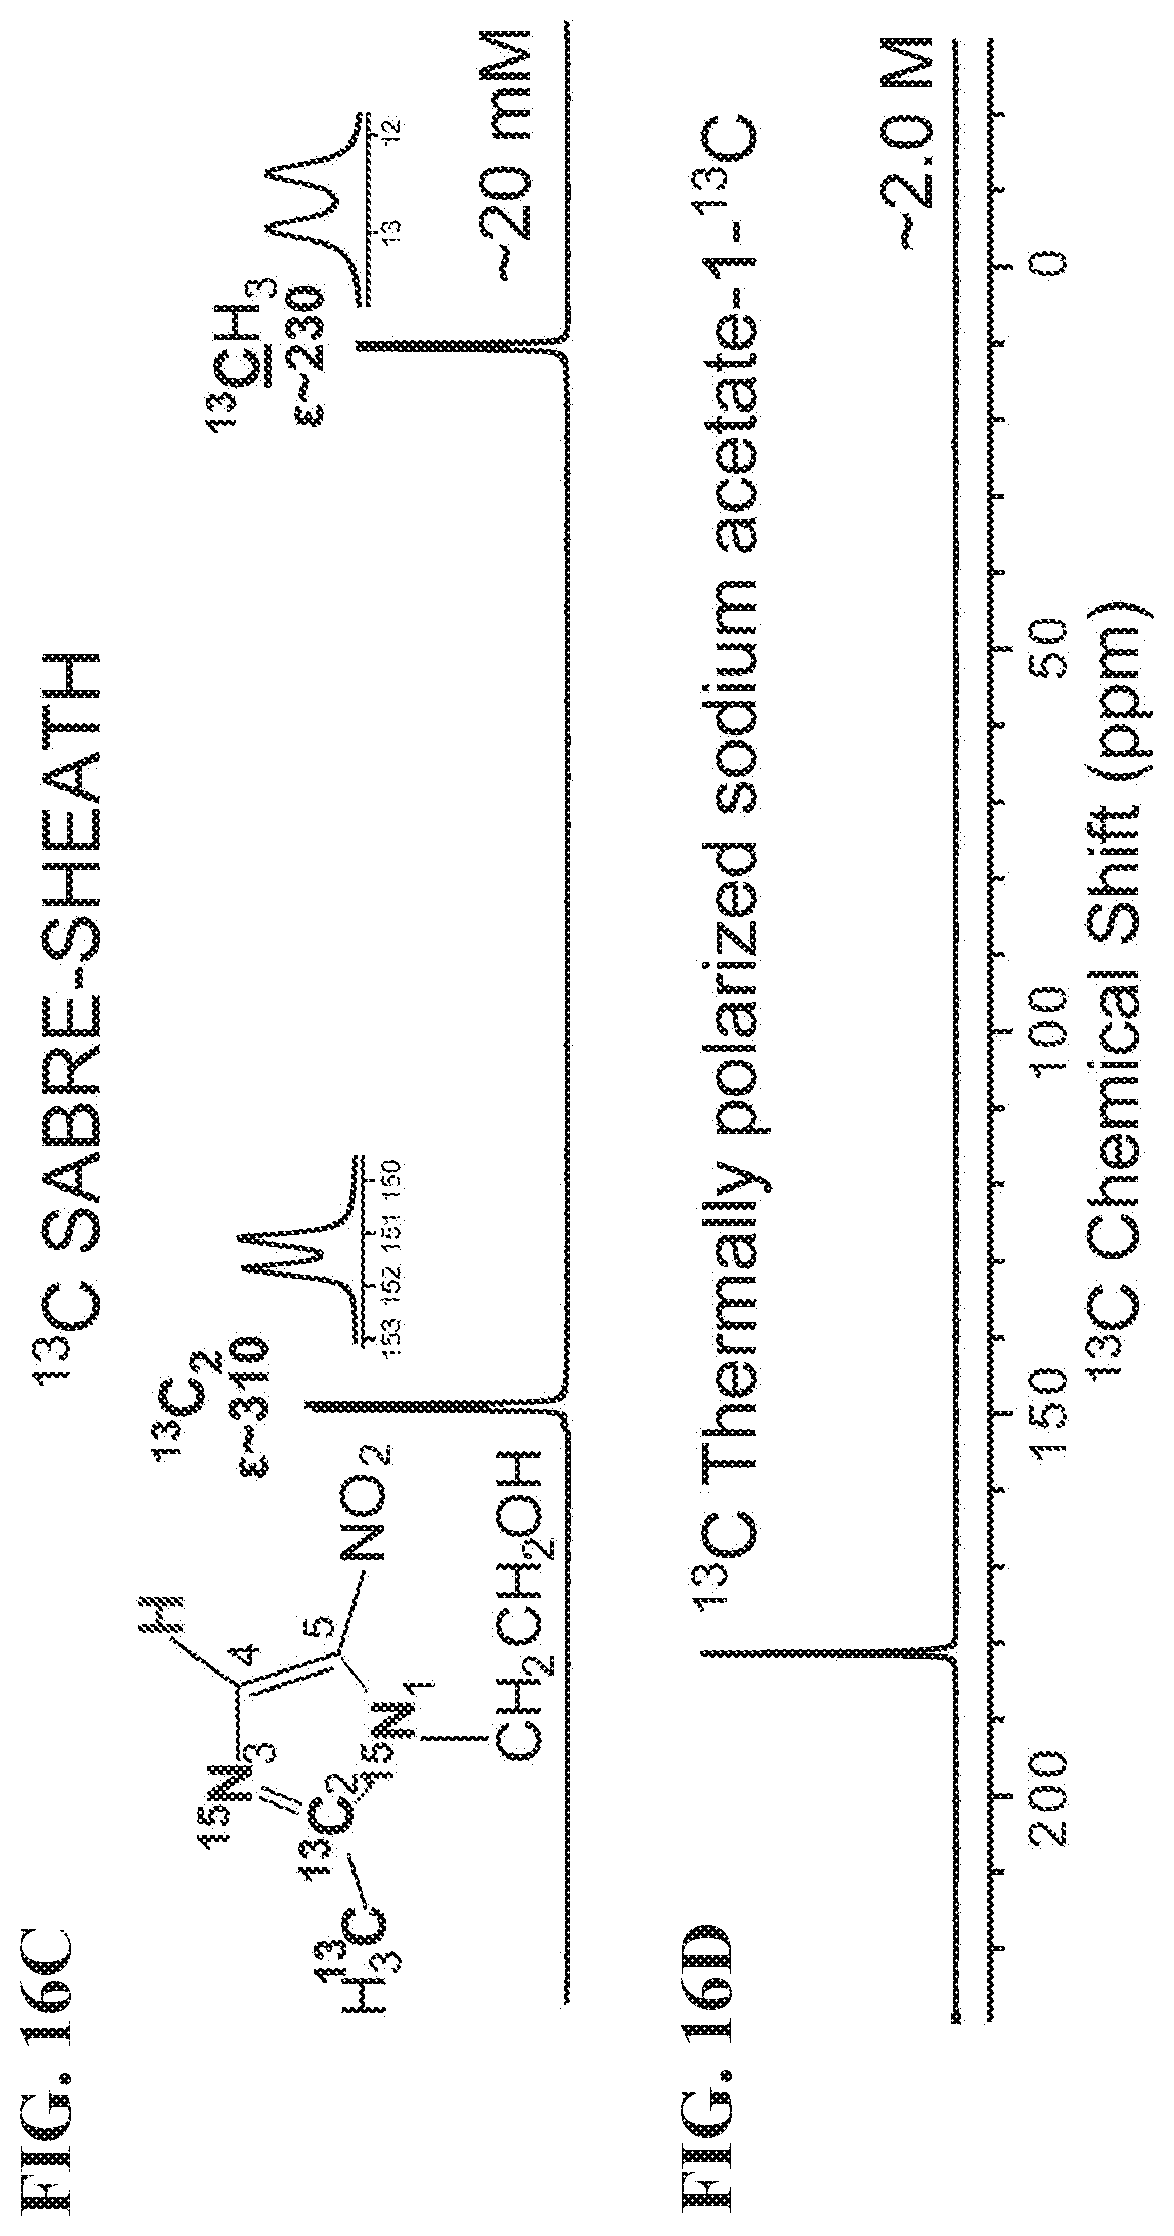
D00033
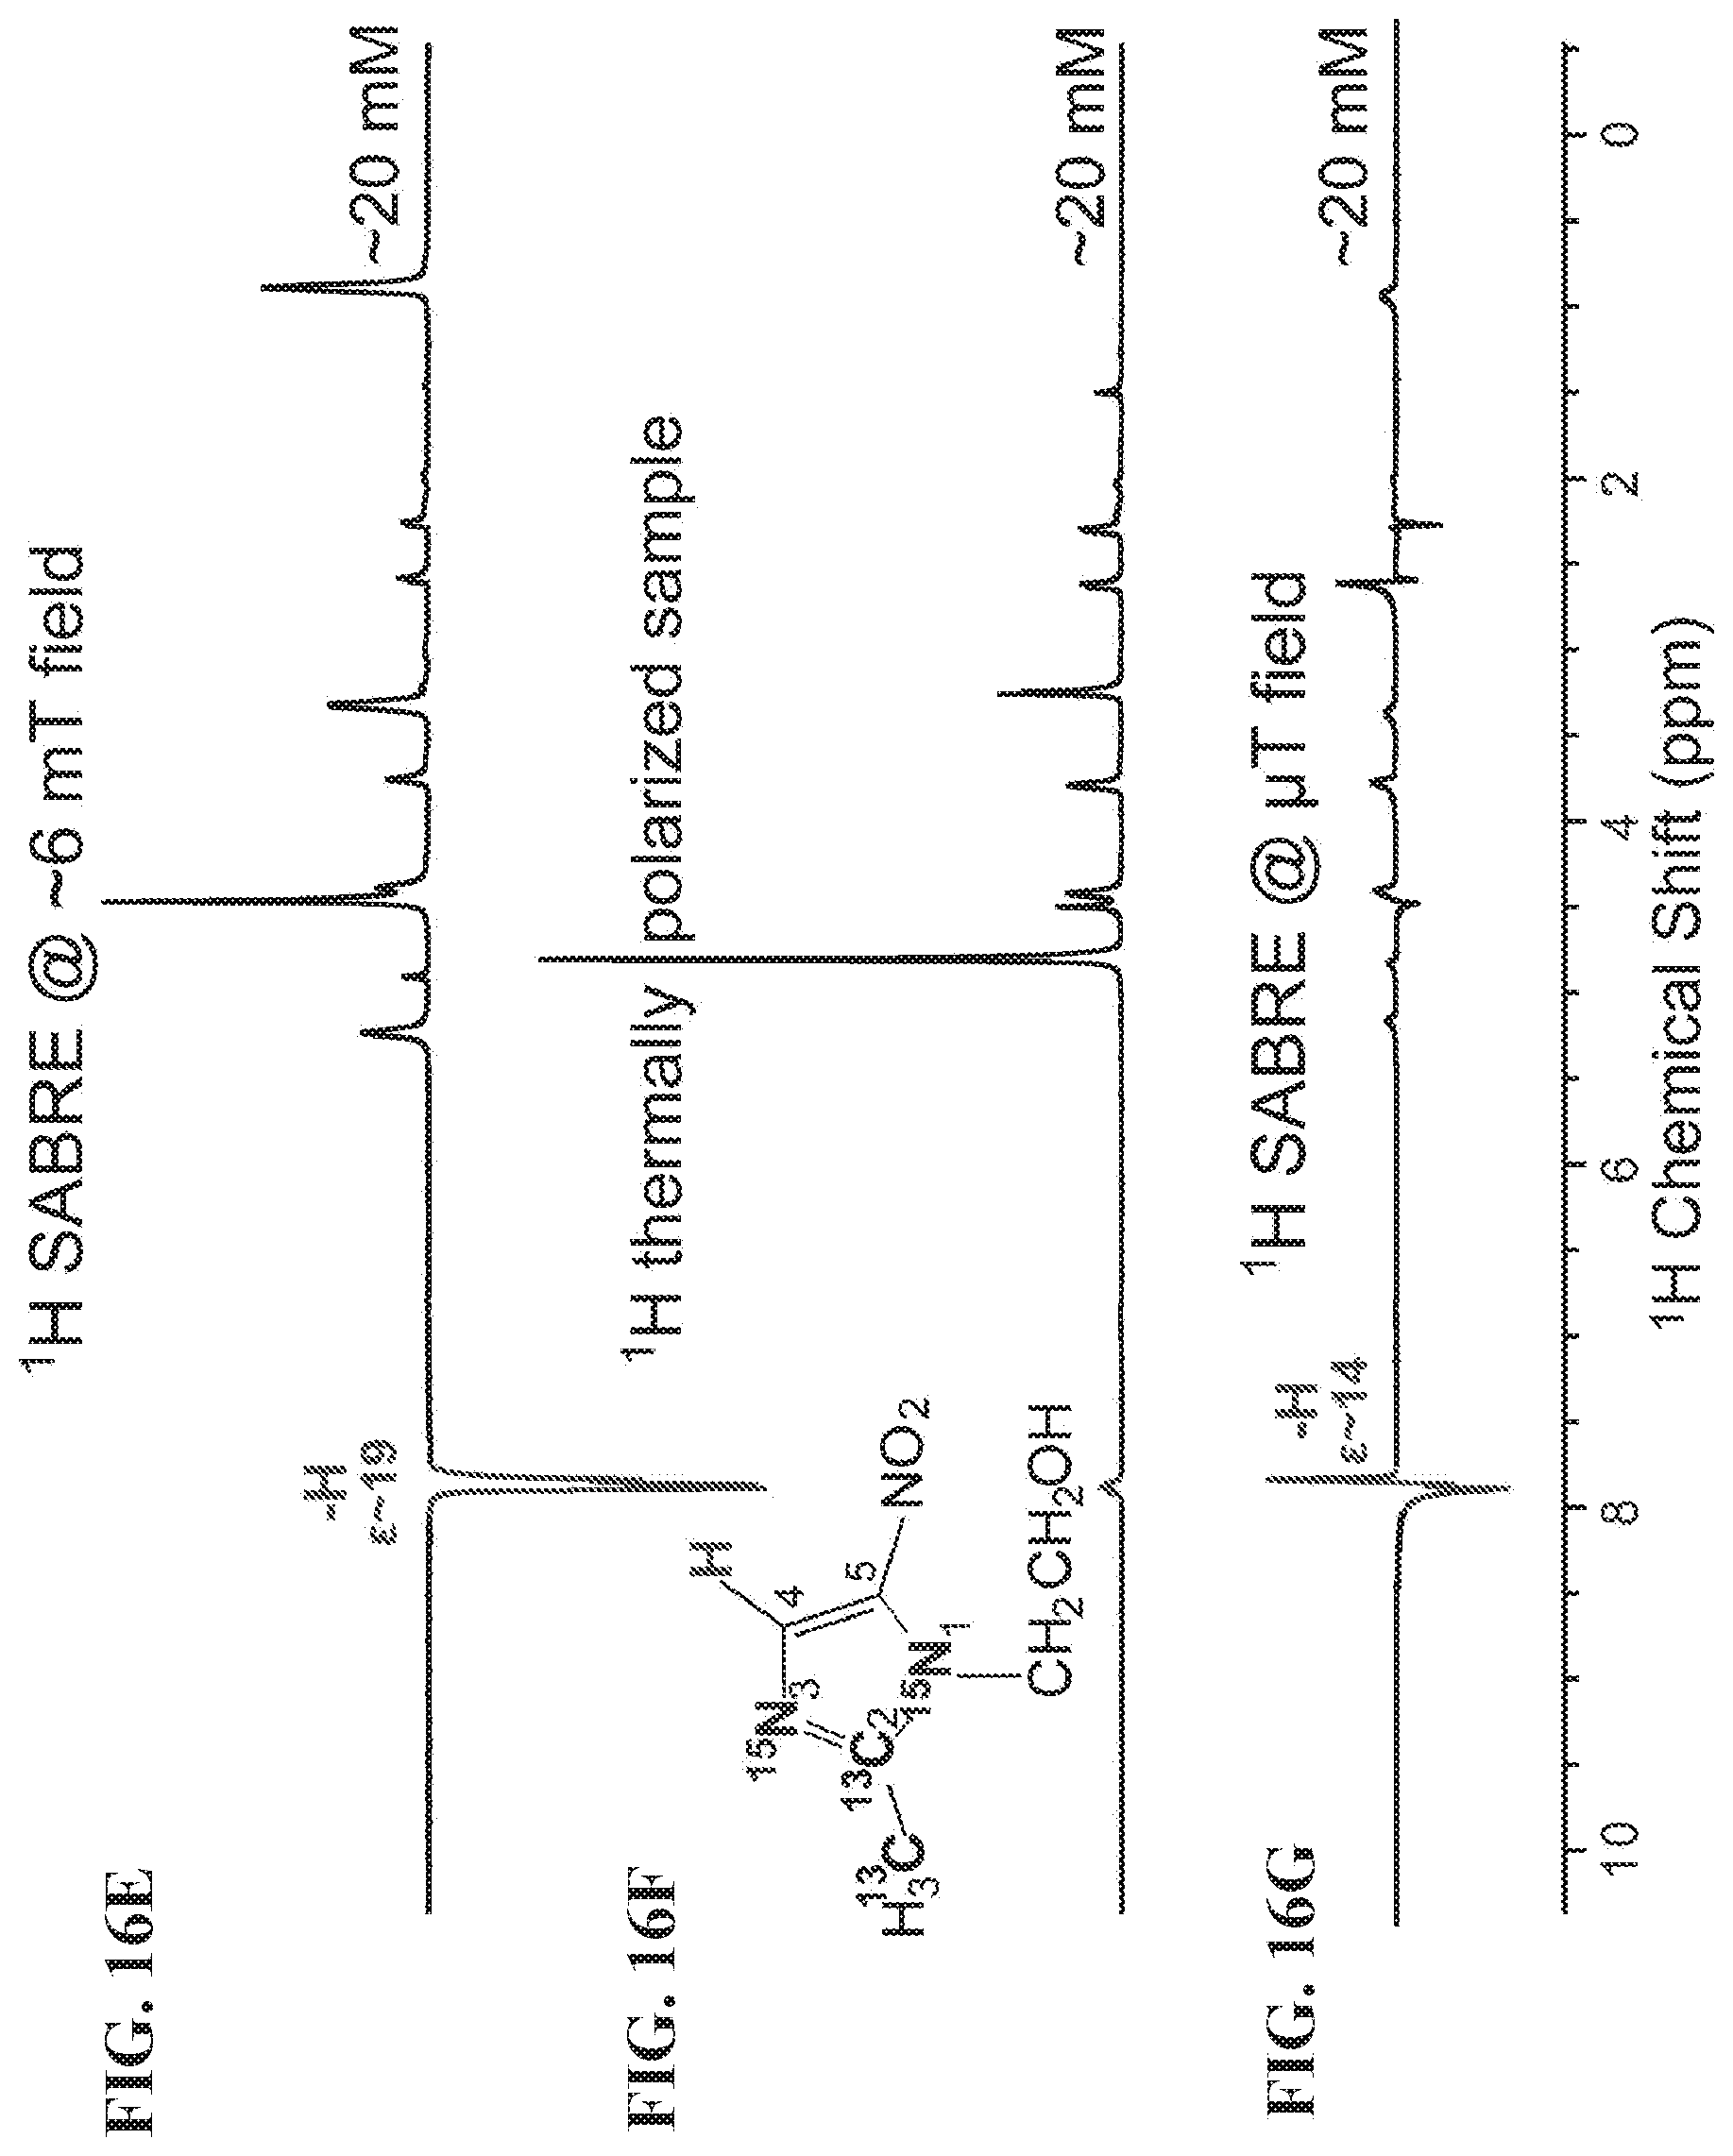
D00034
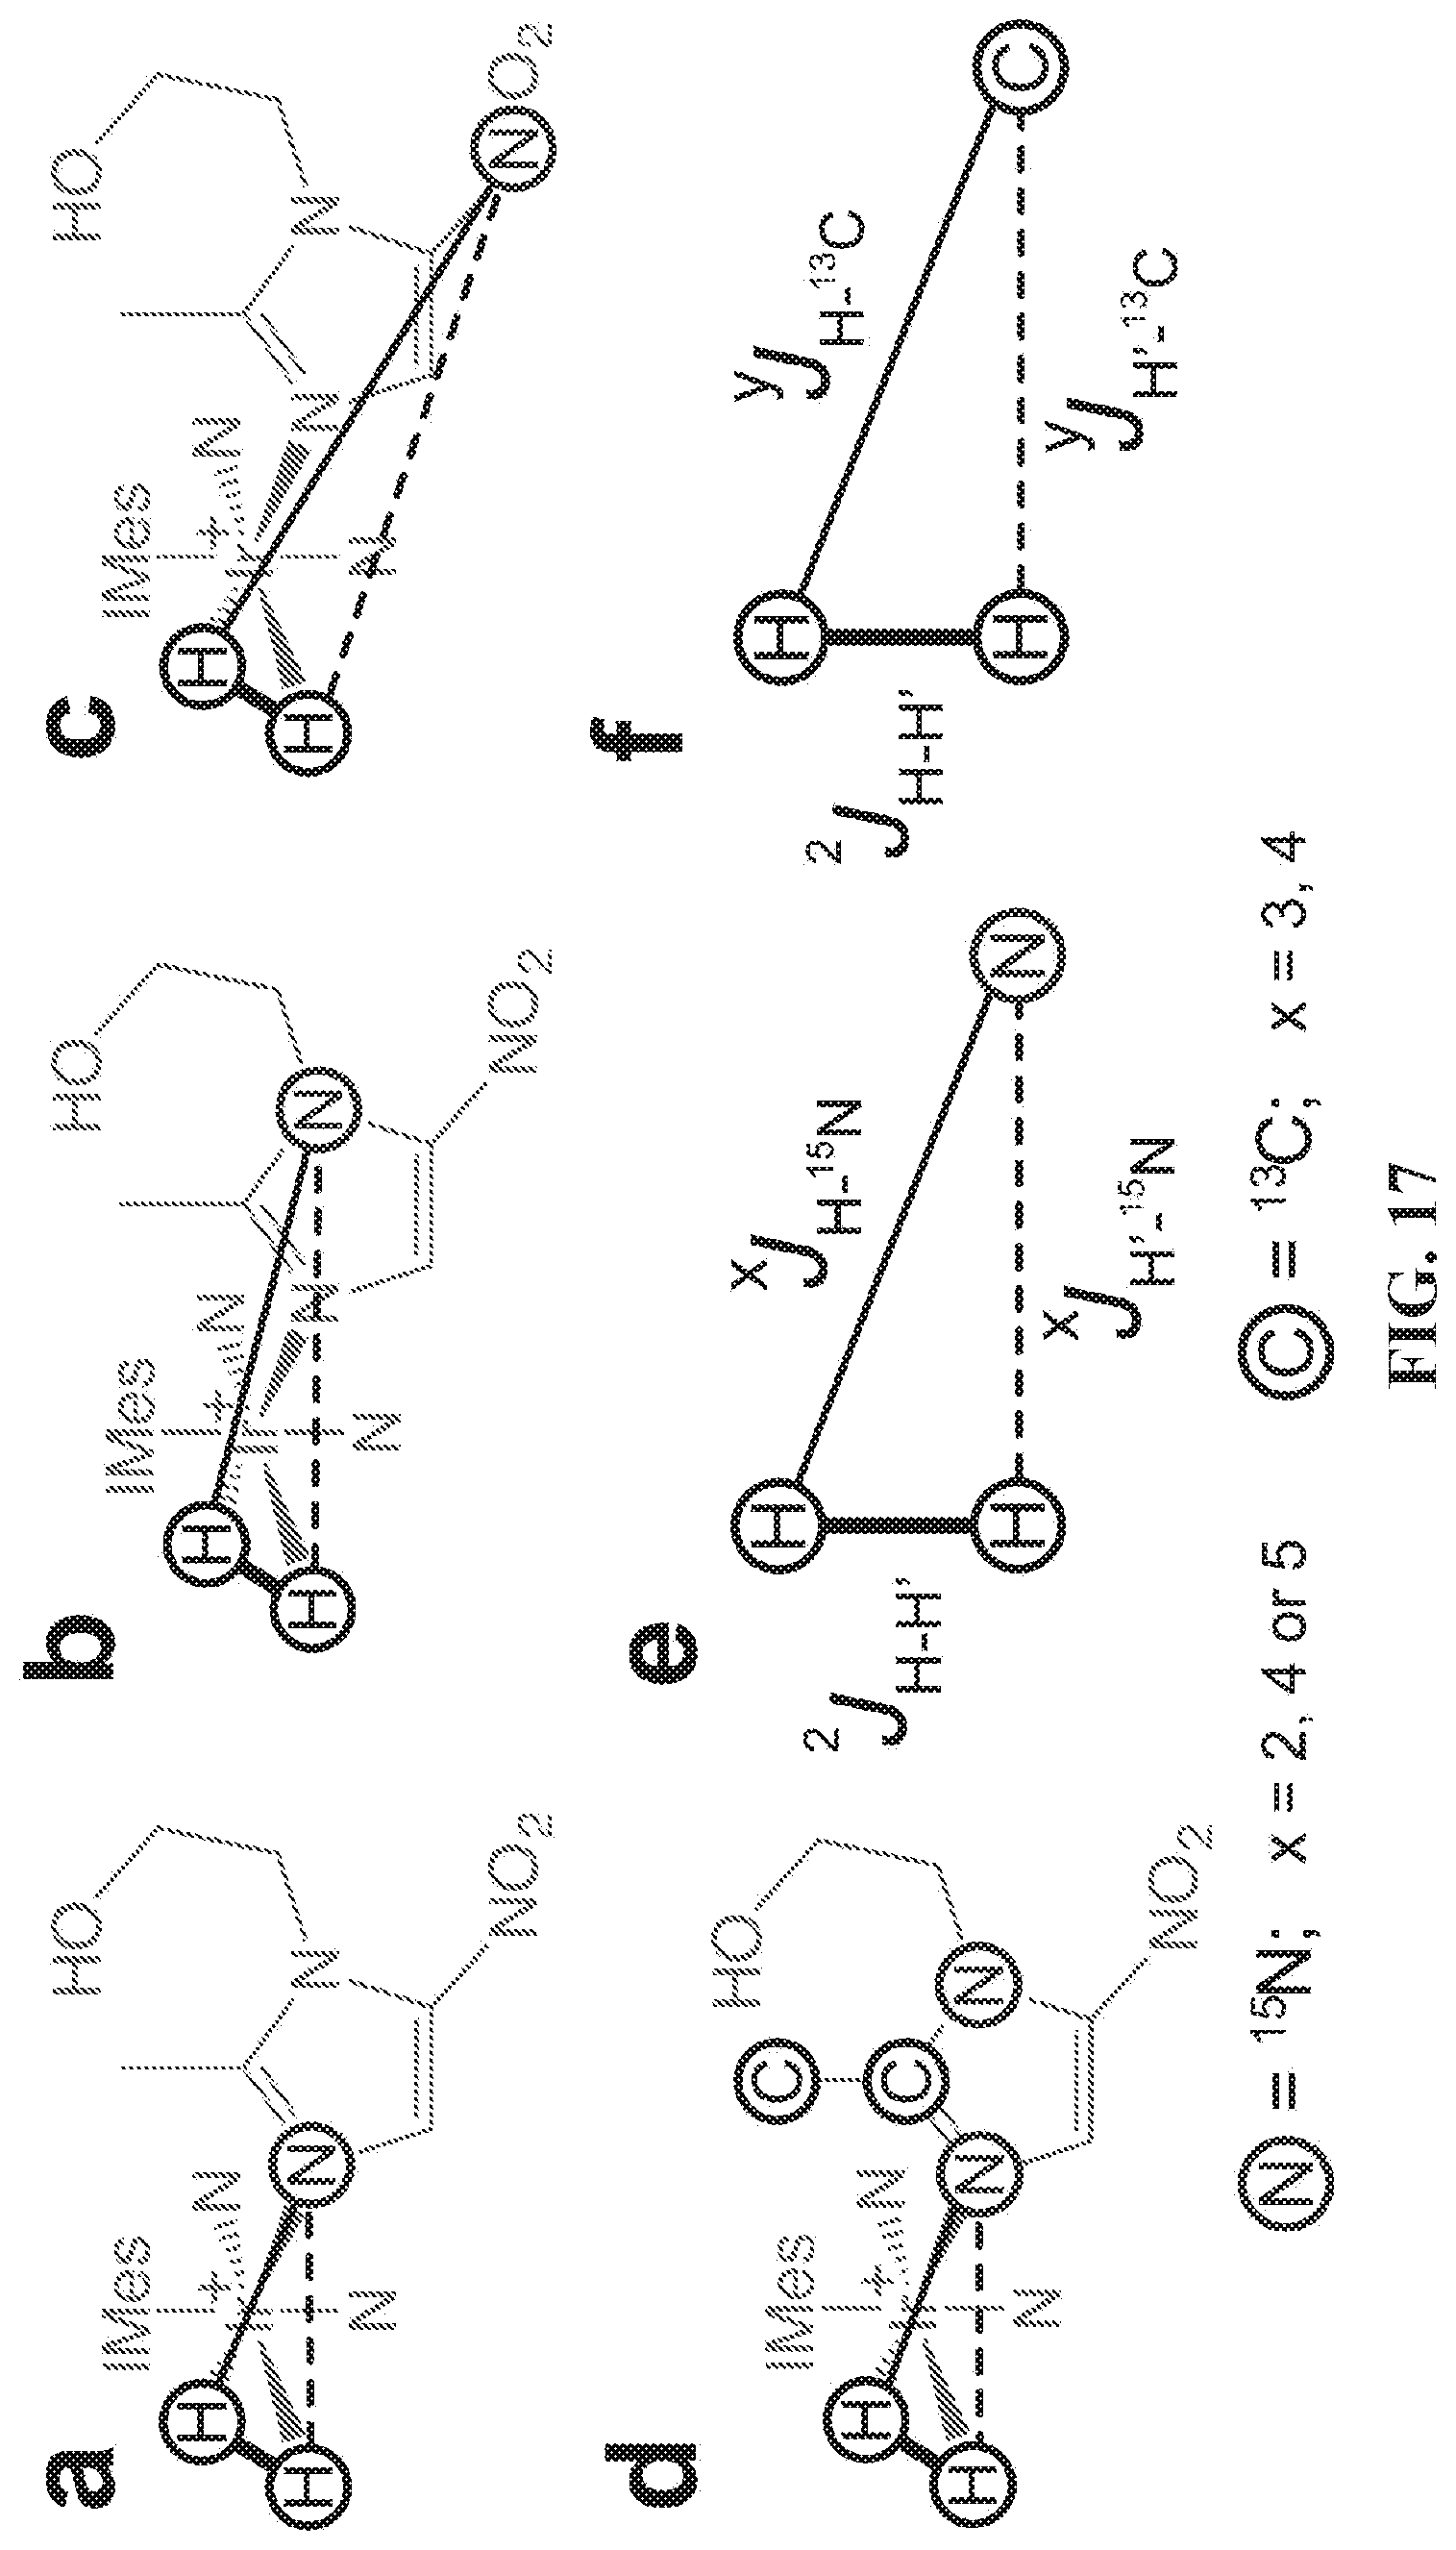
D00035
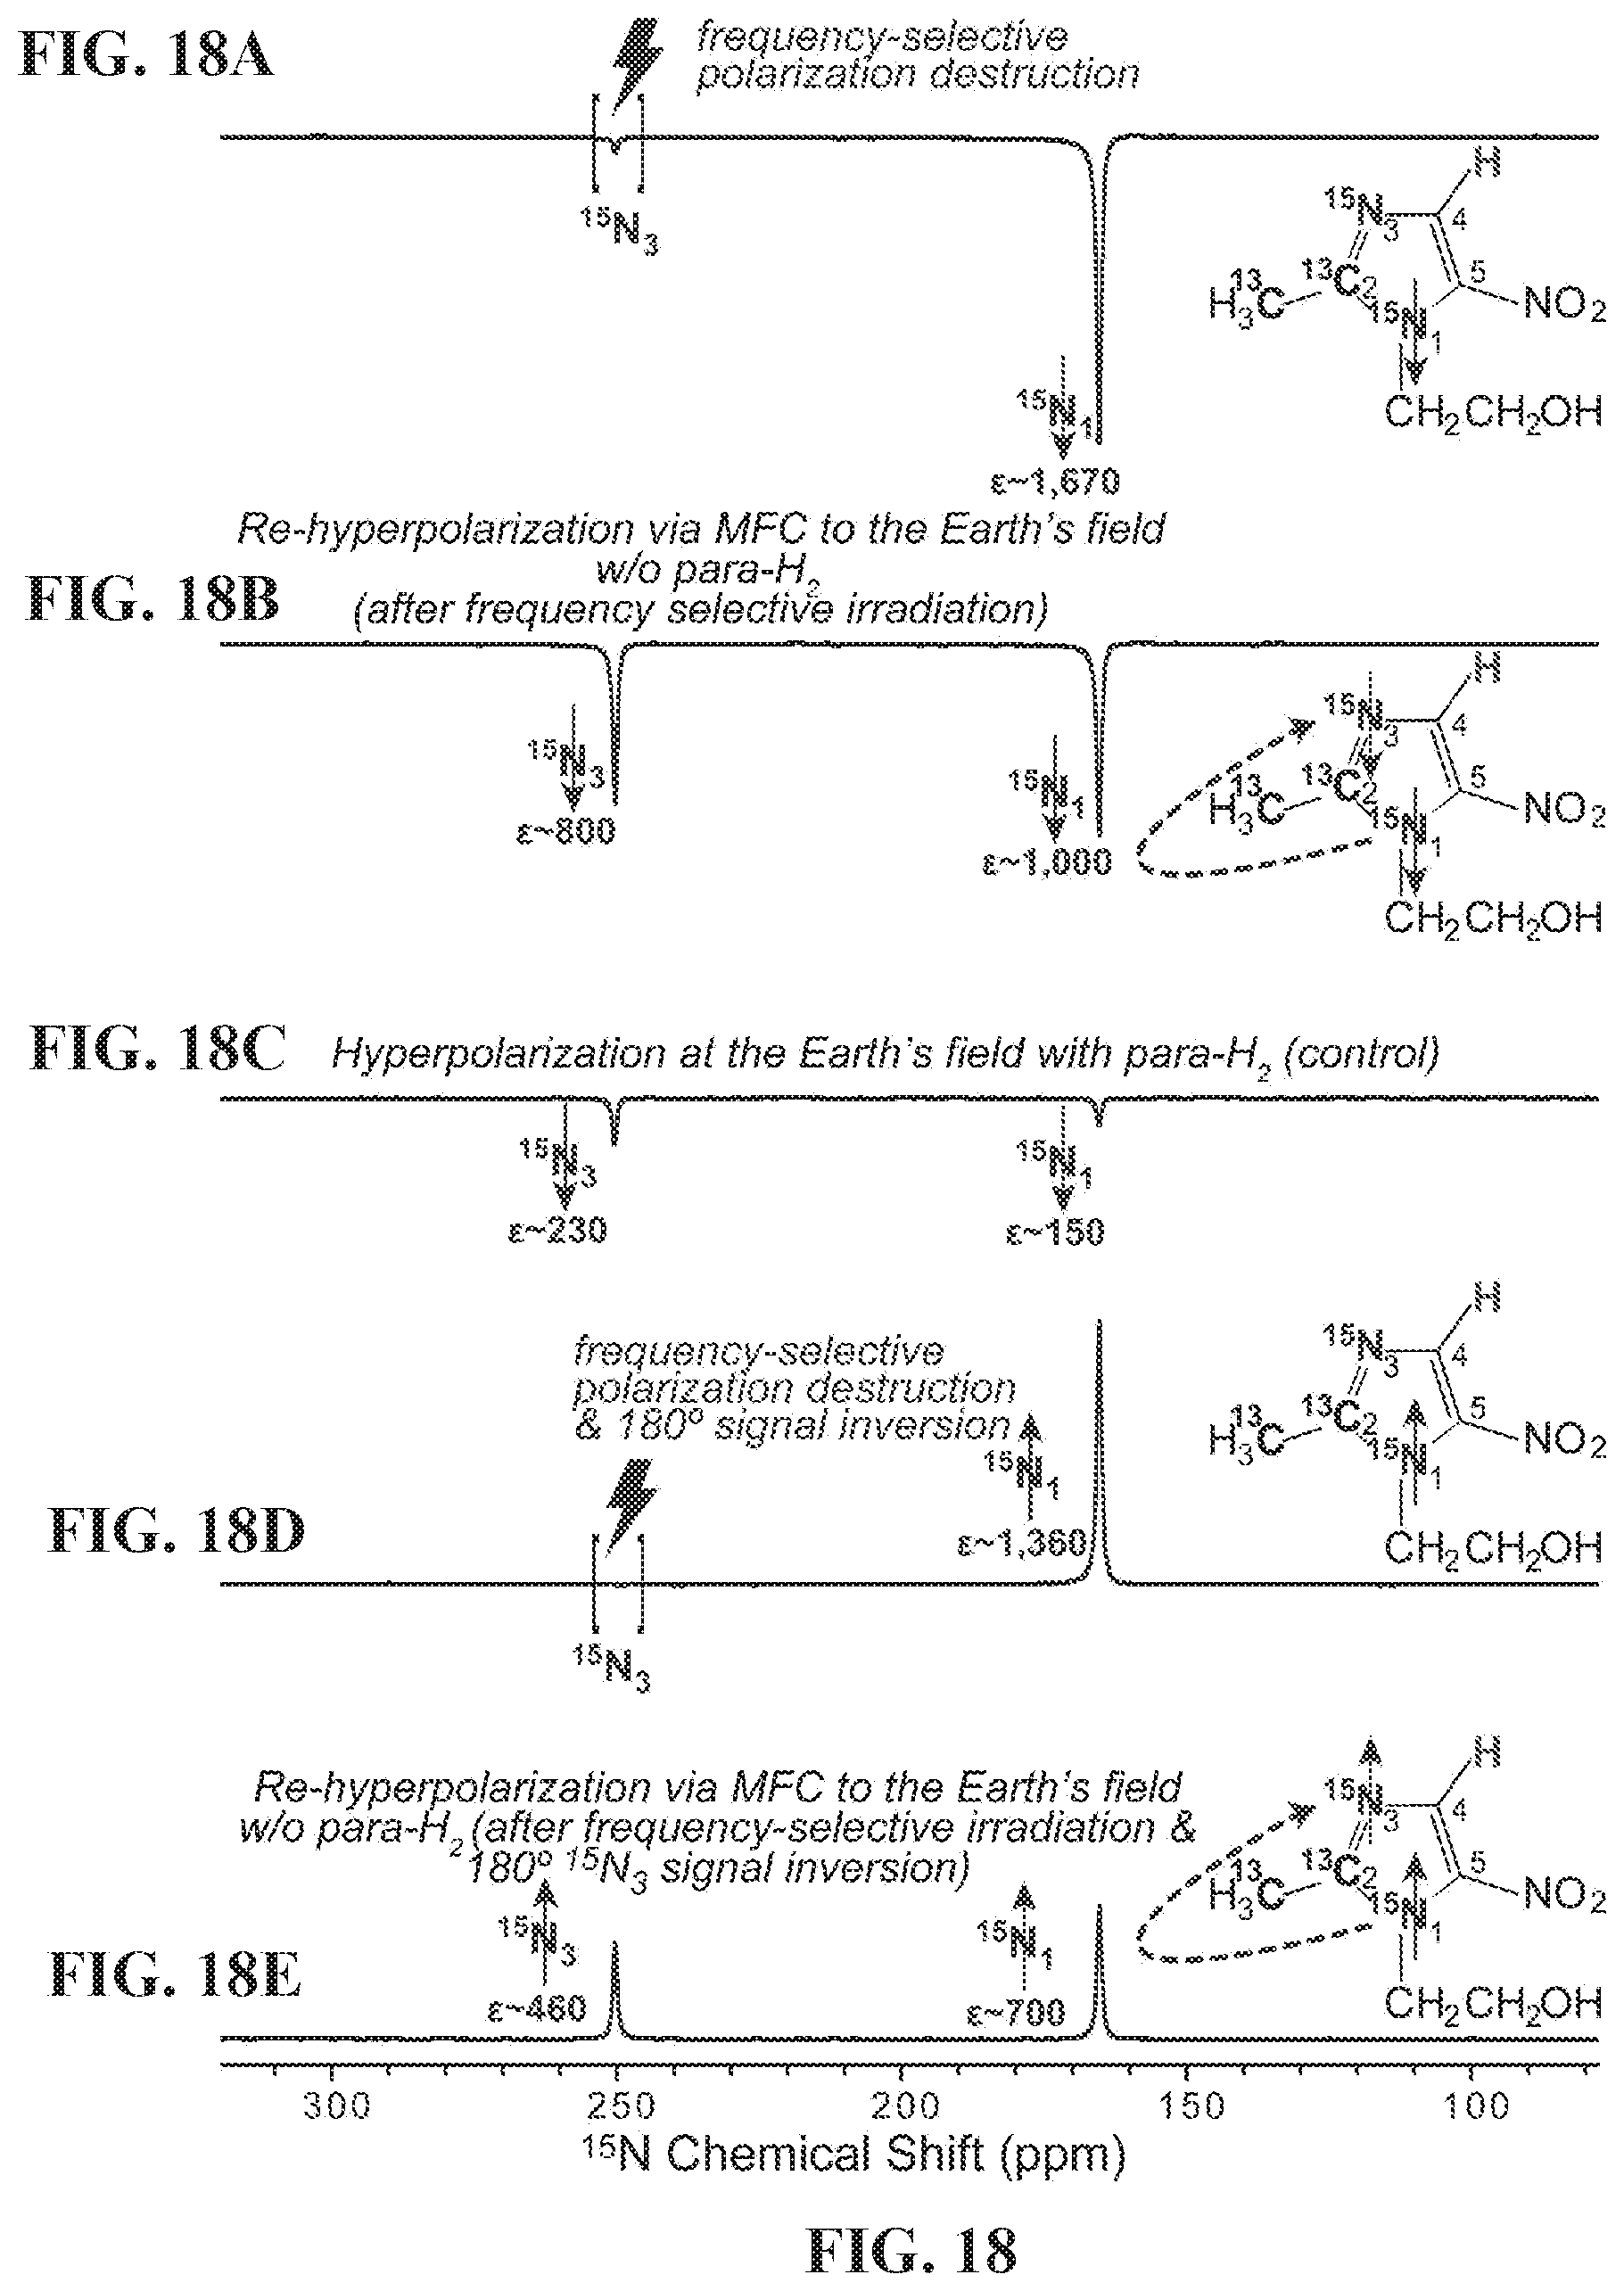
D00036
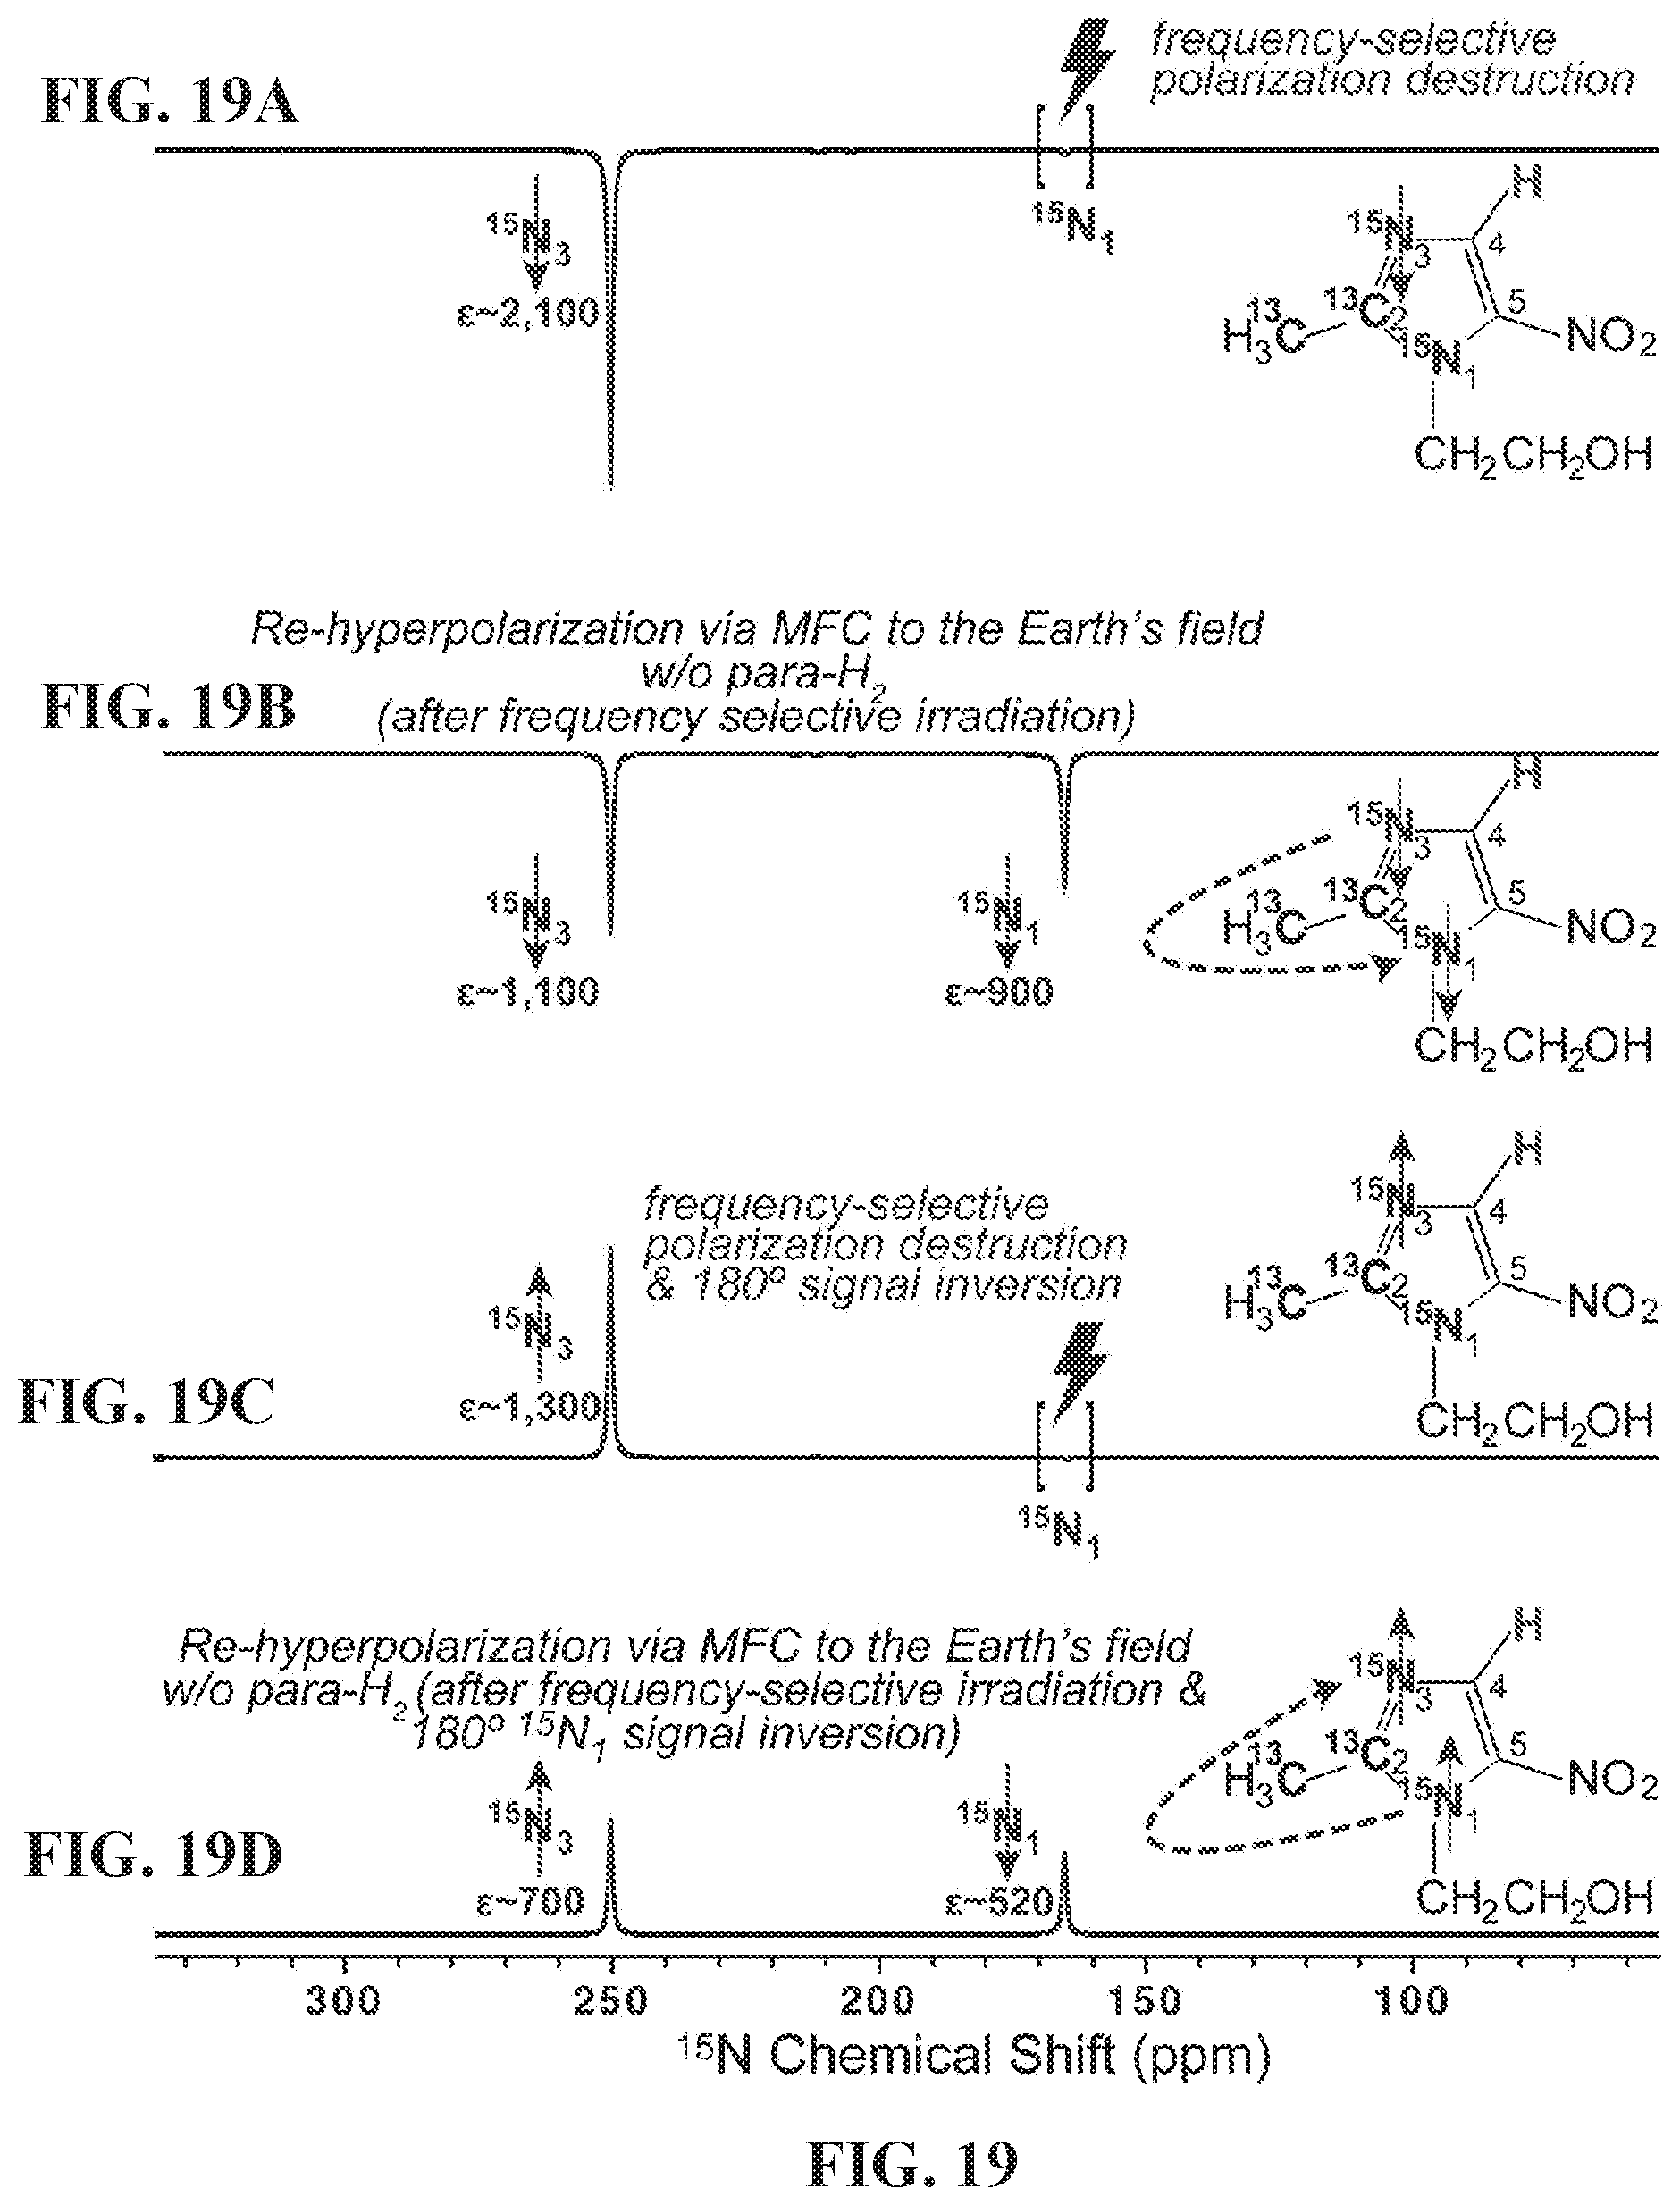
D00037

D00038
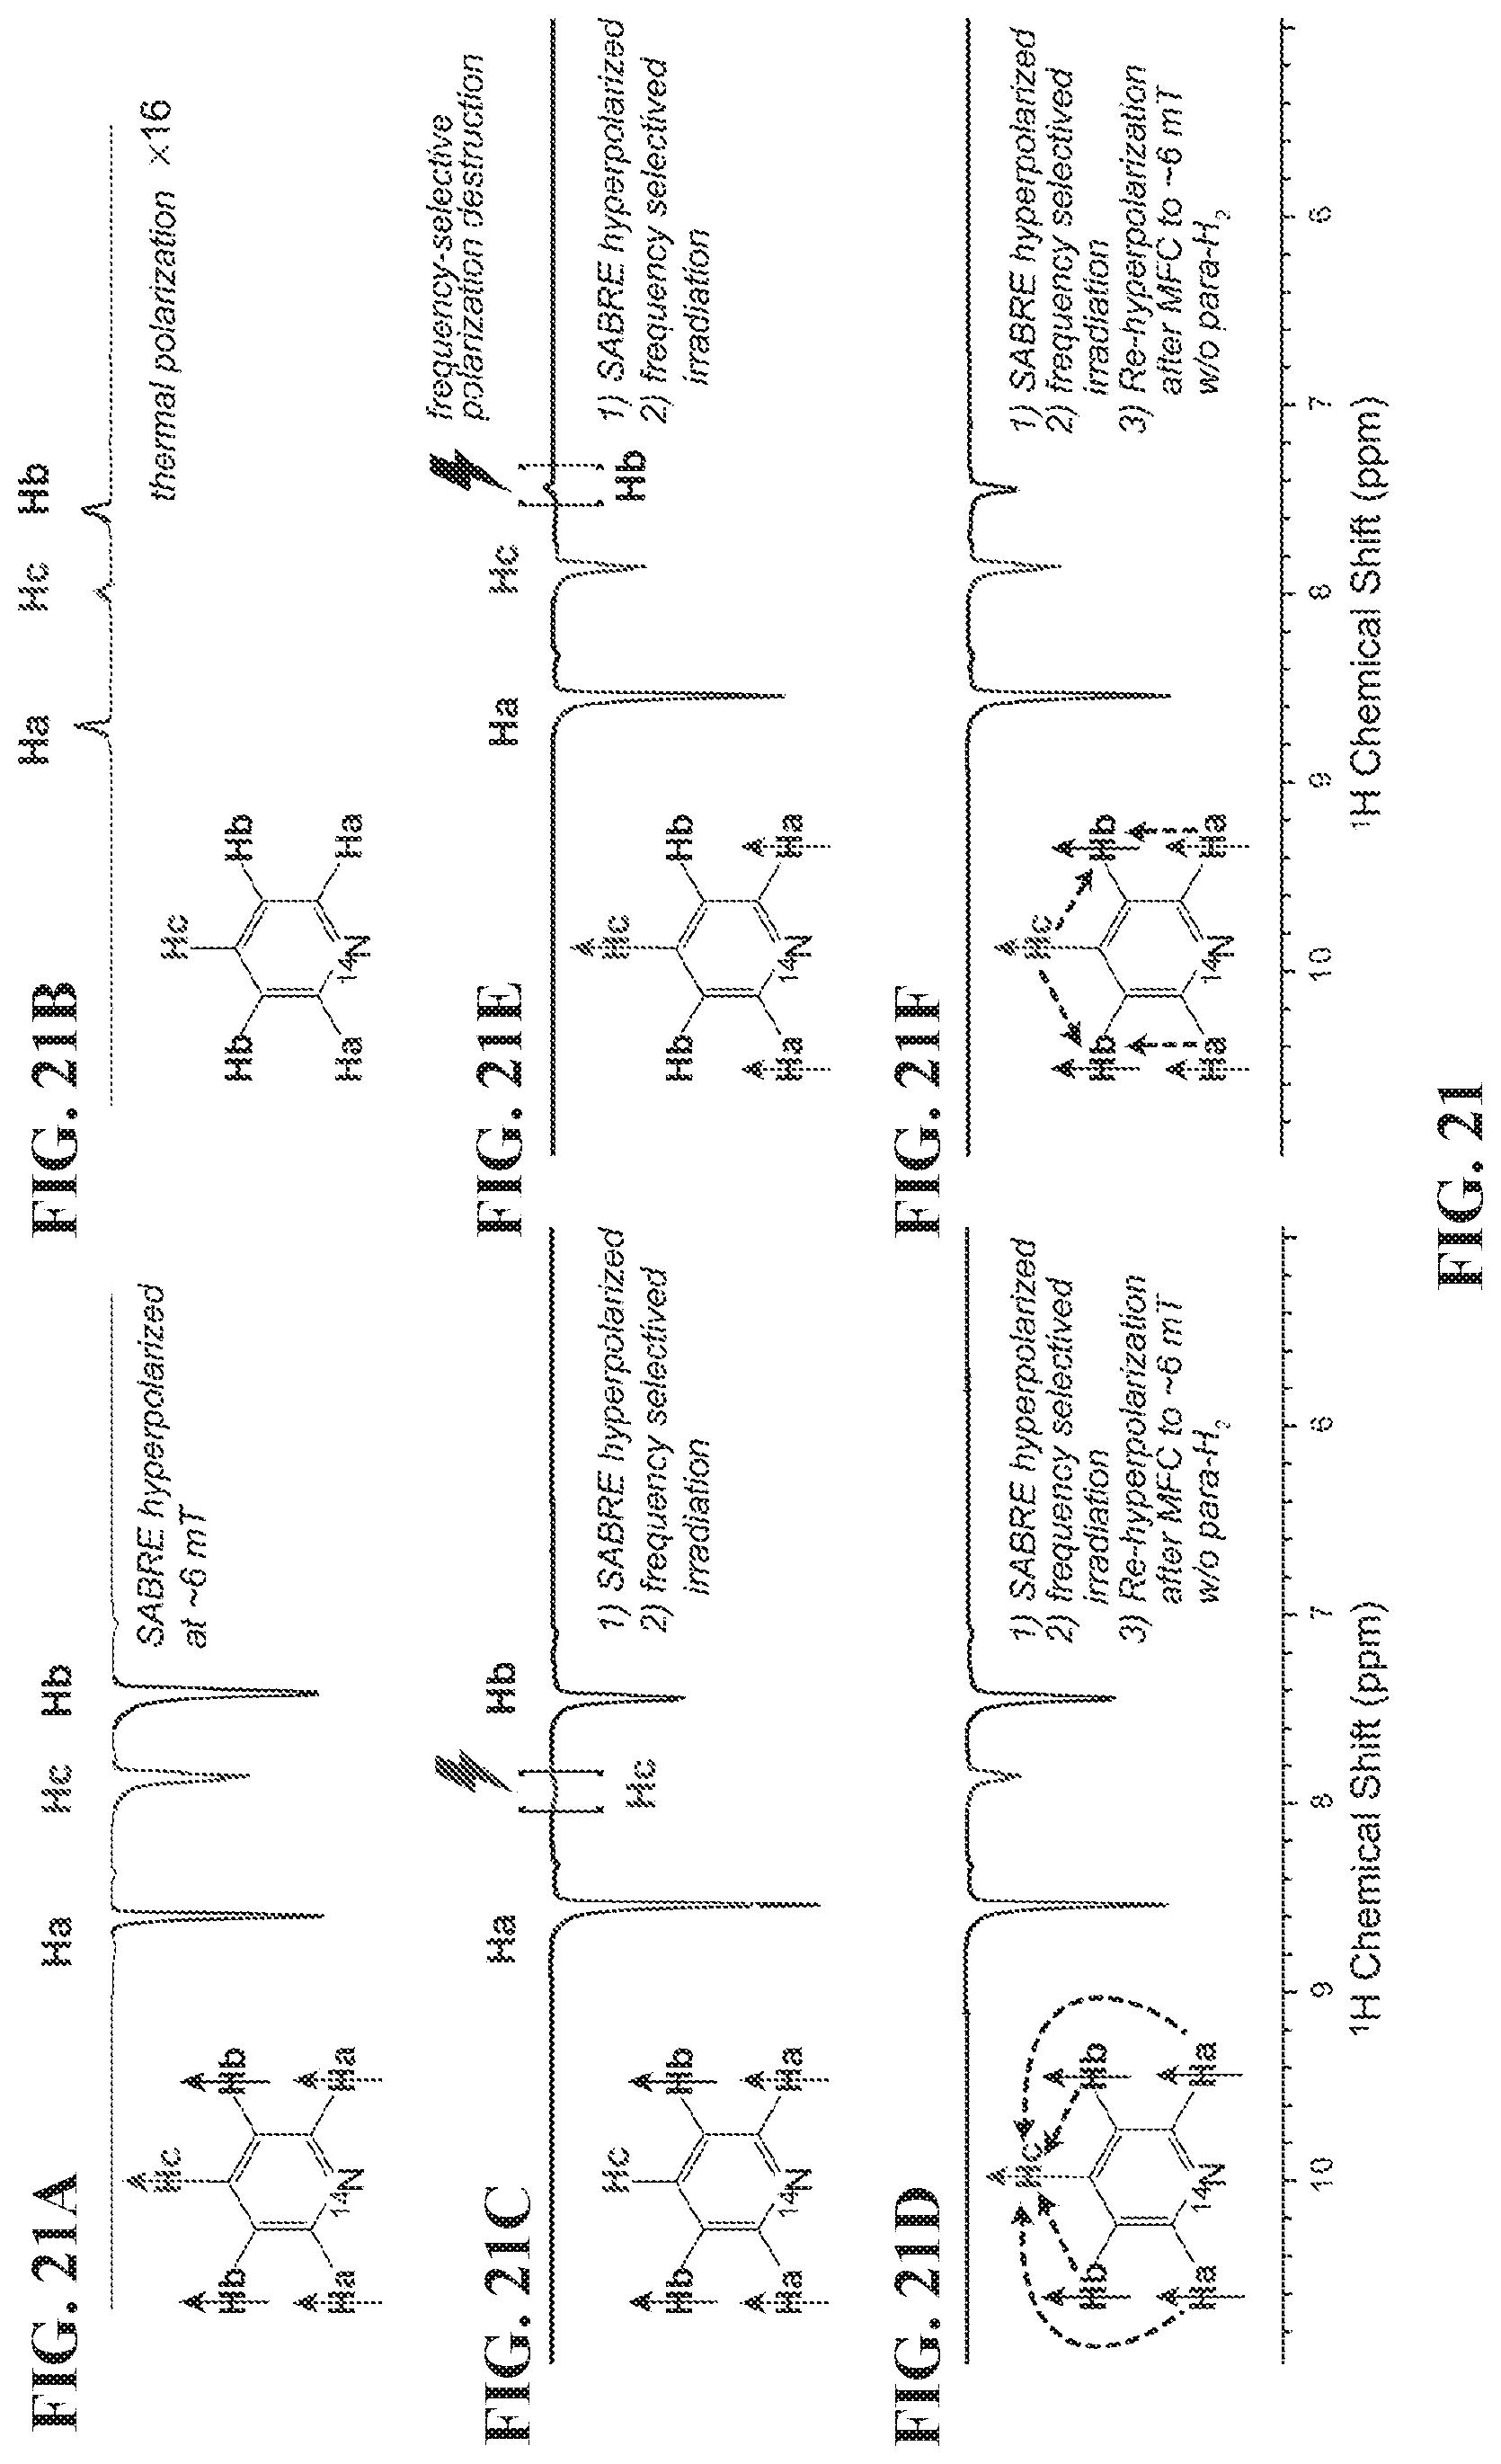
D00039
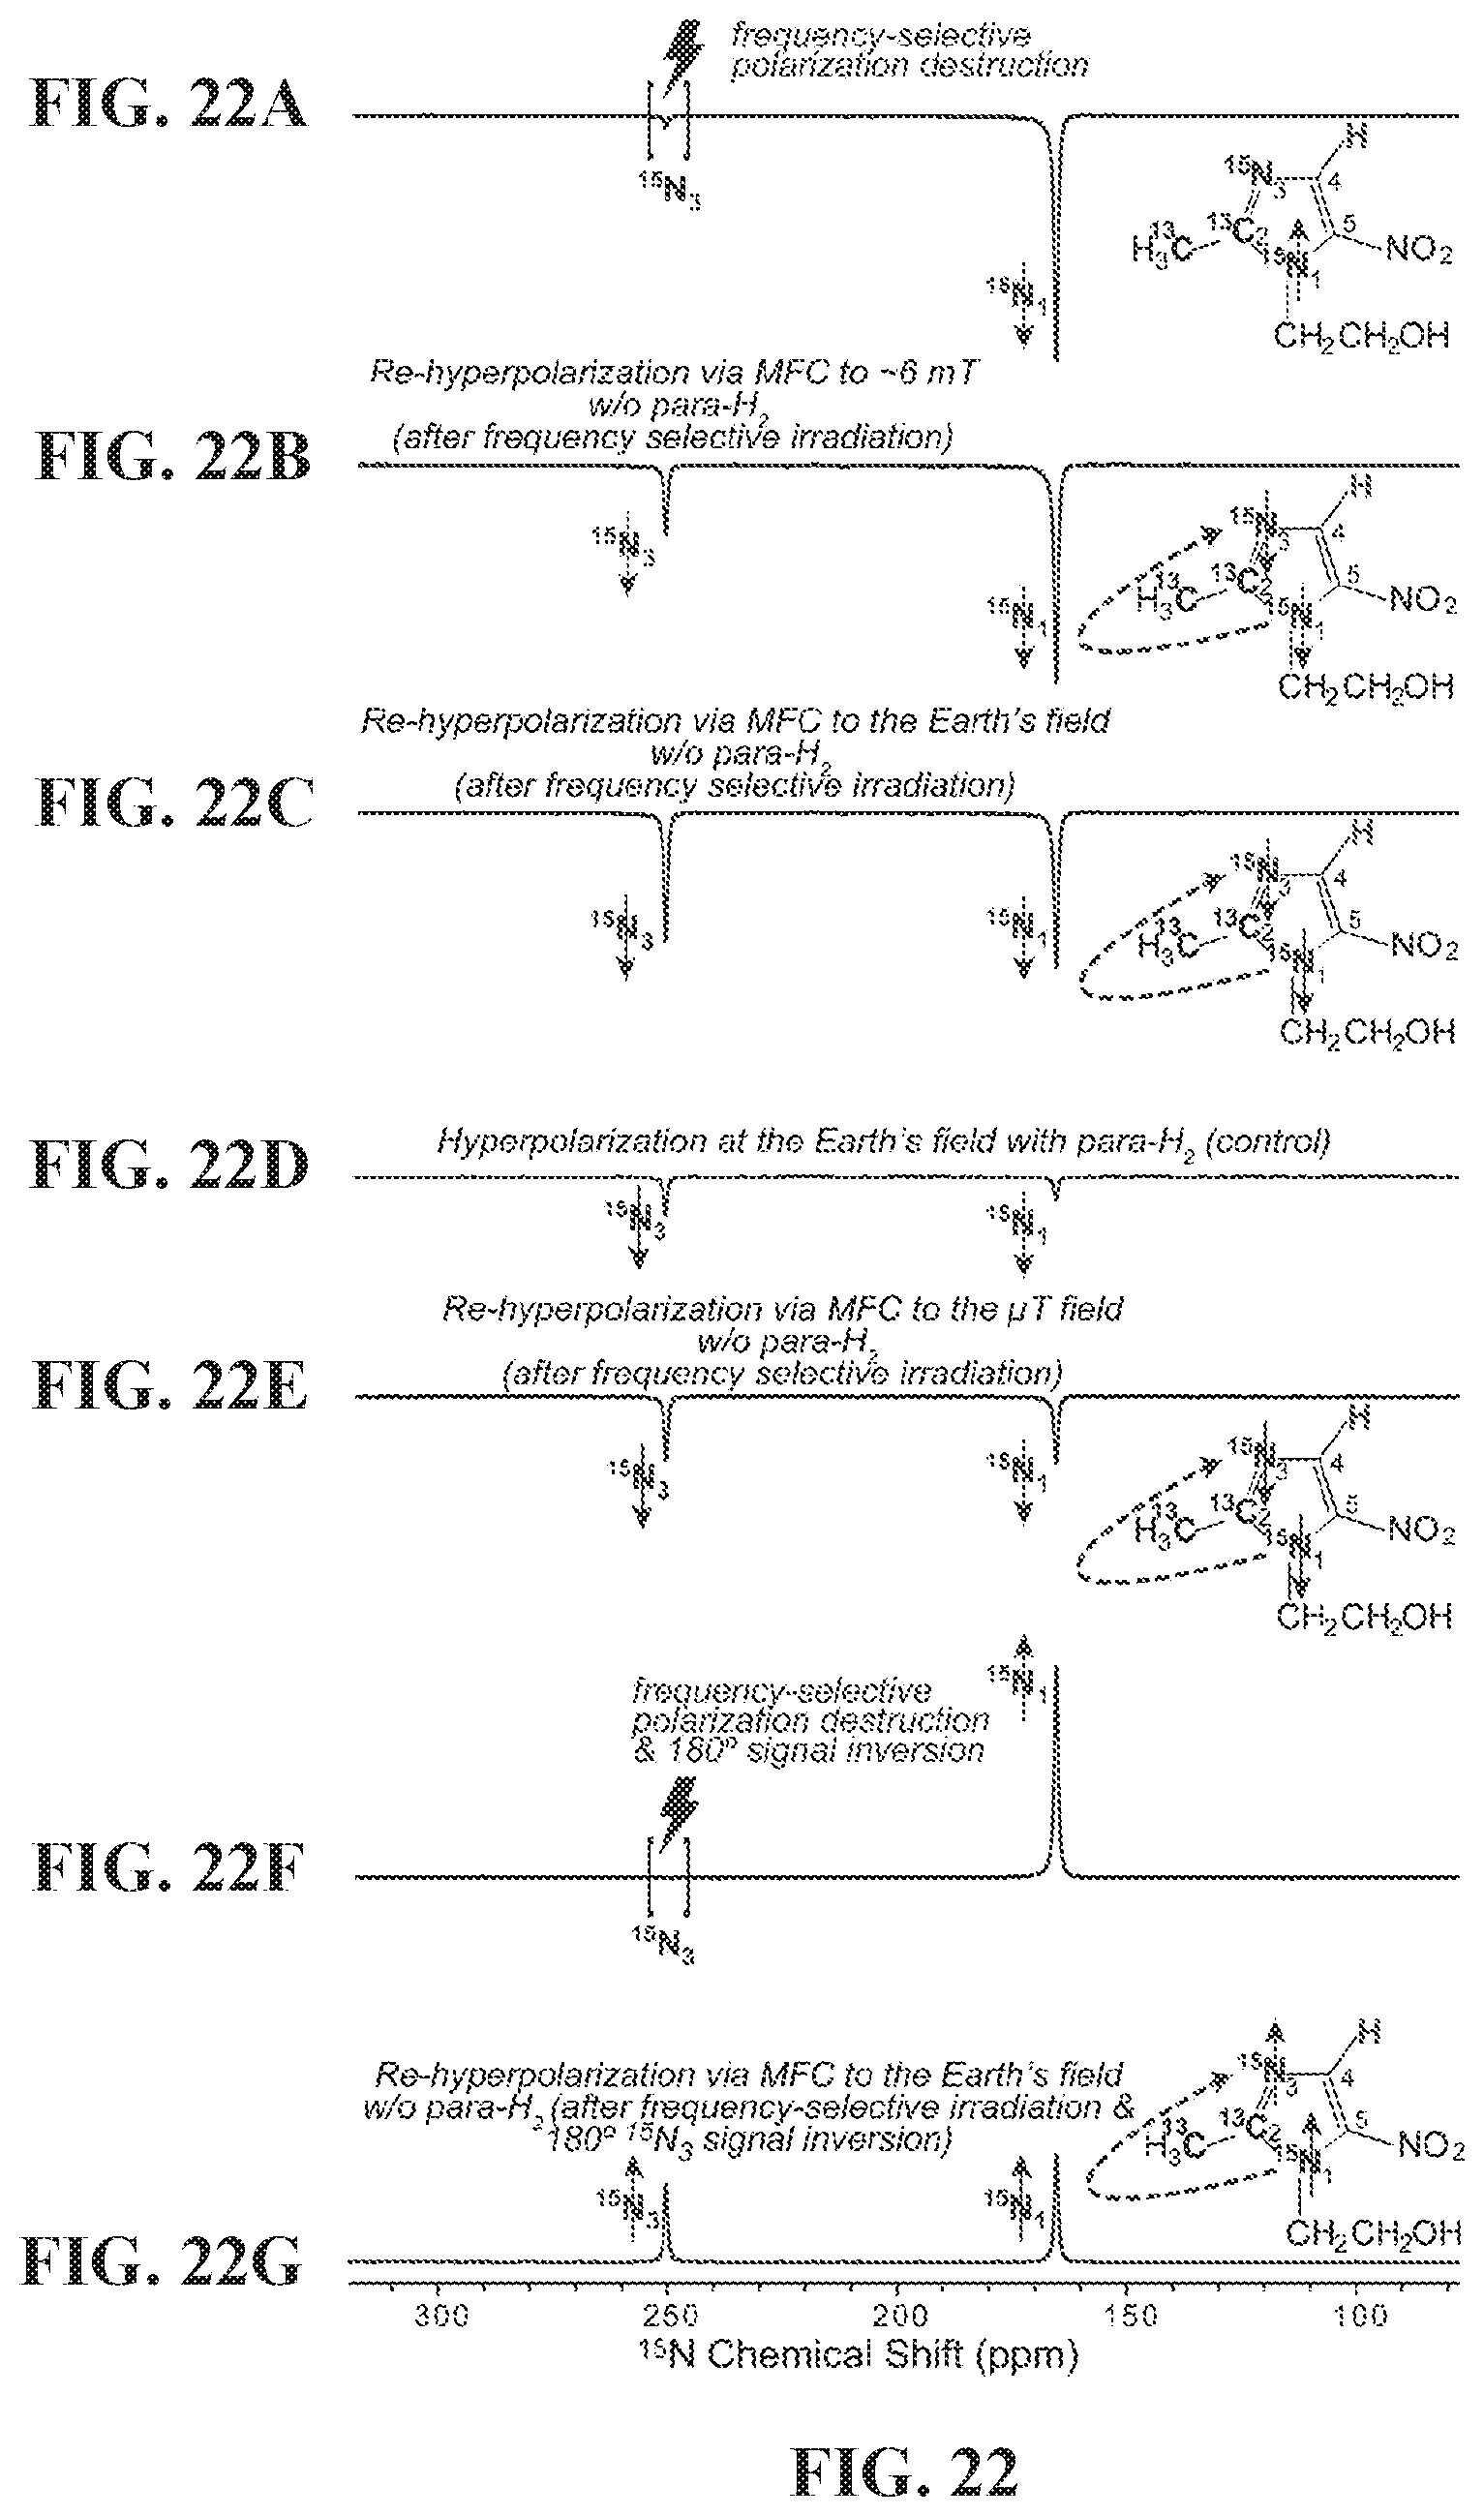
D00040

D00041

D00042

D00043
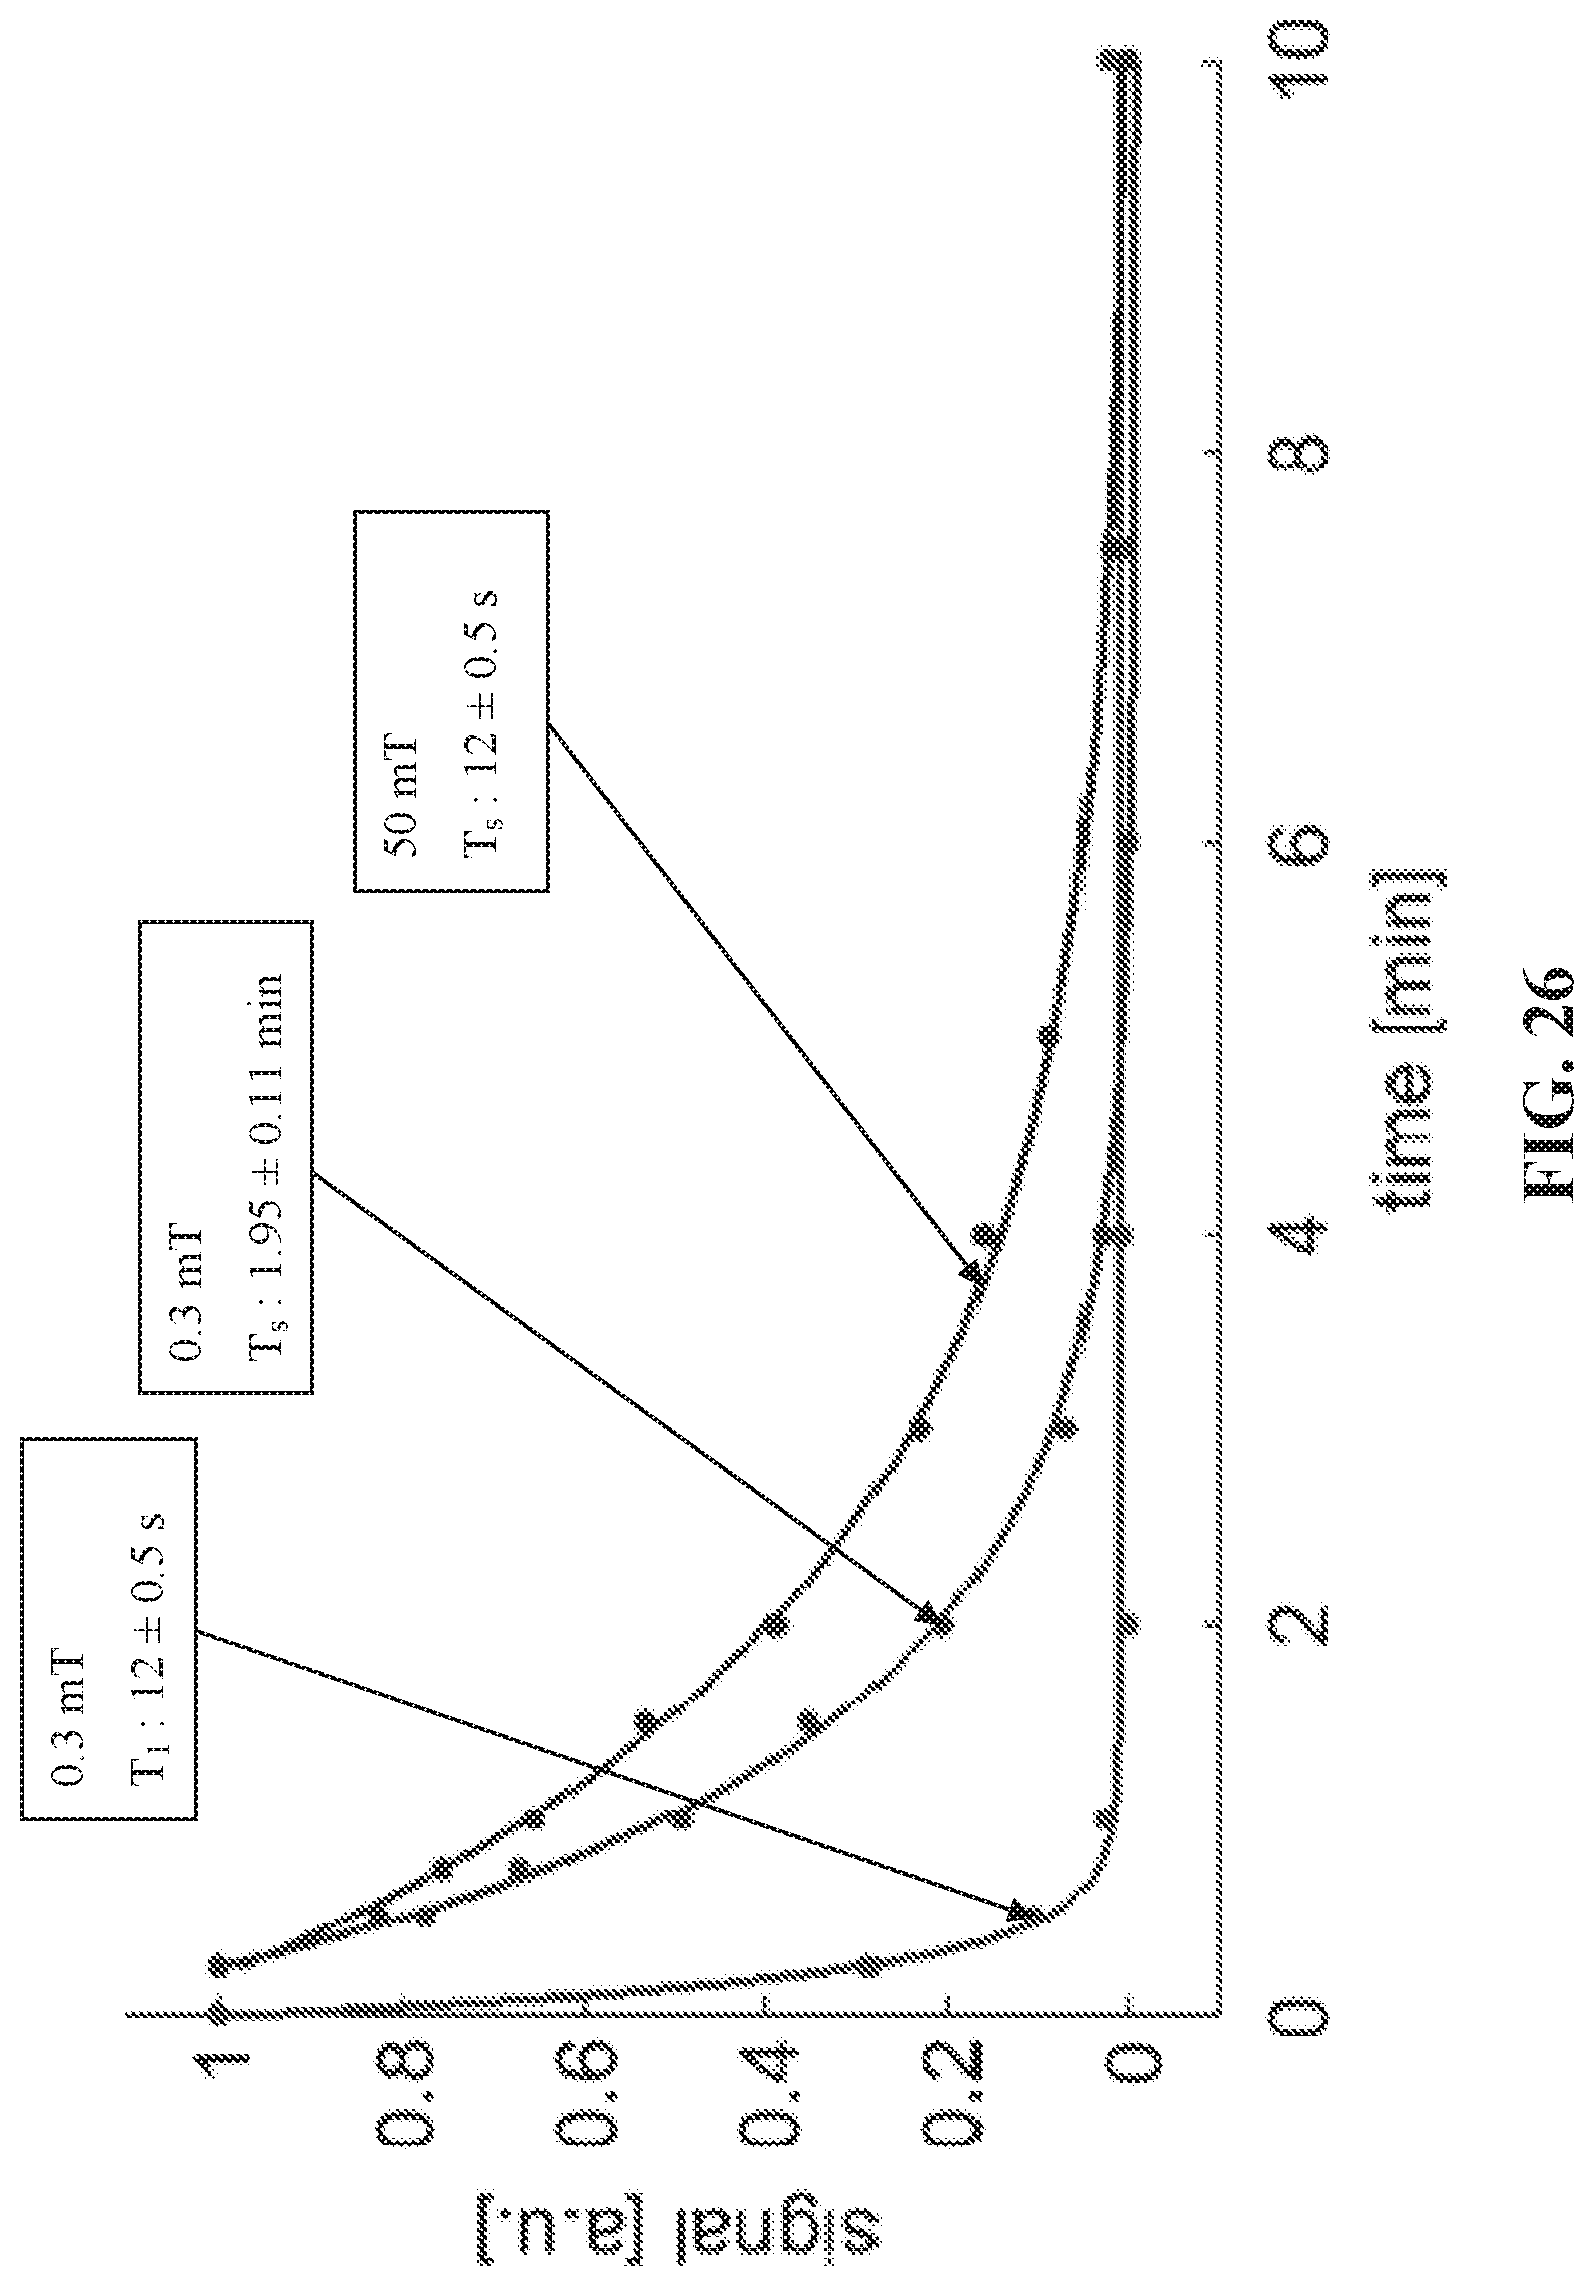
D00044

D00045
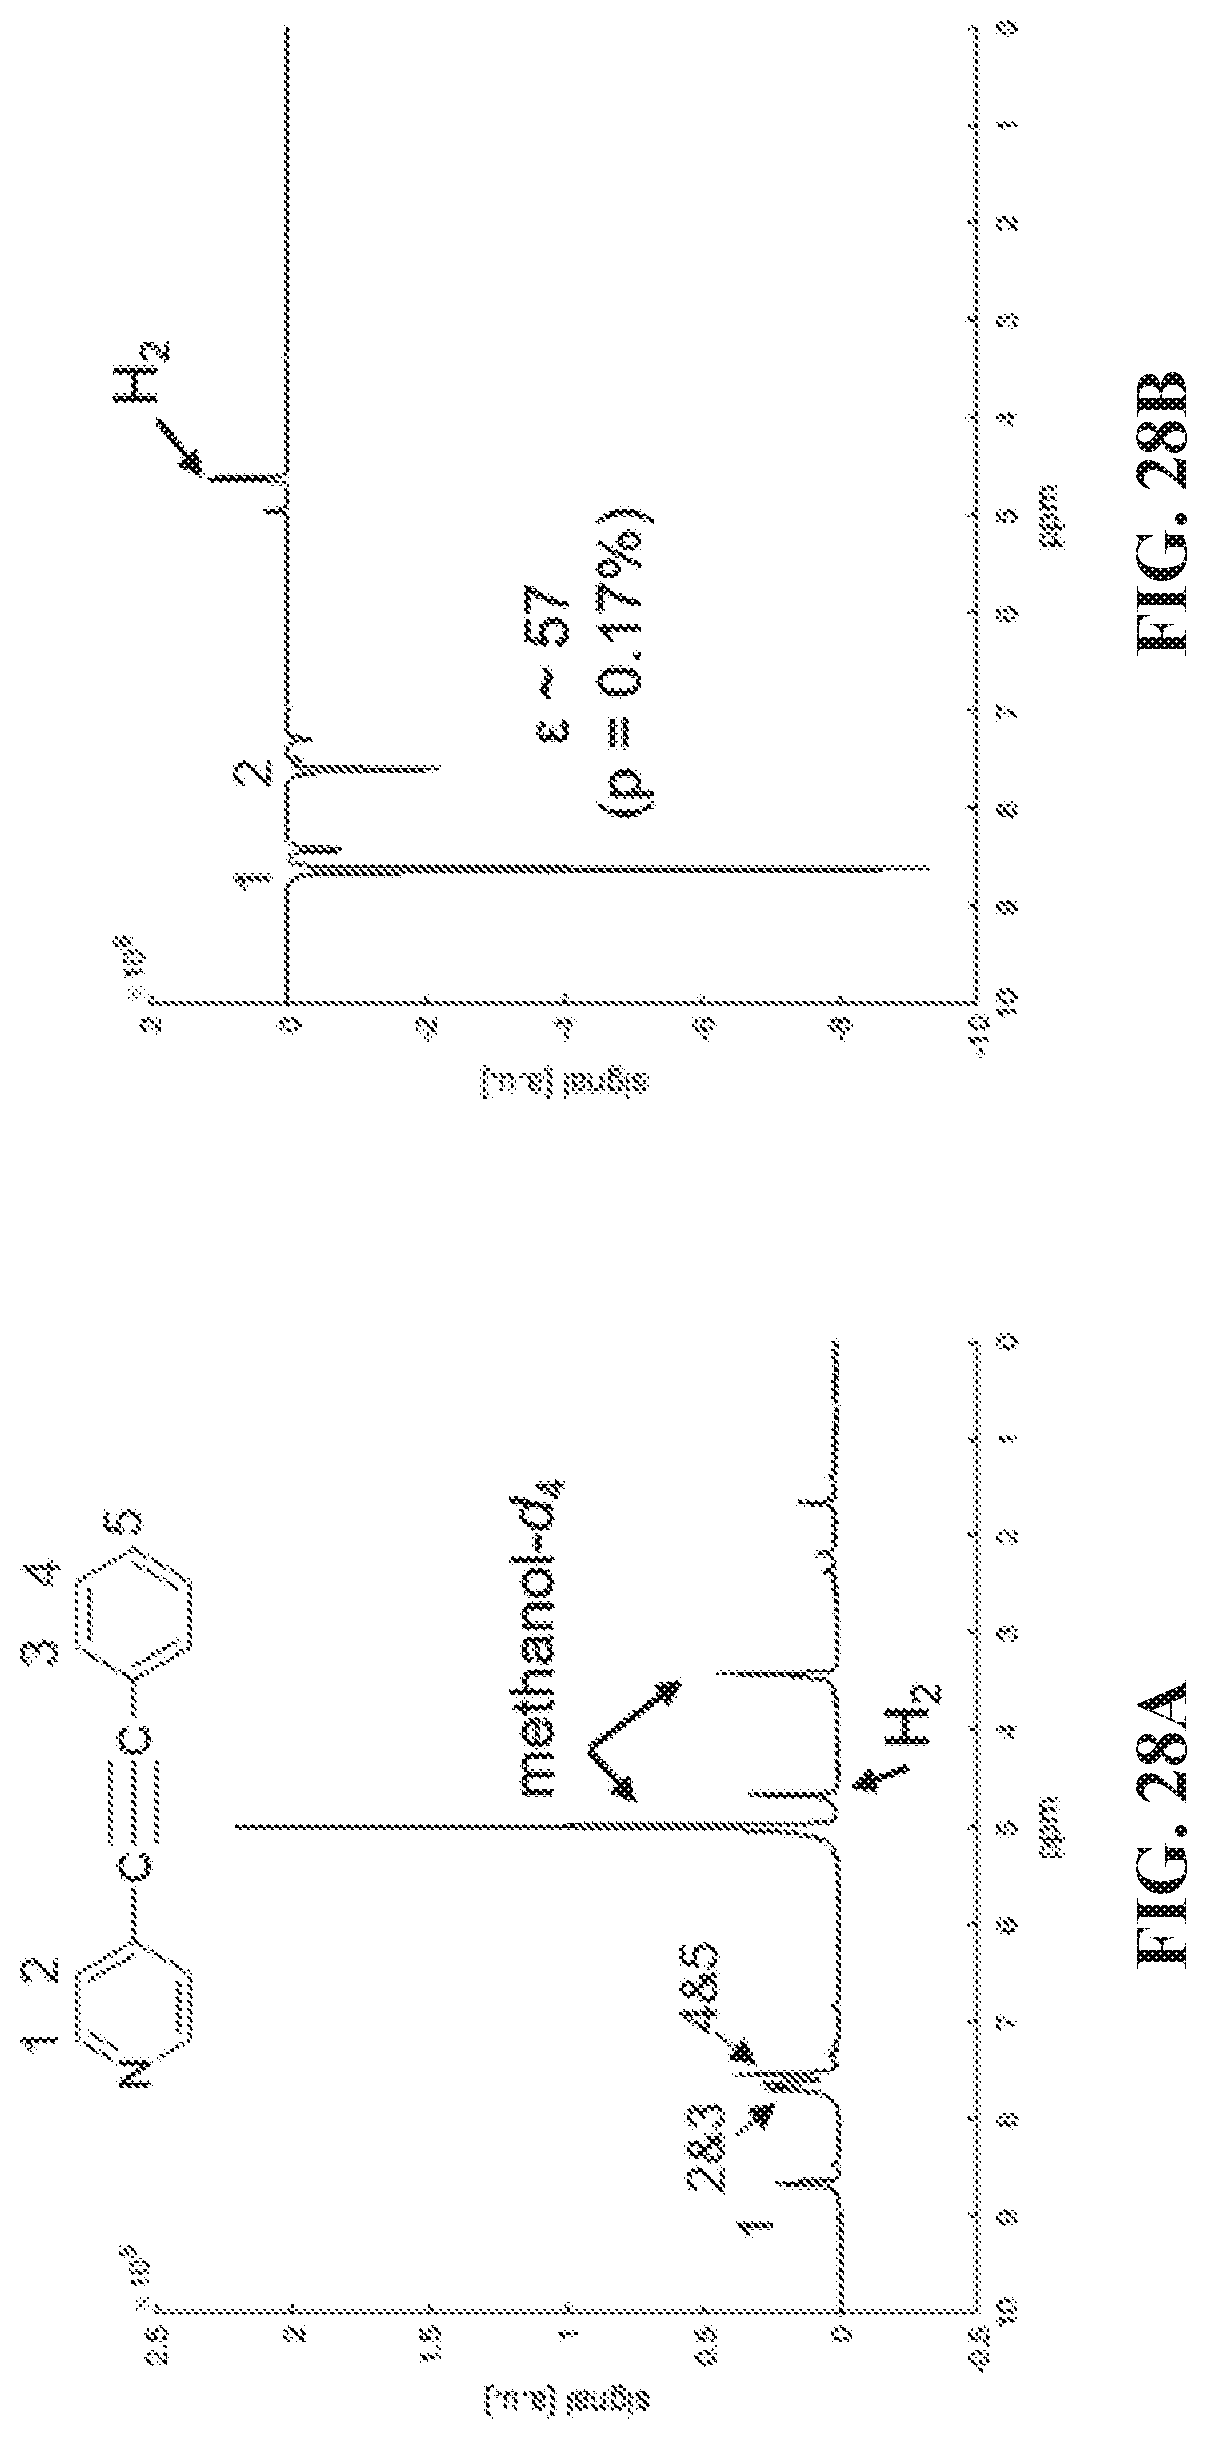
D00046
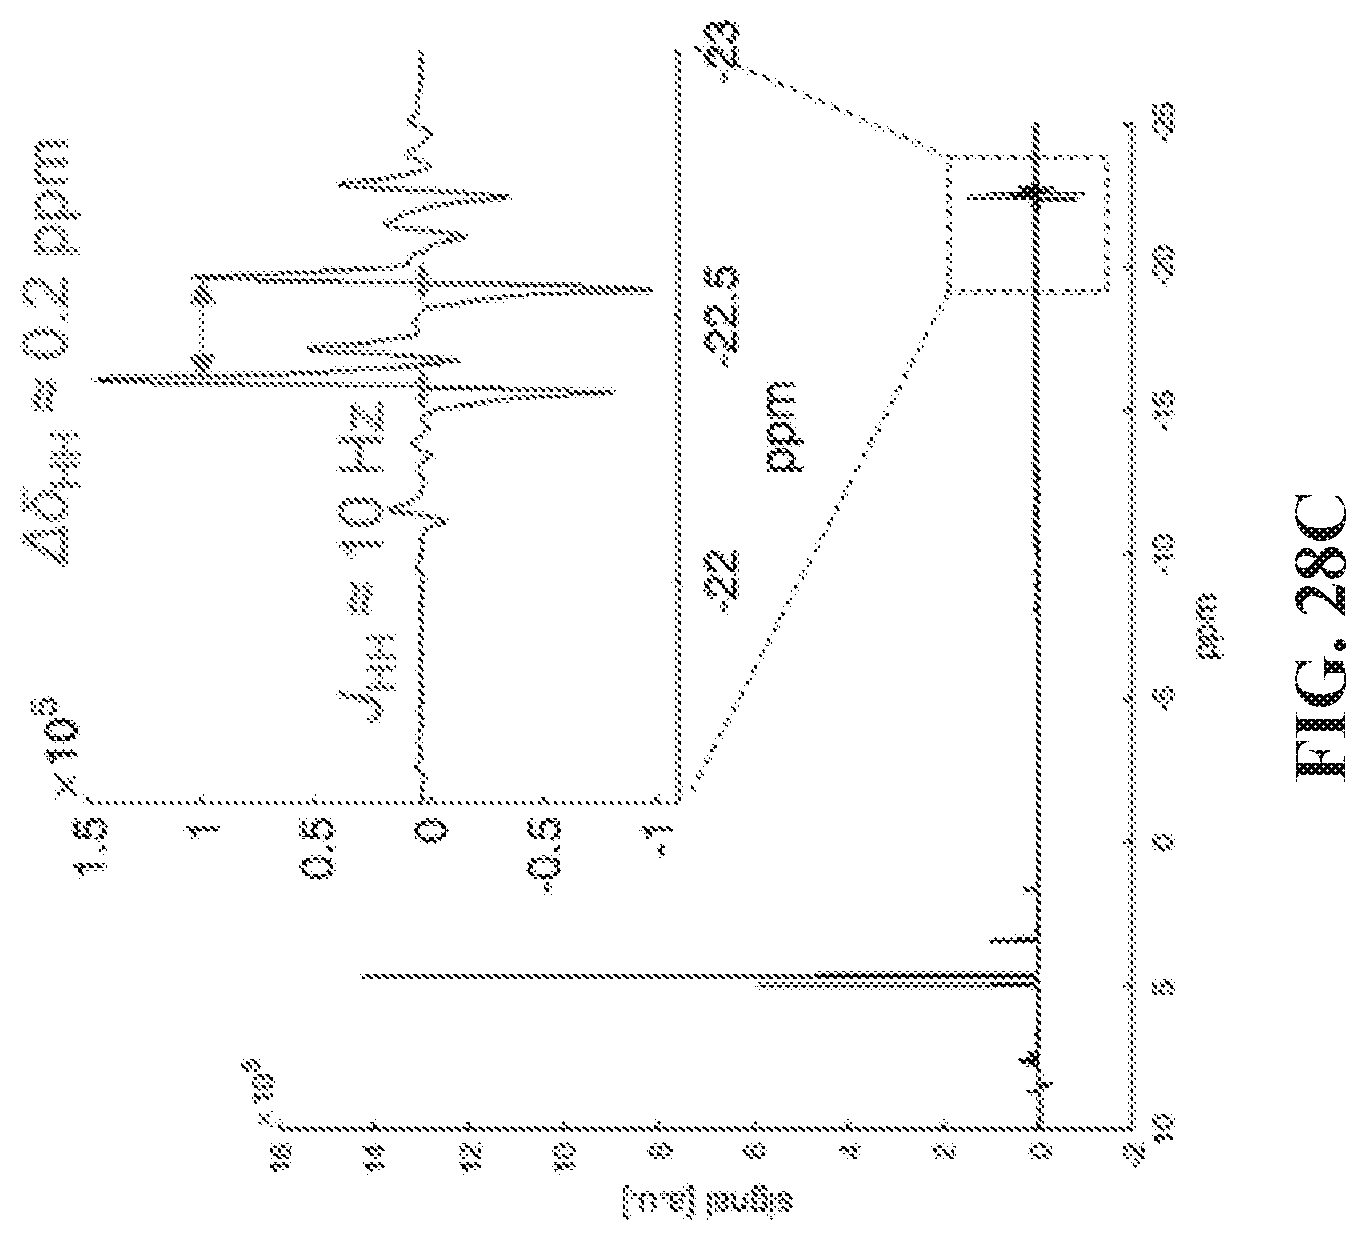
D00047

D00048
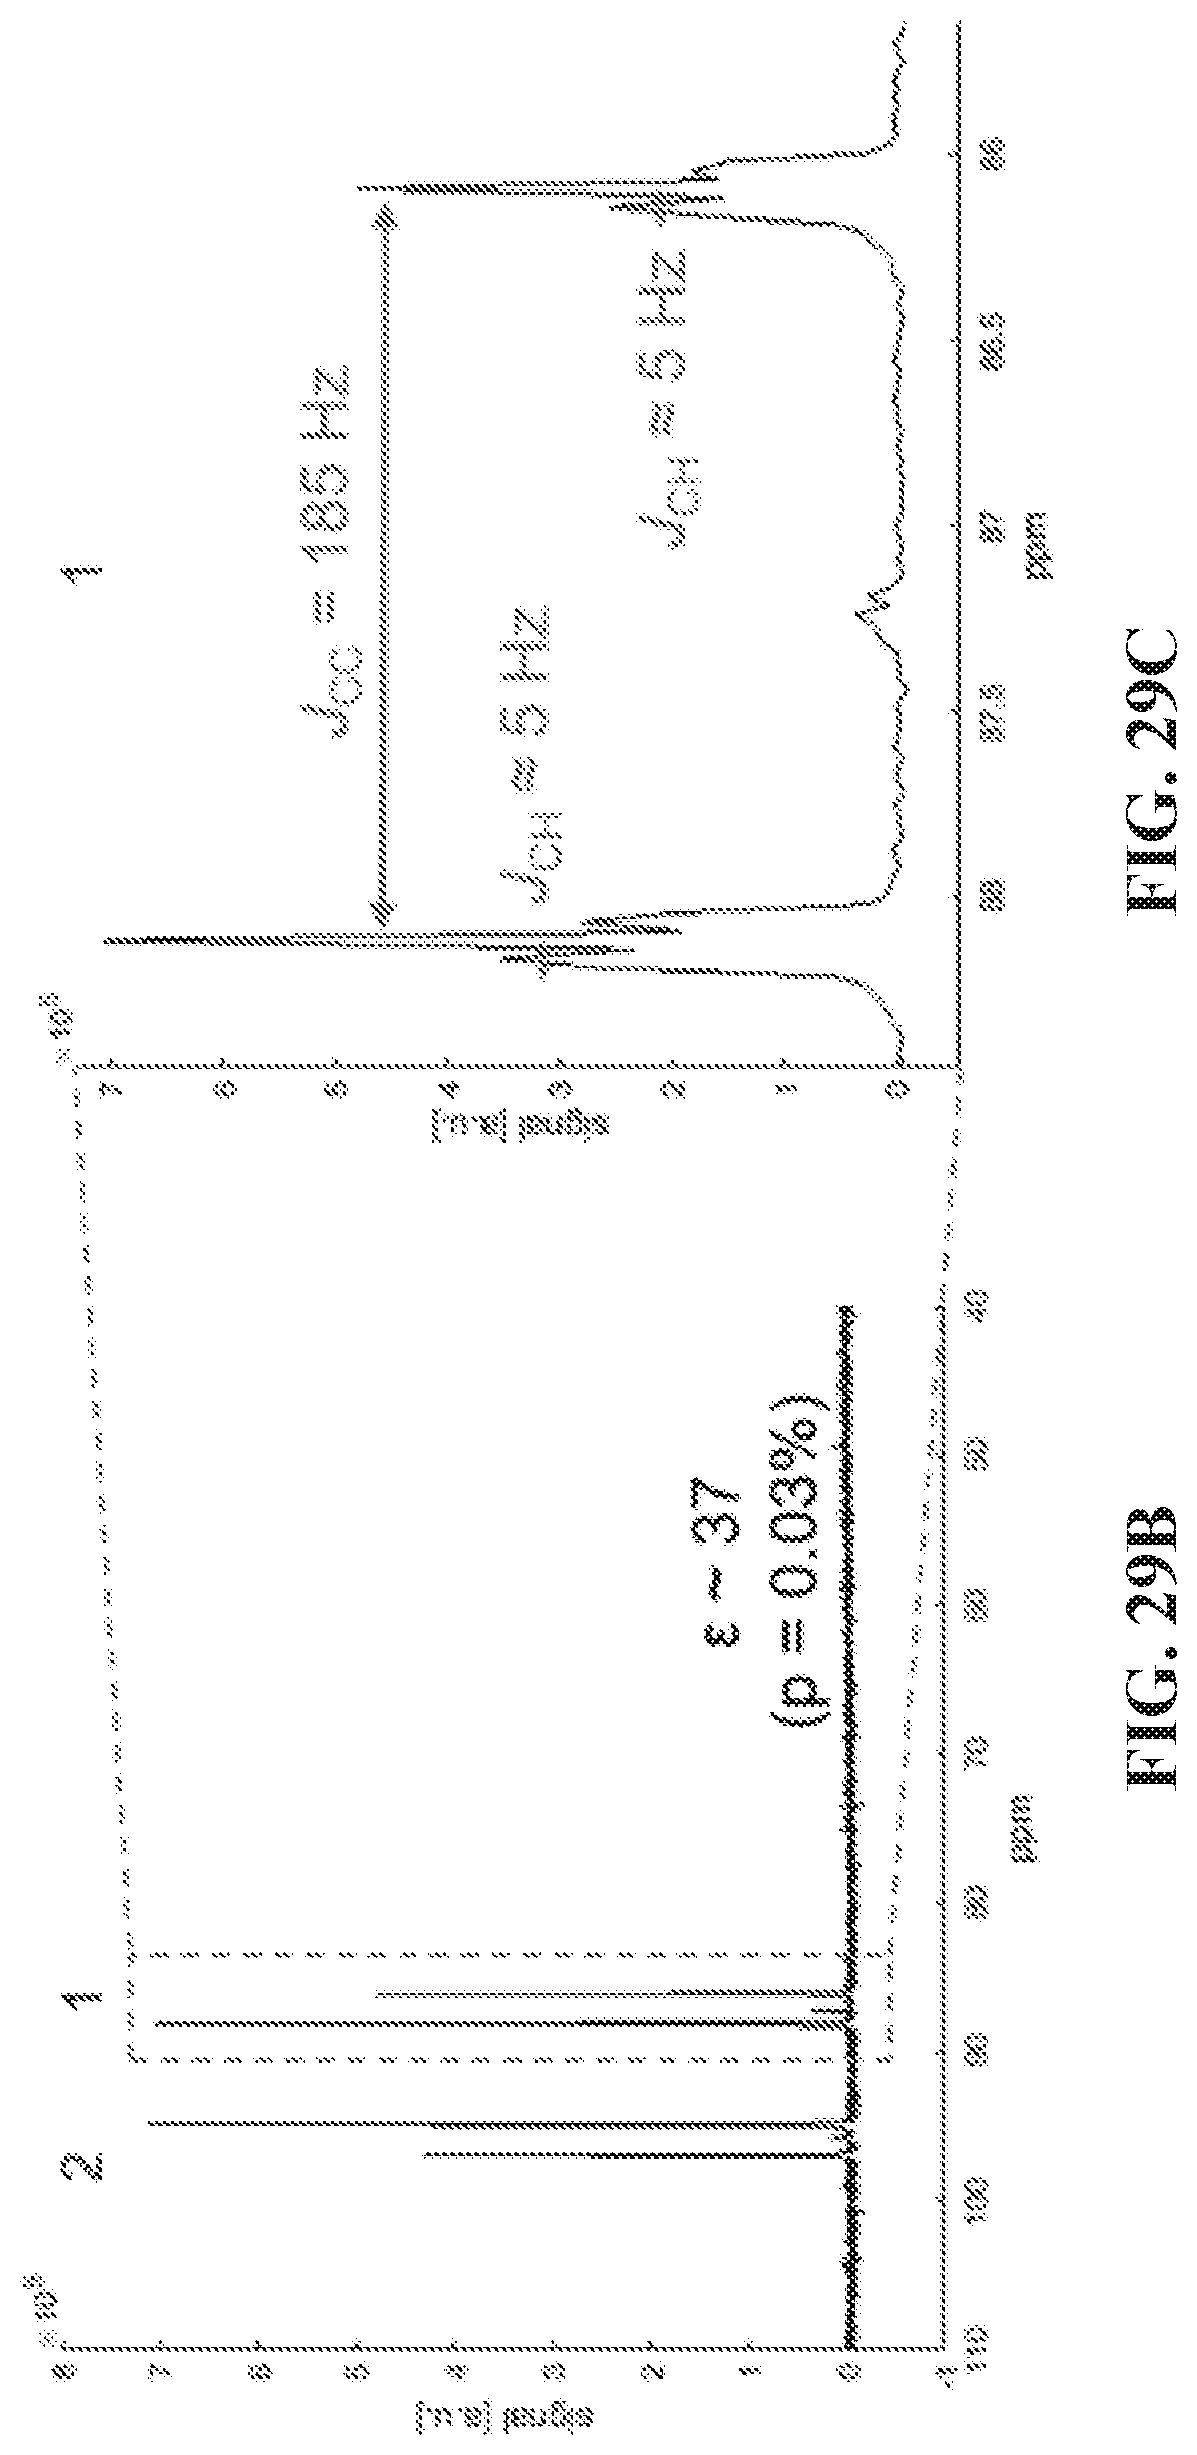
D00049

D00050
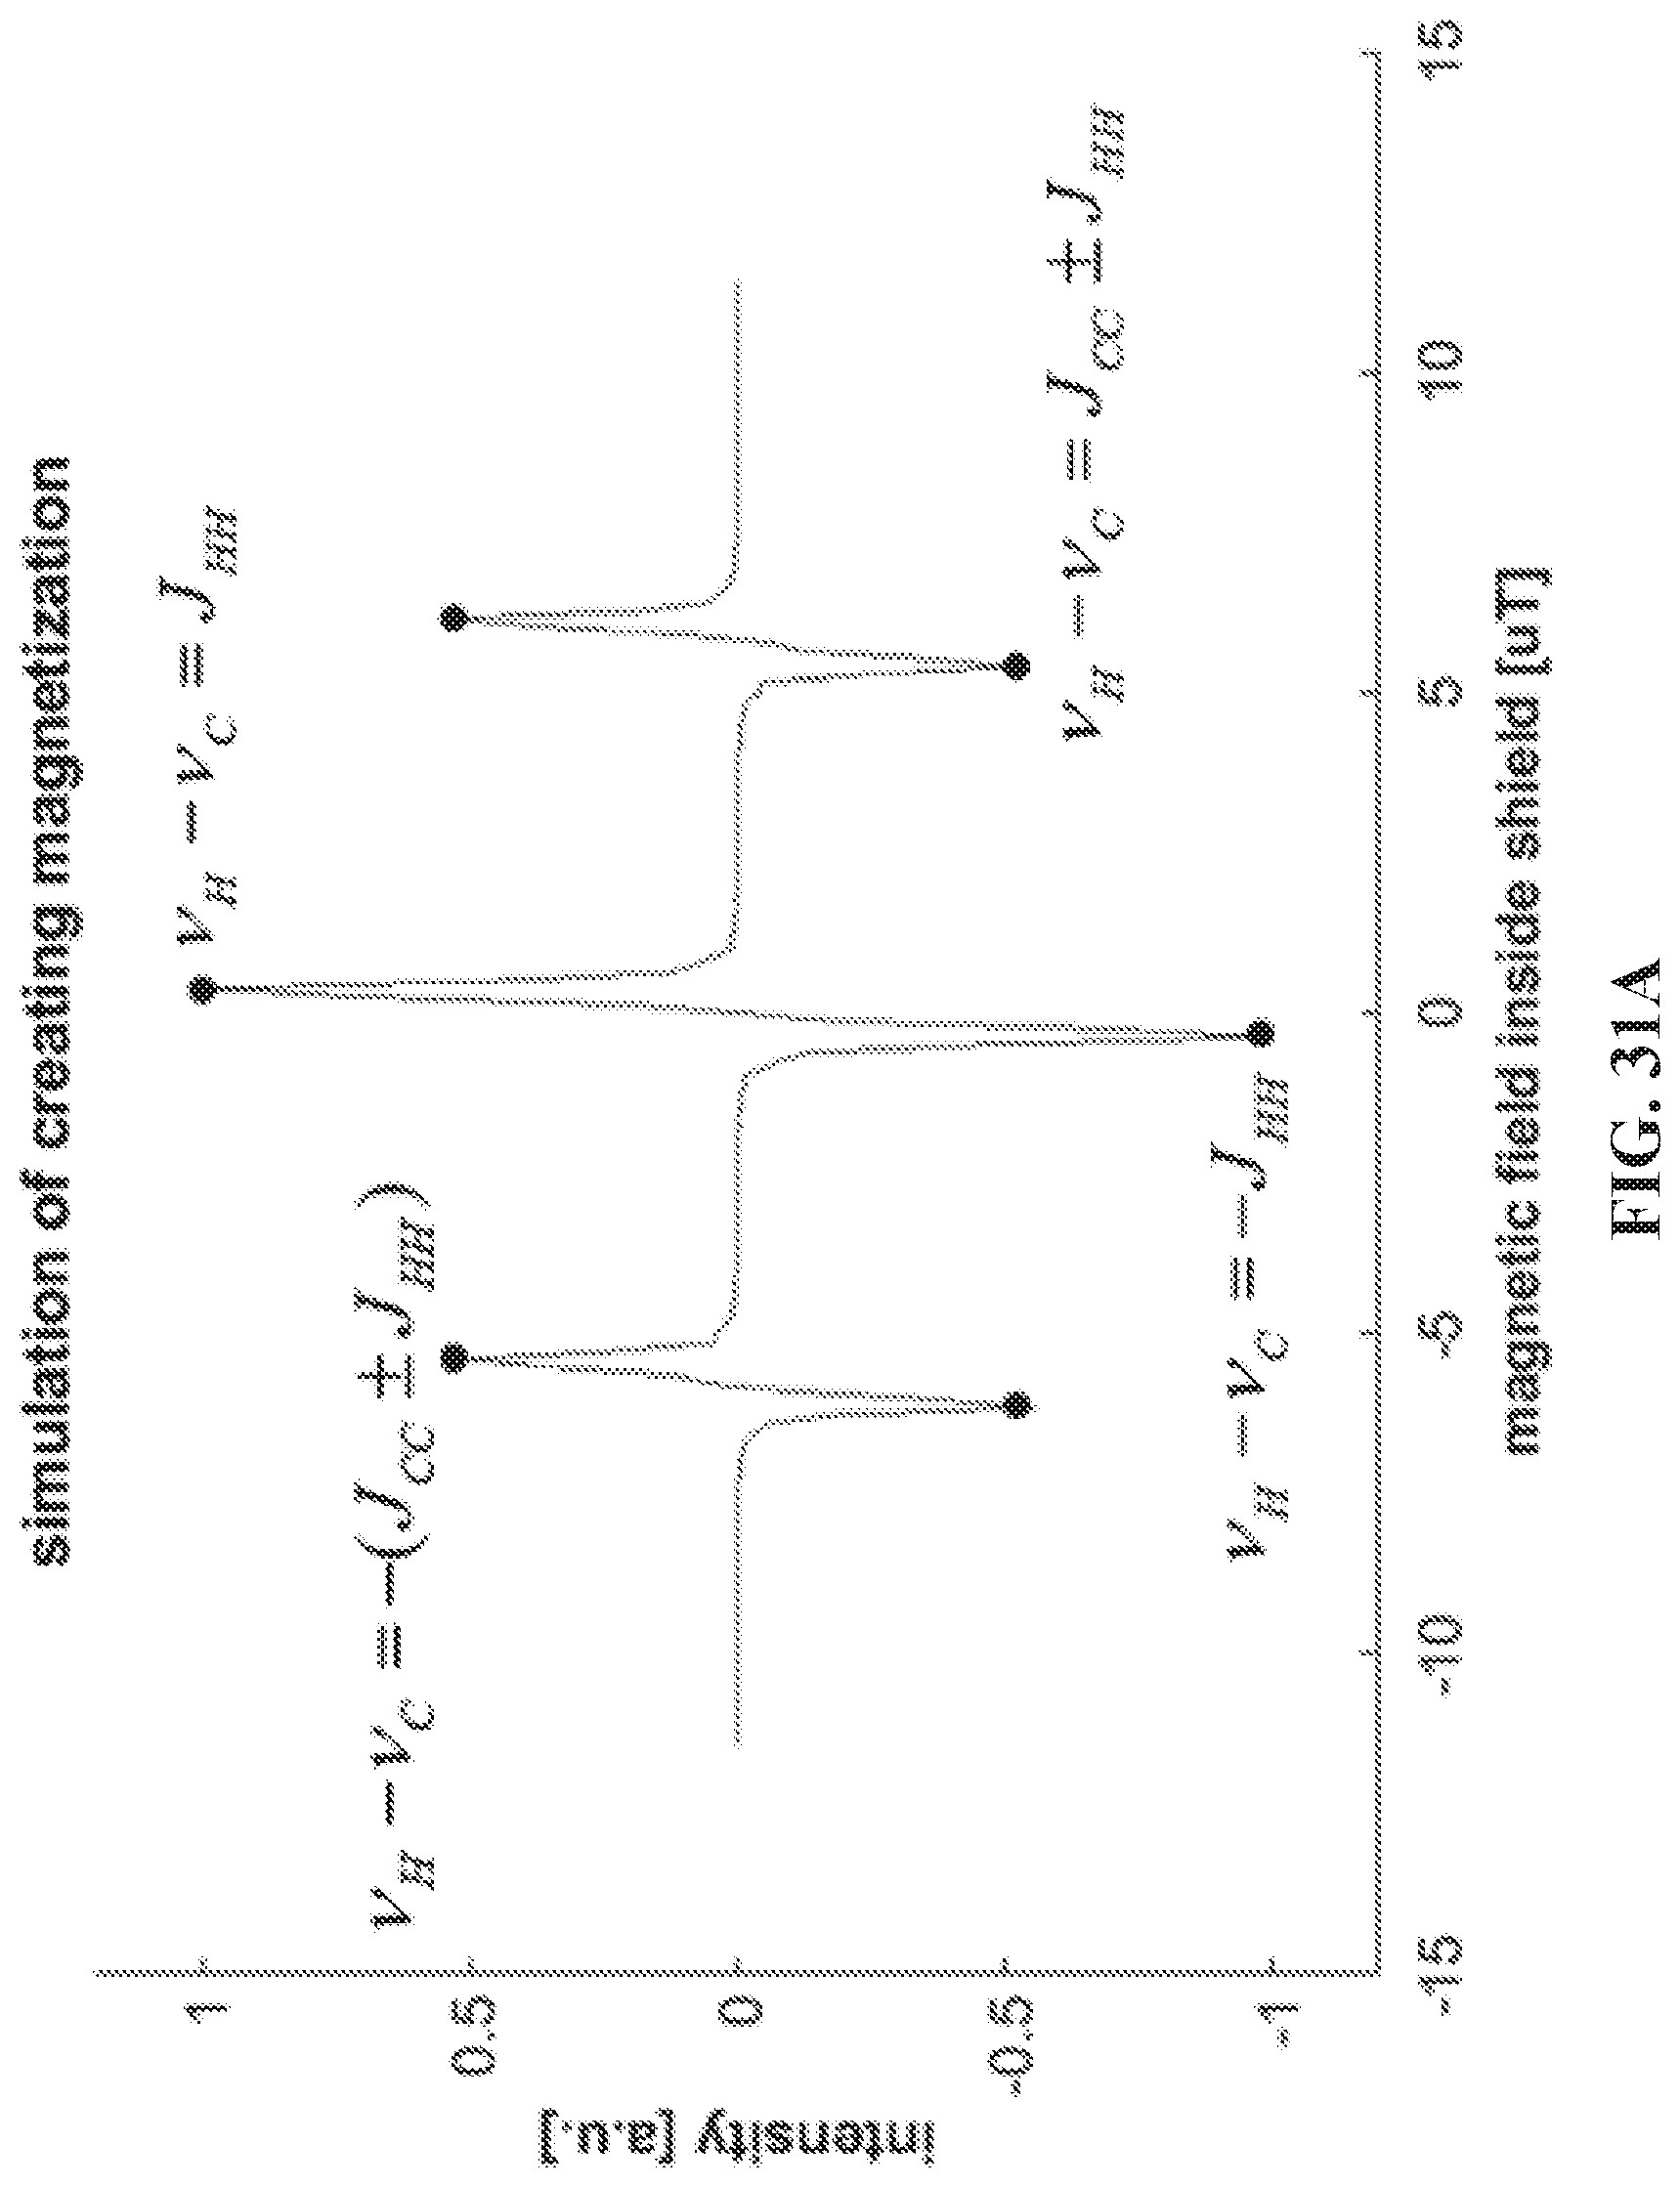
D00051

D00052
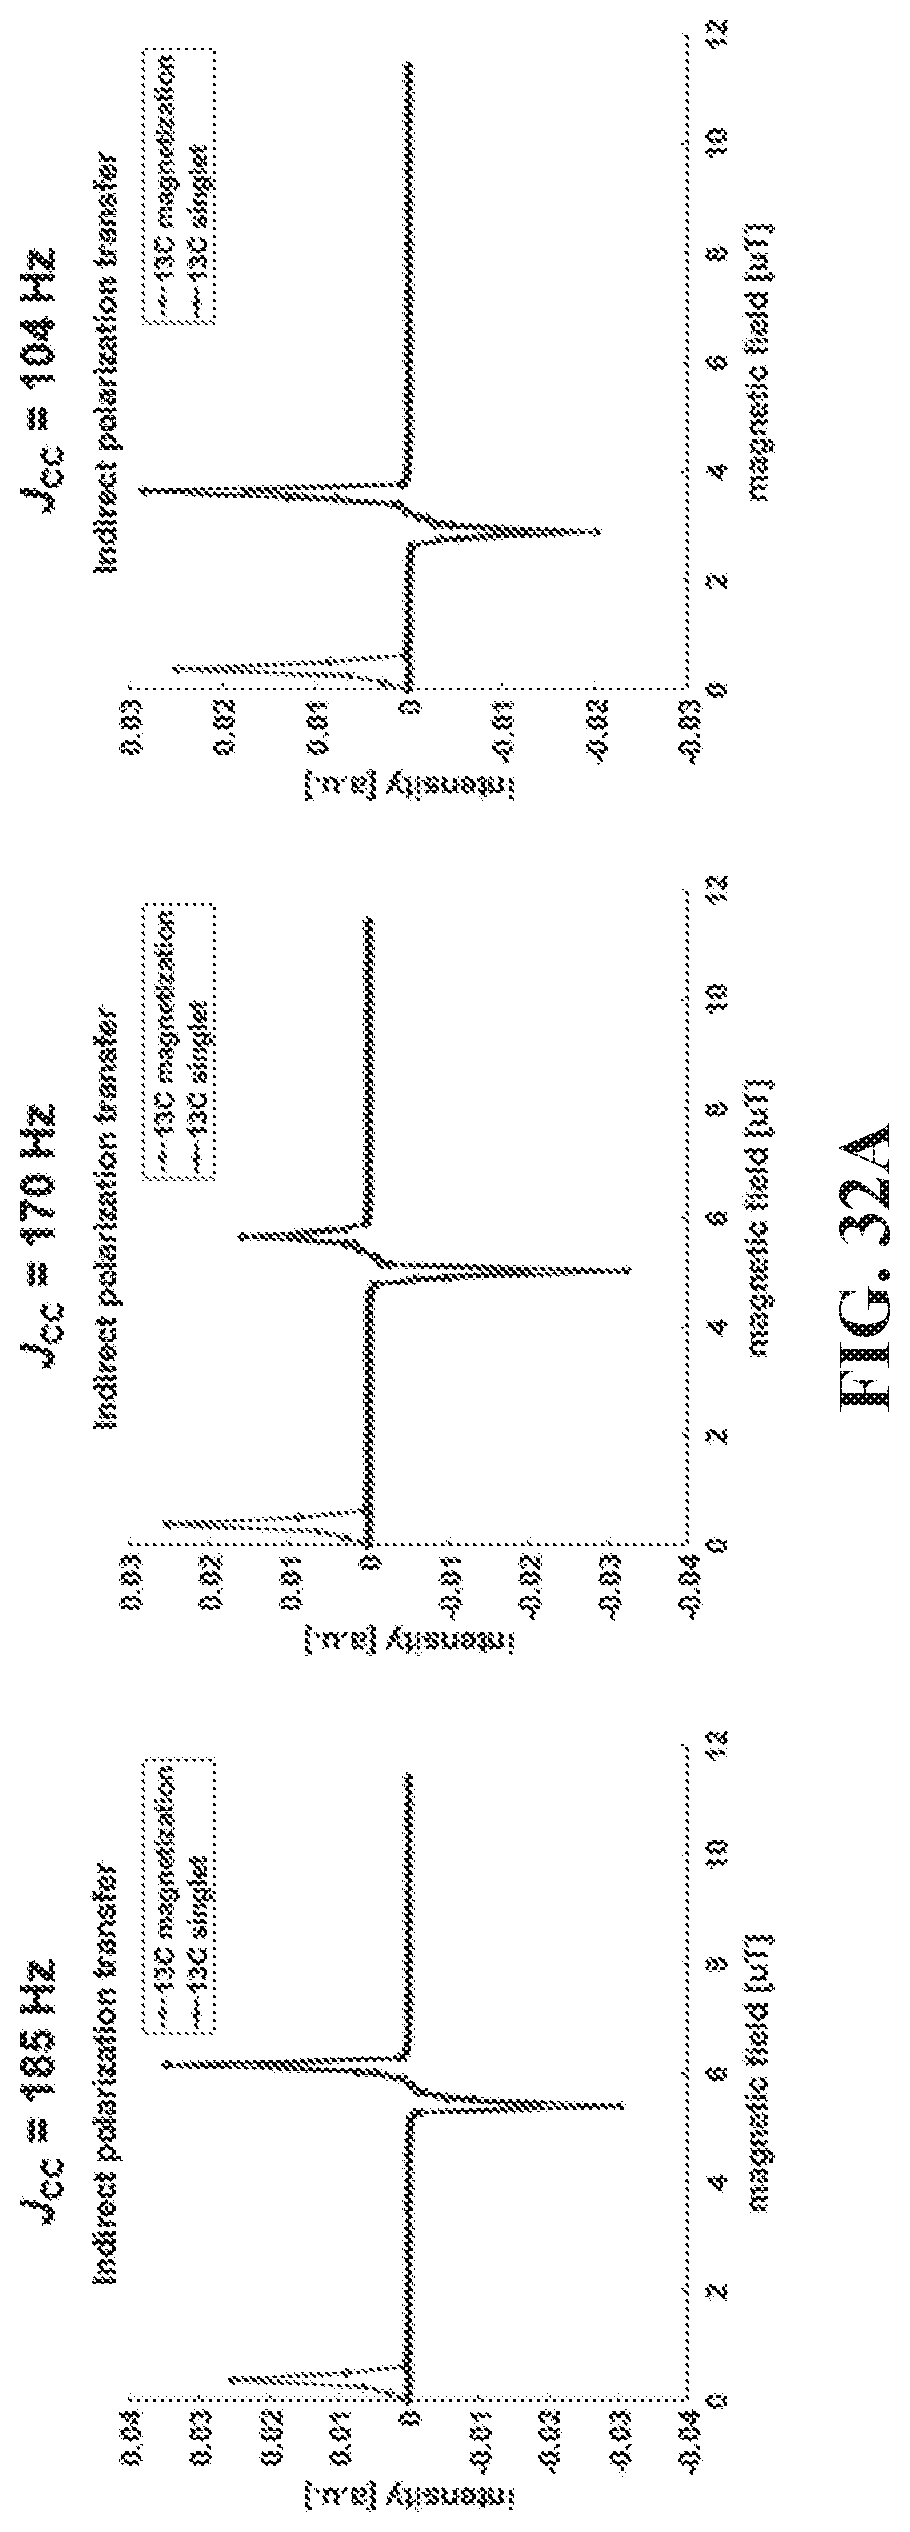
D00053
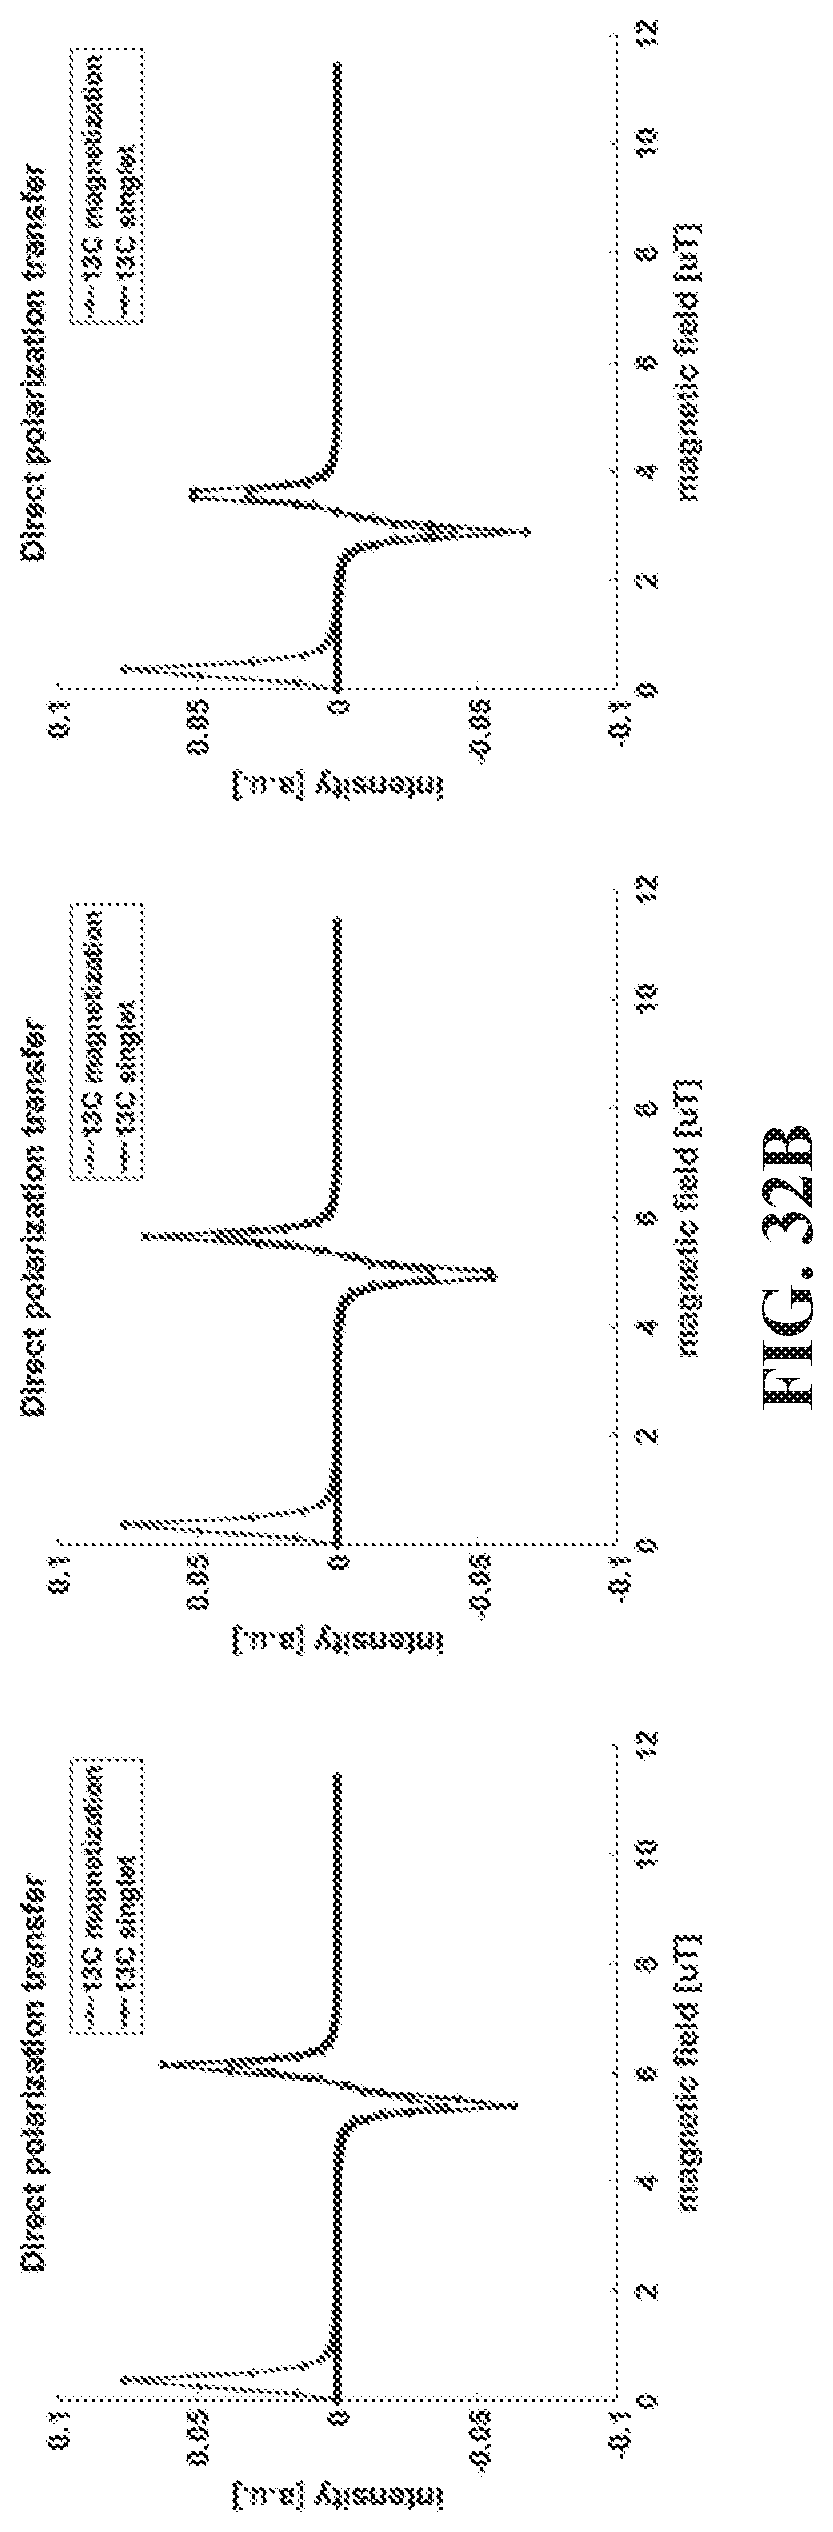
D00054
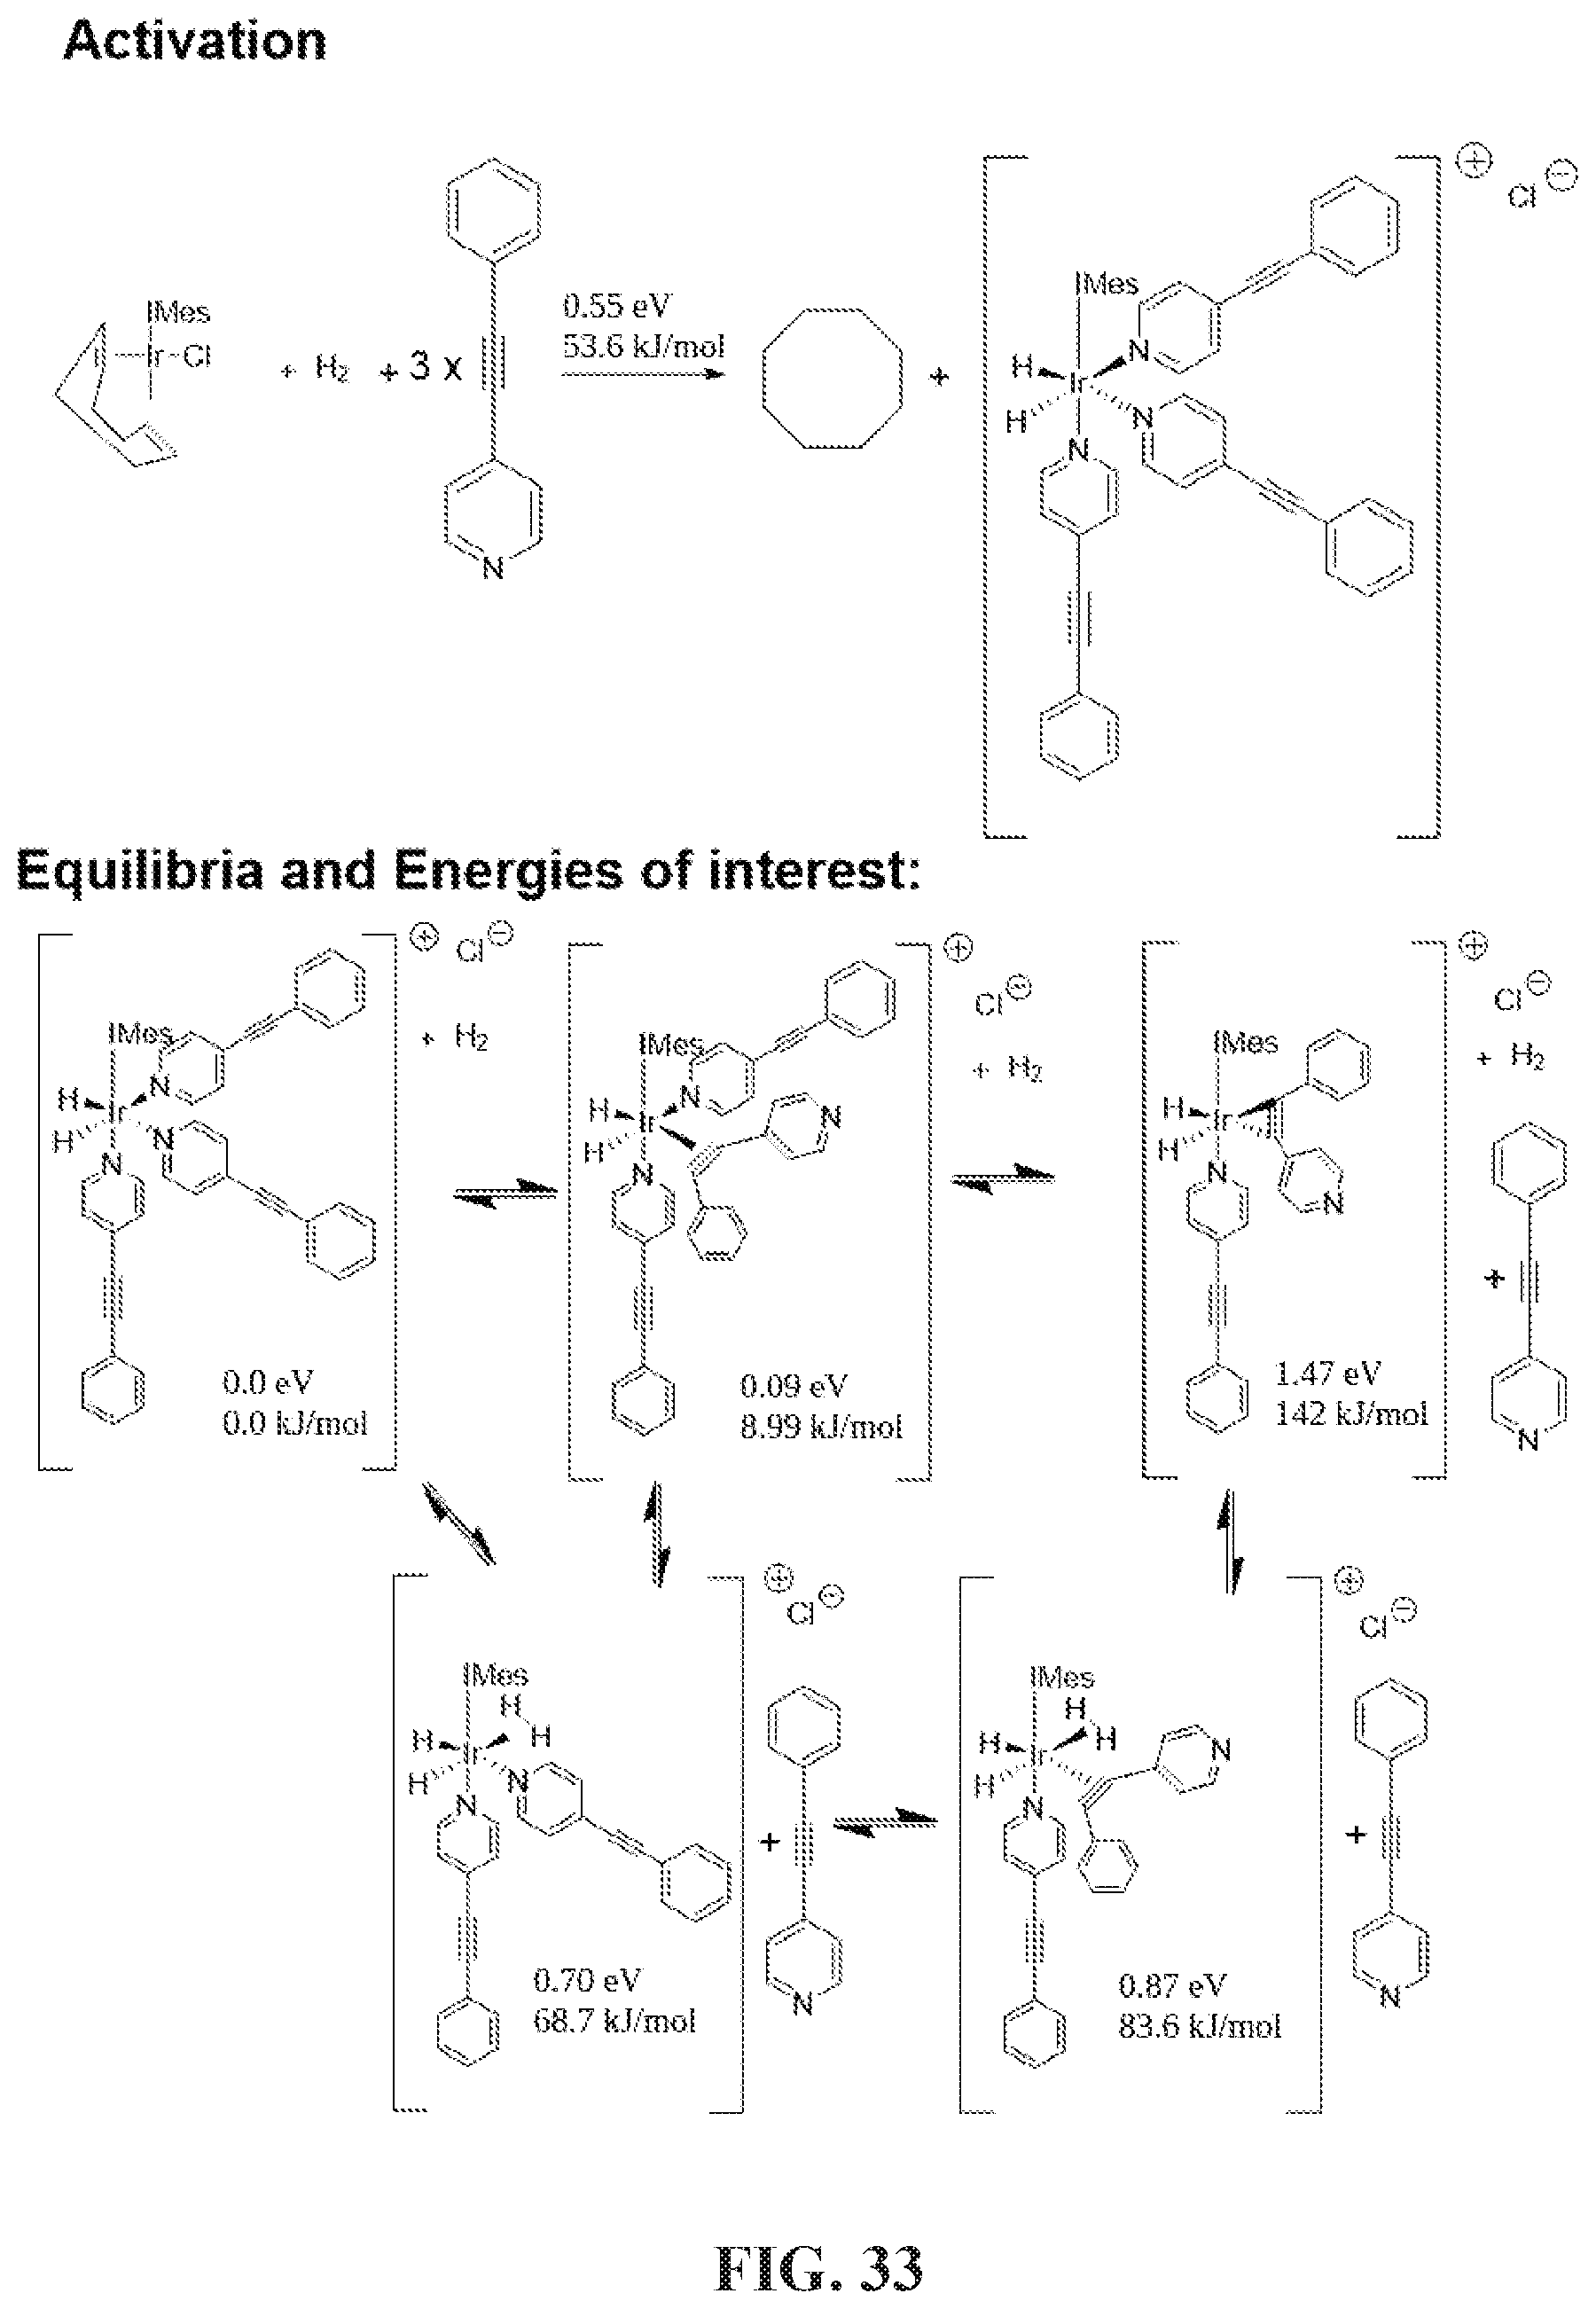


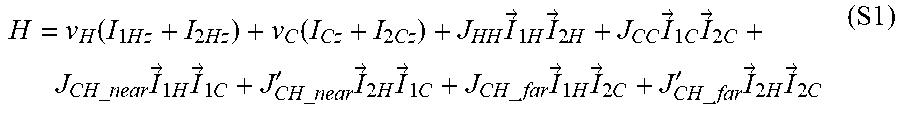

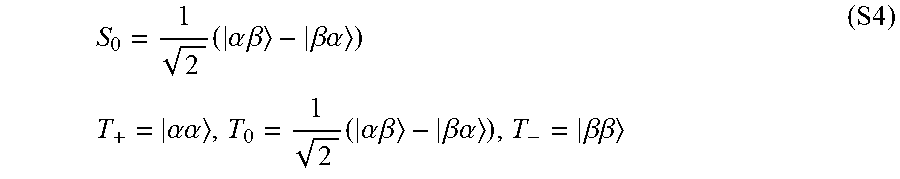
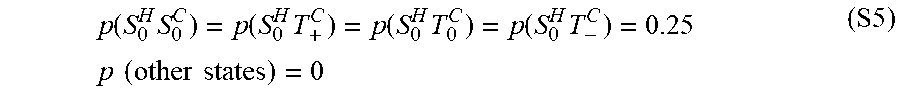


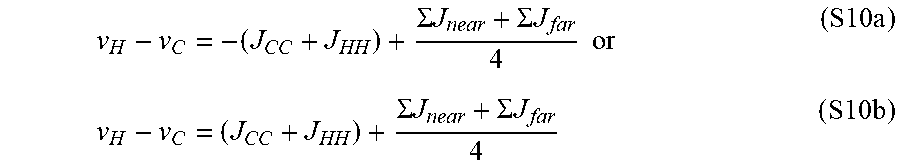


P00001

P00002

P00003

XML
uspto.report is an independent third-party trademark research tool that is not affiliated, endorsed, or sponsored by the United States Patent and Trademark Office (USPTO) or any other governmental organization. The information provided by uspto.report is based on publicly available data at the time of writing and is intended for informational purposes only.
While we strive to provide accurate and up-to-date information, we do not guarantee the accuracy, completeness, reliability, or suitability of the information displayed on this site. The use of this site is at your own risk. Any reliance you place on such information is therefore strictly at your own risk.
All official trademark data, including owner information, should be verified by visiting the official USPTO website at www.uspto.gov. This site is not intended to replace professional legal advice and should not be used as a substitute for consulting with a legal professional who is knowledgeable about trademark law.