Method And System For Improving Amplicon Sequencing Based Taxonomic Resolution Of Microbial Communities
MANDE; Sharmila Shekhar ; et al.
U.S. patent application number 16/537133 was filed with the patent office on 2020-04-16 for method and system for improving amplicon sequencing based taxonomic resolution of microbial communities. This patent application is currently assigned to Tata Consultancy Services Limited. The applicant listed for this patent is Tata Consultancy Services Limited. Invention is credited to Anirban DUTTA, Mohammed Monzoorul HAQUE, Sharmila Shekhar MANDE, Nishal Kumar PINNA.
| Application Number | 20200115766 16/537133 |
| Document ID | / |
| Family ID | 67587688 |
| Filed Date | 2020-04-16 |


View All Diagrams
| United States Patent Application | 20200115766 |
| Kind Code | A1 |
| MANDE; Sharmila Shekhar ; et al. | April 16, 2020 |
METHOD AND SYSTEM FOR IMPROVING AMPLICON SEQUENCING BASED TAXONOMIC RESOLUTION OF MICROBIAL COMMUNITIES
Abstract
The taxonomic resolution obtained with conventional sequencing methods like Sanger (longer read lengths) takes a huge amount of time. While, NGS technologies (shorter read lengths) involves a lot of cost in sequencing. In addition to that the accuracy and depth of taxonomic classification is also less. A method and system for improving accuracy of amplicon sequencing based taxonomic profiling of microbial communities has been provided. The proposed strategy relies on obtaining taxonomic abundance profiles of a microbial community from two paired-end sequencing experiments, each of which targets different pair-wise combinations of non-contiguous (or contiguous) V-regions. The two taxonomic profiles are then combined based on (pre-estimated) accuracies of the individual V-regions (targeted in the experiments) in resolving each of the taxonomic groups under consideration.
| Inventors: | MANDE; Sharmila Shekhar; (Pune, IN) ; DUTTA; Anirban; (Pune, IN) ; PINNA; Nishal Kumar; (Pune, IN) ; HAQUE; Mohammed Monzoorul; (Pune, IN) | ||||||||||
| Applicant: |
|
||||||||||
|---|---|---|---|---|---|---|---|---|---|---|---|
| Assignee: | Tata Consultancy Services
Limited Mumbai IN |
||||||||||
| Family ID: | 67587688 | ||||||||||
| Appl. No.: | 16/537133 | ||||||||||
| Filed: | August 9, 2019 |
| Current U.S. Class: | 1/1 |
| Current CPC Class: | C12N 15/1003 20130101; G16B 30/00 20190201; C12Q 1/6869 20130101; C12Q 1/6888 20130101; G16B 10/00 20190201; G16B 20/00 20190201 |
| International Class: | C12Q 1/6888 20060101 C12Q001/6888; C12Q 1/6869 20060101 C12Q001/6869; C12N 15/10 20060101 C12N015/10; G16B 30/00 20060101 G16B030/00; G16B 10/00 20060101 G16B010/00 |
Foreign Application Data
| Date | Code | Application Number |
|---|---|---|
| Aug 10, 2018 | IN | 201821030219 |
Claims
1. A method for improving accuracy of taxonomic profiling of a microbial community based on amplicon sequencing, the method comprising: collecting a biological sample from environment; obtaining a first subsample and a second subsample from the biological sample; extracting microbial DNA from the first subsample and the second subsample; sequencing, the extracted microbial DNA from the first subsample using a sequencer to get DNA sequence data, wherein the DNA sequence data comprises of a plurality of pairs of sequence fragments, and wherein each pair of the plurality of pairs of sequence fragments is generated through paired-end sequencing of an amplicon that comprises a first combination of informative regions within the amplicon, and wherein the said informative regions contain phylogenetically relevant information; sequencing, the extracted DNA from the second subsample using the sequencer to get DNA sequence data, wherein the DNA sequence data comprises of a plurality of pairs of sequence fragments, wherein each pair of the plurality of pairs of sequence fragments is generated through paired-end sequencing of the amplicon that comprises a second combination of informative regions within the amplicon, wherein the second combination of informative regions are different from the first combination of informative regions, and wherein the amplicon sequencing experiment targets a phylogenetic marker gene; generating, via one or more hardware processors, a microbial taxonomic abundance profile of the first sequenced subsample by employing a taxonomic classification method, wherein the taxonomic classification method utilizing phylogenetically relevant information corresponding to the first combination of informative regions, wherein the microbial taxonomic abundance profile comprises of abundance values corresponding to one or more pair of sequence fragments comprising the first combination of informative regions classified into a plurality of taxonomic groups; generating, via the one or more hardware processors, a microbial taxonomic abundance profile of the second sequenced subsample by employing the taxonomic classification method, wherein the taxonomic classification method utilizing phylogenetically relevant information corresponding to the second combination of informative regions, wherein the microbial taxonomic abundance profile comprises of abundance values corresponding to one or more pair of sequence fragments comprising the second combination of informative regions classified into the plurality of taxonomic groups; pre-computing, via the one or more hardware processors, taxonomic classification accuracies for all different possible combinations of informative regions for microbes belonging to the plurality of taxonomic groups, wherein the pre-computing is based on marker gene sequences of known taxonomic origin present in existing sequence databases, to generate a computation table; and combining, via the one or more hardware processors, the microbial taxonomic abundance profiles of the first and the second sequenced subsample based on the computation table to generate a combined microbial taxonomic abundance profile, wherein the combined microbial taxonomic abundance profile has a refined abundance value and has improved taxonomic classification accuracy as compared to the microbial taxonomic abundance profiles obtained individually for the first and the second subsample, or as compared to a microbial taxonomic abundance profile obtained for the entire biological sample or any other subsample of a biological sample using amplicon sequencing targeting any of the combinations of informative regions in the phylogenetic marker gene.
2. The method of claim 1, wherein combining the microbial taxonomic abundance profiles utilizes a combinatorial strategy to improve the accuracy of taxonomic profiling, wherein the combinatorial strategy further comprises: generating abundance values of a particular taxonomic group `i` (T.sub.i.sup.x and T.sub.i.sup.y) corresponding to the first and second sequenced subsamples employing a taxonomic classification method utilizing a first combination of informative region and the second combination of informative region; providing the pre-computed relative accuracies W.sub.i.sup.x and W.sub.i.sup.y in taxonomic classification for the particular taxonomic group `i` using the first combination of informative region and the second combination of informative region; and calculating the refined abundance value (T.sub.i.sup.xy) for the particular taxonomic group `i` using the following formula: T i xy = ( W i x W i y * T i x ) + T i y 1 + W i x W i y ##EQU00005##
3. The method of claim 1, further comprising calculating the refined abundance value for all the taxonomic groups to obtain a more accurate microbial taxonomic abundance profile as compared to the microbial taxonomic abundance profiles obtained individually for the first and the second subsample.
4. The method of claim 1, wherein the amplicon sequencing is performed to target the phylogenetic marker gene or portions of the phylogenetic marker gene.
5. The method of claim 1, wherein the first combination of informative regions and the second combination of informative regions can be comprised of informative regions arranged contiguously or non-contiguously in the marker gene targeted in the amplicon sequencing, wherein the amplicon sequencing is targeting a phylogentic marker gene.
6. The method of claim 1, further comprising obtaining more than two subsamples targeting multiple different informative regions, wherein the more than two subsamples also configured use combinatorial strategy to improve the accuracy of taxonomic profiling.
7. The method of claim 1, wherein the sequencing is performed to generate an amplicon constituting a 16S rRNA gene or portions of the 16S rRNA gene, and wherein the 16S rRNA gene comprises of multiple phylogenetically informative regions.
8. The method of claim 1, wherein the informative region is a variable region in a 16S rRNA gene amplicon.
9. The method of claim 1, wherein the choice of the phylogenetic marker gene and the first combination of informative regions and the second combination of informative regions within the marker gene selected for amplicon sequencing is based on the pre-computed taxonomic classification accuracies for all different possible combinations of informative regions for microbes belonging to the plurality of taxonomic groups that may be expected to inhabit the environment from which the biological sample is collected.
10. A system for improving amplicon based taxonomic resolution of microbial community, the system comprising: one or more interfaces configured to: collect a biological sample from environment; and obtain a first subsample and a second subsample from the biological sample; a DNA extractor configured to extract microbial DNA from the first subsample and the second subsample; a sequencer configured to: sequence the extracted microbial DNA from the first subsample to get DNA sequence data, wherein the DNA sequence data comprises of a plurality of pairs of sequence fragments, and wherein each pair of the plurality of pairs of sequence fragments is generated through paired-end sequencing of an amplicon that comprises a first combination of informative regions within the amplicon, and wherein the said informative regions contain phylogenetically relevant information, and sequence, the extracted DNA from the second subsample to get DNA sequence data, wherein the DNA sequence data comprises of a plurality of pairs of sequence fragments, wherein each pair of the plurality of pairs of sequence fragments is generated through paired-end sequencing of the amplicon that comprises a second combination of informative regions within the amplicon, wherein the second combination of informative regions are different from the first combination of informative regions, and wherein the amplicon sequencing experiment targets a phylogenetic marker gene; and one or more hardware processors configured to: generate a microbial taxonomic abundance profile of the first sequenced subsample by employing a taxonomic classification method, wherein the taxonomic classification method utilizing phylogenetically relevant information corresponding to the first combination of informative regions, wherein the microbial taxonomic abundance profile comprises of abundance values corresponding to one or more pair of sequence fragments comprising the first combination of informative regions classified into a plurality of taxonomic groups; generate a microbial taxonomic abundance profile of the second sequenced subsample by employing the taxonomic classification method, wherein the taxonomic classification method utilizing phylogenetically relevant information corresponding to the second combination of informative regions, wherein the microbial taxonomic abundance profile comprises of abundance values corresponding to one or more pair of sequence fragments comprising the second combination of informative regions classified into the plurality of taxonomic groups; pre-compute taxonomic classification accuracies for all different possible combinations of informative regions for microbes belonging to the plurality of taxonomic groups, wherein the pre-computing is based on marker gene sequences of known taxonomic origin present in existing sequence databases, to generate a computation table; and combine the microbial taxonomic abundance profiles of the first and the second sequenced subsample based on the computation table to generate a combined microbial taxonomic abundance profile, wherein the combined microbial taxonomic abundance profile has a refined abundance value and has improved taxonomic classification accuracy as compared to the microbial taxonomic abundance profiles obtained individually for the first and the second subsample, or as compared to a microbial taxonomic abundance profile obtained for the entire biological sample or any other subsample of a biological sample using amplicon sequencing targeting any of the combinations of informative regions in the phylogenetic marker gene.
11. One or more non-transitory machine readable information storage media comprising instructions which, when executed by one or more hardware processors, cause identification of key driver responsible for bringing a change in a microbial population by: collecting a biological sample from environment; obtaining a first subsample and a second subsample from the biological sample; extracting microbial DNA from the first subsample and the second subsample; sequencing, the extracted microbial DNA from the first subsample using a sequencer to get DNA sequence data, wherein the DNA sequence data comprises of a plurality of pairs of sequence fragments, and wherein each pair of the plurality of pairs of sequence fragments is generated through paired-end sequencing of an amplicon that comprises a first combination of informative regions within the amplicon, and wherein the said informative regions contain phylogenetically relevant information; sequencing, the extracted DNA from the second subsample using the sequencer to get DNA sequence data, wherein the DNA sequence data comprises of a plurality of pairs of sequence fragments, wherein each pair of the plurality of pairs of sequence fragments is generated through paired-end sequencing of the amplicon that comprises a second combination of informative regions within the amplicon, wherein the second combination of informative regions are different from the first combination of informative regions, and wherein the amplicon sequencing experiment targets a phylogenetic marker gene; generating, via the one or more hardware processors, a microbial taxonomic abundance profile of the first sequenced subsample by employing a taxonomic classification method, wherein the taxonomic classification method utilizing phylogenetically relevant information corresponding to the first combination of informative regions, wherein the microbial taxonomic abundance profile comprises of abundance values corresponding to one or more pair of sequence fragments comprising the first combination of informative regions classified into a plurality of taxonomic groups; generating, via the one or more hardware processors, a microbial taxonomic abundance profile of the second sequenced subsample by employing the taxonomic classification method, wherein the taxonomic classification method utilizing phylogenetically relevant information corresponding to the second combination of informative regions, wherein the microbial taxonomic abundance profile comprises of abundance values corresponding to one or more pair of sequence fragments comprising the second combination of informative regions classified into the plurality of taxonomic groups; pre-computing, via the one or more hardware processors, taxonomic classification accuracies for all different possible combinations of informative regions for microbes belonging to the plurality of taxonomic groups, wherein the pre-computing is based on marker gene sequences of known taxonomic origin present in existing sequence databases, to generate a computation table; and combining, via the one or more hardware processors, the microbial taxonomic abundance profiles of the first and the second sequenced subsample based on the computation table to generate a combined microbial taxonomic abundance profile, wherein the combined microbial taxonomic abundance profile has a refined abundance value and has improved taxonomic classification accuracy as compared to the microbial taxonomic abundance profiles obtained individually for the first and the second subsample, or as compared to a microbial taxonomic abundance profile obtained for the entire biological sample or any other subsample of a biological sample using amplicon sequencing targeting any of the combinations of informative regions in the phylogenetic marker gene.
Description
PRIORITY CLAIM
[0001] This U.S. patent application claims priority under 35 U.S.C. .sctn. 119 to Indian Application No. 201821030219, filed on Aug. 10, 2018. The entire contents of the aforementioned application are incorporated herein by reference.
TECHNICAL FIELD
[0002] The embodiments herein generally relates to the field of taxonomic profiling of microbial communities. More particularly, but not specifically, the invention provides a system and method for improving amplicon sequencing based taxonomic profiling or resolution of microbial communities.
BACKGROUND
[0003] Sequencing of 16S rRNA genes is a standard protocol for taxonomic characterization of bacterial species. Sanger sequencing has been conventionally used for obtaining "full-length" 16S rRNA gene sequences of individual bacterium. Next generation sequencing (NGS) technologies have enabled probing of microbial diversity in different environmental niches with unprecedented sequencing depth. Sequencing of such regions (encompassing one or more variable regions or V-regions) has been utilized in microbiome studies for obtaining taxonomic assignments for bacterial groups present in the studied environment. However, due to read-length limitations of popular NGS technologies, 16S amplicon sequencing based microbiome studies rely on targeting short stretches of the 16S rRNA gene encompassing a selection of variable (V) regions. In most cases such a short stretch constitutes a single V-region or a couple of V-regions placed adjacent to each other on the 16S rRNA gene. Given that different V-regions have different resolving ability with respect to various taxonomic groups, selecting the optimal V-region (or a combination thereof) remains one challenge.
[0004] Furthermore, NGS technologies although enable sequencing in ultrahigh-throughput mode, they are limited with respect to read-lengths. These technologies are currently capable of yielding short sequences (referred to as reads). Due to the mentioned limitations of read-length, 16S rRNA amplicon-based microbiome studies currently rely on sequencing short stretches within the span of the 16S rRNA gene. These short stretches encompass a selection of variable (V) regions. In most cases, the said short stretch constitutes a single V-region (.about.150-250 base pairs in length) or a couple of V-regions placed adjacent to each other on the 16S rRNA gene. As compared to the taxonomic resolution obtained through analysis of `full-length` 16S rRNA gene sequences (.about.1200-1500 base pairs in length) generated using the classical Sanger sequencing technology, short reads provide limited taxonomic resolution because the limited information embedded in such short reads makes it computationally challenging to unambiguously compare and associate them with template/reference database sequences whose taxonomy is known with certainty.
[0005] Nevertheless, the relative lower cost of NGS and the throughput they achieve make them an attractive proposition. The challenge/problem is to reduce the difference/gap in taxonomic resolution obtained with conventional sequencing methods like Sanger (longer read lengths) and NGS technologies (shorter read lengths) without increasing the cost of sequencing employing NGS technologies.
SUMMARY
[0006] Embodiments of the present disclosure present technological improvements as solutions to one or more of the above-mentioned technical problems recognized by the inventors in conventional systems. For example, in one embodiment, a system for improving amplicon based taxonomic resolution of microbial community. The system comprises a sample collection module, an input module, a DNA extraction module, a sequence, a first microbial abundance profile generation module, a second microbial abundance profile generation module, one or more hardware processors and a memory. The memory further comprises a computation table generation module and a combined microbial abundance profile generation module. The sample collection module collects a biological sample from environment. The input module obtains a first subsample and a second subsample from the biological sample. The DNA extraction module extracts microbial DNA from the first subsample and the second subsample. The sequencer sequences the extracted microbial DNA from the first subsample to get DNA sequence data, wherein the DNA sequence data comprises of a plurality of pairs of sequence fragments, and wherein each pair of the plurality of pairs of sequence fragments is generated through paired-end sequencing of an amplicon that comprises a first combination of informative regions within the amplicon, and wherein the said informative regions contain phylogenetically relevant information. The sequencer also sequences the extracted DNA from the second subsample to get DNA sequence data, wherein the DNA sequence data comprises of a plurality of pairs of sequence fragments, wherein each pair of the plurality of pairs of sequence fragments is generated through paired-end sequencing of the amplicon that comprises a second combination of informative regions within the amplicon, wherein the second combination of informative regions are different from the first combination of informative regions, and wherein the amplicon sequencing experiment targets a phylogenetic marker gene. The first microbial abundance profile generation module generated a microbial taxonomic abundance profile of the first sequenced subsample by employing a taxonomic classification method, wherein the taxonomic classification method utilizing phylogenetically relevant information corresponding to the first combination of informative regions, wherein the microbial taxonomic abundance profile comprises of abundance values corresponding to one or more pair of sequence fragments comprising the first combination of informative regions classified into a plurality of taxonomic groups. The second microbial abundance profile generation module generates a microbial taxonomic abundance profile of the second sequenced subsample by employing the taxonomic classification method, wherein the taxonomic classification method utilizing phylogenetically relevant information corresponding to the second combination of informative regions, wherein the microbial taxonomic abundance profile comprises of abundance values corresponding to one or more pair of sequence fragments comprising the second combination of informative regions classified into the plurality of taxonomic groups. The computation table generation module pre-computes taxonomic classification accuracies for all different possible combinations of informative regions for microbes belonging to the plurality of taxonomic groups, wherein the pre-computing is based on marker gene sequences of known taxonomic origin present in existing sequence databases, to generate a computation table. The combined microbial abundance profile generation module combines the microbial taxonomic abundance profiles of the first and the second sequenced subsample based on the computation table to generate a combined microbial taxonomic abundance profile, wherein the combined microbial taxonomic abundance profile has a refined abundance value and has improved taxonomic classification accuracy as compared to the microbial taxonomic abundance profiles obtained individually for the first and the second subsample, or as compared to a microbial taxonomic abundance profile obtained for the entire biological sample or any other subsample of a biological sample using amplicon sequencing targeting any of the combinations of informative regions in the phylogenetic marker gene.
[0007] In another aspect the embodiment here provides a method for improving accuracy of taxonomic profiling of a microbial community based on amplicon sequencing. Initially, a biological sample is collected from environment. A first subsample and a second subsample is then obtained from the biological sample. In the next step, microbial DNA is extracted from the first subsample and the second subsample. Later, The extracted microbial DNA from the first subsample is sequenced using a sequencer to get DNA sequence data, wherein the DNA sequence data comprises of a plurality of pairs of sequence fragments, and wherein each pair of the plurality of pairs of sequence fragments is generated through paired-end sequencing of an amplicon that comprises a first combination of informative regions within the amplicon, and wherein the said informative regions contain phylogenetically relevant information. Similarly, the extracted DNA from the second subsample is also sequenced using the sequencer to get DNA sequence data, wherein the DNA sequence data comprises of a plurality of pairs of sequence fragments, wherein each pair of the plurality of pairs of sequence fragments is generated through paired-end sequencing of the amplicon that comprises a second combination of informative regions within the amplicon, wherein the second combination of informative regions are different from the first combination of informative regions, and wherein the amplicon sequencing experiment targets a phylogenetic marker gene. In the next step, a microbial taxonomic abundance profile of the first sequenced subsample is generated by employing a taxonomic classification method, wherein the taxonomic classification method utilizing phylogenetically relevant information corresponding to the first combination of informative regions, wherein the microbial taxonomic abundance profile comprises of abundance values corresponding to one or more pair of sequence fragments comprising the first combination of informative regions classified into a plurality of taxonomic groups. Similarly, a microbial taxonomic abundance profile of the second sequenced subsample is generated by employing the taxonomic classification method, wherein the taxonomic classification method utilizing phylogenetically relevant information corresponding to the second combination of informative regions, wherein the microbial taxonomic abundance profile comprises of abundance values corresponding to one or more pair of sequence fragments comprising the second combination of informative regions classified into the plurality of taxonomic groups. In the next step, taxonomic classification accuracies are pre-computed for all different possible combinations of informative regions for microbes belonging to the plurality of taxonomic groups, wherein the pre-computing is based on marker gene sequences of known taxonomic origin present in existing sequence databases, to generate a computation table. And finally, the microbial taxonomic abundance profiles of the first and the second sequenced subsample is combined based on the computation table to generate a combined microbial taxonomic abundance profile, wherein the combined microbial taxonomic abundance profile has a refined abundance value and has improved taxonomic classification accuracy as compared to the microbial taxonomic abundance profiles obtained individually for the first and the second subsample, or as compared to a microbial taxonomic abundance profile obtained for the entire biological sample or any other subsample of a biological sample using amplicon sequencing targeting any of the combinations of informative regions in the phylogenetic marker gene.
[0008] In another aspect the embodiment here provides one or more non-transitory machine readable information storage mediums comprising one or more instructions which when executed by one or more hardware processors cause improving accuracy of taxonomic profiling of a microbial community based on amplicon sequencing. Initially, a biological sample is collected from environment. A first subsample and a second subsample is then obtained from the biological sample. In the next step, microbial DNA is extracted from the first subsample and the second subsample. Later, The extracted microbial DNA from the first subsample is sequenced using a sequencer to get DNA sequence data, wherein the DNA sequence data comprises of a plurality of pairs of sequence fragments, and wherein each pair of the plurality of pairs of sequence fragments is generated through paired-end sequencing of an amplicon that comprises a first combination of informative regions within the amplicon, and wherein the said informative regions contain phylogenetically relevant information. Similarly, the extracted DNA from the second subsample is also sequenced using the sequencer to get DNA sequence data, wherein the DNA sequence data comprises of a plurality of pairs of sequence fragments, wherein each pair of the plurality of pairs of sequence fragments is generated through paired-end sequencing of the amplicon that comprises a second combination of informative regions within the amplicon, wherein the second combination of informative regions are different from the first combination of informative regions, and wherein the amplicon sequencing experiment targets a phylogenetic marker gene. In the next step, a microbial taxonomic abundance profile of the first sequenced subsample is generated by employing a taxonomic classification method, wherein the taxonomic classification method utilizing phylogenetically relevant information corresponding to the first combination of informative regions, wherein the microbial taxonomic abundance profile comprises of abundance values corresponding to one or more pair of sequence fragments comprising the first combination of informative regions classified into a plurality of taxonomic groups. Similarly, a microbial taxonomic abundance profile of the second sequenced subsample is generated by employing the taxonomic classification method, wherein the taxonomic classification method utilizing phylogenetically relevant information corresponding to the second combination of informative regions, wherein the microbial taxonomic abundance profile comprises of abundance values corresponding to one or more pair of sequence fragments comprising the second combination of informative regions classified into the plurality of taxonomic groups. In the next step, taxonomic classification accuracies are pre-computed for all different possible combinations of informative regions for microbes belonging to the plurality of taxonomic groups, wherein the pre-computing is based on marker gene sequences of known taxonomic origin present in existing sequence databases, to generate a computation table. And finally, the microbial taxonomic abundance profiles of the first and the second sequenced subsample is combined based on the computation table to generate a combined microbial taxonomic abundance profile, wherein the combined microbial taxonomic abundance profile has a refined abundance value and has improved taxonomic classification accuracy as compared to the microbial taxonomic abundance profiles obtained individually for the first and the second subsample, or as compared to a microbial taxonomic abundance profile obtained for the entire biological sample or any other subsample of a biological sample using amplicon sequencing targeting any of the combinations of informative regions in the phylogenetic marker gene.
[0009] It is to be understood that both the foregoing general description and the following detailed description are exemplary and explanatory only and are not restrictive of the invention, as claimed.
BRIEF DESCRIPTION OF THE DRAWINGS
[0010] The accompanying drawings, which are incorporated in and constitute a part of this disclosure, illustrate exemplary embodiments and, together with the description, serve to explain the disclosed principles.
[0011] FIG. 1 illustrates a block diagram of a system for improving accuracy of amplicon based taxonomic profiling of microbial community according to an embodiment of the present disclosure.
[0012] FIGS. 2A, 2B and 2C illustrate a flowchart showing the steps involved in improving accuracy of amplicon based taxonomic profiling of microbial community according to an embodiment of the present disclosure.
[0013] FIG. 3 is a flowchart showing combinatorial strategy for targeting multiple pair-wise combinations of non-contiguous (or contiguous) V-regions according to an embodiment of the present disclosure.
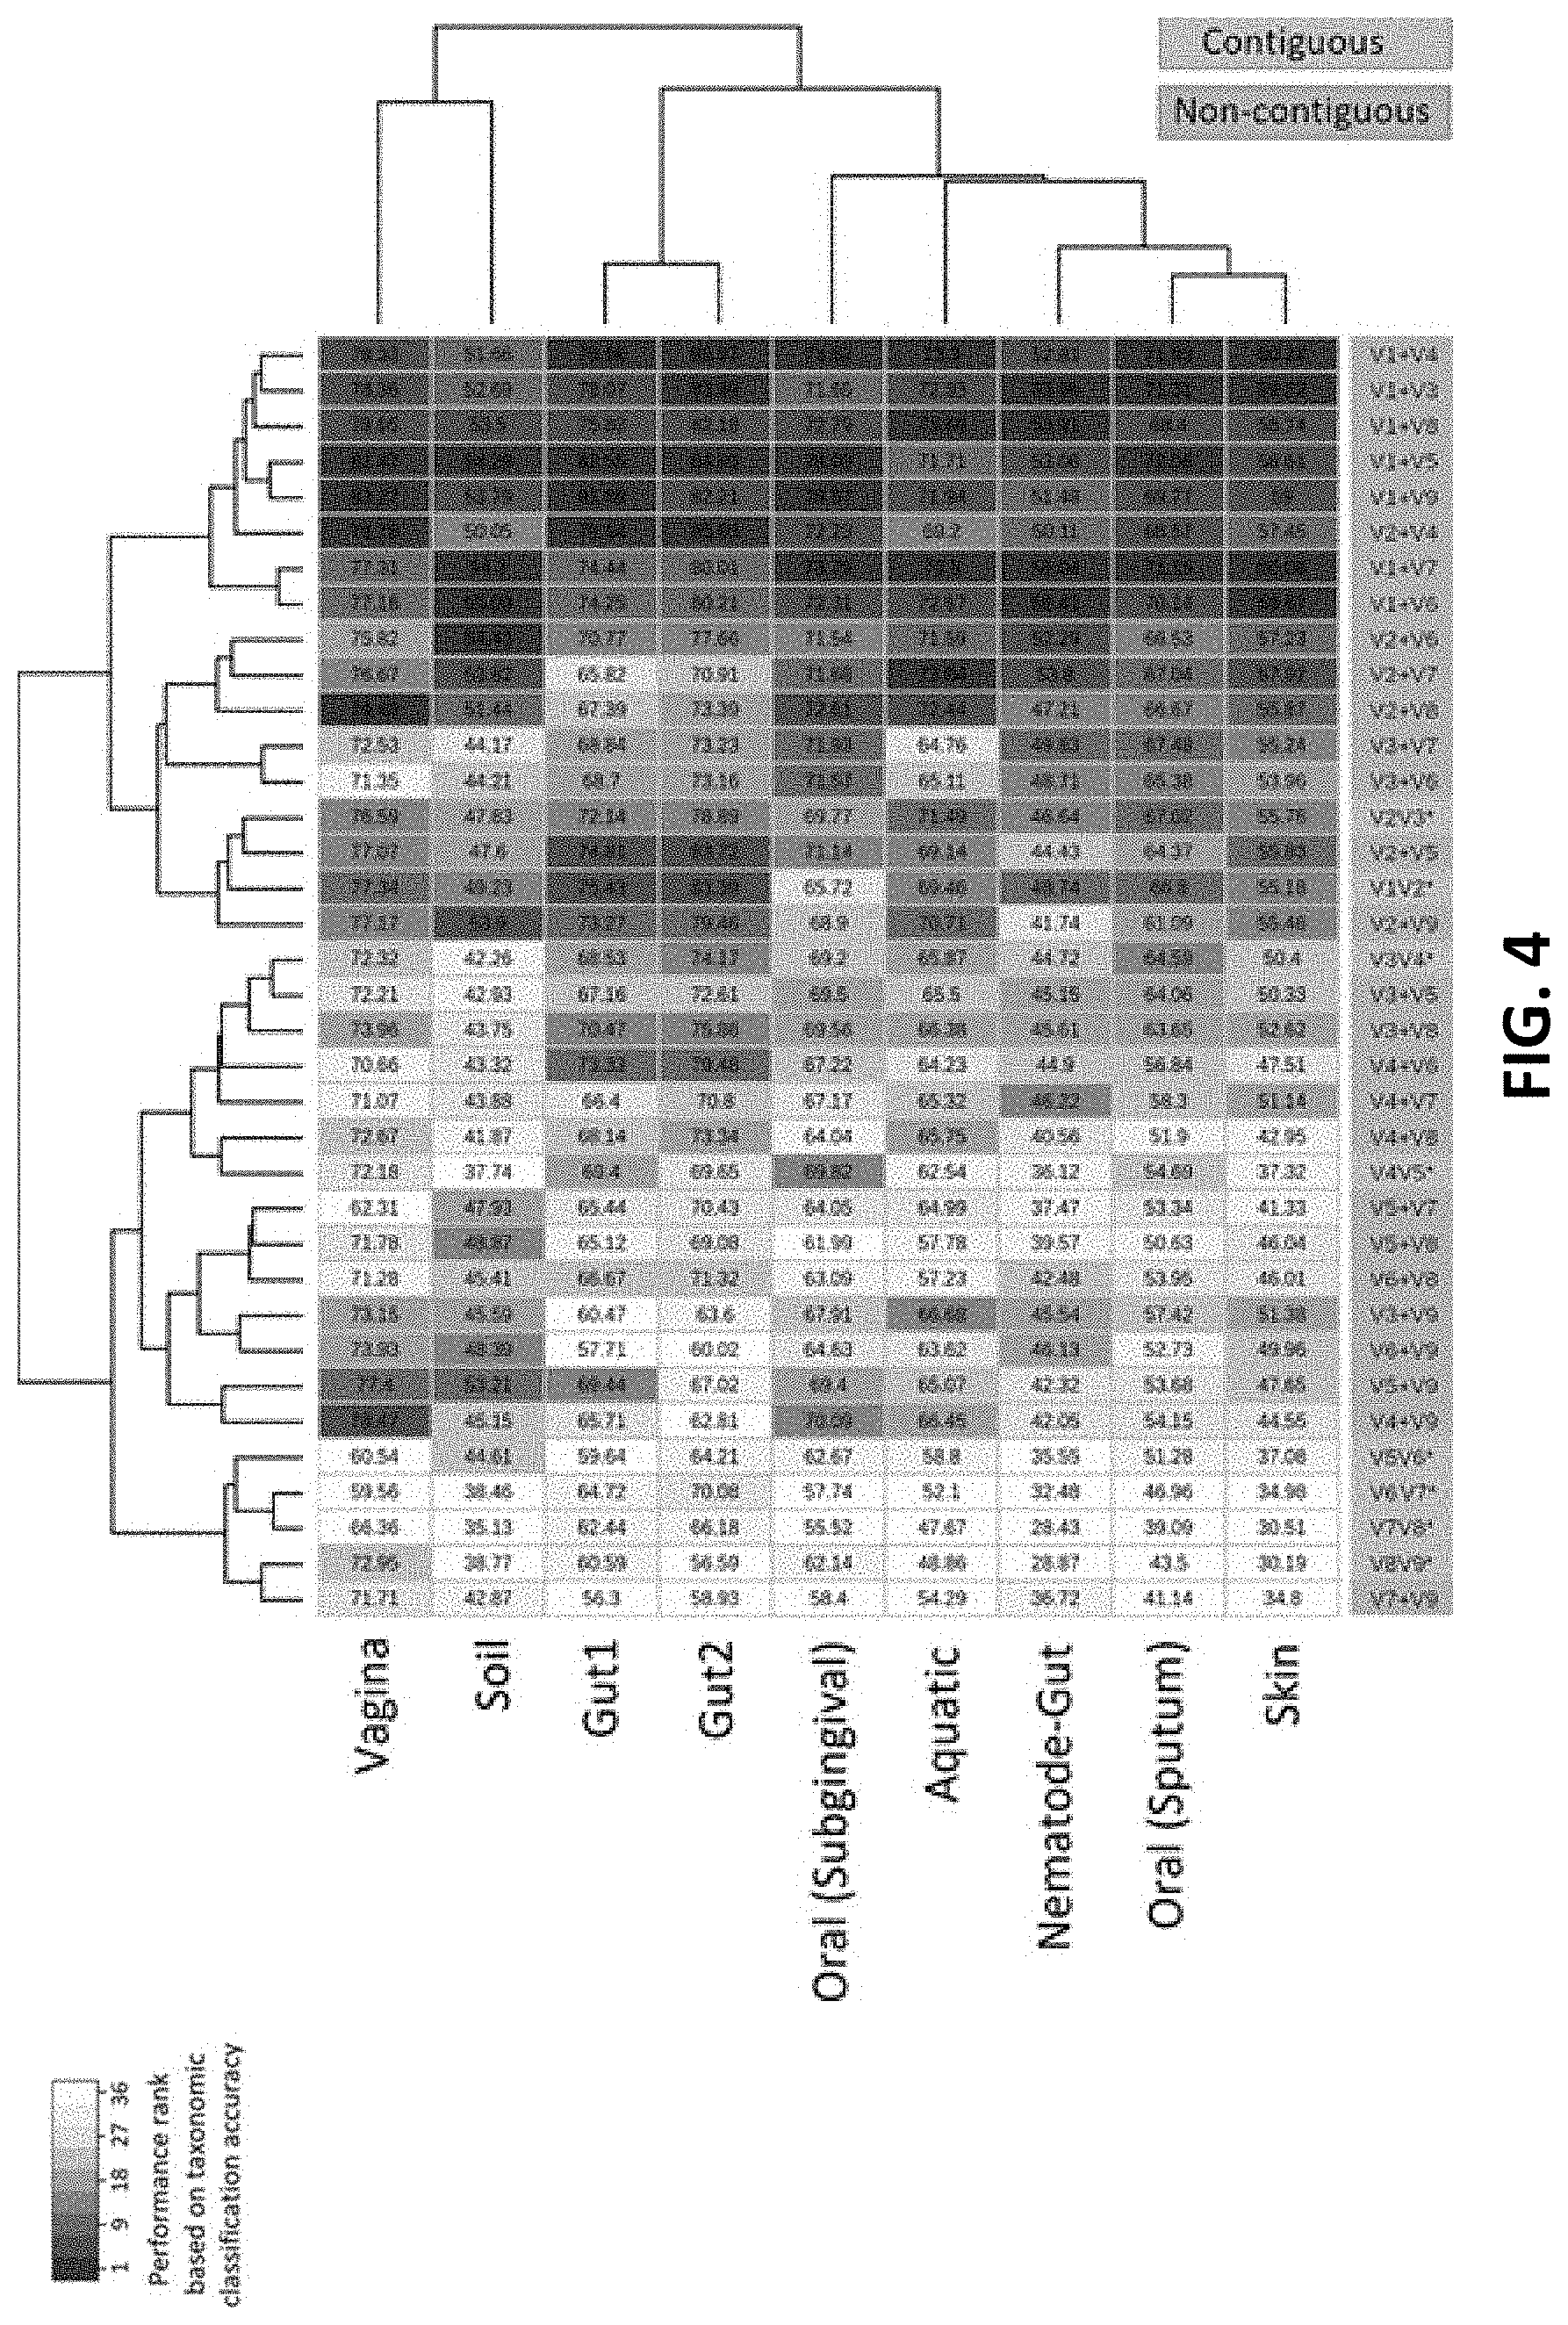
[0014] FIG. 4 shows taxonomic classification efficiency of different combinations of V-regions evaluated on nine simulated microbiome datasets mimicking different host (human) associated and/or other environmental niches according to an embodiment of the disclosure.
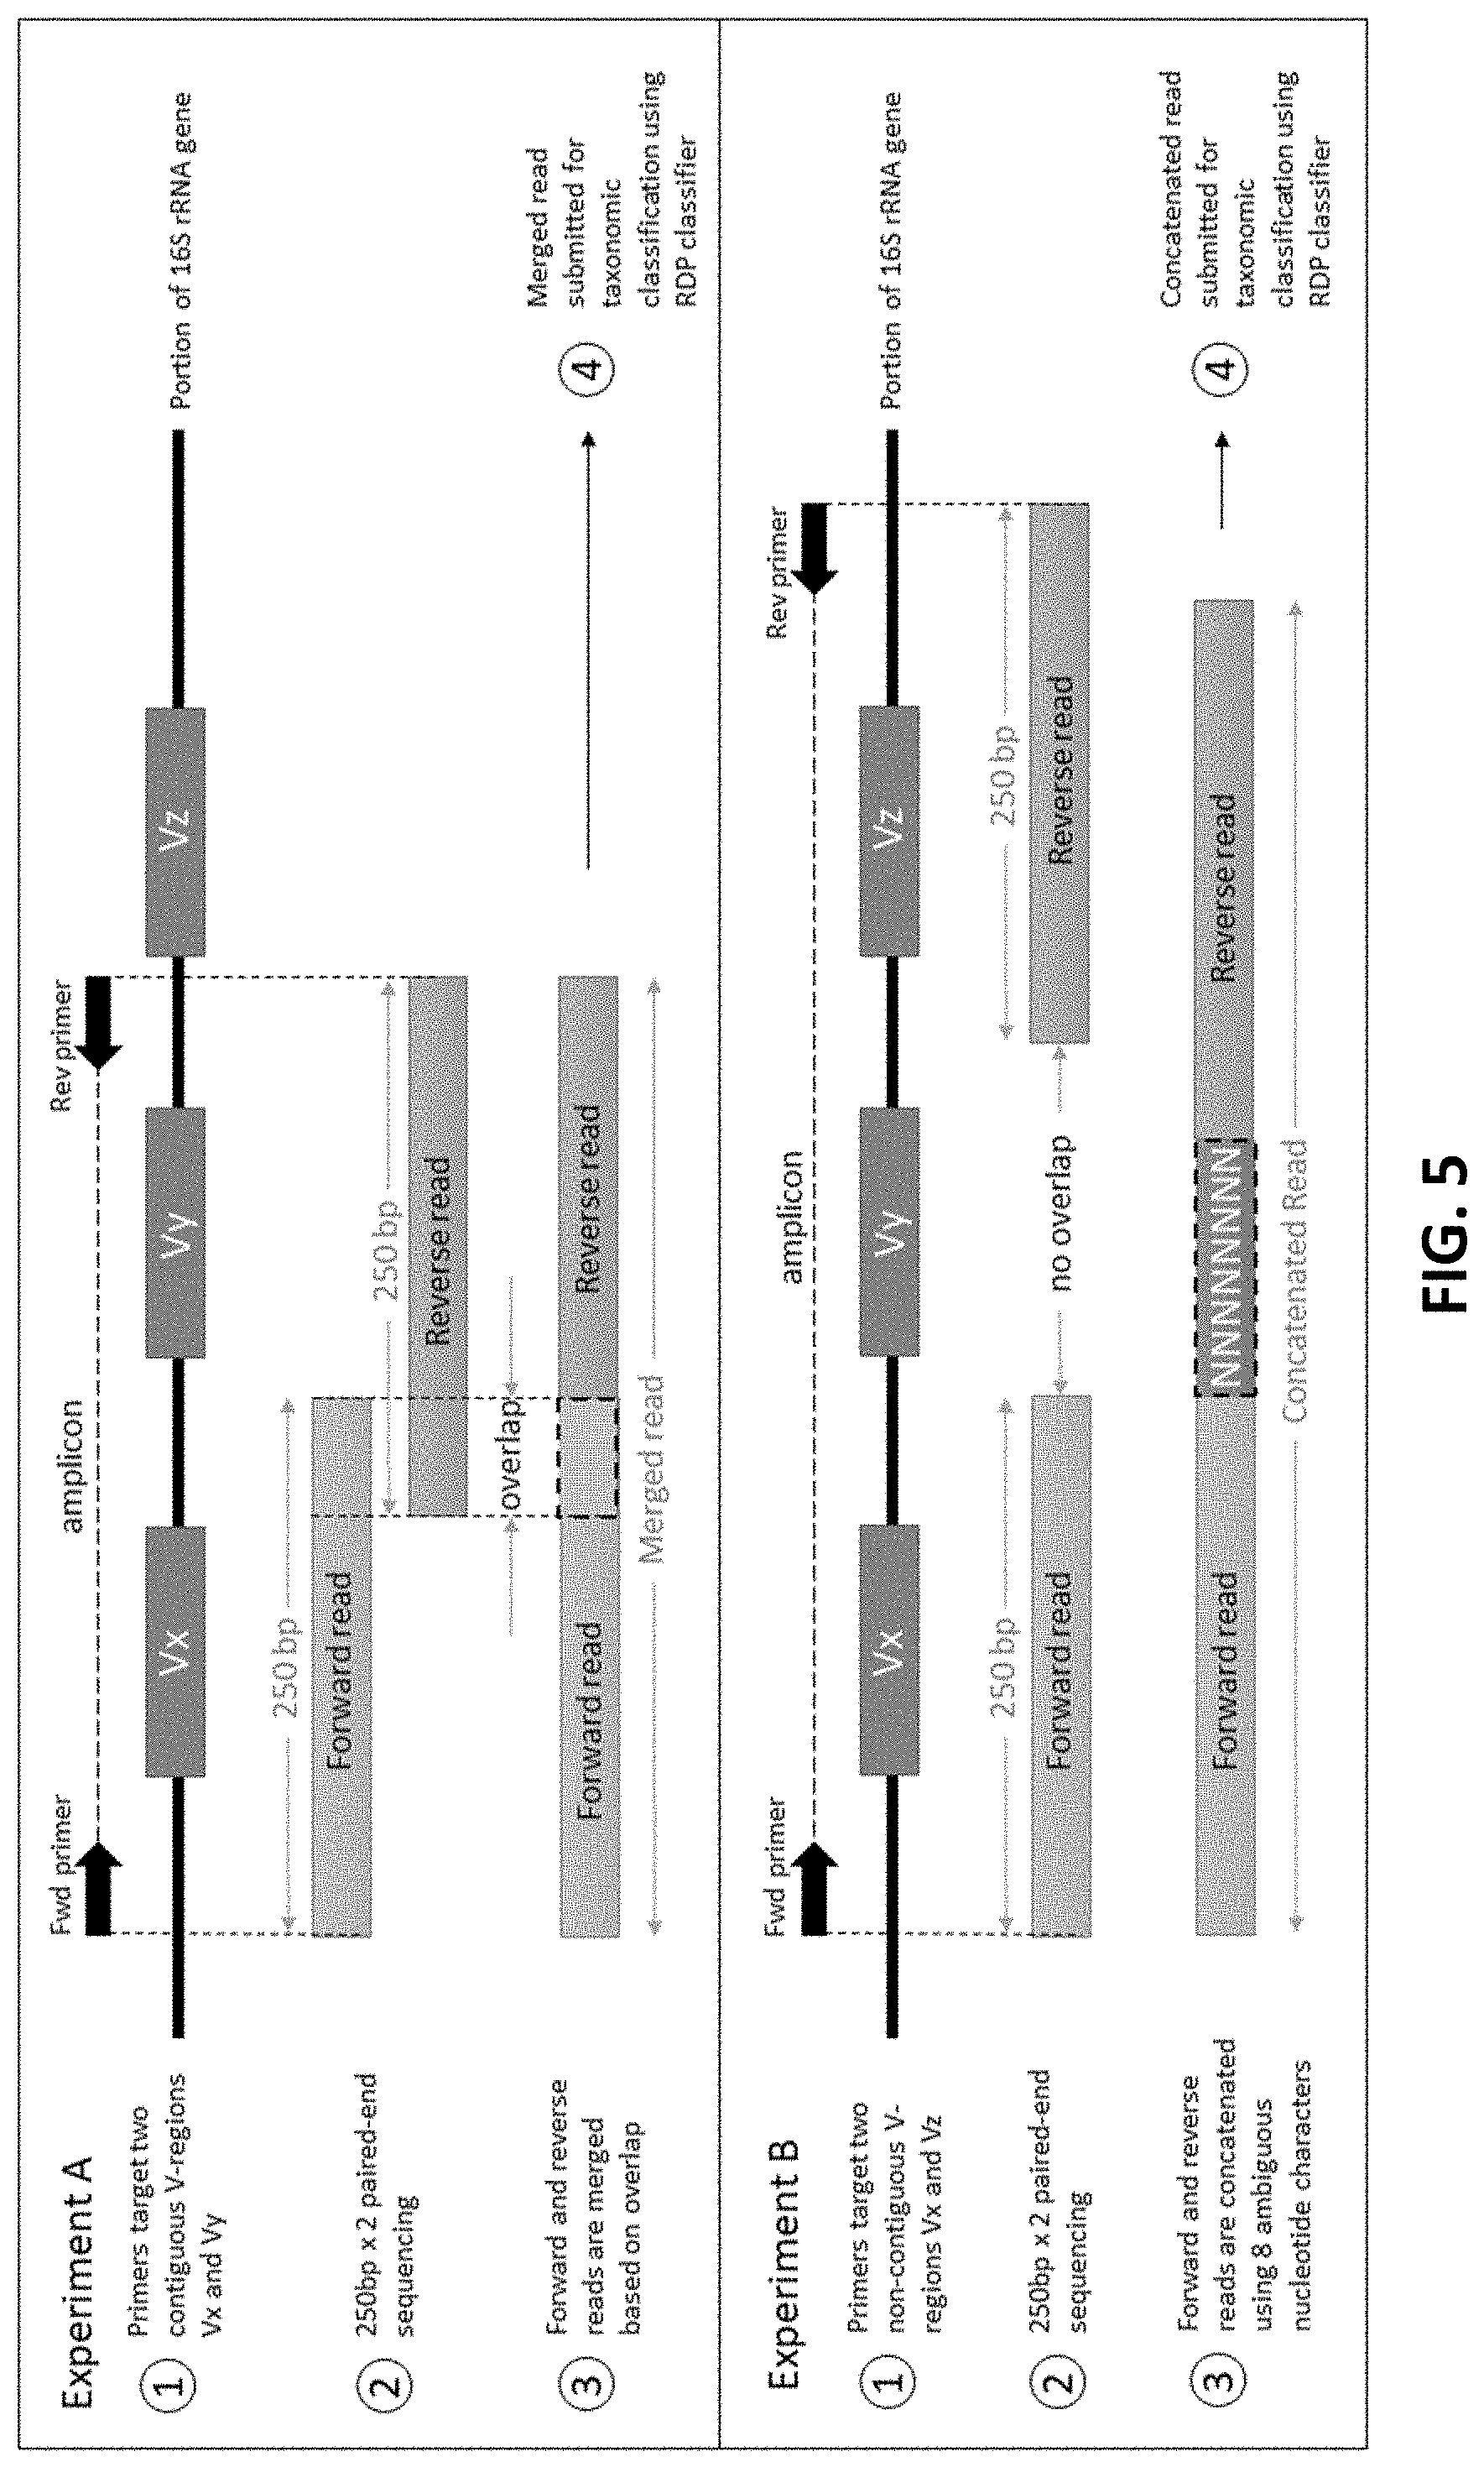
[0015] FIG. 5 depicts two amplicon sequencing experiments targeting different combinations of V-regions according to an embodiment of the disclosure.
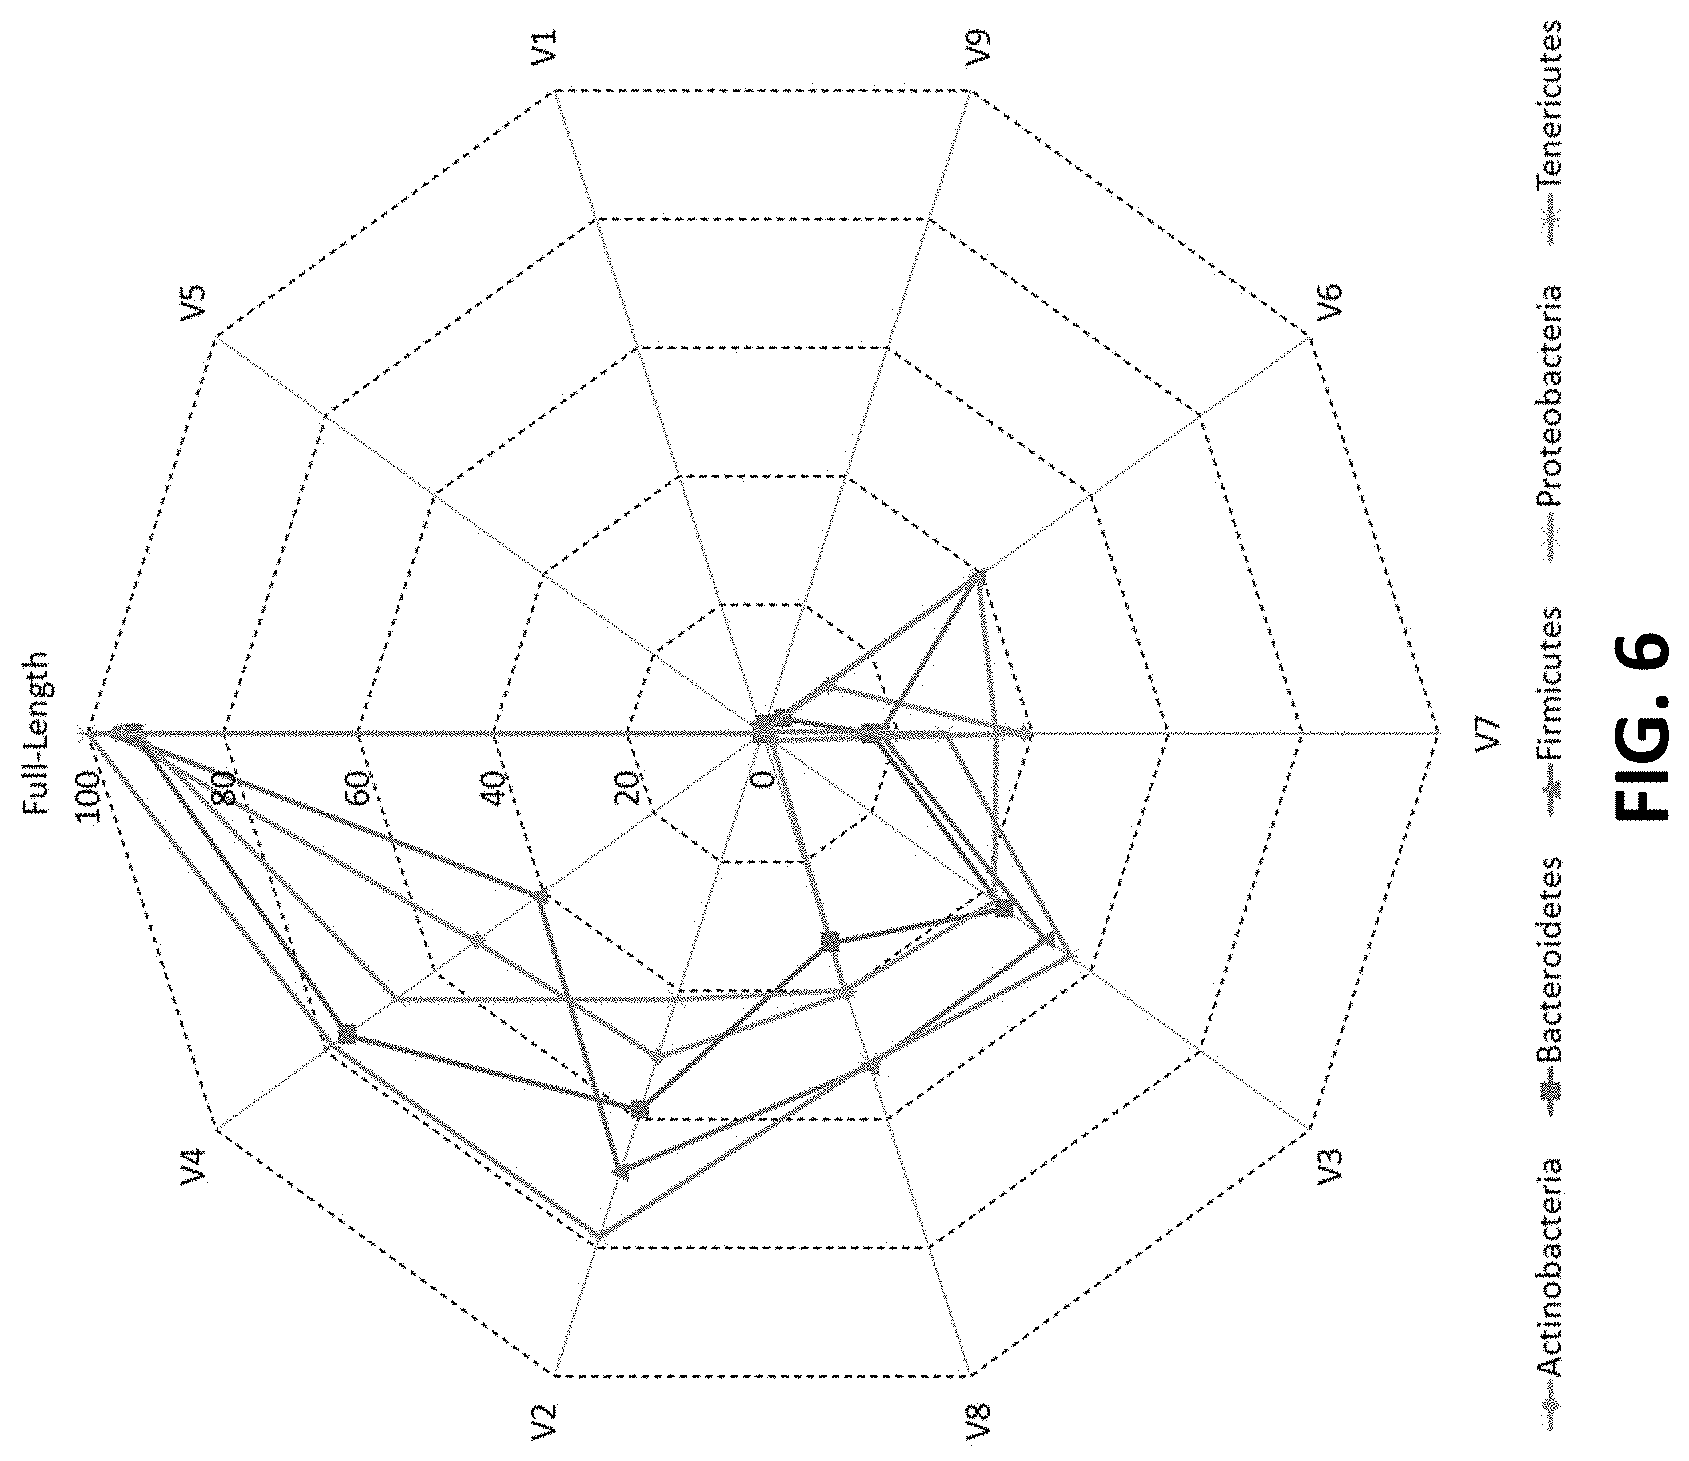
[0016] FIG. 6 shows a plot depicting the percentage of 16S rRNA genes present in RDP database that could be correctly classified utilizing different variable (V) regions according to an embodiment of the disclosure.
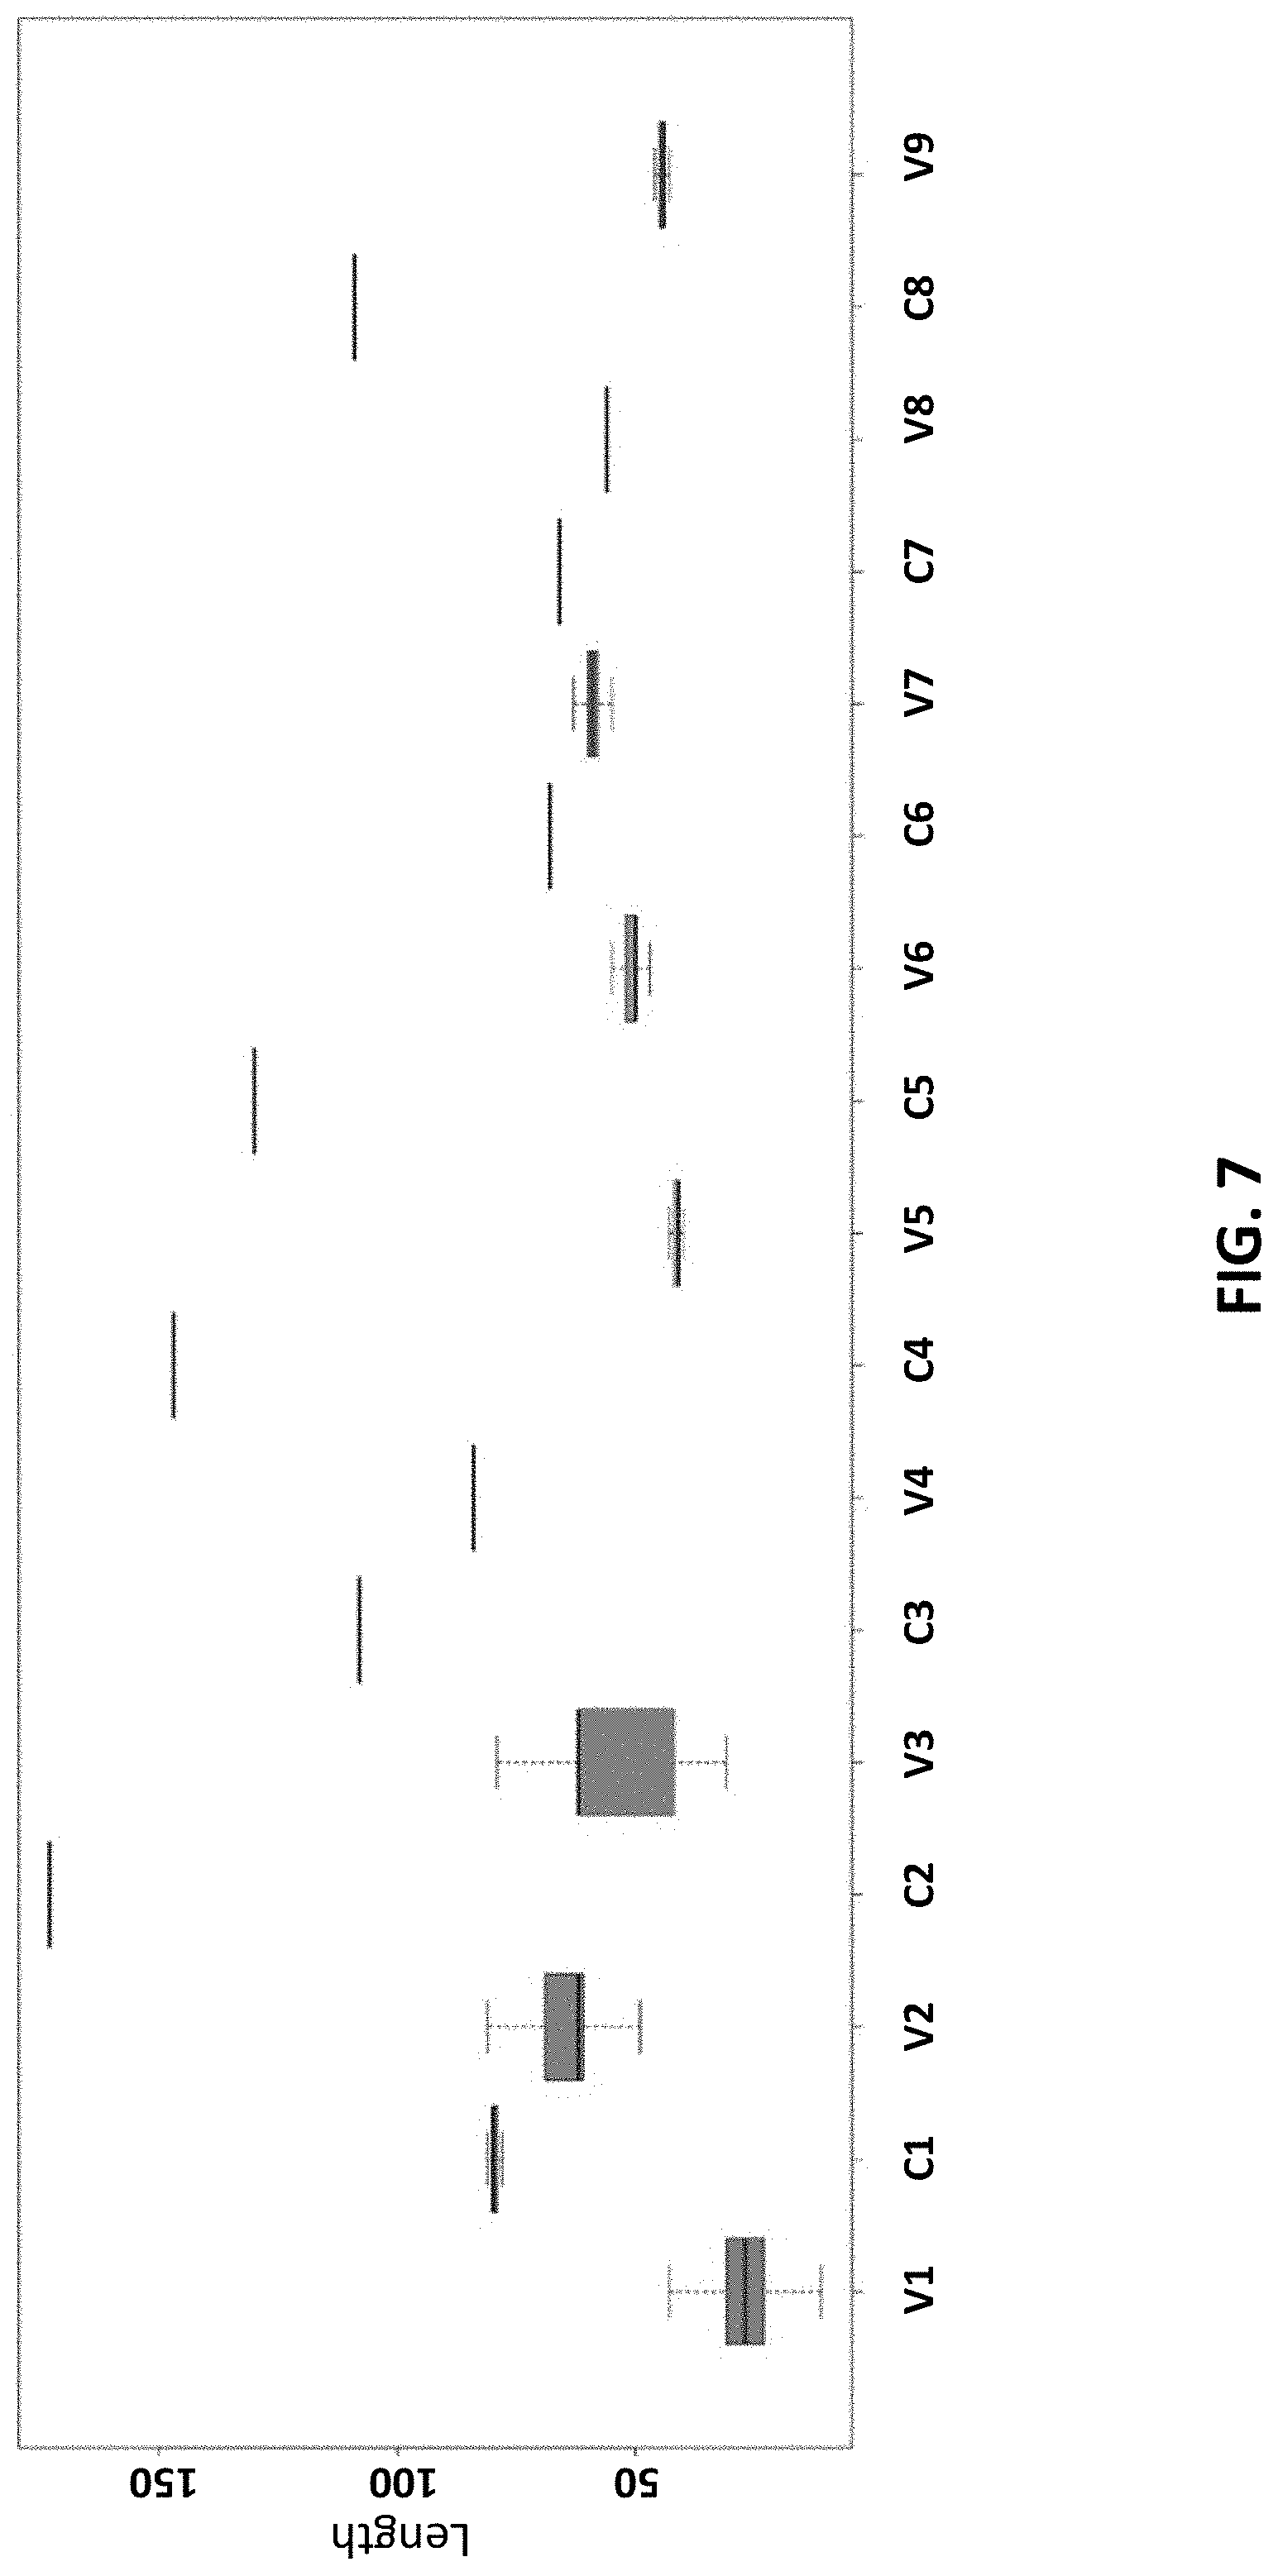
[0017] FIG. 7 shows length distributions (in bp) of different variable (V) and constant (C) regions across 84711 different bacterial 16s rRNA genes retrieved from the RDP database according to an embodiment of the disclosure.
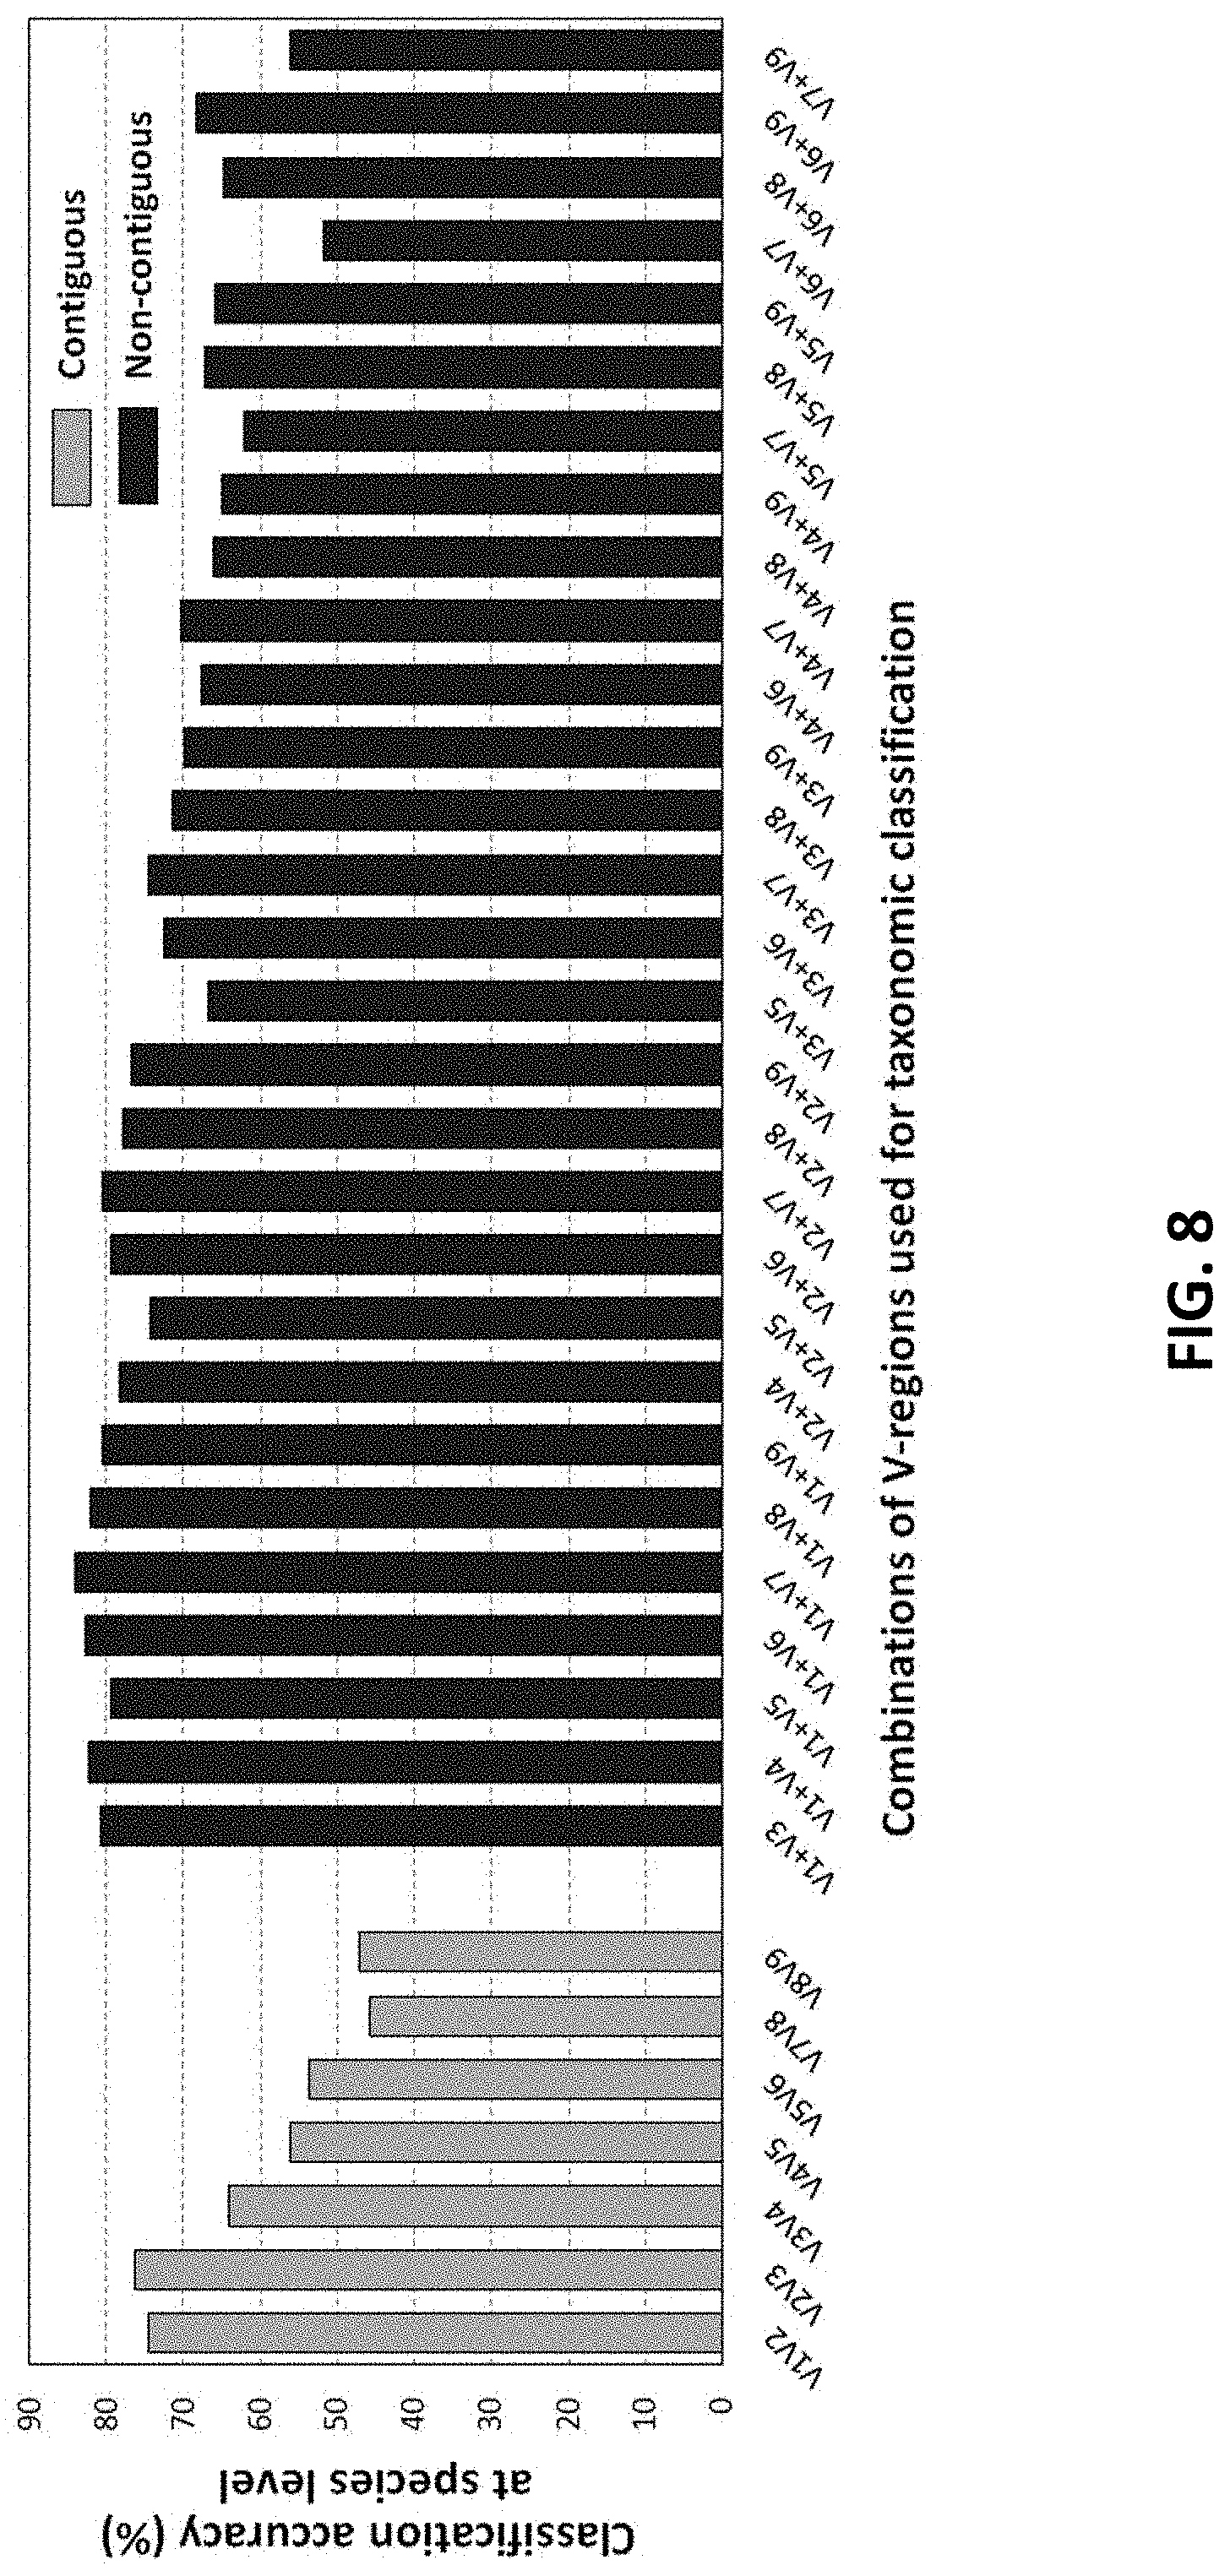
[0018] FIG. 8 shows taxonomic classification accuracies obtained using different pair wise combinations of V-regions (both contiguous as well as non-contiguous). Combinations of V-regions achieving a classification accuracy of >=70% are also shown according to an embodiment of the disclosure.
[0019] FIG. 9 shows a plot depicting the taxonomic classification accuracies obtained at species level using different pair wise combinations of V-regions (both contiguous as well as non-contiguous) drawn from the 16S rRNA genes according to an embodiment of the disclosure.
[0020] FIG. 10 shows a comparison of paired-end reads generated in the in silico experiments (based on constant region HMMs) with respect to those which may be obtained by using different sets of primers currently available for 16S rRNA amplicon sequencing according to an embodiment of the disclosure.
DETAILED DESCRIPTION
[0021] Exemplary embodiments are described with reference to the accompanying drawings. In the figures, the left-most digit(s) of a reference number identifies the figure in which the reference number first appears. Wherever convenient, the same reference numbers are used throughout the drawings to refer to the same or like parts. While examples and features of disclosed principles are described herein, modifications, adaptations, and other implementations are possible without departing from the spirit and scope of the disclosed embodiments. It is intended that the following detailed description be considered as exemplary only, with the true scope and spirit being indicated by the following claims.
[0022] Referring now to the drawings, and more particularly to FIG. 1 through FIG. 10, where similar reference characters denote corresponding features consistently throughout the figures, there are shown preferred embodiments and these embodiments are described in the context of the following exemplary system and/or method.
[0023] According to an embodiment of the disclosure, a system 100 for improving accuracy of amplicon based taxonomic profiling of microbial community is shown in the block diagram of FIG. 1. More specifically, the disclosure provides a method and system for improving the resolution of 16S rRNA gene-based taxonomic profiles corresponding to microbial environments. The other amplicon gene sequences can also be used. The method and system 100 may be extended to other marker genes/genetic elements used for taxonomic classification such as the bacterial CPN60 or other Heat-Shock proteins (HSPs), and the fungal ITS elements sequences. The present disclosure provides a combinatorial strategy which involves sequencing of one pair or multiple pairs of contiguously or non-contiguously located variable regions within the 16S rRNA gene and subsequent processing and analysing the resultant sequencing data using a novel in silico combinatorial approach to improve the resolution of taxonomic profiling. The disclosure also provides increased accuracy and depth of taxonomic classification of a microbiome.
[0024] In the present disclosure, the system 100 have been explained with the help of two experiments targeting two different combinations of variable regions. Though it should be appreciated that the system 100 can also be modified to involve more than two experiments to enable targeting even more combinations which might be relevant for the biological problem.
[0025] According to an embodiment of the disclosure, the system 100 is specifically using paired end sequencing. Paired-end sequencing protocols available with some of the NGS platforms allow sequencing of a stretch of DNA from both its ends. For example, Illumina HiSeq sequencing platforms can be used for paired-end sequencing to generate up to 2.times.250 bp reads. To this end, appropriate primers need to be designed against a desired stretch of the 16S rRNA gene, such that the targeted V-regions (either contiguously or non-contiguously placed) reside within this stretch, and are not far from either of its boundaries. Sequencing of the amplicon generated with these primers can then be performed with a paired-end sequencing protocol, whereby these (amplified) stretches of DNA are sequenced from both ends. Two reads sequenced from each such amplicon would cover the two targeted V-regions (one from each end). Since each of the sequenced reads from any given `pair` targets a single V-region (situated at one of the ends of the amplicon), read-length limitations do not restrict capturing the entirety of the individual V-regions. Consequently, it becomes possible to sequence almost all possible pair wise combinations of V-regions, either arranged contiguously or non-contiguously. Paired-end sequencing protocols can therefore, in principle, be employed for sequencing various pair wise combinations of contiguous or non-contiguous V-regions in a single sequencing run.
[0026] According to an embodiment of the disclosure, the system 100 further comprises a sample collection module 102, an input module 104, a DNA extraction module 106, a sequencer 108, a first microbial abundance profile generation module 110, a second microbial abundance profile generation module 112, a memory 114 and one or more hardware processor 116 as shown in the block diagram of FIG. 1. The one or more hardware processors 116 works in communication with the memory 114. The memory 114 further comprises a plurality of modules. The plurality of modules accesses the set of algorithms stored in the memory 114 to perform a certain functions. The memory 114 further comprises a computation table generation module 118 and a combined microbial abundance profile generation module 120.
[0027] According to an embodiment of the disclosure the sample collection module 102 is configured to collect a biological sample from the environment. The biological sample can be collected from various places such as gut, swab, saliva from human body or any other place outside the human body. The input module 104 is configured to obtaining a first subsample and a second subsample from the collected biological sample. In an example, the input module 104 could be same as the sample collection module 102. The sample collection module 102 and the input module 104 can include a variety of software and hardware interfaces, for example, a web interface, a graphical user interface, and the like and can facilitate multiple communications within a wide variety of networks N/W and protocol types, including wired networks, for example, LAN, cable, etc., and wireless networks, such as WLAN, cellular, or satellite.
[0028] According to an embodiment of the disclosure, the system 100 comprises the DNA extraction module 106 and the sequencer 108. The DNA extraction module 106 is configured to extract DNA fragments from the first subsample and the second subsample using laboratory standardized protocol. The sequencer 108 is configured to sequence the extracted DNA from the first subsample and the second subsample. The sequencing for the first subsample and the second subsample is performed separately and can be performed in any order.
[0029] The sequencing of the extracted microbial DNA from the first subsample is performed using a sequencer to get DNA sequence data. The DNA sequence data comprises of a plurality of pairs of sequence fragments. Each pair of the plurality of pairs of sequence fragments is generated through paired-end sequencing of an amplicon that comprises a first combination informative regions within the amplicon, wherein the informative regions contain phylogenetically relevant information. It should be appreciated that going forward in this disclosure, the informative region can also be referred as the variable regions (V-regions) specific to 16s rRNA.
[0030] The first combination of informative regions are having contiguously or non-contiguously located informative regions.
[0031] Similarly, the sequencing of the extracted DNA from the second subsample is performed using the sequencer to get DNA sequence data. The DNA sequenced data comprises of a plurality of pairs of sequence fragments, wherein each pair of the plurality of pairs of sequence fragments is generated through paired-end sequencing of the amplicon that comprises a second combination of informative regions within the amplicon. The second combination of informative regions are having contiguously or non-contiguously located informative regions. The first combination or the second combination, can both include one or more informative regions. The second combination of informative regions are different from the first combination of informative regions. The amplicon sequencing experiment targets a phylogenetic marker gene. Though it should be appreciated that there could be overlap between the informative regions of the first combination and the second combination but they can never be exactly same. Although, the first combinations and the second combination of informative regions are always expected to be different, one of the informative regions in both combinations may be shared by both the combinations.
[0032] According to an embodiment of the disclosure, the system 100 further comprises the first microbial abundance profile generation module 110 and the second microbial abundance profile generation module 112. The first microbial abundance profile generation module 110 is configured to generate the microbial taxonomic abundance profile of the first sequenced subsample by employing a taxonomic classification method, wherein the taxonomic classification method utilizing phylogenetically relevant information corresponding to the first combination of informative regions, wherein the microbial taxonomic abundance profile comprises of abundance values corresponding to one or more pair of sequence fragments comprising the first combination of informative regions classified into a plurality of taxonomic groups. Similarly, the second microbial abundance profile generation module 112 is configured to generate a microbial abundance profile of the second sequenced subsample by employing the taxonomic classification method, wherein the taxonomic classification method utilizing phylogenetically relevant information corresponding to the second combination of informative regions, wherein the microbial abundance profile comprises of abundance values corresponding to one or more pair of sequence fragments comprising the second combination of informative regions classified into the plurality of taxonomic groups.
[0033] According to an embodiment of the disclosure, the memory 114 further comprises the computation table generation module 118. The computation table generation module 118 is configured to generate a computation table. The computation table generation module pre-compute taxonomic classification accuracies for all different possible combinations of informative regions for microbes belonging to the plurality of taxonomic groups, wherein the pre-computing is based on marker gene sequences of known taxonomic origin present in existing sequence databases, to generate a computation table. The computation table generally comprises thousands of rows and various combination of variable regions in the column. A detailed methodology and rationale employed for computing the taxonomic classification accuracies is explained in the later part of the disclosure. Due to the space and the size constraint, only a part of tables are shown below.
(a) The individual V-regions (targeted in the experiments) in resolving each of the taxonomic groups under consideration is shown in TABLE 1. (b) Pairs of (contiguously or non-contiguously located) V-regions within the 16S rRNA gene in resolving each of the taxonomic groups under consideration is shown in TABLE 2.
TABLE-US-00001 TABLE 1 Taxonomic classification accuracies (in terms of number of correct assignments) obtained using different V-regions extracted from 16S rRNA sequences downloaded from RDP database. Accuracy of taxonomic assignments has been evaluated at the Genus level considering pre-annotated lineages available in RDP. The number of correct assignments that were obtained using full-length 16S rRNA genes is also indicated. No. of correct assignments obtained with- Total Number Full length NAME of sequences sequences V1 V2 . . . V9 Abiotrophia 4 4 0 3 . . . 0 Acaricomes 1 1 0 1 0 Acetanaerobacterium 2 2 1 2 0 . . . . . . . . . . . . . . . . . . . . . . . . . . . . . . . . . . . . . . . . . . Zymophilus 100 100 0 50 . . . 0
TABLE-US-00002 TABLE 2 Taxonomic classification accuracies obtained using different pair-wise combinations of V-regions (both contiguous as well as non-contiguous) evaluated with sequences downloaded from RDP database. Accuracy of taxonomic assignments has been evaluated at the species level considering the assignments obtained with full-length 16S sequences to be correct. The * symbol indicates combinations of contiguous V-regions NAME V1V2* V1 + V3 . . . V2V3* . . . V8V9* Abiotrophia_defectiva_(T) 75 100 . . . 75 . . . 0 Acaricomes_phytoseiuli_(T) 100 100 100 0 Acetanarobacterium_elongatum_(T) 100 100 100 100 . . . . . . . . . . . . . . . . . . . . . . . . . . . . . . . . . . . . . . . . . . marine_bacterium_PP-203 100 100 . . . 100 . . . 100
[0034] According to an embodiment of the disclosure, the memory 114 further comprises the combined microbial abundance profile generation module 120. The combined microbial abundance profile generation module 120 is configured to combine the microbial taxonomic abundance profiles of the first and the second sequenced subsample based on the computation table to generate a combined microbial taxonomic abundance profile. The combined microbial taxonomic abundance profile has a refined abundance value and has improved taxonomic classification accuracy as compared to the microbial taxonomic abundance profiles obtained individually for the first and the second subsample, or as compared to a microbial taxonomic abundance profile obtained for the entire biological sample or any other subsample of a biological sample using amplicon sequencing targeting any of the combinations of informative regions in the phylogenetic marker gene.
[0035] In operation, a flowchart 200 illustrating a method for improving accuracy of amplicon based taxonomic profiling of microbial community is shown in FIG. 2A-2C. Initially at step 202, the biological sample is collected from environment. The biological sample can be collected from any site not limited to human beings. At step 204, a first subsample and a second subsample is obtained from the biological sample. In the next step 206, DNA is extracted from the first subsample and the second subsample. At step 208, the extracted microbial DNA from the first subsample is sequenced using the sequencer to get DNA sequence data. The DNA sequence data comprises of a plurality of pairs of sequence fragments, wherein each pair of the plurality of pairs of sequence fragments is generated through paired-end sequencing of an amplicon that comprises a first combination informative regions within the amplicon, wherein the informative regions contain phylogenetically relevant information. Similarly, at step 210, the extracted DNA from the second subsample is sequenced using the sequencer to get DNA sequence data, wherein the DNA sequenced data comprises of a plurality of pairs of sequence fragments, wherein each pair of the plurality of pairs of sequence fragments is generated through paired-end sequencing of the amplicon that comprises a second combination of informative regions within the amplicon, wherein the second combination of informative regions are different from the first combination of informative regions, wherein the amplicon sequencing experiment targets a phylogenetic marker gene.
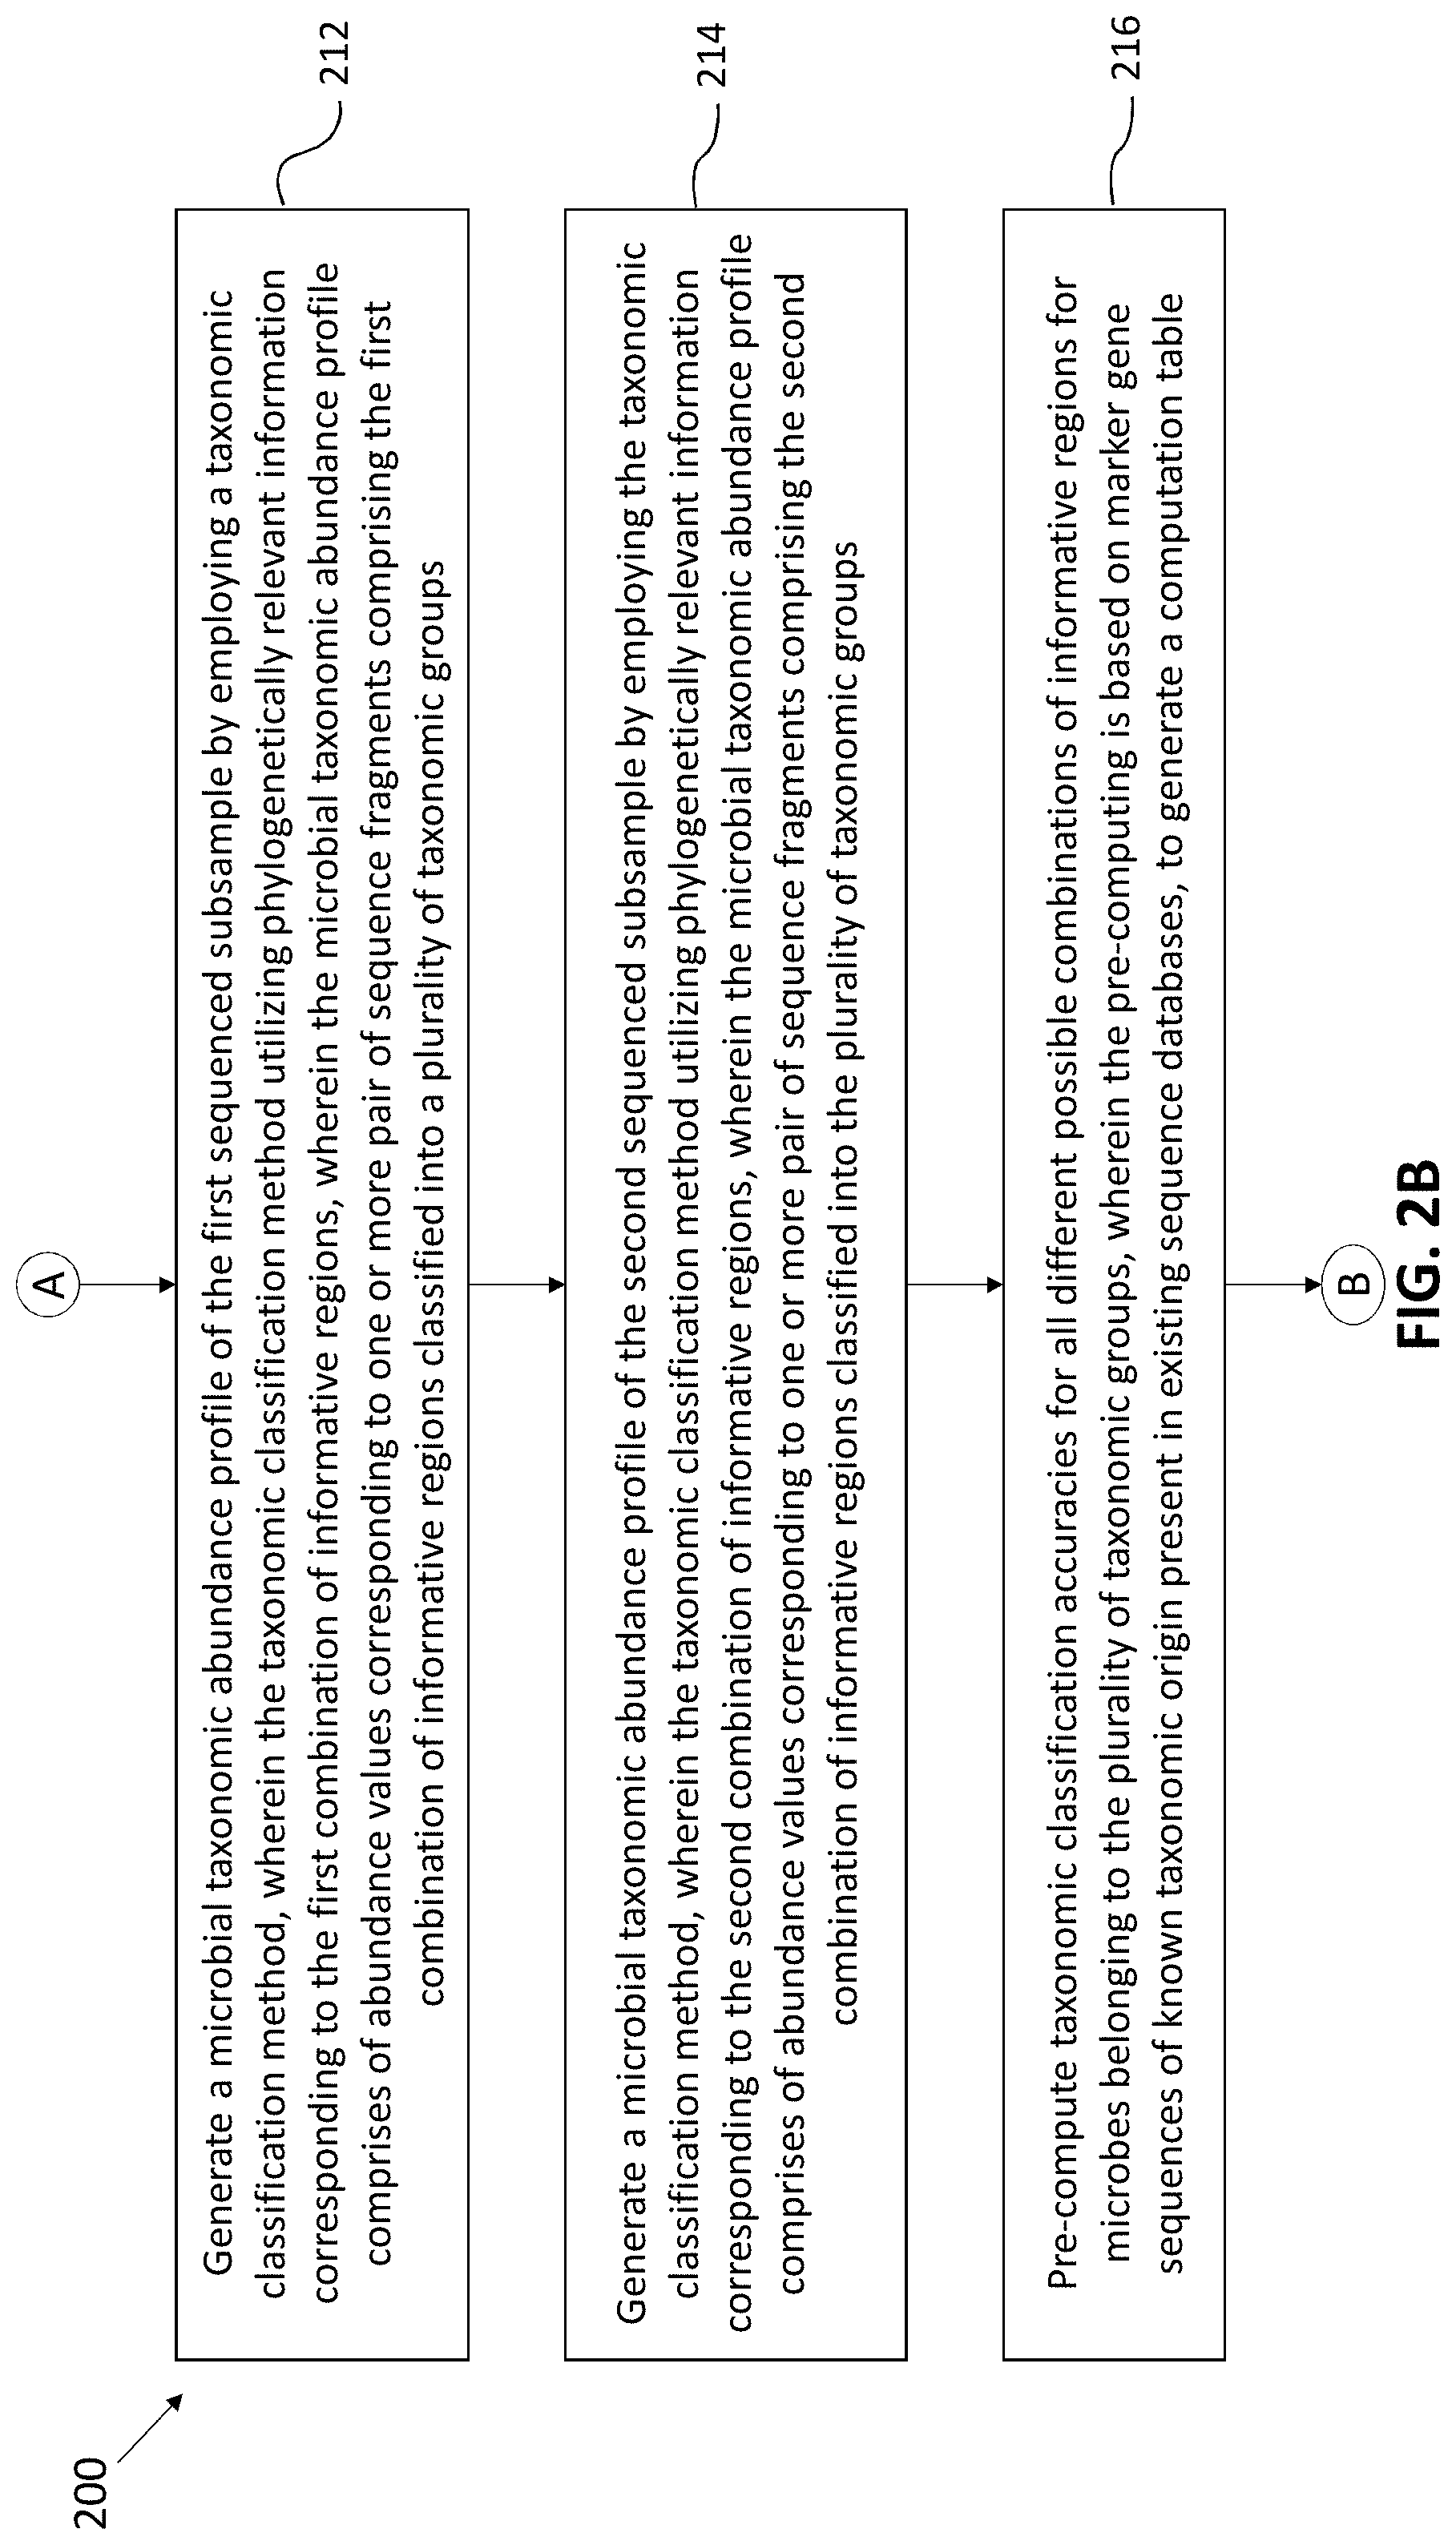
[0036] In the next step 212, the microbial taxonomic abundance profile of the first sequenced subsample is generated by employing a taxonomic classification method. The taxonomic classification method utilizes phylogenetically relevant information corresponding to the first combination of informative regions. The microbial taxonomic abundance profile comprises of abundance values corresponding to one or more pair of sequence fragments comprising the first combination of informative regions classified into a plurality of taxonomic groups. Similarly at step 214, the microbial abundance profile of the second sequenced subsample is generated by employing the taxonomic classification method. The taxonomic classification method utilizing phylogenetically relevant information corresponding to the second combination of informative regions. The microbial abundance profile comprises of abundance values corresponding to one or more pair of sequence fragments comprising the second combination of informative regions classified into the plurality of taxonomic groups.
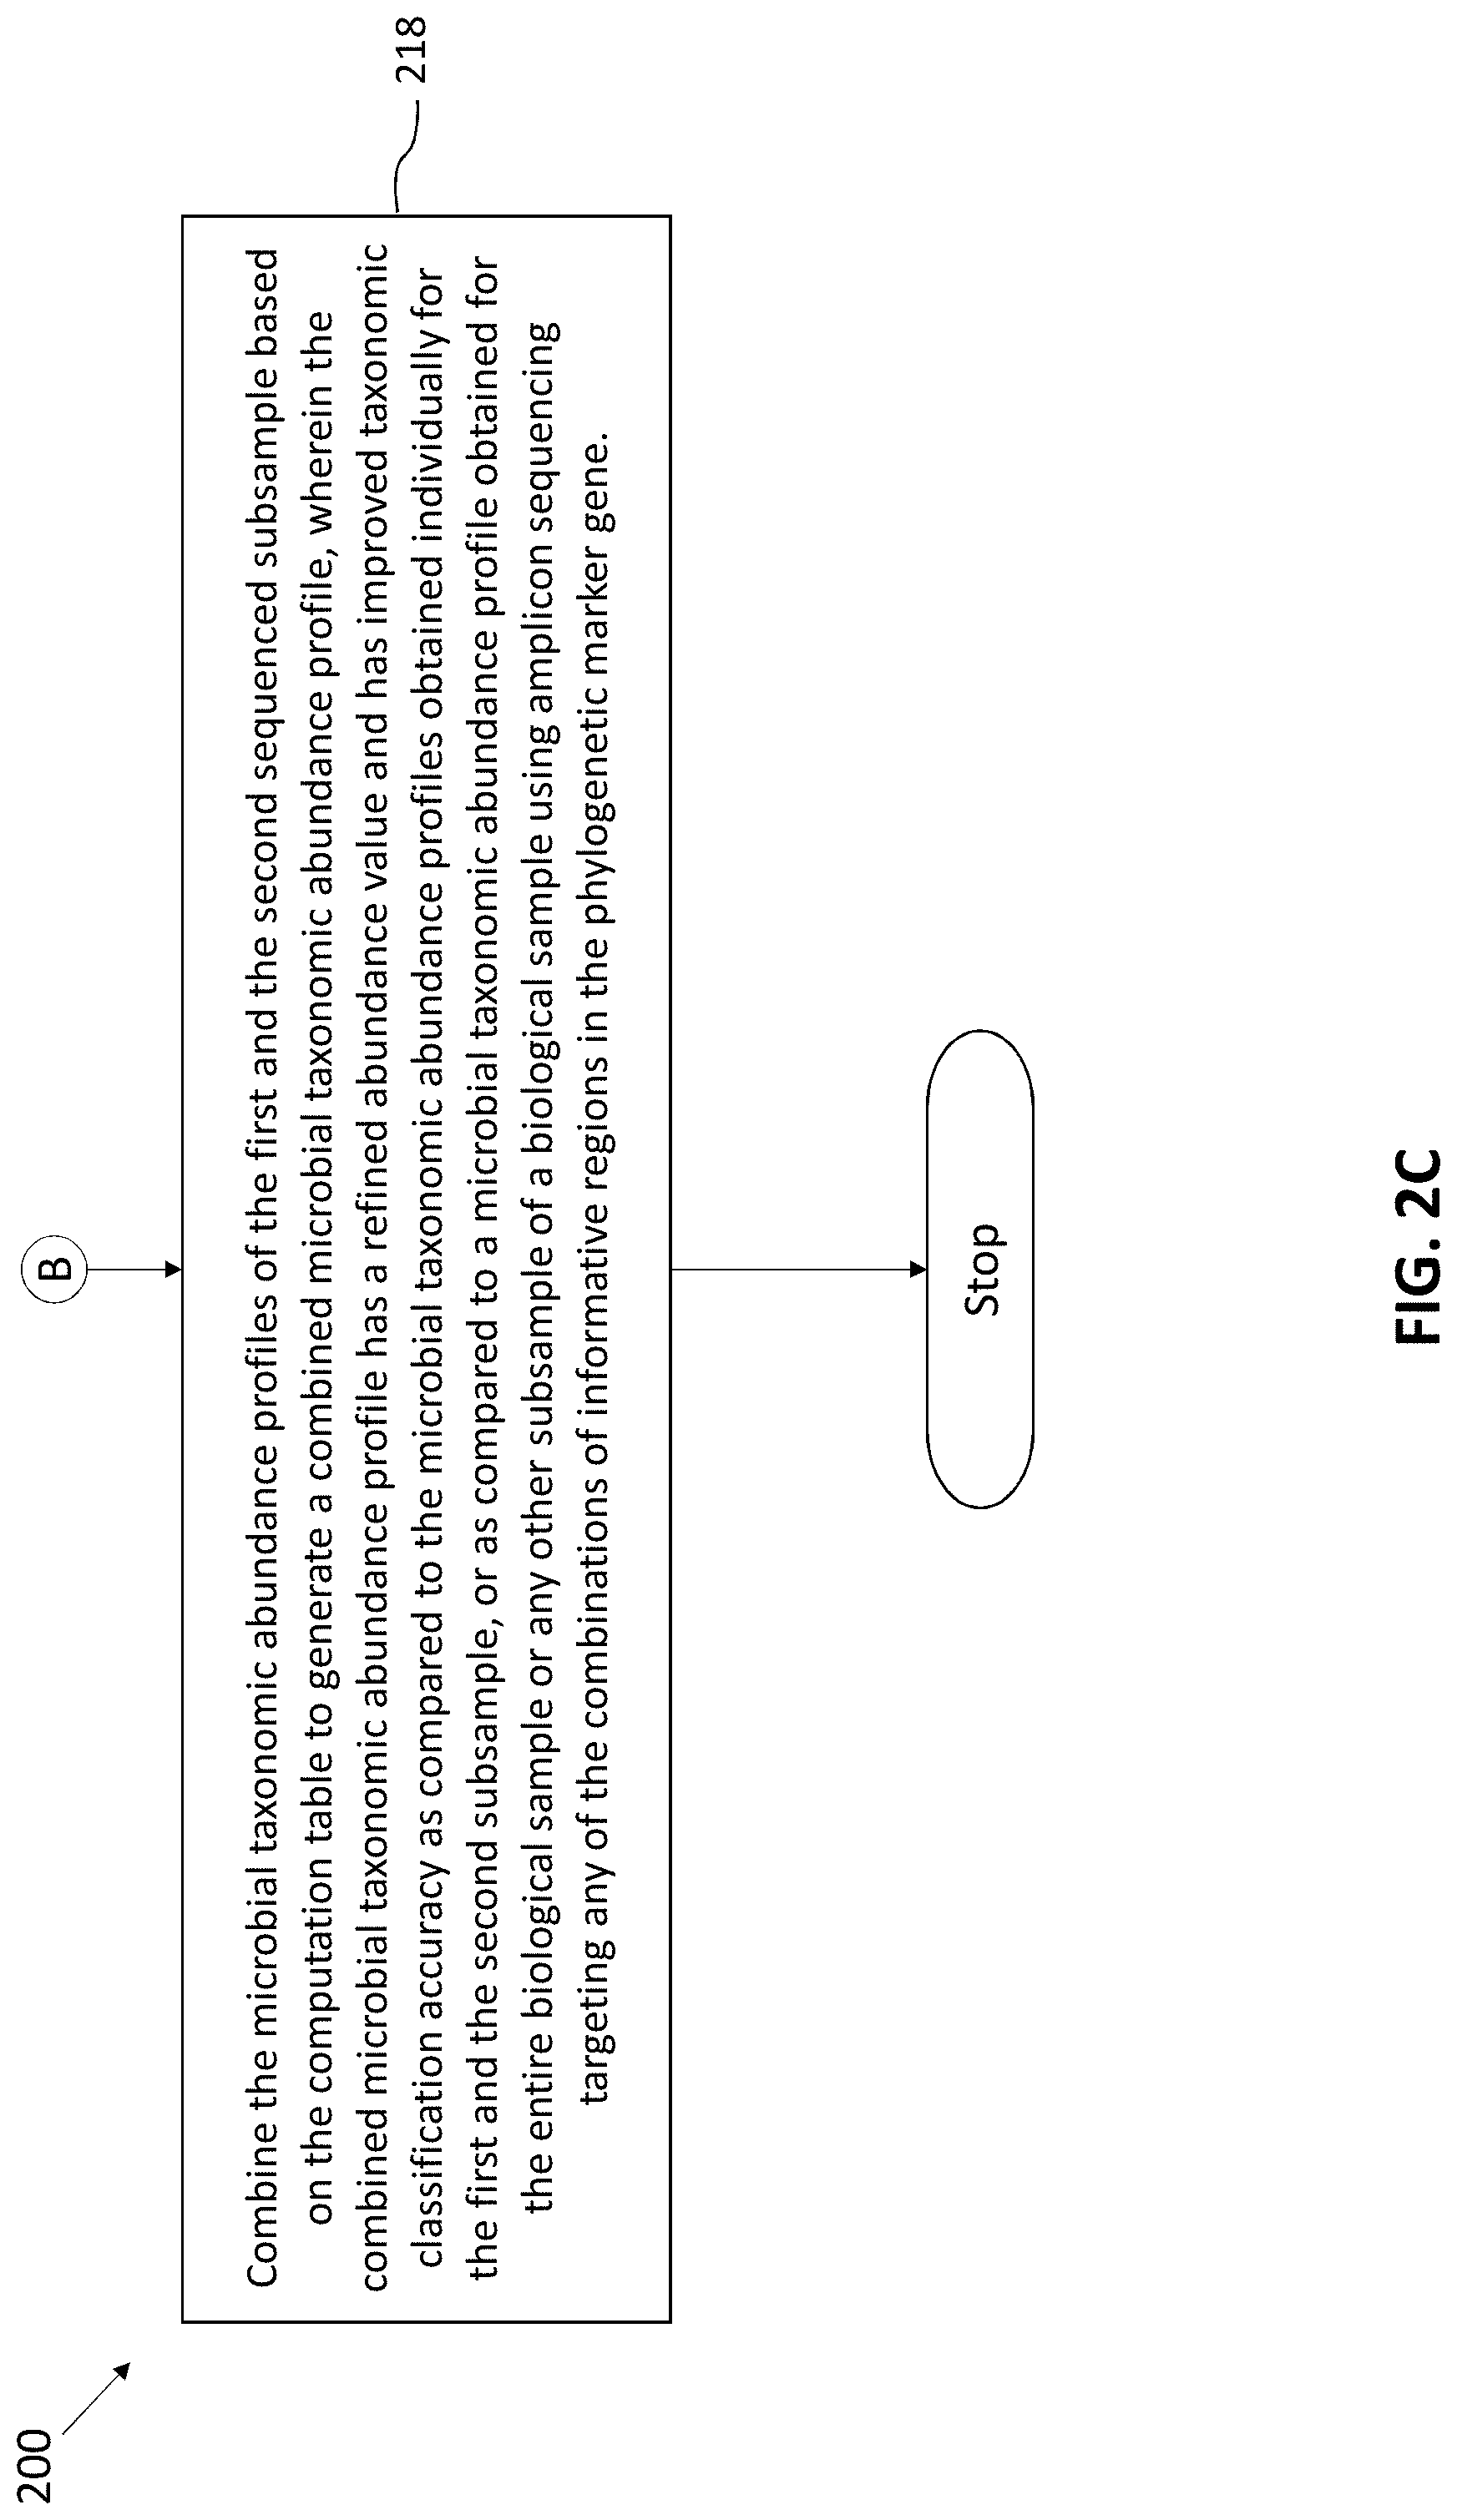
[0037] At step 216, the taxonomic classification accuracies for all different possible combinations of informative regions for microbes belonging to the plurality of taxonomic groups are pre-computed. The pre-computing is based on marker gene sequences of known taxonomic origin present in existing sequence databases, to generate a computation table. At finally at step 218, the microbial abundance profiles of the first and the second sequenced subsample are combined based on the computation table to generate a combined microbial abundance profile. The combined microbial taxonomic abundance profile has a refined abundance value and has improved taxonomic classification accuracy as compared to the microbial taxonomic abundance profiles obtained individually for the first and the second subsample, or as compared to a microbial taxonomic abundance profile obtained for the entire biological sample or any other subsample of a biological sample using amplicon sequencing targeting any of the combinations of informative regions in the phylogenetic marker gene.
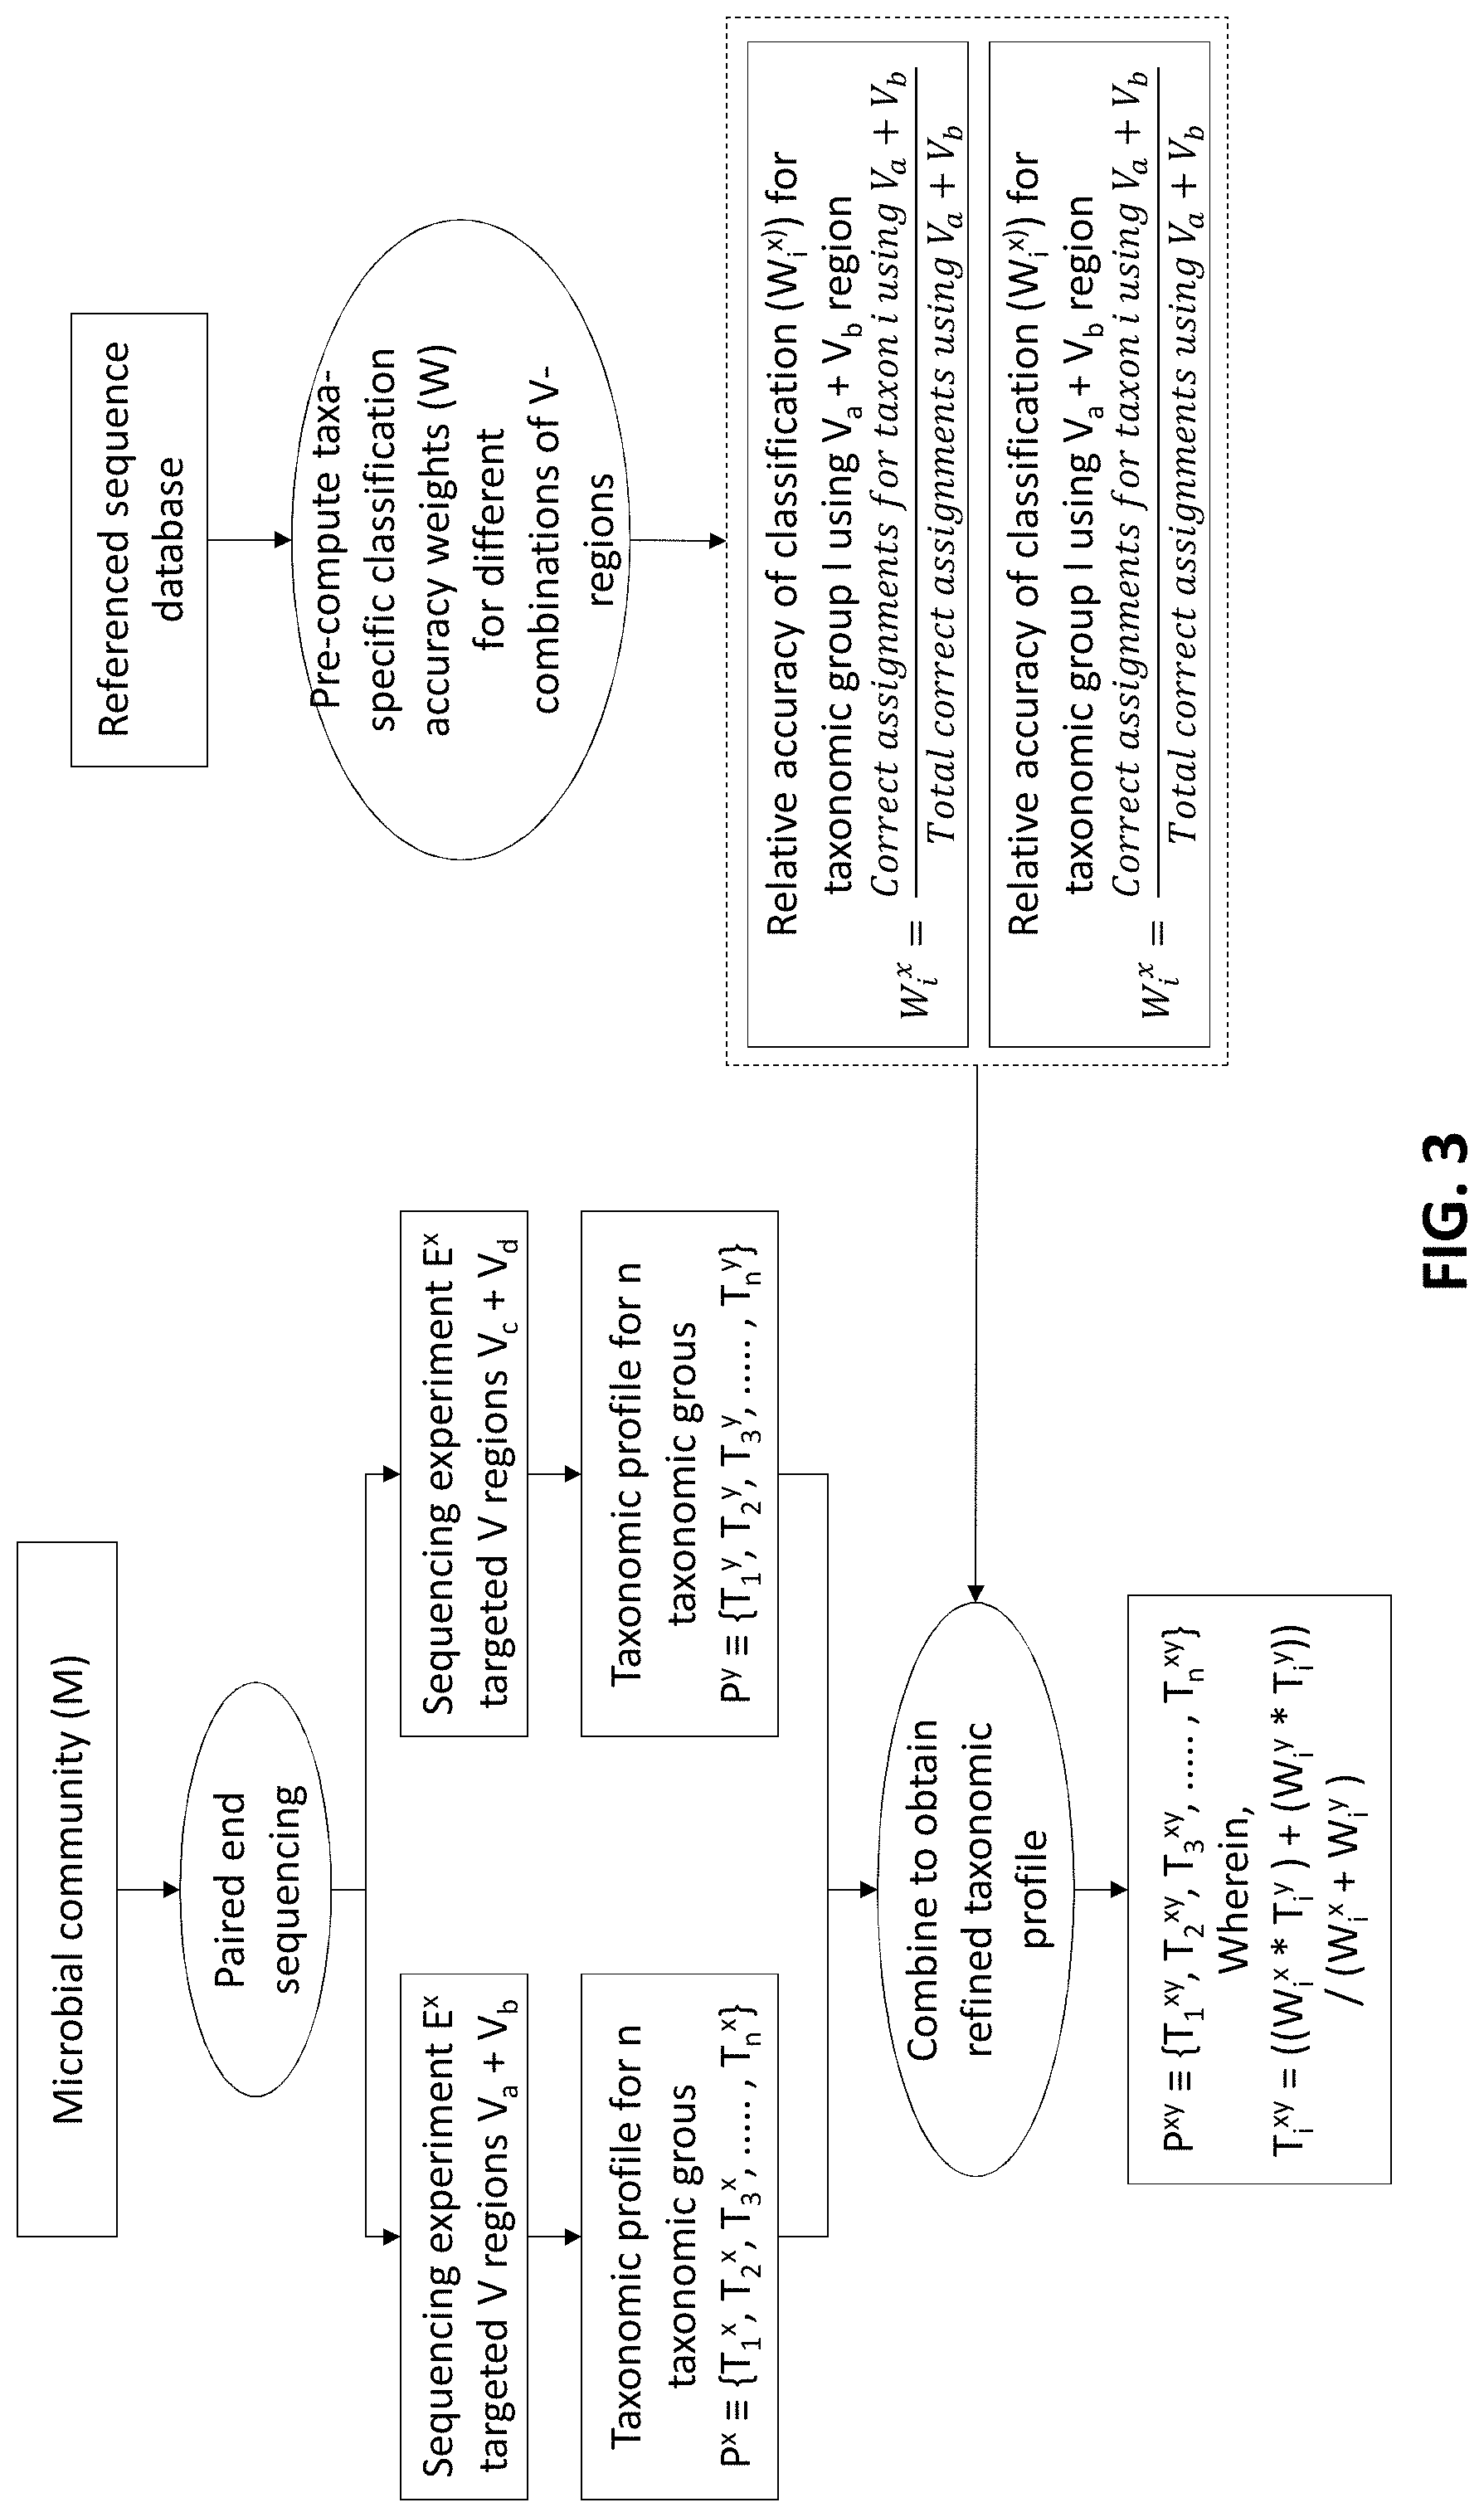
[0038] According to an embodiment of the disclosure, the system 100 can also be explained with the help experimental procedures and results. As mentioned earlier, the disclosure is using 16S rRNA as amplicon for the experimental procedures. Following are the steps involved in determining the combinatorial strategy for improving accuracy of amplicon based taxonomic profiling of microbial community as shown in the flowchart of FIG. 3.
[0039] A microbial community (M) is initially considered for metagenomic profiling by two paired-end sequencing experiments (E.sup.x and E.sup.y). Each of these experiments can target 2 distinct V-regions (either arranged contiguously or non-contiguously on the 16S rRNA gene), using appropriate forward and reverse primers. In the current example, E.sup.x targets the V-region combination V.sub.a+V.sub.b, and E.sup.y targets V.sub.c+V.sub.d. For example, combinations of V-regions selected in the two experiments could be V1+V4 and V2+V6 in one scenario. Based on the taxonomic resolution efficiencies of different (combinations of) V-regions, E.sup.x and E.sup.y will generate two different taxonomic abundance profiles P.sup.x and P.sup.y respectively, each of which constitutes of estimated abundance values (T.sub.i) for different taxonomic groups (i)--
P.sup.x.ident.{T.sub.1.sup.x,T.sub.2.sup.x,T.sub.3.sup.x, . . . ,T.sub.n.sup.x} Equation 1
P.sup.y.ident.{T.sub.1.sup.y,T.sub.2.sup.y,T.sub.3.sup.y, . . . ,T.sub.n.sup.y} Equation 2
[0040] Subsequently, for each of the taxonomic groups (T.sub.i), a refined estimate of its abundance (T.sub.i.sup.xy) can be arrived at by combining the observed abundances T.sub.i.sup.x and T.sub.i.sup.y, such that the refined abundance T.sub.i.sup.xy is relatively closer to the estimate obtained with the experiment (either of E.sup.x or E.sup.y) providing better classification accuracies for taxa `i`. Calculation of the refined estimate therefore takes into consideration the taxonomic classification accuracies of the combination of V-regions that had been used for the initial set of experiments E.sup.x and E.sup.y using the following equation:
T i xy = ( W i x W i y * T i x ) + T i y 1 + W i x W i y Equation 3 ##EQU00001##
[0041] Wherein W.sub.i.sup.x and W.sub.i.sup.y are the relative accuracies in taxonomic classification for a particular taxonomic group `i`, obtained using the specific combination of V-regions chosen for experiments E.sup.x and E.sup.y respectively. These taxonomic classification accuracies can be calculated from the evaluation results obtained from the computation table generated in step 216 (methodology for computation of the values provided in these tables has been described in the later part of the disclosure), as a ratio of the correct assignments obtained for particular taxa using a specific combination of V-regions, and the total number of correct assignments obtained using the same V-region combination. For example, considering that the combination of V.sub.a+V.sub.b was used in experiment E.sup.x, W.sub.i.sup.x can be calculated as:
W i x = Correct assignments for taxon i using V a + V b Total correct assignments using V a + V b Equation 4 ##EQU00002## Similarly,
W i y = Correct assignments for taxon i using V c + V d Total correct assignments using V c + V d Equation 5 ##EQU00003##
[0042] The denominator term representing "total correct assignments using V.sub.a+V.sub.b" has been introduced to capture any additional specificity of the chosen V.sub.a+V.sub.b region toward a particular taxon `i` in context of the overall taxonomic classification performance of V.sub.a+V.sub.b. Other simple ways of calculating the "relative accuracy in taxonomic classification" or weight (W.sub.i.sup.x), e.g., in a case wherein the denominator term is omitted, would also work fine when V-region combinations with decent classification accuracy are chosen.
[0043] It may be noted here, that in the experiment(s) using paired-end sequencing to capture two different V-regions from the 16S rRNA gene, the correspondence between the pairs of V-regions originating from the same 16S rRNA gene is retained. This allows joining the different V-regions together into a single DNA string (separated appropriately by ambiguous nucleotide characters) and providing the same as an input to taxonomic classification tools, such as the RDP classifier. However, for V-regions targeted in separate sequencing experiments, cross-experiment correspondence between the sequenced V-regions with respect to their origin 16S rRNA gene cannot be identified. This necessitates the indirect strategy of combining information obtained from different V-regions (or their combinations) for refining the taxonomic abundance estimates, as described above.
[0044] To avoid variations arising from experimental workflows and sample handling/preparations, it would be ideal to perform a single PCR step for amplicon generation, using different sets of primers appropriate for the chosen combinations of V-regions (V.sub.a+V.sub.b, and V.sub.c+V.sub.d in the given example). However, it also needs to be mentioned here that the designed primers may have different affinities for the targeted regions on 16S rRNA genes originating from different taxonomic groups. This may again result in unequal proportions of 16S rRNA sequence fragments amplified by the different sets of primers, which would subsequently be reflected in the sequencing outcome. In such a scenario, the combination strategy needs to factor in this difference in proportions, while arriving at a refined taxonomic abundance estimate. Alternately, the experiment may target a combination of 3 V-regions (e.g. V.sub.a+V.sub.b and V.sub.a+V.sub.c or, V.sub.a+V.sub.c and V.sub.b+V.sub.c), such that, either the forward primers or the reverse primers be common to the targeted combinations. This way, some equivalence in the proportions of fragments (targeting different taxonomic groups) can be maintained on account of the shared primer (for V-region) selected.
[0045] Further, it should be appreciated that if required the user can also obtain more than 2 subsamples, each targeting different V-regions. For example, there are 4 experiments--E.sup.a, E.sup.b, E.sup.c, E.sup.d . . . then the combinatorial formula can be written as--
T i abcd = W i a * T i a + W i b * T i b + W i c * T i c + W i d * T i d W i a + W i b + W i c + W i d ##EQU00004##
Wherein the values for W and T can be calculated as mentioned earlier Evaluation Results with Novel Combinatorial Strategy
[0046] Considering the fact that human gut is one of the most diverse and densely populated reservoir of microbes, the utility of the combinatorial strategy was assessed with a simulated metagenomic sample (namely GUT1--method of generating the same has been described in the later part of the disclosure) that was specifically generated for this purpose (along with 7 more simulated metagenomes pertaining to different human body sites). The taxonomic classification efficiency of the V-region combinations (at the species level) was assessed on the simulated metagenome GUT1. The V-region combinations V1+V4 and V1+V5 provided highest average classification accuracies for most of the host (human) associated environmental niches along with the simulated metagenome GUT1 as shown in FIG. 4. Consequently, these V-region combinations were targeted for evaluating this combinatorial strategy wherein 5,000 sequence fragments corresponding to each of the V-region combinations (i.e. a total of 10,000 fragments) were sampled from the simulated metagenome. The results obtained with the combinatorial strategy were compared against the results obtained when each of the V-region combinations were targeted separately (with a sequencing depth of 10,000 reads in each case).
[0047] Results in Table 3 indicate that although the V1+V4 and V1+V5 regions can classify the reads with commendable accuracy, the abundance values provided for individual genera deviates from the actual (RDP) lineage by a certain extent. The combinatorial approach was observed to moderate these deviations to a significant extent, and relative abundance of individual genera ascertained by the combinatorial approach exhibited better coherence with the actual lineage. In quantitative terms, while the average deviations (from actual lineage) in relative taxonomic abundance predictions for V1+V4 and V1+V5 combination based approaches were 17.4% and 11.5% respectively, the combinatorial approach exhibited a significantly lower average deviation (6.9%) from the actual lineage. Similar improvements were also observed when this approach was tested on microbiomes pertaining to other host-associated/environmental. Given that the proposed combinatorial approach does not incur any significant additional sequencing cost and is a simple in silico extrapolation of the results obtained with standard pair-end sequencing, adoption of the same would be easy and would enable researchers to explore the taxonomic diversity of different environments with greater accuracy. While certain additional experimental costs for primers, multiplexing barcodes, additional PCR, and handling etc. are expected to be incurred to implement the proposed combinatorial strategy, the actual sequencing (reagents) cost, constituting the bulk of the total expenditure, remains the same. The additional pre-processing and handling efforts can at most be twice compared to the sample handling efforts needed for a single paired-end sequencing experiment. However, the potential benefits in terms of an improved taxonomic resolution are expected to outweigh any inhibitions arising due to the additional, but trivial, pre-processing and handling efforts.
[0048] FIG. 5 is schematic depicting two amplicon sequencing experiments targeting different combinations of V-regions. Experiment A targets two contiguous V-regions (V.sub.X and V.sub.Y). The resulting paired end reads (generated through 250 bp.times.2 paired end sequencing of the amplicon) are merged together utilizing the overlapping region. Subsequently, the merged read is used for taxonomic classification. Similarly, experiment B targets two non-contiguously placed V regions (V.sub.X and V.sub.Z). The resulting pair-end reads do not have any overlap and are concatenated together using eight ambiguous nucleotide characters (N). Subsequently, the concatenated read is used for taxonomic classification.
TABLE-US-00003 TABLE 3 Utility of proposed combinatorial approach in obtaining refined taxonomic profiles compared to taxonomic abundance estimates obtained with pair wise combinations of V-regions. Results in the table pertain to the simulated human gut metagenomic dataset GUT1. Abundance (%) Abundance Abundance Abundance estimated with (%) estimated (%) estimated (%) estimated combinatorial with full- with 10000 with 10000 approach using length 16S V1 + V4 paired- V1 + V5 paired- 5000 V1 + V4 and Species reads end reads end reads 5000 V1 + V5 reads Faecalibacteriumprausnitzii 11.17 12.24 12.25 10.97 Bacteroides faecis 10.69 11.97 11.24 11.26 Prevotellaamnii 6.73 0.00 6.72 7.22 Prevotellani rescens 6.47 6.98 6.76 6.90 Me amonashyperme ale 5.35 6.06 3.53 4.61 Bacteroides pyo enes 4.23 4.44 4.33 4.52 Bacteroides fine oldii 3.98 4.03 4.13 3.97 Alistipesputredinis 3.45 3.73 3.71 3.48 Roseburia hominis 2.41 2.70 2.84 2.59 Bacteroides nordii 2.18 2.50 2.26 2.14 Bacteroides e erthii 2.15 2.51 2.24 2.13 Bacteroides helco enes 2.09 2.35 2.13 2.09 Bacteroides caccae 2.08 2.30 2.32 2.29 Bacteroides massiliensis 2.07 2.10 2.13 2.00 Bacteroides coprocola 2.04 2.43 2.27 2.20 Bacteroides salyersiae 2.04 2.26 2.01 2.10 Bacteroides stercoris 2.03 1.92 2.50 2.15 Bacteroides uniformis 2.02 2.03 2.04 1.92 Bacteroides acidifaciens 2.01 2.30 2.00 2.06 Proteiniphilumacetati enes 2.01 2.21 2.18 2.06 Bacteroides cellulosilyticus 1.98 2.16 0.00 1.95 Bacteroides intestinalis 1.96 2.02 2.08 2.01 Roseburiafaecis 1.74 1.94 1.91 1.68 Roseburia intestinalis 1.74 2.16 1.91 1.84 Parasutterellasecunda 1.50 1.74 1.56 1.38 Roseburiainulinivorans 1.00 1.00 1.06 1.10 Phascolarctobacteriumsuccinat 0.99 0.82 0.78 0.80 Parabacteroides distasonis 0.90 1.03 1.04 0.73 Parabacteroides merdae 0.89 1.07 0.87 0.90 Parasutterellaexcrementihomin 0.82 0.99 0.84 0.74 Dorealon icatena 0.78 0.32 0.51 0.32 Phascolarctobacterium faecium 0.74 0.81 0.83 0.69 Blautiaproducta 0.70 0.55 0.86 0.61 Escherichia/Shi ella fer usonii 0.69 0.59 0.00 0.64 Escherichia/Shi ella albertii 0.57 0.56 0.62 0.70 Escherichia/Shi ella flexneri 0.56 0.00 0.00 0.00 Escherichia/Shi ella 0.53 0.50 0.54 0.57 Dialisterinvisus 0.47 0.58 0.50 0.45 Me asphaeraelsdenii 0.46 0.37 0.47 0.39 Blautia lucerasea 0.45 0.41 0.48 0.60 Blautiahydro enotrophica 0.43 0.44 0.46 0.51 Blautiaschinkii 0.43 0.47 0.54 0.43 Mitsuokella alaludinii 0.39 0.40 0.42 0.34 Collinsellaaerofaciens 0.34 0.37 0.42 0.36 Bifidobacterium lon um 0.32 0.40 0.37 0.36 Bifidobacterium animalis 0.32 0.25 0.32 0.29 Ruminococcusflavefaciens 0.30 0.21 0.25 0.17 Blautiahansenii 0.28 0.33 0.30 0.32 Me asphaera sp. NMBHI-10 0.28 0.22 0.19 0.16 Klebsiella pneumoniae 0.25 0.21 0.29 0.27 Cumulate Percentage -- 17.40 11.47 6.85 Deviation from abundance estimated using full-length 16S sequences indicates data missing or illegible when filed
[0049] Similarly, Table 4, Table 5, Table 6, Table 7, Table 8, Table 9, Table 10 and Table 11 show the results of other simulated microbiome of GUT2, Sputum (oral), sub-gingival (oral), skin, soil, aquatic, vagina and nematode gut respectively. The same has also been shown in FIG. 4.
TABLE-US-00004 TABLE 4 Utility of proposed combinatorial approach in obtaining refined taxonomic profiles compared to taxonomic abundance estimates obtained with pair-wise combinations of V-regions. Results in the table pertain to the simulated human gut microbiome dataset Gut2. Abundance (%) Abundance Abundance Abundance estimated with (%) estimated (%) estimated (%) estimated combinatorial with full- with 10000 with 10000 approach using length 16S V1 + V4 paired- V1 + V5 paired- 5000 V1 + V4 and Species reads end reads end reads 5000 V1 + V5 reads Bacteroides faecis (T) 13.23 13.23 13.31 13.54 Alistipes putredinis (T) 9.14 9.24 9.85 9.54 Faecalibacterium prausnitzii 8.42 8.67 8.64 8.18 Bacteroides pyo enes (T) 5.24 4.99 5.51 4.94 Bacteroides fine oldii (T) 4.89 4.93 5.33 4.72 Parabacteroides merdae (T) 3.57 3.81 3.70 3.38 Parabacteroides distasonis ( 3.23 3.19 3.36 3.41 Oscillibacter valerici enes (T 2.95 3.23 3.01 3.03 Bacteroides acidifaciens (T) 2.81 2.71 2.88 2.88 Bacteroides salyersiae (T) 2.72 2.85 2.98 2.60 Bacteroides coprocola (T) 2.65 2.29 2.82 2.79 Bacteroides massiliensis (T) 2.64 2.69 2.94 2.79 Bacteroides intestinalis (T) 2.63 2.60 2.77 2.35 Bacteroides uniformis (T) 2.62 2.89 2.74 2.69 Bacteroides stercoris (T) 2.59 2.53 2.60 2.88 Bacteroides cellulosilyticus ( 2.58 2.45 0.00 2.60 Bacteroides e erthii (T) 2.53 2.71 2.67 2.62 Bacteroides caccae (T) 2.50 2.74 2.72 2.69 Proteiniphilum acetat enes ( 2.48 2.70 2.20 2.81 Bacteroides helco enes (T) 2.47 2.74 2.41 2.37 Bacteroides nordii (T 2.41 2.68 2.51 2.46 Ruminococcus flavefaciens ( 1.51 1.00 1.29 1.08 Ruminococcus albus (T) 1.45 1.24 1.30 1.26 Roseburia hominis (T) 1.08 1.11 1.10 1.12 Odoribacter laneus (T) 0.93 0.80 1.05 0.94 Roseburia intestinalis (T) 0.88 0.81 0.95 0.78 Parasutterella secunda (T) 0.86 1.08 0.95 0.76 Phascolarctobacterium succi 0.81 0.73 0.55 0.72 Roseburia faecis (T) 0.79 0.74 0.73 0.75 Dialister invisus (T) 0.68 0.72 0.66 0.71 Phascolarctobacterium faeciu 0.60 0.63 0.62 0.54 Prevotella amnii (T) 0.55 0.00 0.74 0.58 Prevotella ni rescens (T) 0.54 0.57 0.51 0.52 Roseburia inulinivorans (T) 0.49 0.64 0.48 0.55 Flavonifractor plautii (T) 0.46 0.45 0.41 0.55 Blautia producta (T) 0.46 0.23 0.47 0.46 Coprococcus catus (T) 0.42 0.45 0.39 0.50 Parasutterella excrementiho 0.40 0.41 0.36 0.37 Dialister pneumosintes (T) 0.38 0.39 0.47 0.33 Dorea lon icatena (T) 0.38 0.14 0.09 0.12 Ruminococcus bromii (T) 0.28 0.23 0.15 0.26 Blautia hydro enotrophica (T 0.25 0.24 0.27 0.27 Coprococcus eutactus (T) 0.24 0.28 0.25 0.24 Blautia lucerasea (T) 0.22 0.24 0.22 0.22 Blautia schinkii (T) 0.21 0.22 0.25 0.16 Blautia wexlerae (T) 0.21 0.19 0.17 0.26 Butyriccoccus pullicaecorum 0.19 0.18 0.20 0.24 Butyricmonas syner istica ( 0.15 0.15 0.10 0.20 Blautia hansenii (T) 0.14 0.11 0.19 0.12 Ruminococcus faecis (T) 0.11 0.11 0.13 0.11 Cumulated Percentage -- 6.32 8.64 5.67 Deviation from abundance estimated using full-length 16S sequences indicates data missing or illegible when filed
TABLE-US-00005 TABLE 5 Utility of proposed combinatorial approach in obtaining refined taxonomic profiles compared to taxonomic abundance estimates obtained with pair-wise combinations of V-regions. Results in the table pertain to the simulated human gut microbiome dataset Sputum. Abundance (%) Abundance Abundance Abundance estimated with (%) estimated (%) estimated (%) estimated combinatorial with full- with 10000 with 10000 approach using length 16S V1 + V4 paired- V1 + V5 paired- 5000 V1 + V4 and Species reads end reads end reads 5000 V1 + V5 reads Prevotella amnii (T) 8.05 0.00 9.60 8.81 Prevotella ni rescens (T) 7.85 9.65 9.08 7.95 Streptococcus salivarius (T) 7.64 8.48 8.91 8.24 Streptococcus suis (T) 6.19 7.29 7.15 6.59 Granulicatella adiacens (T) 5.81 6.72 3.32 5.43 Fusobacterium nucleatum (T 4.59 4.59 4.82 4.34 Streptococcus a alactiae (T) 4.22 5.14 4.83 4.73 Staphylococcus aureus (T) 4.03 4.64 4.83 4.35 Streptococcus pyo enes (T) 3.39 3.52 0.19 3.27 Neisseria menin itidis 2.84 2.72 1.58 2.05 Streptococcus allolyticus (T 2.31 2.65 2.62 2.66 Rothia dentocariosa (T) 2.20 2.49 2.67 2.33 Streptococcus dys alactiae ( 2.04 2.40 2.42 2.35 Veillonella parvula (T) 2.04 1.98 2.24 2.23 Propionibacterium acnes (T) 1.92 2.07 2.12 2.41 Rothia aeria (T) 1.90 2.44 2.45 2.19 Veillonella tobetsuensis (T) 1.90 2.12 2.35 1.92 Streptococcus pneumoniae ( 1.74 0.72 0.88 0.89 Rothia mucila inosa (T) 1.65 1.95 1.20 1.47 Haemophilus ae uytius (T) 1.58 1.91 1.61 1.61 Gemella san uinis (T) 1.50 1.59 1.61 1.61 Gemella haemolysans (T) 1.43 1.73 1.55 1.37 Actinomyces neuii (T) 1.39 1.60 1.86 1.68 Gemella ber eri (T) 1.38 1.32 1.53 1.76 Gemella morbillorum (T) 1.37 1.09 1.23 1.22 Dolosi ranulum pi rum (T) 1.36 1.51 1.52 1.71 Veillonella criceti (T) 1.35 0.79 0.68 0.68 Streptococcus e ui (T) 1.34 1.71 1.64 1.29 Streptococcus infantarius (T) 1.15 1.31 1.28 1.08 Pelomonas saccharophila (T 1.10 0.28 0.11 0.38 Rothia endophytica 0.93 0.93 0.96 0.99 Staphylococcus warneri (T) 0.91 1.12 0.90 0.93 Acinetobacter baumannii (T) 0.85 0.93 0.90 0.94 Veillonella atypica (T) 0.77 0.00 0.00 0.00 Rothia amarae (T) 0.71 1.01 0.90 0.62 Veillonella denticariosi (T) 0.71 1.01 0.36 0.57 Veillonella ratti (T) 0.69 0.36 0.00 0.11 Anoxybacillus rupiensis (T) 0.68 0.87 0.85 0.74 Actinomyces coleocanis (T) 0.68 0.70 0.82 0.77 Staphylococcus cohnii (T) 0.60 0.67 0.57 0.50 Streptococcus constellatus ( 0.59 0.83 0.66 0.60 Peptostreptococcus russellii 0.55 0.59 0.76 0.62 Solobacterium moorei (T) 0.54 0.65 0.68 0.57 Staphylococcus hominis (T) 0.54 0.59 0.63 0.54 Parvimonas micra (T) 0.54 0.65 0.73 0.54 Stenotrophomonas rhizophila 0.53 0.53 0.46 0.58 Streptococcus iniae (T) 0.50 0.62 0.54 0.39 Gemella palaticanis (T) 0.49 0.59 0.43 0.66 Peptostreptococcus anaerobi 0.46 0.54 0.65 0.52 Streptococcus pseudoporcinu 0.46 0.37 0.32 0.20 Cumulated Percentage -- 24.30 24.35 12.64 Deviation from abundance estimated using full-length 16S sequences indicates data missing or illegible when filed
TABLE-US-00006 TABLE 6 Utility of proposed combinatorial approach in obtaining refined taxonomic profiles compared to taxonomic abundance estimates obtained with pair-wise combinations of V-regions. Results in the table pertain to the simulated human gut microbiome dataset Sub-gingival. Abundance (%) Abundance Abundance Abundance estimated with (%) estimated (%) estimated (%) estimated combinatorial with full- with 10000 with 10000 approach using length 16S V1 + V4 paired- V1 + V5 paired- 5000 V1 + V4 and Species reads end reads end reads 5000 V1 + V5 reads Fusobacterium nucleatum (T 19.16 21.85 19.74 19.69 Prevotella ni rescens (T) 11.17 12.88 12.66 12.57 Prevotella amnii (T) 10.27 0.00 11.42 10.43 Parvimonas micra (T) 4.41 5.50 5.13 4.83 Streptococcus salivarius (T) 4.40 5.36 5.07 4.52 Streptococcus suis (T) 3.63 4.47 3.80 4.26 Streptococcus a alactiae (T) 2.85 3.32 3.28 3.13 Streptococcus pyo enes (T) 2.19 2.68 0.16 2.40 Capnocytopha a canimorsus 2.12 2.61 2.13 1.91 Granulicatella adiacens (T) 1.85 2.00 1.03 1.59 Porphyromonas crevioricanis 1.84 2.36 1.99 1.84 Campylobacter lari (T) 1.77 0.42 0.42 0.60 Treponema maltophilum (T) 1.57 1.15 1.62 1.31 Acinetobacter baumannii (T) 1.45 1.66 1.39 1.37 Streptococcus allolyticus (T 1.45 1.87 1.57 1.81 Fusobacterium necrophorum 1.38 1.68 1.65 1.56 Streptococcus dys alactiae ( 1.37 1.74 1.69 1.35 Neisseria menin itidis 1.31 1.50 0.73 0.96 Leptotrichia buccalis (T) 1.25 1.53 1.23 1.12 Porphyromonas somerae (T) 1.25 1.48 1.47 1.19 Enhydrobacter aerosaccus ( 1.18 1.37 1.17 1.43 A re atibacter aphrophilus 1.16 1.10 1.20 1.19 Actinomyces neuii (T) 1.13 1.37 1.23 1.29 Filifactor villosus (T) 1.11 1.10 1.29 1.17 Fusobacterium varium (T) 1.07 1.21 1.27 1.19 Reyranella massiliensis 1.07 1.34 0.97 1.14 Streptococcus pneumoniae ( 1.07 0.63 0.54 0.53 Treponema lecithinolyticum ( 0.97 1.23 1.00 1.03 Veillonella parvula (T) 0.94 0.89 0.94 0.85 Streptococcus e ui (T) 0.90 0.95 0.97 0.79 Treponema amylovorum (T) 0.89 1.11 1.00 0.78 Veillonella tobetsuensis (T) 0.82 0.97 0.93 0.95 Fusobacterium mortiferum (T 0.75 0.45 0.27 0.24 Treponema socranskii (T) 0.71 0.97 0.81 0.82 Streptococcus infantarius (T) 0.70 0.69 0.57 0.72 Porphyromonas asaccharolyti 0.69 0.87 0.76 0.75 Leptotrichia wadei (T) 0.68 0.90 0.73 0.65 Porphyromonas endodontalis 0.65 0.00 0.00 0.00 Acinetobacter calcoaceticus 0.64 0.65 0.45 0.69 Leptotrichia oodfellowii (T) 0.64 0.86 0.61 0.72 Veillonella criceti (T) 0.63 0.37 0.25 0.28 Actinomyces coleocanis (T) 0.60 0.69 0.76 0.60 Porphyromonas ulae (T) 0.60 0.00 0.00 0.00 Sphin obacterium spiritivoru 0.57 0.40 0.52 0.57 Catonella morbi (T) 0.57 0.79 0.64 0.50 Porphyromonas cansulci (T) 0.54 0.60 0.67 0.53 Rothia aeria (T) 0.53 0.66 0.63 0.56 Leptotrichia hofstadii (T) 0.51 0.56 0.72 0.66 Acinetobacter lwoffii (T) 0.49 0.52 0.40 0.40 Capnocytopha a cynode mi 0.49 0.66 0.49 0.55 Cumulated Percentage -- 29.18 16.17 11.42 Deviation from abundance estimated using full-length 16S sequences indicates data missing or illegible when filed
TABLE-US-00007 TABLE 7 Utility of proposed combinatorial approach in obtaining refined taxonomic profiles compared to taxonomic abundance estimates obtained with pair-wise combinations of V-regions. Results in the table pertain to the simulated human gut microbiome dataset Skin. Abundance (%) Abundance Abundance Abundance estimated with (%) estimated (%) estimated (%) estimated combinatorial with full- with 10000 with 10000 approach using length 16S V1 + V4 paired- V1 + V5 paired- 5000 V1 + V4 and Species reads end reads end reads 5000 V1 + V5 reads Staphylococcus aureus (T) 20.21 22.76 24.06 22.83 Propionibacterium acnes (T) 11.28 13.11 13.41 12.33 Staphylococcus warneri (T) 3.81 4.26 4.43 4.44 Methylobacterium populi (T) 3.28 0.41 0.55 0.55 Cupriavidus taiwanensis (T) 2.96 2.70 2.56 2.66 Schle elella thermodepolyme 2.92 3.89 3.68 3.44 Staphylococcus cohnii (T) 2.55 2.74 3.13 2.64 Staphylococcus hominis (T) 2.45 2.83 2.80 2.91 Cupriavidus basilensis (T) 2.40 2.70 2.87 2.56 Uruburuella suis (T) 2.39 2.65 2.84 2.88 Corynebacterium diphtheriae 2.35 2.91 2.76 2.35 Corynebacterium lutamicum 2.27 2.61 2.98 3.09 Cupriavidus respiraculi (T) 2.06 2.35 1.85 2.00 Staphylococcus sciuri (T) 1.88 2.22 2.09 1.84 Micrococcus yunnanensis (T 1.55 0.00 0.00 0.00 Methylobacterium koma atae 1.47 1.41 1.12 1.14 Streptococcus salivarius (T) 1.47 1.50 1.52 1.44 Methylobacterium oesin en 1.45 1.74 1.57 1.70 Dermacoccus nishinomiyaen 1.38 1.89 1.54 1.76 Corynebacterium bovis (T) 1.32 1.50 1.65 1.53 Staphylococcus e uorum (T) 1.28 1.65 1.46 1.43 Streptococcus suis (T) 1.26 1.33 1.59 1.57 Methylobacterium hispanicu 1.23 0.00 0.00 0.00 Fine oldia ma na (T) 1.20 1.30 1.37 1.43 Schle elella a uatica (T) 1.20 0.00 1.48 1.92 Ralstonia syzy ii 1.18 0.26 0.33 0.43 Cupriavidus pauculus (T) 1.13 1.41 1.30 1.27 Staphylococcus capitis (T) 1.13 1.28 1.28 1.31 Geobacillus stearothermophil 1.05 1.00 0.84 1.05 Wautersia numazuensis (T) 1.04 0.13 0.09 0.15 Methylobacterium mesophilic 0.99 1.09 0.88 0.78 Staphylococcus pasteuri (T) 0.95 1.09 1.10 1.45 Cupriavidus campinensis (T) 0.93 1.04 0.95 1.18 Staphylococcus carnosus (T) 0.93 0.96 0.66 0.91 Cupriavidus alkaliphilus (T) 0.91 1.06 0.13 0.84 Methylobacterium rhodesianu 0.90 1.06 1.17 1.05 Methylobacterium marchantia 0.87 0.59 0.71 0.69 Lactobacillus plantarum (T) 0.86 1.15 0.90 1.33 Corynebacterium ulcerans (T 0.84 0.33 0.62 0.34 Propionibacterium acidipropio 0.84 0.00 0.00 0.00 Propionibacterium acidifacien 0.82 0.91 0.95 0.92 Staphylococcus succinus (T) 0.82 0.91 0.95 1.01 Propionibacterium freudenrei 0.82 1.06 0.93 0.99 Geobacillus thermodenitrifica 0.80 0.63 0.60 0.53 Cupriavidus sp. ASC-64 0.79 0.63 0.57 0.65 Geobacillus thermoleovorans 0.78 0.57 0.02 0.39 Methylobacterium brachiatum 0.77 0.00 0.00 0.00 Stenotrophomonas rhizophila 0.77 0.98 0.71 0.82 Reyranella massiliensis 0.76 0.70 0.90 0.73 Streptococcus pyo enes (T) 0.74 0.72 0.11 0.75 Cumulated Percentage -- 24.15 26.99 22.65 Deviation from abundance estimated using full-length 16S sequences indicates data missing or illegible when filed
TABLE-US-00008 TABLE 8 Utility of proposed combinatorial approach in obtaining refined taxonomic profiles compared to taxonomic abundance estimates obtained with pair-wise combinations of V-regions. Results in the table pertain to the simulated Soil microbiome dataset. Abundance (%) Abundance Abundance Abundance estimated with (%) estimated (%) estimated (%) estimated combinatorial with full- with 10000 with 10000 approach using length 16S V1 + V4 paired- V1 + V5 paired- 5000 V1 + V4 and Species reads end reads end reads 5000 V1 + V5 reads Bradyrhizobium pachyrhizi ( 18.72 16.90 14.83 14.67 Rhodomicrobium vannielii 5.92 4.24 7.93 6.47 Gemmata obscuri lobus (T) 5.23 7.60 7.11 6.93 Gemmatimonas aurantiaca ( 5.16 7.89 6.41 6.78 Ktedonobacter racemifer (T) 5.03 7.87 6.94 7.11 Bradyrhizobium diazoefficien 4.29 0.00 2.59 3.15 Bradyrhizobium aponicum ( 3.97 0.00 0.00 0.00 Bradyrhizobium liaonin ense 3.90 0.00 0.00 0.00 A uisphaera iovannonii (T) 3.80 5.34 4.85 5.62 Gaiella occulta (T) 2.23 3.19 2.99 2.52 Mycobacterium leprae 2.17 3.14 2.42 2.72 Bradyrhizobium canariense ( 2.16 3.19 4.89 3.99 Phenylobacterium muchan p 2.09 1.54 1.56 1.72 Bradyrhizobium sp. OO99 1.93 0.00 0.00 0.00 Bradyrhizobium rifense 1.61 0.00 0.00 0.00 Burkholderia fun orum (T) 1.52 1.16 1.92 1.82 Phenylobacterium composti ( 1.45 2.44 1.88 2.24 Bradyrhizobium sp. LMTR 2 1.44 1.91 1.75 1.86 Pedomicrobium ferru ineum 1.42 2.11 1.94 1.79 Pedomicrobium australicum 1.33 2.24 0.00 1.75 Pedomicrobium man anicum 1.33 2.24 1.79 1.47 Massilia aurea (T) 1.29 1.96 1.88 1.70 Thermoleophilum album (T) 1.23 1.98 1.64 1.75 Domibacillus robi inosus (T) 1.15 1.87 1.88 1.80 Acidisoma tundrae (T) 1.11 1.67 1.27 1.70 Domibacillus sp. NIO-1016 1.07 1.80 1.52 1.40 Acidisoma sibiricum (T) 0.98 1.45 1.26 1.15 Dyella aponica (T) 0.98 0.40 0.32 0.34 Opitutus terrae (T) 0.93 1.05 1.03 1.60 Bradyrhizobium iriomotense 0.88 0.66 1.10 0.82 Tumebacillus insen isoli (T 0.88 0.92 1.29 1.19 Burkholderia phenoliruptrix ( 0.86 1.56 1.20 0.94 Burkholderia unamae (T) 0.85 0.57 0.68 0.63 Burkholderia phytofirmans (T 0.84 0.62 0.67 0.54 Pedomicrobium americanum 0.82 1.14 2.80 2.06 Burkholderia bannensis 0.76 0.02 0.04 0.02 Bradyrhizobium denitrificans 0.73 0.70 0.91 0.84 Rhodopila lobiformis (T) 0.72 1.19 0.95 0.97 Sinomonas atrocyanea (T) 0.71 0.22 0.29 0.24 Burkholderia tuberum (T) 0.66 0.83 0.67 0.82 Burkholderia mimosarum (T) 0.66 0.44 0.38 0.39 Microvir a sp. BR3299 0.66 1.03 0.80 0.90 Vampirovibrio chlorellavorus 0.61 0.94 0.95 0.82 Burkholderia sediminicola (T 0.61 0.00 0.38 0.26 Le ionella pneumophila (T) 0.58 0.83 0.87 0.79 Burkholderia udeis 0.57 0.09 0.06 0.10 Chromobacterium vaccinii (T 0.54 0.73 0.82 0.66 Se etibacter koreensis (T) 0.54 0.70 0.70 0.98 Phenylobacterium falsum (T) 0.53 0.79 0.76 0.74 Phenylobacterium immobile ( 0.53 0.83 1.08 1.23 Cumulated Percentage -- 47.96 44.05 40.99 Deviation from abundance estimated using full-length 16S sequences indicates data missing or illegible when filed
TABLE-US-00009 TABLE 9 Utility of proposed combinatorial approach in obtaining refined taxonomic profiles compared to taxonomic abundance estimates obtained with pair-wise combinations of V-regions. Results in the table pertain to the simulated Aquatic microbiome dataset. Abundance (%) Abundance Abundance Abundance estimated with (%) estimated (%) estimated (%) estimated combinatorial with full- with 10000 with 10000 approach using length 16S V1 + V4 paired- V1 + V5 paired- 5000 V1 + V4 and Species reads end reads end reads 5000 V1 + V5 reads Polynucleobacter necessariu 31.17 36.21 36.30 36.01 Polynucleobacter cosmopolit 12.68 14.48 13.55 13.85 Mycobacterium leprae 5.91 6.74 6.67 6.84 Luteolibacter al ae (T) 3.90 4.73 4.64 4.50 Rhodoferax saidenbachensis 3.13 2.00 0.82 1.78 Polynucleobacter acidiphobu 2.60 3.04 2.95 2.83 Acidovorax delafieldii (T) 2.35 0.58 0.37 0.46 Rhodoferax antarcticus (T) 2.09 2.36 2.26 2.29 Acidovorax temperans (T) 1.85 0.58 0.66 0.54 Methylophilus methylotrophu 1.69 0.86 0.59 0.80 Rhodoferax fermentans (T) 1.69 1.87 1.85 2.17 Opitutus terrae (T) 1.60 1.85 1.91 2.03 Luteolibacter pohnpeiensis ( 1.56 1.87 1.85 1.86 Haliscomenobacter hydrossis 1.35 1.59 1.63 1.54 Acidovorax cattleyae (T) 1.27 1.50 2.51 1.82 Mycobacterium iranicum (T) 1.26 1.48 1.44 1.45 Mycobacterium novocastrens 1.16 1.27 1.40 1.35 Mycobacterium marinum (T) 1.13 0.00 0.00 0.00 Methylomonas methanica (T 1.03 0.06 0.04 0.09 Mycobacterium tuberculosis 1.01 0.00 0.00 0.00 Microbacterium paraoxydans 0.99 1.04 1.10 0.83 Al oripha us namhaensis 0.97 1.13 1.00 1.10 Polynucleobacter rarus (T) 0.96 1.08 1.09 0.95 Mycobacterium cookii (T) 0.95 1.20 1.07 1.11 Acidovorax caeni (T) 0.93 1.13 1.03 1.08 Mycobacterium arupense (T) 0.93 0.00 0.00 0.00 Flavobacterium de erlachei ( 0.80 0.33 0.72 0.59 Methylomonas koyamae (T) 0.78 0.59 0.94 0.95 Acidovorax avenae (T) 0.72 0.00 0.00 0.00 Methylophilus leisin eri (T) 0.71 0.82 1.41 0.95 Rhodomicrobium vannielii 0.71 0.39 0.88 0.71 Fluviicola taffensis 0.70 0.87 0.84 0.89 Comamonas testosteroni (T) 0.67 0.65 0.68 0.76 Bei erinckia indica (T) 0.64 0.77 0.76 0.81 Al oripha us antarcticus (T) 0.62 0.73 0.69 0.72 Acidovorax radicis (T) 0.61 0.00 0.00 0.00 Methylocystis rosea (T) 0.57 0.58 1.07 0.75 Methylomonas scandinavica 0.57 0.34 0.66 0.47 Methylophilus flavus (T) 0.57 0.36 0.35 0.37 Stenotrophomonas rhizophila 0.55 0.61 0.50 0.53 Methylocystis hirsuta (T) 0.53 0.47 0.00 0.27 Comamonas ian duensis (T 0.51 0.06 0.06 0.09 Al oripha us halophilus (T) 0.50 0.61 0.60 0.61 Al oripha us lutimaris (T) 0.49 0.52 0.60 0.45 Verrucomicrobium spinosum 0.45 0.52 0.54 0.60 Acidovorax kon aci (T) 0.44 0.13 0.10 0.18 A uisphaera iovannonii (T) 0.44 0.55 0.56 0.60 Belnapia moabensis (T) 0.44 0.52 0.50 0.54 Caulobacter henricii (T) 0.40 0.47 0.34 0.43 Prosthecobacter vanneerveni 0.40 0.49 0.44 0.44 Cumulated Percentage -- 25.26 27.39 24.93 Deviation from abundance estimated using full-length 16S sequences indicates data missing or illegible when filed
TABLE-US-00010 TABLE 10 Utility of proposed combinatorial approach in obtaining refined taxonomic profiles compared to taxonomic abundance estimates obtained with pair-wise combinations of V-regions. Results in the table pertain to the simulated human gut microbiome dataset Vagina. While the chosen pairs of V-regions appear to provide sub-optimal performance for the Vaginal microbiome dataset, using a different set of V- region pairs (e.g. V1 + V5 and V1 + V8) improves the results of the combinatorial approach. Abundance (%) Abundance Abundance Abundance estimated with (%) estimated (%) estimated (%) estimated combinatorial with full- with 10000 with 10000 approach using length 16S V1 + V4 paired- V1 + V5 paired- 5000 V1 + V4 and Species reads end reads end reads 5000 V1 + V5 reads Lactobacillus plantarum (T) 24.11 26.50 24.97 24.72 Lactobacillus paracasei (T) 14.14 15.43 14.90 14.73 Lactobacillus fermentum 8.94 9.45 9.22 9.75 Lactobacillus delbrueckii (T) 7.71 8.43 7.83 7.95 Prevotella amnii (T) 4.99 0.00 5.34 5.30 Prevotella ni rescens (T) 4.82 5.37 5.12 5.18 Sneathia san uine ens (T) 4.39 4.80 4.61 4.43 Atopobium rimae (T) 2.70 1.06 0.93 0.96 Lactobacillus reuteri (T) 2.26 2.54 2.39 2.33 Lactobacillus diolivorans (T) 2.10 2.29 2.45 2.34 Lactobacillus farra inis (T) 1.60 1.63 1.38 1.38 Lactobacillus sakei (T) 1.59 1.81 1.54 1.51 Lactobacillus amylovorus (T) 1.22 1.40 1.29 1.43 Lactobacillus kimchii (T) 1.13 0.37 0.42 0.29 Lactobacillus asseri (T) 1.04 1.18 0.99 1.03 Atopobium minutum (T) 0.98 1.08 1.04 1.11 Lactobacillus kefiri (T) 0.97 1.17 0.97 0.94 Lactobacillus futsaii 0.91 0.89 0.91 0.84 Lactobacillus kefiranofaciens 0.86 0.99 0.89 0.80 Lactobacillus farciminis 0.79 0.18 0.18 0.18 Fine oldia ma na (T) 0.76 0.80 0.85 0.75 Lactobacillus buchneri (T) 0.73 0.90 0.78 0.80 Parvimonas micra (T) 0.73 0.90 0.87 0.75 Lactobacillus mucosae (T) 0.64 0.68 0.73 0.69 Lactobacillus animalis (T) 0.61 0.68 0.57 0.76 Lactobacillus parabuchneri ( 0.58 0.71 0.59 0.46 Lactobacillus florum (T) 0.56 0.66 0.72 0.61 Lactobacillus kunkeei (T) 0.55 0.62 0.55 0.61 Dialister invisus (T) 0.55 0.55 0.58 0.68 Streptococcus salivarius (T) 0.55 0.50 0.57 0.40 Lactobacillus coryniformis (T 0.49 0.59 0.46 0.53 Aerococcus viridans 0.45 0.23 0.07 0.13 Lactobacillus vaccinostercus 0.45 0.55 0.51 0.48 Lactobacillus in luviei (T) 0.41 0.42 0.28 0.34 Anaerococcus murdochii (T) 0.40 0.54 0.30 0.26 Lactobacillus helveticus (T) 0.36 0.00 0.33 0.31 Anaerococcus va inalis (T) 0.36 0.44 0.35 0.41 Streptococcus suis (T) 0.36 0.32 0.40 0.33 Lactobacillus paracollinoides 0.33 0.30 0.29 0.35 Dialister pneumosintes (T) 0.32 0.35 0.35 0.33 Lactobacillus va inalis (T) 0.30 0.31 0.22 0.46 Lactobacillus oeni (T) 0.28 0.37 0.27 0.30 Mobiluncus curtisii (T) 0.27 0.30 0.25 0.36 Lactobacillus crustorum (T) 0.25 0.21 0.23 0.23 Lactobacillus rossiae (T) 0.25 0.15 0.36 0.15 Ureaplasma urealyticum (T) 0.25 0.30 0.28 0.30 Lactobacillus harbinensis (T) 0.24 0.23 0.17 0.18 Lactobacillus acetotolerans ( 0.24 0.22 0.22 0.28 Streptococcus a alactiae (T) 0.24 0.28 0.28 0.29 Lactobacillus sunkii (T) 0.23 0.30 0.21 0.25 Cumulated Percentage -- 17.80 8.83 9.50 Deviation from abundance estimated using full-length 16S sequences indicates data missing or illegible when filed
TABLE-US-00011 TABLE 11 Utility of proposed combinatorial approach in obtaining refined taxonomic profiles compared to taxonomic abundance estimates obtained with pair-wise combinations of V-regions. Results in the table pertain to the simulated Nematode-gut microbiome dataset. Abundance (%) Abundance Abundance Abundance estimated with (%) estimated (%) estimated (%) estimated combinatorial with full- with 10000 with 10000 approach using length 16S V1 + V4 paired- V1 + V5 paired- 5000 V1 + V4 and Species reads end reads end reads 5000 V1 + V5 reads Acinetobacter baumannii (T) 8.40 10.44 8.59 9.11 Cellvibrio vul aris (T) 7.93 0.00 10.13 9.66 Cellvibrio aponicus (T) 6.24 8.52 7.97 7.38 Cellvibrio fibrivorans (T) 4.60 2.02 6.16 3.87 Reyranella massiliensis 3.58 5.31 5.24 4.08 Pseudoalteromonas tetraodo 3.58 4.76 4.62 3.65 Enhydrobacter aerosaccus ( 3.57 4.91 4.39 4.58 Acinetobacter calcoaceticus 3.47 4.21 2.82 3.22 Cellvibrio mixtus (T) 3.17 4.01 4.07 3.37 Cellvibrio sp. E50 3.06 4.04 0.00 3.43 Marinomonas primoryensis ( 2.62 0.00 0.00 0.00 Acinetobacter lwoffii (T) 2.42 2.67 2.34 2.18 Escherichia/Shi ella flexneri 2.15 0.00 0.00 0.00 Escherichia/Shi ella fer uson 2.15 2.89 0.00 2.37 Escherichia/Shi ella dysenter 2.12 2.54 2.76 2.57 Staphylococcus aureus (T) 2.09 2.82 2.62 2.43 Escherichia/Shi ella albertii ( 2.01 2.72 2.87 2.30 Alkanindi es illinoisensis (T) 1.94 2.49 2.62 2.37 Pseudomonas aeru inosa ( 1.76 2.47 2.30 2.02 Arcobacter butzleri (T) 1.74 2.14 2.16 1.66 Cellvibrio fulvus (T) 1.74 2.27 2.32 2.04 Propionibacterium acnes (T) 1.70 2.29 2.30 2.02 Cellvibrio andavensis (T) 1.63 2.27 1.75 1.92 Cellvibrio ostraviensis (T) 1.60 2.19 2.04 2.04 Marinomonas arctica (T) 1.56 1.94 1.79 1.94 Oceanospirillum maris (T) 1.45 2.24 2.00 1.83 Peredibacter starrii (T) 1.39 1.84 1.79 1.54 Pseudoalteromonas arctica ( 1.31 0.00 0.00 0.00 Delftia lacustris (T) 1.25 0.00 0.00 0.00 Oleispira antarctica (T) 1.17 1.54 1.54 1.52 Oceanospirillum bei erinckii ( 1.08 1.50 1.47 1.44 Acinetobacter unii (T) 1.06 1.57 1.15 1.10 Listonella an uillarum (T) 1.01 0.22 0.78 0.54 Brevundimonas nae an sane 1.01 1.00 1.19 1.33 Pseudoalteromonas shioyasa 0.96 0.95 1.19 0.93 Oceanospirillum linum 0.89 0.72 1.10 1.22 Vibrio cholerae (T) 0.87 0.00 0.02 0.08 Brevundimonas diminuta (T) 0.82 1.10 0.02 0.97 Persicirhabdus sediminis (T) 0.82 1.37 1.06 0.97 Leucobacter chromiiresistens 0.82 0.00 0.00 0.00 Acinetobacter radioresistens 0.80 1.20 0.90 0.97 Brevundimonas terrae (T) 0.77 0.35 0.34 0.35 Vibrio rotiferianus (T) 0.77 0.55 0.02 0.59 Acinetobacter uillouiae (T) 0.76 0.37 0.83 0.66 Leucobacter tardus (T) 0.76 1.02 0.85 0.95 Brevundimonas bullata (T) 0.72 1.00 0.23 0.76 Leucobacter koma atae (T) 0.71 0.17 0.23 0.23 Microbacteriaceae bacterium 0.67 0.52 0.21 0.56 Acinetobacter nectaris (T) 0.66 0.85 0.62 0.67 Brevundimonas intermedia ( 0.64 0.00 0.62 0.59 Cumulated Percentage -- 45.74 37.26 24.19 Deviation from abundance estimated using full-length 16S sequences indicates data missing or illegible when filed
[0050] Method for Generation of the Computation Table
[0051] Rationale and methodology employed for pre-computing/pre-estimating the accuracies of [0052] (a) the individual V-regions (targeted in the experiments) in resolving each of the taxonomic groups under consideration. [0053] (b) Pairs of (contiguously or non-contiguously located) V-regions within the 16S rRNA gene in resolving each of the taxonomic groups under consideration.
[0054] As a one-time procedure, the following steps were performed for pre-computing the discriminating capability i.e. the accuracy of different V-regions (or combinations of various possible pairs of the same) with respect to different taxonomic lineages. The pre-generated set of accuracy values are required for solving Equation 3.
[0055] Rationale and Procedure
[0056] Full length bacterial 16S rRNA gene sequences (along with their annotated lineages) present in the RDP database (release 11.3) were retrieved. The RDP hierarchy browser was used for this purpose with the following filters--Strain=`Both`; Source=`Isolates`; Size `>=1200`; Taxonomy=`NCBI`; Quality=`Good`, which resulted in a downloaded set of 232,163 sequences. Further, sequences not containing any of the nine V-regions (V1-V9) were filtered out from the set of sequences, leaving a total of 84,711 16S rRNA sequences belonging to 11,810 species. Subsequently, both full-length as well as different portions of the 16S rRNA gene sequences were extracted in silico to represent outcomes of amplicon sequencing experiments, and were provided as input to the Wang classifier (algorithm used in RDP classifier), for taxonomic classification. The current version of RDP classifier 16S training set was used as the reference database for these taxonomic assignment steps, and the taxonomic hierarchy information of the reference sequences were appropriately used while training the Wang classifier in order to enable obtaining taxonomic classifications resolved up to species level. Only a subset (57,632 sequences) of the originally downloaded full-length 16S rRNA gene sequences, which could be classified at species level with >=80% bootstrap confidence threshold, was later used as a pool for randomly drawing sequences during creation of mock/simulated metagenomic datasets (as described later in this section).
[0057] For evaluating the discriminating ability of individual V-regions and their combinations, the regions of interest were parsed out from corresponding full-length 16S rRNA gene sequences using an in house modified version of the V-xtractor program, and submitted as query sequences to the Wang classifier, after appropriate pre-processing. First, the effectiveness of individual V-regions in resolving between different taxonomic groups was evaluated. For this purpose, different V-regions from all the 16S rRNA gene sequences, downloaded from the RDP database, were extracted. Subsequently, each of these individual V-regions were subjected to taxonomic classification with the Wang classifier, and the resultant assignments at the genus level were checked for accuracy and specificity against the taxonomic attributes provided by RDP for the corresponding full-length sequences.
[0058] The taxonomic classification accuracies of different V-regions in resolving different taxonomic groups are depicted in FIG. 6. The taxonomic classification accuracies (at genus level) obtained with V-regions have been cumulated and depicted at the `phylum level` in the figure, and placed in context with the taxonomic classification accuracies which would have been obtained with full length 16S rRNA gene sequences.
[0059] Except for V1, V5 and V9, all other V-regions were observed to have certain utility in taxonomic classification, even when targeted individually. It was also evident from the plot that some V-regions provide comparatively higher taxonomic classification accuracies of classification for specific taxonomic groups. For example, the V4 region has the highest accuracy while classifying sequences pertaining to the phylum Bacteroidetes (75.9%), whereas the V2 region classifies best with respect to the phylum Firmicutes (68.2%). A detailed list of taxonomic classification accuracies in taxonomic classification obtained with different V-regions at genus level is also calculated and collated in a table (not provided in the disclosure due to large size).
[0060] Given these observations, it would seem logical for a microbiome study design to sequence two (or more) V-regions from a 16S rRNA gene fragment which have complementary abilities with respect to classification of different taxonomic groups. Furthermore, the choice of the combination of V-regions could also be guided by the environment from where the metagenomic sample is being collected, given that diverse environments may be differentially enriched with different taxonomic groups. A preferred combination of V-regions cannot always be expected to be situated in a contiguous stretch on the 16S rRNA gene. Given the read length limitations of NGS technologies, targeting an amplicon constituting the preferred regions becomes difficult in reality.
[0061] The length distributions of V-regions and C-regions (constant/conserved regions flanking the V-regions) across different bacterial taxonomic groups are provided in FIG. 7. These distributions indicate that while individual V-regions and contiguous stretches like V2-V3 (median length 297 bp) or V3-V4 (median length 254 bp) can easily be targeted with short read sequencing techniques like Illumina HiSeq/MiSeq, sequencing longer contiguous stretches encompassing more than two V-regions, such as V2-V3-V4 (median length 482 bp) and V4-V5-V6 (median length 453 bp) necessitates sequencing platforms that can generate longer read lengths.
[0062] Paired-end sequencing protocols available with some of the NGS platforms allow sequencing of a stretch of DNA from both its ends. For example, Illumina HiSeq sequencing platforms can be used for paired-end sequencing to generate up to 2.times.250 bp reads. The current work proposes, and evaluates in silico, the utilization of paired-end sequencing protocols for sequencing various pair wise combinations of non-contiguous V-regions in a single sequencing run. To this end, appropriate primers need to be designed against a desired stretch of the 16S rRNA gene, such that the targeted V-regions (either contiguously or non-contiguously placed) reside within this stretch, and are not far from either of its boundaries. Sequencing of the amplicons generated with these primers can then be performed with a paired-end sequencing protocol, whereby these (amplified) stretches of DNA are sequenced from both ends. Two reads sequenced from each such amplicon would cover the two targeted V-regions (one from each end). Since each of the sequenced reads from any given `pair` targets a single V-region (situated at one of the ends of the amplicon), read-length limitations do not restrict capturing the entirety of the individual V-regions. Consequently, it becomes possible to sequence almost all possible pair wise combinations of V-regions, either arranged contiguously or non-contiguously. The results pertaining to the in silico evaluation of the effectiveness of different combinations of V-regions (see Methods), in providing accurate taxonomic classifications (at the species level) for sequences listed in the RDP database, is depicted in FIG. 8.
[0063] Taxonomic classification accuracies provided by several combinations of non-contiguously placed V-region pairs, namely V1+V3 (77.7%), V1+V4 (77.4%), V1+V8 (76.6%), V2+V5 (73.6%), etc., were sufficiently high, and exceeded the taxonomic classification accuracies provided by combination of adjacently placed V-regions by a fair margin. It was also significant to note that many of the individual V-regions, which had very low taxonomic discriminating ability of their own (FIG. 6), could provide significant taxonomic classification accuracies when paired up with other V-regions. For example, while V1 and V5 provided very low taxonomic classification accuracies when targeted alone, the combination of V1+V5 could provide a significantly high taxonomic classification accuracy of 73.4%. Furthermore, although the individual V-regions were observed to have differential abilities in classifying sequences originating from different phyla (FIG. 6), their combinations were much more coherent in this regard, and could classify sequences from all phyla with almost equivalent efficiency (FIG. 9). Results indicate the potential utility of targeting pairs of non-contiguously placed V-regions to improve taxonomic classification accuracy. Additionally, the results also suggest that for exploring the taxonomic diversity of a particular environment, which may be expected to be enriched with particular groups of bacteria, an appropriate combination of V-regions sensitive to the same bacterial groups may be chosen.
[0064] It may be noted in this context, that reads generated during amplicon sequencing may often encompass flanking `constant` regions in addition to the targeted V-region(s), depending on choice of primers and the maximum read-length attainable by the sequencing technology. Consequently, our evaluation exercise, pertaining to combination of V-regions, aimed at mimicking 250 bp.times.2 paired-end sequencing, wherein the extracted regions (representing sequenced reads) also encompass such flanking regions. To achieve this, regions from the full length 16S rRNA genes were extracted in such a way that either of the 250 bp reads (constituting a read-pair) contained one of the target V-regions, flanked in both directions by equivalent portions (lengths) of the surrounding `constant` regions. HMMs corresponding to constant regions surrounding the V-regions, as provided by the V-xtractor program were used for this purpose. In case two adjacent V-regions were targeted, there was a significant chance of finding an overlap between two reads constituting a pair. This overlap was utilized to join the pair of reads together into a single sequence before submitting the same as a query to the Wang classifier. In contrast, on sequencing two distantly separated non-contiguous V-regions, no overlap between the read pairs could be expected. Accordingly, the pair of reads in this case were concatenated using a string of eight consecutive `N`s, while preserving their orientation, prior to processing with Wang classifier. Given that Wang classifier (or RDP classifier) utilizes 8-mer nucleotide frequencies during taxonomic assignment, joining two non-overlapping sequenced fragments with 8 ambiguous nucleotides (N) ensures avoiding generation of spurious 8-mers consisting nucleotides from non-adjacent regions of the gene. Taxonomic assignments generated by the Wang classifier at a predetermined taxonomic level with a confidence threshold score of >=80% were used for all downstream comparative analyses.
[0065] The utility of all possible pair wise combinations of V regions, either arranged contiguously or non-contiguously, were investigated in silico in terms of accuracy of taxonomic classifications provided by each such combination. As mentioned earlier, sequence fragments mimicking outcomes of 250 bp.times.2 paired-end sequencing, which target different contiguous/non-contiguous combinations of V-regions, were derived from the downloaded 16S rRNA gene sequences. These fragments were subsequently subjected to taxonomic classification with the Wang classifier and the assignments obtained at species level were checked for accuracy and specificity against the pre-annotated taxonomic attributes of their source (full-length) 16S rRNA genes.
[0066] To assess the utility of the proposed non-contiguous combination of V-regions on a microbiome dataset, while avoiding any bias arising out of the proportion of sequences pertaining to different bacterial groups currently catalogued in reference databases like RDP, taxonomic classification exercises were further performed with mock and simulated metagenomic datasets.
[0067] Each of the mock microbiome datasets were constructed using 10,000 randomly selected 16S rRNA gene sequences from one of the five randomized 16S gene pools. Each of these gene pools consisted of sequences downloaded from the RDP database, wherein the proportion of sequences selected from different organisms were also randomized (see Methods). The results, in terms of classification accuracy at the species level, are depicted in Table 12. It was interesting to note that 18 out of the 20 combinations of V-regions, which could provide classification accuracy >=60% on average, constituted of non-contiguous V-regions. The best performing combination of adjacent V-regions was V2-V3, which on average provided 69.1% classification accuracy. In comparison, the combination of the non-contiguously placed V-regions V1+V4 demonstrated a high average classification accuracy of 77.2%.
TABLE-US-00012 TABLE 12 Taxonomic classification accuracies obtained using different pair-wise combinations of V-regions (both contiguous as well as non-contiguous) evaluated for mock microbiome datasets, each constituting of 10,000 randomly selected 16S rRNA genes from five different 16S gene pools. Accuracy of taxonomic assignments has been evaluated at the species level considering the assignments obtained with full-length 16S sequences to be correct. Top 20 combinations in terms of average classification accuracy have been depicted. Classification accuracy (%) at species level averaged over five mock datasets from each 16S gene pool Mock data Mock data Mock data Mock data Mock data Combination from 16S from 16S from 16S from 16S from 16S Average of V-region gene pool 1 gene pool 2 gene pool 3 gene pool 4 gene pool 5 accuracy V1 + V4 77.29 79.47 72.79 75.9 80.48 77.19 V1 + V3 74.69 78.16 77.52 74.76 80.08 77.04 V1 + V8 76.03 77.96 73.24 75.72 79.32 76.46 V1 + V7 77.2 78.33 70.37 77.34 78.6 76.37 V1 + V6 72.46 77.34 69.73 78.25 76.9 74.94 V1 + V5 70.89 74.24 69.16 73.37 76.4 72.81 V1 + V9 71.74 71.41 71.33 73.95 75.57 72.8 V2 + V4 69.07 75.07 72.76 70.99 73.55 72.29 V2 + V8 68.26 74.6 73.33 70.66 73.27 72.02 V2 + V6 66.84 74.54 72.6 72.19 72.67 71.77 V2 + V7 68.34 72.76 72.73 71.17 71.3 71.26 V2V3* 61.53 71.52 72.03 66.31 73.92 69.06 V2 + V9 65.03 68.85 71.6 66.32 71.81 68.72 V1V2* 64.2 70.29 66.81 65.44 72.4 67.83 V3 + V8 68.47 61.8 69.66 66.59 67.82 66.87 V3 + V7 68.41 61.6 71.05 66.8 65.93 66.76 V2 + V5 61.38 68.19 68.42 65.36 69.34 66.54 V3 + V6 63.26 59.91 68.53 67.04 65.15 64.78 V3 + V9 63.63 55.85 67.2 65.94 63.83 63.29 V3 + V5 60.94 56.74 65.79 62.91 62.49 61.77
[0068] The specific combinations of V-regions, which provided comparatively higher accuracies of taxonomic classification with the RDP database sequences, were made subject to this further evaluation wherein 5 mock 16S metagenomic gene pools were created from randomly selected sets of 50 organisms (genus) listed in RDP database (Table 13).
TABLE-US-00013 TABLE 13 Source genera for 16S rRNA sequences included in five 16S gene pools. Randomly drawn sequences from these pools were used in generation of mock datasets. 16S gene 16S gene 16S gene 16S gene 16S gene Genera pool 1 pool 2 pool 3 pool 4 pool 5 Acetobacterium No No No Yes No Achromobacter Yes No Yes No No Acidiphilium No No No No Yes Acidithiobacillus No Yes No No No Acidovorax Yes No No No No Acinetobacter Yes No No Yes No Actinobacillus Yes No No No No Actinomadura No No Yes No Yes Aggregatibacter No Yes No Yes Yes Agromyces No No No No Yes Alcaligenes Yes No No No No Alcanivorax No Yes No No No Alicyclobacillus No No No No Yes Alkalibacterium No No No No Yes Alteromonas No No No No Yes Arcobacter Yes No No No Yes Arthrobacter Yes Yes Yes Yes No Asaia No No Yes No No Azoarcus Yes No No No No Azospirillum No Yes Yes No No Bacillus No No Yes No No Bifidobacterium No Yes No No Yes Borrelia No No No Yes Yes Bosea No No Yes Yes No Brachybacterium No No Yes No No Bradyrhizobium No Yes Yes Yes No Brevibacillus Yes No No No No Brevundimonas Yes No No No No Brucella Yes No No No No Buchnera Yes No Yes No Yes Burkholderia No No No Yes No Butyrivibrio Yes No Yes Yes No Campylobacter Yes No No No No Carnobacterium No Yes No No No Caulobacter No Yes Yes No No Cellulomonas Yes No No No Yes Chromobacterium Yes No No No Yes Chromohalobacter No No Yes No No Chryseobacterium No No No Yes No Citrobacter Yes No No Yes No Colwellia No No Yes Yes No Comamonas No No No No Yes Corallococcus No Yes No Yes No Corynebacterium No No No No Yes Cronobacter Yes No No Yes No Curtobacterium Yes No No Yes Yes Deinococcus No Yes Yes No Yes Delftia No No Yes No Yes Desulfosporosinus Yes No No Yes No Desulfotomaculum No No Yes Yes No Edwardsiella No No Yes Yes No Enterococcus No Yes No No Yes Erythrobacter Yes No No No Yes Eubacterium No No Yes No No Exiguobacterium No Yes No No No Flavobacterium Yes Yes No Yes No Francisella Yes Yes No No No Fusobacterium No No No No Yes Gallibacterium No No Yes No No Geobacillus No No Yes Yes No Glaciecola No No No Yes Yes Gluconobacter No Yes No No No Haemophilus No Yes No No No Halobacillus No No No Yes No Halomonas No Yes No Yes Yes Helicobacter Yes No No No No Herbaspirillum No No No Yes No Hydrogenophaga No No Yes No No Idiomarina No No No Yes No Kitasatospora No Yes No No No Klebsiella Yes No No No No Kocuria No No Yes No No Komagataeibacter No No No No Yes Lactobacillus No No Yes No Yes Lactococcus Yes No No Yes No Legionella No Yes No No No Leifsonia No Yes No No Yes Leptospira No Yes No No No Leucobacter No Yes Yes No Yes Leuconostoc Yes Yes No Yes No Listeria Yes No No No No Loktanella No Yes Yes No No Lysinibacillus Yes No No No No Lysobacter No No No No Yes Marinobacter No Yes No No Yes Marinobacterium No No Yes No No Marinomonas No No No Yes Yes Massilia Yes No Yes Yes No Methylobacterium No No No Yes Yes Microbispora Yes No No No No Micromonospora Yes Yes No No No Moraxella No No Yes No No Moritella No No No No Yes Mycoplasma No Yes No No No Neisseria Yes Yes No No Yes Nitrosomonas No No Yes No No Nocardioides Yes Yes No Yes No Novosphingobium Yes No Yes No No Oceanobacillus Yes No Yes Yes No Paenibacillus Yes Yes No Yes No Pandoraea No No No Yes No Pantoea No No No Yes Yes Paracoccus No No No No Yes Pectobacterium No No Yes No Yes Pediococcus No No No No Yes Photobacterium No No Yes No Yes Photorhabdus No Yes Yes No No Phyllobacterium No Yes No No No Planococcus No No No Yes No Polaribacter No No Yes No No Polynucleobacter Yes No No No No Proteus Yes No Yes No No Pseudomonas No No No No Yes Pseudoxanthomonas No Yes No No No Psychrobacter No No Yes No No Rahnella Yes No No No No Ralstonia No No Yes Yes No Rhizobium No Yes Yes No Yes Rhodopirellula No Yes Yes Yes Yes Rickettsia No No Yes Yes No Ruegeria No No No No Yes Ruminococcus No Yes No No No Salmonella No Yes No Yes Yes Selenomonas No No Yes No No Serratia No Yes No Yes No Shewanella Yes No No No Yes Sorangium Yes No Yes No No Sphingobium No Yes No Yes Yes Spiroplasma Yes No No No No Sporolactobacillus No No Yes Yes No Staphylococcus No Yes No Yes Yes Stenotrophomonas Yes Yes No Yes No Streptococcus No Yes No No No Streptomyces No Yes Yes No No Streptosporangium No No No No Yes Taylorella Yes Yes No No No Thalassospira No Yes Yes No No Thermoanaerobacter Yes No Yes No No Thermoanaerobacterium No No No Yes No Thermus No No No Yes No Thiomonas Yes No Yes No No Trueperella No Yes No Yes Yes Vibrio Yes No No No Yes Virgibacillus Yes No Yes No No Weissella No Yes No No Yes Xanthomonas No Yes No Yes No Xenorhabdus Yes No No Yes No Xylella No Yes No No No
[0069] To obtain reads for building the mock metagenomic datasets corresponding to these pools, each time 10,000 16S rRNA genes were drawn randomly from a gene pool, such that the proportion of 16S rRNA genes drawn from any of the organisms are also randomized. 5 such datasets (with 10,000 reads each) corresponding to each of the 5 gene pools (a total of 25 mock datasets) were constructed for comparative evaluation. Different contiguous as well as non-contiguous combinations of V-regions were subsequently extracted from each of the 16S rRNA genes belonging to these mock datasets, and subjected to taxonomic analysis using Wang classifier, following the classification methodology described above. Taxonomic abundance values (obtained using different combinations of V-regions) were averaged over 5 mock datasets pertaining to the same gene pool. The averaged abundance values for each of the mock gene pools were compared against each other and the pre-annotated taxonomic attributes of their source (full-length) 16S rRNA genes, to assess the utility of the chosen combinations of V-regions. The results, in terms of classification accuracy at the species level, are depicted in Table 12. It was interesting to note that 18 out of the 20 combinations of V-regions, which could provide classification accuracy >=60% on average, constituted of non-contiguous V-regions. The best performing combination of adjacent V-regions was V2-V3, which on average provided 69.1% classification accuracy. In comparison, the combination of the non-contiguously placed V-regions V1+V4 demonstrated a high average classification accuracy of 77.2%.
[0070] Nine more simulated microbiomes mimicking different environmental and host associated niches--namely, gut, skin, vaginal, sub-gingival (oral), sputum (oral), nematode gut, soil, and aquatic were also generated. Taxonomic abundance estimates for eight of these environmental microbiomes were derived from datasets used in an earlier in silico study evaluating functional potential of diverse metagenomes Taxonomic abundance estimates for the aquatic microbiome was derived from a recent study. To populate these simulated microbiomes, sequences from RDP database were randomly drawn, while making sure that the proportions of 16S rRNA genes drawn from different genera were roughly similar to the proportions observed earlier for these environments. The taxonomic classification efficiency of the V-region combinations (at the species level) was also assessed on this set of simulated microbiome. The efficiency of the proposed non-contiguous combination of V-regions was further tested on nine additional simulated metagenomes mimicking different environmental and host associated niches as shown in Table 14. The data in the Table 14 have been collected from various sources in the art.
TABLE-US-00014 TABLE 14 Summary of datasets used for deriving taxonomic profiles pertaining to various environmental and host associated niches used to generate simulated metagenomes mimicking the respective environments. Genera level abundances, averaged over all datasets pertaining to an environment, were used to draw respective proportions 16S rRNA genes from the set of downloaded RDP sequences while constructing the simulated metagenomics datasets No. of Sample Identifier Environment Samples Gut1 (Prebiotics) Gut(Human) 283 Gut2 (HMP) Gut (Human) 306 Sputum Oral Cavity (Human) 68 Skin Skin (Human) 149 Sub-gingival Oral Cavity (Human) 91 Vaginal Vagina (Human) 394 Soil Soil 18 Nematode Nematode Gut 36 (Litoditis Marina) Aquatic Aquatic 20
[0071] Results pertaining to the human associated simulated metagenomes, namely, gut, skin, vaginal, subgingival (oral) and sputum (oral) are depicted in FIG. 4. It was interesting to note that optimal classification of reads from the simulated metagenomes pertaining to different niches could be obtained with different combinations of non-contiguous V-regions.
[0072] The combination of V1+V4 regions provided the maximum accuracy of classification for skin (60.2%) and one of the gut (86.0%) metagenomes (GUT2), whereas metagenomes pertaining to vaginal and sub-gingival niches were best resolved by the combination V1+V9 (with accuracies of 83.3% and 78.6% respectively). Optimal classification of sputum metagenomic samples (72.1%) could be obtained by another non-contiguous combination, viz. V1+V5 regions, which could also provide relatively more accurate classification for the GUT1 metagenome (82.5%). These results further reiterate the need of choosing an optimal combination of V-regions, preferably non-contiguous, for a specific sampled environment.
[0073] It was also noted that the high variability in taxonomic classification accuracies of individual V-region combinations while classifying samples pertaining to different environments. For example, while the combination V2+V4 could classify one of the gut microbiomes (Gut2) with 85.93% accuracy, the classification results were not as high when the same combination was used to classify the aquatic microbiome (69.2%). On the other hand, the combination V2+V7 was observed to provide decent classification for the simulated aquatic microbiome (72.8%), while performing not so well for the simulated gut microbiome datasets (65.8% for Gut1 and 70.9% for Gut2). These results further reiterate the need of choosing an optimal combination of V-regions, preferably non-contiguous, for a specific sampled environment.
[0074] It may be noted here that the paired-end reads generated for in silico evaluation of the utility of different combinations of V-regions were based on HMMs pertaining to the flanking constant regions, as provided by the V-xtractor program. Actual primer design may not always allow generation of reads identical to the in silico experiment, and results from a sequencing experiment may slightly vary from the validation results presented. A comparison of the paired-end reads generated in the in silico experiments with respect to those which may be obtained by using different sets of primers currently available for 16S rRNA amplicon sequencing as shown in FIG. 10.
[0075] It may be mentioned here that assessment of primer specificity on all sequences from RDP database (a total of 232,163 sequences having length >=1,200 bp) revealed that the combinations/pairs (either contiguous or non-contiguous) involving the V1-region could potentially amplify a lower fraction of sequences compared to other combinations. Apparently, the fraction of sequences that can be amplified by the said combinations is limited by the specificity/universality of the primer for V1-region. The presence of many incomplete/truncated SSU rRNA sequences in RDP database, which might be missing the V1 primer binding sites may also contribute to this observation. The overall results, however, do not indicate any significant deviations in the specificity (fraction of bacterial sequences amplified) of primer pairs targeting non-contiguous V-regions, when compared to the primers targeting contiguously placed V-regions.
[0076] The illustrated steps are set out to explain the exemplary embodiments shown, and it should be anticipated that ongoing technological development will change the manner in which particular functions are performed. These examples are presented herein for purposes of illustration, and not limitation. Further, the boundaries of the functional building blocks have been arbitrarily defined herein for the convenience of the description. Alternative boundaries can be defined so long as the specified functions and relationships thereof are appropriately performed. Alternatives (including equivalents, extensions, variations, deviations, etc., of those described herein) will be apparent to persons skilled in the relevant art(s) based on the teachings contained herein. Such alternatives fall within the scope and spirit of the disclosed embodiments. Also, the words "comprising," "having," "containing," and "including," and other similar forms are intended to be equivalent in meaning and be open ended in that an item or items following any one of these words is not meant to be an exhaustive listing of such item or items, or meant to be limited to only the listed item or items. It must also be noted that as used herein and in the appended claims, the singular forms "a," "an," and "the" include plural references unless the context clearly dictates otherwise.
[0077] Furthermore, one or more computer-readable storage media may be utilized in implementing embodiments consistent with the present disclosure. A computer-readable storage medium refers to any type of physical memory on which information or data readable by a processor may be stored. Thus, a computer-readable storage medium may store instructions for execution by one or more processors, including instructions for causing the processor(s) to perform steps or stages consistent with the embodiments described herein. The term "computer-readable medium" should be understood to include tangible items and exclude carrier waves and transient signals, i.e., be non-transitory. Examples include random access memory (RAM), read-only memory (ROM), volatile memory, nonvolatile memory, hard drives, CD ROMs, DVDs, flash drives, disks, and any other known physical storage media.
[0078] It is intended that the disclosure and examples be considered as exemplary only, with a true scope and spirit of disclosed embodiments being indicated by the following claims.
Sequence CWU 1
1
11120DNAArtificial sequencePrimer for amplicon
sequencingmisc_feature(2)..(2)n is a, c, g, or
tmisc_feature(4)..(4)n is a, c, g, or t 1tnanacatgc aagtcgrrcg
20220DNAArtificial sequencePrimer for amplicon sequencing
2agtggcggac gggtgagtaa 20319DNAArtificial sequencePrimer for
amplicon sequencing 3ggaggcagca gtrrggaat 19415DNAArtificial
sequencePrimer for amplicon sequencing 4agggtatcta atcct
15515DNAArtificial sequencePrimer for amplicon sequencing
5accgcggckg ctggc 15617DNAArtificial sequencePrimer for amplicon
sequencing 6cggtgtgtac aagaccc 17719DNAArtificial sequencePrimer
for amplicon sequencing 7cgtcatccmc accttcctc 19817DNAArtificial
sequencePrimer for amplicon sequencing 8crrcacgagc tgacgac
17918DNAArtificial sequencePrimer for amplicon sequencing
9cgtcaattcm tttgagtt 181016DNAArtificial sequencePrimer for
amplicon sequencing 10gacgggcggt gtgtrc 161119DNAArtificial
sequencePrimer for amplicon sequencing 11tgctgcctcc cgtaggagt
19
D00001
D00002
D00003
D00004
D00005
D00006
D00007
D00008
D00009
D00010
D00011
D00012

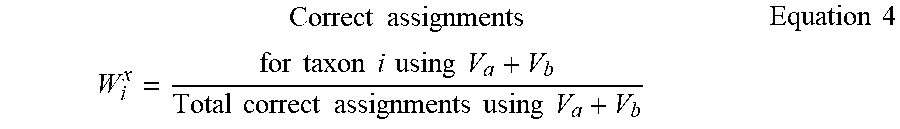


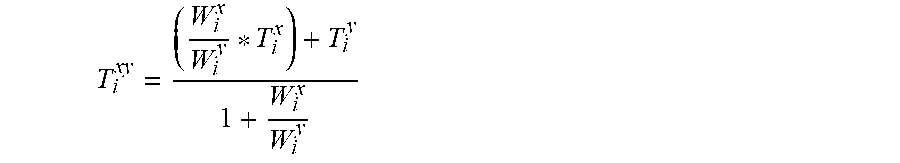
P00899

S00001
XML
uspto.report is an independent third-party trademark research tool that is not affiliated, endorsed, or sponsored by the United States Patent and Trademark Office (USPTO) or any other governmental organization. The information provided by uspto.report is based on publicly available data at the time of writing and is intended for informational purposes only.
While we strive to provide accurate and up-to-date information, we do not guarantee the accuracy, completeness, reliability, or suitability of the information displayed on this site. The use of this site is at your own risk. Any reliance you place on such information is therefore strictly at your own risk.
All official trademark data, including owner information, should be verified by visiting the official USPTO website at www.uspto.gov. This site is not intended to replace professional legal advice and should not be used as a substitute for consulting with a legal professional who is knowledgeable about trademark law.