Method For Culturing Natural Killer Cell, Using Transformed T Cell
MIN; Bokyung ; et al.
U.S. patent application number 16/613601 was filed with the patent office on 2020-04-09 for method for culturing natural killer cell, using transformed t cell. This patent application is currently assigned to GREEN CROSS LAB CELL CORPORATION. The applicant listed for this patent is GREEN CROSS LAB CELL CORPORATION. Invention is credited to Yu Kyeong HWANG, Hyojin KIM, Hyun Ah KIM, Bokyung MIN, Gyeong Min PARK, Bitna YANG.
| Application Number | 20200108096 16/613601 |
| Document ID | / |
| Family ID | 64396946 |
| Filed Date | 2020-04-09 |


View All Diagrams
| United States Patent Application | 20200108096 |
| Kind Code | A1 |
| MIN; Bokyung ; et al. | April 9, 2020 |
METHOD FOR CULTURING NATURAL KILLER CELL, USING TRANSFORMED T CELL
Abstract
A method for culturing natural killer cells uses genetically modified T cells. The method for culturing natural killer cells, using genetically modified T cells enables the effective proliferation and production of natural killer cells from a smaller amount of source cells. In addition, the method enhances the cytolytic activity of natural killer cells. Therefore, the method for culturing natural killer cells, using genetically modified T cells may be suitable for various applications in commercializing cell therapy products. Further, the natural killer cells produced by the culturing method can be useful as a cell therapy product.
| Inventors: | MIN; Bokyung; (Yongin-si, KR) ; PARK; Gyeong Min; (Yongin-si, KR) ; KIM; Hyun Ah; (Yongin-si, KR) ; YANG; Bitna; (Yongin-si, KR) ; HWANG; Yu Kyeong; (Yongin-si, KR) ; KIM; Hyojin; (Yongin-si, KR) | ||||||||||
| Applicant: |
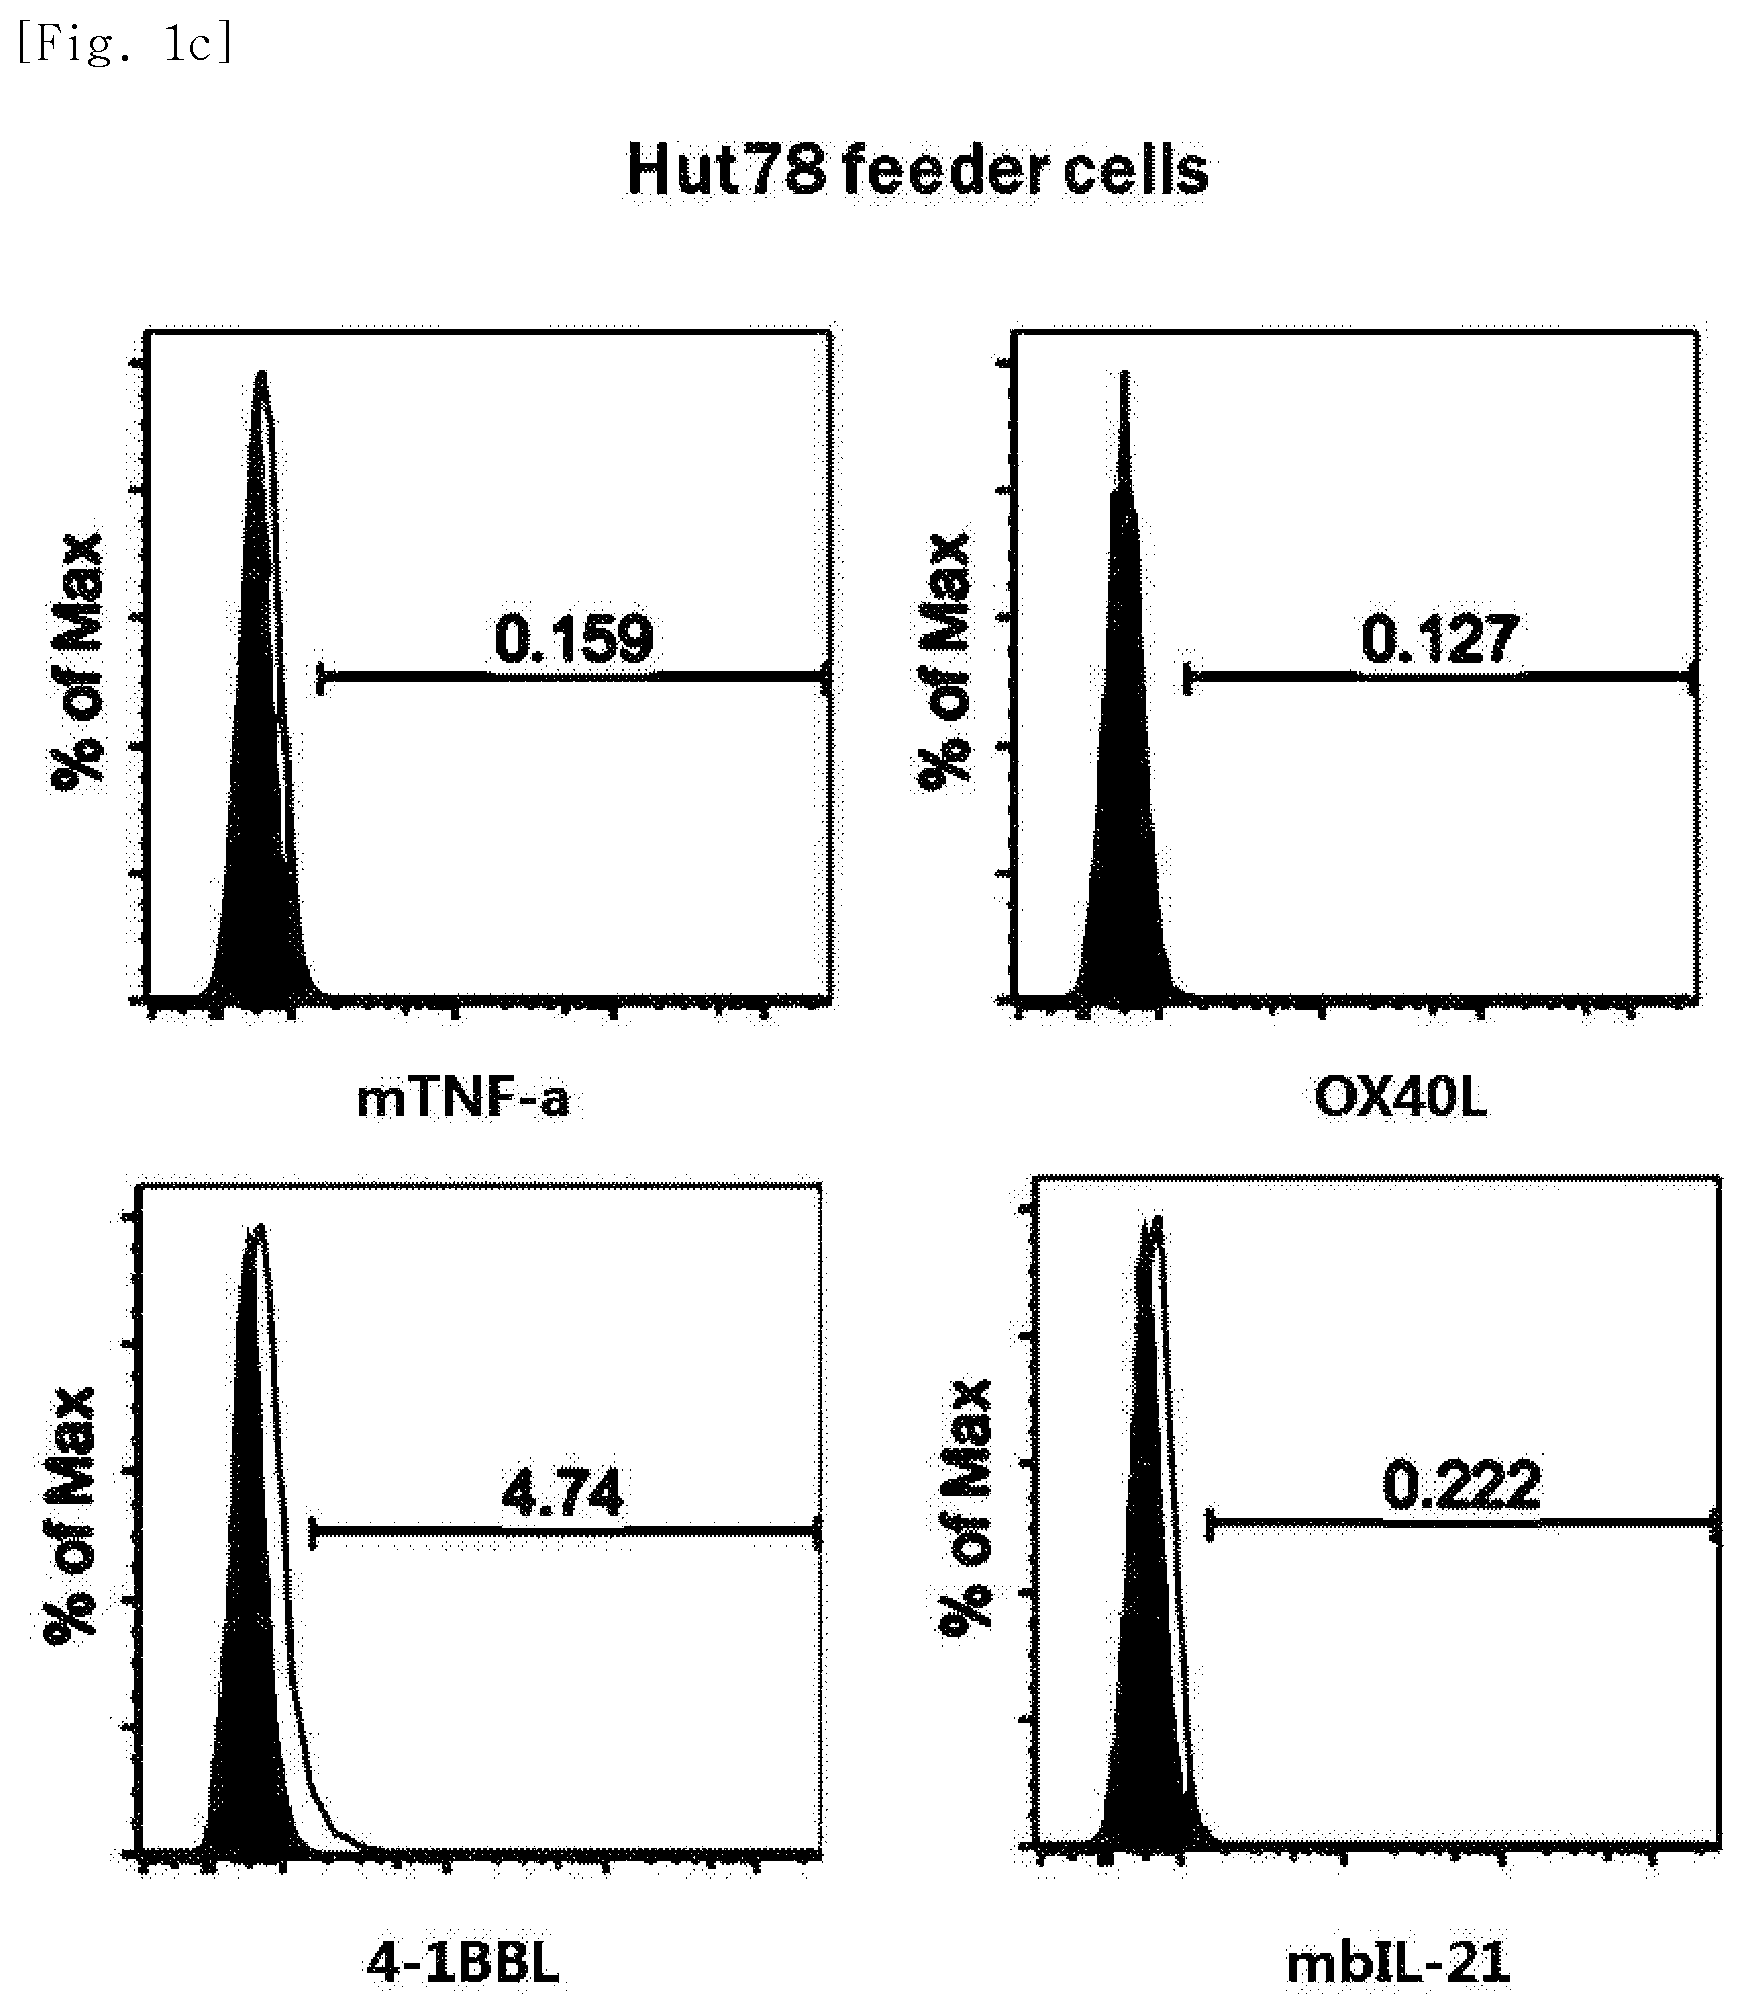
|
||||||||||
|---|---|---|---|---|---|---|---|---|---|---|---|
| Assignee: | GREEN CROSS LAB CELL
CORPORATION Yongin-si, Gyeonggi-do KR |
||||||||||
| Family ID: | 64396946 | ||||||||||
| Appl. No.: | 16/613601 | ||||||||||
| Filed: | May 25, 2018 | ||||||||||
| PCT Filed: | May 25, 2018 | ||||||||||
| PCT NO: | PCT/KR2018/005983 | ||||||||||
| 371 Date: | November 14, 2019 |
| Current U.S. Class: | 1/1 |
| Current CPC Class: | C12N 5/0638 20130101; C12N 2502/1157 20130101; C12N 5/0646 20130101; C12N 2510/00 20130101; C12N 2501/25 20130101; A61K 35/17 20130101 |
| International Class: | A61K 35/17 20060101 A61K035/17; C12N 5/0783 20060101 C12N005/0783 |
Foreign Application Data
| Date | Code | Application Number |
|---|---|---|
| May 26, 2017 | KR | 10-2017-0065180 |
Claims
1. An engineered CD4+ T cell population wherein cells of the population express one or more genes selected from the group consisting of 4-1BBL gene, mbIL-21 gene, OX40L gene, and mTNF-.alpha. gene.
2. The population of cells of claim 1, wherein the 4-1BBL gene has a nucleotide sequence encoding the amino acid sequence represented by SEQ ID NO: 1.
3. The population of cells of claim 2, wherein the nucleotide sequence encoding the amino acid sequence represented by SEQ ID NO: 1 is the nucleotide sequence represented by SEQ ID NO: 2.
4. The population of cells of claim 1, wherein the mbIL-21 gene has a nucleotide sequence encoding the amino acid sequence represented by SEQ ID NO: 3.
5. The population of cells of claim 4, wherein the nucleotide sequence encoding the amino acid sequence represented by SEQ ID NO: 3 is the nucleotide sequence represented by SEQ ID NO: 4.
6. The population of cells of claim 1, wherein the OX40L gene has a nucleotide sequence encoding the amino acid sequence represented by SEQ ID NO: 5.
7. The population of cells of claim 6, wherein the nucleotide sequence encoding the amino acid sequence represented by SEQ ID NO: 5 is the nucleotide sequence represented by SEQ ID NO: 6.
8. The population of cells of claim 1, wherein the mTNF-.alpha. gene has a nucleotide sequence encoding the amino acid sequence represented by SEQ ID NO: 8.
9. The population of cells of claim 8, wherein the nucleotide sequence encoding the amino acid sequence represented by SEQ ID NO: 8 is the nucleotide sequence represented by SEQ ID NO: 9.
10. The population of cells of claim 1, wherein the one or more genes are introduced to the cells via a recombinant lentivirus.
11. The population of cells of claim 1, wherein the cells express the 4-1BBL gene or the mbIL-21 gene.
12. The population of cells of claim 11, wherein the cells express the 4-1BBL gene and the mbIL-21 gene.
13. The population of cells of claim 1, wherein the cells express the 4-1BBL gene, the mbIL-21 gene, and the mTNF-.alpha. gene.
14. The population of cells of claim 1, wherein the cells express the 4-1BBL gene, the mbIL-21 gene, the OX40L gene, and the mTNF-.alpha. gene.
15. The population of cells of claim 1, wherein the CD4+ T cells are any one selected from the group consisting of Hut78, H9, Jurkat, Loucy, Molt-3, Molt-13, PEER, RPMI8402, and TALL-01 cells.
16. A method for producing a population of natural killer cells, comprising: co-culturing the engineered CD4+ T cell population of claim 1 and seed cells.
17. The method of claim 16, wherein the seed cells are any one selected from the group consisting of peripheral blood, peripheral blood mononuclear cells, peripheral blood leukocytes, enriched natural killer cells, and isolated natural killer cells.
18. The method of claim 16, wherein the seed cells are a population of cells from which CD3(+) cells have been removed.
19. The method of claim 16, wherein the engineered CD4+ T cell population and the seed cells are mixed at a ratio of 0.1:1 to 50:1.
20. The method of claim 16, wherein the seed cells are supplied once with feeder cells and the culture is performed for 5 days to 60 days; or the seed cells are supplied two or more times with feeder cells and the culture is performed for 60 days or longer.
21. The method of claim 16, wherein the co-culturing is performed in a medium containing an anti-CD3 antibody and an interleukin protein.
22. The method of claim 21, wherein the anti-CD3 antibody includes any one selected from the group consisting of OKT3, UCHT1, and HIT3a.
23. The method of claim 21, wherein the interleukin protein includes any one selected from the group consisting of IL-2, IL-12, IL-15, IL-18, and IL-21.
24. A composition comprising the engineered CD4+ T cell population of claim 1.
25. A population of natural killer cells prepared by the method of claim 16.
Description
TECHNICAL FIELD
[0001] The present invention relates to a culture method for natural killer cells using transformed T cells.
BACKGROUND ART
[0002] As a therapeutic method for the treatment of cancer patients and the prevention of recurrence of cancer, immunotherapy using the patient's immune function has been developed. In particular, immunotherapy using natural killer cells that can be mass-produced and frozen has been studied. Natural killer cells are lymphoid cells that account for about 15% of peripheral blood lymphocytes, and play an important role in the innate immune response.
[0003] Specifically, natural killer cells activate dendritic cells and induce cytotoxic T lymphocytes (CTLs) to specifically respond to tumors, thereby eliminating tumor cells. Natural killer cells directly kill malignant tumors such as sarcoma, myeloma, carcinoma, lymphoma, and leukemia. However, most natural killer cells present in the bodies of normal subjects exist in an inactive state, and activated natural killer cells are required to eliminate tumors. In addition, in a case of natural killer cells present in the bodies of cancer patients, the natural killer cells have functional defects due to the immune evasion mechanism of cancer cells.
[0004] Therefore, in order to use natural killer cells as a therapeutic agent, it is very important to activate the natural killer cells. In addition, since the number of natural killer cells present in the body is limited, it is essential to develop a technique for massively proliferating and freezing natural killer cells in the blood from normal subjects or patients.
[0005] As a method for massively proliferating natural killer cells, an ex vivo expansion culture method is used. For ex vivo expansion culture of natural killer cells, Peripheral blood mononuclear cells (PBMCs), CD3- cells, CD3-CD56+ cells, CD56+ cells, and the like are used as seed cells, and cytokines such as IL-2, IL-12, IL-15, and IL-21, LPS (Goodier et al., J. Immunol. 165(1):139-147, 2000), OKT-3 antibodies that stimulate CD3 (Condiotti et al., Experimental Hematol. 29(1):104-113, 2001) are used as proliferation factors for natural killer cells. Using the above-mentioned proliferation factors only, it is possible to proliferate natural killer cells about 3 to 10 times. However, with the above proliferation rate, it is difficult to commercialize natural killer cells into a therapeutic agent.
[0006] Recently, methods for proliferating natural killer cells using various types of feeder cells have been studied. Representative cell lines used as feeder cells include PBMC, EBV-LCL, and K562 cell line. K562 cell line is a blood cancer-derived cell line that lacks HLA and is a representative target cell line that natural killer cells can easily attack. The culture method using K562-based feeder cells for NK cells are as follows; a method in which cultures NK cells using 4-1BBL and membrane-bound IL-15 expressed K562 cell line, (Fujisaki et al., Cancer Res. 69(9):4010-4017, 2009), a method in which cultures NK cells using MICA, 4-1BBL, and IL-15 expressed K562 cell line (Gong et al., Tissue Antigens, 76(6):467-475, 2010), and a method in which cultures NK cells using 4-1BBL and membrane-bound IL-21 expressed K562 cell (Cecele J D et al, PloSONE, 7(1):e30264, 2012)
DISCLOSURE OF INVENTION
Technical Problem
[0007] Accordingly, in order to activate and proliferate natural killer cells, the present inventors have developed a method for effectively proliferating natural killer cells ex vivo, comprising expressing co-stimulatory molecules and growth factors, which can enhance proliferation of the natural killer cells, in CD4+ T cells.
[0008] Specifically, in order to increase efficiency of a culturing method for natural killer cells using the CD4(+) T cells as feeder cells, the present inventors have established transformed or genetically modified CD4(+) T cells. The present inventors have identified that in a case where the genetically modified CD4(+) T cells are co-cultured with peripheral blood mononuclear cells, such co-culture increases proliferation and abnormal cell-killing activity of natural killer cells, and thus have completed the present invention. Therefore, there is provided a culture method for proliferating natural killer cells in an efficient and stable manner using the genetically modified CD4(+) T cells.
Solution to Problem
[0009] In an aspect of the present invention, there is provided a genetically modified or transformed CD4+ T cell that expresses at least one gene selected from the group consisting of 4-1BBL gene, mbIL-21 gene, OX40L gene, and mTNF-.alpha. gene.
[0010] In addition, in another aspect of the present invention, there is provided a culture method for natural killer cells, comprising a step of co-culturing the genetically modified CD4+ T cells and seed cells.
[0011] Furthermore, in yet another aspect of the present invention, there is provided a composition for culturing natural killer cells, comprising the genetically modified CD4+ T cell as an active ingredient.
[0012] In addition, in still yet another aspect of the present invention, there is provided a natural killer cell produced by the culture method.
Advantageous Effects of Invention
[0013] The culture method for natural killer cells using the genetically modified T cell of the present invention allows natural killer cells to be effectively proliferated and produced from a small number of seed cells. In addition, the culture method also improves abnormal cell-killing activity of natural killer cells. Therefore, the culture method for natural killer cells using the genetically modified T cell of the present invention can be usefully used for commercialization into a cell therapeutic agent. Furthermore, a natural killer cell produced by the culture method of the present invention can be usefully used as a cell therapeutic agent.
BRIEF DESCRIPTION OF DRAWINGS
[0014] FIG. 1a shows expression of single genes transduced into Hut78 cell line based on FACS.
[0015] FIG. 1b shows expression of double genes transduced into Hut78 cell line based on FACS.
[0016] FIG. 1c shows gene expression in Hut78 cell line based on FACS.
[0017] FIG. 1d shows expression of single genes transduced into Hut78 cell line based on FACS.
[0018] FIG. 1e shows expression of mTNF-.alpha./OX40L and mTNF.alpha./4-1BBL double genes transduced into Hut78 cell line based on FACS.
[0019] FIG. 1f shows expression of mbIL-21/OX40L and mbIL-21/4-1BBL double genes transduced into Hut78 cell line based on FACS.
[0020] FIG. 1g shows expression of triple genes transduced into Hut78 cell line based on FACS.
[0021] FIG. 1h shows expression of quadruple genes transduced into Hut78 cell line based on FACS.
[0022] FIG. 2a shows expression of single genes transduced into H9 cell line based on FACS.
[0023] FIG. 2b shows expression of double genes transduced into H9 cell line based on FACS.
[0024] FIG. 3a shows expression of single genes transduced into Jurkat T cell line based on FACS.
[0025] FIG. 3b shows expression of double genes transduced into Jurkat T cell line based on FACS.
[0026] FIG. 4a shows fold increase, for each transduced gene, of natural killer cells produced by co-culturing Hut78 T cells having undergone single gene or double gene transduction, and peripheral blood mononuclear cells.
[0027] FIG. 4b shows fold increase, for each transduced gene, of natural killer cells produced by co-culturing H9 T cells having undergone single gene or double gene transduction, and peripheral blood mononuclear cells.
[0028] FIG. 4c shows fold increase, for each transduced gene, of natural killer cells produced by co-culturing Jurkat T cells having undergone single gene or double gene transduction, and peripheral blood mononuclear cells.
[0029] FIG. 4d shows fold increase, for each transduced gene, of natural killer cells produced by co-culturing Hut78 T cell line having undergone single gene to quadruple gene transduction, and peripheral blood mononuclear cells.
[0030] FIG. 5a shows fold increase of natural killer cells (D7R) produced by co-culturing Hut78 T cell line having undergone triple gene transduction, and peripheral blood mononuclear cells.
[0031] FIG. 5b shows fold increase, calculated as log values, of natural killer cells (D7R) produced by co-culturing Hut78 T cell line having undergone triple gene transduction, and peripheral blood mononuclear cells.
[0032] FIG. 5c shows fold increases of natural killer cells (D11R) produced by co-culturing Hut78 T cell line having undergone triple gene transduction, and peripheral blood mononuclear cells.
[0033] FIG. 5d shows fold increase, calculated as log values, of natural killer cells (D11R) produced by co-culturing Hut78 T cell line having undergone triple gene transduction, and peripheral blood mononuclear cells.
[0034] FIG. 6a shows viability, for each transduced gene, of natural killer cells produced by co-culturing Hut78 T cell line having undergone single gene or double gene transduction, and peripheral blood mononuclear cells.
[0035] FIG. 6b shows viability, for each transduced gene, of natural killer cells produced by co-culturing H9 T cell line having undergone single gene or double gene transduction, and peripheral blood mononuclear cells.
[0036] FIG. 6c shows viability, for each transduced gene, of natural killer cells produced by co-culturing Jurkat T cell line having undergone single gene or double gene transduction, and peripheral blood mononuclear cells.
[0037] FIG. 6d shows viability, for each transduced gene, of natural killer cells produced by co-culturing Hut78 T cell line having undergone single gene to quadruple gene transduction, and peripheral blood mononuclear cells.
[0038] FIG. 7a shows purity (CD3-CD56+), for each transduced gene, of natural killer cells produced by co-culturing Hut78 T cell line having undergone single gene or double gene transduction, and peripheral blood mononuclear cells.
[0039] FIG. 7b shows activation (CD16+CD56+), for each transduced gene, of natural killer cells produced by co-culturing Hut78 T cell line having undergone single gene or double gene transduction, and peripheral blood mononuclear cells.
[0040] FIG. 7c shows purity (CD3-CD56+), for each transduced gene, of natural killer cells produced by co-culturing H9 T cell line having undergone single gene or double gene transduction, and peripheral blood mononuclear cells.
[0041] FIG. 7d shows activation (CD16+CD56+), for each transduced gene, of natural killer cells produced by co-culturing H9 T cell line having undergone single gene or double gene transduction, and peripheral blood mononuclear cells.
[0042] FIG. 7e shows purity (CD3-CD56+), for each transduced gene, of natural killer cells produced by co-culturing Jurkat T cell line having undergone single gene or double gene transduction, and peripheral blood mononuclear cells.
[0043] FIG. 7f shows activation (CD16+CD56+), for each transduced gene, of natural killer cells produced by co-culturing Jurkat cell line having undergone single gene or double gene transduction, and peripheral blood mononuclear cells.
[0044] FIG. 7g shows purity (CD3-CD56+), for each transduced gene, of natural killer cells produced by co-culturing Hut78 T cell line having undergone single gene to quadruple gene transduction, and peripheral blood mononuclear cells.
[0045] FIG. 7h shows activation (CD16+CD56+), for each transduced gene, of natural killer cells produced by co-culturing Hut78 T cell line having undergone single gene to quadruple gene transduction, and peripheral blood mononuclear cells.
[0046] FIG. 8a shows expression levels of the phenotypic marker CD16, for each transduced gene, in natural killer cells produced by co-culturing Hut78 T cell line having undergone single gene or double gene transduction, and peripheral blood mononuclear cells.
[0047] FIG. 8b shows expression levels of the phenotypic marker NKG2D, for each transduced gene, in natural killer cells produced by co-culturing Hut78 T cell line having undergone single gene or double gene transduction, and peripheral blood mononuclear cells.
[0048] FIG. 8c shows expression levels of the phenotypic marker NKp30, for each transduced gene, in natural killer cells produced by co-culturing Hut78 T cell line having undergone single gene or double gene transduction, and peripheral blood mononuclear cells.
[0049] FIG. 8d shows expression levels of the phenotypic marker NKp44, for each transduced gene, in natural killer cells produced by co-culturing Hut78 T cell line having undergone single gene or double gene transduction, and peripheral blood mononuclear cells.
[0050] FIG. 8e shows expression levels of the phenotypic marker NKp46, for each transduced gene, in natural killer cells produced by co-culturing Hut78 T cell line having undergone single gene or double gene transduction, and peripheral blood mononuclear cells.
[0051] FIG. 8f shows expression levels of the phenotypic marker DNAM-1, for each transduced gene, in natural killer cells produced by co-culturing Hut78 T cell line having undergone single gene or double gene transduction, and peripheral blood mononuclear cells.
[0052] FIG. 8g shows expression levels of the phenotypic marker CXCR3, for each transduced gene, in natural killer cells produced by co-culturing Hut78 T cell line having undergone single gene or double gene transduction, and peripheral blood mononuclear cells.
[0053] FIG. 9a shows expression levels of the phenotypic marker CD16, for each transduced gene, in natural killer cells produced by co-culturing H9 T cell line having undergone single gene or double gene transduction, and peripheral blood mononuclear cells.
[0054] FIG. 9b shows expression levels of the phenotypic marker NKG2D, for each transduced gene, in natural killer cells produced by co-culturing H9 T cell line having undergone single gene or double gene transduction, and peripheral blood mononuclear cells.
[0055] FIG. 9c shows expression levels of the phenotypic marker NKp30, for each transduced gene, in natural killer cells produced by co-culturing H9 T cell line having undergone single gene or double gene transduction, and peripheral blood mononuclear cells.
[0056] FIG. 9d shows expression levels of the phenotypic marker NKp44, for each transduced gene, in natural killer cells produced by co-culturing H9 T cell line having undergone single gene or double gene transduction, and peripheral blood mononuclear cells.
[0057] FIG. 9e shows expression levels of the phenotypic marker NKp46, for each transduced gene, in natural killer cells produced by co-culturing H9 T cell line having undergone single gene or double gene transduction, and peripheral blood mononuclear cells.
[0058] FIG. 9f shows expression levels of the phenotypic marker DNAM-1, for each transduced gene, in natural killer cells produced by co-culturing H9 T cell line having undergone single gene or double gene transduction, and peripheral blood mononuclear cells.
[0059] FIG. 9g shows expression levels of the phenotypic marker CXCR3, for each transduced gene, in natural killer cells produced by co-culturing H9 T cell line having undergone single gene or double gene transduction, and peripheral blood mononuclear cells.
[0060] FIG. 10a shows expression levels of the phenotypic marker CD16, for each transduced gene, in natural killer cells produced by co-culturing Jurkat T cell line having undergone single gene or double gene transduction, and peripheral blood mononuclear cells.
[0061] FIG. 10b shows expression levels of the phenotypic marker NKG2D, for each transduced gene, in natural killer cells produced by co-culturing Jurkat T cell line having undergone single gene or double gene transduction, and peripheral blood mononuclear cells.
[0062] FIG. 10c shows expression levels of the phenotypic marker NKp30, for each transduced gene, in natural killer cells produced by co-culturing Jurkat T cell line having undergone single gene or double gene transduction, and peripheral blood mononuclear cells.
[0063] FIG. 10d shows expression levels of the phenotypic marker NKp44, for each transduced gene, in natural killer cells produced by co-culturing Jurkat T cell line having undergone single gene or double gene transduction, and peripheral blood mononuclear cells.
[0064] FIG. 10e shows expression levels of the phenotypic marker NKp46, for each transduced gene, in natural killer cells produced by co-culturing Jurkat T cell line having undergone single gene or double gene transduction, and peripheral blood mononuclear cells.
[0065] FIG. 10f shows expression levels of the phenotypic marker DNAM-1, for each transduced gene, in natural killer cells produced by co-culturing Jurkat T cell line having undergone single gene or double gene transduction, and peripheral blood mononuclear cells.
[0066] FIG. 10g shows expression levels of the phenotypic marker CXCR3, for each transduced gene, in natural killer cells produced by co-culturing Jurkat T cell line having undergone single gene or double gene transduction, and peripheral blood mononuclear cells.
[0067] FIG. 11a shows expression levels of the phenotypic marker CD16, for each transduced gene, in natural killer cells produced by co-culturing Hut78 T cell line having undergone single gene to quadruple gene transduction, and peripheral blood mononuclear cells.
[0068] FIG. 11b shows expression levels of the phenotypic marker NKG2A, for each transduced gene, in natural killer cells produced by co-culturing Hut78 T cell line having undergone single gene to quadruple gene transduction, and peripheral blood mononuclear cells.
[0069] FIG. 11c shows expression levels of the phenotypic marker NKG2C, for each transduced gene, in natural killer cells produced by co-culturing Hut78 T cell line having undergone single gene to quadruple gene transduction, and peripheral blood mononuclear cells.
[0070] FIG. 11d shows expression levels of the phenotypic marker NKG2D, for each transduced gene, in natural killer cells produced by co-culturing Hut78 T cell line having undergone single gene to quadruple gene transduction, and peripheral blood mononuclear cells.
[0071] FIG. 11e shows expression levels of the phenotypic marker NKp30, for each transduced gene, in natural killer cells produced by co-culturing Hut78 T cell line having undergone single gene to quadruple gene transduction, and peripheral blood mononuclear cells.
[0072] FIG. 11f shows expression levels of the phenotypic marker NKp44, for each transduced gene, in natural killer cells produced by co-culturing Hut78 T cell line having undergone single gene to quadruple gene transduction, and peripheral blood mononuclear cells.
[0073] FIG. 11g shows expression levels of the phenotypic marker NKp46, for each transduced gene, in natural killer cells produced by co-culturing Hut78 T cell line having undergone single gene to quadruple gene transduction, and peripheral blood mononuclear cells.
[0074] FIG. 11h shows expression levels of the phenotypic marker DNAM-1, for each transduced gene, in natural killer cells produced by co-culturing Hut78 T cell line having undergone single gene to quadruple gene transduction, and peripheral blood mononuclear cells.
[0075] FIG. 11i shows expression levels of the phenotypic marker CXCR3, for each transduced gene, in natural killer cells produced by co-culturing Hut78 T cell line having undergone single gene to quadruple gene transduction, and peripheral blood mononuclear cells.
[0076] FIG. 11j shows expression levels of the phenotypic marker CD62L, for each transduced gene, in natural killer cells produced by co-culturing Hut78 T cell line having undergone single gene to quadruple gene transduction, and peripheral blood mononuclear cells.
[0077] FIG. 11k shows expression levels of the phenotypic marker CD57, for each transduced gene, in natural killer cells produced by co-culturing Hut78 T cell line having undergone single gene to quadruple gene transduction, and peripheral blood mononuclear cells.
[0078] FIG. 11l shows expression levels of the phenotypic marker CD69, for each transduced gene, in natural killer cells produced by co-culturing Hut78 T cell line having undergone single gene to quadruple gene transduction, and peripheral blood mononuclear cells.
[0079] FIG. 12a shows expression levels of the phenotypic markers CD16, NKG2A, NKG2C, and NKG2D in natural killer cells produced by co-culturing Hut78 T cell line having undergone triple gene transduction, and peripheral blood mononuclear cells.
[0080] FIG. 12b shows expression levels of the phenotypic markers NKp30, NKp44, NKp46, and DNAM-1 in natural killer cells produced by co-culturing Hut78 T cell line having undergone triple gene transduction, and peripheral blood mononuclear cells.
[0081] FIG. 12c shows expression levels of the phenotypic markers CD62L, CD69, CXCR3, and CD57 in natural killer cells produced by co-culturing Hut78 T cell line having undergone triple gene transduction, and peripheral blood mononuclear cells.
[0082] FIG. 13a shows tumor cell-killing activity, for each transduced gene, of natural killer cells produced by co-culturing Hut78 T cell line having undergone single gene or double gene transduction, and peripheral blood mononuclear cells.
[0083] FIG. 13b shows tumor cell-killing activity, for each transduced gene, of natural killer cells produced by co-culturing H9 T cell line having undergone single gene or double gene transduction, and peripheral blood mononuclear cells.
[0084] FIG. 13c shows tumor cell-killing activity, for each transduced gene, of natural killer cells produced by co-culturing Jurkat T cell line having undergone single gene or double gene transduction, and peripheral blood mononuclear cells.
[0085] FIG. 14a shows tumor cell-killing activity (E:T=10:1), for each transduced gene, of natural killer cells produced by co-culturing Hut78 T cell line having undergone single gene to quadruple gene transduction, and peripheral blood mononuclear cells.
[0086] FIG. 14b shows tumor cell-killing activity (E:T=3:1), for each transduced gene, of natural killer cells produced by co-culturing Hut78 T cell line having undergone single gene to quadruple gene transduction, and peripheral blood mononuclear cells.
[0087] FIG. 14c shows tumor cell-killing activity (E:T=1:1), for each transduced gene, of natural killer cells produced by co-culturing Hut78 T cell line having undergone single gene to quadruple gene transduction, and peripheral blood mononuclear cells.
[0088] FIG. 14d shows tumor cell-killing activity (E:T=0.3:1), for each transduced gene, of natural killer cells produced by co-culturing Hut78 T cell line having undergone single gene to quadruple gene transduction, and peripheral blood mononuclear cells.
[0089] FIG. 15a shows tumor cell-killing activity, for respective cell ratios, of natural killer cells (NoS1) produced by co-culturing Hut78 T cell line having undergone triple gene transduction, and peripheral blood mononuclear cells.
[0090] FIG. 15b shows tumor cell-killing activity, for respective cell ratios, of natural killer cells (D7RS5) produced by co-culturing Hut78 T cell line having undergone triple gene transduction, and peripheral blood mononuclear cells.
[0091] FIG. 15c shows tumor cell-killing activity, for respective cell ratios, of natural killer cells (D11RS4) produced by co-culturing Hut78 T cell line having undergone triple gene transduction, and peripheral blood mononuclear cells.
[0092] FIG. 16a shows, expression levels of the proliferation marker Ki-67, for each transduced gene, in natural killer cells produced by co-culturing Hut78 T cell line having undergone single gene to quadruple gene transduction, and peripheral blood mononuclear cells.
[0093] FIG. 16b shows expression levels of the proliferation marker Ki-67 on day 16, for each transduced gene, in natural killer cells produced by co-culturing Hut78 T cell line having undergone single gene to quadruple gene transduction, and peripheral blood mononuclear cells.
[0094] FIG. 16c shows expression levels of the proliferation marker Ki-67 for each transduced gene, in terms of mean fluorescence index (MFI) ratio values, in natural killer cells produced by co-culturing Hut78 T cell line having undergone single gene to quadruple gene transduction, and peripheral blood mononuclear cells.
[0095] FIG. 16d shows expression levels of the proliferation marker Ki-67 for each transduced gene, in terms of mean fluorescence index ratio values, in natural killer cells produced by co-culturing Hut78 T cell line having undergone single gene to quadruple gene transduction, and peripheral blood mononuclear cells.
[0096] FIG. 17a shows expression levels of the proliferation marker Ki-67 in natural killer cells (D7R) produced by performing re-stimulation at 7-day intervals when co-culturing Hut78 T cell line having undergone triple gene transduction, and peripheral blood mononuclear cells.
[0097] FIG. 17b shows expression levels of the proliferation marker Ki-67 in natural killer cells (D11R) produced by performing re-stimulation at 11-day intervals when co-culturing Hut78 T cell line having undergone triple gene transduction, and peripheral blood mononuclear cells.
[0098] FIG. 17c shows expression levels of the proliferation marker Ki-67, in terms of mean fluorescence index ratio values, in natural killer cells (D7R) produced by performing re-stimulation at 7-day intervals when co-culturing Hut78 T cell line having undergone triple gene transduction, and peripheral blood mononuclear cells.
[0099] FIG. 17d shows expression levels of the proliferation marker Ki-67, in terms of mean fluorescence index ratio values, in natural killer cells (D11R) produced by performing re-stimulation at 11-day intervals when co-culturing Hut78 T cell line having undergone triple gene transduction, and peripheral blood mononuclear cells.
[0100] FIG. 18a shows expression levels of the co-stimulatory molecule CD25, for each transduced gene, in natural killer cells produced by co-culturing Hut78 T cell line having undergone single gene to quadruple gene transduction, and peripheral blood mononuclear cells.
[0101] FIG. 18b shows expression levels of the co-stimulatory molecule CD25 on day 11, for each transduced gene, in natural killer cells produced by co-culturing Hut78 T cell line having undergone single gene to quadruple gene transduction, and peripheral blood mononuclear cells.
[0102] FIG. 18c shows expression levels of the co-stimulatory molecule TNFRII, for each transduced gene, in natural killer cells produced by co-culturing Hut78 T cell line having undergone single gene to quadruple gene transduction, and peripheral blood mononuclear cells.
[0103] FIG. 18d shows expression levels of the co-stimulatory molecule TNFRII on day 16, for each transduced gene, in natural killer cells produced by co-culturing Hut78 T cell line having undergone single gene to quadruple gene transduction, and peripheral blood mononuclear cells.
[0104] FIG. 18e shows expression levels of the co-stimulatory molecule 41BB, for each transduced gene, in natural killer cells produced by co-culturing Hut78 T cell line having undergone single gene to quadruple gene transduction, and peripheral blood mononuclear cells.
[0105] FIG. 18f shows expression levels of the co-stimulatory molecule 41BB on day 7, for each transduced gene, in natural killer cells produced by co-culturing Hut78 T cell line having undergone single gene to quadruple gene transduction, and peripheral blood mononuclear cells.
[0106] FIG. 19a shows expression levels of the co-stimulatory molecule CD25 in natural killer cells (D7R) produced by performing re-stimulation at 7-day intervals when co-culturing Hut78 T cell line having undergone triple gene transduction, and peripheral blood mononuclear cells.
[0107] FIG. 19b shows expression levels of the co-stimulatory molecule TNFRII in natural killer cells (D7R) produced by performing re-stimulation at 7-day intervals when co-culturing Hut78 T cell line having undergone triple gene transduction, and peripheral blood mononuclear cells.
[0108] FIG. 19c shows expression levels of the co-stimulatory molecule 41BB in natural killer cells (D7R) produced by performing re-stimulation at 7-day intervals when co-culturing Hut78 T cell line having undergone triple gene transduction, and peripheral blood mononuclear cells.
[0109] FIG. 19d shows expression levels of the co-stimulatory molecule CD25 in natural killer cells (D11R) produced by performing re-stimulation at 11-day intervals when co-culturing Hut78 T cell line having undergone triple gene transduction, and peripheral blood mononuclear cells.
[0110] FIG. 19e shows expression levels of the co-stimulatory molecule TNFRII in natural killer cells (D11R) produced by performing re-stimulation at 11-day intervals when co-culturing Hut78 T cell line having undergone triple gene transduction, and peripheral blood mononuclear cells.
[0111] FIG. 19f shows expression levels of the co-stimulatory molecule 41BB in natural killer cells (D11R) produced by performing re-stimulation at 11-day intervals when co-culturing Hut78 T cell line having undergone triple gene transduction, and peripheral blood mononuclear cells.
[0112] FIG. 20a shows expression levels of CD107a, for each transduced gene, in natural killer cells produced by co-culturing Hut78 T cell line having undergone single gene to quadruple gene transduction, and peripheral blood mononuclear cells.
[0113] FIG. 20b shows expression levels of IFN-.gamma., for each transduced gene, in natural killer cells produced by co-culturing Hut78 T cell line having undergone single gene to quadruple gene transduction, and peripheral blood mononuclear cells.
[0114] FIG. 20c shows expression levels of TNF-.alpha., for each transduced gene, in natural killer cells produced by co-culturing Hut78 T cell line having undergone single gene to quadruple gene transduction, and peripheral blood mononuclear cells.
[0115] FIG. 21a shows expression levels of CD107a, IFN-.gamma., and TNF-.alpha. in natural killer cells (NoS1) produced by co-culturing Hut78 T cell line having undergone triple gene transduction, and peripheral blood mononuclear cells.
[0116] FIG. 21b shows expression levels of CD107a, IFN-.gamma., and TNF-.alpha. in natural killer cells (D7RS5) produced by co-culturing Hut78 T cell line having undergone triple gene transduction, and peripheral blood mononuclear cells.
[0117] FIG. 21c shows expression levels of CD107a, IFN-.gamma., and TNF-.alpha. in natural killer cells (D11RS4) produced by co-culturing Hut78 T cell line having undergone triple gene transduction, and peripheral blood mononuclear cells.
BEST MODE FOR CARRYING OUT THE INVENTION
[0118] Hereinafter, the present invention will be described in detail.
[0119] In an aspect of the present invention, there is provided a transformed CD4+ T cell that expresses at least one gene selected from the group consisting of 4-1BBL gene, mbIL-21 gene, OX40L gene, and mTNF-.alpha. gene.
[0120] Specifically, when one gene is transduced, the gene may be 4-1BBL, mbIL-21, OX40L, or mTNF-.alpha.. In addition, when two genes are transduced, a combination of the genes may be mbIL-21/4-1BBL, 4-1BBL/OX40L, mTNF.alpha./4-1BBL, mbIL-21/OX40L, mbIL-21/mTNF-.alpha., or mTNF-.alpha./OX40L. In an embodiment of the present invention, combinations of genes, mbIL-21/4-1BBL, mTNF-.alpha./OX40L, mTNF-.alpha./4-1BBL, and mbIL-21/OX40L were transduced into T cells.
[0121] In addition, when three genes are transduced, a combination of the genes may be 4-1BBL/mbIL-21/OX40L, mbIL-21/OX40L/mTNF-.alpha., mTNF-.alpha./mbIL-21/4-1BBL, or 4-1BBL/OX40L/mTNF-.alpha.. In an embodiment of the present invention, a combination of genes, mTNF-.alpha./mbIL-21/4-1BBL was transduced into T cells.
[0122] In addition, when four genes are transduced, a combination of the genes may be mTNF-.alpha./mbIL-21/OX40L/4-1BBL. In an embodiment of the present invention, a combination of genes, mTNF-.alpha./mbIL-21/OX40L/4-1BBL was transduced into T cells.
[0123] The term "4-1BBL" as used herein refers to one of TNF superfamily (TNFSF) called CD137L, and means a ligand that forms a trimer and binds to 4-1BB as a receptor. The 4-1BBL gene may be derived from human.
[0124] Specifically, the 4-1BBL gene may be NCBI Reference Sequence: NM_003811, but is not limited thereto. The 4-1BBL gene may have a nucleotide sequence encoding the amino acid sequence represented by SEQ ID NO: 1. The nucleotide sequence encoding the amino acid sequence represented by SEQ ID NO: 1 may be the nucleotide sequence represented by SEQ ID NO: 2.
[0125] The term "mbIL-21" as used herein may be IL-21 designed to be bound to a cell membrane. Here, mbIL-21 may be a fusion protein formed by binding between IL-21 and a transmembrane protein. The transmembrane protein may be CD8.alpha.. Specifically, the transmembrane protein may be a transmembrane domain of CD8.alpha..
[0126] Specifically, the IL-21 gene may be NCBI Reference Sequence: NM_021803.3, but is not limited thereto. In addition, the CD8.alpha. gene may be NCBI Reference Sequence: NM_001768, but is not limited thereto. The mbIL-21 is expressed in the form of IL-21 bound to a cell membrane. In addition, the mbIL-21 gene may have a nucleotide sequence encoding the amino acid sequence represented by SEQ ID NO: 3. The nucleotide sequence encoding the amino acid sequence represented by SEQ ID NO: 3 may be the nucleotide sequence represented by SEQ ID NO: 4.
[0127] The term "OX40L" as used herein is also referred to as ACT-4 receptor, TNF4-human, GP34, or CD134L, and means a ligand that binds to OX40. Specifically, the OX40L gene may be NCBI Reference Sequence: NM_003326, but is not limited thereto. The OX40L gene may have a nucleotide sequence encoding the amino acid sequence represented by SEQ ID NO: 5. The nucleotide sequence encoding the amino acid sequence represented by SEQ ID NO: 5 may be the nucleotide sequence represented by SEQ ID NO: 6.
[0128] The term "mTNF-.alpha." as used herein means a gene obtained by causing a point mutation to occur on DNA of tumor necrosis factor-alpha so that alanine-valine, a site recognized by tumor necrosis factor-alpha-converting enzyme (TACE) in the amino acid sequence of tumor necrosis factor-alpha, is changed to proline-valine. Mutation of alanine to proline is randomly selected.
[0129] Specifically, the mTNF-.alpha. gene may have a nucleotide sequence encoding the amino acid sequence represented by SEQ ID NO: 8. The nucleotide sequence encoding the amino acid sequence represented by SEQ ID NO: 8 may be the nucleotide sequence represented by SEQ ID NO: 9.
[0130] The 4-1BBL gene, mbIL-21 gene, OX40L gene, or mTNF-.alpha. gene may be transduced through a recombinant lentivirus. However, transduction is not limited thereto.
[0131] As a method of transfecting the gene into cells, a biochemical method, a physical method, or a virus-mediated transfection method may be used. In addition, as the biochemical method, FuGene6 (Roche, USA), lipofectamine (Lipofectamine.TM. 2000, Invitrogen, USA), or ExGen 500 (MBI Fermentas International Inc., CANADA) may be used. In addition, a lipid-mediated method using lipofectamine may be used.
[0132] The term "vector" as used herein is an expression vector capable of expressing a gene of interest in a cell into which the vector is transduced, and refers to a gene construct containing an essential regulatory element operably linked so that a gene insert transduced into the vector is expressed.
[0133] In addition, as the expression vector containing the gene, any expression vector capable of expressing the gene in CD4+ T cell line may be used, and pCDH-CMV-MCS-EF1-Puro (SBI, CD510B-1) or pCDH-CMV-MCS-EF1-Neo (SBI, CD514B-1) lentiviral vector was used in a specific embodiment of the present invention.
[0134] The lentivirus means a virus which belongs to a retrovirus family and is characterized by a long latency period. The lentivirus can deliver genetic information into DNA of a host cell. Use of the lentivirus is one of the most effective methods of using gene delivery vectors that can replicate in non-dividing cells.
[0135] The CD4+ T cells may be ex vivo isolated CD4+ T cells, ex vivo expansion- cultured CD4+ T cells, or CD4+ T cell line (T lymphoma cell line). In addition, the CD4+ T cells may be auxiliary T cells, and may be a hybridoma obtained by fusing CD4+ T cells with cancer cells. Specifically, the CD4+ T cells may be any one selected from the group consisting of Hut78, H9, Jurkat, Loucy, Molt-3, Molt-13, PEER, RPMI8402, and TALL-01 cells. Hut78, H9, or Jurkat T cells may be preferred.
[0136] In another aspect of the present invention, there is provided a culture method for natural killer cells, comprising a step of co-culturing the transformed CD4+ T cells and seed cells.
[0137] The term "feeder cell" as used herein is also referred to as an auxiliary cell for culture, and means a cell which does not proliferate but has metabolic activity so that the cell produces various metabolites and thus helps proliferation of a target cell. The feeder cell may be a transformed CD4+ T cell that expresses at least one gene selected from the group consisting of 4-1BBL gene, mbIL-21 gene, OX40L gene, and mTNF-.alpha. gene.
[0138] T cells used as the feeder cells may be inactivated cells whose division/proliferation is inhibited or cells which have not been inactivated. Preferably, the T cells may be inactivated to ensure safety. As an inactivation method, a conventional method known in the art may be used. For example, a gamma ray-irradiation method may be used. In a case where T cells which have not been inactivated are used, most of them are tumor cells, and thus may be killed by activated natural killer cells during culture.
[0139] The term "seed cell" as used herein means a cell capable of proliferating to natural killer cells through appropriate culture. Specifically, the seed cells may be any one selected from the group consisting of peripheral blood, peripheral blood leukocytes, peripheral blood mononuclear cells (PBMCs), enriched natural killer cells, and isolated natural killer cells. The seed cells may preferably be, but are not limited to, CD3(-) cells from which CD3(+) cells have been eliminated.
[0140] In a culture method for natural killer cells, culture may be performed by mixing the feeder cells and the seed cells at a ratio of 0.1 or higher. Specifically, the feeder cells and the seed cells may be at a ratio of 0.1:1 to 50:1. More specifically, the ratio may be 0.5:1 to 40:1.
Even more specifically, the ratio may be 1:1 to 30:1. Most specifically, the ratio may be 2:1 to 20:1. In an embodiment, the feeder cells and the seed cells may be at a ratio of 5:1, but is not particularly limited thereto. The "ratio" means a ratio based on the number of cells.
[0141] In the culture method for natural killer cells, the seed cells may be mixed once with the feeder cells and culture may be performed for 5 days to 60 days, or may be mixed two or more times with the feeder cells and culture may be performed for 60 days or longer. Preferably, the seed cells may be mixed once with the feeder cells and culture was performed for 14 days to 21 days. However, the culture method is not limited thereto.
[0142] In the culture method for natural killer cells, natural killer cells and T lymphoma cell line are co-cultured in conventional animal cell culture medium such as AIM-V medium, RPMI1640, CellGro SCGM, X-VIVO20, IMDM, and DMEM. In co-culture, culture may be performed with addition of an antibody that has low affinity for T cells and stimulates T cells, and an interleukin. However, the culture method is not limited thereto.
[0143] The term "antibody which has low affinity for T cells and stimulates T cells" as used herein means a protein that specifically responds to CD3 antigens, a group of molecules each of which associates with T cell receptor (TCR) to form an antigen recognition complex. As compared with TCR, the CD3 molecule has a longer intracellular region and plays a role in delivering an antigen recognition signal into a cell.
[0144] The antibody that has low affinity for T cells and stimulates T cells, which can be used in the present invention, may preferably be an anti-CD3 antibody. Specifically, the anti-CD3 antibody may be OKT-3, UCHT1, or HIT3a.
[0145] The term "interleukin (IL)" as used herein refers to a group belonging to cytokines, and means a proteinaceous biologically-active substance produced by immunocompetent cells such as lymphocytes, monocytes, and macrophages. The interleukin may be IL-2, IL-15, IL-12, IL-18, or IL-21.
[0146] In an embodiment of the present invention, culture was performed with addition of OKT-3 antibody and IL-2. A concentration of the OKT-3 antibody to be added may be 0.1 ng/ml to 100 ng/ml. Preferably, the concentration of the OKT-3 antibody may be 10 ng/.mu.l. A concentration of IL-2 may be 10 U/ml to 2,000 U/ml. Preferably, the concentration of IL-2 may be 500 U/ml. In addition, serum or plasma and an additional growth factor that supports growth of lymphocytes may be added and culture may be performed. The type of serum or plasma to be added to the medium is not particularly limited, and a variety of commercially available animal-derived serum or plasma may be used. Preferably, human-derived serum or plasma, in particular, self-derived serum or plasma may be used.
[0147] The term "culture" as used herein means a method of growing cells under an environmental condition that is appropriately artificially regulated. The method of culturing the genetically modified CD4+ T cells may be carried out using methods well known in the art. Specifically, the culture may be performed in a batch or fed-batch process, or may be continuously performed in a repeated fed-batch process.
[0148] In addition, precursors suitable for the culture medium may be used. The above-mentioned raw materials may be added to a culture, during a culture process, in a batch, fed-batch, or continuous manner by an appropriate method. However, the present invention is not particularly limited thereto. A pH of the culture can be regulated by using, in an appropriate manner, basic compounds such as sodium hydroxide, potassium hydroxide, and ammonia, or acidic compounds such as phosphoric acid or sulfuric acid.
[0149] The culture method using the T cells as feeder cells allows natural killer cells to be selectively cultured from seed cells such as PBMCs, and enables a stable culture due to the fact that there is no difference in proliferation of natural killer cells as compared with a case where PBMC feeder cells are used depending on donors.
[0150] Therefore, a large amount of natural killer cell therapeutic agents can be efficiently and stably obtained.
[0151] In addition, in yet another aspect of the present invention, there is provided a composition for culturing natural killer cells, comprising the genetically modified CD4+ T cell as an active ingredient.
[0152] Furthermore, in still yet another aspect of the present invention, there is provided a natural killer cell produced by the culture method for natural killer cells.
[0153] The natural killer cells cultured according to the culture method for natural killer cells can be frozen and do not exhibit impaired cell function even in a case of being thawed again. In addition, due to high expression of an activating receptor such as NKp46, the natural killer cells exhibit increased killing activity against a tumor cell line and increased cytokine secretion, and thus an excellent anticancer effect can be expected. Therefore, it is possible to prepare a cell therapeutic agent effective for tumor treatment, using a large number of activated natural killer cells which can be clinically applied.
[0154] In addition, in a composition for the prevention or treatment of an infectious disease, comprising, as an active ingredient, the natural killer cell produced by the culture method for natural killer cells, the natural killer cell may be contained in an amount of 10% to 95% by weight with respect to the total weight of the composition. In addition, the composition for the prevention or treatment of an infectious disease of the present invention may further comprise, in addition to the active ingredient, one or more active ingredients that exhibit the same or similar functions.
[0155] The composition for the prevention or treatment of an infectious disease may be formulated into a pharmaceutical composition for administration by further including one or more pharmaceutically acceptable carriers in addition to the above-mentioned active ingredients.
[0156] A dose of the pharmaceutical composition for the prevention or treatment of an infectious disease may be regulated depending on various factors including type of disease, severity of disease, types and amounts of active ingredients and other ingredients included in the composition, type of formulation and the patient's age, weight, general health condition, sex, and diet, time of administration, route of administration and secretion rate of composition, duration of treatment, and simultaneously used drugs. However, for desired effects, a dose of the natural killer cells according to the present invention may be 0.01.times.10.sup.7 cells/kg to 1.0.times.10.sup.9 cells/kg, and may be 0.5.times.10.sup.7 cells/kg to 1.0.times.10.sup.8 cells/kg. Here, the dose may be administered once a day or may be divided into several times a day.
[0157] In addition, the pharmaceutical composition for the prevention or treatment of an infectious disease may be administered to an individual by various methods known in the art. The route of administration may be appropriately selected by those skilled in the art in consideration of administration method, body fluid volume, viscosity, and the like.
MODE FOR THE INVENTION
[0158] Hereinafter, the present invention will be described in detail by way of examples. However, the following examples are only for illustrating the present invention, and the present invention is not limited to the following examples.
EXAMPLE 1
Construction of Recombinant Lentivirus
EXAMPLE 1.1
Construction of Recombinant Lentiviral Vector
[0159] As a lentiviral vector, pCDH-CMV-MCS-EF1-Puro (SBI, CD510B-1) or pCDH-CMV-MCS-EF1-Neo (SBI, CD514B-1) was used. As genes for transduction, 4-1BBL (TNF superfamily member 9, TNFSF9), mbIL-21 (membrane-bound IL-21), OX40L (TNF superfamily member 4 (TNFSF4) transcript variant 1) and mTNF-.alpha. (membrane-bound TNF alpha) genes were used.
[0160] Specifically, for the 4-1BBL gene (SEQ ID NO: 2), 4-1BBL gene expression vector (OriGene, RC211160) was used. For the mbIL-21 gene (SEQ ID NO: 4), pcDNA3.1 vector (GenScript, US) into which a codon-optimized mbIL-21 gene sequence is inserted was used. For the OX40L gene (SEQ ID NO: 6), a request for synthesis thereof was made to BIONEER CORPORATION.
[0161] For the mTNF-.alpha. gene (SEQ ID NO: 9), RNA was extracted from peripheral blood mononuclear cells (PBMCs), and then CDS was obtained therefrom by reverse transcriptase (RT)-PCR. In order for TNF-.alpha. to be secreted, TNF-.alpha. was cleaved by tumor necrosis factor-alpha-converting enzyme (TACE); however, a point mutation was caused to occur on DNA of TNF-.alpha. so that alanine-valine (A-V), a site recognized by TACE in the amino acid sequence of TNF-.alpha., became proline-valine (P-V), thereby allowing TNF-.alpha. to remain attached to a cell membrane. The point mutation was performed, in human mTNF-.alpha. gene represented by SEQ ID NO: 7, by replacing guanine, which is the 226.sup.th base, with cytosine, and replacing adenine, which is the 228.sup.th base, with guanine.
[0162] Primers suitable for each gene for transducrion were used to amplify, through PCR, the coding sequence (CDS) of the transgene (Table 1).
TABLE-US-00001 TABLE 1 Primer Sequence information (5'.fwdarw.3') SEQ ID NO 4-1BBL 4-1BBL TCTAGAGCTAGCGAATTCGCCACCATGGAATACGCCTCTGACGC SEQ ID NO: 10 Forward TT 4-1BBL TTCGCGGCCGCGGATCCTTATTCCGACCTCGGTGAAGG SEQ ID NO: 11 Reverse mbIL-21 mbIL-21 TAGAGCTAGCGAATTCGCCACCGCCACCATGGCTCTGCCC SEQ ID NO: 12 Forward mbIL-21 TCGCGGCCGCGGATCCTCAATACAGGGTGATGACC SEQ ID NO: 13 Reverse OX40L OX40L TAGAGCTAGCGAATTCGCCACCATGGAACGGGTGCAAC SEQ ID NO: 14 Forward OX40L TCGCGGCCGCGGATCCTCACAAGACACAGAACTCCCC SEQ ID NO: 15 Reverse mTNF-.alpha. mTNF-.alpha. TAGAGCTAGCGAATTCGCCACCGCCACCATGGCTCTGCCC SEQ ID NO: 16 Forward mTNF-.alpha. TCGCGGCCGCGGATCCTCACAGGGCAATGATCCC SEQ ID NO: 17 Reverse
[0163] Table 1 shows the primers used in the experiment.
[0164] The transgene and the lentiviral vector were treated with EcoRI and BamHI restriction enzymes. Thereafter, ligation was performed using an In-Fusion HD cloning kit (Clontech, 639649). The ligated lentiviral vector was transformed into DH5.alpha. competent cells and culture was performed. Plasmid DNA was obtained from the transformed DH5.alpha. competent cells using a plasmid mini-prep kit (MACHEREY-NAGEL/740422.50). For all plasmid DNA, a request for sequencing thereof was made to an outside company, and it was confirmed that DNA sequences thereof were accurate.
EXAMPLE 1.2
Construction of Enriched Lentiviruses
[0165] For recombinant lentiviral production, 293T cell line was inoculated into a 75T flask (Nunc, 156499) at 1.5.times.10.sup.6 to 2.times.10.sup.6 cells two days prior to transfection, and incubated in an incubator at a condition of 5% CO.sub.2 and 37.degree. C. When cell confluency of the 293T cells reached about 80% to 90%, the medium was replaced with 6 ml of OPTI-MEM (Gibco, 31985-088) and incubated for 30 minutes under a 5% CO.sub.2 condition at a temperature of 37.degree. C. A DNA mixed solution and a lipofectamine (lipofectamine 2000, Life technologies, 11668500) mixed solution were prepared (Table 2).
TABLE-US-00002 TABLE 2 Category Ingredient DNA mixed solution 6 .mu.g of target DNA, 6 .mu.g of Gag, 6 .mu.g of REV, 3 .mu.g of VSVG, 1 ml of OPTI-MEM Lipofectamine mixed 36 .mu.l of lipofectamine 2000, 1 ml of OPTI- solution MEM
[0166] Table 2 shows the DNA mixed solution and the lipofectamine (lipofectamine 2000, Life technologies, 11668500) mixed solution.
[0167] Ingredients of the respective mixed solutions were mixed well using a vortexer and allowed to stand at room temperature for 3 minutes. Then, the two mixed solutions were mixed and allowed to stand at room temperature for 20 minutes or longer. The 293T cells for which medium replacement had been made were subjected to treatment with 2 ml of the mixed solution of DNA and lipofectamine. After 4 hours, the medium was replaced with DMEM (Gibco, 11995073) medium supplemented with 10% (v/v) FBS, and incubation was performed for 48 hours under a condition of 5% CO.sub.2 at a temperature of 37.degree. C.
[0168] 8 ml of culture of the 293T cells obtained by performing incubation for 48 hours was collected and filtered with a 0.45 .mu.m filter (Millipore, SLHP033RS). The filtered culture was enriched to 250 .mu.l or less using the Amicon Ultra-15 Centrifugal Filter Unit with Ultracel-100 membrane (Merckmillipore, UFC910096). The enriched viruses were aliquoted in appropriate amounts and stored at a temperature of -80.degree. C.
EXAMPLE 2
Construction of T Cells Having Transduced Genes
EXAMPLE 2.1
Lentiviral Infection
[0169] 0.5.times.10.sup.6 cells of T cell line in culture, 1 ml of OPTI-MEM, 50 .mu.l of lentiviral thaw, 10 .mu.g/ml of polybrene (Santa Cruz, C2013) were mixed. The mixture was placed in a 6-well plate (Nunc, 140675), and spinoculation was performed at 1800 g and a temperature of 32.degree. C. for 90 minutes. Then, incubation was performed for 2 hours in an incubator at a condition of 5% CO.sub.2 and 37.degree. C. Thereafter, the medium was replaced with the same culture medium and incubation was performed for 48 hours.
[0170] Hut78 cell line (ATCC, TIB-161.TM.) was cultured in IMDM (ATCC, 30-2005) medium containing 20% (v/v) FBS. In subculture, the cell concentration thereof was maintained at 1.5.times.10.sup.5 cells/ml to 2.0.times.10.sup.5 cells/ml. H9 cell line (ATCC, HTB-176.TM.) and Jurkat T cell line (ATCC, TIB-152.TM.) were cultured in RPMI1640 (ATCC, 30-2001) medium containing 10% (v/v) FBS. In subculture, the cell concentrations thereof were maintained at 1.0.times.10.sup.5 cells/ml to 1.5.times.10.sup.5 cells/ml and 0.5.times.10.sup.5 cells/ml to 1.0.times.10.sup.5 cells/ml, respectively. Subculture of all cell lines was performed at 2-day to 3-day intervals. As a culture vessel, a 75T flask was used, and the medium volume was maintained at 15 ml to 20 ml.
[0171] The recombinant lentivirus-infected cell line was selected using antibiotics (Table 3).
TABLE-US-00003 TABLE 3 Combination of transduced genes Cell line Antibiotic concentration used mTNF-.alpha. Hut78 1 .mu.g/ml of puromycin mbIL-21 H9 (Life technologies, A1113802) Jurkat or 6 .mu.g/ml of blasticidin (Gibco, R210-01) OX40L Hut78 1 .mu.g/ml of puromycin 4-1BBL H9 or 50 .mu.g/ml of G418 (Sigma Aldrich, G8168) Jurkat 1 mg/ml of G418 mTNF-.alpha./OX40L Hut78 1 .mu.g/ml of puromycin or 6 .mu.g/ml of blasticidin mbIL-21/OX40L H9 50 .mu.g/ml of G418 mbIL-21/4-1BBL Jurkat 0.5 .mu.g/ml of puromycin 1 mg/ml of G418 mTNF-.alpha./mbIL-21/4-1BBL Hut78 1 .mu.g/ml of puromycin mTNF-.alpha./mbIL-21/OX40L/4-1BBL 6 .mu.g/ml of blasticidin 50 .mu.g/ml of G418
[0172] Table 3 shows antibiotics used for the cell lines having transduced genes.
EXAMPLE 2.2
Identification of Expression of Transduced Genes
[0173] The T cell line subcultured in Example 2.1. was collected and centrifuged at 1,200 rpm for 5 minutes. Then, the culture was removed by suction. FACS buffer was made by adding 2% (v/v) FBS to PBS. Dilution with 1 ml of the FACS buffer was performed and the cell number was measured. Dilution with the FACS buffer was performed so as to give a concentration of 5.times.10.sup.6 cells/ml. 100 .mu.l of the diluted cell solution was added to each 5 ml FACS tube (Falcon, 352052). Staining was performed with anti-human TNF-.alpha. (membrane)-PE (R&D Systems, FAB210P), anti-human OX40L-PE (BD, 558184), anti-human 4-1BBL-PE (BD, 559446), anti-human IL-21-PE (eBioscience, 12-7219-42), 7-AAD (Beckman Coulter, Inc., IM3630c), PE mouse IgG1 k isotype control (BD Pharmingen, 555749), PerCP-Cy5.5 mouse IgG1 k isotype control (BD, 550795) antibodies, and then an expression rate of each gene was analyzed using FACS equipment (FIGS. 1a to 3b).
EXAMPLE 3
Co-Culture of CD3(-) PBMCs and T Cells Having Transduced Genes
EXAMPLE 3.1
Preparation of CD3(-) PBMC Seed Cells
[0174] Phosphate buffered saline (PBS, LONZA, 17-516Q) was added, at a 1:1 ratio, to PBMCs collected from healthy donors and centrifugation was performed at 1,500 rpm and a temperature of 4.degree. C. for 10 minutes. 2% (v/v) FBS and 2 mM EDTA were added to PBS, to make MACS running buffer. The PBMC pellets were suspended in 10 ml of the MACS running buffer and the cell number was measured using an Adam cell counter system.
[0175] In order to obtain the seed cells from which CD3(+) cells have been eliminated, 5.times.10.sup.7 PBMCs were transferred to a new 50-ml tube, and then centrifuged at 1,200 rpm and a temperature of 4.degree. C. for 10 minutes. 400 .mu.l of the MACS running buffer and 100 .mu.l of CD3 magnetic beads (Miltenyi Biotech, 130050101) were added to 5.times.10.sup.7 PBMC cell pellets and reaction was allowed to occur at a temperature of 4.degree. C. for 20 minutes. 10 ml to 20 ml of the MACS running buffer was added thereto and washing was performed. Then, centrifugation was performed at 1,200 rpm and a temperature of 4.degree. C. for 10 minutes, and the resultant was suspended again in 2 ml of the MACS running buffer.
[0176] The cells were isolated using VarioMACS (Miltenyi Biotech) equipped with a CS column (Miltenyi Biotech, 130-041-305). The cells were recovered by washing the column until it reached a final volume of 20 ml. The cell number was measured using the Adam cell counter system. 1.times.10.sup.7 cells were placed in a new 50-ml tube, and centrifuged at 1,200 rpm and a temperature of 4.degree. C. for 10 minutes. The cell pellets were suspended in freezing medium, and freezing was performed in liquid nitrogen to achieve 1.times.10.sup.7 cells per vial.
[0177] One frozen CD3(-) PBMC vial was thawed and transferred to a 50-ml tube. CD3(-) PBMCs were suspended in PBS containing 0.6% (v/v) ACD (citrate-dextrose solution, Sigma-Aldrich, C3821), 0.2% (v/v) fetal serum bovine (FBS), and 2 mM EDTA, and centrifuged at 1,200 rpm and a temperature of 4.degree. C. for 10 minutes. CD3(-) PBMC pellets were suspended in 1% (v/v) CellGro medium (Cellgenix, 20802-0500), and the cell number was measured using the Adam cell counter system. CD3(-) PBMC seed cells were suspended in 1% (v/v) CellGro medium at a concentration of 1.times.10.sup.6 cells/ml.
EXAMPLE 3.2
Co-Culture of CD3(-) PBMC Seed Cells and T Feeder Cells Having Transduced Genes
[0178] T cells having transduced gene were recovered from the culture flask and centrifuged at 1,200 rpm and a temperature of 4.degree. C. for 10 minutes. Thereafter, the cells were suspended in 1% (v/v) CellGro medium, and the cell number was measured using the Adam cell counter system. T feeder cells having transduced gene(s) were prepared by being suspended in 1% (v/v) CellGro medium at a concentration of 5.times.10.sup.6 cells/ml and then being irradiated with 20,000 cGy in a gamma-ray irradiator and inactivated.
[0179] In culture of natural killer cells, 500 IU of IL-2 (Proleukin Inj., Novartis Korea) and 10 ng/ml of OKT-3 (eBioscience, 16-0037-85) were added to a culture plastic plate. On day 0 of culture, the CD3(-) PBMC seed cells and the T feeder cells having transduced gene(s) were added in a volume of 0.5 ml to 1 ml each at a ratio of 1:5 or 1:2.5, and CellGro medium containing 1% (v/v) human plasma was added thereto in a volume of 0.25 ml to 0.5 ml. The resultant was subjected to static culture in an incubator at a temperature condition of 37.degree. C. for 4 to 7 days while adding the medium.
[0180] On days 4 to 5 of culture, the cell number was measured so that the cells had a concentration of about 0.5.times.10.sup.6 to 1.times.10.sup.6 cells/ml. Thereafter, the cells were diluted with CellGro medium containing 500 IU of IL-2 and 1% (v/v) autologous plasma, and placed in an appropriate culture vessel. The cells were again subjected to static culture.
[0181] After that, the cell number was measured at 2-day to 3-day intervals so that the cells had a concentration of 0.5.times.10.sup.5 to 1.times.10.sup.6 cells/ml. Thereafter, the cells were subjected to suspension culture until day 21 while performing dilution with CellGro medium containing 500 IU of IL-2 and 1% (v/v) autologous plasma. On day 21 of suspension culture, natural killer cells were obtained.
[0182] As a result of comparing proliferation rates of the cultured natural killer cells, it was possible to identify that culture with the cell line into which one or more genes (mTNF-.alpha., OX40L, 4-1BBL, or mbIL-21) have been transduced results in increased proliferation of natural killer cells, in terms of proliferation rate based on total nucleated cells (TNC), as compared with the cell line having no transduced gene (76-fold in H9, 382-fold in Hut78, 26-fold in Jurkat). In particular, as compared with single transduction of the 4-1BBL gene or the mbIL-21 gene, in case of the cell line into which the mbIL-21/4-1BBL gene is transduced, remarkably high proliferation rates for natural killer cells, which are 4,169-fold in Hut78-mbIL-21/4-1BBL, 3,758-fold in H9-mbIL-21/4-1BBL, 258-fold in Jurkat-mbIL-21/4-1BBL, were induced regardless of types of T cells (Table 4, FIGS. 4a to 4c). That is, it was identified that a synergistic effect was observed when the mbIL-21 gene and the 4-1BBL gene were transduced.
TABLE-US-00004 TABLE 4 Hut78 feeder cell H9 feeder cell Jurkat feeder cell Transduced Fold Fold Fold gene(s) increase (D21) increase (D21) increase (D14) Parental 382.0 .+-. 379.78 79.3 .+-. 38.60 26.1 .+-. 15.45 mTNF-.alpha. 532.5 .+-. 315.48 147.7 .+-. 101.04 19.1 .+-. 8.84 OX40L 541.4 .+-. 353.22 -- -- 4-1BBL 992.3 .+-. 423.75 689.8 .+-. 541.60 121.7 .+-. 30.46 mbIL-21 979.2 .+-. 745.36 277.8 .+-. 71.00 1.4 .+-. 1.05 mTNF-.alpha./OX40L 916.0 .+-. 204.52 -- -- mTNF-.alpha./4-1BBL 1871.7 .+-. 701.68 985.3 .+-. 705.35 60.7 .+-. 20.09 mbIL-21/4-1BBL 4169.5 .+-. 2795.10 3758.5 .+-. 3232.39 258.5 .+-. 121.36
[0183] Table 4 shows proliferation rates of the natural killer cells cultured with T cell line having undergone single or double gene transduction.
[0184] In order to identify a synergistic effect obtained when a combination of two or more genes is transduced, a proliferative effect of the natural killer cells cultured with Hut78 T cell line having undergone triple gene (mTNF-.alpha./mbIL-21/4-1BBL) or quadruple gene (mTNF-.alpha./mbIL-21/OX40L/4-1BBL) transduction was compared together with combinations of genes for which experiments were previously made. Among the cell lines having undergone double gene transduction, the cell line that induced the highest proliferation of natural killer cells was the cell line (998-fold) into which the mbIL-21/4-1BBL gene had been transduced. However, when cultured with a cell line having undergone triple gene transduction (1,607-fold) or a cell line having undergone quadruple gene transduction (1,640-fold), it was identified that a higher synergistic effect was observed than the cell line (998-fold) into which the mbIL-21/4-1BBL gene was transduced (Table 5 and FIG. 4d).
TABLE-US-00005 TABLE 5 Hut78 feeder cell Transduced gene(s) Fold increase(D21) Parental 72.1 .+-. 71.5 mTNF-.alpha. 121.9 .+-. 103.0 OX40L 212.4 .+-. 297.2 4-1BBL 235.1 .+-. 195.1 mbIL-21 737.2 .+-. 393.6 mTNF-.alpha./OX40L 77.8 .+-. 67.3 mTNF-.alpha./4-1BBL 385.4 .+-. 293.3 mbIL-21/4-1BBL 998.3 .+-. 911.2 mbIL-21/OX40L 743.0 .+-. 411.7 mTNF-.alpha./mbIL-21/4-1BBL 1607.3 .+-. 845.0 mTNF-.alpha./mbIL- 1640.6 .+-. 1191.6 21/OX40L/4-1BBL Single culture of seed cells 0.8
[0185] Table 5 shows proliferation rates of the natural killer cells cultured with T cell lines having undergone multiple gene transduction.
[0186] Experiments were conducted to identify whether culture of natural killer cells can be continuously maintained with repeated re-stimulation by T cell line due to gene transduction.
[0187] Hut78 cells having undergone triple gene transduction were recovered from the culture flask and centrifuged at 1,200 rpm and a temperature of 4.degree. C. for 10 minutes. Thereafter, the cells were suspended in 1% (v/v) CellGro medium, and the cell number was measured using the Adam cell counter system. Hut78 feeder cells having undergone triple gene transduction were prepared by being suspended in 1% (v/v) CellGro medium at a concentration of 2.5.times.10.sup.6 cells/ml and then being irradiated with 20,000 cGy in a gamma-ray irradiator and inactivated.
[0188] In culture of natural killer cells, 500 IU of IL-2 (Proleukin Inj., Novartis Korea) and 10 ng/ml of OKT-3 (eBioscience, 16-0037-85) were added to a culture plastic plate.
[0189] On day 0 of culture, the CD3(-) PBMC seed cells and the Hut78 feeder cells having undergone triple gene transduction were added in a volume of 0.5 ml to 1 ml each at a ratio of 1:2.5, and CellGro medium containing 1% (v/v) human plasma was added thereto in a volume of 0.5 ml to 1 ml. The cells were subjected to static culture in an incubator at a temperature condition of 37.degree. C. for 4 to 7 days. On day 2 or 3 of culture, half of the medium was removed and CellGro medium containing 1% (v/v) human plasma was added thereto as much as the removed volume. On day 4 or 5 of culture, the cell number was measured so that the cells had a concentration of about 0.5.times.10.sup.6 cells/ml to 1.times.10.sup.6 cells/ml.
[0190] On day 7 or 11 of culture, the cell number was measured and the cells were suspended in 1% (v/v) CellGro medium at a concentration of 1.times.10.sup.6 cells/ml. For re-stimulation, the Hut78 feeder cells having undergone triple gene transduction were added thereto in a volume of 0.5 ml to 1 ml each at a ratio of 1:2.5, and CellGro medium containing 500 IU of IL-2 (Proleukin Inj., Novartis Korea), 10 ng/ml of OKT-3 (eBioscience, 16-0037-85), and 1% (v/v) human plasma was added thereto in a volume of 0.5 ml to 1 ml. The cells were subjected to static culture in an incubator at a temperature condition of 37.degree. C. for 3 to 4 days. After that, the cell number was measured at 2-day or 3-day intervals so that the cells had a concentration of 0.5.times.10.sup.5 cells/ml to 1.times.10.sup.6 cells/ml.
[0191] The re-stimulation process was repeated at 7-day or 11-day intervals, so that a total of 4 re-stimulations at 7-day intervals (D7RS5) and a total of 3 re-stimulations at 11-day intervals (D11RS4) were given.
[0192] As a result of comparing proliferation rates of cultured natural killer cells, it was possible to identify that culture with one or more re-stimulations resulted in increased proliferation of natural killer cells, in terms of proliferation based on total nucleated cells (TNC), as compared with a proliferation obtained in a case where no re-stimulation was given (FIGS. 5a to 5d). When being stimulated once with Hut78-mTNF-.alpha./4-1BBL/mbIL-21 cell line on day 0 of culture, culture was continued up to day 25 and 2,124-fold proliferation was achieved. When stimulated 5 times with Hut78-mTNF.alpha./4-1BBL/mbIL-21 cell line at 7-day intervals, culture was continued up to day 35 day and 436,032-fold proliferation was achieved. When stimulated 4 times with Hut78-mTNF-.alpha./4-1BBL/mbIL-21 cell line at 11-day intervals, culture was continued up to day 42 and 2,628,153-fold proliferation was achieved. Therefore, it was possible to identify that repeated stimulation with Hut78-mTNF-.alpha./4-1BBL/mbIL-21 T cell line at 7-day or 11-day intervals resulted in a continuous increase in proliferation of natural killer cells.
EXPERIMENTAL EXAMPLE 1
Identification of Cell Viability of Natural Killer Cells Depending on Transduced Gene(s)
[0193] In order to compare and evaluate in-vitro cell viability, the Adam cell counter system, which is one of cell counters using PI staining solution capable of binding to intracellular nuclei, was used. After the number of viable cells was calculated by subtracting the number of dead cells from the measured total number of cells, cell viability was calculated using the following Expression I.
Cell viability (%)=(Number of viable cells/number of total cells).times.100 [Expression I]
[0194] As a result of measuring viability of the natural killer cells after 21 days of culture, high cell viability of about 80% or more was observed under all conditions (FIGS. 6a to 6d).
EXPERIMENTAL EXAMPLE 2
Cell Phenotypic Analysis in Natural Killer Cells Depending on Transduced Gene(s)
[0195] The natural killer cells cultured for 21 days or the natural killer cells cultured with repeated re-stimulation were collected and centrifuged at 1,200 rpm for 5 minutes. The culture was removed by suction. Dilution with 1 ml of FACS buffer was performed and the cell number was measured. Dilution with the FACS buffer was performed so as to give a concentration of 5.times.10.sup.6 cells/ml. 100 .mu.l of the diluted cell solution was added to each 5-ml FACS tube (Falcon, 352052), and phenotypic analysis was performed with the following antibodies.
[0196] Tube 1: Anti-human CD3-FITC (BD Pharmingen, 555332), anti-human CD16-PE (BD Pharmingen, 555407), anti-human CD56-PE-Cy5 (BD Pharmingen, 555517) or anti-human CD56-PE Cy7 (BD Pharmingen, 557747), anti-human CD56-BV421 (BD Pharmingen, 562751)
[0197] Tube 2: Anti-human CD14-FITC (BD Pharmingen, 555397), anti-human CD19-PE (BD Pharmingen, 555413), anti-human CD3-PE-Cy5 (BD Pharmingen, 555341) or anti-human CD3-PE Cy7 (eBioscience, 25-0038-42), anti-human CD3-BV421 (BD Pharmingen, 562438)
[0198] Tube 3: Anti-human CD3-FITC, anti-human NKG2D-PE (R&D Systems, FAB139P), anti-human CD56-PE-Cy5 or anti-human CD56-PE-Cy7, anti-human CD56-BV421
[0199] Tube 4: Anti-human CD3-FITC, anti-human NKp30-PE (BD Pharmingen, 558407), anti-human CD56-PE-Cy5 or anti-human CD56-PE-Cy7, anti-human CD56-BV421
[0200] Tube 5: Anti-human CD3-FITC, anti-human NKp44-PE (BD Pharmingen, 558563), anti-human CD56-PE-Cy5 or anti-human CD56-PE-Cy7, anti-human CD56-BV421
[0201] Tube 6: Anti-human CD3-FITC, anti-human NKp46-PE (BD Pharmingen, 557991), anti-human CD56-PE-Cy5 or anti-human CD56-PE-Cy7, anti-human CD56-BV421
[0202] Tube 7: Anti-human CD3-FITC, anti-human DNAM-1-PE (BD Pharmingen, 559789), anti-human CD56-PE-Cy5 or anti-human CD56-PE-Cy7, anti-human CD56-BV421
[0203] Tube 8: Anti-human CD3-FITC, anti-human CXCR3-PE (BD Pharmingen, 557185), anti-human CD56-PE-Cy5 or anti-human CD56-PE-Cy7, anti-human CD56-BV421
[0204] Tube 9: Anti-human CD3-FITC, PE mouse IgG1 k isotype control (BD Pharmingen, 555749), anti-human CD56-PE-Cy5 or anti-human CD56-PE-Cy7, anti-human CD56-BV421
[0205] Tube 10: FITC mouse IgG1 k isotype control (BD Pharmingen, 555748), PE mouse IgG1 k isotype control, PE-Cy5 mouse IgG1 k isotype control (BD Pharmingen, 555750) or PE-Cy7 mouse IgG1 k isotype control (BD Pharmingen, 557872), BV421 mouse IgG1 k isotype control (BD Pharmingen, 562438)
[0206] Tube 11: Anti-human CD3-FITC, anti-human NKG2A-PE (R&D Systems, FAB1059P), anti-human CD56-PE-Cy5 or anti-human CD56-PE-Cy7, anti-human CD56-BV421
[0207] Tube 12: Anti-human CD3-FITC, anti-human NKG2C-PE (R&D Systems, FAB138P), anti-human CD56-PE-Cy5 or anti-human CD56-PE-Cy7, anti-human CD56-BV421
[0208] Tube 13: Anti-human CD3-FITC, anti-human CD62L-PE (eBioscience, 12-0629-42), anti-human CD56-PE-Cy5 or anti-human CD56-PE-Cy7, anti-human CD56-BV421
[0209] Tube 14: Anti-human CD3-FITC, anti-human CD69-PE (R&D Systems, FAB23591P), anti-human CD56-PE-Cy5 or anti-human CD56-PE-Cy7, anti-human CD56-BV421
[0210] Tube 15: Anti-human CD3-FITC, anti-human CD57-PE (BD Pharmingen, 560844), anti-human CD56-PE-Cy5 or anti-human CD56-PE-Cy7, anti-human CD56-BV421
[0211] In Tube 1, Staining with anti-human CD56 was performed by selecting one of three fluorescences, and thus the same fluorescence was selected for CD3 of Tube 2 and CD56 of Tubes 3 to 9 and 11 to 15, and isotype control of Tube 10.
[0212] The cells in the above tubes were stained at refrigeration temperature for 30 minutes. Thereafter, 2 ml of FACS buffer was added to the stained cells, and centrifugation was performed at 1,500 rpm for 5 minutes. The supernatant was removed, and 2 ml of FACS buffer was added again. Centrifugation was performed at 1,500 rpm for 5 minutes. The supernatant was removed again, and placed and suspended in 200 .mu.l of fixation buffer (BD, 554655). Then, identification of the cells and examination for purity and phenotype thereof were performed using FACS LSRII Fortessa (BD).
[0213] Identification and purity analysis were performed on the natural killer cells cultured for 21 days. As a result, it was identified that the NK cell (CD3-CD56+) content was 95% or more under all conditions, and that an expression level of CD56+CD16+ marker for evaluating activation of the natural killer cells was highly maintained using the T feeder cells having undergone double gene transduction (FIGS. 7a to 7h).
[0214] In addition, expression of representative receptors in natural killer cells was analyzed. It was identified that all natural killer cells expressed CD16 at a high level, and expressed the activation markers NKG2D, NKp30, NKp44, NKp46, and DNAM-1 at high levels, without variation among donors, under a condition of feeder cells having undergone double gene transduction, as compared with a condition where no gene has been transduced or a condition of feeder cells having undergone single gene transduction. In particular, it was possible to identify that the amount of CXCR3 was greatly increased under a condition of feeder cells having undergone double gene transduction. Therefore, it was identified that the feeder cells having undergone double gene transduction were useful feeder cells capable of increasing activation and tumor targeting of NK cells (FIGS. 8a to 11l).
[0215] As a result of identifying receptors and activation markers of the natural killer cells cultured with repeated re-stimulation by T cell line due to gene transduction, it was identified that under both the condition where no re-stimulation was performed and the condition where repeated re-stimulation was performed, the activation markers (CD16, NKG2D, NKp30, NKp44, NKp46, DNAM-1) were expressed with no large difference even when a re-stimulation interval or a culture period increased (FIGS. 12a to 12c).
EXPERIMENTAL EXAMPLE 3
Identification of Abnormal Cell-Killing Activity of Natural Killer Cells Depending on Transduced Gene(s) for T Cells
[0216] 1.times.10.sup.6 cells of K562 cancer cell line were placed in a 15-ml tube and centrifugation was performed. The cell pellets were suspended in RPMI1640 medium supplemented with 1 ml of 10% (v/v) FBS. Thereafter, 30 .mu.l of 1 mM Calcein-AM (Molecular probe, C34852) was added thereto. Then, silver foil was used to block the light, and staining was performed for 1 hour in an incubator at a temperature condition of 37.degree. C.
[0217] The Calcein-AM-stained tumor cell line was washed by adding thereto 10 ml to 15 ml of RPMI1640 medium supplemented with 10% (v/v) FBS, and centrifugation was performed. Then, the pellets were suspended in 10 ml of RPMI1640 medium supplemented with 10% (v/v) FBS so that the cells had a concentration of 1.times.10.sup.5 cells/ml. Natural killer cells were placed in a 15-ml tube at 1.times.10.sup.6 cells, and centrifugation was performed. The pellets were suspended in RPMI1640 medium supplemented with 10% (v/v) FBS at a desired ratio (1:1) with respect to K562 cancer cell line. The prepared K562 cancer cell line and natural killer cell line were mixed using 100 .mu.l each and dispensed into a 96-well U-bottom plate (Nunc, 163320). Each well was prepared in triplicate and a mean value thereof was obtained.
[0218] To spontaneous release wells were added 100 .mu.l of the stained K562 cancer cell line and 100 .mu.l of RPMI1640 medium supplemented with 10% (v/v) FBS. To maximum release wells were added 100 .mu.l of the stained K562 cancer cell line and 100 .mu.l of triple distilled water supplemented with 2% (v/v) Triton-X 100.
[0219] In order to correct auto-fluorescence present in RPMI1640 medium supplemented with 10% (v/v) FBS and RPMI1640 medium supplemented with 2% (v/v) Triton-X 100, 200 .mu.l of RPMI1640 medium supplemented with 10% (v/v) FBS was added to prepare a medium value; and 100 .mu.l of RPMI1640 medium supplemented with 2% (v/v) Triton-X 100 was added to 100 .mu.l of RPMI1640 medium supplemented with 10% (v/v) FBS, to prepare a mixed solution value of the two solutions. The auto-fluorescence was corrected by adding, to the maximum release value, the difference (A) obtained by subtracting the mixed solution value from the medium value.
[0220] The light was blocked and reaction was allowed to occur for 4 hours in an incubator at a temperature condition of 37.degree. C., and then the plate was centrifuged at 2,000 rpm for 3 minutes. The supernatant was dispensed at 100 .mu.l each into 96-well black plate (Nunc, 237108). Fluorescence values (OD.sub.480/535 nm) were measured using a fluorescence plate reader (Perkin Elmer, VICTOR X3), and tumor cell-killing ability of natural killer cells was calculated using the following Expression II.
% of killing=(Sample well mean fluorescence value -Spon well mean fluorescence value)/{(Max well mean fluorescence value+A)-Spon well mean fluorescence value}.times.100 [Expression II]
[0221] The natural killer cells cultured with various feeder cells were reacted with K562 cancer cell line to measure their direct cell-killing activity. As compared with other conditions, the killing activity against the K562 cancer cell line was increased on average under a condition of feeder cells having undergone double gene transduction (FIGS. 13a to 14d).
[0222] The natural killer cells cultured with re-stimulation by T cell line due to gene transduction were reacted with K562 cancer cell line to measure their direct cell-killing activity. It was identified that under both the condition where no re-stimulation was performed and the condition where repeated re-stimulation was performed, the killing activity against K562 was well maintained even when a culture period was prolonged and fold expansion was increased (FIGS. 15a to 15c).
EXPERIMENTAL EXAMPLE 4
Analysis of Proliferation Marker (Ki-67) in Natural Killer Cells Depending on Transduced Gene(s) for T Cells
[0223] The natural killer cells cultured for 21 days or the natural killer cells cultured with repeated re-stimulation were collected and centrifuged at 1,200 rpm for 5 minutes. The culture was removed by suction. Dilution with 1 ml of FACS buffer was performed and the cell number was measured. Dilution with FACS buffer was performed so as to give a concentration of 5.times.10.sup.6 cells/ml. 100 .mu.l of the diluted cell solution was added to each 5-ml FACS tube (Falcon, 352052), and proliferation marker analysis was performed with the following antibodies.
[0224] Tube 1: Anti-human CD3-FITC (BD Pharmingen, 555332), anti-human CD56-PE-Cy7 (BD Pharmingen, 557747), 7-AAD (Beckman Coulter, Inc., A07704)
[0225] Tube 2: Anti-human CD3-FITC (BD Pharmingen, 555332), anti-human CD56-PE-Cy7 (BD Pharmingen, 557747), 7-AAD (Beckman Coulter, Inc., A07704)
[0226] Tube 3: FITC Mouse IgG1 k isotype control (BD Pharmingen, 555748), PE-Cy7 Mouse IgG1 k isotype control (BD Pharmingen, 557872)
[0227] The cells in the above tubes were stained at refrigeration temperature for 30 minutes. Thereafter, 2 ml of FACS buffer was added to the stained cells, and centrifugation was performed at 1,500 rpm for 5 minutes. The supernatant was removed, and 2 ml of FACS buffer was added again. Centrifugation was performed at 1,500 rpm for 5 minutes. The supernatant was removed again, and placed and suspended in 200 .mu.l of fixation/permeabilization buffer (eBioscience, 00-5521-00). Then, reaction was allowed to occur at refrigeration temperature for 30 minutes or longer. 2 ml of 1.times. Perm/wash buffer was added and centrifugation was performed at 1,500 rpm for 5 minutes. The supernatant was removed, and 2 ml of FACS buffer was added again. Centrifugation was performed at 1,500 rpm for 5 minutes. Anti-human Ki-67-V450 (BD Pharmingen, 561281) was added to the tube 1, and V450 mouse IgG1 k isotype control (BD Pharmingen, 561504) was added to the tubes 2 and 3. Staining was performed at room temperature for 30 minutes.
[0228] Thereafter, 2 ml of 1.times. Perm/wash buffer was added to the stained cells, and centrifugation was performed at 1,500 rpm for 5 minutes. The supernatant was removed, and 2 ml 1.times. Perm/wash buffer was added again. Centrifugation was performed at 1,500 rpm for 5 minutes. The supernatant was removed again, and placed and suspended in 200 .mu.l of fixation buffer (BD, 554655). Then, FACS LSRII Fortessa (BD) was used to examine the proliferation marker in the cells.
[0229] It was identified that expression of Ki-67 in the natural killer cells cultured with HuT 78 cell lines into which one or more genes have been transduced was maintained at a relatively high level, except for Hut78-mTNF-.alpha./OX40L, as compared with the HuT 78 cell line having no gene transduction (FIGS. 16a to 16d).
[0230] Analysis was performed on the proliferation marker in the natural killer cells cultured through re-stimulation by Hut78-mTNF.alpha./4-1BBL/mbIL-21 feeder cells. As a result, it was identified that expression of Ki-67 which had been decreasing increased with stimulation by feeder cells at 7-day or 11-day intervals. In addition, it was identified that expression of Ki-67 could be sustained through repeated re-stimulation (FIGS. 17a to 17d).
EXPERIMENTAL EXAMPLE 5
Analysis of Co-Stimulatory Molecules in Natural Killer Cells Depending on Transduced Gene(s) for T Cells
[0231] The natural killer cells cultured for 21 days or the natural killer cells cultured with repeated re-stimulation were collected and centrifuged at 1,200 rpm for 5 minutes. The culture was removed by suction. Dilution with 1 ml of FACS buffer was performed and the cell number was measured. Dilution with FACS buffer was performed so as to give a concentration of 5.times.10.sup.6 cells/ml. 100 .mu.l of the diluted cell solution was added to each 5-ml FACS tube (Falcon, 352052), and phenotypic analysis was performed with the following antibodies.
[0232] Tube 1: Anti-human CD3-FITC (BD Pharmingen, 555332), anti-human CD25-PE (BD Pharmingen, 555432), anti-human CD56-PE-Cy5 (BD Pharmingen, 555517) or anti-human CD56-PE Cy7 (BD Pharmingen, 557747), anti-human CD56-BV421 (BD Pharmingen, 562751)
[0233] Tube 2: Anti-human CD3-FITC, anti-human TNFRII-PE (R&D Systems, FAB226P), anti-human CD56-PE-Cy5 or anti-human CD56-PE-Cy7, anti-human CD56-BV421
[0234] Tube 3: Anti-human CD3-FITC, anti-human 4-1BB-PE (BD Pharmingen, 559446), anti-human CD56-PE-Cy5 or anti-human CD56-PE-Cy7, anti-human CD56-BV421
[0235] Tube 4: Anti-human CD3-FITC, PE mouse IgG1 k isotype control (BD Pharmingen, 555749), anti-human CD56-PE-Cy5 or anti-human CD56-PE-Cy7, anti-human CD56-BV421
[0236] Tube 5: FITC mouse IgG1 k isotype control (BD Pharmingen, 555748), PE mouse IgG1 k isotype control, PE-Cy5 mouse IgG1 k isotype control (BD Pharmingen, 555750) or PE-Cy7 mouse IgG1 k isotype control (BD Pharmingen, 557872), BV421 mouse IgG1 k isotype control (BD Pharmingen, 562438)
[0237] In Tube 1, Staining with anti-human CD56 was performed by selecting one of three fluorescences, and thus the same fluorescence was selected for CD56 of Tubes 2 to 4, and isotype control of Tube 5.
[0238] The cells in the above tubes were stained at refrigeration temperature for 30 minutes. Thereafter, 2 ml of FACS buffer was added to the stained cells, and centrifugation was performed at 1,500 rpm for 5 minutes. The supernatant was removed, and 2 ml of FACS buffer was added again. Centrifugation was performed at 1,500 rpm for 5 minutes. The supernatant was removed again, and placed and suspended in 200 .mu.l of fixation buffer (BD, 554655). Then, FACS LSRII Fortessa
[0239] (BD) was used to perform identification of the cells and examination for co-stimulatory molecules.
[0240] Analysis was performed on co-stimulatory molecules in the natural killer cells cultured for 21 days using Hut78 cell lines having various gene combinations. As a result, it was identified that expression of the co-stimulatory molecules in the natural killer cells cultured with the Hut78 cell lines into which one or more genes have been transduced is maintained at a relatively high level as compared with the non-transgenic Hut78 cell line. In particular, it was identified that the cell lines into which a single gene or combinations of multiple genes including the mbIL-21 gene have been transduced exhibited higher expression of co-stimulatory molecules than other cell lines (FIGS. 18a to 18f).
[0241] Analysis was performed on co-stimulatory molecules in the natural killer cells cultured after one stimulation by Hut78-mTNF-.alpha./4-1BBL/mbIL-21 cell line on day 0 of culture or the natural killer cells cultured through repeated re-stimulation by Hut78-mTNF-.alpha./4-1BBL/mbIL-21 cell line at 7-day or 11-day intervals. As a result, expression of the co-stimulatory molecules increased and then remained in a decreased state, unless additional re-stimulation is performed after the first stimulation. On the other hand, expression of the co-stimulatory molecules was continued during the culture period while repeatedly showing that upon repeated stimulation by feeder cells, expression of the co-stimulatory molecules increased at a time point of stimulation and then decreased after a certain time elapsed (FIGS. 19a to 19f).
EXPERIMENTAL EXAMPLE 6
Identification of Cytokine-Secretion of Natural Killer Cells Depending on Transduced Gene(s) for T Cells
[0242] 2.5.times.10.sup.6 cells of K562 cancer cell line were placed in a 15-ml tube and centrifuged. The cell pellets were suspended in 1 ml of RPMI1640 medium supplemented with 10% (v/v) FBS.
[0243] Natural killer cells were placed at 2.5.times.10.sup.6 cells in a 15-ml tube and centrifuged. The cell pellets were suspended in RPMI1640 medium supplemented with 1 ml of 10% (v/v) FBS. In order to identify, within the cells, cytokines to be secreted out of the cells, the protein transport inhibitors Golgiplug (BD, 555029) and Golgistop (BD, 554724) were added thereto.
[0244] The prepared cells were dispensed into a 96-well U-bottom plate (Nunc, 163320), in which the natural killer cells and the medium were added in 100 .mu.l each to well 1, and the K562 cancer cell line and the natural killer cell line were mixed using 100 .mu.l each and added to wells 2 and 3.
[0245] Wells 1, 2: Anti-human CD107a-APC (BD Pharmingen, 560664)
[0246] Well 3: APC mouse IgG1 k isotype control (BD Pharmingen, 555751)
[0247] The light was blocked and reaction was allowed to occur for 4 hours in an incubator at a temperature condition of 37.degree. C., and then the plate was centrifuged at 2,000 rpm for 3 minutes. The supernatant was removed and cytokine-secreting ability analysis was performed with the following antibodies.
[0248] Wells 1, 2, 3: Anti-human CD3-PerCP-Cy5.5 (eBioscience, 45-0036-42), anti-human CD56-APC-Cy7 (eBioscience, 47-0567-42), 7-AAD (Beckman Coulter, Inc., A07704)
[0249] The plate was stained at refrigeration temperature for 30 minutes. Thereafter, 100 .mu.l of FACS buffer was added to the stained cells, and centrifugation was performed at 2,000 rpm for 3 minutes. The supernatant was removed and 200 .mu.l FACS buffer was added again thereto. Centrifugation was performed at 2,000 rpm for 3 minutes. The supernatant was removed again, and placed and suspended in 200 .mu.l of fixation/permeabilization buffer (BD Pharmingen, 554714). Then, reaction was allowed to occur at refrigeration temperature for 30 minutes or longer.
[0250] 200 .mu.l of 1.times. Perm/wash buffer was added thereto, and centrifugation was performed at 1,500 rpm for 5 minutes. The supernatant was removed, and 2 ml of FACS buffer was added again. Centrifugation was performed at 2,000 rpm for 3 minutes. Anti-human IFN-.gamma.-FITC (BD Pharmingen, 554700), anti-human TNF.alpha.-PE-Cy7 (eBioscience, 25-7349-82) were added to wells 1 and 2, and FITC mouse
[0251] IgG1 k isotype control (BD Pharmingen, 555748), PE-Cy7 mouse IgG1 k isotype control (BD Pharmingen, 557872) were added to well 3. Staining was performed at refrigeration temperature for 30 minutes.
[0252] Thereafter, 100 .mu.l of 1.times. Perm/wash buffer was added to the stained cells, and centrifugation was performed at 2,000 rpm for 3 minutes. The supernatant was removed and 100 .mu.l of 1.times. Perm/wash buffer was added again thereto. Centrifugation was performed at 2,000 rpm for 3 minutes. The supernatant was removed again, and placed and suspended in 200 .mu.l of fixation buffer (BD, 554655). Then, FACS LSRII Fortessa (BD) was used to examine cytokine-secreting ability of the cells.
[0253] Measurements were performed on the cytokine-secreting ability, against K562 cancer cell line, of the natural killer cells cultured for 21 days using Hut78 cell lines having various gene combinations. As a result, it was identified that when being cultured with cell lines into which one or more genes have been transduced, a similar level of cytokine-secreting ability was observed despite large difference in expansion fold, as compared with the cell line having no gene transduction (FIGS. 20a to 20c).
[0254] The cytokinesecretion of the natural killer cells cultured after one stimulation by Hut78-mTNF.alpha./4-1BBL/mbIL-21 cell line on day 0 of culture or the natural killer cells cultured through repeated re-stimulation by Hut78-mTNF.alpha./4-1BBL/mbIL-21 cell line at 7-day or 11-day intervals was measured by reaction with K562 cancer cell line. It was identified that as compared with the natural killer cells cultured with one stimulation, the cytokine-secreting ability against K562 was maintained, without large difference, in the natural killer cells cultured with repeated re-stimulation, despite a long culture period and high expansion fold (FIGS. 21a to 21c).
Sequence CWU 1
1
171254PRTArtificial Sequenceamino acid seqeunce for 4-1BBL 1Met Glu
Tyr Ala Ser Asp Ala Ser Leu Asp Pro Glu Ala Pro Trp Pro1 5 10 15Pro
Ala Pro Arg Ala Arg Ala Cys Arg Val Leu Pro Trp Ala Leu Val 20 25
30Ala Gly Leu Leu Leu Leu Leu Leu Leu Ala Ala Ala Cys Ala Val Phe
35 40 45Leu Ala Cys Pro Trp Ala Val Ser Gly Ala Arg Ala Ser Pro Gly
Ser 50 55 60Ala Ala Ser Pro Arg Leu Arg Glu Gly Pro Glu Leu Ser Pro
Asp Asp65 70 75 80Pro Ala Gly Leu Leu Asp Leu Arg Gln Gly Met Phe
Ala Gln Leu Val 85 90 95Ala Gln Asn Val Leu Leu Ile Asp Gly Pro Leu
Ser Trp Tyr Ser Asp 100 105 110Pro Gly Leu Ala Gly Val Ser Leu Thr
Gly Gly Leu Ser Tyr Lys Glu 115 120 125Asp Thr Lys Glu Leu Val Val
Ala Lys Ala Gly Val Tyr Tyr Val Phe 130 135 140Phe Gln Leu Glu Leu
Arg Arg Val Val Ala Gly Glu Gly Ser Gly Ser145 150 155 160Val Ser
Leu Ala Leu His Leu Gln Pro Leu Arg Ser Ala Ala Gly Ala 165 170
175Ala Ala Leu Ala Leu Thr Val Asp Leu Pro Pro Ala Ser Ser Glu Ala
180 185 190Arg Asn Ser Ala Phe Gly Phe Gln Gly Arg Leu Leu His Leu
Ser Ala 195 200 205Gly Gln Arg Leu Gly Val His Leu His Thr Glu Ala
Arg Ala Arg His 210 215 220Ala Trp Gln Leu Thr Gln Gly Ala Thr Val
Leu Gly Leu Phe Arg Val225 230 235 240Thr Pro Glu Ile Pro Ala Gly
Leu Pro Ser Pro Arg Ser Glu 245 2502765DNAArtificial
Sequencenucleotide sequence of 4-1BBL 2atggaatacg cctctgacgc
ttcactggac cccgaagccc cgtggcctcc cgcgccccgc 60gctcgcgcct gccgcgtact
gccttgggcc ctggtcgcgg ggctgctgct gctgctgctg 120ctcgctgccg
cctgcgccgt cttcctcgcc tgcccctggg ccgtgtccgg ggctcgcgcc
180tcgcccggct ccgcggccag cccgagactc cgcgagggtc ccgagctttc
gcccgacgat 240cccgccggcc tcttggacct gcggcagggc atgtttgcgc
agctggtggc ccaaaatgtt 300ctgctgatcg atgggcccct gagctggtac
agtgacccag gcctggcagg cgtgtccctg 360acggggggcc tgagctacaa
agaggacacg aaggagctgg tggtggccaa ggctggagtc 420tactatgtct
tctttcaact agagctgcgg cgcgtggtgg ccggcgaggg ctcaggctcc
480gtttcacttg cgctgcacct gcagccactg cgctctgctg ctggggccgc
cgccctggct 540ttgaccgtgg acctgccacc cgcctcctcc gaggctcgga
actcggcctt cggtttccag 600ggccgcttgc tgcacctgag tgccggccag
cgcctgggcg tccatcttca cactgaggcc 660agggcacgcc atgcctggca
gcttacccag ggcgccacag tcttgggact cttccgggtg 720acccccgaaa
tcccagccgg actcccttca ccgaggtcgg aataa 7653223PRTArtificial
Sequenceamino acid seqeunce for membrane bound IL-21 (mbIL-21) 3Met
Ala Leu Pro Val Thr Ala Leu Leu Leu Pro Leu Ala Leu Leu Leu1 5 10
15His Ala Ala Arg Pro Gln Asp Arg His Met Ile Arg Met Arg Gln Leu
20 25 30Ile Asp Ile Val Asp Gln Leu Lys Asn Tyr Val Asn Asp Leu Val
Pro 35 40 45Glu Phe Leu Pro Ala Pro Glu Asp Val Glu Thr Asn Cys Glu
Trp Ser 50 55 60Ala Phe Ser Cys Phe Gln Lys Ala Gln Leu Lys Ser Ala
Asn Thr Gly65 70 75 80Asn Asn Glu Arg Ile Ile Asn Val Ser Ile Lys
Lys Leu Lys Arg Lys 85 90 95Pro Pro Ser Thr Asn Ala Gly Arg Arg Gln
Lys His Arg Leu Thr Cys 100 105 110Pro Ser Cys Asp Ser Tyr Glu Lys
Lys Pro Pro Lys Glu Phe Leu Glu 115 120 125Arg Phe Lys Ser Leu Leu
Gln Lys Met Ile His Gln His Leu Ser Ser 130 135 140Arg Thr His Gly
Ser Glu Asp Ser Ala Lys Pro Thr Thr Thr Pro Ala145 150 155 160Pro
Arg Pro Pro Thr Pro Ala Pro Thr Ile Ala Ser Gln Pro Leu Ser 165 170
175Leu Arg Pro Glu Ala Cys Arg Pro Ala Ala Gly Gly Ala Val His Thr
180 185 190Arg Gly Leu Asp Phe Ala Cys Asp Ile Tyr Ile Trp Ala Pro
Leu Ala 195 200 205Gly Thr Cys Gly Val Leu Leu Leu Ser Leu Val Ile
Thr Leu Tyr 210 215 2204672DNAArtificial Sequencenucleotide
sequence of membrane bound IL-21 (mbIL-21) 4atggctctgc ccgtcaccgc
tctgctgctg cctctggccc tgctgctgca cgccgcaaga 60ccacaggacc gccacatgat
tcggatgagg cagctgatcg acattgtgga tcagctgaag 120aactacgtga
atgacctggt ccccgagttc ctgcccgctc ctgaggatgt cgaaacaaac
180tgcgaatggt ctgcattcag ttgttttcag aaggctcagc tgaaatctgc
aaacactgga 240aacaatgagc gaatcattaa tgtgagcatc aagaaactga
agcggaaacc cccttccact 300aatgcaggcc ggagacagaa gcaccgactg
acctgcccct catgtgacag ctatgaaaag 360aaaccaccca aagagttcct
ggagcggttc aagagcctgc tccagaaaat gatccaccag 420cacctgagca
gccggaccca cggcagcgag gattctgcca agcctaccac aactccagct
480ccccgccctc caacccctgc accaacaatt gccagtcagc ccctgtcact
gaggcctgaa 540gcatgccgcc cagccgctgg cggagcagtc cacacacgag
gcctggactt tgcttgtgat 600atctacattt gggcacctct ggctggaact
tgcggcgtcc tgctgctgtc cctggtcatc 660accctgtatt ga
6725183PRTArtificial Sequenceamino acid seqeunce for OX40L 5Met Glu
Arg Val Gln Pro Leu Glu Glu Asn Val Gly Asn Ala Ala Arg1 5 10 15Pro
Arg Phe Glu Arg Asn Lys Leu Leu Leu Val Ala Ser Val Ile Gln 20 25
30Gly Leu Gly Leu Leu Leu Cys Phe Thr Tyr Ile Cys Leu His Phe Ser
35 40 45Ala Leu Gln Val Ser His Arg Tyr Pro Arg Ile Gln Ser Ile Lys
Val 50 55 60Gln Phe Thr Glu Tyr Lys Lys Glu Lys Gly Phe Ile Leu Thr
Ser Gln65 70 75 80Lys Glu Asp Glu Ile Met Lys Val Gln Asn Asn Ser
Val Ile Ile Asn 85 90 95Cys Asp Gly Phe Tyr Leu Ile Ser Leu Lys Gly
Tyr Phe Ser Gln Glu 100 105 110Val Asn Ile Ser Leu His Tyr Gln Lys
Asp Glu Glu Pro Leu Phe Gln 115 120 125Leu Lys Lys Val Arg Ser Val
Asn Ser Leu Met Val Ala Ser Leu Thr 130 135 140Tyr Lys Asp Lys Val
Tyr Leu Asn Val Thr Thr Asp Asn Thr Ser Leu145 150 155 160Asp Asp
Phe His Val Asn Gly Gly Glu Leu Ile Leu Ile His Gln Asn 165 170
175Pro Gly Glu Phe Cys Val Leu 1806552DNAArtificial
Sequencenucleotide sequence of OX40L 6atggaacggg tgcaacctct
ggaggagaat gtgggcaatg cagcccggcc aagatttgag 60aggaacaagc tactgctggt
ggcctctgtg atacagggac tggggctcct cctgtgcttc 120acctacatct
gcctgcactt cagcgctctt caggtgtcac accggtatcc ccgcatacaa
180agtatcaagg tccagtttac cgagtataag aaagagaagg gtttcatcct
cactagtcag 240aaggaggatg aaatcatgaa ggtgcagaac aactcagtta
ttattaactg tgacggcttt 300tatctgatca gcctgaaggg ctacttctcc
caggaagtaa acatcagcct gcattaccag 360aaggatgagg agcccctgtt
tcagctgaag aaggtccggt ccgtgaactc ccttatggtc 420gcctctctga
cgtacaagga caaggtgtac ctcaatgtga ccacagacaa tacatccctg
480gatgacttcc atgtgaatgg cggagaactg attctgattc accagaaccc
tggggagttc 540tgtgtcttgt ga 5527705DNAHomo sapiens 7atgagcactg
aaagcatgat ccgggacgtg gagctggccg aggaggcgct ccccaagaag 60acaggggggc
cccagggctc caggcggtgc ttgttcctca gcctcttctc cttcctgatc
120gtggcaggcg ccaccacgct cttctgcctg ctgcactttg gagtgatcgg
cccccagagg 180gaagagttcc ccagggacct ctctctaatc agccctctgg
cccaggcagt cagatcatct 240tctcgaaccc cgagtgacaa gcctgtagcc
catgttgtag caaaccctca agctgagggg 300cagctccagt ggctgaaccg
ccgggccaat gccctcctgg ccaatggcgt ggagctgaga 360gataaccagc
tggtggtgcc atcagagggc ctgtacctca tctactccca ggtcctcttc
420aagggccaag gctgcccctc cacccatgtg ctcctcaccc acaccatcag
ccgcatcgcc 480gtctcctacc agaccaaggt caacctcctc tctgccatca
agagcccctg ccagagggag 540accccagagg gggctgaggc caagccctgg
tatgagccca tctatctggg aggggtcttc 600cagctggaga agggtgaccg
actcagcgct gagatcaatc ggcccgacta tctcgacttt 660gccgagtctg
ggcaggtcta ctttgggatc attgccctgt gagga 7058233PRTArtificial
Sequenceamino acid seqeunce for mutated TNF alpha (mTNF-a) 8Met Ser
Thr Glu Ser Met Ile Arg Asp Val Glu Leu Ala Glu Glu Ala1 5 10 15Leu
Pro Lys Lys Thr Gly Gly Pro Gln Gly Ser Arg Arg Cys Leu Phe 20 25
30Leu Ser Leu Phe Ser Phe Leu Ile Val Ala Gly Ala Thr Thr Leu Phe
35 40 45Cys Leu Leu His Phe Gly Val Ile Gly Pro Gln Arg Glu Glu Phe
Pro 50 55 60Arg Asp Leu Ser Leu Ile Ser Pro Leu Ala Gln Pro Val Arg
Ser Ser65 70 75 80Ser Arg Thr Pro Ser Asp Lys Pro Val Ala His Val
Val Ala Asn Pro 85 90 95Gln Ala Glu Gly Gln Leu Gln Trp Leu Asn Arg
Arg Ala Asn Ala Leu 100 105 110Leu Ala Asn Gly Val Glu Leu Arg Asp
Asn Gln Leu Val Val Pro Ser 115 120 125Glu Gly Leu Tyr Leu Ile Tyr
Ser Gln Val Leu Phe Lys Gly Gln Gly 130 135 140Cys Pro Ser Thr His
Val Leu Leu Thr His Thr Ile Ser Arg Ile Ala145 150 155 160Val Ser
Tyr Gln Thr Lys Val Asn Leu Leu Ser Ala Ile Lys Ser Pro 165 170
175Cys Gln Arg Glu Thr Pro Glu Gly Ala Glu Ala Lys Pro Trp Tyr Glu
180 185 190Pro Ile Tyr Leu Gly Gly Val Phe Gln Leu Glu Lys Gly Asp
Arg Leu 195 200 205Ser Ala Glu Ile Asn Arg Pro Asp Tyr Leu Asp Phe
Ala Glu Ser Gly 210 215 220Gln Val Tyr Phe Gly Ile Ile Ala Leu225
2309702DNAArtificial Sequencenucleotide sequence of mutated TNF
alpha (mTNF-a) 9atgagcactg aaagcatgat ccgggacgtg gagctggccg
aggaggcgct ccccaagaag 60acaggggggc cccagggctc caggcggtgc ttgttcctca
gcctcttctc cttcctgatc 120gtggcaggcg ccaccacgct cttctgcctg
ctgcactttg gagtgatcgg cccccagagg 180gaagagttcc ccagggacct
ctctctaatc agccctctgg cccagccggt cagatcatct 240tctcgaaccc
cgagtgacaa gcctgtagcc catgttgtag caaaccctca agctgagggg
300cagctccagt ggctgaaccg ccgggccaat gccctcctgg ccaatggcgt
ggagctgaga 360gataaccagc tggtggtgcc atcagagggc ctgtacctca
tctactccca ggtcctcttc 420aagggccaag gctgcccctc cacccatgtg
ctcctcaccc acaccatcag ccgcatcgcc 480gtctcctacc agaccaaggt
caacctcctc tctgccatca agagcccctg ccagagggag 540accccagagg
gggctgaggc caagccctgg tatgagccca tctatctggg aggggtcttc
600cagctggaga agggtgaccg actcagcgct gagatcaatc ggcccgacta
tctcgacttt 660gccgagtctg ggcaggtcta ctttgggatc attgccctgt ga
7021046DNAArtificial SequenceForward primer for 4-1BBL 10tctagagcta
gcgaattcgc caccatggaa tacgcctctg acgctt 461138DNAArtificial
SequenceReverse primer for 4-1BBL 11ttcgcggccg cggatcctta
ttccgacctc ggtgaagg 381240DNAArtificial SequenceForward primer for
mbIL-21 12tagagctagc gaattcgcca ccgccaccat ggctctgccc
401335DNAArtificial SequenceReverse primer for mbIL-21 13tcgcggccgc
ggatcctcaa tacagggtga tgacc 351438DNAArtificial SequenceForward
primer for OX40L 14tagagctagc gaattcgcca ccatggaacg ggtgcaac
381537DNAArtificial SequenceReverse primer for OX40L 15tcgcggccgc
ggatcctcac aagacacaga actcccc 371640DNAArtificial SequenceForward
primer for mTNF-a 16tagagctagc gaattcgcca ccgccaccat ggctctgccc
401734DNAArtificial SequenceReverse primer for mTNF-a 17tcgcggccgc
ggatcctcac agggcaatga tccc 34
D00000
D00001
D00002
D00003
D00004
D00005
D00006
D00007
D00008
D00009
D00010
D00011
D00012

D00013

D00014

D00015

D00016
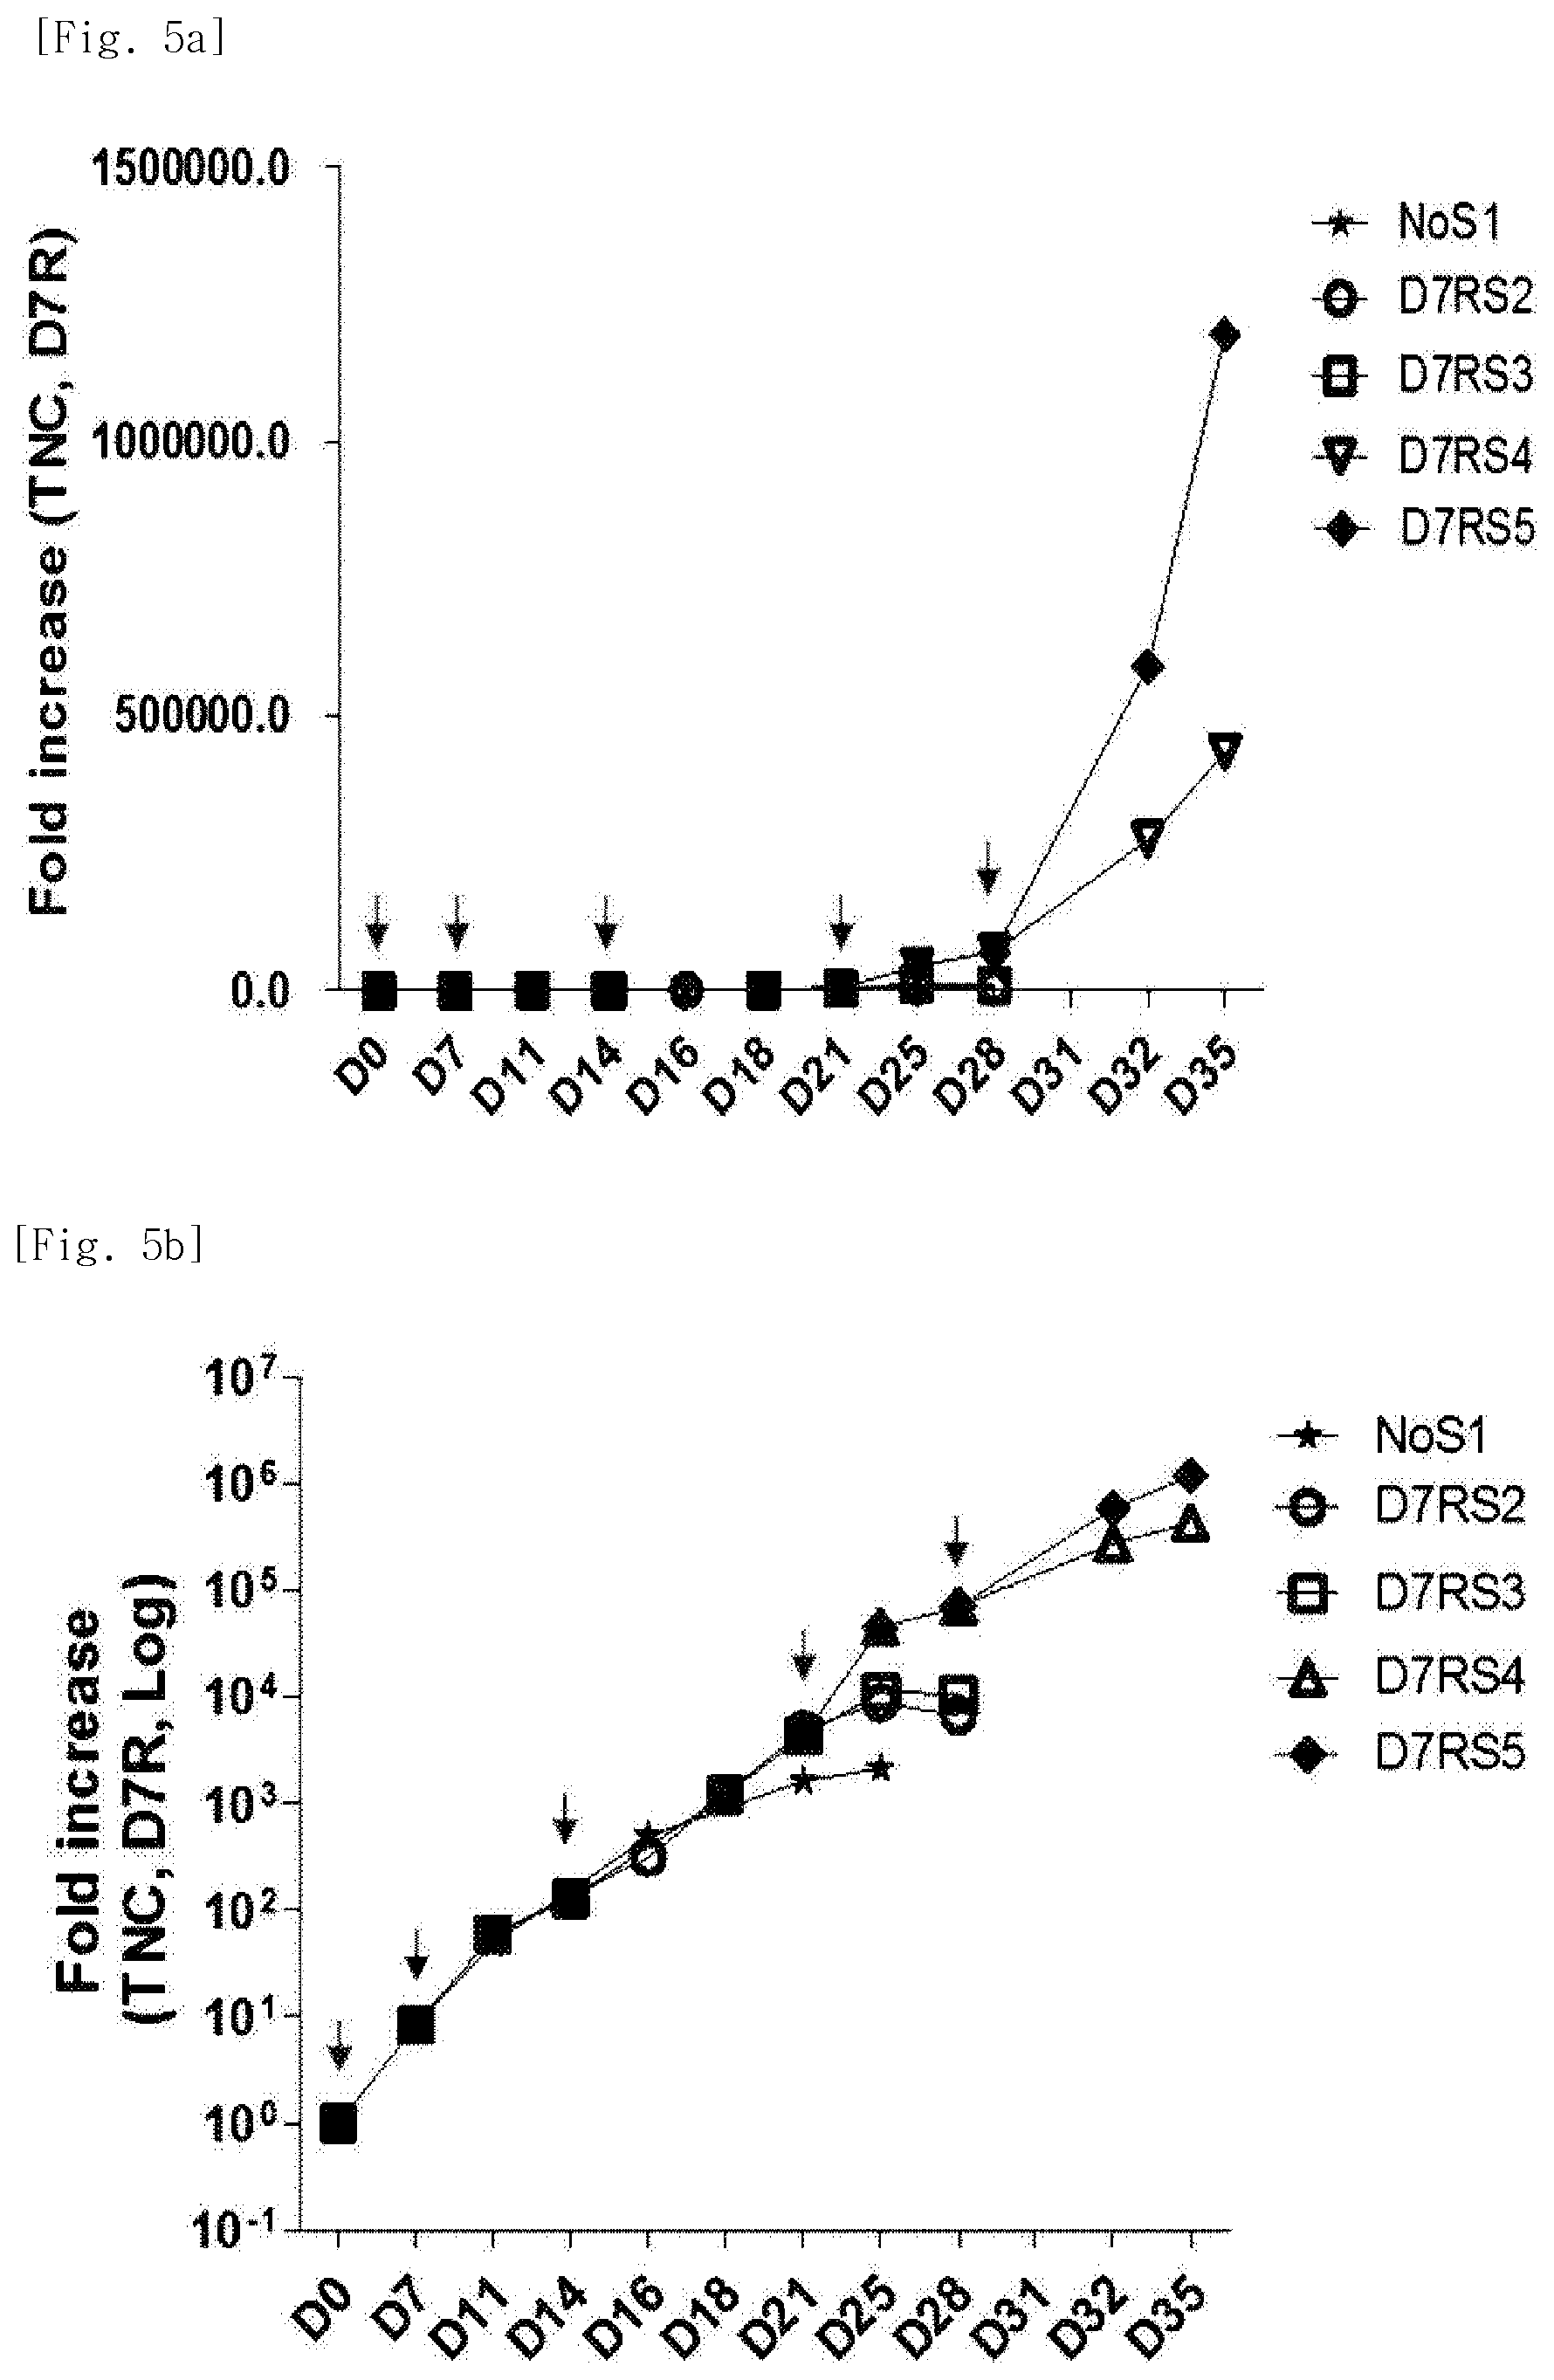
D00017

D00018
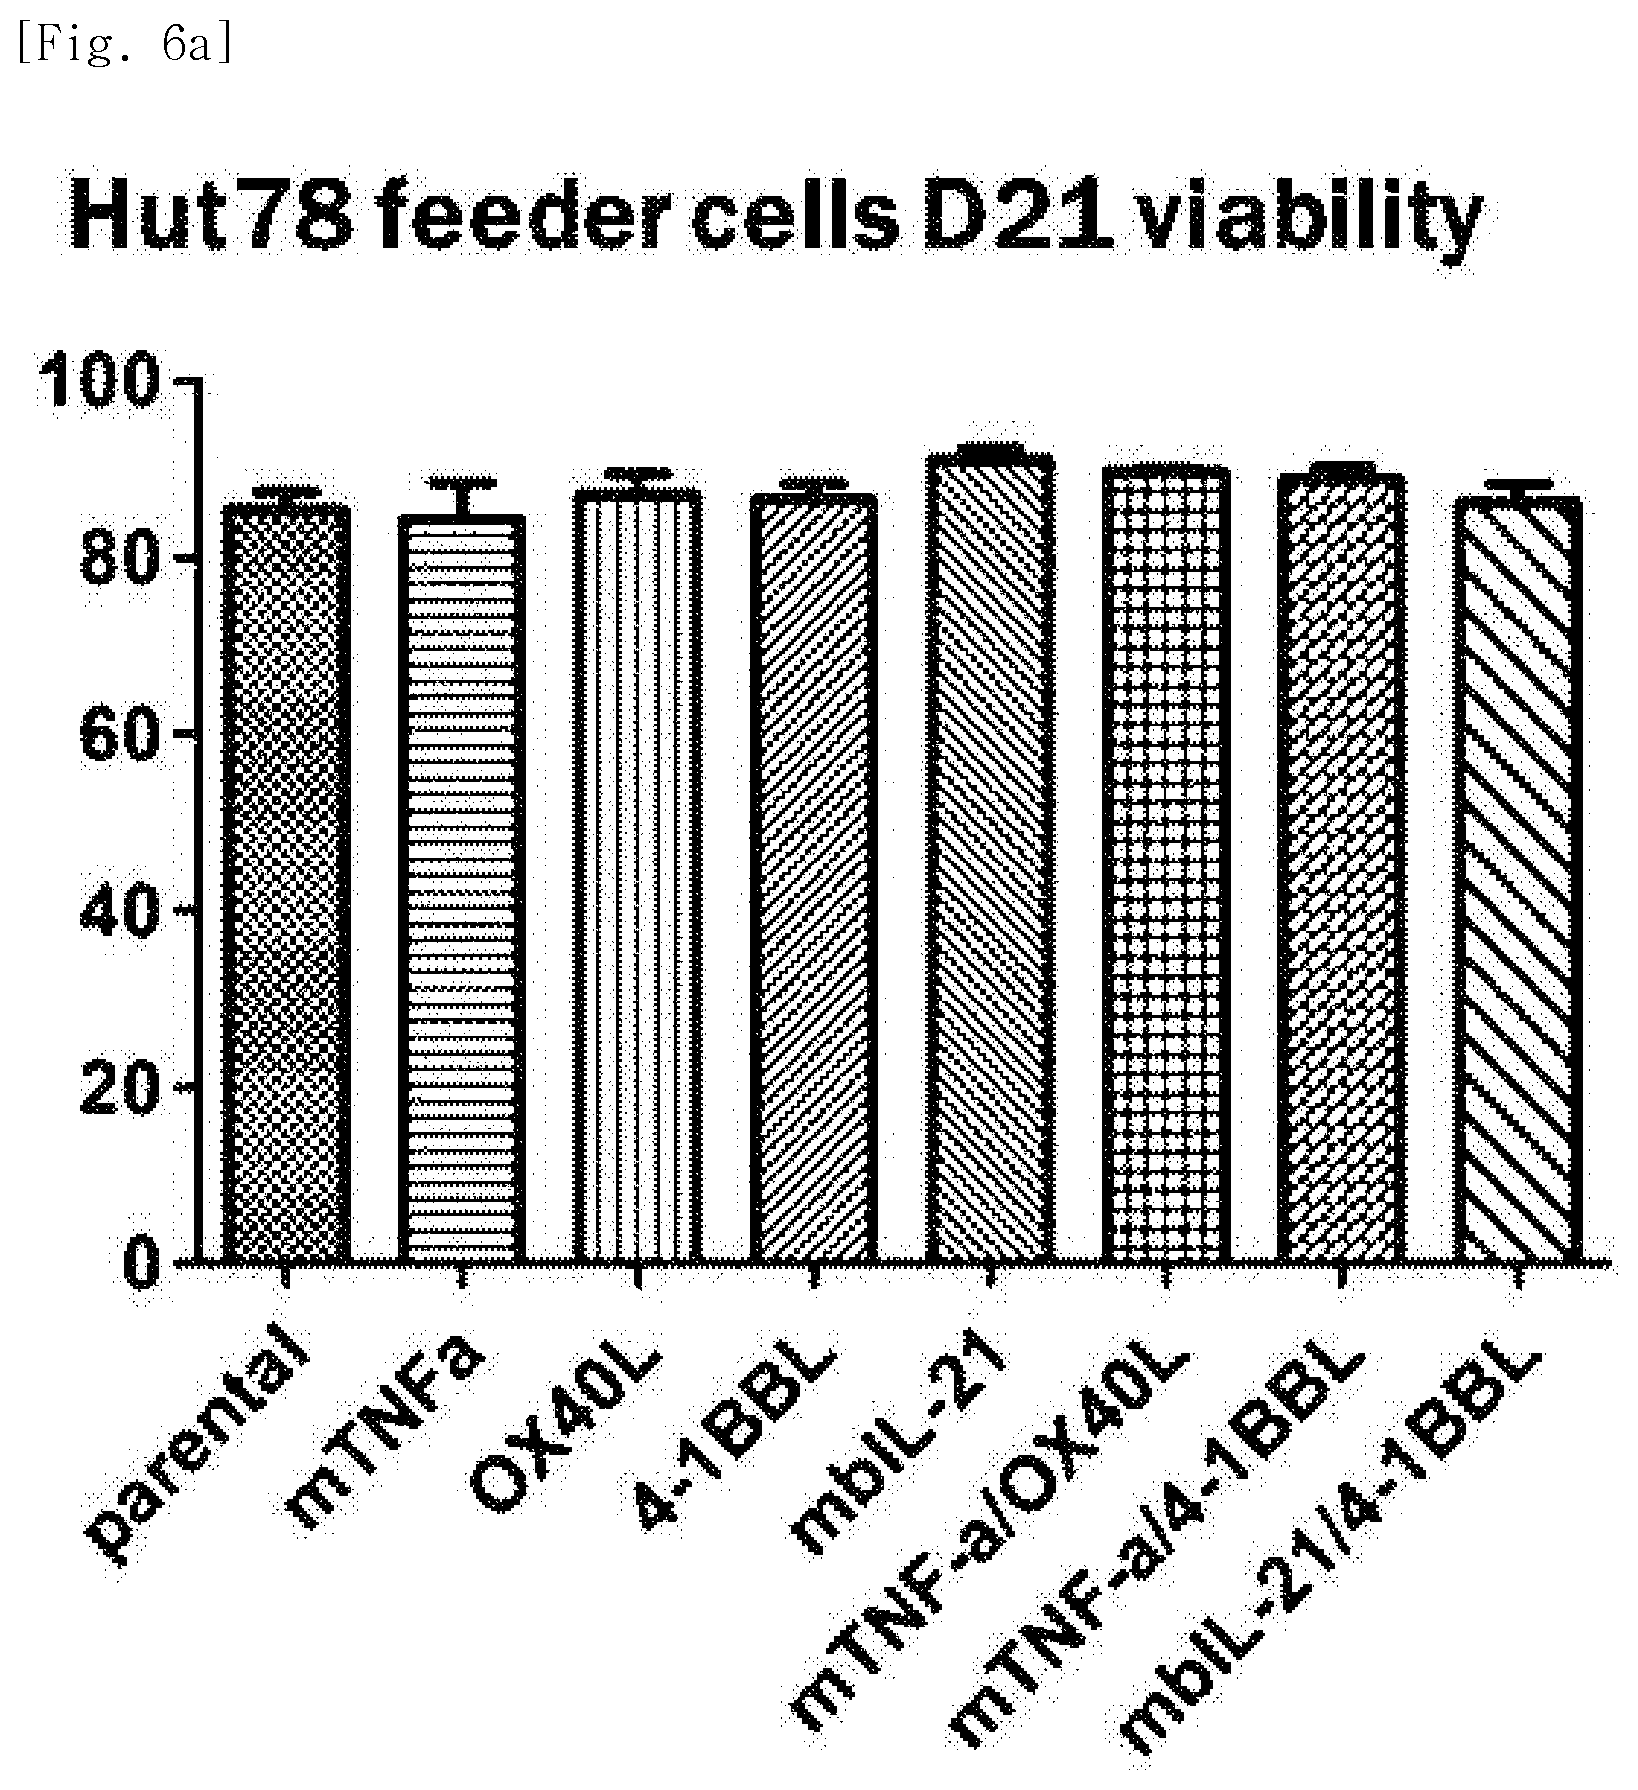
D00019
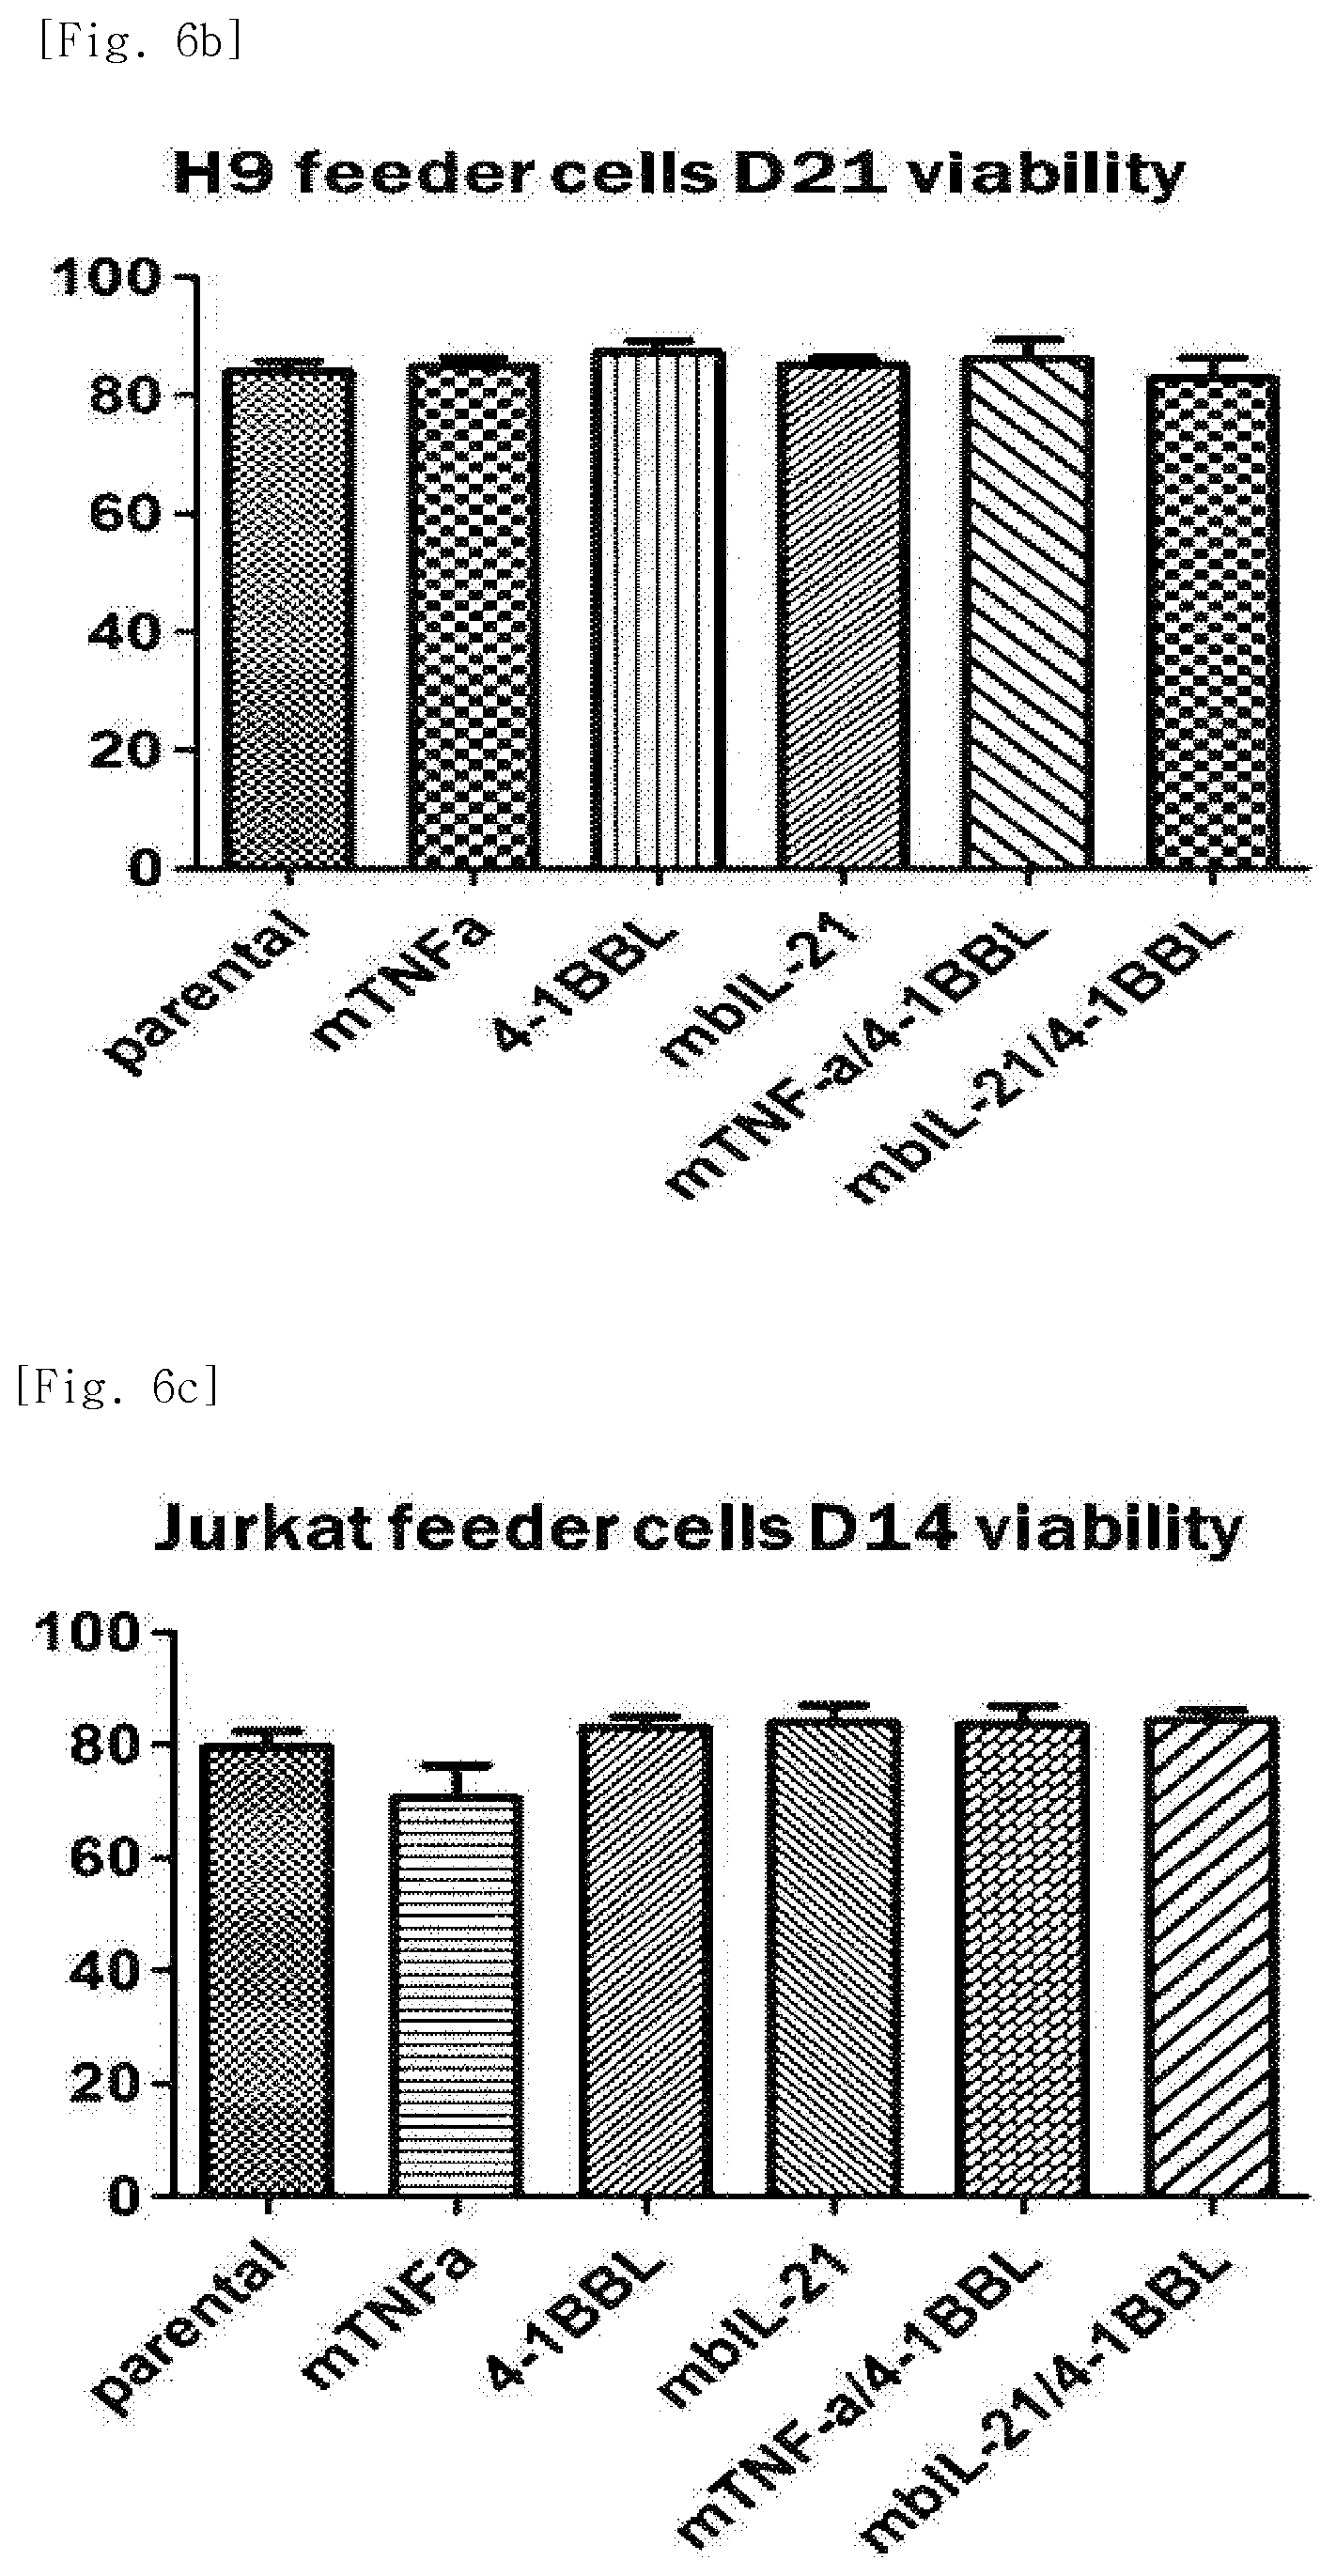
D00020

D00021
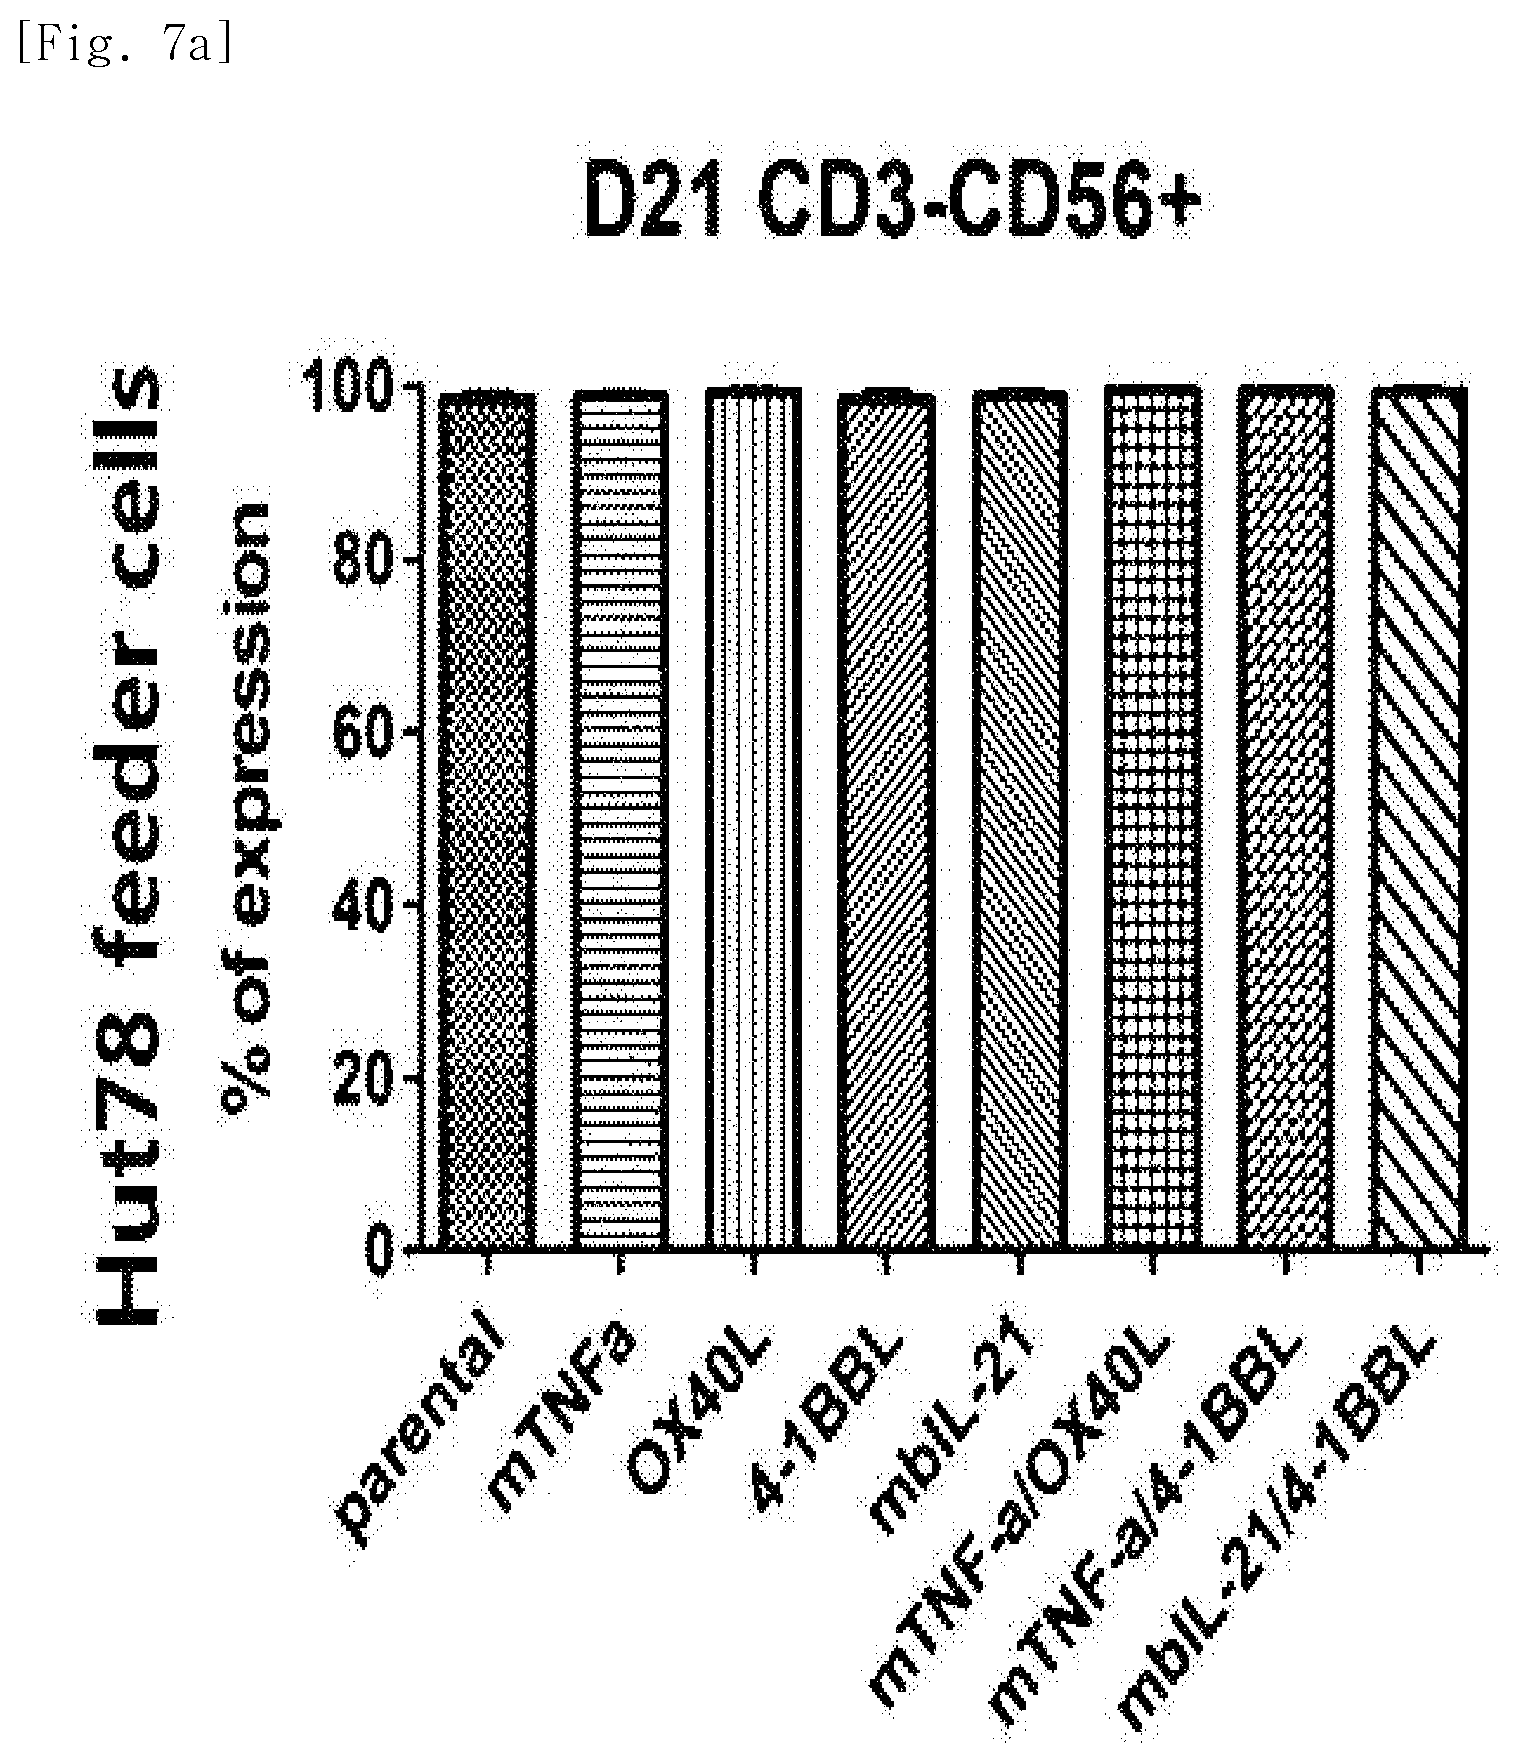
D00022

D00023
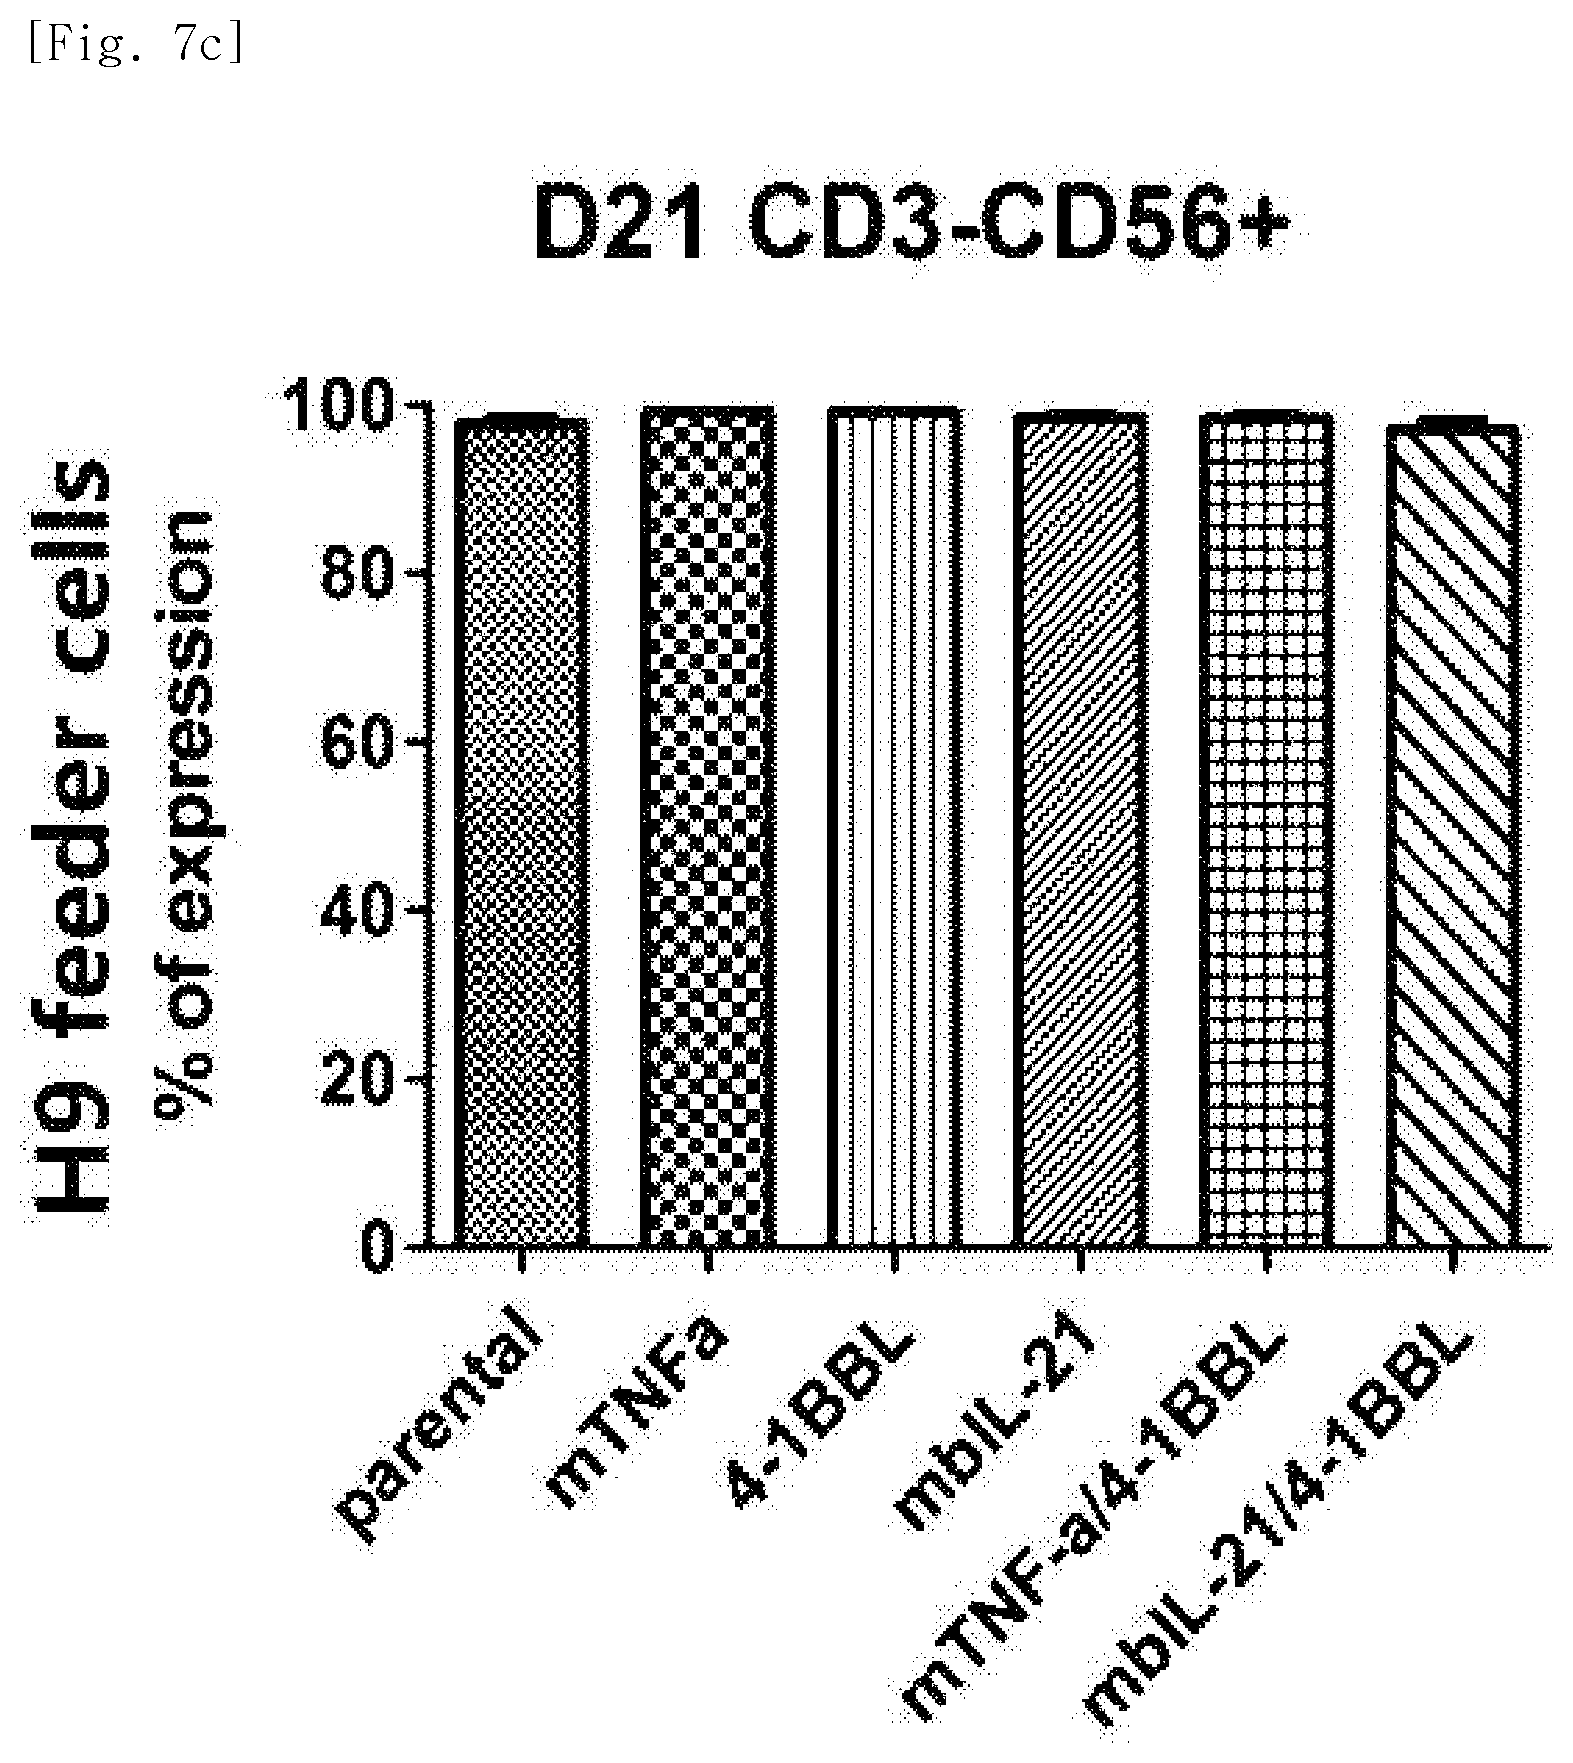
D00024

D00025

D00026

D00027

D00028
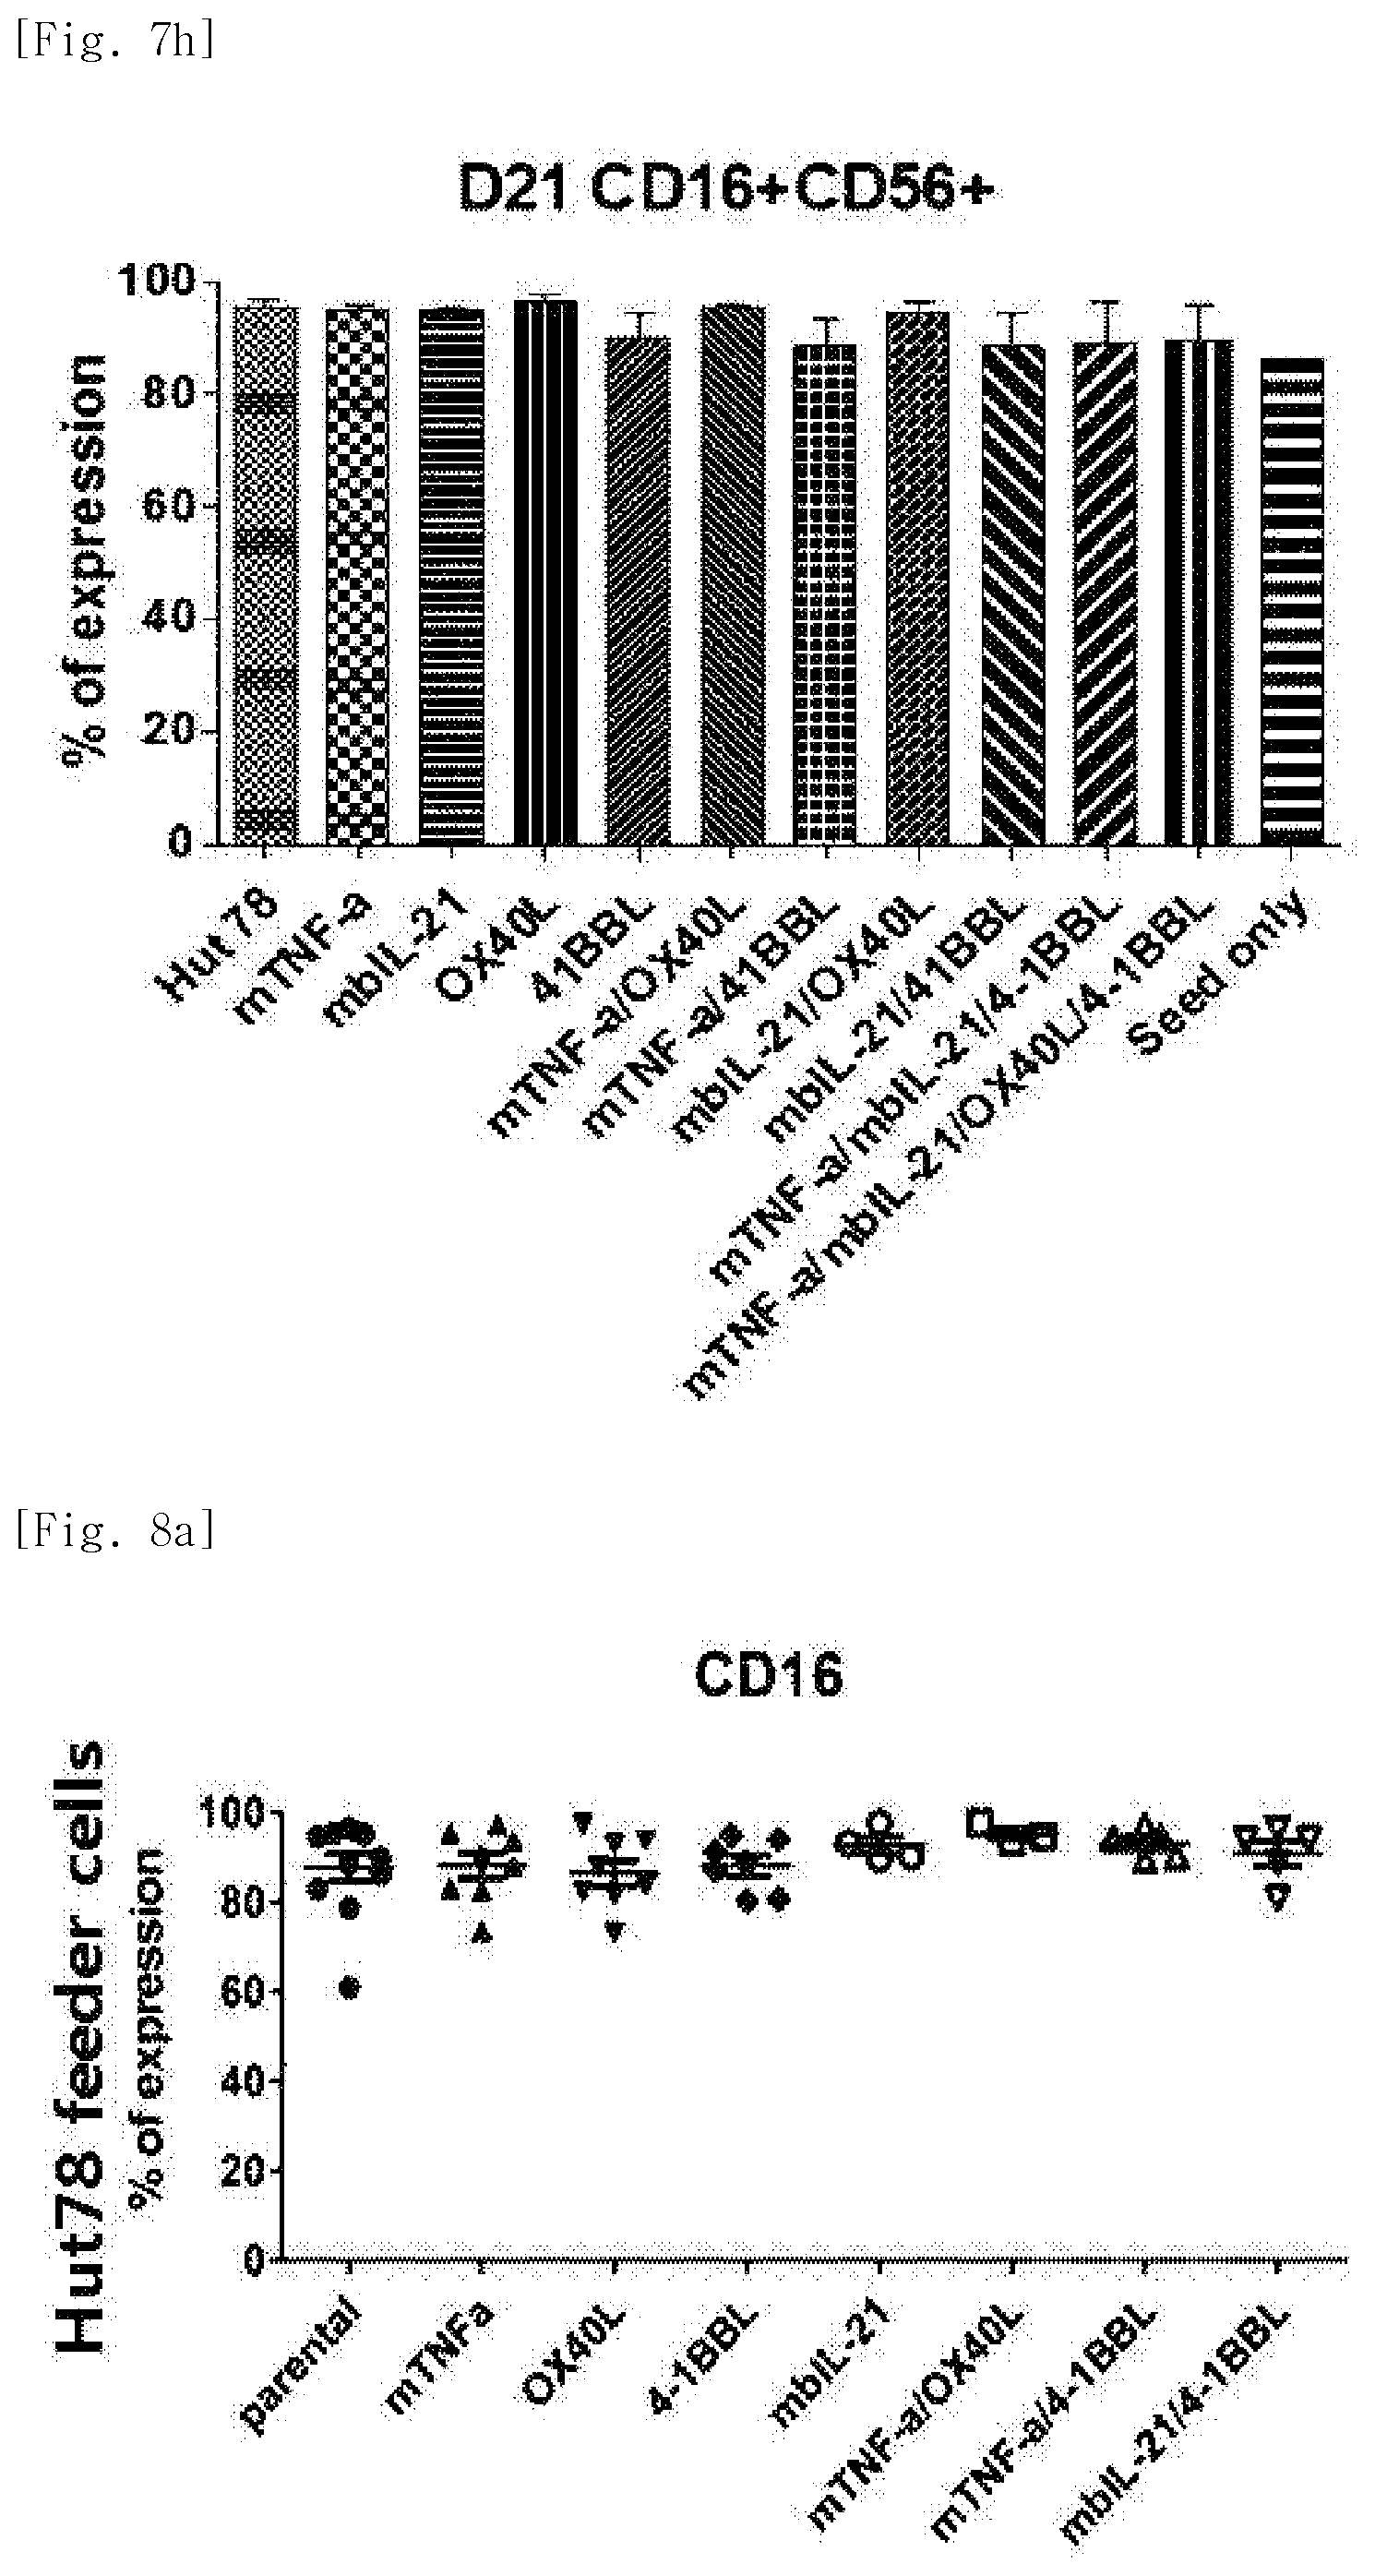
D00029

D00030

D00031
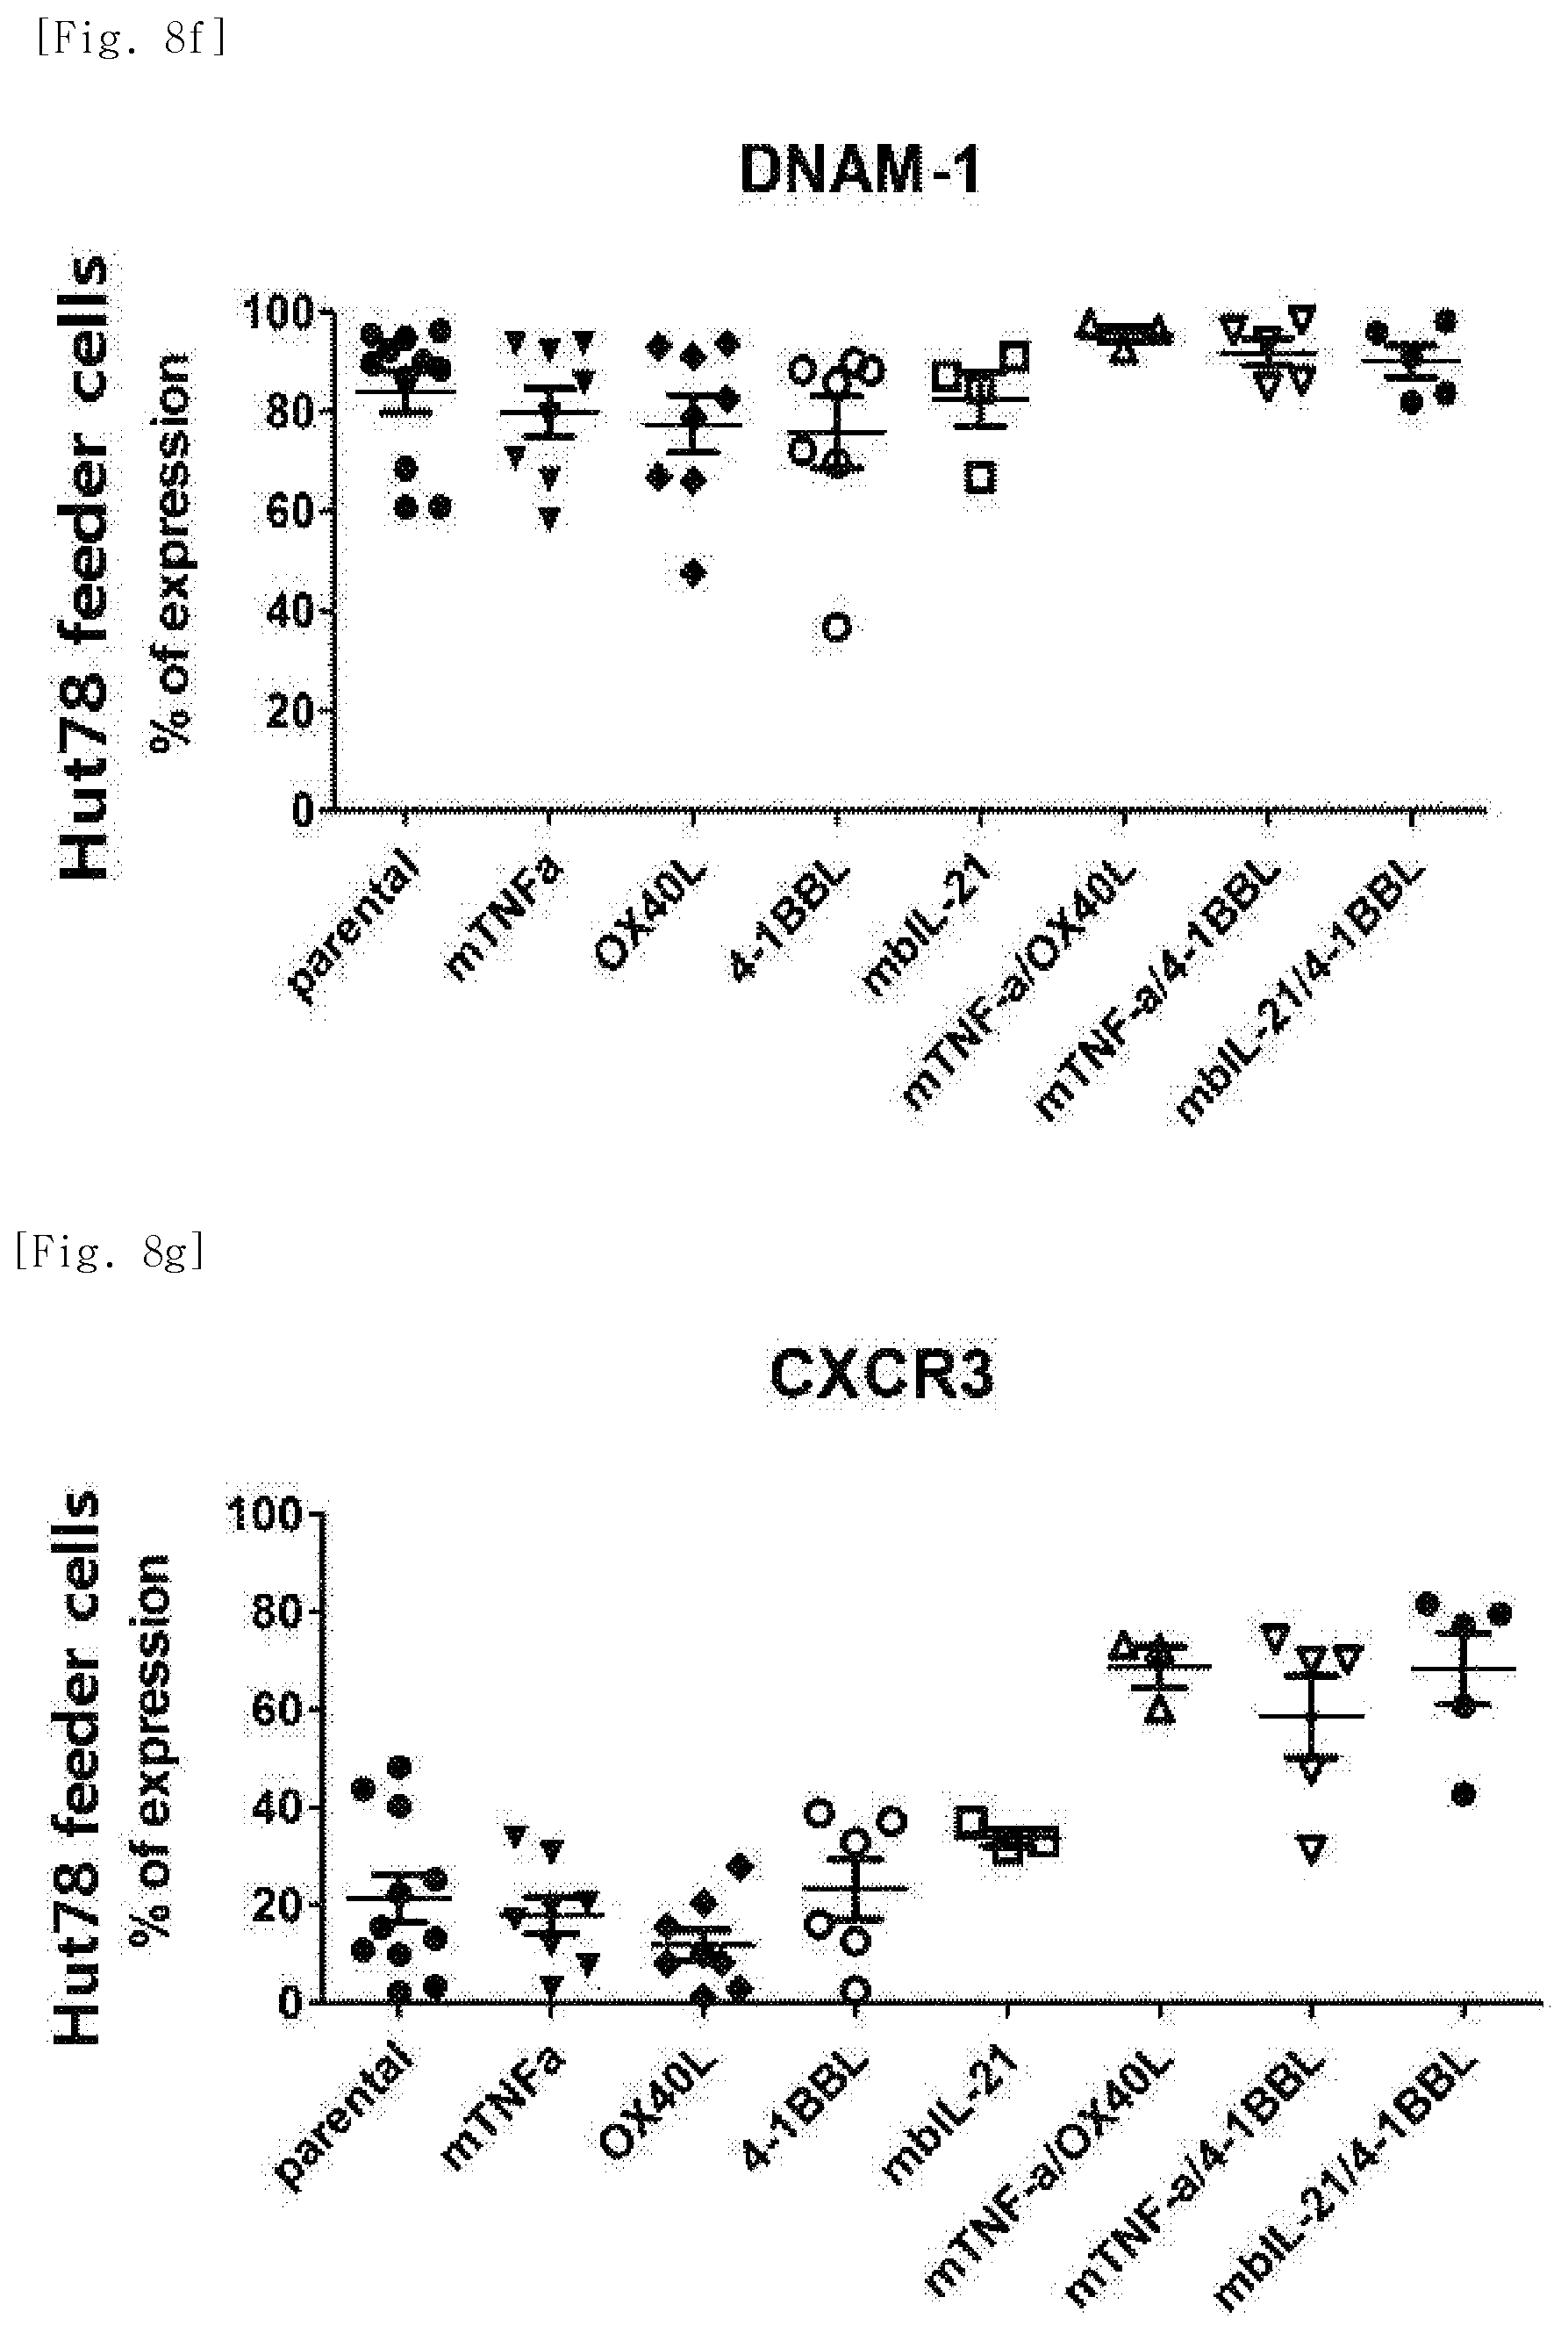
D00032

D00033

D00034

D00035

D00036

D00037

D00038

D00039
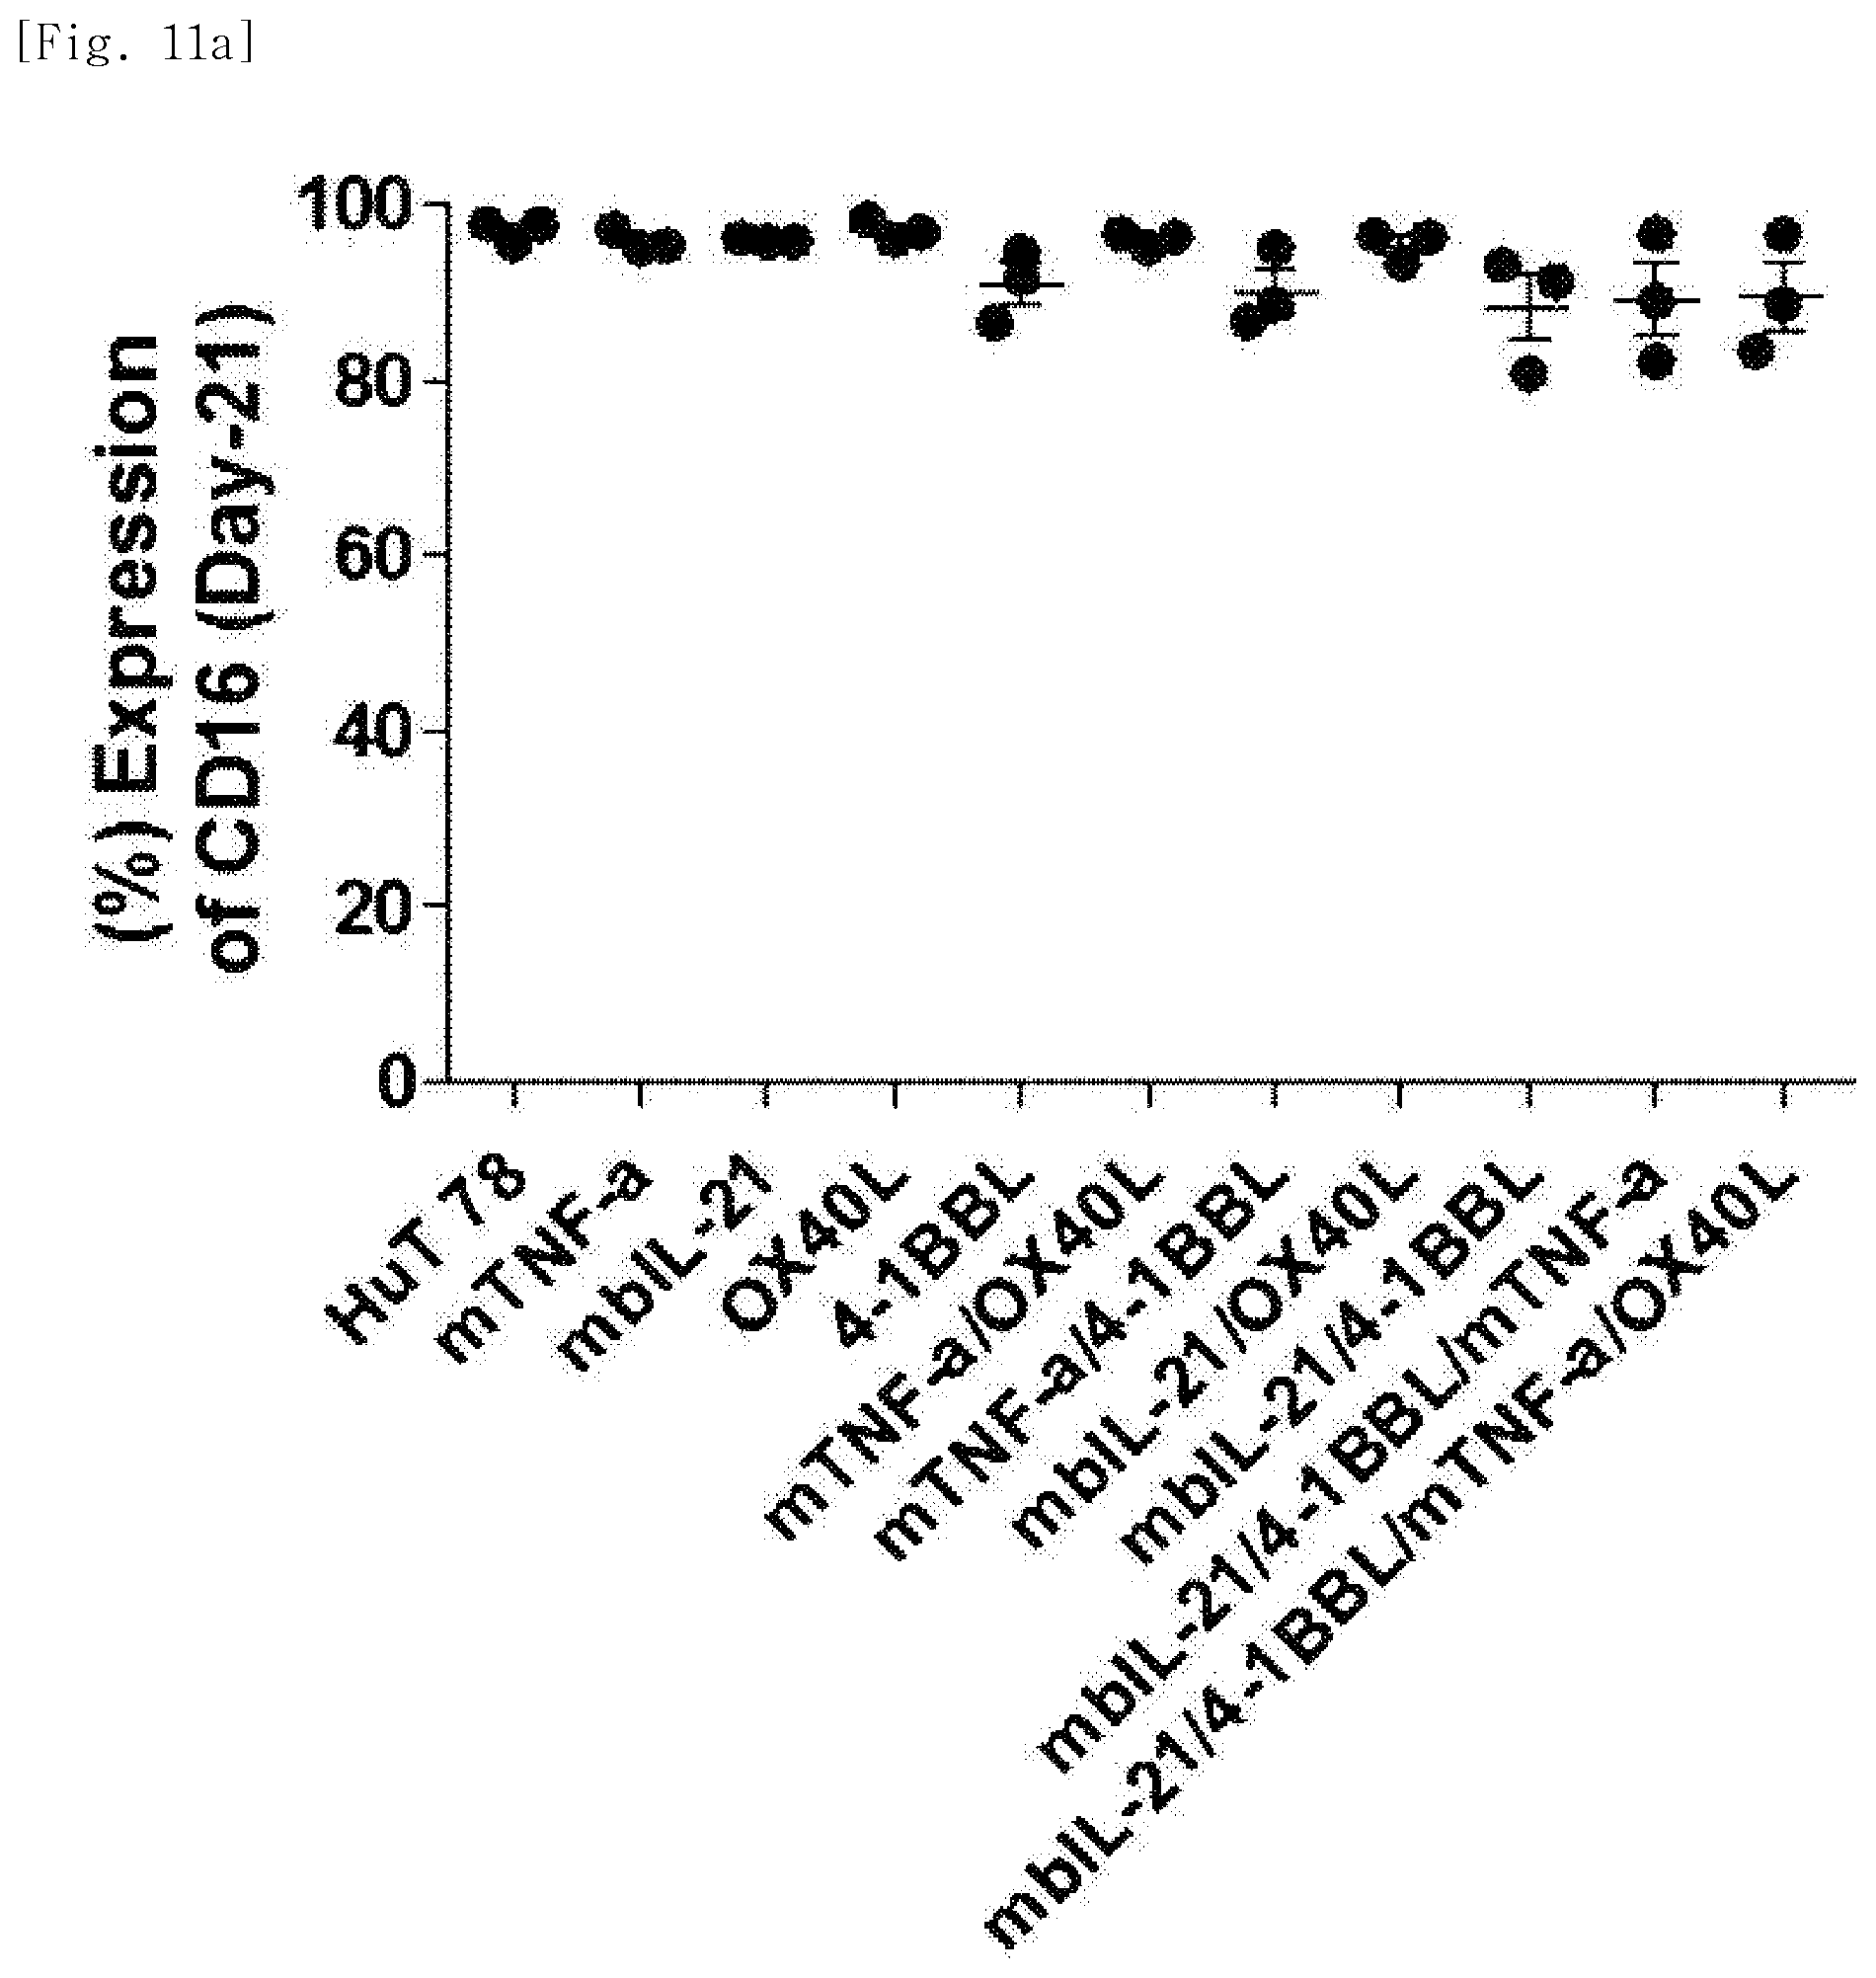
D00040

D00041

D00042

D00043
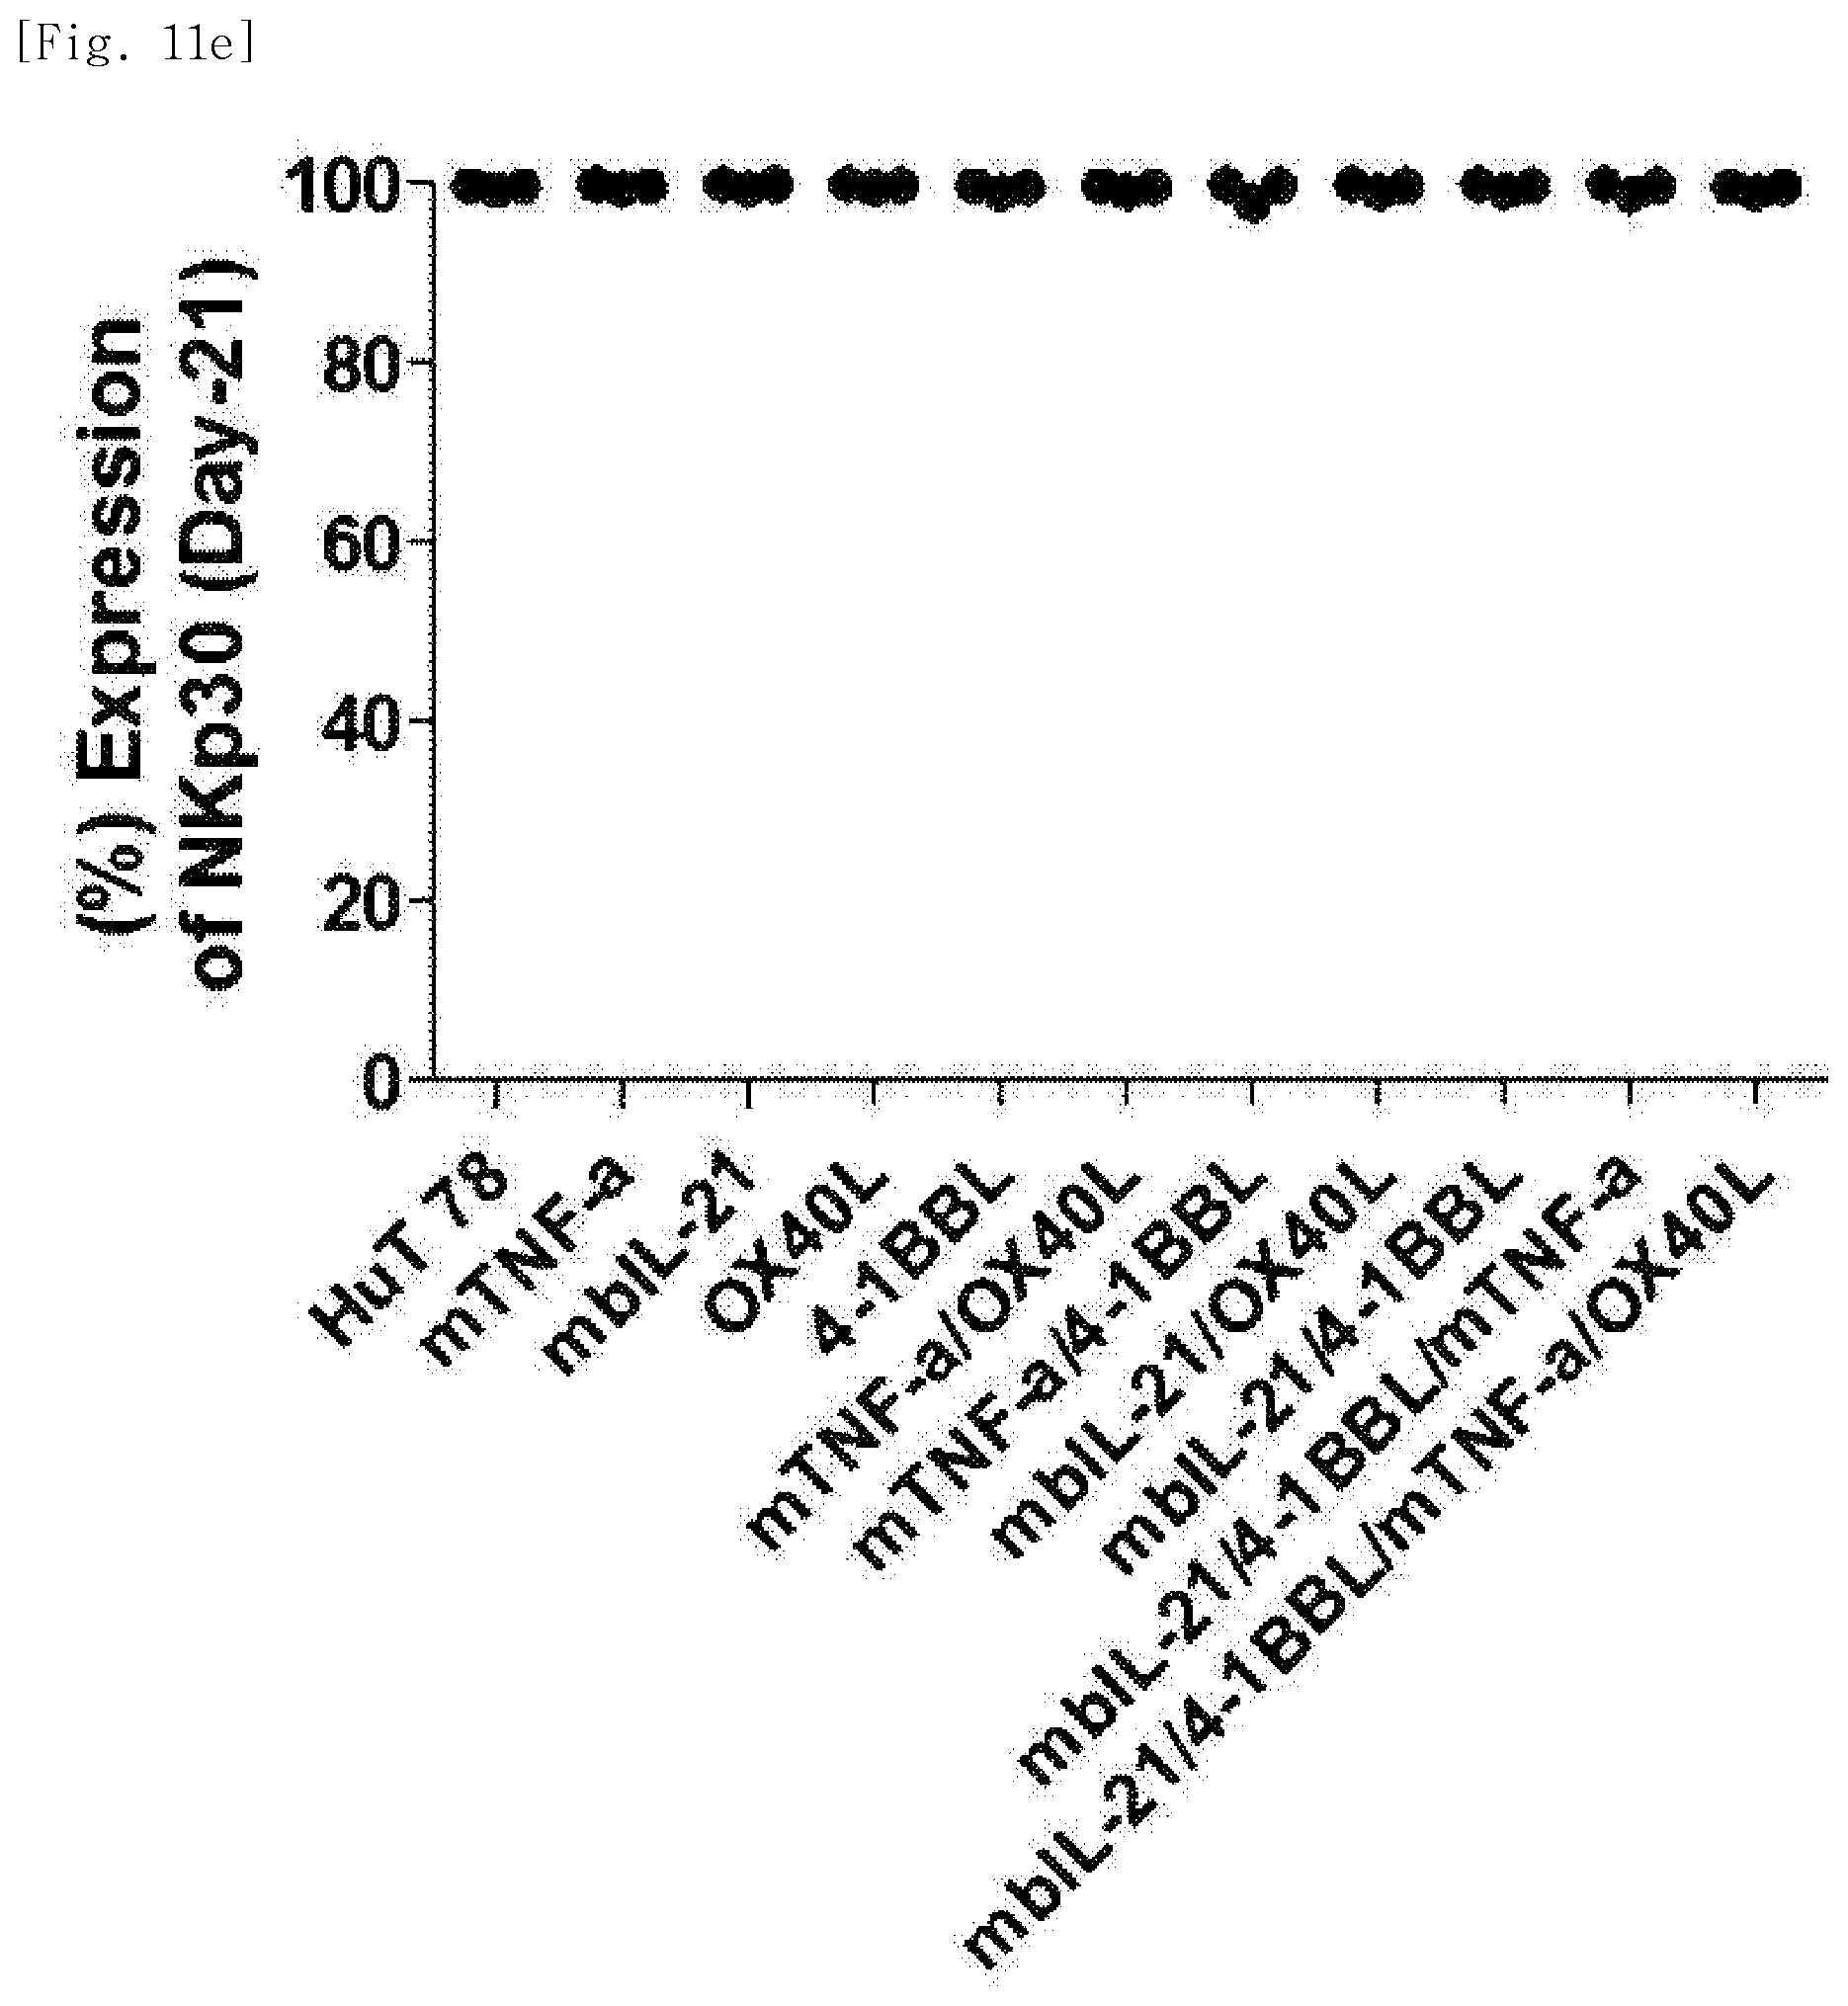
D00044

D00045

D00046

D00047

D00048

D00049

D00050

D00051

D00052

D00053

D00054

D00055

D00056

D00057
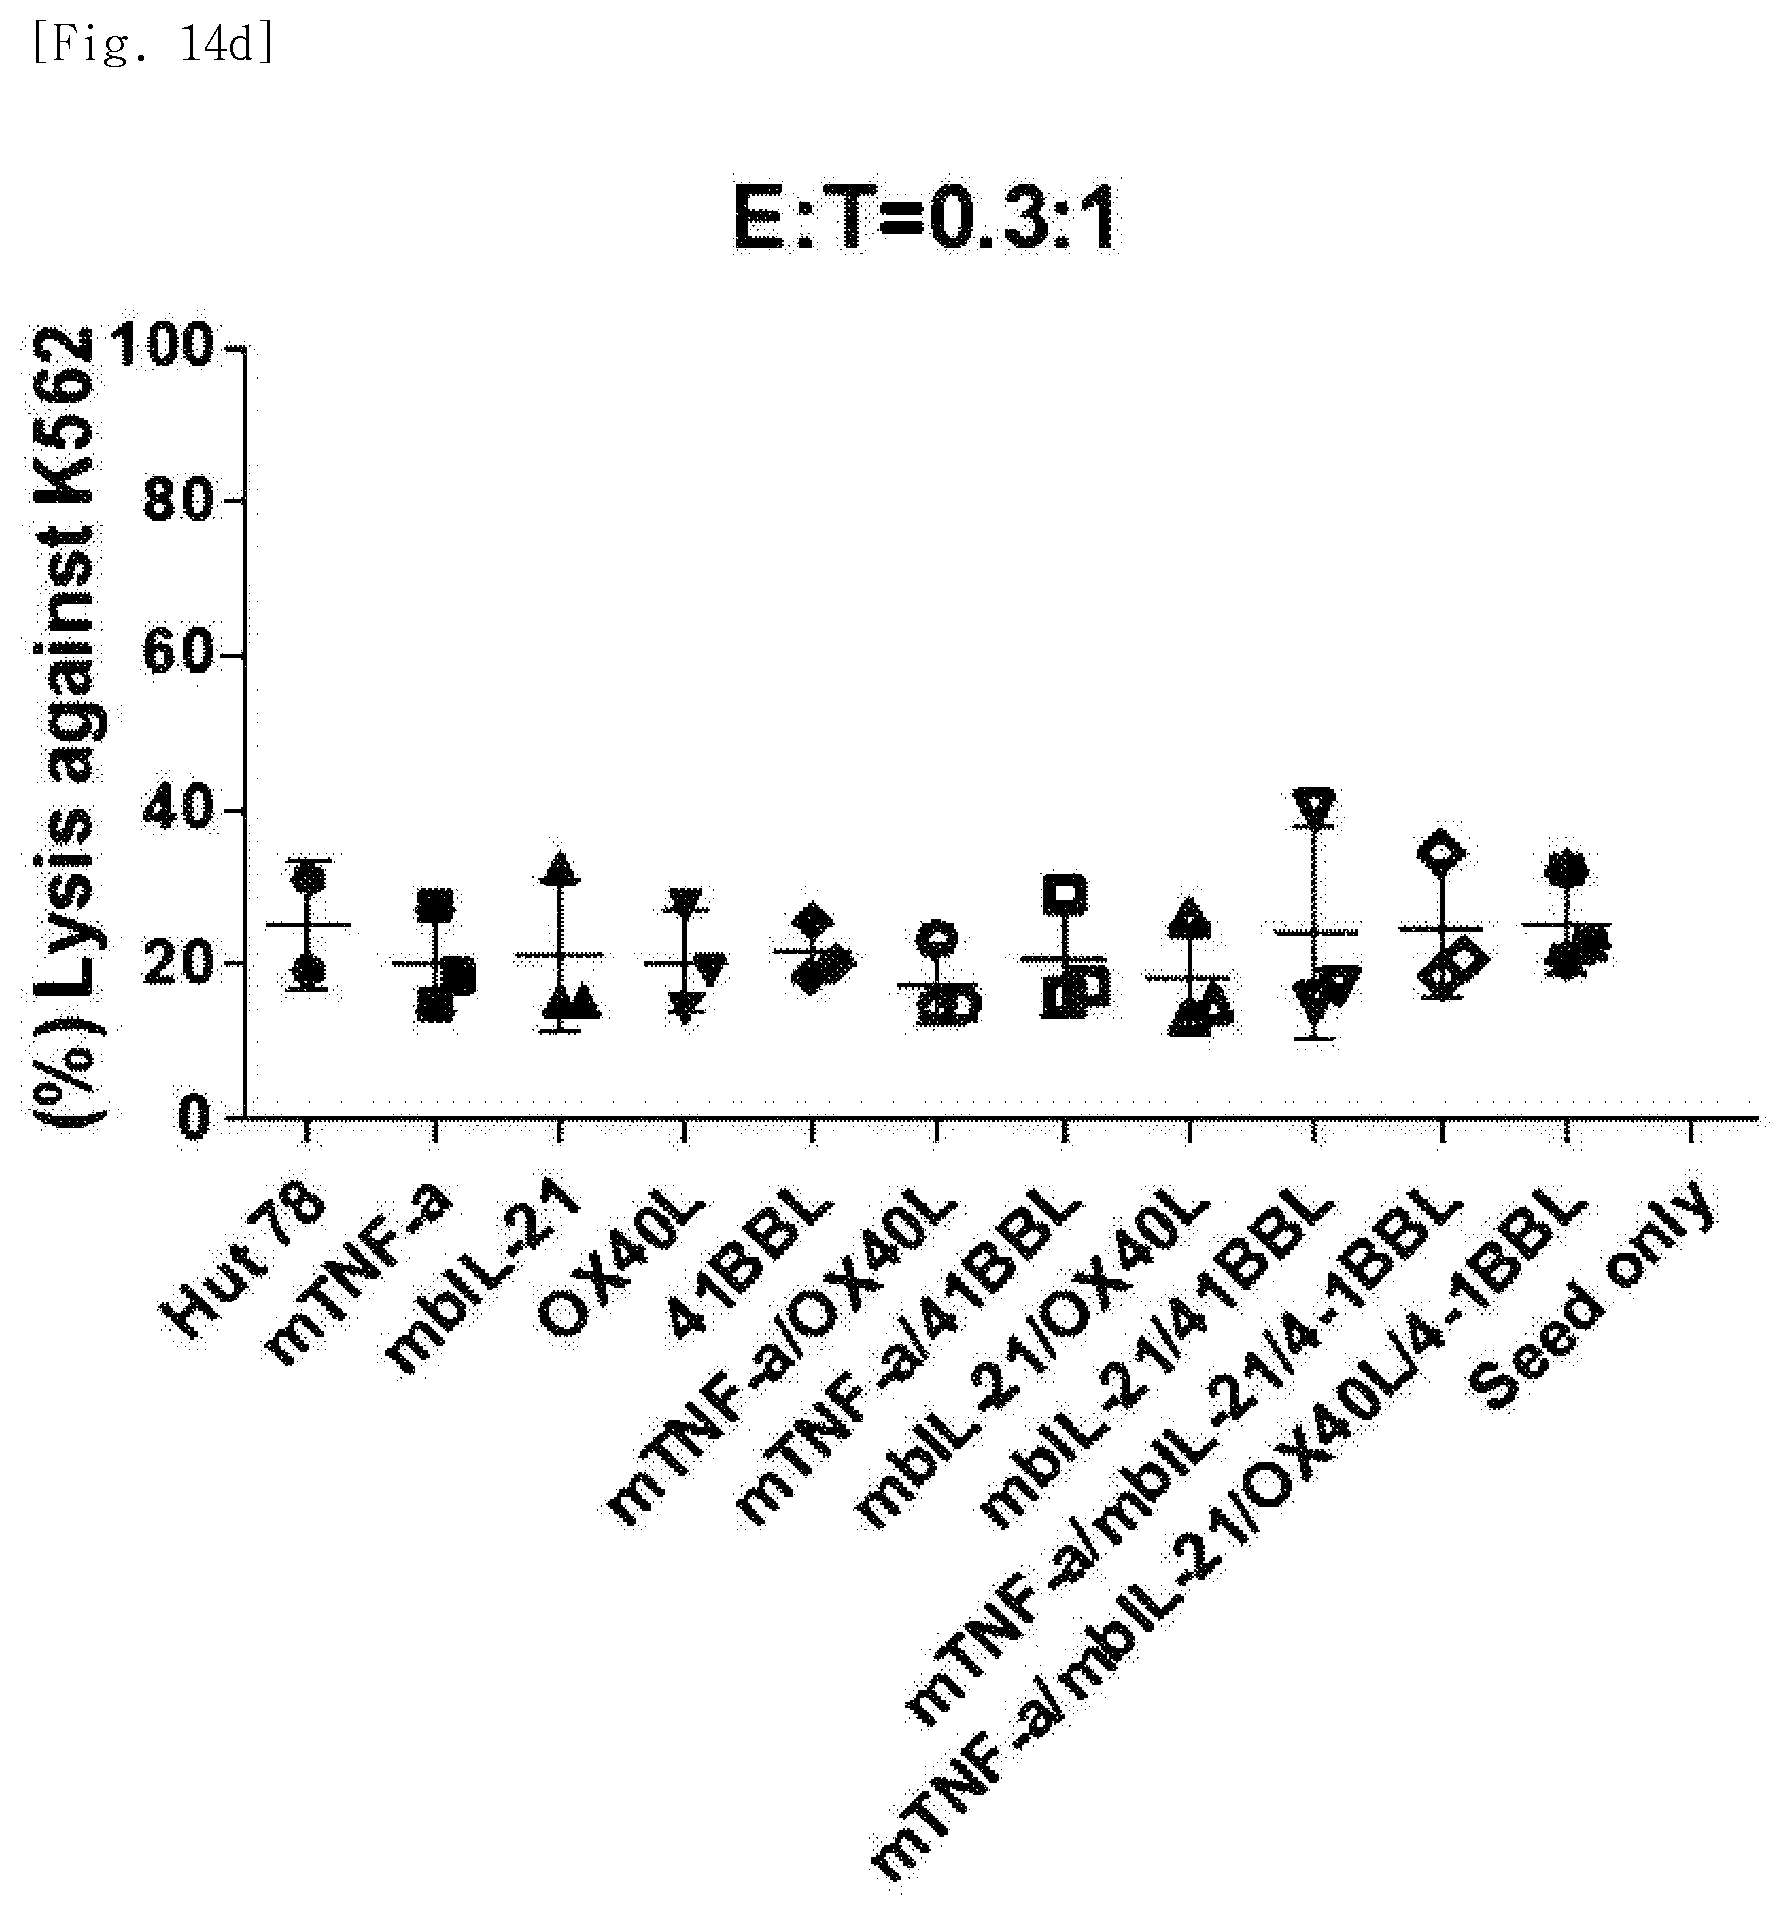
D00058

D00059

D00060
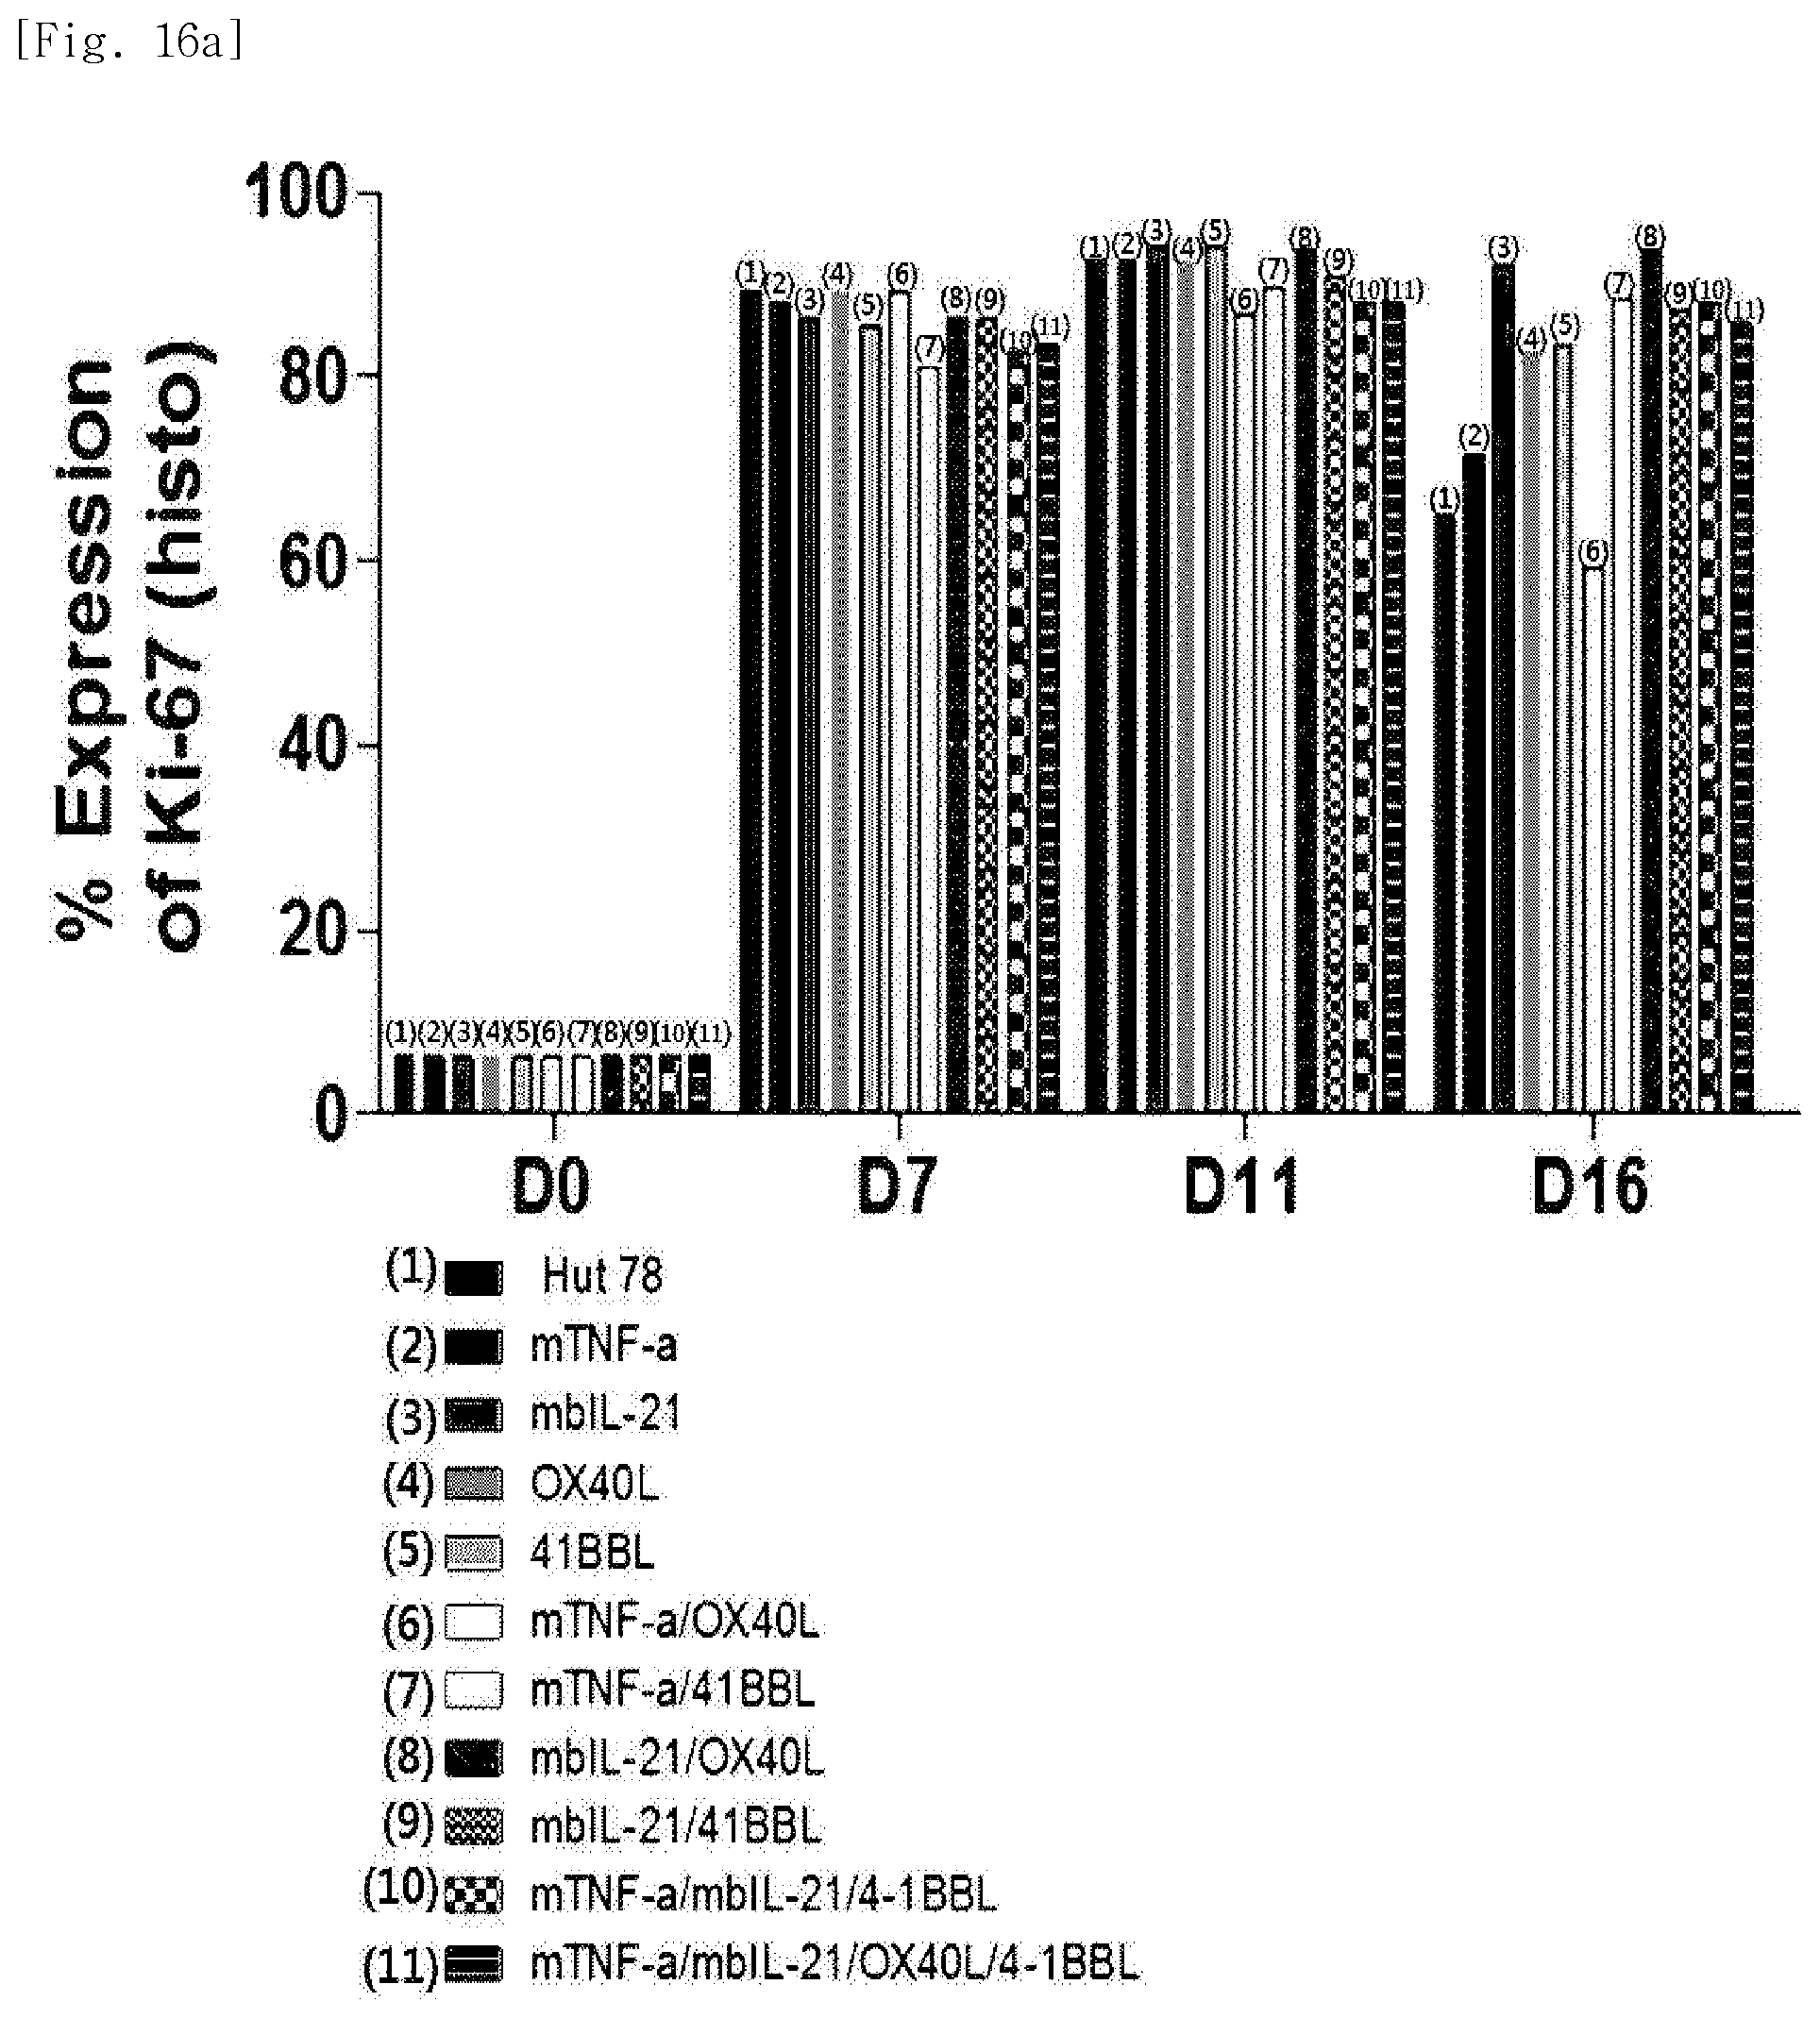
D00061

D00062

D00063

D00064

D00065

D00066
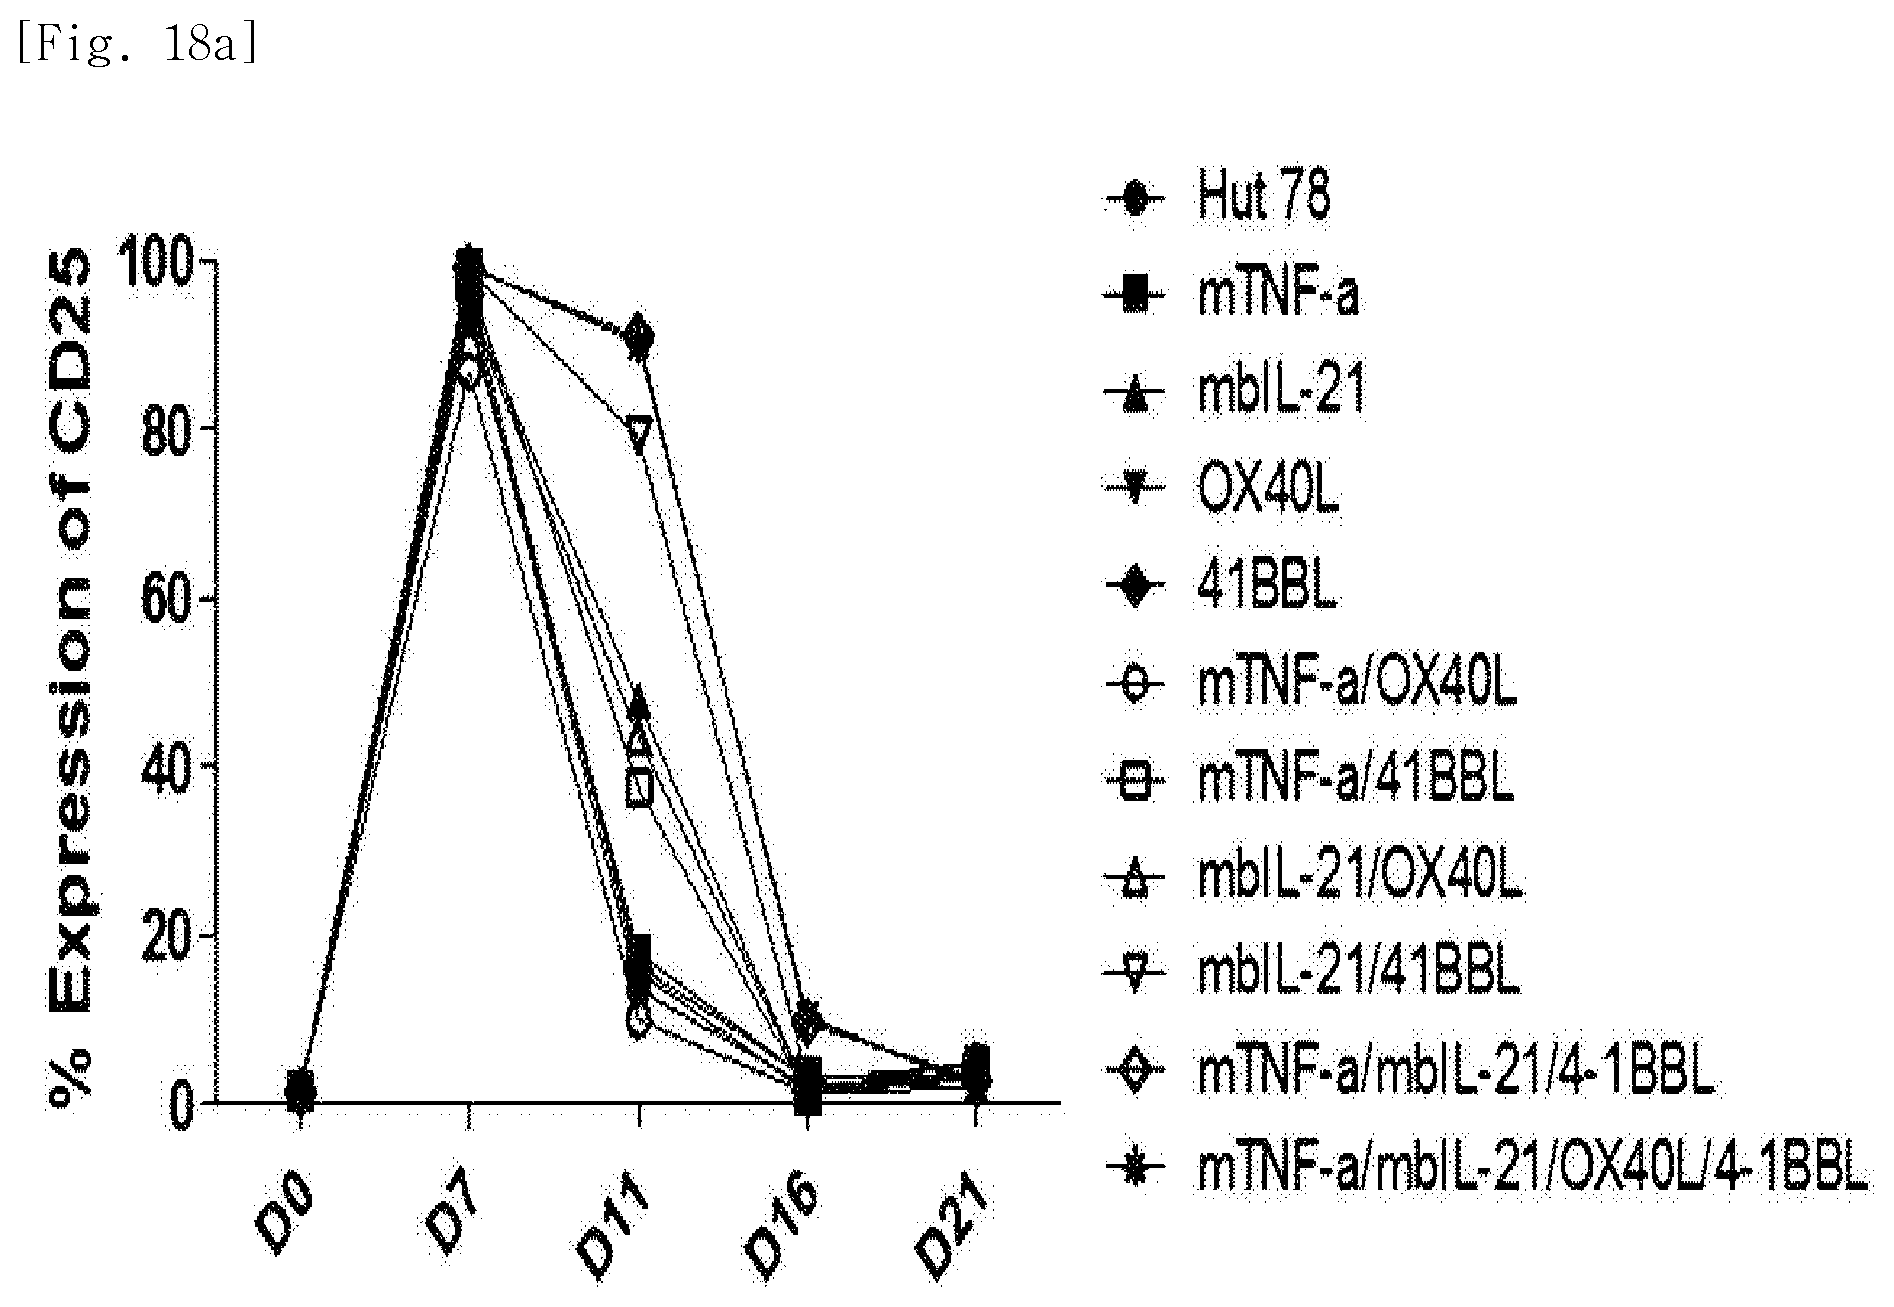
D00067
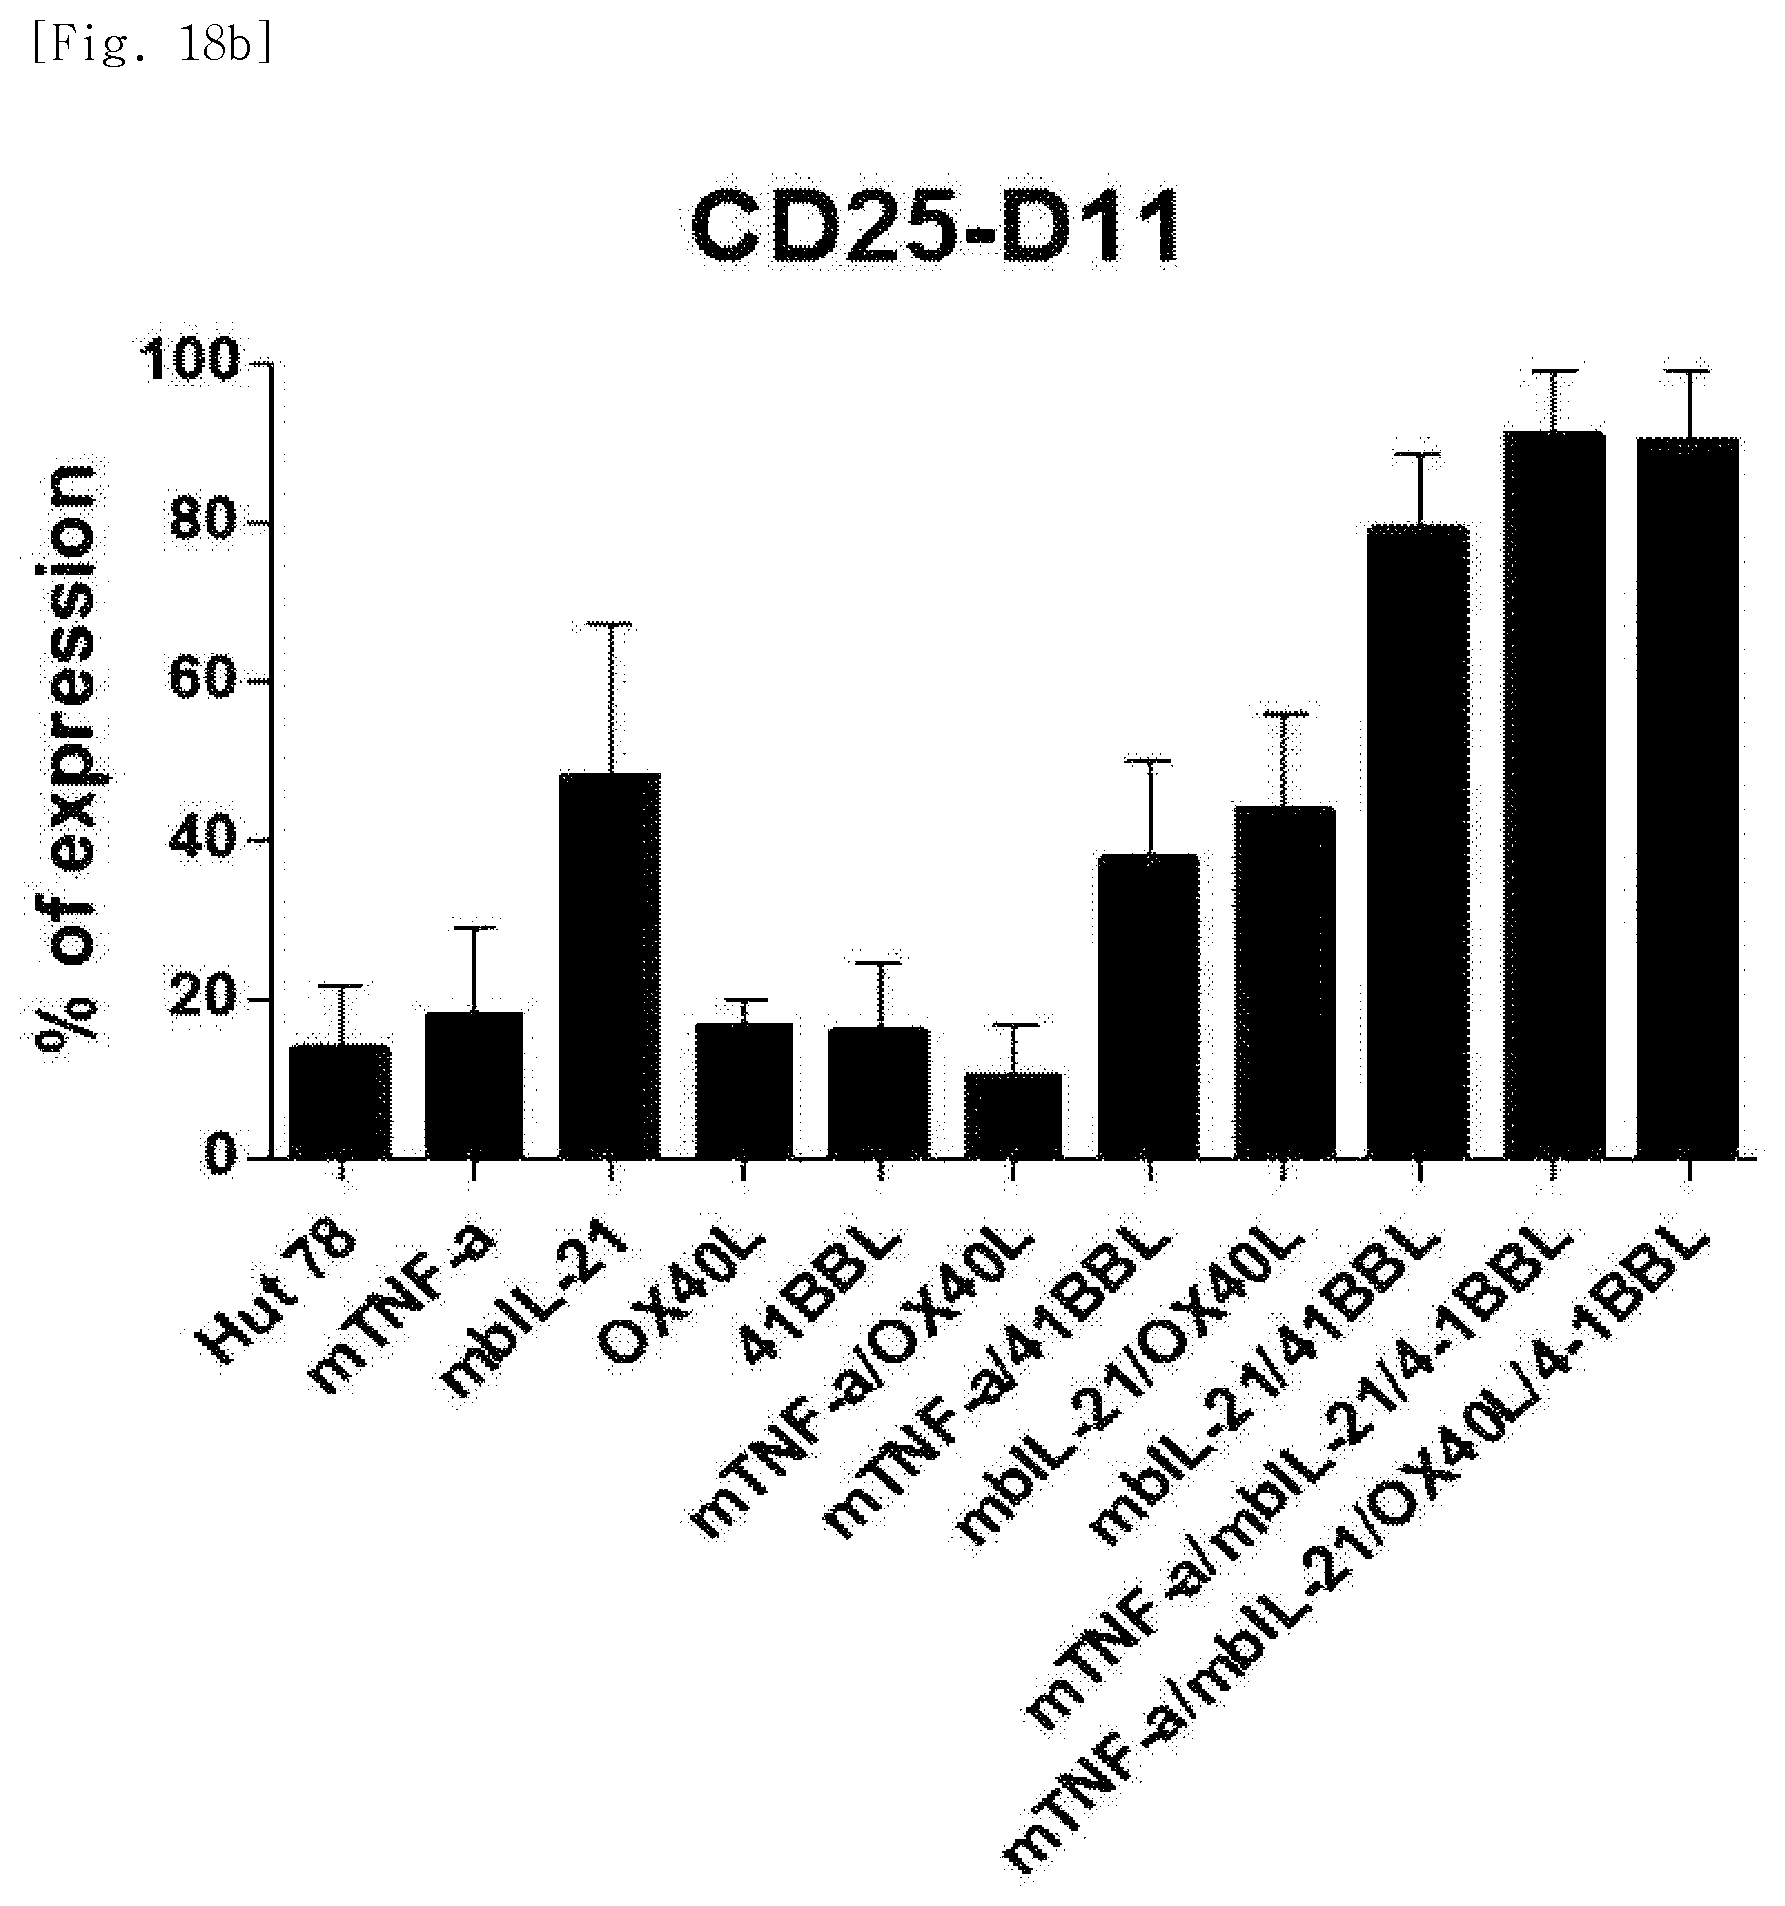
D00068

D00069

D00070

D00071

D00072

D00073

D00074

D00075
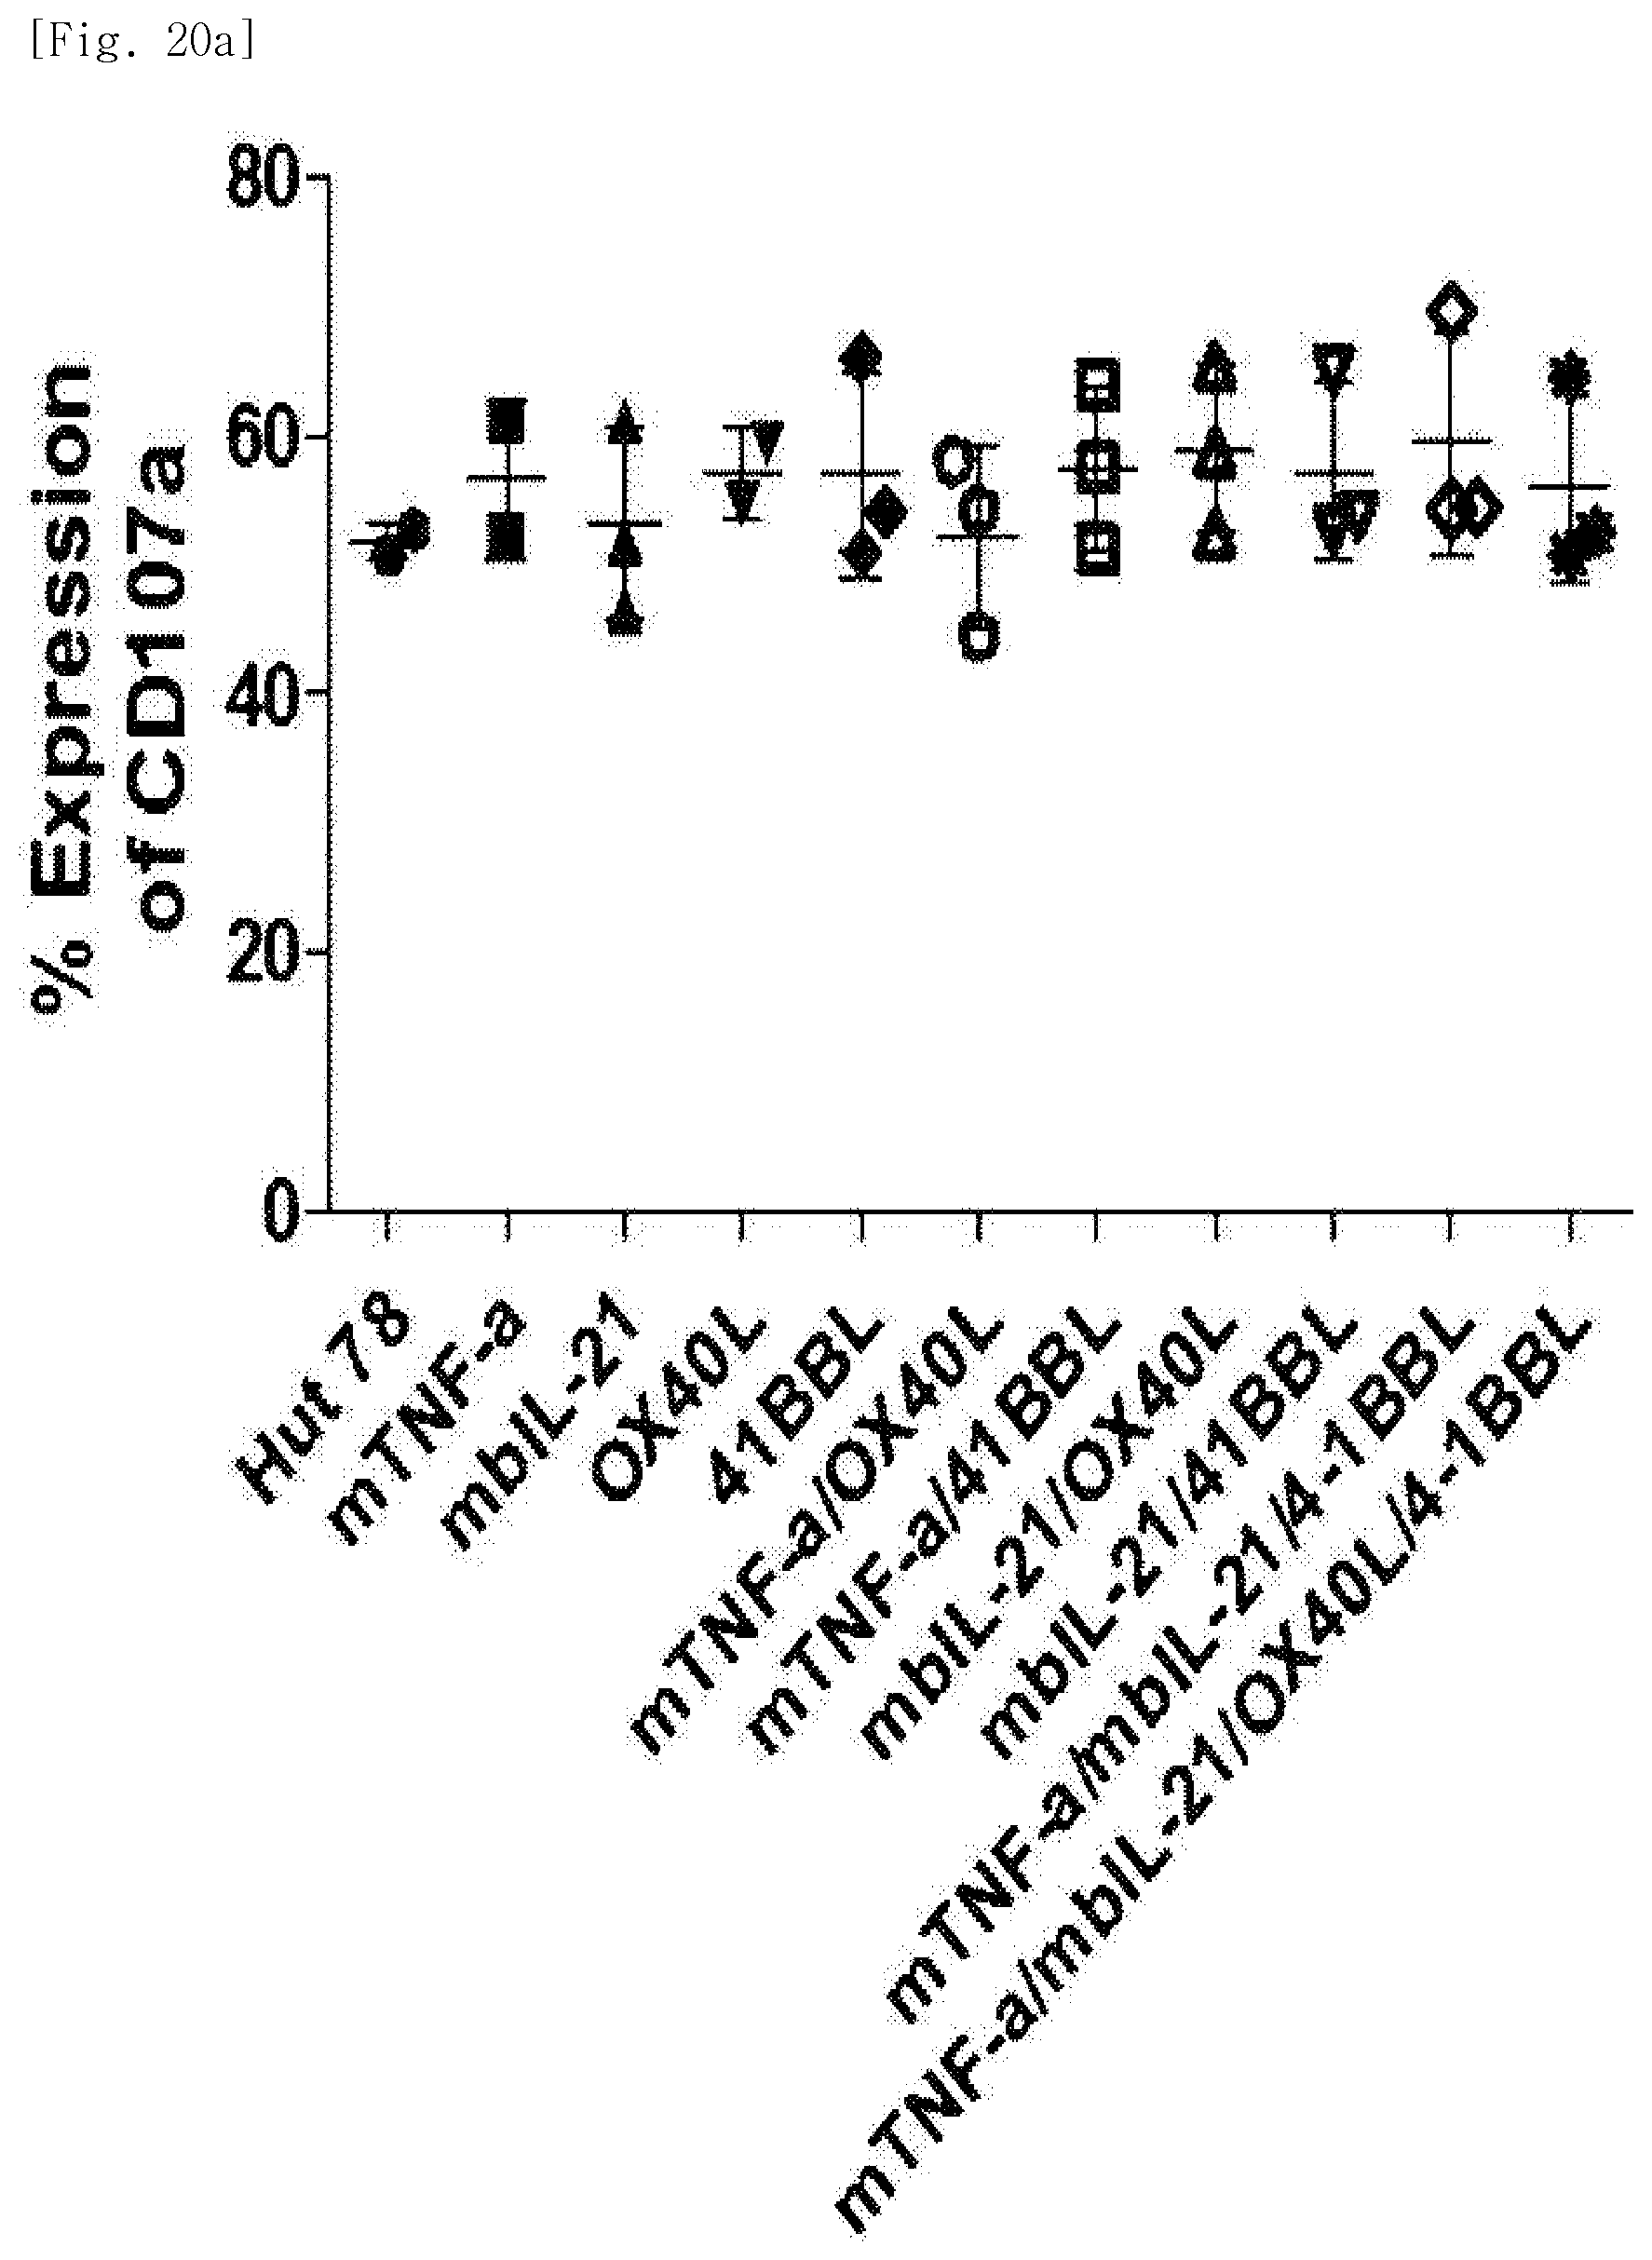
D00076

D00077
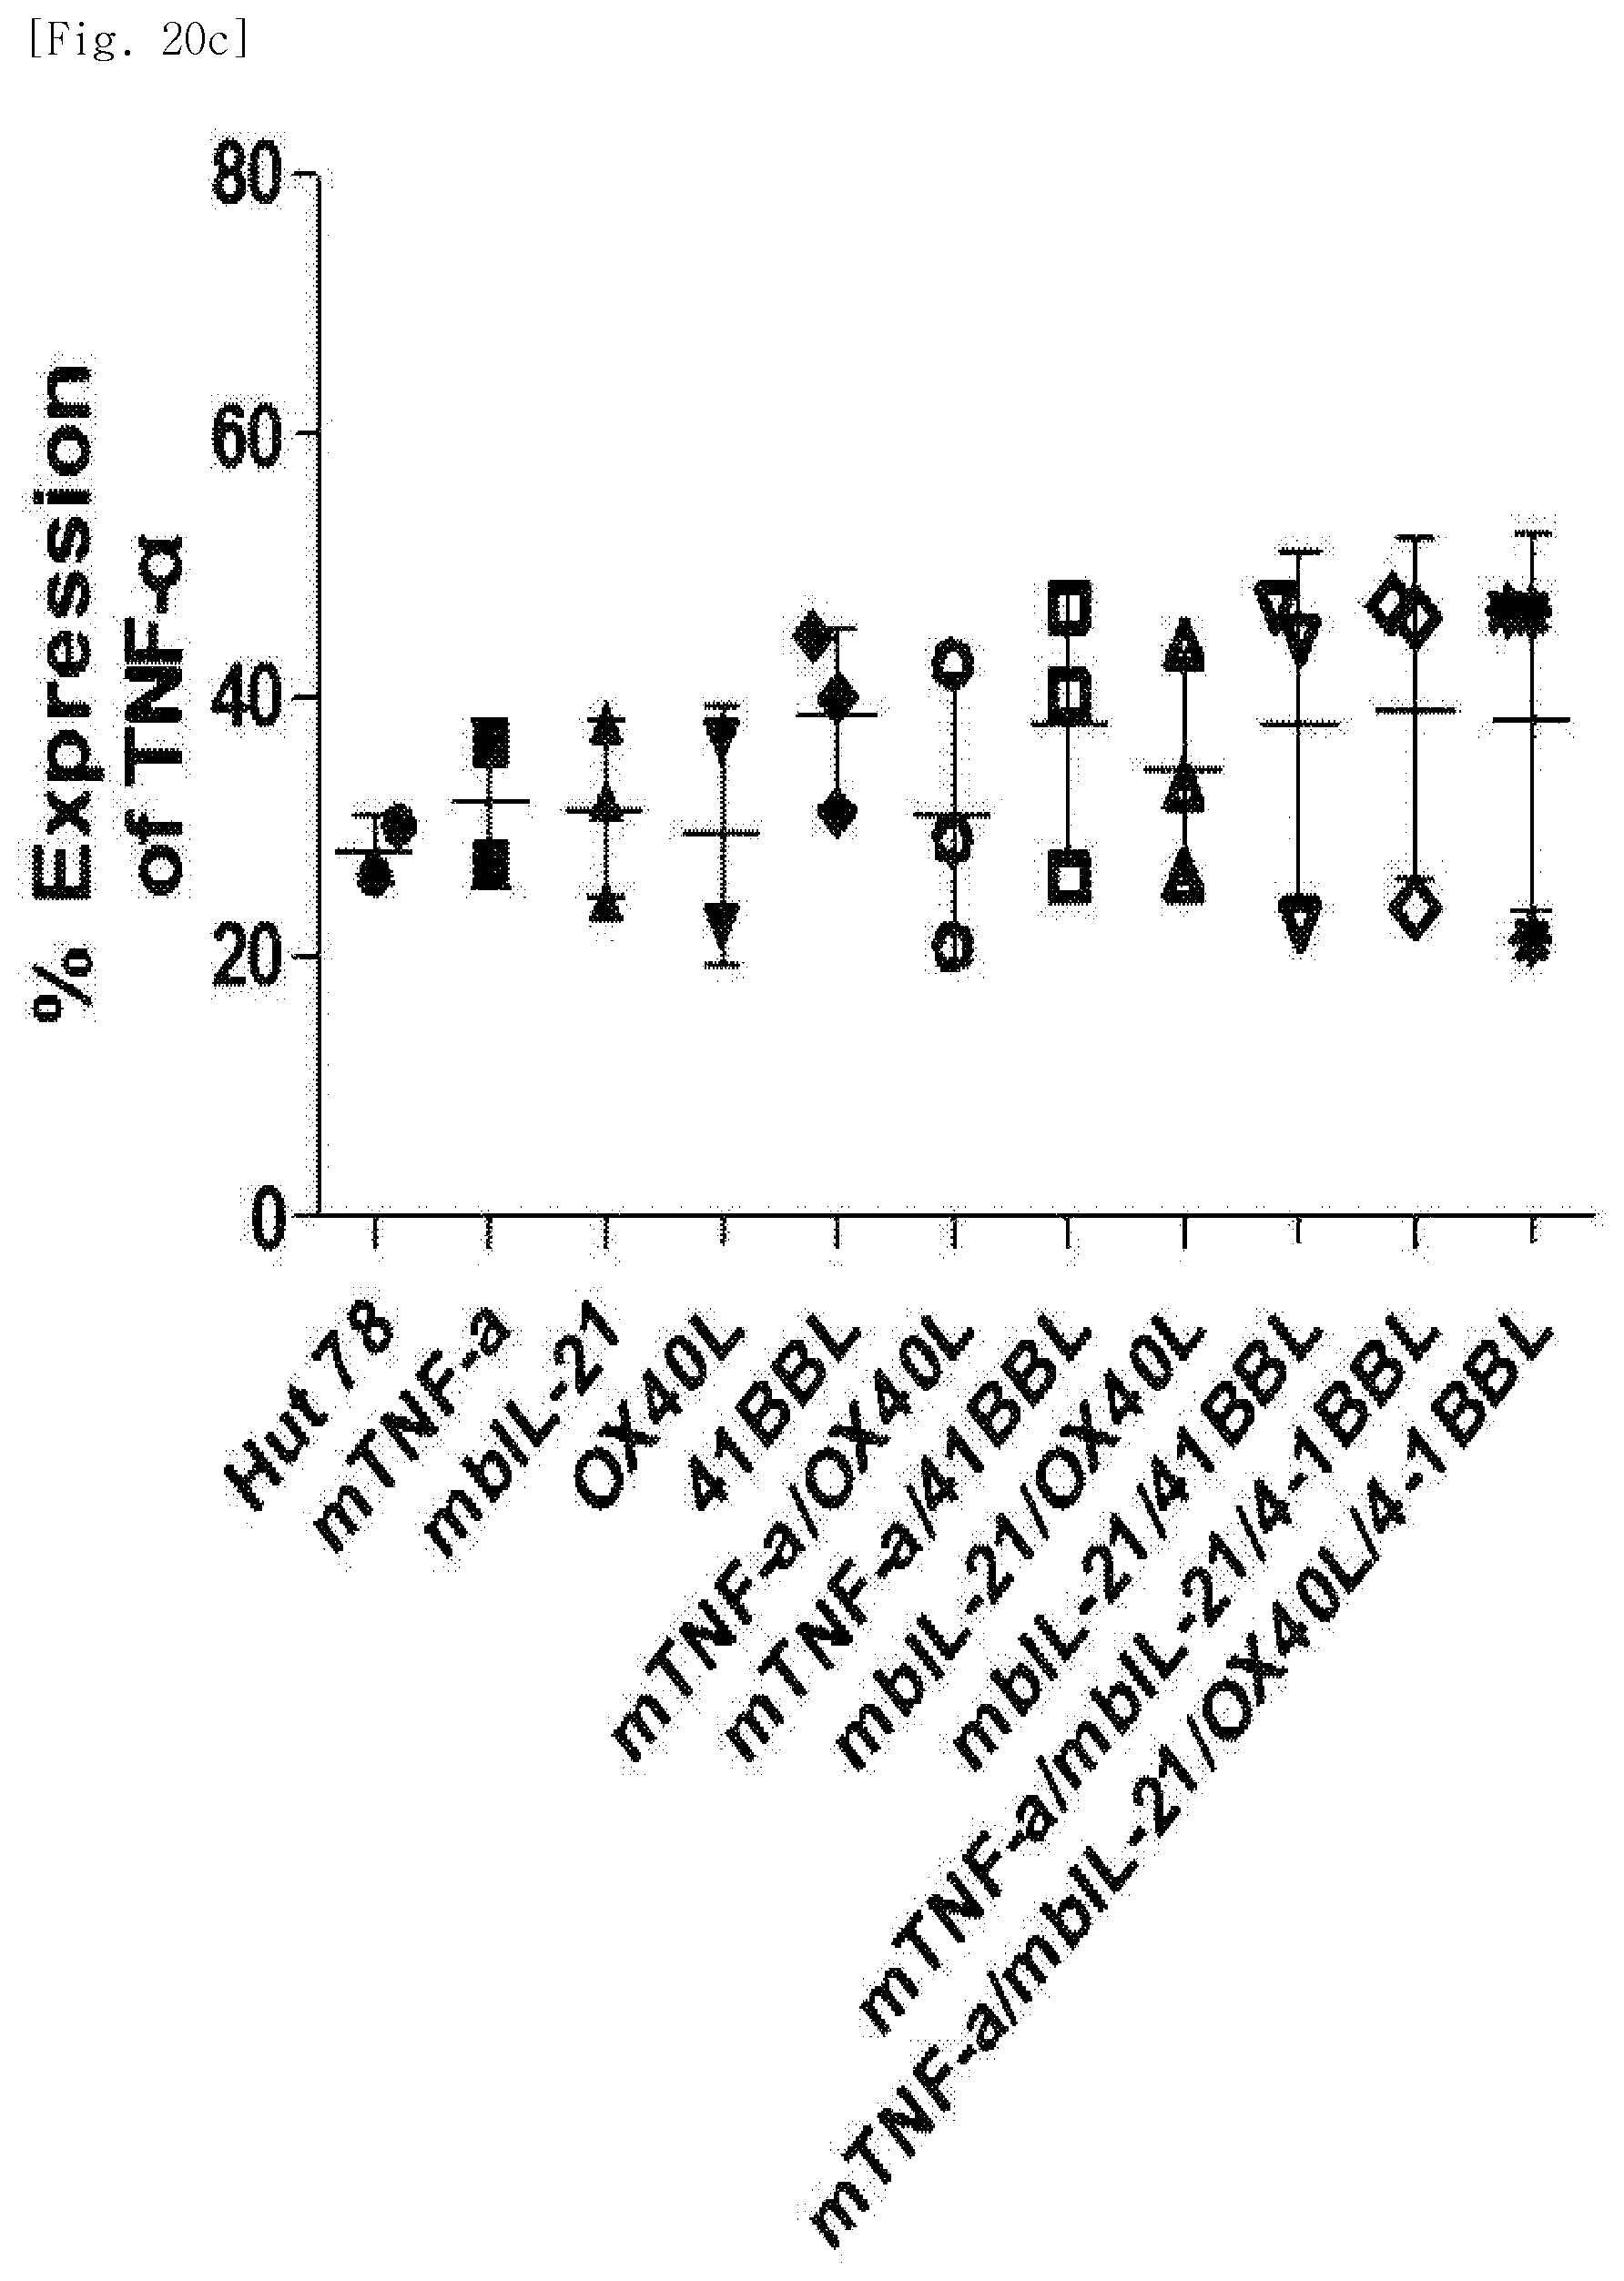
D00078

D00079

S00001
XML
uspto.report is an independent third-party trademark research tool that is not affiliated, endorsed, or sponsored by the United States Patent and Trademark Office (USPTO) or any other governmental organization. The information provided by uspto.report is based on publicly available data at the time of writing and is intended for informational purposes only.
While we strive to provide accurate and up-to-date information, we do not guarantee the accuracy, completeness, reliability, or suitability of the information displayed on this site. The use of this site is at your own risk. Any reliance you place on such information is therefore strictly at your own risk.
All official trademark data, including owner information, should be verified by visiting the official USPTO website at www.uspto.gov. This site is not intended to replace professional legal advice and should not be used as a substitute for consulting with a legal professional who is knowledgeable about trademark law.