Method For Determining Lymphoma Type
Staudt; Louis M. ; et al.
U.S. patent application number 16/713528 was filed with the patent office on 2020-04-02 for method for determining lymphoma type. The applicant listed for this patent is Board of Regents of the University of Nebraska, British Columbia Cancer Agency Branch, City of Hope, The Cleveland Clinic Foundation, Hospital Clinic de Barcelona, Institut D'Investigacions Biomediques August Pi I Sunyer (IDIBAPS), Julius-Maximilians-University of Wurzburg, Mayo Foundation for Medical Education and Research, Oregon Health & Science University, Oslo University Hospital HF, Robert Bosch Gesellschaft fuer medizinische Forschung mbH, The United States of America,as represented by the Secretary,Department of Health and Human Services, Universitat de Barcelona. Invention is credited to Rita Braziel, Elias Campo Guerri, Wing C. Chan, James R. Cook, Jan Delabie, Kai Fu, Randy Gascoyne, Timothy Greiner, Elaine S. Jaffe, Anja Mottok, German Ott, Lisa M. Rimsza, Andreas Rosenwald, David William Scott, Erlend B. Smeland, Joo Song, Louis M. Staudt, Christian Steidl, Dennis Weisenburger, George W. Wright.
| Application Number | 20200105364 16/713528 |
| Document ID | / |
| Family ID | 1000004536524 |
| Filed Date | 2020-04-02 |


View All Diagrams
| United States Patent Application | 20200105364 |
| Kind Code | A1 |
| Staudt; Louis M. ; et al. | April 2, 2020 |
METHOD FOR DETERMINING LYMPHOMA TYPE
Abstract
In embodiments of the invention, the invention provides a method for distinguishing between lymphoma types based on gene expression measurements. In embodiments, the invention distinguishes between PMBCL and DLBCL based on gene expression signatures, and can further distinguish between DLBCL subtypes. In embodiments of the invention, the distinctions are used in methods of treatment.
| Inventors: | Staudt; Louis M.; (Bethesda, MD) ; Steidl; Christian; (North Vancouver, CA) ; Mottok; Anja; (Ulm, DE) ; Wright; George W.; (Rockville, MD) ; Scott; David William; (Vancouver, CA) ; Rimsza; Lisa M.; (Scottsdale, AZ) ; Rosenwald; Andreas; (Wurzburg, DE) ; Gascoyne; Randy; (North Vancouver, CA) ; Greiner; Timothy; (Council Bluffs, IA) ; Weisenburger; Dennis; (Glendora, CA) ; Smeland; Erlend B.; (Oslo, NO) ; Delabie; Jan; (Toronto, CA) ; Campo Guerri; Elias; (Barcelona, ES) ; Ott; German; (Bitighein-Bissingen, DE) ; Braziel; Rita; (West Linn, OR) ; Jaffe; Elaine S.; (Great Falls, VA) ; Fu; Kai; (Omaha, NE) ; Chan; Wing C.; (Pasadena, CA) ; Song; Joo; (Duarte, CA) ; Cook; James R.; (Shaker Heights, OH) | ||||||||||
| Applicant: |
|
||||||||||
|---|---|---|---|---|---|---|---|---|---|---|---|
| Assignee: | The United States of America,as
represented by the Secretary,Department of Health and Human
Services Bethesda MD British Columbia Cancer Agency Branch Vancouver BC Mayo Foundation for Medical Education and Research Rochester MN Julius-Maximilians-University of Wurzburg Wurzburg MN Board of Regents of the University of Nebraska Lincoln NE Oslo University Hospital HF Oslo NE Hospital Clinic de Barcelona Barcelona NE Universitat de Barcelona Barcelona NE Institut D? Investigacions Biomediques August Pi I Sunyer (IDIBAPS) Barcelona NE Robert Bosch Gesellschaft fuer medizinische Forschung mbH Stuttgart NE Oregon Health & Science University Portland OR City of Hope Duarte CA The Cleveland Clinic Foundation Cleveland OH |
||||||||||
| Family ID: | 1000004536524 | ||||||||||
| Appl. No.: | 16/713528 | ||||||||||
| Filed: | December 13, 2019 |
Related U.S. Patent Documents
| Application Number | Filing Date | Patent Number | ||
|---|---|---|---|---|
| PCT/US2018/036084 | Jun 5, 2018 | |||
| 16713528 | ||||
| 62519728 | Jun 14, 2017 | |||
| Current U.S. Class: | 1/1 |
| Current CPC Class: | G16B 25/10 20190201; C12Q 2600/158 20130101; C12Q 2600/112 20130101; C12Q 1/6886 20130101; G16B 5/00 20190201 |
| International Class: | G16B 5/00 20060101 G16B005/00; C12Q 1/6886 20060101 C12Q001/6886; G16B 25/10 20060101 G16B025/10 |
Goverment Interests
STATEMENT REGARDING FEDERALLY SPONSORED RESEARCH AND DEVELOPMENT
[0002] This invention was made with Government support under Grant Number U01CA157581 awarded by the Strategic Partnering to Evaluate Cancer Signatures (SPECS II). This invention was made with government support under Grant Number CA157581 awarded by the National Institutes of Health. This invention was made with Government support under project number ZIA BC011006-05 by the National Institutes of Health, National Cancer Institute. The Government has certain rights in this invention.
Claims
1. A method of treating a human subject having lymphoma, the method comprising: (a) obtaining a formalin-fixed and paraffin-embedded (FFPE) lymphoma sample from the subject; (b) isolating RNA from the sample; (c) obtaining gene expression data from the RNA, wherein the gene expression data comprises signal values that represent expression levels for each gene of Table 1; (d) determining a tumor predictor score from the gene expression data, wherein the tumor predictor score is calculated by S=.SIGMA..sub.k=0.sup.58a.sub.ix.sub.i, wherein a.sub.i is the model coefficient value for gene i as listed in Table 1, column D for determining whether the sample is PMBCL or DLBCL and as listed in Table 1, column E for determining whether the sample is ABC DLBCL or GCB DLBCL, and x.sub.i is the log.sub.2 transformed expression signal value for gene i; (e) when the coefficient values in column D of Table 1 are used, classifying the lymphoma as: (i) DLBCL when S is less than -57.95, (ii) PMBCL when S is greater than -23.57, (iii) uncertain DLBCL/PMBCL when S is between -57.95 and -23.57, (e') when the coefficient values in column E of Table 1 are used, classifying the lymphoma as: (iv) GCB DLBCL when S is less than 798.5, (v) ABC DLBCL when S is greater than 1324.5, or (vi) uncertain ABC/GCB DLBCL when S is between 798.5 and 1324.5; and (f) treating the subject with an effective amount of DA-R-EPOCH when the classification is PMBCL or with an effective amount of R-CHOP when the classification is DLBCL, uncertain DLBCL/PMBCL, GCB DLBCL, ABC DLBCL, or uncertain ABC/GCB DLBCL.
2. The method of claim 1, wherein the method further comprises determining the probability that the sample is PMBCL or ABC DLBCL, wherein the probability is determined by (f) determining the probability that the sample is PMBCL by calculating the probability score of P ( PMBCL ) = .PHI. ( S PMBCL / DLBCL ; .mu. PMBCL , .sigma. PMBCL ) .PHI. ( S ; .mu. PMBCL , .sigma. PMBCL ) + .PHI. ( S ; .mu. DLBCL , .sigma. DLBCL ) , ##EQU00030## wherein S.sub.PMBCL/DLBCL is the tumor predictor score; .mu..sub.PMBCL, .mu..sub.DLBCL and .sigma..sub.PMBCL, .sigma..sub.DLBCL represent the mean and standard deviations of the PMBCL and DLBCL subtypes as indicated in Table 2; (g) determining the probability that the samples is ABC DLBCL by calculating the probability score of P ( ABC ) = .PHI. ( S ABC / GCB ; .mu. ABC , .sigma. ABC ) .PHI. ( S ; .mu. ABC , .sigma. ABC ) + .PHI. ( S ; .mu. GCB , .sigma. GCB ) , ##EQU00031## wherein S.sub.ABC/GCB is the tumor predictor score; .mu..sub.ABC, .mu..sub.GCB and .sigma..sub.ABC, .sigma..sub.GCB represent the mean and standard deviations of the ABC and GCB subtypes as indicated in Table 2; and wherein .phi.(x; .mu., .alpha.) is the standard normal density calculated by .PHI. ( x ; .mu. , .sigma. ) = 1 2 .pi..sigma. 2 exp ( - ( x - .mu. ) 2 2 .sigma. 2 ) . ##EQU00032##
3. The method of claim 2, wherein a score of P(PMBCL).gtoreq.0.9 indicates that the sample is PMBCL, regardless of the P(ABC) score.
4. The method of claim 2, wherein a score of P(PMBCL).ltoreq.0.1 and a score of P(ABC).ltoreq.0.1 indicates that the tumor is GCB DLBCL.
5. The method of claim 2, wherein a score of P(PMBCL).ltoreq.0.1 and a score of P(ABC).gtoreq.0.9 indicates that the tumor is ABC DLBCL.
6. The method of claim 2, wherein a score of P(PMBCL).ltoreq.0.1 and a score of P(ABC) greater than 0.1 and less than 0.9 indicates that the tumor is an unclassified DLBCL.
7. The method of any one of claims 1-6, wherein the RNA gene expression data is obtained using a NanoString Technologies.RTM. nCounter.RTM. assay.
Description
CROSS-REFERENCE TO RELATED APPLICATIONS
[0001] This patent application is a continuation-in-part of International Patent Application No. PCT/US2018/036084, filed Jun. 5, 2018, which claims the benefit of U.S. Provisional Patent Application No. 62/519,728, filed Jun. 14, 2017, each of which is incorporated by reference herein in its entirety.
INCORPORATION-BY-REFERENCE OF MATERIAL SUBMITTED ELECTRONICALLY
[0003] Incorporated by reference in its entirety herein is a computer-readable nucleotide/amino acid sequence listing submitted concurrently herewith and identified as follows: one 16,045 Byte ASCII (Text) file named "746801_ST25.txt" dated Dec. 12, 2019.
BACKGROUND OF THE INVENTION
[0004] Primary mediastinal large B cell lymphoma (PMBCL), known as the "third subtype" of diffuse large B cell lymphoma (DLBCL), represents 2-4% of all B cell non-Hodgkin Lymphoma. PMBCL is recognized as a distinct clinico-pathological entity in the current World Health Organization classification. The pathogenic hallmarks of PMBCL include (1) activation of the JAK-STAT pathway, (2) activation of the NF-.kappa.B pathway, and (3) overexpression of specific immune checkpoint molecules, such as programmed death ligands (PDL) 1 and 2. The current classification of PMBCL from DLBCL is based on clinico-pathologic consensus. Presently the diagnosis of PMBCL relies on the integration of clinical characteristics and clinical/pathological presentation because a reliable distinction from DLBCL solely based on morphological or immunophenotypic features can be challenging for pathologists for various reasons. Reasons for the difficulty in diagnosing PMBCL include, among others, (1) that clinico-pathologic consensus is not always well instituted, and (2) gene expression profiling developed in fresh-frozen tissue is not routinely available in clinical practice.
[0005] Gene expression profiling studies provide evidence that PMBCL can be distinguished from DLBCL on a molecular level and supported a strong relationship between PMBCL and classical Hodgkin lymphoma. However, because these studies were performed using snap-frozen tissue, the molecular classification of PMBCL has not penetrated into clinical practice.
[0006] Therefore, there is an unmet need for a gene expression-based molecular classifier using formalin-fixed, paraffin-embedded (FFPE) samples, with the ability to distinguish PMBCL from DLBCL. There is also an unmet need for additional methods of classifying DLBCL subtype tumors. The present invention provides such methods.
BRIEF SUMMARY OF THE INVENTION
[0007] In an embodiment, the present invention provides a method for classifying the lymphoma type of a sample, which method comprises providing a formalin-fixed and paraffin-embedded (FFPE) lymphoma sample from the subject, isolating RNA from the sample, obtaining gene expression data from the RNA, wherein the gene expression data comprises signal values that represent expression levels for each gene of Table 1, and determining a predictor score from the gene expression data, wherein the tumor predictors score is calculated by
S = k = 0 58 a i x i ##EQU00001##
wherein a.sub.i is the model coefficient value for gene i, as listed in Table 1, column D for determining whether the sample is PMBCL or DLBCL and as listed in Table 1 column E for determining whether a sample is ABC DLBCL or GCB DLBCL, and x.sub.i is the log.sub.2 transformed expression signal value for gene i; and when the coefficient values in column D of Table 1 are used, classifying the lymphoma as DLBCL when S is less than -57.95, PMBCL when S is greater than -23.57, or uncertain DLBCL/PMBCL when S is between -57.95 and -23.57; and when the coefficient values in column E are used, classifying the lymphoma as GCB DLBCL when S is less than 798.5, ABC DLBCL when S is greater than 1324.5, or uncertain ABC/GCB DLBCL when S is between 798.5 and 1324.5.
BRIEF DESCRIPTION OF THE DRAWINGS
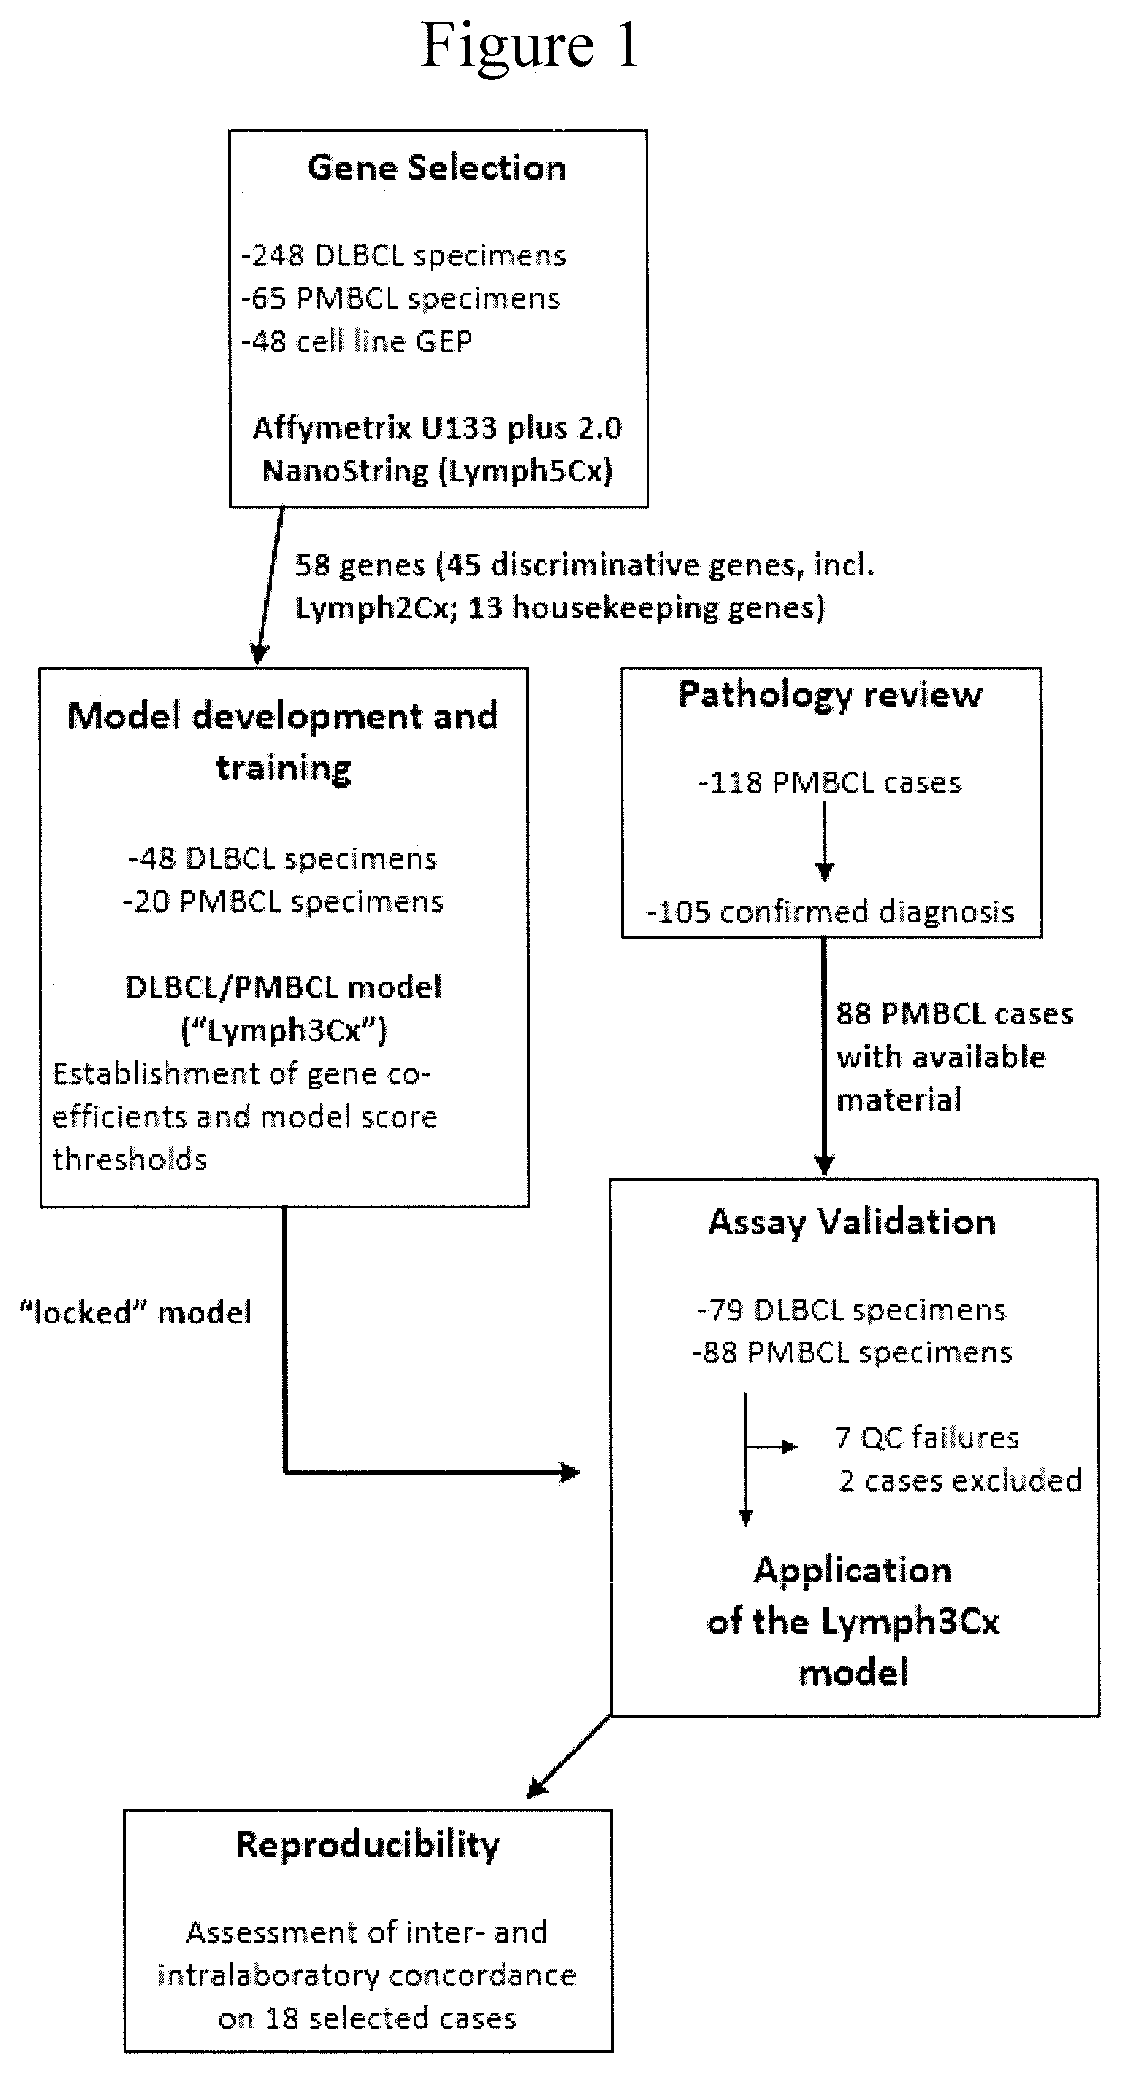
[0008] FIG. 1 presents a schematic overview of the studies described in the Example.
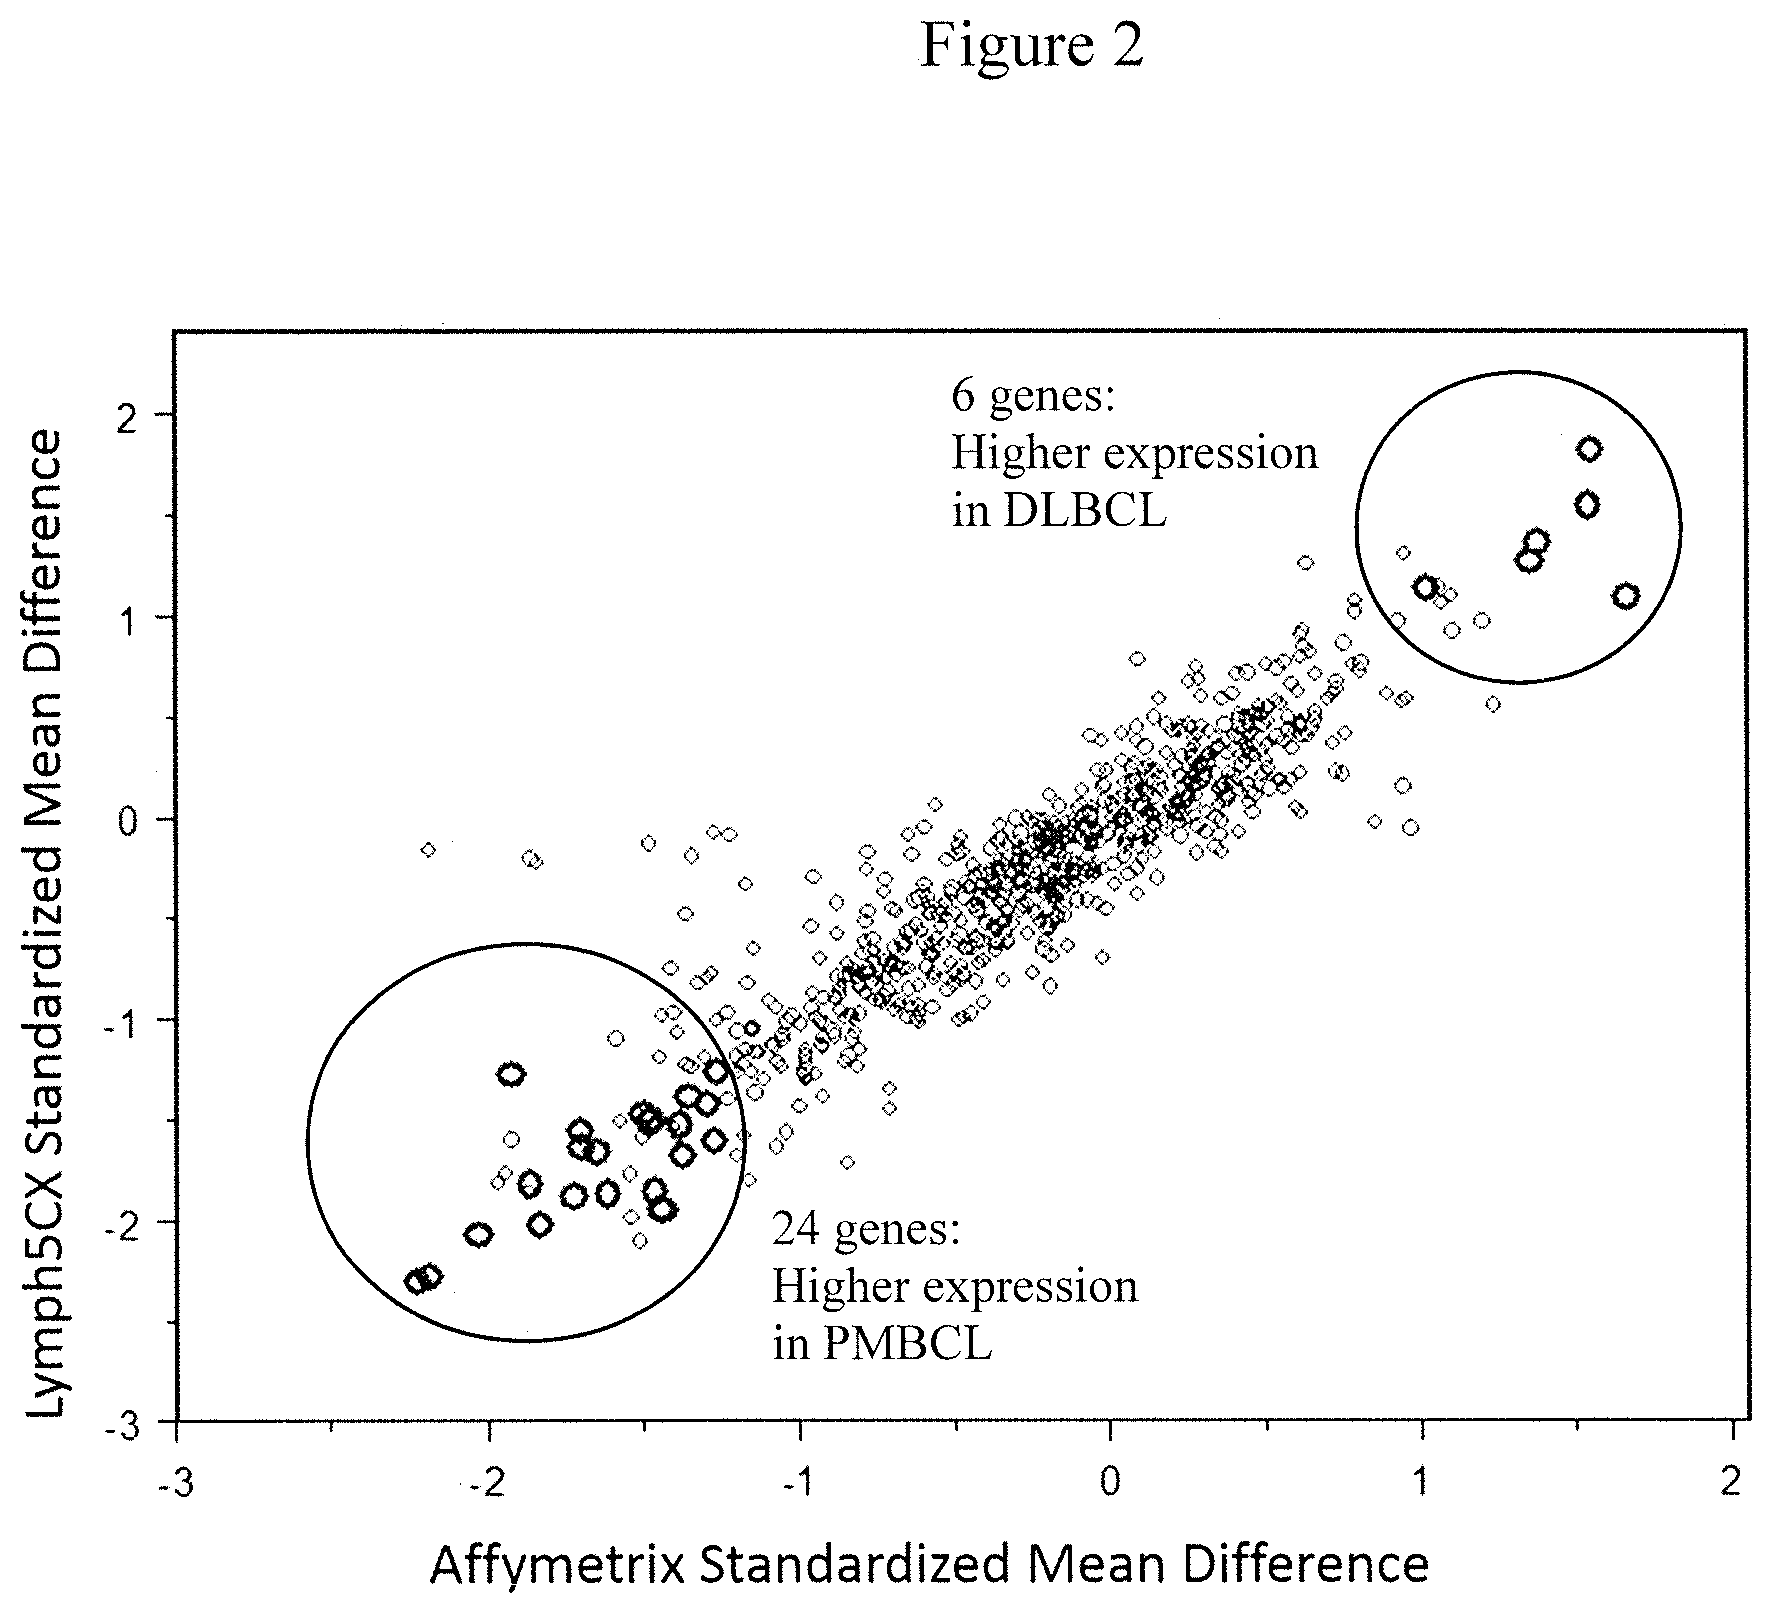
[0009] FIG. 2 is a dot plot of the genes used in selecting Nanostring probe set for the novel Lymph3Cx assay. The large circles represent the higher expressing genes in PMBCL (bottom) and DLBCL (top). The Y axis represents the Lymph5Cx standardized mean difference and the X axis represents the Affymetrix standardized mean difference. The genes with higher expression in DLBCL are CARD11, BTG2, PRKCBB, FAM159A, PRDX2, and BANK1. The genes that are higher expressed in PMBCL are MAL, HOMER2, CCL17, FSCN1, TFP12, TMOD1, SLAMF1, RCL1, PRR6, IL13RA1, MST1R, LIMA1, TRAF1, PDCD1LG2, PTGIR, NFIL3, BATF3, RHOF, SNX11, QSOX1, AUH, IFIH1, MOBKL2C, and NECAP2.
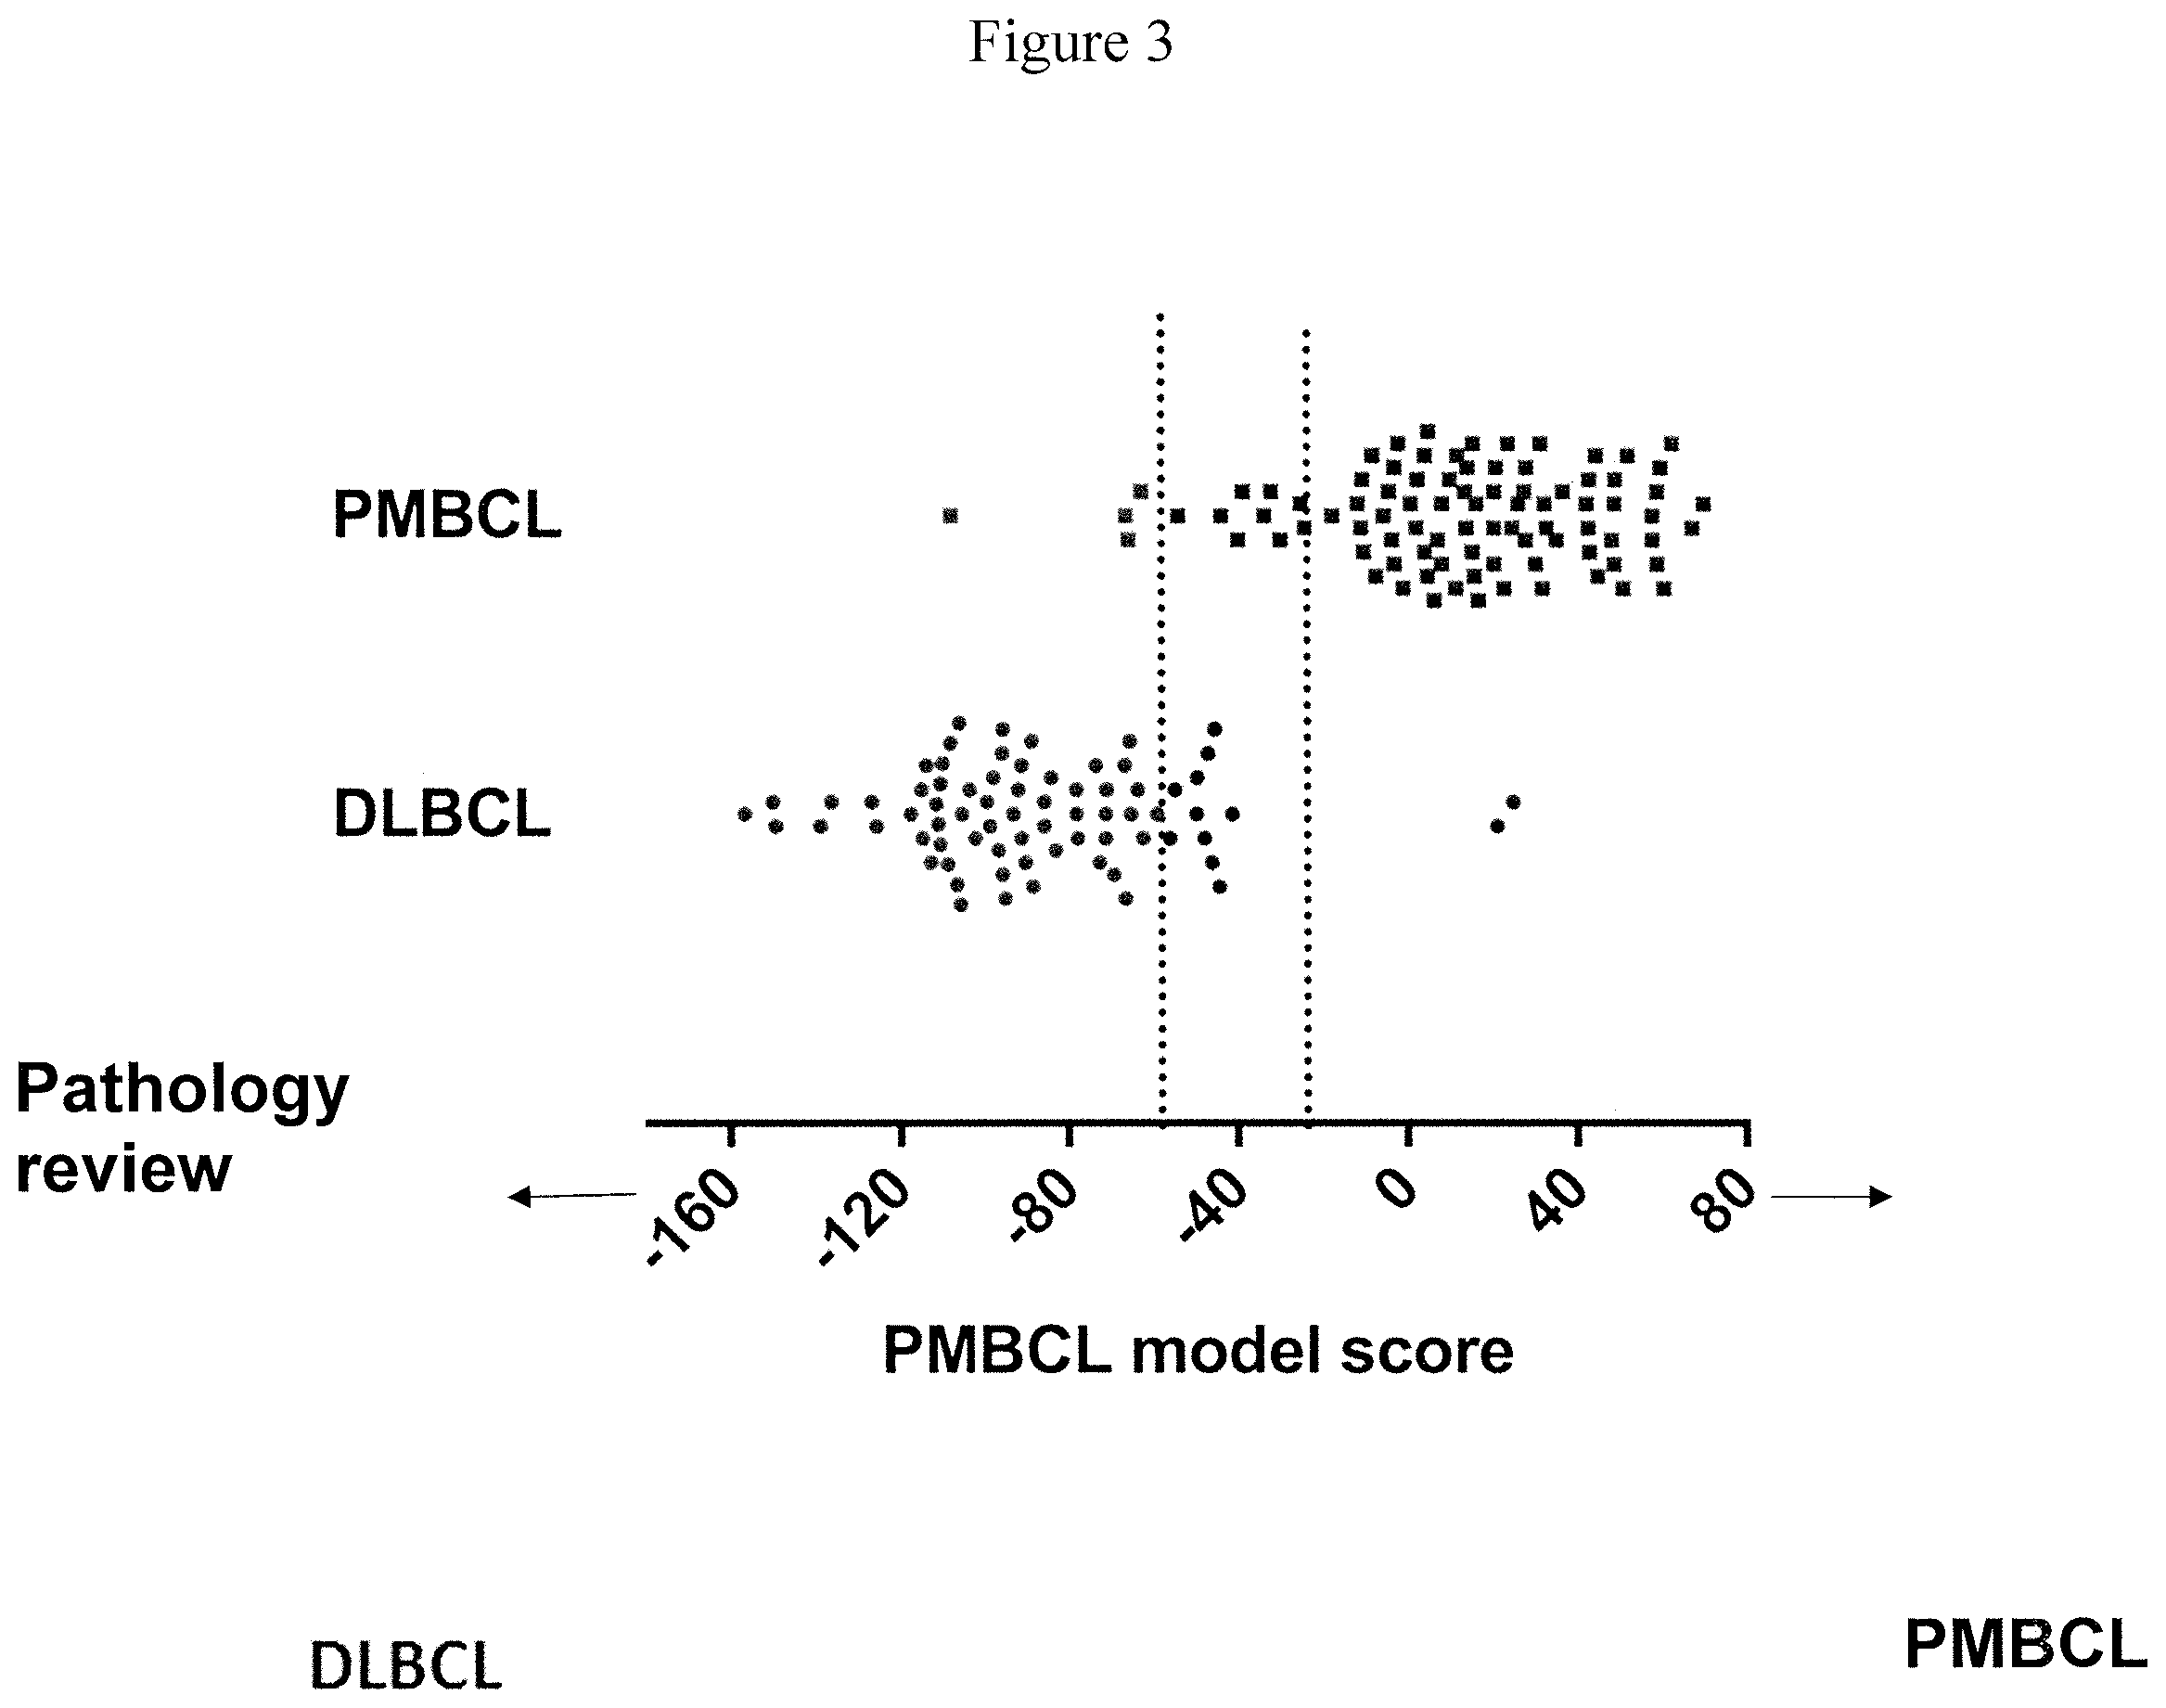
[0010] FIG. 3 shows a dot plot of the pathology review (Y axis) against the PMBCL model score (X axis) from the Lymph3Cx assay.
[0011] FIG. 4 is a graph showing comparison of the linear predictor scores (LPS) for 66 cases which were run using the published Lymph2Cx assay and the Lymph3Cx assay. Dotted lines represent the thresholds previously defined for COO-assignment.
[0012] FIG. 5 is a graph showing comparison of Lymph3Cx scores for selected cases of the validation cohort from two independent laboratories (BC Cancer Agency (BCCA) and Mayo Clinic). Dotted lines represent the defined thresholds to discriminate PMBCL from DLBCL using the Lymph3Cx assay. Of note, no case changed subtype assignment between the different laboratories.
DETAILED DESCRIPTION OF THE INVENTION
[0013] In an embodiment, the present invention provides a method for classifying the lymphoma type of a sample, which method comprises providing a formalin-fixed and paraffin-embedded (FFPE) lymphoma sample from the subject, isolating RNA from the sample, obtaining gene expression data from the RNA, wherein the gene expression data comprises signal values that represent expression levels for each gene of Table 1, and determining a tumor predictor score from the gene expression data, wherein the tumor predictors score is calculated by
S = k = 0 58 a i x i ##EQU00002##
wherein a.sub.i is the model coefficient value for gene i, as listed in Table 1, column D for determining whether the sample is PMBCL or DLBCL and as listed in Table 1 column E for determining whether a sample is ABC DLBCL or GCB DLBCL, and x.sub.i is the log.sub.2 transformed expression signal value for gene i; and when the coefficient values in column D of Table 1 are used, classifying the lymphoma as DLBCL when S is less than -57.95, PMBCL when S is greater than -23.57, or uncertain DLBCL/PMBCL when S is between -57.95 and -23.57; and when the coefficient values in column E are used, classifying the lymphoma as GCB DLBCL when S is less than 798.5, ABC DLBCL when S is greater than 1324.5, or uncertain ABC/GCB DLBCL when S is between 798.5 and 1324.5.
[0014] In an embodiment, the method further comprises determining the probability that the sample is PMBCL or ABC DLBCL, wherein the probability is determined by
[0015] (a) determining the probability that the sample is PMBCL by calculating the probability score of
P ( PMBCL ) = .PHI. ( S PMBCL / DLBCL ; .mu. PMBCL , .sigma. PMBCL ) .PHI. ( S ; .mu. PMBCL , .sigma. PMBCL ) + .PHI. ( S ; .mu. DLBCL , .sigma. DLBCL ) , ##EQU00003##
wherein S.sub.PMBCL/DLBCL is the tumor predictor score; .mu..sub.PMBCL, .mu..sub.DLBCL and .sigma..sub.PMBCL, .sigma..sub.DLBCL represent the mean and standard deviations of the PMBCL and DLBCL subtypes as indicated in Table 2 provided herein;
[0016] (b) determining the probability that the sample is ABC DLBCL by calculating the probability score of
P ( ABC ) = .PHI. ( S ABC / GCB ; .mu. ABC , .sigma. ABC ) .PHI. ( S ; .mu. ABC , .sigma. ABC ) + .PHI. ( S ; .mu. GCB , .sigma. GCB ) , ##EQU00004##
wherein S.sub.ABC/GCB is the tumor predictor score; .mu..sub.ABC, .mu..sub.GCB and .sigma..sub.ABC, .sigma..sub.GCB represent the mean and standard deviations of the ABC and GCB subtypes as indicated in Table 2 herein; and
[0017] wherein .phi.(x; .mu., .sigma.) is the standard normal density calculated by
.PHI. ( x ; .mu. , .sigma. ) = 1 2 .pi..sigma. 2 exp ( - ( x - .mu. ) 2 2 .sigma. 2 ) . ##EQU00005##
[0018] In an embodiment, a score of P(PMBCL).gtoreq.0.9 indicates that the sample is PMBCL, regardless of the P(ABC) score. In an embodiment, a score of P(PMBCL).ltoreq.0.1 and a score of P(ABC).ltoreq.0.1 indicates that the tumor is GCB DLBCL. In an embodiment, wherein a score of P(PMBCL).ltoreq.0.1 and a score of P(ABC).gtoreq.0.9 indicates that the tumor is ABC DLBCL. In an embodiment, a score of P(PMBCL).ltoreq.0.1 and a score of P(ABC) greater than 0.1 and less than 0.9 indicates that the tumor is an unclassified DLBCL.
[0019] In an embodiment, the method encompasses genes which have a coefficient of zero. In an embodiment, the equation
S = k = 0 58 a i x i ##EQU00006##
may be utilized for determining a tumor predictor score for a sample, taking into account genes having a coefficient of zero when classifying PMBCL v. DLBCL and GCB DLBCL v. ABC DLBCL. In an embodiment the genes with a coefficient of zero need not be taken into account in the equation.
[0020] In an embodiment, the RNA gene expression data is obtained using a NanoString Technologies.RTM. nCounter.RTM. assay.
[0021] The inventive method comprises isolating sufficient RNA from a human subject, e.g., from a sample from a subject, such as from fresh tissue, a snap-frozen sample from a subject, or a formalin-fixed and paraffin-embedded (FFPE) sample from a subject. The sample may be a biopsy sample. As understood by one of ordinary skill in the art, the phrase "a snap-frozen sample from a subject" means that a sample is first taken from a subject and afterwards snap-frozen, and the phrase "obtaining or providing a formalin-fixed and paraffin-embedded (FFPE) sample from the subject" means that a sample is first taken from a subject and afterwards fixed with formalin and embedded in paraffin.
[0022] The gene expression product, e.g., the main mRNA species, is RNA, for example, total cellular mRNA. The RNA gene expression product may be obtained from the subject in any suitable manner. For example, one or more samples may be obtained from a patient that has been diagnosed as having a non-Hodgkin lymphoma, and the samples can be formalin-fixed and paraffin-embedded using protocols that are known in the art or are commercially available (see, e.g., Keiman, J. (ed.), Histological and Histochemical Methods: Theory and Practice, 4th edition, Cold Spring Harbor Laboratory Press (2008), incorporated herein by reference). The RNA can be extracted from an FFPE sample using methods that are known in the art or are commercially available (see, e.g., Huang et al., Cancer Epidemiol Biomarkers Prev., 19: 973-977 (2010), incorporated herein by reference; QIAGEN AIIPREP DNA/RNA FFPE Kit (Qiagen, Venlo, Netherlands)). The digital gene expression profile may be obtained from archived FFPE tissue.
[0023] The inventive method further comprises obtaining gene expression data from the isolated RNA, wherein the gene expression data comprises data for genes in a gene expression signature. The phrase "gene expression data" as used herein refers to information regarding the relative or absolute level of expression of RNA species. "Gene expression data" may be acquired for an individual cell, or for a group of cells such as a tumor or biopsy sample.
[0024] Any effective method of quantifying the expression of at least one gene, gene set, or group of gene sets may be used to acquire gene expression data for use in the invention. For example, gene expression data may be measured or estimated using one or more microarrays, where, e.g., the microarrays produce a signal value for each gene and the signal values of all genes in a gene expression signature may comprise the gene expression data. See, for example, the methods as described in the Example below.
[0025] Nucleic acid microarrays generally comprise nucleic acid probes derived from individual genes and placed in an ordered array on a support. This support may be, for example, a glass slide, a nylon membrane, or a silicon wafer. Gene expression patterns in a sample are obtained by hybridizing the microarray with the RNA gene expression product from the sample. The RNA gene expression product from a sample is labeled with a radioactive, fluorescent, or other label to allow for detection. Following hybridization, the microarray is washed, and hybridization of RNA gene expression product to each nucleic acid probe on the microarray is detected and quantified using a detection device such as a phosphoimager or scanning confocal microscope.
[0026] The microarray may be a cDNA microarray or an oligonucleotide microarray. cDNA arrays consist of hundreds or thousands of cDNA probes immobilized on a solid support, and are described in detail in, e.g., Southern et al., Genomics, 13: 1008-1017 (1992); Southern et al., Nucl. Acids. Res., 22: 1368-1373 (1994); Gress et al., Oncogene, 13: 1819-1830 (1996); Pietu et al., Genome Res., 6: 492-503 (1996); Schena et al., Science, 270: 467-470 (1995); DeRisi et al., Nat. Genet., 14: 457-460 (1996); Schena et al., Proc. Natl. Acad. Sci. USA, 93: 10614-10619 (1996); Shalon et al., Genome Res., 6: 639-645 (1996); DeRisi et al., Science, 278: 680-686 (1997); Heller et al., Proc. Natl. Acad. Sci. USA, 94: 2150-2155 (1997); and Lashkari et al., Proc. Natl. Acad. Sci. USA, 94: 13057-13062 (1997), each incorporated herein by reference. Oligonucleotide arrays differ from cDNA arrays in that the probes are 20- to 25-mer oligonucleotides. Oligonucleotide arrays are generally produced by in situ oligonucleotide synthesis in conjunction with photolithographic masking techniques (see, e.g., Pease et al., Proc. Natl. Acad. Sci. USA, 91: 5022-5026 (1994); Lipshutz et al., Biotechniques, 19: 442-447 (1995); Chee et al., Science, 274: 610-14 (1996); Lockhart et al., Nat. Biotechnol., 14: 1675-1680 (1996); and Wodicka et al., Nat. Biotechnol., 15: 1359-1367 (1997), each incorporated herein by reference). The solid support for oligonucleotide arrays is typically a glass or silicon surface.
[0027] Methods and techniques applicable to array synthesis and use have been described in, for example, U.S. Pat. Nos. 5,143,854, 5,242,974, 5,252,743, 5,324,633, 5,384,261, 5,424,186, 5,445,934, 5,451,683, 5,482,867, 5,491,074, 5,527,681, 5,550,215, 5,571,639, 5,578,832, 5,593,839, 5,599,695, 5,624,711, 5,631,734, 5,795,716, 5,831,070, 5,837,832, 5,856,101, 5,858,659, 5,936,324, 5,968,740, 5,974,164, 5,981,185, 5,981,956, 6,025,601, 6,033,860, 6,040,193, 6,090,555, and 6,410,229, and U.S. Patent Application Publication 2003/0104411, each incorporated herein by reference. Techniques for the synthesis of microarrays using mechanical synthesis methods are described in, for example, U.S. Pat. Nos. 5,384,261 and 6,040,193, each incorporated herein by reference. Microarrays may be nucleic acids on beads, gels, polymeric surfaces, fibers such as fiber optics, glass or any other appropriate substrate (see, e.g., U.S. Pat. Nos. 5,708,153, 5,770,358, 5,789,162, 5,800,992, and 6,040,193, each incorporated herein by reference).
[0028] Microarrays may be packaged in such a manner as to allow for diagnostic use, or they may be an all-inclusive device (see, e.g., U.S. Pat. Nos. 5,856,174 and 5,922,591, each incorporated herein by reference). Microarrays directed to a variety of purposes are commercially available from, e.g., Affymetrix (Affymetrix, Santa Clara, Calif., USA).
[0029] In an embodiment, the signal value comprises digital counts. Gene expression data can be obtained and analyzed using a variety of digital methods known in the art, such as, for example, serial analysis of gene expression (SAGE) (see, e.g., Velculescu et al., Science, 270(5235): 484-487 (1995)), SuperSAGE (see e.g., Matsumura et al., Proc. Natl. Acad. Sci. USA, 100 (26): 15718-15723 (2003)), digital northern analysis (see, e.g., Cao et al., Breast Cancer Research, 10: R91 (2008)), and RNA-seq (see, e.g., Mortazavi et al. Nat Methods, 5(7):621-628 (2008)), each article incorporated herein by reference. In an embodiment, the RNA gene expression data is obtained using a NanoString Technologies.RTM. nCounter.RTM. assay available from NanoString Technologies.RTM., Inc. (Seattle, Wash., USA)
[0030] The NanoString platform is used for subtyping lymphomas (see e.g., Scott et al., J. Clin. Oncol. 31(6): 692-700 (2013), Scott et al., Blood 123(8): 1214-1217 (2014), Scott and Mottok et al., J. Clin. Oncol. 33(26): 2848-2856 (2015), Kridel and Mottok et al., Blood 126(18): 21118-2127 (2015), Scott and Abrisqueta et al., J. Clin. Oncol. 35(15): 1668-1677, Rosenwald et al., J. Exper. Med. 198(6): 851-862 (2003), and Savage et al., Blood 102(12): 3871-3879 (2003), each incorporated herein by reference.
[0031] The nCounter.RTM. assay can detect the expression of up to 800 genes in a single reaction with high sensitivity and linearity across a broad range of expression levels. The nCounter.RTM. assay is based on direct digital detection of mRNA molecules of interest using target-specific, color-coded probe pairs, and does not require the conversion of mRNA to cDNA by reverse transcription or the amplification of the resulting cDNA by PCR. Each target gene of interest is detected using a pair of reporter and capture probes carrying 35- to 50-nucleotide target-specific sequences. In addition, each reporter probe carries a unique color code at the 5' end that enables the molecular barcoding of the genes of interest, while the capture probes all carry a biotin label at the 3' end that provides a molecular handle for attachment of target genes to facilitate downstream digital detection. After solution-phase hybridization between target mRNA and reporter-capture probe pairs, excess probes are removed and the probe/target complexes are aligned and immobilized in an nCounter.RTM. cartridge, which is then placed in a digital analyzer for image acquisition and data processing. Hundreds of thousands of color codes designating mRNA targets of interest are directly imaged on the surface of the cartridge. The expression level of a gene is measured by counting the number of times the color-coded barcode for that gene is detected, and the barcode counts are then tabulated. NanoString Technologies.RTM. technology and analysis of digital gene expression data is described in detail in, e.g., Kulkarni, M. M., "Digital Multiplexed Gene Expression Analysis Using the NanoString Technologies.RTM. nCounter.RTM. System," Current Protocols in Molecular Biology. 94: 25B.10.1-25B.10.17 (2011), incorporated herein by reference; Geiss et al., Nature Biotechnology, 26: 317-325 (2008), incorporated herein by reference; and U.S. Pat. No. 7,919,237, incorporated herein by reference.
[0032] The term "gene expression signature" as used herein refers to a group of coordinately expressed genes. The genes making up a particular signature may be expressed in a specific cell lineage, stage of differentiation, or during a particular biological response. The genes may reflect biological aspects of the tumors in which they are expressed, such as the cell of origin of the cancer, the nature of the non-malignant cells in the sample, and the oncogenic mechanisms responsible for the cancer (see, e.g., Shaffer et al., Immunity, 15: 375-385 (2001), incorporated herein by reference). Examples of gene expression signatures include lymph node (see Shaffer et al., supra), proliferation (see, e.g., Rosenwald et al., New Engl. J. Med., 346: 1937-1947 (2002), incorporated herein by reference), MHC class II, ABC DLBCL high, B-cell differentiation, T-cell, macrophage, immune response-1, immune response-2, and germinal center B cell.
[0033] The 58 genes of a gene expression signature of the present invention are shown in Table 1 with their respective coefficient values. When gene expression is detected using RNA, the sequences detected are the RNA sequences of the DNA target sequences, where the DNA sequences have thymine replaced with uracil.
TABLE-US-00001 TABLE 1 D E A B C PMBCL/DLBCL ABC/GCB Gene Gene Symbol Accession Gene Type Coefficient Coefficient Target Sequence 1 ASB13 NM_024701.3 GCB gene 0 -66.35 GGACACGTAGGCGGTACCACTAAGGTTTTGGTAATGAGC CATTCAAACCGACAGCAGTGTGAAGGTGTGTCAAGGTGT ATATTCTCGTGGCTCGGCATTC (SEQ ID NO: 1) 2 AUH NM_001698.2 PMBCL gene 3.16 0 GGTGGTCTTGAACTGGCTTTAGCCTGTGATATACGAGTAG CAGCTTCCTCTGCAAAAATGGGCCTGGTTGAAACAAAAT TGGCGATTATTCCTGGTGGAG (SEQ ID NO: 2) 3 BANK1 NM_001083907.1 DLBCL gene -0.8 0 GGCAAATGAAATGGAAGGGGAAGGAAAACAGAATGGAT CAGGCATGGAGACCAAACACAGCCCACTAGAGGTTGGCA GTGAGAGTTCTGAAGACCAGTAT (SEQ ID NO: 3) 4 BATF3 NM_018664.2 PMBCL gene 2.44 0 CTGCTGTTATGCAGAGCCATTTCCTCTAGAATTTGGATAA TAAAGATGCTTATTGTCTCTCCCTTCTCCAGTTCTGGGAA TTTACAGGCACAATACACTT (SEQ ID NO: 4) 5 BTG2 NM_006763 .2 DLBCL gene -2.23 0 TGCTCTCCTTGGGATGATGGCTGGCTAGTCAGCCTTGCAT GTATTCCTTGGCTGAATGGGAGAGTGCCCCATGTTCTGCA AGACTACTTGGTATTCTTGT (SEQ ID NO: 5) 6 CARD11 NM_032415.2 DLBCL gene -3.12 0 TTGAAAATCGGCCCAAGAAGGAGCAGGTTCTGGAACTGG AGCGGGAGAATGAAATGCTGAAGACCAAAAACCAGGAG CTGCAGTCCATCATCCAGGCCGG (SEQ ID NO: 6) 7 CCDC50 NM_174908.3 ABC Gene 0 40.54 AAACACTTTCCAGAGTTCCCTGCAACCCGTGCTTATGCAG ATAGTTACTATTATGAAGATGGAGGAATGAAGCCAAGAG TGATGAAAGAAGCTGTATCTA (SEQ ID NO: 7) 8 CCL17 NM_002987.2 PMBCL gene 0.98 0 GCCTGGAGTACTTCAAGGGAGCCATTCCCCTTAGAAAGC TGAAGACGTGGTACCAGACATCTGAGGACTGCTCCAGGG ATGCCATCGTTTTTGTAACTGT (SEQ ID NO: 8) 9 CREB3L2 NM_194071.2 ABC Gene 0 65.79 ATGCCTGAGGGGATCAGGCTTTTCTACTCCAGGCAAACCT GCCCCATCTTGTCGCTTTTAGGACCTCCCACAACCTGGTT CCCCACACATCCATAGTTCT (SEQ ID NO: 9) 10 CYB5R2 NM_016229.3 ABC Gene 0 67.72 CCATGTCTTAGGGCTTCCTGTAGGTAACTATGTCCAGCTC TTGGCAAAAATCGATAATGAATTGGTGGTCAGGGCTTAC ACCCCTGTCTCCAGTGATGAT (SEQ ID NO: 10) 11 DNAJB12 NM_017626.4 Housekeeping -2.97 -4.14 TTTCTTCCATGTTTTAGAAAATGAGGCCTGTTTGGGGAAG GTACCCTGGTGATGTTTTTGCTAGACATTAGCTGTAGCTG ACAGCATAAGGAGAGTCGCA (SEQ ID NO: 11) 12 FAM159A NM_001042693.1 DLBCL gene -1.78 0 ACAGCTACATGTGGTGGCTCAGCATTGGCGCTCTCATAGG CCTGTCCGTAGCAGCAGTGGTTCTTCTCGCCTTCATTGTT ACCGCCTGTGTGCTCTGCTA (SEQ ID NO: 12) 13 FSCN1 NM_003088.2 PMBCL gene 1.01 0 CCCTGCCCTCTTGTCTGCCACGGGGCGAGTCTGGCACCTC TTTCTTCTGACCTCAGACGGCTCTGAGCCTTATTTCTCTGG AAGCGGCTAAGGGACGGTT (SEQ ID NO: 13) 14 GIT2 NM_057169.2 Housekeeping -2.97 -4.14 CAGATTTTACAGGCTGAATTATTGGCAGTATATGGAGCA GACCCAGGCACACAGGATTCTAGTGGGAAAACTCCCGTT GATTATGCAAGGCAAGGAGGGC (SEQ ID NO: 14) 15 GSK3B NM_002093.2 Housekeeping -2.97 -4.14 ACTGATTATACCTCTAGTATAGATGTATGGTCTGCTGGCT GTGTGTTGGCTGAGCTGTTACTAGGACAACCAATATTTCC AGGGGATAGTGGTGTGGATC (SEQ ID NO: 15) 16 HOMER2 NM_004839.2 PMBCL gene 0.89 0 TGGAAGACAAAGTGCGTTCCTTAAAGACAGACATTGAGG AGAGCAAATACCGACAGCGCCACCTGAAGGTGGAGTTGA AGAGCTTCCTGGAGGTGCTGGA (SEQ ID NO: 16) 17 IFIH1 NM_022168.2 PMBCL gene 3.35 0 GCTTGGGAGAACCCTCTCCCTTCTCTGAGAAAGAAAGAT GTCGAATGGGTATTCCACAGACGAGAATTTCCGCTATCTC ATCTCGTGCTTCAGGGCCAGG (SEQ ID NO: 17) 18 IK NM_006083.3 Housekeeping -2.97 -4.14 GTCCAAATTCTTGGGTGGTGACATGGAACACACCCATTTG GTGAAAGGCTTGGATTTTGCTCTGCTTCAAAAGGTACGAG CTGAGATTGCCAGCAAAGAG (SEQ ID NO: 18) 19 IL13RA1 NM_001560.2 PMBCL gene 1.63 0 TCTGCACTGGAAGAAGTACGACATCTATGAGAAGCAAAC CAAGGAGGAAACCGACTCTGTAGTGCTGATAGAAAACCT GAAGAAAGCCTCTCAGTGATGG (SEQ ID NO: 19) 20 IRF4 NM_002460.1 ABC Gene 0 71.92 GGGCACTGTTTAAAGGAAAGTTCCGAGAAGGCATCGACA AGCCGGACCCTCCCACCTGGAAGACGCGCCTGCGGTGCG CTTTGAACAAGAGCAATGACTT (SEQ ID NO: 20) 21 ISY1 NM_020701.2 Housekeeping -2.97 -4.14 GGCAAAACATCAGTGTCTGTGGGTAGTTGGAATCTTCAGT TCCTGTGAGCGTCGGCGTCTTCTGGGCCTGTGGAGTTTCT TGGACAGGGGCCGCGGGGCT (SEQ ID NO: 21) 22 ITPKB NM_002221.3 GCB gene 0 -67.78 GTGGCCTCCTGGCATCATTTGTTATTGCCTCTGAAACAAG CCTTACTGCCTGGAGGGCTTAGATTCCTGCTTCTCCAATG TAGTGTGGGTATCTTGTAGG (SEQ ID NO: 22) 23 LIMA1 NM_001113547.1 PMBCL gene 1.8 0 AACTACATCCTGAACTCGACGTCCTGAGGTATAATACAA CAGAGCACTTTTTGAGGCAATTGAAAAACCAACCTACAC TCTTCGGTGCTTAGAGAGATCT (SEQ ID NO: 23) 24 LIMD1 NM_014240.2 ABC Gene 0 61.92 AAGGCAAGTCTCAGGAACCCATGCAGGTACATCGCTTGC ACCTGTTTTTAGCTTATTTAATGACGGGCTTTTGGGAAGA GCTGCCCGCATACTGAGAGAC (SEQ ID NO: 24) 25 MAL NM_002371.2 PMBCL gene 0.54 0 GCCTTCGCGTCCGGGTTGGGAGCTTGCTGTGTCTAACCTC CAACTGCTGTGCTGTCTGCTAGGGTCACCTCCTGTTTGTG AAAGGGGACCTTCTTGTTCG (SEQ ID NO: 25) 26 MAML3 NM_018717.4 GCB gene 0 -58.59 TGGAAGCCATCAACAATTTGCCCAGTAACATGCCACTGC CTTCAGCTTCTCCTCTTCACCAACTTGACCTGAAACCTTCT TTGCCCTTGCAGAACAGTGG (SEQ ID NO: 26) 27 MME NM_000902.2 GCB gene 0 -56.55 GGATTGTAGGTGCAAGCTGTCCAGAGAAAAGAGTCCTTG TTCCAGCCCTATTCTGCCACTCCTGACAGGGTGACCTTGG GTATTTGCAATATTCCTTTGG (SEQ ID NO: 27) 28 MOBKL2C NM_145279.4 PMBCL gene 3.37 0 TTCTCTTACCCAGAGATGCCCATGAGCTGACATTTTACTC ATCCCTCTGCCTCCAAGAAGGCCTGTATTATACGTGTCCT CCTGGGGGTTGGAGATGATC (SEQ ID NO: 28) 29 MST1R NM_002447.1 PMBCL gene 1.69 0 CCACTTTGGAGTTGTCTACCACGGAGAATACATAGACCA GGCCCAGAATCGAATCCAATGTGCCATCAAGTCACTAAG TCGCATCACAGAGATGCAGCAG (SEQ ID NO: 29) 30 MYBL1 XM_034274.14 GCB gene 0 -72.92 GGCAAACGCTGTGTTATCCTCTTTGCAGACCATCCCAGAA TTTGCAGAGACTCTAGAACTTATTGAATCTGATCCTGTAG CATGGAGTGACGTTACCAGT (SEQ ID NO: 30) 31 NECAP2 NM_018090.4 PMBCL gene 6.6 0 CTCTCCTCTCCTCCTTGTCTGGCTCTGTTGACAAACCGGG CATGTTTGGCAGTAAATTGGCACCGTGTCACACTGTTTCC TGGGATTCAAGTATGCAACC (SEQ ID NO: 31) 32 NFIL3 NM_005384.2 PMBCL gene 2.06 0 CCTTTCTTTCTCCTCGCCGGCCCGAGAGCAGGAACACGAT AACGAAGGAGGCCCAACTTCATTCAATAAGGAGCCTGAC GGATTTATCCCAGACGGTAGA (SEQ ID NO: 32) 33 OPA1 NM_130837.1 Housekeeping -2.97 -4.14 CTGAGACCATATCCTTAAATGTAAAAGGCCCTGGACTAC AGAGGATGGTGCTTGTTGACTTACCAGGTGTGATTAATAC TGTGACATCAGGCATGGCTCC (SEQ ID NO: 33) 34 PDCDILG2 NM_025239.3 PMBCL gene 1.98 0 AGGAAAATAAACACTCACATCCTAAAGGTTCCAGAAACA GATGAGGTAGAGCTCACCTGCCAGGCTACAGGTTATCCT CTGGCAGAAGTATCCTGGCCAA (SEQ ID NO: 34) 35 PHF23 NM_024297.2 Housekeeping -2.97 -4.14 CTGTCTGTGTCCCGACACATAATCTCTGTCTCTTGGACCT GCCACCATCACTTTCTGGGTCAGGATTGGAATTGGGATGG AATGGGACAGTTGTCTATAA (SEQ ID NO: 35) 36 PIM2 NM_006875.2 ABC Gene 0 71.8 GCCATCCAGCACTGCCATTCCCGTGGAGTTGTCCATCGTG ACATCAAGGATGAGAACATCCTGATAGACCTACGCCGTG GCTGTGCCAAACTCATTGATT (SEQ ID NO: 36) 37 PRDX2 NM_005809.4 DLBCL gene -1.28 0 GCATGGGGAAGTTTGTCCCGCTGGCTGGAAGCCTGGCAG TGACACGATTAAGCCCAACGTGGATGACAGCAAGGAATA TTTCTCCAAACACAATTAGGCT (SEQ ID NO: 37) 38 PRKCB NM_212535.1 DLBCL gene -1.83 0 GCATTTGGAGTCCTGCTGTATGAAATGTTGGCTGGGCAGG CACCCTTTGAAGGGGAGGATGAAGATGAACTCTTCCAAT CCATCATGGAACACAACGTAG (SEQ ID NO: 38) 39 PRR6 NM_181716.2 PMBCL gene 1.33 0 TTCATTGTTCCAGCTTCTCGCTTCAAGCTCCTGAAGGGAG CTGAGCACATAACGACTTACACGTTCAATACTCACAAAG CCCAGCATACCTTCTGTAAGA (SEQ ID NO: 39) 40 PTG1R NM_000960.3 PMBCL gene 2.06 0 CTGACATTTCAAGCTGACCCTGTGATCTCTGCCCTGTCTT CGGGCGACAGGAGCCAGAAAATCAGGGACATGGCTGAT GGCTGCGGATGCTGGAACCTTG (SEQ ID NO: 40) 41 QSOX1 NM_002826.4 PMBCL gene 2.85 0 TAGGGCAGCTCAGTCCCTGGCCTCTTAGCACCACATTCCT GTTTTTCAGCTTATTTGAAGTCCTGCCTCATTCTCACTGGA GCCTCAGTCTCTCCTGCTT (SEQ ID NO: 41) 42 R3HDM1 NM_015361.2 Housekeeping -2.97 -4.14 CCTGTGTTCCCAAGAGAATTACATTATTGACAAAAGACTC CAAGACGAGGATGCCAGTAGTACCCAGCAGAGGCGCCAG ATATTTAGAGTTAATAAAGAT (SEQ ID NO: 42) 43 RAB7L1 NM_001135664.1 ABC Gene 0 70.45 CATTTGAATTGTCTCCTGACTACTGTCCAGTAAGGAGGCC CATTGTCACTTAGAAAAGACACCTGGAACCCATGTGCATT TCTGCATCTCCTGGATTAGC (SEQ ID NO: 43) 44 RCL1 NM_005772.3 PMBCL gene 1.32 0 TGGTGAATCATTTGAACTGAAGATTGTGCGACGGGGAAT GCCTCCCGGAGGAGGAGGCGAAGTGGTTTTCTCATGTCCT GTGAGGAAGGTCTTGAAGCCC (SEQ ID NO: 44) 45 RHOF NM_019034.2 PMBCL gene 2.48 0 CTGCGGCAAGACCTCGCTGCTCATGGTGTACAGCCAGGG CTCCTTCCCCGAGCACTACGCCCCATCGGTGTTCGAGAAG TACACGGCCAGCGTGACCGTT (SEQ ID NO: 45) 46 S1PR2 NM_004230.2 GCB gene 0 -78.74 TCCCGCCAGGTGGCCTCGGCCTTCATCGTCATCCTCTGTT GCGCCATTGTGGTGGAAAACCTTCTGGTGCTCATTGCGGT GGCCCGAAACAGCAAGTTCC (SEQ ID NO: 46) 47 SERPINA9 NM_001042518.1 GCB gene 0 -61.81 CCACTAAATCCTAGGTGGGAAATGGCCTGTTAACTGATG GCACATTGCTAATGCACAAGAAATAACAAACCACATCCC TCTTTCTGTTCTGAGGGTGCAT (SEQ ID NO: 47) 48 SLAMF1 NM_003037.2 PMBCL gene 1.18 0 GTGTCTCTTGATCCATCCGAAGCAGGCCCTCCACGTTATC TAGGAGATCGCTACAAGTTTTATCTGGAGAATCTCACCCT GGGGATACGGGAAAGCAGGA (SEQ ID NO: 48) 49 SNX11 NM_013323.2 PMBCL gene 2.79 0 TCATTTGTATGTAGGACCAGGAGTATCTCCTCAGGTGACC AGTTTTGGGGACCCGTATGTGGCAAATTCTAAGCTGCCAT ATTGAACATCATCCCACTGG (SEQ ID NO: 49)
50 TFPI2 NM_006528.2 PMBCL gene 1.06 0 TTTAATCCAAGATACAGAACCTGTGATGCTTTCACCTATA CTGGCTGTGGAGGGAATGACAATAACTTTGTTAGCAGGG AGGATTGCAAACGTGCATGTG (SEQ ID NO: 50) 51 TMOD1 NM_003275.2 PMBCL gene 1.15 0 AGATGCTCAAGGAGAACAAGGTGTTGAAGACACTGAATG TGGAATCCAACTTCATTTCTGGAGCTGGGATTCTGCGCCT GGTAGAAGCCCTCCCATACAA (SEQ ID NO: 51) 52 TNERSF13B NM_012452.2 ABC Gene 0 66.49 TGCAAAACCATTTGCAACCATCAGAGCCAGCGCACCTGT GCAGCCTTCTGCAGGTCACTCAGCTGCCGCAAGGAGCAA GGCAAGTTCTATGACCATCTCC (SEQ ID NO: 52) 53 TRAF1 NM_005658.3 PMBCL gene 1.98 0 CGAGTGATGGGTCTAGGCCCTGAAACTGATGTCCTAGCA ATAACCTCTTGATCCCTACTCACCGAGTGTTGAGCCCAAG GGGGGATTTGTAGAACAAGCC (SEQ ID NO: 53) 54 TRIM56 NM_030961.1 Housekeeping -2.97 -4.14 GTGGAGGCCGAGGACATTTTCCTGAAGGGCAGGGGTTGG CAACTTTTCAACATGGAGTGCCAAACTGCTAACCCGTCTT CTAGTGTGTGAGAATAGGGAC (SEQ ID NO: 54) 55 UBXN4 NM_014607.3 Housekeeping -2.97 -4.14 CATCGCGACGGCCAAAAGGAGCGGCGCGGTCTTCGTGGT GTTCGTGGCAGGTGATGATGAACAGTCTACACAGATGGC TGCAAGTTGGGAAGATGATAAA (SEQ ID NO: 55) 56 VRK3 NM_016440.3 Housekeeping -2.97 -4.14 ACAGACAAGAGTGGGCGACAGTGGAAGCTGAAGTCCTTC CAGACCAGGGACAACCAGGGCATTCTCTATGAAGCTGCA CCCACCTCCACCCTCACCTGTG (SEQ ID NO: 56) 57 WAC NM_100486.2 Housekeeping -2.97 -4.14 CCTCTGGACTGAACCCCACATCTGCACCTCCAACATCTGC TTCAGCGGTCCCTGTTTCTCCTGTTCCACAGTCGCCAATA CCTCCCTTACTTCAGGACCC (SEQ ID NO: 57) 58 WDR55 NM_017706.4 Housekeeping -2.97 -4.14 CTACCTCTTCAATTGGAATGGCTTTGGGGCCACAAGTGAC CGCTTTGCCCTGAGAGCTGAATCTATCGACTGCATGGTTC CAGTCACCGAGAGTCTGCTG (SEQ ID NO: 58)
[0034] The above set of genes comprise the Lymph3Cx assay, which includes probe sets for 30 PMBCL/DLBCL predictive genes that were identified by being strongly differentially expressed between the PMBCL and DLBCL in U133+ data, strongly differentially expressed between the PMBCL and DLBCL in Lymph5Cx data, and differentially expressed between the DLBCL and PMBCL/cHL cell lines; 15 probes sets that had been included on the Lymph2Cx assay as being predictive of the ABC and GCB subtypes within DLBCL; probe sets for 13 housekeeping genes (including the 5 housekeeping genes from the Lymph2Cx assay) that showed strong expression and low variability in both U133+ and Lymph5Cx data and so were suitable for normalization. The data are discussed in the Example below.
[0035] In an embodiment, an equation used to determine a tumor predictor score is:
S=.SIGMA..sub.k=0.sup.58a.sub.ix.sub.i,
wherein a.sub.i is the model coefficient value for gene i as listed in Table 1, column D for determining whether the sample is PMBCL or DLBCL and as listed in Table 1, column E for determining whether the sample is ABC DLBCL or GCB DLBCL, and x.sub.i is the log.sub.2 transformed expression signal value for gene i.
[0036] In an embodiment, the coefficients used to generate a tumor predictor score may be refined, and tumor predictor score cut-points used to produce model scores may be refined. For example, using methods as described herein with the same genes as those in Table 1, the coefficients for each gene may be determined to be different than as listed in Table 1 based on, e.g., the use of different types of sample (e.g., fresh) or use of different microarrays that provide different signal values. In an embodiment, the above methods may be incorporated into other methods, for example a Bayesian method as described in International Patent Application Publication No. WO 2015/069790, which is incorporated herein by reference.
[0037] In an embodiment, the present invention also provides a method for classifying a lymphoma according to the following tumor predictor scores (S value cut-points): (i) DLBCL when S is less than -57.95, (ii) PMBCL when S is greater than -23.57, (iii) uncertain DLBCL/PMBCL when S is between -57.95 and -23.57, (iv) GCB DLBCL when S is less than 798.5, (v) ABC DLBCL when S is greater than 1324.5, or (vi) uncertain ABC/GCB DLBCL when S is between 798.5 and 1324.5. Such an embodiment uses the equation
S = k = 0 58 a i x i ##EQU00007##
as defined above.
[0038] In an embodiment, an equation used to determine the probability score P(PMBCL) of a sample is
P ( PMBCL ) = .PHI. ( S PMBCL / DLBCL ; .mu. PMBCL , .sigma. PMBCL ) .PHI. ( S ; .mu. PMBCL , .sigma. PMBCL ) + .PHI. ( S ; .mu. DLBCL , .sigma. DLBCL ) ##EQU00008##
wherein S.sub.PMBCL/DLBCL is the tumor predictor score; .mu..sub.PMBCL, .mu..sub.DLBCL and .sigma..sub.PMBCL, .sigma..sub.DLBCL represent the mean and standard deviations of the PMBCL and DLBCL subtypes as indicated in Table 2, herein.
[0039] In an embodiment, an equation used to determine the probability score P(ABC) of a sample is
P ( ABC ) = .PHI. ( S ABC / GCB ; .mu. ABC , .sigma. ABC ) .PHI. ( S ; .mu. ABC , .sigma. ABC ) + .PHI. ( S ; .mu. GCB , .sigma. GCB ) ##EQU00009##
wherein S.sub.ABC/GCB is the tumor predictor score; .mu..sub.ABC, .mu..sub.GCB and .sigma..sub.ABC, .sigma..sub.GCB represent the mean and standard deviations of the ABC and GCB subtypes as indicated in Table 2; and wherein .phi.(x; .mu., .sigma.) is the standard normal density calculated by
.PHI. ( x ; .mu. , .sigma. ) = 1 2 .pi..sigma. 2 exp ( - ( x - .mu. ) 2 2 .sigma. 2 ) . ##EQU00010##
[0040] In an embodiment, after the P(PMBCL) and P(ABC) have been calculated for a particular sample, the sample is classified according Table 3, provided herein.
[0041] In an embodiment, the present invention entails the development of a set of nucleic acid probes that are able to measure the abundance of particular mRNA species using the NanoString Technologies.RTM. platform for the purpose of gene expression profiling of PMBCL in order to distinguish this lymphoma subtype from other subtypes of aggressive B cell lymphoma. In this embodiment, RNA is extracted from, e.g., FFPE, samples using standard commercial kits and then hybridized and detected. The resultant digital RNA counts reflect the relative abundance of mRNAs transcribed from different genes. These expression levels are then combined in statistical algorithms to create a tumor predictor score that provides a probability that a tumor is PMBCL, ABC DLBCL, or GCB DLBCL.
[0042] In an embodiment, the present invention provides a composition consisting of probes to the target sequences described herein. In another embodiment, the present invention also provides a kit comprising the probes, for example, a kit comprising components suitable for performing NanoString Technologies.RTM. nCounter.RTM. digital gene expression assays.
[0043] An "effective amount" or "an amount effective to treat" refers to a dose that is adequate to prevent or treat cancer in an individual. Amounts effective for a therapeutic or prophylactic use will depend on, for example, the stage and severity of the disease being treated, the age, weight, and general state of health of the patient, and the judgment of the prescribing physician. The size of the dose will also be determined by the active selected, method of administration, timing and frequency of administration, the existence, nature, and extent of any adverse side-effects that might accompany the administration of a particular active, and the desired physiological effect. It will be appreciated by one of skill in the art that various cancers could require prolonged treatment involving multiple administrations, perhaps using various rounds of administration.
[0044] The terms "treat," and "prevent" as well as words stemming therefrom, as used herein, do not necessarily imply 100% or complete treatment or prevention. Rather, there are varying degrees of treatment or prevention of which one of ordinary skill in the art recognizes as having a potential benefit or therapeutic effect. In this respect, the methods can provide any amount or any level of treatment or prevention of cancer in a subject. Furthermore, the treatment or prevention provided by the method can include treatment or prevention of one or more conditions or symptoms of the disease being treated or prevented. Also, for purposes herein, "prevention" can encompass delaying the onset of the disease, or a symptom or condition thereof, or recurrence of the disease.
[0045] Treatment can be with an effective amount of infusional dose-adjusted etoposide, doxorubicin, and cyclophosphamide with vincristine, prednisone, and rituximab (DA-EPOCH-R) when the classification is PMBCL or with an effective amount of rituximab, cyclophosphamide, doxorubicin, vincristine, and prednisone (R-CHOP) when the classification is DLBCL, uncertain DLBCL/PMBCL, GCB DLBCL, ABC DLBCL, or uncertain ABC/GCB DLBCL. When the classification is PMBCL, an effective amount of filgrastim can also be used.
[0046] For treatment, the first cycle of DA-EPOCH-R (dose level 1) can be administered as previously described (Wilson et al., J. Clin. Oncol., 26:2717-24 (2008), incorporated herein by reference) and shown in Table 4 (mg/m.sup.2/day), with the following as exemplary: rituximab (rituxan; Genentech, South San Francisco, Calif., USA) 375 as 3-hour infusion day 1; doxorubicin (generic) 10, etoposide (generic) 50 and vincristine (generic) 0.4 (no cap) as a continuous infusion on days 1, 2, 3, 4 (96-hour total); cyclophosphamide (generic) 750 as 2-hour infusion on day 5; and prednisone (generic) 60 twice daily (120 mg/m.sup.2/day) on days 1, 2, 3, 4, 5. Patients can receive filgrastim (neupogen; Amgen, Thousand Oaks, Calif., USA) 300 .mu.g on day 6 through absolute neutrophil count (ANC)>5000 cells/.mu.l (5.0.times.10.sup.9 cells/1) past the nadir. Subsequent cycles can be dose adjusted every cycle based on the neutrophil nadir, which can be monitored with twice-weekly complete blood counts (Table 5). If the ANC nadir is .gtoreq.500 cells/.mu.l (0.5.times.10.sup.9 cells/1), the doses can be increased 20%; if the nadir ANC is <500 cells/.mu.l (0.5.times.10.sup.9 cells/1) the doses can be left unchanged; or if the platelet nadir is <25,000/.mu.l (25.0.times.10.sup.9 cells/I) the doses can be reduced 20% from those on the previous cycle (Table 6). Dose adjustments above dose level 1 can be applied to etoposide, doxorubicin and cyclophosphamide, and adjustments below dose level 1 can be applied to cyclophosphamide. Deviations from the adjustment paradigm can be made in the event of a critical illness on the previous cycle. Vincristine can be reduced 25% or 50% for grade 2 or 3 motor neuropathy, respectively, and can be reduced 50% for grade 3 sensory neuropathy. Patients with >1 extranodal site and elevated lactate dehydrogenase can receive intrathecal methotrexate 12 mg on day 1 and 5 of cycles 3-6.
TABLE-US-00002 TABLE 4 Dose Treatment mg/m.sup.2/day Days Infusional Agents Etoposide 50 Vincristine 0.4 (No cap) Days 1, 2, 3, 4 Doxorubicin 10 Bolus Agents Prednisone 60 BID Days 1, 2, 3, 4, 5 Cyclophosphamide 750 Day 5 Biologic Agents Rituximab 375 Day 1 Filgrastim 5 (.mu.g/kg) Days 6 .fwdarw. ANC recovery
[0047] Dose-Adjusted EPOCH-R Regimen. Exemplary doses for the first cycle (dose level 1) are shown. Rituximab can be infused as per manufacturers guidelines. Immediately after completion of rituximab, the infusional agents can be administered using a portable infusion pump through a central venous device. After completion of the infusions (on day 5), cyclophosphamide can be administered on the same day as per manufacturers guidelines. All treatment may be administered outpatient. Cycles can be repeated every three weeks. Patients with an ANC<1000/.mu.l on day one of the next cycle can receive one dose of filgrastim and treated the following day if the ANC>1000/.mu.l. Patients with platelet counts<75,000/.mu.l can be observed for up to one week and treated when the platelets are >75,000/.mu.l. Patients with bone marrow involvement by lymphoma can be treated on time irrespective of the ANC and platelet counts if safe. Patients can receive 6 cycles of treatment. If the tumor masses shrink>20% between the end of cycle 4 and 6, two additional cycles can be administered.
TABLE-US-00003 [0047] TABLE 5 Dose adjustments above level 1 apply to etoposide, doxorubicin and cyclophosphamide Dose adjustments below level 1 apply to cyclophosphamide only. Measurement of ANC nadir based on twice-weekly complete blood counts. These drug doses are based on previous cycle ANC nadir as follows: If Nadir ANC .gtoreq.500/.mu.l: .uparw. 1 dose level above last cycle If Nadir ANC <500/.mu.l: Same dose level as last cycle Or If nadir platelet <25,000/.mu.l: .dwnarw.1 dose level below last cycle.
[0048] Pharmacodynamic Dose-Adjustment Paradigm. Dose adjustment above level 1 can apply to etoposide, doxorubicin and cyclophosphamide, and adjustments below level 1 might only apply to cyclophosphamide (see Table 6). The pharmacodynamic dose adjustment can be based on the previous cycle absolute neutrophil nadir. This can be monitored by obtaining twice weekly complete blood counts. As shown, if the ANC nadir is .gtoreq.500/.mu.l, the doses can be increased one dose level, whereas if the ANC<500/.mu.l, the doses can be unchanged. Reduction by one dose level can be done if the nadir platelet<.sup.25,000/.mu.l. On rare occasions, patients may develop prolonged neutropenia<500/.mu.l for over seven days or life threatening infections associated with organ failure or prolonged morbidity. In these cases, physicians can use their clinical judgment regarding reduction by one dose level. Doses might not be reduced for non-life threatening infections. Doses might not be reduced for neutropenia or thrombocytopenia in patients with bone marrow compromise due to marrow involvement by lymphoma unless life-threatening complications occur.
TABLE-US-00004 [0048] TABLE 6 Drug Doses per Dose Levels Drugs -2 -1 1 2 3 4 5 6 Doxorubicin (mg/m.sup.2/day) 10 10 10 12 14.4 17.3 20.7 24.8 Etoposide (mg/m.sup.2/day) 50 50 50 60 72 86.4 103.7 124.4 Cyclophosphamide (mg/m.sup.2/day) 480 600 750 900 1080 1296 1555 1866 Drug Dose Levels. Exemplary drug dose escalation for doxorubicin, etoposide and cyclophosphamide are shown for each dose level. The doses can be escalated 20% above the last cycle. The 20% dose escalation can be based on the previous doses (i.e. compounded dose escalation). Cyclophosphamide might only be adjusted when reducing below level 1.
[0049] The agents in DA-EPOCH-R are administered per manufacturer guidelines except for infusional vincristine, etoposide and doxorubicin (Wilson et al., J. Clin. Oncol., 26:2717-24 (2008) and Wilson et al., Blood, 99:2685-93 (2002), each incorporated herein by reference). The daily dose (i.e., 24 hour supply) of vincristine, doxorubicin, and etoposide can be admixed together in 0.9% Sodium Chloride Injection. The diluent volume can be based on the etoposide dose for a 24 hour treatment: If etoposide.ltoreq.150 mg per 24 hours, dilute drugs in 500 mL and if etoposide>150 mg per 24 hours, dilute drugs in 1000 mL 0.9% Sodium Chloride Injection. The chemotherapy can then be administered with a suitable infusion pump via a central venous access device. Temporary PICC lines or permanent lines may be used. The bag can be exchanged daily for each of the four days to complete the 96 hour infusion. Stability studies conducted by the Pharmaceutical Development Service, Pharmacy Department, NIH Clinical Center, have demonstrated that admixtures of vincristine, doxorubicin, and etoposide in 0.9% Sodium Chloride Injection, USP at concentrations, respectively, of 1, 25, and 125 .mu.g/mL; 1.4, 35, and 175 .mu.g/mL; 2, 50, and 250 .mu.g/mL; and 2.8, 70, and 350 .mu.g/mL are stable for at least 36 hours at room temperature when protected from light (Wolfe et al., Am. J. Health Syst. Pharm., 56:985-9 (1999), incorporated by reference). Also, admixtures containing vincristine, doxorubicin, etoposide concentrations of 1.6, 40, and 200 pig/mL are stable for at least 30 hours at 32.degree. C. Extravasation of these diluted agents should not cause local tissue damage due to their low concentrations in the diluent. Pegfilgrastim is not a recommended replacement for daily filgrastim due to its unpredictable pharmacokinetics. There may be no maximum number of dose escalations except as limited by the number of cycles.
[0050] All patients can receive the following prophylactic medications on all cycles: [0051] Baxtrim (sulphametoxazole and trimethoprim) DS 1 tablet TIW (equivalent if allergic) [0052] Omeprazole 20 mg PO QD daily (or equivalent) [0053] Docusate and senna 2 tablets PO BID as necessary for constipation [0054] Lactulose 20 gms Q6 PO as necessary for constipation. [0055] Hepatis B surface Ag+ patients can receive anti-viral therapy daily until 8 weeks past chemotherapy completion.
[0056] See Dunleavy et al, N. Engl. J. Med., 368:1408-1416 (2013), and supplementary materials, incorporated herein by reference in its entirety, with regard to treatment.
[0057] The following includes certain aspects of the invention.
[0058] 1. A method for classifying the lymphoma type of a sample, the method comprising:
[0059] (a) providing a formalin-fixed and paraffin-embedded (FFPE) lymphoma sample from the subject;
[0060] (b) isolating RNA from the sample;
[0061] (c) obtaining gene expression data from the RNA,
[0062] wherein the gene expression data comprises signal values that represent expression levels for each gene of Table 1; and
[0063] (d) determining a tumor predictor score from the gene expression data, wherein the tumor predictor score is calculated by
S=.SIGMA..sub.k=0.sup.58a.sub.ix.sub.i,
wherein a.sub.i is the model coefficient value for gene i as listed in Table 1, column D for determining whether the sample is PMBCL or DLBCL and as listed in Table 1, column E for determining whether the sample is ABC DLBCL or GCB DLBCL,
[0064] and x.sub.i is the log.sub.2 transformed expression signal value for gene i; and
[0065] (e) when the coefficient values in column D of Table 1 are used, classifying the lymphoma as: [0066] (i) DLBCL when S is less than -57.95, [0067] (ii) PMBCL when S is greater than -23.57, [0068] (iii) uncertain DLBCL/PMBCL when S is between -57.95 and -23.57,
[0069] (e') when the coefficient values in column E of Table 1 are used, classifying the lymphoma as: [0070] (iv) GCB DLBCL when S is less than 798.5, [0071] (v) ABC DLBCL when S is greater than 1324.5, or [0072] (vi) uncertain ABC/GCB DLBCL when S is between 798.5 and 1324.5.
[0073] 2. The method of aspect 1, wherein the method further comprises determining the probability that the sample is PMBCL or ABC DLBCL, wherein the probability is determined by
[0074] (g) determining the probability that the sample is PMBCL by calculating the probability score of
P ( PMBCL ) = .PHI. ( S PMBCL / DLBCL ; .mu. PMBCL , .sigma. PMBCL ) .PHI. ( S ; .mu. PMBCL , .sigma. PMBCL ) + .PHI. ( S ; .mu. DLBCL , .sigma. DLBCL ) , ##EQU00011##
wherein S.sub.PMBCL/DLBCL is the tumor predictor score; .mu..sub.PMBCL, .mu..sub.DLBCL and .sigma..sub.PMBCL, .sigma..sub.DLBCL represent the mean and standard deviations of the PMBCL and DLBCL subtypes as indicated in Table 2;
[0075] (h) determining the probability that the samples is ABC DLBCL by calculating the probability score of
P ( ABC ) = .PHI. ( S ABC / GCB ; .mu. ABC , .sigma. ABC ) .PHI. ( S ; .mu. ABC , .sigma. ABC ) + .PHI. ( S ; .mu. GCB , .sigma. GCB ) , ##EQU00012##
wherein S.sub.ABC/GCB is the tumor predictor score; .mu..sub.ABC, .mu..sub.GCB and .sigma..sub.ABC, .sigma..sub.GCB represent the mean and standard deviations of the ABC and GCB subtypes as indicated in Table 2; and
[0076] wherein .phi.(x; .mu., .sigma.) is the standard normal density calculated by
.PHI. ( x ; .mu. , .sigma. ) = 1 2 .pi..sigma. 2 exp ( - ( x - .mu. ) 2 2 .sigma. 2 ) . ##EQU00013##
[0077] 3. The method of aspect 2, wherein a score of P(PMBCL).gtoreq.0.9 indicates that the sample is PMBCL, regardless of the P(ABC) score.
[0078] 4. The method of aspect 2, wherein a score of P(PMBCL).ltoreq.0.1 and a score of P(ABC).ltoreq.0.1 indicates that the tumor is GCB DLBCL.
[0079] 5. The method of aspect 2, wherein a score of P(PMBCL).ltoreq.0.1 and a score of P(ABC).gtoreq.0.9 indicates that the tumor is ABC DLBCL.
[0080] 6. The method of aspect 2, wherein a score of P(PMBCL).ltoreq.0.1 and a score of P(ABC) greater than 0.1 and less than 0.9 indicates that the tumor is an unclassified DLBCL.
[0081] 7. The method of any one of aspects 1-6, wherein the RNA gene expression data is obtained using a NanoString Technologies.RTM. nCounter.RTM. assay.
[0082] 8. A method of treating a human subject having lymphoma, the method comprising:
[0083] (a) obtaining a formalin-fixed and paraffin-embedded (FFPE) lymphoma sample from the subject;
[0084] (b) isolating RNA from the sample;
[0085] (c) obtaining gene expression data from the RNA,
[0086] wherein the gene expression data comprises signal values that represent expression levels for each gene of Table 1;
[0087] (d) determining a tumor predictor score from the gene expression data, wherein the tumor predictor score is calculated by
S=.SIGMA..sub.k=0.sup.58a.sub.ix.sub.i,
wherein a.sub.i is the model coefficient value for gene i as listed in Table 1, column D for determining whether the sample is PMBCL or DLBCL and as listed in Table 1, column E for determining whether the sample is ABC DLBCL or GCB DLBCL,
[0088] and x.sub.i is the log.sub.2 transformed expression signal value for gene i;
[0089] (e) when the coefficient values in column D of Table 1 are used, classifying the lymphoma as: [0090] (i) DLBCL when S is less than -57.95, [0091] (ii) PMBCL when S is greater than -23.57, [0092] (iii) uncertain DLBCL/PMBCL when S is between -57.95 and -23.57,
[0093] (e') when the coefficient values in column E of Table 1 are used, classifying the lymphoma as: [0094] (iv) GCB DLBCL when S is less than 798.5, [0095] (v) ABC DLBCL when S is greater than 1324.5, or [0096] (vi) uncertain ABC/GCB DLBCL when S is between 798.5 and 1324.5; and
[0097] (f) treating the subject with an effective amount of DA-R-EPOCH when the classification is PMBCL or with an effective amount of R-CHOP when the classification is DLBCL, uncertain DLBCL/PMBCL, GCB DLBCL, ABC DLBCL, or uncertain ABC/GCB DLBCL.
[0098] 9. The method of aspect 8, wherein the method further comprises determining the probability that the sample is PMBCL or ABC DLBCL, wherein the probability is determined by
[0099] (g) determining the probability that the sample is PMBCL by calculating the probability score of
P ( PMBCL ) = .PHI. ( S PMBCL / DLBCL ; .mu. PMBCL , .sigma. PMBCL ) .PHI. ( S ; .mu. PMBCL , .sigma. PMBCL ) + .PHI. ( S ; .mu. DLBCL , .sigma. DLBCL ) , ##EQU00014##
wherein S.sub.PMBCL/DLBCL is the tumor predictor score; .mu..sub.PMBCL, .mu..sub.DLBCL and .sigma..sub.PMBCL, .sigma..sub.DLBCL represent the mean and standard deviations of the PMBCL and DLBCL subtypes as indicated in Table 2;
[0100] (h) determining the probability that the samples is ABC DLBCL by calculating the probability score of
P ( ABC ) = .PHI. ( S ABC / GCB ; .mu. ABC , .sigma. ABC ) .PHI. ( S ; .mu. ABC , .sigma. ABC ) + .PHI. ( S ; .mu. GCB , .sigma. GCB ) , ##EQU00015##
wherein S.sub.ABC/GCB is the tumor predictor score; .mu..sub.ABC, .mu..sub.GCB and .sigma..sub.ABC, .sigma..sub.GCB represent the mean and standard deviations of the ABC and GCB subtypes as indicated in Table 2; and
[0101] wherein .phi.(x; .mu., .sigma.) is the standard normal density calculated by
.PHI. ( x ; .mu. , .sigma. ) = 1 2 .pi..sigma. 2 exp ( - ( x - .mu. ) 2 2 .sigma. 2 ) . ##EQU00016##
[0102] 10. The method of aspect 9, wherein a score of P(PMBCL).gtoreq.0.9 indicates that the sample is PMBCL, regardless of the P(ABC) score.
[0103] 11. The method of aspect 9, wherein a score of P(PMBCL).ltoreq.0.1 and a score of P(ABC).ltoreq.0.1 indicates that the tumor is GCB DLBCL.
[0104] 12. The method of aspect 9, wherein a score of P(PMBCL).ltoreq.0.1 and a score of P(ABC).gtoreq.0.9 indicates that the tumor is ABC DLBCL.
[0105] 13. The method of aspect 9, wherein a score of P(PMBCL).ltoreq.0.1 and a score of P(ABC) greater than 0.1 and less than 0.9 indicates that the tumor is an unclassified DLBCL.
[0106] 14. The method of any one of aspects 8-13, wherein the RNA gene expression data is obtained using a NanoString Technologies.RTM. nCounter.RTM. assay.
[0107] It shall be noted that the preceding are merely examples of embodiments. Other exemplary embodiments are apparent from the entirety of the description herein. It will also be understood by one of ordinary skill in the art that each of these embodiments may be used in various combinations with the other embodiments provided herein.
[0108] The following example further illustrates the invention but, of course, should not be construed as in any way limiting its scope.
Example
[0109] This example demonstrates the ability of the newly developed and validated assay to distinguish a PMBCL sample from a DLBCL sample, and to distinguish between ABC DLBCL and GCB DLBCL samples based on gene expression signatures, in accordance with embodiments of the invention.
[0110] All cases included in this study were retrieved from the tissue archives of participating centers. Conventional and immunohistochemically stained slides were reviewed by at least 4 members of the Lymphoma/Leukemia Molecular Profiling Project (LLMPP) expert hematopathology panel. Information on age, sample location and clinical presentation were made available whenever possible. If 3 pathologists independently agreed, a definite diagnosis was established--all other cases were subjected to panel discussion. Pathological diagnosis is referred to as the "gold standard" for DLBCL/PMBCL classification herein. This study was conducted with approval from Institutional Review Boards according to the Declaration of Helsinki.
[0111] Details on study design, gene selection and model building are provided in FIG. 1 and below. Between the training and validation cohorts, in total 108 PMBCL and 127 DLBCL cases were studied. Following deparaffinization, RNA was extracted from up to five 10 .mu.m formalin-fixed, paraffin-embedded (FFPE) tissue sections (tumor content.gtoreq.60% of tissue area) using the Qiagen DNA/RNA FFPE Kit (Hilden, Germany) according to the manufacturer's instructions. RNA was quantified using a spectrophotometer (Nanodrop, ThermoFisher, Germany). Gene expression analysis was performed on 200 ng of RNA using a custom codeset on the NanoString platform (NanoString Technologies, Seattle, Wash., USA) at the "high sensitivity" setting on the Prep Station and 555 fields of view on second generation nCounter analyzers.
Feature/Gene Selection
[0112] To select genes with high discriminative power to distinguish between PMBCL and DLBCL, a large set of existing gene expression data, previously generated using different platforms (Lenz et al., N. Engl. J. Med., 359: 2313-2323 (2008) and Scott et al., Blood, 124: 3016-3019 (2014), both incorporated herein by reference), was interrogated.
[0113] In total 248 DLBCLs were used, all with gene expression profiling performed on fresh-frozen tissue using the Affymetrix U133 plus 2.0 microarray platform (Thermo Fisher Scientific, Waltham, Mass., USA). A subset of 79 of the cases had matching gene expression analysis performed using NanoString technology in conjunction with a customized codeset containing 814 genes (termed Lymph5Cx) on formalin-fixed, paraffin-embedded (FFPE) material (Scott et al., Blood, 124: 3016-3019 (2014)).
[0114] The dataset for PMBCL consisted of 36 gene expression profiles (GEP) generated with the Affymetrix platform and 42 targeted gene expression data derived from the Lymph5Cx assay, with 13 cases overlapping between the two platforms.
[0115] Affymetrix samples were normalized with the Affymetrix MAS5.0 algorithm and log 2-transformed. NanoString gene expression counts for a given sample were normalized by dividing the counts for each gene by the geometric mean of counts for the housekeeping genes for that sample and then multiplying them by 512. The normalized counts were then log 2-transformed. Lymph3Cx samples for which the geometric mean of the housekeeping genes was less than 60 were excluded from analysis.
[0116] In order to identify genes which were strongly predictive of subtype (i.e. DLBCL or PMBCL), a "Z-score" was calculated for each gene represented on both the Affymetrix and Lymph5Cx platform:
Z i = .mu. Pi - .mu. Di n P .sigma. Pi 2 + n D .sigma. Di 2 n P + n D ##EQU00017##
where {n.sub.P, n.sub.D} represent the number of PMBCL and DLBCL specimens available on a particular platform and {.mu..sub.Pi, .mu..sub.Di, .sigma..sub.Pi.sup.2, .sigma..sub.Di.sup.2} represent their respective means and variances of the normalized signal values of gene i. The genes considered as significant were those for which both the Affymetrix and the Lymph5Cx Z-score were either greater than 1.25 or less than -1.0. In this way, the larger Affymetrix data set was used to identify potential genes, while at the same time ensuring that similar results are likely when analyzing FFPE samples. A less stringent negative cut-point than positive cut-point was used in order to avoid a large imbalance between the number of predictor genes that were characteristic of PMBCL (i.e., higher in PMBCL than DLBCL) rather than characteristic of DLBCL (i.e., higher in DLBCL than PMBCL). These cut-offs resulted in 9 DLBCL characteristic genes and 35 PMBCL characteristic genes.
[0117] To guard against a potential bias of selecting predominantly microenvironment/stroma-related genes, also included was GEP (generated using Affymetrix arrays) of cell lines (42 DLBCL-derived in addition to 3 PMBCL and 3 classical Hodgkin lymphoma (cHL) cell lines). A t-test between the DLBCL and the combined set of PMBCL and cHL lines was performed and any gene which did not show a significant p-value (one-sided p<0.05) in the same direction as it was observed in the patient data was excluded. In this way, the differential expression observed was due to differences in the tumor cells rather than due to infiltrating bystander cells. Fourteen genes were excluded in this step, resulting in a final list of 6 DLBCL characteristic genes and 24 PMBCL characteristic genes (FIG. 2).
Model Building and Score Formulation
[0118] The core training set of cases to build the model and define score thresholds to distinguish PMBCL from DLBCL consisted of 68 cases (48 DLBCL (19 ABC, 19 GCB, 10 unclassified DLBCL) and 20 PMBCL, according to consensus review). Data were normalized as described above. Samples with low normalizer values were excluded from further analyses. Based on the Lymph3Cx data set, a naive linear discriminant analysis score was calculated as follows:
S j = i = 1 58 a i x ij ##EQU00018##
where x.sub.ij is the Lymph3Cx signal (log.sub.2-transformed nCounter expression) for a predictive gene i on sample j, and a.sub.i is a scaling factor.
[0119] The scaling factor coefficients were calculated as follows for the DLBCL/PMBCL model:
a i = .mu. Pi - .mu. Di ( 20 .sigma. Pi 2 + 48 .sigma. Di 2 ) / 68 ##EQU00019##
{.mu..sub.Pi, .mu..sub.Di, .sigma..sub.Pi.sup.2, .sigma..sub.Di.sup.2} represent the observed mean and variance of the log 2-transformed normalized counts for gene i within the PMBCL or DLBCL specimens on the Lymph3Cx platform, and the numbers 20 and 48 are derived from the number of histopathological reviewed DLBCL and PMBCL samples available on the Lymph3Cx platform. Coefficients for housekeeping genes were set to the constant value that would make the total sum of coefficients (both housekeeping and predictive genes) equal to 0. In this way, the model is automatically normalized so that a uniform fold increase or decrease of expression across all genes will have no effect on the model score.
[0120] The scaling factor coefficients for the predictive ABC/GCB genes in the Lymph3Cx ABC/GCB predictor were set equal to those in the Lymph2Cx predictor. Coefficients for housekeeping genes were set to that constant value that would make the total sum of coefficients (both housekeeping and predictive genes) equal to 0.
[0121] The values of the a.sub.i coefficients are provided in Table 1 for the DLBCL/PMBCL and ABC/GCB models.
[0122] All 38 DLBCL samples for which Lymph3Cx data was available were additionally analyzed by the Lymph2Cx array. For these samples the Lymph3Cx model score was compared to the Lymph2Cx model score and were found to be nearly identical except for shift by a constant value of 1109. Therefore, the ABC and GCB variance values were used, as in the Lymph2Cx predictor, but the ABC and GCB means were shifted by 1109 points in the Lymph3Cx predictor, as indicated in Table 2.
[0123] In order to estimate the distribution of the DLBCL vs PMBCL score within the DLBCL and PMBCL subsets score, it was important to draw from as many available cases as possible. To this end, predictor scores were generated for all 313 samples (248 DLBCL and 65 PMBCL) available.
[0124] Of the DLBCL samples, 86 were of the ABC DLBCL type, 121 were of the GCB DLBCL type and 41 were unclassified DLBCL. Of the samples, 284 samples (36 PMBCL, and all DLBCL samples) were analyzed with an Affymetrix U133+ array, 121 of the samples were analyzed with the 814 gene Lymph5Cx array (42 PMBCL, 28 ABC, 38 GCB, 13 unclassified DLBCL). Of the samples, 92 samples (13 PMBCL, 28 ABC, 38 GCB, 13 unclassified DLBCL) were analyzed with both the Affymetrix U133+ and Lymph5Cx arrays.
[0125] For each sample on each platform, a linear model score was generated based on the coefficients defined above (column D of Table 1) but using the normalized gene signal values of the particular platform. To account for platform differences, the Lymph5Cx scores were linearly normalized such that the mean and variance of the normalized Lymph5Cx model score, over the set of 68 cases for which also Lymph3Cx data was available, matched the mean and variance of the Lymph3Cx model score over the same set of cases. Similarly, the Affymetrix model score was normalized to match the normalized Lymph5Cx model score over all cases for which both Lymph5Cx and Affymetrix data was available. As a final score, the Lymph3Cx score was used for all cases for which it was available, the normalized Lymph5Cx score was used for all cases for which Lymph5Cx but not Lymph3Cx was available, and the normalized Affymetrix model score was used for cases in which Lymph5Cx/3Cx was unavailable.
[0126] In more detail, for a given sample j analyzed with the Lymph3Cx platform, a Lymph3Cx model score was calculated as
T j = i = 1 58 a i x ij ##EQU00020##
where x.sub.ij is the log transformed Lymph3Cx for gene i on sample j. Similarly, a Lymph5Cx based score for sample j was calculated as:
F j = i = 1 58 a i y ij ##EQU00021##
where y.sub.ij is the log transformed Lymph5Cx counts for gene i on sample j. The model was then linearly adjusted so that it matches the mean and variance of the Lymph3Cx model as follows
F j ' = ( F j + Mean k .di-elect cons. B ( T k - F k ) ) Var k .di-elect cons. A ( T k ) Var k .di-elect cons. A ( F k ) ##EQU00022##
where the mean and variance are taken over A, the set of samples for which both Lymph3Cx and Lymph5Cx data exists. The technique was then repeated for samples for which only U133+ data was available. The score was calculated as:
U j = i = 1 58 a i z ij ##EQU00023##
where z.sub.ij is the log transformed MAS5 U133+ measure of gene expression for gene i on sample j.
U j ' = ( U j + Mean k .di-elect cons. B ( F k ' - U k ) ) Var k .di-elect cons. B ( F k ' ) Var k .di-elect cons. B ( U k ) ##EQU00024##
where the mean and variance are taken over B, the set of samples for which both Lymph5Cx and U133+ data exists. For each of the 313 samples a final model score representative was defined:
S j = { T j if sample j has Lymph3Cx data available F j if sample j has Lymph5Cx data available but not Lymph3Cx U j if sample j has only U 133 + data available ##EQU00025##
[0127] To account for a certain possibility of erroneous classification during the pathology review process, the final score formulation was adjusted. In modeling the relationship between model score and diagnosis, the following normal mixture model was used:
P(S.sub.j|D.sub.j=DLBCL)=(1-.epsilon..sub.D).phi.(S.sub.j;{circumflex over (.mu.)}.sub.D,{circumflex over (.sigma.)}.sub.D.sup.2)+.epsilon..sub.D.phi.(S.sub.j;{circumflex over (.mu.)}.sub.P,{circumflex over (.sigma.)}.sub.P.sup.2)
P(S.sub.j|D.sub.j=PMBCL)=.epsilon..sub.P.phi.(S.sub.j;{circumflex over (.mu.)}.sub.D,{circumflex over (.sigma.)}.sub.D.sup.2))+(1-.epsilon..sub.P).phi.(S.sub.j;{circumflex over (.mu.)}.sub.P,{circumflex over (.sigma.)}.sub.P.sup.2)
where S.sub.j is the model score for sample j; D.sub.j is the pathological diagnosis for sample j; .phi. is the normal density function calculated by
.PHI. ( S j ; .mu. ^ , .sigma. ^ 2 ) = 1 2 .pi. .sigma. ^ 2 exp ( - ( S j - .mu. ^ ) 2 2 .sigma. ^ 2 ) ##EQU00026##
and .epsilon..sub.P and .epsilon..sub.D are the probability of misclassification of a case as DLBCL or PMBCL; and {circumflex over (.mu.)}.sub.D, {circumflex over (.sigma.)}.sub.D.sup.2, {circumflex over (.mu.)}.sub.P, {circumflex over (.sigma.)}.sub.P.sup.2 are the means and variances of the model scores for cases for which the diagnosis of DLBCL or PMBCL is correct (Table 2).
[0128] The values .epsilon..sub.P, .epsilon..sub.D, {circumflex over (.mu.)}.sub.D, {circumflex over (.sigma.)}.sub.D.sup.2, {circumflex over (.mu.)}.sub.P, {circumflex over (.sigma.)}.sub.P.sup.2 were estimated via maximum likelihood over the 313 normalized model scores, resulting in a very low rate of pathology misclassification with .epsilon..sub.P=0.033 and .epsilon..sub.D=0.0076. The principal of maximum likelihood is used to estimate the unknown parameters by choosing those values which maximized the following expression representing the likelihood of obtaining the observed data.
j Path reviewed as PMBCL P ( S j D j = DLBCL ) + j Path reviewed as DLBCL P ( S j D j = DLBCL ) ##EQU00027##
TABLE-US-00005 TABLE 2 Model means and standard deviations Model Subtype Mean Standard deviation PMBCL/DLBCL PMBCL -85.60 24.66 PMBCL/DLBCL DLBCL 14.42 31.94 ABC/GCB ABC 2107.24 468.93 ABC/GCB GCB -216.78 595.51
[0129] By estimating distributions for model scores of true DLBCL and PMBCL cases, a Bayesian algorithm was used to calculate the probability of a sample being PMBCL:
P ( PMBCL ) = .PHI. ( S j ; .mu. ^ P , .sigma. ^ P 2 ) .PHI. ( S j ; .mu. ^ P , .sigma. ^ P 2 ) + .PHI. ( S j ; .mu. ^ D , .sigma. ^ D 2 ) ##EQU00028##
where .phi.(S.sub.j; {circumflex over (.mu.)}, {circumflex over (.sigma.)}.sup.2) is the standard normal density.
[0130] Since it was unknown what the composition of the target population of this assay would be, the following was assumed: a flat prior with equal a priori likelihood of a sample being of the DLBCL or PMBCL subtype.
[0131] Similarly, the probability that a sample was ABC was calculated according to:
P ( ABC ) = .PHI. ( S j ; .mu. ^ ABC , .sigma. ^ ABC ) .PHI. ( S j ; .mu. ^ ABC , .sigma. ^ ABC 2 ) + .PHI. ( S j ; .mu. ^ GCB , .sigma. ^ GCB 2 ) ##EQU00029##
where {circumflex over (.mu.)}.sub.ABC, {circumflex over (.sigma.)}.sub.ABC.sup.2 and {circumflex over (.mu.)}.sub.GCB, {circumflex over (.sigma.)}.sub.GCB.sup.2 represent the mean and standard deviations of the ABC and GCB subtypes as indicated in Table 2.
[0132] After the P(PMBCL) and P(ABC) have been calculated for a particular sample, the sample is classified according Table 3.
TABLE-US-00006 TABLE 3 Prediction result look-up table PMBCL/DLBCL Model result P(PMBCL) .ltoreq. 0.1 0.1 < P(PMBCL) < 0.9 P(PMBCL) .gtoreq. 0.9 ABC/GCB Model Result P(ABC) .ltoreq. 0.1 GCB Unclear PMBCL PMBCL/GCB 0.1 < P(ABC) < 0.9 Unclassified Unclear PMBCL DLBCL PMBCL/Unclassified DLBCL P(ABC) .gtoreq. 0.9 ABC Unclear PMBCL PMBCL/ABC
[0133] As a final molecular diagnosis, those specimens were designated to represent PMBCL for which P(PMBCL).gtoreq.0.9; as DLBCL for which P(PMBCL).ltoreq.0.1; and as "uncertain DLBCL/PMBCL", those cases for which 0.1<P(PMBCL)<0.9.
[0134] Also, if P(PMBCL).gtoreq.0.9 then the tumor sample will be predicted to be PMBCL regardless of the ABC/GCB predictor result. If P(PMBCL).ltoreq.0.1 and P(ABC).ltoreq.0.1 then that tumor is indicated as GCB DLBCL. If P(PMBCL).ltoreq.0.1 and P(ABC).gtoreq.0.9 then that tumor is indicated as ABC DLBCL. If (PMBCL).ltoreq.0.1 and P(ABC) is greater than 0.1 and less than 0.9, then that tumor is indicated as an unclassified DLBCL.
[0135] If the PMBCL probability falls between 0.1 and 0.9, the tumor prediction results may be unclear. For example, if 0.1<P(PMBCL)<0.9 and P(ABC).ltoreq.0.1, then the sample is indicated as unclear PMBCL/GCB. If 0.1<P(PMBCL)<0.9 and 0.1<P(ABC)<0.9, then the sample is indicated as unclear PMBCL/Unclassified DLBCL. If 0.1<P(PMBCL)<0.9 and P(ABC).gtoreq.0.9, then the sample is indicated as unclear PMBCL/GCB.
[0136] Eighteen PMBCL cases of the core training cohort were assigned to be PMBCL by the gene expression-based assay, whereas the remaining two cases were classified into the uncertain group. None of the PMBCL cases were misclassified as DLBCL. Eight DLBCL cases fell in the uncertain category and one GCB DLBCL case was classified as PMBCL by the Lymph3Cx assay. Notably, the score of this case (-15.54) was relatively close to the cut-off (-23.57). As the new assay contains the probes for DLBCL COO assignment as described previously (Scott et al., Blood, 123: 1214-1217 (2014), incorporated herein by reference), it was assessed whether the classification matches the COO as derived from gene expression profiling using snap-frozen tissue biopsies and the Affymetrix U133 plus 2.0 microarrays or the Lymph2Cx assay, respectively. A linear model score was generated using the same probe sets and coefficients as were used in the Lymph2Cx predictor (Scott et al., Blood, 123: 1214-1217 (2014); the Lymph2Cx assay is a 2-way classifier that is focused on distinguishing between two subtypes of aggressive B-cell Non-Hodgkins lymphoma: ABC-DLBCL and GCB-DLBCL; the Lymph2Cx assay does not distinguish between PMBCL and DLBCL). Of note, there was no misclassification of cases with regards to switching between the ABC and GCB classes. Nine cases changed between the unclassified category and ABC or GCB, respectively.
Validation Cases and Re-Review of Misclassified Cases
[0137] For the independent validation cohort, 118 cases diagnosed as PMBCL and collected over a period of 35 years at the Department of Pathology at the BC Cancer Agency (BCCA), Vancouver, Canada, were selected for pathology review. Five cases were re-classified (4 cases were diagnosed as DLBCL and 1 case as classical Hodgkin lymphoma). In 7 cases PMBCL was considered to be among the differential diagnoses and correlation with clinical data and presentation was recommended. In 1 case the material available for review was not sufficient to render a diagnosis, and in the remaining cases (105) the diagnosis of PMBCL was confirmed. Of these, 88 cases had sufficient material for further analysis.
[0138] For intra-laboratory comparison, RNA from 12 of the 18 biopsies selected were run a second time at BCCA, with each run performed using a different RNA aliquot and different NanoString cartridges and 6 cases were replicated at Mayo Clinic.
Results
[0139] To develop a classification assay, applicable to FFPE tissue specimens, that aims at a robust discrimination between PMBCL and DLBCL as well as the DLBCL subtypes (GCB, ABC, and unclassified, respectively), gene expression features were selected from previously published datasets (Rosenwald et al., J. Exp. Med., 198: 851-861 (2003); Lenz et al., N. Eng. J. Med., 359: 2313-2323 (2008); and Alizadeh et al., Nature, 403: 503-511 (2000); each incorporated herein by reference). The selection process, aiming at identification of genes with the highest discriminative power and good concordance between the different analytical platforms used for GEP, yielded 58 genes for subsequent assay development (Table 1). Of those, 30 genes were employed to distinguish PMBCL from DLBCL, with 24 being overexpressed in PMBCL and 6 genes showing higher expression levels in DLBCL. This approach of "balanced" gene selection was chosen to make the model less vulnerable to normalization artifacts. Additionally, 15 genes from the Lymph2Cx assay (Scott et al., Blood, 123: 1214-1217 (2014)) were included, and the remaining 13 genes were chosen as housekeeping genes, including all 5 from the Lymph2Cx assay. To train a linear regression model and establish model thresholds to distinguish PMBCL from DLBCL, a customized NanoString codeset including these 58 genes was then applied to a training cohort of 68 cases, of which 20 were diagnosed as PMBCL by consensus review and 56 were classified as DLBCL. The performance of the Lymph3Cx assay in the training cohort is shown above. The gene expression-based model, including coefficients and thresholds was "locked" and subsequently applied to the independent validation cohort comprising 167 FFPE tissue biopsies (88 PMBCL and 79 DLBCL by consensus review). None of these specimens were part of the training cohort, nor had been previously used to train the Lymph2Cx assay.
[0140] The assay yielded gene expression data of sufficient quality in 160/167 cases (95.8%), leaving 88 PMBCL and 70 DLBCL cases for final analysis (2 additional DLBCL cases were excluded because of a mismatch to previously analyzed frozen biopsies). Among the pathologically-defined PMBCL, 75 cases (85%) were classified as such based on Lymph3Cx. Ten percent (9 cases) were assigned to the "uncertain" category and .about.5% (4 cases) showed a molecular signature of DLBCL. Of note, scores for most of the `misclassified` PMBCLs (3/4) were close to the cut-off (FIG. 3). Among the pathologically-defined DLBCL cases, 58 (83%) were classified as DLBCL by the assay, 14% (10 cases) were "uncertain" and two cases (3%) were predicted to be PMBCL.
[0141] A pathological re-review was performed on the six misclassified cases from the validation cohort. For one DLBCL case the panel would have changed the diagnosis to PMBCL (as assigned by the assay) based on additional clinical information (young patient, mediastinal involvement), which was not available at the time of initial review. The other misclassified DLBCL case, presenting as an intra-parotid lymph node enlargement with no other manifestations, was still considered to represent DLBCL. Of the 4 mis-assigned PMBCL cases, two were still felt to fit the morphological spectrum of PMBCL with typical clinical presentation, one case was deemed unclassifiable based on the available information and material for review and one case was felt to rather represent DLBCL based on the clinical information of a generalized lymphadenopathy. Of note, none of these 4 cases harbored rearrangements or copy number alteration of CIITA or the PD1 receptor ligands PDL1 and PDL2. Similar to the results obtained in the training cohort, no misclassified cases were seen with regards to DLBCL cell-of-origin (COO) subclassification. Eleven cases changed between the unclassified category and ABC or GCB, respectively.
[0142] For 66 cases with available COO predictions and model scores from the Lymph2Cx assay (Scott et al., Blood 123: 1214-1217 (2014) and Scott et al., J. Clin. Oncol., 33: 2848-2856 (2015), both incorporated herein by reference) the results were compared to Lymph3Cx and revealed a high correlation coefficient between both assays (Spearman r=0.9937). No classification changes were observed, demonstrating the robustness of DLBCL COO-assignment across these assays (FIG. 4).
[0143] Experiments were next performed to determine intra-laboratory reproducibility and inter-laboratory concordance of the Lymph3Cx assay. Eighteen biopsies were selected on the basis that their model scores were equally distributed across the population and thus are representative of the validation cohort. For inter-laboratory comparison, separate tissue scrolls or unstained sections were distributed to an independent laboratory (Mayo Clinic, Scottsdale) where RNA was extracted and run on the Lymph3Cx assay. The concordance was excellent with Spearman r.sup.2=0.996 (FIG. 5), demonstrating the robustness of the assay.
[0144] These results demonstrate that the newly developed and validated Lymph3Cx assay robustly distinguishes between PMBCL and DLBCL tumors based on gene expression signatures and shows high concordance with the pathological classification of an expert hematopathologist panel.
[0145] All references, including publications, patent applications, and patents, cited herein are hereby incorporated by reference to the same extent as if each reference were individually and specifically indicated to be incorporated by reference and were set forth in its entirety herein.
[0146] The use of the terms "a" and "an" and "the" and "at least one" and similar referents in the context of describing the invention (especially in the context of the following claims) are to be construed to cover both the singular and the plural, unless otherwise indicated herein or clearly contradicted by context. The use of the term "at least one" followed by a list of one or more items (for example, "at least one of A and B") is to be construed to mean one item selected from the listed items (A or B) or any combination of two or more of the listed items (A and B), unless otherwise indicated herein or clearly contradicted by context. The terms "comprising," "having," "including," and "containing" are to be construed as open-ended terms (i.e., meaning "including, but not limited to,") unless otherwise noted. Recitation of ranges of values herein are merely intended to serve as a shorthand method of referring individually to each separate value falling within the range, unless otherwise indicated herein, and each separate value is incorporated into the specification as if it were individually recited herein. All methods described herein can be performed in any suitable order unless otherwise indicated herein or otherwise clearly contradicted by context. The use of any and all examples, or exemplary language (e.g., "such as") provided herein, is intended merely to better illuminate the invention and does not pose a limitation on the scope of the invention unless otherwise claimed. No language in the specification should be construed as indicating any non-claimed element as essential to the practice of the invention.
[0147] Preferred embodiments of this invention are described herein, including the best mode known to the inventors for carrying out the invention. Variations of those preferred embodiments may become apparent to those of ordinary skill in the art upon reading the foregoing description. The inventors expect skilled artisans to employ such variations as appropriate, and the inventors intend for the invention to be practiced otherwise than as specifically described herein. Accordingly, this invention includes all modifications and equivalents of the subject matter recited in the claims appended hereto as permitted by applicable law. Moreover, any combination of the above-described elements in all possible variations thereof is encompassed by the invention unless otherwise indicated herein or otherwise clearly contradicted by context.
Sequence CWU 1
1
581100DNAArtificial Sequencesynthetic 1ggacacgtag gcggtaccac
taaggttttg gtaatgagcc attcaaaccg acagcagtgt 60gaaggtgtgt caaggtgtat
attctcgtgg ctcggcattc 1002100DNAArtificial Sequencesynthetic
2ggtggtcttg aactggcttt agcctgtgat atacgagtag cagcttcctc tgcaaaaatg
60ggcctggttg aaacaaaatt ggcgattatt cctggtggag 1003100DNAArtificial
Sequencesynthetic 3ggcaaatgaa atggaagggg aaggaaaaca gaatggatca
ggcatggaga ccaaacacag 60cccactagag gttggcagtg agagttctga agaccagtat
1004100DNAArtificial Sequencesynthetic 4ctgctgttat gcagagccat
ttcctctaga atttggataa taaagatgct tattgtctct 60cccttctcca gttctgggaa
tttacaggca caatacactt 1005100DNAArtificial Sequencesynthetic
5tgctctcctt gggatgatgg ctggctagtc agccttgcat gtattccttg gctgaatggg
60agagtgcccc atgttctgca agactacttg gtattcttgt 1006100DNAArtificial
Sequencesynthetic 6ttgaaaatcg gcccaagaag gagcaggttc tggaactgga
gcgggagaat gaaatgctga 60agaccaaaaa ccaggagctg cagtccatca tccaggccgg
1007100DNAArtificial Sequencesynthetic 7aaacactttc cagagttccc
tgcaacccgt gcttatgcag atagttacta ttatgaagat 60ggaggaatga agccaagagt
gatgaaagaa gctgtatcta 1008100DNAArtificial Sequencesynthetic
8gcctggagta cttcaaggga gccattcccc ttagaaagct gaagacgtgg taccagacat
60ctgaggactg ctccagggat gccatcgttt ttgtaactgt 1009100DNAArtificial
Sequencesynthetic 9atgcctgagg ggatcaggct tttctactcc aggcaaacct
gccccatctt gtcgctttta 60ggacctccca caacctggtt ccccacacat ccatagttct
10010100DNAArtificial Sequencesynthetic 10ccatgtctta gggcttcctg
taggtaacta tgtccagctc ttggcaaaaa tcgataatga 60attggtggtc agggcttaca
cccctgtctc cagtgatgat 10011100DNAArtificial Sequencesynthetic
11tttcttccat gttttagaaa atgaggcctg tttggggaag gtaccctggt gatgtttttg
60ctagacatta gctgtagctg acagcataag gagagtcgca 10012100DNAArtificial
Sequencesynthetic 12acagctacat gtggtggctc agcattggcg ctctcatagg
cctgtccgta gcagcagtgg 60ttcttctcgc cttcattgtt accgcctgtg tgctctgcta
10013100DNAArtificial Sequencesynthetic 13ccctgccctc ttgtctgcca
cggggcgagt ctggcacctc tttcttctga cctcagacgg 60ctctgagcct tatttctctg
gaagcggcta agggacggtt 10014100DNAArtificial Sequencesynthetic
14cagattttac aggctgaatt attggcagta tatggagcag acccaggcac acaggattct
60agtgggaaaa ctcccgttga ttatgcaagg caaggagggc 10015100DNAArtificial
Sequencesynthetic 15actgattata cctctagtat agatgtatgg tctgctggct
gtgtgttggc tgagctgtta 60ctaggacaac caatatttcc aggggatagt ggtgtggatc
10016100DNAArtificial Sequencesynthetic 16tggaagacaa agtgcgttcc
ttaaagacag acattgagga gagcaaatac cgacagcgcc 60acctgaaggt ggagttgaag
agcttcctgg aggtgctgga 10017100DNAArtificial Sequencesynthetic
17gcttgggaga accctctccc ttctctgaga aagaaagatg tcgaatgggt attccacaga
60cgagaatttc cgctatctca tctcgtgctt cagggccagg 10018100DNAArtificial
Sequencesynthetic 18gtccaaattc ttgggtggtg acatggaaca cacccatttg
gtgaaaggct tggattttgc 60tctgcttcaa aaggtacgag ctgagattgc cagcaaagag
10019100DNAArtificial Sequencesynthetic 19tctgcactgg aagaagtacg
acatctatga gaagcaaacc aaggaggaaa ccgactctgt 60agtgctgata gaaaacctga
agaaagcctc tcagtgatgg 10020100DNAArtificial Sequencesynthetic
20gggcactgtt taaaggaaag ttccgagaag gcatcgacaa gccggaccct cccacctgga
60agacgcgcct gcggtgcgct ttgaacaaga gcaatgactt 10021100DNAArtificial
Sequencesynthetic 21ggcaaaacat cagtgtctgt gggtagttgg aatcttcagt
tcctgtgagc gtcggcgtct 60tctgggcctg tggagtttct tggacagggg ccgcggggct
10022100DNAArtificial Sequencesynthetic 22gtggcctcct ggcatcattt
gttattgcct ctgaaacaag ccttactgcc tggagggctt 60agattcctgc ttctccaatg
tagtgtgggt atcttgtagg 10023100DNAArtificial Sequencesynthetic
23aactacatcc tgaactcgac gtcctgaggt ataatacaac agagcacttt ttgaggcaat
60tgaaaaacca acctacactc ttcggtgctt agagagatct 10024100DNAArtificial
Sequencesynthetic 24aaggcaagtc tcaggaaccc atgcaggtac atcgcttgca
cctgttttta gcttatttaa 60tgacgggctt ttgggaagag ctgcccgcat actgagagac
10025100DNAArtificial Sequencesynthetic 25gccttcgcgt ccgggttggg
agcttgctgt gtctaacctc caactgctgt gctgtctgct 60agggtcacct cctgtttgtg
aaaggggacc ttcttgttcg 10026100DNAArtificial Sequencesynthetic
26tggaagccat caacaatttg cccagtaaca tgccactgcc ttcagcttct cctcttcacc
60aacttgacct gaaaccttct ttgcccttgc agaacagtgg 10027100DNAArtificial
Sequencesynthetic 27ggattgtagg tgcaagctgt ccagagaaaa gagtccttgt
tccagcccta ttctgccact 60cctgacaggg tgaccttggg tatttgcaat attcctttgg
10028100DNAArtificial Sequencesynthetic 28ttctcttacc cagagatgcc
catgagctga cattttactc atccctctgc ctccaagaag 60gcctgtatta tacgtgtcct
cctgggggtt ggagatgatc 10029100DNAArtificial Sequencesynthetic
29ccactttgga gttgtctacc acggagaata catagaccag gcccagaatc gaatccaatg
60tgccatcaag tcactaagtc gcatcacaga gatgcagcag 10030100DNAArtificial
Sequencesynthetic 30ggcaaacgct gtgttatcct ctttgcagac catcccagaa
tttgcagaga ctctagaact 60tattgaatct gatcctgtag catggagtga cgttaccagt
10031100DNAArtificial Sequencesynthetic 31ctctcctctc ctccttgtct
ggctctgttg acaaaccggg catgtttggc agtaaattgg 60caccgtgtca cactgtttcc
tgggattcaa gtatgcaacc 10032100DNAArtificial Sequencesynthetic
32cctttctttc tcctcgccgg cccgagagca ggaacacgat aacgaaggag gcccaacttc
60attcaataag gagcctgacg gatttatccc agacggtaga 10033100DNAArtificial
Sequencesynthetic 33ctgagaccat atccttaaat gtaaaaggcc ctggactaca
gaggatggtg cttgttgact 60taccaggtgt gattaatact gtgacatcag gcatggctcc
10034100DNAArtificial Sequencesynthetic 34aggaaaataa acactcacat
cctaaaggtt ccagaaacag atgaggtaga gctcacctgc 60caggctacag gttatcctct
ggcagaagta tcctggccaa 10035100DNAArtificial Sequencesynthetic
35ctgtctgtgt cccgacacat aatctctgtc tcttggacct gccaccatca ctttctgggt
60caggattgga attgggatgg aatgggacag ttgtctataa 10036100DNAArtificial
Sequencesynthetic 36gccatccagc actgccattc ccgtggagtt gtccatcgtg
acatcaagga tgagaacatc 60ctgatagacc tacgccgtgg ctgtgccaaa ctcattgatt
10037100DNAArtificial Sequencesynthetic 37gcatggggaa gtttgtcccg
ctggctggaa gcctggcagt gacacgatta agcccaacgt 60ggatgacagc aaggaatatt
tctccaaaca caattaggct 10038100DNAArtificial Sequencesynthetic
38gcatttggag tcctgctgta tgaaatgttg gctgggcagg caccctttga aggggaggat
60gaagatgaac tcttccaatc catcatggaa cacaacgtag 10039100DNAArtificial
Sequencesynthetic 39ttcattgttc cagcttctcg cttcaagctc ctgaagggag
ctgagcacat aacgacttac 60acgttcaata ctcacaaagc ccagcatacc ttctgtaaga
10040100DNAArtificial Sequencesynthetic 40ctgacatttc aagctgaccc
tgtgatctct gccctgtctt cgggcgacag gagccagaaa 60atcagggaca tggctgatgg
ctgcggatgc tggaaccttg 10041100DNAArtificial Sequencesynthetic
41tagggcagct cagtccctgg cctcttagca ccacattcct gtttttcagc ttatttgaag
60tcctgcctca ttctcactgg agcctcagtc tctcctgctt 10042100DNAArtificial
Sequencesynthetic 42cctgtgttcc caagagaatt acattattga caaaagactc
caagacgagg atgccagtag 60tacccagcag aggcgccaga tatttagagt taataaagat
10043100DNAArtificial Sequencesynthetic 43catttgaatt gtctcctgac
tactgtccag taaggaggcc cattgtcact tagaaaagac 60acctggaacc catgtgcatt
tctgcatctc ctggattagc 10044100DNAArtificial Sequencesynthetic
44tggtgaatca tttgaactga agattgtgcg acggggaatg cctcccggag gaggaggcga
60agtggttttc tcatgtcctg tgaggaaggt cttgaagccc 10045100DNAArtificial
Sequencesynthetic 45ctgcggcaag acctcgctgc tcatggtgta cagccagggc
tccttccccg agcactacgc 60cccatcggtg ttcgagaagt acacggccag cgtgaccgtt
10046100DNAArtificial Sequencesynthetic 46tcccgccagg tggcctcggc
cttcatcgtc atcctctgtt gcgccattgt ggtggaaaac 60cttctggtgc tcattgcggt
ggcccgaaac agcaagttcc 10047100DNAArtificial Sequencesynthetic
47ccactaaatc ctaggtggga aatggcctgt taactgatgg cacattgcta atgcacaaga
60aataacaaac cacatccctc tttctgttct gagggtgcat 10048100DNAArtificial
Sequencesynthetic 48gtgtctcttg atccatccga agcaggccct ccacgttatc
taggagatcg ctacaagttt 60tatctggaga atctcaccct ggggatacgg gaaagcagga
10049100DNAArtificial Sequencesynthetic 49tcatttgtat gtaggaccag
gagtatctcc tcaggtgacc agttttgggg acccgtatgt 60ggcaaattct aagctgccat
attgaacatc atcccactgg 10050100DNAArtificial Sequencesynthetic
50tttaatccaa gatacagaac ctgtgatgct ttcacctata ctggctgtgg agggaatgac
60aataactttg ttagcaggga ggattgcaaa cgtgcatgtg 10051100DNAArtificial
Sequencesynthetic 51agatgctcaa ggagaacaag gtgttgaaga cactgaatgt
ggaatccaac ttcatttctg 60gagctgggat tctgcgcctg gtagaagccc tcccatacaa
10052100DNAArtificial Sequencesynthetic 52tgcaaaacca tttgcaacca
tcagagccag cgcacctgtg cagccttctg caggtcactc 60agctgccgca aggagcaagg
caagttctat gaccatctcc 10053100DNAArtificial Sequencesynthetic
53cgagtgatgg gtctaggccc tgaaactgat gtcctagcaa taacctcttg atccctactc
60accgagtgtt gagcccaagg ggggatttgt agaacaagcc 10054100DNAArtificial
Sequencesynthetic 54gtggaggccg aggacatttt cctgaagggc aggggttggc
aacttttcaa catggagtgc 60caaactgcta acccgtcttc tagtgtgtga gaatagggac
10055100DNAArtificial Sequencesynthetic 55catcgcgacg gccaaaagga
gcggcgcggt cttcgtggtg ttcgtggcag gtgatgatga 60acagtctaca cagatggctg
caagttggga agatgataaa 10056100DNAArtificial Sequencesynthetic
56acagacaaga gtgggcgaca gtggaagctg aagtccttcc agaccaggga caaccagggc
60attctctatg aagctgcacc cacctccacc ctcacctgtg 10057100DNAArtificial
Sequencesynthetic 57cctctggact gaaccccaca tctgcacctc caacatctgc
ttcagcggtc cctgtttctc 60ctgttccaca gtcgccaata cctcccttac ttcaggaccc
10058100DNAArtificial Sequencesynthetic 58ctacctcttc aattggaatg
gctttggggc cacaagtgac cgctttgccc tgagagctga 60atctatcgac tgcatggttc
cagtcaccga gagtctgctg 100
D00001
D00002
D00003
D00004
D00005


S00001
XML
uspto.report is an independent third-party trademark research tool that is not affiliated, endorsed, or sponsored by the United States Patent and Trademark Office (USPTO) or any other governmental organization. The information provided by uspto.report is based on publicly available data at the time of writing and is intended for informational purposes only.
While we strive to provide accurate and up-to-date information, we do not guarantee the accuracy, completeness, reliability, or suitability of the information displayed on this site. The use of this site is at your own risk. Any reliance you place on such information is therefore strictly at your own risk.
All official trademark data, including owner information, should be verified by visiting the official USPTO website at www.uspto.gov. This site is not intended to replace professional legal advice and should not be used as a substitute for consulting with a legal professional who is knowledgeable about trademark law.