Blood Profiling with Protease Inhibitors
Herbert; Benjamin Ross ; et al.
U.S. patent application number 16/471479 was filed with the patent office on 2020-03-26 for blood profiling with protease inhibitors. The applicant listed for this patent is Sangui Bio Pty. Ltd. Invention is credited to Benjamin Ross Herbert, Elisabeth Karsten.
| Application Number | 20200096512 16/471479 |
| Document ID | / |
| Family ID | 62624059 |
| Filed Date | 2020-03-26 |


View All Diagrams
| United States Patent Application | 20200096512 |
| Kind Code | A1 |
| Herbert; Benjamin Ross ; et al. | March 26, 2020 |
Blood Profiling with Protease Inhibitors
Abstract
The present disclosure relates to methods for generating blood protein profiles from whole blood, red blood cell enriched blood samples, or red blood cell components. The methods involve the comparison of protein levels before and after incubation with protease inhibitors, or the comparison of protein levels after incubation in the presence and absence of protease inhibitors. The protein profiles are used for monitoring and diagnosing diseases and disorders in subjects including colorectal cancer and preeclampsia.
| Inventors: | Herbert; Benjamin Ross; (North Epping, NSW, AU) ; Karsten; Elisabeth; (Northmead, NSW, AU) | ||||||||||
| Applicant: |
|
||||||||||
|---|---|---|---|---|---|---|---|---|---|---|---|
| Family ID: | 62624059 | ||||||||||
| Appl. No.: | 16/471479 | ||||||||||
| Filed: | December 18, 2017 | ||||||||||
| PCT Filed: | December 18, 2017 | ||||||||||
| PCT NO: | PCT/AU2017/000282 | ||||||||||
| 371 Date: | June 19, 2019 |
Related U.S. Patent Documents
| Application Number | Filing Date | Patent Number | ||
|---|---|---|---|---|
| 62436875 | Dec 20, 2016 | |||
| 62482582 | Apr 6, 2017 | |||
| 62523489 | Jun 22, 2017 | |||
| Current U.S. Class: | 1/1 |
| Current CPC Class: | G01N 33/57419 20130101; G01N 33/57484 20130101; G01N 33/80 20130101; G01N 2333/95 20130101; G01N 2800/52 20130101; G01N 33/689 20130101; G01N 33/6863 20130101 |
| International Class: | G01N 33/574 20060101 G01N033/574 |
Claims
1. (canceled)
2. A method of producing a protein profile comprising: a.) obtaining a blood sample or a red blood cell component from a blood sample; b.) obtaining a first and second portion from the blood sample or the red blood cell component; c.) contacting the second portion from the blood sample or the red blood cell component with one or more protease inhibitors; d.) measuring the level of one or more proteins from the first and second portions of the blood sample or the red blood cell component, wherein the first portion has not been contacted with the one or more protease inhibitors; and e.) determining the change in the level of the one or more proteins from the first portion of the blood sample or the red blood cell component and the second portion of the blood sample or the red blood cell component, wherein the protein profile produced comprises one or more proteins having a change in level of the one or more proteins from first portion of the blood sample or the red blood cell component and the second portion of the blood sample or the red blood cell component.
3. (canceled)
4. A method of producing a protein profile comprising: a.) obtaining a blood sample that is from a subject not having a disease or disorder; b.) obtaining a red blood cell component from the blood sample; c.) measuring the level of one or more proteins from the red blood cell component; d.) contacting the red blood cell component with one or more protease inhibitors; e.) measuring the level of the one or more proteins from the red blood cell component contacted with the one or more protease inhibitors; and f.) determining the change in the level of the one or more proteins from the red blood cell component before and after being contacted with the one or more protease inhibitors, wherein the protein profile produced comprises the change in the level of the one or more proteins from the red blood cell component before and after being contacted with one or more protease inhibitors.
5. A method of producing a disease protein profile comprising: a.) obtaining from a subject having a disease or disorder a first protein profile, comprising: 1) obtaining a blood sample or a red blood cell component from a blood sample; 2) obtaining a first and second portion from the blood sample or the red blood cell component; 3) contacting the second portion from the blood sample or the red blood cell component with one or more protease inhibitors; 4) measuring the level of one or more proteins from the first and second portions of the blood sample or the red blood cell component, wherein the first portion has not been contacted with the one or more protease inhibitors; and 5) determining the change in the level of the one or more proteins from the first portion of the blood sample or the red blood cell component and the second portion of the blood sample or the red blood cell component; wherein the protein profile produced comprises one or more proteins having a change in level of the one or more proteins from first portion of the blood sample or the red blood cell component and the second portion of the blood sample or the red blood cell component; b.) obtaining from a subject not having the disease or disorder a second protein profile, comprising: 1) obtaining a blood sample that is from a subject not having a disease or disorder; 2) obtaining a red blood cell component from the blood sample; 3) measuring the level of one or more proteins from the red blood cell component; 4) contacting the red blood cell component with one or more protease inhibitors; 5) measuring the level of the one or more proteins from the red blood cell component contacted with the one or more protease inhibitors; and 6) determining the change in the level of the one or more proteins from the red blood cell component before and after being contacted with the one or more protease inhibitors; wherein the second protein profile produced: i) is obtained from the same red blood cell component the first protein profile was obtained from; and ii) comprises the change in the level of the one or more proteins from the red blood cell component before and after being contacted with one or more protease inhibitors; and c.) comparing the difference between the change in the level of one or more proteins from the subject having the disease or disorder to the change in the level of the one or more proteins from the subject not having the disease or disorder, wherein the disease protein profile produced comprises one or more proteins for which there is a difference between the change in the level of the one or more proteins from the subject having the disease or disorder and the change in the level of the one or more proteins from the subject not having the disease or disorder.
6. The method of claim 5, wherein the red blood cell component is obtained from whole blood or isolated red blood cells.
7. The method of claim 6, wherein the red blood cell component is red blood cells or red blood cell membranes.
8. The method of claim 5, wherein the level of two or more proteins, three or more proteins, four or more proteins, five or more proteins, six or more proteins, seven or more proteins, eight or more proteins, nine or more proteins, or ten or more proteins is measured.
9. (canceled)
10. The method of claim 5, wherein the red blood cell component is contacted with one or more protease inhibitors, two or more protease inhibitors, three or more protease inhibitors, four or more protease inhibitors, five or more protease inhibitors, six or more protease inhibitors, seven or more protease inhibitors, eight or more protease inhibitors, nine or more protease inhibitors, or ten or more protease inhibitors.
11. The method of claim 5, wherein the red blood component is contacted with a protease inhibitor cocktail comprising at least two protease inhibitors.
12. The method of claim 5, wherein the red blood cell component is contacted with the protease inhibitor cocktail A8127s.
13. The method of claim 5, wherein the one or more protease inhibitors are selected from the group consisting of serine protease inhibitors, cysteine protease inhibitors, metalloprotease inhibitors, aspartic protease inhibitors, and aminopeptidase inhibitors.
14-15. (canceled)
16. The method of claim 5, wherein the difference between the change in the level of the one or more proteins from the subject having a disease or disorder and the change in the level of the one or more proteins from the subject not having the disease or disorder is determined by a statistical analysis selected from the group consisting of a Student T's test, an ANOVA test, a mixed-effects model, a Mann-Whitney test, a Wilcoxon rank sum, and a Spermans rank correlation.
17. The method of claim 5, wherein the difference between the change in the level of the one or more proteins from the subject having a disease or disorder and the change in the level of the one or more proteins from the subject not having the disease or disorder is an increase in the change in the level or a decrease in the change in the level.
18-19. (canceled)
20. The method of claim 5, wherein the one or more proteins are selected from the group consisting of chemokines, cytokines, growth factors, receptors, intracellular signal transmitters, hormones, nuclear transcription factors, neurotransmitters, extracellular matrix components, glycoproteins, inflammatory proteins, and enzymes.
21. The method of claim 5, wherein the one or more proteins are selected from the group consisting of the proteins listed in Table 1 or the proteins listed in Table 2.
22. The method of claim 5, wherein the disease or disorder is preeclampsia.
23. The method of claim 22, wherein the disease protein profile is a preeclampsia protein profile comprising one or more proteins selected from the group consisting of IL-1.beta., IL-8, TNF-.alpha., IL-1ra, MCP-1, G-CSG, GM-CSF, IL-6, IFN.alpha.2, IL-1a, IL-18, MIF, IL-2ra, and HGF.
24. The method of claim 5, wherein the disease or disorder is colorectal cancer.
25. The method of claim 24, wherein the disease protein profile is a cancer protein profile comprising one or more proteins selected from the group consisting of IL-6, IFN-.gamma., IL-4, IL-13, MIF, Eotaxin, RANTES, IL-7, IP-10, PDGF, and IL-12p40.
26. (canceled)
27. A method of monitoring the effect of a treatment in a subject comprising: a.) obtaining from the subject a first protein profile produced at a first point in time, comprising: 1) obtaining a blood sample or a red blood cell component from a blood sample; 2) obtaining a first and second portion from the blood sample or the red blood cell component; 3) contacting the second portion from the blood sample or the red blood cell component with one or more protease inhibitors; 4) measuring the level of one or more proteins from the first and second portions of the blood sample or the red blood cell component, wherein the first portion has not been contacted with the one or more protease inhibitors; and 5) determining the change in the level of the one or more proteins from the first portion of the blood sample or the red blood cell component and the second portion of the blood sample or the red blood cell component; wherein the first protein profile produced comprises one or more proteins having a change in level of the one or more proteins from first portion of the blood sample or the red blood cell component and the second portion of the blood sample or the red blood cell component; b.) obtaining from the subject a second protein profile produced at a second point in time, comprising: 1) obtaining a blood sample or a red blood cell component from a blood sample; 2) obtaining a first and second portion from the blood sample or the red blood cell component; 3) contacting the second portion from the blood sample or the red blood cell component with one or more protease inhibitors; 4) measuring the level of one or more proteins from the first and second portions of the blood sample or the red blood cell component, wherein the first portion has not been contacted with the one or more protease inhibitors; and 5) determining the change in the level of the one or more proteins from the first portion of the blood sample or the red blood cell component and the second portion of the blood sample or the red blood cell component; wherein the second protein profile produced comprises one or more proteins having a change in level of the one or more proteins from first portion of the blood sample or the red blood cell component and the second portion of the blood sample or the red blood cell component; and c.) comparing the change in the level of at least one protein from the first protein profile to the change in the level of the at least one protein from the second protein profile, wherein a difference between the change in the level of the at least one protein from the first protein profile and the change in the level of the at least one protein from the second protein profile indicates an effect of the treatment.
28. The method of claim 27, wherein: i) the first point in time is before treatment and the second point in time is after treatment; ii) the first point in time is before treatment and the second point in time is during treatment; iii) the first point in time and the second point in time are during treatment; iv) the first point in time is during treatment and the second point in time is after treatment; or v) the first point in time and the second point in time are after treatment.
29-34. (canceled)
35. The method of claim 27, wherein the blood sample is a small volume blood sample.
36. The method of claim 35, wherein the subject is monitored: i) a number of times selected from the group consisting of one or more times per day, two or more times per day, three or more times per day, four or more times per day, and five or more times per day; ii) a number of times selected from the group consisting of one or more times per week, two or more times per week, three or more times per week, four or more times per week, five or more times per week, six or more times per week, and seven or more times per week; iii) daily; or iv) a number of times selected from the group consisting of once a week, once every two weeks, once every three weeks, and once every four weeks.
37-40. (canceled)
41. A method of diagnosing a disease or disorder in a subject comprising: a.) obtaining at least one protein profile for the subject, comprising: 1) obtaining a blood sample or a red blood cell component from a blood sample; 2) obtaining a first and second portion from the blood sample or the red blood cell component; 3) contacting the second portion from the blood sample or the red blood cell component with one or more protease inhibitors; 4) measuring the level of one or more proteins from the first and second portions of the blood sample or the red blood cell component, wherein the first portion has not been contacted with the one or more protease inhibitors; and 5) determining the change in the level of the one or more proteins from the first portion of the blood sample or the red blood cell component and the second portion of the blood sample or the red blood cell component; wherein the protein profile produced comprises one or more proteins having a change in level of the one or more proteins from first portion of the blood sample or the red blood cell component and the second portion of the blood sample or the red blood cell component; and b.) comparing the change in the level of at least one protein from the at least one protein profile for said subject to the change in the level of the at least one protein from a disease protein profile produced according to steps comprising, 1) obtaining from a subject having a disease or disorder a first protein profile, comprising: i) obtaining a blood sample or a red blood cell component from a blood sample; ii) obtaining a first and second portion from the blood sample or the red blood cell component; iii) contacting the second portion from the blood sample or the red blood cell component with one or more protease inhibitors; iv) measuring the level of one or more proteins from the first and second portions of the blood sample or the red blood cell component, wherein the first portion has not been contacted with the one or more protease inhibitors; and v) determining the change in the level of the one or more proteins from the first portion of the blood sample or the red blood cell component and the second portion of the blood sample or the red blood cell component; wherein the protein profile produced comprises one or more proteins having a change in level of the one or more proteins from first portion of the blood sample or the red blood cell component and the second portion of the blood sample or the red blood cell component; 2) obtaining from a subject not having the disease or disorder a second protein profile, comprising: i) obtaining a blood sample that is from a subject not having a disease or disorder; ii) obtaining a red blood cell component from the blood sample; iii) measuring the level of one or more proteins from the red blood cell component; iv) contacting the red blood cell component with one or more protease inhibitors; v) measuring the level of the one or more proteins from the red blood cell component contacted with the one or more protease inhibitors; and vi) determining the change in the level of the one or more proteins from the red blood cell component before and after being contacted with the one or more protease inhibitors; wherein the second protein profile produced: A) is obtained from the same red blood cell component the first protein profile was obtained from; and B) comprises the change in the level of the one or more proteins from the red blood cell component before and after being contacted with one or more protease inhibitors; and 3) comparing the difference between the change in the level of one or more proteins from the subject having the disease or disorder to the change in the level of the one or more proteins from the subject not having the disease or disorder; wherein the disease protein profile produced comprises one or more proteins for which there is a difference between the change in the level of the one or more proteins from the subject having the disease or disorder and the change in the level of the one or more proteins from the subject not having the disease or disorder; wherein a same or similar change in level of the at least one protein from the at least one protein profile for the subject to the change in the level of the at least one protein from the disease protein profile indicates that the subject has the disease or disorder.
42. A method of diagnosing a disease or disorder in a subject comprising: a.) obtaining at least one protein profile for the subject, comprising: 1) obtaining a blood sample or a red blood cell component from a blood sample; 2) obtaining a first and second portion from the blood sample or the red blood cell component; 3) contacting the second portion from the blood sample or the red blood cell component with one or more protease inhibitors; 4) measuring the level of one or more proteins from the first and second portions of the blood sample or the red blood cell component, wherein the first portion has not been contacted with the one or more protease inhibitors; and 5) determining the change in the level of the one or more proteins from the first portion of the blood sample or the red blood cell component and the second portion of the blood sample or the red blood cell component; wherein the protein profile produced comprises one or more proteins having a change in level of the one or more proteins from first portion of the blood sample or the red blood cell component and the second portion of the blood sample or the red blood cell component; b.) obtaining at least one protein profile, comprising: 1) obtaining a blood sample that is from a subject not having a disease or disorder; 2) obtaining a red blood cell component from the blood sample; 3) measuring the level of one or more proteins from the red blood cell component; 4) contacting the red blood cell component with one or more protease inhibitors; 5) measuring the level of the one or more proteins from the red blood cell component contacted with the one or more protease inhibitors; and 6) determining the change in the level of the one or more proteins from the red blood cell component before and after being contacted with the one or more protease inhibitors, wherein the protein profile produced comprises the change in the level of the one or more proteins from the red blood cell component before and after being contacted with one or more protease inhibitors; and c.) comparing the change in the level of at least one protein from the at least one protein profile for said subject to the change in the level of the at least one protein from the at least one protein profile obtained from the subject not have the disease or disorder; wherein a difference between the change in the level of the at least one protein from the at least one protein profile for said subject and the change in the level of the at least one protein from the at least one protein profile obtained from the subject not have the disease or disorder indicates that said subject has the disease or disorder.
43. A kit for producing a protein profile of a blood sample comprising: a.) at least one reagent to obtain a red blood cell component; b.) one or more protease inhibitors; and c.) at least one reagent to measure the level of one or more proteins from the red blood cell component.
44-46. (canceled)
47. The method of claim 43, wherein the one or more protease inhibitors comprise a protease inhibitor cocktail, wherein the protease inhibitor cocktail is A8127s.
48. (canceled)
Description
CROSS REFERENCE TO RELATED APPLICATIONS
[0001] This application claims the benefit of priority from (1) U.S. Provisional Application No. 62/436,875 entitled "Blood Profiling with Protease Inhibitors" filed 20 Dec. 2016, (2) U.S. Provisional Application No. 62/482,582 entitled "Blood Profiling with Protease Inhibitors" filed 6 Apr. 2017, and (3) U.S. Provisional Application No. 62/523,489 entitled "Blood Profiling with Protease Inhibitors" filed 22 Jun. 2017. Each of the foregoing related applications, in their entirety, are incorporated herein by reference.
[0002] In addition, each of the following applications, in their entirety, are incorporated herein by reference: (1) Australian Application No. 2015904075 entitled "Blood Preparation and Profiling" filed 7 Oct. 2015; (2) International Application No. PCT/AU2016/000341, entitled "Blood Preparation and Profiling", filed 6 Oct. 2016, and (3) Australian Application No. 2015905309 entitled "Therapeutic Methods Using Erythrocytes" filed 22 Dec. 2015. In addition, the other references or publications referred to in the present disclosure are also hereby incorporated by reference in their entirety.
TECHNICAL FIELD
[0003] The present disclosure relates generally to the field of haematology. The present disclosure relates to protein profiling in the blood and methods for producing and/or generating blood protein profiles, including, for example, cytokine and/or chemokine profiles, from red blood cell-enriched blood samples and/or red blood cell components.
BACKGROUND
[0004] Protein profiling of blood is used for a variety of purposes. For example, the profiling of indicative proteins in peripheral blood mononuclear cells (PBMC) and serum/plasma is commonly used in disease diagnosis. Additionally, monitoring protein profiles within the blood may assist in directing more effective therapeutic interventions by providing a way of monitoring responsiveness to treatment and an indication of remission or regression.
[0005] Biological markers found in blood such as cytokines, chemokines and growth factors may provide insight into inflammation, immune responses, and repair. For example, the detection and quantification of pro- and/or anti-inflammatory cytokine and chemokine levels in blood is employed to gauge immune status. These cytokines and chemokines may be used to diagnose certain disease states, determine a predisposition to developing disease, and/or to predict prognostic outcomes. However, identifying proteins to serve as biological markers for various diseases can be time consuming and labor intensive.
[0006] Typically, the detection and quantification of various proteins in the blood may be performed using isolated serum/plasma, and/or PBMCs. Erythrocytes/red blood cells (RBCs), which are an abundant cellular component of blood and account typically for 40% to 50% of its volume, are routinely removed and discarded prior to conducting blood protein analyses because they are thought to, among other things, complicate current processing and assaying methods for blood. RBCs are also not believed to provide a significant contribution to the overall protein profile of the blood. Still, reliance on the less abundant blood components like plasma/serum and PBMCs to assay for blood proteins may, for example, increase inaccuracies in blood protein profiles and limit the ability to detect proteins and/or differences in protein levels under various circumstances. There are advantages to using RBCs in protein profiling and other evaluations of proteins from blood samples that have not been fully appreciated to date by those of ordinary skill in the art.
[0007] The present disclosure is directed to solving these and other problems disclosed herein. The present disclosure is also directed to overcoming and/or ameliorating at least one of the disadvantages of the prior art as will become apparent from the discussion herein. The present disclosure is also directed to pointing out one or more advantages to using RBCs.
SUMMARY OF THE DISCLOSURE
[0008] The present disclosure is directed to solving some of the aforementioned problems with blood protein profiles, surprisingly finding that RBCs are a source of a number of different proteins (e.g., cytokines, chemokines, and/or growth factors) at substantial levels. Moreover, the present inventors have found, among other things, that the addition of protease inhibitors to a red blood cell sample modulates the levels of various proteins in samples from those having a disease or disorder, yet does not similarly modulate the levels of those proteins in red blood cell samples from those not having the disease or disorder. Thus, the present inventors have created, among other things, new and useful laboratory techniques for producing a protein profile from whole blood, an enriched red blood cell sample and/or red blood cell components by evaluating the presence, level, or change in level of proteins in RBCs that have been contacted with various protease inhibitors. The new and useful laboratory techniques are an improvement over current techniques for producing a protein profile from blood and/or detecting a disease or disorder by increasing the ability to detect proteins and/or differentiate between those having a disease or disorder and healthy individuals. The present disclosure provides, among other things, improved methods, kits, and/or systems for producing protein profiles from whole blood, a red blood cell-enriched sample, red blood cell-enriched fraction, and/or red blood cell components using protease inhibitors, thereby providing one or more advantages including, but not limited to, reducing inaccuracies in protein detection and increasing protein detection and differential expression in relevant blood samples.
[0009] Certain non-limiting embodiments of the present disclosure are disclosed herein.
[0010] Certain embodiment are to methods for producing a protein profile, the methods comprising obtaining a blood sample; obtaining a red blood cell component from the blood sample; measuring the level of one or more proteins from the red blood cell component; contacting the red blood cell component with one or more protease inhibitors;
[0011] measuring the level of the one or more proteins from the red blood cell component contacted with the one or more protease inhibitors; and determining the change in the level of the one or more proteins from the red blood cell component before and after being contacted with the one or more protease inhibitors, wherein the protein profile produced comprises one or more proteins having a change in level before and after the red blood cell component is contacted with the one or more protease inhibitors.
[0012] Certain embodiments are to methods of producing a protein profile, the methods comprising obtaining blood sample or a red blood cell component from a blood sample; obtaining a first and second portion from the blood sample or the red blood cell component; contacting the second portion from the blood sample or the red blood cell component with one or more protease inhibitors; measuring the level of one or more proteins from the first and second portions of the blood sample or the red blood cell component, wherein the first portion has not been contacted with the one or more protease inhibitors; and determining the change in the level of the one or more proteins from the first portion of the blood sample or the red blood cell component and the second portion of the blood sample or the red blood cell component, wherein the protein profile produced comprises one or more proteins having a change in level of the one or more proteins from first portion of the blood sample or the red blood cell component and the second portion of the blood sample or the red blood cell component. In some embodiments, both a blood sample and a red blood cell component are obtained.
[0013] Certain embodiments are to methods of producing a protein profile, the methods comprising obtaining a blood sample that is from a subject not having a disease or disorder; obtaining a red blood cell component from the blood sample; measuring the level of one or more proteins from the red blood cell component; contacting the red blood cell component with one or more protease inhibitors; measuring the level of the one or more proteins from the red blood cell component contacted with the one or more protease inhibitors; and determining the change in the level of the one or more proteins from the red blood cell component before and after being contacted with the one or more protease inhibitors, wherein the protein profile produced comprises the change in the level of the one or more proteins from the red blood cell component before and after being contacted with one or more protease inhibitors.
[0014] Certain embodiments are to methods of producing a disease protein profile, the methods comprising obtaining from a subject having a disease or disorder a first protein profile produced according to one or more of the other embodiments; obtaining from a subject not having the disease or disorder a second protein profile produced according to one or more of the other embodiments, wherein the second protein profile is obtained from the same red blood cell component the first protein profile was obtained from; and comparing the difference between the change in the level of one or more proteins from the subject having the disease or disorder to the change in the level of the one or more proteins from the subject not having the disease or disorder, wherein the disease protein profile produced comprises one or more proteins for which there is a difference between the change in the level of the one or more proteins from the subject having the disease or disorder and the change in the level of the one or more proteins from the subject not having the disease or disorder.
[0015] In some embodiments, the red blood cell component is obtained from whole blood or isolated red blood cells. In other embodiments, the red blood cell component is red blood cells or red blood cell membranes. In other embodiments, the level of two or more proteins, three or more proteins, four or more proteins, five or more proteins, six or more proteins, seven or more proteins, eight or more proteins, nine or more proteins, or ten or more proteins is measured. In certain embodiments, the level of three or more proteins is measured. In certain other embodiments, the red blood cell component is contacted with one or more protease inhibitors, two or more protease inhibitors, three or more protease inhibitors, four or more protease inhibitors, five or more protease inhibitors, six or more protease inhibitors, seven or more protease inhibitors, eight or more protease inhibitors, nine or more protease inhibitors, or ten or more protease inhibitors. In other embodiments, the red blood component is contacted with a protease inhibitor cocktail comprising at least two protease inhibitors. In certain embodiments, the red blood cell component is contacted with the protease inhibitor cocktail A8127s. In some embodiments, the one or more protease inhibitors are selected from the group consisting of serine protease inhibitors, cysteine protease inhibitors, metalloprotease inhibitors, aspartic protease inhibitors, and aminopeptidase inhibitors. In other embodiments, the change in the level of the one or more proteins is determined by a statistical analysis selected from the group consisting of a Student T's test, an ANOVA test, a mixed-effects model, a Mann-Whitney test, a Wilcoxon rank sum, and a Spermans rank correlation. In certain embodiments, the change in the level of the one or more proteins is a fold change between 0-fold and 5-fold. In still other embodiments, the difference between the change in the level of the one or more proteins from the subject having a disease or disorder and the change in the level of the one or more proteins from the subject not having the disease or disorder is determined by a statistical analysis selected from the group consisting of a Student T's test, an ANOVA test, a mixed-effects model, a Mann-Whitney test, a Wilcoxon rank sum, and a Spermans rank correlation. In yet other embodiments, the difference between the change in the level of the one or more proteins from the subject having a disease or disorder and the change in the level of the one or more proteins from the subject not having the disease or disorder is an increase in the change in the level or a decrease in the change in the level. In certain other embodiments, the subject is a human or a non-human animal. In some embodiments, the level of the one or more proteins is measured using one or more antibodies. In other embodiments, the one or more proteins are selected from the group consisting of chemokines, cytokines, growth factors, receptors, intracellular signal transmitters, hormones, nuclear transcription factors, neurotransmitters, extracellular matrix components, glycoproteins, inflammatory proteins, and enzymes. In certain embodiments, the one or more proteins are selected from the group consisting of the proteins listed in Table 1 or the proteins listed in Table 2. In some embodiments, the disease or disorder is preeclampsia. In certain embodiments, the disease protein profile is a preeclampsia protein profile comprising one or more proteins selected from the group consisting of IL-1.beta., IL-8, TNF-.alpha., IL-1ra, MCP-1, G-CSG, GM-CSF, IL-6, IFN.alpha.2, IL-1a, IL-18, MIF, IL-2ra, and HGF. In other embodiments, the disease or disorder is colorectal cancer. In still other embodiments, the disease protein profile is a cancer protein profile comprising one or more proteins selected from the group consisting of IL-6, IFN-.gamma., IL-4, IL-13, MIF, Eotaxin, RANTES, IL-7, IP-10, PDGF, and IL-12p40.
[0016] Certain embodiments are to methods of monitoring a disease or disorder in a subject, the methods comprising obtaining from the subject having a disease or disorder a first blood sample at a first point in time and a second blood sample at a second point in time; measuring the level of at least one protein from a disease protein profile produced according to one or more of the other embodiments for the disease or disorder in the first blood sample and second blood sample; and determining the difference between the change in the level of the at least one protein in the first blood sample and second blood sample, wherein a difference between the change in the level of the at least one protein in the first blood sample and second blood sample indicates a change in the disease or disorder.
[0017] Certain embodiments are to methods of monitoring the effect of a treatment in a subject, the methods comprising obtaining from the subject a first protein profile produced according to one or more of the other embodiments at a first point in time and a second protein profile produced according to one or more of the other embodiments at a second point in time; and comparing the change in the level of at least one protein from the first protein profile to the change in the level of the at least one protein from the second protein profile, wherein a difference between the change in the level of the at least one protein from the first protein profile and the change in the level of the at least one protein from the second protein profile indicates an effect of the treatment. In certain embodiments, the first point in time is before treatment and the second point in time is after treatment. In some embodiments, the first point in time is before treatment and the second point in time is during treatment. In other embodiments, the first point in time and the second point in time are during treatment. In still other embodiments, the first point in time is during treatment and the second point in time is after treatment. In other embodiments, the first point in time and the second point in time are after treatment. In yet other embodiments, the subject has received the same treatment. In other embodiments, the subject has received a different treatment. In certain embodiments, the blood sample is a small volume blood sample. In other embodiments, the subject is monitored a number of times selected from the group consisting of one or more times per day, two or more times per day, three or more times per day, four or more times per day, and five or more times per day. In still other embodiments, the subject is monitored a number of times selected from the group consisting of one or more times per week, two or more times per week, three or more times per week, four or more times per week, five or more times per week, six or more times per week, and seven or more times per week. In certain embodiments, the subject is monitored daily. In some embodiments, the subject is monitored a number of times selected from the group consisting of once a week, once every two weeks, once every three weeks, and once every four weeks.
[0018] Certain embodiments are to methods of diagnosing a disease or disorder, the methods comprising obtaining at least one disease protein profile produced according to one or more of the other embodiments; obtaining a blood sample that is from a subject; obtaining a red blood cell component from the blood sample; contacting at least a first portion of the red blood component with one or more protease inhibitors; measuring the level of at least one protein from the disease protein profile in the first portion of the red blood component and the level of the at least one protein in a second portion of the red blood component that has not been contacted with the one or more protease inhibitors; determining the change in the level between the at least one protein in the first portion of the red blood component and the at least one protein in a second portion of the red blood component; and comparing the change in the level between the at least one protein in the first portion of the red blood cell component and the second portion of the red blood cell component to the change in level of the at least one protein in the disease protein profile, wherein a same or similar change in the level of the at least one protein in the first portion of the red blood cell component and the second portion of the red blood cell component compared to the change in level of the at least one protein in the disease protein profile indicates that the subject has the disease or disorder.
[0019] Certain embodiments are to methods of diagnosing a disease or disorder in a subject, the methods comprising obtaining at least one protein profile for the subject produced according to one or more of the other embodiments; and comparing the change in the level of at least one protein from the at least one protein profile to the change in the level of the at least one protein from a disease protein profile produced according to one or more of the other embodiments, wherein a same or similar change in level of the at least one protein from the at least one protein profile for the subject to the change in the level of the at least one protein from the disease protein profile indicates that the subject has the disease or disorder.
[0020] Certain embodiments are to methods of diagnosing a disease or disorder in a subject, the methods comprising obtaining at least one protein profile produced according to one or more of the other embodiments for the subject; obtaining at least one protein profile produced according to one or more of the other embodiments for a subject not having a disease or disorder; and comparing the change in the level of at least one protein from the at least one protein profile for the subject to the change in the level of the at least one protein from the at least one protein profile produced according to one or more of the other embodiments for a subject not having a disease or disorder, wherein a difference between the change in the level of the at least one protein from the at least one protein profile for the subject and the change in the level of the at least one protein from the at least one protein profile produced according one or more of the other embodiments for a subject not having a disease or disorder indicates that the subject has the disease or disorder.
[0021] Certain embodiments are to kits for producing a protein profile of a blood sample, the kits comprising at least one reagent to obtain a red blood cell component; one or more protease inhibitors; and at least one reagent to measure the level of one or more proteins from the red blood cell component. In certain embodiments, the kit further comprises at least one reagent to obtain a blood sample from a subject. In other embodiments, the reagent to measure the level of one or more proteins is one or more antibodies. In still other embodiments, the reagent to detect the measure the level of one or more proteins is an enzyme-linked immunosorbent assay (ELISA) apparatus. In other embodiments, the one or more protease inhibitors comprise a protease inhibitor cocktail. In yet other embodiments, the protease inhibitor cocktail is A8127s.
[0022] Certain embodiments are to methods for producing a protein profile, the methods comprising obtaining a blood sample from a subject having a disease or disorder; leukodepleting at least a portion of the blood sample to produce a red blood cell-enriched sample; contacting the red blood cell-enriched sample with one or more protease inhibitors; and detecting the presence of one or more proteins in the red blood cell-enriched sample, wherein the protein profile produced comprises one or more proteins detected in the red blood cell-enriched sample.
[0023] Certain embodiments are to methods of producing a protein profile, the methods comprising obtaining a blood sample from a subject having a disease or disorder; leukodepleting at least a portion of the blood sample to produce a red blood cell-enriched sample; isolating red blood cells and plasma in the red blood cell-enriched sample; contacting the red blood cells with one or more protease inhibitors; measuring the level of one or more proteins in the red blood cells and the level of the one or more proteins in the plasma; and calculating a protein ratio comprising the level of the one or more proteins in the red blood cells to the level of the one or more proteins in the plasma, wherein the protein profile produced comprises one or more proteins that have a protein ratio of at least 2:1. In some embodiments, the one or more proteins have a protein ratio selected from the group consisting of at least 3:1, at least 4:1, at least 5:1, at least 10:1, at least 15:1, and at least 20:1.
[0024] Certain embodiments are to methods of producing a protein profile comprising obtaining a blood sample from a subject having a disease or disorder; leukodepleting at least a portion of the blood sample to produce a red blood cell-enriched sample; incubating the red blood cells in the red blood cell-enriched sample in a medium containing one or more protease inhibitors; and detecting one or more proteins in the medium, wherein the protein profile produced comprises one or more proteins detected in the medium.
[0025] In certain embodiments, the methods further comprise measuring the level of the one or more proteins detected in the red blood cell-enriched sample or the medium. In some embodiments, the presence of two or more proteins, three or more proteins, four or more proteins, five or more proteins, six or more proteins, seven or more proteins, eight or more proteins, nine or more proteins, or ten or more proteins, eleven or more proteins, twelve or more proteins, thirteen or more proteins, fourteen or more proteins, or fifteen or more proteins is detected or the level of two or more proteins, three or more proteins, four or more proteins, five or more proteins, six or more proteins, seven or more proteins, eight or more proteins, nine or more proteins, ten or more proteins, eleven or more proteins, twelve or more proteins, thirteen or more proteins, fourteen or more proteins, or fifteen or more proteins is measured. In some embodiments, the presence of three or more proteins is detected or the level of three or more proteins is measured. In other embodiments, the red blood cell-enriched sample is contacted with two or more protease inhibitors, three or more protease inhibitors, four or more protease inhibitors, five or more protease inhibitors, six or more protease inhibitors, seven or more protease inhibitors, eight or more protease inhibitors, nine or more protease inhibitors, or ten or more protease inhibitors. In other embodiments, the red blood cell-enriched sample is contacted with three or more protease inhibitors. In other embodiments, the red blood cell-enriched sample is contacted with three or more protease inhibitors and the presence of two or more proteins is detected or the level of two or more proteins is measured. In still other embodiments, the red blood cell-enriched sample is contacted with two or more protease inhibitors and the presence of three or more proteins is detected or the level of three or more proteins is measured. In certain embodiments, the one or more protease inhibitors are selected from the group consisting of serine protease inhibitors, cysteine protease iii inhibitors, metalloprotease inhibitors, and aspartic protease inhibitors.
[0026] In other embodiments, the subject is a human or a non-human animal. In still other embodiments, the presence of one or more proteins is detected or the level of one or more proteins is measured using one or more antibodies. In certain other embodiments, the one or more proteins are selected from the group consisting of chemokines, cytokines, growth factors, receptors, intracellular signal transmitters, hormones, nuclear transcription factors, neurotransmitters, and extracellular matrix components, and enzymes. In other embodiments, the one or more proteins are selected from the group consisting of the proteins listed in Table 1 or the proteins listed in Table 2. In some embodiments, the blood sample is leukodepleted by one or more methods selected from the group consisting of flow cytometry, magnetic bead separation, centrifugation, cellulose column, and dextran sedimentation. In some embodiments, the red blood cells are leukodepleted by dextran sedimentation.
[0027] Certain embodiments are to methods of monitoring a disease or disorder in a subject comprising obtaining at least one protein profile produced according to one or more of the other embodiments disclosed herein from the subject at a first point in time and a second point in time; and comparing the at least one protein profile of the subject at the first point in time to the at least one protein profile of the subject at the second point in time, wherein a difference in the presence or level of one or more proteins in the at least one protein profile of the subject at the first point in time compared to the at least one protein profile of the subject at the second point in time indicates a change in the disease or disorder.
[0028] Certain embodiments are to methods of monitoring treatment in a subject comprising obtaining at least one protein profile produced, according to the one or more of the other embodiments, from a subject before treatment and after treatment; and comparing the at least one protein profile of the subject before treatment to the at least one protein profile of the subject after treatment, wherein a difference in the presence or level of one or more proteins in the at least one protein profile of the subject before treatment compared to the at least one protein profile of the subject after treatment indicates an effect of the treatment on the subject. In some embodiments, the at least one protein profile of a subject who has received no treatment is compared to the at least one protein profile of the subject after receiving treatment. In some embodiments, the at least one protein profile of a subject who has received substantially no or little treatment is compared to the at least one protein profile of the subject after receiving treatment. In some embodiments, the at least one protein profile of a subject after treatment at one point in time is compared to the at least one protein profile of the subject after treatment at a different point in time. In other embodiments, the subject has received the same treatment. In other embodiments, the subject has received substantially the same treatment or similar treatment. In still other embodiments, the subject has received a different treatment. In some embodiments, the blood sample is a small volume blood sample. In some embodiments, the subject is monitored a number of times selected from the group consisting of one or more times per day, two or more times per day, three or more times per day, four or more times per day, and five or more times per day. In other embodiments, the subject is monitored a number of times selected from the group consisting of one or more times per week, two or more times per week, three or more times per week, four or more times per week, five or more times per week, six or more times per week, and seven or more times per week. In certain embodiments, the subject is monitored daily. In other embodiments, the subject is monitored a number of times selected from the group consisting of once a week, once every two weeks, once every three weeks, and once every four weeks.
[0029] Certain embodiments are to methods of producing a disease protein profile comprising obtaining a blood sample from a subject having a disease or disorder; leukodepleting at least a portion of the blood sample to produce a red blood cell-enriched sample; contacting a first portion of the red blood cell-enriched sample with one or more protease inhibitors; measuring the level of one or more proteins in the first portion of the red blood cell-enriched sample and the level of the one or more proteins in a second portion of the red blood cell-enriched sample that has not been contacted with the one or more protease inhibitors; and comparing the level of the one or more proteins in the first portion of the red blood cell-enriched sample to the level of the one or more proteins in the second portion of the red blood cell-enriched sample, wherein the disease protein profile produced comprises one or more proteins that have a different level in the first portion of the red blood cell-enriched sample compared to the level of the one or more proteins in the second portion of the red blood cell-enriched sample. In some embodiments, the difference in the level of the one or more proteins in the first portion of the red blood cell-enriched sample compared to the level of the one or more proteins in the second portion of the red blood cell-enriched sample is determined by a statistical analysis selected from the group consisting of a Student T's test, an ANOVA test, a mixed-effects model, a Mann-Whitney test, a Wilcoxon rank sum, and a Spermans rank correlation. In some embodiments, the level of two or more proteins, three or more proteins, four or more proteins, five or more proteins, six or more proteins, seven or more proteins, eight or more proteins, nine or more proteins, or ten or more proteins is measured. In certain embodiments, the level of three or more proteins is measured. In some embodiments, the disease or disorder is preeclampsia. In other embodiments, the disease protein profile is a preeclampsia protein profile comprising one or more proteins selected from the group consisting of IL-1.beta., IL-8, TNF-.alpha., IL-1ra, MCP-1, G-CSG, GM-CSF, IL-6, IFN.alpha.2, IL-1a, IL-18, MIF, IL-2ra, and HGF. In still other embodiments, the disease or disorder is cancer. In other embodiments, the disease protein profile is a cancer protein profile comprising one or more proteins selected from the group consisting of IL-6, IFN-.gamma., IL-4, IL-13, MIF, Eotaxin, RANTES, IL-7, IP-10, PDGF, and IL-12p40.
[0030] Certain embodiments are to methods for diagnosing a disease or disorder comprising obtaining a blood sample from a subject; leukodepleting at least a portion of the blood sample to produce a red blood cell-enriched sample; contacting at least a first portion of the red blood cell-enriched sample with one or more protease inhibitors; measuring the level of one or more proteins in the first portion of the red blood cell-enriched sample and the level of the one or more proteins in a second portion of the red blood cell-enriched sample that has not been contacted with the one or more protease inhibitors; and comparing the level of the one or more proteins in the first portion of the red blood cell-enriched sample to the level of the one or more proteins in the second portion of the red blood cell-enriched sample, wherein a difference in the level of one or more proteins in the first portion of the red blood cell-enriched sample compared to the level of the one or more proteins in the second portion of the red blood cell-enriched sample indicates the subject has the disease or disorder. In some embodiments, no difference in the level of the one or more proteins indicates the subject does not have the disease or disorder.
[0031] Certain embodiments are to methods of determining whether a subject has a disease or disorder comprising obtaining a blood sample from the subject; leukodepleting at least a portion of the blood sample to produce a red blood cell-enriched sample; contacting at least a first portion of the red blood cell-enriched sample with one or more protease inhibitors; measuring the level of one or more proteins in the first portion of the red blood cell-enriched sample and the level of the one or more proteins in a second portion of the red blood cell-enriched sample that has not been contacted with the one or more protease inhibitors; and comparing the level of the one or more proteins in the first portion of the red blood cell-enriched sample to the level of the one or more proteins in the second portion of the red blood cell-enriched sample, wherein no difference in the level of the one or more proteins in the first portion of the red blood cell-enriched sample compared to the level of the one or more proteins in the second portion of the red blood cell-enriched sample indicates that the subject does not have the disease or disorder.
[0032] Certain embodiments are to methods of diagnosing a disease or disorder in a subject comprising obtaining at least one protein profile from the subject produced according to the methods provided herein; and comparing the at least one protein profile to at least one disease protein profile, wherein the presence or level of one or more proteins in the at least one protein profile that is similar to the presence or level of the one or more proteins in the at least one disease protein profile indicates the subject has the disease or disorder. In some embodiments, the at least one disease protein profile obtained is produced according to the one or more of the methods provided herein.
[0033] Certain embodiments are to methods of diagnosing a disease or disorder in a subject comprising obtaining at least one protein profile from the subject produced according to the methods provided herein; obtaining at least one protein profile from one or more subjects not having the disease or disorder; and comparing the at least one protein profile obtained from the subject to the at least one protein profile obtained from one or more subjects not having the disease or disorder, wherein a difference in the presence or level of the one or more proteins in the at least one protein profile obtained from the subject compared to presence or level of the one or more proteins in the at least one protein profile obtained from one or more subjects not having the disease or disorder indicates that the subject has the disease or disorder.
[0034] Certain embodiments are to kits for producing a protein profile of a blood sample, the kit comprising at least one reagent to leukodeplete a blood sample and produce a red blood cell-enriched sample; one or more protease inhibitors; and at least one reagent to detect the presence or measure the level of one or more proteins in the red blood cell-enriched sample. In some embodiments, the kit further comprises at least one reagent to obtain a blood sample from a subject. In other embodiments, the reagent to detect the presence or measure the level of one or more proteins is one or more antibodies. In still other embodiments, the reagent to detect the presence or measure the level of one or more proteins is an enzyme-linked immunosorbent assay (ELISA) apparatus.
[0035] As well as the embodiments discussed in the summary, other embodiments are disclosed in the specification, drawings and claims. The summary is not meant to cover each and every embodiment; combination or variations are contemplated with the present disclosure.
BRIEF DESCRIPTION OF THE DRAWINGS
[0036] Embodiments of the present disclosure are described, by way of example only, with reference to the accompanying figures.
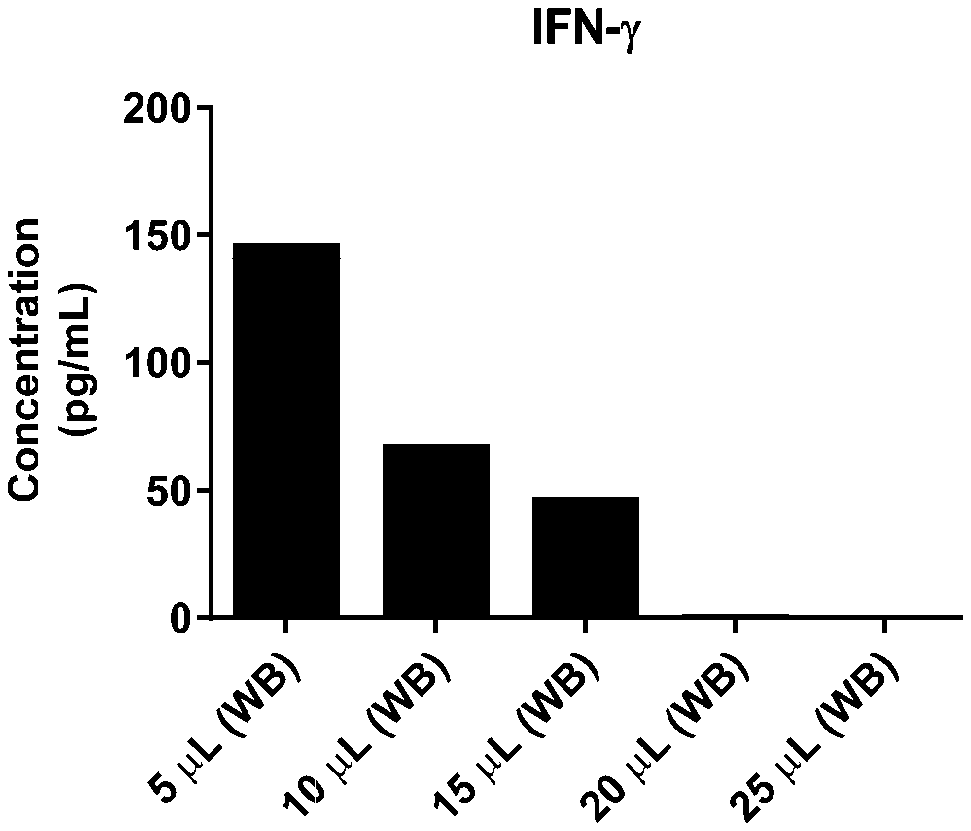
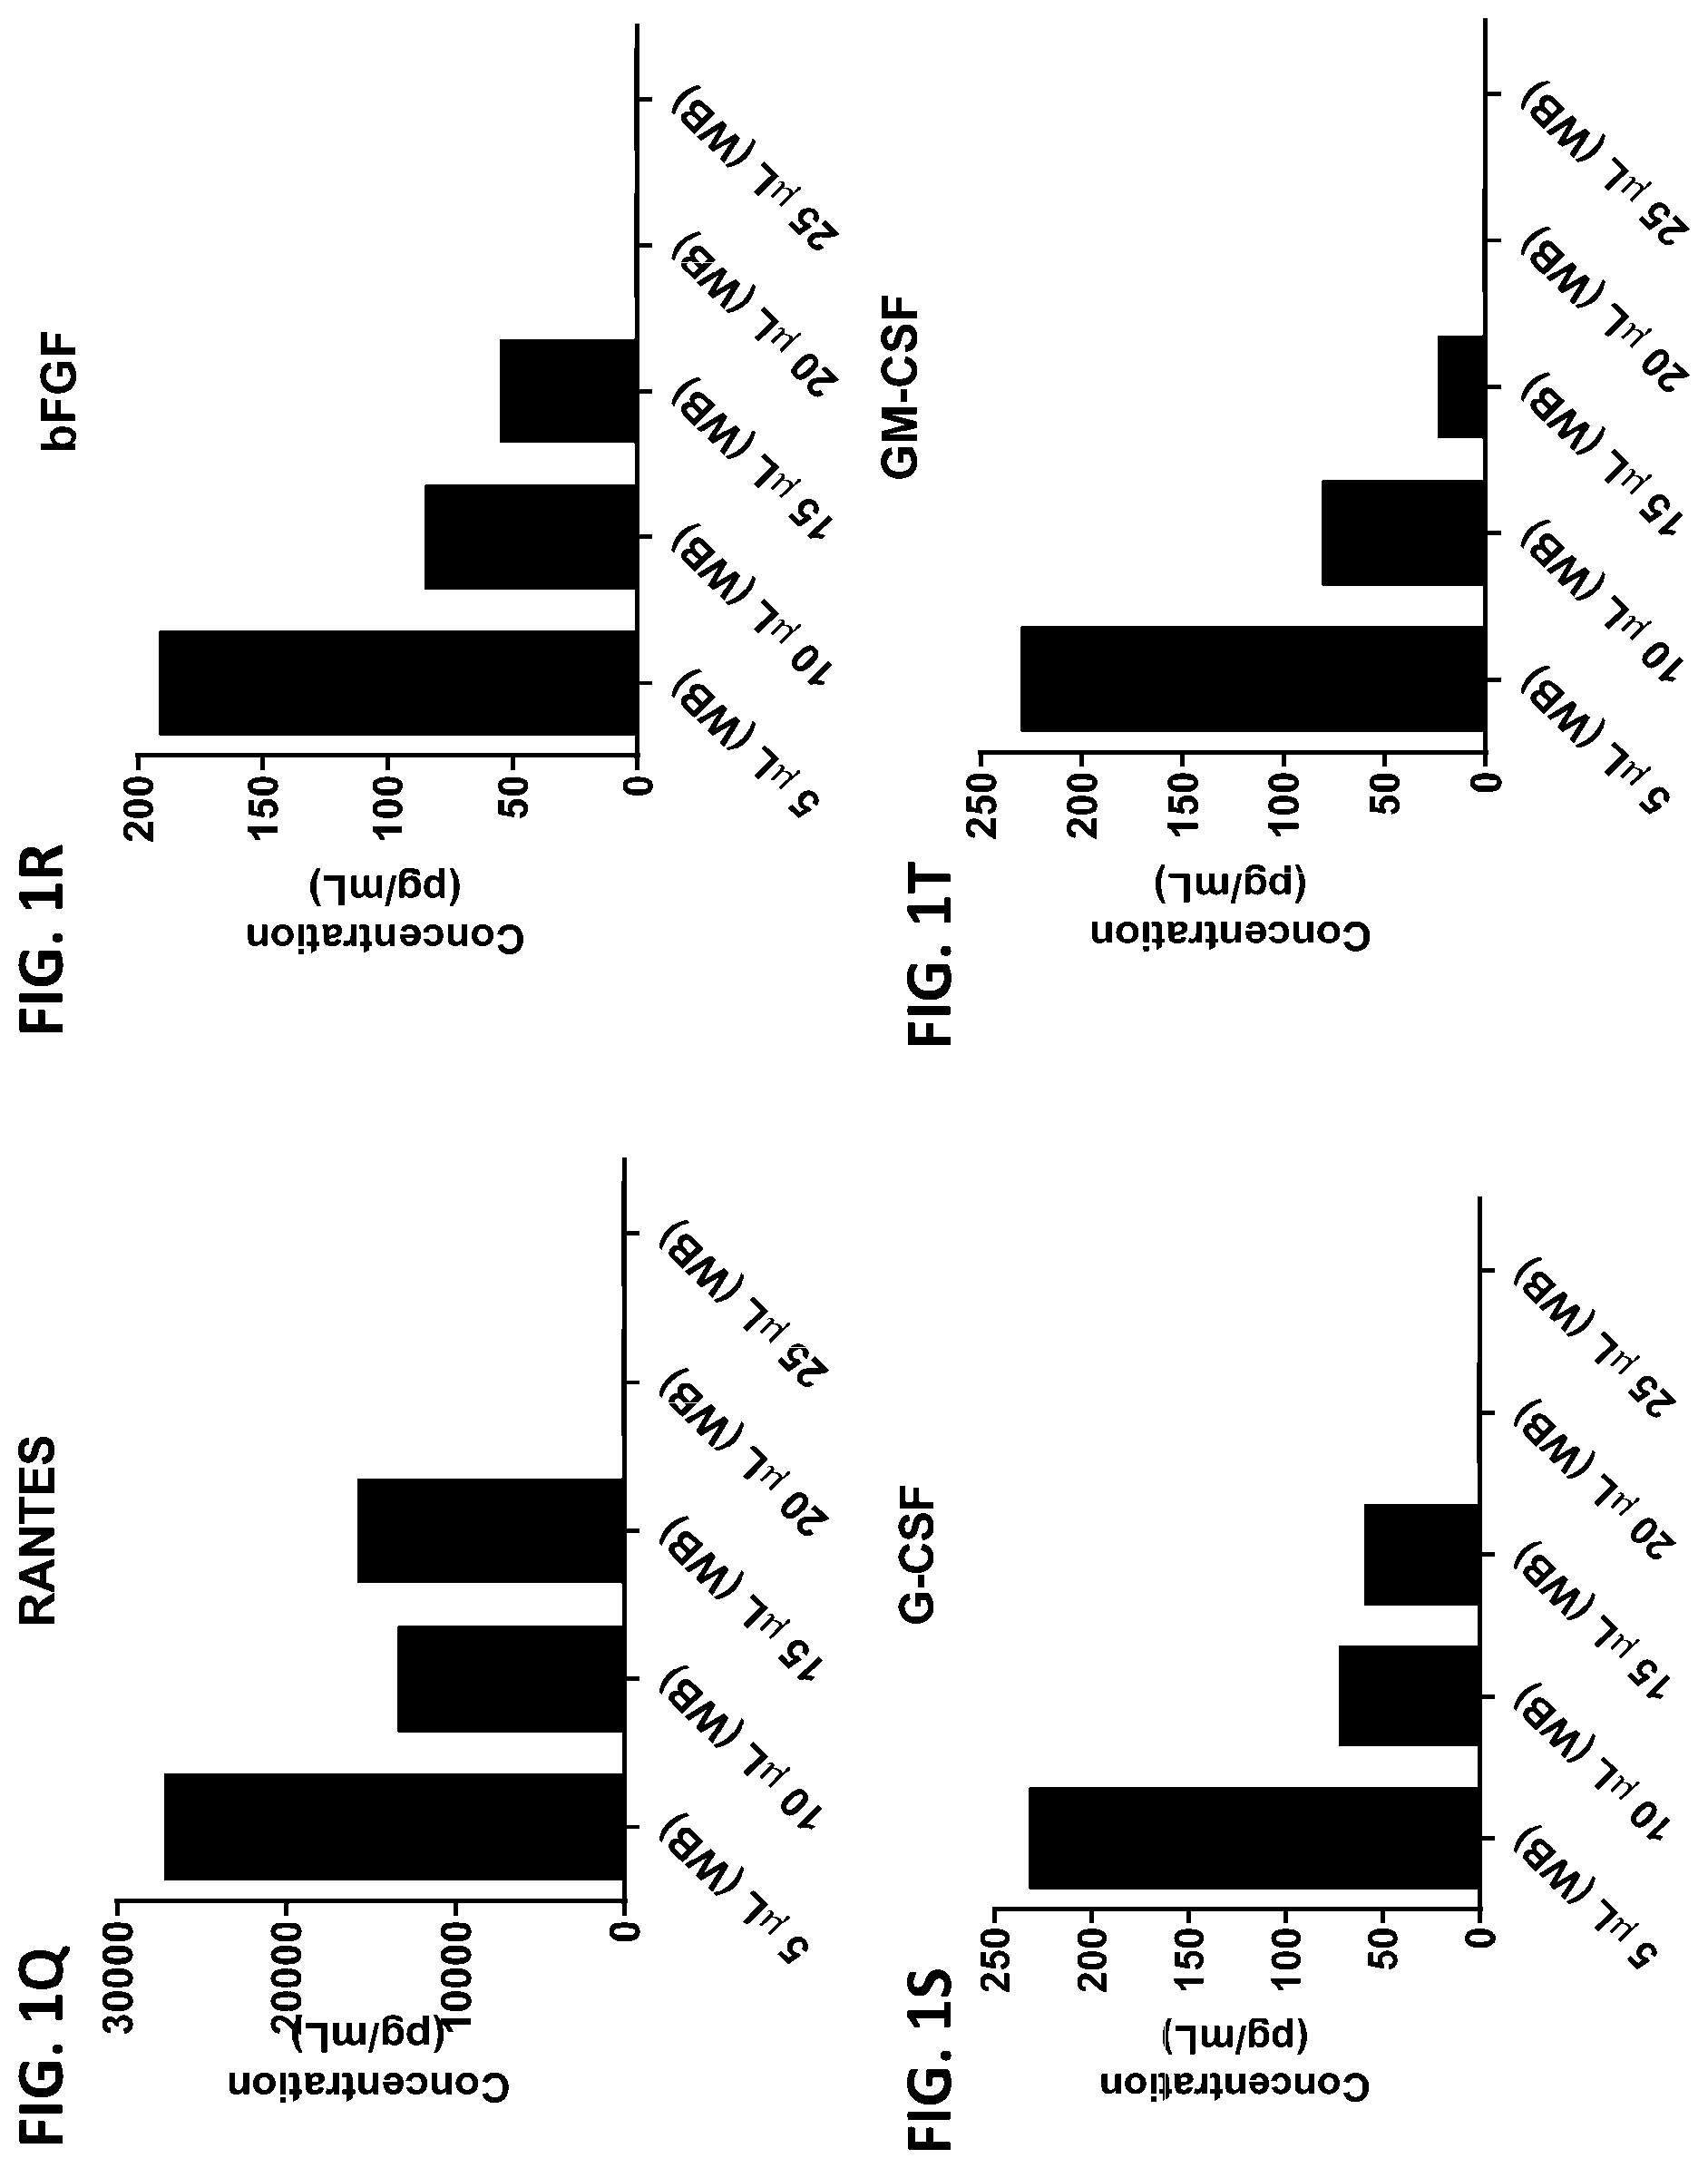
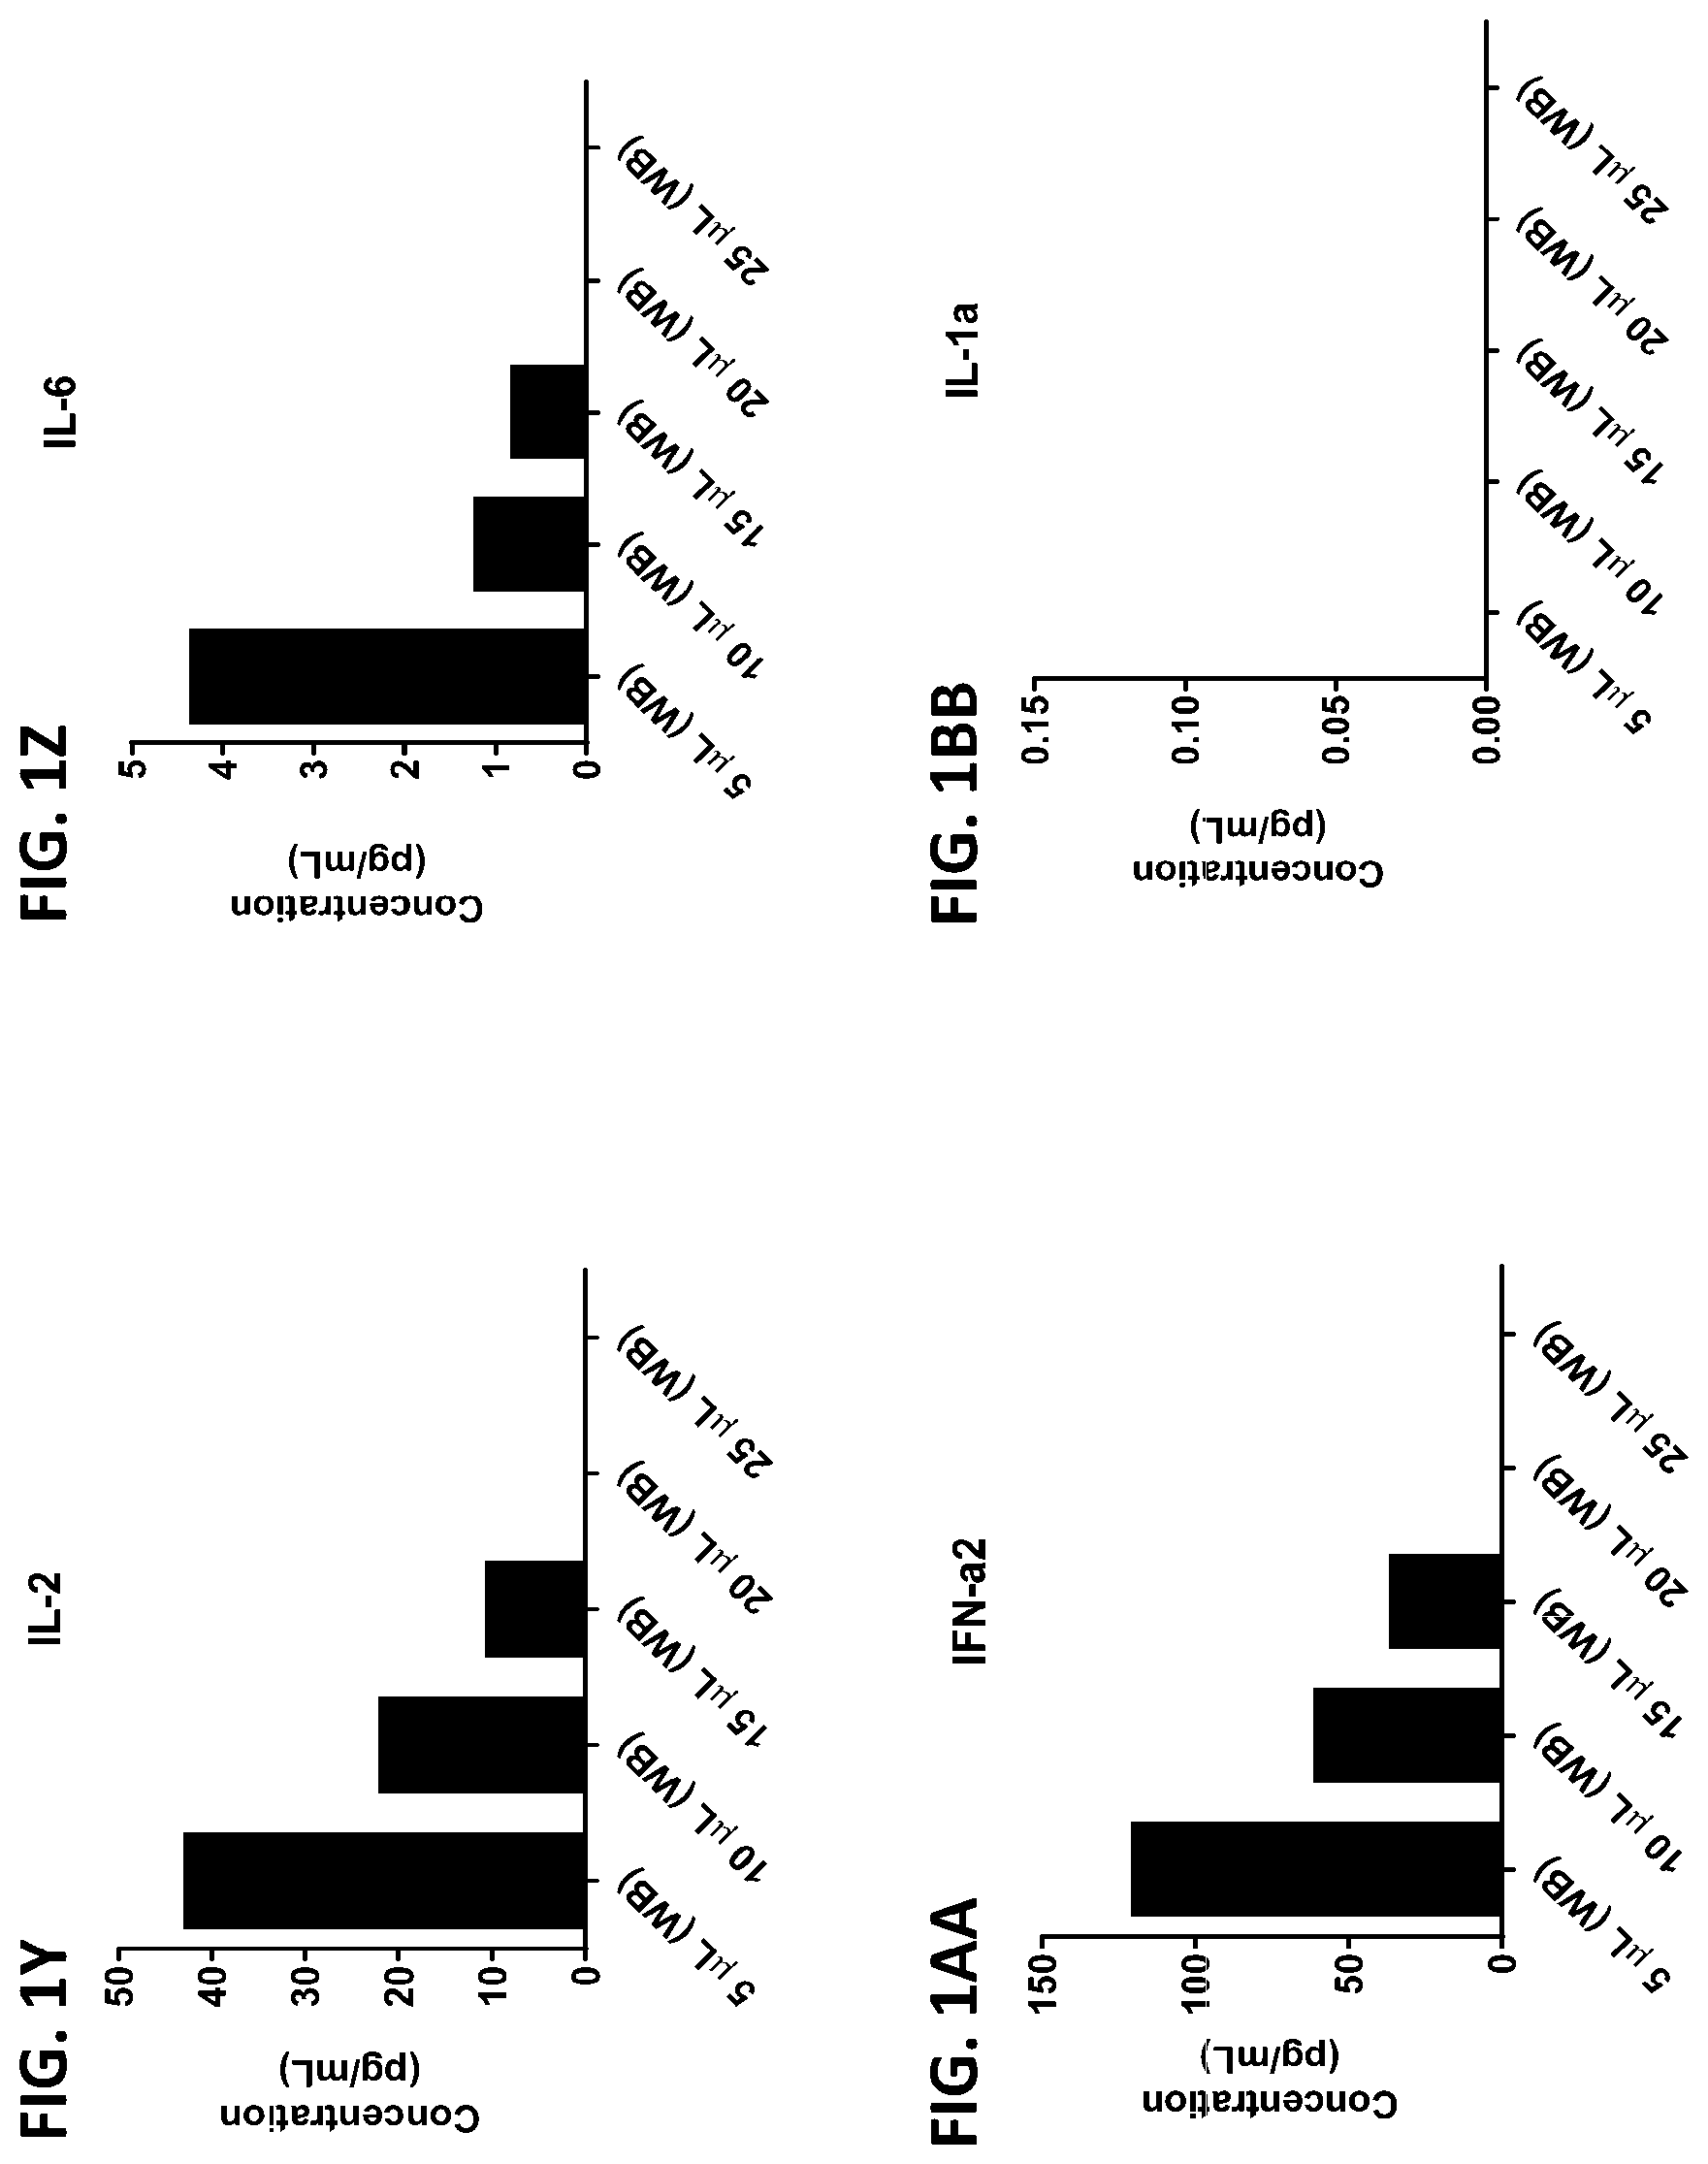
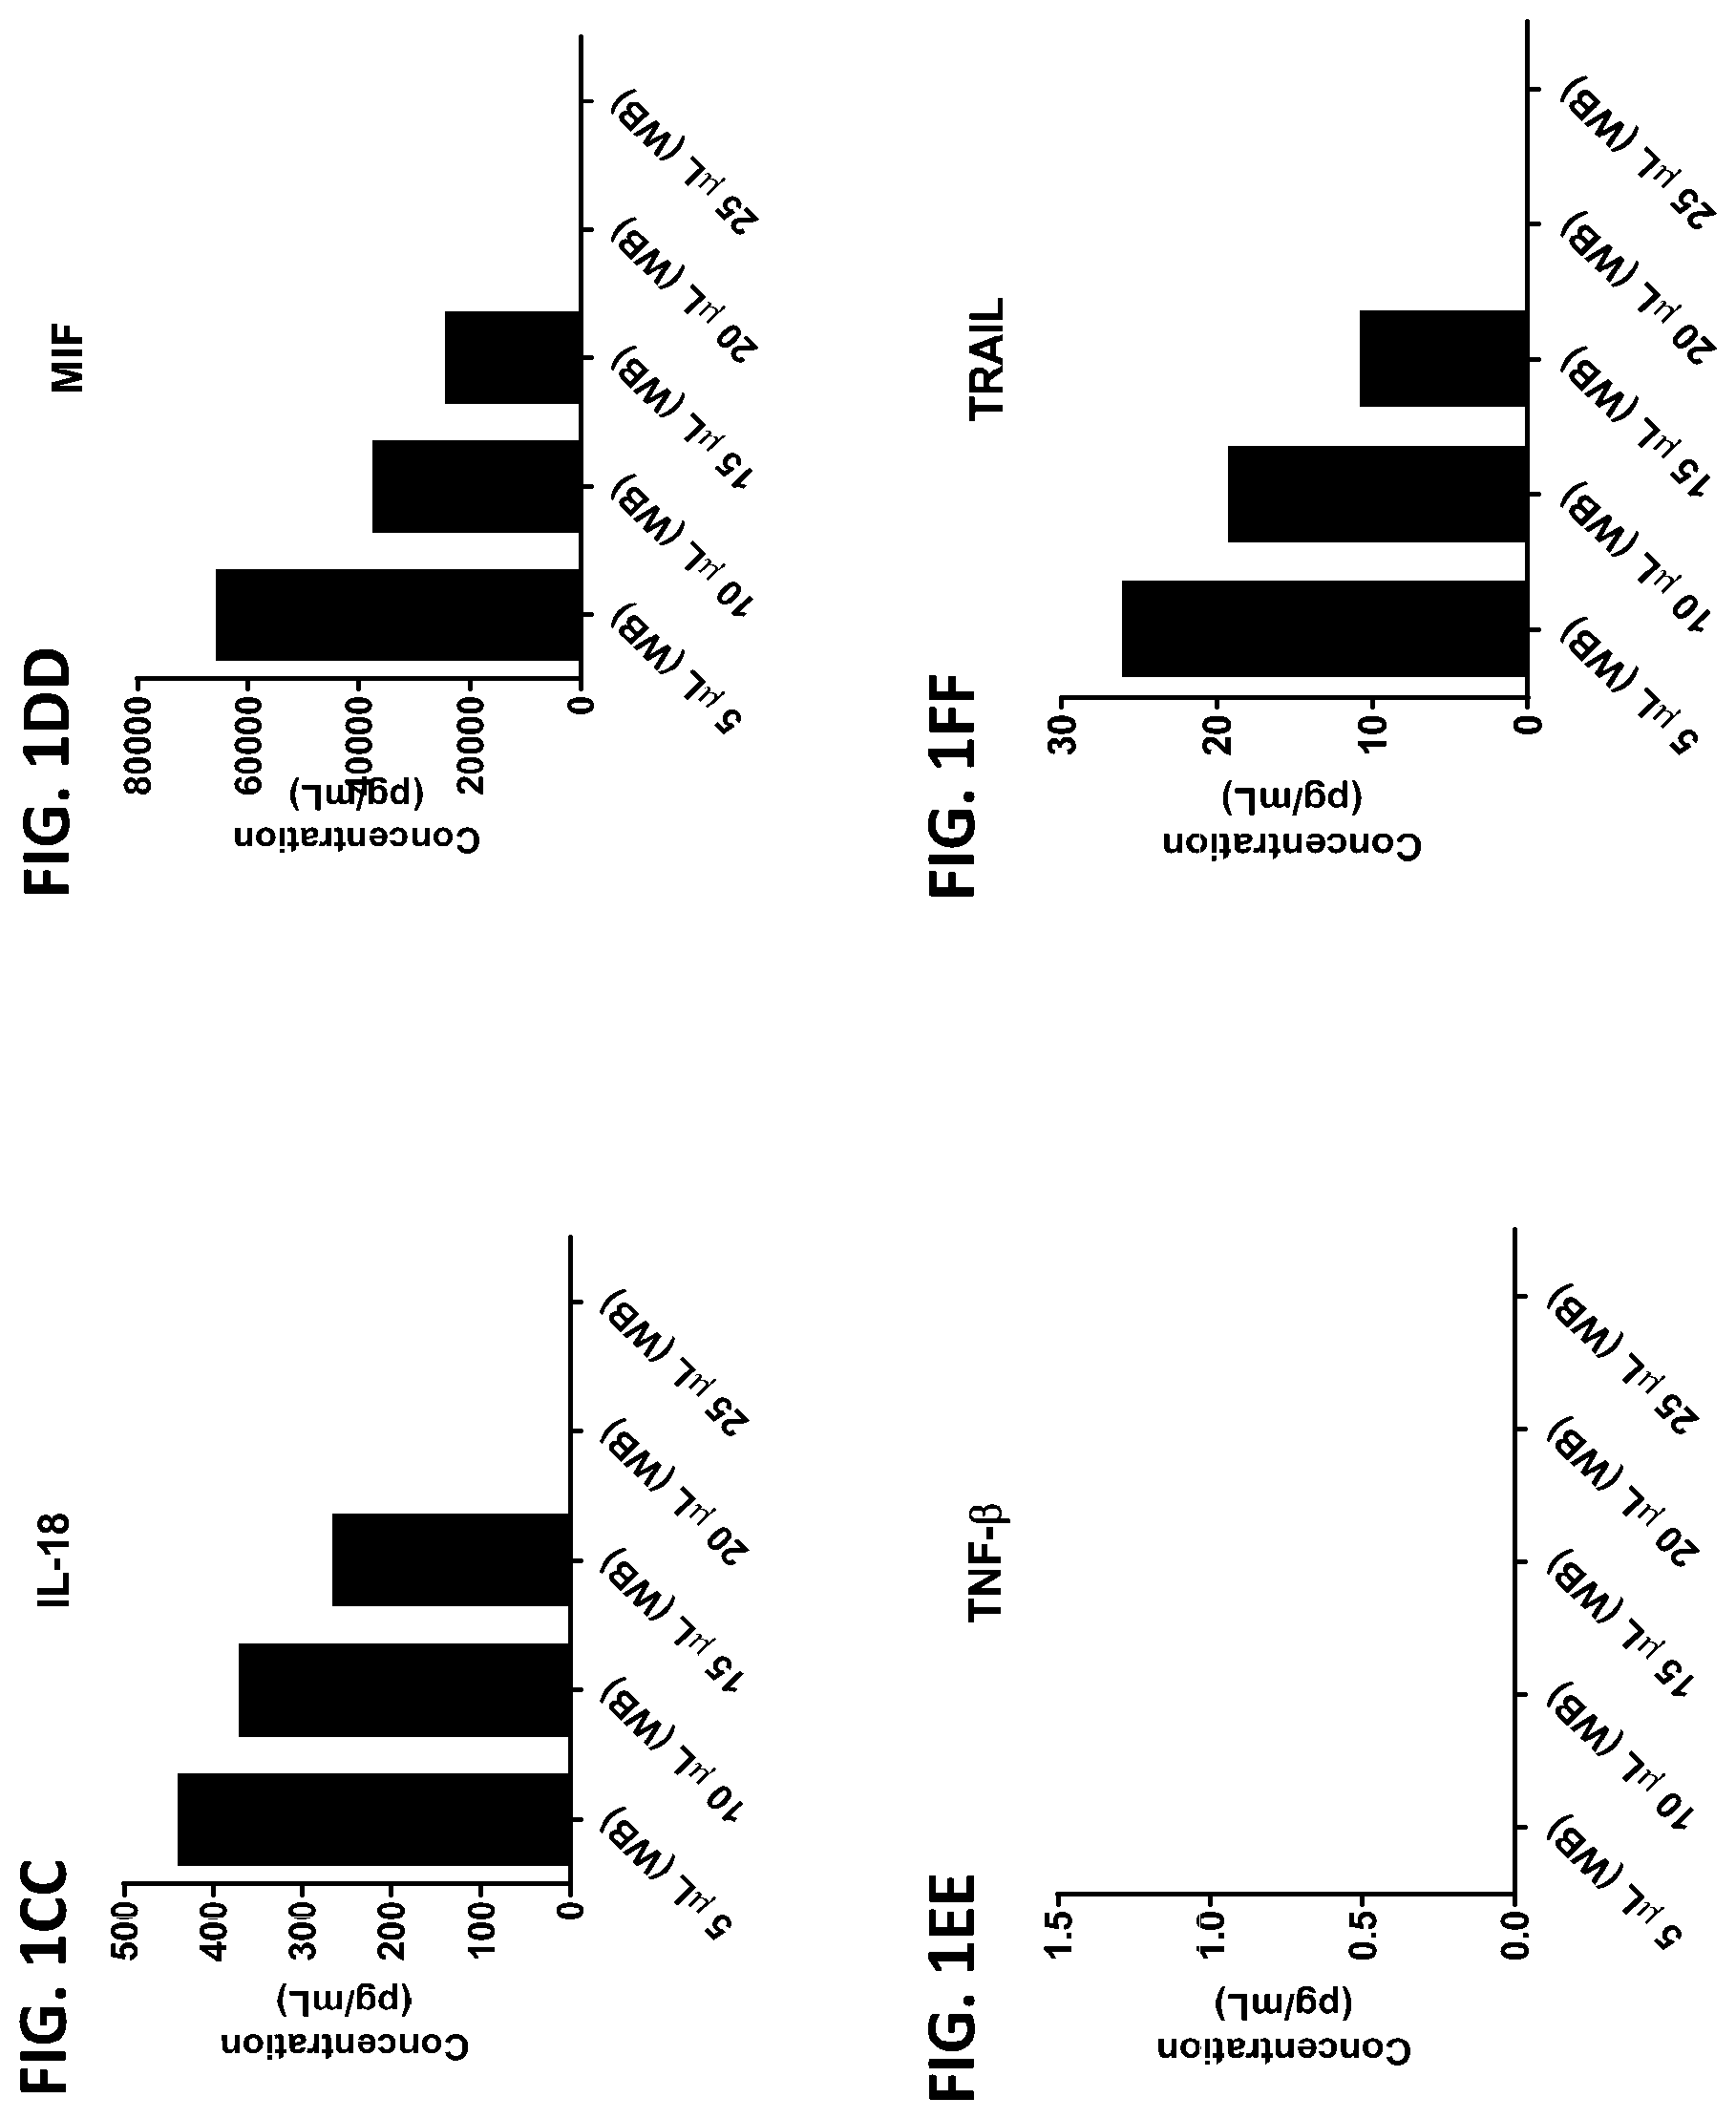
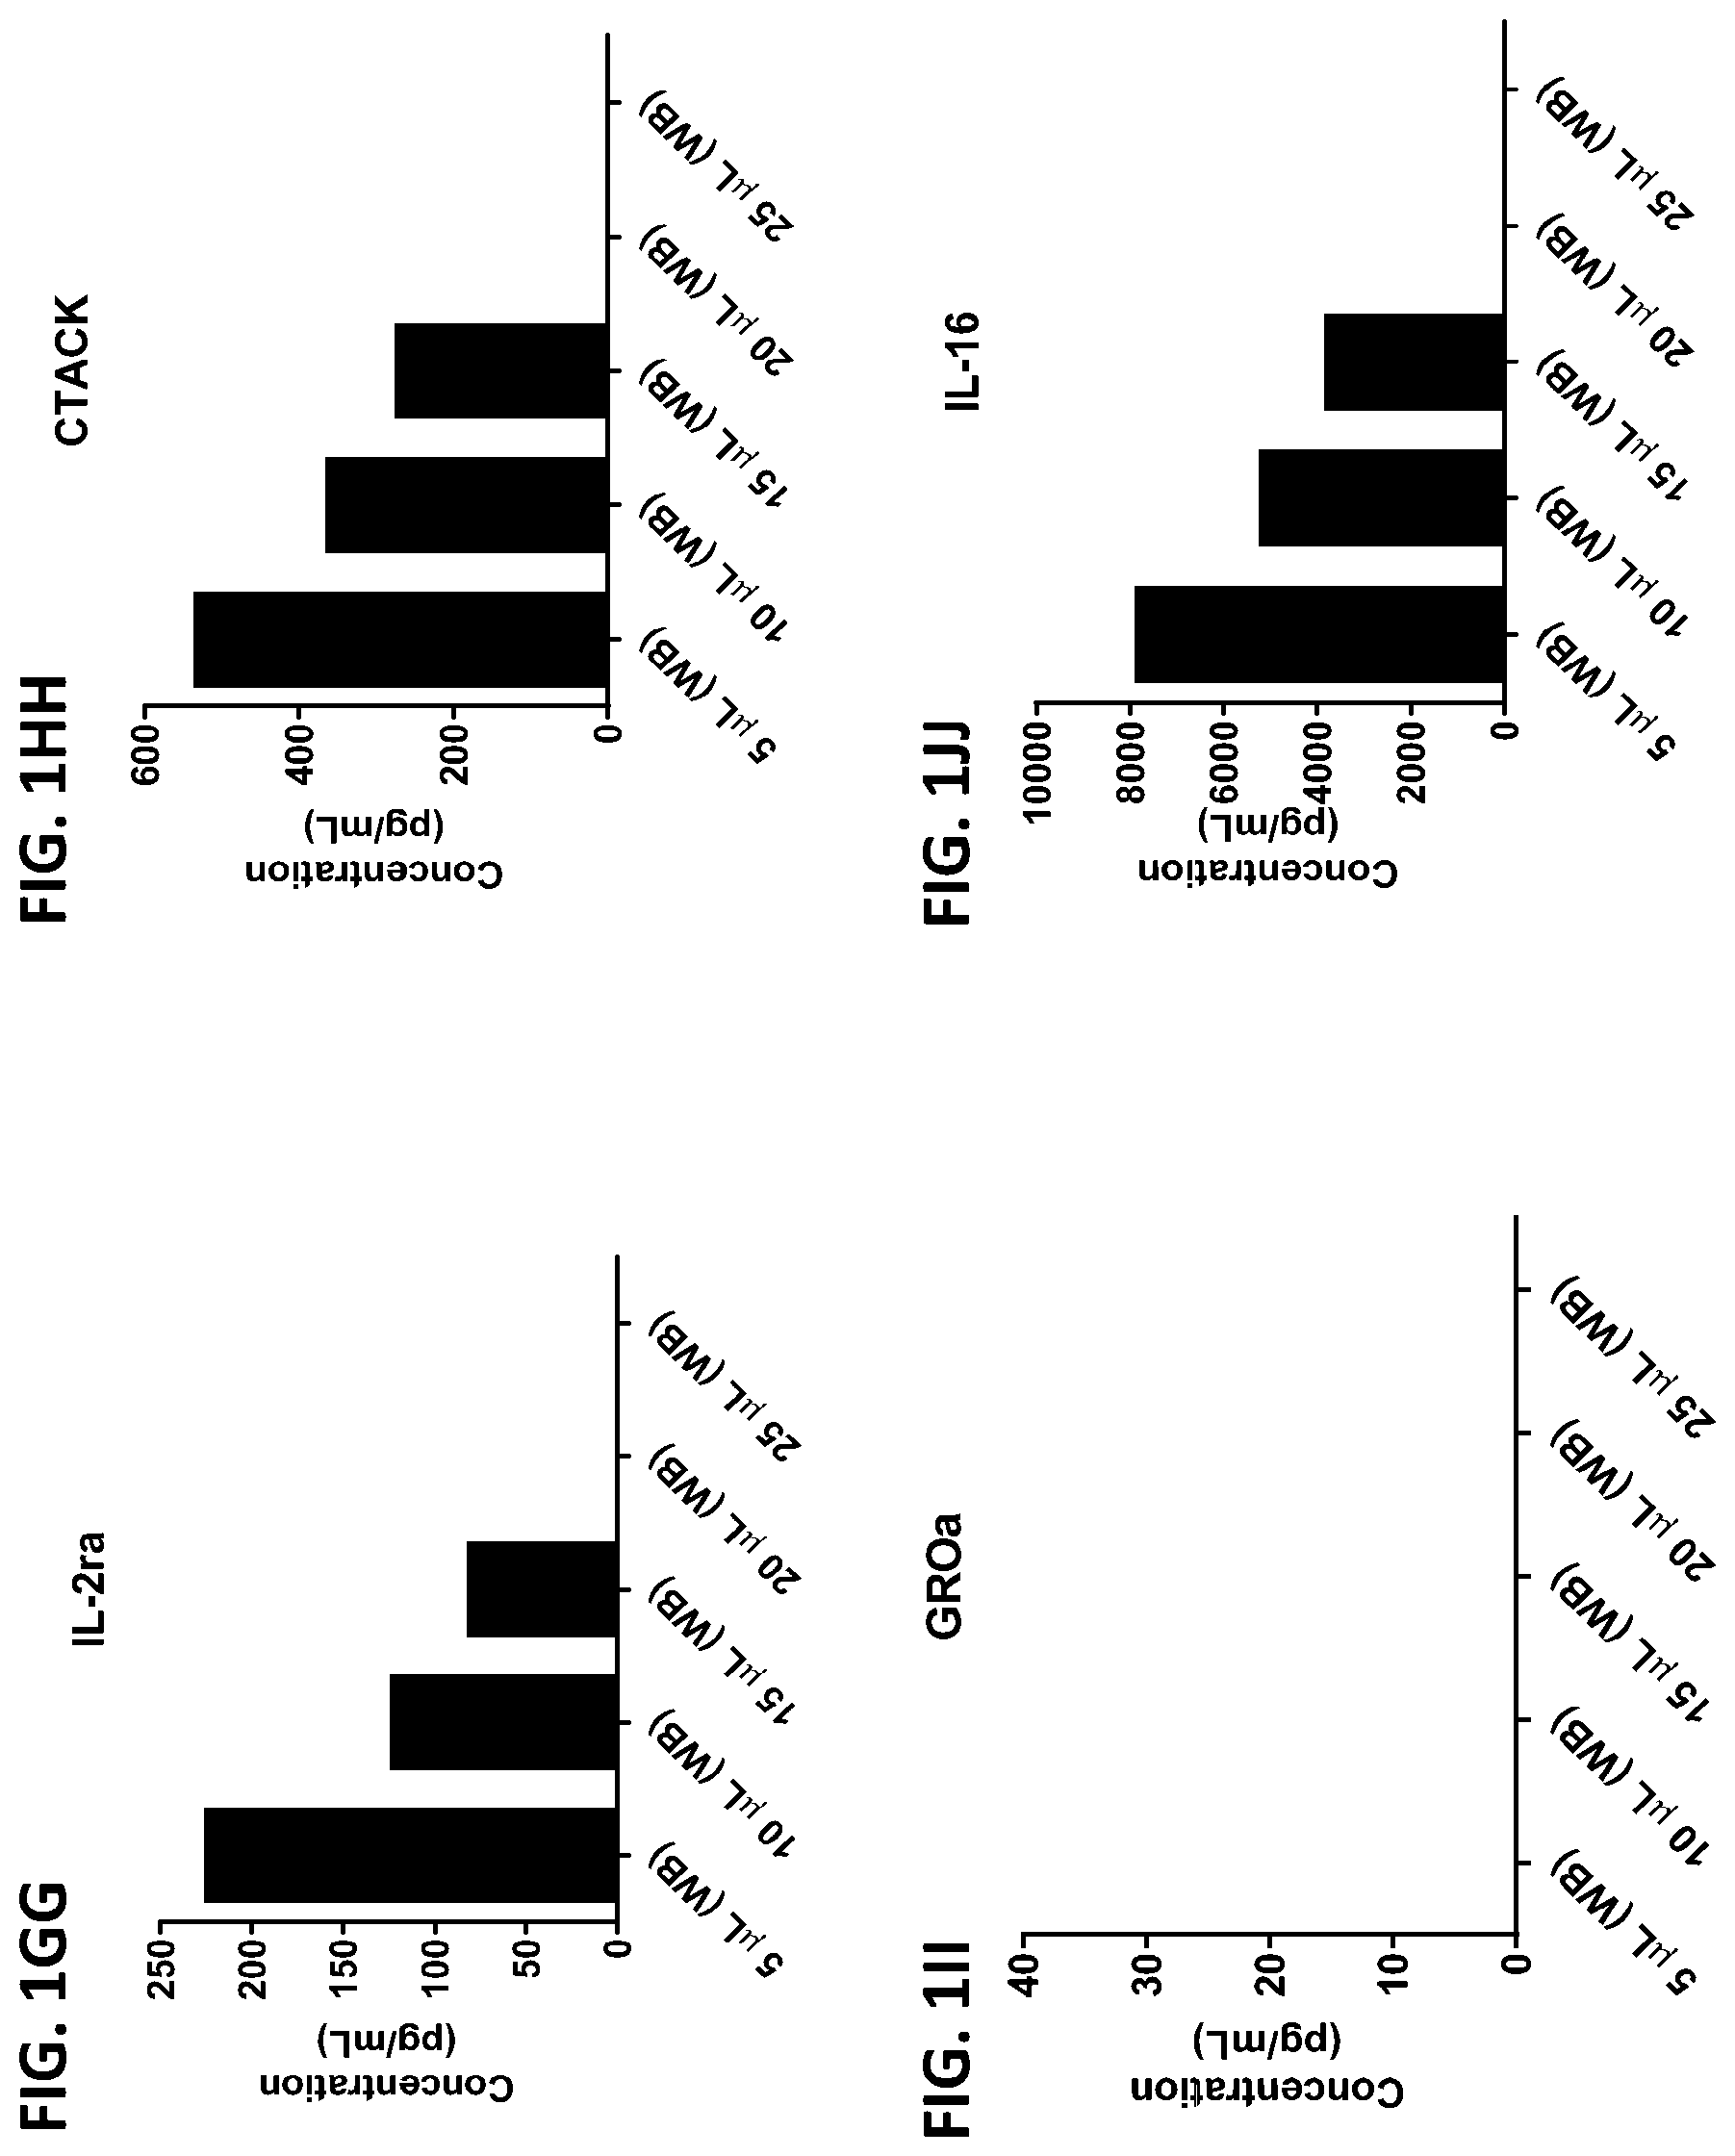
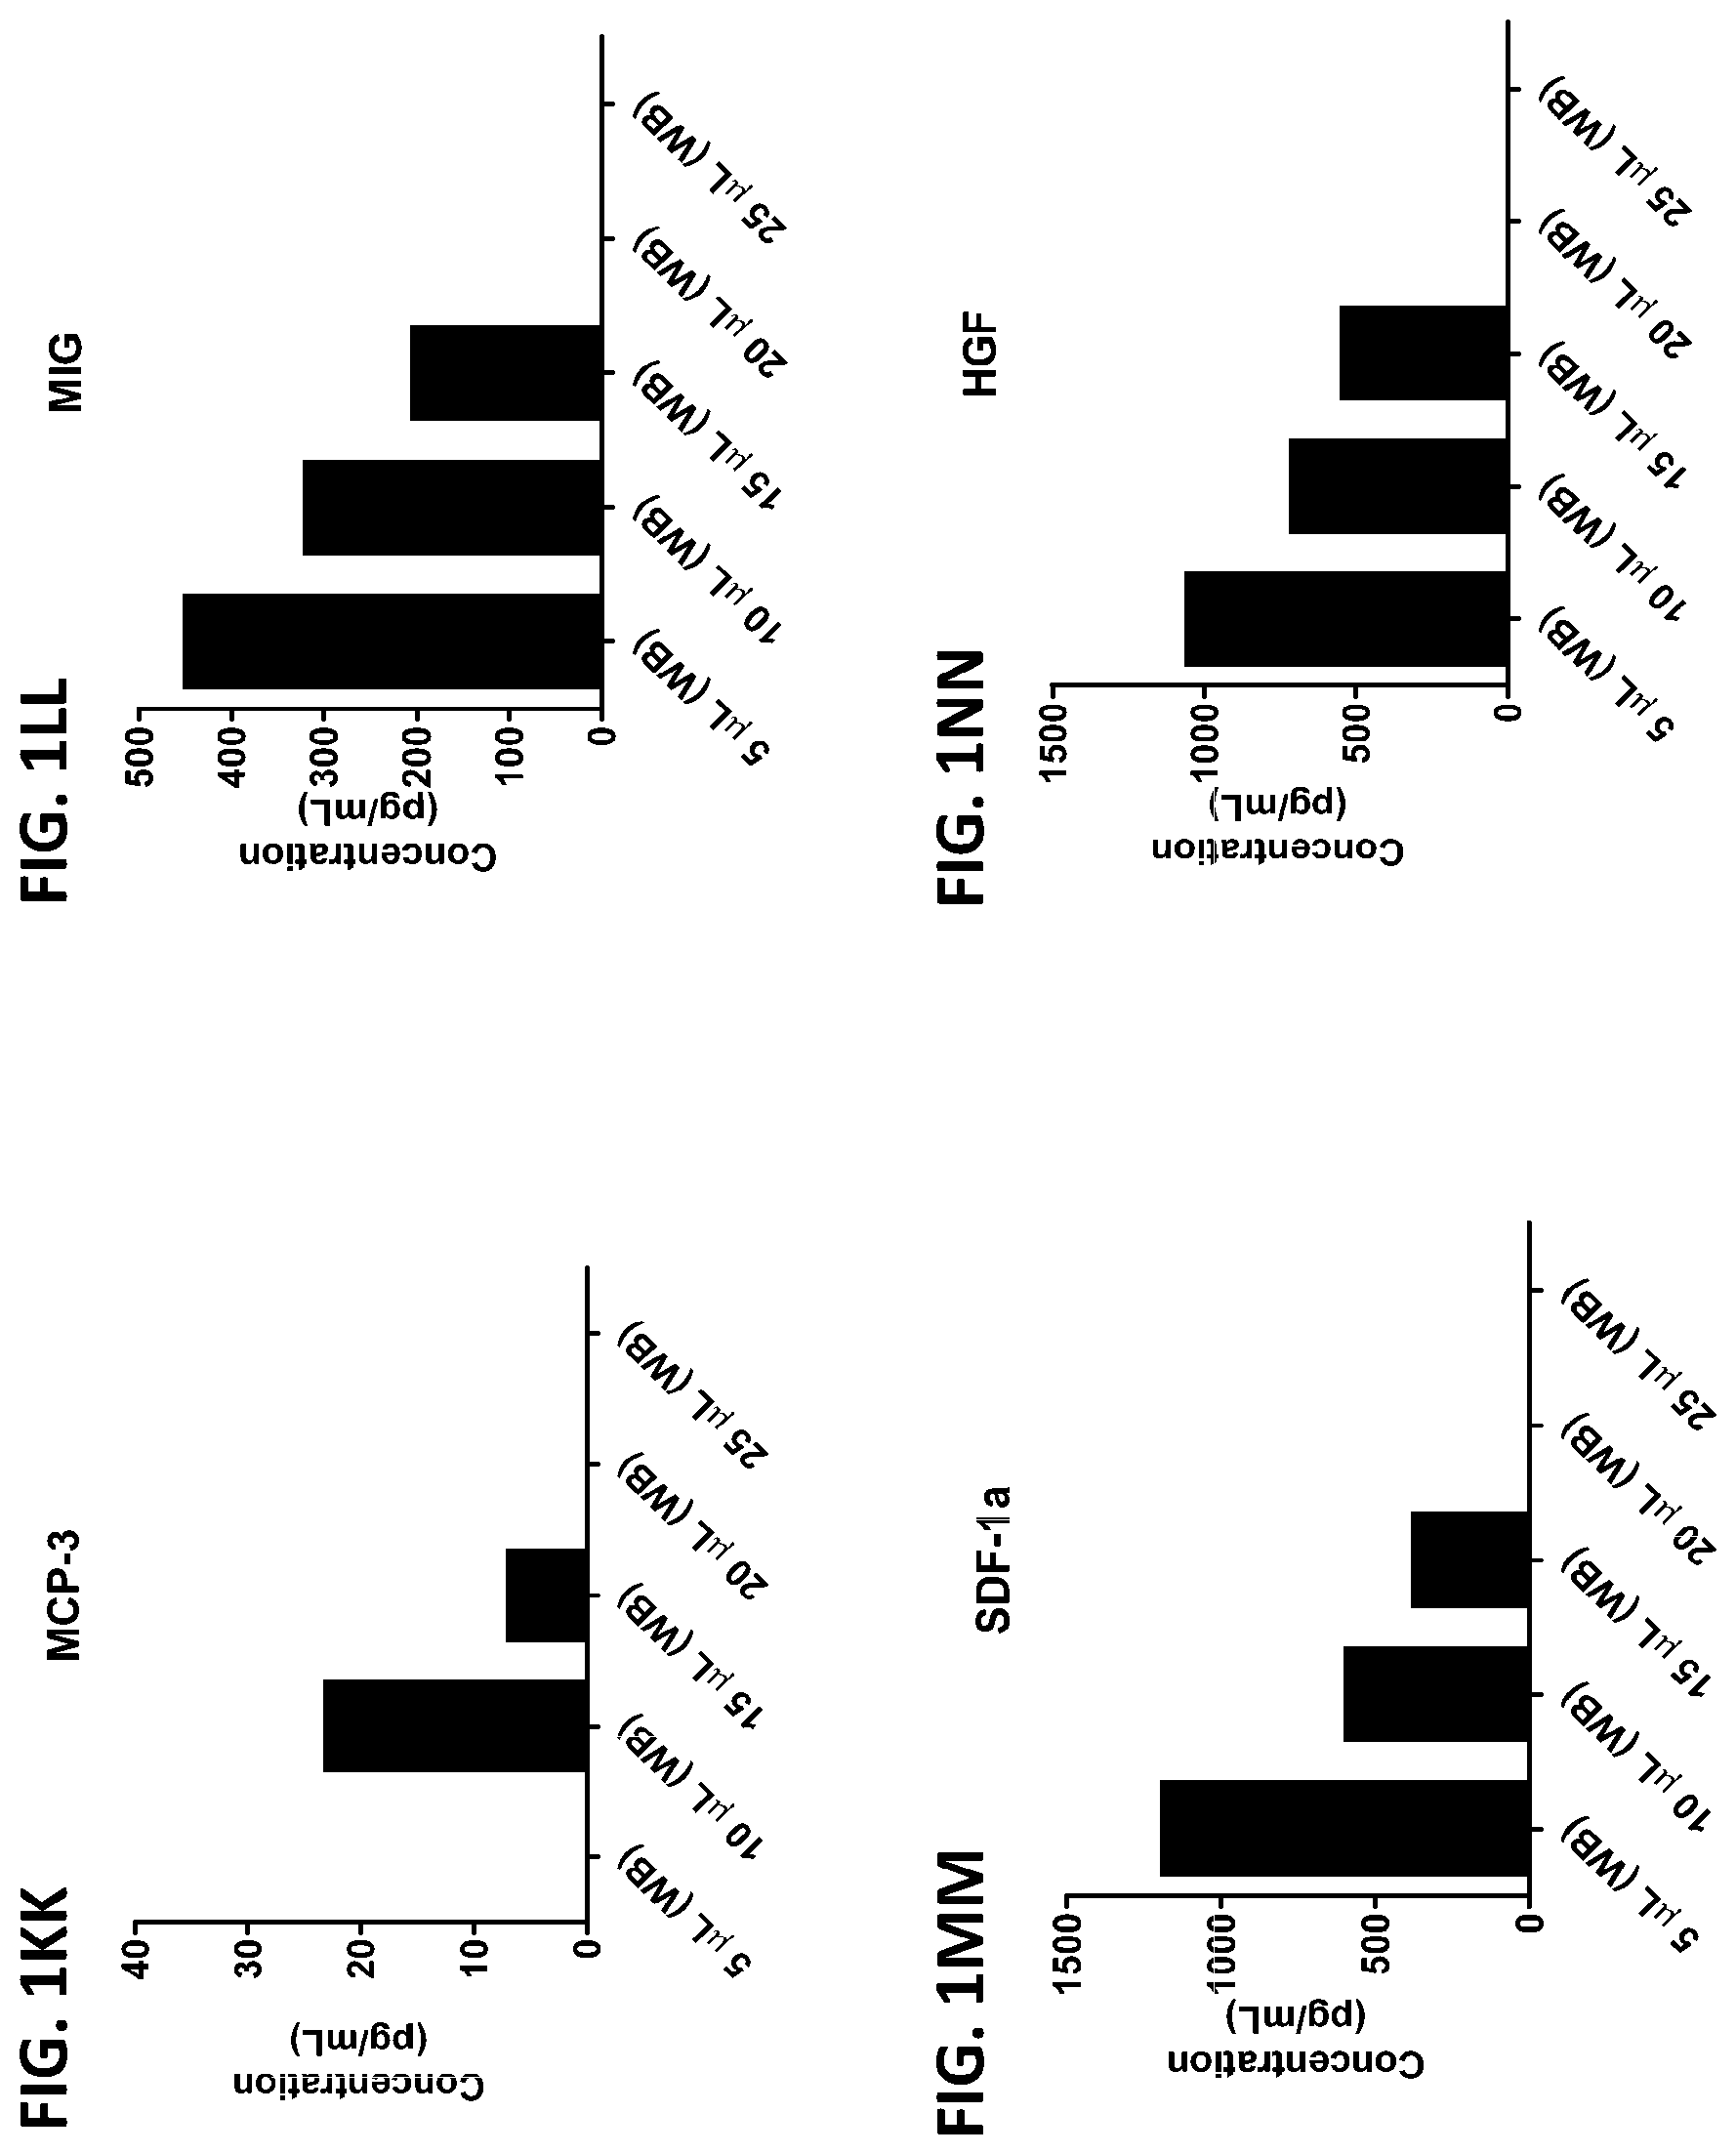
[0037] FIG. 1A-1TT is a series of graphs showing the levels of various proteins in small volumes of whole blood.
[0038] FIG. 2A-2AA is a series of graphs showing the levels of various proteins in red blood cells isolated from whole blood samples obtained from healthy subjects by finger prick (FT) or venipuncture (V).
[0039] FIG. 3A-3G is a series of graphs showing the levels of various proteins in red blood cells contacted with lithium chloride.
[0040] FIG. 4A-4VV is a series of graphs showing the difference in the level of various proteins in red blood cells isolated from healthy individuals, healthy pregnant women, pregnant women with preeclampsia, and oncology patients.
[0041] FIG. 5A-5C is a chart indicating the ratio of the levels of various proteins in red blood cells to the levels in plasma isolated from oncology patients.
[0042] FIG. 6A-6RR is a series of graphs showing the levels of various proteins from red blood cells isolated from healthy individuals, healthy pregnant women, pregnant women with preeclampsia, and oncology patients.
[0043] FIG. 7A-7Z is a series of graphs showing the effect of protease inhibitors (PI) on the concentration of proteins released from RBCs (black columns) and the concentration of proteins remaining in the cells after incubation (grey columns).
[0044] FIG. 8A-8ZZ is a series of graphs showing the effect of protease inhibitors (PI) on the concentration of proteins from red blood cells isolated from healthy individuals, healthy pregnant women, pregnant women with preeclampsia, and oncology patients.
[0045] FIG. 9A-9FF is a series of graphs showing the effect of protease inhibitors (PI) on the concentration of proteins from red blood cells isolated from healthy individuals, healthy pregnant women, pregnant women with preeclampsia, and oncology patients.
[0046] FIG. 10A-10D is a series of graphs showing the effect of protease inhibitors (PI) on the cumulative data of cytokines released from red blood cells from healthy individuals, healthy pregnant women, pregnant women with preeclampsia, and oncology patients.
[0047] FIG. 11A-11D is a series of graphs showing the difference in the cumulative data of cytokines released from red blood cells from healthy individuals, healthy pregnant women, pregnant women with preeclampsia, and oncology patients in the presence or absence of protease inhibitors (PI).
[0048] FIG. 12A-12VV is a series of graphs showing the effect of individual protease inhibitors on cytokines released from red blood cells from healthy individuals.
[0049] FIG. 13A-13VV is a series of graphs showing the effect of protease inhibitor cocktails on cytokines released from red blood cells from healthy individuals.
[0050] FIG. 14A-14AA is a series of graphs showing the effect of protease inhibitor cocktails on cytokines released from red blood cell membranes from healthy individuals.
[0051] FIG. 15A-15AA is a series of graphs showing the effect of individual protease inhibitors and a protease inhibitor cocktail on cytokines released from red blood cells from individuals having colorectal cancer.
[0052] FIG. 16A-16AA is a series of graphs showing the effect of protease inhibitor cocktails on cytokines released from red blood cells from individuals having colorectal cancer.
[0053] FIG. 17A-17AA is a series of graphs showing the effect of individual protease inhibitors on cytokines released from red blood cells from healthy individuals compared to cytokines released from red blood cells from individuals with colorectal cancer.
[0054] FIG. 18A-18AA is a series of graphs showing the effect of protease inhibitor cocktails on the fold change of cytokines released from red blood cells from healthy individuals compared to cytokines released from red blood cells from individuals with colorectal cancer.
[0055] FIG. 19A-19VV is a series of graphs showing the effect of protease inhibitor cocktails on the fold change of cytokines released from red blood cell membranes from healthy individuals compared to cytokines released from red blood cell membranes from individuals with colorectal cancer.
[0056] FIG. 20A-20LL is a series of graphs showing the effect of individual protease inhibitors and protease inhibitor cocktails on other proteins released from red blood cells from healthy individuals.
[0057] FIG. 21A-21LL is a series of graphs showing the effect of protease inhibitor cocktails on cytokines released from red blood cells from healthy individuals compared to cytokines released from red blood cell membranes from healthy individuals.
[0058] FIG. 22A-22VV is a series of graphs showing the effect of protease inhibitor cocktails on cytokines released from red blood cell membranes obtained from whole blood lysates from healthy individuals compared to individuals having lymphoma.
[0059] FIG. 23A-23VV is a series of graphs showing the effect of protease inhibitor cocktails on cytokines released from red blood cell membranes obtained isolated red blood cells from healthy individuals compared to individuals having lymphoma.
[0060] FIG. 24A-24VV is a series of graphs showing the effect of protease inhibitor cocktails on cytokines released from red blood cell membranes from healthy individuals compared to individuals having osteoarthritis.
[0061] FIG. 25A-25VV is a series of graphs showing the effect of protease inhibitor cocktails on cytokines released from red blood cell membranes from healthy individuals compared to individuals having pre-eclampsia.
[0062] FIG. 26A-26VV is a series of graphs showing the effect of protease inhibitor cocktails on cytokines released from red blood cell membranes from healthy individuals compared to individuals having pre-eclampsia with intrauterine growth restriction.
[0063] FIG. 27A-27VV is a series of graphs showing the effect of protease inhibitor cocktails on cytokines released from red blood cell membranes from healthy individuals compared to individuals having ulcerative colitis.
[0064] FIG. 28A-28VV is a series of graphs showing the effect of protease inhibitor cocktails on cytokines released from red blood cell membranes from healthy individuals compared to individuals having duodenal ulcer.
[0065] FIG. 29A-29LL is a series of graphs showing the effect of protease inhibitor cocktails on other proteins released from red blood cells from healthy individuals compared to individuals having lymphoma.
[0066] FIG. 30A-30NN is a series of graphs showing the effect of protease inhibitor cocktails on other proteins released from red blood cells from healthy individuals compared to individuals having osteoarthritis.
[0067] FIG. 31A-31NN is a series of graphs showing the effect of protease inhibitor cocktails on other proteins released from red blood cells from healthy individuals compared to individuals having ulcerative colitis.
[0068] FIG. 32-45 are a series of graphs showing the effect of individual protease inhibitors on proteins released from red blood cells from healthy individuals with colorectal cancer.
[0069] FIG. 46-59 are a series of graphs showing the effect of protease inhibitor cocktails on the concentration of proteins released from red blood cell membranes from healthy individuals compared to proteins released from red blood cell membranes from individuals with colorectal cancer.
[0070] FIG. 60-73 are a series of graphs showing the effect of protease inhibitor cocktails on the fold change of proteins released from red blood cells from healthy individuals compared to proteins released from red blood cells from individuals with colorectal cancer.
[0071] FIG. 74-87 are a series of graphs showing the effect of protease inhibitor cocktails on the fold change of proteins released from red blood cell membranes from healthy individuals compared to proteins released from red blood cell membranes from healthy individuals with colorectal cancer.
DEFINITIONS
[0072] As used in this application, the singular form "a", "an" and "the" include plural references unless the context clearly dictates otherwise. For example, the term "a cell lysate" includes multiple cell lysates.
[0073] As used herein, the term "comprising" means "including." Variations of the word "comprising", such as "comprise" and "comprises," have correspondingly varied meanings. Thus, for example, a method "comprising" steps `A` and `B` may consist exclusively of steps `A` and `B` or may include one or more additional steps (e.g., steps `A`, `B`, and `C`).
[0074] The subject headings used in the detailed description are included for the ease of reference or the reader and should not be used to limit the subject matter found throughout the disclosure or the claims. The subject headings should not be used in construing the scope of the claims or the claim limitations.
[0075] As used herein, the term "subject" includes animals of economic, social or research importance including bovine, equine, ovine, primate, avian and rodent species. Hence, a "subject" may be a mammal such as, for example, a human or a non-human mammal.
[0076] As used herein, the terms "antibody" and "antibodies" include IgG (including IgG1, IgG2, IgG3, and IgG4), IgA (including IgA1 and IgA2), IgD, IgE, or IgM, and IgY, whole antibodies, including single-chain whole antibodies, and antigen-binding fragments thereof. Antigen-binding antibody fragments include, but are not limited to, Fab, Fab' and F(ab')2, Fd, single-chain Fvs (scFv), single-chain antibodies, disulfide-linked Fvs (sdFv) and fragments comprising either a VL or VH domain. The antibodies may be from animal origin. Antigen-binding antibody fragments, including single-chain antibodies, may comprise the variable region(s) alone or in combination with the entire or partial of the following: hinge region, CH1, CH2, and CH3 domains. Also included are combinations of variable region(s) and hinge region, CH1, CH2, and CH3 domains. Antibodies may be monoclonal, polyclonal, chimeric, multispecific, humanized, and human monoclonal and polyclonal antibodies which specifically bind the biological molecule.
[0077] As used herein, the term "protein" refers to a polymer made up of amino acids linked together by peptide bonds.
[0078] As used herein, the term "protease", "peptidase", or "proteinase" refers to an enzyme that breaks, cleaves, or proteolyzes the peptide bond(s) of a protein by hydrolysis. Proteases may include those that are specific to and/or specifically cleave a particular protein substrate (e.g., a particular protein), are specific to a type of protein substrate (e.g., a serine protease, cysteine protease, metalloprotease, or aspartic protease), or specific to more than one type of protein substrate (e.g., a cysteine and serine protease). Proteases may also include those that are non-specific or non-specifically cleave protein substrates (e.g., pepsin, proteinase K, elastase, exoproteases, endoproteases, and the like).
[0079] As used herein, the term "protease inhibitor" refers to a substance (e.g., protein or chemical substance) that blocks or reduces the catalytic (e.g., proteolytic) activity of a protease enzyme. A protease inhibitor may block the ability of a protease to cleave the peptide bond of a given protein, typically by blocking the active site of the protease and preventing its access to a substrate. By way of non-limiting example, protease inhibitors may include non-specific protease inhibitors (e.g., EDTA), specific protease inhibitors (including serine protease inhibitors, cysteine protease inhibitors, metalloprotease inhibitors, aspartic protease inhibitors, and aminopeptidase inhibitors), or dual-, multi- or pan-specific protease inhibitors (including serine and cysteine protease inhibitors).
[0080] As used herein, the term "protein profile" refers to protein(s) and/or protein fragment(s) present in a sample. The sample may or may not comprise cells. If the sample comprises cells, the proteins or protein fragments may exist intracellularly and/or partially or completely at the cell surface. Although not a requirement, the protein profile may also provide quantitative information for protein(s) and/or protein fragment(s) in the sample.
[0081] As used herein, the term "blood sample" refers to a sample comprising at least in part blood and/or blood components. The blood sample may be obtained directly from one or more subjects or from a pre-existing collection of blood from one or more subjects. The blood sample may be obtained from a human subject by a number of methods, for example, venipuncture (e.g., butterfly needle and Vacutainer, straight needle and Vacutainer, and butterfly needle and syringe) of a body part (e.g., arm, leg, ear) or by stick (e.g., finger, heel, or ear prick). The blood sample may be obtained from a non-human mammal subject by a number of methods, for example, venipuncture (e.g., needle and syringe) of a body part (e.g., tail, arm, leg (e.g., thigh), nose, face, ear, thorax, neck/throat, tongue, heart) or by stick (e.g., finger, heel, ear, or tail prick). The blood sample may be obtained from other non-human animals (e.g., chicken or birds) by a number of methods, for example, venipuncture (e.g., needle and syringe) of a body part (e.g., wing, throat, or heart).
[0082] As used herein, the term "blood cells" or "cell present in the blood sample" refers to cells in the sample, including red blood cells and white blood cells, but excludes, or substantially excludes, platelets.
[0083] As used herein, the term "red blood cell-enriched sample", "red blood cell sample", or "RBC-enriched fraction" refers to a sample or component of a sample in which the proportion of RBCs is increased compared to that of the blood sample prior to enriching. The proportion of RBCs may be increased, for example, by removing cell type(s) from the sample that are not RBCs (e.g., removal of leukocytes (leukodepletion) and/or removal of platelets), and/or by removing RBCs from other cell type(s) in the sample to provide a separate sample. The red blood cell-enriched sample may also be comprised of media, plasma/serum, supernatant, and/or cell wash. The RBC-enriched fraction may comprise more than 99.5%, more than 99.6%, more than 99.7%, more than 99.75%, more than 99.8%, more than 99.85%, more than 99.9%, more than 99.5%, approximately 100% red blood cells, or 100% red blood cells of the total blood cell number.
[0084] As used herein, the term "red blood cell component" refers to whole/intact red blood cells and a constituent part or element of red blood cells. For example, in certain embodiments a red blood cell component is red blood cells. In other embodiments, a red blood cell component is red blood cell membranes. The red blood cells may be obtained, for instance, from whole blood or a red blood cell-enriched sample. Red blood cell membranes may be obtained and/or produced from whole blood, a red blood cell-enriched sample, and/or isolated red blood cells.
[0085] As used herein, the term "snap freezing" refers to freezing blood cells (e.g., RBCs) and/or plasma/serum to a temperature below their freezing point generally within a rapid time period (for example, in a period of a few milliseconds, 1-2 seconds, 1-5 seconds, 1-10 seconds, 1-15 seconds, 1-20 seconds, 10-20 seconds, 10-30 seconds, 30-60 seconds, less than one minute, or less than two minutes).
[0086] As used herein, "leukodepletion" refers to reducing the proportion of leukocytes in a blood sample or a blood sample component, for example, by removing leukocytes from the blood sample or blood sample component, or alternatively by removing other blood constituent(s) from the blood sample or blood sample component to provide a separate leukodepleted sample. In some embodiments, leukodepletion includes platelet depletion.
[0087] As used herein, "platelet depletion" refers to reducing the proportion of platelets in a blood sample or a blood sample component, for example, by removing platelets from the blood sample or blood sample component or, alternatively, by isolating other blood constituent(s) from the blood sample or blood sample component to provide a separate platelet depleted sample.
[0088] As used herein, a "cell supernatant" will be understood to mean a cell culture medium in which a population of cells are incubated or cultured at a given temperature or a given range of temperatures for a given time period, for example, more than: 30 minutes, 1 hour, 2 hours, 3 hours, 6 hours, 12 hours, 24 hours, 48 hours, 72 hours, 96 hours, or 120 hours.
[0089] As used herein, a "cell wash" will be understood to mean a liquid that has been used to rinse a population of cells, and differs from a cell supernatant as defined above insofar as the cell wash is generally not used as a medium for cell culture. Accordingly, a fluid used to generate a "cell wash" may be mixed with the cell population for a period of less than: 30 minutes, 20 minutes, 15 minutes, 10 minutes, 5 minutes, 4, minutes, 3 minutes, 2 minutes, 1 minute, or 30 seconds.
[0090] As used herein, a "media" or "medium" refers to a composition having the ability to maintain the viability of cells within a blood sample, cells isolated from a blood sample, or cell components produced from cells isolated from a blood sample. The media may stimulate cell growth and proliferation or maintain cells at a particular and/or existing growth state. Non-limiting examples of media include isotonic salt solution, balanced salt solution, saline, phosphate buffered saline (PBS), hank's balanced salt solution (HBSS), Earles' balanced salt solution (EBSS), Roswell Park Memorial Institute medium (RPMI), minimum essential medium (MEM), Improved Minimum Essential Medium (IMEM), Eagle's minimal essential medium (EMEM), Dulbecco's modified Eagle's medium (DMEM), and Iscove's Modified Dulbecco's Media (IMDM).
[0091] As used herein, the term "small volume" refers to a volume of blood that is one millilitre or less. A small volume may be 1 .mu.L to 100 .mu.L, 100 .mu.L to 200 .mu.L, 200 .mu.L to 300 .mu.L, 300 .mu.L to 400 .mu.L, 400 .mu.L to 500 .mu.L, 500 .mu.L to 600 .mu.L, 600 .mu.L to 700 .mu.L, 700 .mu.L to 800 .mu.L, 800 .mu.L to 900 .mu.L and 900 .mu.L to 1000 .mu.L. In some embodiments, a small volume is 50 .mu.L to 100 .mu.L, 100 .mu.L to 150 .mu.L, 150 .mu.L to 200 .mu.L, 200 .mu.L to 250 .mu.L, 250 .mu.L to 300 .mu.L, 300 .mu.L to 350 .mu.L, 350 .mu.L to 400 .mu.L, 400 .mu.L to 450 .mu.L, 450 .mu.L to 500 .mu.L, 500 .mu.L to 550 .mu.L, 550 .mu.L to 600 .mu.L, 600 .mu.L to 650 .mu.L, 650 .mu.L to 700 .mu.L, 700 .mu.L to 750 .mu.L, 750 .mu.L to 800 .mu.L, 800 .mu.L, to 850 .mu.L, 850 .mu.L to 900 .mu.L, 900 .mu.L to 950 .mu.L, 950 .mu.L to 1000 .mu.L. In some embodiments, a small volume is 1 .mu.L to 10 .mu.L, 10 .mu.L to 20 .mu.L, 20 .mu.L to 30 .mu.L, 30 .mu.L to 40 .mu.L, 40 .mu.L to 50 .mu.L, 50 .mu.L to 60 .mu.L, 60 .mu.L to 70 .mu.L, 70 .mu.L to 80 .mu.L, 80 .mu.L to 90 .mu.L, or 90 .mu.L to 100 .mu.L. In other embodiments, a small volume is 0.1 .mu.L to 0.5 .mu.L, 0.5 .mu.L to 1 .mu.L, 1 .mu.L to 5 .mu.L, 5 .mu.L to 10 .mu.L, 10 .mu.L to 15 .mu.L, 15 .mu.L to 20 .mu.L, 20 .mu.L to 25 .mu.L, 25 .mu.L to 30 .mu.L, 30 .mu.L to 35 .mu.L, 35 .mu.L to 40 .mu.L, 40 .mu.L to 45 .mu.L, 45 .mu.L to 50 .mu.L, 50 .mu.L to 55 .mu.L, 55 .mu.L to 60 .mu.L, 60 .mu.L to 65 .mu.L, 65 .mu.L to 70 .mu.L, 70 .mu.L to 75 .mu.L, 75 .mu.L to 80 .mu.L, 80 .mu.L to 85 .mu.L, 85 .mu.L to 90 .mu.L, 90 .mu.L to 95 .mu.L, or 95 .mu.L to 100 .mu.L. In some embodiments, a small volume is 5 .mu.L to 10 .mu.L, 5 .mu.L to 15 .mu.L, 5 .mu.L to 20 .mu.L, 5 .mu.L to 25 .mu.L, 5 .mu.L to 30 .mu.L, 5 .mu.L to 35 .mu.L, 5 .mu.L to 40 .mu.L, 5 .mu.L, to 45 .mu.L, 5 .mu.L to 50 .mu.L, 5 .mu.L to 55 .mu.L, 5 .mu.L to 60 .mu.L, 5 .mu.L to 65 .mu.L, 5 .mu.L to 70 .mu.L, 5 .mu.L to 75 .mu.L, 5 .mu.L to 80 .mu.L, 5 .mu.L to 85 .mu.L, 5 .mu.L to 90 .mu.L, 5 .mu.L to 95 .mu.L, or 5 .mu.L to 100 .mu.L. In other embodiments, a small volume is 0.1 .mu.L, 0.5 .mu.L, 1 .mu.L, 2 .mu.L, 3 .mu.L, 4 .mu.L, 5 .mu.L, 6 .mu.L, 7 .mu.L, 8 .mu.L, 9 .mu.L, 10 .mu.L, 11 .mu.L, 12 .mu.L, 13 .mu.L, 14 .mu.L, 15 .mu.L, 16 .mu.L, 17 .mu.L, 18 .mu.L, 19 .mu.L, 20 .mu.L, 21 .mu.L, 22 .mu.L, 23 .mu.L, 24 .mu.L, 25 .mu.L, 26 .mu.L, 27 .mu.L, 28 .mu.L, 29 .mu.L, 30 .mu.L, 31 .mu.L, 32 .mu.L, 33 .mu.L, 34 .mu.L, 35 .mu.L, 36 .mu.L, 37 .mu.L, 38 .mu.L, 39 .mu.L, 40 .mu.L, 41 .mu.L, 42 .mu.L, 43 .mu.L, 44 .mu.L, 45 .mu.L, 46 .mu.L, 47 .mu.L, 48 .mu.L, 49 .mu.L, or 50 .mu.L.
[0092] As used herein, the term "detectable level" or "level of detection" refers to the ability of a composition or agent to indicate and/or signal the presence of a desired molecule, such as a protein, in a sample (e.g., a blood sample). In a red blood cell-enriched sample, for example, the detectable level of a protein may increase due to an increase in the protein available for detection. This increase may be due to one or more reasons, for example, through a disruption of protein-molecule interactions (e.g., protein-protein, protein-membrane, protein-nucleic acid) that prevent and/or decrease the detection of the protein.
[0093] As used herein, the term a "change in level" or "change in the level" of a protein(s) refers to an increase or decrease in the detectable level of the protein(s) that one of ordinary skill in the art would not consider to be the same, substantially the same, similar, or substantially similar protein level. Thus, the skilled artisan would recognize the increase or decrease in the detectable level of the protein as statistically significant by e.g., observation (e.g., chromatography), results of a statistical test (e.g., a Student T's test, an ANOVA test, a mixed-effects model, a Mann-Whitney test, a Wilcoxon rank sum, or a Spermans rank correlation) or a calculation of a relevant fold change (e.g., a statistically significant fold change (e.g., more than 0-fold change, more than 0.5-fold change, more than 1-fold change, or more than a 1.5-fold change)) in the protein(s) level measured.
[0094] As used herein, the term "no change" or "no difference" in the level of a protein(s) refers to either no increase or decrease in the protein(s) level (e.g., the protein level is the same) or a small enough increase or decrease in the protein(s) level that one of ordinary skill in the art would consider the protein level to be the same or substantially similar. Thus, the skilled artisan would recognize that the increase or decrease in the detectable level of the protein(s) as not statistically significant by e.g., observation (e.g., chromatography), results of a statistical test (e.g., a Student T's test, an ANOVA test, a mixed-effects model, a Mann-Whitney test, a Wilcoxon rank sum, or a Spermans rank correlation) or a calculation of a relevant fold change (e.g., a statistically significant fold change (e.g., less than 0.5-fold change, less than 1.0-fold change, or less than a 1.5-fold change)) in the protein levels measured.
[0095] As used herein, a "different change in level" or "difference between the change in level" refers to the change in the level of one or more proteins in one sample or subject that is not the same, not substantially the same, not similar, or not substantially similar to the change in the level of the one or more proteins in another sample or subject (e.g., a subject having a disease or disorder compared to a subject not having the disease or disorder). For example, a difference in a change in level of one or more proteins may include: an increase in protein levels in one subject compared to a decrease in the same protein levels in another subject; a larger or smaller magnitude of change in level of one or more proteins in one subject compared to that in another subject (e.g., an increase or decrease in protein levels in one subject that is larger or smaller than the increase or decrease in the protein levels in a different subject); or a change in level in one subject compared to no change in level in another subject (e.g., an increase or decrease in protein levels in one subject compared to no significant increase or decrease in the protein levels in the other subject). The difference in the change in level may be determined by data visualization (e.g., charts or graphs) or analysis methods, including statistical analyses (e.g., a Student T's test, an ANOVA test, a mixed-effects model, a Mann-Whitney test, a Wilcoxon rank sum, or a Spermans rank correlation).
[0096] As used herein, protein "release" from RBCs refers to proteins that have moved by active or inactive mechanisms from (i) the intracellular region or interior of a RBC to the surface and/or extracellular or exterior region of the RBC (e.g., plasma, serum, and/or medium) or (ii) moved from the extracellular or exterior region of the RBC (from, e.g., the plasma, serum and/or medium) to the surface and/or extracellular region or the exterior of the RBC. In some embodiments, the proteins may be bound to the surface of the RBCs by cell surface-protein binding interactions (e.g., receptors, covalent attachment, noncovalent attachment and/or adhesion). In other embodiments, the surface bound proteins may be released back into the extracellular or exterior region of the RBC (e.g., into the plasma, serum, and/or medium).
[0097] As used herein, "treatment" refers to one or more therapies, protocols, methods and/or agents that may be used in preventing, managing, alleviating, or ameliorating a disease, disorder, or condition, including in the prevention, alleviation, or amelioration of one or more symptoms of a disease, disorder, or condition and/or a symptom related thereto. In certain embodiments, the terms "treatment" and "treatments" refer to a biological therapy, supportive therapy, and/or other therapies useful in the prevention, management, alleviation, and/or amelioration of a disease, disorder, or condition.
[0098] As used herein, the phrase "substantially similar" or "substantially the same" denotes a sufficiently high degree of similarity between two numeric values such that one of skill in the art would consider the difference between the two values (e.g., protein concentration/level or change in level (e.g., fold change)) to be of little or no biological and/or statistical significance within the context of the biological characteristic measured by the values. For example, the difference between the two values may be less than about 50%, less than about 40%, less than about 30%, less than about 20%, less than about 10%, or less than about 5%.
[0099] As used herein, the term "kit" refers to a delivery system having the components useful for carrying out one or more of the embodiments described herein. By way of non-limiting example, the kits may comprise ways of: collecting blood, inhibiting proteases, increasing protein detection, preventing coagulation, stabilizing blood, obtaining red blood cell components, enrichment of RBC, removal/separation of non-RBC blood components, snap-freezing blood or component(s) thereof, lysing cells, washing cells, culturing cells, detecting specific target protein(s) intracellularly and/or extracellularly, or combinations thereof. In some embodiments, kits may comprise one or more of the following: device(s) for obtaining a blood sample from a subject (e.g., a syringe, needle, butterfly needle, tube, needle holder, blood collection set, transfer device, vacutainer, hemaPEN.TM.); device(s) for obtaining a dried blood sample from a subject (e.g., filter paper, cards, HemaSpot.TM.); device(s) for obtaining a red blood cell fraction, a leukocyte fraction, and/or a platelet fraction from a liquid blood sample (e.g., antibody coated magnetic beads); protease inhibitors; cationic salts; anticoagulants; protease inhibitors; protein denaturation agents; and the like. Such delivery systems may include systems that allow for the storage, transport, or delivery of reaction reagents (for example labels, reference samples, supporting material, etc. in the appropriate containers) and/or supporting materials (for example, buffers, written instructions for performing an assay etc.) from one location to another. For example, kits may include one or more enclosures, such as boxes, containing the relevant reaction reagents and/or supporting materials. The term "kit" includes both fragmented and combined kits.
[0100] As used herein, the term "fragmented kit" refers to a delivery system comprising two or more separate containers that contain a subportion of the total kit components. The containers may be delivered to the intended recipient together or separately. A delivery system comprising two or more separate containers that contain a subportion of the total kit components are included within the meaning of the term "fragmented kit".
[0101] As used herein, a "combined kit" refers to a delivery system containing the components of a reaction assay in a single container (e.g., in a single box housing each of the desired components).
[0102] Any description of prior art documents herein, or statements herein derived from or based on those documents, is not an admission that the documents or derived statements are part of the common general knowledge of the relevant art.
DETAILED DESCRIPTION
[0103] Currently used techniques for profiling protein levels in blood typically restrict the analysis to serum/plasma and/or PBMCs. Because RBCs are believed to interfere with blood processing and/or blood protein measurement, they are routinely removed and discarded during blood processing prior to generating protein profiles.
[0104] The present inventors have made the unexpected finding that RBCs provide a significant source of protein markers and that contacting a red blood cell-enriched sample with protease inhibitors modulates the detectable levels of protein markers in subjects having a disease or disorder, while leaving unchanged or differentially modulating protein levels in red blood cell samples from those not having the disease or disorder. Accordingly, a deficiency in current technologies has been identified in that RBCs were not previously recognised to provide a source of various protein markers described herein, and the exclusion of RBCs from protein profiling thus provides an inadequate and/or inaccurate assessment. (See also, Australian Application No. AU2015904075 entitled "Blood Preparation and Profiling", filed on Oct. 7, 2015 and International Application No. PCT/AU2016/000341, entitled "Blood Preparation and Profiling", filed on Oct. 6, 2016). Moreover, current technologies do not lend themselves to simple and/or rapid delineation between a subject having a disease or disorder and a subject not having a disease or disorder based on a non-specific and/or specific change in the levels of red blood cell protein markers in response to the presence of protease inhibitors in a blood sample. The present disclosure remedies blood protein profiling deficiencies, providing a new and useful laboratory technique for generating protein profiles from blood that incorporate analyses of RBCs contacted with protease inhibitors to modulate protein levels/detection in subjects having a disease or disorder. The new and useful laboratory techniques provided herein have diagnostic, prognostic, and/or therapeutic applications.
[0105] The following description conveys exemplary embodiments of the present disclosure in sufficient detail to enable those of ordinary skill in the art to practice it. Features or limitations of the various embodiments described do not necessarily limit other embodiments of the present disclosure or the present disclosure as a whole. Hence, the following detailed description does not limit the scope of the present disclosure, which is defined by the claims.
Protein Profiling in Red Blood Cells (RBCs)
[0106] The present disclosure provides methods for generating a protein profile from a blood sample, red blood cell-enriched sample, red blood cell component, and/or blood sample component comprising RBCs using protease inhibitors. In some embodiments, the number of RBCs constitute more than: 0.5%, 1%, 5%, 10%, 20%, 30%, 40%, 50%, 60%, 70%, 80%, 90%, 95%, 97.5%, 98%, 99%, 99.5%, 99.75%, 99.9%, or 99.95%, of total number of blood cells present in the blood sample or the blood sample component.
Blood Samples
[0107] The blood sample obtained from a subject in the provided methods is as defined herein (see, e.g., "blood sample") and may be obtained from a subject or an existing collection of blood (e.g., blood previously obtained from one or more subjects and/or stored blood). The blood sample may be obtained from a subject using exemplary means available to those of ordinary skill in the art (see, for example, World Health Organisation, "Requirements for the collection, processing and quality control of blood, blood components and plasma derivatives", World Health Organisation Technical report Series, No. 840, 1994, Annex 2). By way of non-limiting example, the blood sample may be obtained from a subject using venous blood, capillary blood, arterial blood or, combinations thereof.
[0108] In certain embodiments, a small volume blood sample is obtained from a subject or an existing collection of blood. The small volume may be obtained from a subject by various methodologies including, for example, by stick (e.g., finger prick, heel prick, ear prick, or tail prick). In some embodiments, the small volume blood sample is obtained by finger prick, heel prick, or ear prick or dried blood spot (from, e.g., a human). In other embodiments, the small volume blood sample is obtained by tail prick (from, e.g., a mouse or rat). In other embodiments, the small volume blood sample is obtained by finger prick. In other embodiments, the small volume blood sample is obtained by heel prick (from, e.g., an infant). In still other embodiments, the small volume blood sample is obtained by ear prick. In further embodiments, the small volume blood sample is obtained by tail prick.
[0109] In some embodiments, the small volume is as defined herein (see, e.g., "small volume"). In other embodiments, the small volume is 1 .mu.L to 10 .mu.L, 5 .mu.L to 100 .mu.L or 5 .mu.L to 50 .mu.L. In other embodiments, the small volume is 5 .mu.L to 20 .mu.L or 5 .mu.L to 10 .mu.L. In still other embodiments, the small volume is 5 .mu.L. In other embodiments, the small volume is 1 .mu.L.
[0110] Obtaining a small volume blood sample allows for the more frequent sampling of, for example, a subject compared to a larger volume blood sample because taking a small volume blood sample decreases the harm to the subject (e.g., pain, blood loss, slow recovery of blood levels). For instance, using typical current methods, frequent blood sampling from small animals (e.g., rats, mice) is not achievable because a comprehensive blood analysis requires so much blood that the animal must be sacrificed. Similarly, to prevent harm from blood loss, infants may only be safely sampled frequently by stick (e.g., heel prick). In certain embodiments provided herein, a small volume blood sample is obtained. In certain embodiments, a small volume blood sample is obtained with a frequency of one or more times per day, two or more times per day, three or more times per day, four or more times per day, or five or more times per day. In other embodiments, a small volume blood sample is obtained one or more times per week, two or more times per week, three or more times per week, four or more times per week, five or more times per week, six or more times per week, or seven or more times per week. In other embodiments, a small volume blood sample is obtained daily. In still other embodiments, a small volume blood sample is obtained once a week, once every two weeks, once every three weeks, or once every four weeks. In certain embodiments, a small volume blood sample is obtained once a month.
Enriched Red Blood Cell Samples or Fractions
[0111] In some embodiments, the methods involve producing or generating a protein profile from a red blood cell-enriched sample, a red blood cell-enriched fraction, or red blood cells and determining the levels of one or more proteins in the red blood cell-enriched sample, red blood cell-enriched fraction, or red blood cells. The red blood cell-enriched sample and red blood cell-enriched fraction may be produced from a blood sample by, for example, leukodepletion and/or platelet depletion. Additionally or alternatively, RBCs may be removed from a sample to produce the red blood cell-enriched sample or red blood cell-enriched fraction.
[0112] Various methodologies for leukodepletion and platelet depletion are available (see, for example Wenz, B., "Methods for leukodepletion" in "Clinical Benefits of Leukodepleted Blood Products", pp 5-16, 1995, Springer Berlin Heidelberg; Novotny V., and Brand, A., "Leukocyte-Poor Blood and Platelet Transfusions" in "Modern Transfusion Medicine", pp 117-121, 1995, CRC Press, Inc.; White and Jennings, "Platelet Protocols: Research and Clinical Laboratory Procedures", 1999, Academic Press). Non-limiting examples of suitable techniques for leukodepletion include flow cytometry, dextran sedimentation, ficol/percol density gradient centrifugation, and the like.
[0113] The present disclosure also provides methods for increasing the sensitivity of the detection or measurement of one or more proteins in a blood sample by producing a red blood cell-enriched sample and detecting the presence or measuring the level of one or more proteins in the red blood cell-enriched sample. In certain embodiments, the ratio of blood to dextran is between 1:1 and 2:1, 1:1 and 3:1, 1:1 and 4:1, 1:1 and 5:1, 1:1 and 6:1, 1:1 and 7:1, 1:1 and 8:1, 1:1 and 9:1, or 1:1 and 10:1. In other embodiments, the ratio of blood to dextran is 1:1, 2:1, 3:1, 4:1, 5:1, 6:1, 7:1, 8:1, 9:1, or 10:1. In still other embodiments, the ratio of blood to dextran is 2:1. In further embodiments, the ratio of blood to dextran is 4:1.
[0114] By way of non-limiting example, the red blood cell-enriched sample or red blood cell-enriched fraction may be generated by leukodepletion of more than 90%, 92.5%, 95%, 97.5%, 99%, 99.5%, 99.75%, or 99.9% of the number of leukocytes that were present in the blood sample. `Leukodepletion` in this context may be achieved by depleting leukocytes from the blood sample directly, and/or by removing RBCs from the sample to provide a separate leukodepleted (RBC-enriched) fraction. In some embodiments, leukodepletion includes platelet depletion.
[0115] Additionally or alternatively, the red blood cell-enriched sample or red blood cell-enriched fraction may be generated by platelet depletion of more than 90%, 92.5%, 95%, 97.5%, 99%, 99.5%, 99.75%, or 99.9% of the number of platelets that were present in the blood sample. `Platelet depletion` in this context may be achieved by depleting platelets from the blood sample directly, and/or by removing RBCs from the sample to provide a separate platelet-depleted (RBC-enriched) fraction.
[0116] In some embodiments the red blood cell-enriched sample or red blood cell-enriched fraction may comprise more than 99.75%, more than 99.8%, more than 99.9%, more than 99.95%, approximately 100%, or 100% red blood cells (as a component of the total number of blood cells present within the RBC-enriched fraction).
[0117] The percentage of RBCs in a given enriched sample or red blood cell-enriched fraction may be assessed using methodologies available to those of ordinary skill in the art including, for example, flow cytometry, fluorescence microscopy, other antibody-based techniques, and the like.
Red Blood Cell Membranes
[0118] In certain embodiments, the methods provided herein involve producing or generating a protein profile from red blood cell membranes and/or red blood cell ghosts. Red blood cell membranes refer to RBCs from which some (e.g., more than: 10%, 20%, 30%, 40%, 50%, 60%, 70%, 80%, 90%, 95%, or 99%) of the cytoplasmic protein has been removed. The cytoplasmic protein may be removed, for example, by lysis, washing, and centrifugation of red blood cells, both isolated and found in whole blood. Red blood cells may be lysed to obtain red blood cell membranes by a number of methods including, for instance, hypotonic hemolysis. (see, for example, Bramley T A, Coleman R, Finean J B. Chemical, enzymological and permeability properties of human erythrocyte ghosts prepared by hypotonic lysis in media of different osmolarities. Biochimica et Biophysica Acta--Biomembranes, 241(3) 1971), freeze-thaw cycles, and the like. Freeze-thaw cycles may be repeated an appropriate number of times (e.g., at least two times, at least three times, at least four times, or at least five times) to achieve the desired level of cytoplasmic material associated with the red blood cell membrane (e.g., 95% free of cytoplamic protein). Because red blood cell membranes may be obtained by centrifugation (e.g., at 16,000 g) of lysed red blood cells, the membranes may be isolated from a sample that comprises red blood cells, even if the red blood cells are a small or minimal component of the sample.
Small Volume Red Blood Cell-Enriched Samples
[0119] The present disclosure also provides methods of producing a protein profile from a small volume of a red blood cell-enriched blood sample. A small volume may be obtained from a red blood cell-enriched blood sample by methods available in the art and as deemed appropriate by one of ordinary skill in the art for subsequent methods of protein detection or protein measurement in the red blood cell-enriched sample (see, e.g., protein profiling below). A small volume is a volume as defined herein (see, e.g., "small volume"). By way of non-limiting example, in other embodiments, the small volume may be 0.1 .mu.L to 0.5 .mu.L, 0.5 .mu.L to 1 .mu.L, 1 .mu.L to 5 .mu.L, 5 .mu.L to 10 .mu.L, 5 .mu.L to 20 .mu.L, 5 .mu.L to 30 .mu.L, 5 .mu.L to 40 .mu.L, 5 .mu.L to 50 .mu.L, 5 .mu.L to 60 .mu.L, 5 .mu.L to 70 .mu.L, 5 .mu.L to 80 .mu.L, 5 .mu.L to 90 .mu.L, or 5 .mu.L to 100 .mu.L. In some embodiments, the small volume is 5 .mu.L to 100 .mu.L. In other embodiments, the small volume is 5 .mu.L to 50 .mu.L or 5 .mu.L to 20 .mu.L. In still other embodiments, the small volume is 5 .mu.L to 10 .mu.L. In certain embodiments, the small volume is 5 .mu.L.
Whole Blood Comprising RBCs
[0120] Other embodiments involve the analysis of a whole blood sample comprising RBCs. In these embodiments, the whole blood sample is analysed for a protein profile without, or substantially without, altering the relative proportions of blood cell types within the sample and without separating plasma/serum.
[0121] The whole blood sample may be obtained using exemplary means available to those of ordinary skill in the art (see, for example, World Health Organisation, "Requirements for the collection, processing and quality control of blood, blood components and plasma derivatives", World Health Organisation Technical report Series, No. 840, 1994, Annex 2). Methodology is also presented in the Examples of the present specification.
[0122] By way of non-limiting example, the whole blood sample may be obtained using venous blood, capillary blood, arterial blood, or combinations thereof.
[0123] In some embodiments, methods of the present disclosure involving the analysis of whole blood may be carried out using dried blood spot (DBS) sampling. Non-limiting advantages of DBS sampling include one or more of the following: sample stability, minimal volume requirements (e.g., 30-100 .mu.L per spot), ease of sample collection (e.g., finger, toe or heel prick) and transport. A DBS sample obtained for use in the present disclosure may, for example, maintain stability for months to years under refrigeration and/or at ambient temperature.
[0124] Suitable methodologies for DBS are well available to those of ordinary skill in the art (see for example, McDade, et al; Demography 2007, 44: 899-925; De Jesus et al. Clin Chem 2009, 55:1; 158-164; Sharma et al. Drug Testing and Analysis, 2014, 6(5), 399-414).
[0125] Briefly, and again by way of non-limiting example only, whole blood may be obtained from a subject of interest (e.g., finger, heel or toe prick) using an appropriate instrument (e.g., a sterile surgical blade or disposable lancet) and spotted onto, for example, a membrane or paper (e.g., filter paper cards). For quantitative analyses, a measured volume of blood may be applied. The blood may then be allowed to dry for example, at room temperature and/or under nitrogen flow and/or controlled humidity. Drying time will generally depend at least in part on sample volume. DBS membranes or paper may be stored at ambient temperature or refrigerated, and may be appropriately packaged to avoid humidity. The DBS may then be extracted for analysis at a suitable time (e.g., using an extraction solvent or similar).
Analyses of Additional Blood Compartments
[0126] In addition to protein profiling of enriched RBCs sample, RBC fractions or whole blood samples comprising RBCs, the methods of the present disclosure may further comprise conducting protein profile analyses of one or more additional blood compartment(s).
[0127] For example, protein profile analyses may be conducted on one or more additional blood compartment(s) selected from plasma, serum, platelets, leukocytes, an enriched platelet fraction, an enriched leukocyte fraction, platelet-rich plasma, leukocyte-rich plasma, a mixture of platelets and leukocytes, specific leukocyte(s) (e.g., one or more of T lymphocytes (e.g., CD4+T lymphocytes, CD8+T lymphocytes), B lymphocytes, NK cells, monocytes, neutrophils, eosinophils, basophils, and the like), and combinations thereof.
[0128] The additional blood compartment(s) for analysis may be prepared using available techniques. For example, cellular components may be isolated by flow cytometry, magnetic bead separation, centrifugation, and the like. Plasma/serum separation techniques are also available in the art. Many standard texts and protocols are available and widely used for these purposes, and by way of non-limiting example reference is made to: World Health Organisation, "Requirements for the collection, processing and quality control of blood, blood components and plasma derivatives", World Health Organisation Technical report Series, No. 840, 1994, Annex 2; Wenz, B., "Methods for leukodepletion" in "Clinical Benefits of Leukodepleted Blood Products", pp 5-16, 1995, Springer Berlin Heidelberg; Novotny V., and Brand, A. "Leukocyte-Poor Blood and Platelet Transfusions" in "Modern Transfusion Medicine", pp 117-121, 1995, CRC Press, Inc.; White and Jennings, "Platelet Protocols: Research and Clinical Laboratory Procedures", 1999, Academic Press).
Lysate Analyses
[0129] In some embodiments, the methods of the present disclosure comprise generating a protein profile from a cellular lysate.
[0130] By way of non-limiting example only, an enriched RBC sample or RBC fraction prepared in accordance with the one or more of the methods of the present disclosure may be treated to provide a lysate in which the levels of one or more proteins are determined. The lysate may also be produced from one or more other blood compartment(s) selected from whole blood, plasma, serum, platelets, leukocytes, an enriched platelet fraction, an enriched leukocyte fraction, platelet-rich plasma, leukocyte-rich plasma, a mixture of platelets and leukocytes, specific leukocyte(s) (e.g., one or more of T lymphocytes (e.g., CD4+T lymphocytes, CD8+T lymphocytes), B lymphocytes, NK cells, monocytes, neutrophils, eosinophils, basophils, and the like), and combinations thereof.
[0131] Additionally or alternatively, other cellular components of blood that are not RBCs, or that contain minimal amounts of RBCs (e.g., less than: 10%, 5%, 4%, 3%, 2%, 1%, or 0.5% RBCs) may be treated to provide a lysate in which the levels of one or more proteins are determined.
[0132] Cell lysates for use in the methods of the disclosure may be produced using suitable means including, for example, liquid homogenization, mechanical disruption, freeze/thaw cycles, high frequency sound waves, manual grinding, chemical permeabilisation, enzymatic permeabilisation, permeabilisation using streptolysin, and the like.
[0133] In some embodiments, cell lysates are prepared by one, two, three, four, five, or more than five cycles of freeze/thawing. This technique offers the potential benefit of providing a means of stabilising a blood sample or component(s) thereof at the point of freezing and allowing storage prior to lysing and analysis of protein content. Typically, the snap freezing may be performed at a temperature of at or below: -10.degree. C., -20.degree. C., -30.degree. C., -40.degree. C., -50.degree. C., -60.degree. C., -70.degree. C., -75.degree. C., -80.degree. C., -90.degree. C., -100.degree. C., -120.degree. C., -140.degree. C., -160.degree. C., -180.degree. C., -190.degree. C., -195.degree. C., or -196.degree. C. In still other embodiments, snap freezing is performed at a temperature of below: -5.degree. C., -10.degree. C., -20.degree. C., -30.degree. C., -40.degree. C., -50.degree. C., -60.degree. C., -70.degree. C., -75.degree. C., -80.degree. C., -90, -100.degree. C., -120.degree. C., -104.degree. C., -160.degree. C., -180.degree. C., -190.degree. C., -200.degree. C. In still other embodiments, snap-freezing is performed at a temperature below: -190.degree. C., -191.degree. C., -192.degree. C., -193.degree. C., -194.degree. C., -195.degree. C., -196.degree. C., -197.degree. C., -198.degree. C., or -199.degree. C. A whole blood sample, a RBC-enriched sample, a RBC-enriched fraction, and/or other different cellular components may be snap frozen to stabilise the cells. This may reduce or prevent, for example, the sequestration and/or release of proteins from RBCs and/or other cell types present during processing.
Analyses of Cell Washes and Supernatants
[0134] In some embodiments, the methods of the present disclosure comprise generating a protein profile from a cell wash and/or a cell supernatant.
[0135] The cell wash and/or cell supernatant may be produced from a blood sample or blood sample component comprising RBCs. In some embodiments, the number of RBCs constitute more than: 0.5%, 1%, 5%, 10%, 20%, 30%, 40%, 50%, 60%, 70%, 80%, 90%, 95%, 97.5%, 98%, 99%, 99.5%, 99.75%, 99.9%, or 99.95%, of total number of blood cells present in the blood sample or the blood sample component.
[0136] In some embodiments, the cell wash may be produced by washing RBC-enriched cells and/or by separately washing one or more cellular blood compartment(s) selected from whole blood, platelets, leukocytes, an enriched platelet fraction, an enriched leukocyte fraction, platelet-rich plasma, leukocyte-rich plasma, mixtures of platelets and leukocytes, specific leukocyte(s) (e.g., one or more of T lymphocytes (e.g., CD4+T lymphocytes, CD8+T lymphocytes), B lymphocytes, NK cells, monocytes, neutrophils, eosinophils, basophils, and the like), or combinations thereof.
[0137] In some embodiments, the cell supernatant may be produced by incubating or culturing RBC-enriched cells and/or by separately incubating or culturing one or more cellular blood compartment(s) selected from platelets, leukocytes, an enriched platelet fraction, an enriched leukocyte fraction, platelet-rich plasma, leukocyte-rich plasma, mixtures of platelets and leukocytes, specific leukocyte(s) (e.g., one or more of T lymphocytes (e.g., CD4+T lymphocytes, CD8+T lymphocytes), B lymphocytes, NK cells, monocytes, neutrophils, eosinophils, basophils, and the like), or combinations thereof. Cell supernatant may then be separated from the cells and analysed for proteins released (intracellularly and/or from the cell surface) by the incubated or cultured cells. Optionally, cells remaining after removal of the supernatant may be washed and used to generate a protein profile. The cell wash may be combined with the cell supernatant to generate the protein profile, or alternatively individual protein profiles may be generated from the cell wash and the cell supernatant separately. This will allow comparison of the two individual profiles if desired.
[0138] A series of cell supernatants may be produced by culturing cells as above for a time period and collecting a series of supernatants at different time points. The supernatant may be analysed for protein content to provide a protein profile analysis over multiple time points. Optionally, the incubation or culture conditions (e.g., content of media, temperature, etc.) may be varied between time points sampling of supernatants. Optionally, cells remaining after removal of the supernatant at one or more time points may be washed and used to generate a protein profile. The cell wash may be combined with the cell supernatant of a given time point (e.g., the same time point) to generate the protein profile. Alternatively, individual protein profiles may be generated from individual cell washes and individual cell supernatants. Alternatively, cell washes from multiple time points may be pooled and analysed to generate the protein profile. Likewise, cell supernatants from multiple time points may be pooled and analysed to generate the protein profile.
[0139] Suitable exemplary protocols and/or media for incubating or culturing the RBC-enriched cells and/or separately incubating or culturing the other cellular blood compartment(s) are available to those of ordinary skill in the art (see, for example, Koller, Palsson, Masters, (Eds) "Human Cell Culture: Vol IV. Primary Hematopoietic cells", 2006, Springer Science and Business Media; Mirty and Hughes (Eds) 2001, "Human Cell Culture Protocols, Third edition", 2011, Humana Press). Methodology is also presented in the Examples of the present specification.
[0140] Cell washes may be performed using suitable media such as, for example, phosphate buffered saline (PBS), an isotonic salt solution, a growth medium, a culture medium, or combinations thereof.
[0141] Non-limiting examples of suitable media for use as cell wash liquid, cell culture media, or cell incubation media in the methods of the present disclosure include isotonic salt solution, balanced salt solution, saline, phosphate buffered saline (PBS), hank's balanced salt solution (HBSS), Earles' balanced salt solution (EBSS), Roswell Park Memorial Institute medium (RPMI), minimum essential medium (MEM), Improved Minimum Essential Medium (IMEM), Eagle's minimal essential medium (EMEM), Dulbecco's modified Eagle's medium (DMEM), and Iscove's Modified Dulbecco's Media (IMDM), or combinations thereof. In some embodiments, the media is PBS or HBSS to maintain the RBCs in a non-growth or proliferation state. In other embodiments, the media is RPMI to stimulate the growth or proliferation of RBCs.
Blood Stabilising Agents and Anticoagulants
[0142] Without limitation to specific mechanistic features, it is hypothesised that RBCs may have a capacity to sequester and release different proteins (e.g., cytokines and chemokines), and the degree of protein release (or alternatively sequestration) by RBCs is thought to be influenced by various factors arising during blood collection and processing.
[0143] In some embodiments a blood sample or a component thereof used in certain embodiments may be mixed with a blood stabilising agent. Agents having a capacity to stabilise RBCs are useful so as to reduce or prevent the sequestration and/or release of proteins from RBCs during processing.
[0144] The blood cell stabilising agent may be mixed with the blood sample at the time of collecting the blood sample from the subject and/or during subsequent processing of the blood sample or component(s) thereof. By way of non-limiting example, the blood stabilising agent may be mixed with the blood sample or a component thereof within 1 second, 2 seconds, 3 seconds, 4 seconds, 5 seconds, 10 seconds, 20 seconds, 30 seconds, 1 minute, 2 minutes, 3 minutes, 4 minutes, 5 minutes, 10 minutes, 15 minutes, 30 minutes, 45 minutes, 1 hour, 2 hours, 3 hours, 4 hours, 5 hours, 7.5 hours or 10 hours of the blood sample being obtained from the subject.
[0145] Non-limiting examples of suitable blood stabilising agents include protease inhibitors, anticoagulants, RNA stabilisers (e.g., RNALater--Thermo Fisher Scientific), protein denaturation agents, or combinations thereof. In certain embodiments, the blood stabilising agent is not a protease inhibitor.
[0146] In exemplary embodiments, the blood stabilising agent is an anticoagulant. The anticoagulant may be mixed with the anticoagulant at the time of collecting the blood sample from the subject (e.g., a vessel or container into which the blood sample is collected may contain the anticoagulant), and/or during subsequent processing of the blood sample or component(s) thereof.
[0147] Non-limiting examples of suitable anticoagulants include heparin, ethylenediaminetetraacetic acid (EDTA), EDTA disodium salt, EDTA tetrasodium salt, EDTA dipotassium salt, EDTA diammonium salt, ethylenebis(oxyethylenenitrilo)tetraacetic acid (EGTA), EDTA trisodium salt, EDTA tripotassium salt, ethylene glycol-O,O-bis(2-aminoethyl)-N,N,N,N-tetraacetic acid, N-(2-hydroxyethyl)ethylenediamine-N,N,N-triacetic acid trisodium salt, citrate, acid-citrate-dextrose, di-ammonium hydrogen citrate, di-ammonium tartrate, warfarin, N-(2-bis(carboxymethyl)aminoethyl)-N-(2-hydroxyethyl)glycin salt dihydrate, citric acid, citric acid monosodium salt, citric acid disodium salt, citric acid trisodium salt, citric acid monopotassium salt, citric acid tripotassium salt, protein C/protein S, nitrilotriacetic acid, potassium sodium tartrate, potassium hydrogen D-tartrate, L-tartaric acid monosodium salt, L-tartaric acid disodium salt, L-tartaric acid dipotassium salt, streptokinase, protamine sulfate, tris(carboxymethyl)amine, anti-thrombin III, phenprocoumon, hirudin, nicoumalone, Coumadin, glycosaminoglymays, ibuprofen, acetylsalicylic acid, indomethacin, prostaglandins, sulfinpyrazone, urokinase, hirulog, tissue plasminogen activator, coumarin, or combinations thereof.
[0148] An anticoagulant may be beneficial to use, for example, when, in addition to the analysis of a RBC-enriched fraction, protein profiling of one or more of leukocytes (white blood cells), platelets and/or plasma is desirable. An anticoagulant may also be beneficial to use if it is desirable to conduct protein profiling of the full cellular component of blood (i.e., a mixed population of blood cells minus the plasma component).
[0149] In other embodiments, a blood sample used in the methods of the present disclosure may not be mixed with an anticoagulant when, for example, protein profiling is to be conducted on RBCs, enriched RBCs, or a whole blood sample. In such cases, other stabilising agents without anti-coagulant activity or with only a nominal amount of anticoagulant activity may be mixed with the blood sample or a component thereof. In other embodiments, a blood sample or a component thereof used in the methods of the present disclosure may be stabilised by freezing (e.g., snap freezing) or by drying (e.g., dried blood spot).
Use of Protease Inhibitors
[0150] In certain embodiments, the methods comprise contacting a whole blood sample, a red blood cell-enriched sample, or a red blood cell component (e.g., red blood cells or red blood cell membranes) with one or more protease inhibitors that modulate the level of one or more proteins in the sample or component. A red blood cell-enriched sample, or a red blood cell component may be contacted with one or more protease inhibitors by, for example, incubating the red blood cell-enriched sample, or a red blood cell component in a medium (e.g., PBS, HBSS, EBSS, RPMI, MEM, IMEM, EMEM, DMEM, IMDM) containing one or more protease inhibitors. The blood sample or component may be obtained from a subject having a disease or disorder and/or a subject not having a disease or disorder (e.g., a healthy subject). For example, the blood sample or component may be contacted by one or more protease inhibitors that differentially modulate the level of one or more proteins in a sample or component from a subject having a disease or disorder in comparison to the modulation of the level of the one or more proteins in a blood sample or component from a subject that does not have the disease or disorder.
[0151] Numerous protease inhibitors may be used in the methods provided herein, either individually or in combination, with suitable protease inhibitors for use in the methods determined by one of ordinary skill in the art. For example, by determining the effect (e.g., magnitude of increase or decrease, or lack of a significant increase or decrease) of individual protease inhibitors on the levels of protein(s) from a red blood cell component, one of skill in the art may choose to use a particular protease inhibitor based on a desired modulation of protein levels. Protease inhibitors suitable for use in the methods may include those that inhibit proteases from various protease families, including, in some embodiments, serine protease inhibitors, cysteine protease inhibitors, metalloproteases inhibitors, aspartic protease inhibitors, and aminopeptidase inhibitors. Protease inhibitors may be specific to the inhibition of a particular protease, or a particular family of proteases, or non-specific, inhibiting a general/common proteolytic mechanism (e.g., EDTA). Protease inhibitors may also include those that inhibit proteases from more than one protease family, for instance, a protease inhibitor that inhibits both serine and cysteine proteases (e.g., leupeptin, phenylmethylsulfonyl fluoride (PMSF), squamous cell carcinoma antigen-1 (SCCA-1)). The protease inhibitors may include those that are endogenous (e.g., endogenous proteins) or synthetic (e.g., chemically synthesized).
[0152] Serine protease inhibitors suitable for use in the provided methods may include, for example, alpha-1-antichymotrypsin, C1 Inhibitor (C1INH), alpha-1-antitrypsin, antithrombin III, alpha-1-antiplasmin, plasminogen activator inhibitor-1 (PAI-1), pancreatic trypsin inhibitor, SCCA-1, other members of the SERPIN superfamily that inhibit serine protease activity, aprotinin, chymostatin, leupeptin, antipain dihydrochloride, PMSF (Thermo Fisher Scientific), diisopropyl fluorophosphate (DSF), E-64 (N--(N-L-3-trans-carbonyl)-L-leucyl)-agmatine), Pefabloc.RTM. SC (Roche/Sigma-Aldrich), TLCK (CAS 131918-97-3), cathespin (e.g., cathepsin A and G) inhibitors, trypsin inhibitors, and the like.
[0153] Cysteine (thiol) protease inhibitors suitable for use in the methods provided herein may include, for example, caspase inhibitors, calpain inhibitors (e.g., calpain inhibitor I, calpain inhibitor II, calpastatin), cathepsin (e.g., cathepsin B, C, F, H, K, S, L, O, S, V, X, and W) (e.g., papain) inhibitors (e.g., cystatins (e.g., stefins, cystatins, kininogens), thyropins, serpins, E-64 (N--(N-L-3-trans-carbonyl)-L-leucyl)-agmatine)), SCCA-1, chymostatin, antipain dihydrochloride, N-Ethylmaleimide, leupeptin, .alpha.2-macroglobulin, PMSF, and the like.
[0154] Metalloprotease (metalloproteinase) inhibitors suitable for use in the methods provided herein may include, for example, bestatin, phosphoramidon, .alpha.2-macroglobulin, tissue inhibitors of metalloproteinases (e.g., TIMP1-TIMP4), EDTA, 2,2'-bipyridyl ReagentPlus.RTM., ethylenediaminetetraacetic acid disodium salt dehydrate, 1,10-phenanthroline monohydrate, phosphoramidon disodium salt, and other synthetic inhibitors (e.g, hydroxamate-based, thiol-based, pyrimidine-based, hydroxyprone-based, phosphorus-based, and tetracycline-based, and metalloendopeptidase inhibitors (e.g., phosphoramidon, SCH 39370), and the like.
[0155] Aspartic/aspartyl protease inhibitors suitable for use in the methods provided herein may include, for example, .alpha.2-macroglobulin, pepstatin, pepstatin A, cathepsin (e.g., cathepsin D and E) inhibitors, and the like.
[0156] Aminopeptidase inhibitors suitable for use in the methods provided herein may include, for example, bestatin hydrochloride, actinonin, arphamenine A, aspstatin, amastatin hydrochloride, arphamenine B, ebelactone A, epiamastatin hydrochloride, aminopeptidase N inhibitor, bestatin methyl ester, 1-glutamic acid gamma-(7-amido-4-methylcoumarin), CHR 2797, captopril, fumagillin, HFI 142, SC 57461A, and the like.
[0157] Also suitable for use in the methods provided herein are protease inhibitor cocktails (PIC). In certain embodiments, the protease inhibitor cocktail is A8127s, which comprises antipain-dihydrochloride, bestatin, E-64, leupeptin, pepstatin, phosphoramidon, pefabloc SC, EDTA-Na.sub.2, and aprotinin. In other embodiments, PICs such as cOmplete.RTM. Protease Inhibitor Cocktail Tablets (Roche), protease inhibitor cocktail powder (Sigma Aldrich, Cat. No. SRE0055), SIGMAFAST protease inhibitor tablets (Sigma Aldrich, Cat. No. S8820), protease inhibitor cocktail (Sigma Aldrich, Cat. No. P8340), animal component free protease inhibitor cocktail (Sigma Aldrich, Cat. No. 13786), Halt Protease and phosphate inhibitor cocktails (Thermo Fisher), Abcam's protease inhibitor (Abcam), Protease inhibitor cocktails (Promega), and the like may be used in the methods provided herein. Moreover, a protease inhibitor cocktail may be customized to enhance the change in the level of protein(s) of interest by determining the effect of individual protease inhibitors on the change in the level of the protein(s) of interest (e.g., proteins in a protein profile). A protease inhibitors may be included in or eliminated from a particular protease inhibitor cocktail based on its effect on the expression of proteins(s) being measured, for instance, for a particular disease protein profile.
[0158] In some embodiments, a whole blood sample, a red blood cell-enriched sample, and/or red blood cell component is contacted with one or more protease inhibitors. In other embodiments, a whole blood sample, a red blood cell-enriched sample, and/or red blood cell component is contacted with a combination of the foregoing protease inhibitors (e.g., a combination of serine protease inhibitors, cysteine protease inhibitors, metalloproteases inhibitors, aspartic protease inhibitors, and/or aminopeptidase inhibitors). In some embodiments, a whole blood sample, a red blood cell-enriched sample, and/or red blood cell component is contacted with one or more serine protease inhibitors, one or more cysteine protease inhibitors, one or more metalloprotease inhibitors, one or more aspartic protease inhibitors and/or one or more aminopeptidase inhibitors. In other embodiments, a whole blood sample, a red blood cell-enriched sample, and/or red blood cell component is contacted with one or more serine protease inhibitors and one or more cysteine protease inhibitors. In other embodiments, a whole blood sample, a red blood cell-enriched sample, and/or red blood cell component is contacted with one or more serine protease inhibitors and one or more metalloprotease inhibitors. In some embodiments, a whole blood sample, a red blood cell-enriched sample, and/or red blood cell component is contacted with one or more serine protease inhibitors and one or more aspartyl protease inhibitors. In still other embodiments, a whole blood sample, a red blood cell-enriched sample, and/or red blood cell component is contacted with one or more serine protease inhibitors and one or more aminopeptidase inhibitors. In yet other embodiments, a whole blood sample, a red blood cell-enriched sample, and/or red blood cell component is contacted with one or more serine protease inhibitors, one or more cysteine protease inhibitors, and one or more metalloprotease inhibitors. In other embodiments, a whole blood sample, a red blood cell-enriched sample, and/or red blood cell component is contacted with one or more serine protease inhibitors, one or more cysteine protease inhibitors, and one or more aspartic protease inhibitors. In other embodiments, a whole blood sample, a red blood cell-enriched sample, and/or red blood cell component is contacted with one or more serine protease inhibitors, one or more cysteine protease inhibitors, and one or more aminopeptidase inhibitors. In yet other embodiments, a whole blood sample, a red blood cell-enriched sample, and/or red blood cell component is contacted with one or more cysteine protease inhibitors and one or more metalloprotease inhibitors. In some other embodiments, a whole blood sample, a red blood cell-enriched sample, and/or red blood cell component is contacted with one or more cysteine protease inhibitors and one or more aspartic protease inhibitors. In certain embodiments, a whole blood sample, a red blood cell-enriched sample, and/or red blood cell component is contacted with one or more cysteine protease inhibitors and one or more aminopeptidase inhibitors. In still other embodiments, a whole blood sample, a red blood cell-enriched sample, and/or red blood cell component is contacted with one or more cysteine protease inhibitors, one or more metalloprotease inhibitors and/or one or more aspartic protease inhibitors. In still other embodiments, a whole blood sample, a red blood cell-enriched sample, and/or red blood cell component is contacted with one or more cysteine protease inhibitors, one or more metalloprotease inhibitors and/or one or more aminopeptidase inhibitors. In other embodiments, a whole blood sample, a red blood cell-enriched sample, and/or red blood cell component is contacted with one or more cysteine protease inhibitors, one or more metalloprotease inhibitors, one or more aspartic protease inhibitors, and/or one or more aminopeptidase inhibitors. In other embodiments, a whole blood sample, a red blood cell-enriched sample, and/or red blood cell component is contacted with one or more metalloprotease inhibitors and one or more aspartic protease inhibitors. In still other embodiments, a whole blood sample, a red blood cell-enriched sample, and/or red blood cell component is contacted with one or more metalloprotease inhibitors and one or more aminopeptidase inhibitors. In still other embodiments, a whole blood sample, a red blood cell-enriched sample, and/or red blood cell component is contacted with one or more metalloprotease inhibitors, one or more aspartic protease inhibitors, and one or more aminopeptidase inhibitors. In still other embodiments, a whole blood sample, a red blood cell-enriched sample, and/or red blood cell component is contacted with one or more aspartic protease inhibitors and one or more aminopeptidase inhibitors.
[0159] In yet other embodiments, a whole blood sample, a red blood cell-enriched sample, and/or red blood cell component is contacted with one or more protease inhibitors that inhibit both serine and cysteine proteases. In still other embodiments, a whole blood sample, a red blood cell-enriched sample, and/or red blood cell component is contacted with one or more protease inhibitors that inhibit both serine and cysteine proteases and one or more metalloproteases. In other embodiments, a whole blood sample, a red blood cell-enriched sample, and/or red blood cell component is contacted with one or more protease inhibitors that inhibit both serine and cysteine proteases and one or more aspartic proteases. In still other embodiments, a whole blood sample, a red blood cell-enriched sample, and/or red blood cell component is contacted with one or more protease inhibitors that inhibit both serine and cysteine proteases and one or more aminopeptidases. In other embodiments, a whole blood sample, a red blood cell-enriched sample, and/or red blood cell component is contacted with one or more protease inhibitors that inhibit both serine and cysteine proteases, one or more metalloproteases, and one or more aspartic proteases. In other embodiments, a whole blood sample, a red blood cell-enriched sample, and/or red blood cell component is contacted with one or more protease inhibitors that inhibit both serine and cysteine proteases, one or more metalloproteases, one or more aspartic acid proteases, and one or more aminopeptidases. In certain embodiments, a whole blood sample, a red blood cell-enriched sample, and/or red blood cell component is contacted with one or more specific protease inhibitors (e.g., serine, cysteine, metalloprotease, aspartyl protease, or aminopeptidase inhibitors) and one or more non-specific protease inhibitors (e.g., EDTA). In some embodiments, a whole blood sample, a red blood cell-enriched sample, and/or red blood cell component is contacted with one or more of the foregoing protease inhibitors that comprise a protease inhibitor cocktail. In a certain embodiments, a whole blood sample, a red blood cell-enriched sample, and/or red blood cell component is contacted with the protease inhibitor cocktail A8127s.
[0160] A number of the foregoing protease inhibitors may be used in combination in certain embodiments. For instance, in some embodiments, a whole blood sample, a red blood cell-enriched sample, and/or red blood cell component may be contacted with one or more protease inhibitors, two or more protease inhibitors, three or more protease inhibitors, four or more protease inhibitors, five or more protease inhibitors, six or more protease inhibitors, seven or more protease inhibitors, eight or more protease inhibitors, nine or more protease inhibitors, ten or more protease inhibitors, eleven or more protease inhibitors, twelve or more protease inhibitors, thirteen or more protease inhibitors, fourteen or more protease inhibitors, fifteen or more protease inhibitors, sixteen or more protease inhibitors, seventeen or more inhibitors, eighteen or more protease inhibitors, nineteen or more protease inhibitors or twenty or more protease inhibitors. In other embodiments, a whole blood sample, a red blood cell-enriched sample, and/or red blood cell component is contacted with two or more protease inhibitors. In other embodiments, a whole blood sample, a red blood cell-enriched sample, and/or red blood cell component is contacted with three or more protease inhibitors. In still other embodiments, a whole blood sample, a red blood cell-enriched sample, and/or red blood cell component is contacted with four or more protease inhibitors. In some other embodiments, a whole blood sample, a red blood cell-enriched sample, and/or red blood cell component is contacted with five or more protease inhibitors. In other embodiments, a whole blood sample, a red blood cell-enriched sample, and/or red blood cell component is contacted with six or more protease inhibitors. In some other embodiments, a whole blood sample, a red blood cell-enriched sample, and/or red blood cell component is contacted with seven or more protease inhibitors. In yet other embodiments, a whole blood sample, a red blood cell-enriched sample, and/or red blood cell component is contacted with eight or more protease inhibitors. In still other embodiments, a whole blood sample, a red blood cell-enriched sample, and/or red blood cell component is contacted with nine or more protease inhibitors. In other embodiments, a whole blood sample, a red blood cell-enriched sample, and/or red blood cell component is contacted with ten or more protease inhibitors. In other embodiments, a whole blood sample, a red blood cell-enriched sample, and/or red blood cell component is contacted with fifteen or more protease inhibitors. In yet other embodiments, a whole blood sample, a red blood cell-enriched sample, and/or red blood cell component is contacted with twenty or more protease inhibitors.
Use of Cationic Salts
[0161] Certain embodiments further comprise contacting a red blood cell-enriched sample with at least one cationic salt that increases and/or enhances the detectable level of one or more proteins in the sample. The cationic salt may be one or more that are suitable for use in the methods, as determined by one of ordinary skill in the art. The cationic salt, in some embodiments, is a monovalent or multivalent (e.g., divalent, trivalent) metal ion salt. In other embodiments, the cationic salt is an ammonium salt.
[0162] Monovalent metal cationic salts suitable for use in the methods may include, for example, a sodium salt, a potassium salt, a lithium salt, and the like, or combinations thereof. Suitable sodium salts may include, for example, sodium chloride, sodium citrate, sodium sulfate, sodium lactate, sodium acetate, sodium bicarbonate, sodium carbonate, sodium stearate, sodium ascorbate, sodium benzoate, sodium biphosphate, dibasic sodium phosphate, sodium phosphate, sodium bisulfite, sodium borate, sodium gluconate, sodium metasilicate, sodium propionate and the like, or combinations thereof. Suitable potassium salts may include, for example, potassium chloride, potassium citrate, potassium bromide, potassium iodide, potassium bicarbonate, potassium nitrite, potassium persulfate, potassium sulfite, potassium sulfate, potassium bisulfite, potassium phosphate, potassium acetate, potassium citrate, potassium glutamate, dipotassium guanylate, potassium gluconate, potassium malate, potassium ascorbate, potassium sorbate, potassium succinate, potassium tartrate and combinations thereof. Suitable lithium salts include, for example, lithium chloride, lithium bromide, lithium carbonate, lithium nitrate, lithium sulfate, lithium acetate, lithium lactate, lithium citrate, lithium aspartate, lithium gluconate, lithium malate, lithium ascorbate, lithium orotate, lithium succinate or combinations thereof.
[0163] Divalent metal cation salts suitable for use in the methods may include, for example, a calcium salt, a potassium salt, a beryllium salt, a strontium salt, a barium salt, a radium salt, an iron (ferrous) salt, and the like, or combinations thereof. Suitable calcium salts include, for example, calcium chloride, calcium sulfate, calcium lactate, calcium citrate, calcium carbonate, calcium acetate, calcium phosphate, calcium alginite, calcium stearate, calcium sorbate, calcium gluconate and the like, or combinations thereof. Suitable magnesium salts may include, for example, magnesium fluoride, magnesium chloride, magnesium bromide, magnesium iodide, magnesium lactate, magnesium phosphate, magnesium sulfate, magnesium sulfite, magnesium carbonate, magnesium oxide, magnesium nitrate, magnesium borate, magnesium acetate, magnesium citrate, magnesium gluconate, magnesium maleate, magnesium succinate, magnesium malate, magnesium taurate, magnesium orotate, magnesium glycinate, magnesium naphthenate, magnesium acetylacetonate, magnesium formate, magnesium hydroxide, magnesium stearate, magnesium hexafluorsilicate, magnesium salicylate or combinations thereof. Suitable beryllium salts may include, for example, beryllium phosphate, beryllium acetate, beryllium tartrate, beryllium citrate, beryllium gluconate, beryllium maleate, beryllium succinate, sodium beryllium malate, beryllium alpha brom camphor sulfonate, beryllium acetylacetonate, beryllium formate or combinations thereof. Suitable strontium salts may include, for example, strontium chloride, strontium phosphate, strontium sulfate, strontium carbonate, strontium oxide, strontium nitrate, strontium acetate, strontium tartrate, strontium citrate, strontium gluconate, strontium maleate, strontium succinate, strontium malate, strontium aspartate in either L and/or D-form, strontium fumarate, strontium glutamate in either L- and/or D-form, strontium glutarate, strontium lactate, strontium L-threonate, strontium malonate, strontium ranelate (organic metal chelate), strontium ascorbate, strontium butyrate, strontium clodronate, strontium ibandronate, strontium salicylate, strontium acetyl salicylate or combinations thereof. Suitable barium salts may include, for example, barium hydroxide, barium fluoride, barium chloride, barium bromide, barium iodide, barium sulfate, barium sulfide (S), barium carbonate, barium peroxide, barium oxide, barium nitrate, barium acetate, barium tartrate, barium citrate, barium gluconate, barium maleate, barium succinate, barium malate, barium glutamate, barium oxalate, barium malonate, barium naphthenate, barium acetylacetonate, barium formate, barium benzoate, barium p-t-butylbenzoate, barium adipate, barium pimelate, barium suberate, barium azelate, barium sebacate, barium phthalate, barium isophthalate, barium terephthalate, barium anthranilate, barium mandelate, barium salicylate, barium titanate or combinations thereof. Suitable radium salts may include, for example, radium fluoride, radium chloride, radium bromide, radium iodide, radium oxide, radium nitride or combinations thereof. Suitable radium salts included, for example, radium fluoride, radium chloride, radium bromide, radium iodide, radium oxide, radium nitride, and the like. Suitable iron (ferrous) salts may include, for example, ferrous sulfate, ferrous oxides, ferrous acetate, ferrous citrate, ferrous ammonium citrate, ferrous gluconate, ferrous oxalate, ferrous fumarate, ferrous maleate, ferrous malate, ferrous lactate, ferrous ascorbate, ferrous erythrobate, ferrous glycerate, ferrous pyruvate, and the like, or combinations thereof.
[0164] In certain embodiments, the cationic salt is one that may prevent and/or minimize pH change in the red blood cell-enriched sample (e.g., a chloride or carbonate salt). Thus, in certain embodiments, the cationic salt is a carbonate salt. In further embodiments, the cationic salt may also prevent or minimize damage to cell membranes (e.g., RBC membranes). In certain embodiments, the cationic salt is a chloride salt. In other embodiments, the cationic salt is calcium chloride, potassium chloride, strontium chloride, barium chloride, radium chloride, or combinations thereof. In still other embodiments, the cationic salt is sodium chloride, potassium chloride, rubidium chloride, cesium chloride, lithium chloride, or combinations thereof. In other embodiments, the cationic salt is lithium chloride. In other embodiments, the cationic salt may be sodium chloride. In certain embodiments, the cationic salt may be calcium carbonate, potassium carbonate, strontium carbonate, barium carbonate, or radium carbonate. In still other embodiments, the cationic salt is sodium carbonate, potassium carbonate, rubidium carbonate, cesium carbonate, lithium carbonate, or combinations thereof. In yet other embodiments, the cationic salt is lithium carbonate. In other embodiments, the cationic salt is sodium carbonate.
[0165] Salts other than monovalent or divalent metal cation salts may be used in the methods, including, for example, a trivalent or other multivalent salt, such as aluminum, silicon, scandium, titanium, vanadium, chromium, cobalt, nickel, copper, manganese, zinc, tin, silver and the like, or combinations thereof.
[0166] Ammonium salts may also be used in the methods with suitable ammonium salts including ammonium carbonate, ammonium chloride, ammonium nitrate, ammonium acetate, ammonium biorate, ammonium bromide, ammonium carbamate, ammonium cerium (IV) sulphate, ammonium chromate, ammonium dichromate, ammonium dihydrogen phosphate, ammonium fluoride, ammonium formate, ammonium phosphate, ammonium sodium phosphate dibasic tetrahydrate, ammonium thiosulfate, ammonium zirconium, and the like, or combinations thereof.
[0167] In certain embodiments, the cationic salt is ammonium chloride. In other embodiments, the cationic salt is ammonium carbonate.
[0168] In certain embodiments, the red blood cell-enriched sample is contacted with one or more combinations of the foregoing cationic salts to increase and/or enhance the detectable level of one or more protein in the sample. In some embodiments, the red blood cell-enriched sample is contacted with at least one cationic salt. In other embodiments, the red blood cell-enriched sample is contacted with at least two cationic salts. In still other embodiments, the red blood cell-enriched sample is contacted with at least three cationic salts.
[0169] In certain embodiments, the blood sample is contacted with one or more combinations of the foregoing cationic salts to increase and/or enhance the detectable level of one or more proteins in the sample prior to the red blood cell enriching of the blood sample. In some embodiments, the blood sample is contacted with at least one cationic salt. In other embodiments, the blood sample is contacted with at least two cationic salts. In still other embodiments, the blood sample is contacted with at least three cationic salts.
[0170] The references to salts (e.g., sodium containing salts) herein include anhydrous forms and hydrated forms of the salt.
[0171] In certain embodiments, a whole blood sample is contacted with at least one of the foregoing cationic salts to produce a protein profile. The whole blood sample may be obtained from venous blood, capillary blood, arterial blood or combinations thereof, using methods available to one of ordinary skill in the art.
[0172] In other embodiments, one or more additional blood compartment(s) selected from plasma, serum, platelets, leukocytes, an enriched platelet fraction, an enriched leukocyte fraction, platelet-rich plasma, leukocyte-rich plasma, a mixture of platelets and leukocytes, specific leukocyte(s) (e.g., one or more of T lymphocytes (e.g., CD4+T lymphocytes, CD8+T lymphocytes), B lymphocytes, NK cells, monocytes, neutrophils, eosinophils, basophils, and the like), and combinations thereof, are contacted by at least one of the foregoing cationic salts to produce a protein profile. The additional blood compartment(s) for analysis may be prepared using available techniques (e.g., flow cytometry, magnetic bead separation, centrifugation, and the like).
Protein Detection and Profiling
[0173] The present disclosure provides methods for producing a protein profile from a blood sample comprising a RBC component (e.g., an RBC-enriched sample, RBC-enriched fraction or a whole blood sample). The production of such profiles may provide insight into biological processes including, but not limited to inflammation, immune responses, and/or cellular repair, and/or disease state.
[0174] While not imparting particular limitations to the type(s) of proteins that may be detected or measured in generating a protein profile by the methods of the present disclosure, non-limiting examples include signalling molecules, e.g., chemokines, cytokines, other inflammatory proteins, glycoproteins, growth factors, receptors, intracellular signal transmitters, hormones, nuclear transcription factors, neurotransmitters, and extracellular matrix components, and enzymes. For instance, growth factors may include those that stimulate the growth, proliferation, healing, or differentiation of, for example, skin cells (e.g., epidermal growth factor (EGF), keratinocyte growth factor (KGF), migration stimulating factor (MSF)), nerve cells/nervous system (e.g., neuregulins (e.g., neuregulin 1-4) and neurotrophins (e.g., nerve growth factor (NGF), brain-derived neurotrophic factor (BDNF), neurotrophin-3 (NT-3), neurotrophin-4 (NT-4))), connective tissue and mesenchymal cells (e.g., fibroblast growth factor (FGF)), blood vessel cells (e.g., platelet-derived growth factor (PDGF), placental growth factor (PGF), vascular endothelial growth factor (VEGF)), blood cells (e.g., erythropoietin, granulocyte colony stimulating factor (G-CSF), granulocyte macrophage colony-stimulating factor (GM-CSF)), and cell proliferation (e.g., insulin-like growth factor (IGF-1), insulin-like growth factor-2 (IGF-2)) along with pleitropic growth factors (e.g, transforming growth factor-beta (TGF-.beta.), transforming growth factor-beta (TGF-.alpha.), tumor necrosis factor (TNF)).
[0175] Receptors may include intracellular receptors (e.g., nuclear (e.g., transcription factors), cytoplasmic (e.g., steroid), and endoplasmic recticulum (e.g., IP3) receptors), cell surface receptors (e.g., ion channel-linked, G-protein-linked, enzyme-linked, toll gate, and ligand gated receptors, integrins), soluble receptors (e.g., soluble cytokine receptors), and scavenger receptors (e.g., SR-A1, SR-A2, SCARA1-SCARA5, SCARB1-SCARB3, CD68, dSR-C1, LOX-1, sPD-1, sCTLA-4). Hormones may include lipid-derived (e.g., prostaglandins, leukotrienes, prostacylins, thromboxane); amino acid-derived (e.g., epinephrine, melatonin, thyroxine); peptide (e.g., amylin, adiponenctin, angiotensinogen, calcitonin, brain natriuretic peptide (BNP), erythropoietin, follicle-stimulating hormone (FSH), ghrelin, glucagon-like peptide-1 (GLP-1), human chorionic gonadotropin (hCG), insulin, insulin-like growth factor (IGF), and the like); and steroids (e.g., androgen, estrogen, glucocorticoid, progestogen, secosteroid, and the like). Intracellular signal transmitters or transducers may include families of proteins and protein kinases (e.g., Ras and Src families), and Wnt signalling family proteins. Neurotransmitters may include amino acids, peptides (e.g., .beta.-endorphin, opioid), monoamines, trace amines, purines, and gasotransmitters. Nuclear transcription factors may include modulators of DNA transcription (e.g., fos, myc, N-myc), and modulators of mRNA transcription, and suppressors of cell division (e.g., p53, pRb). Enzymes may include oxidoreductases (e.g., alcohol, aldehyde, amino acid, sulphur, diphenol, peroxidises, and the like) NADH, NADPH, nucleases, proteases, kinases, transferases, hydrolases, lyases, isomerases, and ligases. Chemokines and cytokines are numerous may include, for example, those listed in Table 1 and Table 2 below.
[0176] In certain embodiments, the methods comprise producing a protein profile consisting of, or comprising, a single protein or combinations of proteins as set out in Tables 1 and 2 below. The profile may be generated from a blood sample comprising an RBC component (e.g., a red blood cell-enriched sample, RBC-enriched fraction, or a whole blood sample). Additional profile(s) may be generated from other cellular compartment(s) including, but not limited to, plasma, serum, platelets, leukocytes, an enriched platelet fraction, an enriched leukocyte fraction, platelet-rich plasma, leukocyte-rich plasma, a mixture of platelets and leukocytes, specific leukocyte(s) (e.g., one or more of T lymphocytes (e.g., CD4+T lymphocytes, CD8+T lymphocytes), B lymphocytes, NK cells, monocytes, neutrophils, eosinophils, basophils, and the like), or combinations thereof.
TABLE-US-00001 TABLE 1 Non-limiting examples of individual proteins that may be included in a protein profile generated by the methods of the present disclosure. The protein profile may comprise or consist of one or more of the proteins listed. Single Protein (acronym) Single Protein (full name) basic FGF basic fibroblast growth factor CTACK (CCL27) cutaneous T cell-attracting chemokine Eotaxin 1 CCL11 #1 G-CSF (GCSF) granulocyte-colony stimulating factor GM-CSF (CSF2) granulocyte-macrophage colony-stimulating factor HGF hepatocyte growth factor IFN-.alpha.2 interferon alpha subtype .alpha.2 IFN-.gamma. interferon gamma IL-10 interleukin 10 IL-12 (IL-12p70) interleukin 12 p35 and p40 heterodimer IL-13 interleukin 13 IL-12p40 interleukin 12 p40 subunit IL-15 interleukin 15 IL-16 interleukin 16 IL-17A interleukin 17A IL-18 interleukin 18 IL-1.alpha. interleukin 1 alpha IL-1.beta. interleukin 1 beta IL-2 interleukin 2 IL-2ra interleukin 2 receptor alpha chain IL-3 interleukin 3 IL-5 interleukin 5 IL-6 interleukin 6 IL-7 interleukin 7 IL-9 interleukin 9 IP-10 (CXCL10) interferon gamma-induced protein 10 LIF leukaemia inhibitory factor M-CSF (CSF1) macrophage colony-stimulating factor MIG (CXCL9) monokine induced by IFN-.gamma., Chemokine (C-X-C motif) ligand 9 MIP-1.alpha. (CCL3) macrophage inflammatory protein-1 alpha MIP-1.beta. (CCL4) macrophage inflammatory protein-1 alpha PDGF-BB platelet-derived growth factor B chain homodimer SDF-1.alpha. (CXCL12) stromal cell-derived factor 1 TNF-.alpha. (cachexin) tumour necrosis factor alpha TNF-.beta. tumour necrosis factor-beta (lymphotoxin) TRAIL TNF-related apoptosis-inducing ligand VEGF vascular endothelial growth factor IL-8 interleukin 8 MCP-1 (CCL2) monocyte chemoattractant protein-1 MGSA maintenance of genome stability protein A PGE-2 prostaglandin E2 RANTES (CCL5) regulated on activation, normal T cell expressed and secreted MIF (MMIF) macrophage migration inhibitory factor GRO-.alpha. (CXCL1) Growth-regulated oncogene .alpha. CRP C-reactive protein DDT (MIF-2) D-dopachrome tautomerase IGF-1 insulin like growth factor 1 sEGFR epidermal growth factor receptor sHER-2/neu receptor tyrosine-protein kinase erbB-2 (CD340) sIL-6Ra interleukin-6 receptor Leptin Osteopontin PECAM-1 (CD31) platelet endothelial cell adhesion molecule precursor PDGF-AB/BB platelet-derived growth factor AB/platelet derived growth factor BB Prolactin prolactin sTIE-1 tyrosine kinase with Ig and EGF homology domains-1 sTIE-2 tyrosine kinase with Ig and EGF homology domains-2 sVEGFR-1 vascular endothelial growth factor receptor-1 sVEGFR-2 vascular endothelial growth factor receptor-2 APRIL/TNFSF13 A proliferation-inducing ligand/tumor necrosis factor ligand superfamily member 13 BAFF/TNFSF13B B-cell activating factor/tumor necrosis factor ligand superfamily member 13B TNFRSF8 (CD30) TNF receptor superfamily member 8 sCD163 cluster of differentiation 163 CHl3L1 Chitinase-3-like 1 gp130/sIL-6R.beta. glycoprotein 130/interleukin-6 receptor beta IL-11 interleukin-11 IL-19 interleukin-19 IL-20 interleukin-20 IL-22 interleukin-22 IL-26 interleukin-26 IL-27(p28) interleukin-27(p28) IL-28A/IFN-.lamda.2 interleukin-28/interferon gamma 2 IL-29/IFN-.lamda.1 interleukin-29/interferon gamma 1 IL-32 interleukin-32 IL-34 interleukin-34 IL-35 interleukin-35 TNFSF14/LIGHT tumor necrosis factor superfamily member 14/homologous to lymphotoxin, exhibits inducible expression and competes with HSV glycoprotein D for binding to herpersvirus entry mediator, a receptor expressed on T lymphocytes/ MMP-1 matrix metalloproteinase-1 MMP-2 matrix metalloproteinase-2 MMP-3 matrix metalloproteinase-3 Osteocalcin Pentraxin-3 sTNF-R1 tumor necrosis factor receptor 1 sTNF-R2 tumor necrosis factor receptor 2 TSLP thymic stromal lymphopoietin TWEAK/ TNF-related weak inducer of apoptosis/tumor TNFSF12 necrosis factor superfamily member 12 4-1BB (CD137) CTLA-4 (CD152) cytotoxic T-lymphocyte associated protein 4 Lag-3 (CD223) lymphocyte-activation gene 3 CD27 HVEM/TNFRSF14 herpesvirus entry mediator/tumor necrosis factor (CD270) superfamily member 14 BTLA (CD272) B- and T-lymphocyte associated PD-1 (CD279) programmed cell death protein 1 CD28 GITR/TNFRSF18 glucocorticoid-induced TNFR family related gene/ (CD357) tumor necrosis factor superfamily member 18 B7-1 (CD80) TIM3 T-cell immunoglobulin domain and mucin domain 3
TABLE-US-00002 TABLE 2 Non-limiting examples of protein pairs that may be included in a protein profile generated by the methods of the present disclosure. The protein profile may comprise or consist of one or more protein pairs listed. Protein #1 Protein #2 Protein #1 Protein #2 Protein #1 Protein #2 Protein #1 Protein #2 basic FGF CTACK CTACK Eotaxin 1 Eotaxin 1 G-CSF G-CSF GM-CSF basic FGF Eotaxin 1 CTACK G-CSF Eotaxin 1 GM-CSF G-CSF HGF basic FGF G-CSF CTACK GM-CSF Eotaxin 1 HGF G-CSF IFN-.alpha.2 basic FGF GM-CSF CTACK HGF Eotaxin 1 IFN-.alpha.2 G-CSF IFN-.gamma. basic FGF HGF CTACK IFN-.alpha.2 Eotaxin 1 IFN-.gamma. G-CSF IL-10 basic FGF IFN-.alpha.2 CTACK IFN-.gamma. Eotaxin 1 IL-10 G-CSF IL-12 basic FGF IFN-.gamma. CTACK IL-10 Eotaxin 1 IL-12 G-CSF IL-13 basic FGF IL-10 CTACK IL-12 Eotaxin 1 IL-13 G-CSF IL-12p40 basic FGF IL-12 CTACK IL-13 Eotaxin 1 IL-12p40 G-CSF IL-15 basic FGF IL-13 CTACK IL-12p40 Eotaxin 1 IL-15 G-CSF IL-16 basic FGF IL-12p40 CTACK IL-15 Eotaxin 1 IL-16 G-CSF IL-17A basic FGF IL-15 CTACK IL-16 Eotaxin 1 IL-17A G-CSF IL-18 basic FGF IL-16 CTACK IL-17A Eotaxin 1 IL-18 G-CSF IL-1.alpha. basic FGF IL-17A CTACK IL-18 Eotaxin 1 IL-1.alpha. G-CSF IL-1.beta. basic FGF IL-18 CTACK IL-1.alpha. Eotaxin 1 IL-1.beta. G-CSF IL-2 basic FGF IL-1.alpha. CTACK IL-1.beta. Eotaxin 1 IL-2 G-CSF IL-2ra basic FGF IL-1.beta. CTACK IL-2 Eotaxin 1 IL-2ra G-CSF IL-3 basic FGF IL-2 CTACK IL-2ra Eotaxin 1 IL-3 G-CSF IL-5 basic FGF IL-2ra CTACK IL-3 Eotaxin 1 IL-5 G-CSF IL-6 basic FGF IL-3 CTACK IL-5 Eotaxin 1 IL-6 G-CSF IL-7 basic FGF IL-5 CTACK IL-6 Eotaxin 1 IL-7 G-CSF IL-9 basic FGF IL-6 CTACK IL-7 Eotaxin 1 IL-9 G-CSF IP-10 basic FGF IL-7 CTACK IL-9 Eotaxin 1 IP-10 G-CSF LIF basic FGF IL-9 CTACK IP-10 Eotaxin 1 LIF G-CSF M-CSF basic FGF IP-10 CTACK LIF Eotaxin 1 M-CSF G-CSF MIG basic FGF LIF CTACK M-CSF Eotaxin 1 MIG G-CSF MIP-1.alpha. basic FGF M-CSF CTACK MIG Eotaxin 1 MIP-1.alpha. G-CSF MIP-1.beta. basic FGF MIG CTACK MIP-1.alpha. Eotaxin 1 MIP-1.beta. G-CSF PDGF-BB basic FGF MIP-1.alpha. CTACK MIP-1.beta. Eotaxin 1 PDGF-BB G-CSF SDF-1.alpha. basic FGF MIP-1.beta. CTACK PDGF-BB Eotaxin 1 SDF-1.alpha. G-CSF TNF-.alpha. basic FGF PDGF-BB CTACK SDF-1.alpha. Eotaxin 1 TNF-.alpha. G-CSF TNF-.beta. basic FGF SDF-1.alpha. CTACK TNF-.alpha. Eotaxin 1 TNF-.beta. G-CSF TRAIL basic FGF TNF-.alpha. CTACK TNF-.beta. Eotaxin 1 TRAIL G-CSF VEGF basic FGF TNF-.beta. CTACK TRAIL Eotaxin 1 VEGF G-CSF IL-8 basic FGF TRAIL CTACK VEGF Eotaxin 1 IL-8 G-CSF MCP-1 basic FGF VEGF CTACK IL-8 Eotaxin 1 MCP-1 G-CSF MGSA basic FGF IL-8 CTACK MCP-1 Eotaxin 1 MGSA G-CSF PGE-2 basic FGF MCP-1 CTACK MGSA Eotaxin 1 PGE-2 G-CSF RANTES basic FGF MGSA CTACK PGE-2 Eotaxin 1 RANTES G-CSF MIF basic FGF PGE-2 CTACK RANTES Eotaxin 1 MIF G-CSF GRO-.alpha. basic FGF RANTES CTACK MIF Eotaxin 1 GRO-.alpha. G-CSF CRP basic FGF MIF CTACK GRO-.alpha. Eotaxin 1 CRP G-CSF DDT basic FGF GRO-.alpha. CTACK CRP Eotaxin 1 DDT basic FGF CRP CTACK DDT basic FGF DDT GM-CSF HGF HGF IFN-.alpha.2 IFN-.alpha.2 IFN-.gamma. IFN-.gamma. IL-10 GM-CSF IFN-.alpha.2 HGF IFN-.gamma. IFN-.alpha.2 IL-10 IFN-.gamma. IL-12 GM-CSF IFN-.gamma. HGF IL-10 IFN-.alpha.2 IL-12 IFN-.gamma. IL-13 GM-CSF IL-10 HGF IL-12 IFN-.alpha.2 IL-13 IFN-.gamma. IL-12p40 GM-CSF IL-12 HGF IL-13 IFN-.alpha.2 IL-12p40 IFN-.gamma. IL-15 GM-CSF IL-13 HGF IL-12p40 IFN-.alpha.2 IL-15 IFN-.gamma. IL-16 GM-CSF IL-12p40 HGF IL-15 IFN-.alpha.2 IL-16 IFN-.gamma. IL-17A GM-CSF IL-15 HGF IL-16 IFN-.alpha.2 IL-17A IFN-.gamma. IL-18 GM-CSF IL-16 HGF IL-17A IFN-.alpha.2 IL-18 IFN-.gamma. IL-1.alpha. GM-CSF IL-17A HGF IL-18 IFN-.alpha.2 IL-1.alpha. IFN-.gamma. IL-1.beta. GM-CSF IL-18 HGF IL-1.alpha. IFN-.alpha.2 IL-1.beta. IFN-.gamma. IL-2 GM-CSF IL-1.alpha. HGF IL-1.beta. IFN-.alpha.2 IL-2 IFN-.gamma. IL-2ra GM-CSF IL-1.beta. HGF IL-2 IFN-.alpha.2 IL-2ra IFN-.gamma. IL-3 GM-CSF IL-2 HGF IL-2ra IFN-.alpha.2 IL-3 IFN-.gamma. IL-5 GM-CSF IL-2ra HGF IL-3 IFN-.alpha.2 IL-5 IFN-.gamma. IL-6 GM-CSF IL-3 HGF IL-5 IFN-.alpha.2 IL-6 IFN-.gamma. IL-7 GM-CSF IL-5 HGF IL-6 IFN-.alpha.2 IL-7 IFN-.gamma. IL-9 GM-CSF IL-6 HGF IL-7 IFN-.alpha.2 IL-9 IFN-.gamma. IP-10 GM-CSF IL-7 HGF IL-9 IFN-.alpha.2 IP-10 IFN-.gamma. LIF GM-CSF IL-9 HGF IP-10 IFN-.alpha.2 LIF IFN-.gamma. M-CSF GM-CSF IP-10 HGF LIF IFN-.alpha.2 M-CSF IFN-.gamma. MIG GM-CSF LIF HGF M-CSF IFN-.alpha.2 MIG IFN-.gamma. MIP-1.alpha. GM-CSF M-CSF HGF MIG IFN-.alpha.2 MIP-1.alpha. IFN-.gamma. MIP-1.beta. GM-CSF MIG HGF MIP-1.alpha. IFN-.alpha.2 MIP-1.beta. IFN-.gamma. PDGF-BB GM-CSF MIP-1.alpha. HGF MIP-1.beta. IFN-.alpha.2 PDGF-BB IFN-.gamma. SDF-1.alpha. GM-CSF MIP-1.beta. HGF PDGF-BB IFN-.alpha.2 SDF-1.alpha. IFN-.gamma. TNF-.alpha. GM-CSF PDGF-BB HGF SDF-1.alpha. IFN-.alpha.2 TNF-.alpha. IFN-.gamma. TNF-.beta. GM-CSF SDF-1.alpha. HGF TNF-.alpha. IFN-.alpha.2 TNF-.beta. IFN-.gamma. TRAIL GM-CSF TNF-.alpha. HGF TNF-.beta. IFN-.alpha.2 TRAIL IFN-.gamma. VEGF GM-CSF TNF-.beta. HGF TRAIL IFN-.alpha.2 VEGF IFN-.gamma. IL-8 GM-CSF TRAIL HGF VEGF IFN-.alpha.2 IL-8 IFN-.gamma. MCP-1 GM-CSF VEGF HGF IL-8 IFN-.alpha.2 MCP-1 IFN-.gamma. MGSA GM-CSF IL-8 HGF MCP-1 IFN-.alpha.2 MGSA IFN-.gamma. PGE-2 GM-CSF MCP-1 HGF MGSA IFN-.alpha.2 PGE-2 IFN-.gamma. RANTES GM-CSF MGSA HGF PGE-2 IFN-.alpha.2 RANTES IFN-.gamma. MIF GM-CSF PGE-2 HGF RANTES IFN-.alpha.2 MIF IFN-.gamma. GRO-.alpha. GM-CSF RANTES HGF MIF IFN-.alpha.2 GRO-.alpha. IFN-.gamma. CRP GM-CSF MIF HGF GRO-.alpha. IFN-.alpha.2 CRP IFN-.gamma. DDT GM-CSF GRO-.alpha. HGF CRP IFN-.alpha.2 DDT GM-CSF CRP HGF DDT GM-CSF DDT IL-10 IL-12 IL-12 IL-13 IL-13 IL-12p40 IL-12p40 IL-15 IL-10 IL-13 IL-12 IL-12p40 IL-13 IL-15 IL-12p40 IL-16 IL-10 IL-12p40 IL-12 IL-15 IL-13 IL-16 IL-12p40 IL-17A IL-10 IL-15 IL-12 IL-16 IL-13 IL-17A IL-12p40 IL-18 IL-10 IL-16 IL-12 IL-17A IL-13 IL-18 IL-12p40 IL-1.alpha. IL-10 IL-17A IL-12 IL-18 IL-13 IL-1.alpha. IL-12p40 IL-1.beta. IL-10 IL-18 IL-12 IL-1.alpha. IL-13 IL-1.beta. IL-12p40 IL-2 IL-10 IL-1.alpha. IL-12 IL-1.beta. IL-13 IL-2 IL-12p40 IL-2ra IL-10 IL-1.beta. IL-12 IL-2 IL-13 IL-2ra IL-12p40 IL-3 IL-10 IL-2 IL-12 IL-2ra IL-13 IL-3 IL-12p40 IL-5 IL-10 IL-2ra IL-12 IL-3 IL-13 IL-5 IL-12p40 IL-6 IL-10 IL-3 IL-12 IL-5 IL-13 IL-6 IL-12p40 IL-7 IL-10 IL-5 IL-12 IL-6 IL-13 IL-7 IL-12p40 IL-9 IL-10 IL-6 IL-12 IL-7 IL-13 IL-9 IL-12p40 IP-10 IL-10 IL-7 IL-12 IL-9 IL-13 IP-10 IL-12p40 LIF IL-10 IL-9 IL-12 IP-10 IL-13 LIF IL-12p40 M-CSF IL-10 IP-10 IL-12 LIF IL-13 M-CSF IL-12p40 MIG IL-10 LIF IL-12 M-CSF IL-13 MIG IL-12p40 MIP-1.alpha. IL-10 M-CSF IL-12 MIG IL-13 MIP-1.alpha. IL-12p40 MIP-1.beta. IL-10 MIG IL-12 MIP-1.alpha. IL-13 MIP-1.beta. IL-12p40 PDGF-BB IL-10 MIP-1.alpha. IL-12 MIP-1.beta. IL-13 PDGF-BB IL-12p40 SDF-1.alpha. IL-10 MIP-1.beta. IL-12 PDGF-BB IL-13 SDF-1.alpha. IL-12p40 TNF-.alpha. IL-10 PDGF-BB IL-12 SDF-1.alpha. IL-13 TNF-.alpha. IL-12p40 TNF-.beta. IL-10 SDF-1.alpha. IL-12 TNF-.alpha. IL-13 TNF-.beta. IL-12p40 TRAIL IL-10 TNF-.alpha. IL-12 TNF-.beta. IL-13 TRAIL IL-12p40 VEGF IL-10 TNF-.beta. IL-12 TRAIL IL-13 VEGF IL-12p40 IL-8 IL-10 TRAIL IL-12 VEGF IL-13 IL-8 IL-12p40 MCP-1 IL-10 VEGF IL-12 IL-8 IL-13 MCP-1 IL-12p40 MGSA IL-10 IL-8 IL-12 MCP-1 IL-13 MGSA IL-12p40 PGE-2 IL-10 MCP-1 IL-12 MGSA IL-13 PGE-2 IL-12p40 RANTES IL-10 MGSA IL-12 PGE-2 IL-13 RANTES IL-12p40 MIF IL-10 PGE-2 IL-12 RANTES IL-13 MIF IL-12p40 GRO-.alpha. IL-10 RANTES IL-12 MIF IL-13 GRO-.alpha. IL-12p40 CRP IL-10 MIF IL-12 GRO-.alpha. IL-13 CRP IL-12p40 DDT IL-10 GRO-.alpha. IL-12 CRP IL-13 DDT IL-10 CRP IL-12 DDT IL-10 DDT IL-15 IL-16 IL-16 IL-17A IL-17A IL-18 IL-18 IL-1.alpha. IL-15 IL-17A IL-16 IL-18 IL-17A IL-1.alpha. IL-18 IL-1.beta. IL-15 IL-18 IL-16 IL-1.alpha. IL-17A IL-1.beta. IL-18 IL-2 IL-15 IL-1.alpha. IL-16 IL-1.beta. IL-17A IL-2 IL-18 IL-2ra IL-15 IL-1.beta. IL-16 IL-2 IL-17A IL-2ra IL-18 IL-3 IL-15 IL-2 IL-16 IL-2ra IL-17A IL-3 IL-18 IL-5 IL-15 IL-2ra IL-16 IL-3 IL-17A IL-5 IL-18 IL-6 IL-15 IL-3 IL-16 IL-5 IL-17A IL-6 IL-18 IL-7 IL-15 IL-5 IL-16 IL-6 IL-17A IL-7 IL-18 IL-9 IL-15 IL-6 IL-16 IL-7 IL-17A IL-9 IL-18 IP-10 IL-15 IL-7 IL-16 IL-9 IL-17A IP-10 IL-18 LIF IL-15 IL-9 IL-16 IP-10 IL-17A LIF IL-18 M-CSF IL-15 IP-10 IL-16 LIF IL-17A M-CSF IL-18 MIG IL-15 LIF IL-16 M-CSF IL-17A MIG IL-18 MIP-1.alpha. IL-15 M-CSF IL-16 MIG IL-17A MIP-1.alpha. IL-18 MIP-1.beta. IL-15 MIG IL-16 MIP-1.alpha. IL-17A MIP-1.beta. IL-18 PDGF-BB IL-15 MIP-1.alpha. IL-16 MIP-1.beta. IL-17A PDGF-BB IL-18 SDF-1.alpha. IL-15 MIP-1.beta. IL-16 PDGF-BB IL-17A SDF-1.alpha. IL-18 TNF-.alpha. IL-15 PDGF-BB IL-16 SDF-1.alpha. IL-17A TNF-.alpha. IL-18 TNF-.beta. IL-15 SDF-1.alpha. IL-16 TNF-.alpha. IL-17A TNF-.beta. IL-18 TRAIL IL-15 TNF-.alpha. IL-16 TNF-.beta. IL-17A TRAIL IL-18 VEGF IL-15 TNF-.beta. IL-16 TRAIL IL-17A VEGF IL-18 IL-8 IL-15 TRAIL IL-16 VEGF IL-17A IL-8 IL-18 MCP-1 IL-15 VEGF IL-16 IL-8 IL-17A MCP-1 IL-18 MGSA IL-15 IL-8 IL-16 MCP-1 IL-17A MGSA IL-18 PGE-2 IL-15 MCP-1 IL-16 MGSA IL-17A PGE-2 IL-18 RANTES IL-15 MGSA IL-16 PGE-2 IL-17A RANTES IL-18 MIF IL-15 PGE-2 IL-16 RANTES IL-17A MIF IL-18 GRO-.alpha. IL-15 RANTES IL-16 MIF IL-17A GRO-.alpha. IL-18 CRP IL-15 MIF IL-16 GRO-.alpha. IL-17A CRP IL-18 DDT IL-15 GRO-.alpha. IL-16 CRP IL-17A DDT IL-15 CRP IL-16 DDT IL-15 DDT IL-1.alpha. IL-1.beta. IL-1.beta. IL-2 IL-2 IL-2ra IL-2ra IL-3 IL-1.alpha. IL-2 IL-1.beta. IL-2ra IL-2 IL-3 IL-2ra IL-5 IL-1.alpha. IL-2ra IL-1.beta. IL-3 IL-2 IL-5 IL-2ra IL-6 IL-1.alpha. IL-3 IL-1.beta. IL-5 IL-2 IL-6 IL-2ra IL-7 IL-1.alpha. IL-5 IL-1.beta. IL-6 IL-2 IL-7 IL-2ra IL-9 IL-1.alpha. IL-6 IL-1.beta. IL-7 IL-2 IL-9 IL-2ra IP-10 IL-1.alpha. IL-7 IL-1.beta. IL-9 IL-2 IP-10 IL-2ra LIF IL-1.alpha. IL-9 IL-1.beta. IP-10 IL-2 LIF IL-2ra M-CSF IL-1.alpha. IP-10 IL-1.beta. LIF IL-2 M-CSF IL-2ra MIG IL-1.alpha. LIF IL-1.beta. M-CSF IL-2 MIG IL-2ra MIP-1.alpha. IL-1.alpha. M-CSF IL-1.beta. MIG IL-2 MIP-1.alpha. IL-2ra MIP-1.beta. IL-1.alpha. MIG IL-1.beta. MIP-1.alpha. IL-2 MIP-1.beta. IL-2ra PDGF-BB IL-1.alpha. MIP-1a IL-1.beta. MIP-1.beta. IL-2 PDGF-BB IL-2ra SDF-1.alpha. IL-1.alpha. MIP-1.beta. IL-1.beta. PDGF-BB IL-2 SDF-1.alpha. IL-2ra TNF-.alpha. IL-1.alpha. PDGF-BB IL-1.beta. SDF-1.alpha. IL-2 TNF-.alpha. IL-2ra TNF-.beta. IL-1.alpha. SDF-1.alpha. IL-1.beta. TNF-.alpha. IL-2 TNF-.beta. IL-2ra TRAIL IL-1.alpha. TNF-.alpha. IL-1.beta. TNF-.beta. IL-2 TRAIL IL-2ra VEGF IL-1.alpha. TNF-.beta. IL-1.beta. TRAIL IL-2 VEGF IL-2ra IL-8 IL-1.alpha. TRAIL IL-1.beta. VEGF IL-2 IL-8 IL-2ra MCP-1 IL-1.alpha. VEGF IL-1.beta. IL-8 IL-2 MCP-1 IL-2ra MGSA IL-1.alpha. IL-8 IL-1.beta. MCP-1 IL-2 MGSA IL-2ra PGE-2 IL-1.alpha. MCP-1 IL-1.beta. MGSA IL-2 PGE-2 IL-2ra RANTES IL-1.alpha. MGSA IL-1.beta. PGE-2 IL-2 RANTES IL-2ra MIF IL-1.alpha. PGE-2 IL-1.beta. RANTES IL-2 MIF IL-2ra GRO-.alpha. IL-1.alpha. RANTES IL-1.beta. MIF IL-2 GRO-.alpha. IL-2ra CRP IL-1.alpha. MIF IL-1.beta. GRO-.alpha. IL-2 CRP IL-2ra DDT IL-1.alpha. GRO-.alpha. IL-1.beta. CRP IL-2 DDT IL-1.alpha. CRP IL-1.beta. DDT IL-1.alpha. DDT IL-3 IL-5 IL-5 IL-6 IL-6 IL-7 IL-7 IL-9 IL-3 IL-6 IL-5 IL-7 IL-6 IL-9 IL-7 IP-10 IL-3 IL-7 IL-5 IL-9 IL-6 IP-10 IL-7 LIF IL-3 IL-9 IL-5 IP-10 IL-6 LIF IL-7 M-CSF IL-3 IP-10 IL-5 LIF IL-6 M-CSF IL-7 MIG IL-3 LIF IL-5 M-CSF IL-6 MIG IL-7 MIP-1.alpha. IL-3 M-CSF IL-5 MIG IL-6 MIP-1.alpha. IL-7 MIP-1.beta. IL-3 MIG IL-5 MIP-1.alpha. IL-6 MIP-1.beta. IL-7 PDGF-BB IL-3 MIP-1.alpha. IL-5 MIP-1.beta. IL-6 PDGF-BB IL-7 SDF-1.alpha. IL-3 MIP-1.beta. IL-5 PDGF-BB IL-6 SDF-1.alpha. IL-7 TNF-.alpha. IL-3 PDGF-BB IL-5 SDF-1.alpha. IL-6 TNF-.alpha. IL-7 TNF-.beta. IL-3 SDF-1.alpha. IL-5 TNF-.alpha. IL-6 TNF-.beta. IL-7 TRAIL IL-3 TNF-.alpha. IL-5 TNF-.beta. IL-6 TRAIL IL-7 VEGF IL-3 TNF-.beta. IL-5 TRAIL IL-6 VEGF IL-7 IL-8 IL-3 TRAIL IL-5 VEGF IL-6 IL-8 IL-7 MCP-1 IL-3 VEGF IL-5 IL-8 IL-6 MCP-1 IL-7 MGSA IL-3 IL-8 IL-5 MCP-1 IL-6 MGSA IL-7 PGE-2 IL-3 MCP-1 IL-5 MGSA IL-6 PGE-2 IL-7 RANTES IL-3 MGSA IL-5 PGE-2 IL-6 RANTES IL-7 MIF IL-3 PGE-2 IL-5 RANTES IL-6 MIF IL-7 GRO-.alpha. IL-3 RANTES IL-5 MIF IL-6 GRO-.alpha. IL-7 CRP IL-3 MIF IL-5 GRO-.alpha. IL-6 CRP IL-7 DDT IL-3 GRO-.alpha. IL-5 CRP IL-6 DDT IL-3 CRP IL-5 DDT IL-3 DDT IL-9 IP-10 IP-10 LIF LIF M-CSF M-CSF MIG IL-9 LIF IP-10 M-CSF LIF MIG M-CSF MIP-1.alpha. IL-9 M-CSF IP-10 MIG LIF MIP-1.alpha. M-CSF MIP-1.beta. IL-9 MIG IP-10 MIP-1.alpha. LIF MIP-1.beta. M-CSF PDGF-BB IL-9 MIP-1.alpha. IP-10 MIP-1.beta. LIF PDGF-BB M-CSF SDF-1.alpha. IL-9 MIP-1.beta. IP-10 PDGF-BB LIF SDF-1.alpha. M-CSF TNF-.alpha. IL-9 PDGF-BB IP-10 SDF-1.alpha. LIF TNF-.alpha. M-CSF TNF-.beta. IL-9 SDF-1.alpha. IP-10 TNF-.alpha. LIF TNF-.beta. M-CSF TRAIL IL-9 TNF-.alpha. IP-10 TNF-.beta. LIF TRAIL M-CSF VEGF IL-9 TNF-.beta. IP-10 TRAIL LIF VEGF M-CSF IL-8 IL-9 TRAIL IP-10 VEGF LIF IL-8 M-CSF MCP-1 IL-9 VEGF IP-10 IL-8 LIF MCP-1 M-CSF MGSA IL-9 IL-8 IP-10 MCP-1 LIF MGSA M-CSF PGE-2 IL-9 MCP-1 IP-10 MGSA LIF PGE-2 M-CSF RANTES IL-9 MGSA IP-10 PGE-2 LIF RANTES M-CSF MIF IL-9 PGE-2 IP-10 RANTES LIF MIF M-CSF CRP IL-9 RANTES IP-10 MIF LIF GRO-.alpha. M-CSF DDT IL-9 MIF IP-10 GRO-.alpha. LIF CRP IL-9 GRO-.alpha. IP-10 CRP LIF DDT
IL-9 CRP IP-10 DDT IL-9 DDT MIG MIP-1.alpha. MIP-1.alpha. MIP-1.beta. MIP-1.beta. PDGF-BB PDGF-BB SDF-1.alpha. MIG MIP-1.beta. MIP-1.alpha. PDGF-BB MIP-1.beta. SDF-1.alpha. PDGF-BB TNF-.alpha. MIG PDGF-BB MIP-1.alpha. SDF-1.alpha. MIP-1.beta. TNF-.alpha. PDGF-BB TNF-.beta. MIG SDF-1.alpha. MIP-1.alpha. TNF-.alpha. MIP-1.beta. TNF-.beta. PDGF-BB TRAIL MIG TNF-.alpha. MIP-1.alpha. TNF-.beta. MIP-1.beta. TRAIL PDGF-BB VEGF MIG TNF-.beta. MIP-1.alpha. TRAIL MIP-1.beta. VEGF PDGF-BB IL-8 MIG TRAIL MIP-1.alpha. VEGF MIP-1.beta. IL-8 PDGF-BB MCP-1 MIG VEGF MIP-1.alpha. IL-8 MIP-1.beta. MCP-1 PDGF-BB MGSA MIG IL-8 MIP-1.alpha. MCP-1 MIP-1.beta. MGSA PDGF-BB PGE-2 MIG MCP-1 MIP-1.alpha. MGSA MIP-1.beta. PGE-2 PDGF-BB RANTES MIG MGSA MIP-1.alpha. PGE-2 MIP-1.beta. RANTES PDGF-BB MIF MIG PGE-2 MIP-1.alpha. RANTES MIP-1.beta. MIF PDGF-BB GRO-.alpha. MIG RANTES MIP-1.alpha. MIF MIP-1.beta. GRO-.alpha. PDGF-BB CRP MIG MIF MIP-1.alpha. GRO-.alpha. MIP-1.beta. CRP PDGF-BB DDT MIG GRO-.alpha. MIP-1.alpha. CRP MIP-1.beta. DDT MIG CRP MIP-1.alpha. DDT MIG DDT SDF-1.alpha. TNF-.alpha. TNF-.alpha. TNF-.beta. TNF-.beta. TRAIL TRAIL VEGF SDF-1.alpha. TNF-.beta. TNF-.alpha. TRAIL TNF-.beta. VEGF TRAIL IL-8 SDF-1.alpha. TRAIL TNF-.alpha. VEGF TNF-.beta. IL-8 TRAIL MCP-1 SDF-1.alpha. VEGF TNF-.alpha. IL-8 TNF-.beta. MCP-1 TRAIL MGSA SDF-1.alpha. IL-8 TNF-.alpha. MCP-1 TNF-.beta. MGSA TRAIL PGE-2 SDF-1.alpha. MCP-1 TNF-.alpha. MGSA TNF-.beta. PGE-2 TRAIL RANTES SDF-1.alpha. MGSA TNF-.alpha. PGE-2 TNF-.beta. RANTES TRAIL MIF SDF-1.alpha. PGE-2 TNF-.alpha. RANTES TNF-.beta. MIF TRAIL GRO-.alpha. SDF-1.alpha. RANTES TNF-.alpha. MIF TNF-.beta. GRO-.alpha. TRAIL CRP SDF-1.alpha. MIF TNF-.alpha. GRO-.alpha. TNF-.beta. CRP TRAIL DDT SDF-1.alpha. GRO-.alpha. TNF-.alpha. CRP TNF-.beta. DDT SDF-1.alpha. CRP TNF-.alpha. DDT SDF-1.alpha. DDT VEGF IL-8 IL-8 MCP-1 MCP-1 MGSA MGSA PGE-2 VEGF MCP-1 IL-8 MGSA MCP-1 PGE-2 MGSA RANTES VEGF MGSA IL-8 PGE-2 MCP-1 RANTES MGSA MIF VEGF PGE-2 IL-8 RANTES MCP-1 MIF MGSA GRO-.alpha. VEGF RANTES IL-8 MIF MCP-1 GRO-.alpha. MGSA CRP VEGF MIF IL-8 GRO-.alpha. MCP-1 CRP MGSA DDT VEGF GRO-.alpha. IL-8 CRP MCP-1 DDT VEGF CRP IL-8 DDT VEGF DDT PGE-2 RANTES RANTES MIF MIF GRO-.alpha. GRO-.alpha. CRP PGE-2 MIF RANTES GRO-.alpha. MIF CRP GRO-.alpha. DDT PGE-2 GRO-.alpha. RANTES CRP MIF DDT PGE-2 CRP RANTES DDT PGE-2 DDT CRP DDT
[0177] In certain embodiments, the presence, level, or change in level of one or more, two or more, three or more, four or more, five or more, six or more, seven or more, eight or more, nine or more, ten or more, eleven or more, twelve or more, thirteen or more, fourteen or more, fifteen or more, sixteen or more, seventeen or more, eighteen or more, nineteen or more, twenty or more, twenty-one or more, twenty-two or more, twenty-three or more, twenty-four or more, twenty-five or more, twenty-six or more, twenty-seven or more, twenty-eight or more, twenty-nine or more or thirty or more proteins is detected or measured in a red blood cell-enriched sample and/or a red blood cell component.
[0178] In certain other embodiments, the presence of one or more proteins is detected, the level of one or more proteins is measured, or the change in level of one or more proteins is determined from a red blood cell-enriched sample or red blood cell component. In other embodiments, the presence of two or more proteins is detected, the level of two or more proteins is measured, or the change in level of two or more proteins is determined from a red blood cell-enriched sample or red blood cell component. In other embodiments, the presence of three or more proteins is detected, the level of three or more proteins is measured, or the change in level of three or more proteins is determined from a red blood cell-enriched sample or red blood cell component. In other embodiments, the presence of four or more proteins is detected, the level of four or more proteins is measured, or the change in level of four or more proteins is determined from a red blood cell-enriched sample or red blood cell component. In yet other embodiments, the presence of five or more proteins is detected, the level of five or more proteins is measured, or the change in level of five or more proteins is determined from a red blood cell-enriched sample or red blood cell component. In other embodiments, the presence of six or more proteins is detected, the level of six or more proteins is measured, or the change in level of six or more proteins is determined from a red blood cell-enriched sample or red blood cell component. In other embodiments, the presence of seven or more proteins is detected, the level of seven or more proteins is measured, or the change in level of seven or more proteins is determined from a red blood cell-enriched sample or red blood cell component. In still other embodiments, the presence of eight or more proteins is detected, the level of eight or more proteins is measured, or the change in level of eight or more proteins is determined from a red blood cell-enriched sample or red blood cell component. In other embodiments, the presence of nine or more proteins is detected, the level of nine or more proteins is measured, or the change in level of nine or more proteins is determined from a red blood cell-enriched sample or red blood cell component. In still other embodiments, the presence of ten or more proteins is detected, the level of ten or more proteins is measured, or the change in level of ten or more proteins is determined from a red blood cell-enriched sample or red blood cell component. In yet other embodiments, the presence of eleven or more proteins is detected, the level of eleven or more proteins is measured, or the change in level of eleven or more proteins is determined from a red blood cell-enriched sample or red blood cell component. In some embodiments, the presence of twelve or more proteins is detected, the level of twelve or more proteins is measured, or the change in level of twelve or more proteins is determined from a red blood cell-enriched sample or red blood cell component. In other embodiments, the presence of thirteen or more proteins is detected, the level of thirteen or more proteins is measured, or the change in level of thirteen or more proteins is determined from a red blood cell-enriched sample or red blood cell component. In yet other embodiments, the presence of fourteen or more proteins is detected, the level of fourteen or more proteins is measured, or the change in level of fourteen or more proteins is determined from a red blood cell-enriched sample or red blood cell component. In further embodiments, the presence of fifteen or more proteins is detected, the level of fifteen or more proteins is measured, or the change in level of fifteen or more proteins is determined from a red blood cell-enriched sample or red blood cell component. In other embodiments, the presence of sixteen or more proteins is detected, the level of sixteen or more proteins is measured, or the change in level of sixteen or more proteins is determined from a red blood cell-enriched sample or red blood cell component. In still other embodiments, the presence of seventeen or more proteins is detected, the level of seventeen or more proteins is measured, or the change in level of seventeen or more proteins is determined from a red blood cell-enriched sample or red blood cell component. In yet other embodiments, the presence of eighteen or more proteins is detected, the level of eighteen or more proteins is measured, or the change in level of eighteen or more proteins is determined from a red blood cell-enriched sample or red blood cell component. In other embodiments, the presence of nineteen or more proteins is detected, the level of nineteen or more proteins is measured, or the change in level of nineteen or more proteins is determined in a red blood cell-enriched sample. In still other embodiments, the presence of twenty or more proteins is detected, the level of twenty or more proteins is measured, or the change in level of twenty or more proteins is determined from a red blood cell-enriched sample or red blood cell component. In yet other embodiments, the presence of twenty-one or more proteins is detected, the level of twenty-one or more proteins is measured, or the change in level of twenty-one or more proteins is determined from a red blood cell-enriched sample or red blood cell component. In other embodiments, the presence of twenty-two or more proteins is detected, the level of twenty-two or more proteins is measured, or the change in level of twenty-two or more proteins is determined from a red blood cell-enriched sample or red blood cell component. In other embodiments, the presence of twenty-three or more proteins is detected, the level of twenty-three or more proteins is measured, or the change in level of twenty-three or more proteins is determined from a red blood cell-enriched sample or red blood cell component. In still other embodiments, the presence of twenty-four or more proteins is detected, the level of twenty-four or more proteins is measured, or the change in level of twenty-four or more proteins is determined from a red blood cell-enriched sample or red blood cell component. In yet other embodiments, the presence of twenty-five or more proteins is detected, the level of twenty-five or more proteins is measured, or the change in level of twenty-five or more proteins is determined from a red blood cell-enriched sample or red blood cell component. In still other embodiments, the presence of twenty-six or more proteins is detected, the level of twenty-six or more proteins is measured, or the change in level of twenty-six or more proteins is determined from a red blood cell-enriched sample or red blood cell component. In still other embodiments, the presence of twenty-seven or more proteins is detected, the level of twenty-seven or more proteins is measured, or the change in level of twenty-seven or more proteins is determined from a red blood cell-enriched sample or red blood cell component. In other embodiments, the presence of twenty-eight or more proteins is detected or the level or change in level of twenty-eight or more proteins is measure is detected, the level of twenty-eight or more proteins is measured, or the change in level of twenty-eight or more proteins is determined from a red blood cell-enriched sample or red blood cell component. In other embodiments, the presence of twenty-nine or more proteins is detected, the level of twenty-nine or more proteins is measured, or the change in level of twenty-nine or more proteins is determined from a red blood cell-enriched sample or red blood cell component. In still other embodiments, the presence of thirty or more proteins is detected, the level of thirty or more proteins is measured, or the change in level of thirty or more proteins is determined from a red blood cell-enriched sample or red blood cell component.
[0179] A protein profile may be produced or generated for example, by detecting the presence of one or more proteins in a lysate, cell wash, cell supernatant, or a combination thereof prepared according to one or more of the methods of the present disclosure. The protein(s) detected may also be quantified (e.g., levels measured) to produce or generate the protein profile. In other embodiments, a protein profile may be produced according to the methods provided herein by measuring the change in the level of one or more proteins, where the protein profile may comprise one or more proteins having a change in level and/or the measurement of the change in level of the one or more proteins.
[0180] Methods for the detection and/or quantification of proteins in single or mixed blood cell populations and plasma/serum are available to those of ordinary skill in the art. Non-limiting examples of suitable methods include antibody-based methods generally, flow cytometry, ELISA, lateral flow, immunostaining, immunofluorescence, immunoelectrophoresis (including, e.g., Western blot), and the like. Alternatively, proteins may be detected and/or quantified using mass spectrometry, spectroscopy, chromatography, electrophoresis, bicinchoninic acid assay (BCA), enzyme assay and the like. Again by way of example only, protein quantification methods are described in U.S. Pat. Nos. 7,501,286, 8,530,182, and United States Patent Publication Number 2013028838. Methodology is also presented in the Examples of the present specification.
[0181] The present disclosure also provides methods for producing a protein profile from a red blood cell-enriched sample or red blood cell component by calculating a protein ratio comprising the level of one or more proteins in red blood cells to the level of those same one or more proteins in plasma. The protein ratio maybe calculated by normalizing the measured protein concentration in the RBCs and the plasma and then dividing the concentration of the protein(s) in the RBCs by the concentration of the protein(s) in the plasma. The concentration of the protein(s) in the RBCs and plasma are normalized by calculating their relative concentration per millilitre in whole blood (e.g., percent in whole blood).
[0182] In certain embodiments, the protein ratio comprising the level of one or more proteins in red blood cells to the level of those one or more proteins in the plasma is at least 2:1, at least 10:1, at least 20:1, at least 30:1, at least 40:1, at least 50:1, at least 60:1, at least 70:1, at least 80:1, at least 90:1, at least 100:1, at least 110:1, at least 120:1, at least 130:1, at least 140:1, at least 150:1, at least 160:1, at least 170:1, at least 180:1, at least 190:1, or at least 200:1. In other embodiments, the protein ratio is at least 3:1, at least 4:1, at least 5:1, at least 6:1, at least 7:1, at least 8:1, at least 9:1, at least 10:1, at least 11:1, at least 12:1, at least 13:1, at least 14:1, at least 15:1, at least 16:1, at least 17:1, at least 18:1, at least 19:1, at least 20:1, at least 21:1, at least 22:1, at least 23:1, at least 24:1, at least 25:1, at least 26:1, at least 27:1, at least 28:1, at least 29:1, at least 30:1, at least 31:1, at least 32:1, at least 33:1, at least 34:1, at least 35:1, at least 36:1, at least 37:1, at least 38:1, at least 39:1 or at least 40:1.
Disease Profiling and Evaluation
[0183] The present disclosure provides methods herein for producing a disease protein profile in a blood sample (e.g., a whole blood sample or a red blood cell-enriched blood sample or red blood cell-enriched fraction). In certain embodiments, a disease profile may be produced for a disease or disorder for which there is a difference in the presence and/or levels of one or more proteins associated with a red blood cell-enriched sample or red blood cell component that has been contacted with protease inhibitors compared to a sample that has not been contacted with protease inhibitors. Alternatively or in addition, a disease protein profile may be produced for a disease or disorder for which there is a difference in the presence and/or levels of one or more proteins associated with a red blood cell-enriched sample or red blood cell component contacted with protease inhibitors from a subject having a disease or disorder compared to a red blood cell-enriched sample or red blood cell component (e.g., a sample contacted with protease inhibitors) from a subject not having a disease or disorder. In yet other embodiments, a disease protein profile may be produced for a disease or disorder for which there is a difference between the change in level of one or more proteins from a protein profile for a subject having a disease or disorder and the change in levels of the one or more proteins from a protein profile for a subject not having the disease or disorder. By way of non-limiting example, a disease profile maybe produced for a disease or disorder for which there is a difference in the presence or level of one or more of the proteins set out in Table 1 or one or more combinations of proteins set out in Table 2.
[0184] In certain embodiments, a disease protein profile(s) is produced by obtaining at least one protein profile according to the methods provided herein from one or more subjects having a disease or disorder and comparing the presence, level, or change in level of one of more proteins in red blood cell enriched samples that have and have not been contacted with protease inhibitors. In other embodiments, a disease protein profile(s) is produced by obtaining at least one protein profile from one or more subjects not having a disease or disorder according to the methods and comparing the presence or level of one of more proteins in the at least one protein profile obtained according to the methods from one or more subjects having a disease or disorder. In certain embodiments, at least one protein profile is obtained from a subject having a disease or disorder. In other embodiments, at least one profile is obtained from a subject not having the disease or disorder. In further embodiments, at least one protein profile is obtained from a subject having a disease or disorder and at least one protein profile is obtained from a subject not having the disease or disorder. In other embodiments, the blood samples are obtained from one or more subjects having a disease or disorder and pooled. In other embodiments, blood samples are obtained from one or more subjects not having the disease or disorder and pooled. A protein profile may be obtained according to the methods from the pooled blood samples of the one or more subjects having the disease or disorder and/or one or more subjects not having the disease or disorder. The protein profiles may be obtained at a time prior to determining the proteins that would comprise the disease protein profile by comparing the presence or level of one or more proteins in the protein profiles.
[0185] In some embodiments, a disease protein profile is comprised of one or more proteins that have a different presence, level, or change in level in a red blood cell-enriched sample or red blood cell component from a subject having a disease or disorder that has been contacted with protease inhibitors compared to a red blood cell-enriched sample or red blood cell component from the subject that has not been contacted with protease inhibitors. In other embodiments, a disease protein profile is produced according to the methods and comprises one or more proteins that have a different presence, level, or change in level in a red blood cell-enriched sample or red blood cell component from a subject having a disease or disorder compared to a red blood cell-enriched sample or red blood cell component from a subject not having a disease or disorder. One of skill in the art may determine whether a protein has a different (e.g., changed or altered) presence and/or level (e.g., higher or lower level), or different change in level (e.g., fold change) using an analysis that determines a statistically relevant difference in the presence and/or level of the proteins.
[0186] In certain embodiments, the disease protein profile comprises one or more proteins that are present in a blood sample (e.g., whole blood sample or red blood cell-enriched sample) or red blood cell component from a subject having a disease or disorder that has been contacted with one or more protease inhibitors that are not present in the blood sample from the subject that has not been contacted with protease inhibitors. In other embodiments, the disease protein profile comprises one or more proteins that are not present in a blood sample or red blood cell component from a subject having a disease or disorder that has been contacted with one or more protease inhibitors that are present in the blood sample or red blood cell component from the subject that has not been contacted with protease inhibitors. In other embodiments, the disease protein profile comprises one or more proteins that have a higher level in a blood sample or red blood cell component from a subject having a disease or disorder that has been contacted with protease inhibitors compared to a blood sample or red blood cell component from the subject that has not been contacted with protease inhibitors. In still other embodiments, the disease protein profile comprises one or more proteins that have a lower level in a blood sample or red blood cell component from a subject having a disease or disorder that has been contacted with protease inhibitors compared to a blood sample from the subject that has not been contacted with protease inhibitors.
[0187] In yet other embodiments, the disease protein profile produced according to the methods comprises one or more proteins that have a different change in level in a subject having a disease or disorder compared to a subject not having the disease or disorder. In other embodiments, the change in the level of the one or more proteins in a subject having the disease or disorder is an increase in level compared to a decrease in the level of the one or more proteins in a subject not having the disease or disorder. In still other embodiments, the change in the level of the one or more proteins in a subject having the disease or disorder is a decrease in level compared an increase in the level of the one or more proteins in a subject not having the disease or disorder. In other embodiments, the magnitude of the increase or decrease of the change in the level of one or more protein is larger in a subject having a disease or disorder compared to the magnitude of the increase or decrease in the change in level of the one or more proteins in a subject not having the disease or disorder. In other embodiments, the magnitude of the increase or decrease of the change in level of the one or more protein is smaller in a subject having a disease or disorder compared to the magnitude of the increase in the change of level of the one or more proteins in a subject not having the disease or disorder. In other embodiments, there is no significant change in the level of the one or more proteins in a subject having a disease or disorder compared to the change in the level of the one or more proteins in a subject not having the disease or disorder. In yet other embodiments, there is no significant change in the level of the one or more proteins in a subject not having a disease or disorder compared to the change in the level of the one or more proteins in a subject having the disease or disorder.
[0188] In other embodiments, the disease protein profile comprises combinations of the foregoing--for example, it comprises one or more proteins that have a higher level and one or more proteins that have a lower level in a blood sample or red blood cell component from a subject having a disease or disorder that has been contacted with protease inhibitors compared to the level of those one or more proteins in a blood sample or red blood cell component from the subject that has not been contacted with protease inhibitors. In certain embodiments, a disease protein profile comprises one or more proteins that have a different level in a blood sample or red blood cell component from a subject having a disease or disorder that has been contacted with protease inhibitors compared to the level of those one or more proteins in a blood sample or red blood cell component from the subject that has not been contacted with protease inhibitors.
[0189] In other embodiments, the disease protein profile comprises one or more proteins that are present in a subject having a disease or disorder but not present in a subject not having the disease or disorder. In other embodiments, the disease protein profile comprises one or more proteins that are not present in a subject having a disease or disorder but are present in a subject not having the disease or disorder. In some other embodiments, the disease protein profile comprises one or more proteins that have a higher level in a subject having a disease or disorder compared to the one or more proteins in a subject not having the disease or disorder. In yet other embodiments, the disease protein profile comprises one or more proteins that have a lower level in a subject having a disease or disorder compared to the one or more proteins in a subject not having a disease or disorder. In still other embodiments, the disease protein profile comprises combinations of the foregoing--for instance, one or more proteins having a higher level and one or more proteins having a lower level in a subject having a disease or disorder compared to the one or more proteins in a subject not having the disease or disorder. In certain embodiments, a disease protein profile comprises one or more proteins that have a different level in a subject having a disease or disorder compared to the one or more proteins in a subject not having the disease or disorder. In still other embodiments, a disease protein profile comprises one or more proteins that have a different change in level in a subject having a disease or disorder compared to the change in level of the one or more proteins in a subject not having a disease or disorder.
[0190] In certain embodiments, the disease protein profile is a cancer protein profile comprising one or more proteins selected from the group consisting of IL-6, IFN-.gamma., IL-4, IL-13, MIF, Eotaxin, RANTES, IL-7, IP-10, PDGF, and IL-12p40. In other embodiments, the disease protein profile is a preeclampsia protein profile comprising one or more proteins selected from the group consisting of IL-10, IL-8, TNF-.alpha., IL-1ra, MCP-1, G-CSG, GM-CSF, IL-6, IFN.alpha.2, IL-1a, IL-18, MIF, IL-2ra, and HGF.
[0191] The present disclosure also provides methods for determining whether a subject has a disease or disorder using a disease protein profile produced by the methods provided herein. At least one protein profile may be obtained from a subject that has been produced by one of the methods provided herein. The protein profile(s) of the subject may be compared to a disease protein profile produced by the methods provided herein for similarities between the two protein profiles (in, e.g., protein presence, protein levels, or change in protein levels). Similarities between a subject's protein profile and a disease protein profile may indicate that the subject has the disease or disorder. In certain embodiments, there are similarities between at least one protein, at least two proteins, at least three proteins, at least four proteins, at least five proteins, at least six proteins, at least seven proteins, at least eight proteins, at least nine proteins, at least ten proteins, at least eleven proteins, at least twelve proteins, at least thirteen proteins, at least fourteen proteins, at least fifteen proteins, at least sixteen proteins, at least seventeen proteins, at least eighteen proteins, at least nineteen proteins, at least twenty proteins, at least twenty-one proteins, at least twenty-two proteins, at least twenty-three proteins, at least twenty-four proteins, at least twenty-five proteins, at least twenty-six proteins, at least twenty-seven proteins, at least twenty-eight proteins, at least twenty-nine proteins, or at least thirty proteins in the subject's protein profile compared to the disease protein profile. In other embodiments, there are similarities between at least one protein in the subject's protein profile compared to at least one protein in the disease protein profile. In yet other embodiments, there are similarities between at least 3 proteins in the subject's protein profile compared to the disease protein profile. In still other embodiments, there are similarities between at least 5 proteins in the subject's protein profile compared to the disease protein profile. In still other embodiments, there are similarities between at least 10 proteins in the subject's protein profile compared to the disease protein profile. In yet other embodiments, there are similarities between at least 15 proteins in the subject's protein profile compared to the disease protein profile. In other embodiments, there are similarities between at least 20 proteins in the subject's protein profile compared to the disease protein profile. In other embodiments, there are similarities between at least 30 proteins in the subject's protein profile compared to the disease protein profile.
[0192] In certain embodiments, a subject's protein profile and a disease protein profile have the same or similar presence, level, or change in level, indicating that the subject may have the disease or disorder. The same or substantially the same level or change in level of one or more proteins may range from, for example, protein levels that are the same (e.g., within a relevant statistical analysis as determined by one of skill in the art) to protein levels less than those determined to be different by a person of ordinary skill in the art by, for example, a statistical analysis or a threshold fold difference (e.g., protein levels less than two-fold different). In some embodiments, the level or change in level of one or more proteins of a subject's protein profile and a disease protein profile are the same. In yet other embodiments, the level or change in level of one or more proteins of a subject's protein profile and a disease protein profile are substantially similar. In other embodiments, the difference in the level or change in level of one or more proteins of a subject's protein profile and a disease protein profile is substantially similar as determined by statistical methods available to one skilled in the art (e.g., a Student's T-test with a p-value of 0.05 or less). In yet other embodiments, the difference in the level of one or more proteins of a subject's protein profile and a disease protein profile is determined by comparison to a predetermined reference range (e.g., a healthy or normal concentration range of the proteins) available to those of skill in the art or determined by one of skill in the art. In other embodiments, the level of one or more proteins of a subject's protein profile and a disease protein profile is less than 0.5 fold different. In certain other embodiments, the level of one or more proteins of a subject's protein profile and a disease protein profile is less than 1-fold different. In yet other embodiments, the level of one or more proteins of a subject's protein profile and a disease protein profile is less than 1.5-fold different. In still other embodiments, the level of one or more proteins of a subject's protein profile and a disease protein profile is less than 2-fold different.
[0193] In other embodiments, a subject's protein profile and a disease protein profile have a different presence, level, or change in level of proteins, indicating that the subject does not have the disease or disorder. In certain embodiments, a subject's protein profile and a disease protein profile comprise one or more different proteins. In other embodiments, a subject's protein profile and a disease protein profile have a different or substantially different level of one or more proteins. The different or substantially different level or change in level of one or more proteins may range from, for example, protein levels that are different (e.g., not within a relevant statistical analysis as determined by one of skill in the art) to protein levels that are more than those determined to be similar by a person of ordinary skill in the art by, for example, a statistical analysis or a threshold fold difference (e.g., proteins levels more than two-fold different). In some embodiments, the level or change in level of one or more proteins of a subject's protein profile and a disease protein profile are different. In yet other embodiments, the level or change in level of one or more proteins of a subject's protein profile and a disease protein profile are substantially different. In other embodiments, the difference in the level or change in level of one or more proteins of a subject's protein profile and a disease protein profile is substantially different as determined by statistical methods available to one skilled in the art (e.g., a Student's T-test with a p-value of 0.05 or higher). In yet other embodiments, the difference in the level or change in level of one or more proteins of a subject's protein profile and a disease protein profile is determined by comparison to a predetermined reference range (e.g., a healthy or normal concentration range of the proteins) available to those of skill in the art or determined by one of skill in the art. In certain embodiments, the level or change in level of one or more proteins of a subject's protein profile and a disease protein profile is between 0-fold and 5-fold different. In other embodiments, the level or change in level of one or more proteins of a subject's protein profile and a disease protein profile is more than 0.5 fold different. In other embodiments, the level or change in level of one or more proteins of a subject's protein profile and a disease protein profile is more than 1.0 fold different. In certain other embodiments, the level or change in level of one or more proteins of a subject's protein profile and a disease protein profile is more than 1.5-fold different. In yet other embodiments, the level or change in level of one or more proteins of a subject's protein profile and a disease protein profile is more than 2.0-fold different. In still other embodiments, the level or change in level of one or more proteins of a subject's protein profile and a disease protein profile is more than 2.5-fold different. In other embodiments, the level or change in level of one or more proteins of a subject's protein profile and a disease protein profile is more than 3.0-fold different. In other embodiments, the level or change in level of one or more proteins of a subject's protein profile and a disease protein profile is more than 3.5 fold different. In still other embodiments, the level or change in level of one or more proteins of a subject's protein profile and a disease protein profile is more than 4.0 fold different. In further embodiments, the level or change in level of one or more proteins of a subject's protein profile and a disease protein profile is more than 4.5 fold different. In other embodiments, the level or change in level of one or more proteins of a subject's protein profile and a disease protein profile is more than 5.0 fold different.
Treatment Evaluation
[0194] The present disclosure also provides methods for monitoring treatment in a subject using a protein profile produced by the methods provided herein. In certain embodiments a protein profile produced according to the methods provided herein is obtained from a subject before treatment and after treatment and the protein profiles compared for differences between the two (in, e.g., protein presence, levels, or change in levels). In other embodiments, a protein profile produced according to the methods provided herein is obtained from a subject before treatment and during treatment and the protein profiles compared for differences between the two. In still other embodiments, a protein profile produced according to the methods provided herein is obtained from a subject during treatment and after treatment and the protein profiles compared for differences between the two. In other embodiments, a protein profile produced according to the methods provided herein is obtained from a subject after treatment completion and at subsequent time after treatment completion and the protein profiles compared for differences between the two.
[0195] In certain embodiments, the subject receiving treatment may be undergoing one or more treatments or a number of treatments. In other embodiments, the subject has received and/or is receiving a particular treatment. In certain embodiments, the protein profile obtained before treatment may be obtained from a subject who has had no treatment and is compared to the protein profile of the subject after treatment. In other embodiments, a protein profile is obtained during the course of a treatment where at least one protein profile of the subject obtained at one point in time during the treatment is compared to at least one protein profile of the subject obtained at a different point in time during the treatment. In certain embodiments, the protein profiles before treatment and after treatment are obtained from a subject that is undergoing the same treatment during the course of a treatment. In other embodiments, the protein profiles before treatment and after treatment are obtained from a subject that is undergoing a different treatment during the course of a treatment (e.g., a subject that has switched treatments). Differences between a subject's protein profile (e.g., protein presence, levels, or change in levels) obtained before treatment compared to the subject's protein profile after treatment may indicate that the treatment has had an effect on the subject. Differences between a subject's protein profiles obtained at different points in time during treatment may indicate that the treatment has had an effect on the subject. Differences between a subject's protein profiles obtained during and after treatment may indicate that the treatment has had an effect on the subject.
[0196] In certain embodiments, there are differences between at least one protein, at least two proteins, at least three proteins, at least four proteins, at least five proteins, at least six proteins, at least seven proteins, at least eight proteins, at least nine proteins, at least ten proteins, at least eleven proteins, at least twelve proteins, at least thirteen proteins, at least fourteen proteins, at least fifteen proteins, at least sixteen proteins, at least seventeen proteins, at least eighteen proteins, at least nineteen proteins, at least twenty proteins, at least twenty-one proteins, at least twenty-two proteins, at least twenty-three proteins, at least twenty-four proteins, at least twenty-five proteins, at least twenty-six proteins, at least twenty-seven proteins, at least twenty-eight proteins, at least twenty-nine proteins, or at least thirty proteins in the protein profiles before and after treatment.
[0197] In certain embodiments, there are differences between at least one protein in the protein profile before treatment compared to the protein profile after treatment. In yet other embodiments, there are differences between at least 3 proteins in the protein profile before treatment compared to the protein profile after treatment. In still other embodiments, there are differences between at least 5 proteins in the protein profiles before treatment compared to the protein profile after treatment. In still other embodiments, there are differences between at least 10 proteins in the protein profiles before treatment compared to the protein profiles after treatment. In yet other embodiments, there are differences between at least 15 proteins in the protein profiles before treatment compared to the protein profiles after treatment. In other embodiments, there are differences between at least 20 proteins in the protein profiles before treatment compared to the protein profiles after treatment. In other embodiments, there are differences between at least 30 proteins in the protein profiles before treatment compared to the protein profiles after treatment. In certain embodiments, there are differences between at least one protein in the protein profile at one point in time during treatment compared to the protein profile at another point in time during treatment. In yet other embodiments, there are differences between at least 3 proteins in the protein profile at one point in time during treatment compared to the protein profile at another point in time during treatment. In still other embodiments, there are differences between at least 5 proteins in the protein profiles at one point in time during treatment compared to the protein profile at another point in time during treatment. In still other embodiments, there are differences between at least 10 proteins in the protein profiles at one point in time during treatment compared to the protein profile at another point in time during treatment. In yet other embodiments, there are differences between at least 15 proteins in the protein profiles at one point in time during treatment compared to the protein profile at another point in time during treatment. In other embodiments, there are differences between at least 20 proteins in the protein profiles at one point in time during treatment compared to the protein profile at another point in time during treatment. In other embodiments, there are differences between at least 30 proteins in the protein profiles at one point in time during treatment compared to the protein profile at another point in time during treatment. In certain other embodiments, there are differences between at least one protein in the protein profile during treatment compared to the protein profile after treatment. In yet other embodiments, there are differences between at least 3 proteins in the protein profile during treatment compared to the protein profile after treatment. In still other embodiments, there are differences between at least 5 proteins in the protein profiles during treatment compared to the protein profile after treatment. In still other embodiments, there are differences between at least 10 proteins in the protein profiles during treatment compared to the protein profiles after treatment. In yet other embodiments, there are differences between at least 15 proteins in the protein profiles during treatment compared to the protein profiles after treatment. In other embodiments, there are differences between at least 20 proteins in the protein profiles during treatment compared to the protein profiles after treatment. In other embodiments, there are differences between at least 30 proteins in the protein profiles during treatment compared to the protein profiles after treatment.
[0198] In certain embodiments, a subject's protein profile obtained before treatment comprises different protein(s) than the protein profile obtained after treatment, indicating that the treatment may have had an effect on the subject. In other embodiments, a subject's protein profile obtained before treatment has different levels of one or more proteins compared to the protein profile obtained after treatment, indicating that the treatment may have had an effect on the subject. The difference in levels of the one or more proteins may be appropriately determined by one of skill in the art as previously described (e.g., using a statistical analysis or measuring and comparing protein levels to determine a statistically significant difference in protein presence or levels). The different levels of one or more proteins may include, for example, levels that are greater than a 1-fold difference. In certain embodiments, the difference in the level of one or more proteins of a subject's protein profile before and after treatment is greater than 1-fold, greater than 1.5 fold, greater than 2-fold, greater than 2.5 fold, greater than 3-fold, greater than 3.5-fold, greater than 4-fold, greater than 4.5 fold, greater than 5-fold, greater than 5.5 fold, greater than 6-fold, greater than 6.5-fold, greater than 7-fold, greater than 7.5-fold, greater than 8-fold, greater than 8.5-fold, greater than 9-fold, greater than 9.5-fold, or greater than 10-fold. In some embodiments, the difference in the level of one or more proteins of a subject's protein profile before and after treatment is greater than 1.5-fold. In other embodiments, the difference in the level of one or more proteins of a subject's protein profile before and after treatment is greater than 2-fold. In other embodiments, the difference in the level of one or more proteins of a subject's protein profile before and after treatment is greater than 2.5-fold. In still other embodiments, the difference in the level of one or more proteins of a subject's protein profile before and after treatment is greater than 3-fold. In still other embodiments, the difference in the level of one or more proteins of a subject's protein profile before and after treatment is greater than 4-fold. In other embodiments, the difference in the level of one or more proteins of a subject's protein profile before and after treatment is greater than 5-fold. In other embodiments, the difference in the level of one or more proteins of a subject's protein profile before and after treatment is greater than 6-fold. In still other embodiments, the difference in the level of one or more proteins of a subject's protein profile before and after treatment is greater than 7-fold. In other embodiments, the difference in the level of one or more proteins of a subject's protein profile before and after treatment is greater than 8-fold. In yet other embodiments, the difference in the level of one or more proteins of a subject's protein profile before and after treatment is greater than 9-fold. In still other embodiments, the difference in the level of one or more proteins of a subject's protein profile before and after treatment is greater than 10-fold.
[0199] In certain embodiments, a small volume blood sample is obtained to produce the protein profiles before treatment and after treatment in order to monitor treatment of a subject. A small volume blood sample allows the subject to be sampled frequently and, consequently, allows for treatment monitoring at a frequency not previously achievable. In some embodiments, a small volume blood sample may be obtained at a frequency of one or more times per day, two or more times per day, three or more times per day, four or more times per day, or five or more times per day. In other embodiments, a small volume blood sample is obtained one or more times per week, two or more times per week, three or more times per week, four or more times per week, five or more times per week, six or more times per week, or seven or more times per week. In other embodiments, a small volume blood sample is obtained daily. In still other embodiments, a small volume blood sample is obtained once a week, once every two weeks, once every three weeks, or once every four weeks. In certain embodiments, a small volume blood sample is obtained once a month.
[0200] The present disclosure also provides methods for determining the effectiveness of a treatment in a subject using protein profiles produced by the methods provided herein. In certain embodiments, at least one protein profile is obtained from a subject that has undergone a treatment. In other embodiments, at least one protein profile is obtained from a subject that has not undergone a treatment and the at least one protein profile of the subject that has undergone treatment is compared to the at least one protein profile of the subject that has not undergone treatment. In other embodiments, the protein profile is produced using blood samples obtained from one or more subjects who have not undergone treatment and the blood samples are pooled. In other embodiments, a protein profile is produced using one or more blood samples obtained from a subject who has undergone treatment and the blood samples are pooled. A protein profile may be obtained from the pooled blood samples of the one or more subjects that have not undergone treatment and/or the one or more blood samples from a subject that has not undergone treatment. In other embodiments, one or more protein profiles are obtained from one or more subjects that have not undergone treatment and/or one or more protein profiles are obtained from a subject that has undergone treatment, and a statistical analysis is performed by means available in the art to determine the proteins that will comprise (by statistically significant difference in presence and/or level) the protein profile of a subject that has not undergone treatment and/or a reference range from healthy individual(s) is compared to the protein profile of a subject that has undergone treatment. The protein profile of a subject that has undergone a treatment and the protein profile of a subject that has not undergone a treatment may be produced at a time prior to comparison of the two protein profiles.
[0201] Similarities in the presence, level, or change in level of one or more proteins between the protein profile of the subject that has undergone treatment, compared to the protein profile of the subject that has not undergone treatment may indicate the effectiveness of the treatment. In certain embodiments, there are similarities between at least one protein, at least two proteins, at least three proteins, at least four proteins, at least five proteins, at least six proteins, at least seven proteins, at least eight proteins, at least nine proteins, at least ten proteins, at least eleven proteins, at least twelve proteins, at least thirteen proteins, at least fourteen proteins, at least fifteen proteins, at least sixteen proteins, at least seventeen proteins, at least eighteen proteins, at least nineteen proteins, at least twenty proteins, at least twenty-one proteins, at least twenty-two proteins, at least twenty-three proteins, at least twenty-four proteins, at least twenty-five proteins, at least twenty-six proteins, at least twenty-seven proteins, at least twenty-eight proteins, at least twenty-nine proteins, or at least thirty proteins. In other embodiments, there are similarities between at least one protein. In yet other embodiments, there are similarities between at least 3 proteins. In still other embodiments, there are similarities between at least 5 proteins. In still other embodiments, there are similarities between at least 10 proteins. In yet other embodiments, there are similarities between at least 15 proteins. In other embodiments, there are similarities between at least 20 proteins. In other embodiments, there are similarities between at least 30 proteins.
[0202] In certain embodiments, the protein profile of a subject that has undergone treatment and the protein profile of a subject that has not undergone treatment have the same one or more proteins present, indicating that the treatment may have been effective. In other embodiments, the protein profile of a subject that has undergone treatment and the protein profile of a subject that has not undergone treatment have the same or substantially similar level or change in level of one or more proteins, indicating that the treatment may have been effective. The same or substantially similar level or change in level of one or more proteins may include, for example, protein level or change in level that are the same (e.g., within a relevant statistical analysis as determined by one of skill in the art) to protein levels that are determined to be sufficiently different by a person of ordinary skill in the art by, for example, a statistical analysis or a determined threshold fold difference (e.g., less than a two-fold difference). In some embodiments, the level or change in level of one or more proteins of the protein profile of a subject that has undergone treatment and the protein profile of a subject that has not undergone treatment are the same. In yet other embodiments, the level or change in level of one or more proteins of the protein profile of a subject that has undergone treatment and the protein profile of a subject that has not undergone treatment are substantially similar. In other embodiments, the difference in the level or change in level of one or more proteins of the protein profile of a subject that has undergone treatment and the protein profile of a subject that has not undergone treatment is determined by statistical methods available to one skilled in the art (e.g., a Student's T-test with a p-value of 0.05 of less). In yet other embodiments, the difference in the level or change in level of one or more proteins of the protein profile of a subject that has undergone treatment and the protein profile of a subject that has not undergone treatment is determined by comparison to a predetermined reference range (e.g., a healthy or normal concentration range) available to those of skill in the art or determined by one of skill in the art. In other embodiments, the level or change in level of one or more proteins of the protein profile of a subject that has undergone treatment and the protein profile of a subject that has not undergone treatment is less than 0.5 fold different. In other embodiments, the level or change in level of one or more proteins of the protein profile of a subject that has undergone treatment and the protein profile of a subject that has not undergone treatment is less than 1-fold different. In still other embodiments, the level or change in level of one or more proteins of the protein profile of a subject that has undergone treatment and the protein profile of a subject that has not undergone treatment is less than 1.5-fold different. In still other embodiments, the level or change in level of one or more proteins of the protein profile of a subject that has undergone treatment and the protein profile of a subject that has not undergone treatment is less than 2-fold different.
Subjects
[0203] Certain embodiments relate to determining the protein profile of a blood sample or component thereof from a subject.
[0204] The subject may be an animal in which blood comprises red blood cells (e.g., a mammal, bird, fish, reptile, or amphibian). Non-limiting examples of suitable subjects include bovine, equine, ovine, primate, avian and rodent species. Hence, in some embodiments, the subject may be a human or a non-human animal. In other embodiments, the subject may be a mouse, rat, hamster, ferret, gerbil, rabbit, monkey, chimpanzee, horse, pony, donkey, sheep, pig, chicken, goat, cat, or dog.
Kits
[0205] The present disclosure also provides kits comprising the components necessary for carrying out the methods described herein.
[0206] By way of non-limiting example, the kits may comprise means for: collecting blood, inhibiting proteases, preventing blood coagulation, stabilising blood, enriching RBCs, obtaining red blood cell components, the removal/separation of non-RBCs blood components, snap-freezing blood or component(s) thereof, lysing cells, washing cells, culturing cells, detecting specific target protein(s) intracellularly and/or extracellularly, measuring the level of specific proteins, and/or combinations thereof. In certain embodiments, the kits comprise at least one reagent to leukodeplete a blood sample and produce a red blood cell-enriched sample and at least one reagent to detect the presence or measure the level of one or more proteins in a small volume red blood cell-enriched sample. In certain embodiments, the reagent to detect the presence or measure the level of one or more proteins is an ELISA apparatus. In other embodiments, the kit further comprises at least one reagent to obtain a blood sample from a subject.
[0207] In some embodiments, kits according to the present disclosure may comprise one or more of the following: device(s) for obtaining a blood sample from a subject (e.g., a syringe, needle, butterfly needle, tube, needle holder, blood collection set, transfer device, vacutainer, hemaPEN.TM.), device(s) for obtaining a dried blood sample from a subject (e.g., filter paper, cards, HemaSpot.TM.); device(s) for obtaining a red blood cell fraction, a leukocyte fraction, and/or a platelet fraction from a liquid blood sample (e.g., antibody coated magnetic beads); protease inhibitors; anticoagulants; protein denaturation agents; and the like and combinations thereof.
EXAMPLES
[0208] The present disclosure will now be described with reference to specific example(s), which should not be construed as in any way limiting.
Example 1. Measurement of Protein Levels in a Small Blood Volume
[0209] The discovery of a high level of various proteins in red blood cells as compared to their levels in an equivalent volume in plasma, for example, suggested that a small volume of whole blood and/or RBCs may be used to identify protein markers. The levels of numerous proteins were analyzed in a small volume of whole blood and RBCs.
[0210] Whole blood was collected from healthy volunteers by finger prick (n=1) directly into EDTA solution (3 mg/mL). For multiplex analysis (BioPlex analysis) the samples were stored at -80.degree. C. and were subjected to 3 freeze-thaw cycles at -80.degree. C. to ensure complete cellular lysis prior to analysis. The red blood cells were subjected to 3 freeze-thaw cycles to ensure complete cellular lysis. Following lysis, the whole blood was analysed on the multiplex cytokine assay at 5 .mu.L whole blood (in 45 .mu.L PBS), 10 .mu.L whole blood (in 40 .mu.L PBS), 15 .mu.L whole blood (in 35 .mu.L PBS), 20 .mu.L whole blood (in 30 .mu.L, PBS), or 25 .mu.L whole blood (in 25 .mu.L PBS). Two multiplex assays were utilised. The first was the 27-plex human cytokine panel that assays for FGF basic, Eotaxin, G-CSF, GM-CSF, IFN-.gamma., IL-1.beta., IL-1ra, IL-2, IL-4, IL-5, IL-6, IL-7, IL-8, IL-9, IL-10, IL-12(p70), IL-13, IL-15, IL-17, IP-10, MCP-1, MIP-1.alpha., MIP-1.beta., PDGF-BB, RANTES, TNF-.alpha., and VEGF, and the second was the 21-plex human cytokine panel that assays for IL-1.alpha., IL-2Ra, IL-3, IL-12, IL-16, IL-18, CTACK, GRO-.alpha., HGF, IFN-.alpha.2, LIF, MCP-3, M-CSF, MIF, MIG, .beta.-NGF, SCF, SCGF-.beta., SDF-1.alpha., TNF-.beta., TRAIL (Bio-Plex Pro 27-plex and 21-plex, Bio-Rad). The assays were performed according to manufacturer's instructions using an automated magnetic wash station (BioPlex Pro II, Bio-Rad) for the washing steps. The assays were run on the Luminex.RTM. 200.TM. system (Bio-Rad) and fluorescent values were collected. The calibration curve for each cytokine was analysed with 5 parametric logistic curve regression using BioPlex manager software (ver. 5.0, Bio-Rad, USA).
[0211] The concentration of the indicated proteins in whole blood at various dilutions (1:10, 1:5, 1:3.3, 1:2.5, 1:2) are shown in FIG. 1A-1TT (calculated back to the undiluted concentration). Analysis of whole blood revealed the presence of a number of proteins and these proteins were also present at a range of dilutions. However, there was no dilution linearity for many of the analysed proteins, which is not unique to whole blood; it is also observed in the analysis of plasma on Luminex platforms such as BioPlex (more protein is typically detected with dilution). The results indicate that proteins may be monitored in small volumes of whole blood (down to 5 .mu.L). The ease of detection of numerous proteins in whole blood demonstrates that very small blood volumes (obtained from e.g., the fingertip) could be collected and used for analysis of protein levels.
Example 2. Presence of Proteins in Fingertip Versus Venous Blood Samples
[0212] To further explore the detection of proteins in small blood volumes, the levels of numerous proteins in a finger prick was compared to their levels in venous blood collected by available methods.
[0213] Whole blood was collected from healthy volunteers by venipuncture or by finger prick (n>12) directly into EDTA vacutainers (k.sub.2EDTA vacutainers, BD Biosciences) or EDTA solution (3 mg/mL). The fractions of blood were collected and processed at room temperature within 4 hours of collection. For multiplex analysis (BioPlex analysis) the samples were stored at -80.degree. C. and were subjected to 3 freeze-thaw cycles at -80.degree. C. to ensure complete cellular lysis prior to analysis. The plasma and red blood cells were isolated using dextran sedimentation as follows. Whole blood was centrifuged (1500 g, 10 minutes) and the upper plasma layer was collected. The remaining cell pellet was resuspended in an equal volume of sodium chloride (0.15 M). Dextran (6% w/v in 0.15 M sodium chloride) was then added to this cellular suspension at a 1:4 ratio (dextran:cell suspension). This solution was left at room temperature for 30 minutes for red blood cell sedimentation to the bottom of the tube. After this time the upper white blood cell rich layer was discarded and the lower red blood cell fraction was isolated. The red blood cell fraction was washed twice in phosphate buffered saline (PBS, 500 g, 5 minutes) and the remaining red blood cell pellet was counted (Coulter Act Diff, Beckman Coulter) and then frozen (-80.degree. C.) until analysis.
[0214] The red blood cells were subjected to 3 freeze-thaw cycles to ensure complete cellular lysis. Following lysis, the red blood cell lysates were diluted in PBS to the equivalent of 400 million cells/mL. These lysates were then analysed on the multiplex cytokine assay. One multiplex assay was utilised. It was the 27-plex human cytokine panel that assays for FGF basic, Eotaxin, G-CSF, GM-CSF, IFN-.gamma., IL-1.beta., IL-1ra, IL-2, IL-4, IL-5, IL-6, IL-7, IL-8, IL-9, IL-10, IL-12(p70), IL-13, IL-15, IL-17, IP-10, MCP-1, MIP-1.alpha., MIP-1.beta., PDGF-BB, RANTES, TNF-.alpha., and VEGF (Bio-Plex Pro 27-plex, Bio-Rad). The assays were performed according to manufacturer's instructions using an automated magnetic wash station (BioPlex Pro II, Bio-Rad) for the washing steps. The assays were run on the Luminex.RTM. 200.TM. system (Bio-Rad) and fluorescent values were collected. The calibration curve for each cytokine was analysed with 5 parametric logistic curve regression using BioPlex manager software (ver. 5.0, Bio-Rad, USA).
[0215] The concentration of the indicated proteins in the plasma isolated from venous blood and fingertip blood, or the lysate of red blood cells isolated from venous blood and fingertip blood are depicted in FIG. 2A-2AA. Significant differences (p<0.05) were determined using Student T-tests. There were consistent trends between levels of proteins in the plasma and the red blood cells when fingertip blood and venous blood were compared. For example, the concentration of IL-6 was at a significantly higher concentration in the plasma isolated from the fingertip as opposed to that in venous plasma. This same trend was observed with the red blood cells, with significantly higher levels of proteins observed in the cells isolated from fingertip blood. This trend was observed for a number of proteins including, for example, IL-2, RANTES, and IP-10. For a number of proteins, higher concentrations were observed in the plasma and red blood cells isolated from fingertip blood, including, for instance, IL-1.beta., IL-8, and TNF-.alpha..
[0216] For the red blood cells, the biological variation (standard deviation) was lower in the fingertip samples than the venous samples (e.g., MIP-1.beta., G-CSF). This suggested that analysis of the red blood cells collected from the fingertip would be more reproducible than analysis of venous blood. The opposite was observed for a number of proteins in plasma, where venous plasma was less variable than the fingertip blood (e.g., IL-7, PDGF-bb). These results supported the case for isolating and analysing red blood cells from the fingertip, where frequent blood collection may be used.
Example 3. Protein Profile in RBCs Using Cationic Salts
[0217] Red blood cells were isolated using dextran sedimentation as follows. Whole blood was centrifuged (1500 g, 10 minutes) and the upper plasma layer was discarded. The remaining cell pellet was resuspended in an equal volume of sodium chloride (0.15 M). Dextran (6% w/v in 0.15 M sodium chloride) was then added to this cellular suspension at a 1:4 ratio (dextran:cell suspension). This solution was left at room temperature for 30 minutes for red blood cell sedimentation to the bottom of the tube. After this time the upper white blood cell rich layer and the lower red blood cell fraction were separated and the white blood cells discarded. The lower red blood cell fraction was washed twice in phosphate buffered saline (PBS, 500 g, 5 minutes). The supernatant was discarded, and the red blood cell pellet resuspended in either PBS or PBS containing 100 mM LiCl.
[0218] The red blood cells were subjected to 3 freeze-thaw cycles to ensure complete cellular lysis. Following lysis, the red blood cell lysates were diluted in PBS to the equivalent of 400 million cells/mL. The red blood cell lysates were analysed on a 21-plex human cytokine panel that assays for IL-1.alpha., IL-2Ra, IL-3, IL-12, IL-16, IL-18, CTACK, GRO-.alpha., HGF, IFN-.alpha.2, LIF, MCP-3, M-CSF, MIF, MIG, .beta.-NGF, SCF, SCGF-.beta., SDF-1.alpha., TNF-.beta., TRAIL (Bio-Plex Pro 27-plex and 21-plex, Bio-Rad). The assays were performed according to manufacturer's instructions using an automated magnetic wash station (BioPlex Pro II, Bio-Rad) for the washing steps. The assays were run on the Luminex.RTM. 200.TM. system (Bio-Rad) and fluorescent values were collected. The calibration curve for each cytokine was analysed with 5 parametric logistic curve regression using BioPlex manager software (ver. 5.0, Bio-Rad, USA).
[0219] As seen in FIG. 3A-FIG. 3G, lithium chloride increased and/or enhanced the level of several of the proteins in the assay.
Example 4. Protein Profile in RBCs from Healthy Individuals Versus Individuals Having Preeclampsia or Cancer
[0220] The difference in the levels of proteins in the blood of healthy individuals compared to those with a disease or disorder was measured. Whole blood was collected from four groups of people including: 1) healthy volunteers, 2) healthy, pregnant women, 3) pregnant women with preeclampsia, and 4) oncology patients (see Table 1). The healthy, pregnant controls were matched with the preeclampsia samples according to gestation. Blood was collected from each volunteer by venipuncture (n.gtoreq.3) directly into EDTA vacutainers (k.sub.2EDTA vacutainers, BD Biosciences).
TABLE-US-00003 TABLE 1 Participant summary. Subject Condition Relevant information OBS-101 Lymphoma Chemotherapy and radiation therapy OBS-102 Lymphoma Chemotherapy OBS-103 Cancer (specific type unknown) Chemotherapy PE-001 Preeclampsia 3.sup.rd trimester PE-002 Preeclampsia 3.sup.rd trimester PE-003 Preeclampsia 3.sup.rd trimester
[0221] The fractions of blood were collected and processed at room temperature within 4 hours of collection. For multiplex analysis (BioPlex analysis) the samples were stored at -80.degree. C. and were subjected to 3 freeze-thaw cycles at -80.degree. C. to ensure complete cellular lysis prior to analysis.
[0222] The plasma and red blood cells were isolated using dextran sedimentation as follows. Whole blood was centrifuged (1500 g, 10 minutes) and the upper plasma layer was collected. The remaining cell pellet was resuspended in an equal volume of sodium chloride (0.15 M). Dextran (6% w/v in 0.15 M sodium chloride) was then added to this cellular suspension at a 1:4 ratio (dextran:cell suspension). This solution was left at room temperature for 30 minutes for red blood cell sedimentation to the bottom of the tube. After this time the upper white blood cell rich layer was discarded and the lower red blood cell fraction was isolated. The red blood cell fraction was washed twice in phosphate buffered saline (PBS, 500 g, 5 minutes) and the remaining red blood cell pellet was counted (Coulter Act Diff, Beckman Coulter) and then frozen (-80.degree. C.) until analysis.
[0223] The red blood cells were subjected to 3 freeze-thaw cycles to ensure complete cellular lysis. Following lysis, the red blood cell lysates were diluted in PBS to the equivalent of 400 million cells/mL. These lysates and the plasma samples (undiluted) were then analysed on the multiplex cytokine assays. Two multiplex assays were utilised. The first was the 27-plex human cytokine panel that assays for FGF basic, Eotaxin, G-CSF, GM-CSF, IFN-.gamma., IL-1.beta., IL-1ra, IL-2, IL-4, IL-5, IL-6, IL-7, IL-8, IL-9, IL-10, IL-12(p70), IL-13, IL-15, IL-17, IP-10, MCP-1, MIP-1.alpha., MIP-1.beta., PDGF-BB, RANTES, TNF-.alpha., and VEGF, and the second was the 21-plex human cytokine panel that assays for IL-1.alpha., IL-2Ra, IL-3, IL-12, IL-16, IL-18, CTACK, GRO-.alpha., HGF, IFN-.alpha.2, LIF, MCP-3, M-CSF, MIF, MIG, .beta.-NGF, SCF, SCGF-.beta., SDF-1.alpha., TNF-.beta., TRAIL (Bio-Plex Pro 27-plex and 21-plex, Bio-Rad). The assays were performed according to manufacturer's instructions using an automated magnetic wash station (BioPlex Pro II, Bio-Rad) for the washing steps. The assays were run on the Luminex.RTM. 200.TM. system (Bio-Rad) and fluorescent values were collected. The calibration curve for each cytokine was analysed with 5 parametric logistic curve regression using BioPlex manager software (ver. 5.0, Bio-Rad, USA).
[0224] FIG. 4A-FIG. 4VV shows the concentration of the indicated proteins in the plasma and the lysate of red blood cells (400 million cells/mL) from participant groups calculated back to the relative concentration per mL of whole blood (approximately 5.times.10.sup.9 cells/mL). Significant differences (p<0.05) were determined using Student T-tests. The protein levels in the blood of healthy (non-pregnant) individuals were compared to the oncology patients and that of healthy, pregnant individuals was compared to that of pregnant individuals with preeclampsia. FIG. 5A-FIG. 5C shows the fold difference between the concentrations of the proteins in red blood cell as opposed to plasma.
[0225] There were significant differences between the protein levels in healthy control individuals and that in the individuals with a disease or disorder in a collection of proteins. For example, IL-2 was significantly lower (approximately 10-fold lower) in the red blood cells collected from the oncology group than in the healthy group and the chemokine CTACK was significantly higher in the red blood cells collected from the preeclampsia group than the healthy, pregnant group. In addition, twenty-eight of the 48 cytokines had a level of protein in RBCs that substantially exceeded the plasma level (greater than 2:1), with the fold change ranging from 2:1 to -280:1 (RBC:plasma ratio). The median RBC-plasma ratio was 5.9:1. The results of the study demonstrated that red blood cells may be a useful tool for identifying biomarkers in disease. Moreover, analysis of red blood cells in conjunction with plasma may provide more information about the disease state that is currently unachievable, for example, in instances in which there are no clear differences in protein levels in plasma alone, but identifiable differences in red blood cells (e.g., bFGF) or between red blood cells and plasma.
Example 5. Protein Profile in RBCs and RBC Protein Release from Healthy Individuals Versus Individuals Having Preeclampsia or Cancer
[0226] The levels of proteins released by red blood cells was evaluated in healthy individuals and those with a disease or disorder. Whole blood was collected from four groups of people including: 1) healthy volunteers, 2) healthy, pregnant women, 3) pregnant women with pre-eclampsia, and 4) oncology patients (Table 2).
TABLE-US-00004 TABLE 2 Participant summary Subject Condition Relevant information OBS-101 Lymphoma Chemotherapy and radiation therapy OBS-102 Lymphoma Chemotherapy OBS-103 Cancer (specific type unknown) Chemotherapy PE-001 Preeclampsia 3.sup.rd trimester PE-002 Preeclampsia 3.sup.rd trimester PE-003 Preeclampsia 3.sup.rd trimester
[0227] The healthy, pregnant control samples were matched with the preeclampsia samples according to gestation. Blood was collected from each volunteer by venipuncture (n.gtoreq.3) directly into EDTA vacutainers (k.sub.2EDTA vacutainers, BD Biosciences). The fractions of blood were collected and processed at room temperature within 4 hours of collection. For multiplex analysis (BioPlex analysis) the samples were stored at -80.degree. C. and were subjected to 3 freeze-thaw cycles at -80.degree. C. to ensure complete cellular lysis prior to analysis.
[0228] The red blood cells were isolated using dextran sedimentation as follows. Whole blood was centrifuged (1500 g, 10 minutes) and the upper plasma layer was discarded. The remaining cell pellet was resuspended in an equal volume of sodium chloride (0.15 M). Dextran (6% w/v in 0.15 M sodium chloride) was then added to this cellular suspension at a 1:4 ratio (dextran:cell suspension). This solution was left at room temperature for 30 minutes for red blood cell sedimentation to the bottom of the tube. After this time the upper white blood cell rich layer was discarded and the lower red blood cell fraction was isolated. The red blood cell fraction was washed twice in phosphate buffered saline (PBS, 500 g, 5 minutes) and the remaining red blood cell pellet was counted (Coulter Act Diff, Beckman Coulter). The red blood cells were then diluted to 400 million cells/mL in PBS and were incubated at 37.degree. C. and 5% CO.sub.2 for 24 hours. After incubation, the resulting conditioned PBS was isolated by centrifugation (500 g, 5 minutes). The samples were stored at -80.degree. C., and underwent 3 freeze/thaw cycles before analysis. The conditioned PBS samples were then analysed on the multiplex cytokine assays. Two multiplex assays were utilised. The first was the 27-plex human cytokine panel that assays for FGF basic, Eotaxin, G-CSF, GM-CSF, IFN-.gamma., IL-1.beta., IL-1ra, IL-2, IL-4, IL-5, IL-6, IL-7, IL-8, IL-9, IL-10, IL-12(p70), IL-13, IL-15, IL-17, IP-10, MCP-1, MIP-1.alpha., MIP-1.beta., PDGF-BB, RANTES, TNF-.alpha., and VEGF, and the second was the 21-plex human cytokine panel that assays for IL-1.alpha., IL-2Ra, IL-3, IL-12, IL-16, IL-18, CTACK, GRO-.alpha., HGF, IFN-.alpha.2, LIF, MCP-3, M-CSF, MIF, MIG, .beta.-NGF, SCF, SCGF-.beta., SDF-1.alpha., TNF-.beta., TRAIL (Bio-Plex Pro 27-plex and 21-plex, Bio-Rad). The assays were performed according to the manufacturer's instructions using an automated magnetic wash station (BioPlex Pro II, Bio-Rad) for the washing steps. The assays were run on the Luminex.RTM. 200.TM. system (Bio-Rad) and fluorescent values were collected. The calibration curve for each cytokine was analysed with 5 parametric logistic curve regression using BioPlex manager software (ver. 5.0, Bio-Rad, USA).
[0229] FIG. 6A-FIG. 6RR shows the concentration of the indicated proteins in the red blood cell conditioned PBS from the participant groups. The conditioned PBS was produced following red blood cell incubation for 24 hours at 37.degree. C. Significant differences (p<0.05) were determined using Student T-tests. There were significant differences in protein levels between the healthy control individuals and individuals in the disease groups. For example, significantly less IL-1.alpha. and GCS-F was released from red blood cells isolated from people with cancer when compared to the healthy controls, and significantly more IL-12(p40) and Eotaxin was released from the red blood cells isolated from cancer patients than healthy individuals. Similarly, a few cytokines were significantly different between the healthy pregnant group and the group with preeclampsia, such as MIF
[0230] The results suggested that analysis of the secretome of red blood cells may be a useful diagnostic tool for identifying and tracking biomarkers in disease. Analysis of the secretion of red blood cells (red blood cell protein release) may provide additional information regarding disease state.
Example 6. Effect of Protease Inhibitors on Proteins Present in RBCs
[0231] Whole blood was collected by venous collection into EDTA vacutainers. Plasma was collected after centrifugation and cells were isolated using either FACS or dextran sedimentation as described above. Isolated cells and whole blood were pelleted by centrifugation (2000 g, 10 minutes) and were resuspended to set concentrations. Samples were frozen at -80.degree. C., and subjected 3 times to freeze/thaw cycles to lyse the cells. Samples were analyzed on a Hu 27-plex BioPlex. In addition, proteins released or secreted by RBCs were analyzed. Whole blood was collected by venous collection into EDTA vacutainers and RBCs isolated by dextran sedimentation as described previously. Isolated RBCs were aliquoted to 20 million cells in 100 uL of PBS or PBS+protease inhibitors (PI) (1.times.) and cells were incubated at 37.degree. C. with 5% CO2 for 24 hours. After incubation, supernatant and cells were separated by centrifugation, samples were frozen at -80.degree. C., and subjected to 3 times freeze/thaw cycles to lyse the cells. The samples were analyzed on Hu 27-plex BioPlex.
[0232] The addition of protease inhibitors during RBCs culture altered protein release or secretion (24 hours at 37.degree. C.).
[0233] Incubation conditions were as follows:
[0234] 1. RBCs+PBS (20 million RBCs in 100 uL PBS)
[0235] 2. RBCs+PBS+protease inhibitors (PI) (20 million RBCs in 100 uL PBS+PI)
[0236] The series of graphs shown in FIG. 7A-7Z depict the effect of protease inhibitors (PI) on the concentration of proteins released or secreted from RBCs (black columns) and the concentration of proteins remaining in the cells after release or secretion (grey columns). Inclusion of protease inhibitors in the culture solution typically resulted in a lower detectable concentration for both release or secretion and cell lysate, although there were some exceptions (i.e., MIP-1b). Data presented as mean.+-.standard deviation (SD).
Example 7. Effect of Protease Inhibitors on Protein Levels in RBCs from Healthy Individuals Versus Individuals Having Preeclampsia or Cancer
[0237] The levels of proteins released by red blood cells were evaluated in red blood cells from healthy individuals and from those with a disease or disorder. Whole blood was collected from four groups of people including: 1) healthy volunteers, 2) healthy, pregnant women, 3) pregnant women with pre-eclampsia, and 4) oncology patients (Table 3).
TABLE-US-00005 TABLE 3 Participant summary Subject Condition Relevant information OBS-101 Lymphoma Chemotherapy and radiation therapy OBS-102 Lymphoma Chemotherapy OBS-103 Cancer (specific type unknown) Chemotherapy PE-001 Preeclampsia 3.sup.rd trimester PE-002 Preeclampsia 3.sup.rd trimester PE-003 Preeclampsia 3.sup.rd trimester
[0238] The healthy, pregnant control samples were matched with the preeclampsia samples according to gestation. Blood was collected from each volunteer by venipuncture (n.gtoreq.3) directly into EDTA vacutainers (k.sub.2EDTA vacutainers, BD Biosciences). The fractions of blood were collected and processed at room temperature within 4 hours of collection. For multiplex analysis (BioPlex analysis) the samples were stored at -80.degree. C. and were subjected to 3 freeze-thaw cycles at -80.degree. C. to ensure complete cellular lysis prior to analysis.
[0239] Whole blood was centrifuged (1500 g, 10 minutes) and the upper plasma layer was discarded. Then, red blood cells were isolated using dextran sedimentation as follows. Whole blood was centrifuged (1500 g, 10 minutes) and the upper plasma layer was discarded. The remaining cell pellet was resuspended in an equal volume of sodium chloride (0.15 M). Dextran (6% w/v in 0.15 M sodium chloride) was then added to this cellular suspension at a 1:4 ratio (dextran:cell suspension). This solution was left at room temperature for 30 minutes for red blood cell sedimentation to the bottom of the tube. After this time the upper white blood cell rich layer was discarded and the lower red blood cell fraction was isolated. The red blood cell fraction was washed twice in phosphate buffered saline (PBS, 500 g, 5 minutes) and the remaining red blood cell pellet was counted (Coulter Act Diff, Beckman Coulter). The red blood cells were then diluted to 400 million cells/mL in PBS and were incubated at 37.degree. C. and 5% CO.sub.2 for 24 hours.
[0240] In one instance, the whole blood sample was divided into two aliquots and one aliquot was treated with a protease inhibitor cocktail (1.times.), mini cOmplete protease inhibitor cocktail tablets, Roche) during the overnight incubation for each group (healthy volunteers, healthy pregnant, pre-eclampsia, oncology) as indicated in Table 4. The red blood cells were then isolated from the whole blood using dextran sedimentation. In another instance, red blood cells were first isolated from whole blood by dextran sedimentation and the red blood cell fraction divided into two aliquots and treated with a protease inhibitor cocktail (1.times., mini cOmplete protease inhibitor cocktail tablets, Roche) during the overnight incubation for each group (healthy volunteers, healthy pregnant, pre-eclampsia, oncology) as indicated in Table 4.
TABLE-US-00006 TABLE 4 Experimental conditions RBCs (200 million Protease cells per mL) PBS Inhibitors Condition 1 (none) x Condition 2 (PI)
[0241] After incubation, the resulting conditioned PBS was isolated by centrifugation (500 g, 5 minutes). The samples were stored at -80.degree. C., and underwent 3 freeze/thaw cycles before analysis. The conditioned PBS samples were then analysed on the multiplex cytokine assays. Two multiplex assays were utilised. The first was the 27-plex human cytokine panel that assays for FGF basic, Eotaxin, G-CSF, GM-CSF, IFN-.gamma., IL-1.beta., IL-1ra, IL-2, IL-4, IL-5, IL-6, IL-7, IL-8, IL-9, IL-10, IL-12(p70), IL-13, IL-15, IL-17, IP-10, MCP-1, MIP-1.alpha., MIP-1.beta., PDGF-BB, RANTES, TNF-.alpha., and VEGF, and the second was the 21-plex human cytokine panel that assays for IL-1.alpha., IL-2Ra, IL-3, IL-12, IL-16, IL-18, CTACK, GRO-.alpha., HGF, IFN-.alpha.2, LIF, MCP-3, M-CSF, MIF, MIG, .beta.-NGF, SCF, SCGF-.beta., SDF-1.alpha., TNF-.beta., TRAIL (Bio-Plex Pro 27-plex and 21-plex, Bio-Rad). The assays were performed according to the manufacturer's instructions using an automated magnetic wash station (BioPlex Pro II, Bio-Rad) for the washing steps. The assays were run on the Luminex.RTM. 200.TM. system (Bio-Rad) and fluorescent values were collected. The calibration curve for each cytokine was analysed with 5 parametric logistic curve regression using BioPlex manager software (ver. 5.0, Bio-Rad, USA).
[0242] FIG. 8A-FIG. 8ZZ and FIG. 9A-FIG. 9FF shows the concentration of the indicated proteins in the red blood cell conditioned PBS either in the presence or absence of protease inhibitors from the participant groups. The conditioned PBS was produced following red blood cell incubation for 24 hours at 37.degree. C. Significant differences (p<0.05) were determined using Student T-tests. As opposed to blood samples from healthy subjects in which protein levels generally decreased in the presence of protease inhibitors (see FIG. 7A-7Z), there was a trend for similar or increased levels of proteins when the blood samples of subjects having preeclampsia or cancer were incubated with protease inhibitors. The results suggest that one may differentiate between healthy and diseased blood samples by contacting either blood sample with protease inhibitors and detecting/measuring a change in protein levels.
[0243] FIG. 10A-FIG. 10D and FIG. 11A-FIG. 11D shows the cumulative fluorescence data (log 2) of the cytokine analyses in the red blood cell conditioned PBS either in the presence or absence of protease inhibitors from the participant groups. The conditioned PBS was produced following red blood cell incubation for 24 hours at 37.degree. C. Significant differences (p<0.05) were determined using Student T-tests. These data show that red blood cells isolated from women with pre-eclampsia released significantly more cytokines when treated with protease inhibitors compared to their absence (see FIG. 10C). In comparison, no significant difference was observed with and without protease inhibitors for healthy non-pregnant participants (see FIG. 10A) or for healthy pregnant participants (see FIG. 10B). Similarly, there was a significant difference between the level of cytokines with protease inhibitor treatment between healthy non-pregnant and healthy pregnant individuals (FIG. 10B), and a trend towards significance between healthy participants and oncology patients (FIG. 11D). The results suggest that the use of protease inhibitors to treat blood samples may aid in the discrimination between healthy and diseased groups.
Example 8. Effect of Specific Protease Inhibitors on Proteins from Red Blood Cells from Healthy Individuals
[0244] Blood samples from healthy volunteers were used to evaluate the effect of specific protease inhibitors on proteins from red blood cells. Whole blood was collected from healthy volunteers by venepuncture (n.gtoreq.3) directly into EDTA vacutainers (k.sub.2EDTA vacutainers, BD Biosciences). The fractions of blood were collected and processed at room temperature within 4 hours of collection. For multiplex analysis (BioPlex analysis) the samples were stored at -80.degree. C.
[0245] The red blood cells were isolated using dextran sedimentation as follows. Whole blood was centrifuged (1500 g, 10 minutes) and the upper plasma layer was discarded. The remaining cell pellet was resuspended in an equal volume of sodium chloride (0.15 M). Dextran (6% w/v in 0.15 M sodium chloride) was then added to this cellular suspension at a 1:4 ratio (dextran:cell suspension). The solution was left at room temperature for 30 minutes for red blood cell sedimentation to the bottom of the tube. The upper white blood cell rich layer was then discarded and the lower red blood cell fraction isolated. The red blood cell fraction was washed once in phosphate buffered saline (PBS, 500 g, 5 minutes) and the remaining red blood cell pellet was counted (Coulter Act Diff, Beckman Coulter). The red blood cells were then diluted to 400 million cells/mL in PBS and were incubated at 37.degree. C. and 5% CO.sub.2 for 24 hours. Some samples were also incubated with the protease inhibitors indicated in Table 5 during the PBS incubation.
TABLE-US-00007 TABLE 5 Protease inhibitors Sample ID Protease Inhibitors Concentration Specificity 1 None -- -- 2 cOmplete protease 1.times. Serine, cysteine, and inhibitor cocktail metallo-proteases (Roche) 3 Antipain- 50 .mu.g/mL Papain, trypsin, dihydrochloride cathepsin A and B 4 Bestatin 40 .mu.g/mL Aminopeptidases 5 E-64 10 .mu.g/mL Cysteine proteases 6 Leupeptin 5 .mu.g/mL Serine and cysteine proteases 7 Pepstatin 0.7 .mu.g/mL Aspartate proteases 8 Phosphoramidon 330 .mu.g/mL Metallo- endopeptidases 9 Pefabloc SC 1 mg/mL Serine proteases 10 EDTA-Na.sub.2 0.5 mg/mL Metalloproteases 11 Aprotinin 2 .mu.g/mL Serine proteases 12 A8127s protease 1.times. Serine, cysteine, and inhibitor cocktail aspartic proteases, aminopeptidases, metalloproteases
[0246] After incubation, the resulting conditioned PBS was isolated by centrifugation (500 g, 5 minutes) and then stored at -80.degree. C. The conditioned PBS samples were then analysed on the multiplex cytokine assays. Two multiplex assays were utilised. The first was a 27-plex human cytokine panel that assays for FGF basic, Eotaxin, G-CSF, GM-CSF, IFN-.gamma., IL-1.beta., IL-1ra, IL-2, IL-4, IL-5, IL-6, IL-7, IL-8, IL-9, IL-10, IL-12(p70), IL-13, IL-15, IL-17, IP-10, MCP-1, MIP-1.alpha., MIP-1.beta., PDGF-BB, RANTES, TNF-.alpha., and VEGF, and the second was a 21-plex human cytokine panel that assays for IL-1.alpha., IL-2Ra, IL-3, IL-12, IL-16, IL-18, CTACK, GRO-.alpha., HGF, IFN-.alpha.2, LIF, MCP-3, M-CSF, MIF, MIG, .beta.-NGF, SCF, SCGF-.beta., SDF-1.alpha., TNF-.beta., TRAIL (Bio-Plex Pro 27-plex and 21-plex, Bio-Rad). The assays were performed according to manufacturer's instructions using an automated magnetic wash station (BioPlex Pro II, Bio-Rad) for the washing steps. The assays were run on the Luminex.RTM. 200.TM. system (Bio-Rad) and fluorescent values were collected. The calibration curve for each cytokine was analysed with 5 parametric logistic curve regression using BioPlex manager software (ver. 5.0, Bio-Rad, USA).
[0247] The fold change was determined for proteins in red blood cell-conditioned PBS at 400 million cells/mL following incubation at 37.degree. C. for 24 hours with protease inhibitor cocktail or individual protease inhibitors from healthy participants. Values significantly different from untreated control if p<0.05 (* for p=0.05-0.01; ** for p=0.01-0.001; *** for p<0.001). Values with a fold change of >1 indicated that the protein was higher in the sample incubated with protease inhibitor(s) compared to one that was not (control), and values with a fold change of <1 indicated that the protein had a lower concentration in the sample incubated with protease inhibitor(s) compared to one that was not (control). Significant differences (p<0.05) were determined using Student T-tests.
TABLE-US-00008 TABLE 6 Fold change of proteins in red blood cells due to protease inhibitors Protease Inhibitor Sample ID Protein 2 3 4 5 6 7 8 9 10 11 IFN-.alpha.2 0.64** 3.81** 0.53* 0.46* 1.50* IL-1.alpha. 1.28*** 1.43* 1.14* IL-18 2.01* 1.45** MIF 0.59*** 0.83* 1.42** 1.39* 0.82* 0.77** TNF-.beta. 1.22*** 0.93** TRAIL 1.45** 1.69* IL-2ra 0.81** CTACK 7.39* 1.61* 2.31* GRO-a 1.13** 1.08*** IL-16 0.84* 0.59* MCP-3 1.83*** 4.07* 1.24* MIG 1.07** 1.07* SDF-1.alpha. 1.55* HGF 9.10*** 0.43** 0.47* IL-3 1.73*** 6.06* 1.45* M-CSF 1.24** 2.35* .beta.-NGF 1.13** 1.16* SCF 1.13*** 2.55* IL- 1.38*** 2.17* 1.11* 1.34* 12p40 LIF 1.09* IL-9 0.64** IL-15 3.85** IL-17 1.34** 3.50* IL-1ra IL-10 0.46* 0.50** 0.45* 1.32* Eotaxin 0.63** MCP-1 0.93** 0.66* 0.81* 0.70* MIP-1.beta. 3.99* bFGF 1.16* G-CSF 1.66** GM- 1.20* 1.37* 1.07* CSF VEGF 0.44* 0.47* 0.60** IL-2 1.40* 9.01* 0.06*
[0248] The use of individual protease inhibitors changed the concentration of a variety of cytokines that were released from the red blood cells when compared to control cells (no protease inhibitor(s)) (See Table 6). Although multiple protease inhibitors changed the concentration of the same cytokine, the direction of this change was variable. For example, bestatin and pepstatin are prime examples of the complex effects of different protease inhibitors on release of proteins from red blood cell. Incubating red blood cells with bestatin, which is an amino peptidase inhibitor, alters the concentration of released IFN-a2, IL-18, MIF, TRAIL, HGF, and IL12-p40. Pepstatin, an aspartate protease, also affects the concentration of IFN-a2, MIF, and HGF. However in each of those instances, pepstatin produced the opposite effect of bestatin. Similarly, the concentration of HGF was dramatically increased following red blood cell incubation with bestatin, but HGF concentration was significantly decreased following red blood cell incubation with pepstatin (Table 6). The complex nature of this interaction between specific protease inhibitors and the concentration of multiple cytokines provided compelling evidence that more than the inhibition of non-specific proteolysis of cytokines was causing the protease inhibitor-mediated protein concentration effects.
[0249] To determine the effect of a combination of protease inhibitors on the release of proteins from red blood cells, a protein profile was obtained from healthy red blood cells incubated with protease inhibitor cocktails. The protease inhibitor cocktail A8127s was produced by combining the individual protease inhibitors in Table 5 (antipain-dihydrochloride 50 .mu.g/mL; bestatin 40 .mu.g/mL; E-64 10 .mu.g/mL; leupeptin 5 .mu.g/mL; pepstatin 0.7 .mu.g/mL; phosphoramidon 330 .mu.g/mL; Pefabloc SC 1 mg/mL; EDTA-Naz 0.5 mg/mL; aprotinin 2 .mu.g/mL), each of which had a significant effect on cytokine release from healthy red blood cells individually (Table 6 and FIG. 12A-FIG. 12VV). Healthy red blood cells were incubated with A8127s and the cOmplete protease inhibitor cocktail (Roche). A8127s produced statistically significant changes in IL-17, Eotaxin, GM-CSF, PDGF-bb, INF-a2, IL-2ra, CTACK, MCP-3, MIG and IL-3 (FIG. 13A-FIG. 13VV), while the cOmplete protease inhibitor cocktail did not produce significant changes to cytokine concentration in the experiment.
[0250] Overall, the data demonstrated that protease inhibitors produced significant changes in the concentration of cytokines released from red blood cells isolated from healthy individuals. The complex relationship between individual proteases and changes in cytokine concentrations indicated that such effects were unlikely to be only related to the inhibition of non-specific proteolysis of the cytokines. Moreover, comparison of a commercial inhibitor cocktail (Roche complete) and the A8127s protease inhibitor cocktail showed that A8127s has a greater capacity to produce significant changes in the concentration/profile of cytokines released from red blood cells isolated from healthy participants.
Example 9. Effect of Protease Inhibitors on Proteins from Red Blood Cell Membranes
[0251] To determine if protease inhibitors had an effect on the release of proteins from red blood cell membranes, red blood cell membranes were obtained from isolated red blood cells and whole blood and then incubated with protease inhibitors. Whole blood was collected from healthy volunteers by venepuncture directly into EDTA vacutainers (k.sub.2EDTA vacutainers, BD Biosciences). The fractions of blood were collected and processed at room temperature within 4 hours of collection. For multiplex analysis (BioPlex analysis) the samples were stored at -80.degree. C. prior to analysis.
[0252] An aliquot of whole blood was collected and frozen at -80.degree. C. The red blood cells were isolated from remaining fresh whole blood using dextran sedimentation as follows. Whole blood was centrifuged (1500 g, 10 minutes) and the upper plasma layer was discarded. The remaining cell pellet was resuspended in an equal volume of sodium chloride (0.15 M). Dextran (6% w/v in 0.15 M sodium chloride) was then added to the cellular suspension at a 1:4 ratio (dextran:cell suspension). The solution was left at room temperature for 30 minutes for red blood cell sedimentation to the bottom of the tube. Then the upper white blood cell rich layer was discarded and the lower red blood cell fraction isolated. The red blood cell fraction was washed once in phosphate buffered saline (PBS, 500 g, 5 minutes), the remaining red blood cell pellet was counted (Coulter Act Diff, Beckman Coulter), and an aliquot of the cells were frozen at -80.degree. C.
[0253] For the isolation of red blood cell membranes, frozen aliquots of both whole blood and the isolated red blood cells were subjected to 3 freeze thaw cycles to ensure complete cellular lysis. An aliquot of the lysates (volume equivalent to 40 million red blood cells per 100 .mu.L) was added to PBS at a 1:20 ratio (lysate:PBS). The red blood cell membranes were then isolated by centrifugation out of solution (16,000 g, 20 mins, 4.degree. C.). The upper fraction was then discarded and the resulting membranes were then diluted to 400 million cells/mL in PBS and were incubated at 37.degree. C. and 5% CO.sub.2 for 24 hours. Some samples were also incubated with the protease inhibitors in Table 5.
[0254] After incubation, the resulting conditioned PBS was isolated by centrifugation (16,000 g, 20 minutes, 4.degree. C.). The samples were stored at -80.degree. C. until analysis. The conditioned PBS samples were then analysed on a multiplex cytokine assay. The 27-plex human cytokine panel assays for FGF basic, Eotaxin, G-CSF, GM-CSF, IFN-.gamma., IL-1.beta., IL-1ra, IL-2, IL-4, IL-5, IL-6, IL-7, IL-8, IL-9, IL-10, IL-12(p70), IL-13, IL-15, IL-17, IP-10, MCP-1, MIP-1.alpha., MIP-1.beta., PDGF-BB, RANTES, TNF-.alpha., and VEGF. The assay was performed according to manufacturer's instructions using an automated magnetic wash station (BioPlex Pro II, Bio-Rad) for the washing steps. The assay was run on the Luminex.RTM. 200.TM. system (Bio-Rad) and fluorescent values were collected. The calibration curve for each cytokine was analysed with 5 parametric logistic curve regression using BioPlex manager software (ver. 5.0, Bio-Rad, USA).
[0255] FIG. 14A-FIG. 14AA shows the concentration of several proteins in the red blood cell membranes incubated in conditioned PBS in either the presence or absence of protease inhibitor cocktails (A8127s and cOmplete (Roche)). The data demonstrated that even at lower red blood cell numbers, a significant number of cytokines were still present at readily detectable levels in red blood cell membrane-conditioned PBS (from both whole blood and enriched red blood cell lysates). The concentration of 400 million red blood cells per mL, was equivalent to only 80 .mu.L of whole blood per mL (assuming a normal concentration of 5.times.10.sup.9 red blood cells per mL of fresh whole blood). Because the experiment was carried out in only 200 .mu.L of the 400 million cells/mL solution, it follow that a starting sample of only 16 .mu.L of whole blood would be sufficient to detect the cytokine concentrations observed above.
Example 10. Effect of Protease Inhibitors on Red Blood Cell Proteins from Cancer Cohorts
[0256] A change in the presence or levels of numerous proteins characterizes a variety of diseases. In particular, cancer is a disease involving differential levels of, among other proteins, inflammatory proteins (e.g., cytokines). Thus, the concentration of proteins from the red blood cells from those having colorectal cancer and lymphoma was investigated.
[0257] Whole blood was collected from volunteers with by venepuncture directly into EDTA vacutainers (k.sub.2EDTA vacutainers, BD Biosciences). The fractions of blood were collected and processed at room temperature within 4 hours of collection. For multiplex analysis (BioPlex analysis) the samples were stored at -80.degree. C. prior to analysis. The red blood cells were isolated using dextran sedimentation as follows. Whole blood was centrifuged (1500 g, 10 minutes) and the upper plasma layer was discarded. The remaining cell pellet was resuspended in an equal volume of sodium chloride (0.15 M). Dextran (6% w/v in 0.15 M sodium chloride) was then added to this cellular suspension at a 1:4 ratio (dextran:cell suspension). The solution was left at room temperature for 30 minutes for red blood cell sedimentation to the bottom of the tube. The upper white blood cell rich layer was discarded and the lower red blood cell fraction was isolated. The red blood cell fraction was washed once in phosphate buffered saline (PBS, 500 g, 5 minutes) and the remaining red blood cell pellet was counted (Coulter Act Diff, Beckman Coulter). The red blood cells were then diluted to 400 million cells/mL in PBS and incubated at 37.degree. C. and 5% CO.sub.2 for 24 hours. Some samples were also incubated with the individual protease inhibitors in Table 5, a commercial protease inhibitor cocktail (cOmplete, Roche), or the A8127s protease inhibitor cocktail during the PBS incubation. The A8127s protease inhibitor cocktail comprised antipain-dihydrochloride (50 .mu.g/mL); bestatin (40 .mu.g/mL); E-64 (10 .mu.g/mL); leupeptin (5 .mu.g/mL); pepstatin (0.7 .mu.g/mL); phosphoramidon (330 .mu.g/mL); Pefabloc SC (1 mg/mL); EDTA-Na.sub.2 (0.5 mg/mL); and aprotinin (2 .mu.g/mL).
[0258] After incubation, the resulting conditioned PBS was isolated by centrifugation (500 g, 5 minutes). The samples were stored at -80.degree. C. The conditioned PBS samples were then analysed on a 27-plex human cytokine panel that assays for FGF basic, Eotaxin, G-CSF, GM-CSF, IFN-.gamma., IL-1.beta., IL-1ra, IL-2, IL-4, IL-5, IL-6, IL-7, IL-8, IL-9, IL-10, IL-12(p70), IL-13, IL-15, IL-17, IP-10, MCP-1, MIP-1.alpha., MIP-1.beta., PDGF-BB, RANTES, TNF-.alpha., and VEGF (Bio-Plex Pro 27-plex, Bio-Rad). The assay was performed according to manufacturer's instructions using an automated magnetic wash station (BioPlex Pro II, Bio-Rad) for the washing steps. The assay was run on the Luminex.RTM. 200.TM. system (Bio-Rad) and fluorescent values were collected. The calibration curve for each cytokine was analysed with 5 parametric logistic curve regression using BioPlex manager software (ver. 5.0, Bio-Rad, USA).
[0259] 10.1 Colorectal Cancer
[0260] FIG. 15A-FIG. 15AA shows the concentration of the indicated proteins released from red blood cells from individuals having colorectal cancer, where the red blood cells had been incubated with individual protease inhibitors or a commercial protease inhibitor cocktail (cOmplete, Roche). Significant differences (p<0.05) were determined using Student T-tests. Individual protease inhibitors changed the concentration of a variety of cytokines that were released from the red blood cells from colorectal cancer participants when compared to the control (no protease inhibitors). Individual protease inhibitors changed the released cytokine profile in very different ways. For example, treating red blood cells with antipain-dihydrochloride (an inhibitor of papain, trypsin and cathepsin) increased the concentration of released IFN-.gamma., IL-12(p70), IL-15, IL-17, IL-13, IL-7, IP-10, PDGF-bb and IL-2, while decreasing the concentration IL-1.beta., IL-8, TNF-.alpha., MIP-1.alpha., G-CSF and IL-6. In contrast, Pefabloc SC (a serine protease inhibitor) increased the released concentration of only IL-13 and IL-7, while decreasing the concentration of IL-1.beta., IL-8, IL-9, TNF-.alpha., IL-1ra, MCP-1, MIP-1.alpha., G-CSF and IL-6. The complex nature of the interaction between specific protease inhibitors and the release of multiple cytokines provided compelling evidence that more than the inhibition of non-specific proteolysis of cytokines was causing protease inhibitor-mediated effects on protein levels. FIG. 16A-FIG. 16AA shows the concentration of proteins released from red blood cells from individuals having colorectal cancer into conditioned PBS containing either a commercial protease inhibitor cocktail (cOmplete, Roche) or A8127s. The cOmplete protease inhibitor cocktail only significantly changed the concentration of IL-2 when compared to control samples. In contrast, incubation of red blood cells with the A8127s protease inhibitor cocktail significantly changed the concentration of IL-1.beta., IL-15 and GM-CSF when compared to control samples. The data demonstrated that exposure of red blood cells isolated from colorectal cancer patients to protease inhibitors resulted in significant changes to the concentration of the cytokines released into the conditioned PBS. Moreover, comparison of the cOmplete protease inhibitor cocktail and the A8127s protease inhibitor cocktail showed that the A8127s cocktail had a greater capacity to produce significant changes in the profile of released cytokines from red blood cells isolated from colorectal cancer participants.
[0261] Next, the difference in the effect of protease inhibitors on proteins released from red blood cells from healthy individuals compared their effect on proteins released from the red blood cells of those with colorectal cancer was assessed. The concentration of proteins from red blood cells incubated with the individual protease inhibitors in Table 5 is shown in FIG. 17A-FIG. 17AA. The data provide a method by which a protease inhibitor cocktail may be optimized for a specific disease state. The cytokines IL-8, IL-15, TNF-.alpha., MIP-1.alpha., MIP-1.beta. and IL-6 were identified as having a statistically significant change in red blood cells incubated with A8127s from colorectal cancer participants. The individual protease inhibitor data showed that Pefabloc SC affected healthy and colorectal cancer participants in the same way for IL-8, IL-15, TNF-.alpha., MIP-1.alpha., MIP-1.beta. and IL-6. Therefore, the removal of Pefabloc SC from the A8127s protease cocktail may increase the differences observed between the healthy and colorectal cancer cytokine profiles.
[0262] FIG. 18A-FIG. 18AA illustrates the fold change in protein concentration in red blood cells from healthy individuals versus colorectal cancer participants when the red blood cells were incubated with protease inhibitor cocktails (A8127s and cOmplete (Roche)). The results indicated that incubation of red blood cells with protease inhibitors resulted in significant changes to the cytokine profile of red blood cell conditioned PBS from both healthy and colorectal cancer participant groups. The A8127s protease inhibitor cocktail produced the largest number of statistically significant changes in cytokine levels when compared to untreated samples for both healthy and colorectal cancer participants. The results were consistent with previous data in healthy individuals, which showed that the A8127s protease inhibitor cocktail resulted in more significant changes in the cytokine profile than the cOmplete protease inhibitor cocktail.
[0263] Samples isolated from the healthy and colorectal cancer cohorts differed in how they responded to the protease inhibitors. There were a number of cytokines that changed significantly when intact red blood cells from colorectal cancer patients were incubated with the A8127s protease inhibitor cocktail-IL-8, IL-15, TNF-.alpha., MIP-1.alpha., MIP-1.beta. and IL-6. In contrast, no significant change was detected when intact red blood cells were isolated from healthy participants and incubated with A8127s. This indicated that intact red blood cells incubated with or without the A8127s protease inhibitor cocktail may be valuable in identifying cytokine profiles that are specific to colorectal cancer. Table 7 summarizes the number of cytokines that significantly changed in healthy and colorectal cancer participants with each protease inhibitor cocktail.
TABLE-US-00009 TABLE 7 Number of proteins having significantly changed concentrations after incubation of red blood cells with protease inhibitor cocktails. Intact red blood cell secretions Healthy Colorectal cancer cOmplete PI cOmplete PI cocktail A8127s cocktail A8127s 1 5 2 9
[0264] Proteins released from red blood cell membranes from healthy and colorectal cancer cohorts also had a differential concentration in the presence and absence of protease inhibitors. For the isolation of red blood cell membrane, the frozen aliquots of the whole blood were subjected to 3 freeze thaw cycles to ensure complete cellular lysis. Following this, an aliquot of the lysates (volume equivalent to 120 million red blood cells per 100 .mu.L) was added to PBS at a 1:20 ratio (lysate:PBS). The red blood cell membranes were then isolated by centrifugation out of solution (16,000 g, 20 mins, 4.degree. C.). The upper fraction was then discarded and the resulting membranes were then diluted to 1,200 million cells/mL in PBS and were incubated at 37.degree. C. and 5% CO.sub.2 for 24 hours. The fold change of proteins in red blood cell membrane-conditioned PBS (isolated from whole blood lysates) at 1,200 million cells/mL following incubation at 37.degree. C. for 24 hours with protease inhibitors compared to no protease inhibitor incubation of red blood cell membranes from healthy participants or participants with colorectal cancer. Values significantly different (*) if p<0.05. Data are mean.+-.standard deviation. FIG. 19A-19VV shows that eight cytokines had a differential response to the protease inhibitor cocktail A8127s in red blood cell membranes from individuals having colorectal cancer compared to that of healthy individuals.
[0265] The concentration of additional proteins were analyzed in red blood cells incubated with protease inhibitors from healthy individuals and those having colorectal cancer. A 16-plex human cancer biomarker panel 1 that assays for sEGFR, FGF-basic, G-CSF, HGF, sHER-2/neu, sIL-6Ra, Leptin, Osteopontin, PECAM-1, PDGF-AB/BB, Prolactin, SCF, sTIE-2, sVEGFR-1, and sVEGFR-2, and a 37-plex human inflammation cytokine panel that assays for APRIL/TNFSF13, BAFF/TNFSF13B, sCD30/TNFRF8, sCD163, Chitinase-3-like 1, gp130/sIL-6.beta., IFN-.alpha.2, IFN-.gamma., IL-2, sIL-6R.alpha., IL-8, IL-10, IL-11, IL-12(p40), IL-12(p70), IL-19, IL-20, IL-22, IL-26, IL-27(p28), IL-28A/IFN-.lamda.2, IL-29/IFN-.lamda.1, IL-32, IL-34, IL-35, LIGHT/TNFSF14, MMP-1, MMP-2, MMP-3, Osteocalcin, Osteopontin, Pentraxin-3, sTNF-R1, sTNF-R2, TSLP, and TWEAK/TNFSF12 (Bio-Plex cancer biomarker 16-plex panel and inflammation 37-plex panel, Bio-Rad) were used. The assays were performed according to manufacturer's instructions using an automated magnetic wash station (BioPlex Pro II, Bio-Rad) for the washing steps. The assays were run on the Luminex.RTM. 200.TM. system (Bio-Rad) and fluorescent values were collected. The calibration curve for each cytokine was analysed with 5 parametric logistic curve regression using BioPlex manager software (ver. 5.0, Bio-Rad, USA).
[0266] FIG. 20A-20LL shows the concentration of proteins in red blood cell-conditioned PBS at 400 million cells/mL following incubation at 37.degree. C. for 24 hours with either no protease inhibitors and protease inhibitor cocktails for healthy participants (n=3) or participants with colorectal cancer (n=2). Values were significantly different (*) if p<0.05. Data are presented as mean.+-.standard deviation. The data demonstrated that protease inhibitors have an effect on the concentration of a range of hormones, soluble receptors, proteins, and cytokines that are released from red blood cells. High concentrations of molecules, such as osteopontin, chitinase 3-like 1, and MMP-1, were released from red blood cells isolated from healthy individuals that were incubated for 24 hours at 37.degree. C. in PBS (FIG. 20A-20LL). The addition of protease inhibitor cocktails to the red blood cells, resulted in an alteration in protein concentration. For example, sCD30/TNFRSF8, IL-19, and LIGHT/TNFSF14 were significantly higher with A8127s incubation in comparison to the control (no protease inhibitors) (FIG. 20A-20LL). The observed changes following protease inhibitor incubation was different between red blood cells isolated from healthy participants and those isolated from participants with colorectal cancer. For instance, the concentration of osteopontin was significantly increased with A8127s incubation of red blood cells from the healthy group, but it did not change under the same conditions in the colorectal cancer group. Conversely, the concentration of IL-27(p28) significantly decreased with A8127s in the colorectal cancer group, but did not change in the healthy group. The trend of one cohort having a significantly changed protein concentration in the presence of protease inhibitors while in the other cohort protein concentration moved in the opposite direction or did not change, occurred in 10 proteins.
[0267] Next, whether proteins released from the red blood cell membranes were at differential concentrations in red blood cells compared to red blood cell membranes incubated with protease inhibitor cocktails was assessed for healthy individuals. To obtain red blood cell membranes, frozen aliquots of whole blood were subjected to 3 freeze thaw cycles to ensure complete cellular lysis. Following this, an aliquot of the lysates (volume equivalent to 120 million red blood cells per 100 .mu.L) was added to PBS at a 1:20 ratio (lysate:PBS). The red blood cell membranes were then isolated by centrifugation out of solution (16,000 g, 20 mins, 4.degree. C.). The upper fraction was then discarded and the resulting membranes were then diluted to 1,200 million cells/mL in PBS and were incubated at 37.degree. C. and 5% CO.sub.2 for 24 hours. Some samples were treated with the protease inhibitor cocktails (complete or A8127s) during the PBS incubation. Concentration of proteins in red blood cell-conditioned PBS at 400 million cells/mL (intact red blood cells) or red blood cell membrane-conditioned PBS at 1,200 million cells/mL (red blood cell membranes) following incubation at 37.degree. C. for 24 hours with either no protease inhibitors and protease inhibitor cocktails from healthy participants (n=3) or participants with colorectal cancer (n=2). Values were significantly different (*) if p<0.05. Data are presented as mean.+-.standard deviation.
[0268] As seen in FIG. 21A-21LL, there was a stark difference in the protein profile of intact red blood cells and red blood cell membranes from healthy participants. In the control (no protease inhibitors), the concentration of proteins released by red blood cell membranes was significantly higher than that released by intact red blood cells for 16 proteins, and was significantly lower for 6 proteins. There were also differences in how the protease inhibitors altered the proteins profile of the conditioned PBS in both intact cells and red blood cell membranes. For example, PDGF-AB/BB was significantly lower in the red blood cell membranes incubated with A8127s compared to the control, but was unchanged in the intact cell group. A similar trend was observed for prolactin, gp130/sIL-6Rb, BAFF/TNFSF13B, MMP-2, and TWEAK/TNFSF12 amongst others (see FIG. 21A-21LL). In other instances, the inclusion of protease inhibitor cocktails significantly changed the concentration of proteins in the conditioned PBS of intact red blood cells but did not affect the release of proteins from red blood cell membranes. Examples of this included osteopontin, sVEGR-1, IL-19, MMP-1, and pentraxin-3. The results indicated that the mechanisms regulating the response to protease inhibitors and the concentration of proteins in conditioned PBS was substantially changed in red blood cell membranes compared to intact red blood cells.
[0269] 10.2 Lymphoma
[0270] To further explore the effect of protease inhibitors on the concentration of proteins released from red blood cell components from those having cancer, the change in concentration of proteins from red blood cell membranes of healthy individuals and those having lymphoma was assessed. For the isolation of red blood cell membranes, frozen aliquots of the whole blood and red blood cells were subjected to 3 freeze thaw cycles to ensure complete cellular lysis. Following this, an aliquot of the lysates (volume equivalent to 120 million red blood cells per 100 .mu.L) was added to PBS at a 1:20 ratio (lysate:PBS). The red blood cell membranes were then isolated by centrifugation out of solution (16,000 g, 20 mins, 4.degree. C.). The upper fraction was then discarded and the resulting membranes were then diluted to 1,200 million cells/mL in PBS and were incubated at 37.degree. C. and 5% CO.sub.2 for 24 hours. Some samples were treated with protease inhibitor cocktails (cOmplete or A8127s) during the PBS incubation period.
[0271] FIG. 22A-22VV shows the change in level of proteins from red blood cell membranes isolated from whole blood lysates, while FIG. 23A-23VV shows the change in the level of proteins from red blood cell membranes obtained from isolated red blood cells in the presence of protease inhibitor cocktails. Red blood cell membrane-conditioned PBS isolated from whole blood lysates or enriched red blood cell lysates, at 1,200 million cells/mL, were incubated at 37.degree. C. for 24 hours with or without protease inhibitors, with red blood cells from healthy participants or participants with lymphoma. Values were significantly different (*) if p<0.05. Data are the mean.+-.standard deviation. It may be concluded from the data that the effect of protease inhibitors on the release of cytokines (as has been show in intact red blood cells) is still active in isolated red blood cell membranes. A8127s produced the largest number of cytokine changes in every group except for enriched red blood cell membranes from healthy participants. This was consistent with previous data demonstrating that A8127s resulted in more significant changes in the cytokine profile than a commercial protease inhibitor cocktail (Roche cOmplete).
[0272] Notably, the samples isolated from the healthy and lymphoma group differed in how they responded to the protease inhibitor incubation. There were also a number of cytokines that changed significantly when the red blood cell membranes from lymphoma patients were incubated with A8127s. In contrast, no significant change was detected when red blood cell membranes were isolated from healthy participants and treated in the same way. For red blood cell membranes isolated from whole blood, the cytokines IL-8, IL-6, IP-10, IL-3, and SCF behaved in this manner. Similarly, the cytokines IL-12p70, IL-17, IL-4, MCP-1, GM-CSF, IFN-a2, IL-1a, IL-18, M-CSF, SCGF-B, IL-12p40 in red blood cell membranes isolated from enriched red blood cells followed the same pattern. This indicates that red blood cell membranes isolated from enriched red blood cell lysates may be valuable in identifying cytokine profiles that are specific to lymphoma.
[0273] The data also indicated that IL-4, IFN-a2, IL-18, SCGF-b, and LIF may be used together as a panel for the differentiation between healthy and lymphoma samples. The cytokines are not only statistically changed in lymphoma samples following incubation with A8127s, but also, the fold change trend (from unincubated control to incubation with A8127s) is different for the lymphoma samples compared to samples from healthy individuals. Table 8 summarizes the number of cytokines that significantly changed in red blood cell membranes from both healthy and lymphoma participants, by protease inhibitor cocktail used.
TABLE-US-00010 TABLE 8 Number of statistically significantly (p <0.05) changed cytokines following incubation with each protease inhibitor (PI) cocktail compared to the unincubated control for each sample group. Red blood cell membranes Red blood cell membranes (from whole blood) (from RBC lysates) Healthy Lymphoma Healthy Lymphoma cOmplete cOmplete cOmplete cOmplete PI PI PI PI cocktail A8127s cocktail A8127s cocktail A8127s cocktail A8127s 5 17 3 11 4 2 5 12
Example 11. Effect of Protease Inhibitors on Red Blood Cell Components from Inflammatory Disease Cohorts
[0274] To further explore whether protease inhibitors have a differential effect on proteins from red blood cell components from individuals that have a range of inflammatory conditions, red blood cells or red blood cell membranes obtained from those having the various inflammatory conditions were incubated with protease inhibitor cocktails and change in protein level assessed.
[0275] Whole blood was collected from volunteers by venepuncture directly into EDTA vacutainers (k.sub.2EDTA vacutainers, BD Biosciences). The fractions of blood were collected and processed at room temperature within 4 hours of collection. For multiplex analysis (BioPlex analysis) the samples were stored at -80.degree. C. and were subjected to 3 freeze-thaw cycles at -80.degree. C. to ensure complete cellular lysis prior to analysis.
[0276] Following collection, whole blood was aliquoted and frozen at -80.degree. C. For the isolation of red blood cell membranes, the frozen aliquots of the whole blood were subjected to 3 freeze thaw cycles to ensure complete cellular lysis. Following this, an aliquot of the lysates (volume equivalent to 120 million red blood cells per 100 .mu.L) was added to PBS at a 1:20 ratio (lysate:PBS). The red blood cell membranes were then isolated by centrifugation out of solution (16,000 g, 20 mins, 4.degree. C.). The upper fraction was then discarded and the resulting membranes were then diluted to 1,200 million cells/mL in PBS and were incubated at 37.degree. C. and 5% CO.sub.2 for 24 hours. Some samples were incubated with protease inhibitor cocktails (cOmplete, Roche; A8127s). The A8127s protease inhibitor cocktail is comprised of antipain-dihydrochloride (50 .mu.g/mL); bestatin (40 .mu.g/mL); E-64 (10 .mu.g/mL); leupeptin (5 .mu.g/mL); pepstatin (0.7 .mu.g/mL); phosphoramidon (330 .mu.g/mL); Pefabloc SC (1 mg/mL); EDTA-Na.sub.2 (0.5 mg/mL); and aprotinin (2 .mu.g/mL).
[0277] After incubation, the resulting conditioned PBS was isolated by centrifugation (16,000 g, 20 minutes, 4.degree. C.). The samples were stored at -80.degree. C., and underwent 3 freeze/thaw cycles before analysis. The conditioned PBS samples were then analyzed on the multiplex cytokine assays. Two multiplex assays were utilised. The first was the 27-plea human cytokine panel that assays for FGF basic, Eotaxin, G-CSF, GM-CSF, IFN-.gamma., IL-1.beta., IL-1ra, IL-2, IL-4, IL-5, IL-6, IL-7, IL-8, IL-9, IL-10, IL-12(p70), IL-13, IL-15, IL-17, IP-10, MCP-1, MIP-1.alpha., MIP-1.beta., PDGF-BB, RANTES, TNF-.alpha., and VEGF, and the second was the 21-plex human cytokine panel that assays for IL-1.alpha., IL-2Ra, IL-3, IL-12, IL-16, IL-18, CTACK, GRO-.alpha., HGF, IFN-.alpha.2, LIF, MCP-3, M-CSF, MIF, MIG, .beta.-NGF, SCF, SCGF-.beta., SDF-1.alpha., TNF-.beta., TRAIL (Bio-Plex Pro 27-plex and 21-plex, Bio-Rad). The assays were performed according to manufacturer's instructions using an automated magnetic wash station (BioPlex Pro II, Bio-Rad) for the washing steps. The assays were run on the Luminex.RTM. 200.TM. system (Bio-Rad) and fluorescent values were collected. The calibration curve for each cytokine was analysed with 5 parametric logistic curve regression using BioPlex manager software (ver. 5.0, Bio-Rad, USA).
[0278] The effect of protease inhibitors on the red blood cell membranes of healthy individuals was compared to that on red blood cell membranes from individuals having osteoarthritis (FIG. 24A-24VV); pre-eclampsia (FIG. 25A-25VV); pre-eclampsia with intrauterine growth restriction (FIG. 26A-26VV); ulcerative colitis (FIG. 27A-27VV); and duodenal ulcer and infection (FIG. 28A-28VV). The fold change of proteins in red blood cell membrane-conditioned PBS (isolated from whole blood lysates) at 1,200 million cells/mL following incubation at 37.degree. C. for 24 hours with protease inhibitors compared to no protease inhibitor of red blood cell membranes from healthy participants or participants with osteoarthritis (OA), pre-eclampsia (PE), pre-eclampsia and intrauterine growth restriction (PE+IUGR), ulcerative colitis (UC), and duodenal ulcer and infection (DU). Values were significantly different (*) if p<0.05. Data are the mean.+-.standard deviation.
[0279] The data demonstrated that incubation of red blood cell membranes with protease inhibitors resulted in notable changes in the cytokine profile of the red blood cell membrane-conditioned PBS from healthy and disease participants. The data also demonstrated that A8127s produced larger changes in cytokine levels compared to the control and the cOmplete protease inhibitor cocktail (FIG. 24A-FIG. 28VV).
[0280] Samples isolated from the healthy and diseased groups differed in how they responded to protease inhibitor incubation. FIG. 24A-FIG. 28VV identify examples of a number of cytokines that show distinct differences in how A8127s affected cytokine concentration in disease samples compared to healthy samples. For example, IFN-a2 concentration was reduced in red blood cell membranes from the healthy group treated with protease inhibitors, but was substantially increased in the osteoarthritis groups. Likewise, IP-10 increased in the red blood cell membranes from the healthy pregnant cohort with protease inhibitor incubation, but decreased in the pre-eclamptic cohort. Each of the diseases investigated showed a number of cytokines that exhibited a differential response between red blood cell membranes from the healthy and disease cohorts following protease inhibitor incubation. Table 9 summarizes the total number of cytokines for each disease state that showed a significant differential effect.
TABLE-US-00011 TABLE 9 Total number of cytokines for each disease state showing a differential concentration change related to protease inhibitor incubation between healthy and disease participant groups Number of cytokines with differential response to A8127s Disease state between healthy and disease Osteoarthritis (OA) 16 Pre-eclampsia (PE) 7 Pre-eclampsia (PE + IUGR) 6 Ulcerative colitis (UC) 16 Duodenal ulcer and infection (DU) 5
[0281] Red blood cell membranes from individuals with various diseases that were incubated with protease inhibitors were assayed for additional proteins involved in disease states. Red blood cell membranes were obtained from healthy individuals, and those having lymphoma, osteoarthritis, and ulcerative colitis. Two multiplex assays were utilised. The first was the 16-plex human cancer biomarker panel 1 that assays for sEGFR, FGF-basic, G-CSF, HGF, sHER-2/neu, sIL-6Ra, Leptin, Osteopontin, PECAM-1, PDGF-AB/BB, Prolactin, SCF, sTIE-2, sVEGFR-1, and sVEGFR-2, and the second was the 37-plex human inflammation cytokine panel that assays for APRIL/TNFSF13, BAFF/TNFSF13B, sCD30/TNFRF8, sCD163, Chitinase-3-like 1, gp130/sIL-6R.beta., IFN-.alpha.2, IFN-.gamma., IL-2, sIL-6R.alpha., IL-8, IL-10, IL-11, IL-12(p40), IL-12(p70), IL-19, IL-20, IL-22, IL-26, IL-27(p28), IL-28A/IFN-.lamda.2, IL-29/IFN-.lamda.1, IL-32, IL-34, IL-35, LIGHT/TNFSF14, MMP-1, MMP-2, MMP-3, Osteocalcin, Osteopontin, Pentraxin-3, sTNF-R1, sTNF-R2, TSLP, and TWEAK/TNFSF12 (Bio-Plex cancer biomarker 16-plex panel and inflammation 37-plex panel, Bio-Rad). The assays were performed according to manufacturer's instructions using an automated magnetic wash station (BioPlex Pro II, Bio-Rad) for the washing steps. The assays were run on the Luminex.RTM. 200.TM. system (Bio-Rad) and fluorescent values were collected. The calibration curve for each cytokine was analysed with 5 parametric logistic curve regression using BioPlex manager software (ver. 5.0, Bio-Rad, USA). The fold change of proteins in red blood cell membrane-conditioned PBS (isolated from whole blood lysates) at 1,200 million cells/mL following incubation at 37.degree. C. for 24 hours with protease inhibitors compared to no protease inhibitors from healthy participants or participants with lymphoma, osteoarthritis (OA), and ulcerative colitis (UC). Values were significantly different (*) if p<0.05. Data are the mean.+-.standard deviation.
[0282] The data demonstrated that protease inhibitors altered the release of several proteins in the healthy participant group (FIG. 29A-FIG. 31NN), and also in the lymphoma (FIG. 29A-FIG. 29LL), osteoarthritis (FIG. 30A-FIG. 30NN), and ulcerative colitis (FIG. 31A-FIG. 31NN) participant groups as well. The effect of protease inhibitors was variable both between proteins and disease groups. For instance, in the lymphoma participant group, a significant decrease was observed for PECAM-1 in red blood cell membranes incubated with A8127s, but no significant change was detected in the healthy group. Similarly, prolactin was significantly decreased following incubation with protease inhibitors but was not significantly changed in the healthy group. Although not statistically significant, a differential trend in fold change following A8127s incubation was observed between the healthy and lymphoma groups for chitinase 3-like 1, IL-26, and IL-35, where the concentration of the respective proteins increased in the healthy group and decreased in the lymphoma group, and vice versa.
[0283] Each of the diseases investigated had a number of proteins that exhibited a differential response between healthy and disease cohorts following protease inhibitor incubation. In participants with osteoarthritis, 12 cytokines exhibited a differential response, including pentraxin-3 and chitinase 3-like 1. Similarly, in participants with ulcerative colitis, 26 cytokines a differential response, including IL-20, IL-27(p28), and BAFF/TNFSF13B. Using the foregoing information, a diagnostic panel may be developed to differentiate between healthy and diseased cohorts.
Example 12. Effect of Protease Inhibitors on Cell Checkpoint Regulator Proteins from Red Blood Cell Components from Cancer Cohorts
[0284] The concentration and change in concentration of proteins specifically implicated in disease states like carcinogenesis, are investigated in red blood cells and red blood cell membranes in the presence and absence of protease inhibitors. Whole blood is collected from healthy volunteers or volunteers with cancer. Blood is collected from each volunteer by venepuncture directly into EDTA vacutainers (k.sub.2EDTA vacutainers, BD Biosciences). The fractions of blood are collected and processed at room temperature within 4 hours of collection. For multiplex analysis (BioPlex analysis) the samples are stored at -80.degree. C. prior to analysis. Following collection, an aliquot of whole blood is frozen at -80.degree. C. The red blood cells are isolated from the remaining whole blood using dextran sedimentation as follows. Whole blood is centrifuged (1500 g, 10 minutes) and the upper plasma layer is discarded. The remaining cell pellet is resuspended in an equal volume of sodium chloride (0.15 M). Dextran (6% w/v in 0.15 M sodium chloride) is then added to this cellular suspension at a 1:4 ratio (dextran:cell suspension). This solution is left at room temperature for 30 minutes for red blood cell sedimentation to the bottom of the tube. The upper white blood cell rich layer is discarded and the lower red blood cell fraction is isolated. The red blood cell fraction is washed once in phosphate buffered saline (PBS, 500 g, 5 minutes) and the remaining red blood cell pellet is counted (Coulter Act Diff, Beckman Coulter). The red blood cells are then diluted to 400 million cells/mL in PBS and incubated at 37.degree. C. and 5% CO.sub.2 for 24 hours. Some samples are also treated with individual protease inhibitors in Table 5, a commercial protease inhibitor cocktail (cOmplete, Roche), or A8127s protease inhibitor cocktail during the PBS incubation. The A8127s protease inhibitor cocktail comprises antipain-dihydrochloride (50 .mu.g/mL); bestatin (40 .mu.g/mL); E-64 (10 .mu.g/mL); leupeptin (5 .mu.g/mL); pepstatin (0.7 .mu.g/mL); phosphoramidon (330 .mu.g/mL); Pefabloc SC (1 mg/mL); EDTA-Na.sub.2 (0.5 mg/mL); and aprotinin (2 .mu.g/mL).
[0285] For the isolation of red blood cell membranes, the frozen aliquots of the whole blood are subjected to 3 freeze thaw cycles to ensure complete cellular lysis. Following this, an aliquot of the lysates (volume equivalent to 120 million red blood cells per 100 .mu.L) was added to PBS at a 1:20 ratio (lysate:PBS). The red blood cell membranes are then isolated by centrifugation out of solution (16,000 g, 20 mins, 4.degree. C.). The upper fraction is then discarded and the resulting membranes were then diluted to 1,200 million cells/mL in PBS and are incubated at 37.degree. C. and 5% CO.sub.2 for 24 hours. Some red blood cell membrane samples are treated with the protease inhibitor cocktails (complete, Roche; A8127s).
[0286] After incubation, the resulting conditioned PBS is isolated by centrifugation (16,000 g, 20 minutes, 4.degree. C.). The samples are stored at -80.degree. C. The conditioned PBS samples are then analysed on a multiplex assay. A 14-plex human immuno-oncology checkpoint panel that assays CD137 (4-1BB), CD152 (CTLA-4), CD223 (Lag-3), CD27, CD270 (HVEM), CD272 (BTLA), CD279 (PD-1), CD28, CD357 (GITR), CD80 (B7-1), TIM3 (ProcartaPlex 14-plex human immuno-oncology checkpoint panel, Affymetrix eBioscience) is used. The assays are performed according to the manufacturer's instructions using an automated magnetic wash station (BioPlex Pro II, Bio-Rad) for the washing steps. The assays are run on the Luminex.RTM. 200.TM. system (Bio-Rad) and fluorescent values were collected. The calibration curve for each cytokine is analysed with 5 parametric logistic curve regression using BioPlex manager software (ver. 5.0, Bio-Rad, USA).
[0287] The concentration is measured of proteins in red blood cell-conditioned PBS at 400 million cells/mL following incubation at 37.degree. C. for 24 hours with individual protease inhibitors, the red blood cells from healthy participants or participants with cancer. The data indicate changes in protein concentration in red blood cells from individuals with cancer compared to those from healthy individuals (FIG. 32-45). In addition, the individual protease inhibitors have varying effects on protein concentration. Such information may be used to customize a protease inhibitor cocktail such that there is a greater magnitude of effect on protein concentration in red blood cell components from individuals with cancer. For example, specific individual protease inhibitors may be added or removed from a protease inhibitor cocktail based on data indicating the effect of the protease inhibitor on protein concentration. A protease inhibitor cocktail may be optimized to emphasize/maximize statistically significant differences between the healthy and cancer profiles.
[0288] The concentration is measured of proteins in red blood cell-conditioned PBS at 400 million cells/mL and red blood cell membrane-conditioned PBS at 1,200 million cells/mL following incubation at 37.degree. C. for 24 hours with either no protease inhibitors or protease inhibitor cocktails in red blood cell components from healthy participants or participants with cancer. Values are significantly different (*) if p<0.05. Data are presented as the mean.+-.standard deviation. A range of cancer checkpoint proteins are released from red blood cells and red blood cell membranes (FIG. 46-59). The data further demonstrate that protease inhibitors have an effect on the concentration of a range of cancer checkpoint proteins released from the red blood cells and red blood cell membranes of healthy individuals and those with cancer (FIG. 46-59). Moreover, the observed changes following protease inhibitor incubation is different between red blood cell components isolated from healthy participants and those with colorectal cancer.
[0289] The fold change of proteins in red blood cell-conditioned PBS at 400 million cells/mL and red blood cell membrane-conditioned PBS (isolated from whole blood lysates) at 1,200 million cells/mL following incubation at 37.degree. C.
D00000
D00001
D00002
D00003
D00004
D00005
D00006
D00007
D00008
D00009
D00010
D00011
D00012
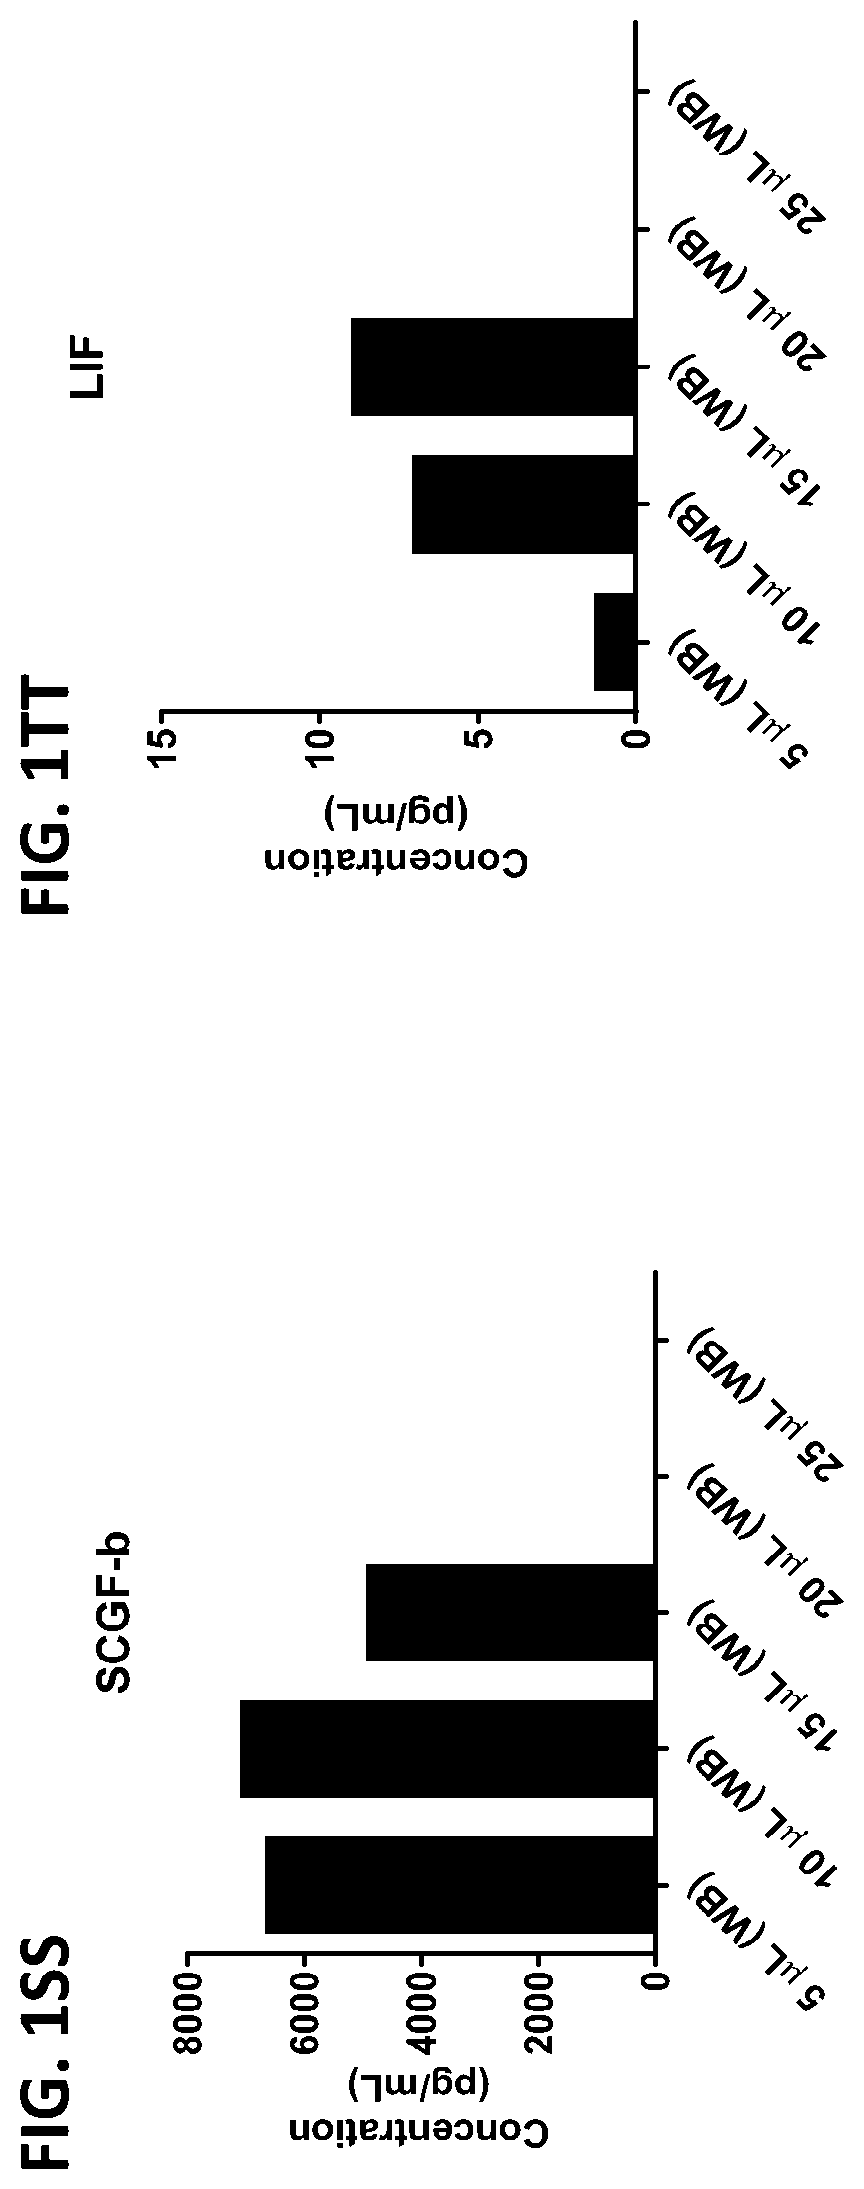
D00013

D00014

D00015
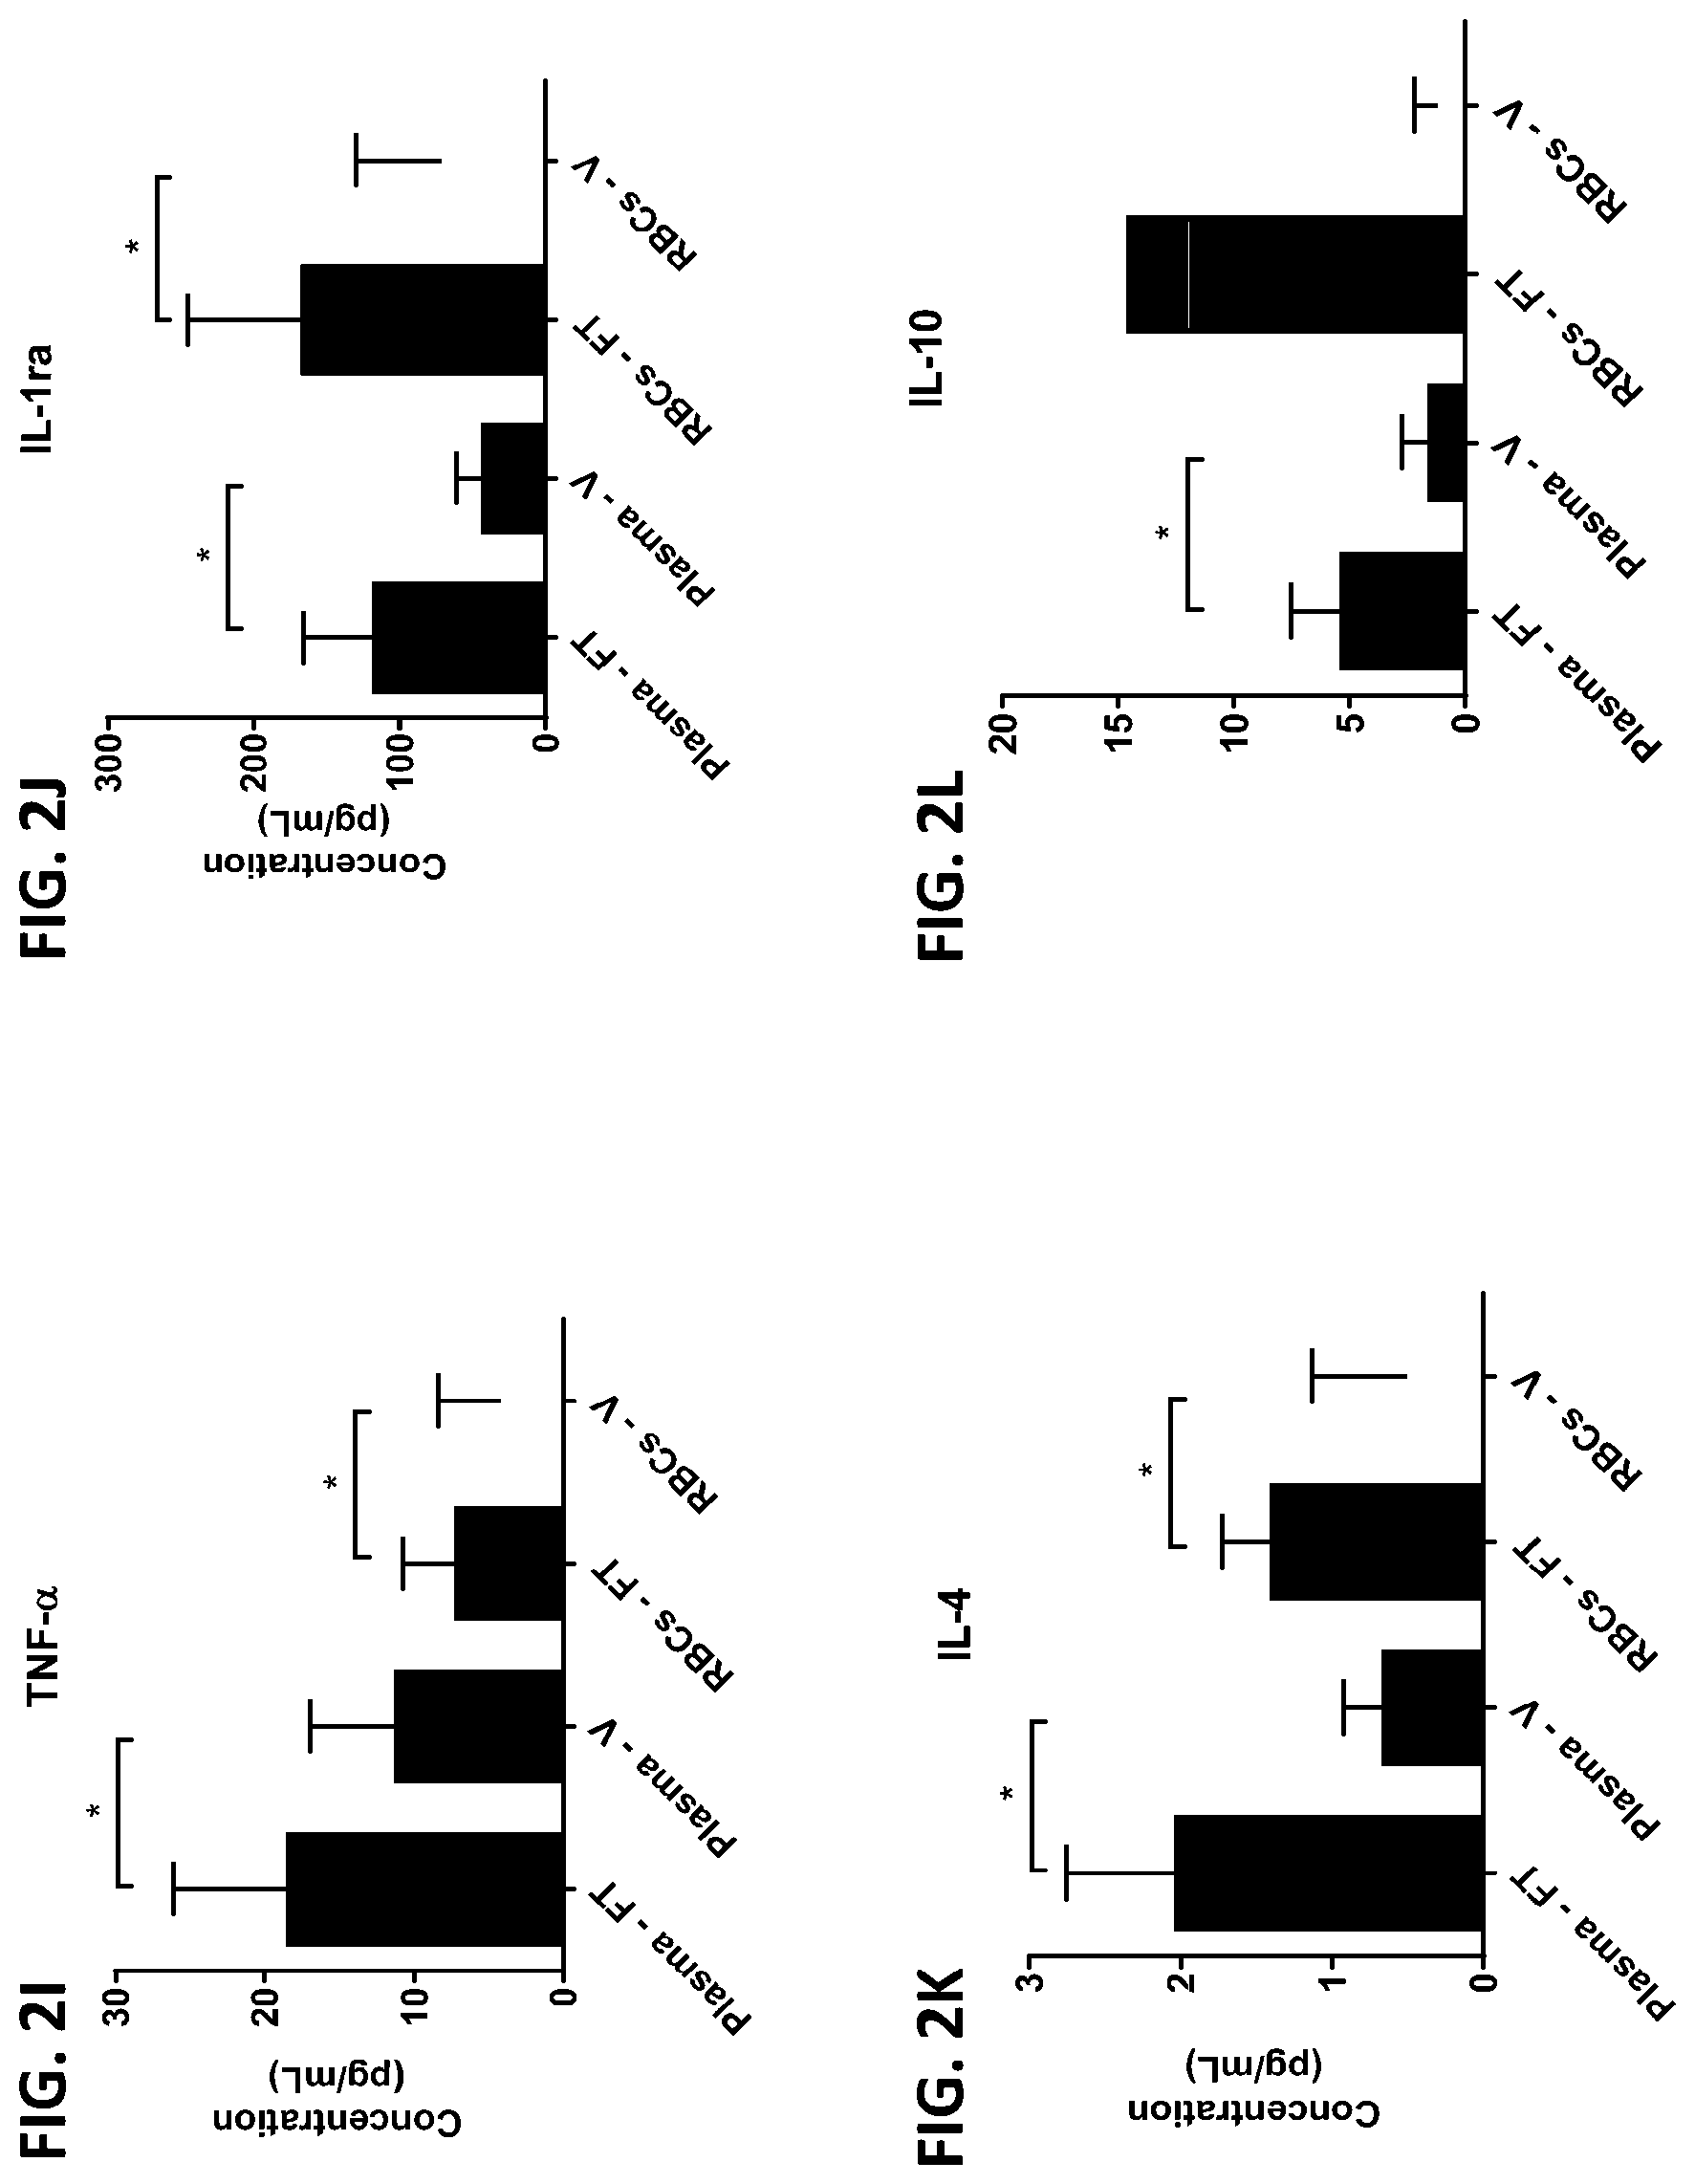
D00016

D00017

D00018
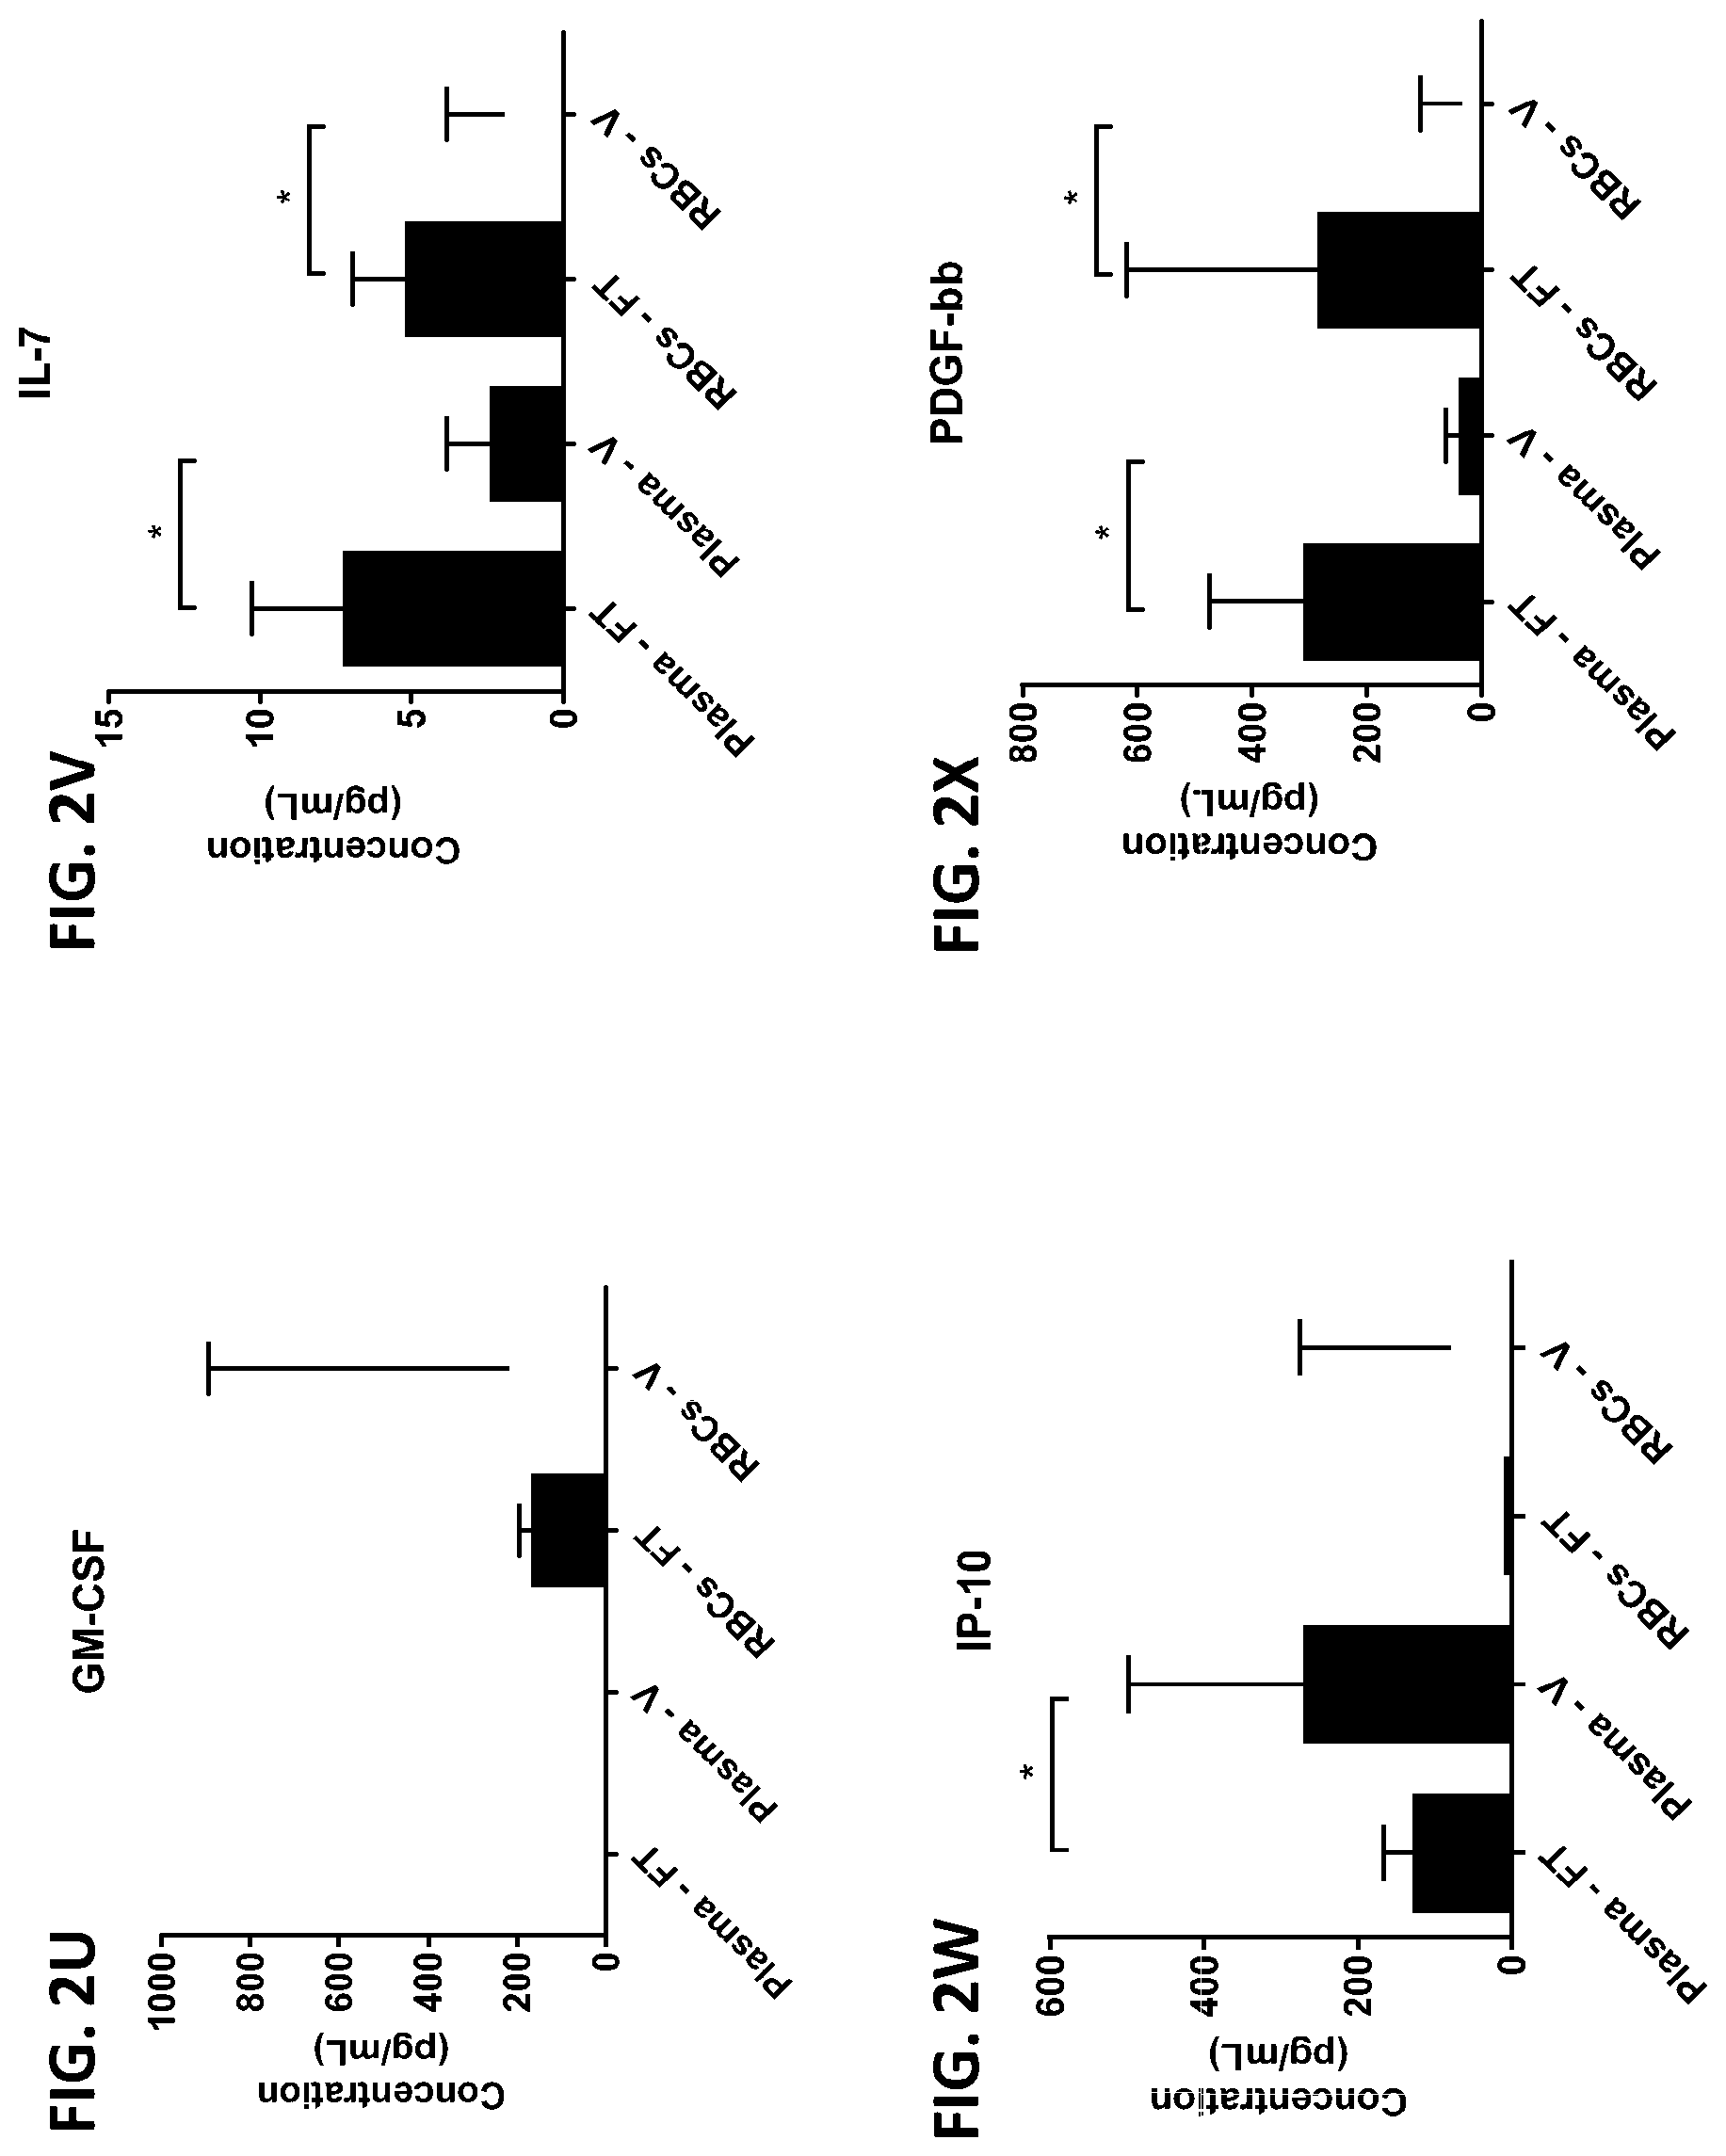
D00019

D00020

D00021
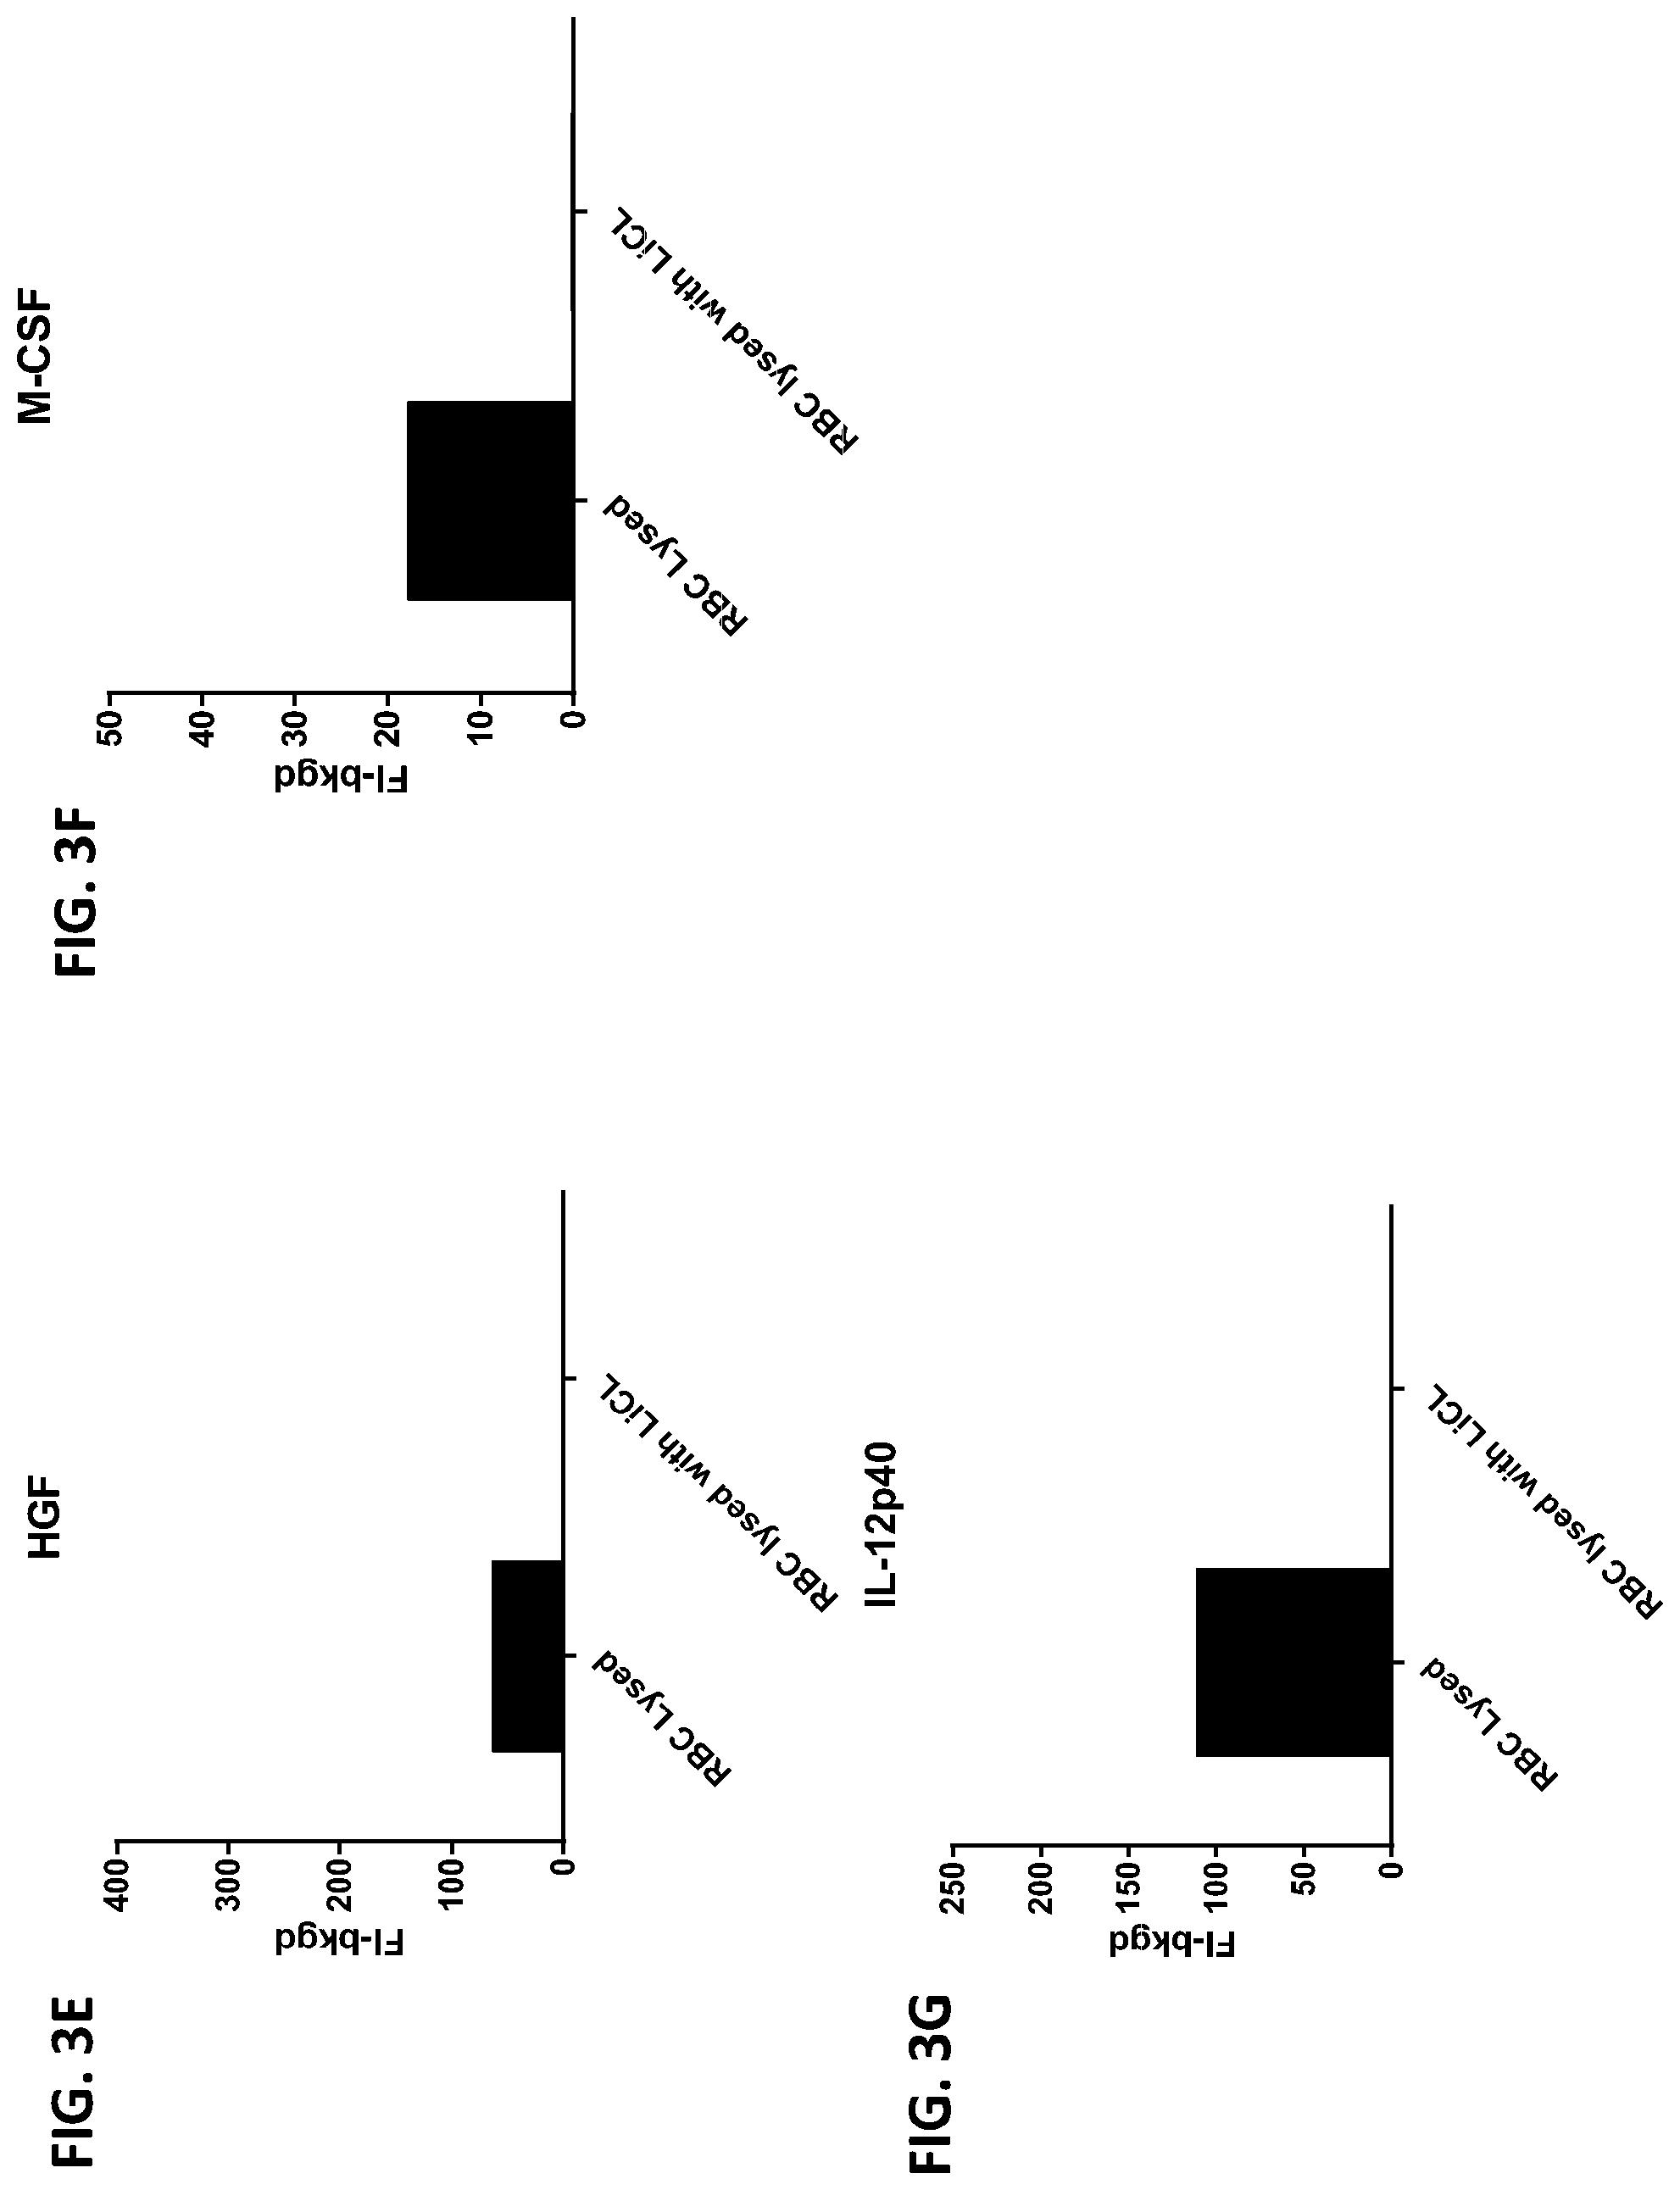
D00022
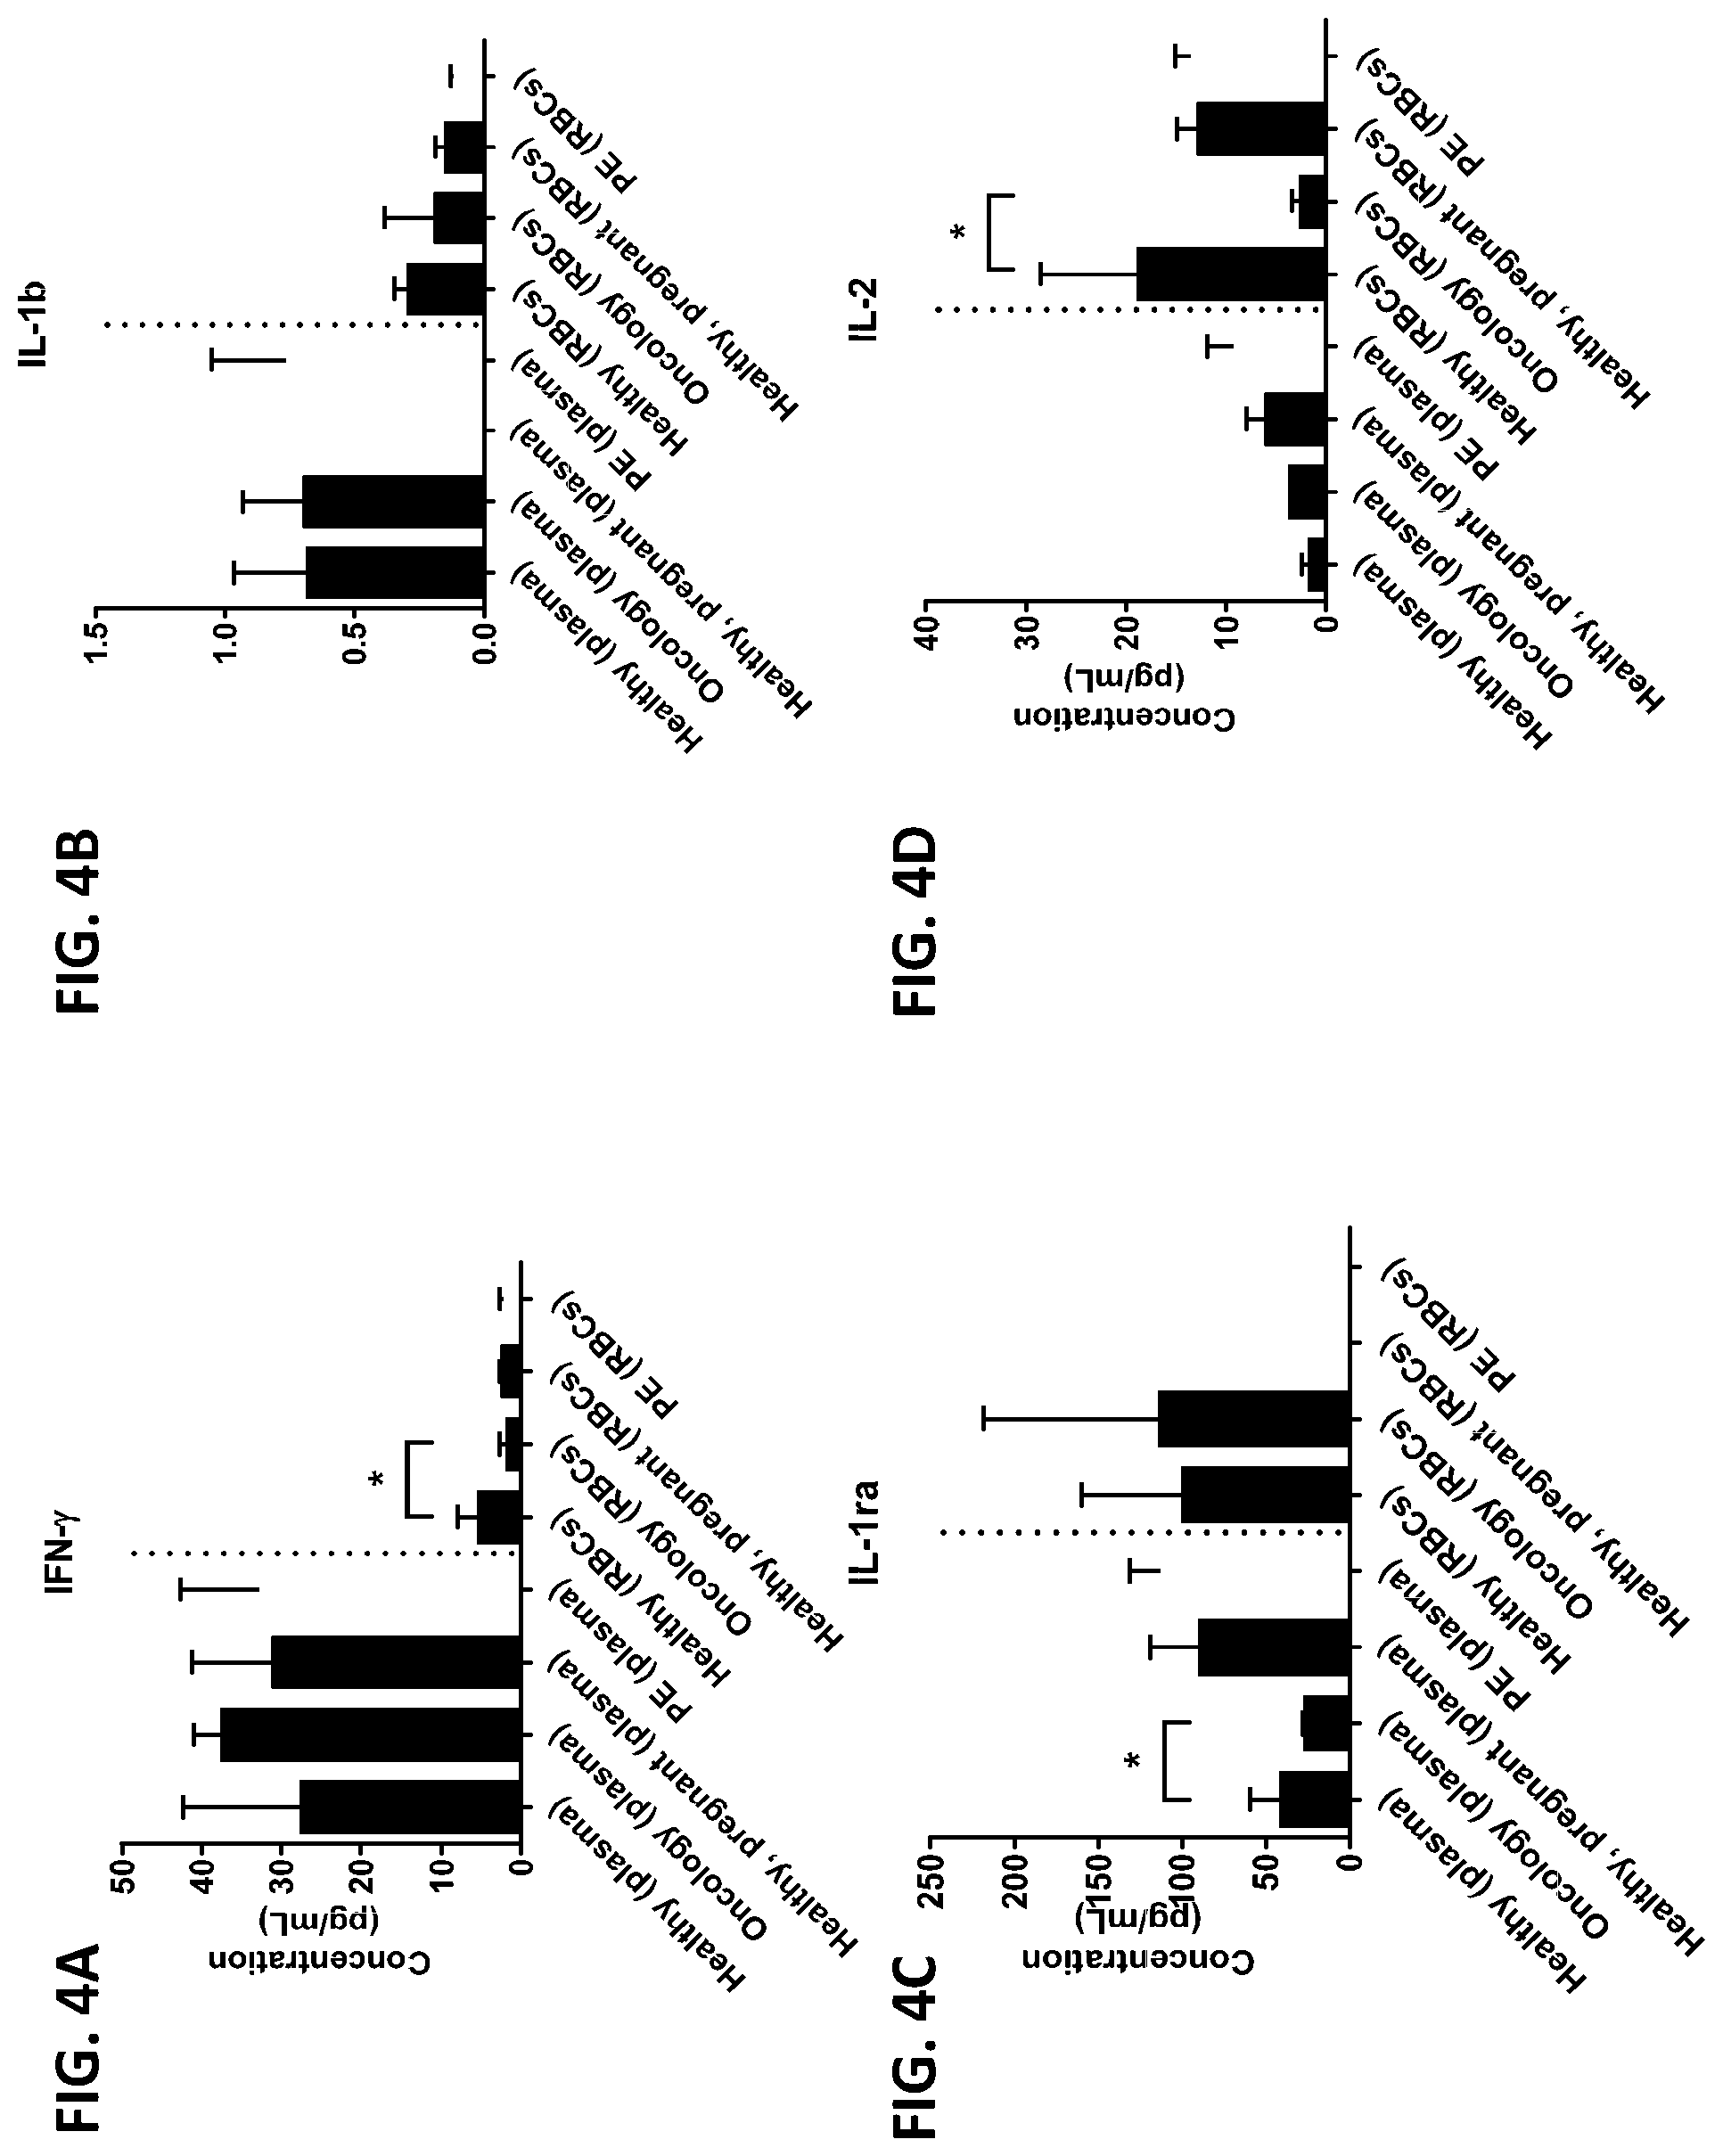
D00023
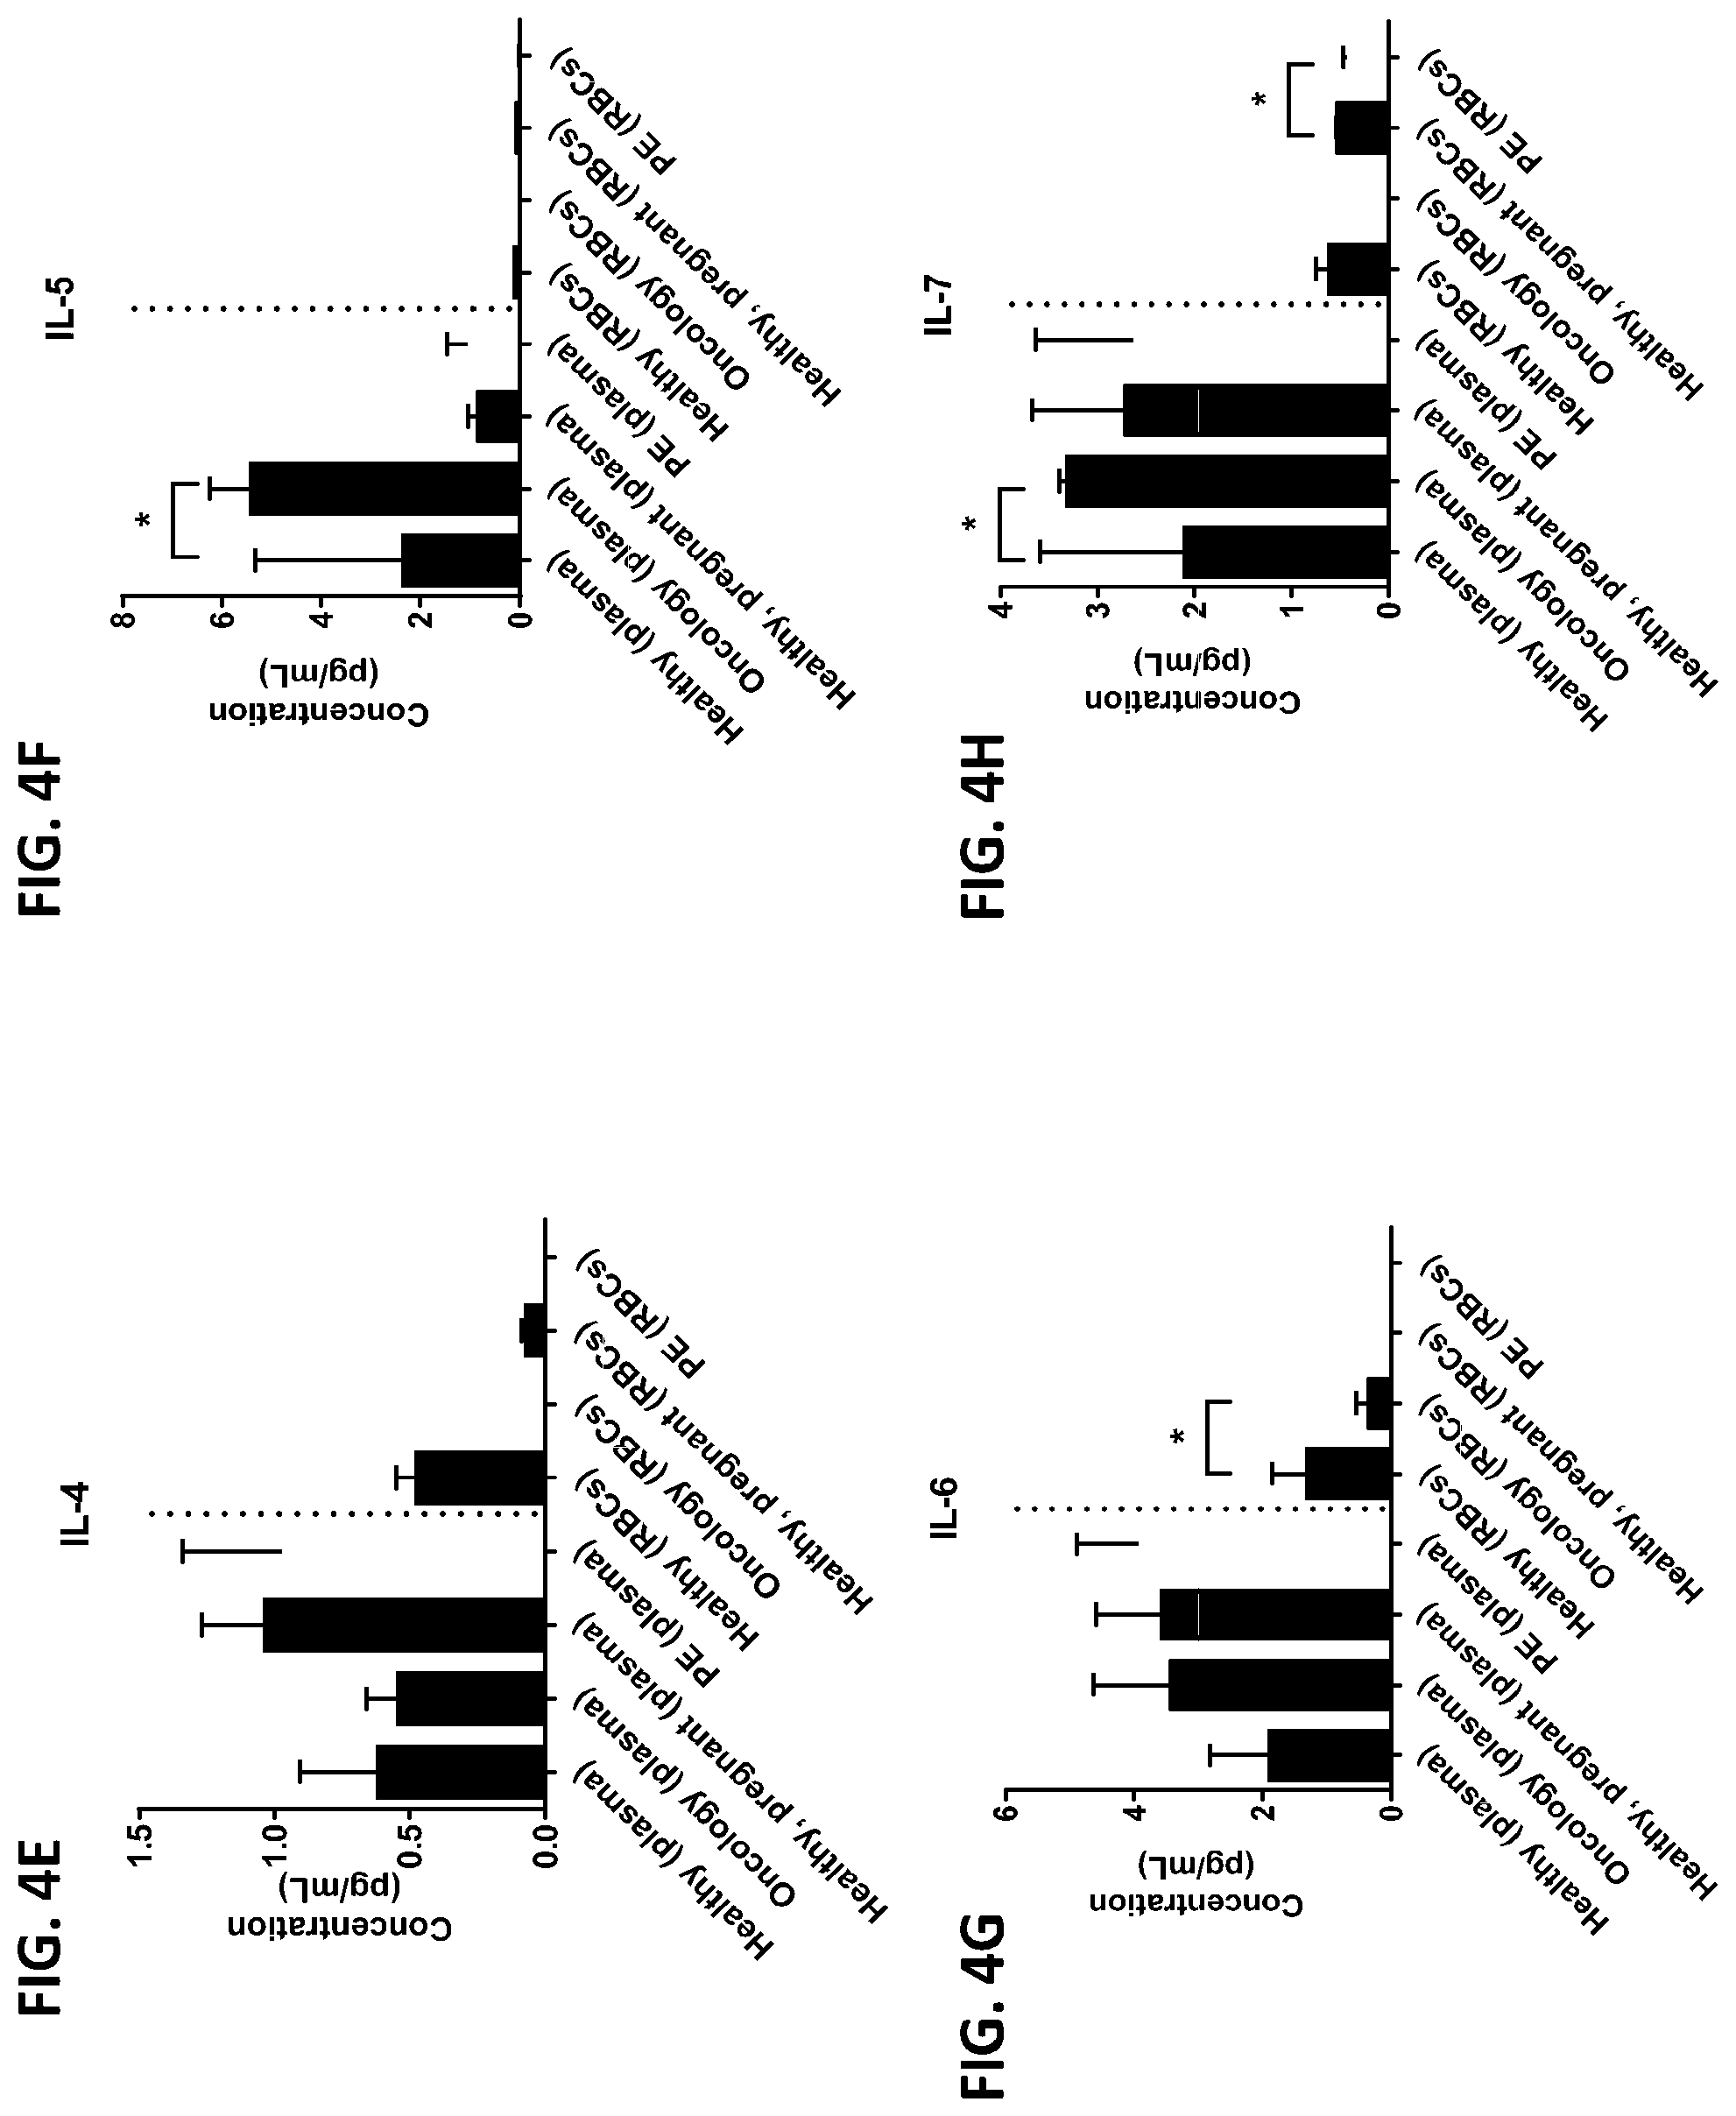
D00024

D00025
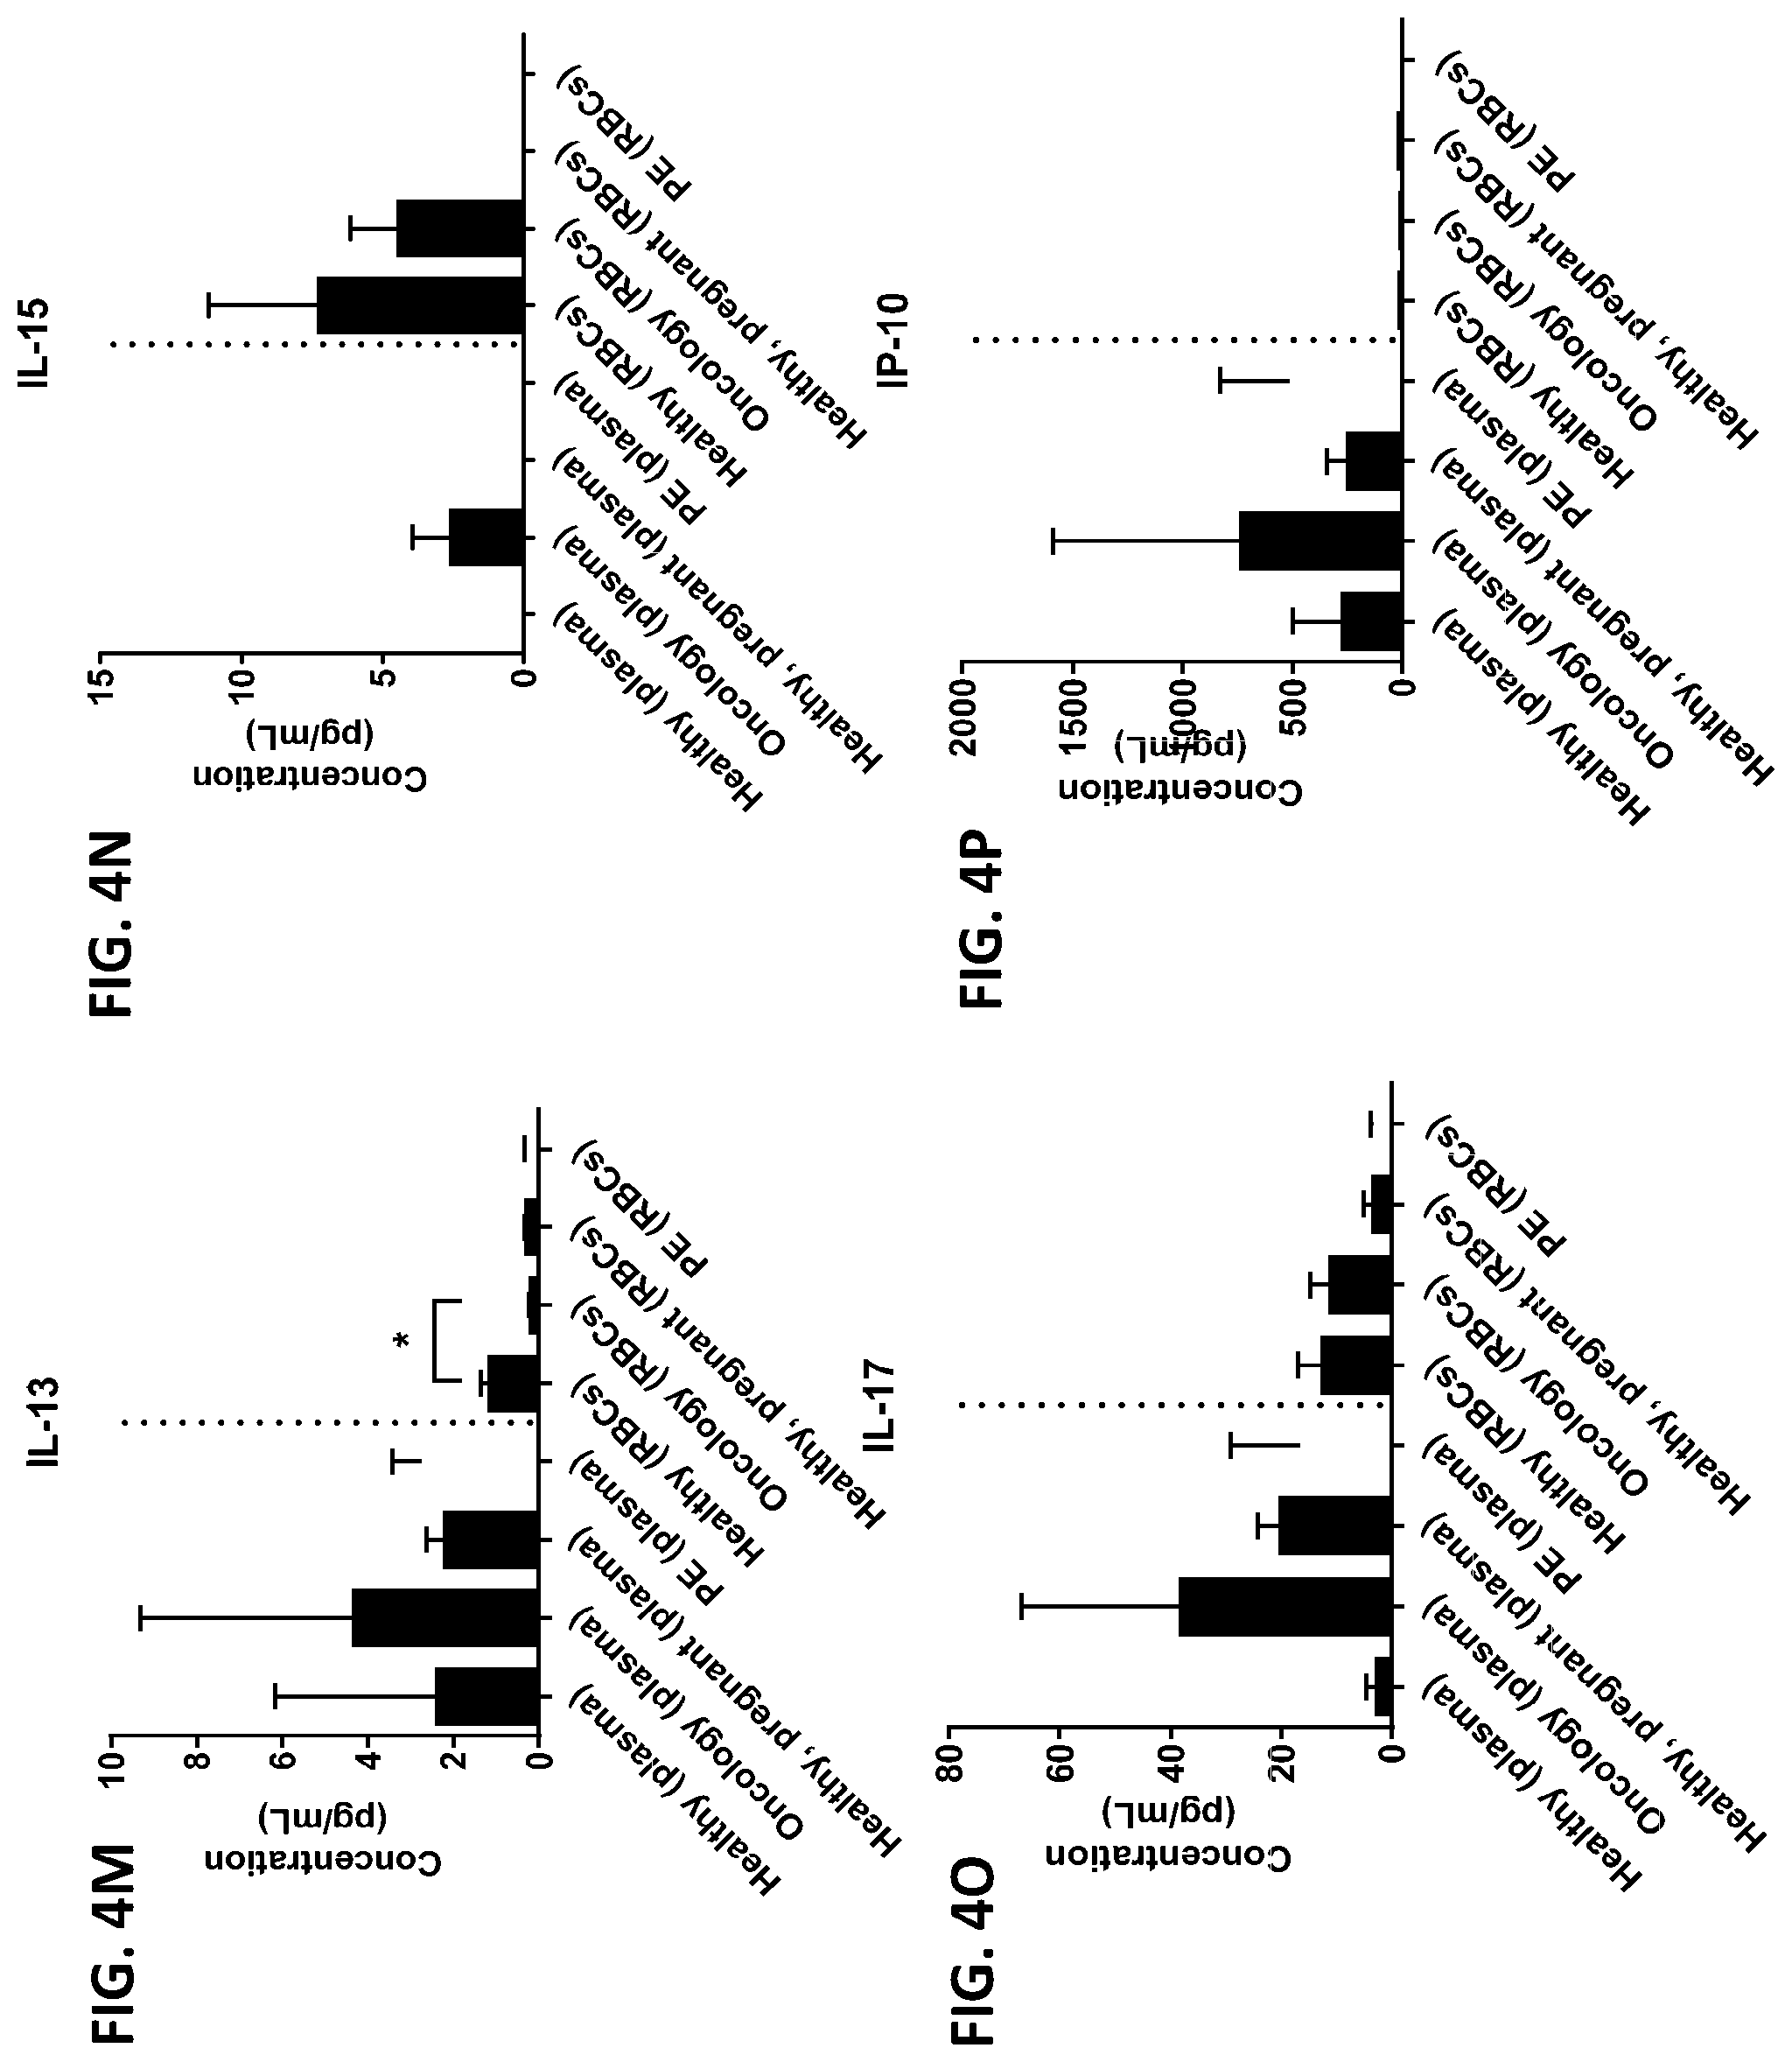
D00026

D00027

D00028

D00029

D00030

D00031
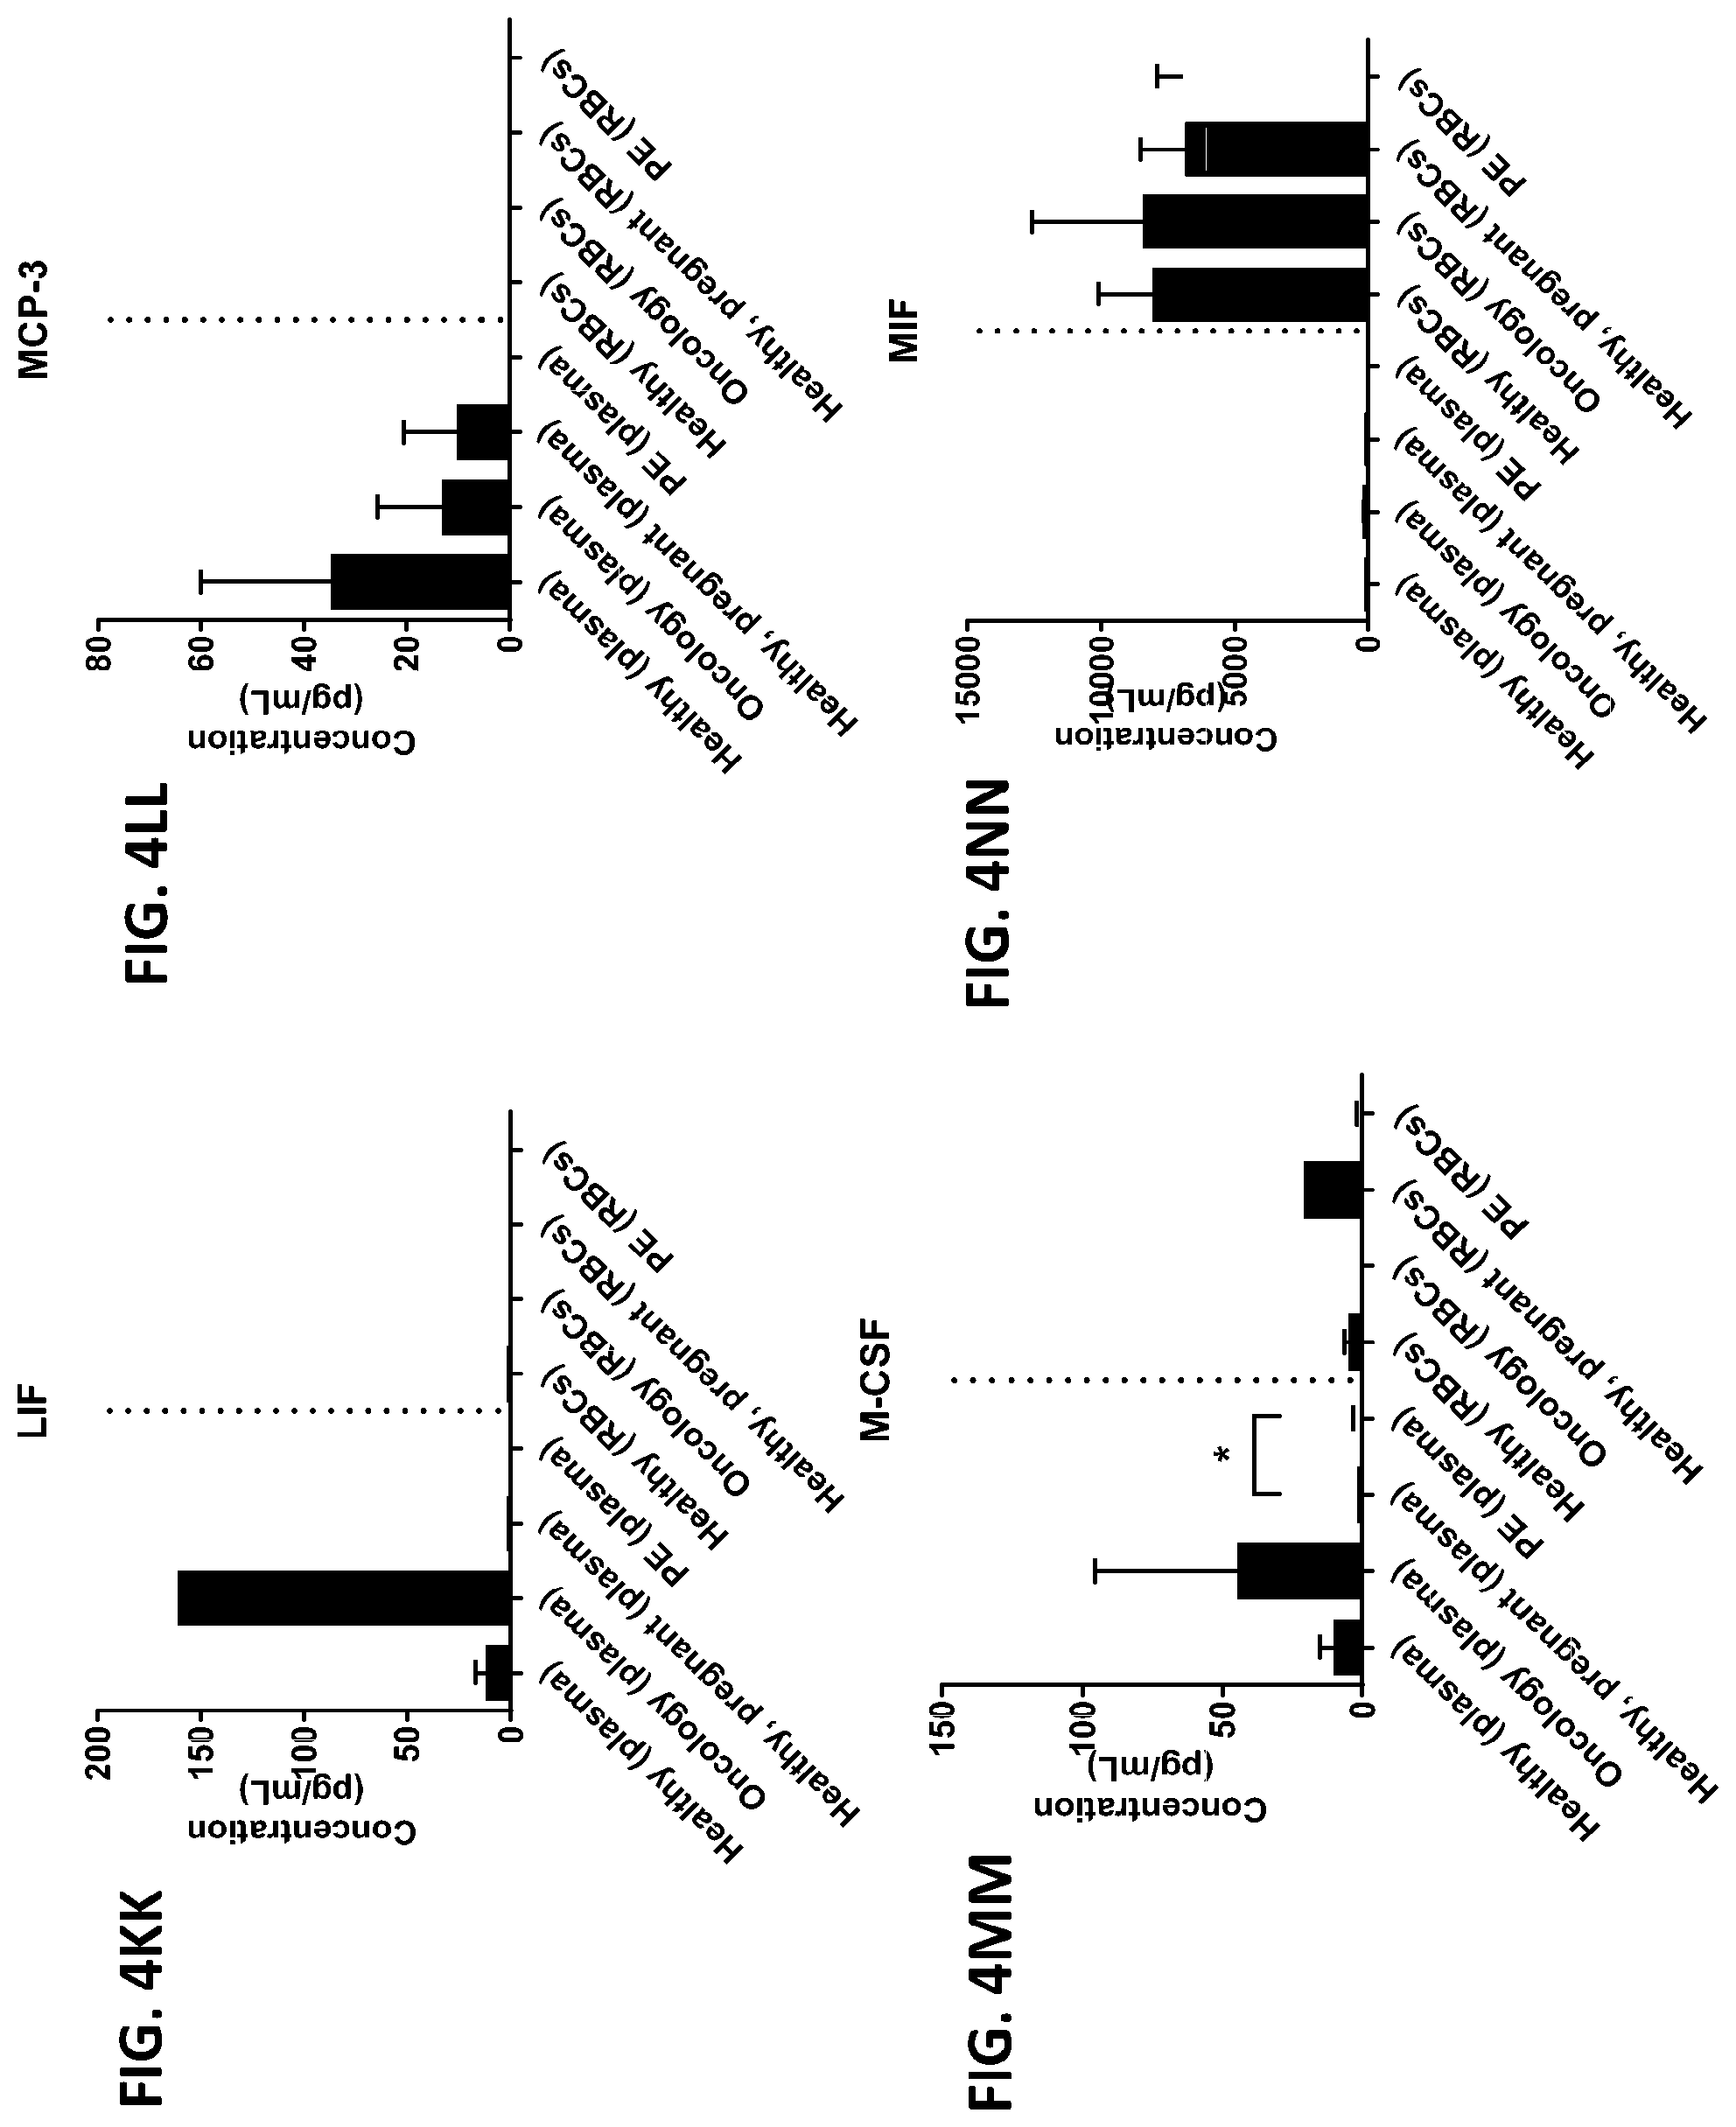
D00032
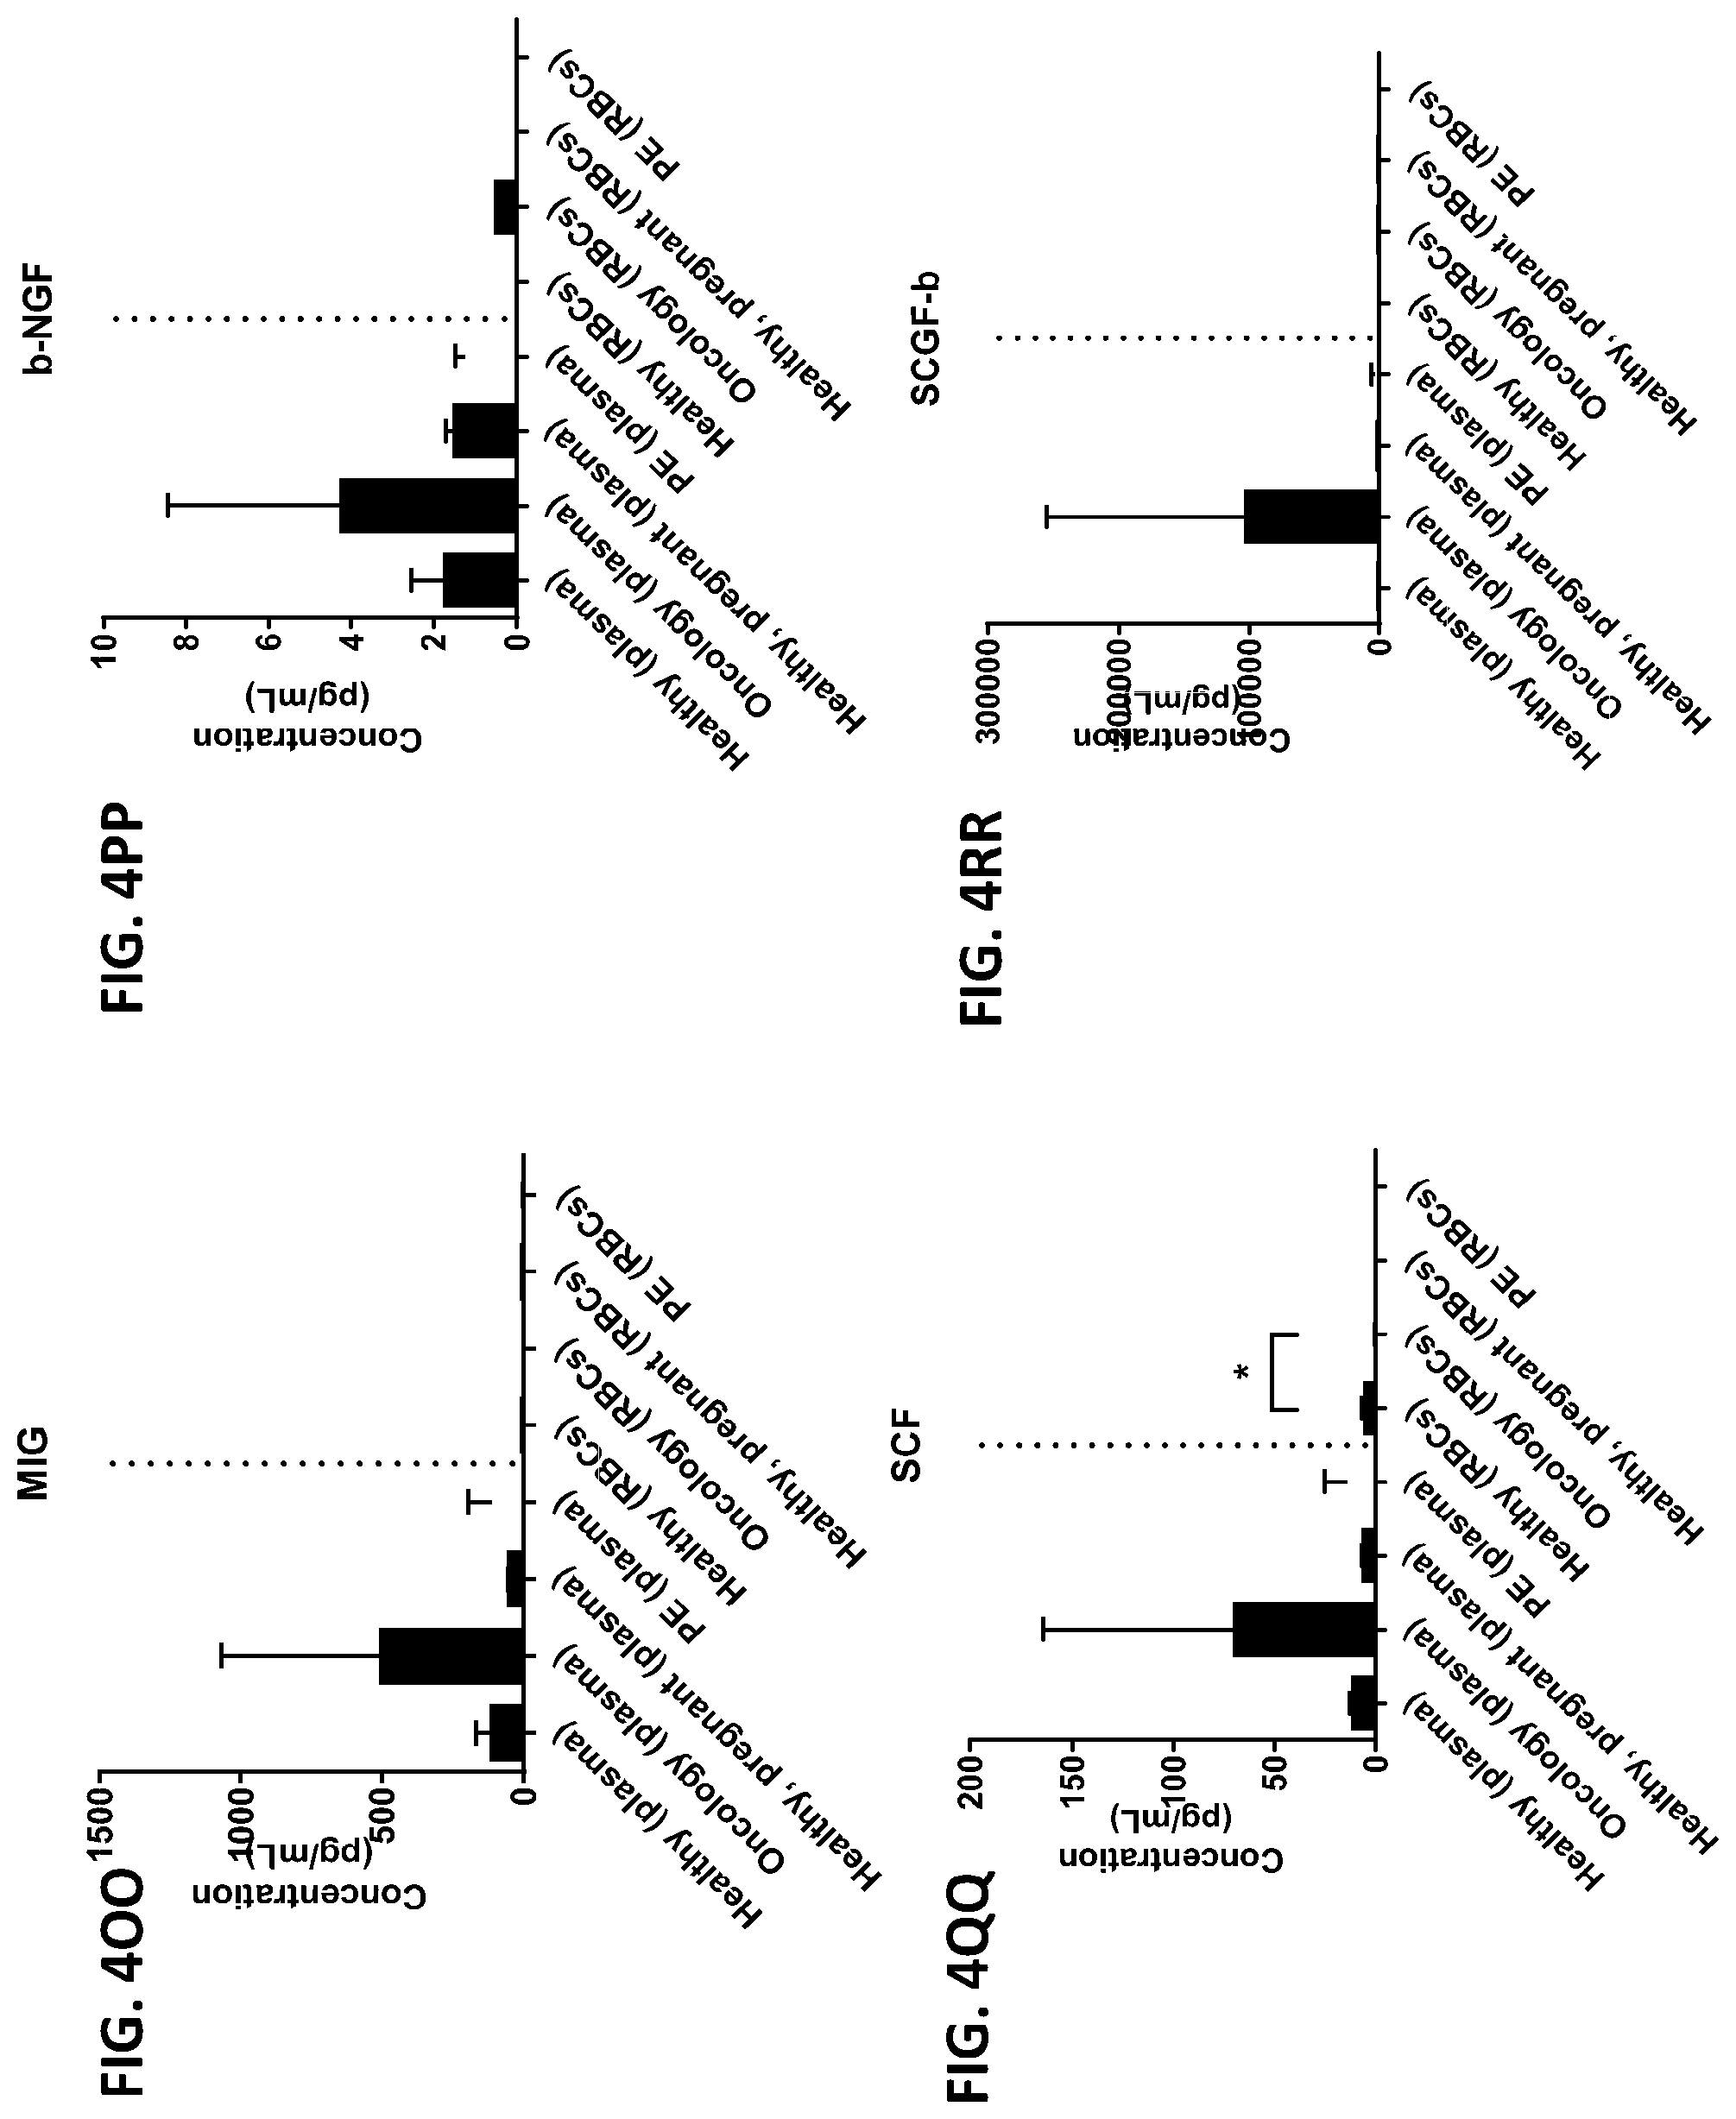
D00033

D00034
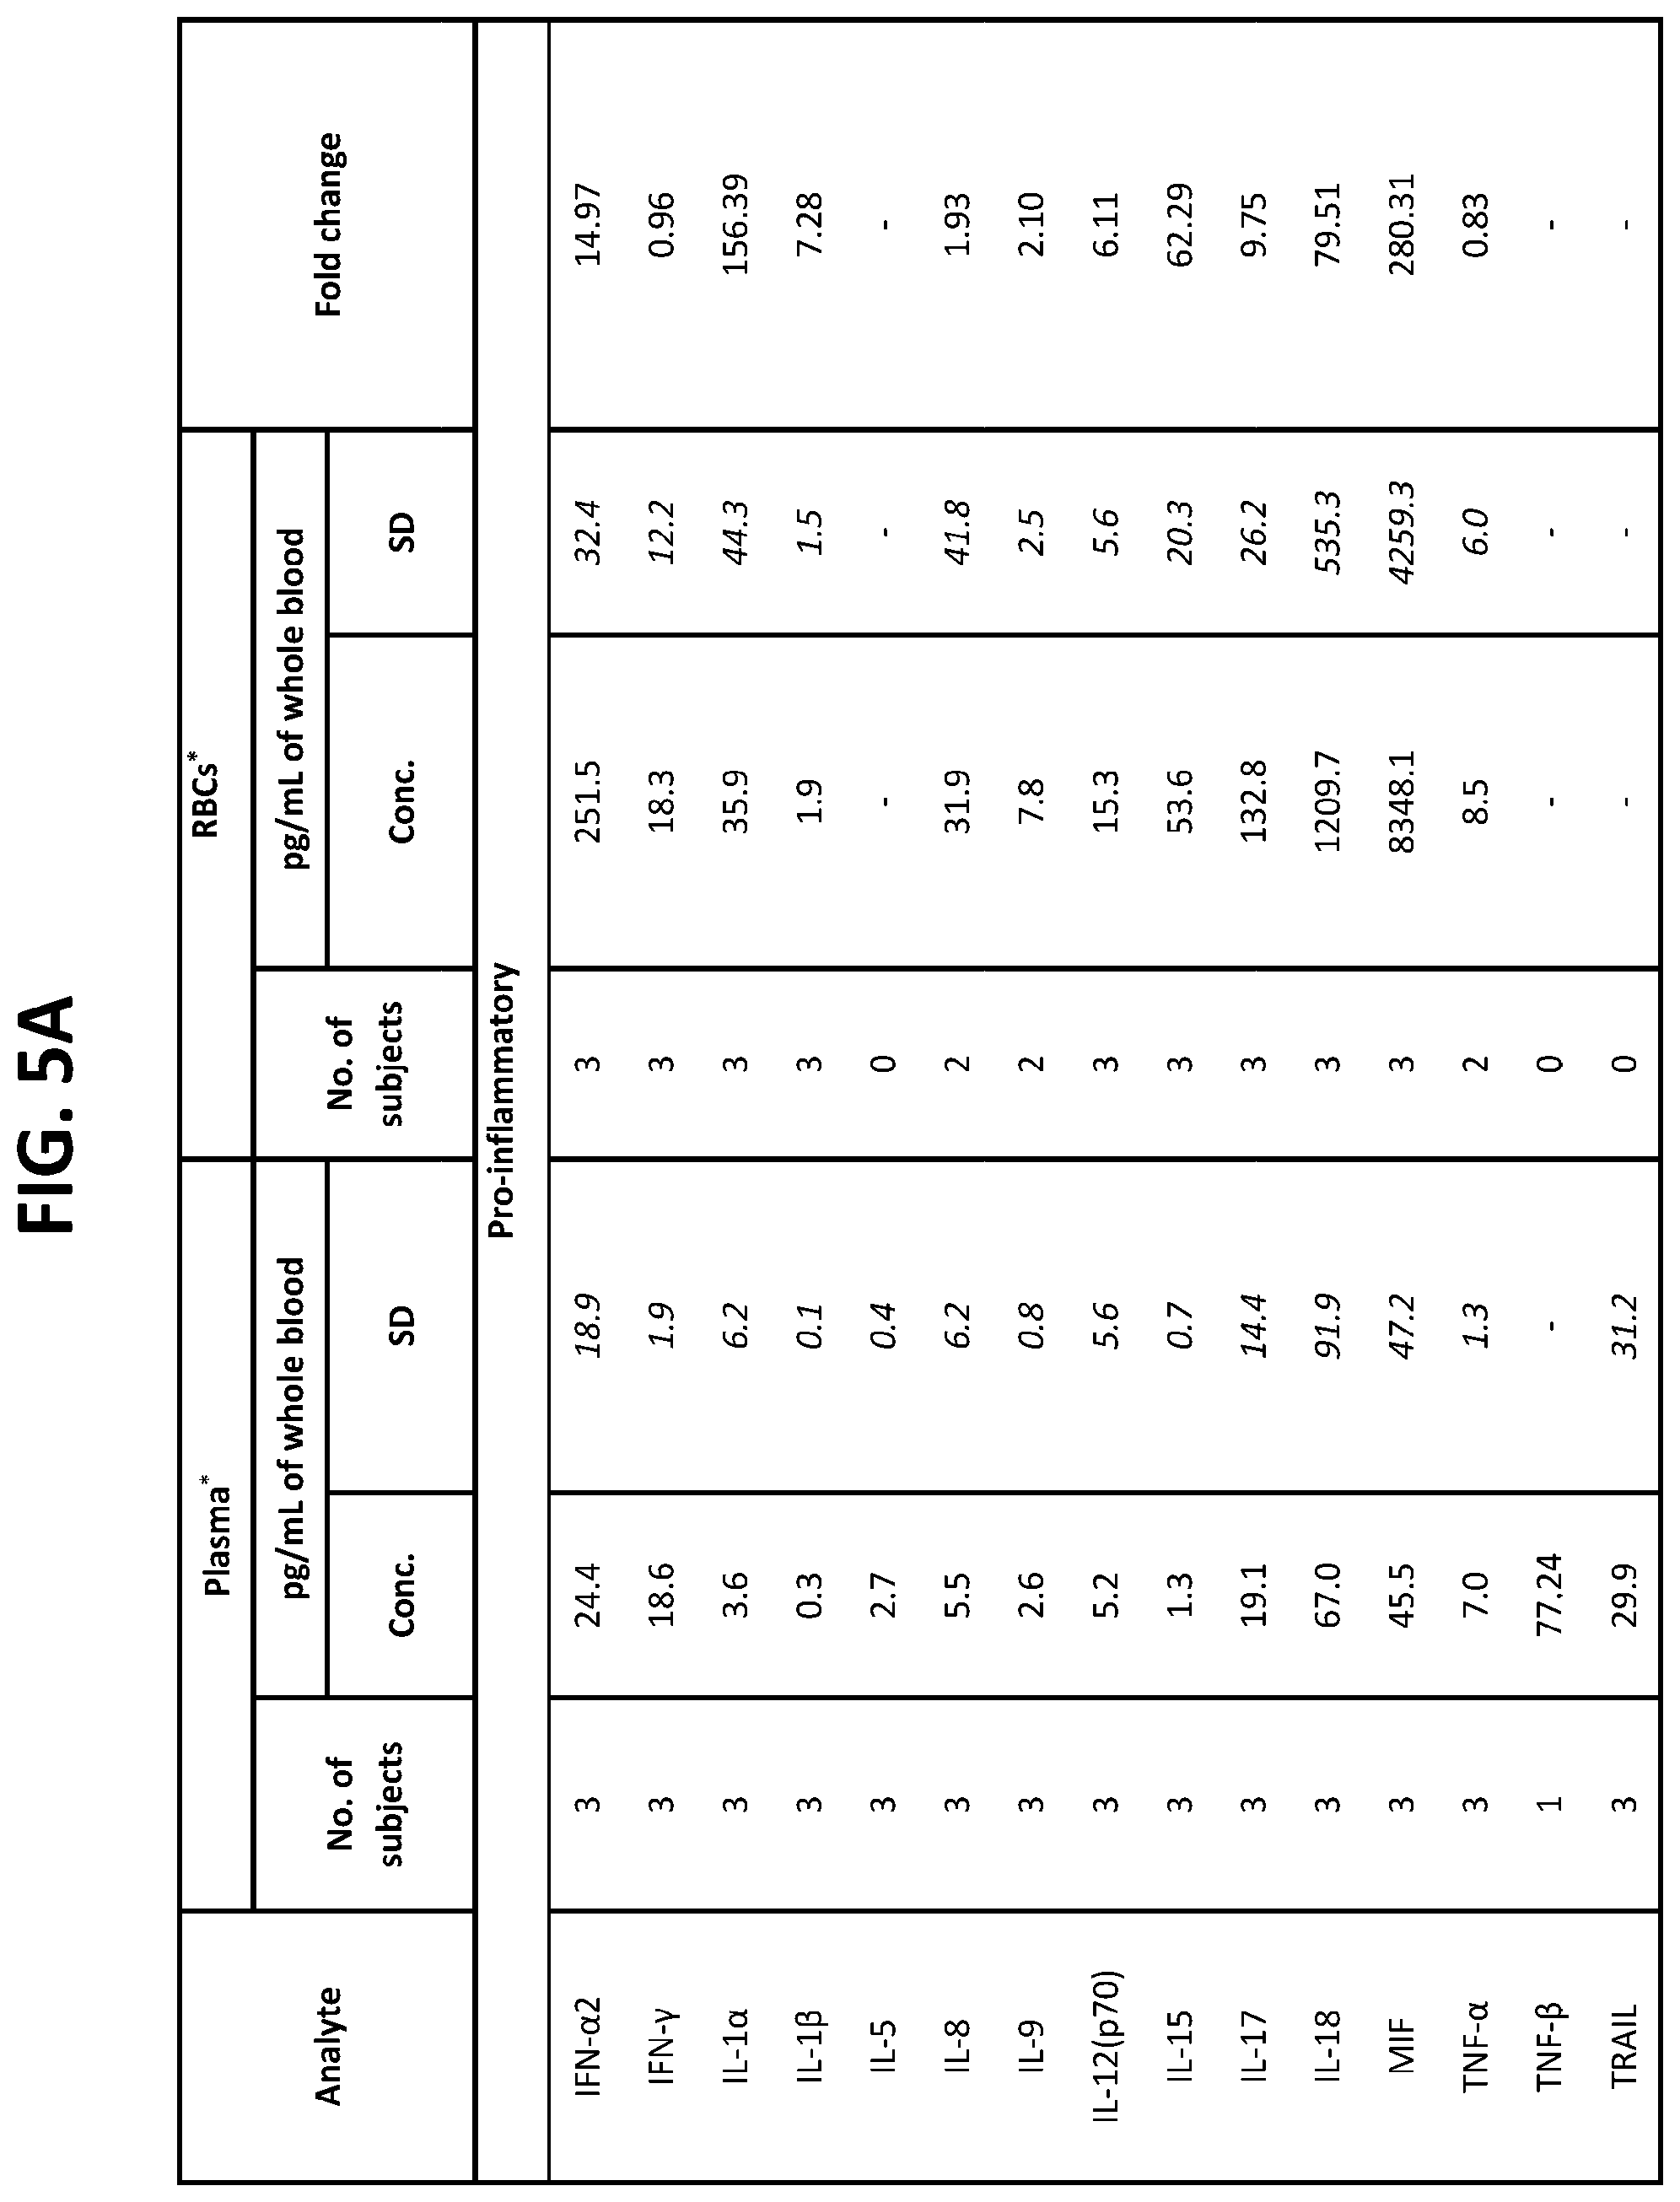
D00035

D00036

D00037

D00038
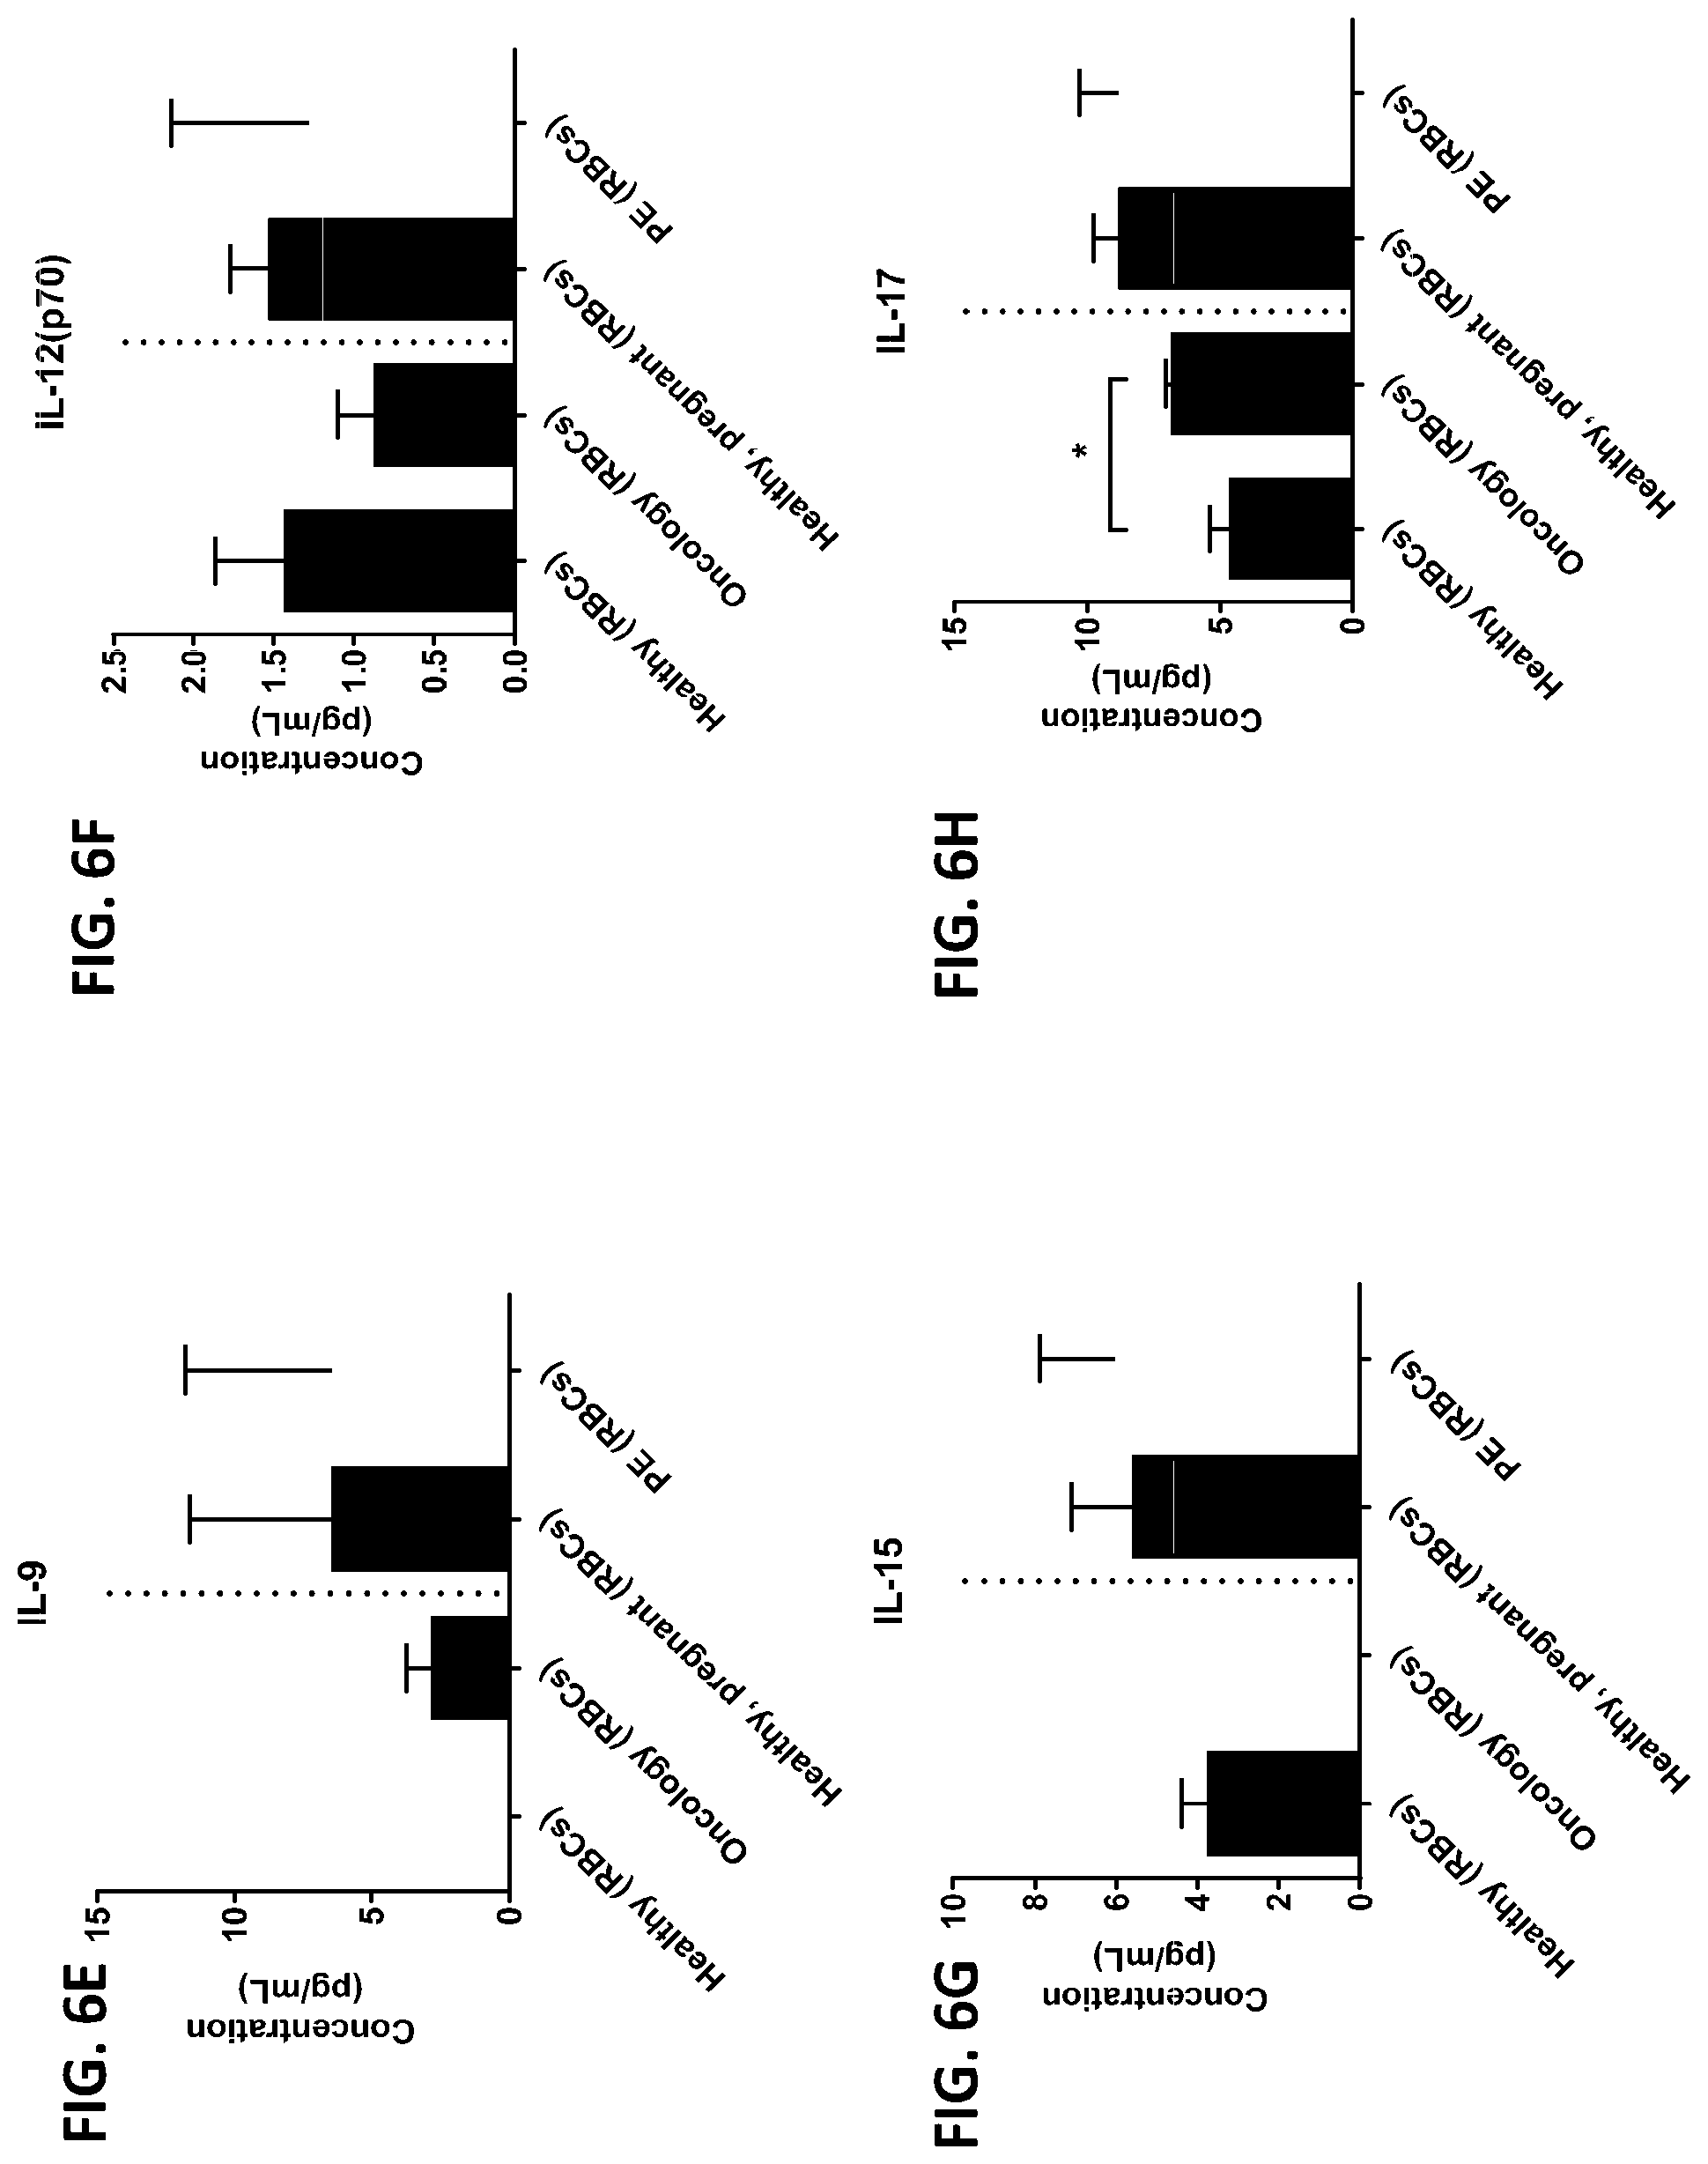
D00039

D00040

D00041
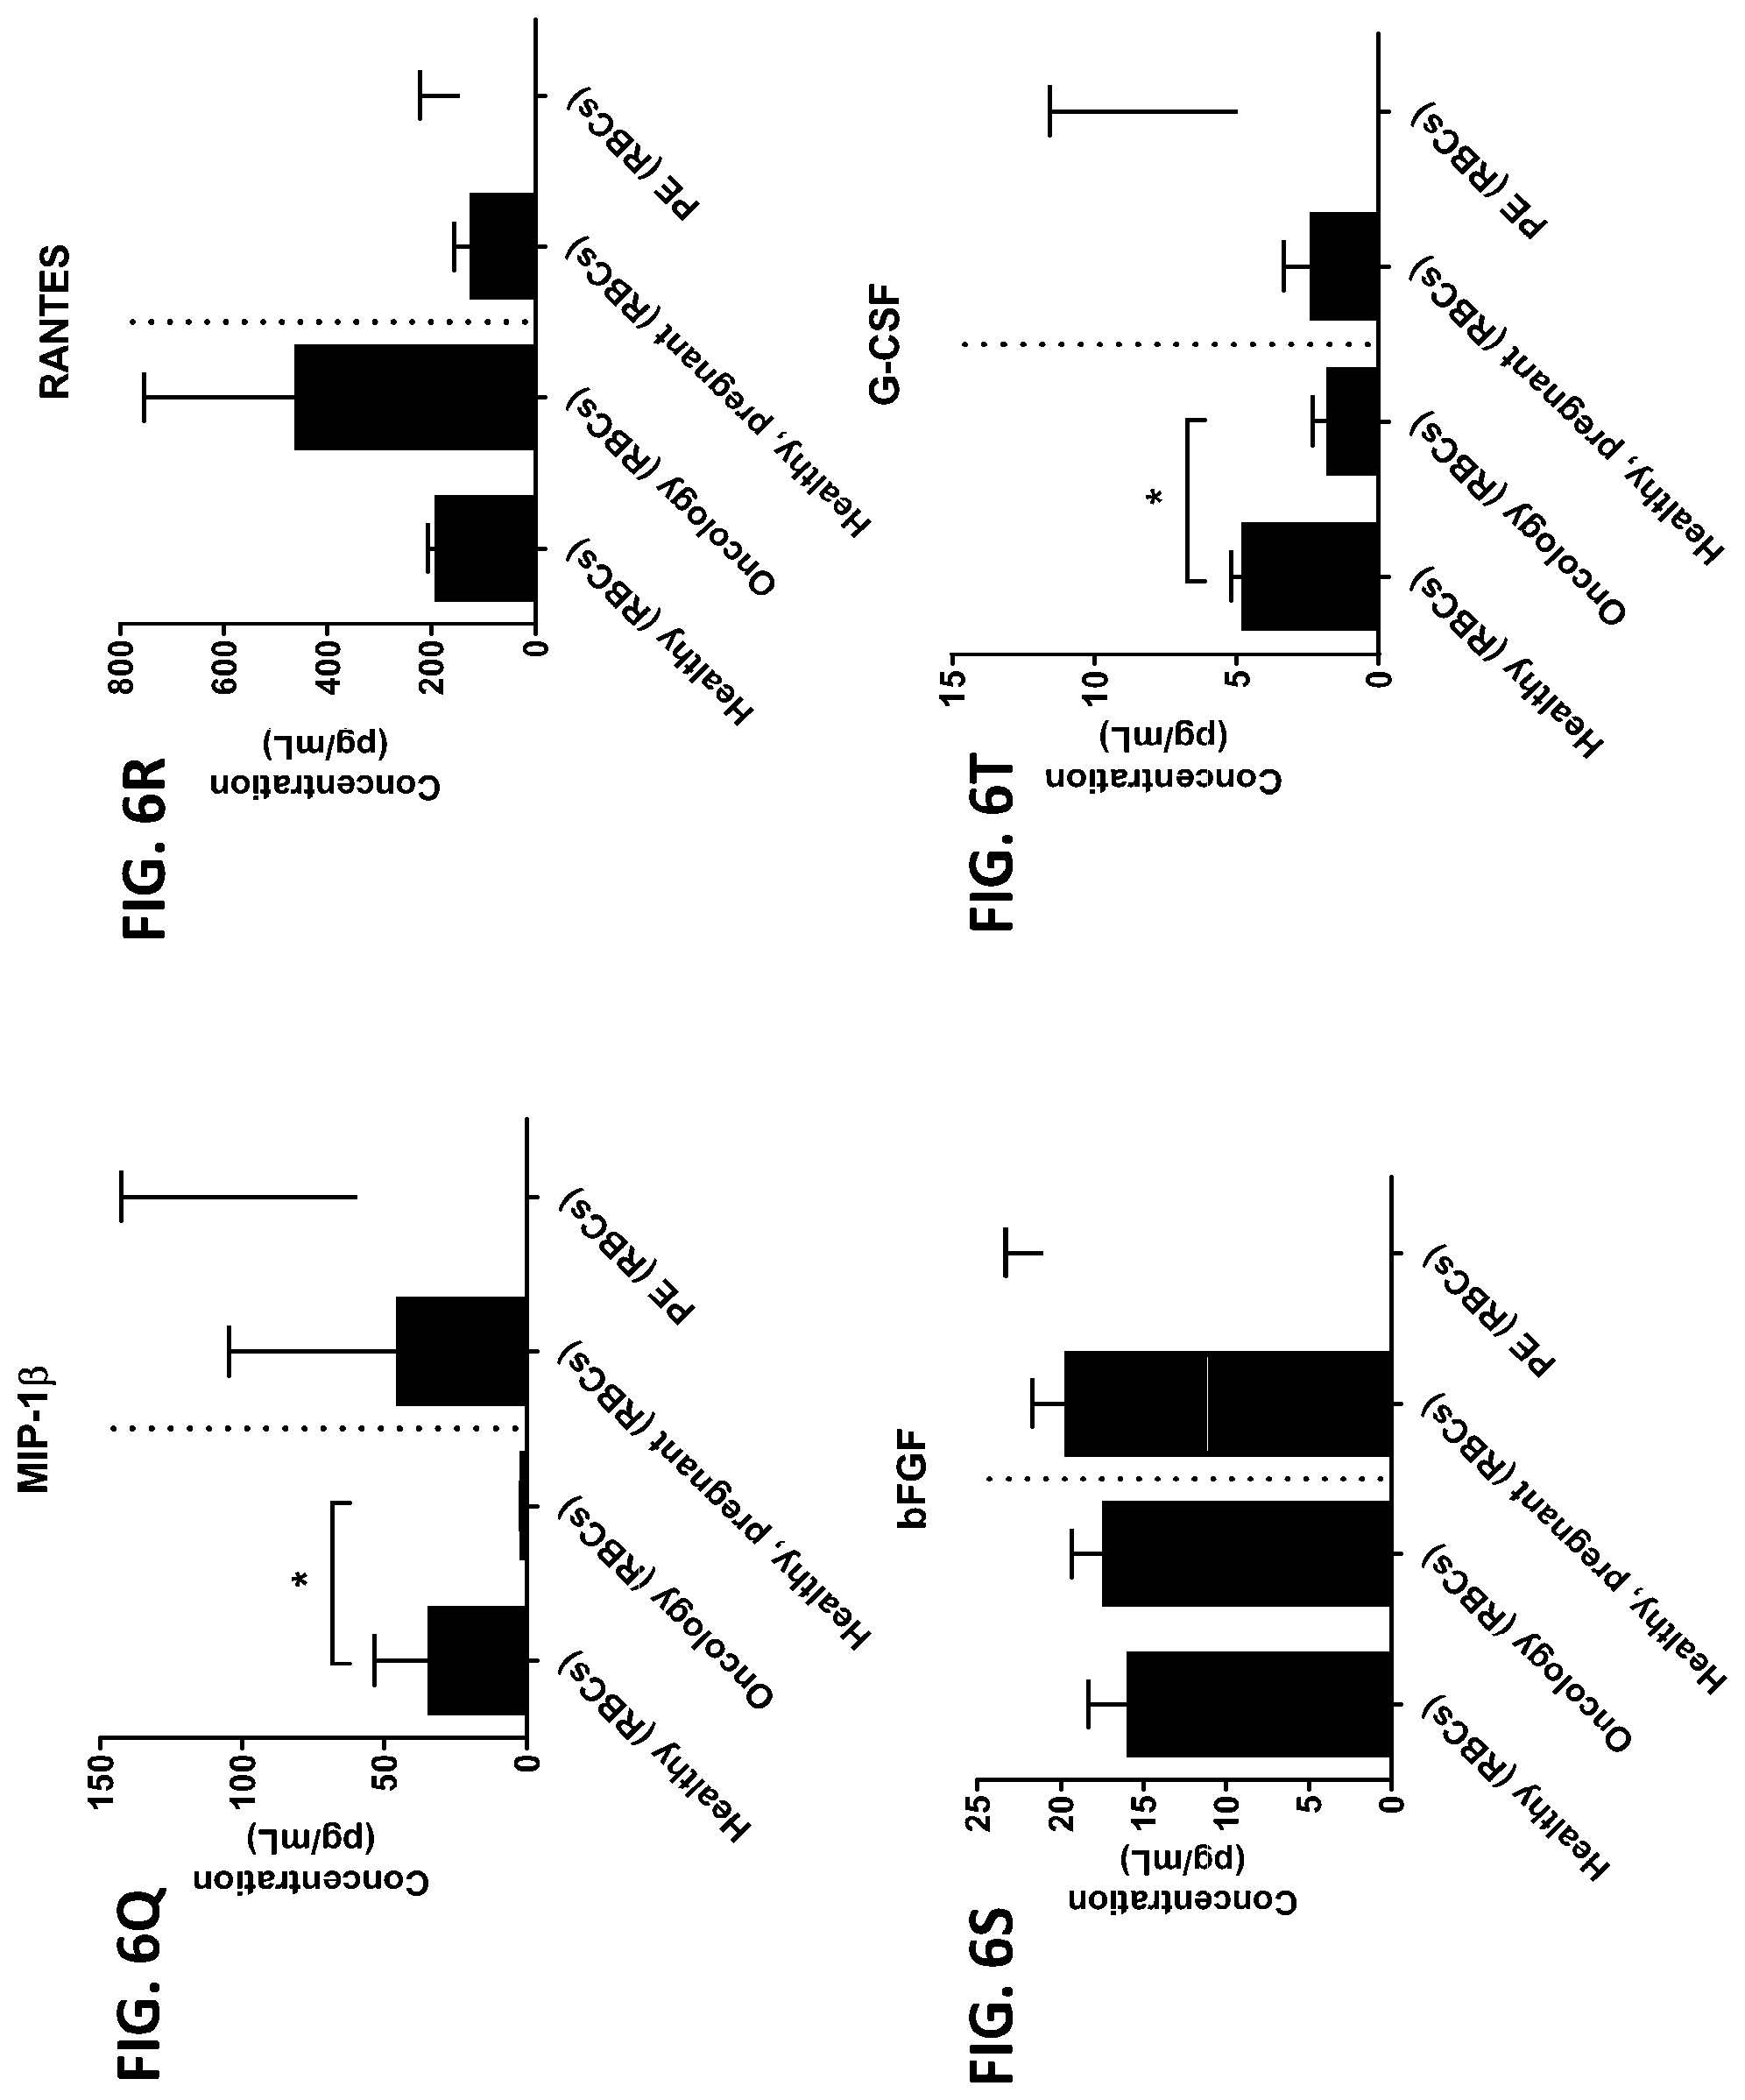
D00042

D00043
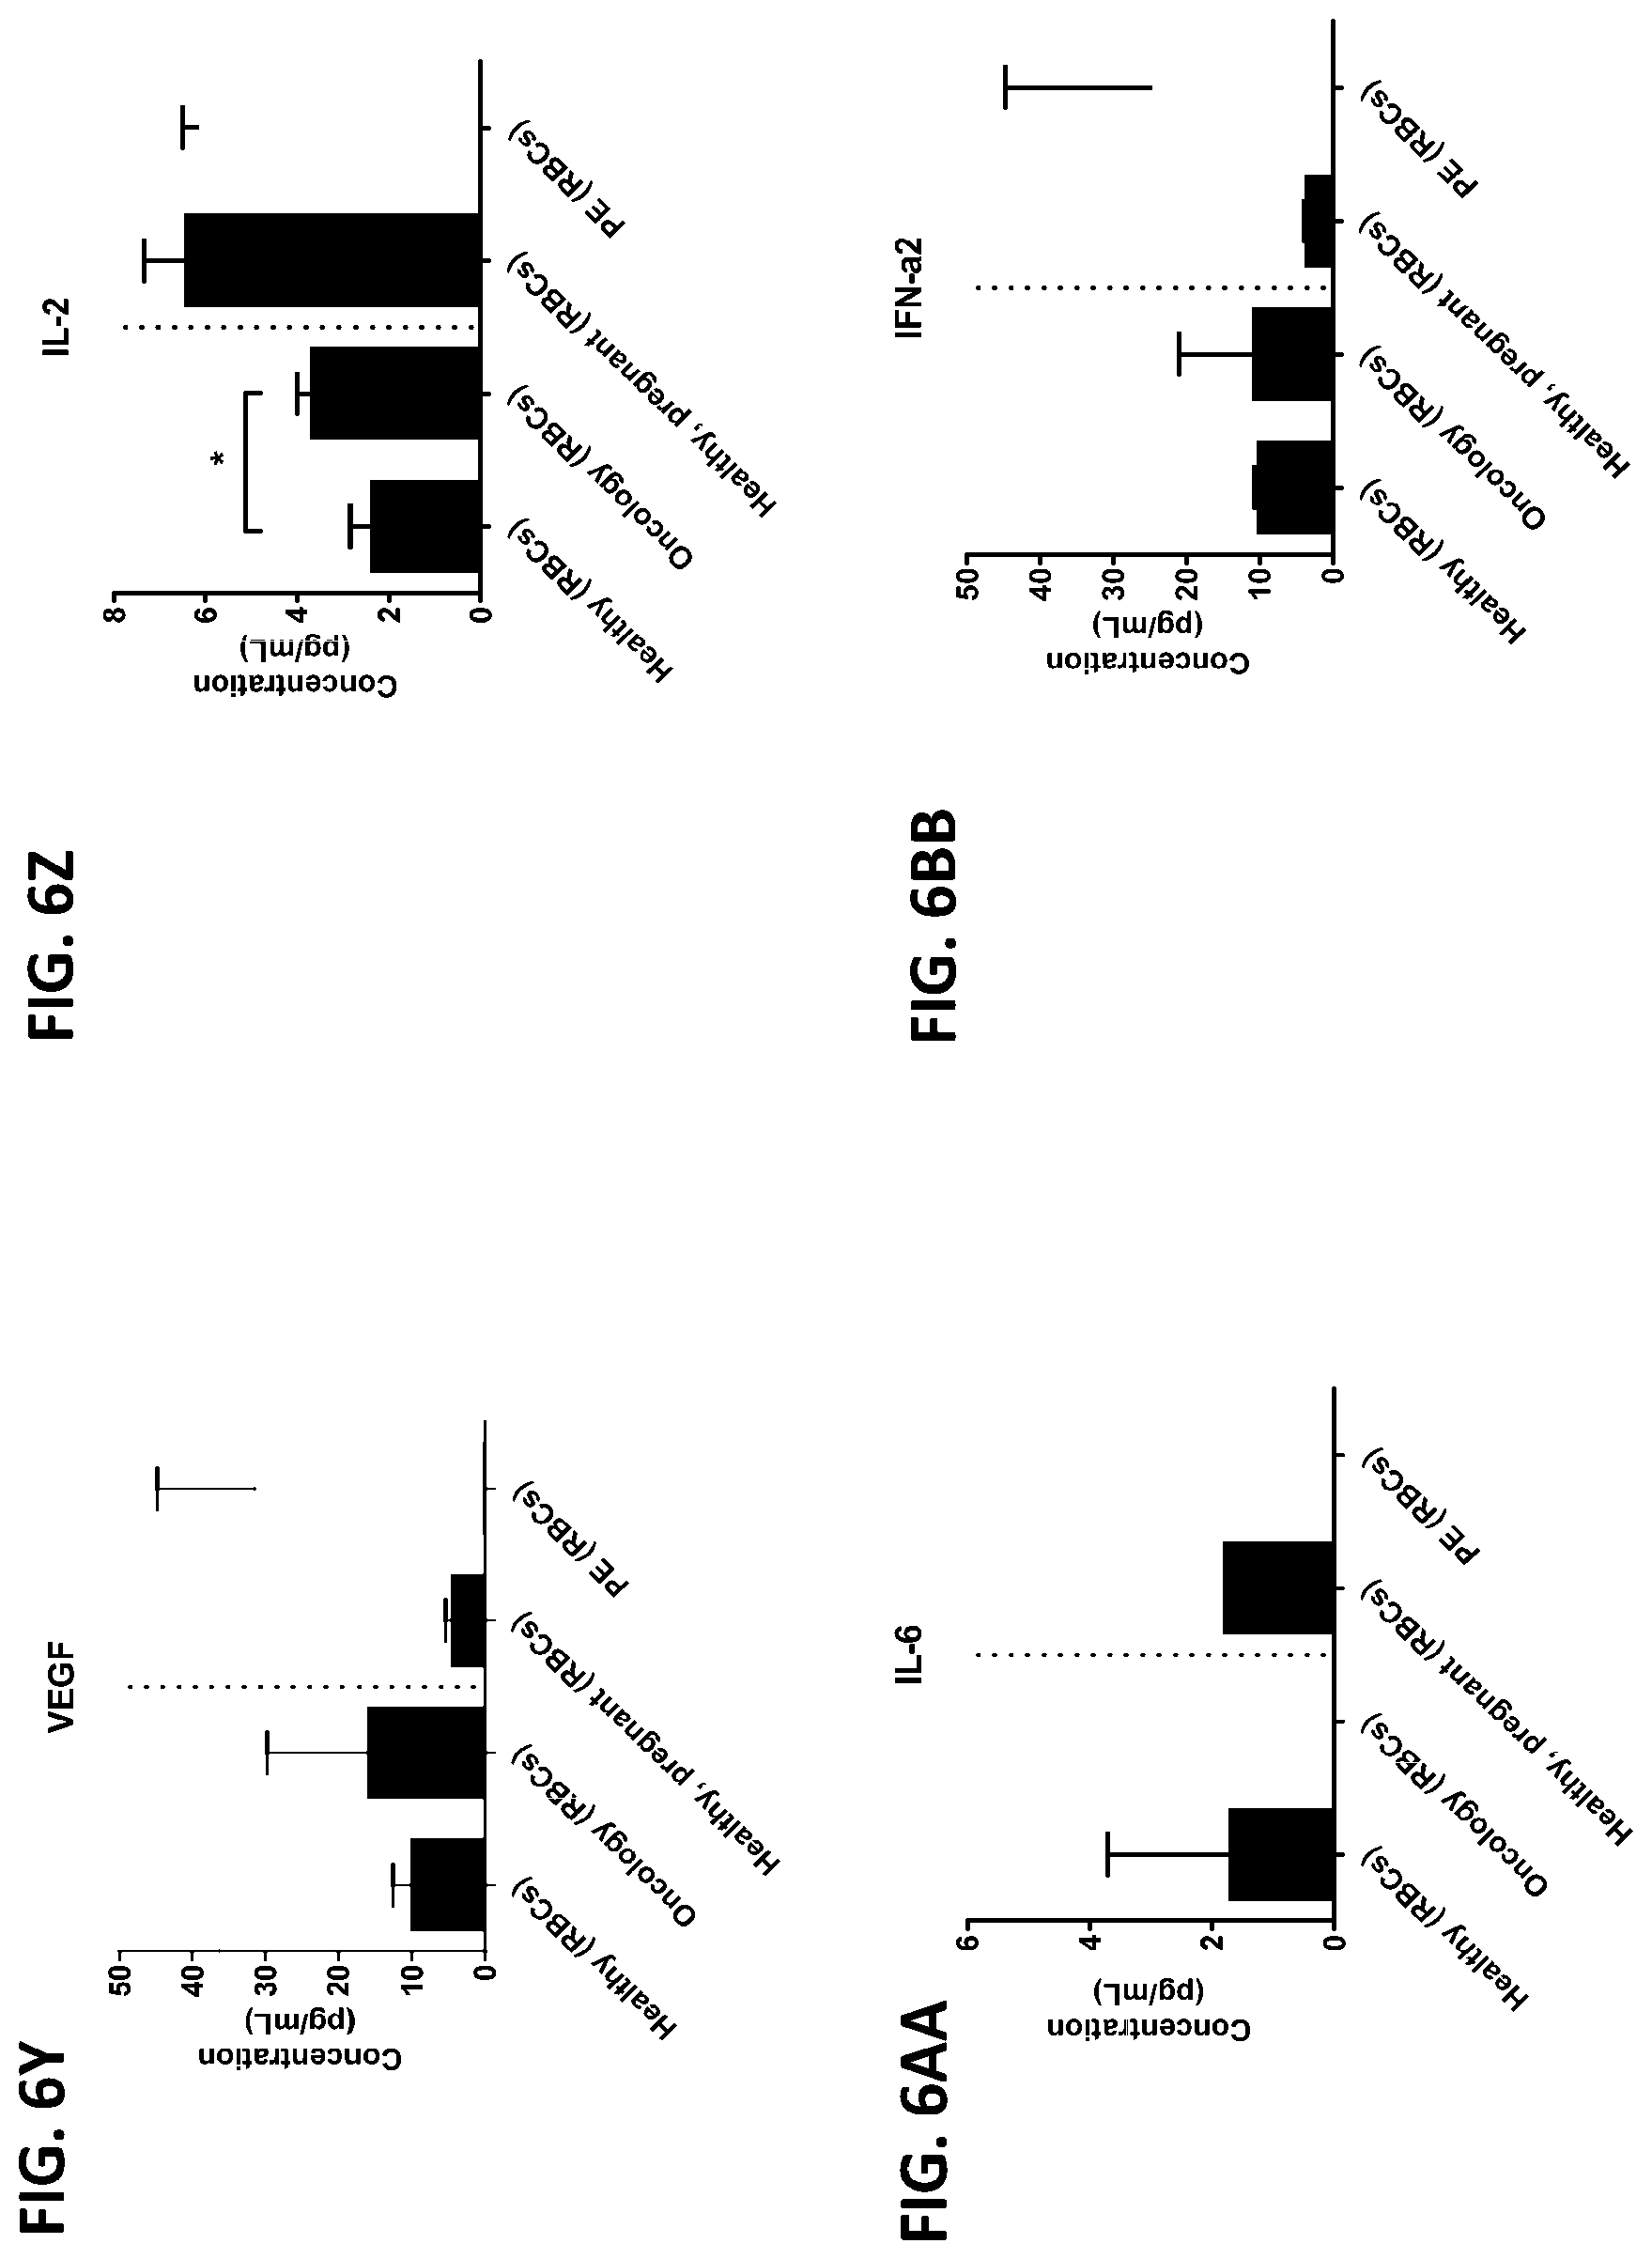
D00044
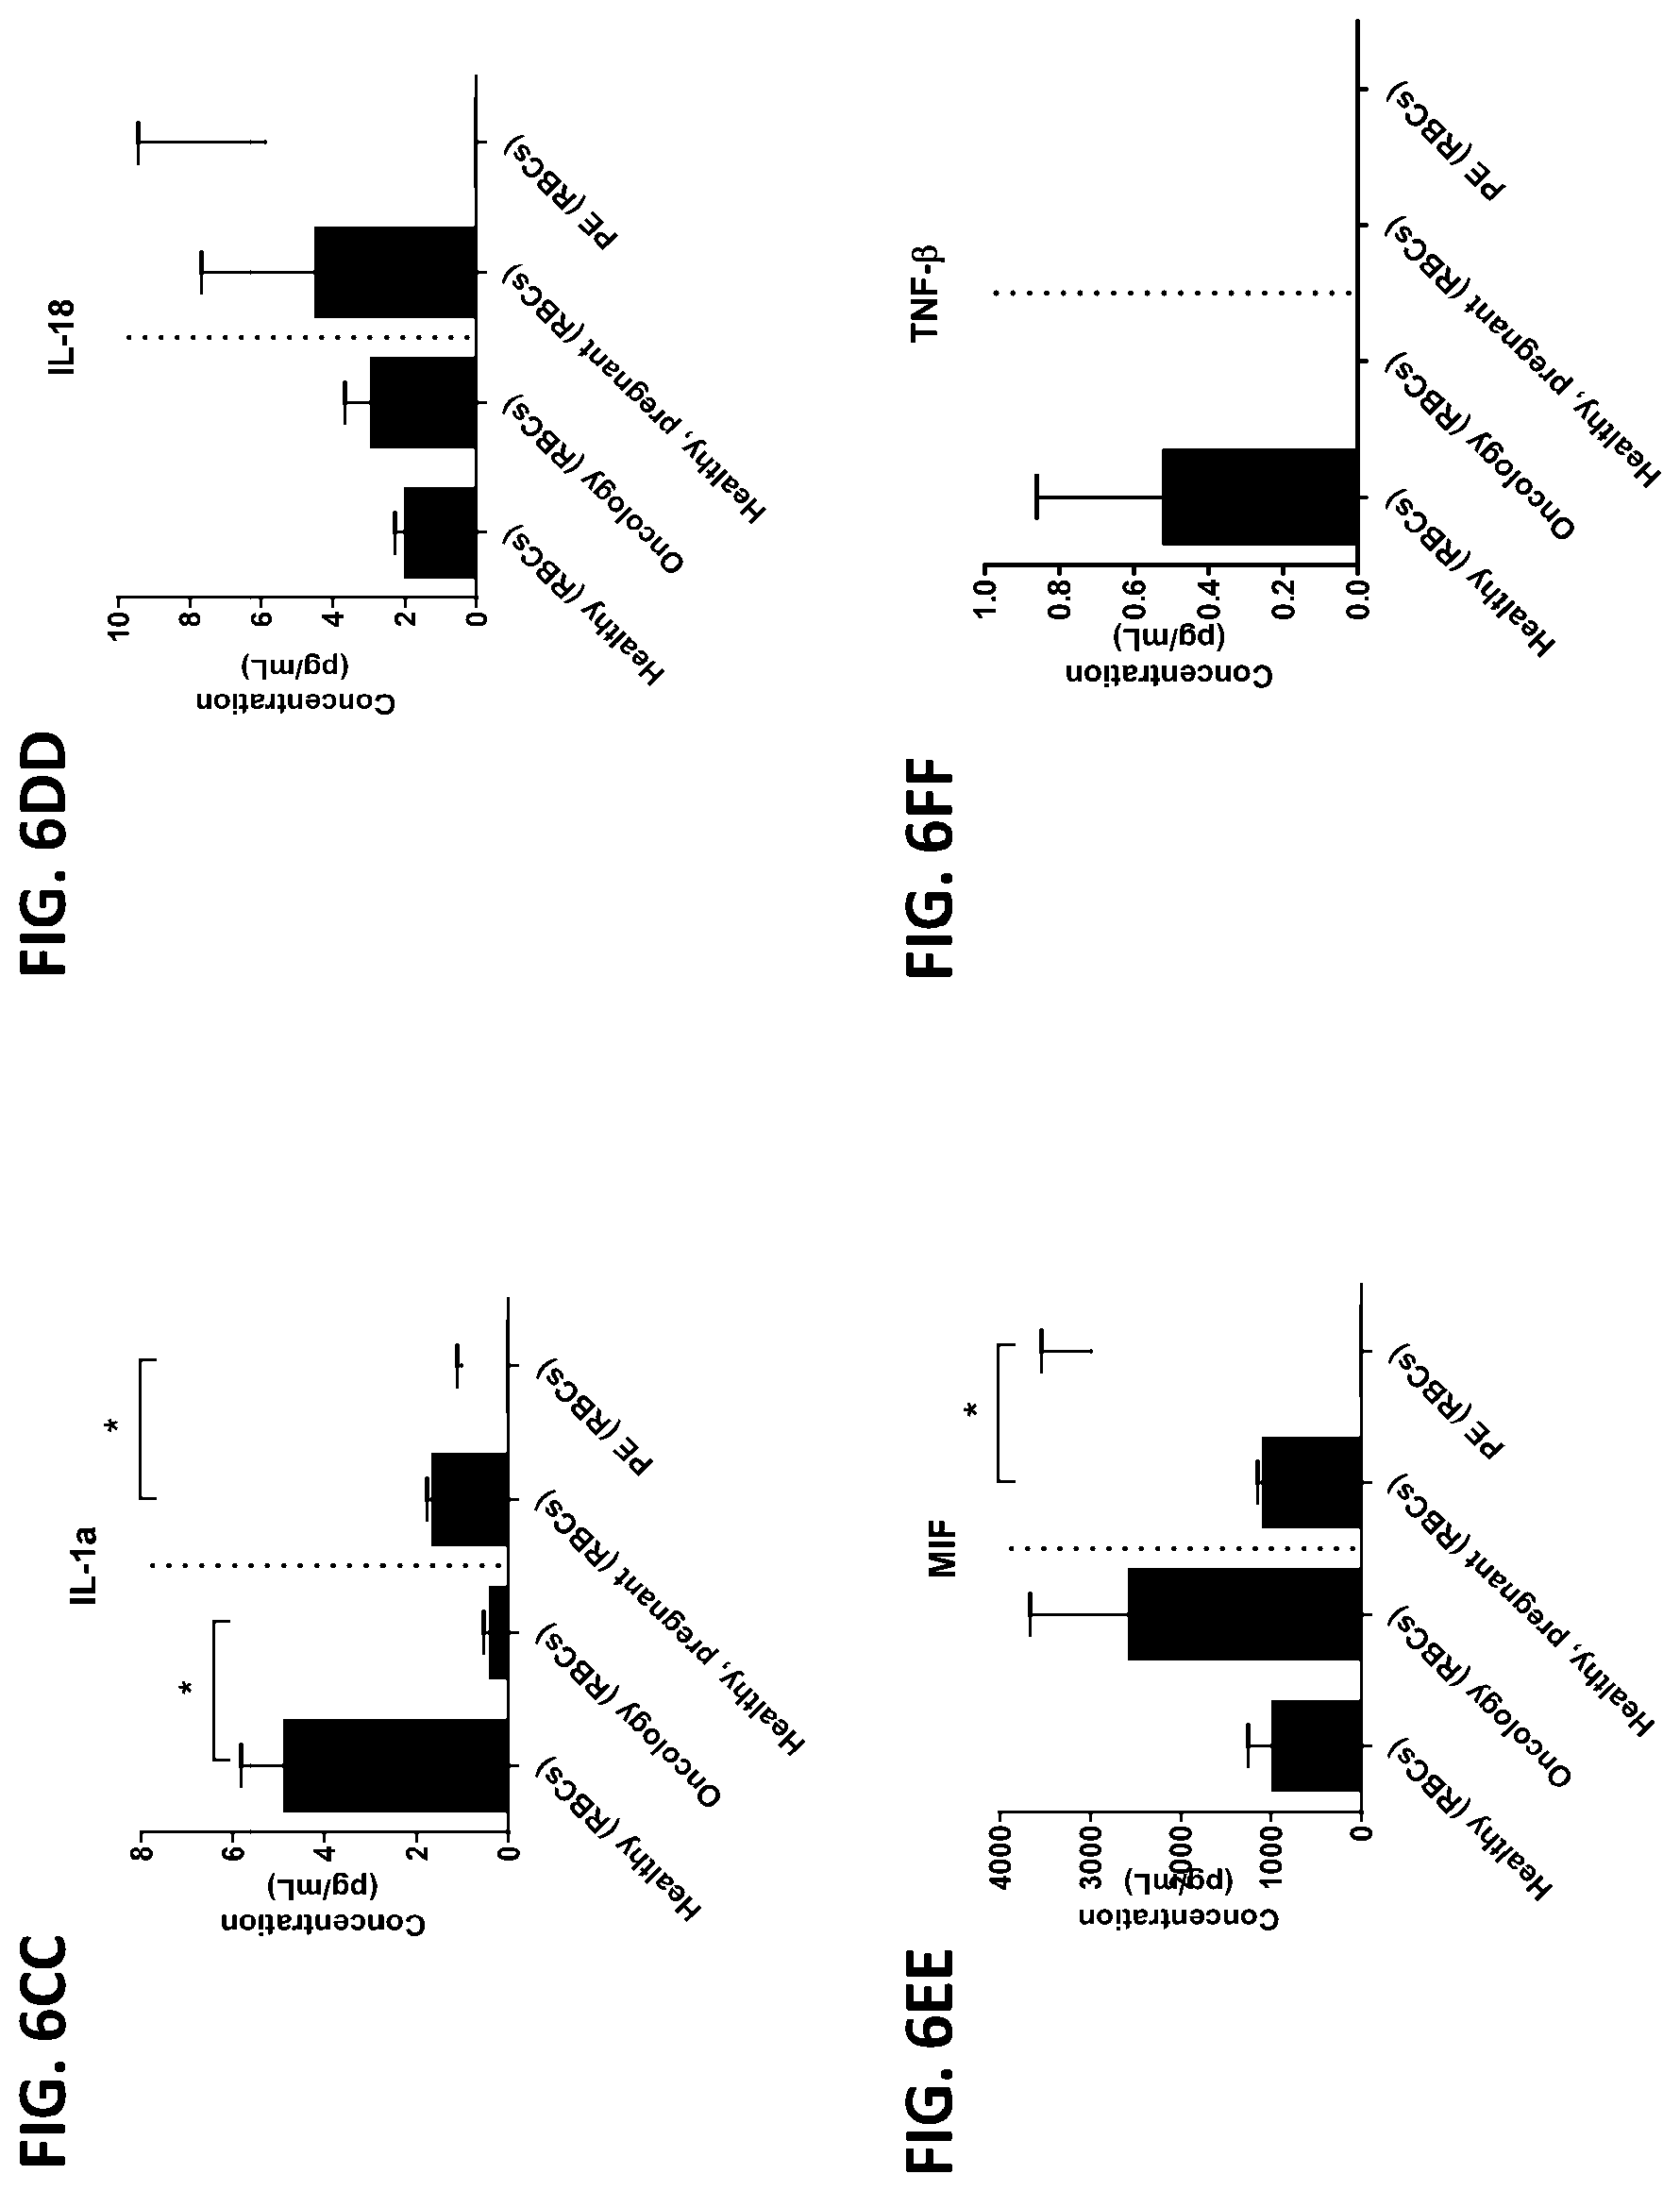
D00045

D00046
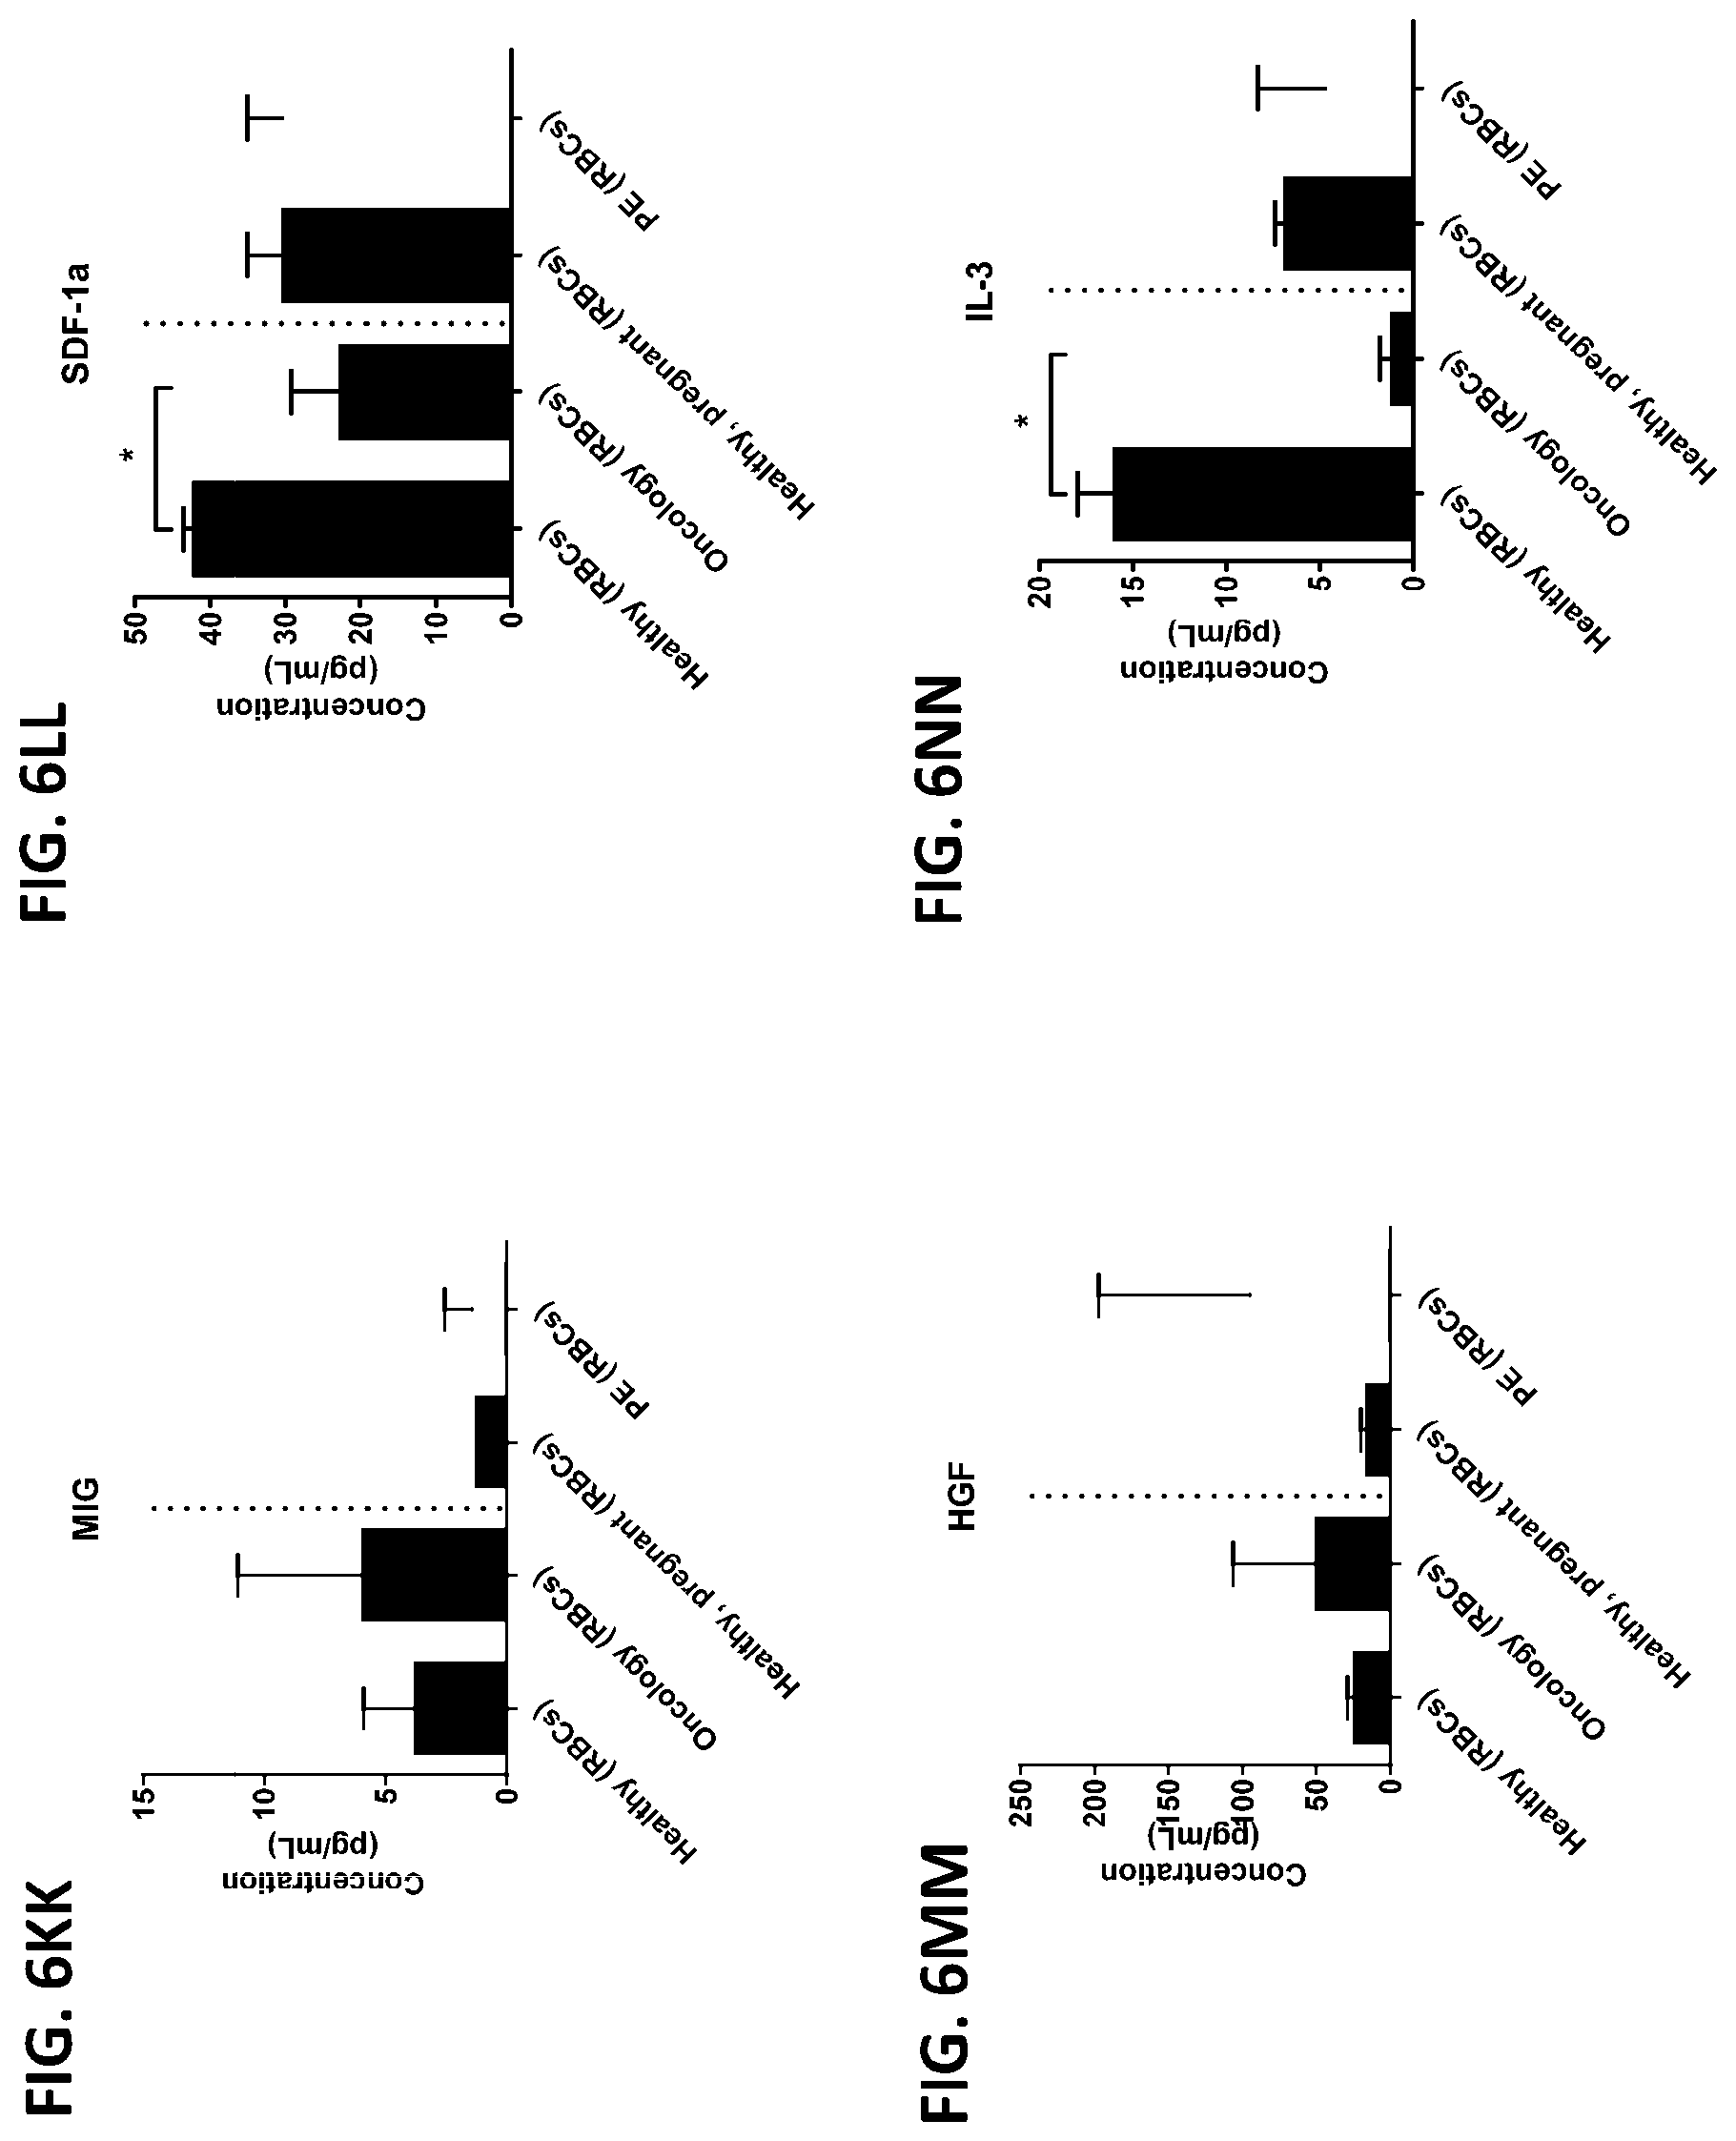
D00047

D00048

D00049
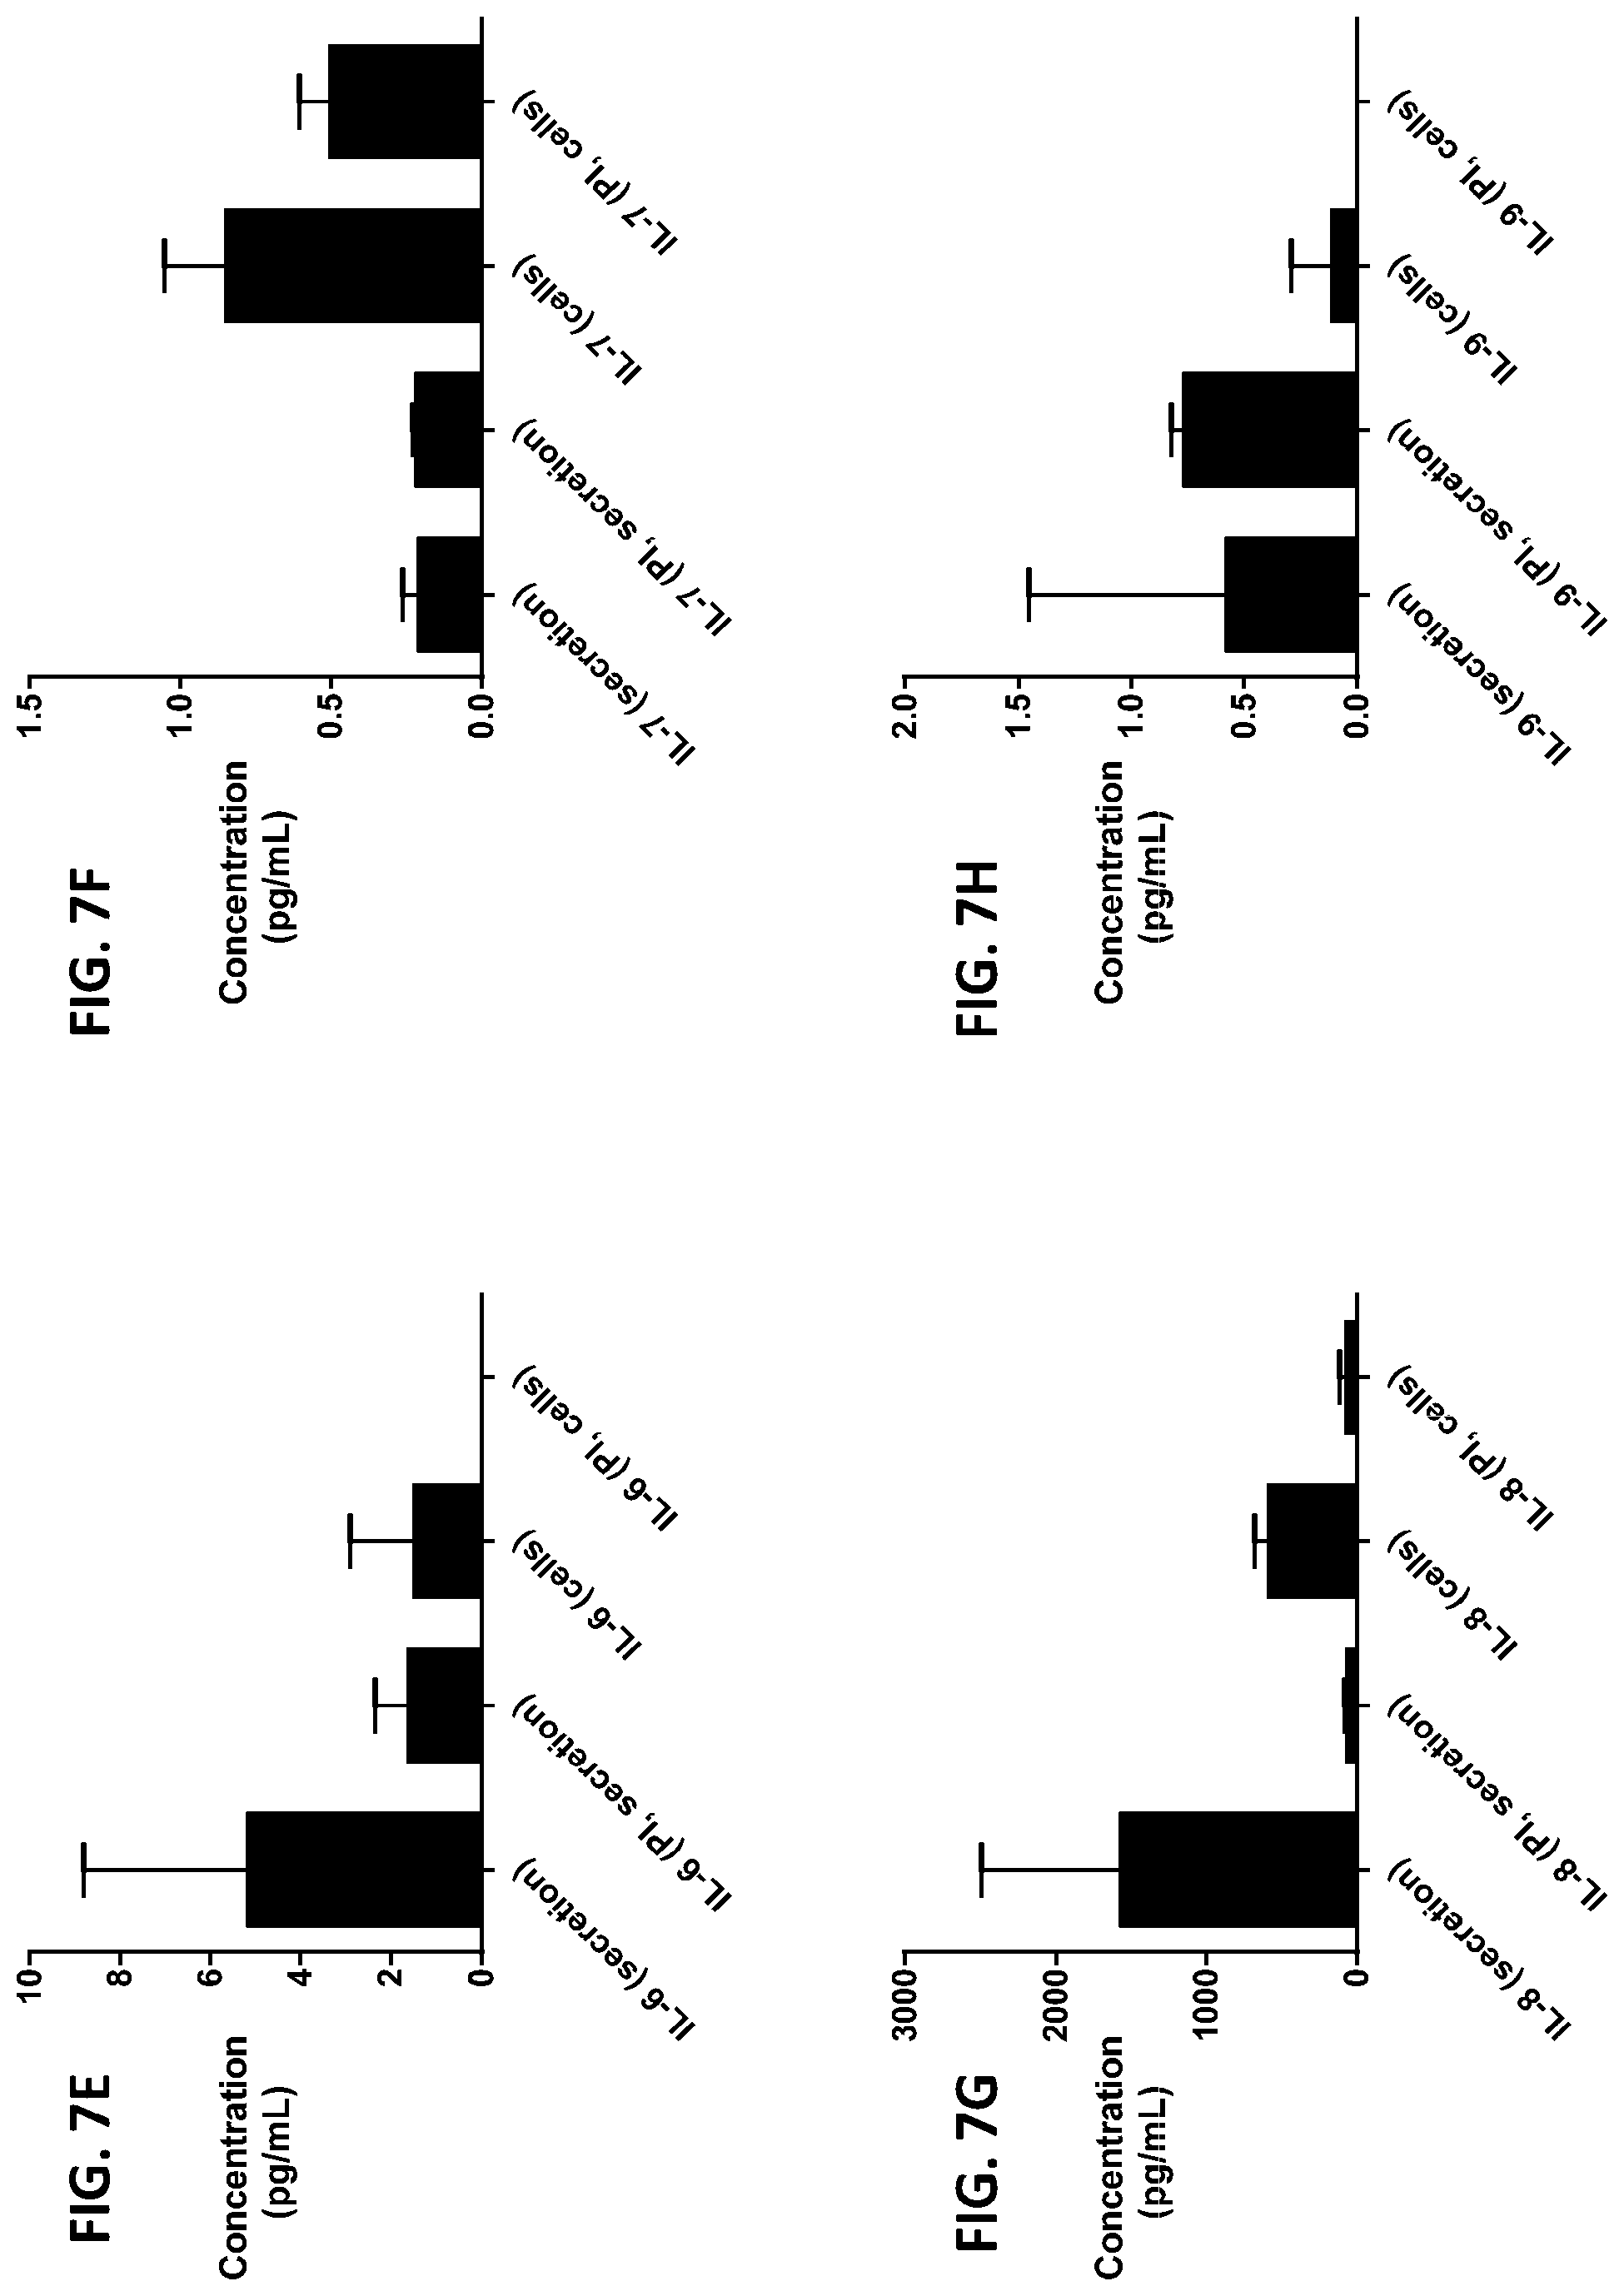
D00050

D00051
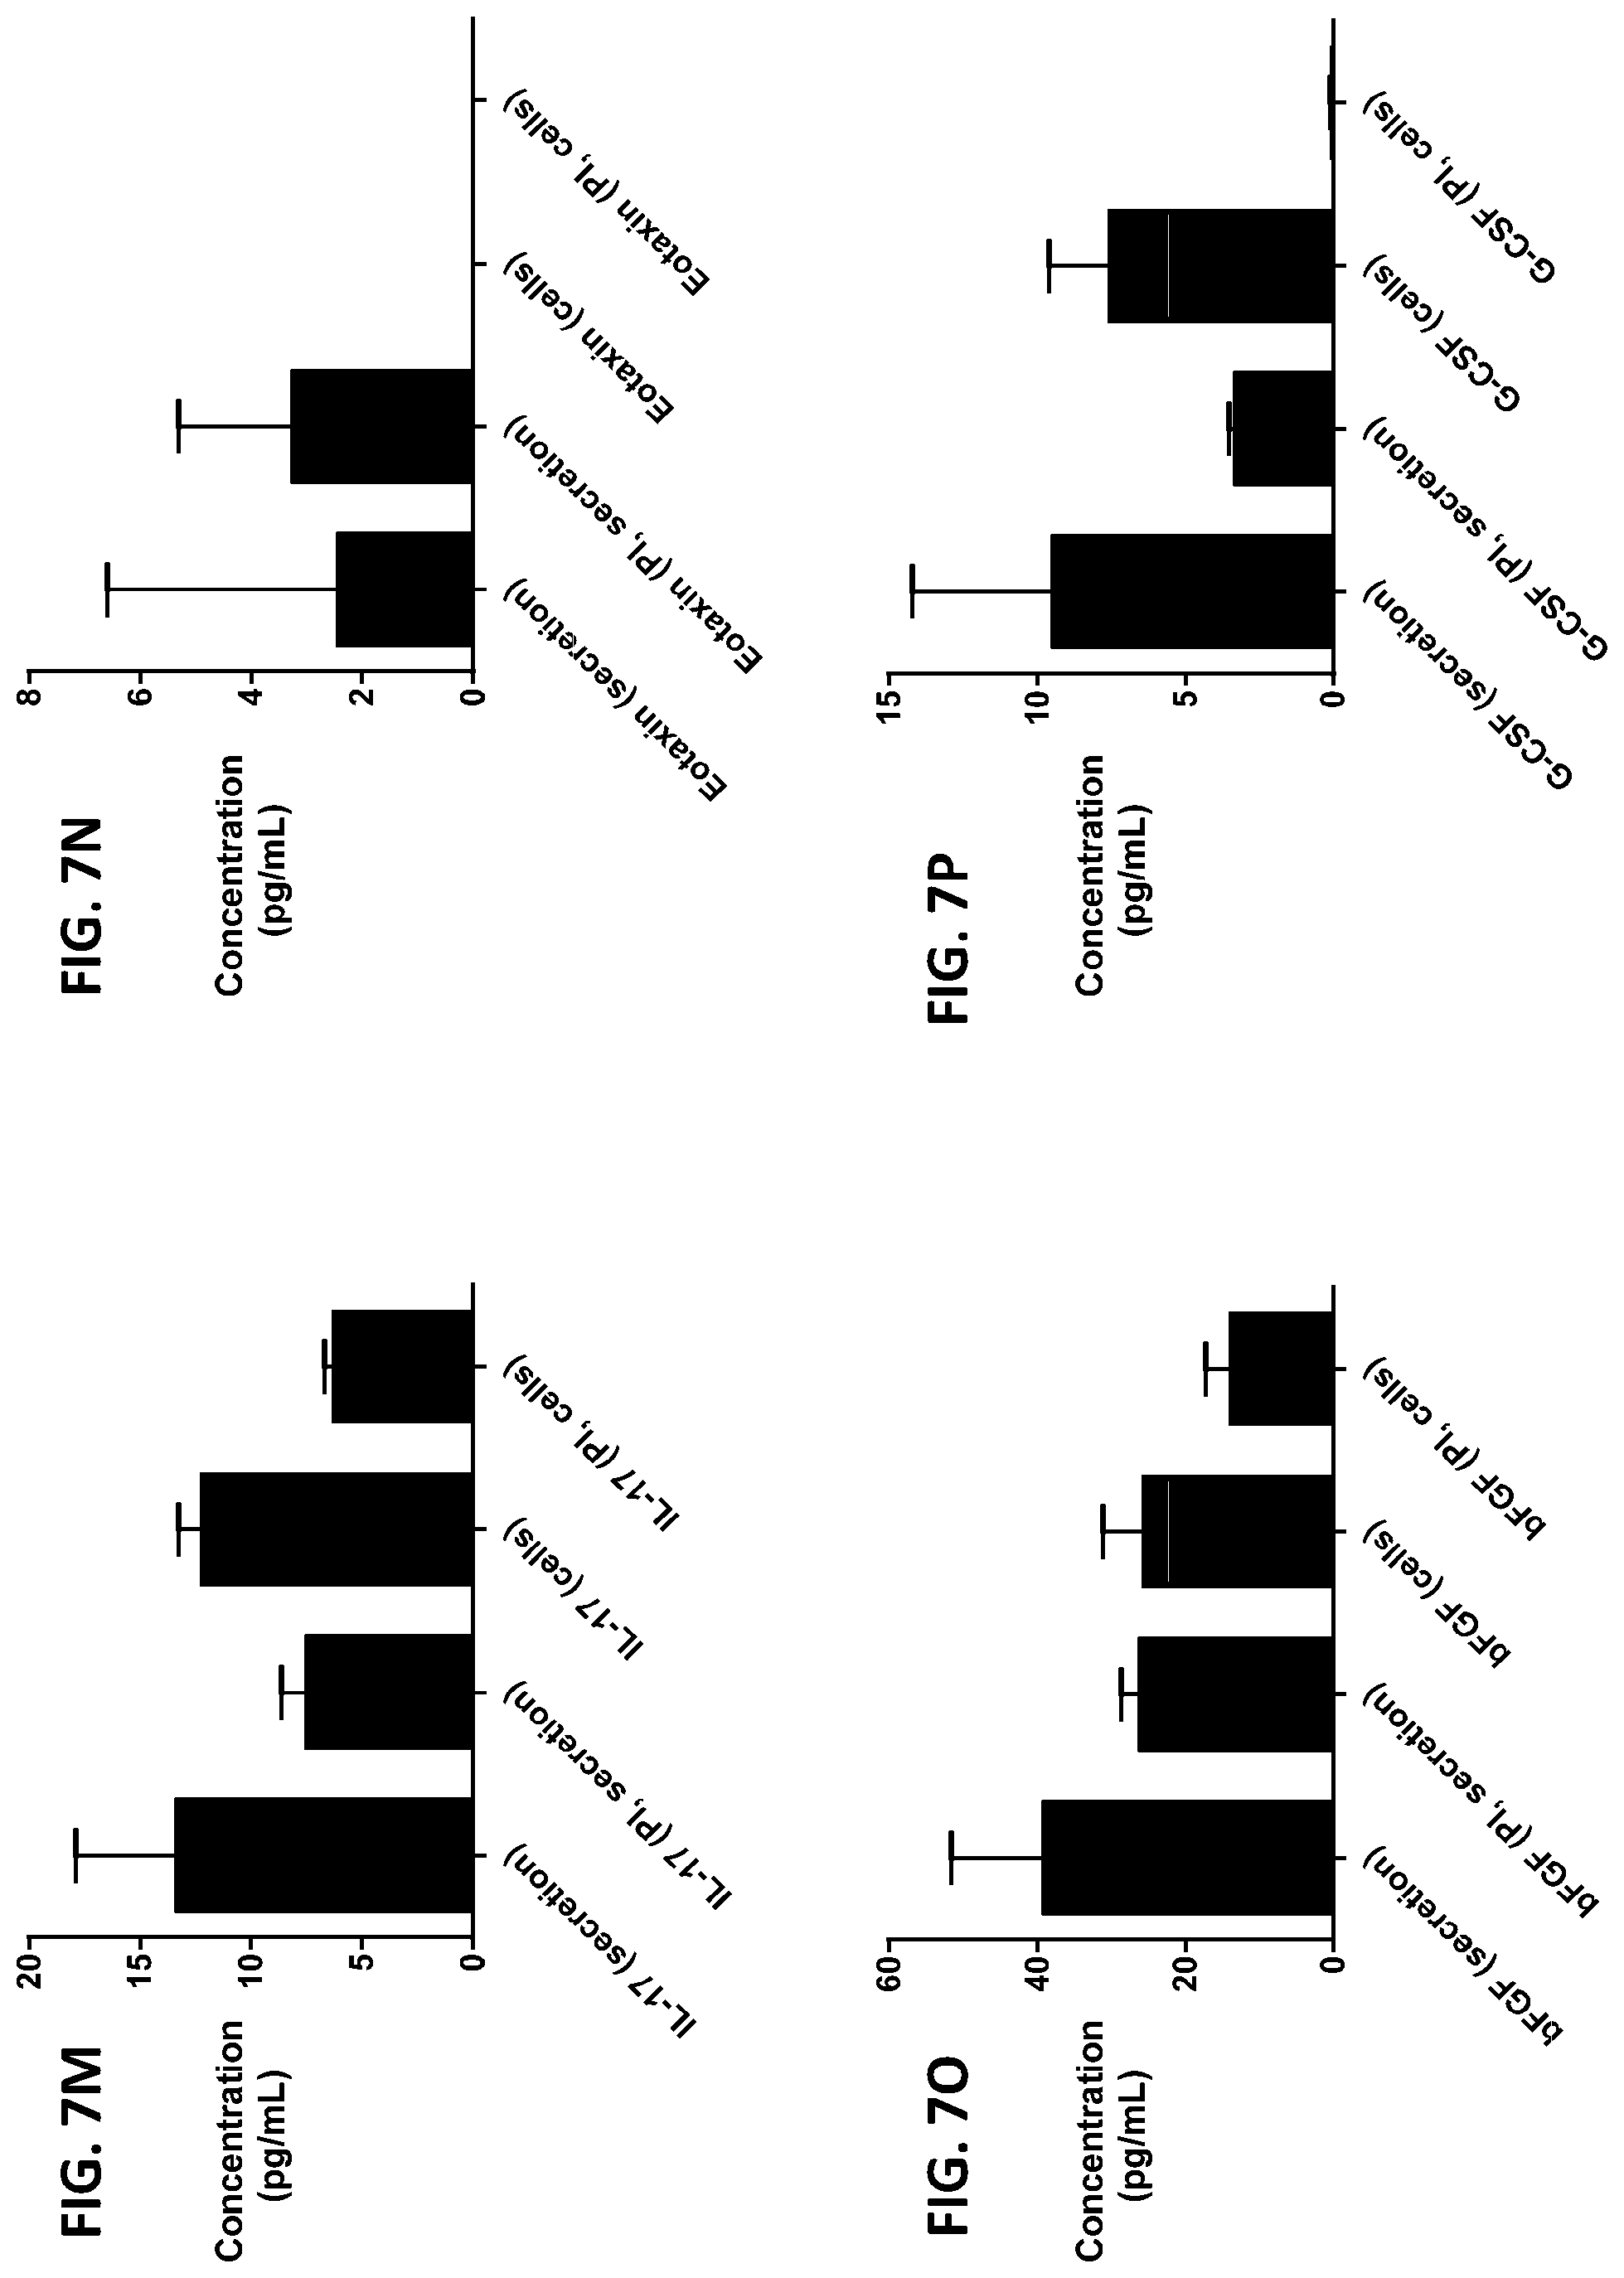
D00052
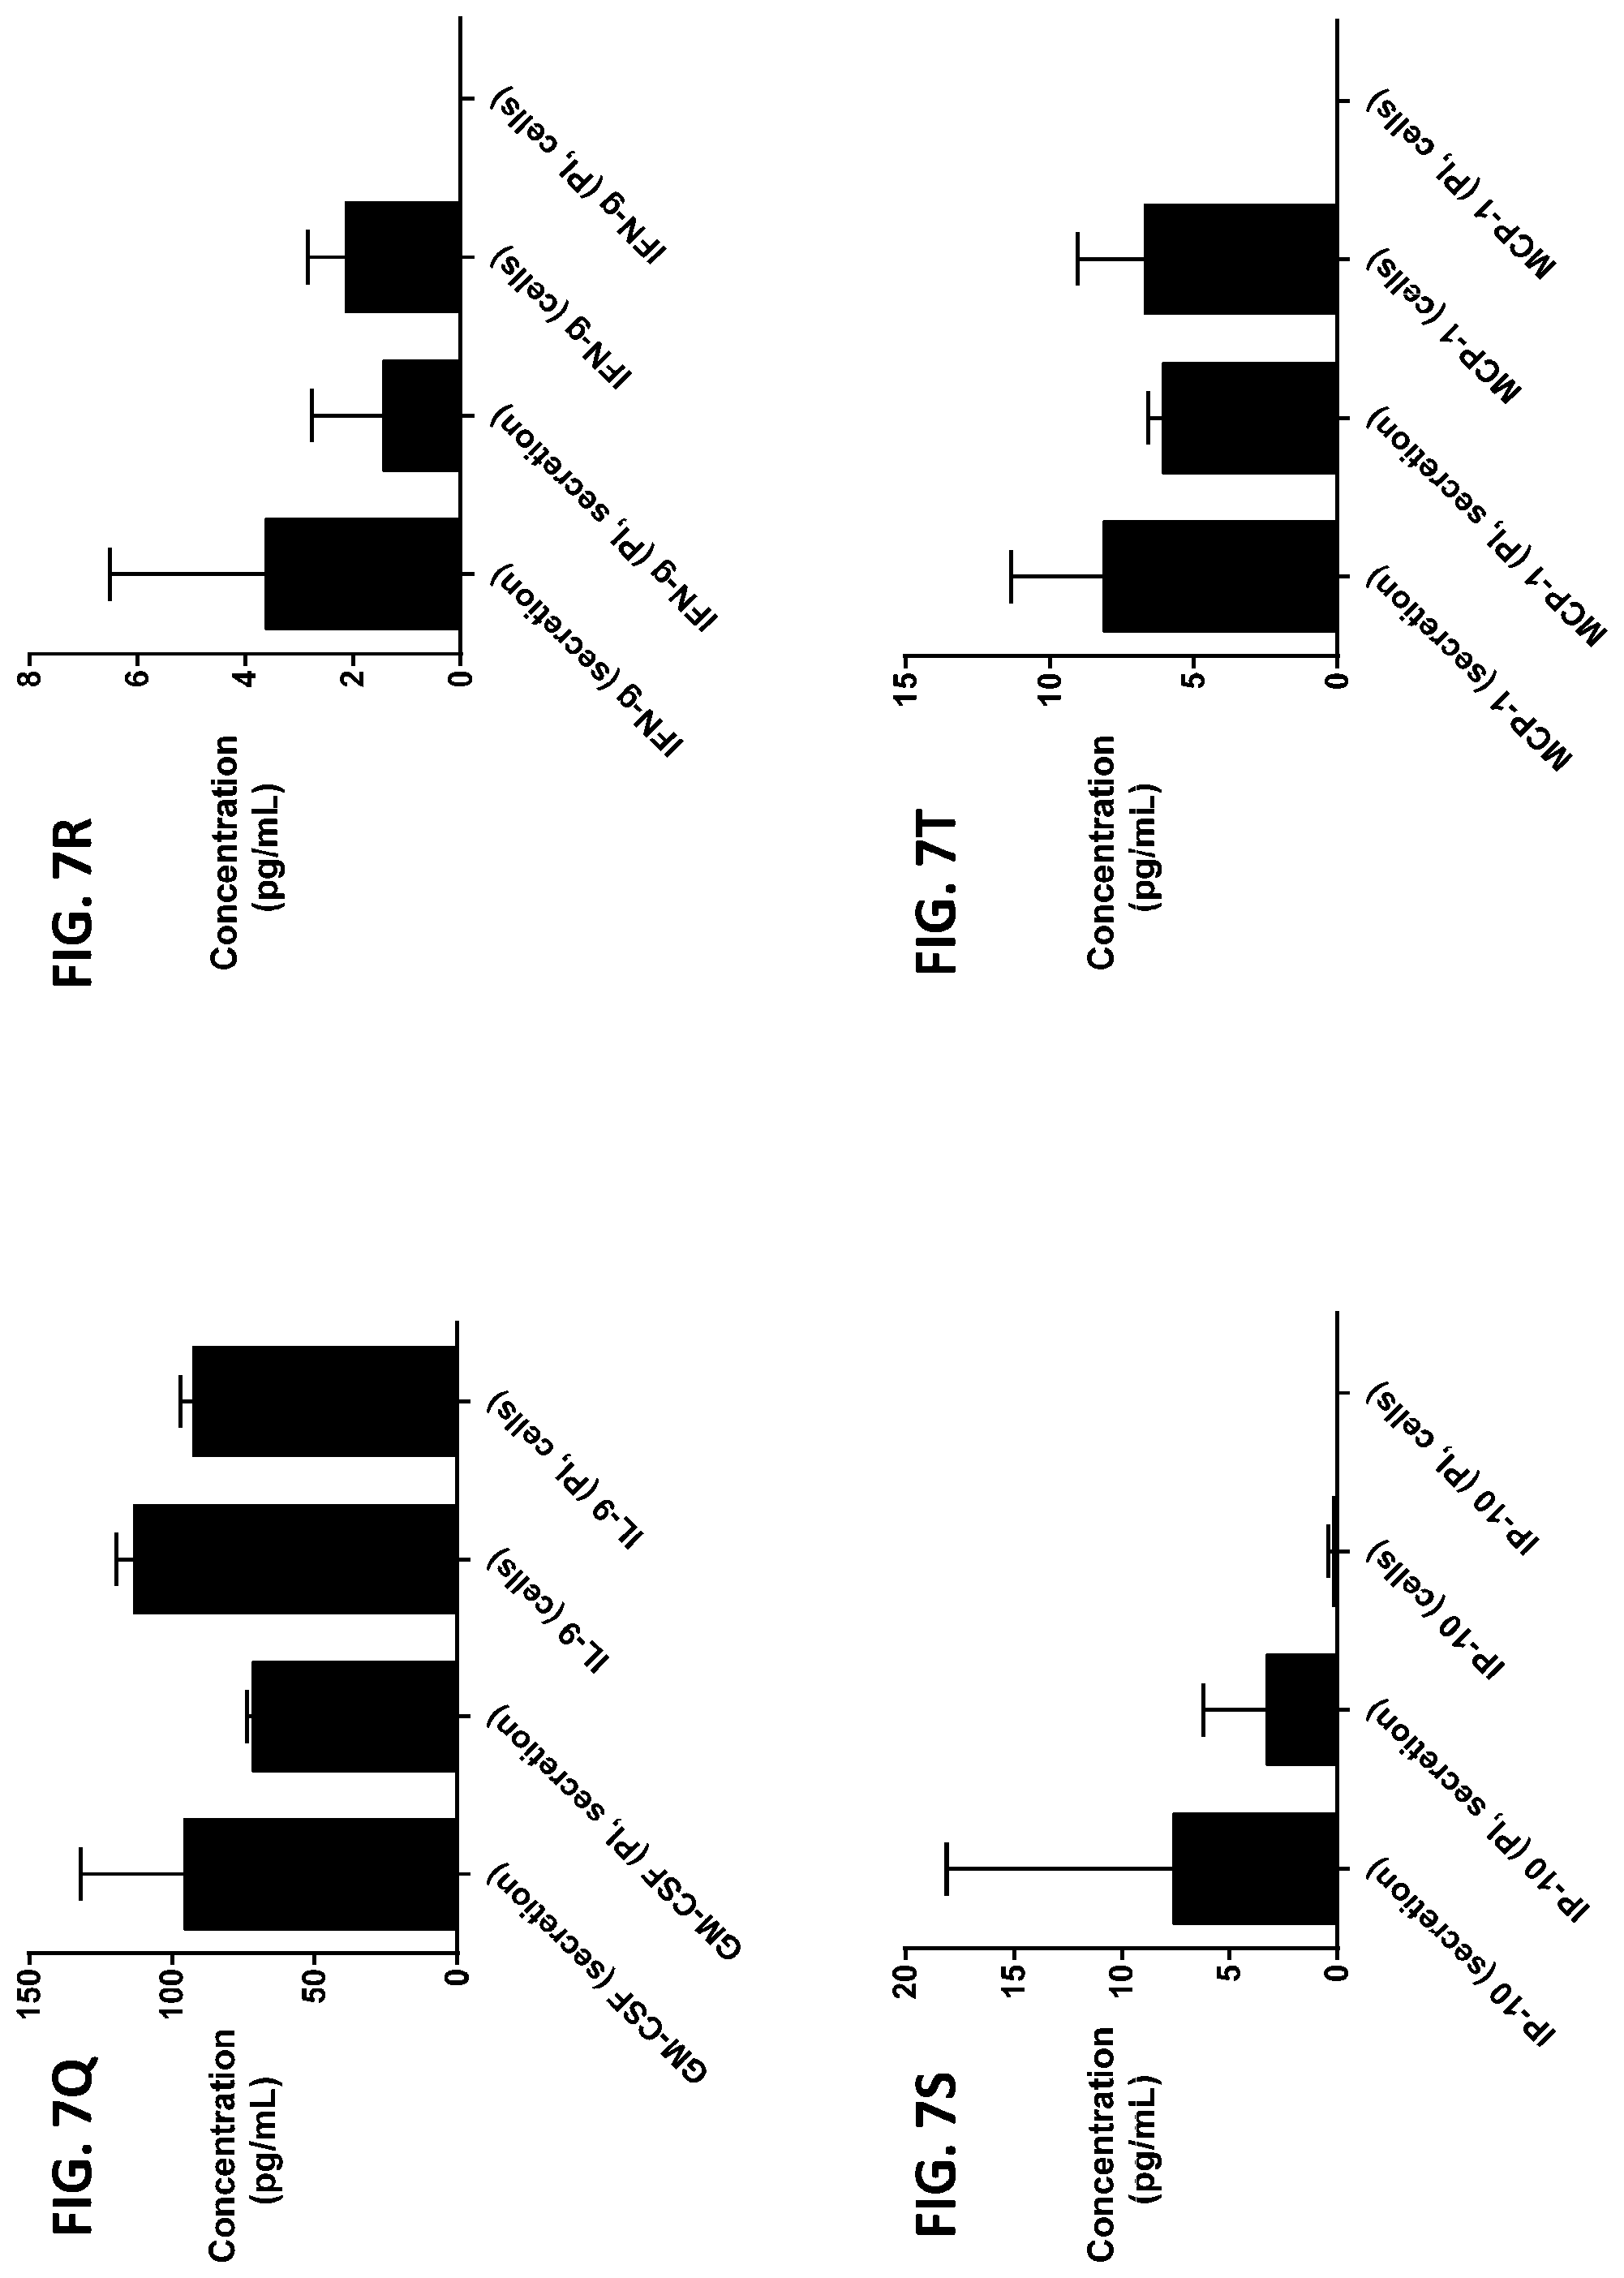
D00053

D00054

D00055

D00056

D00057
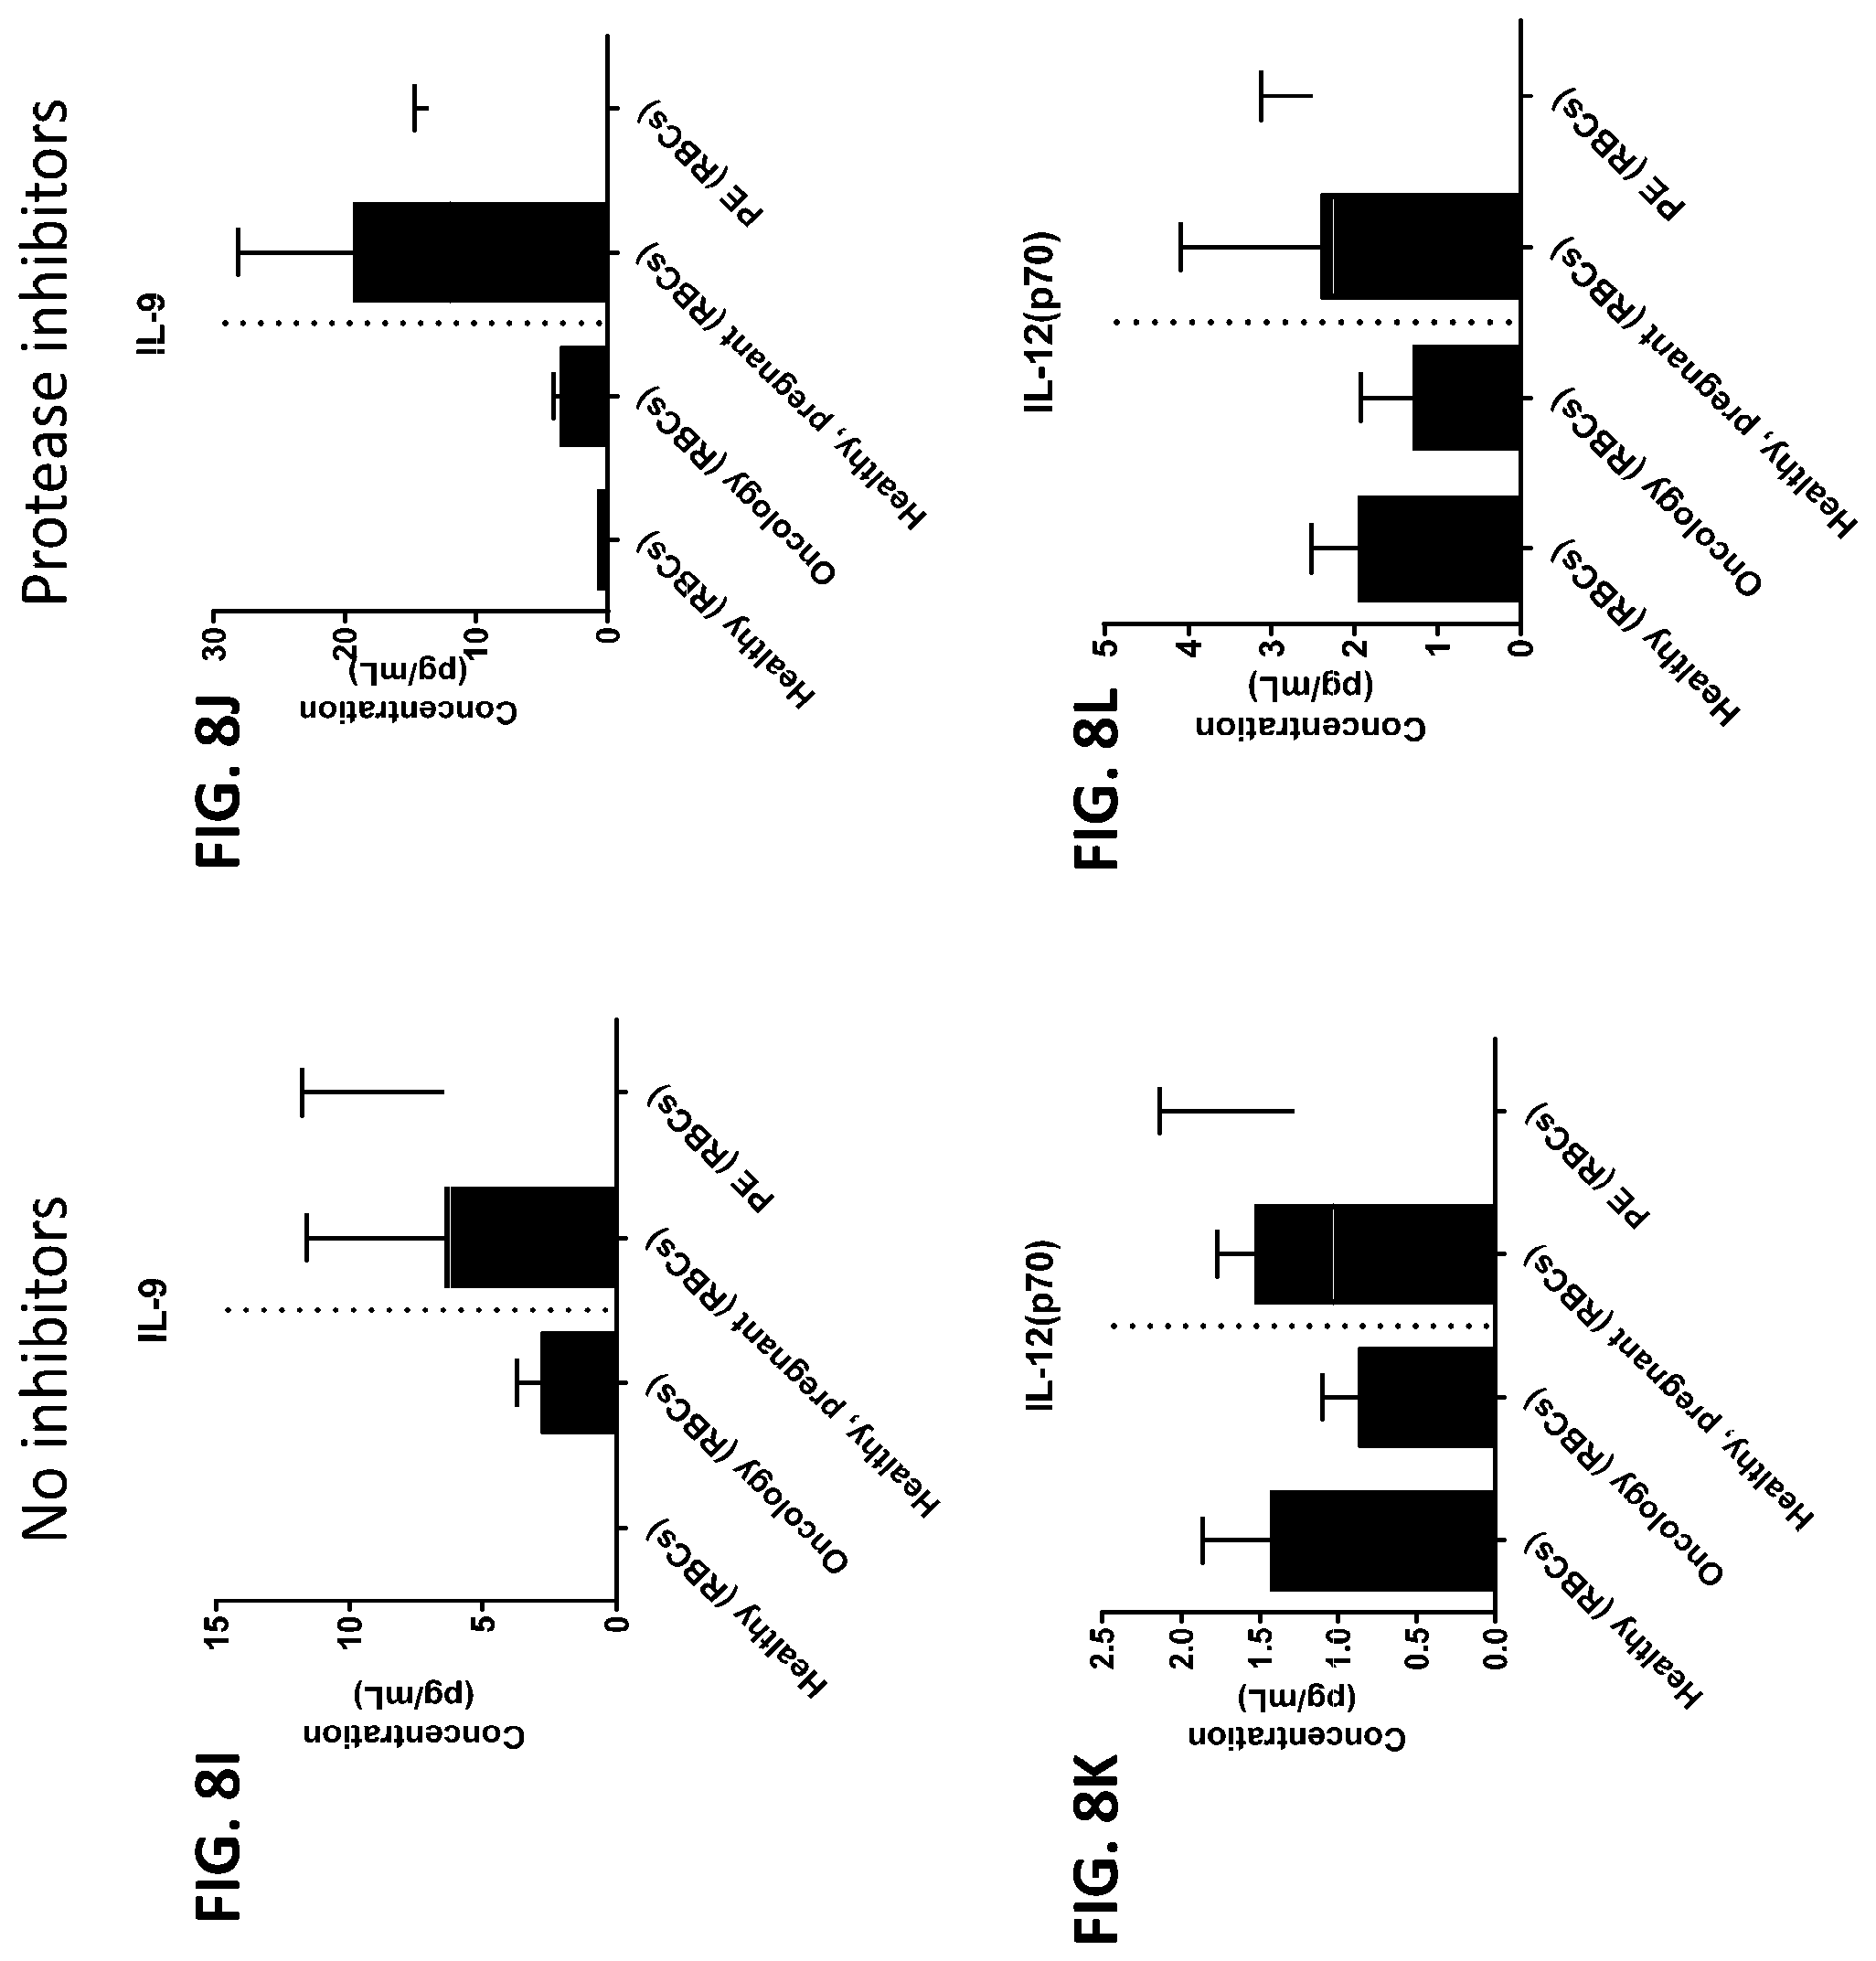
D00058
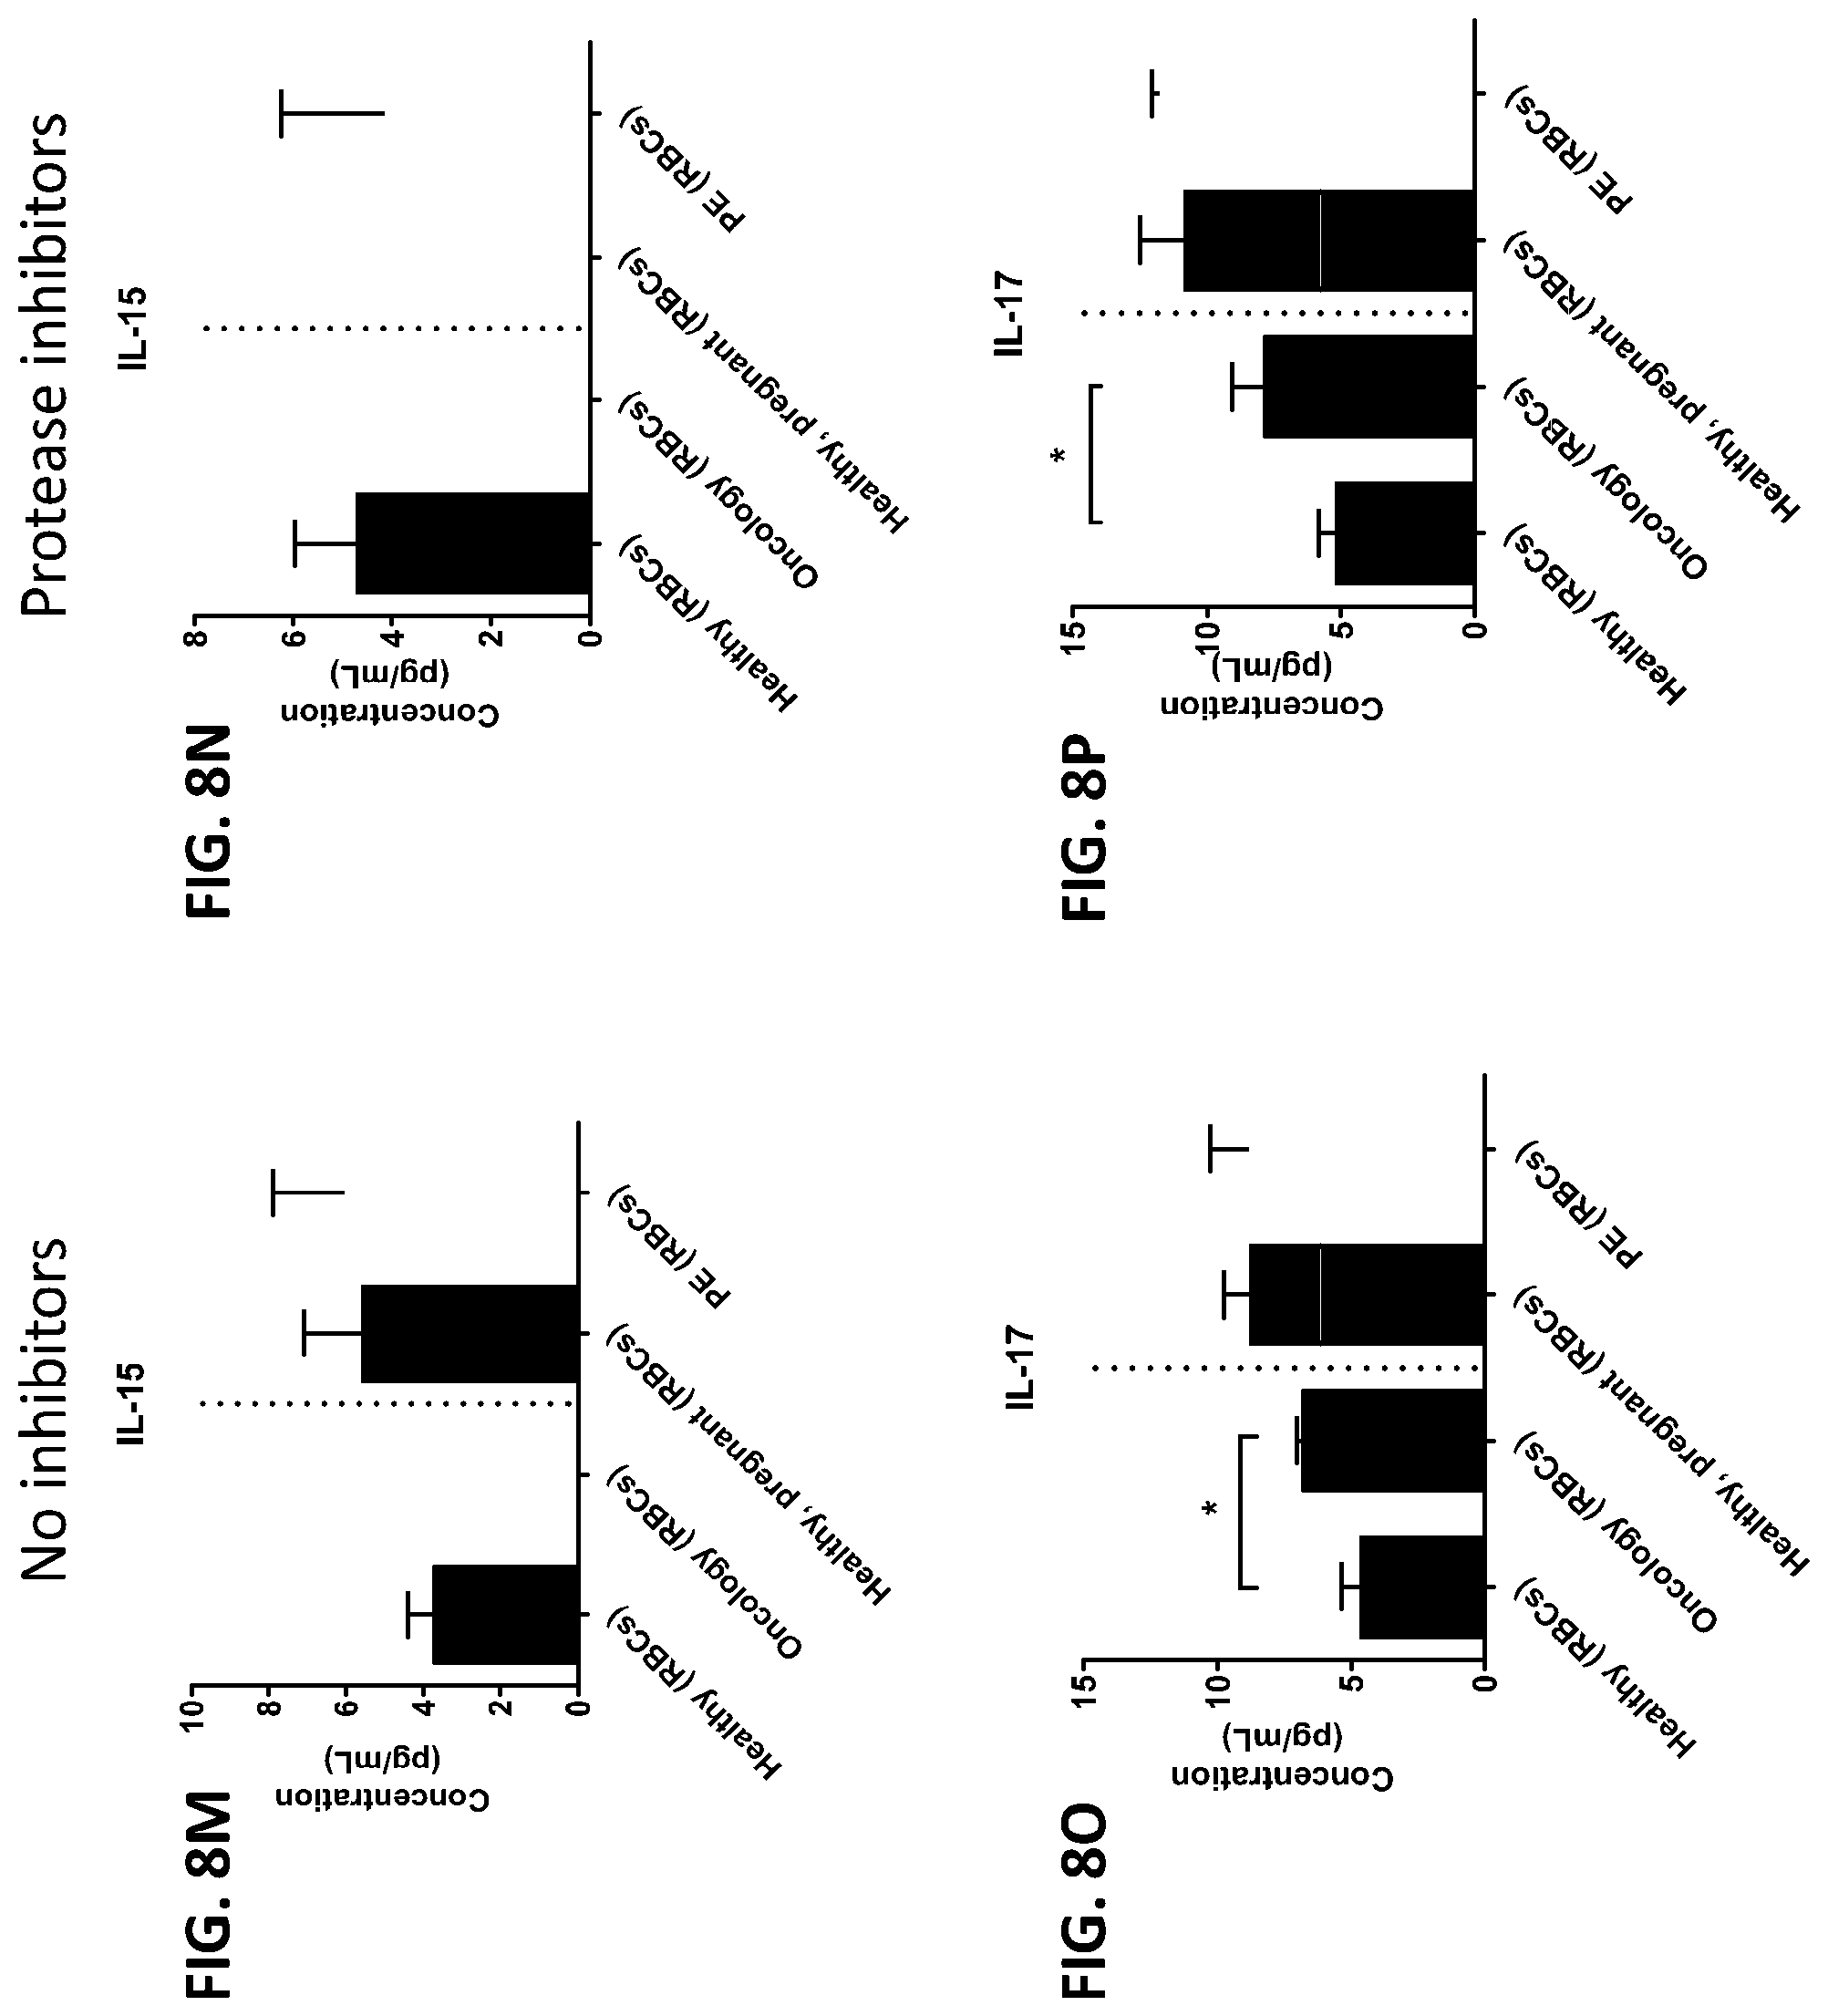
D00059

D00060

D00061
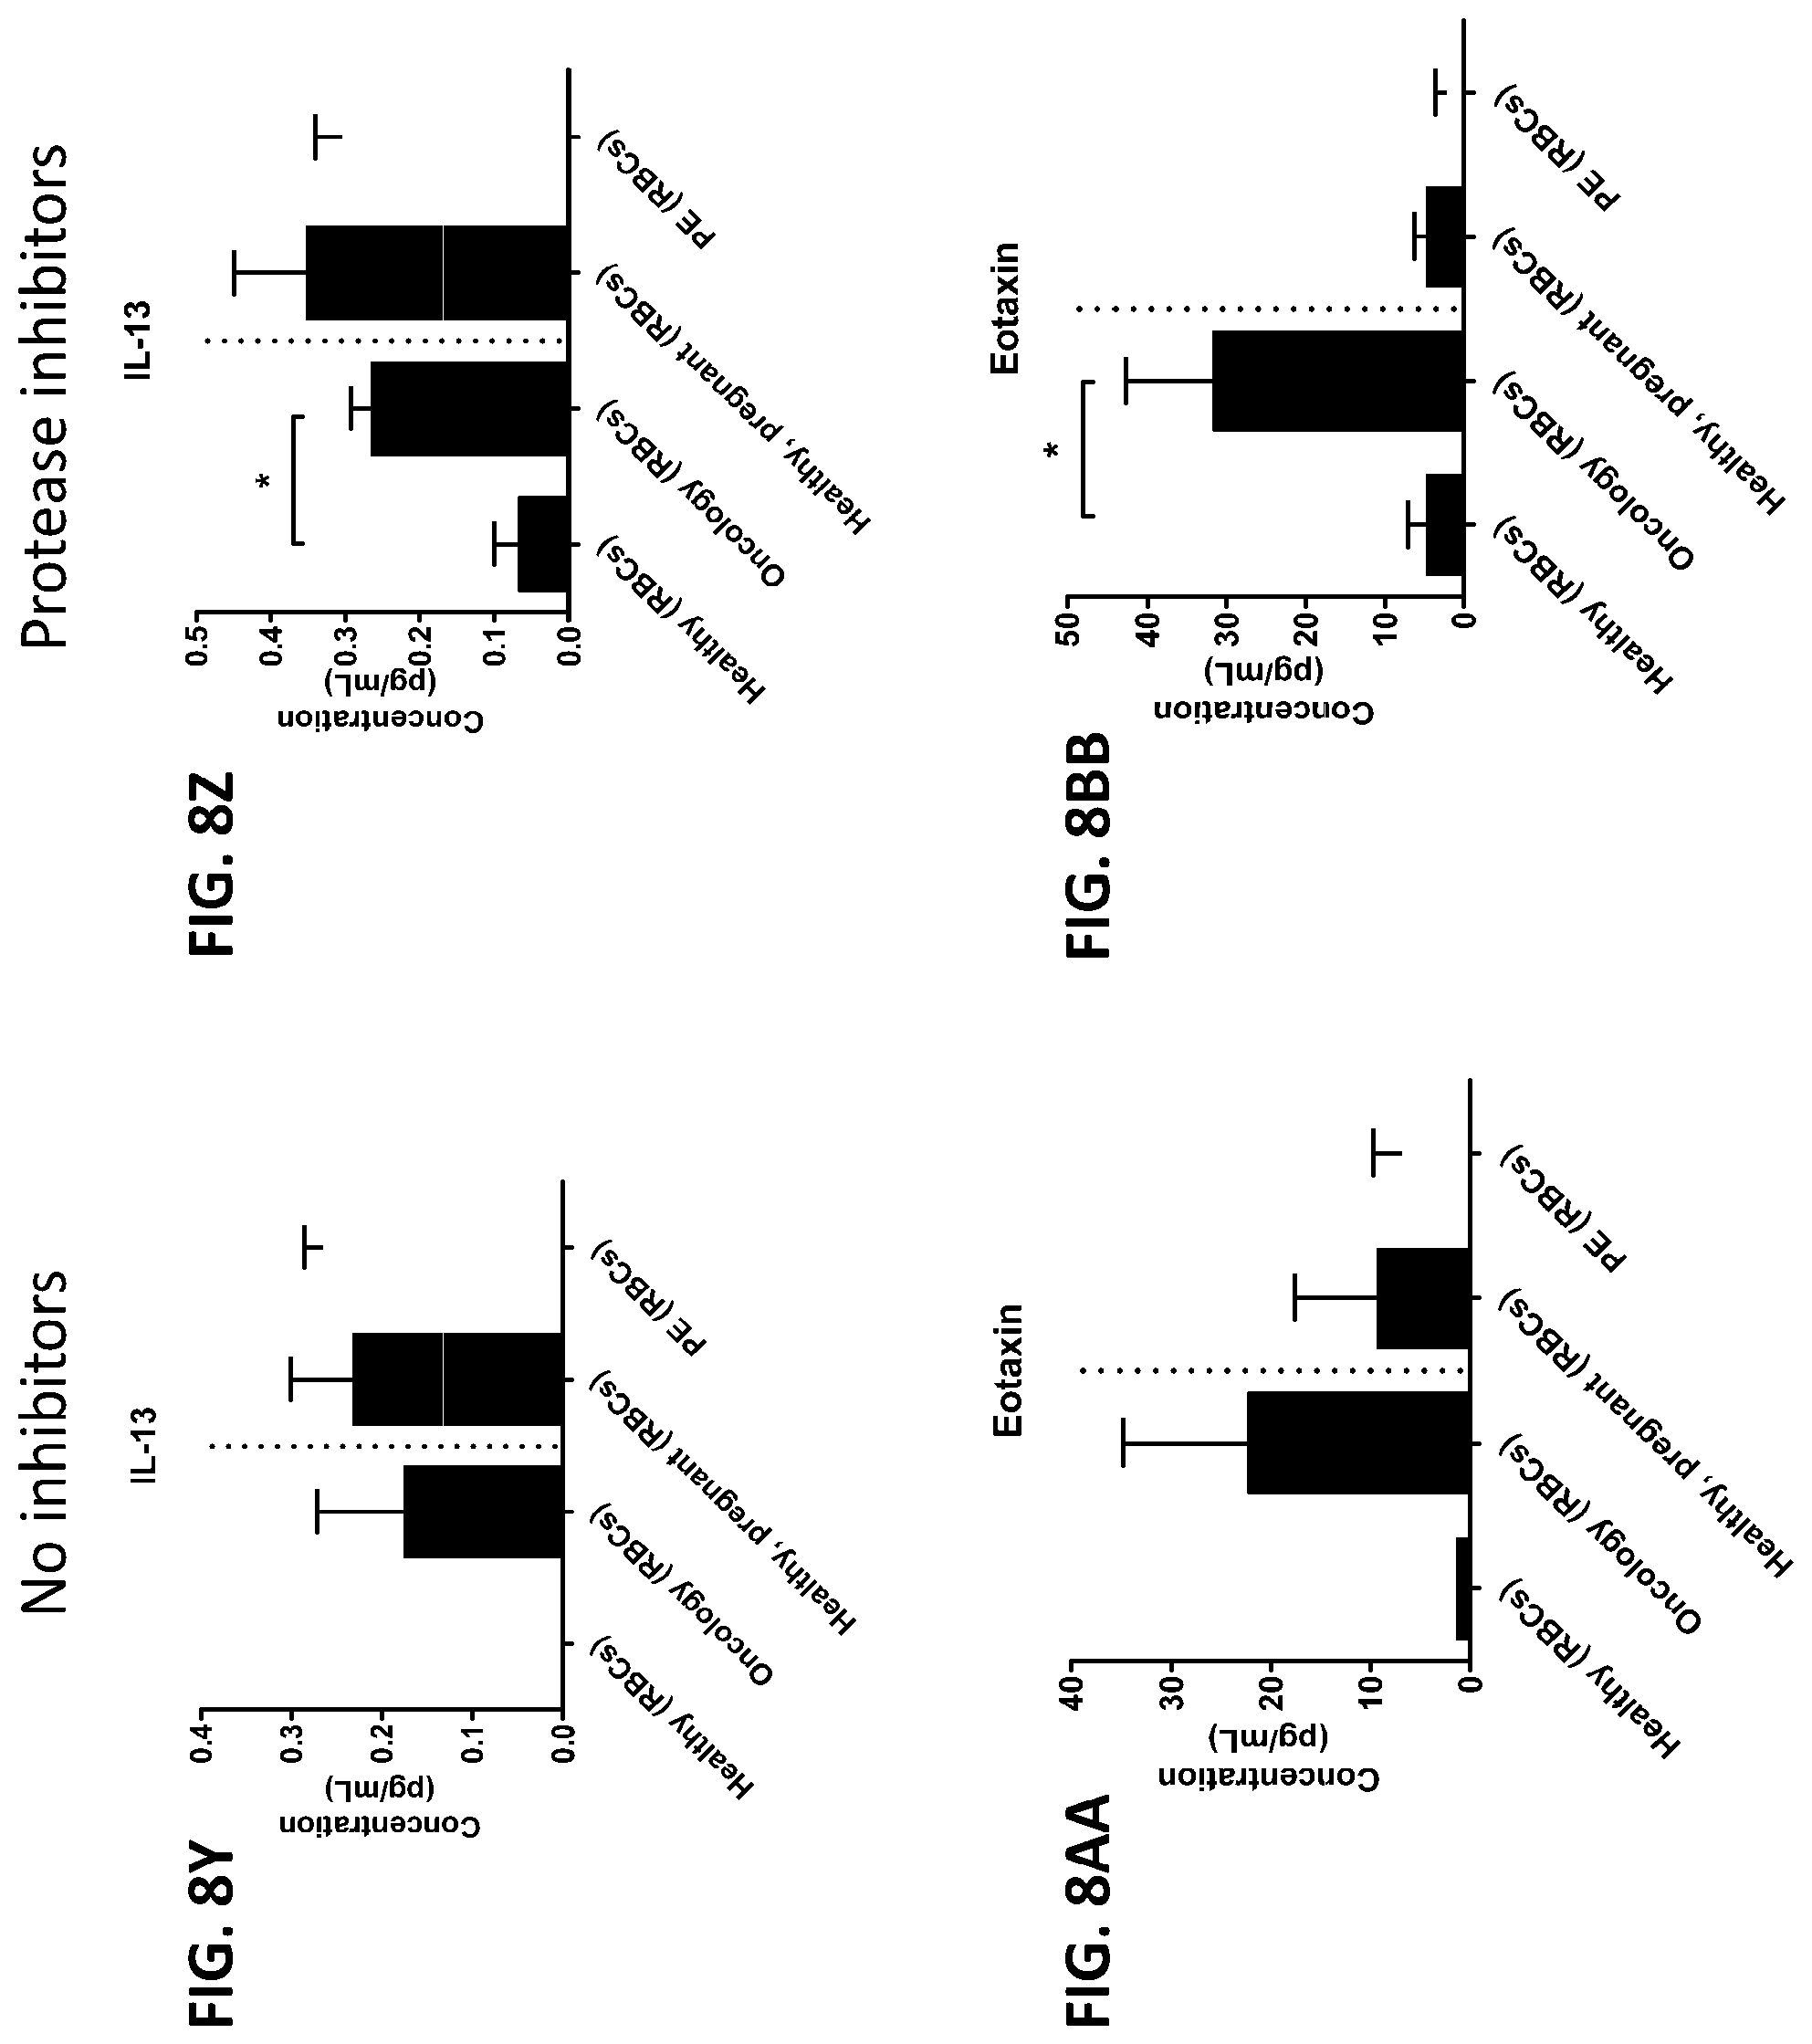
D00062

D00063
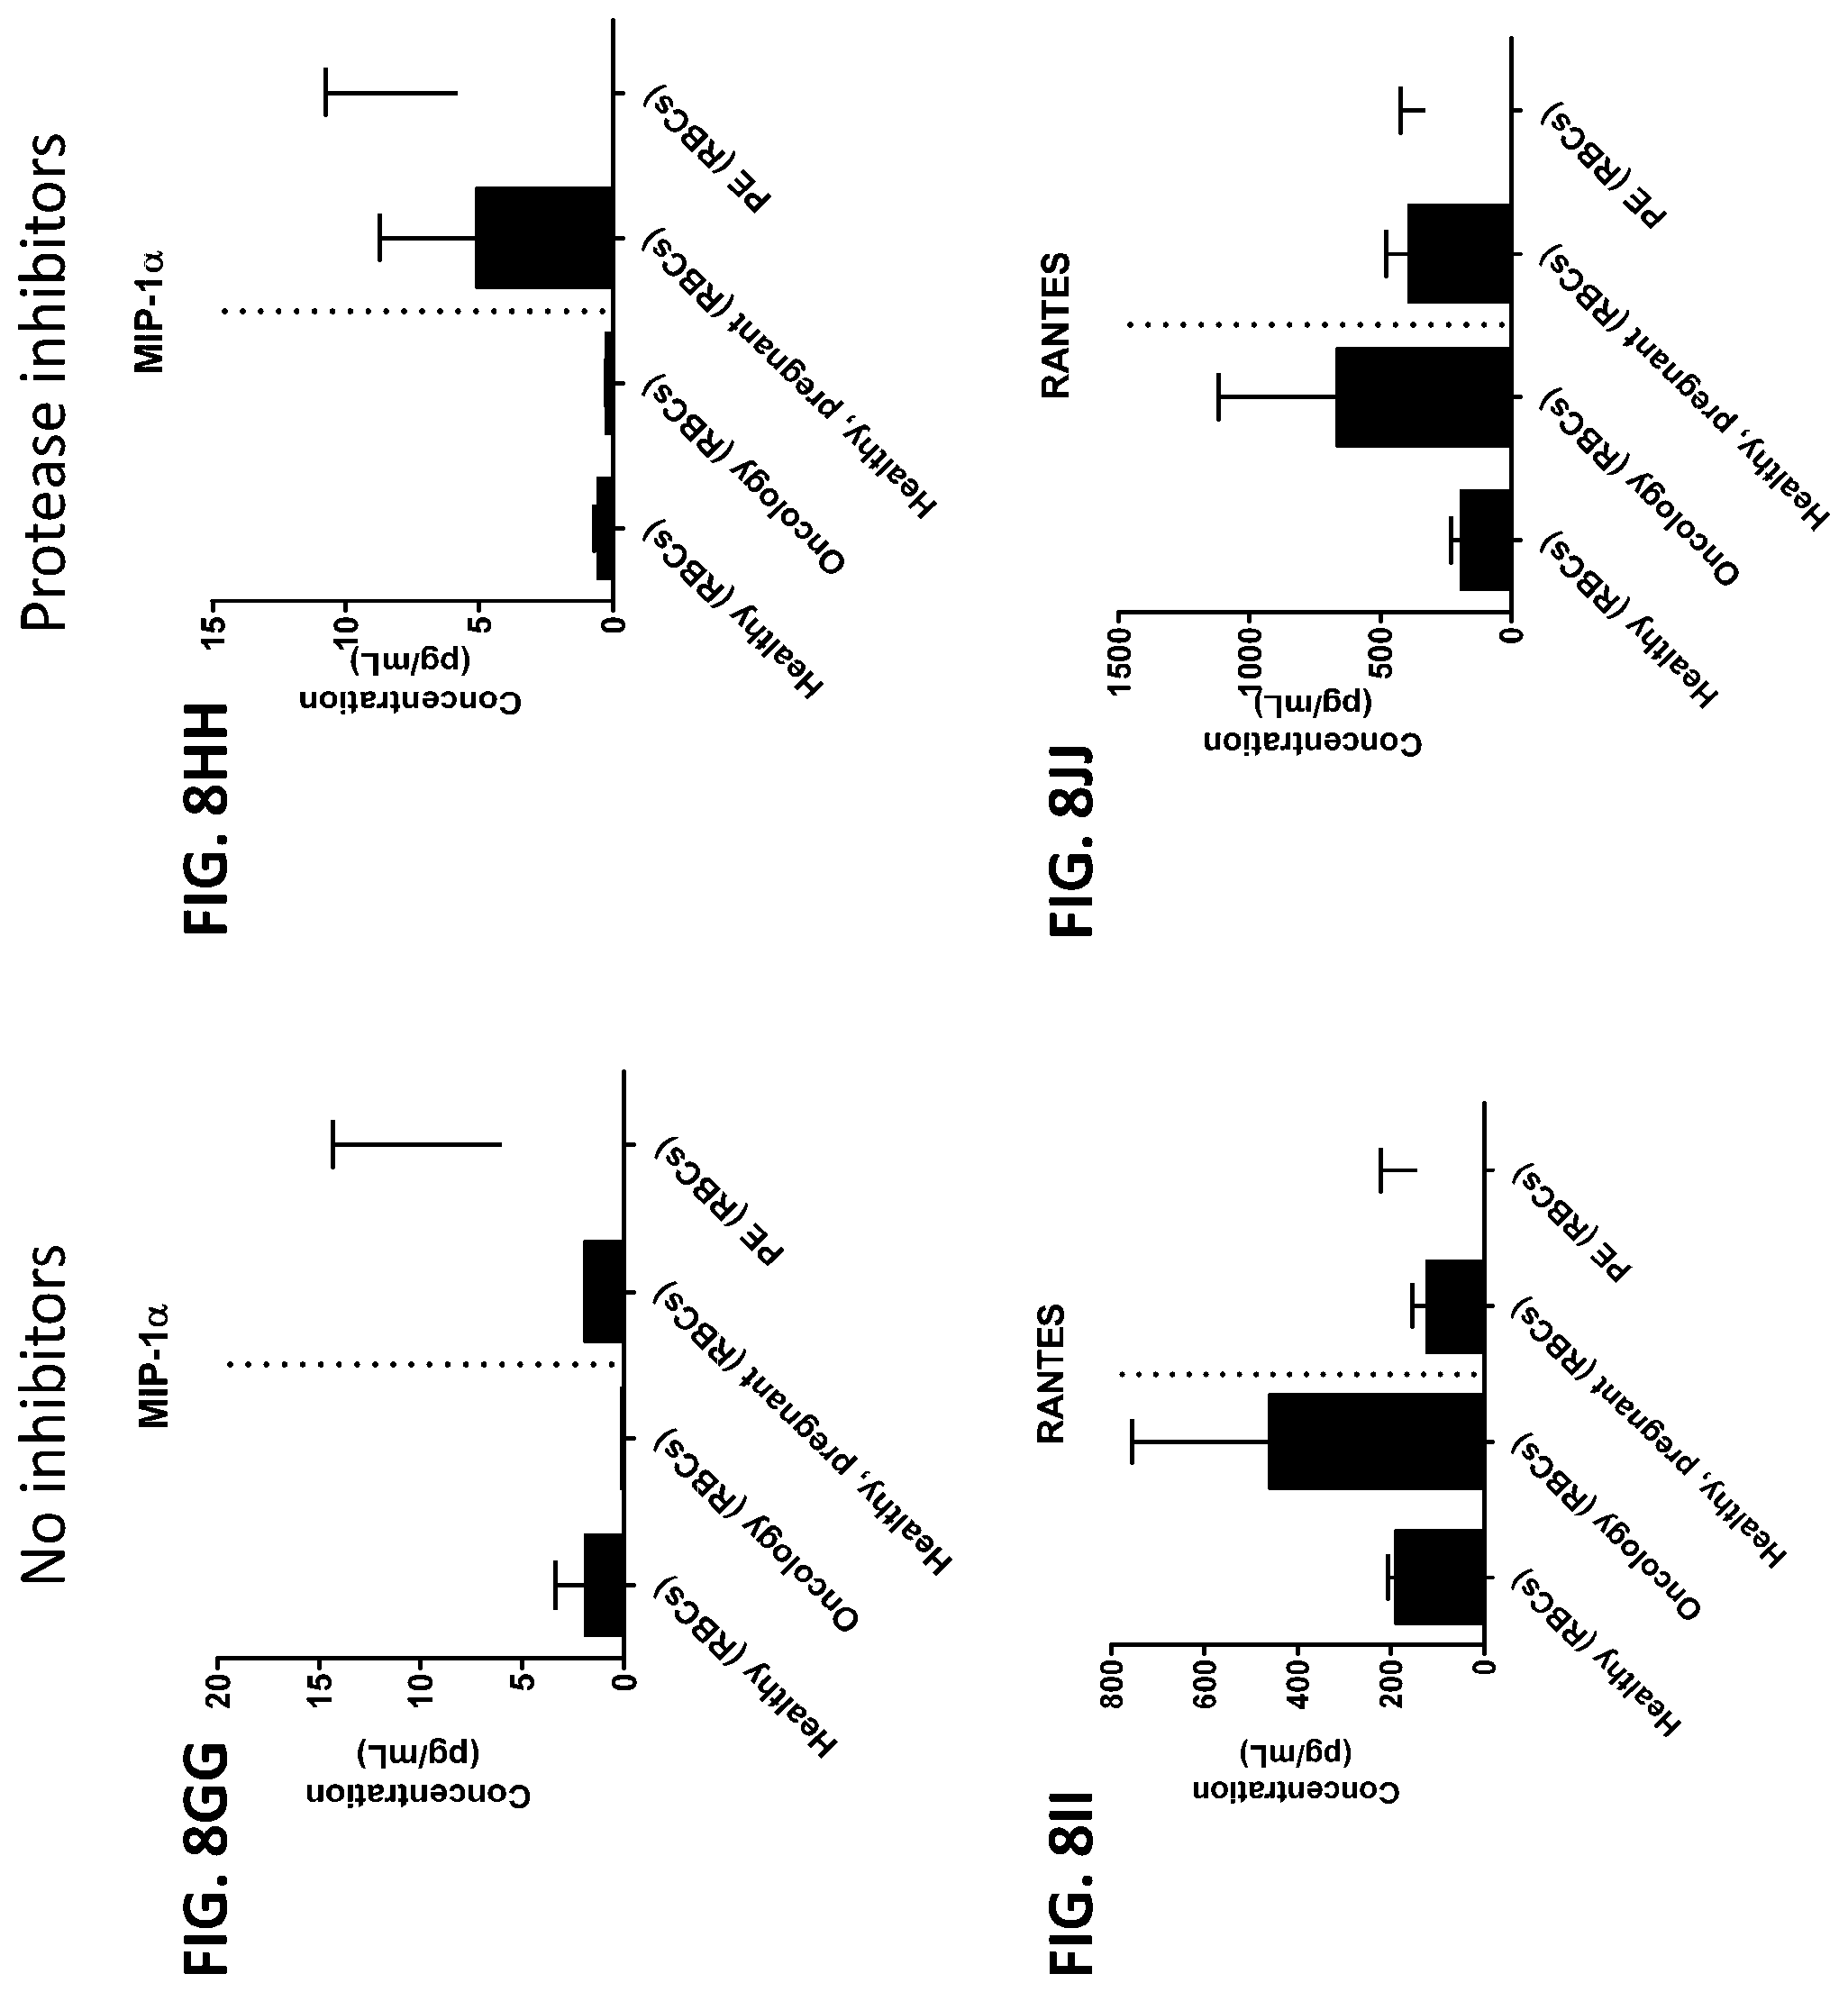
D00064

D00065
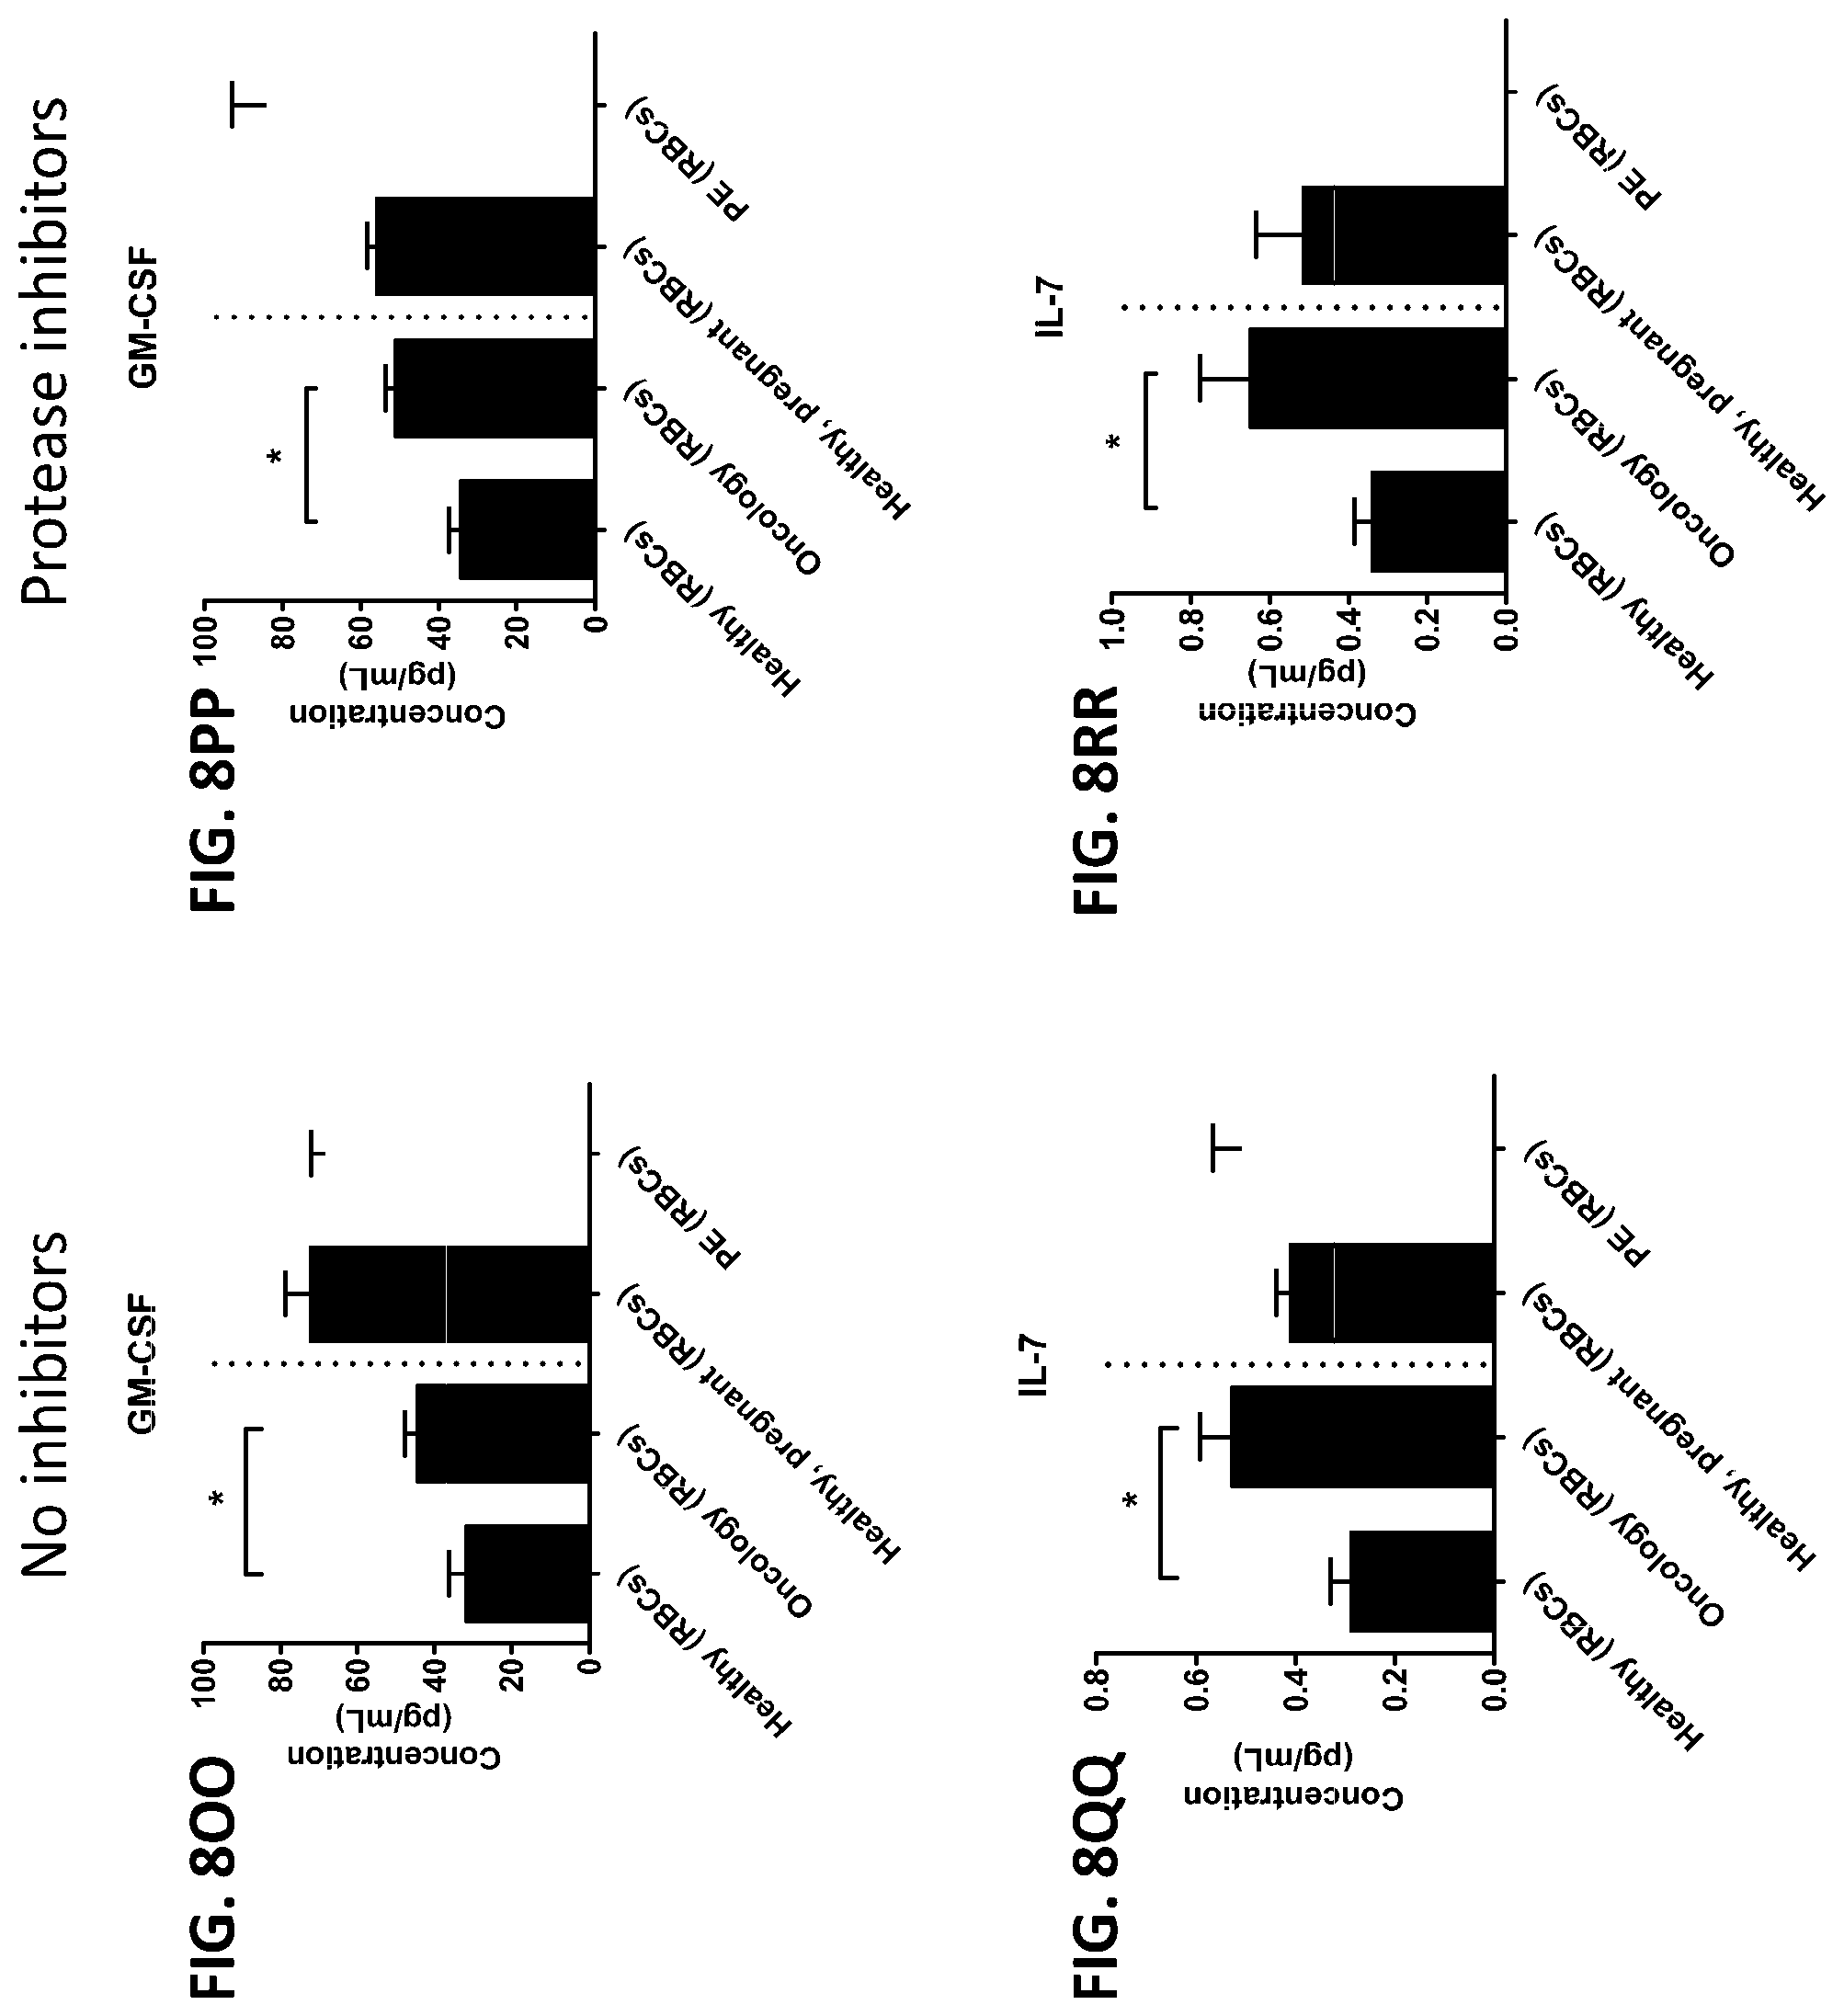
D00066
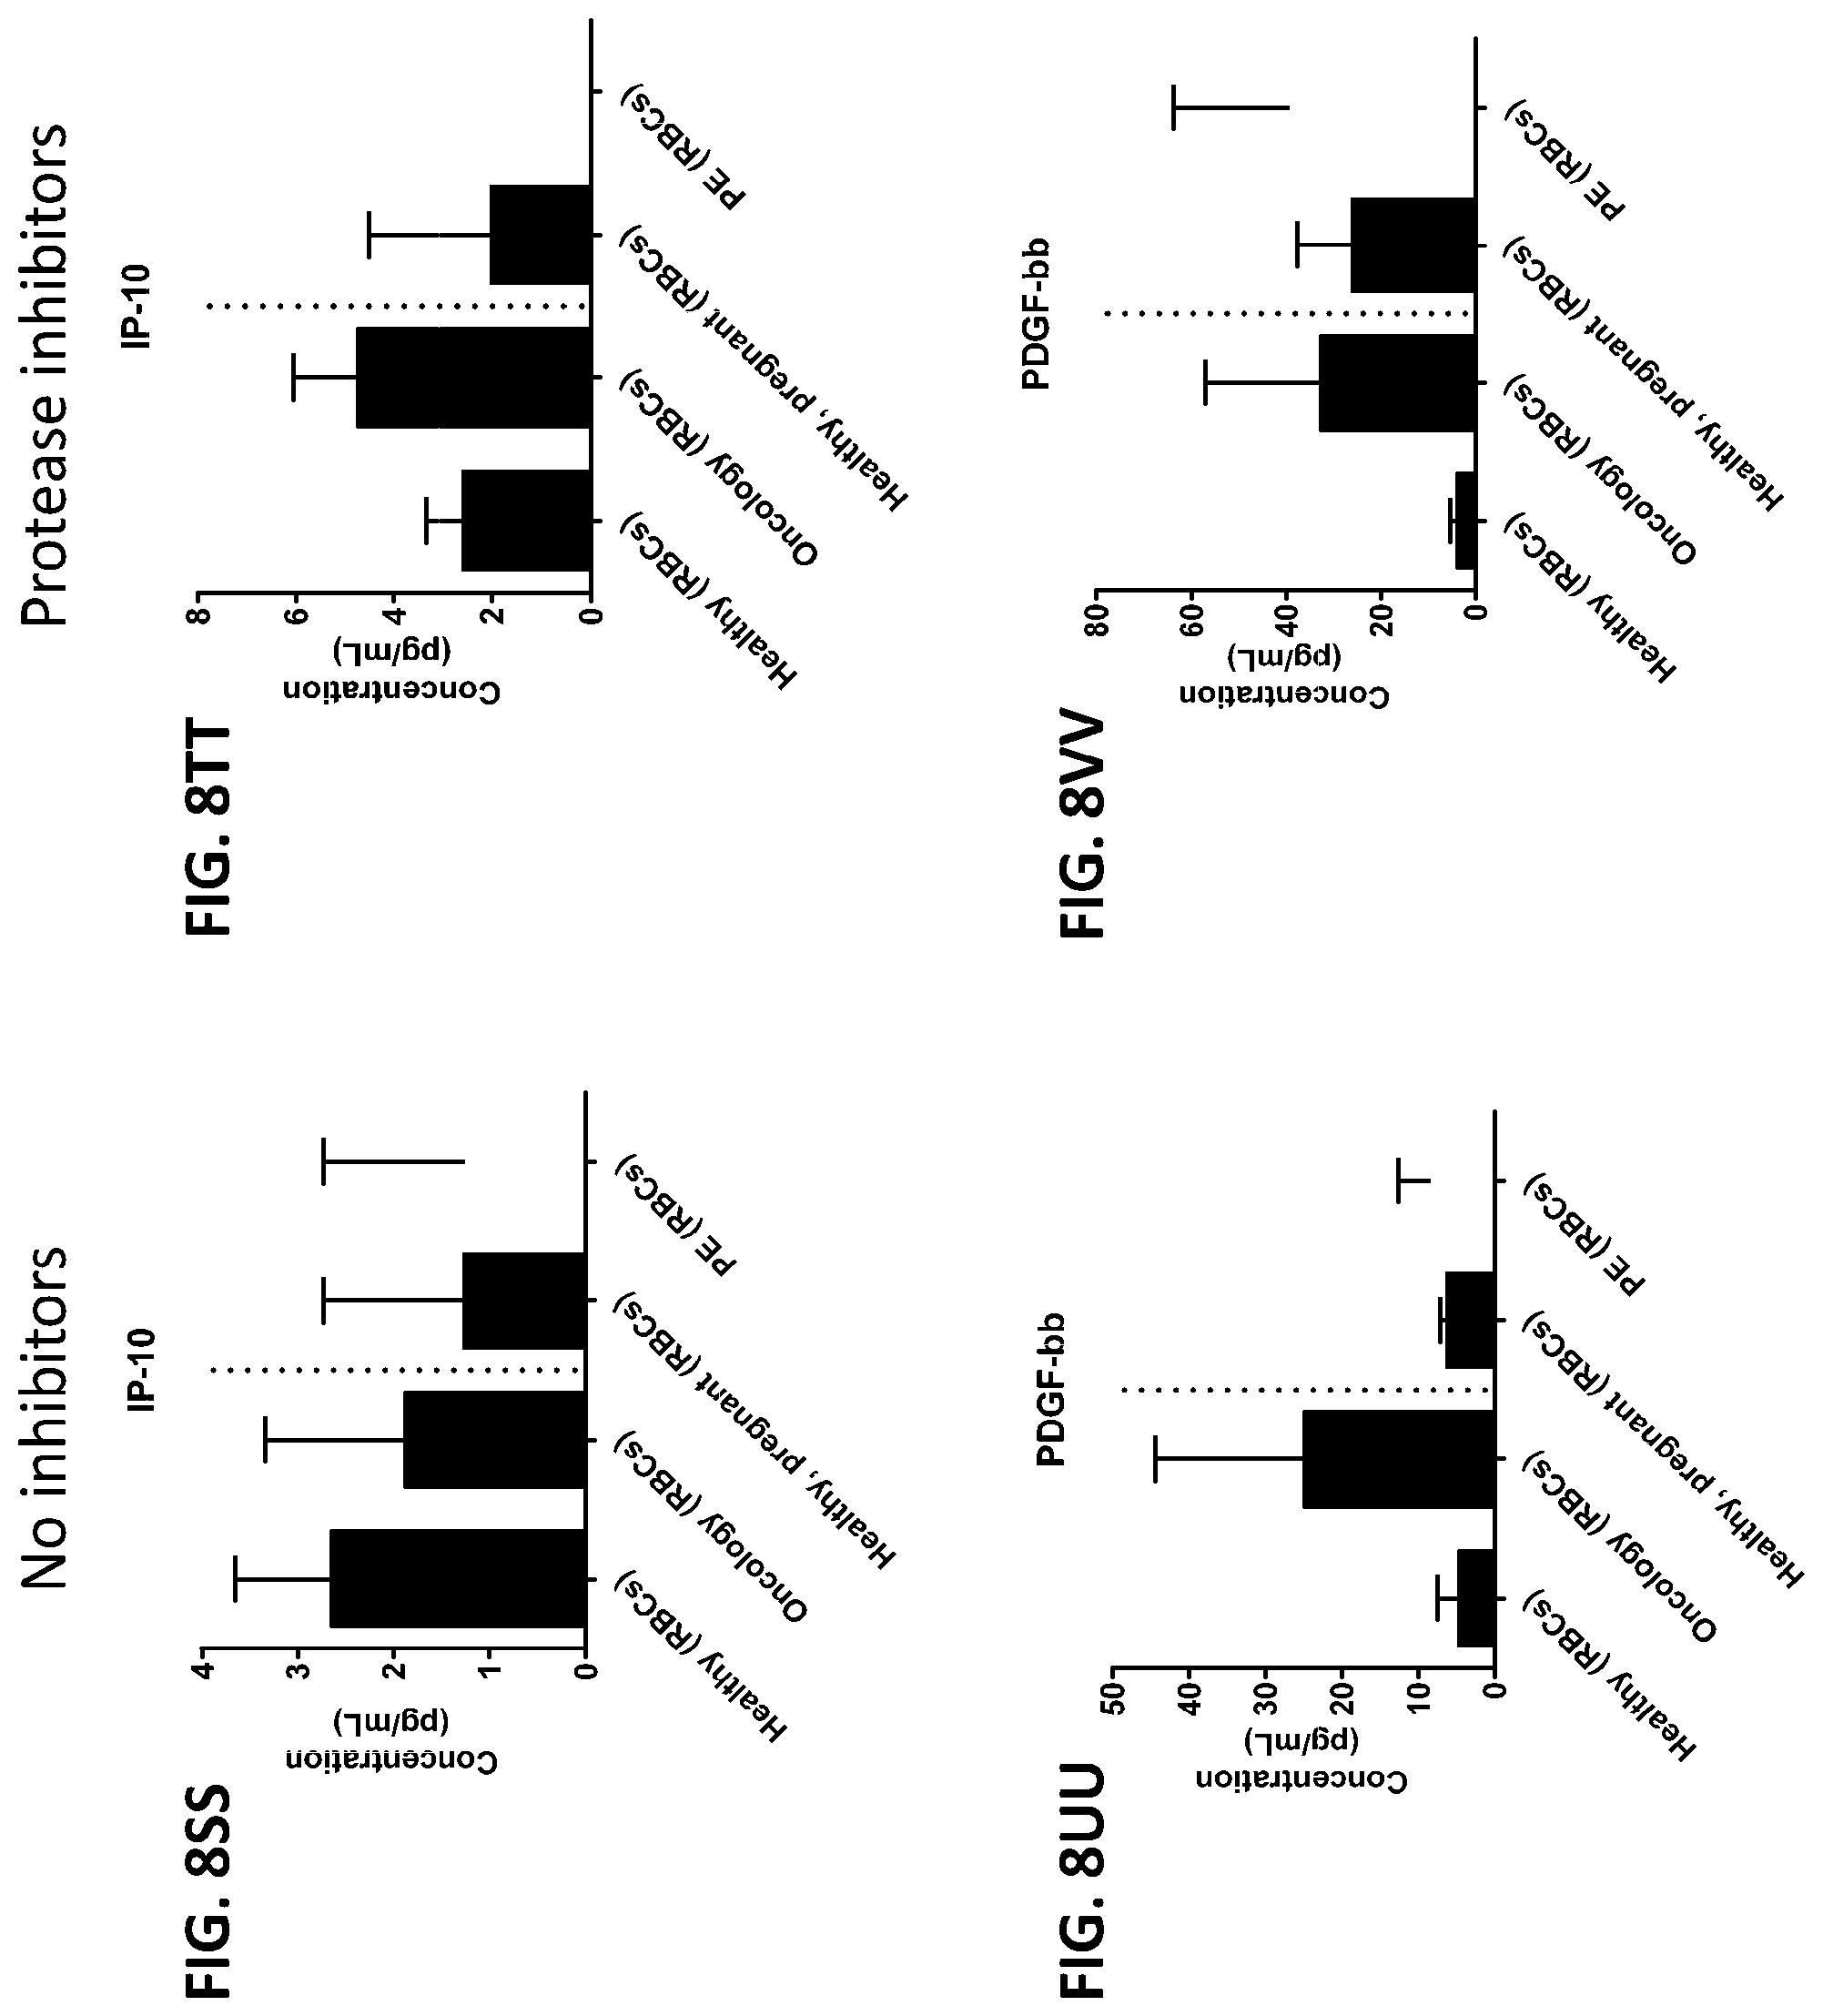
D00067

D00068

D00069

D00070

D00071

D00072

D00073

D00074
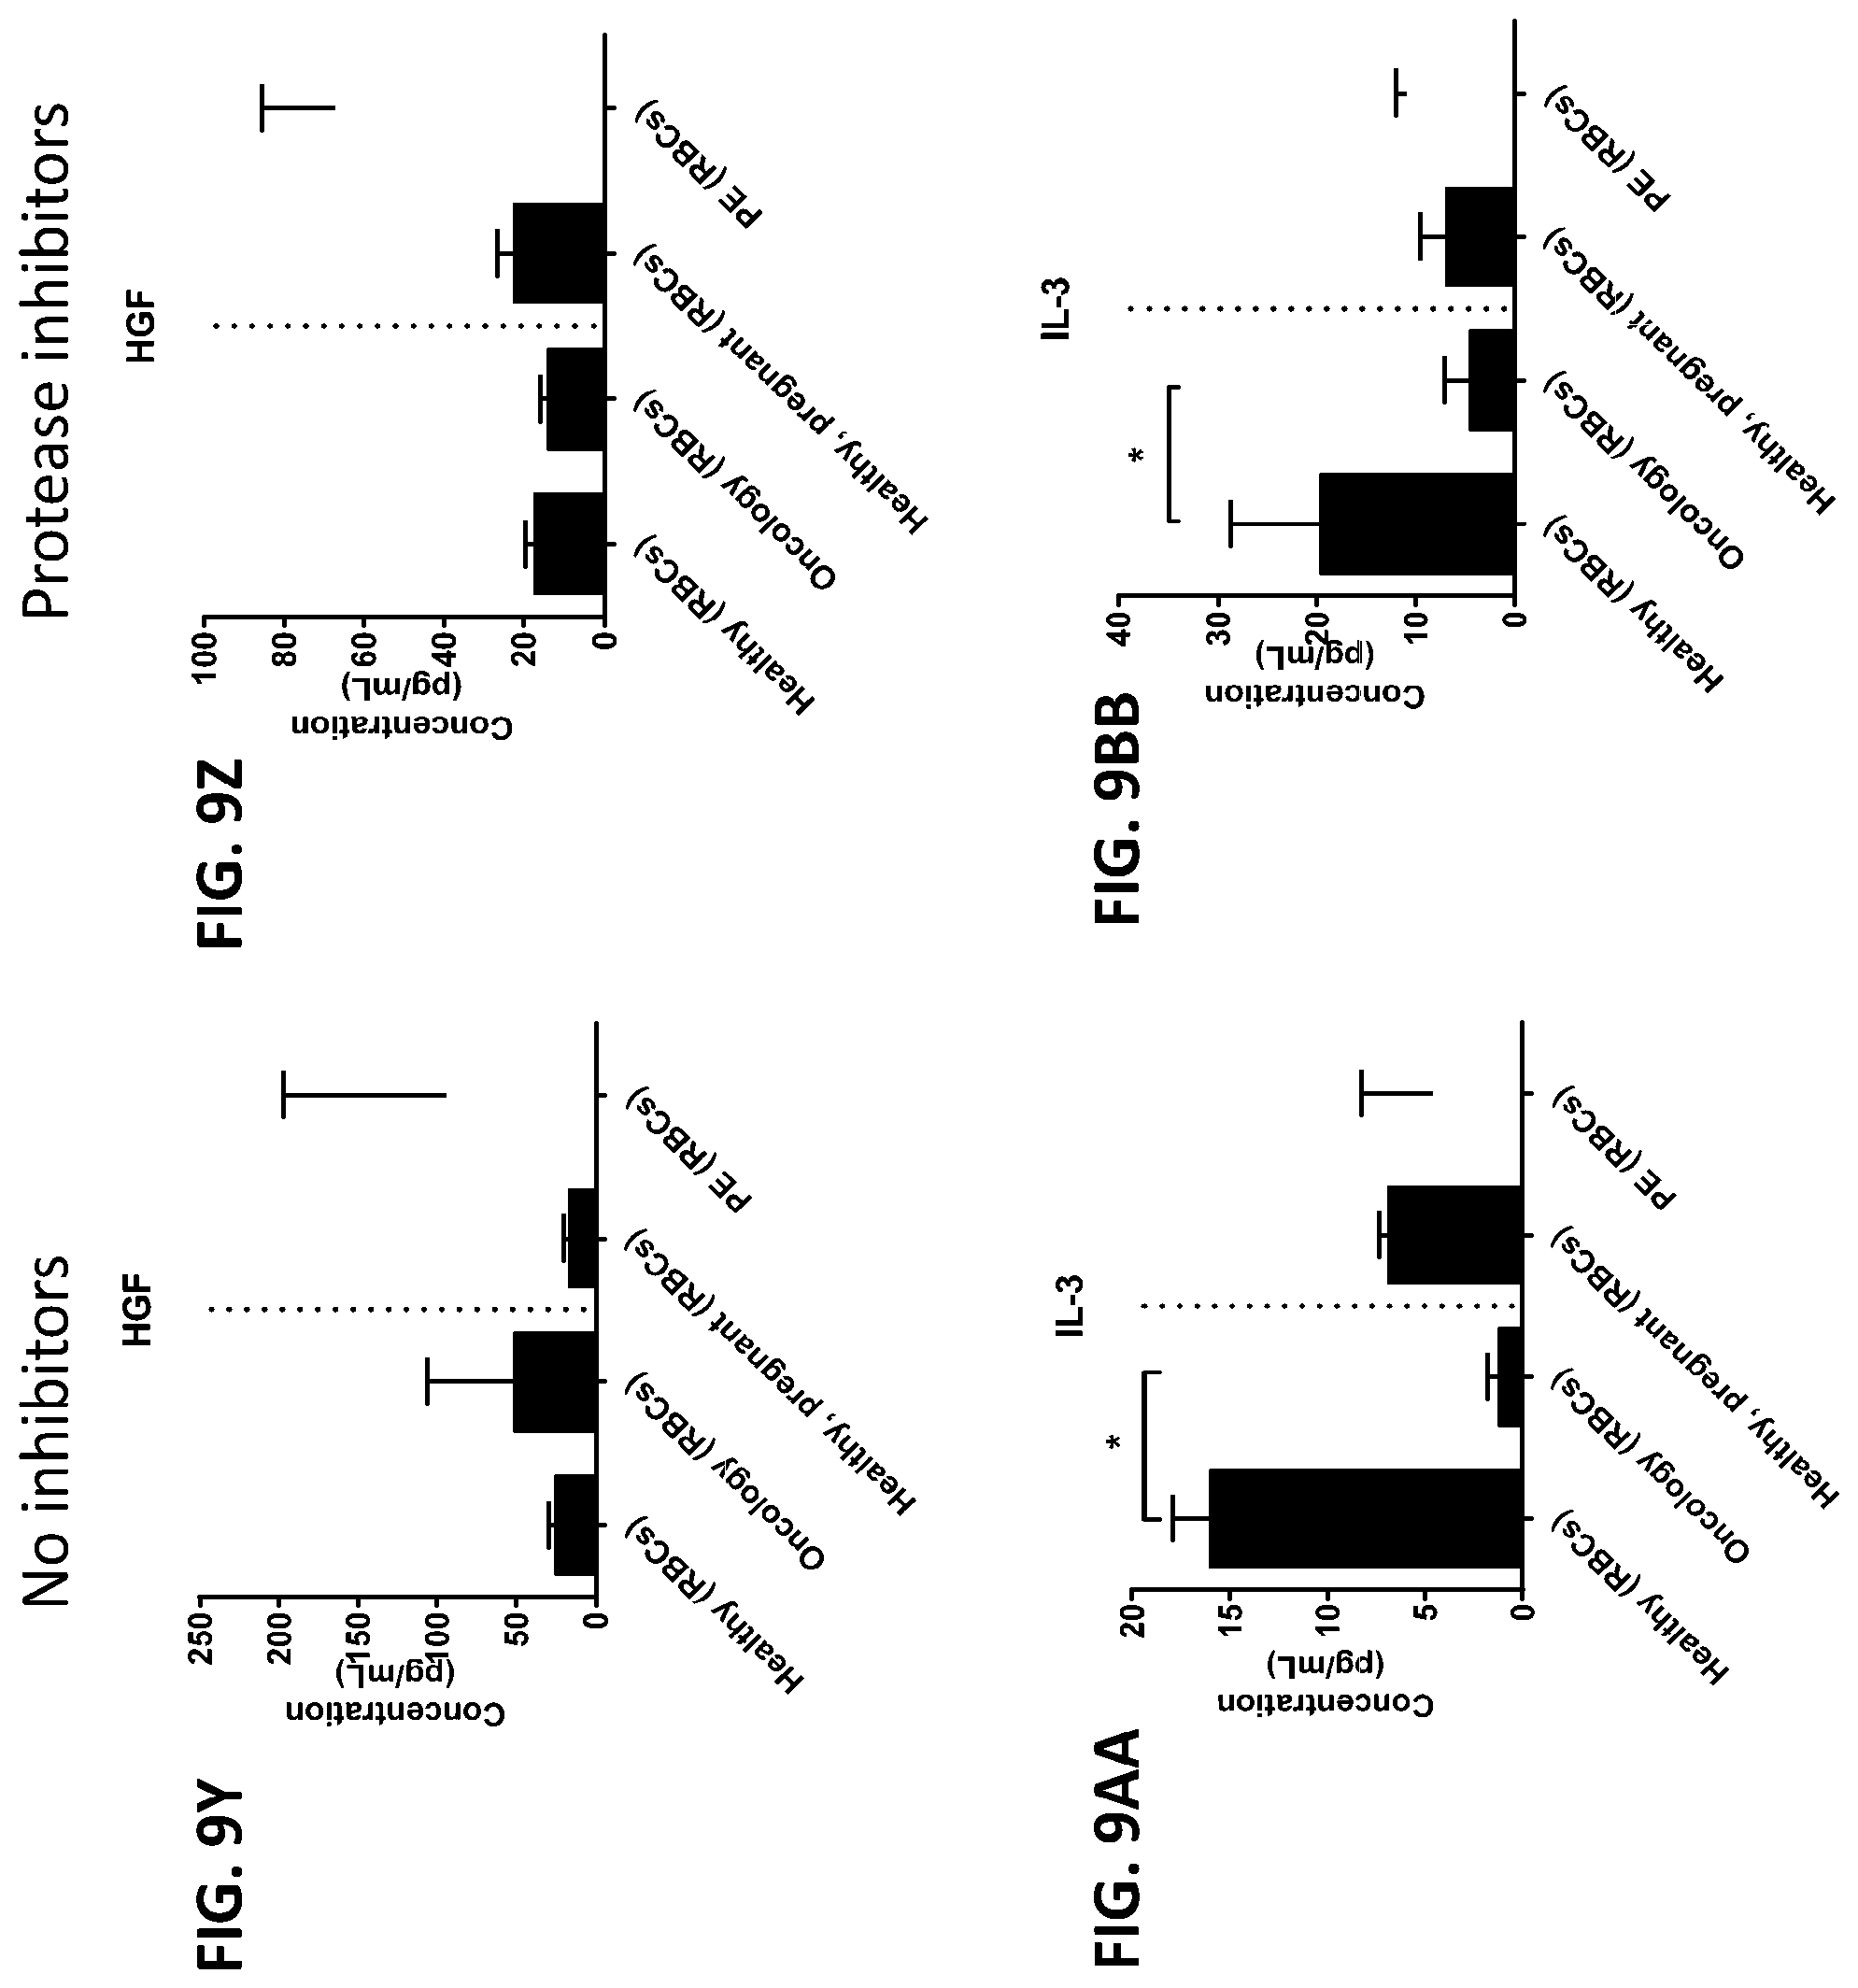
D00075
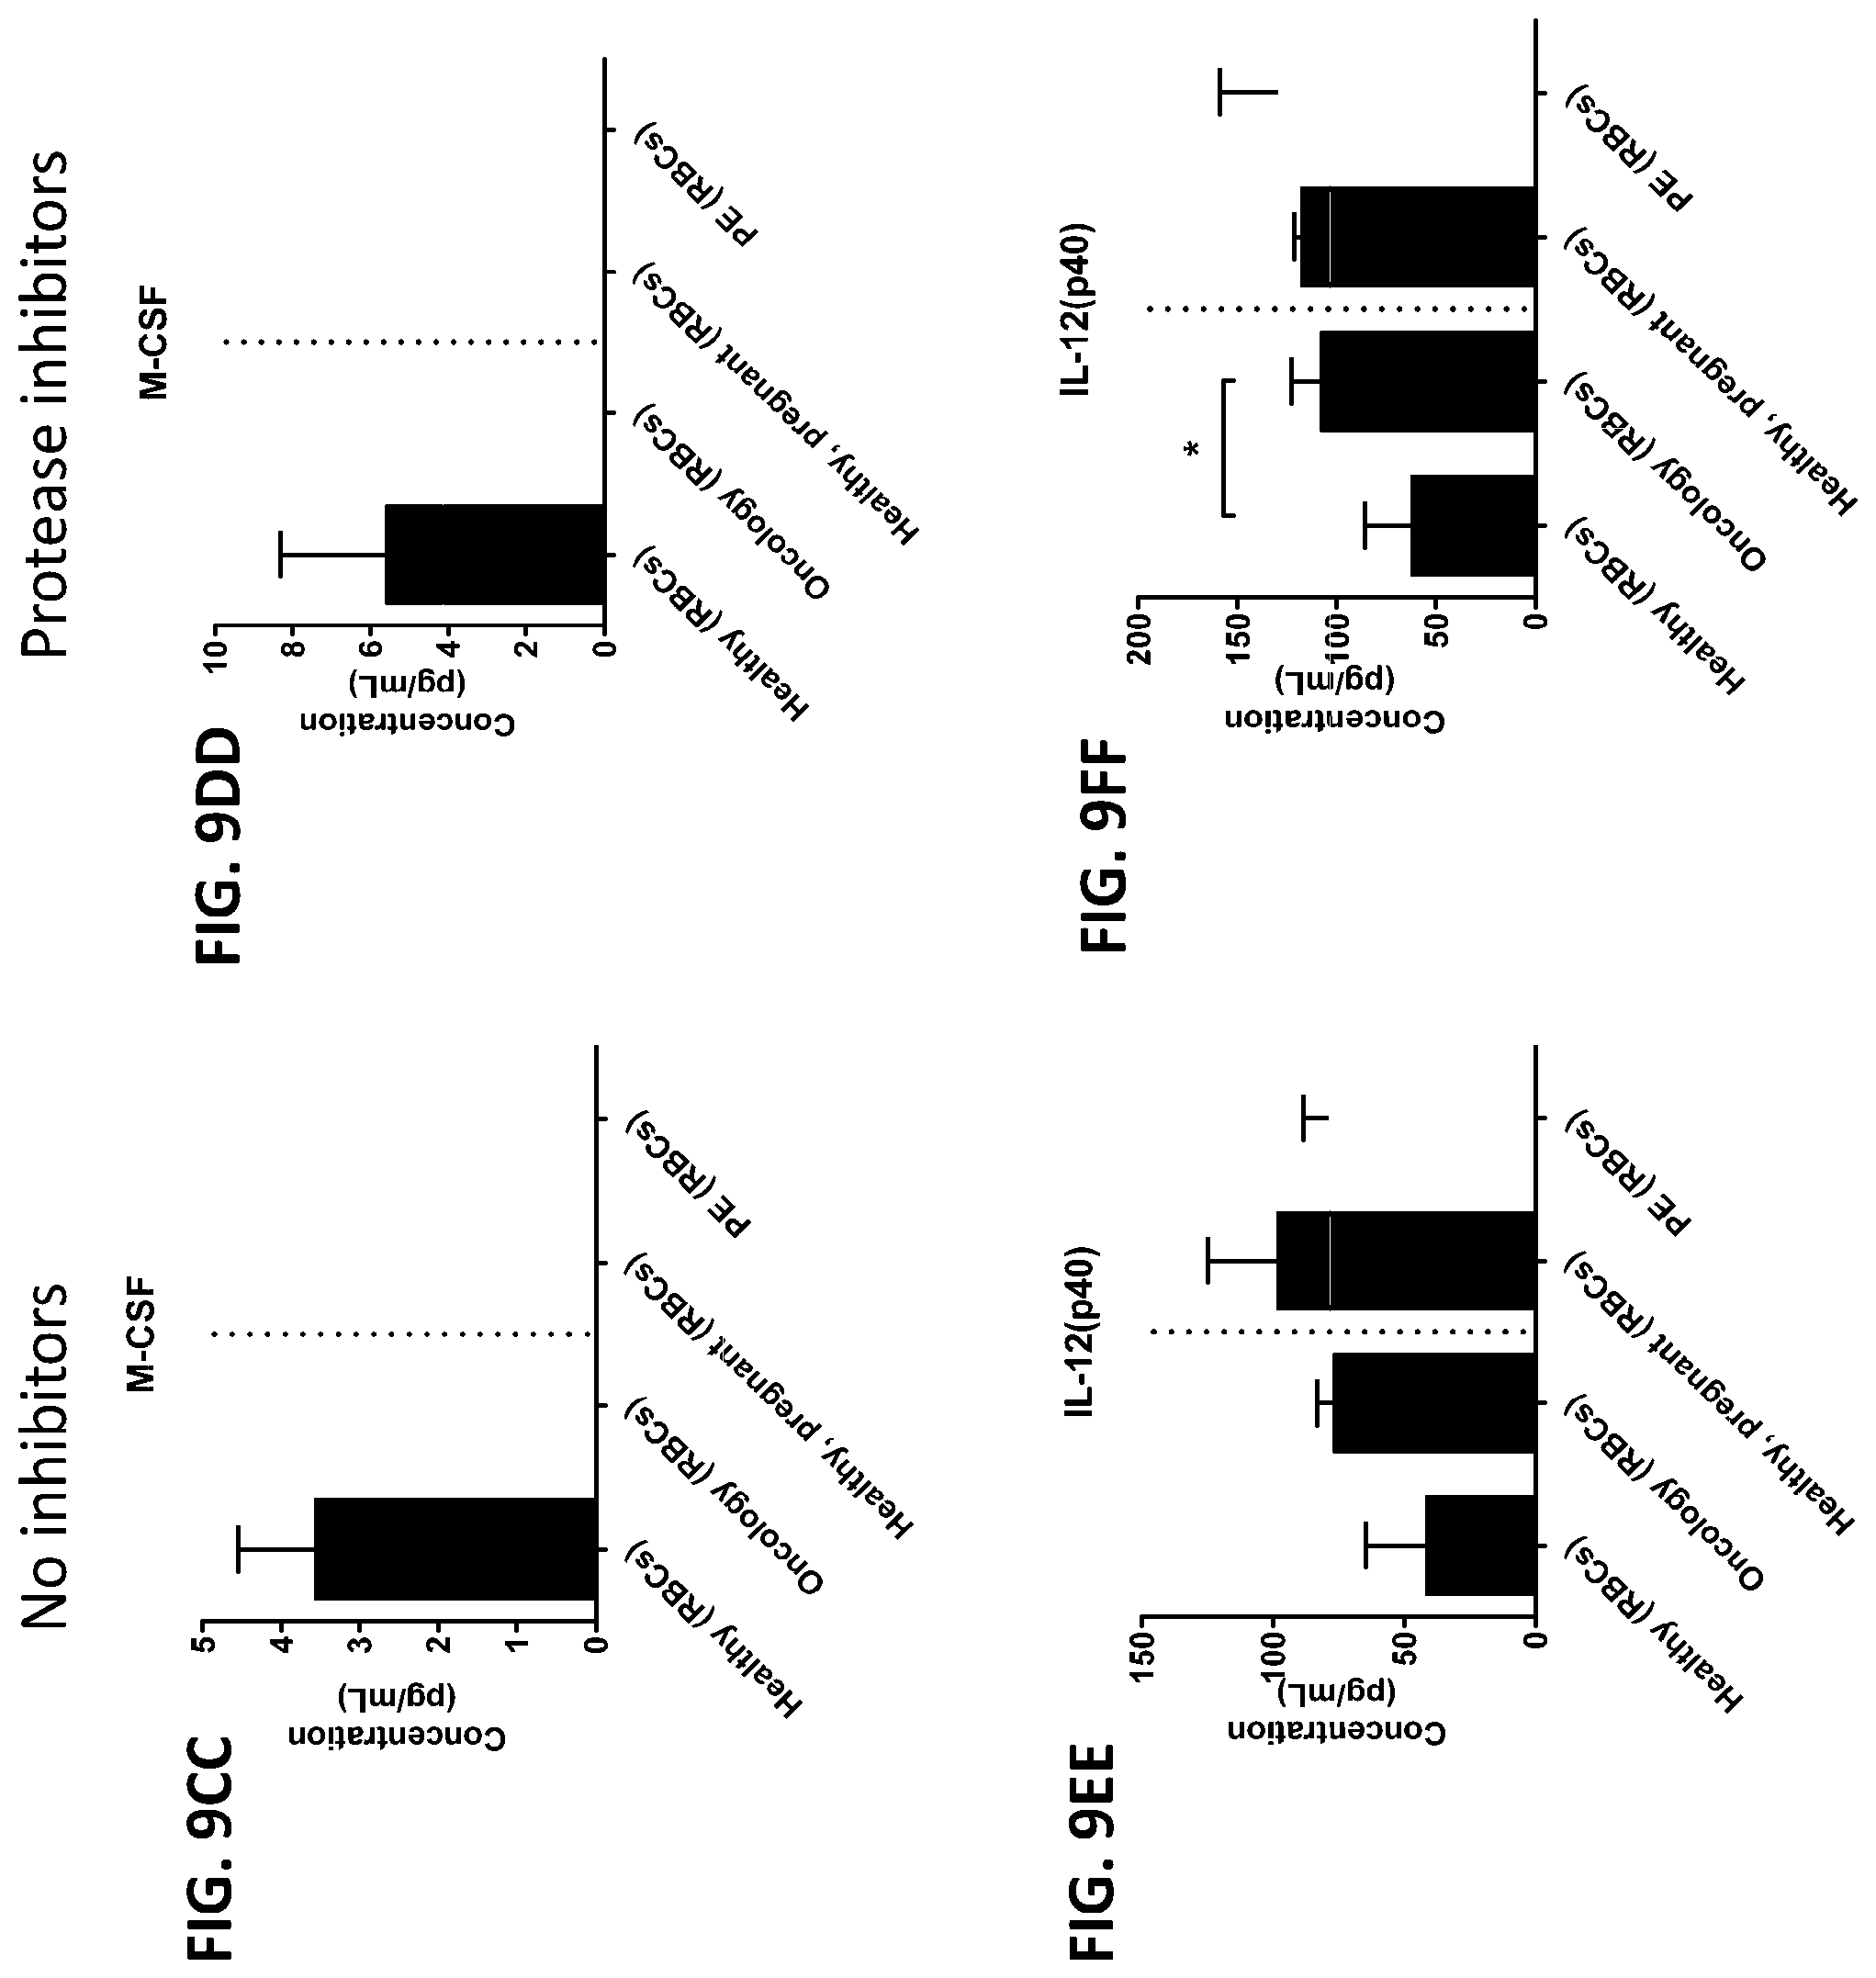
D00076
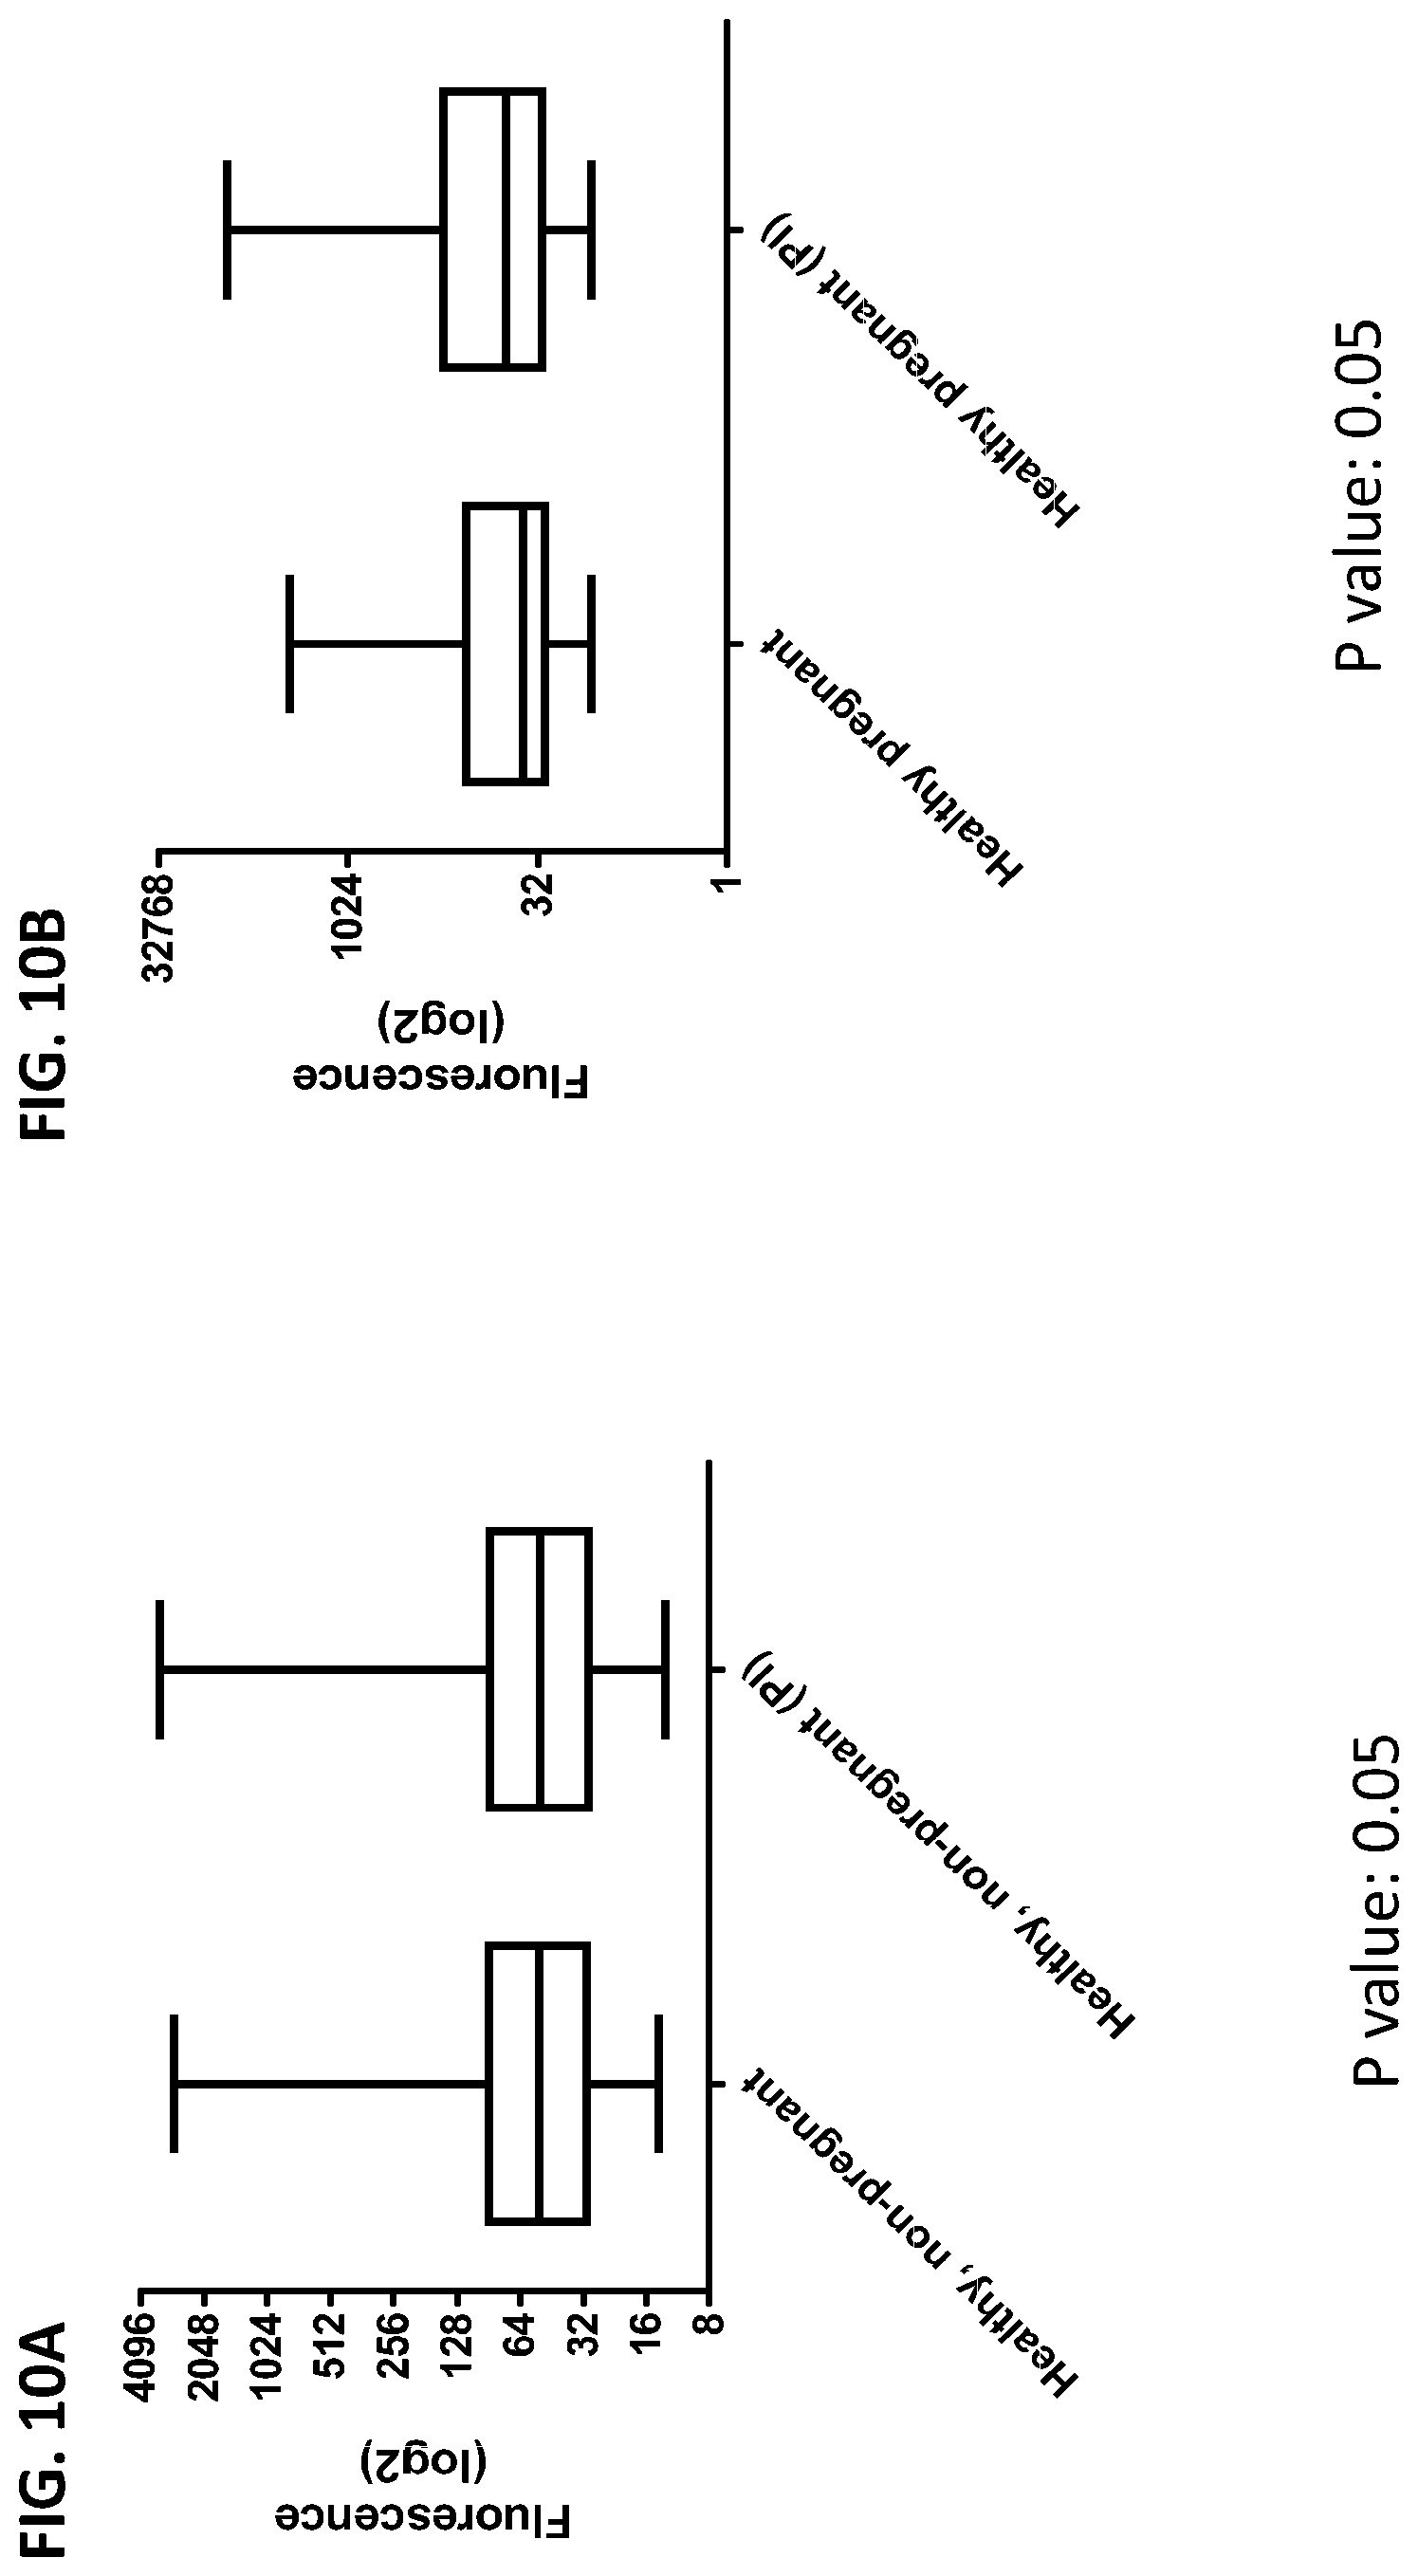
D00077
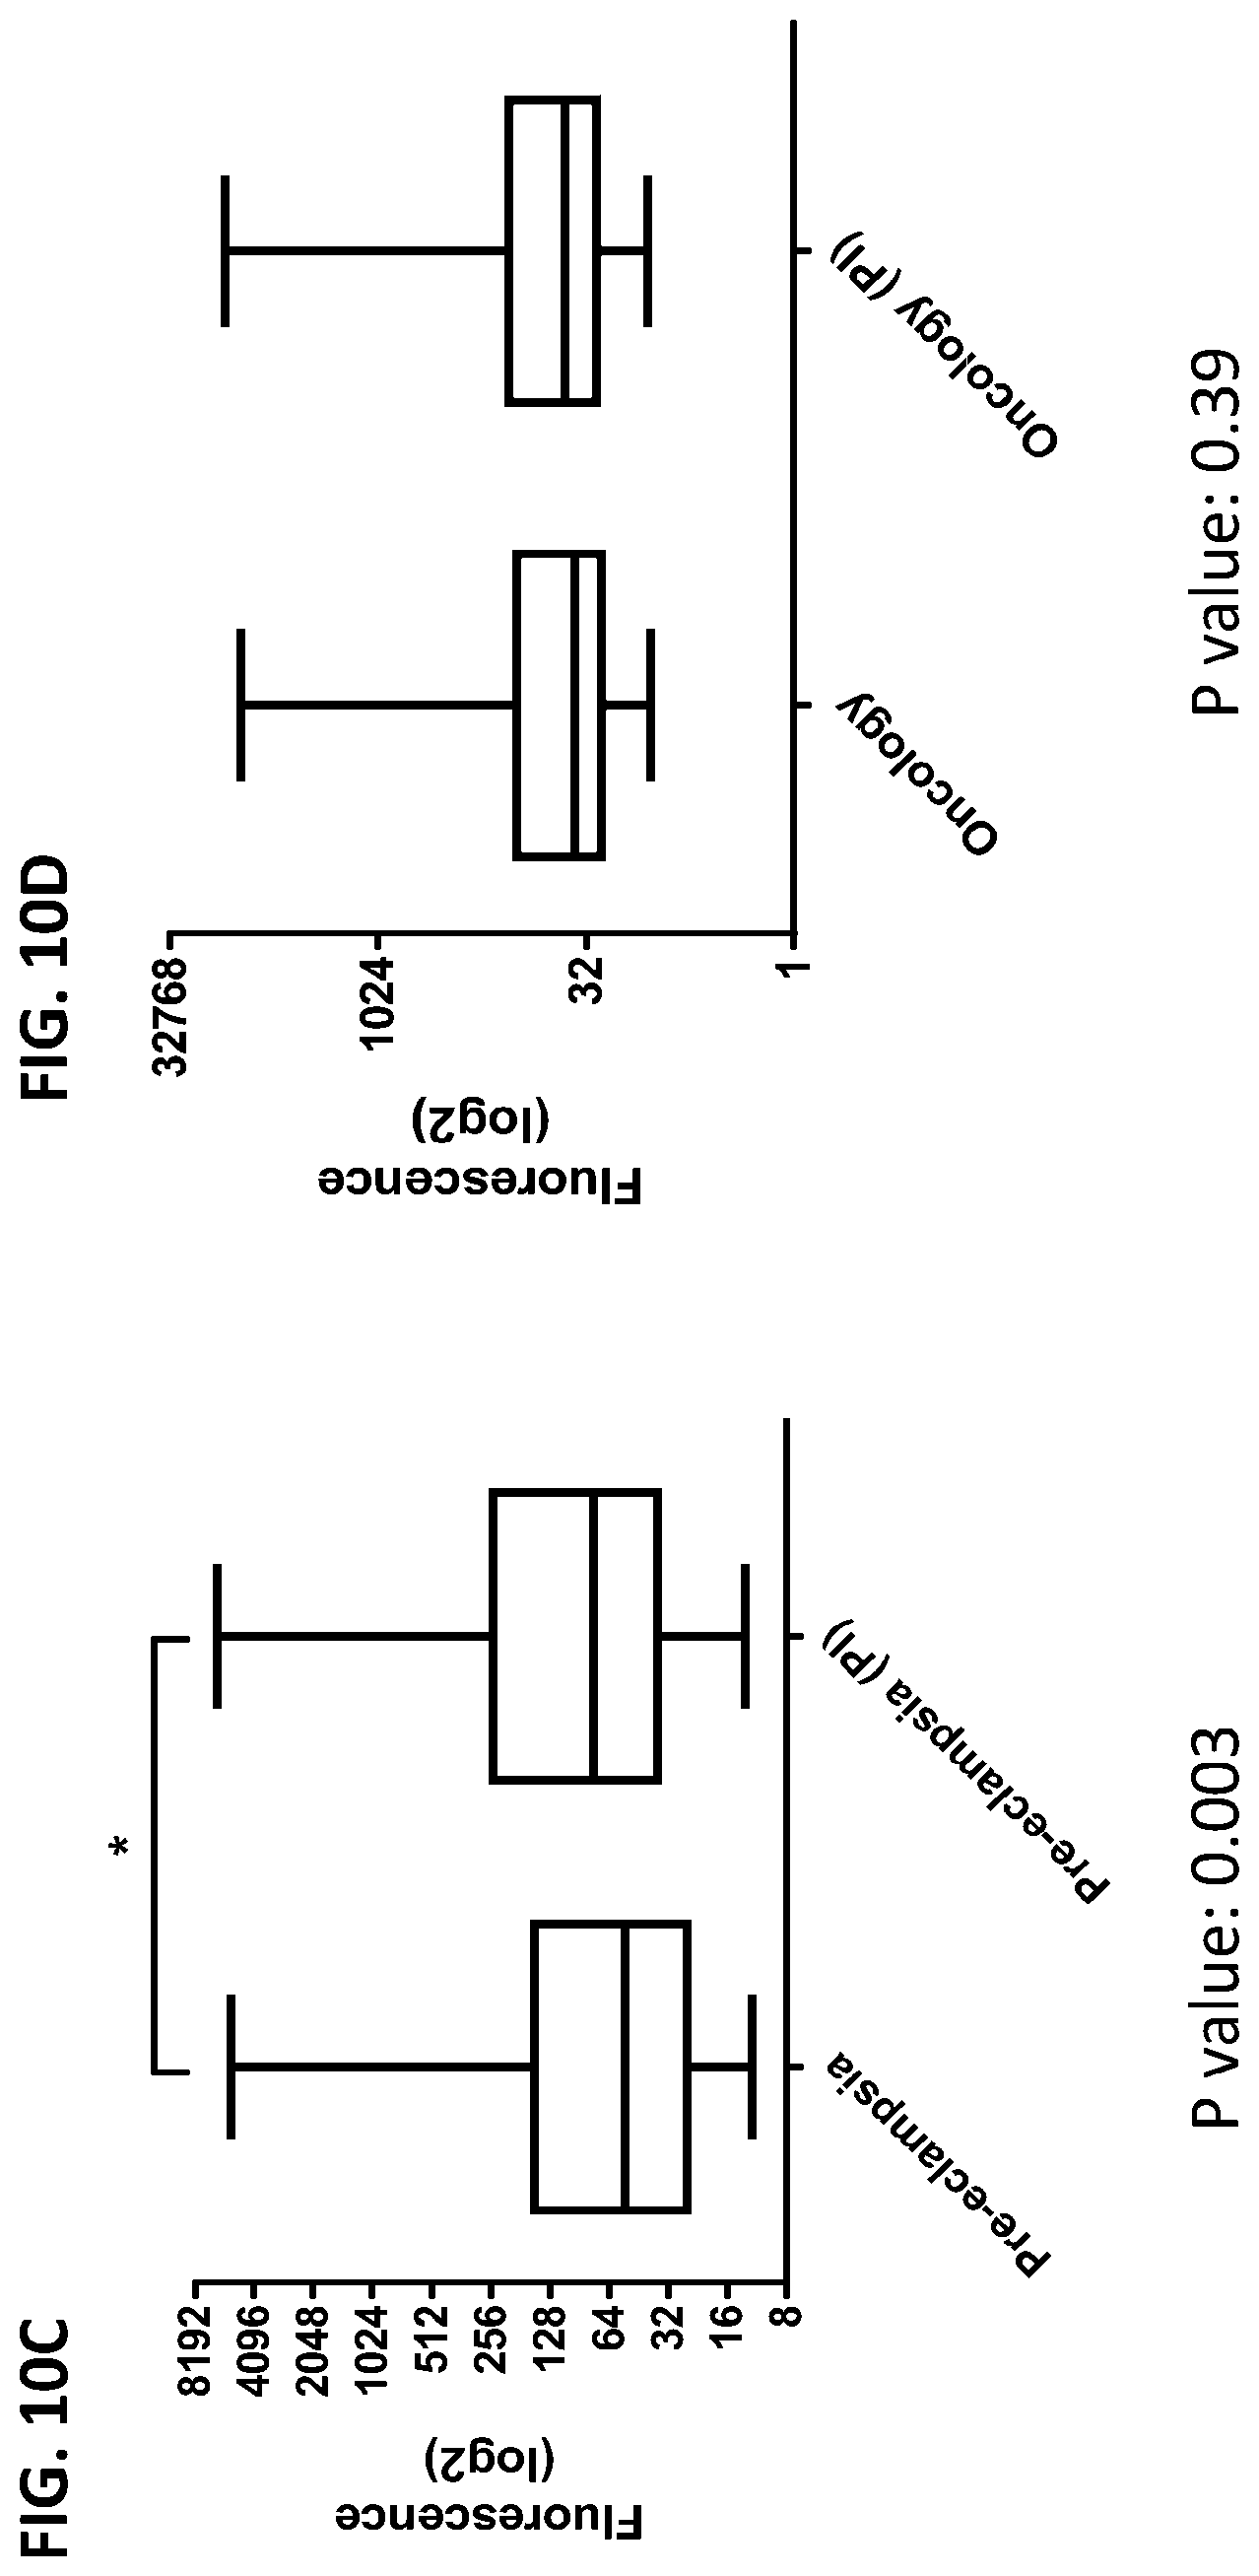
D00078

D00079
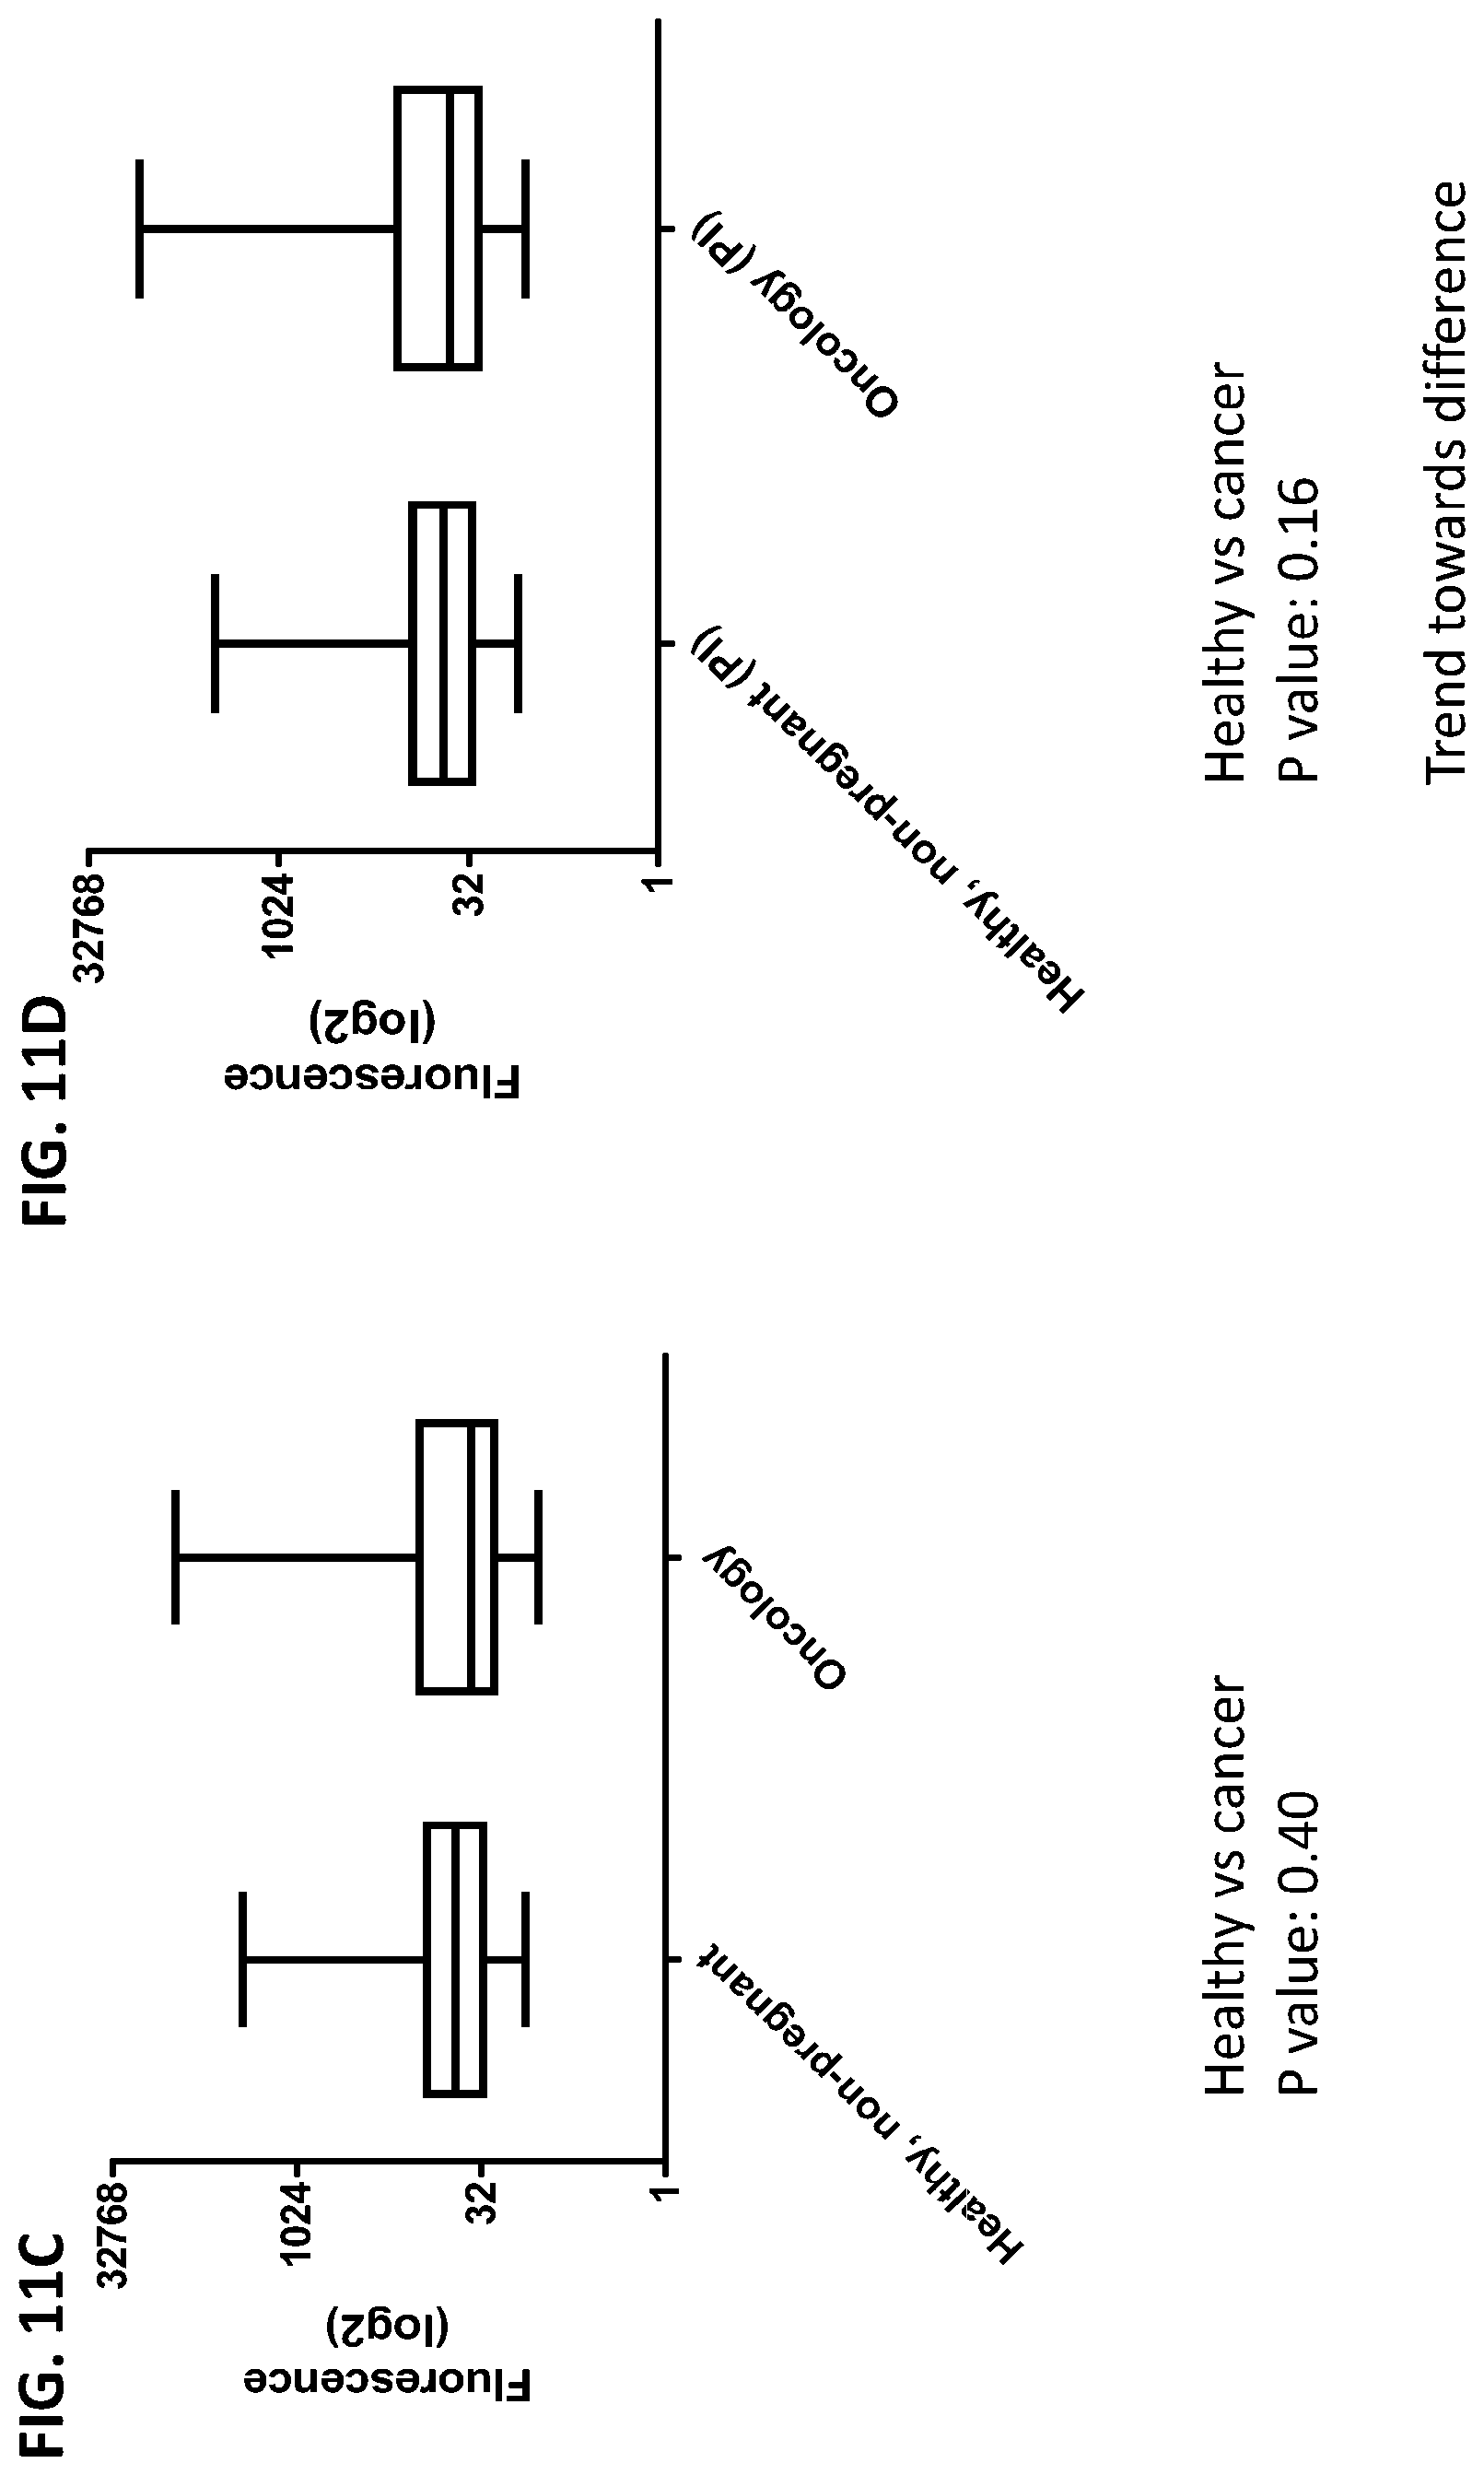
D00080
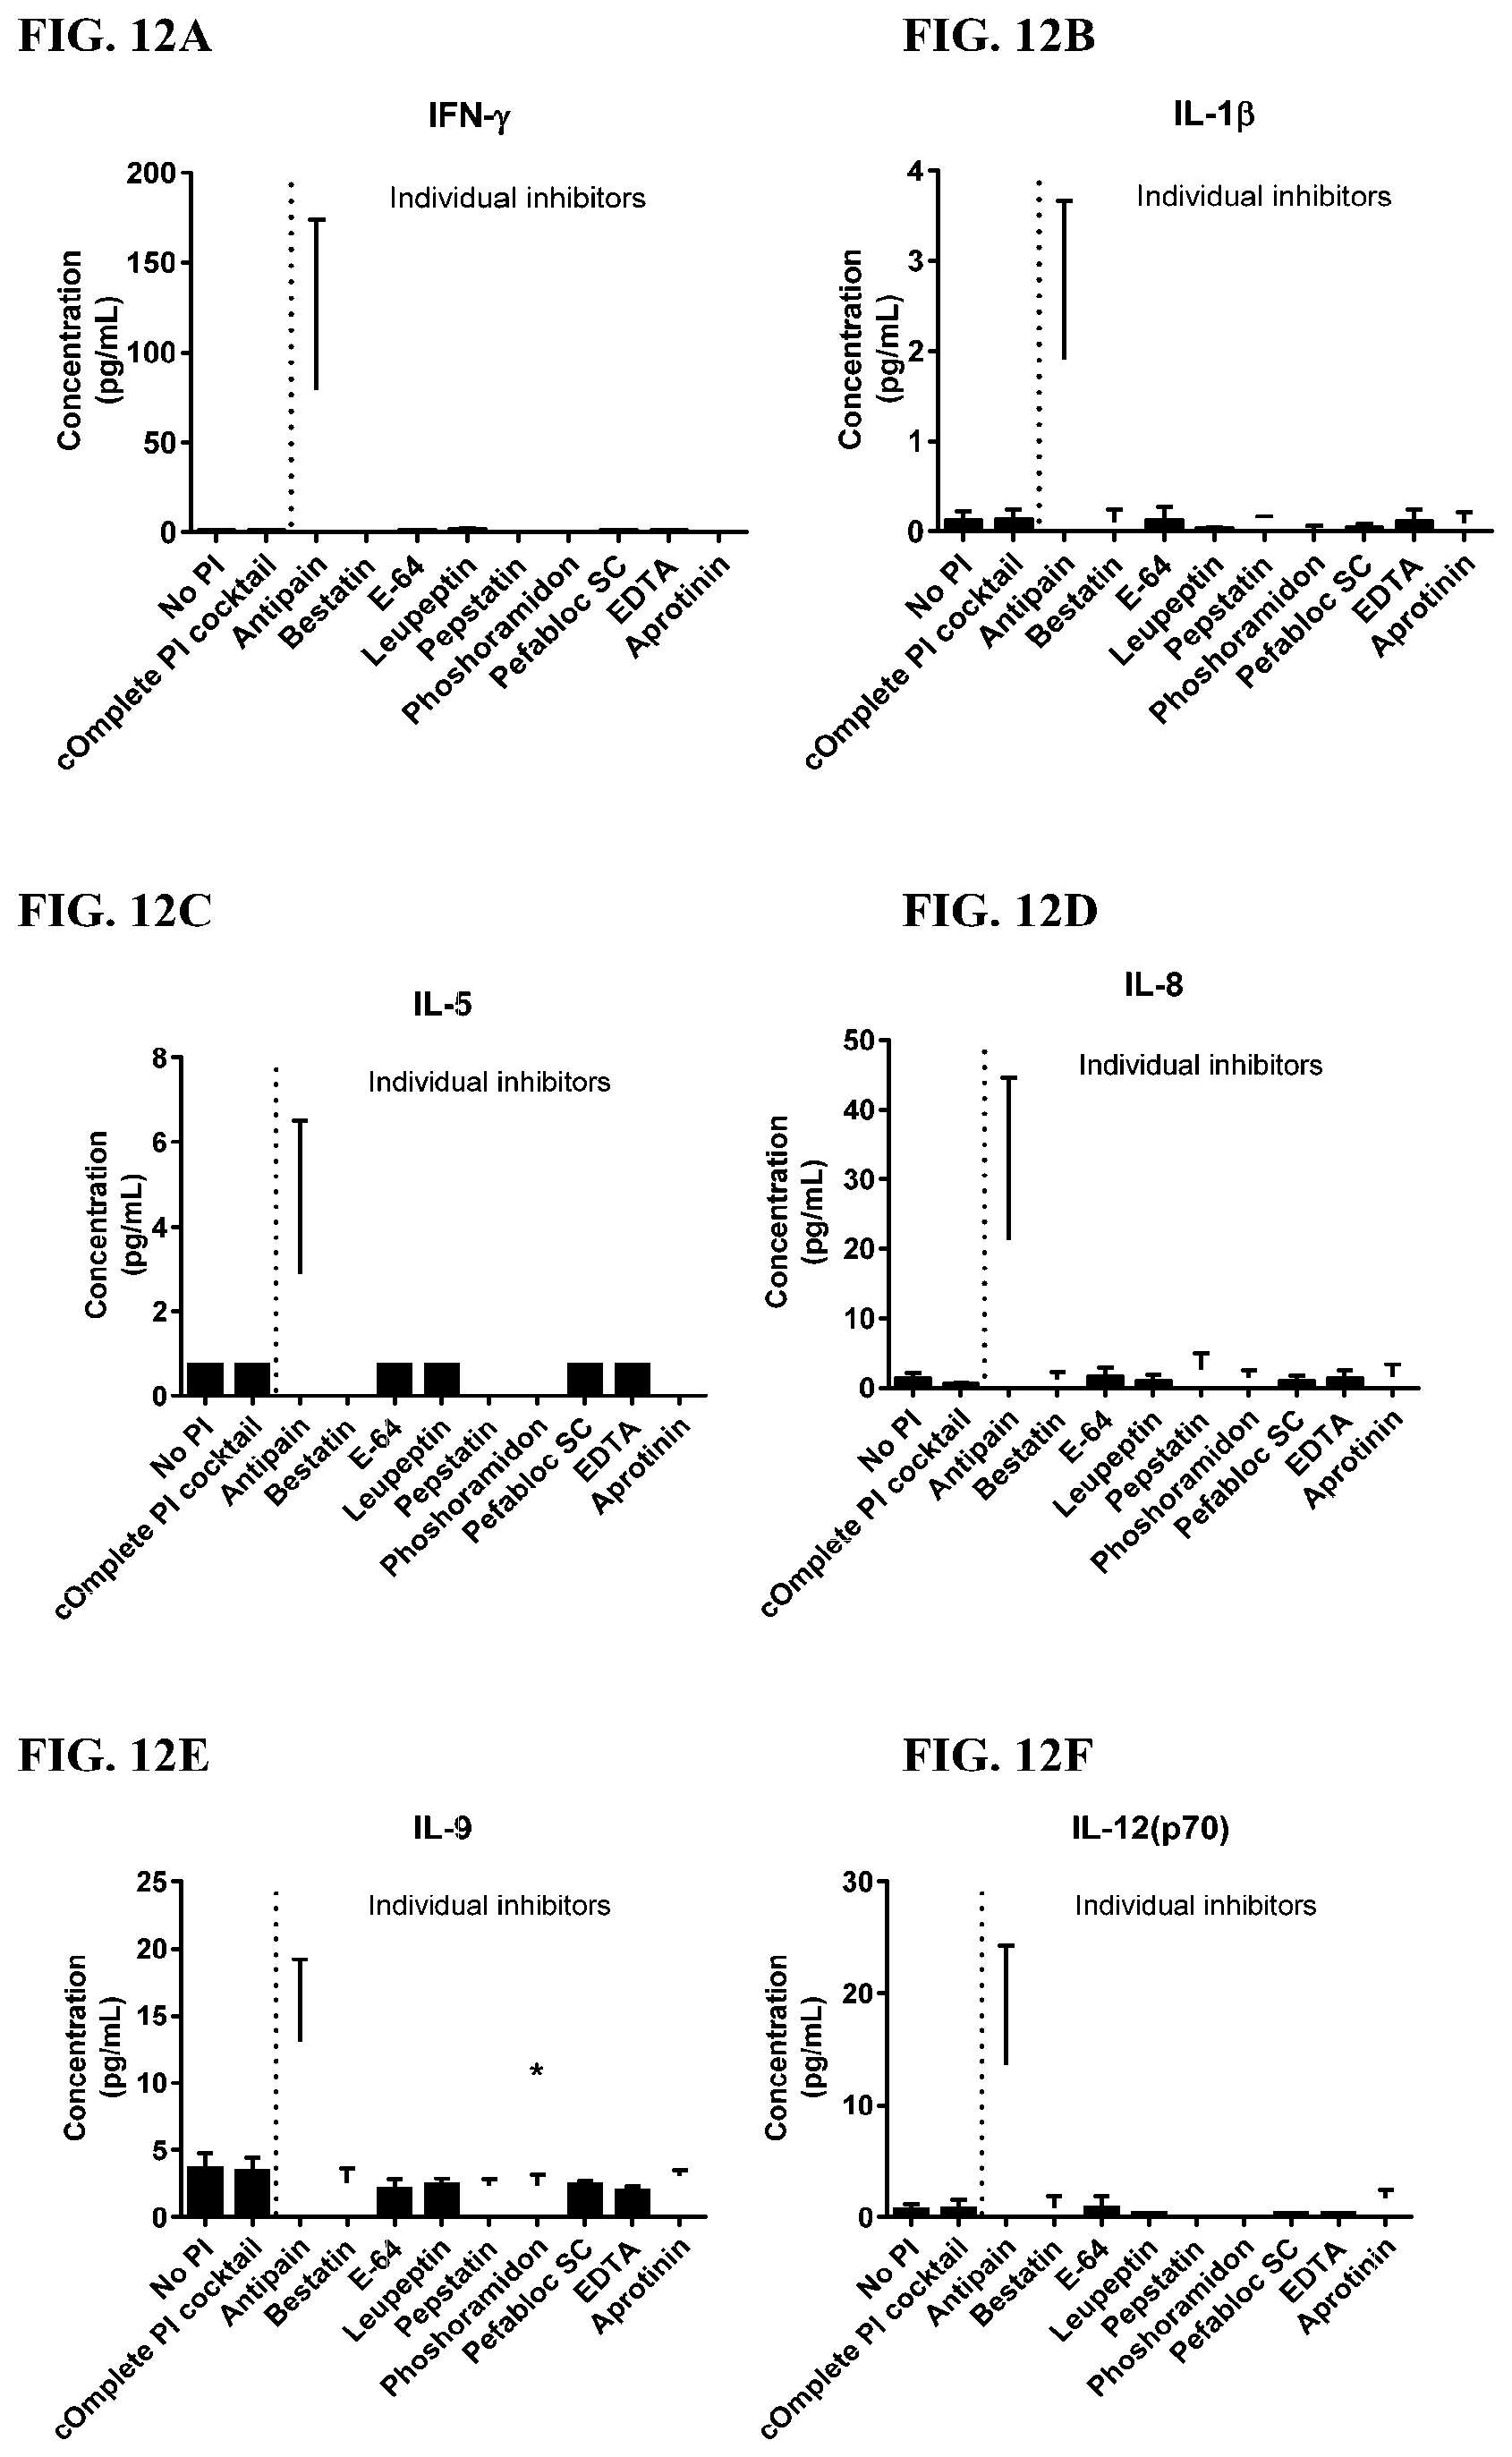
D00081

D00082
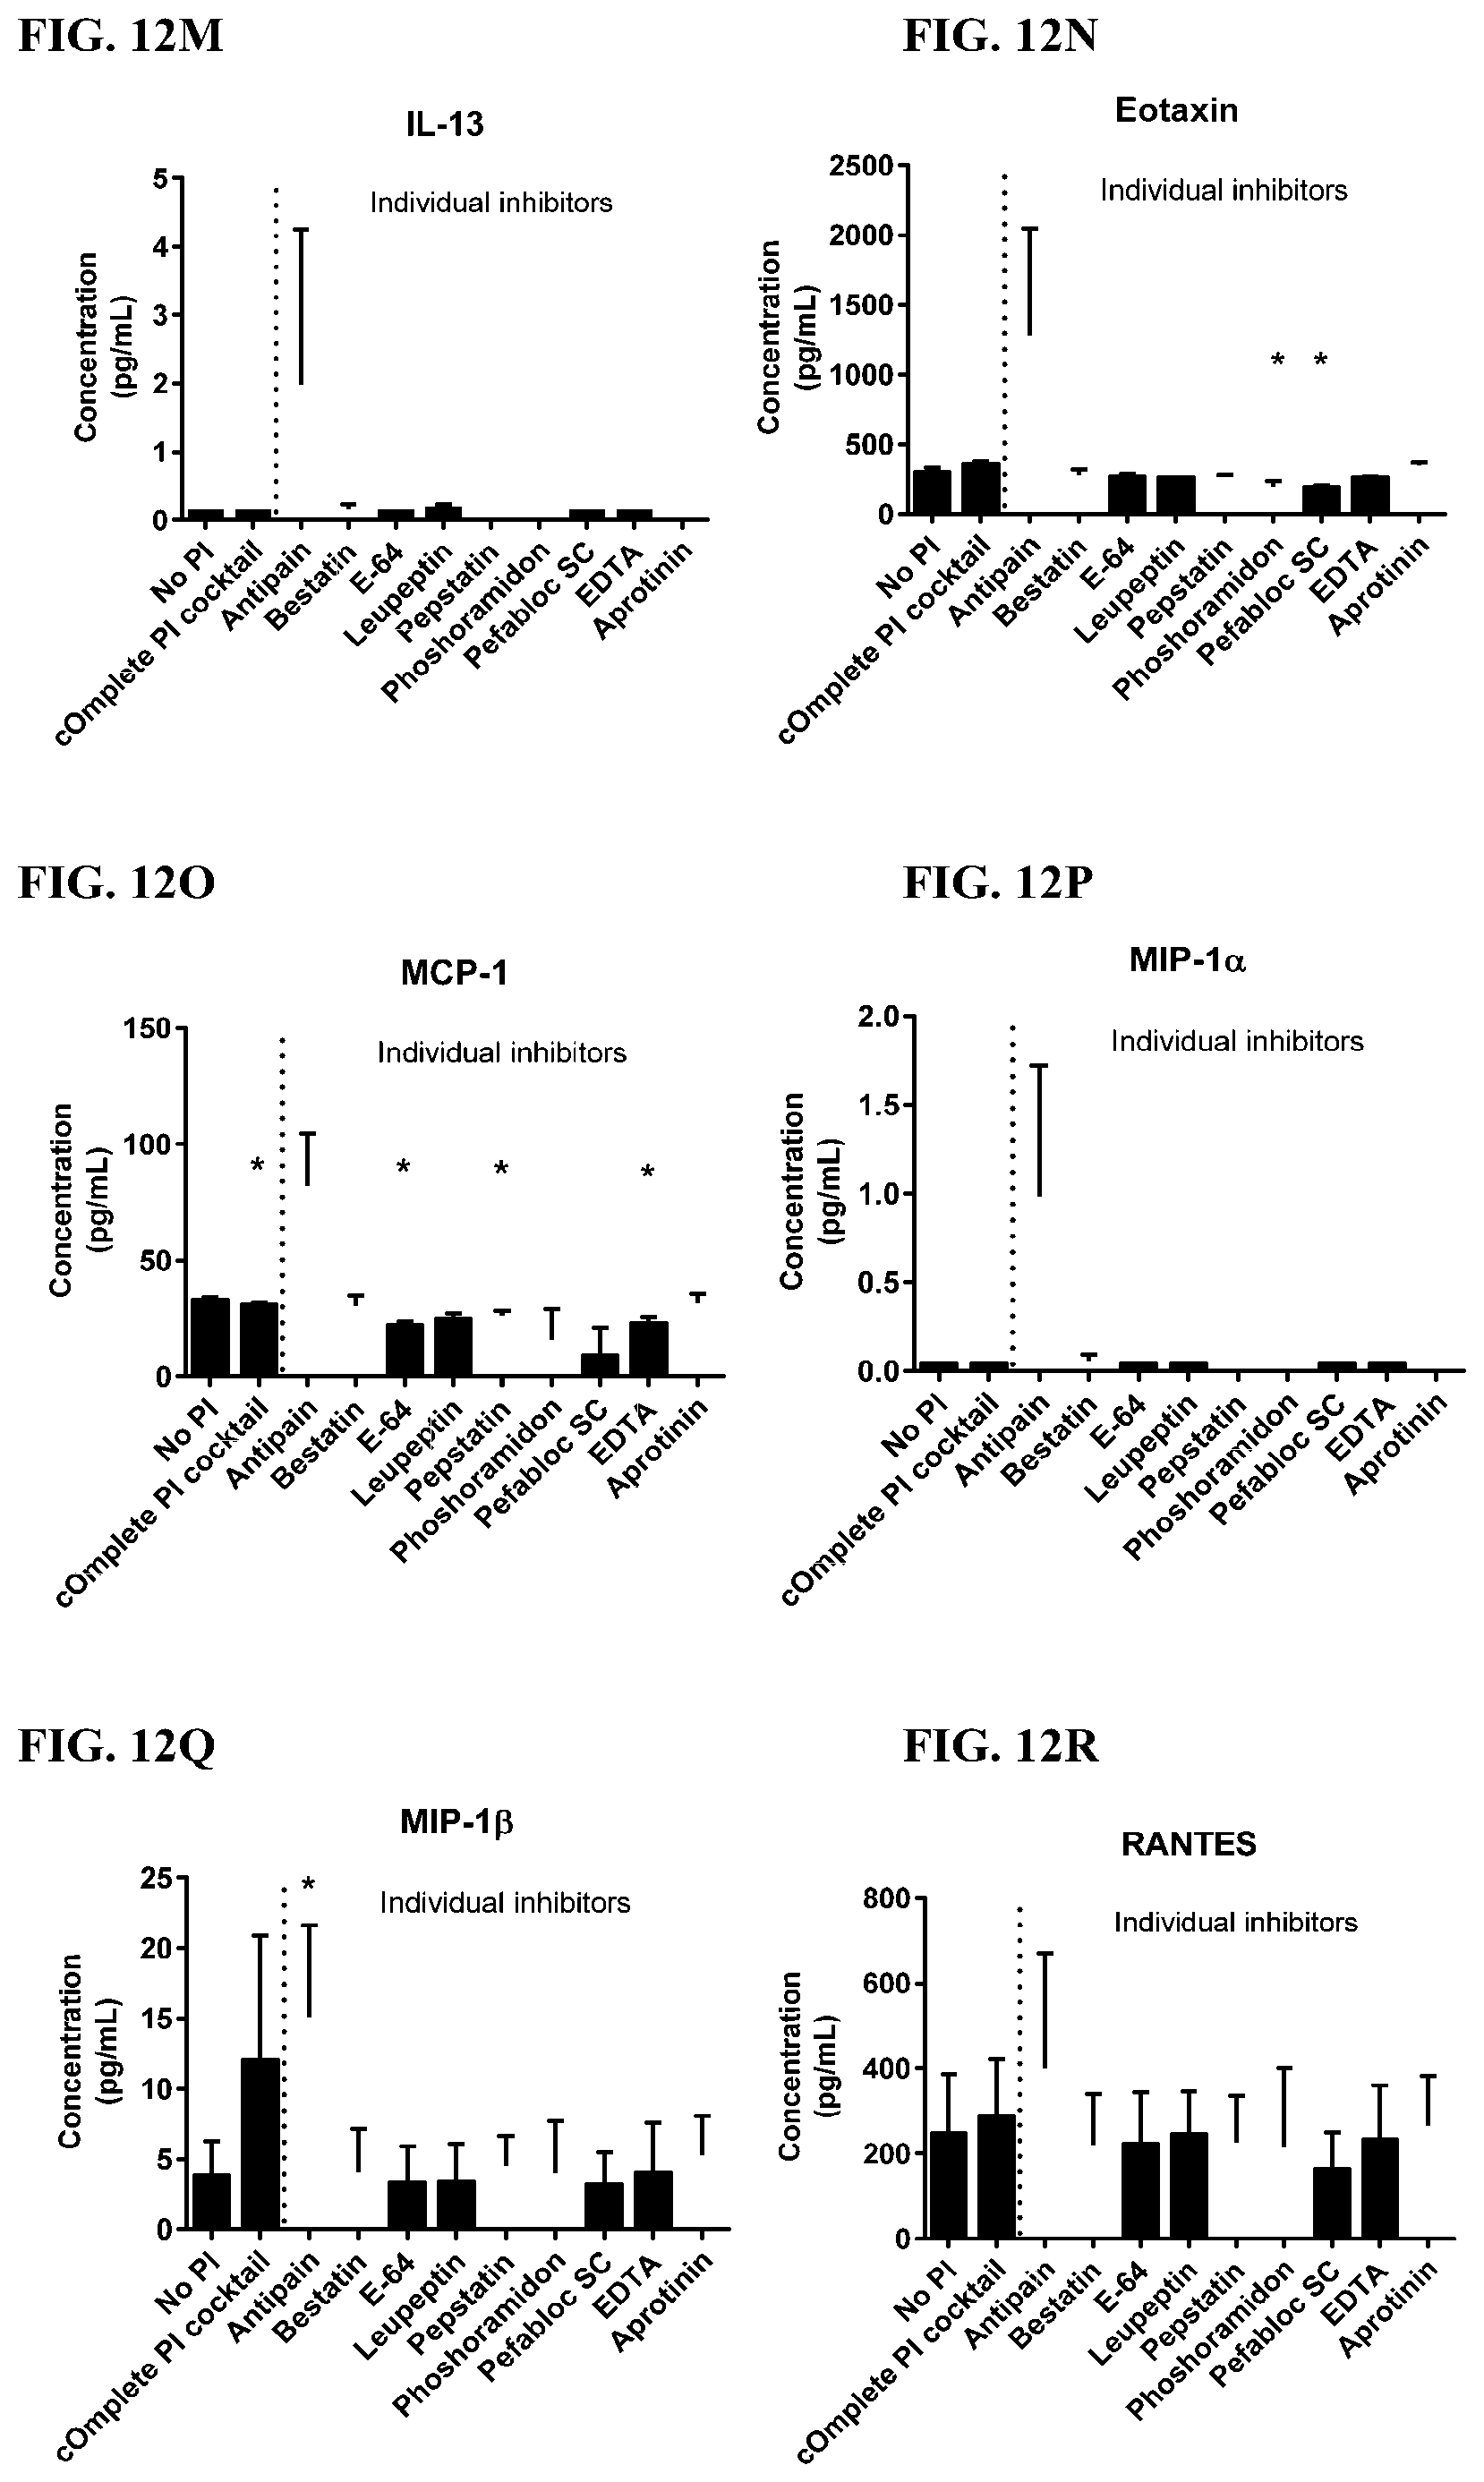
D00083
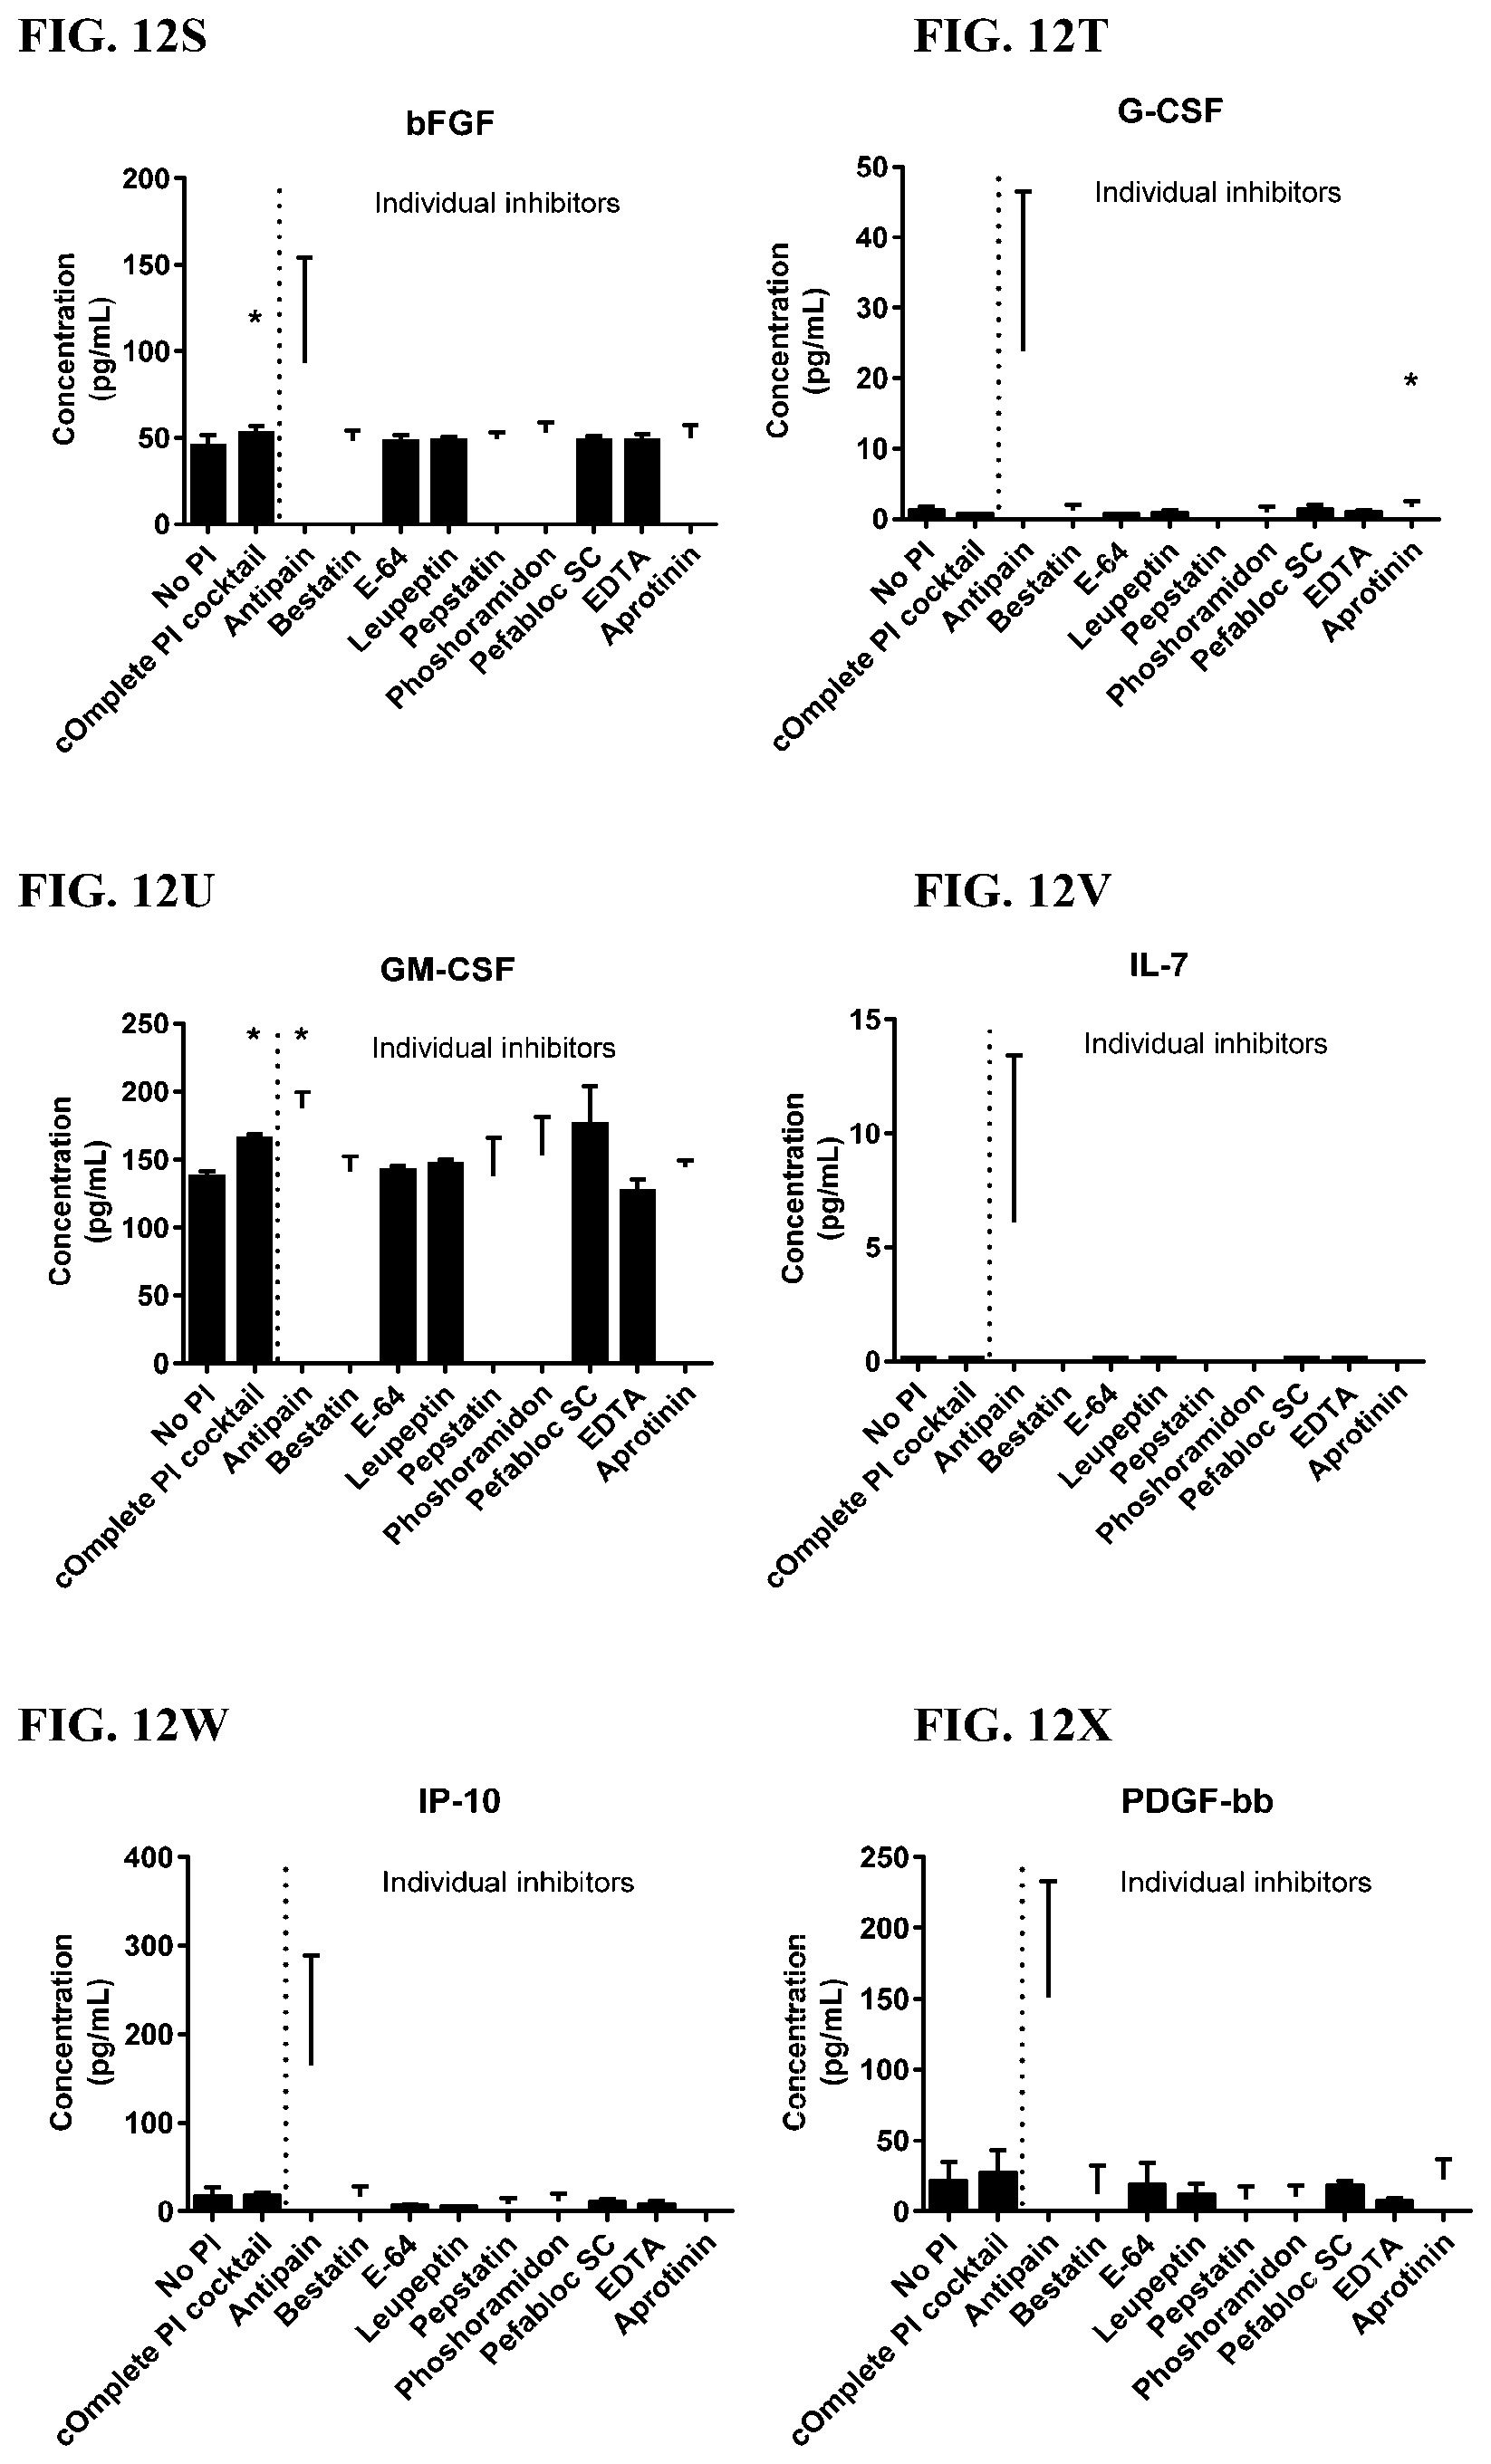
D00084

D00085
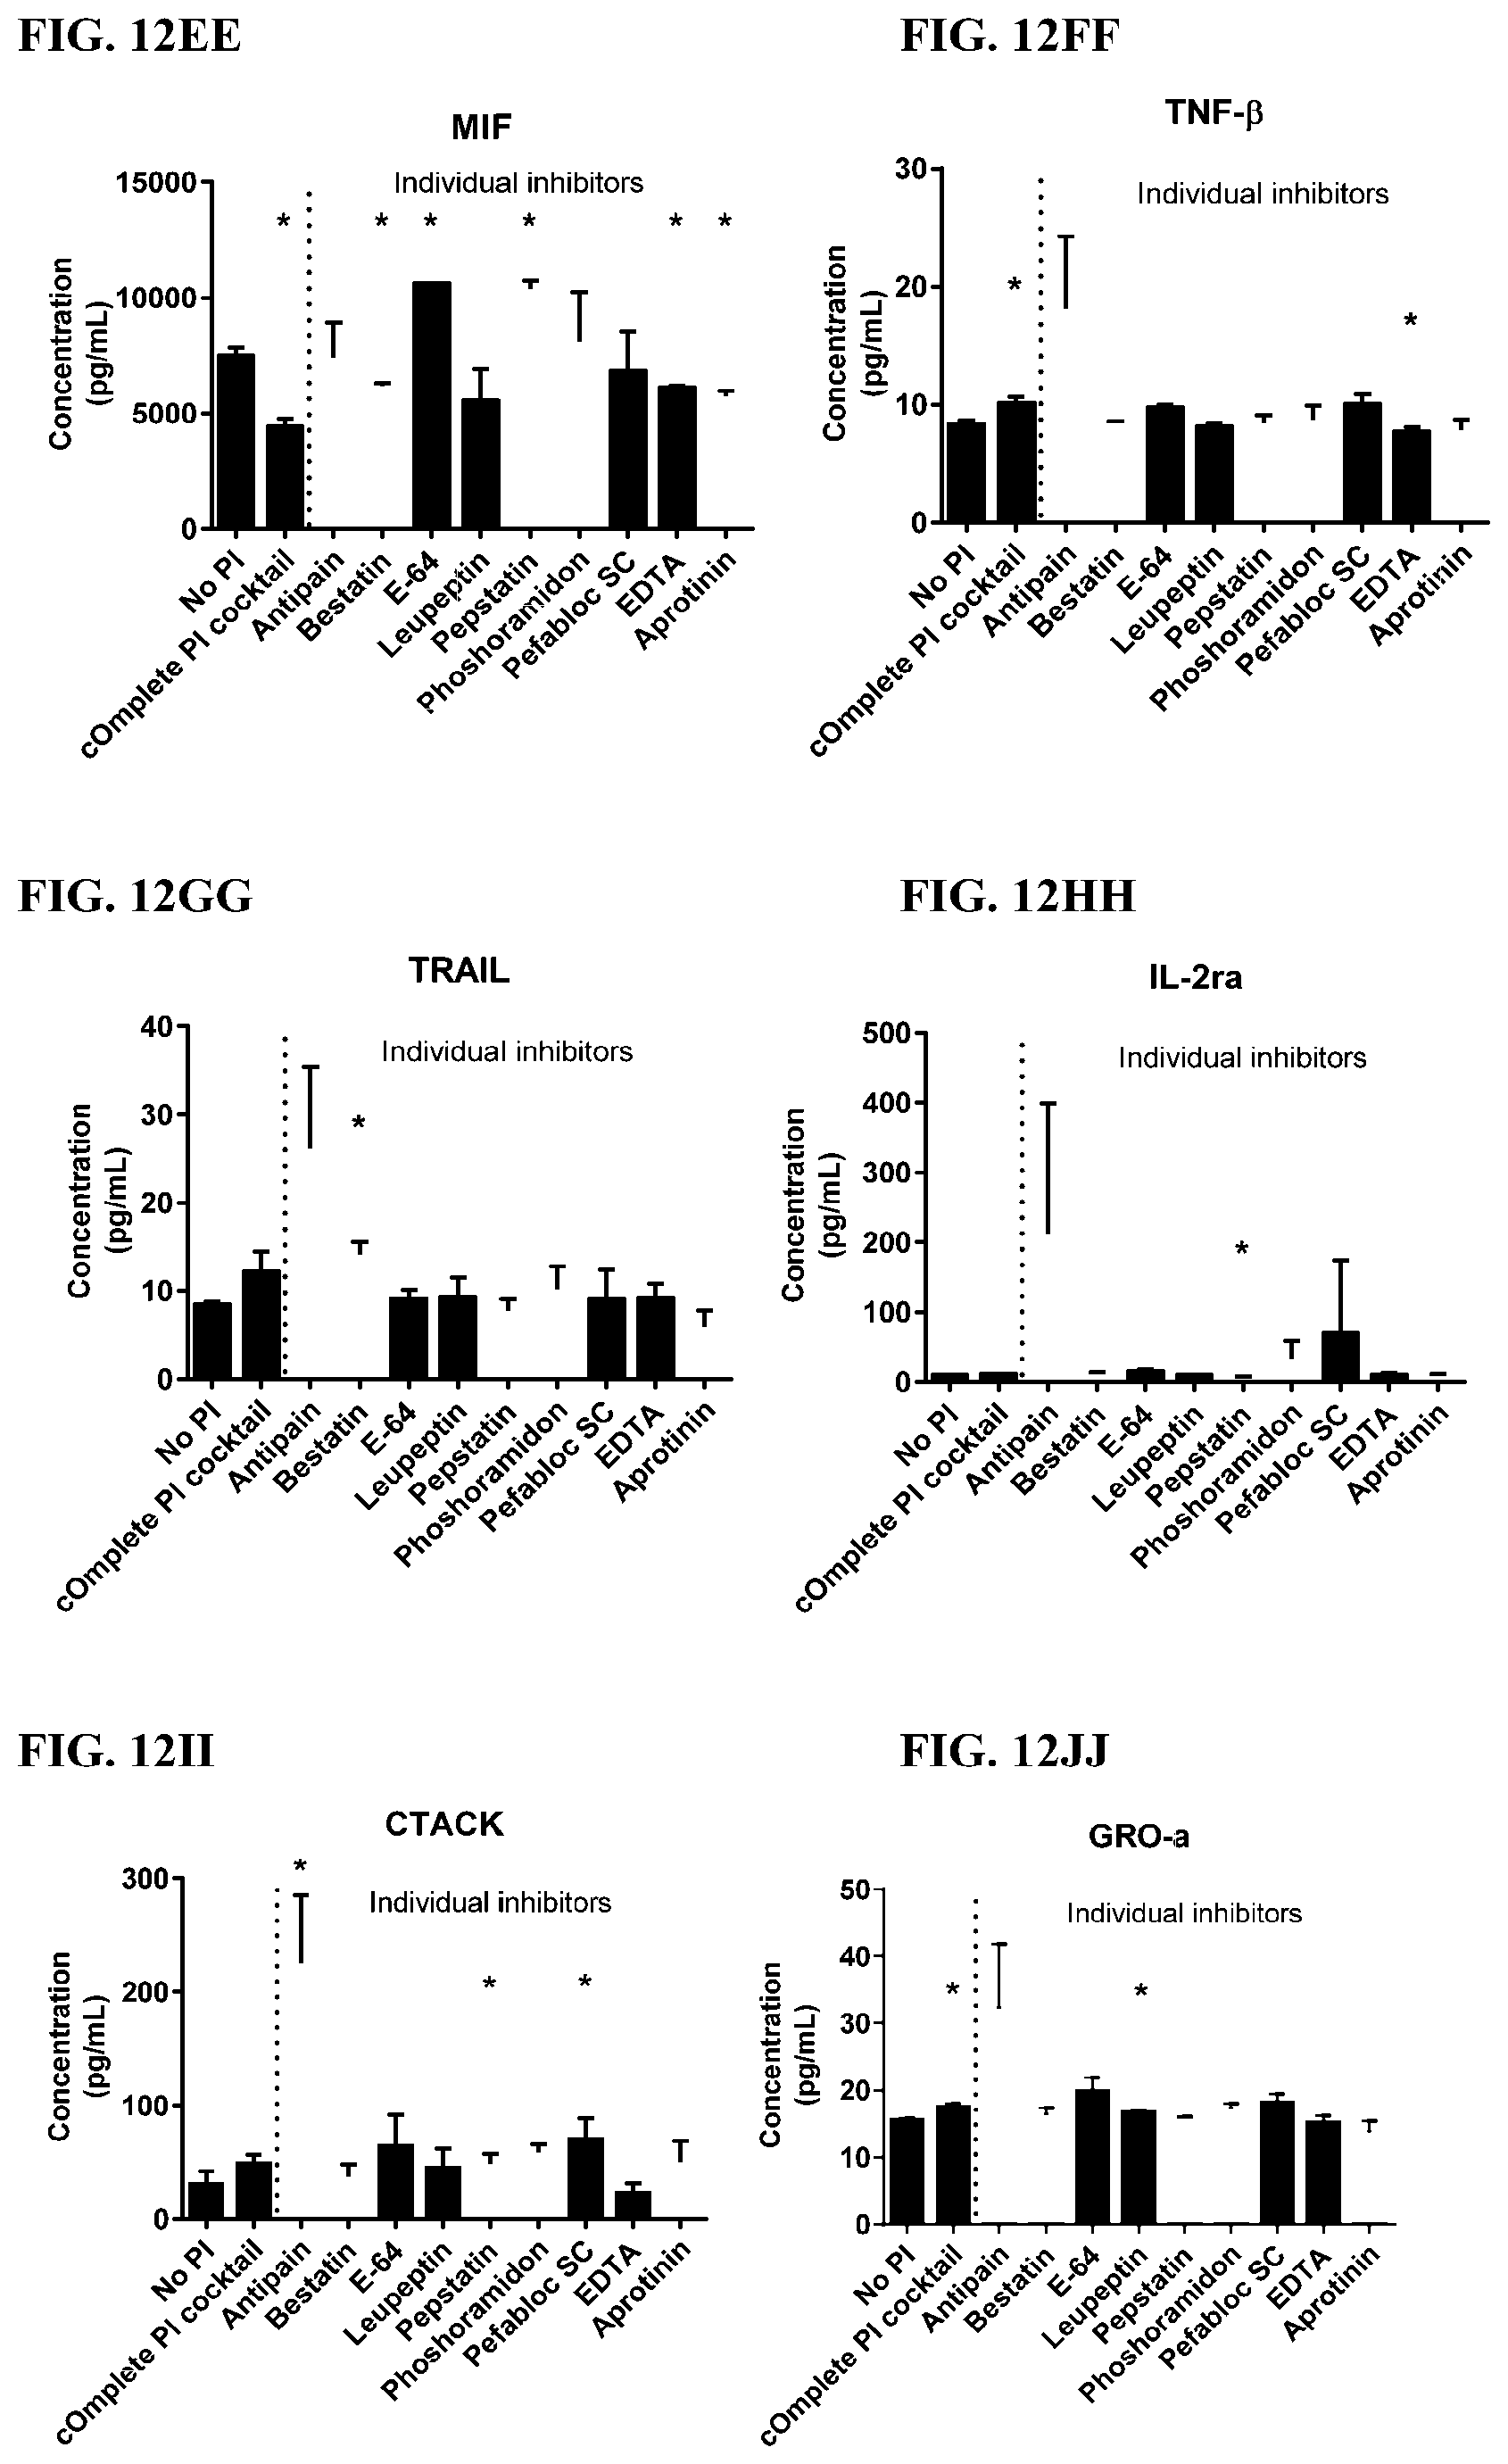
D00086

D00087
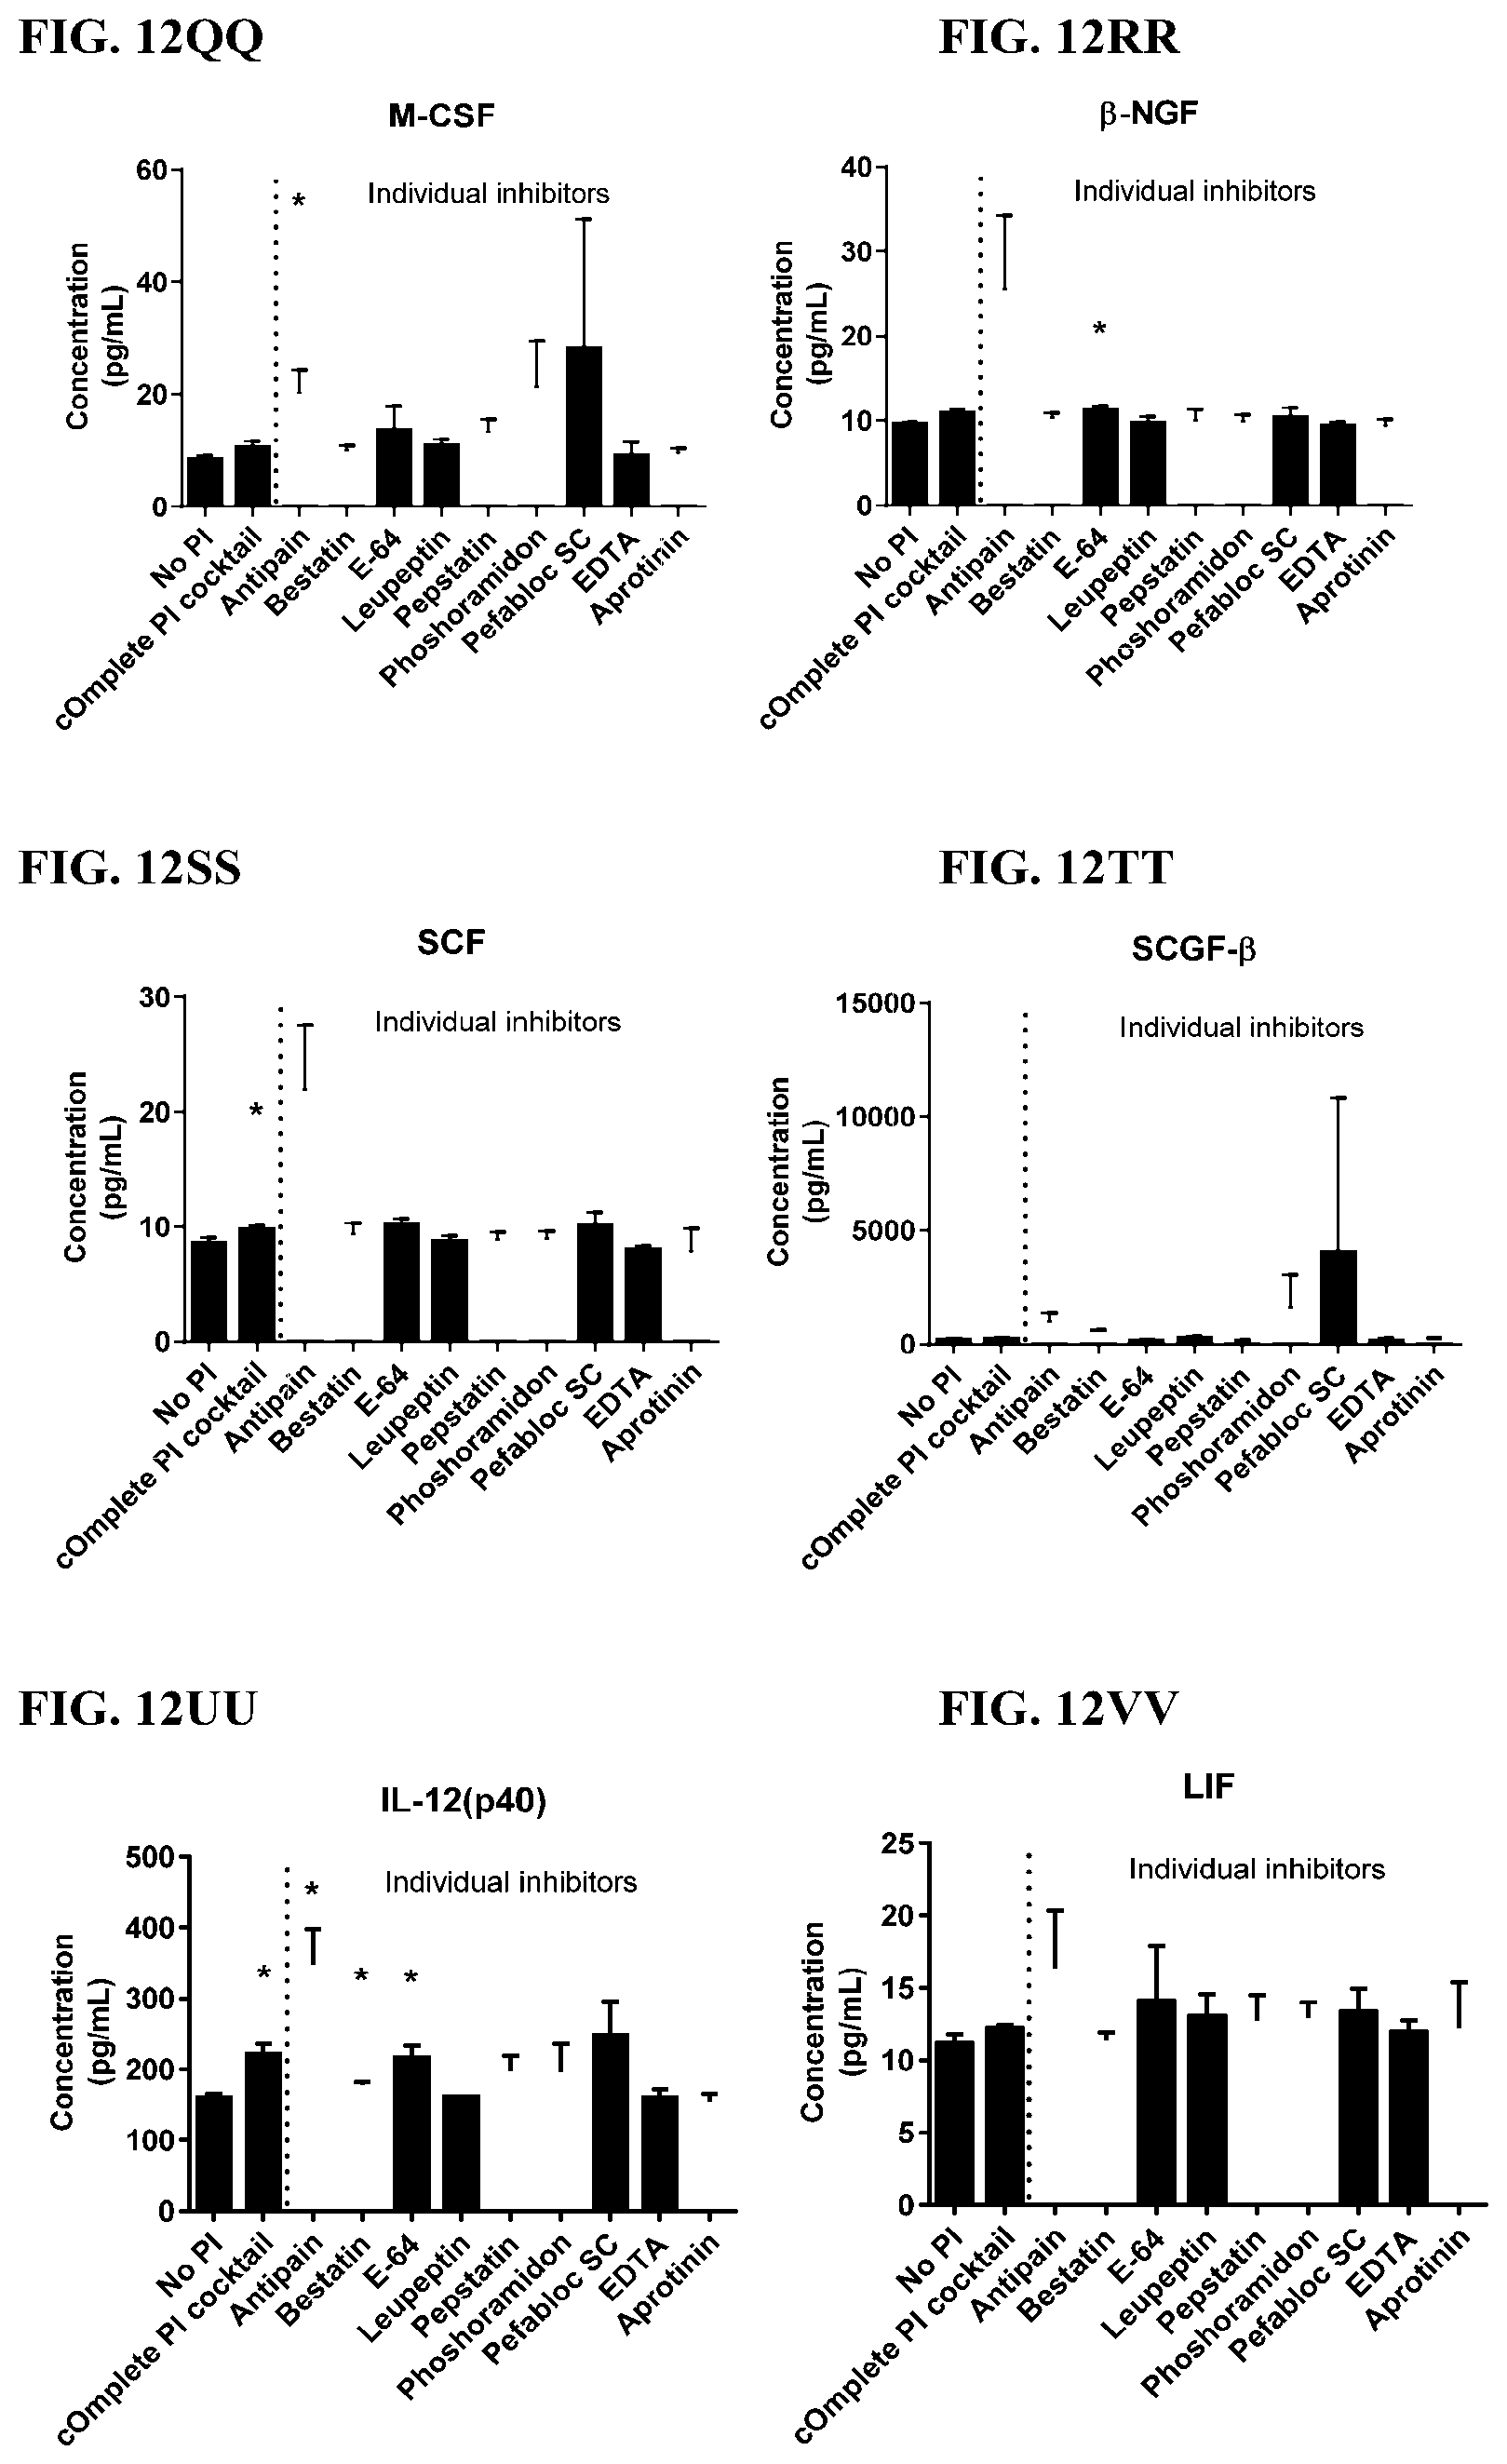
D00088

D00089

D00090

D00091

D00092

D00093
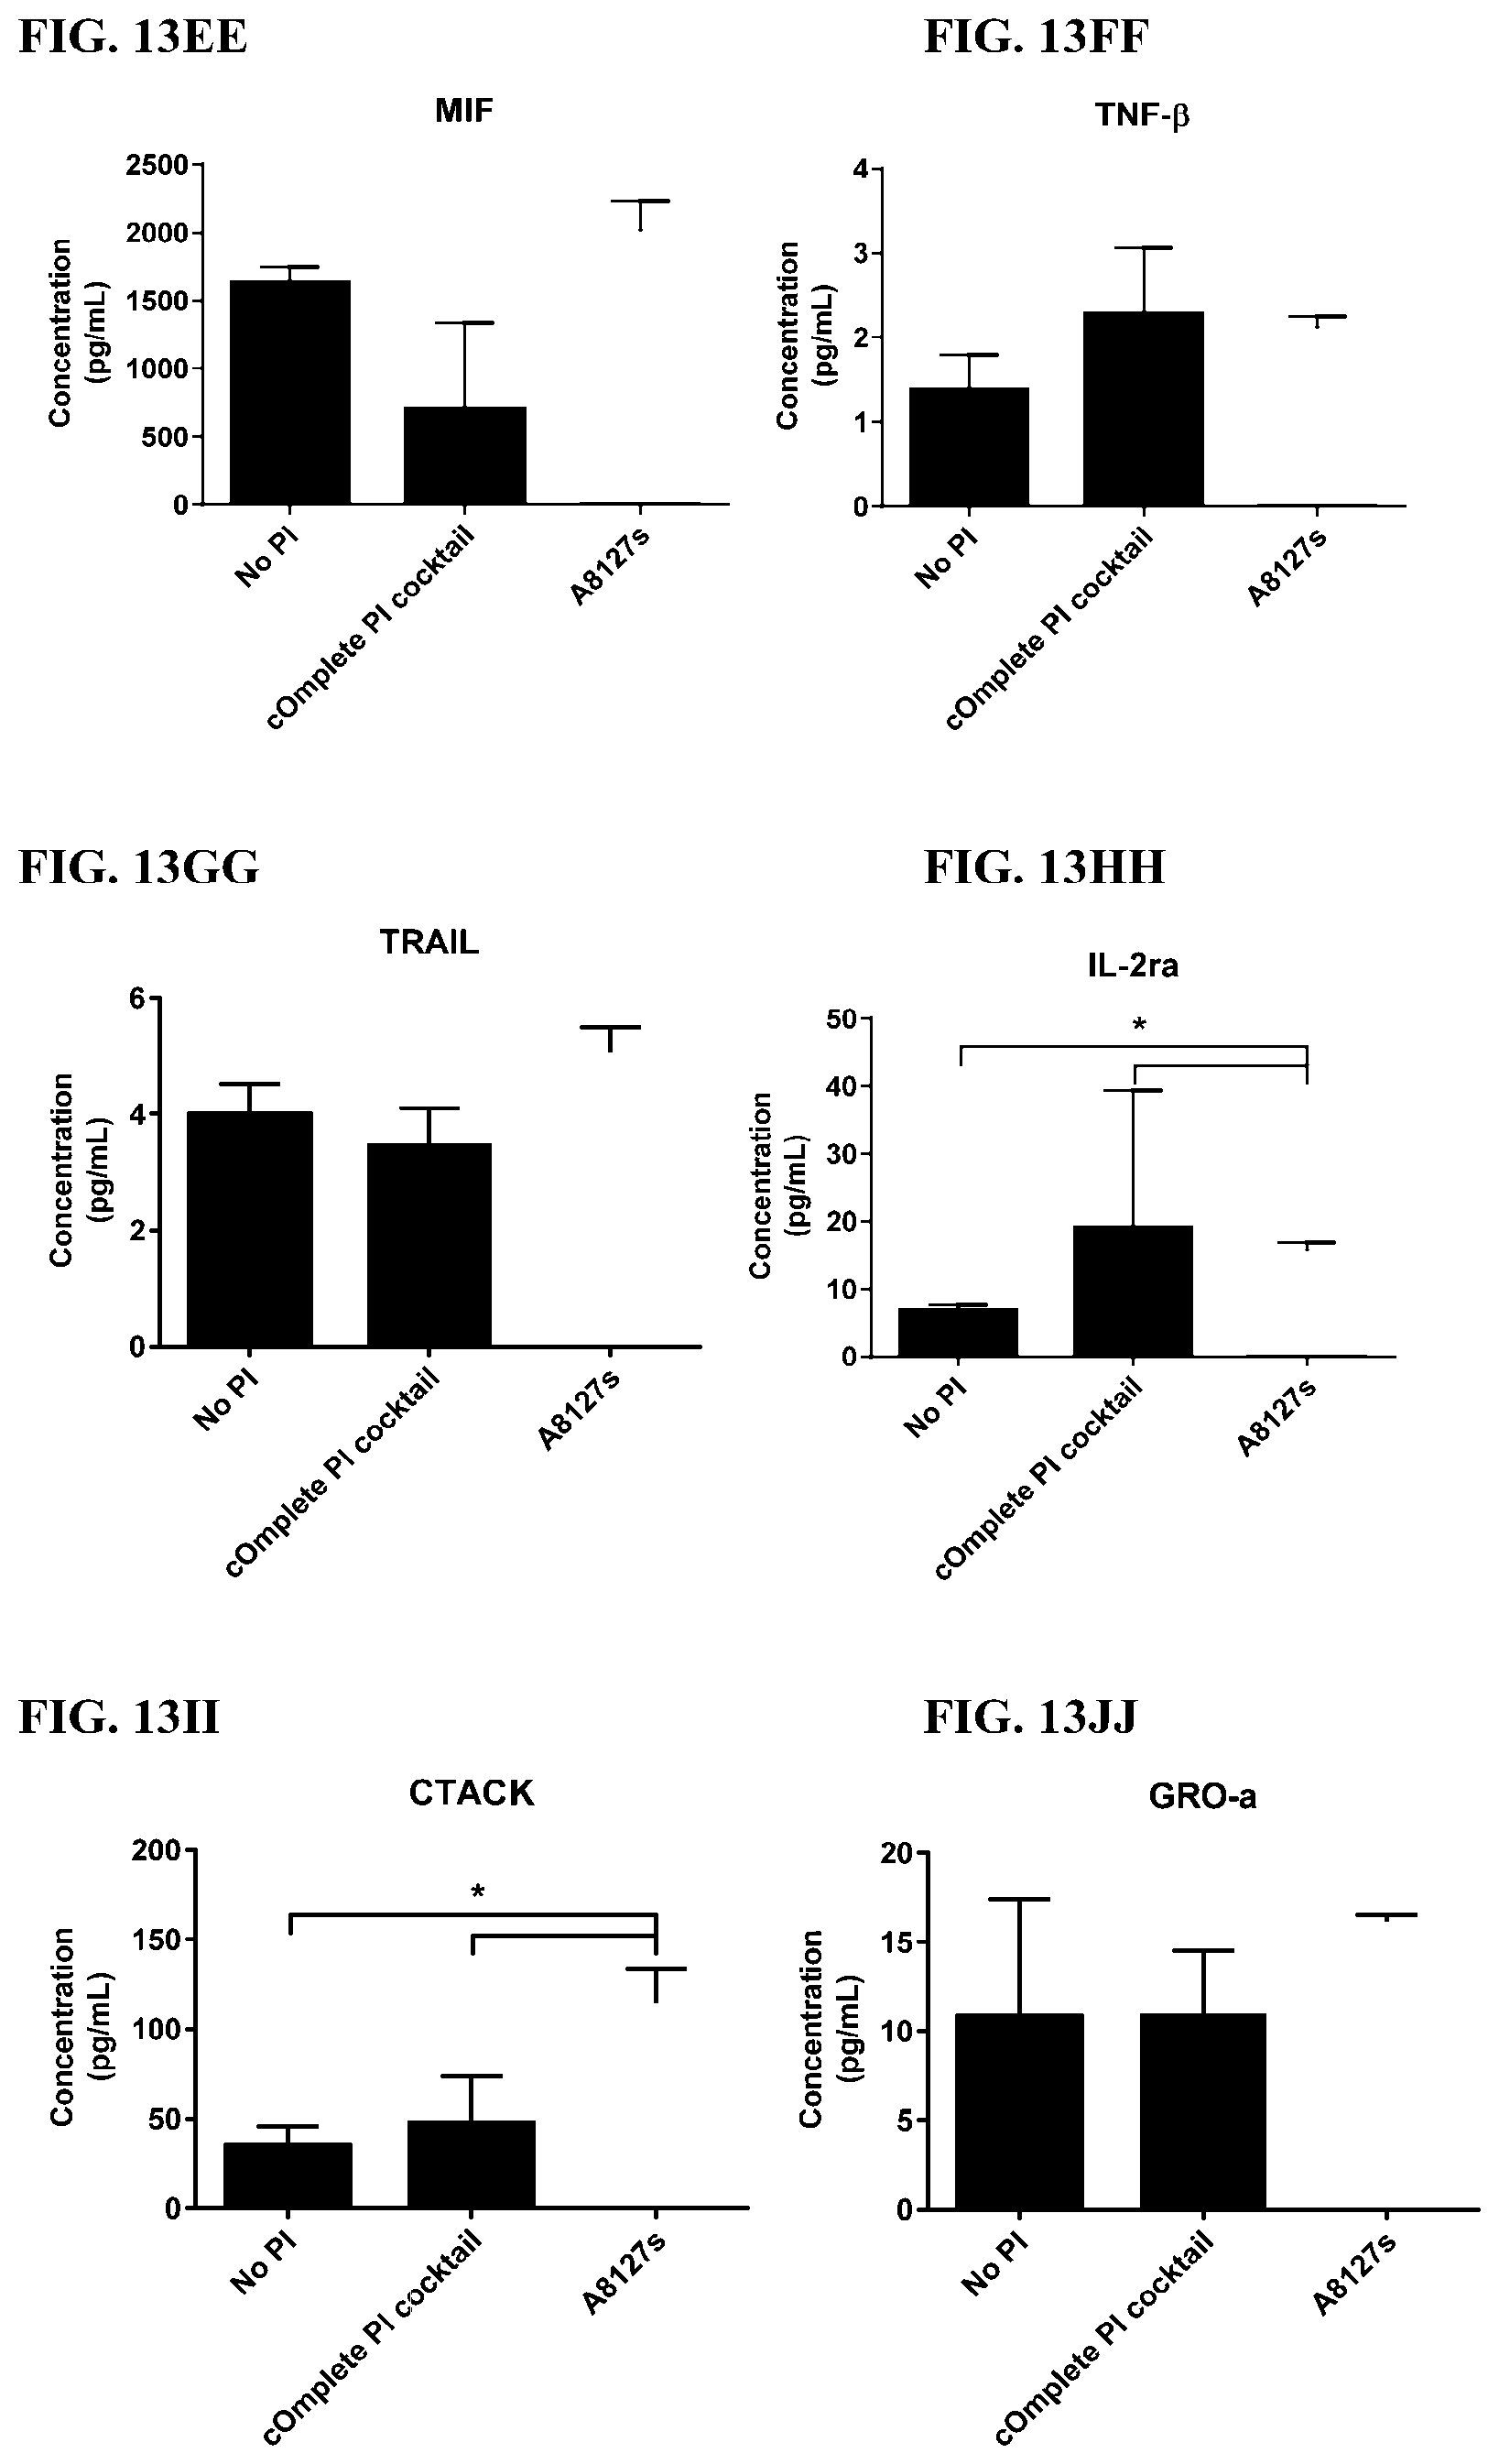
D00094

D00095

D00096

D00097
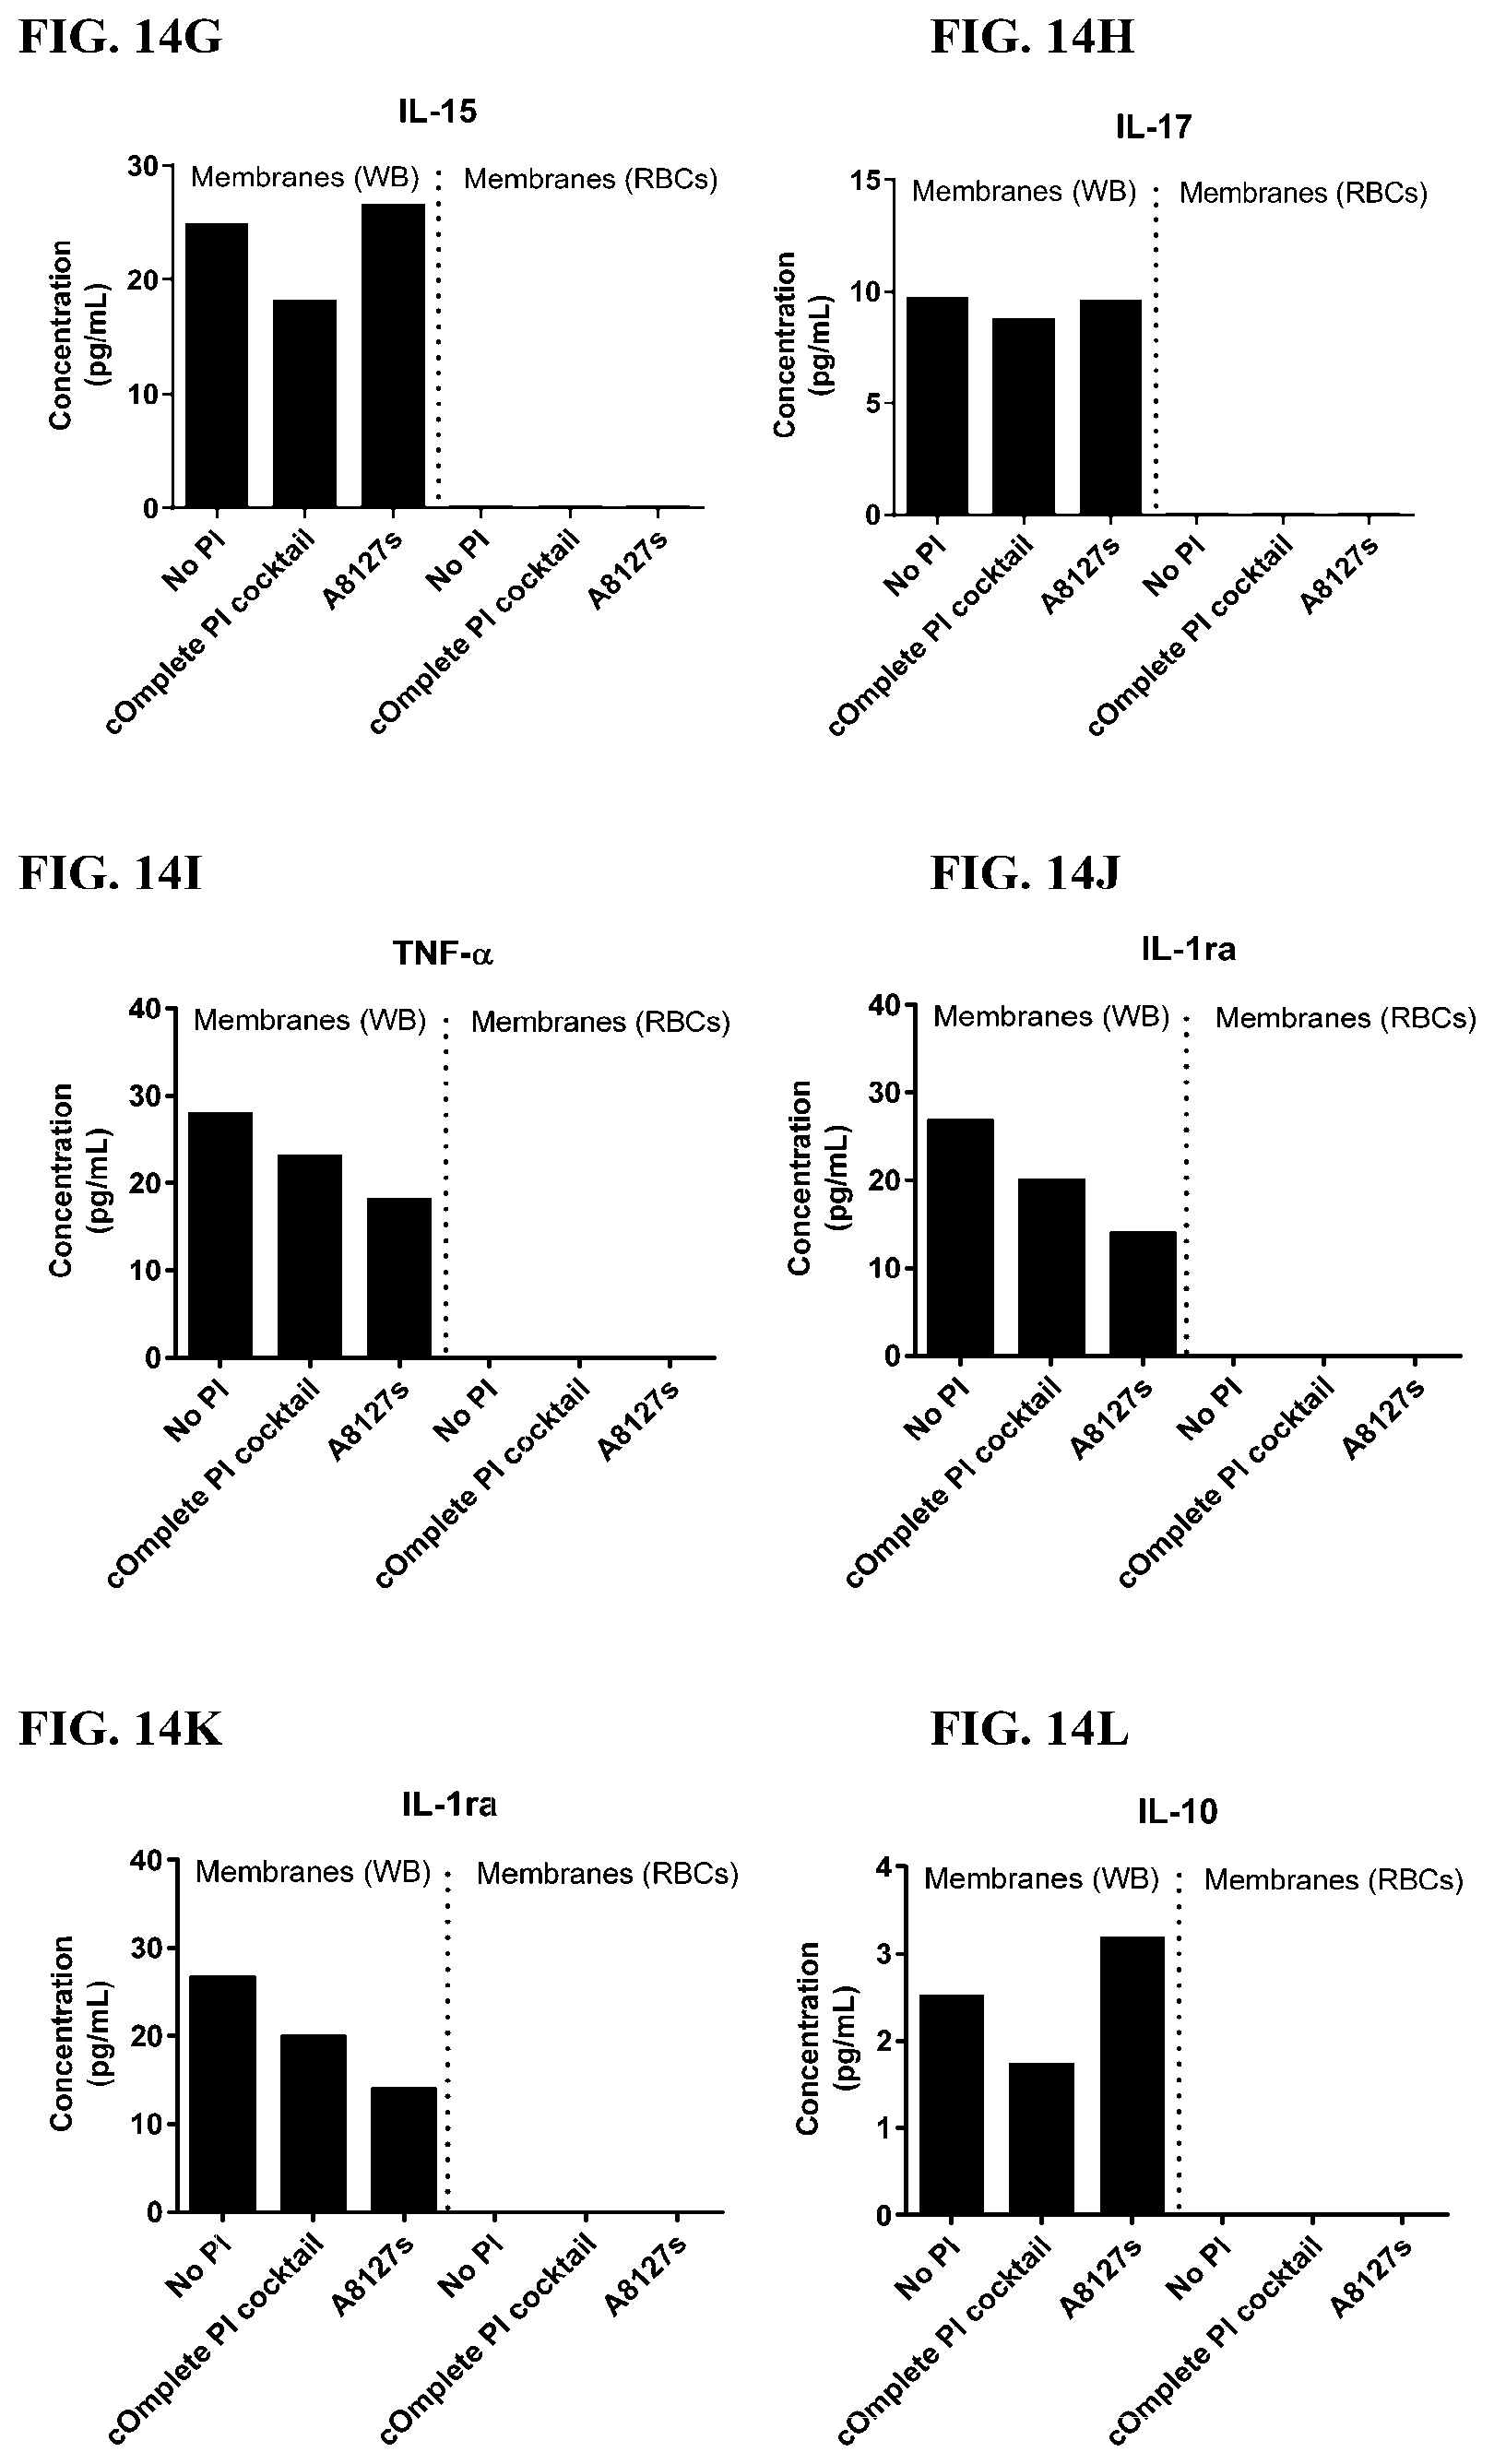
D00098

D00099
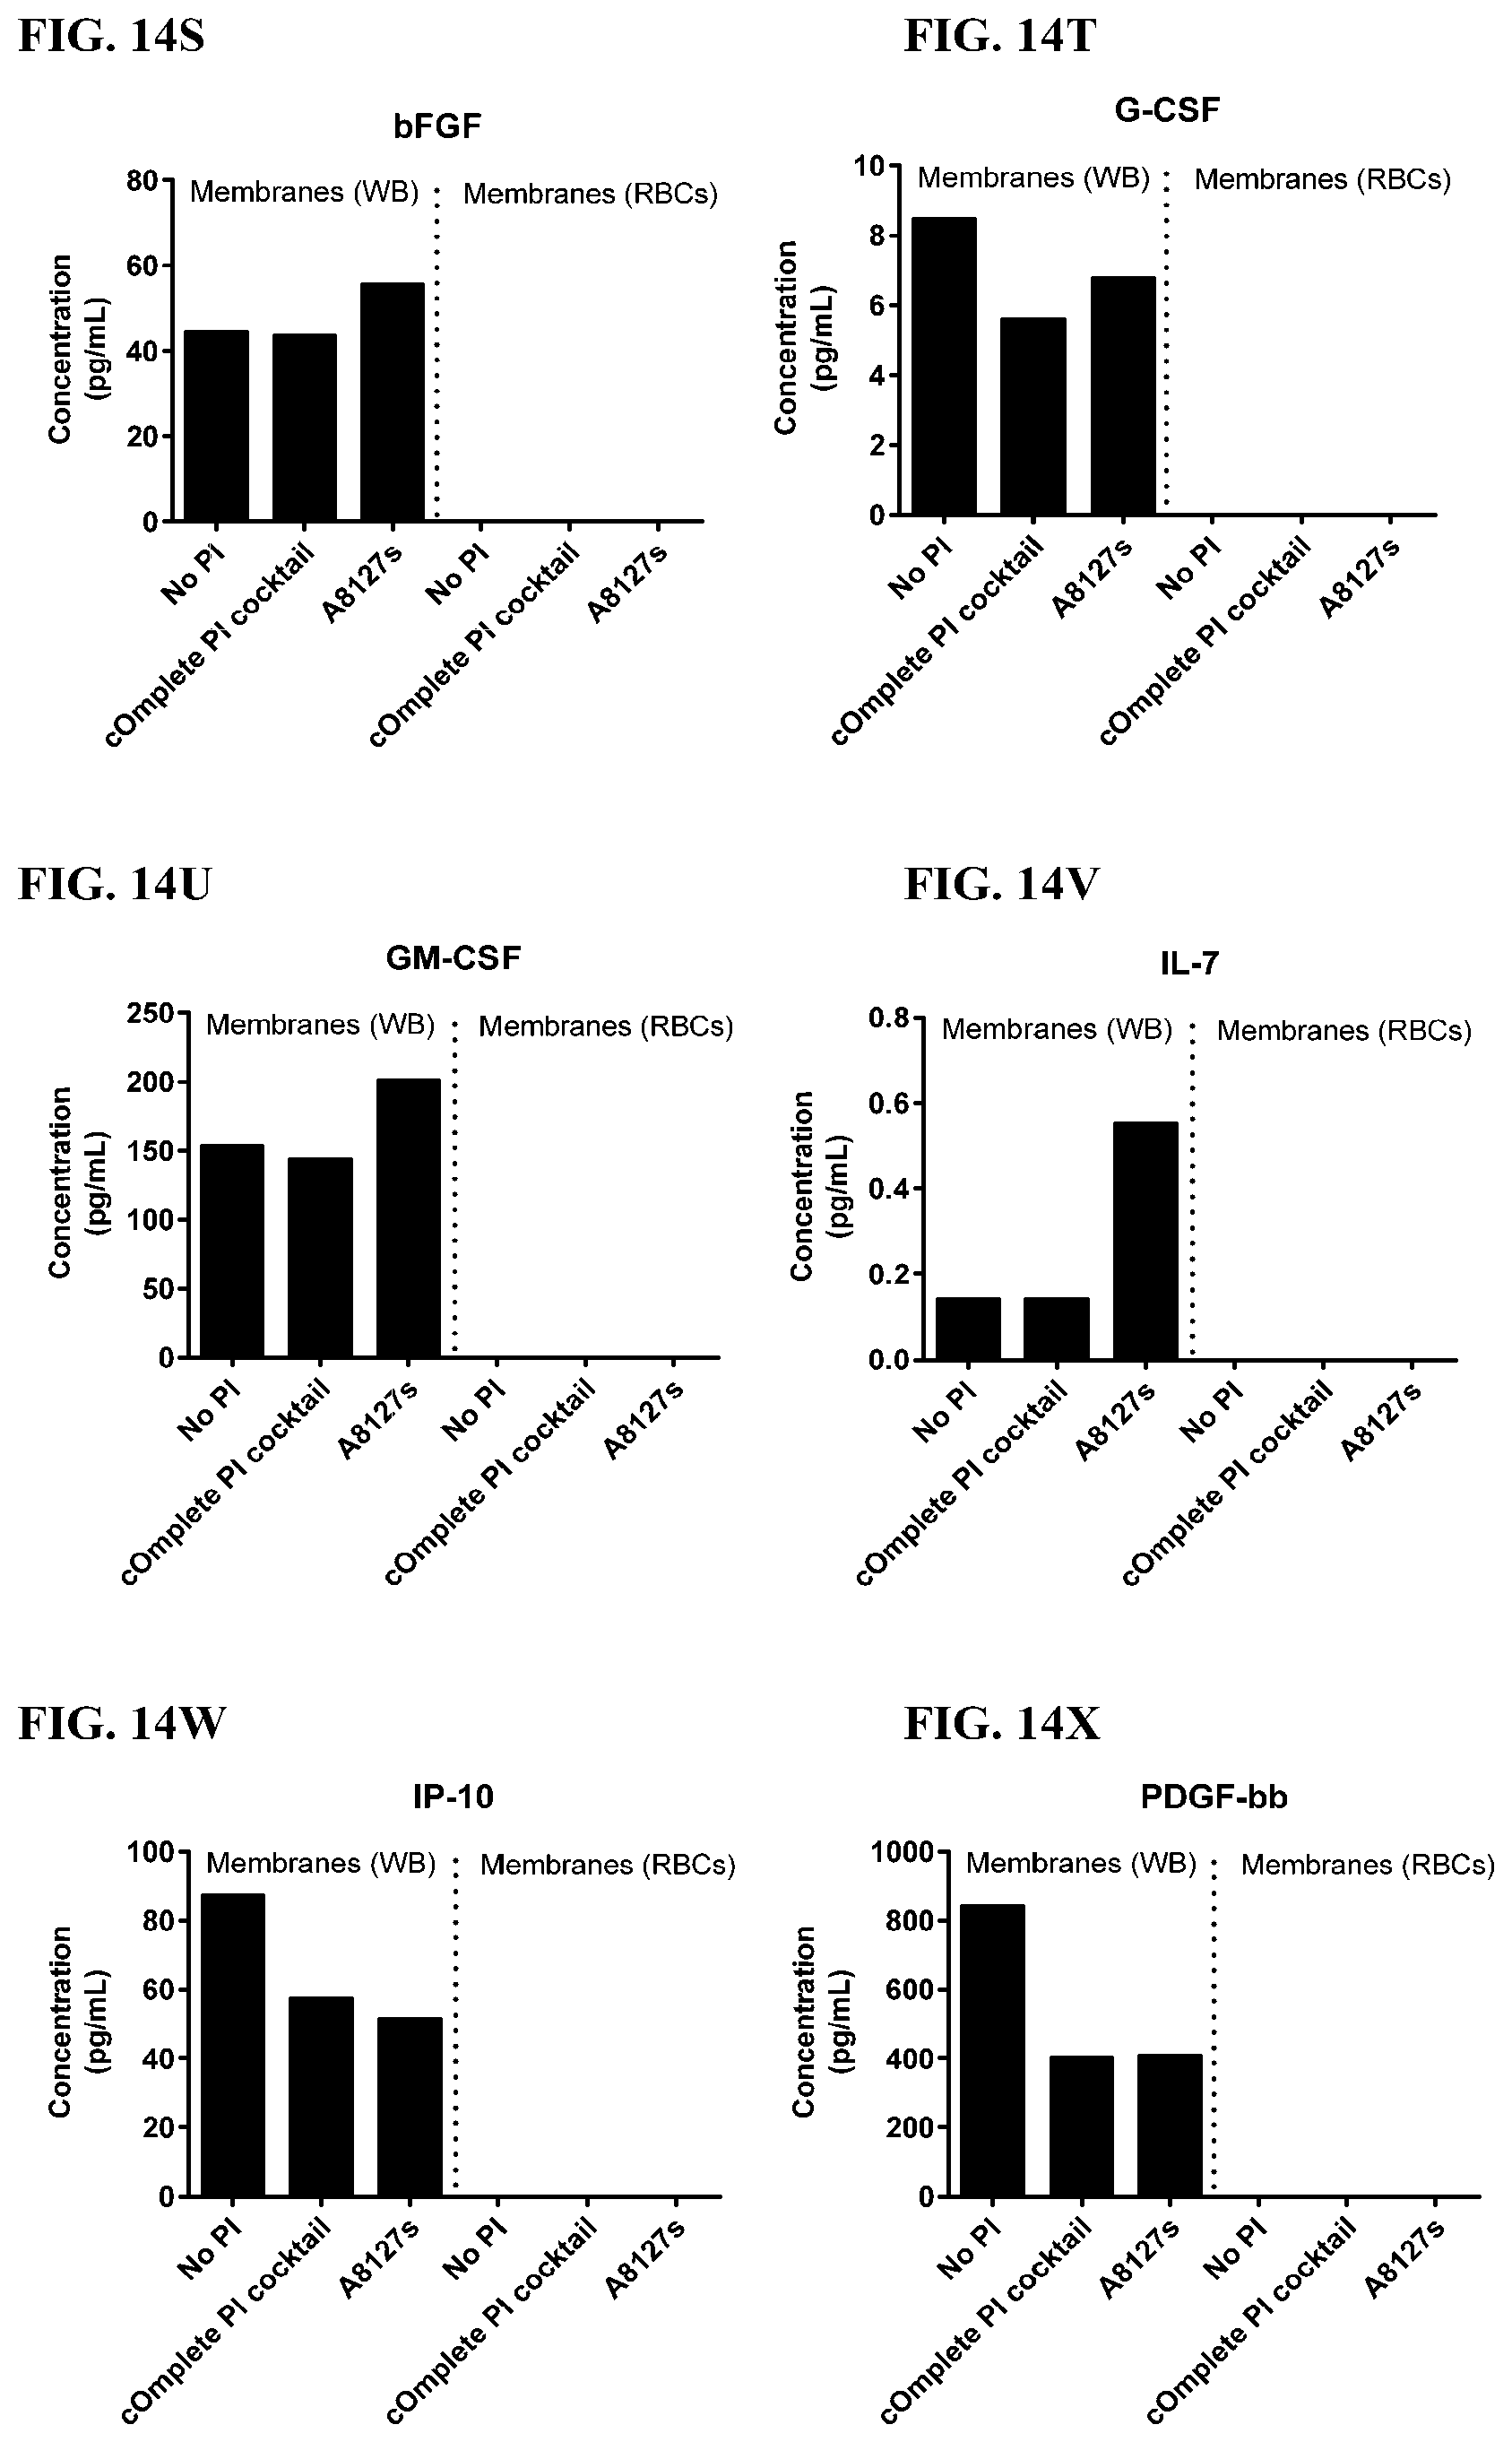
D00100
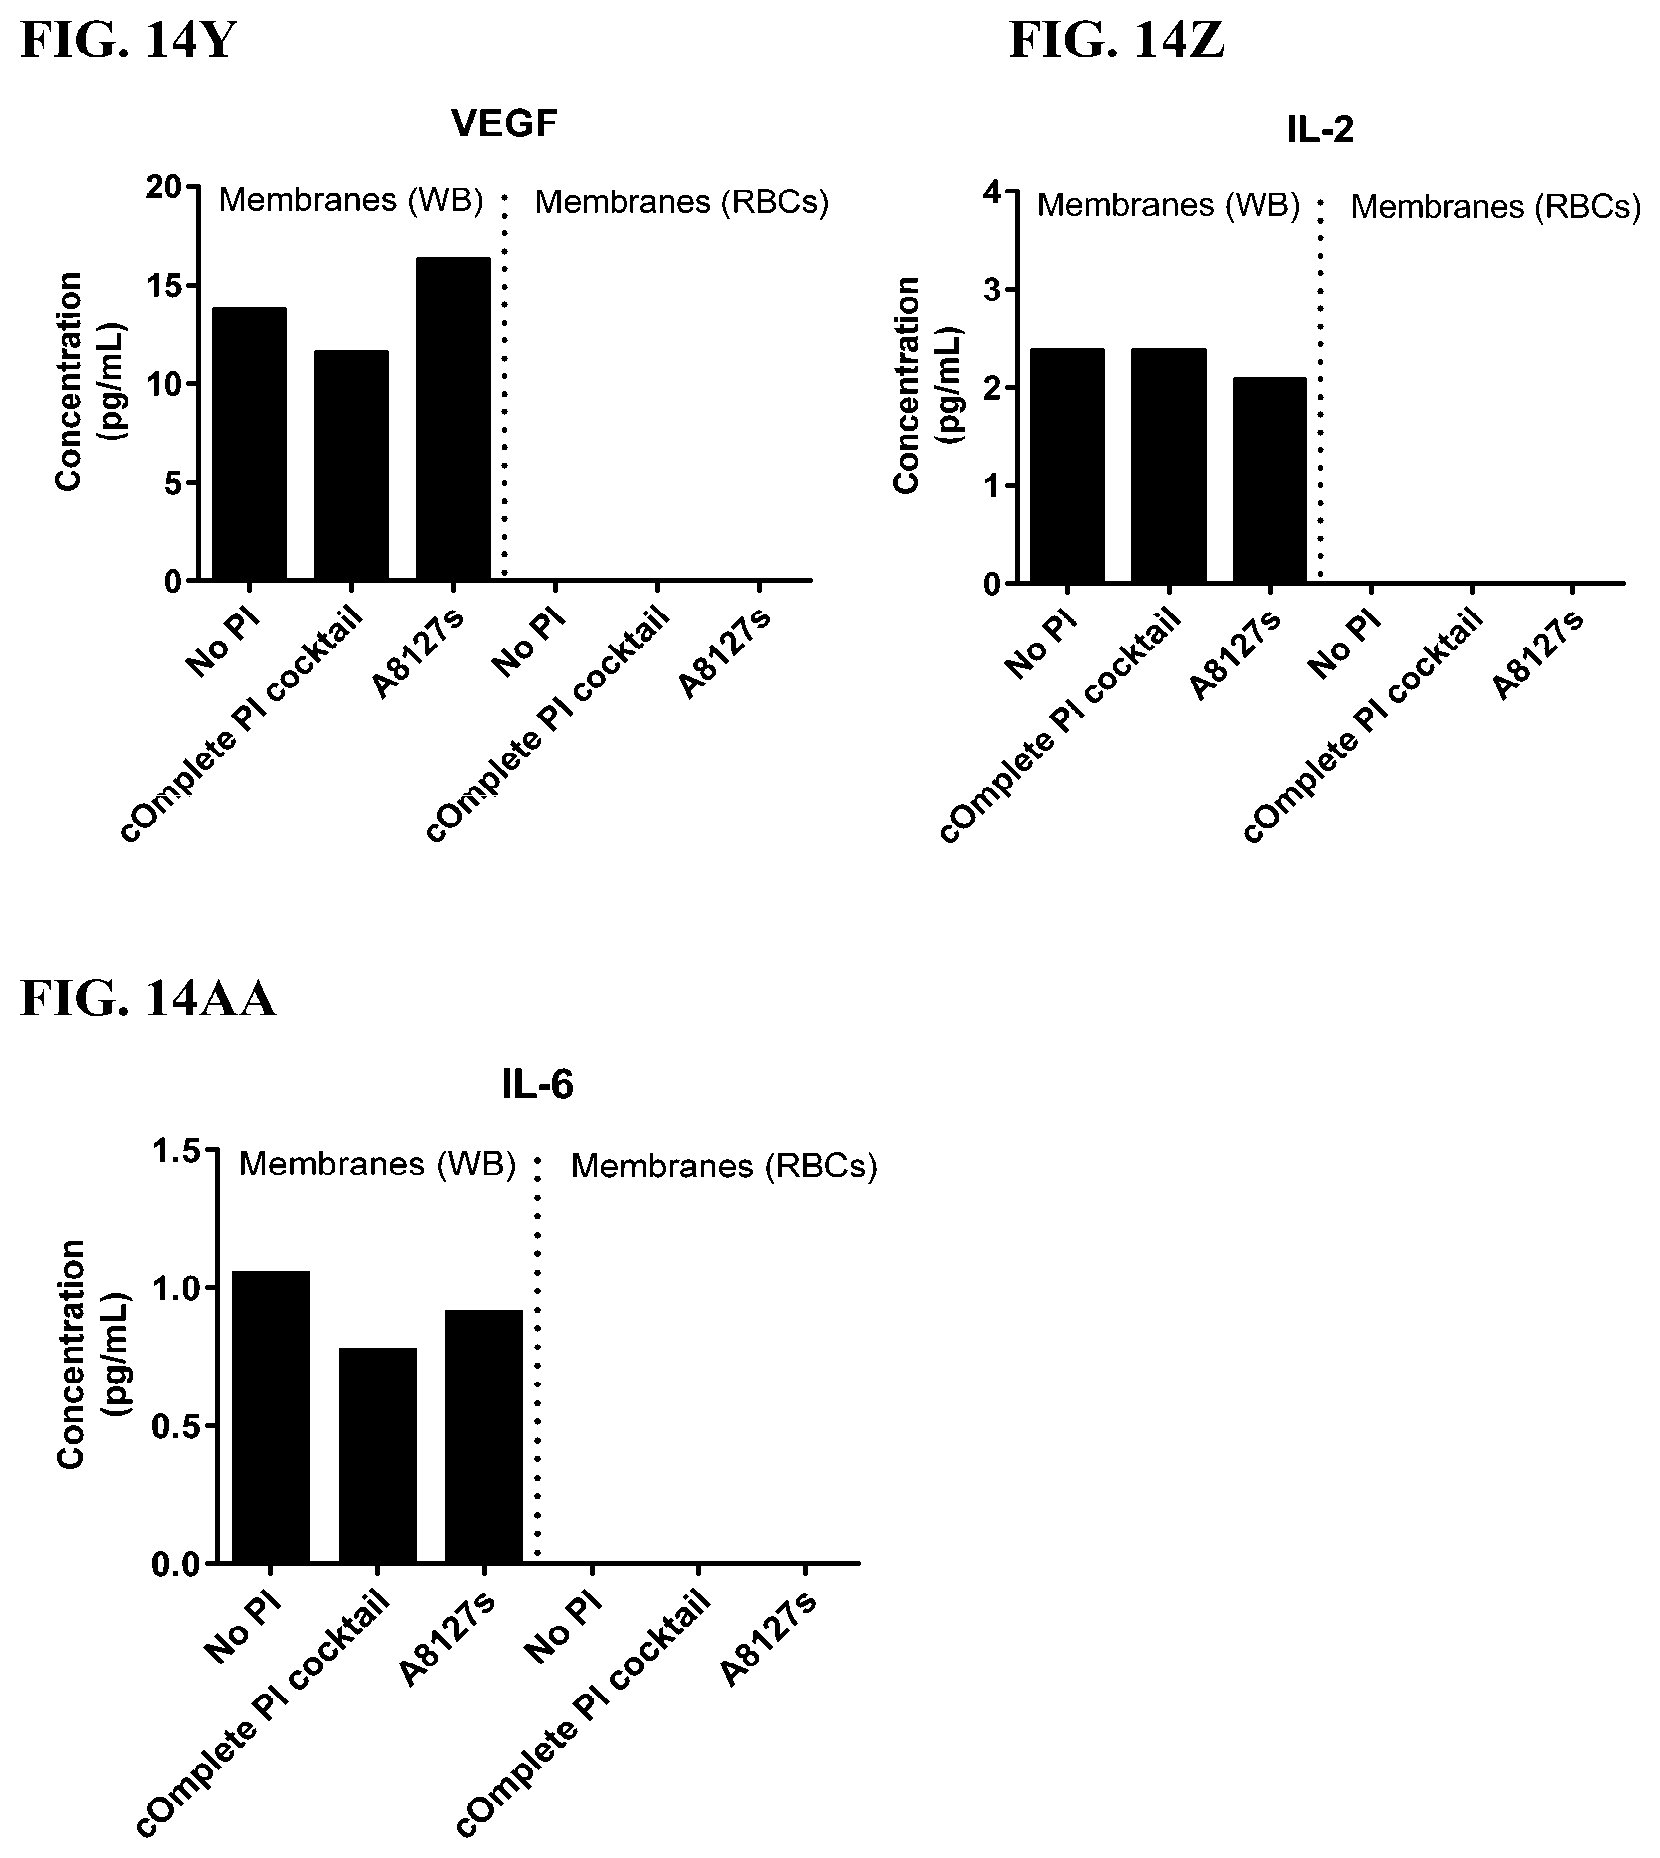
D00101

D00102

D00103

D00104

D00105
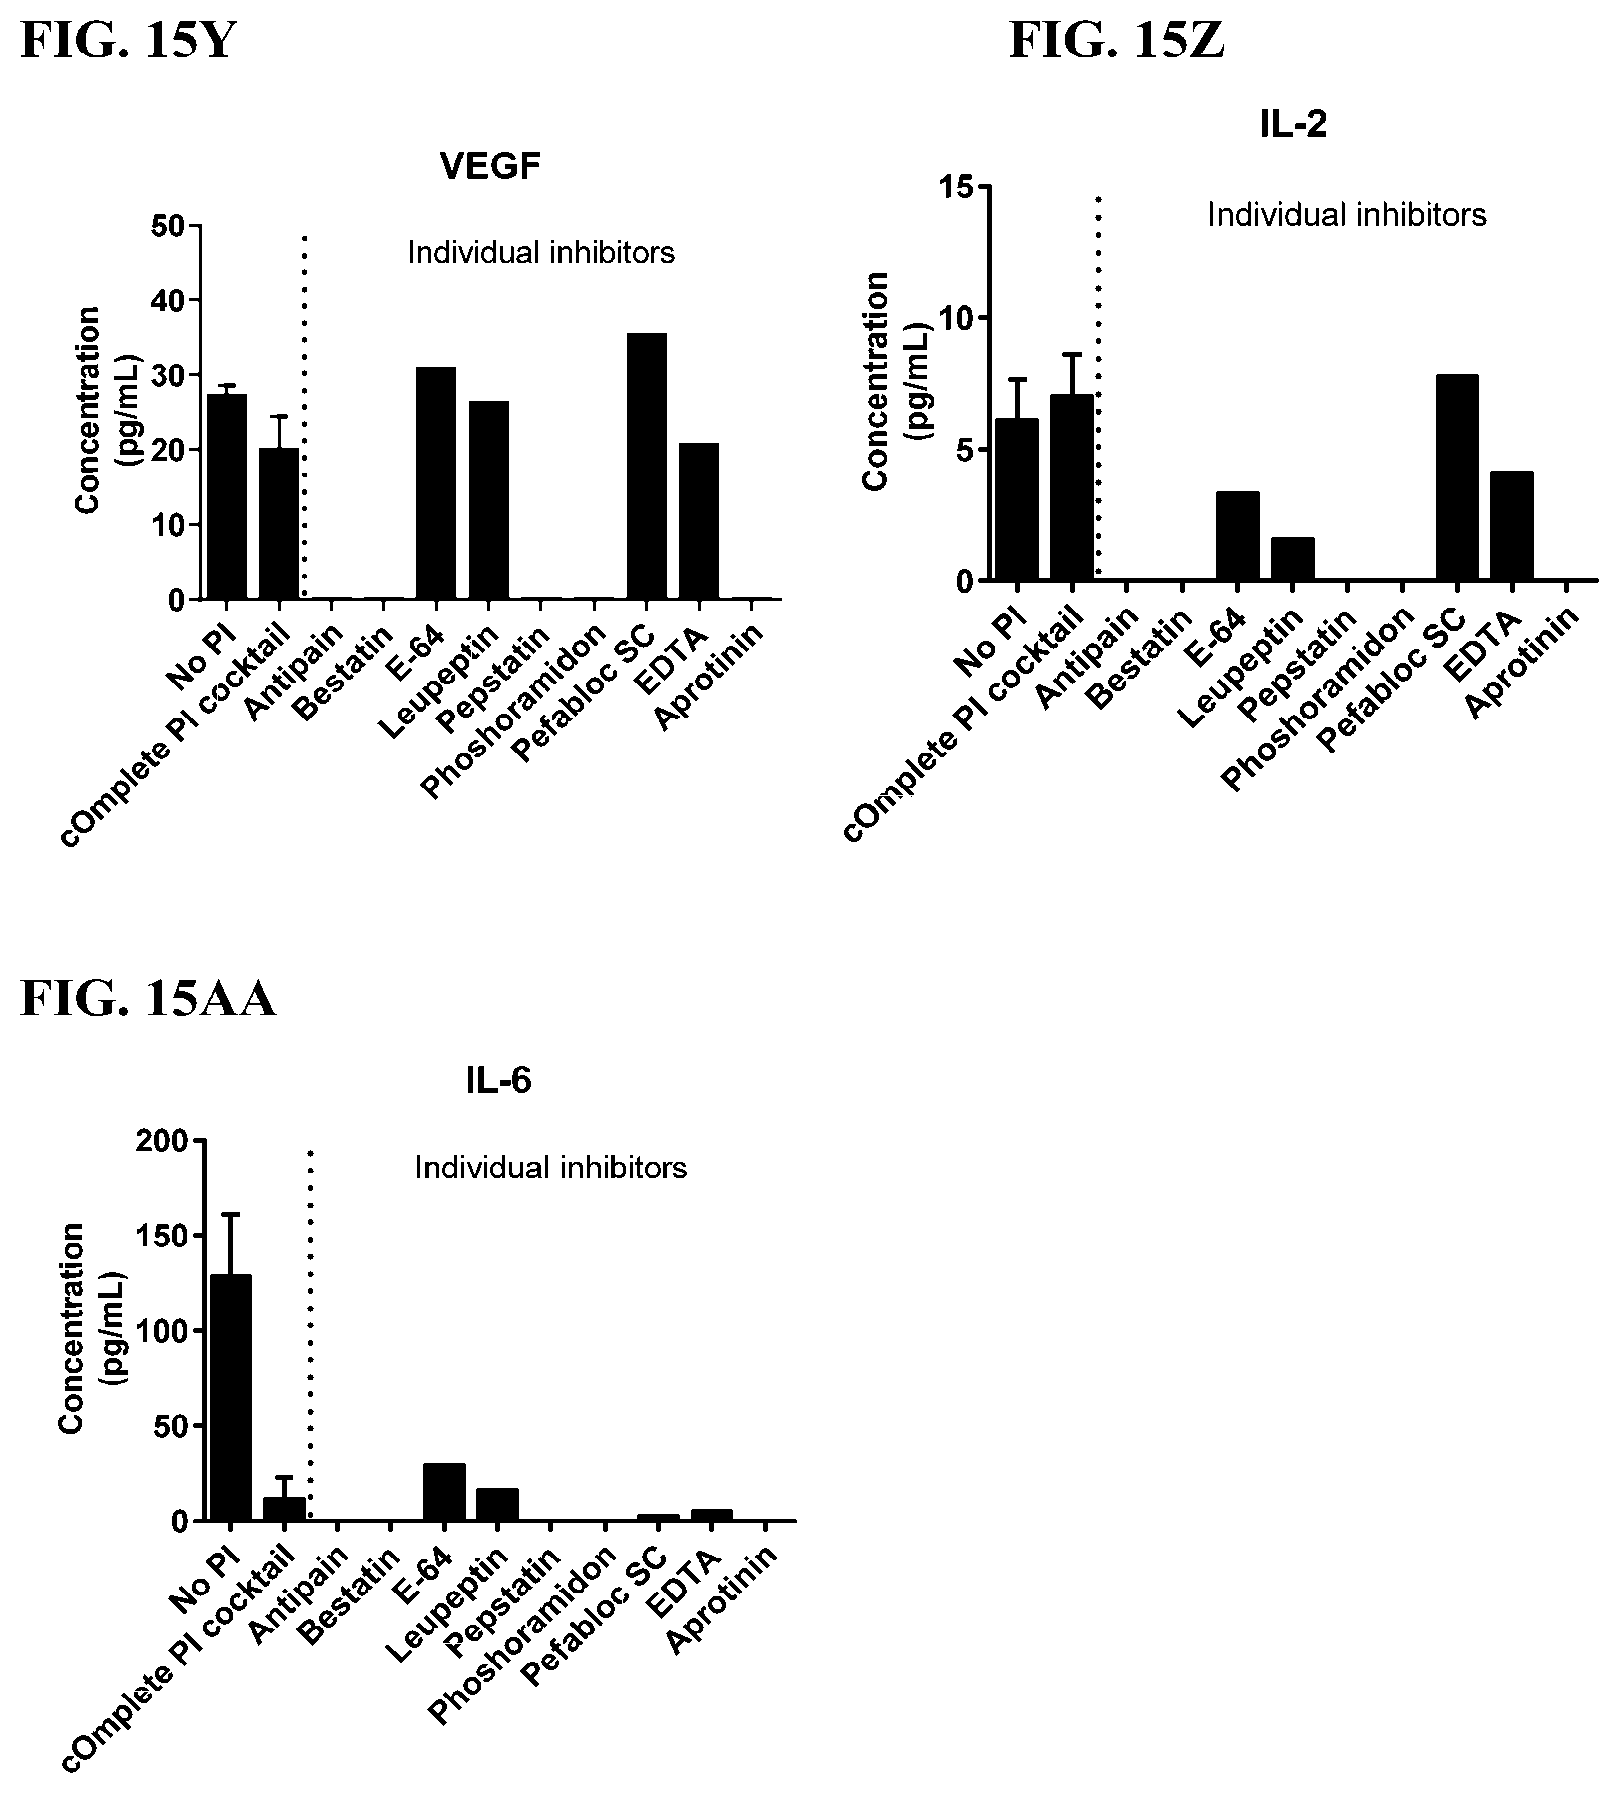
D00106

D00107

D00108

D00109

D00110

D00111

D00112

D00113

D00114

D00115

D00116

D00117
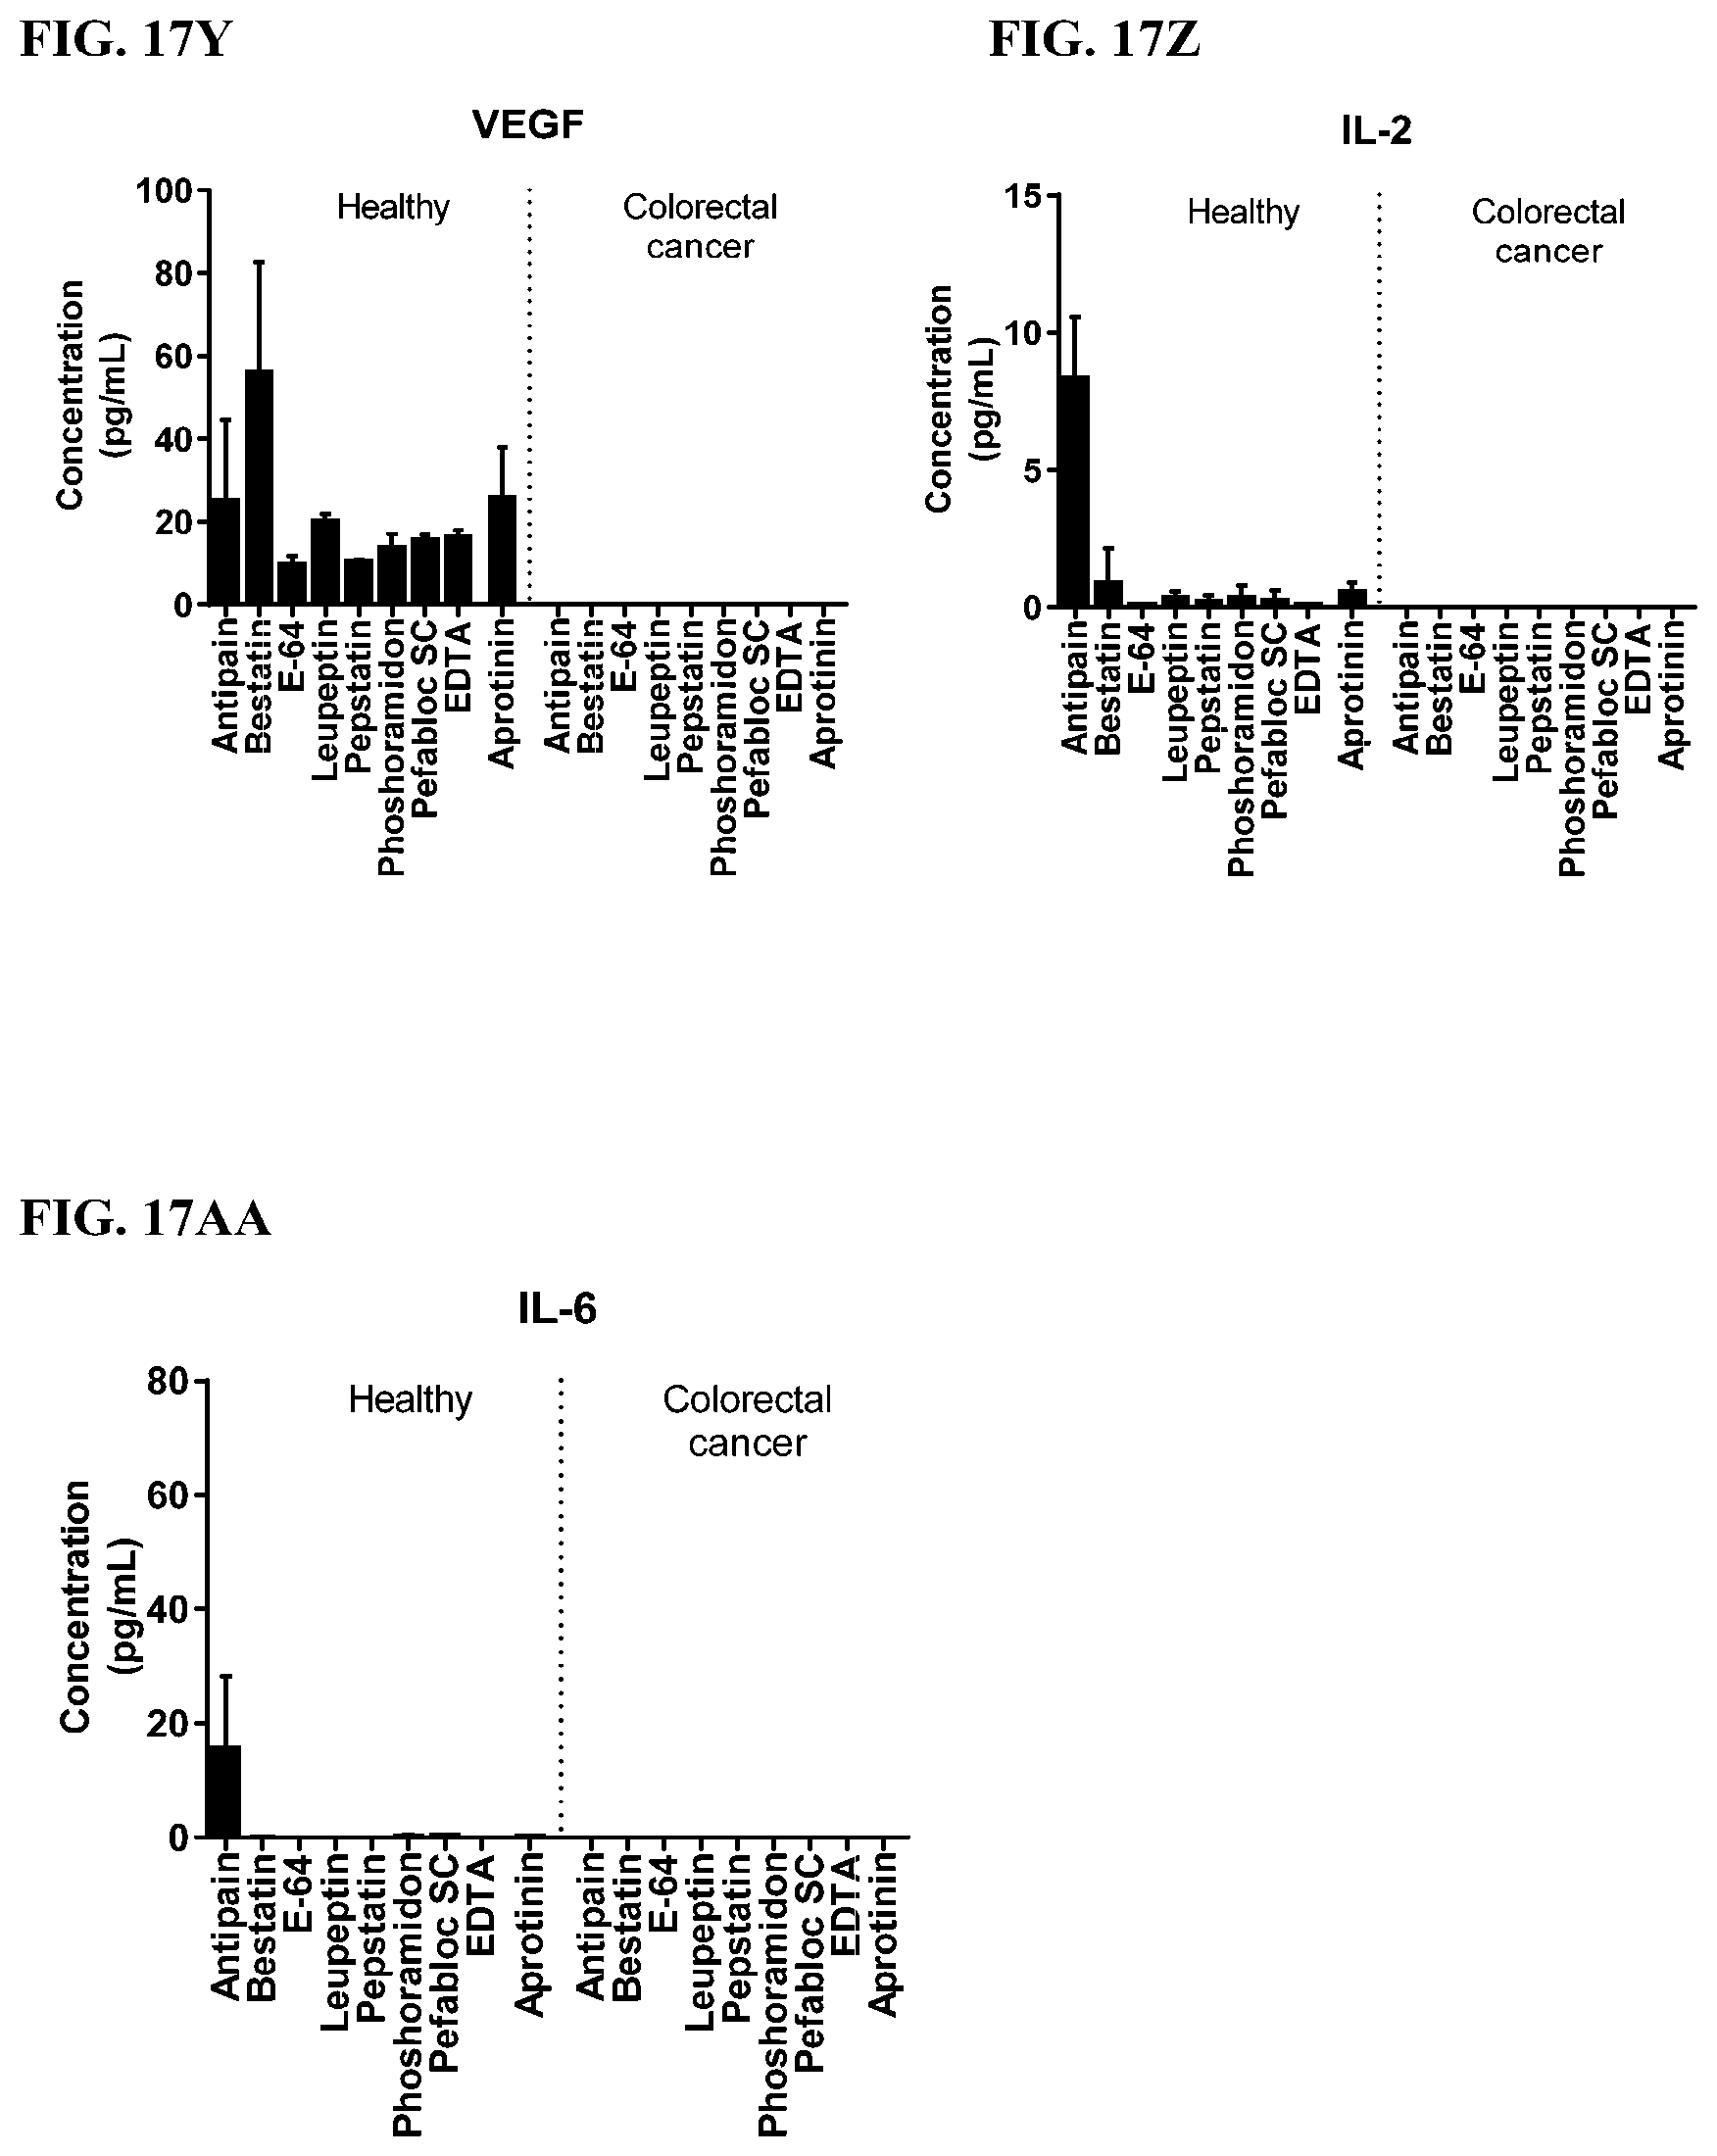
D00118

D00119

D00120

D00121

D00122

D00123
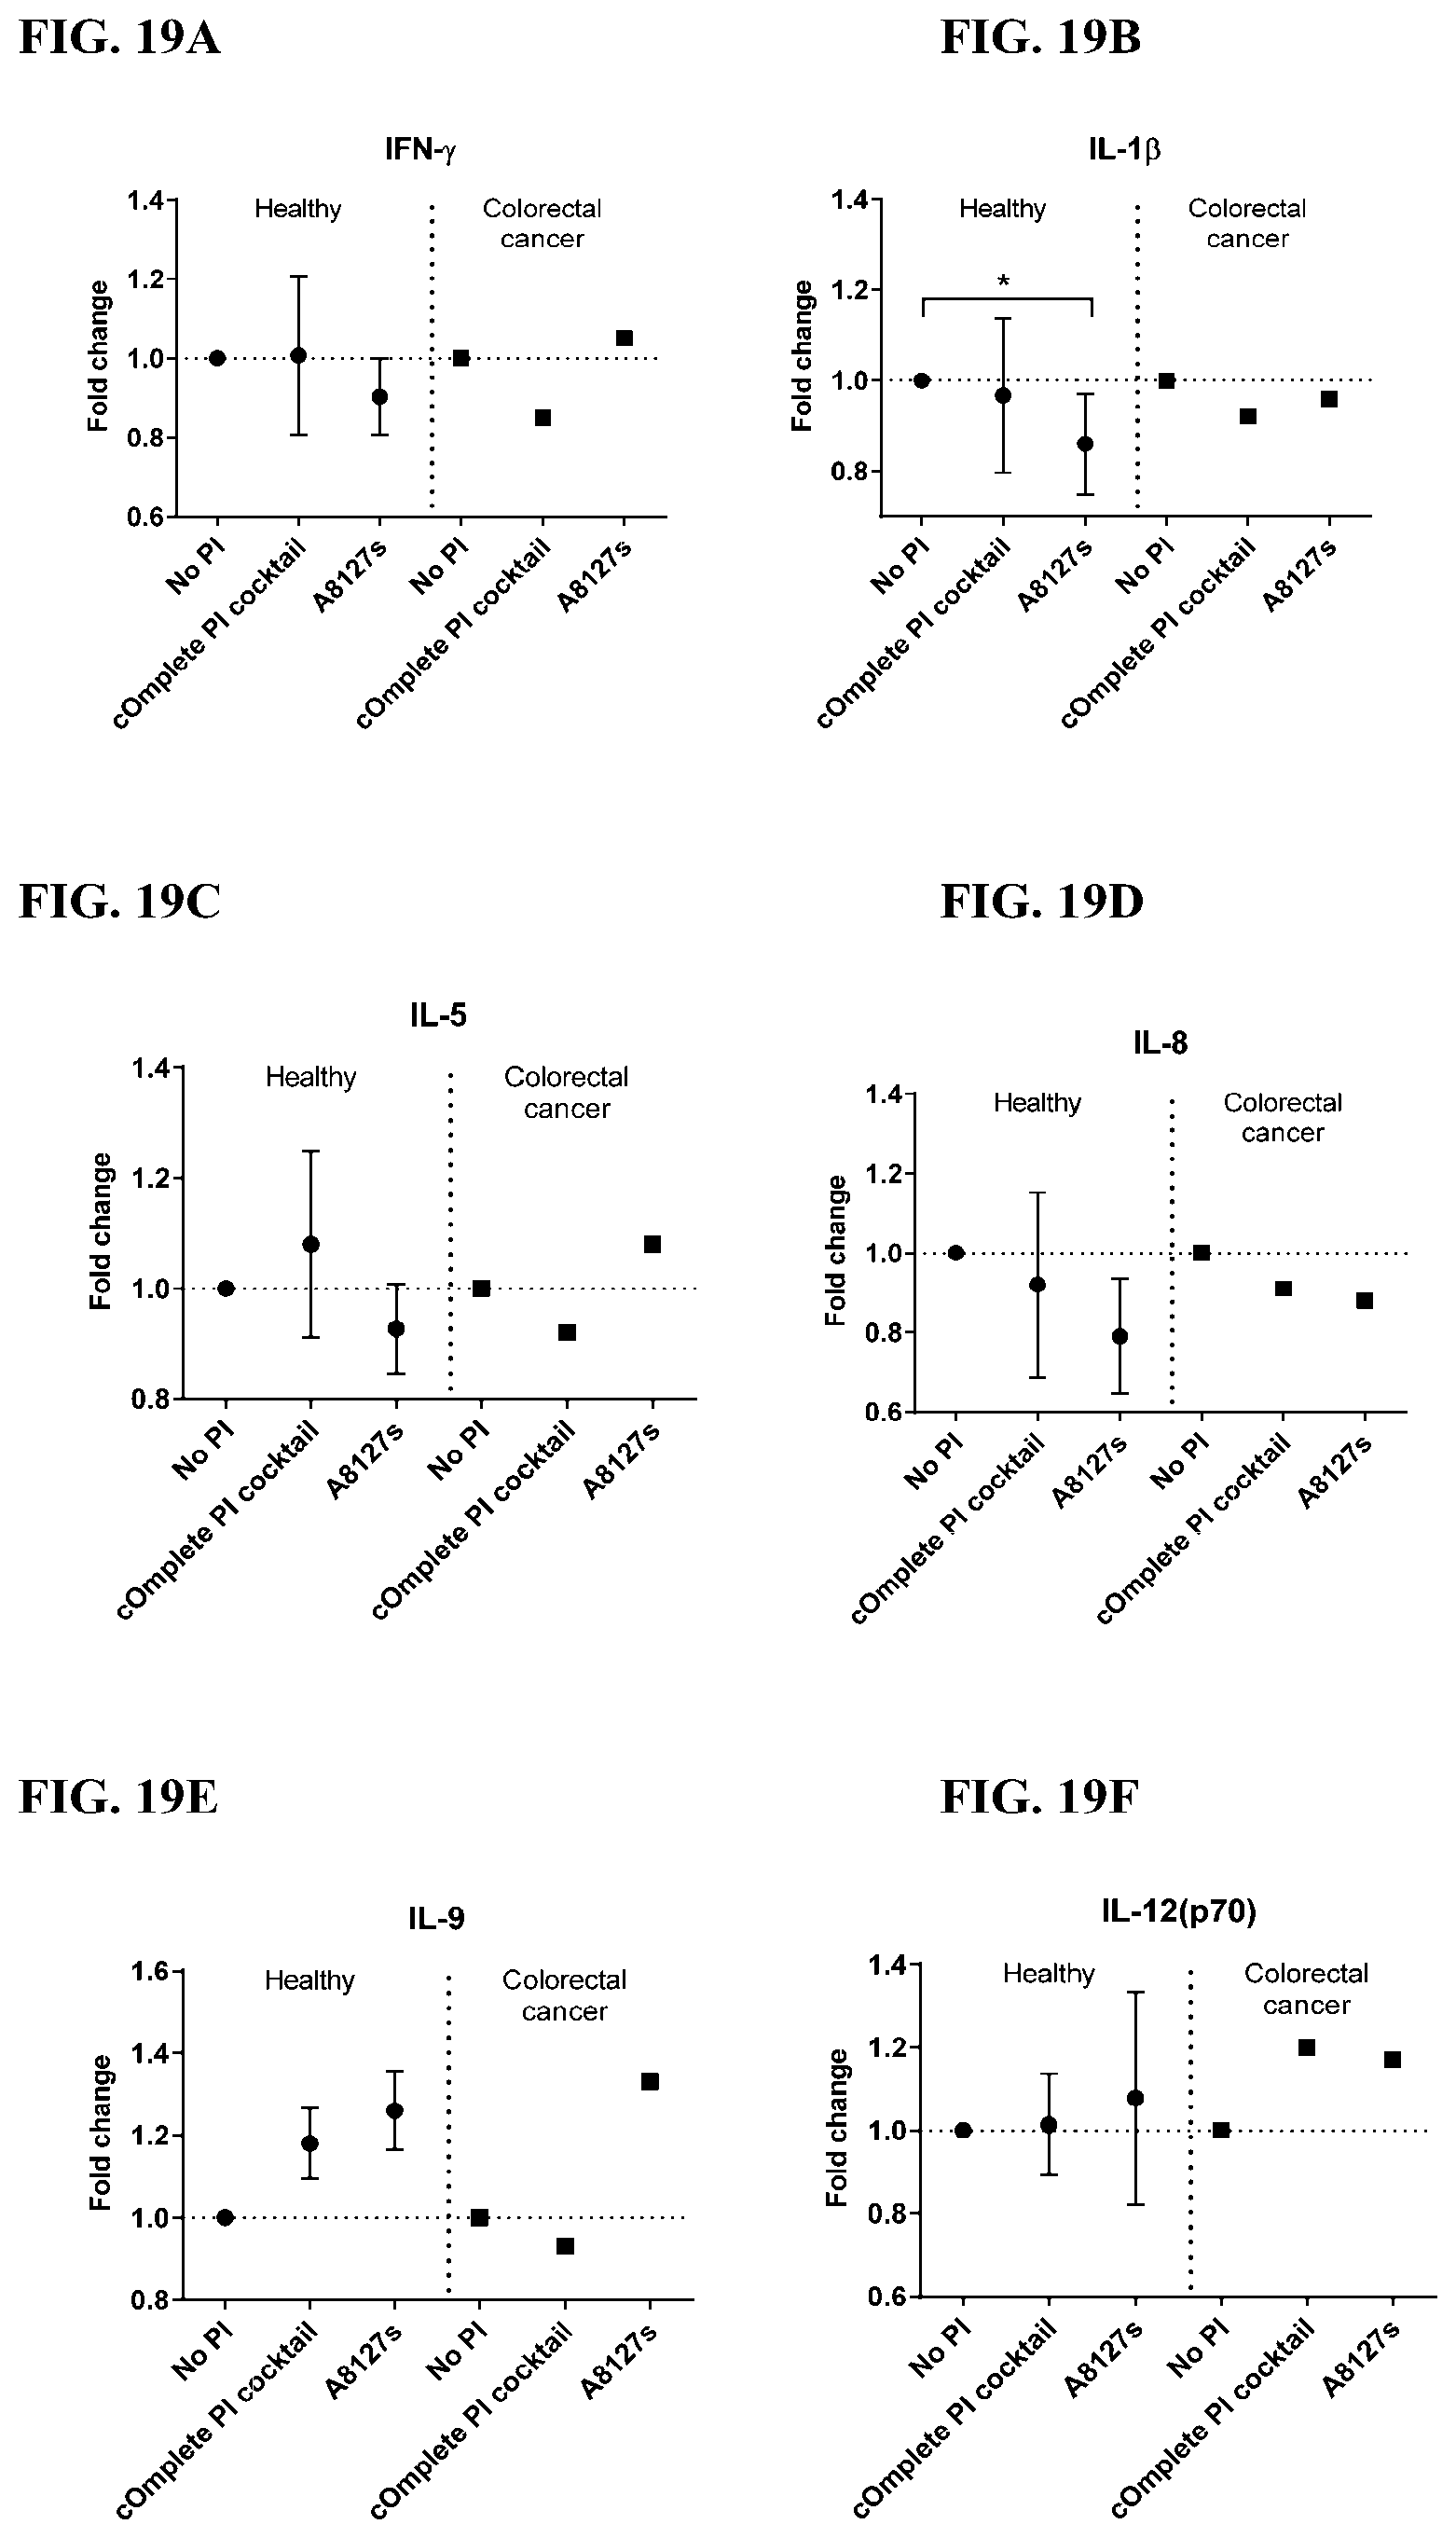
D00124

D00125

D00126
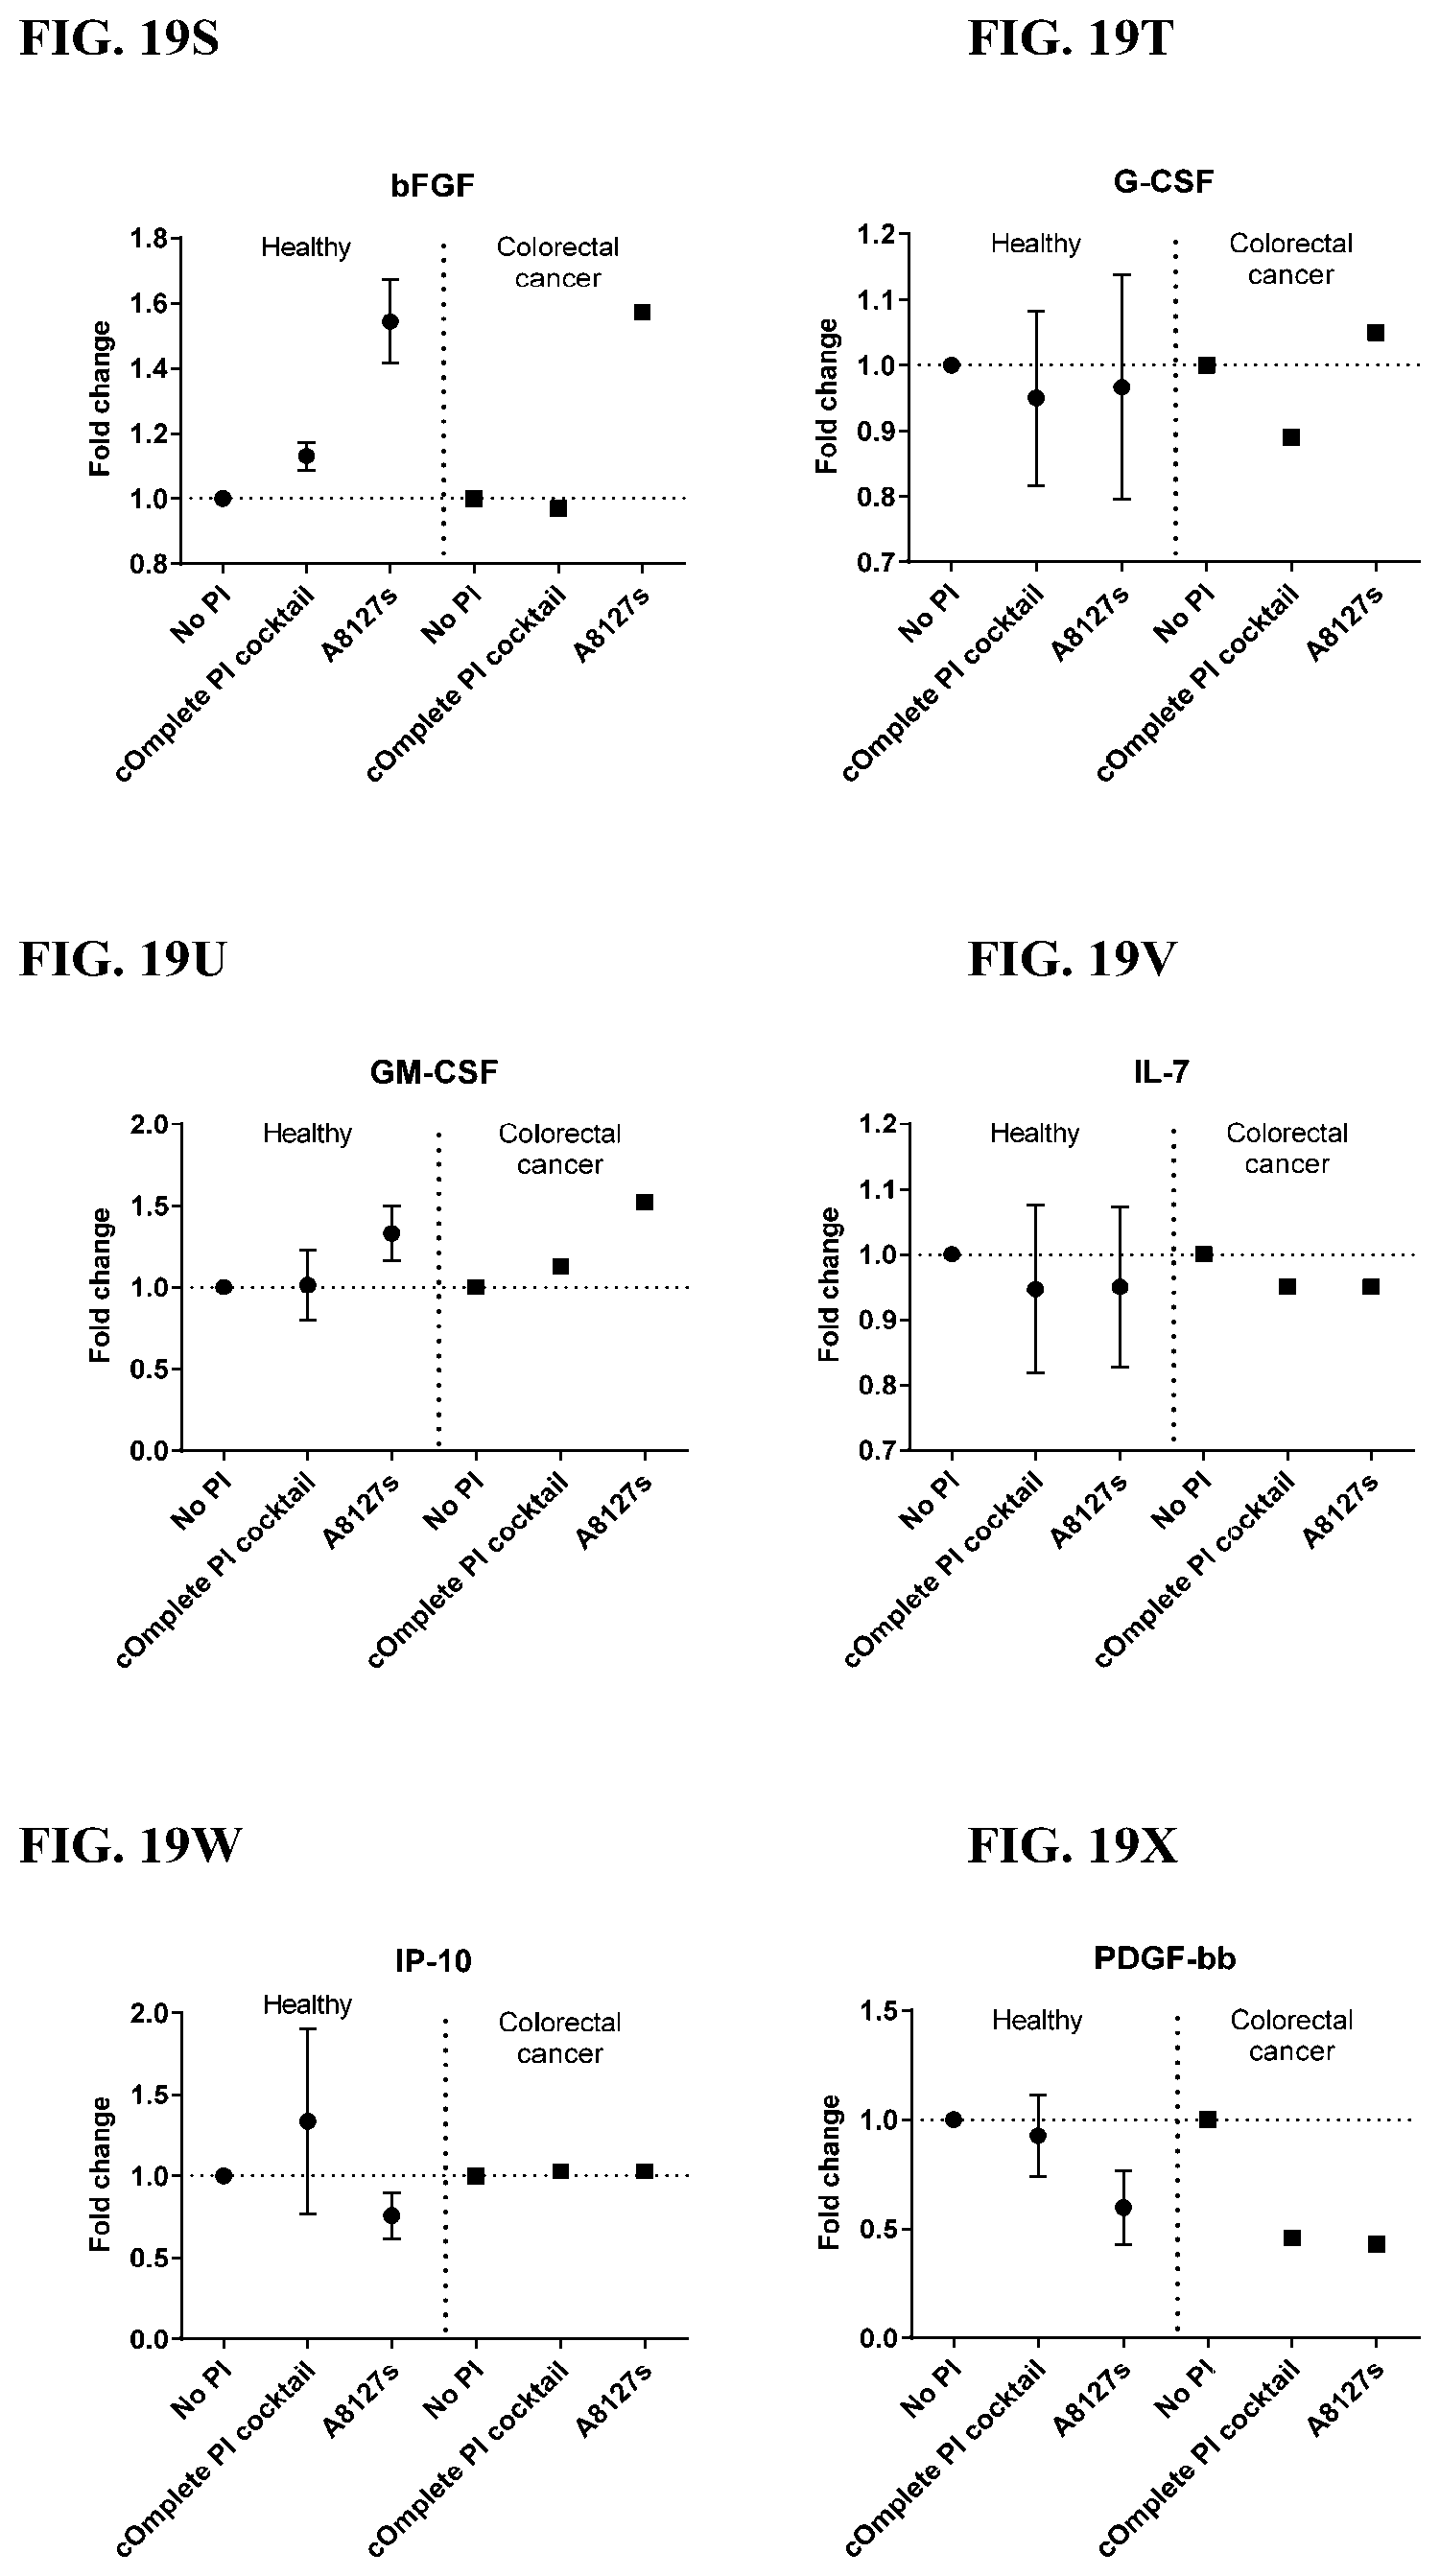
D00127

D00128
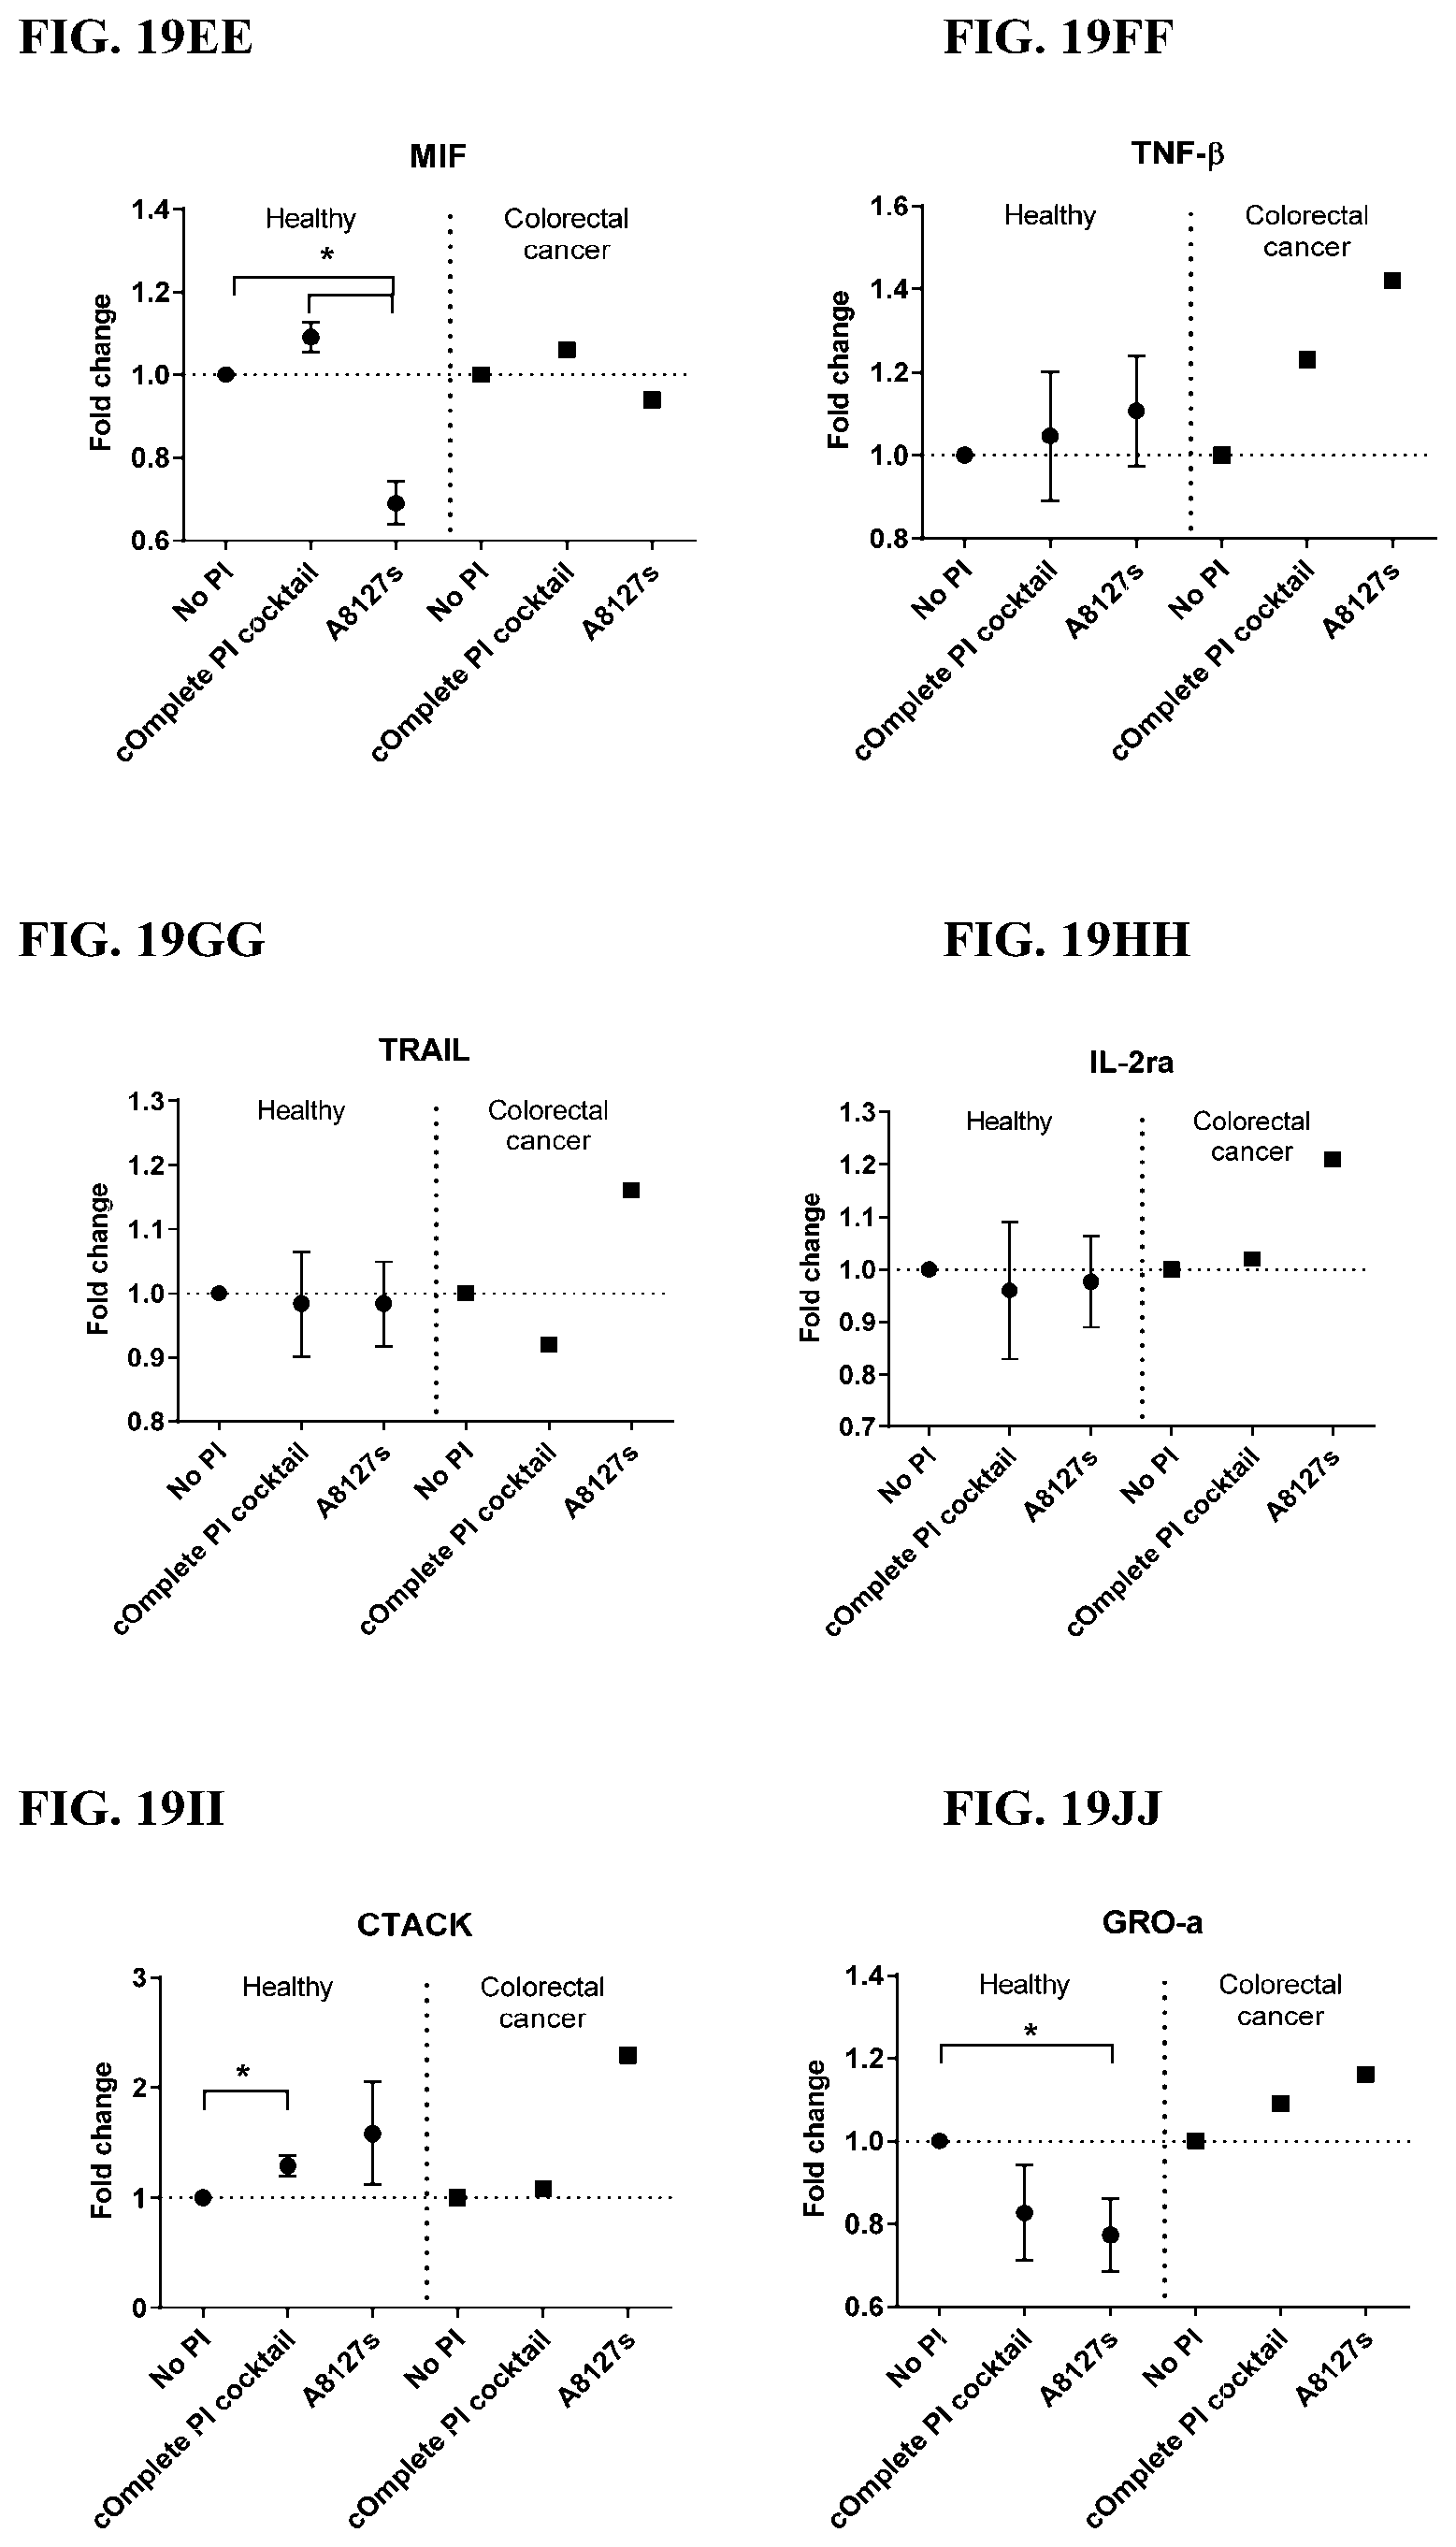
D00129
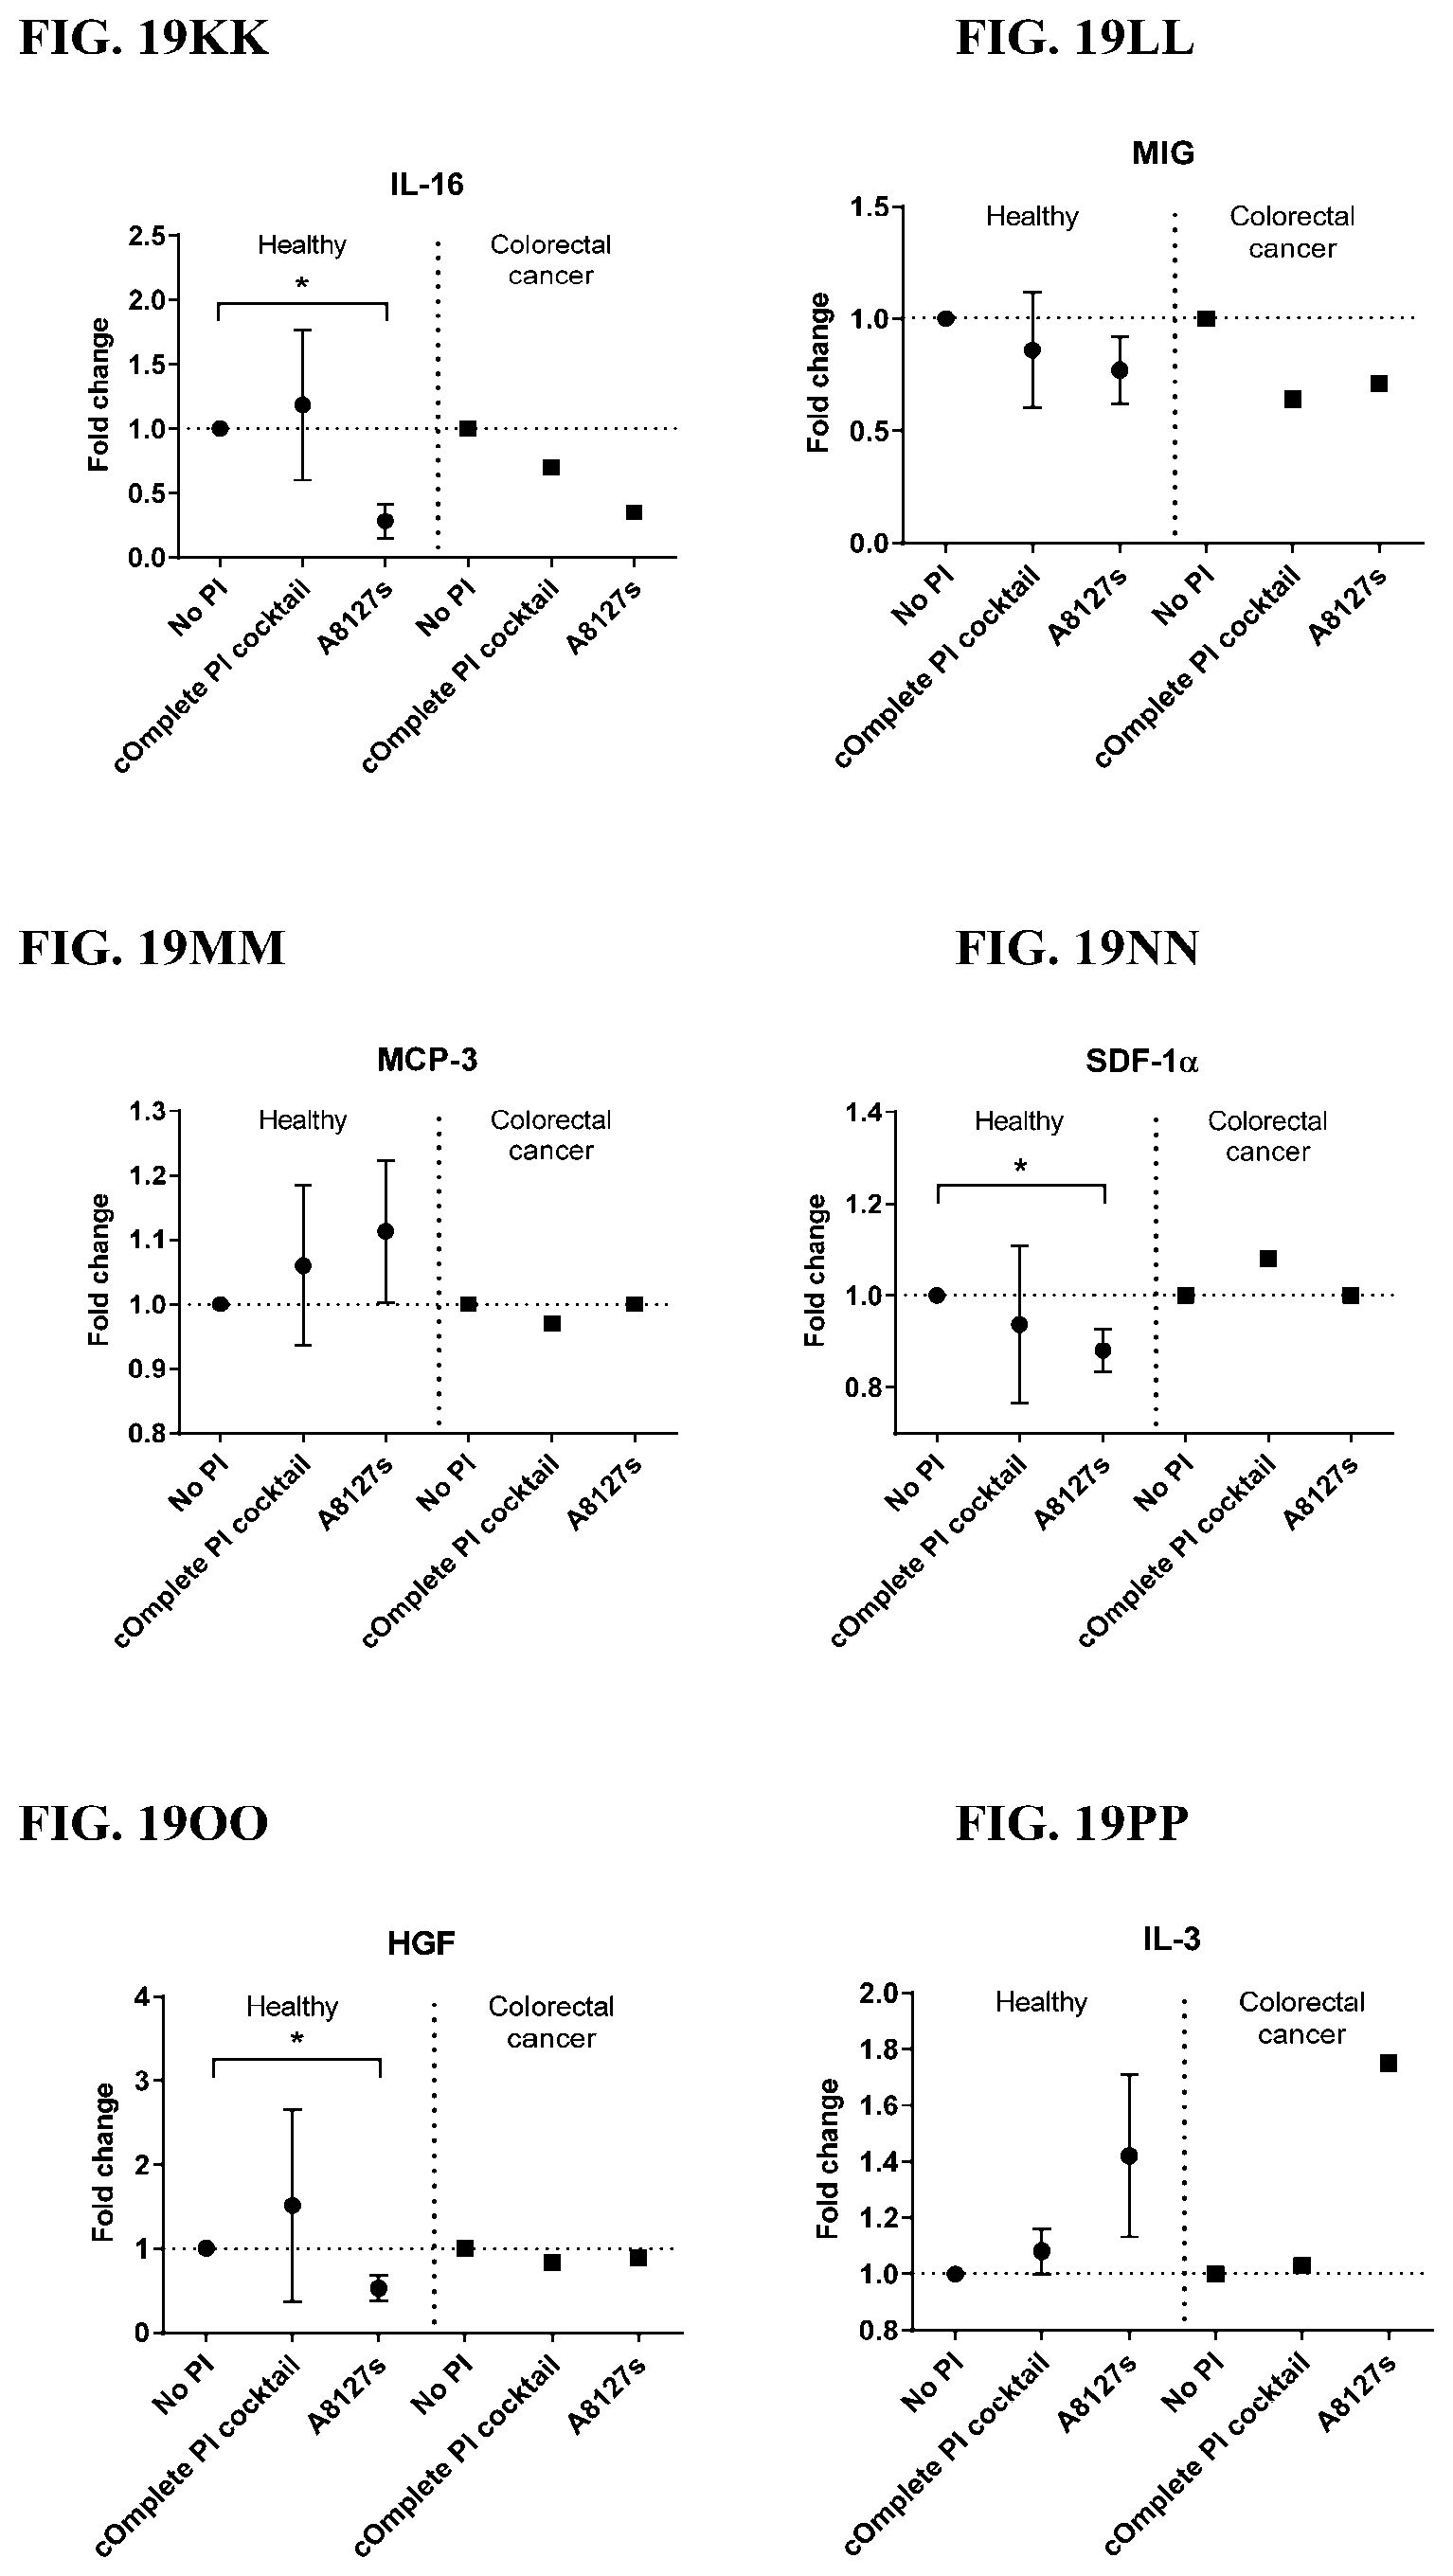
D00130

D00131
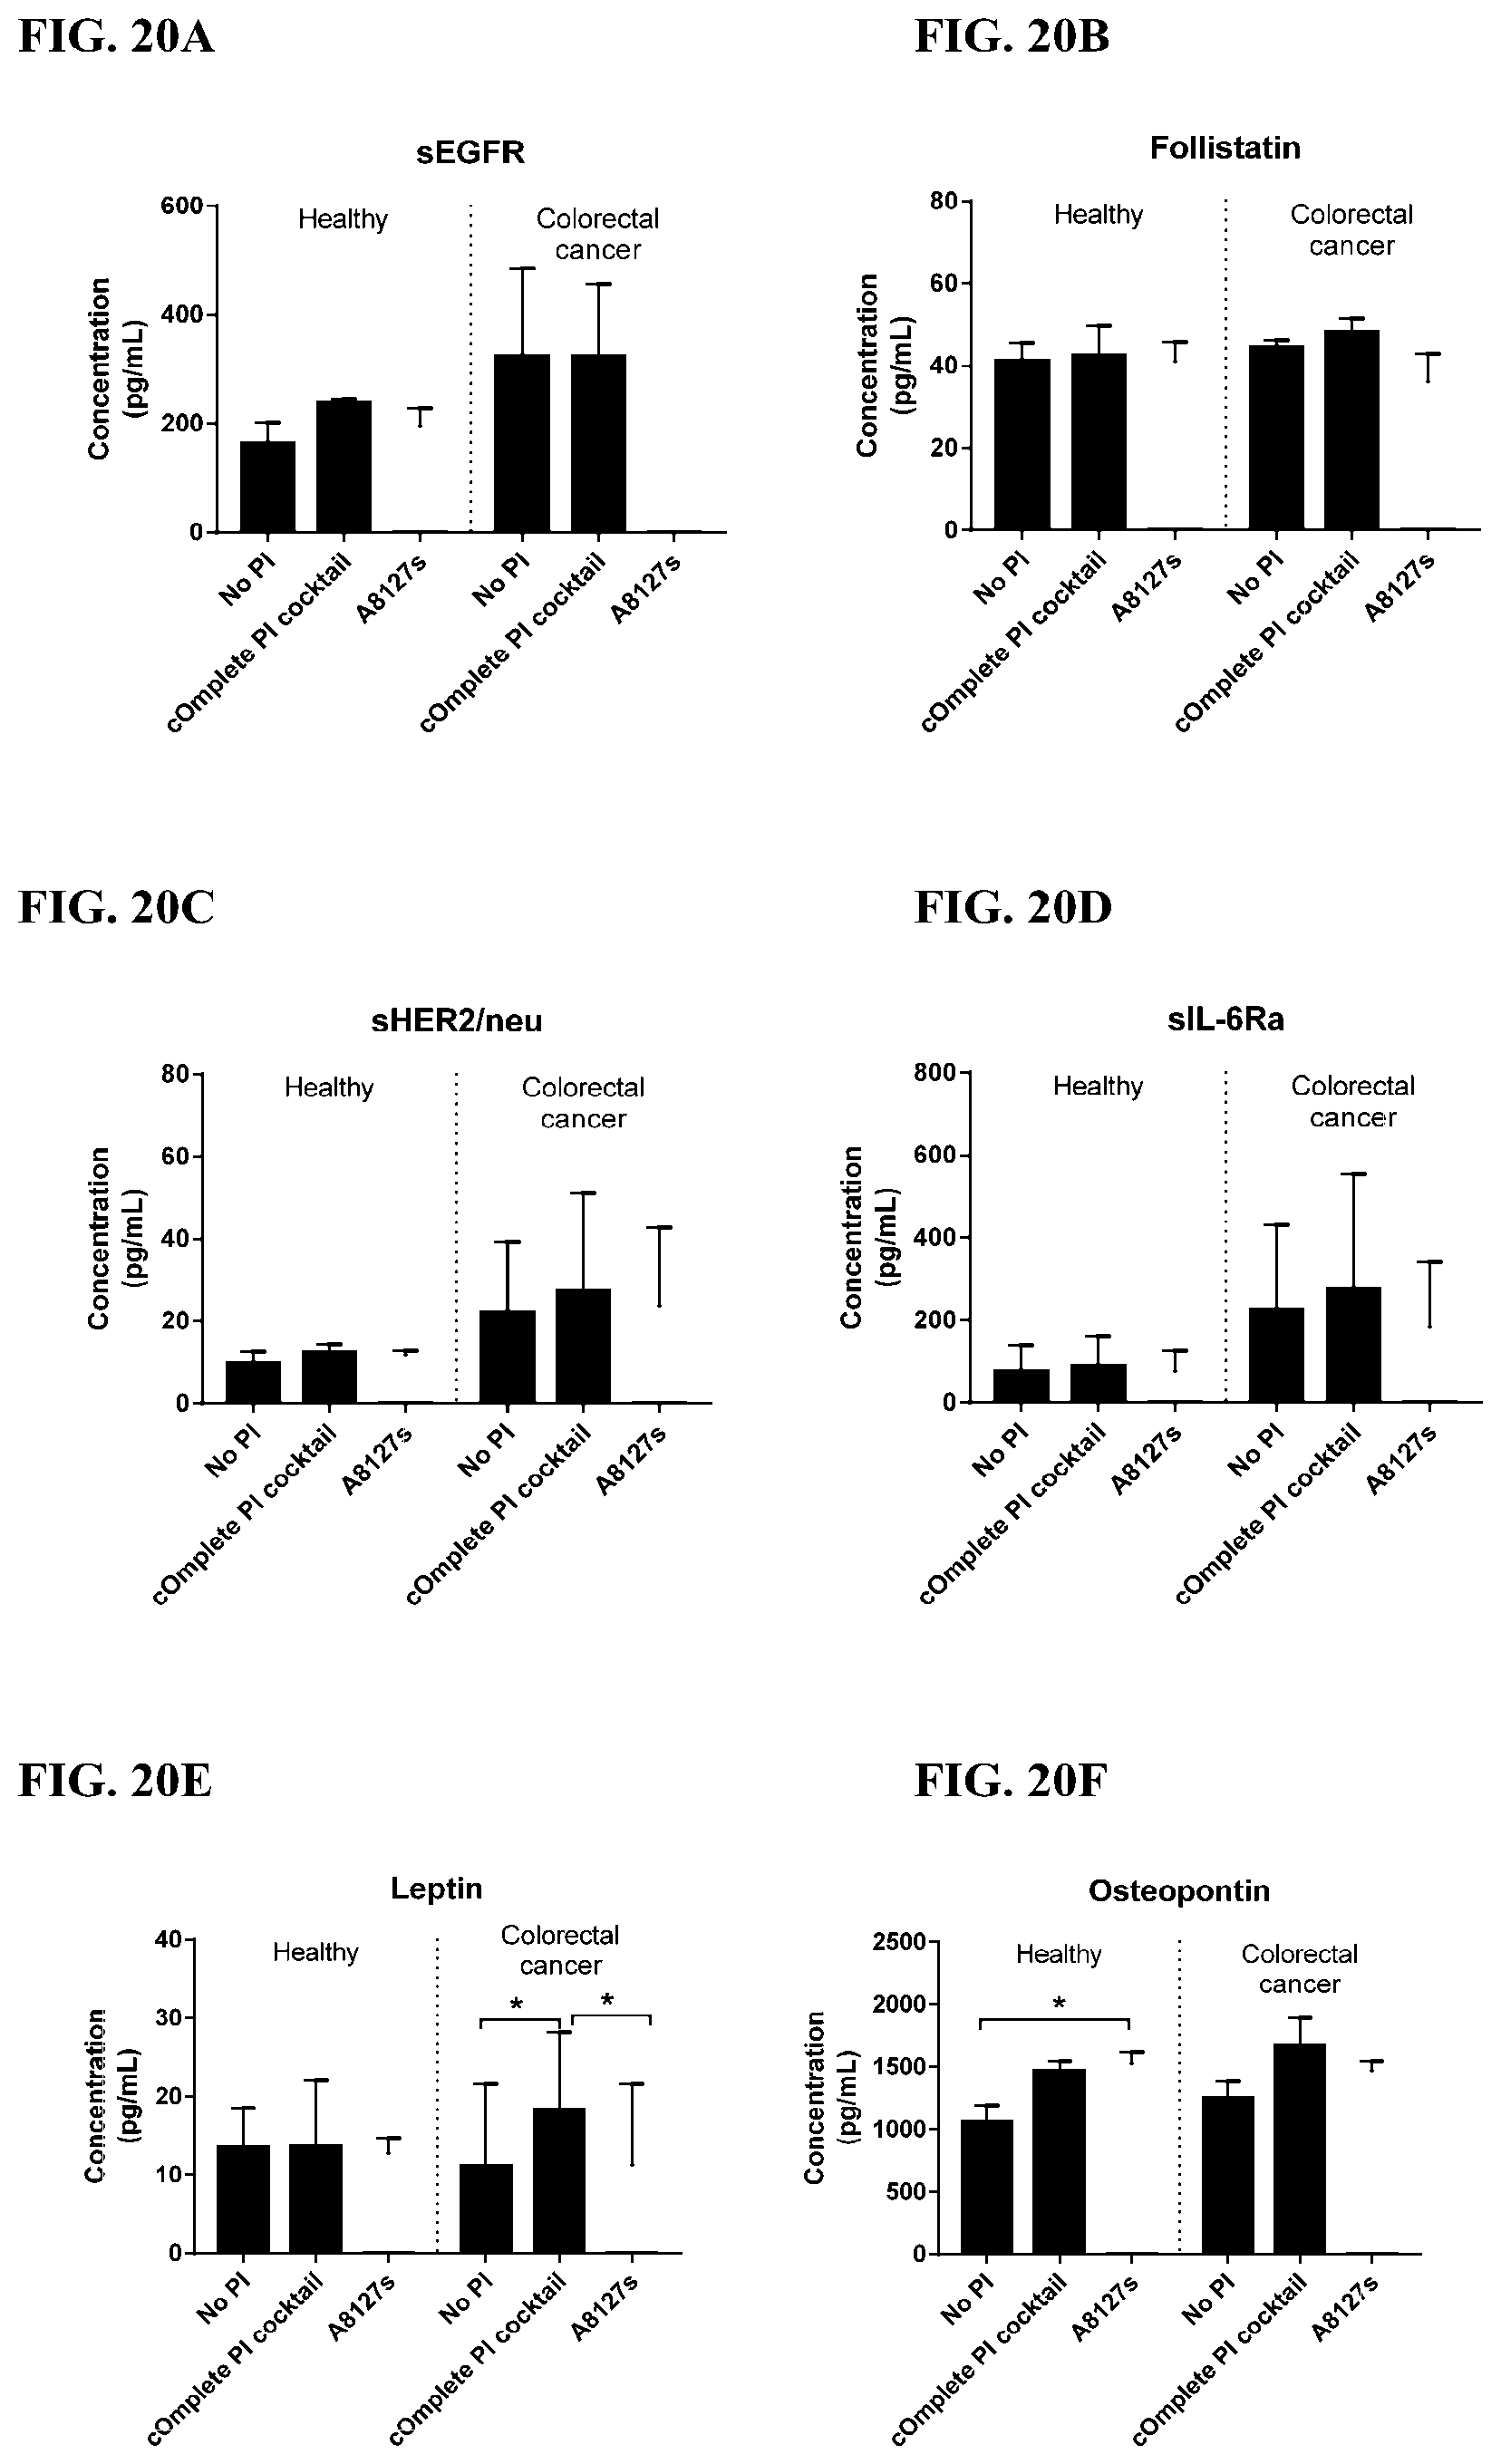
D00132
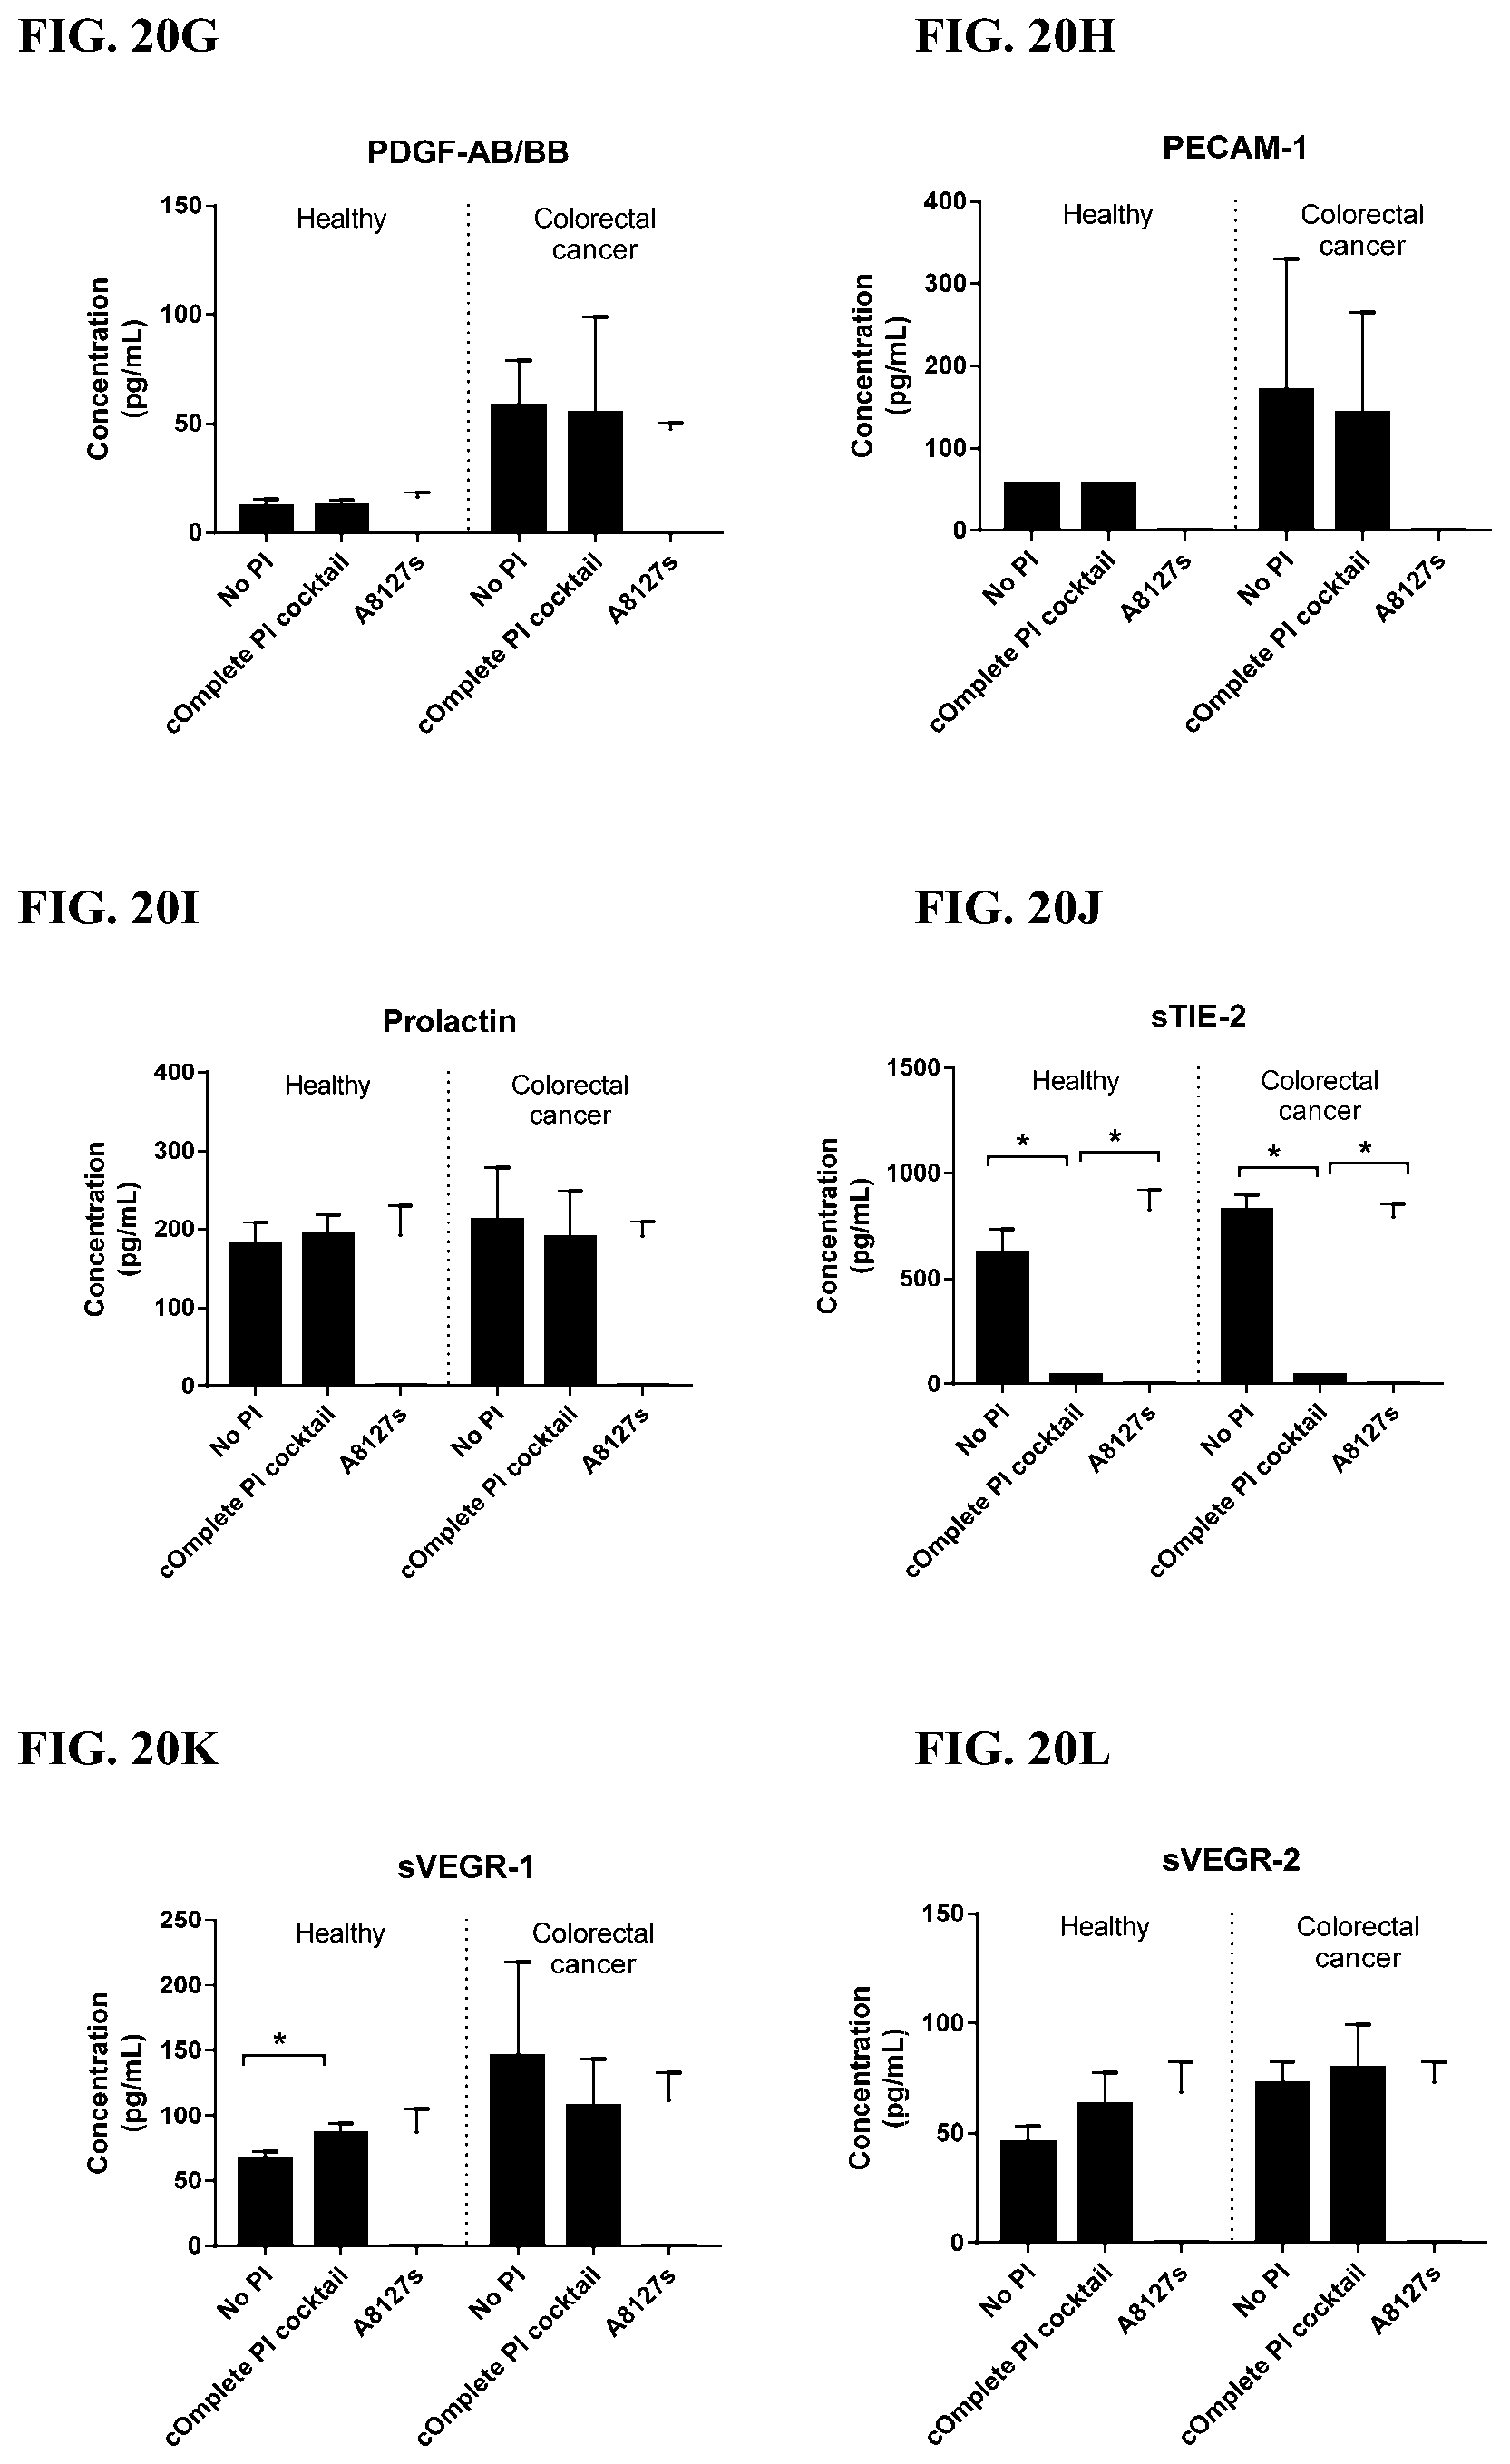
D00133
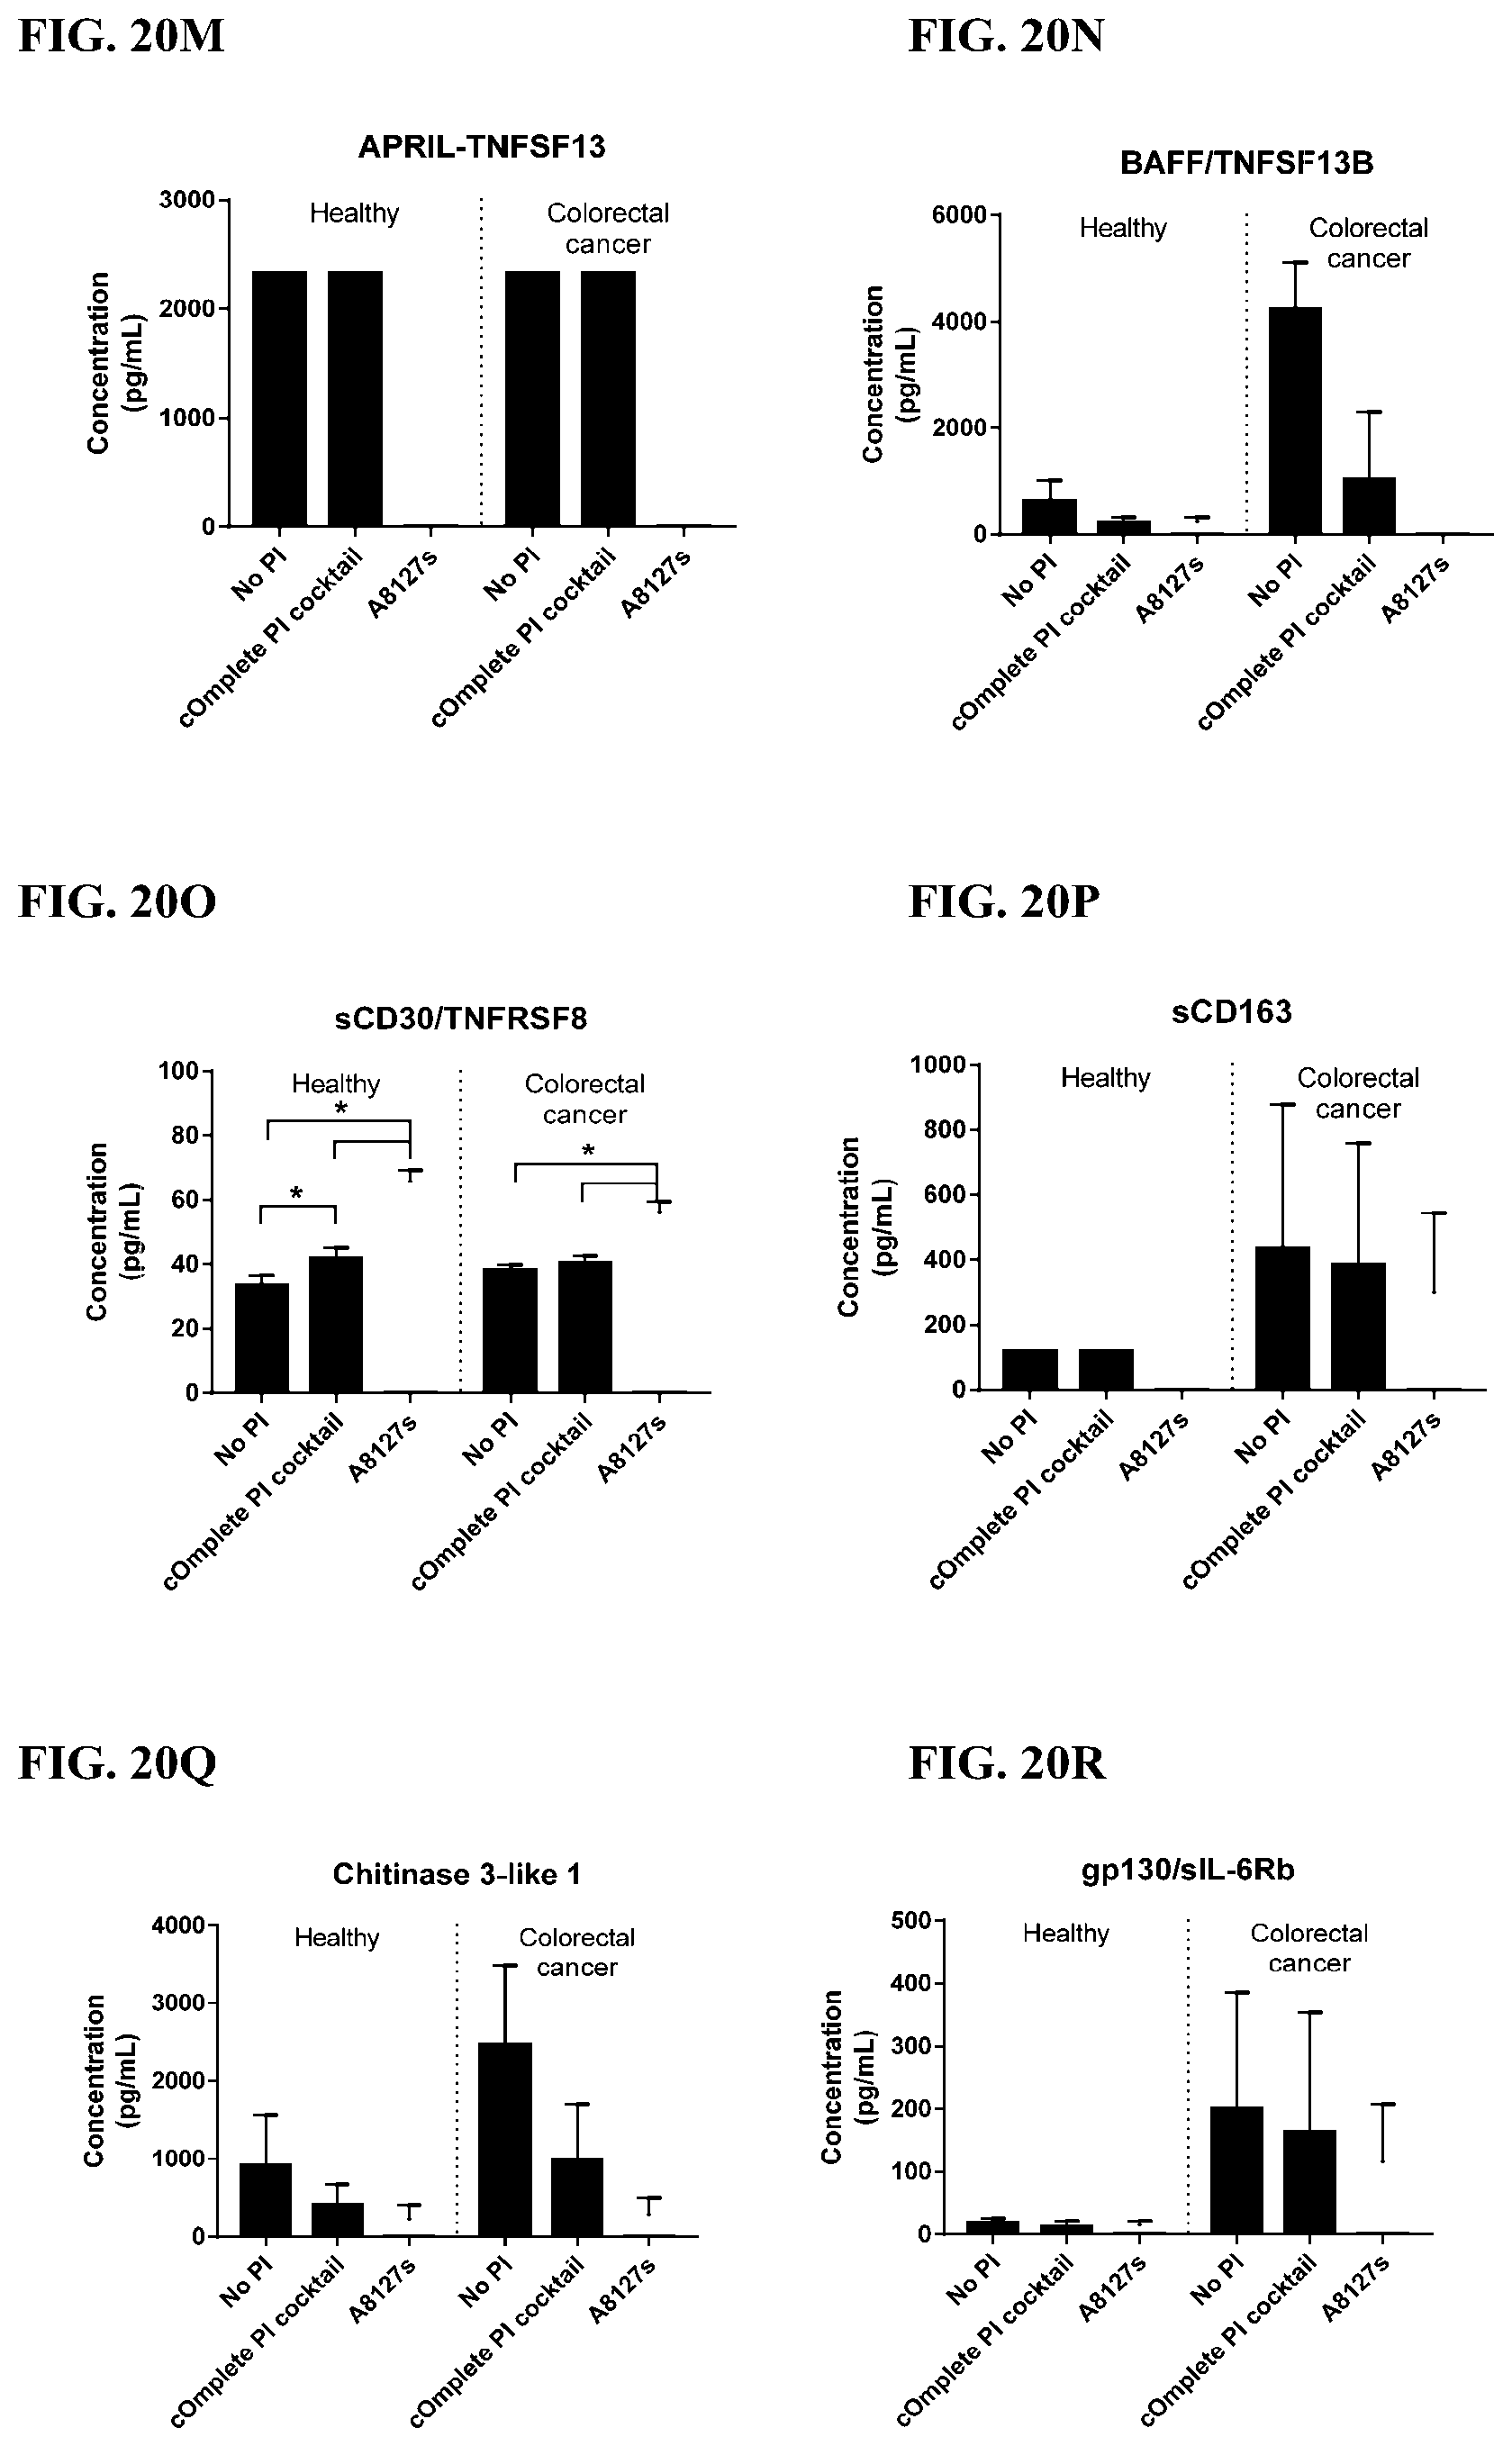
D00134
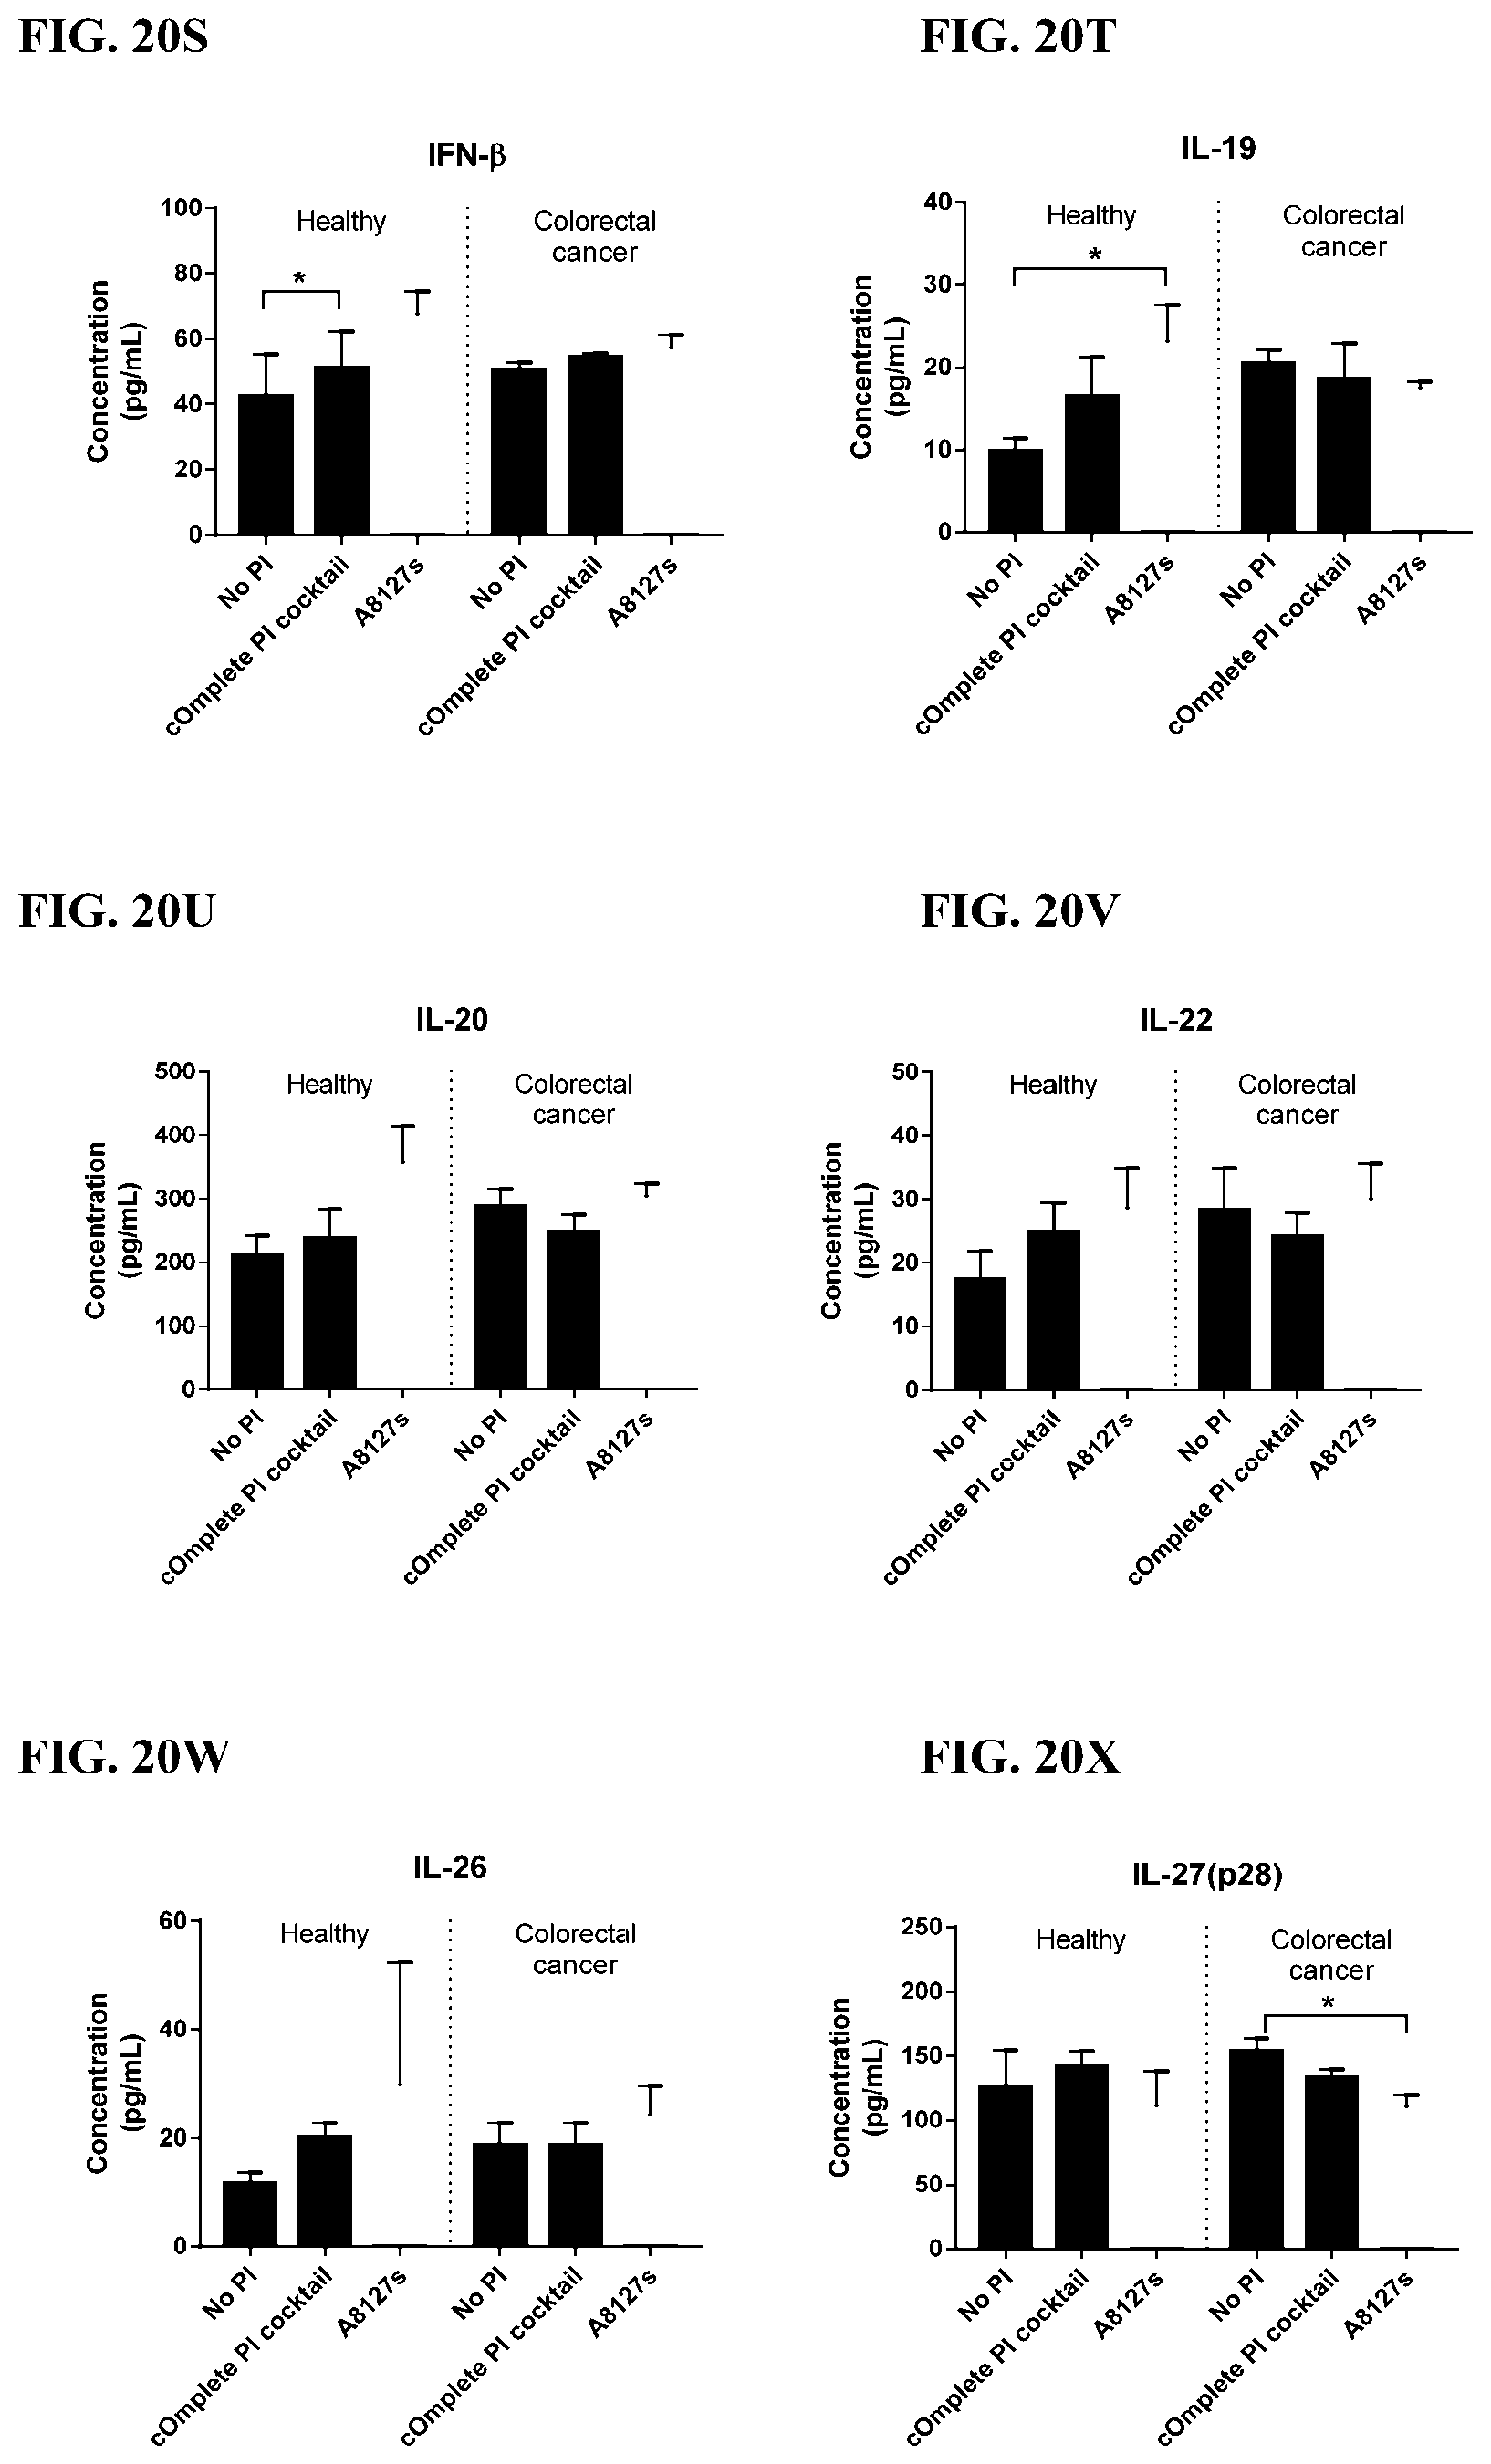
D00135
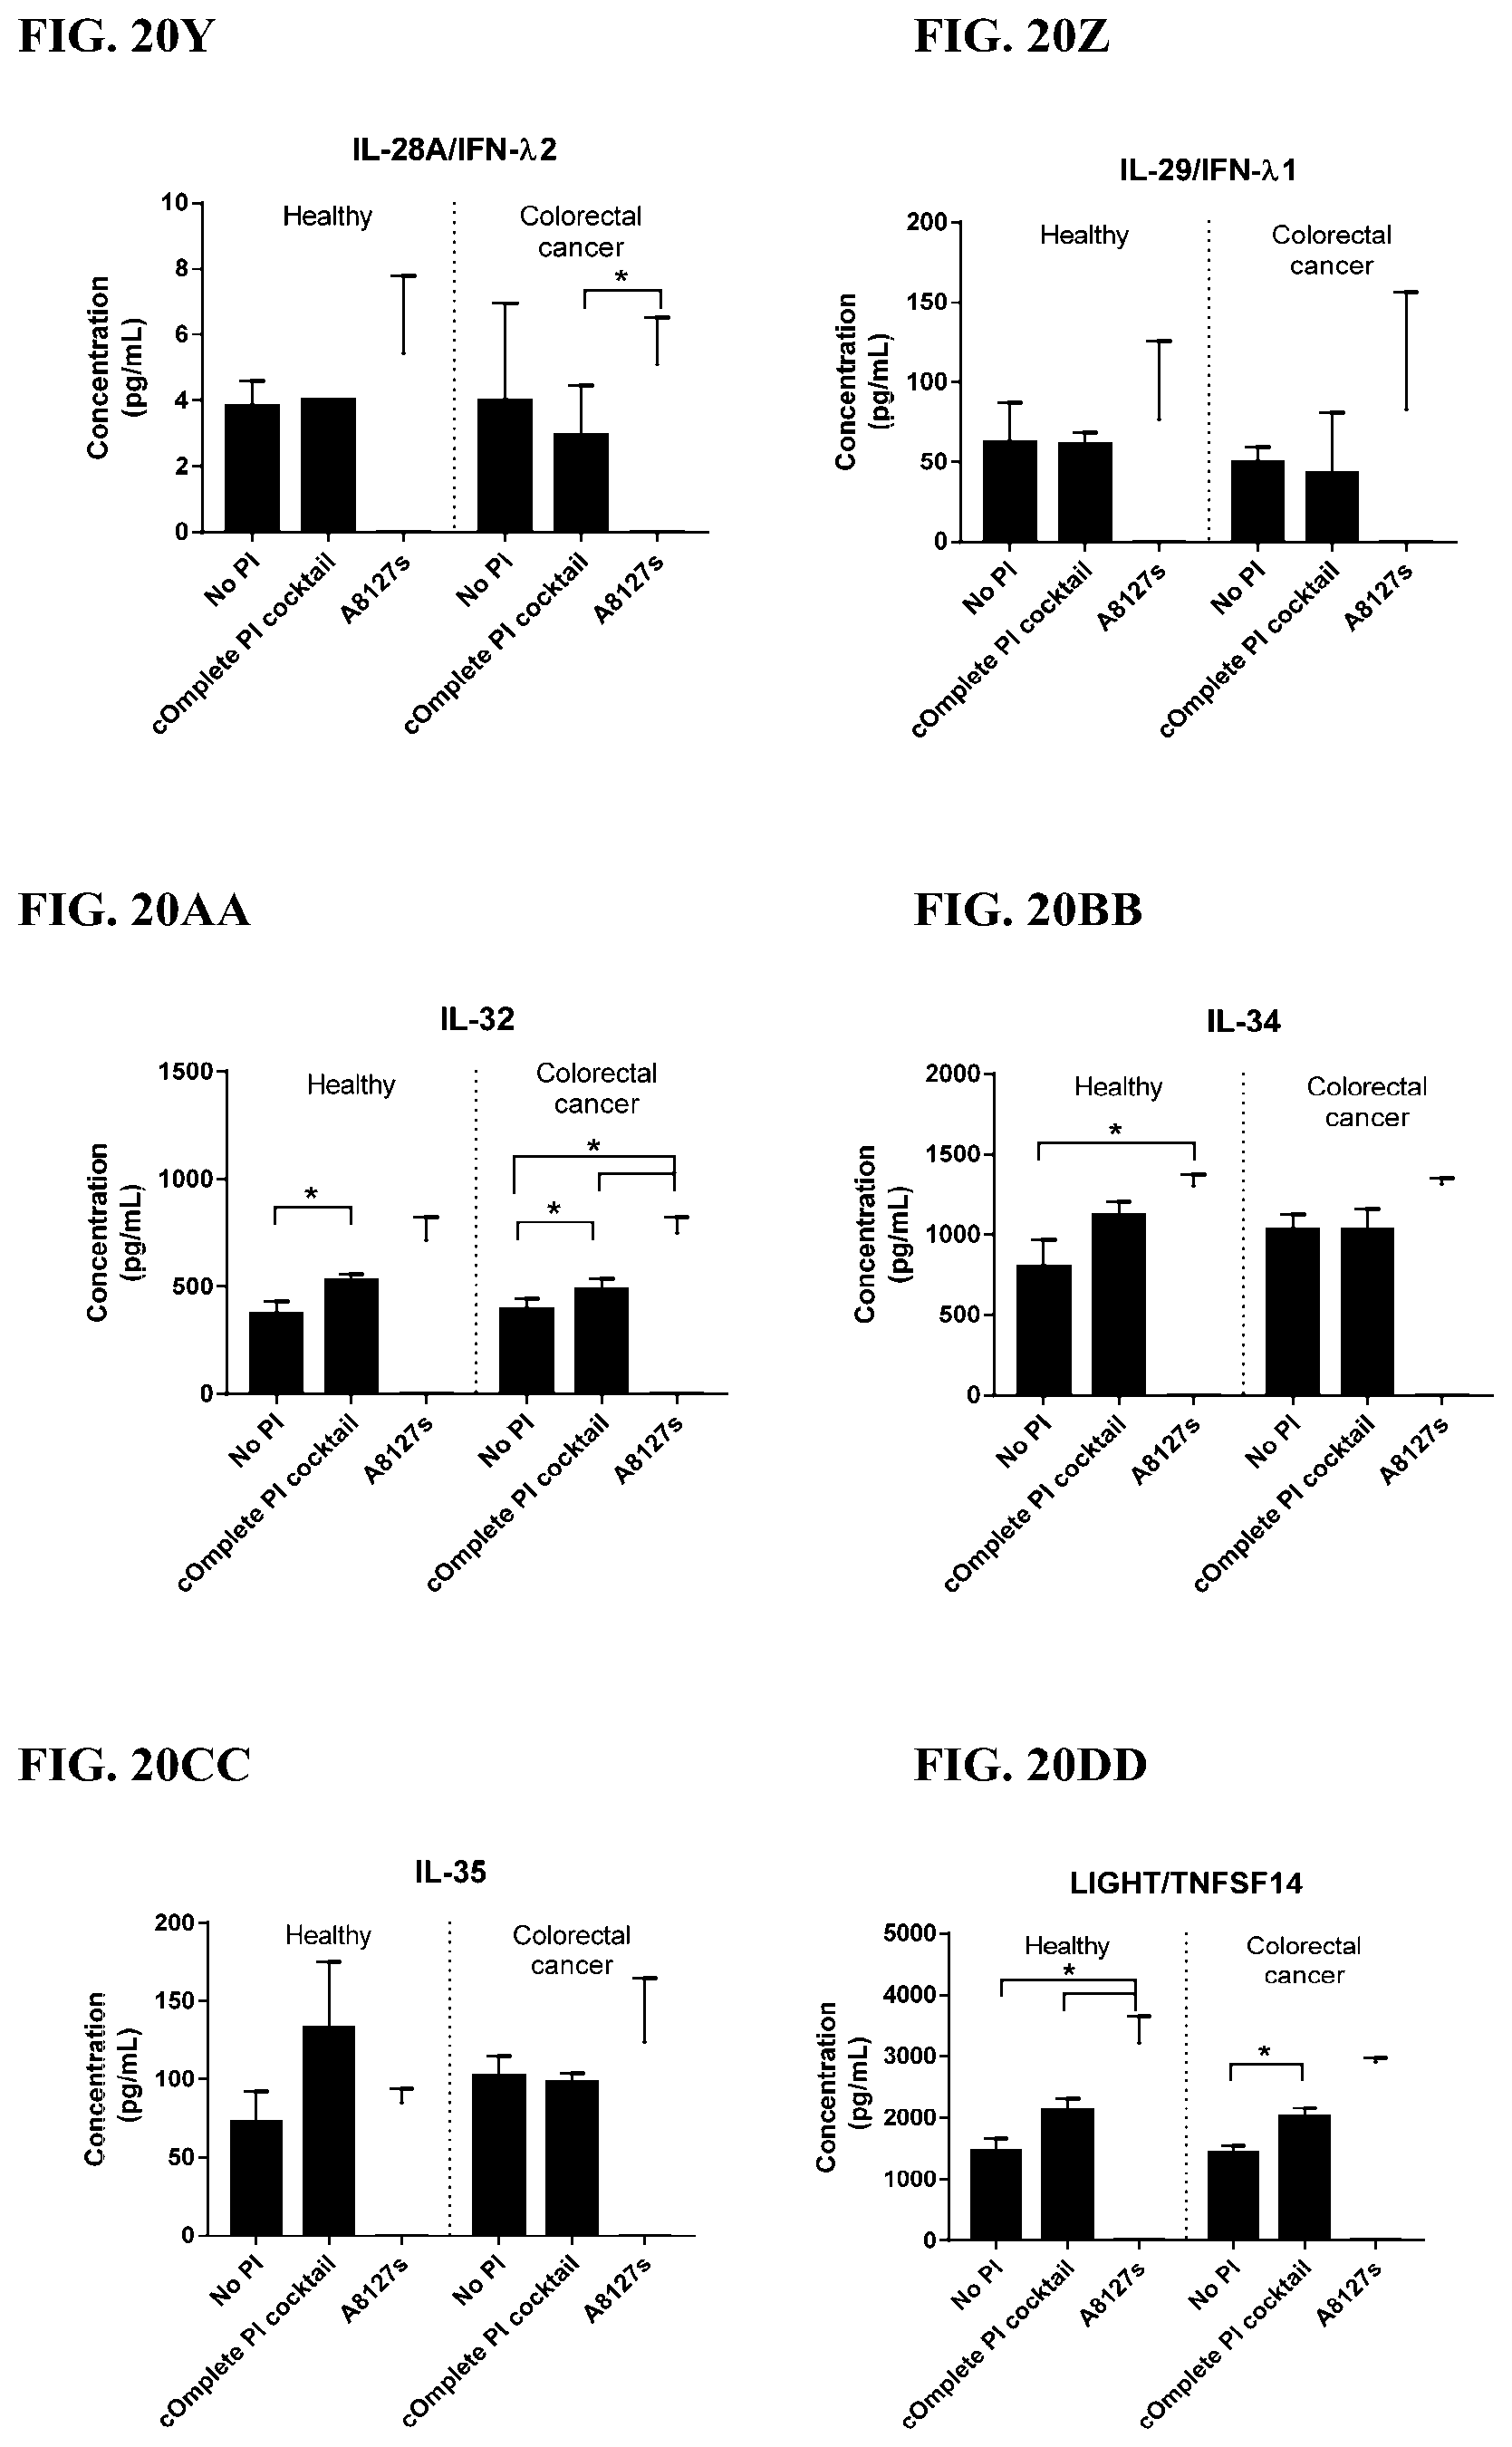
D00136

D00137

D00138

D00139
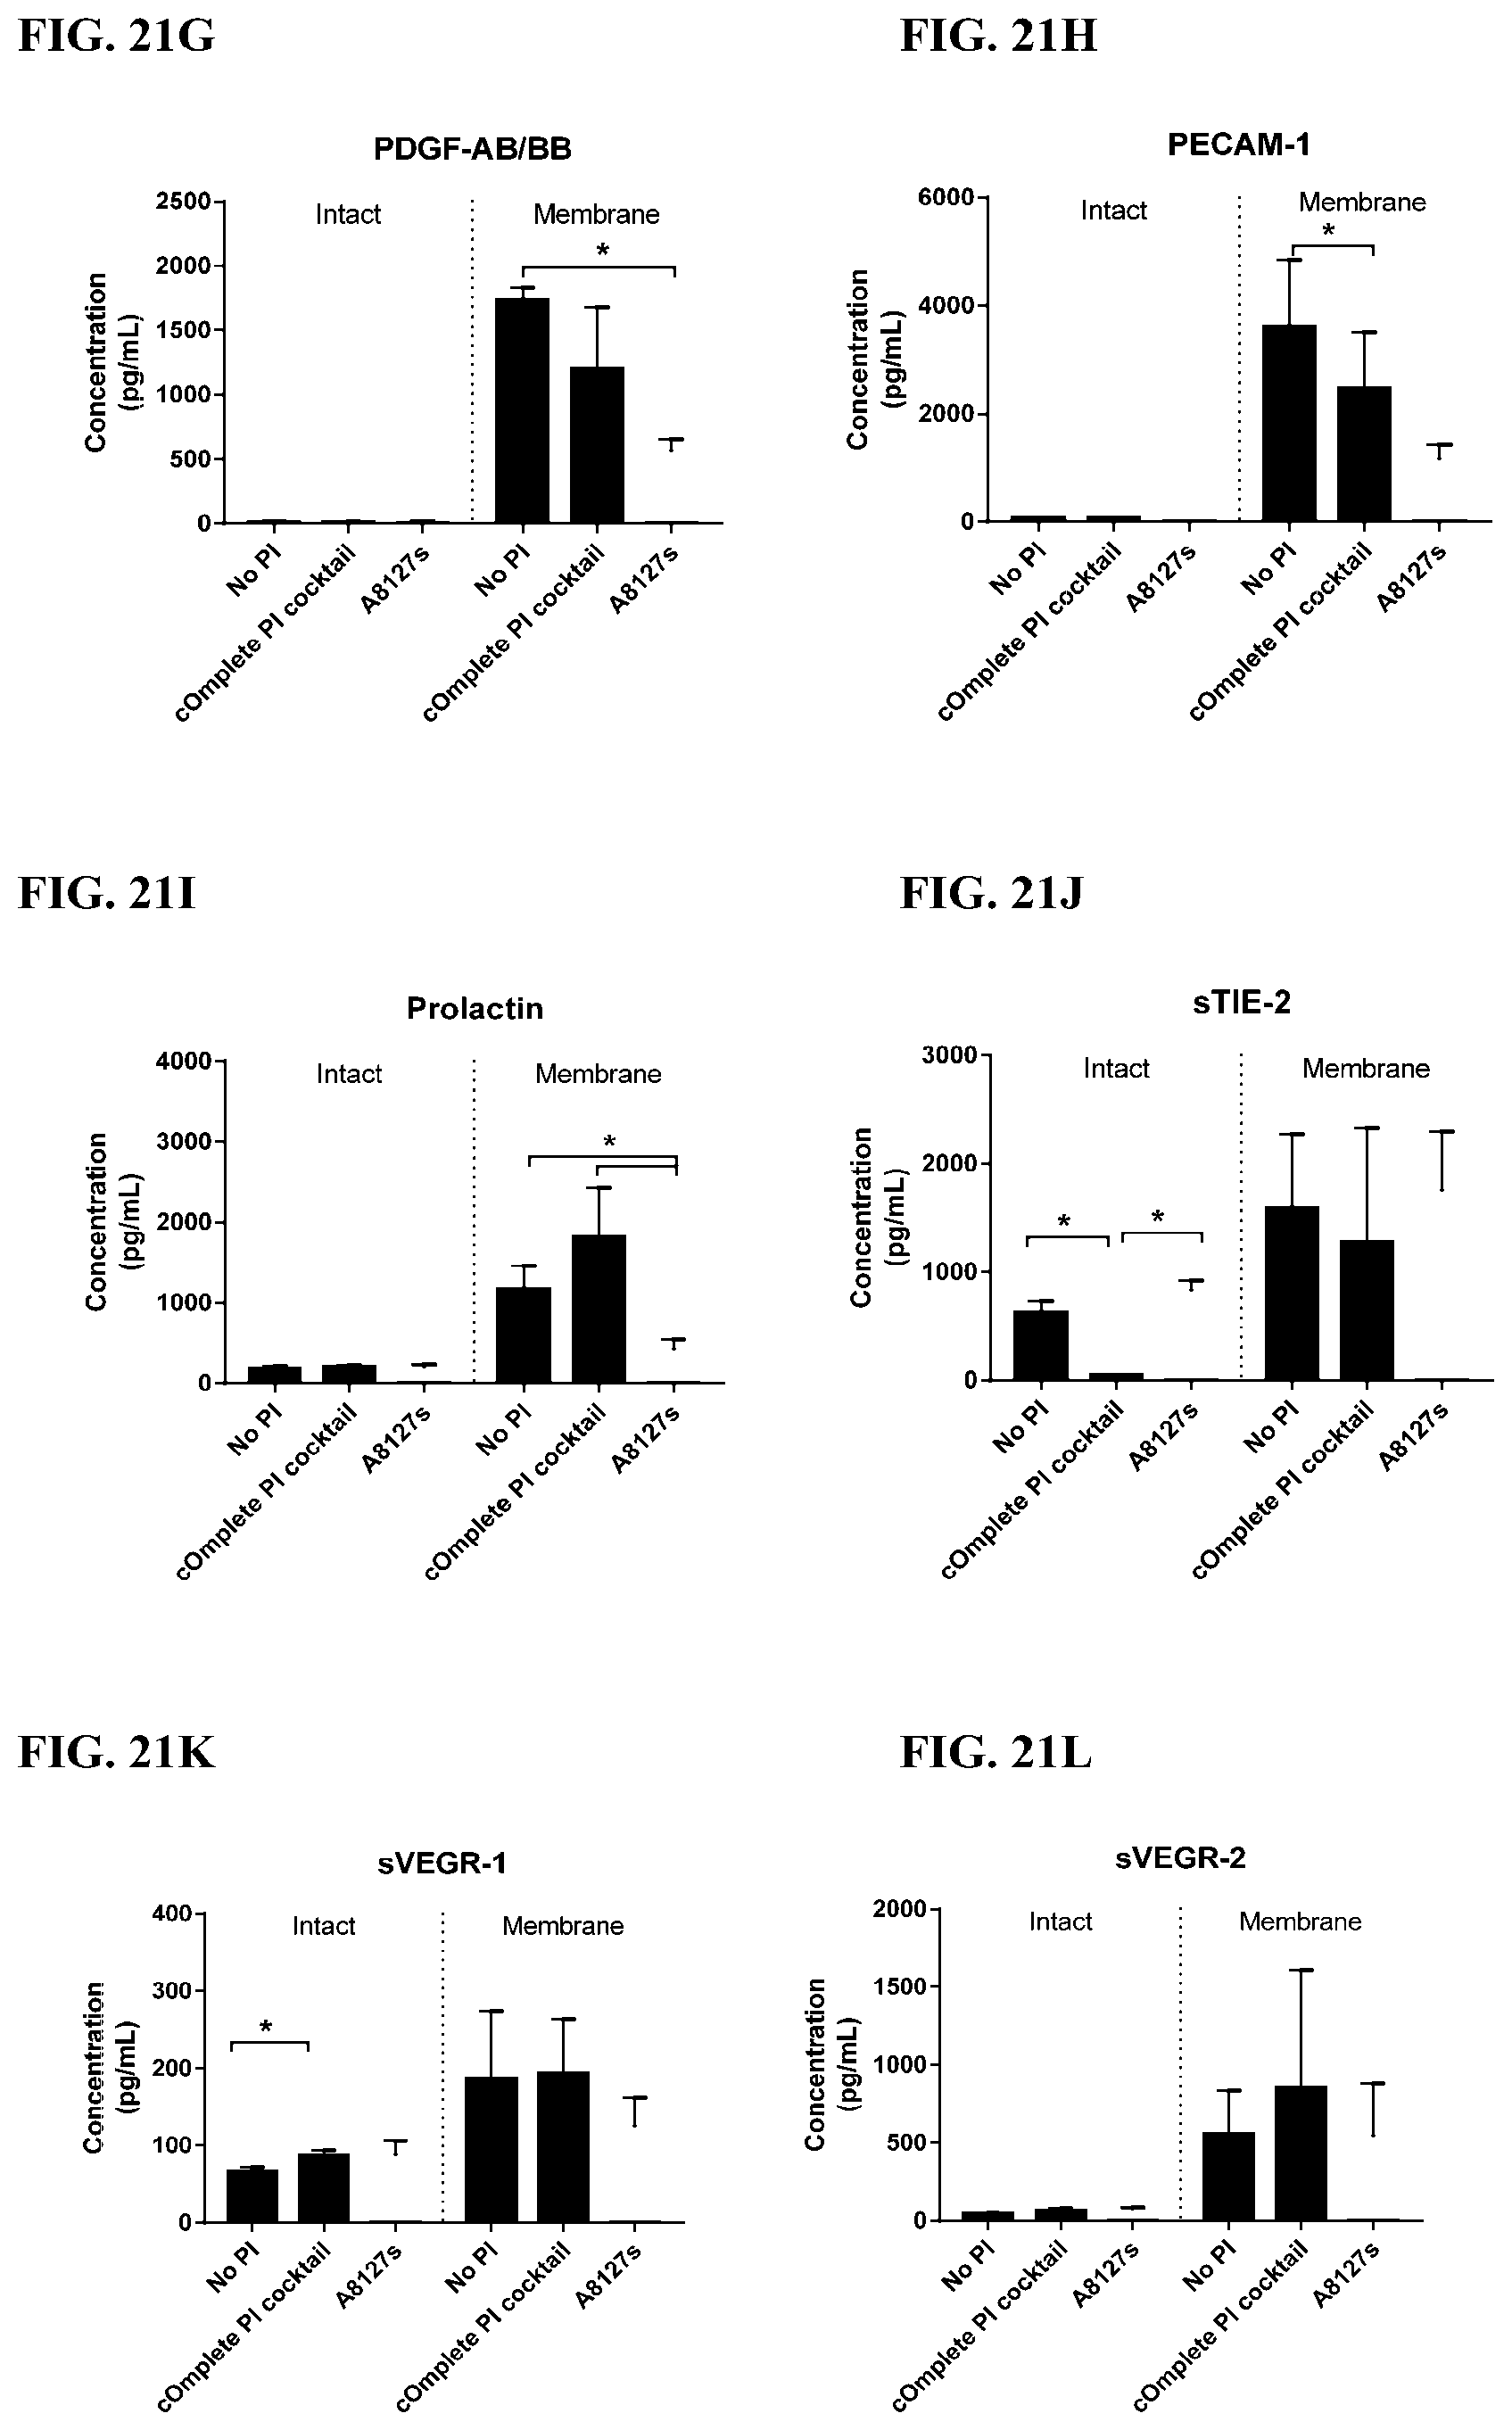
D00140

D00141

D00142

D00143

D00144

D00145

D00146
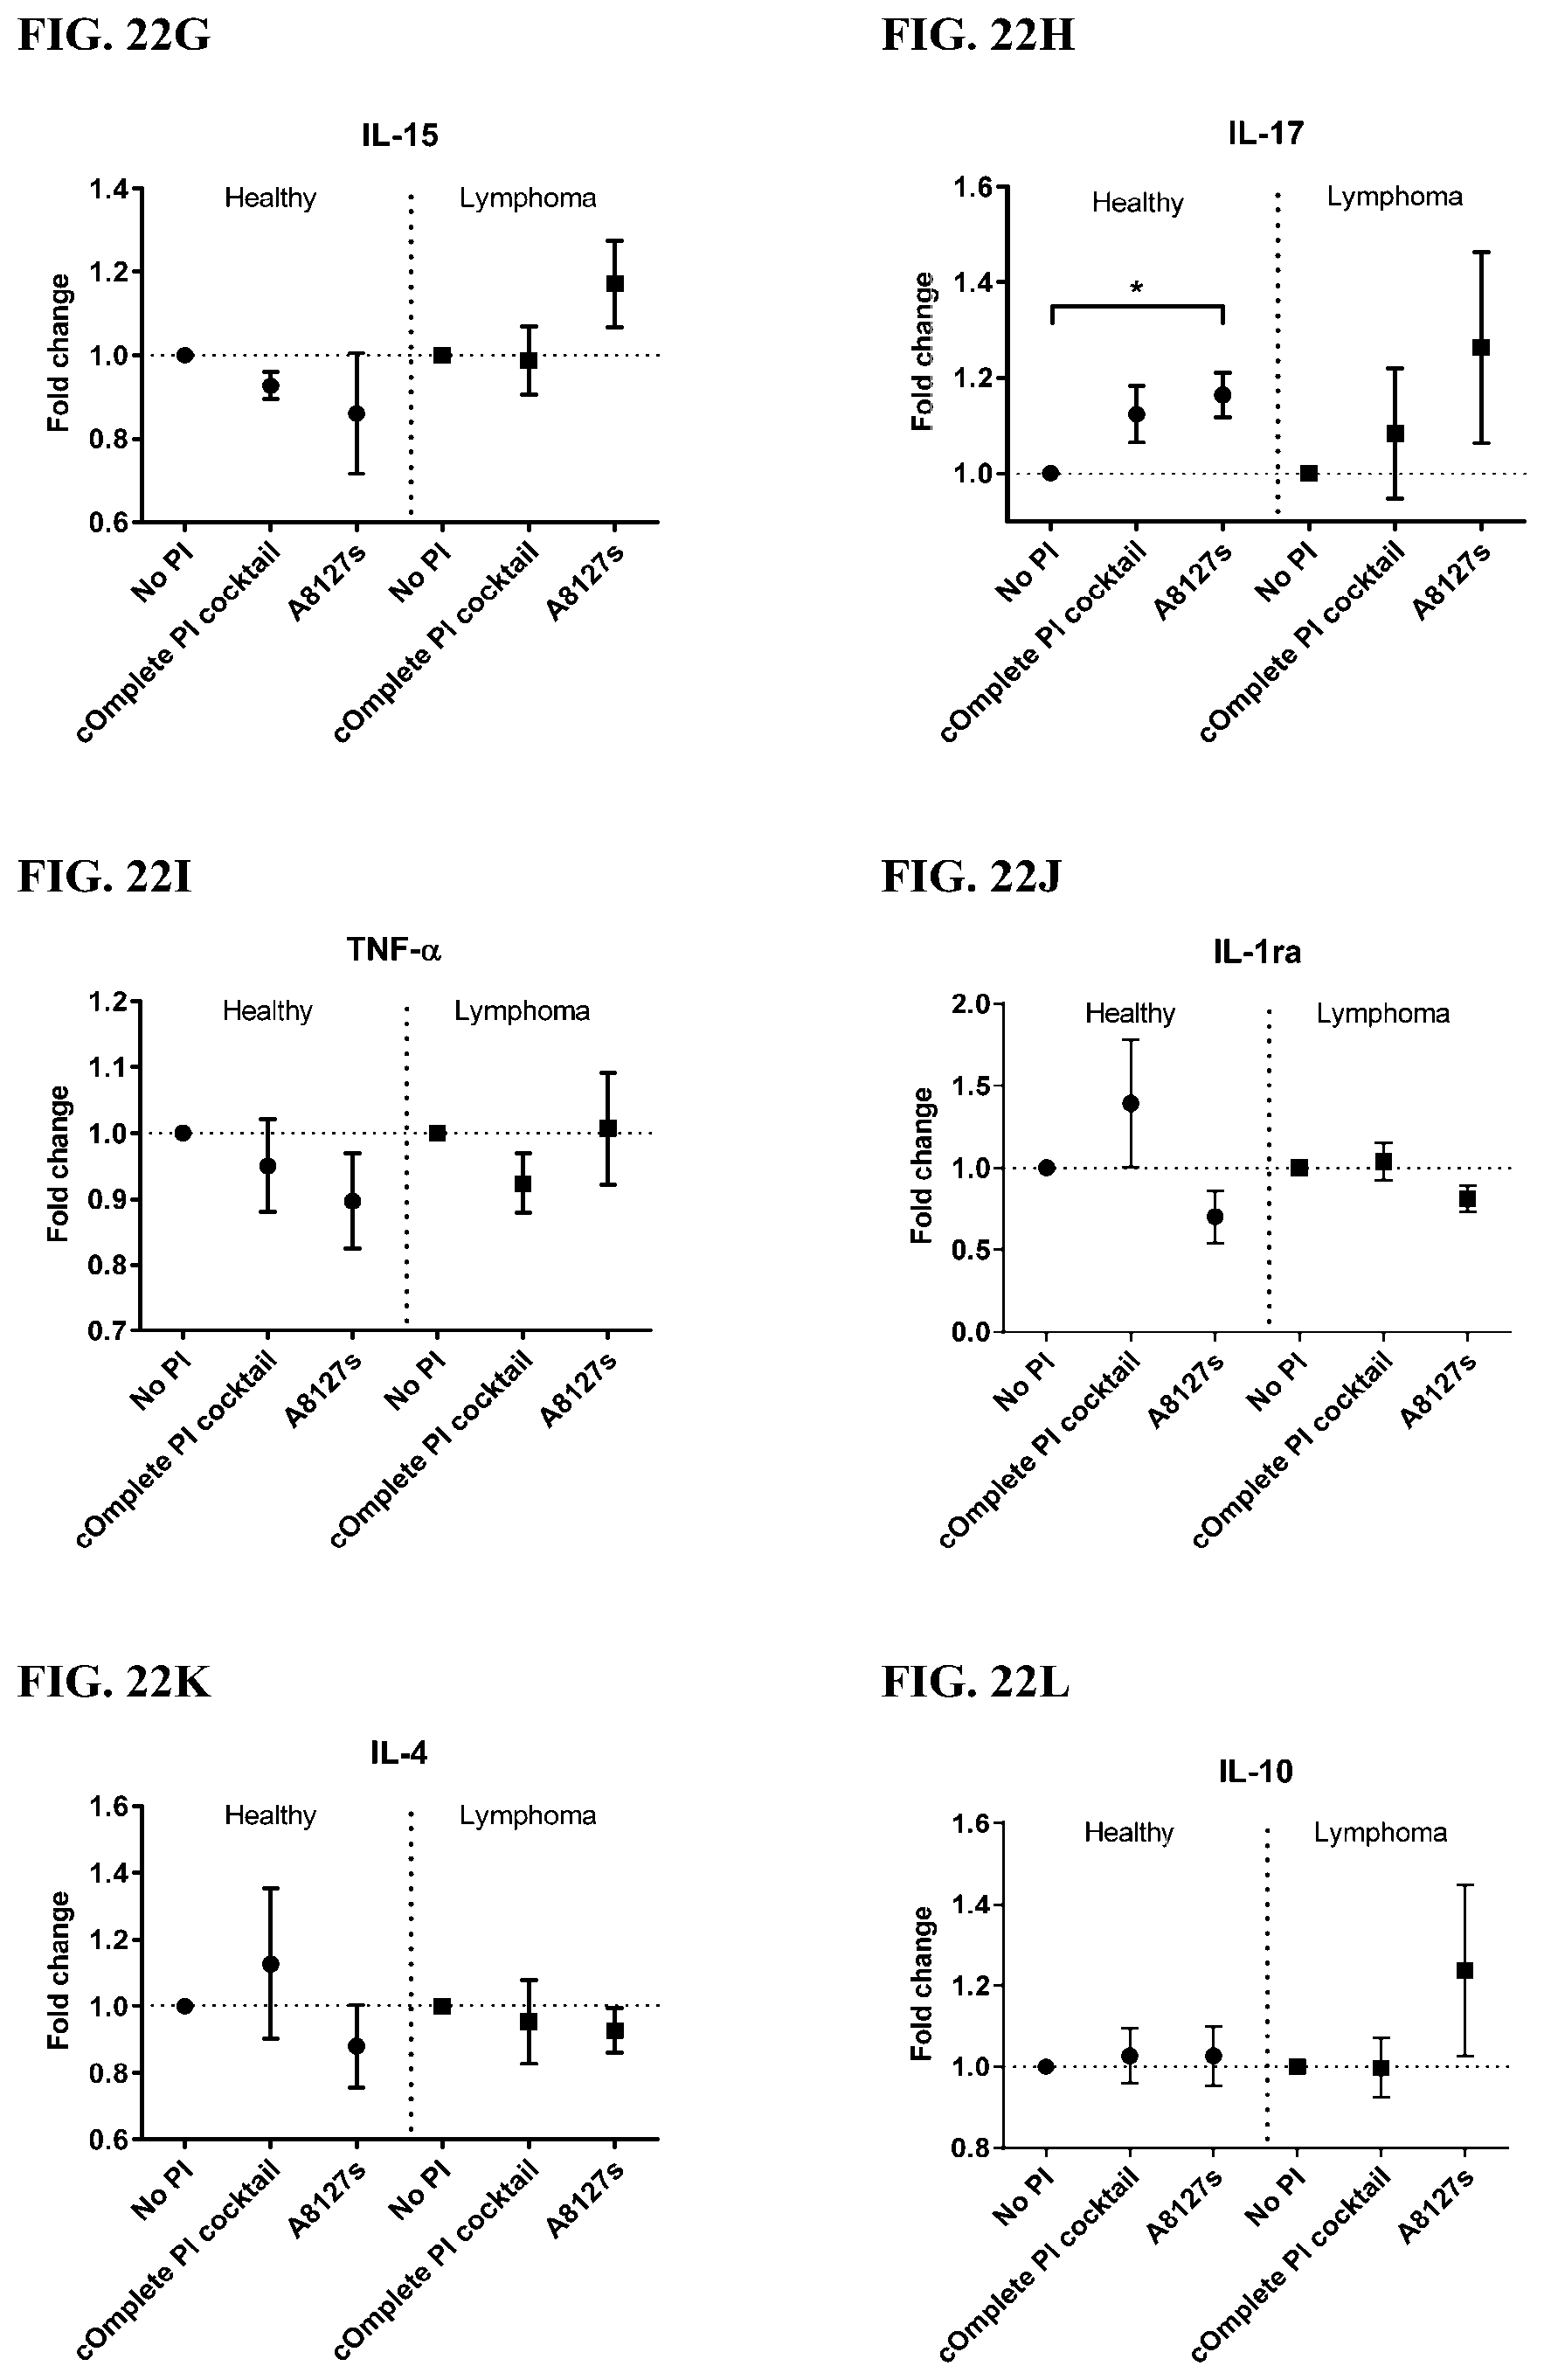
D00147

D00148

D00149

D00150

D00151
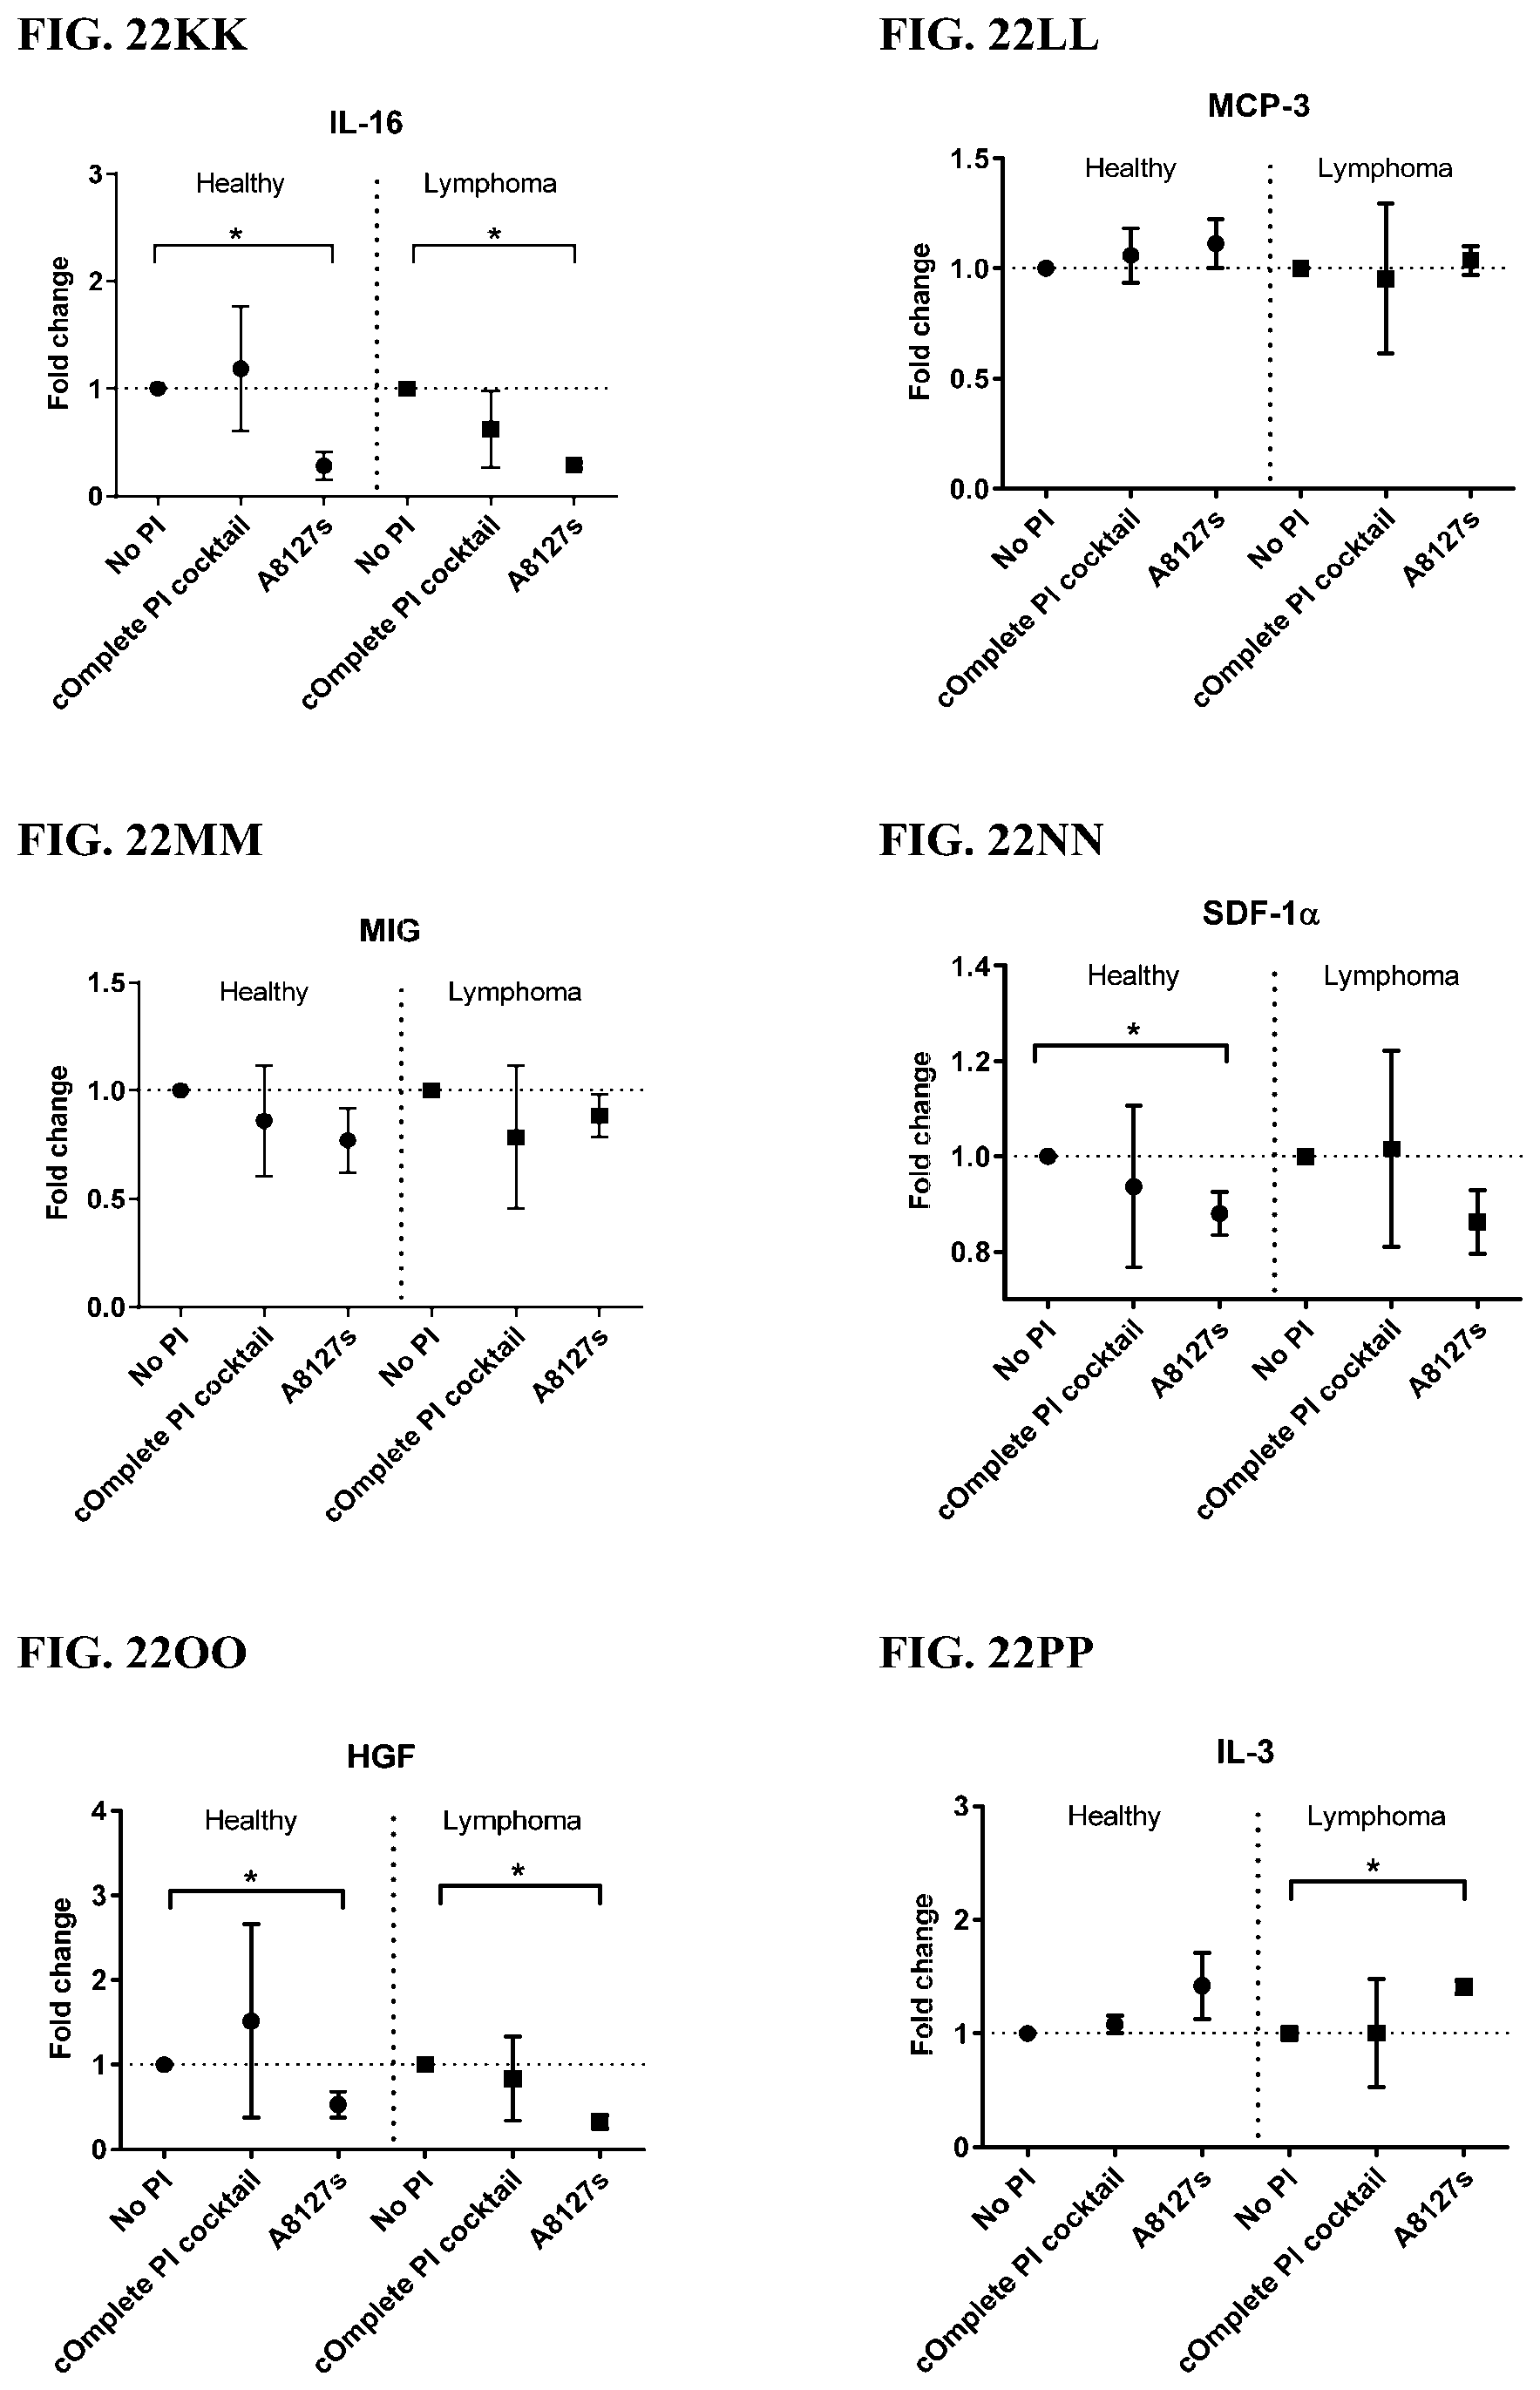
D00152

D00153

D00154
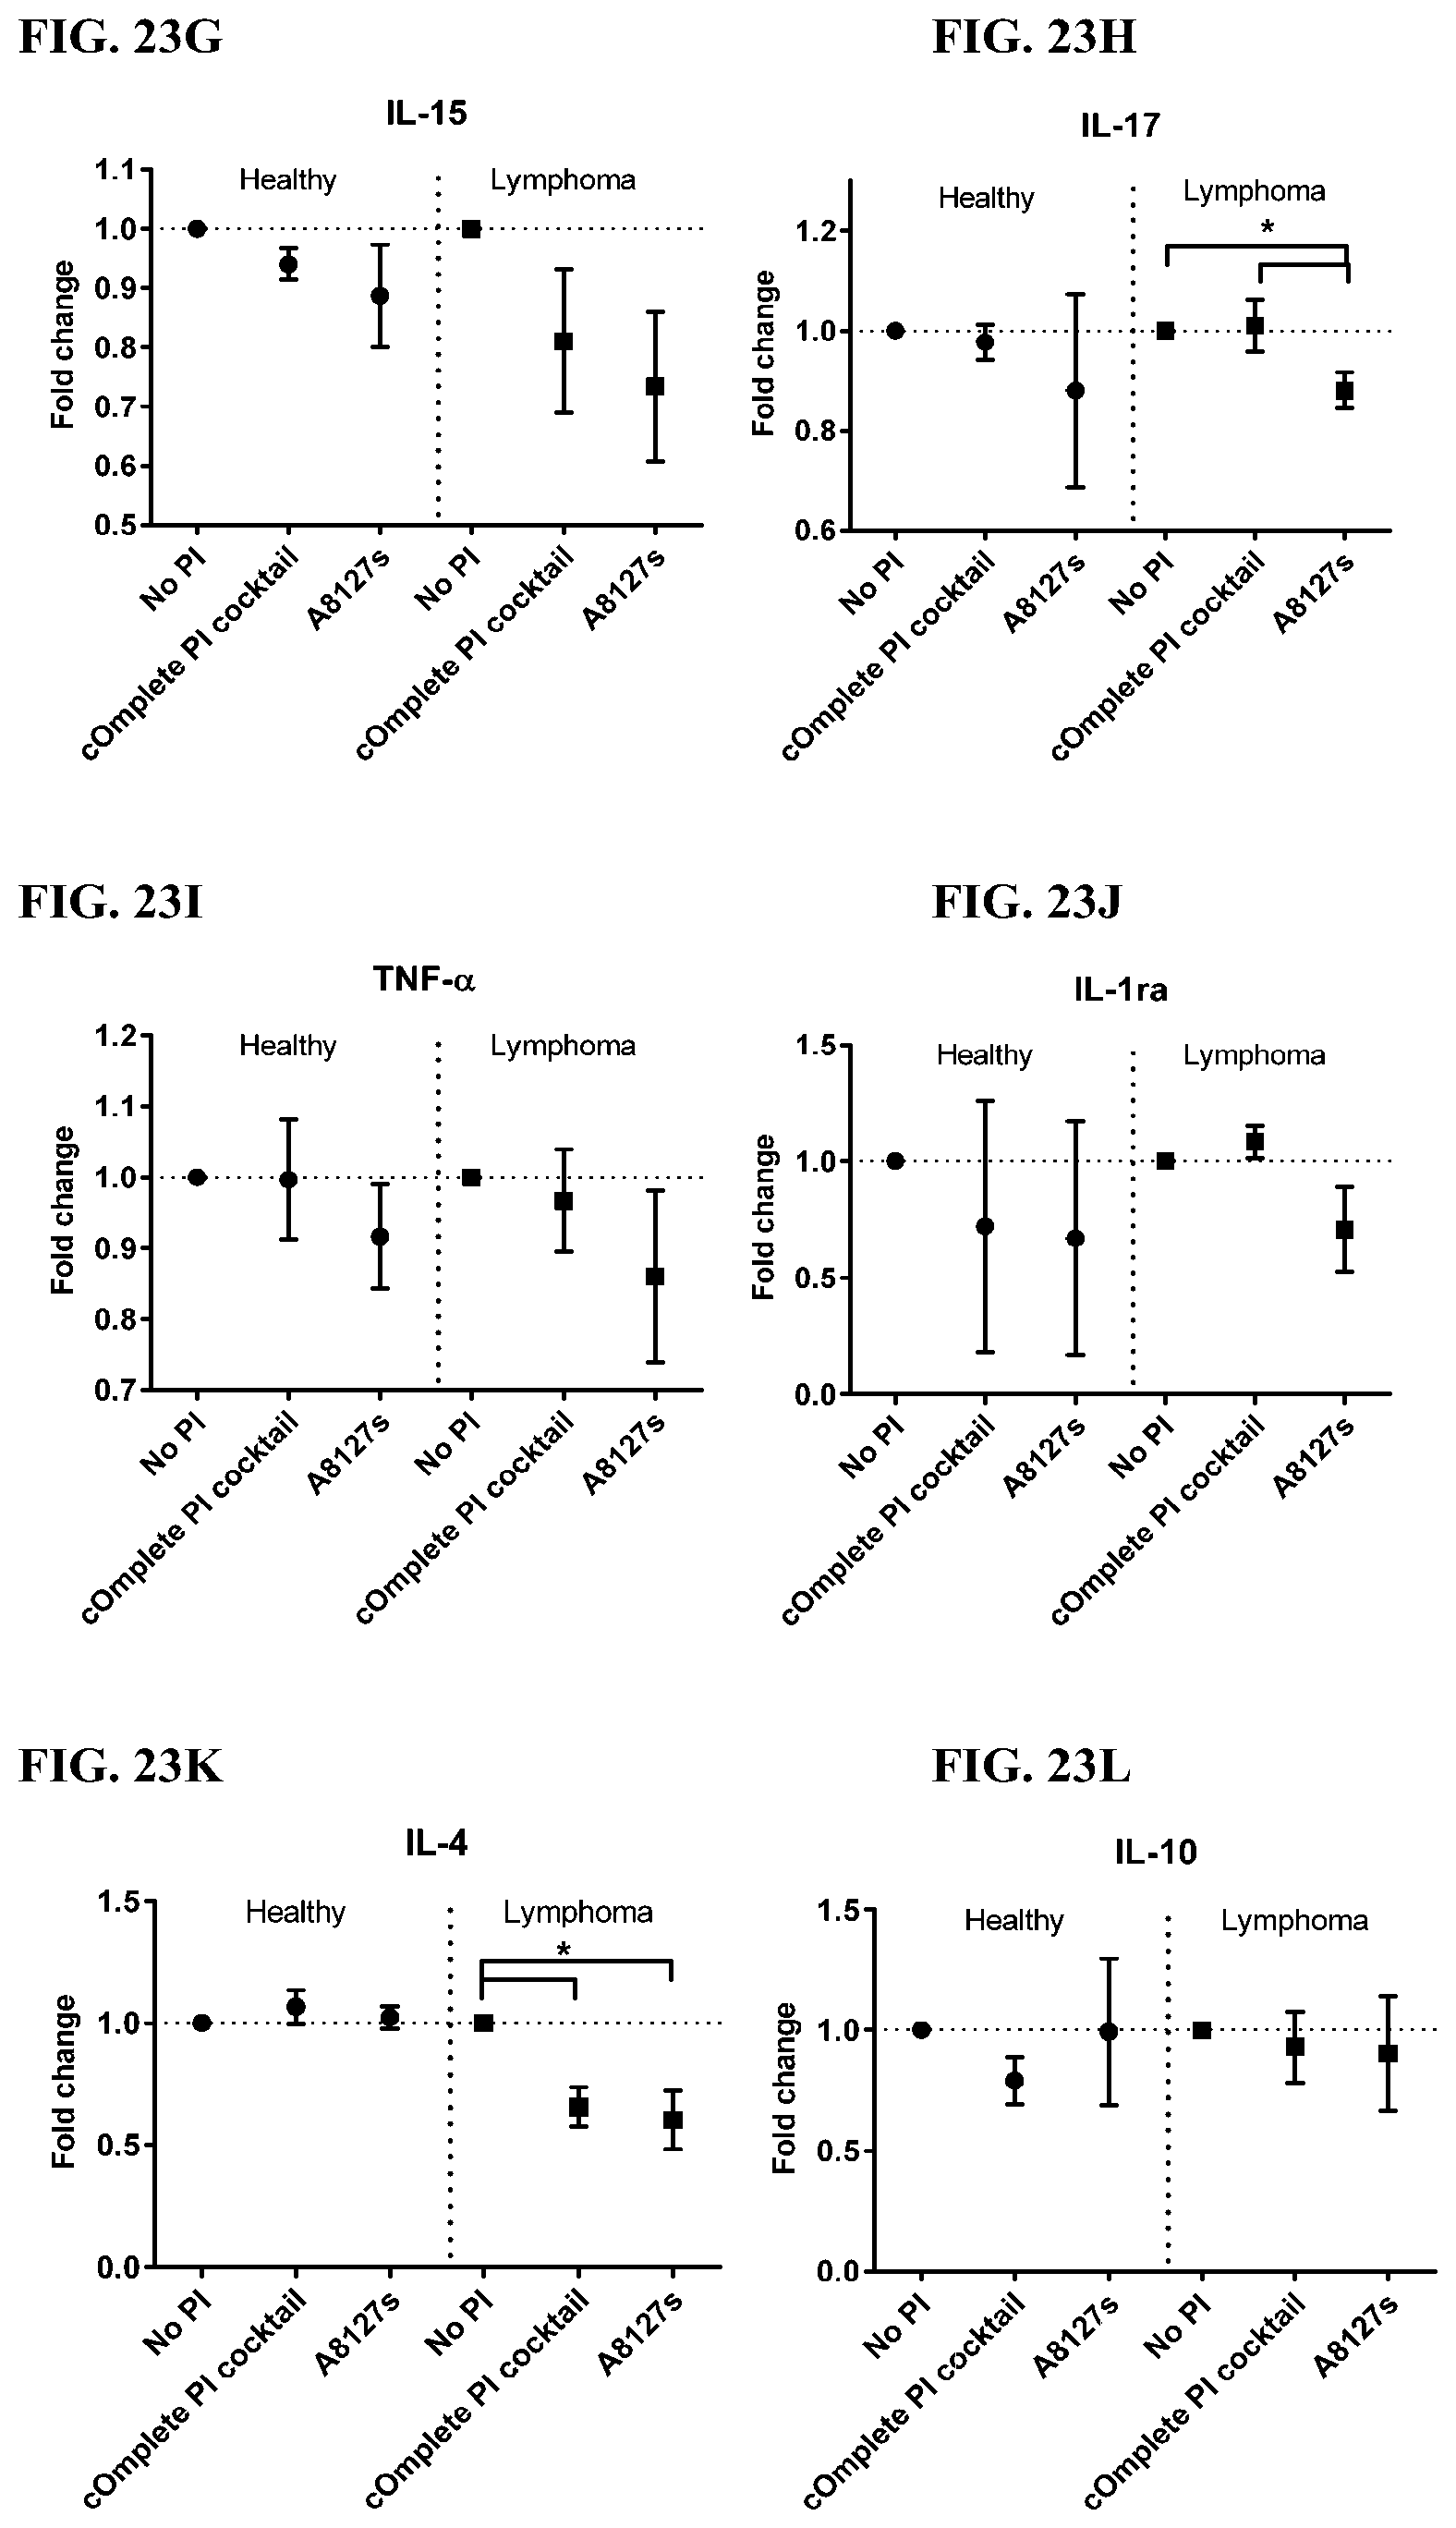
D00155

D00156

D00157
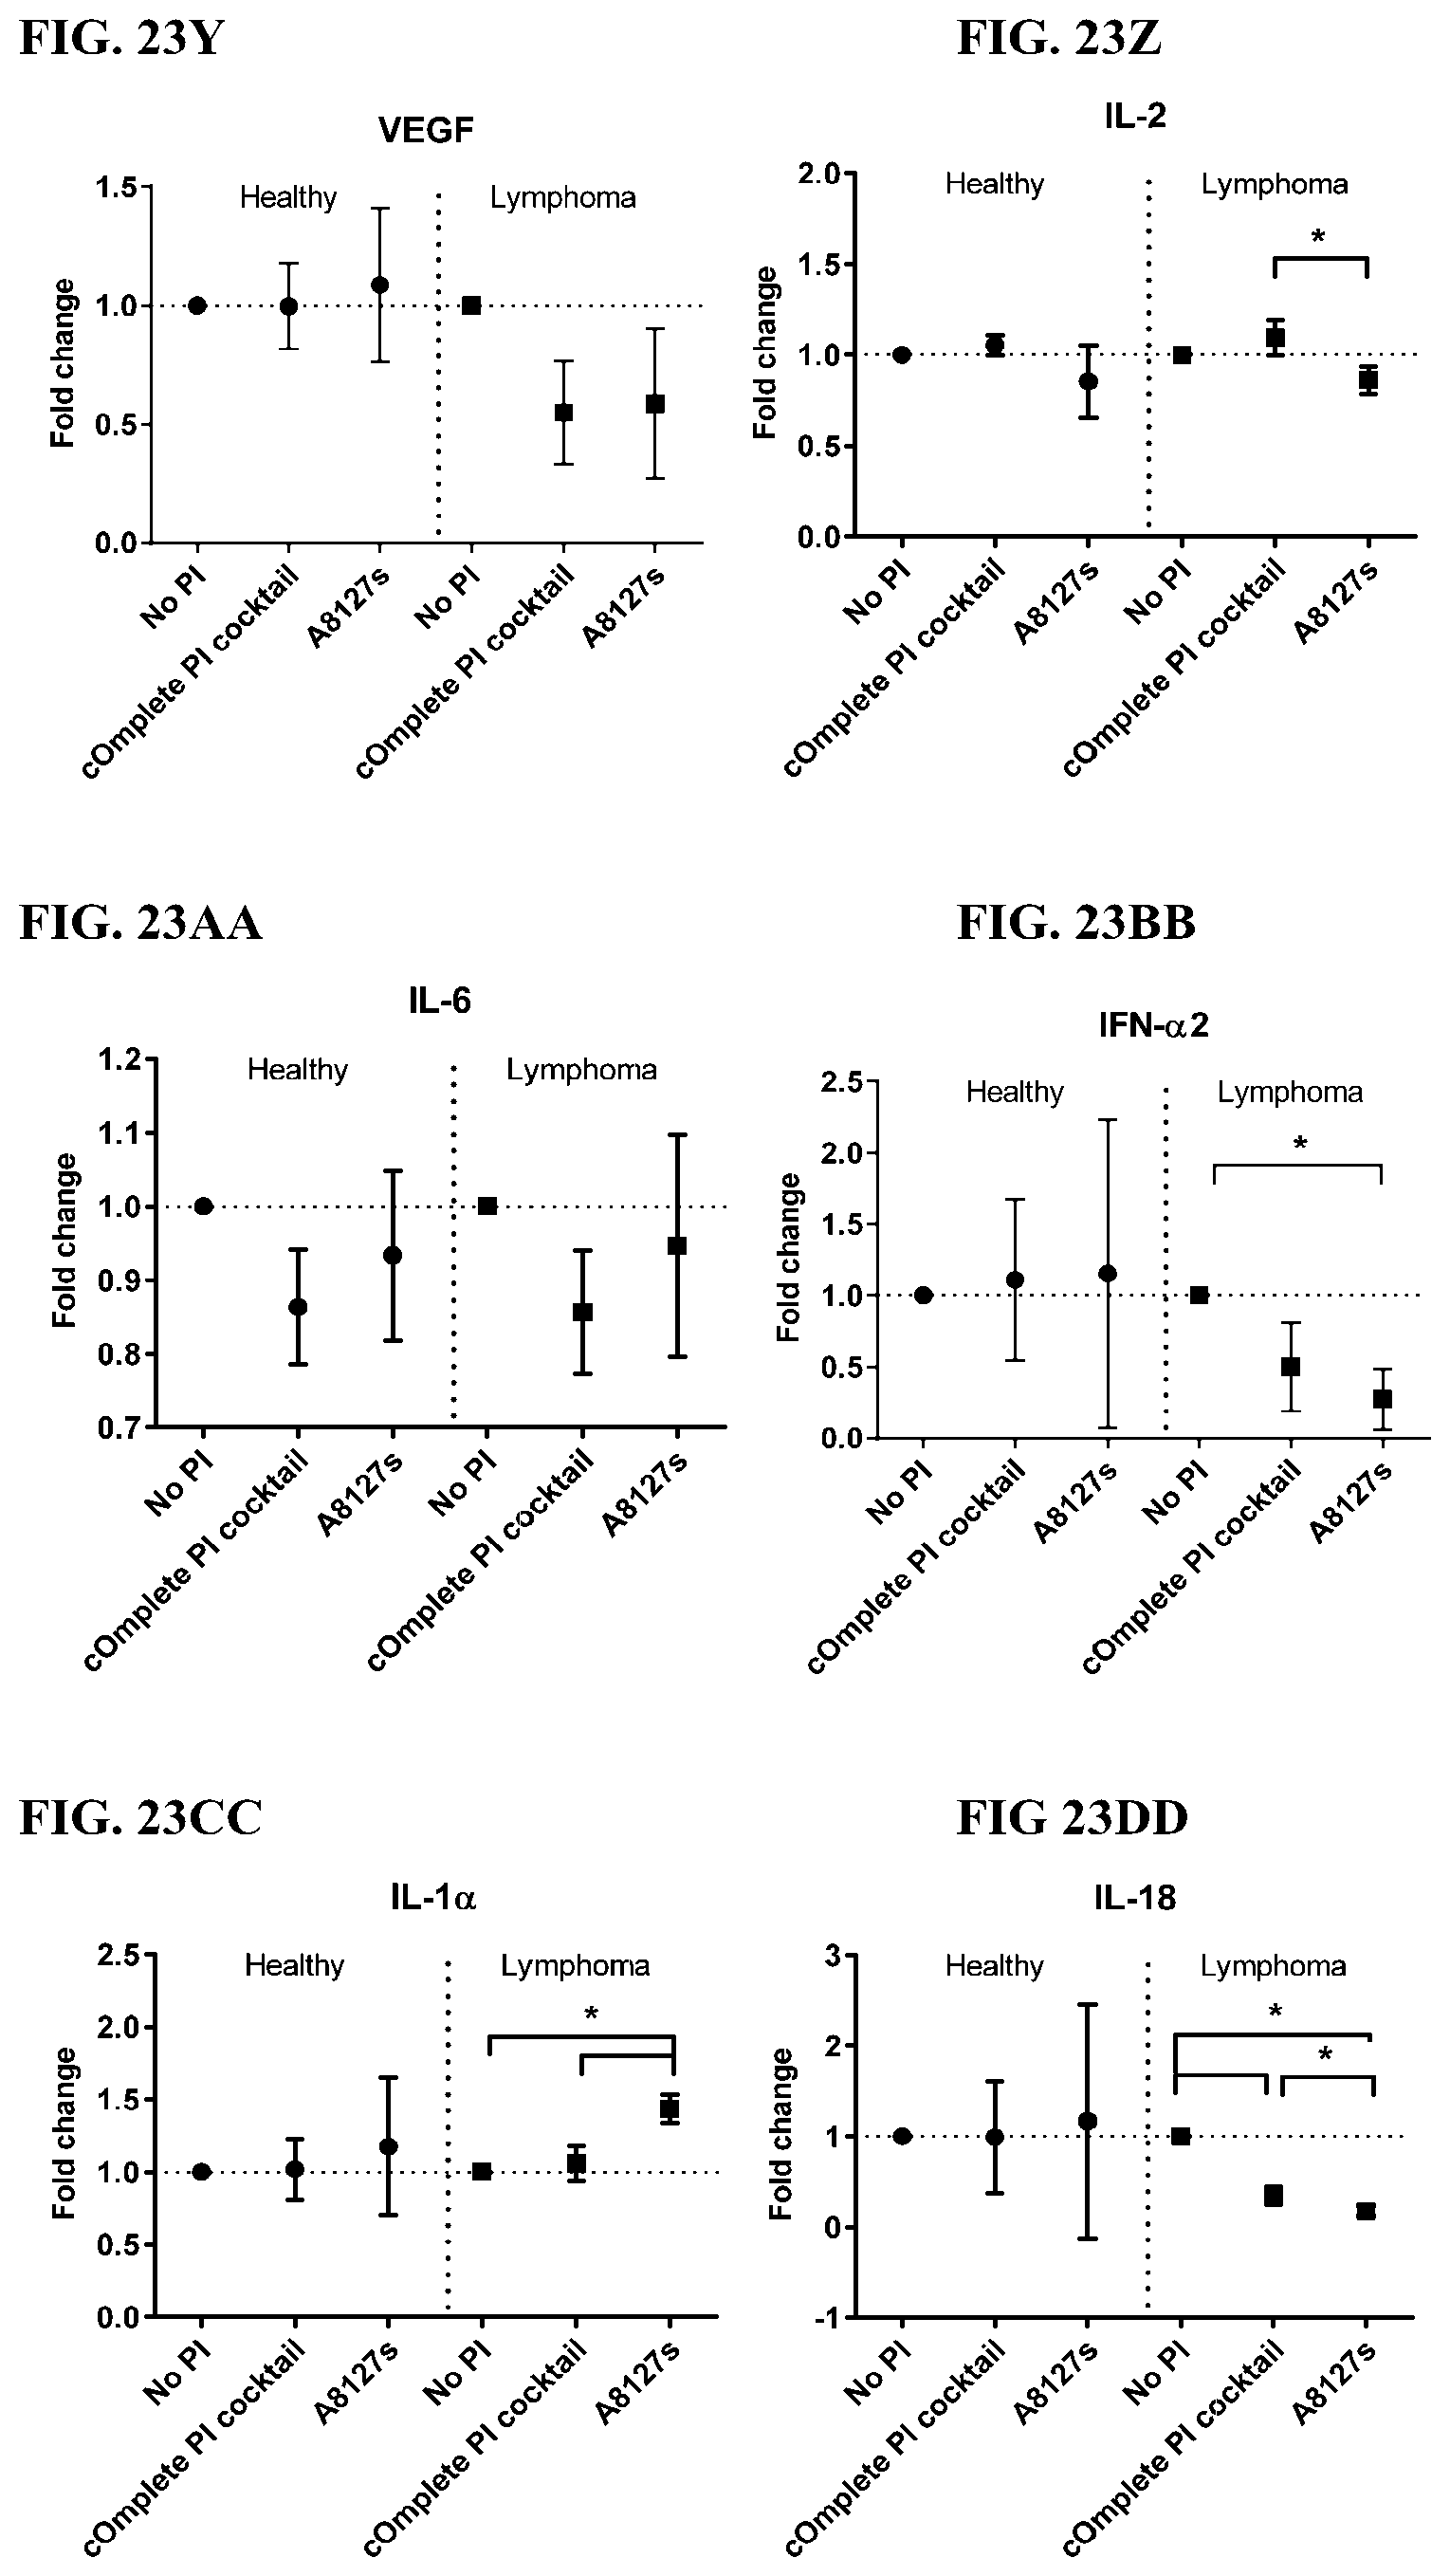
D00158

D00159
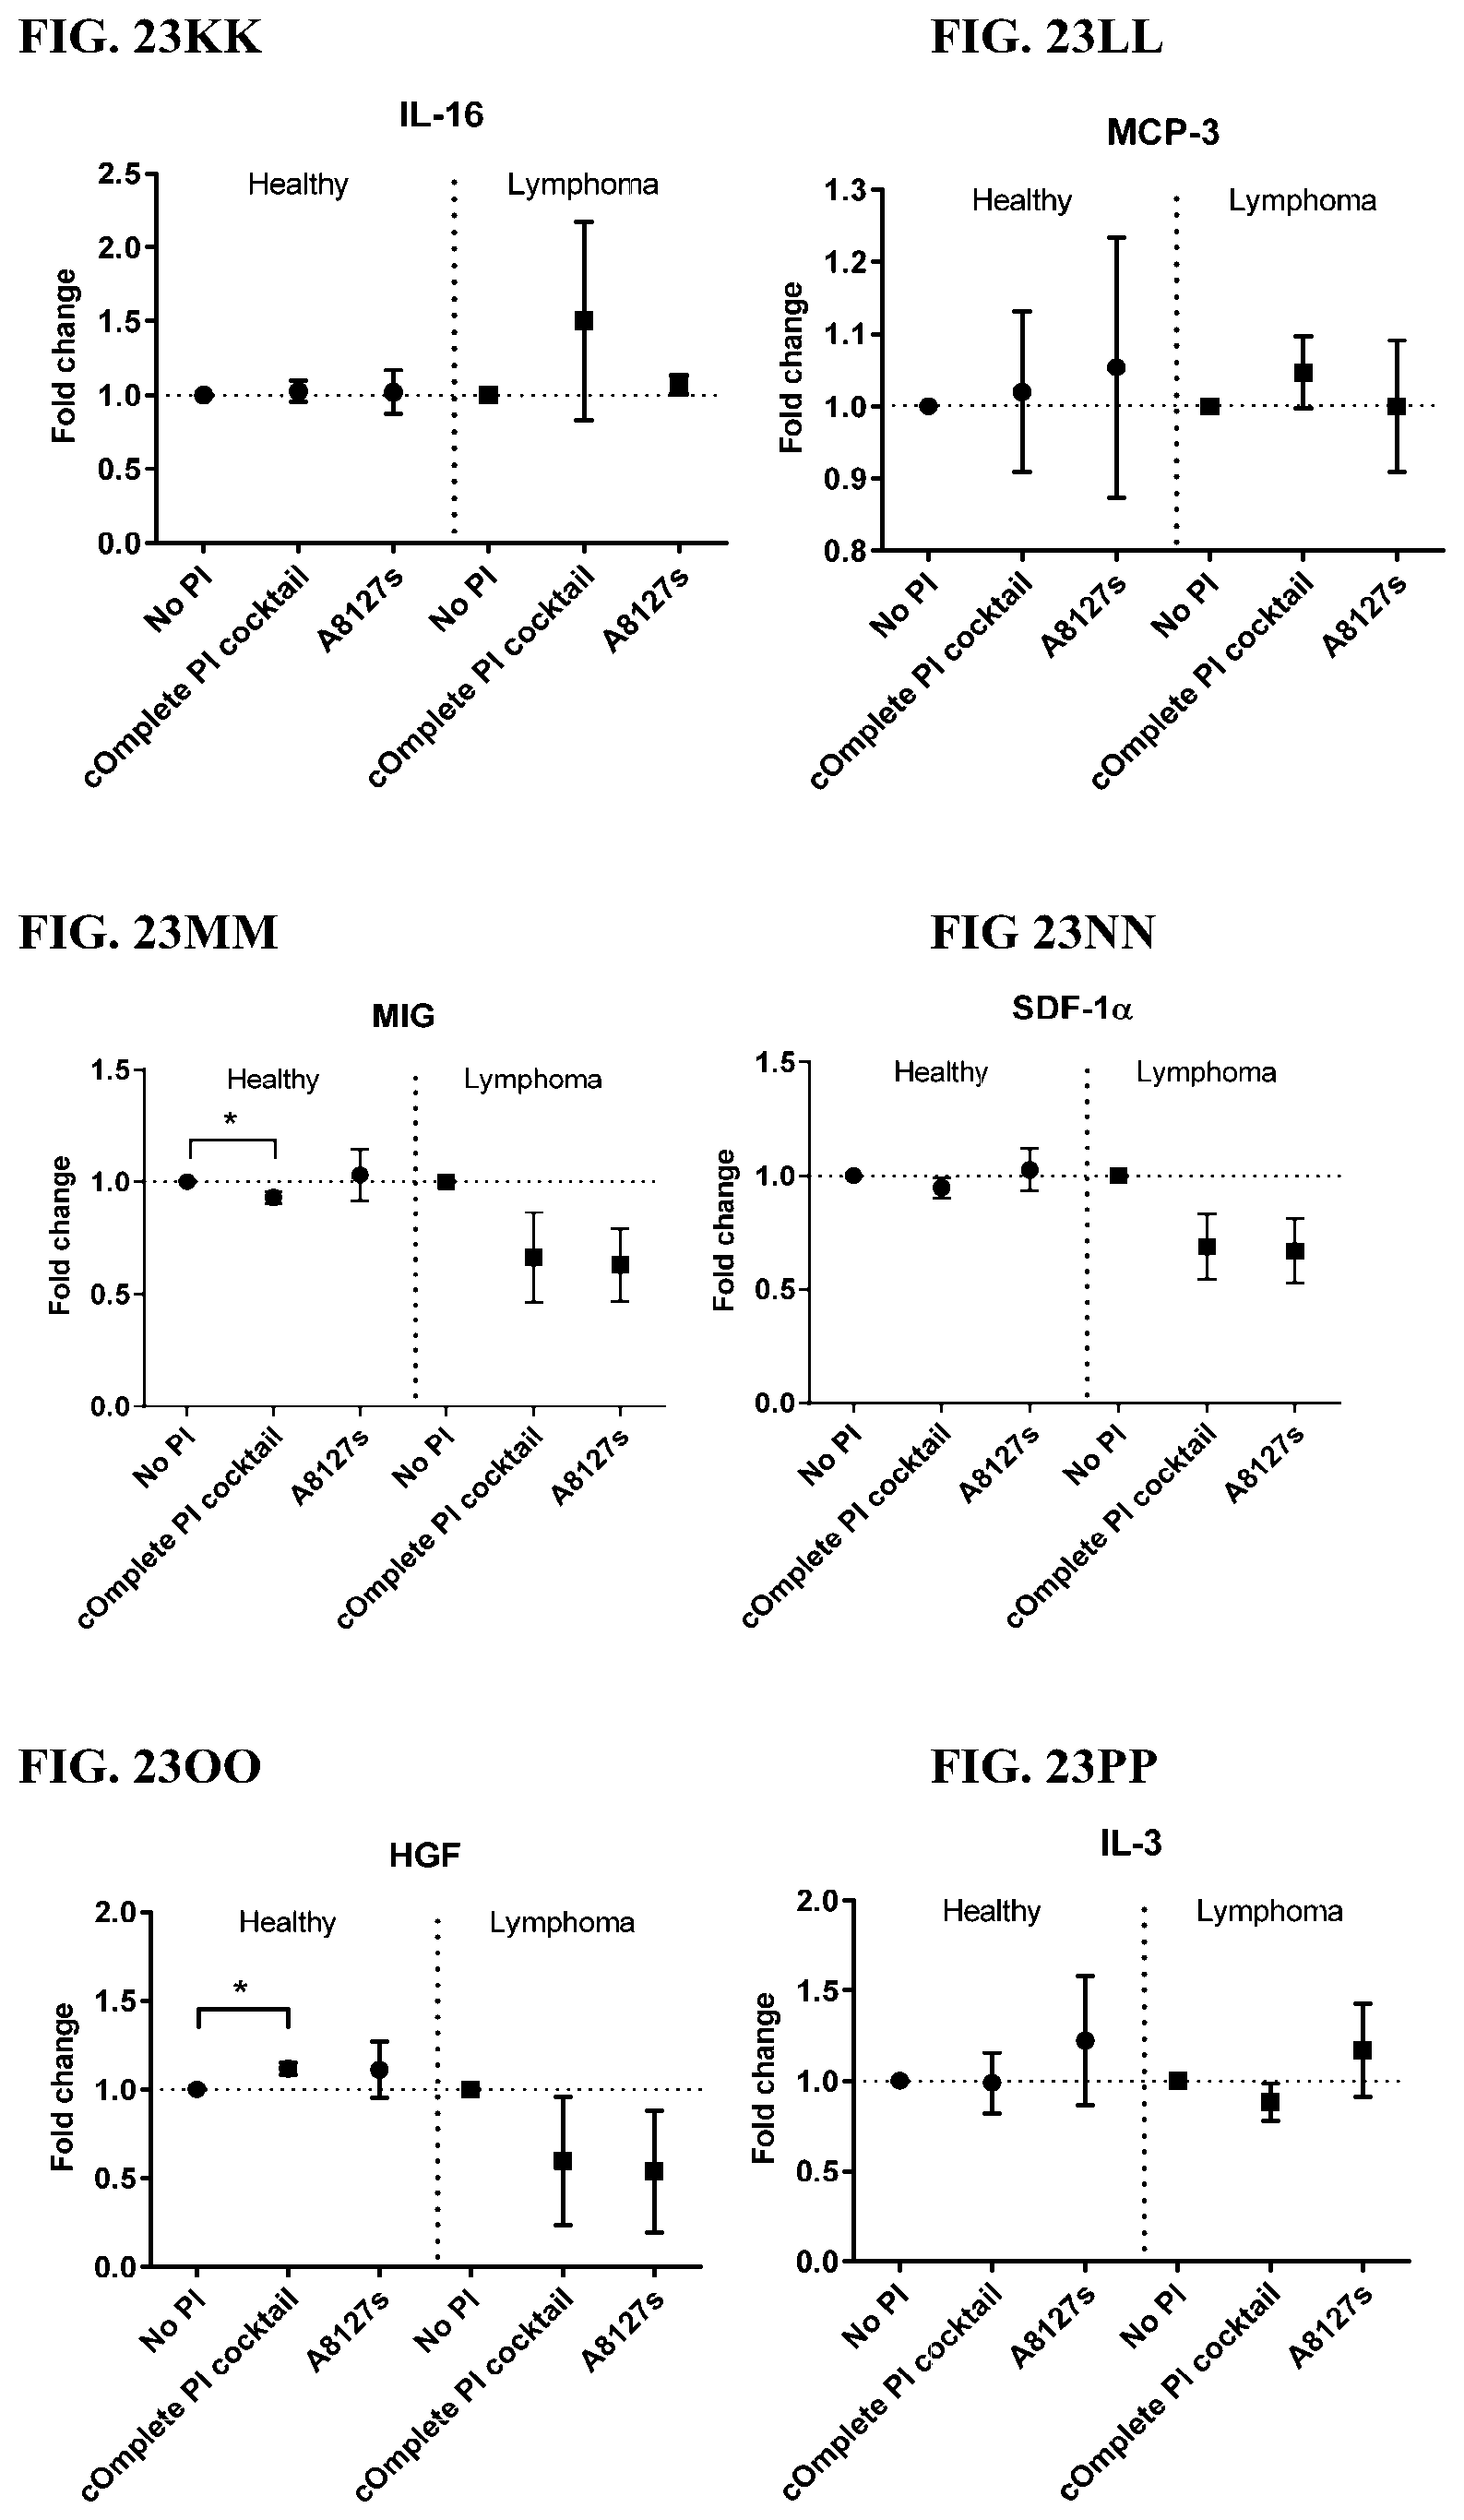
D00160

D00161

D00162

D00163
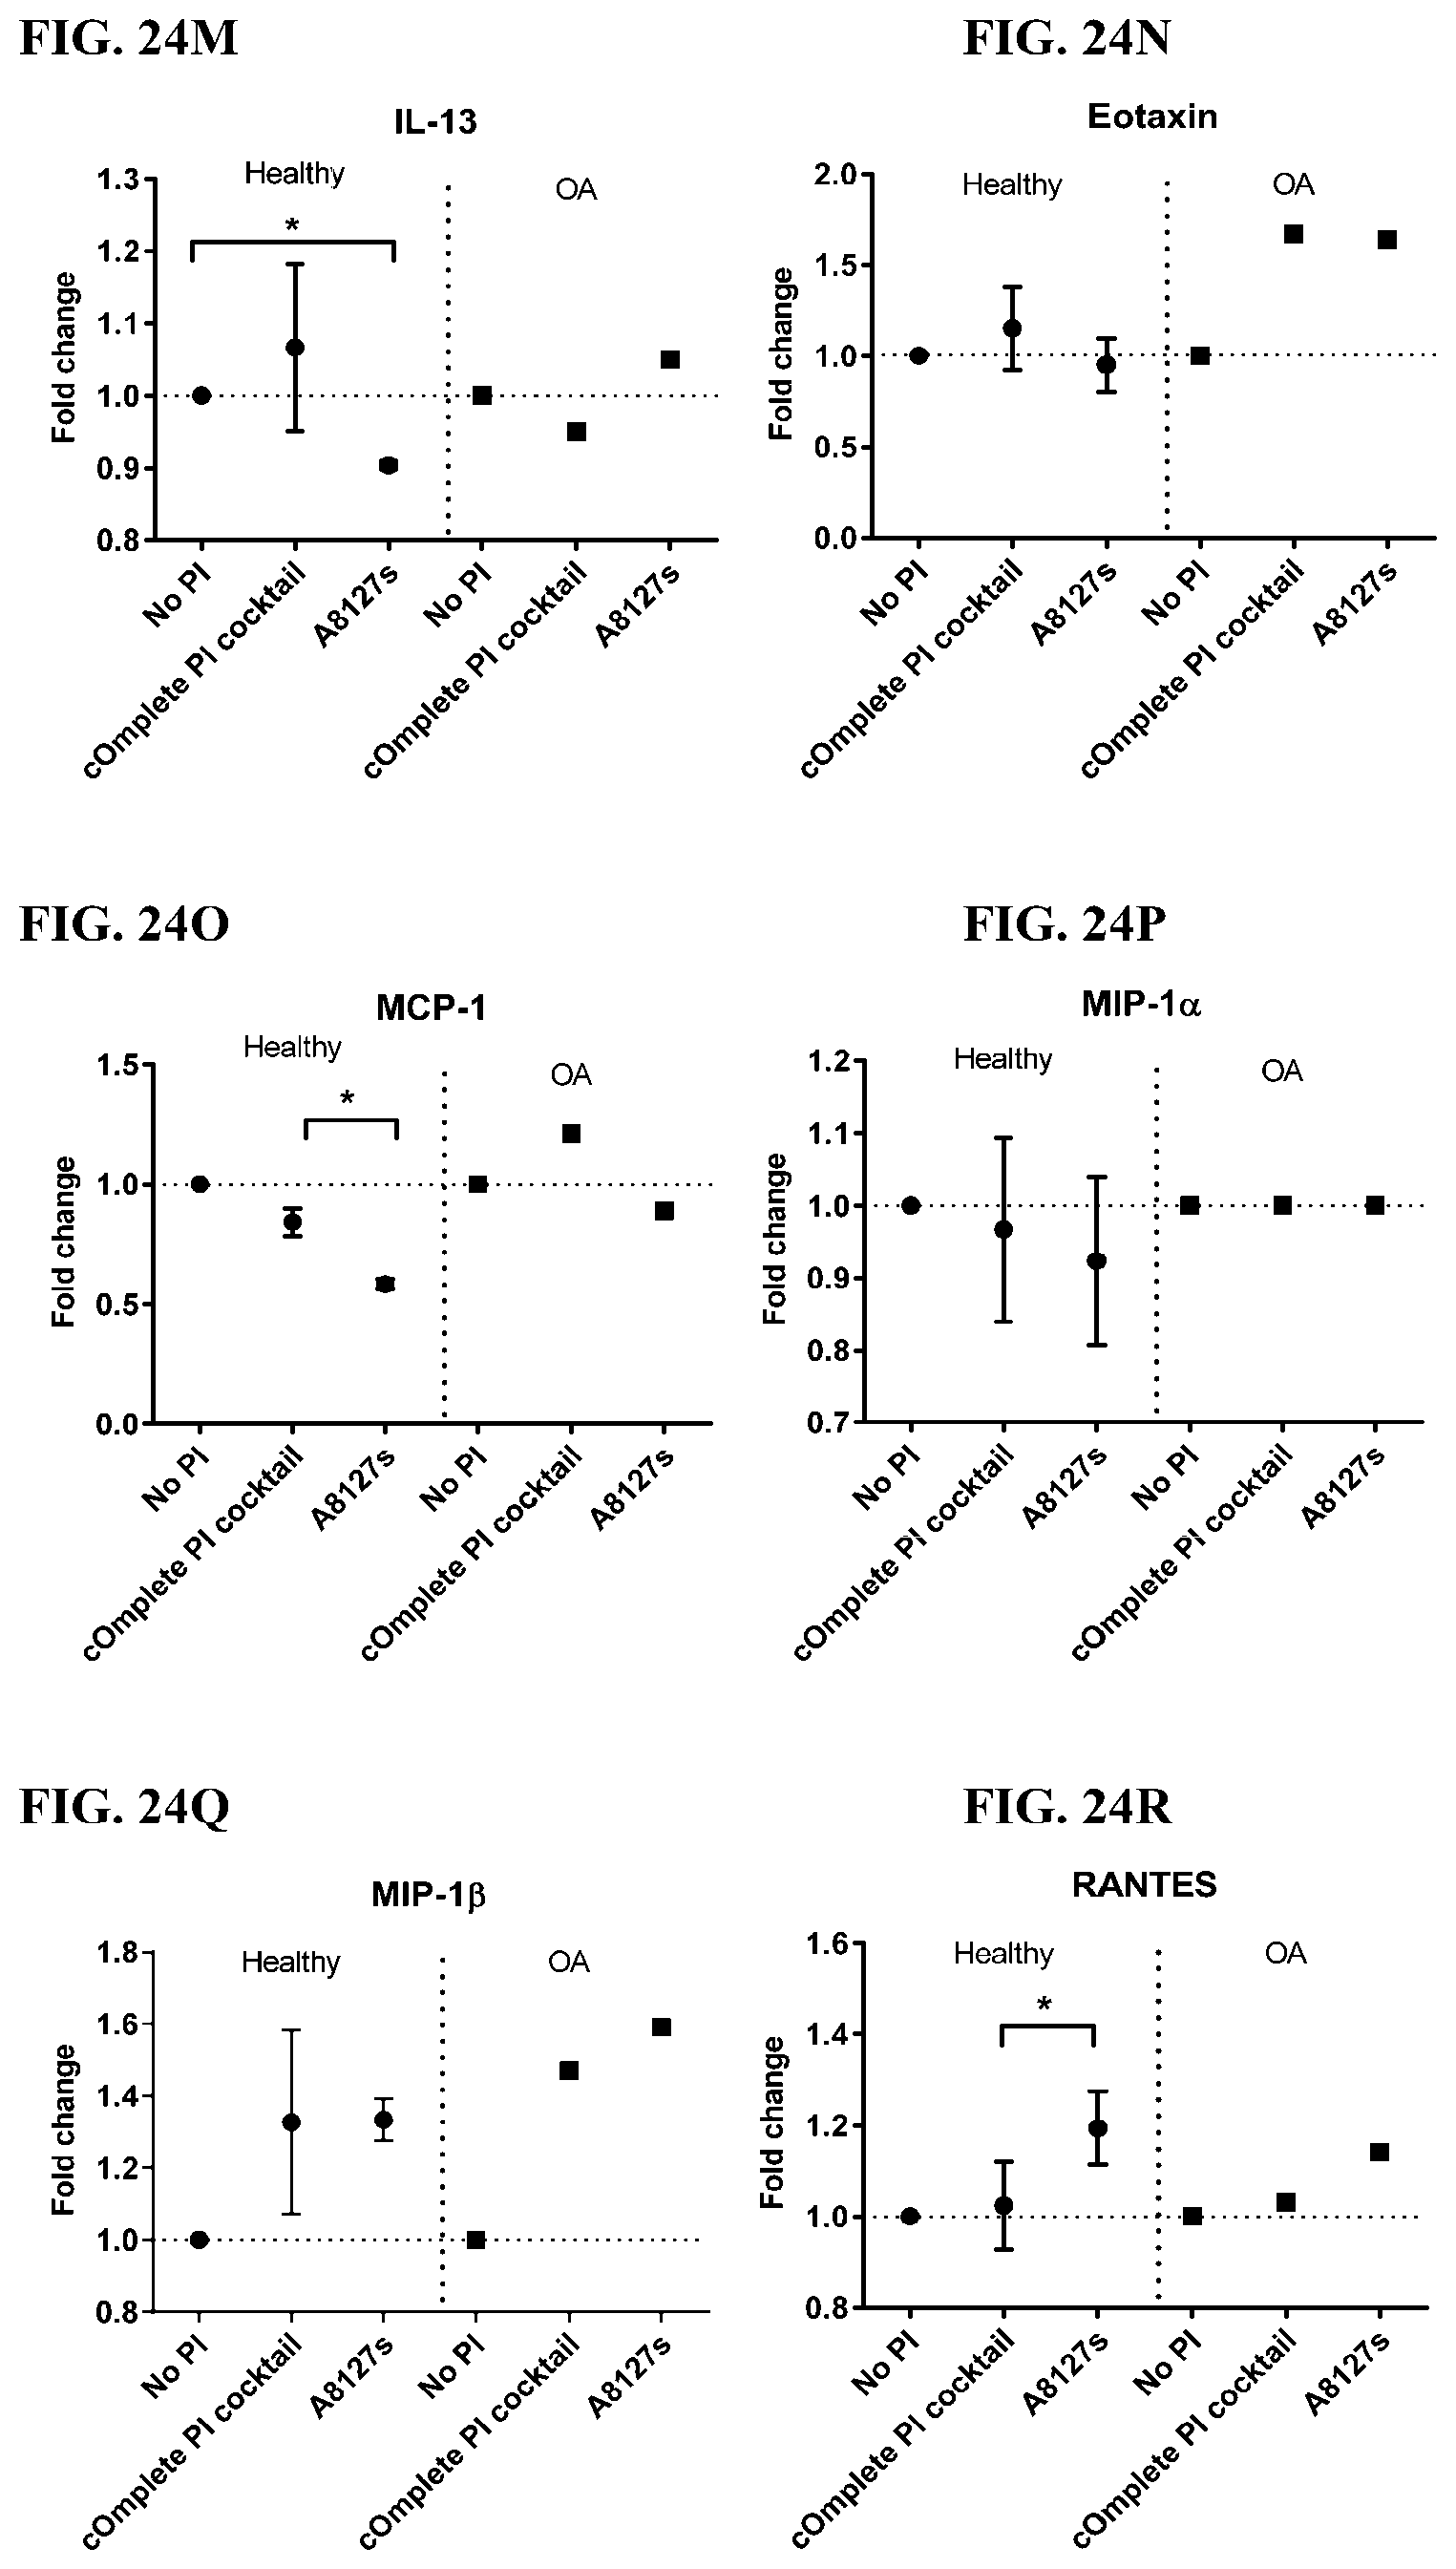
D00164

D00165

D00166

D00167

D00168

D00169

D00170
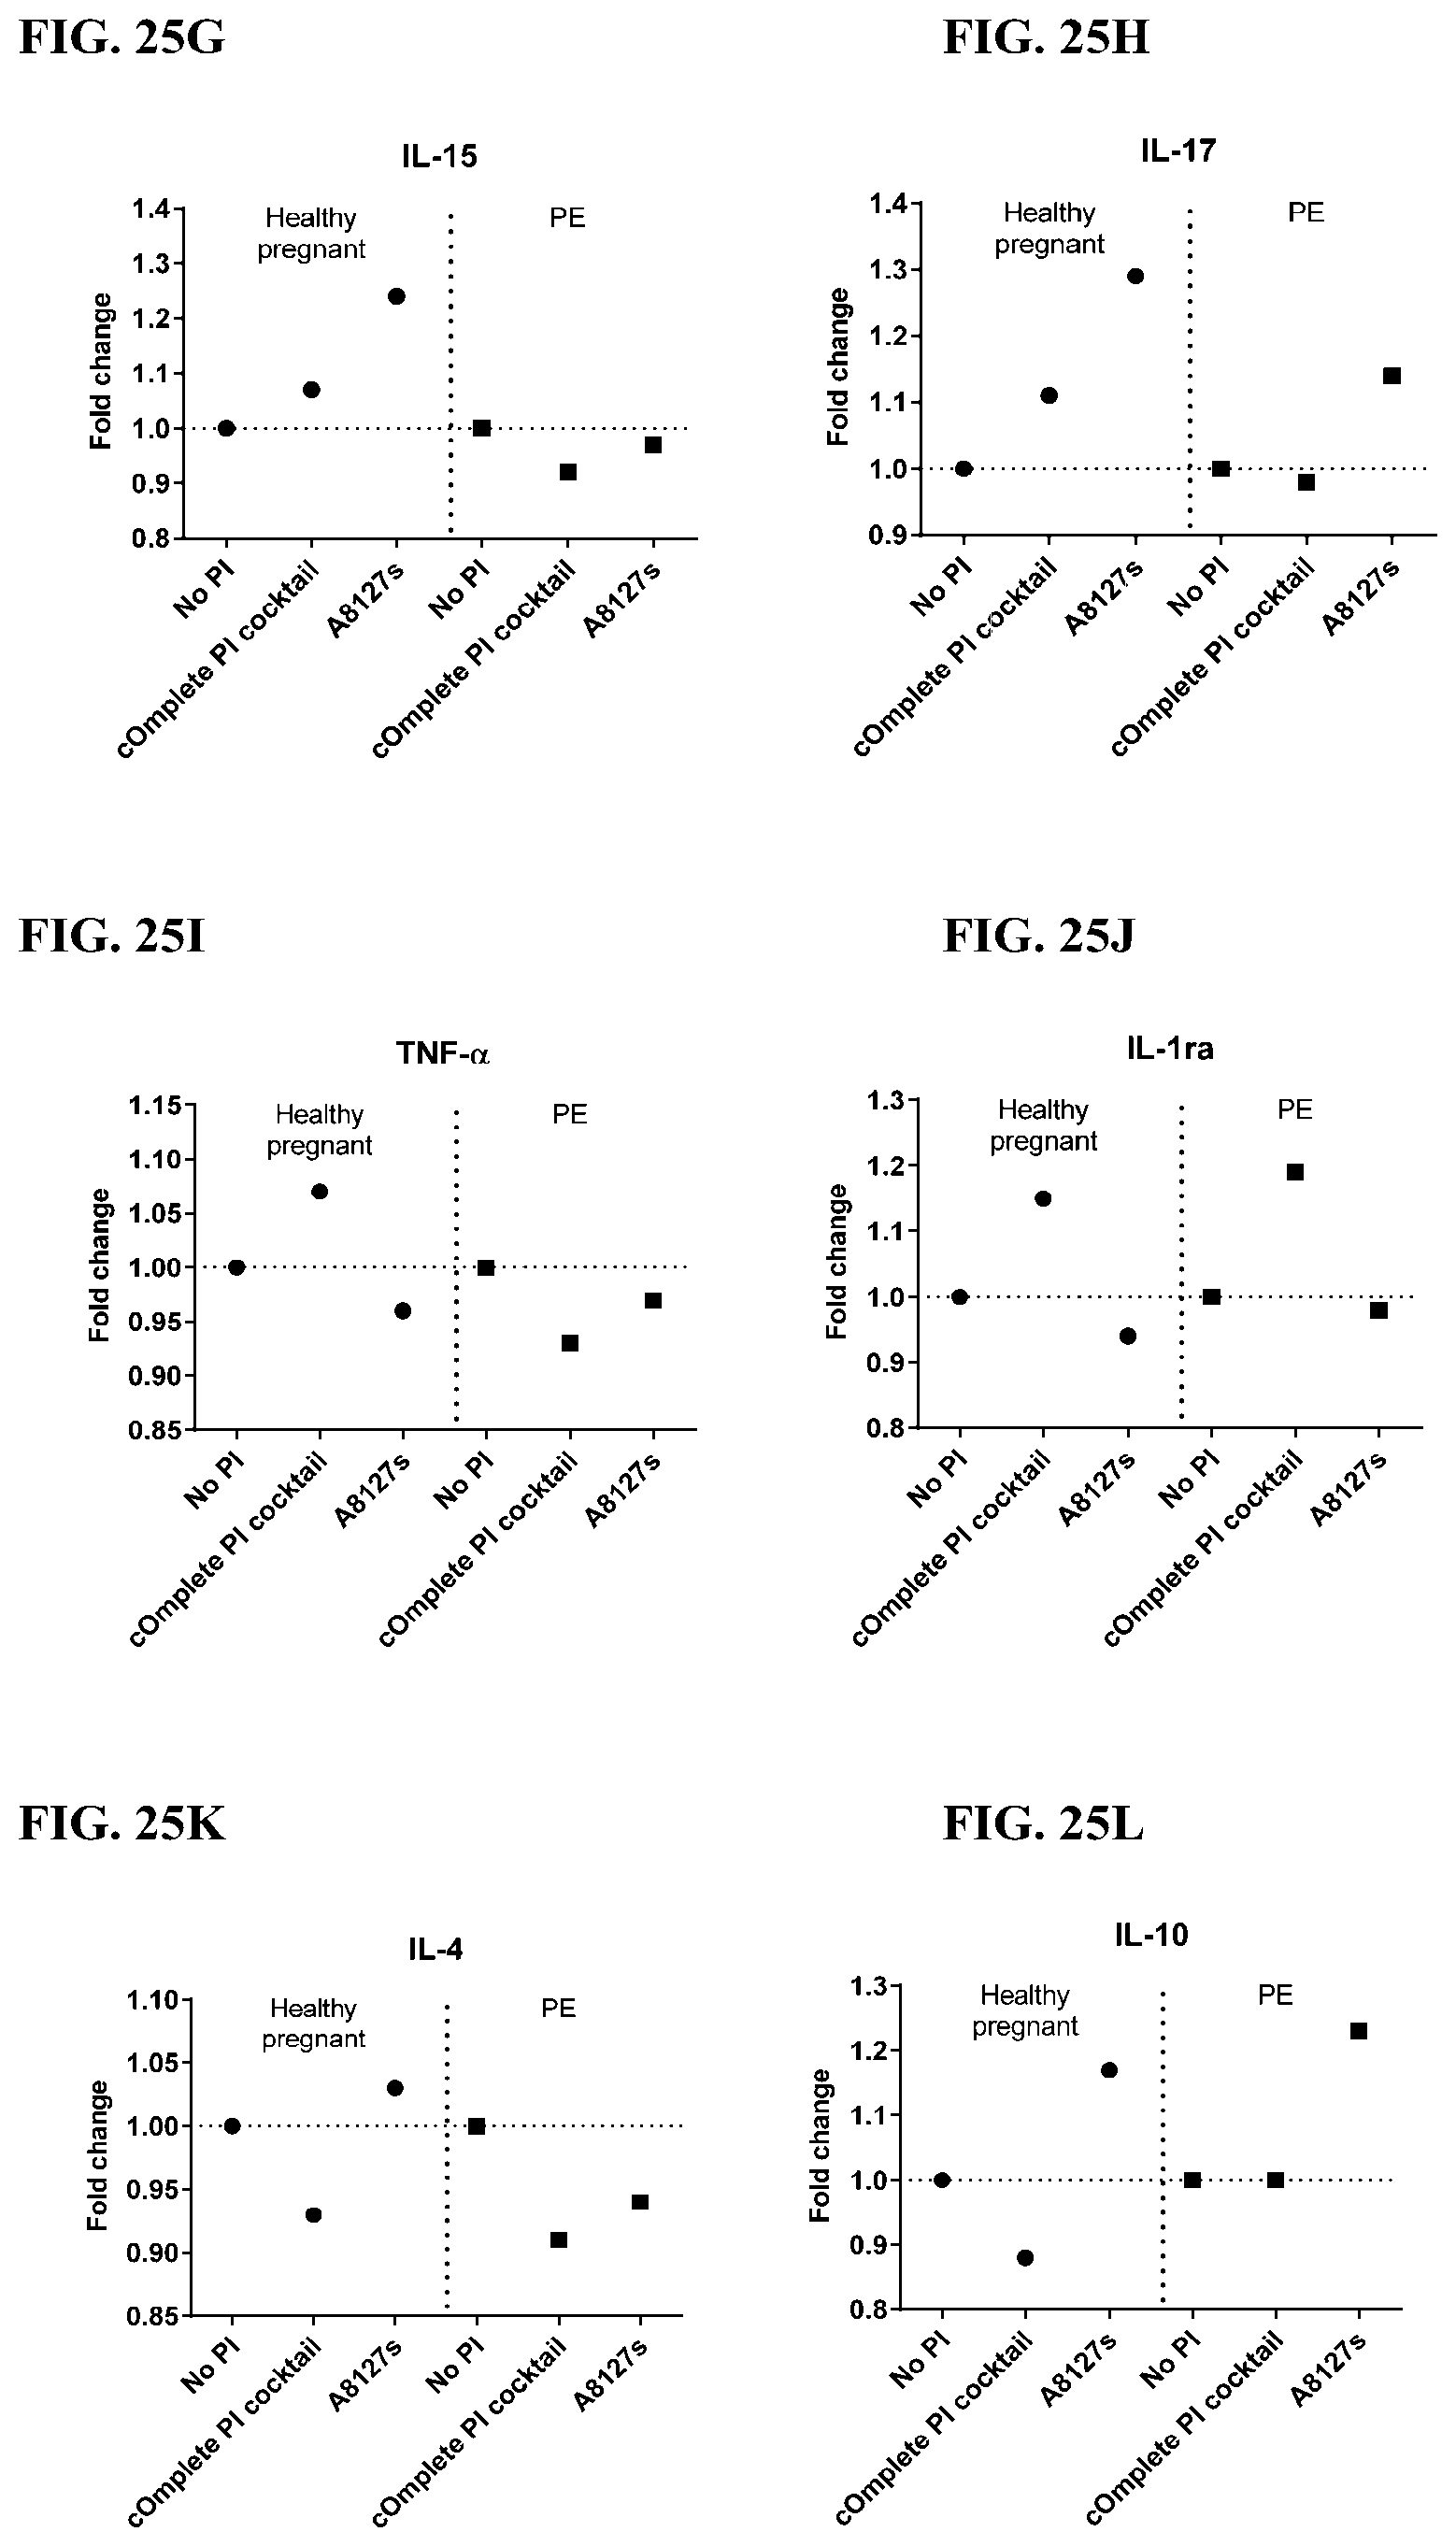
D00171
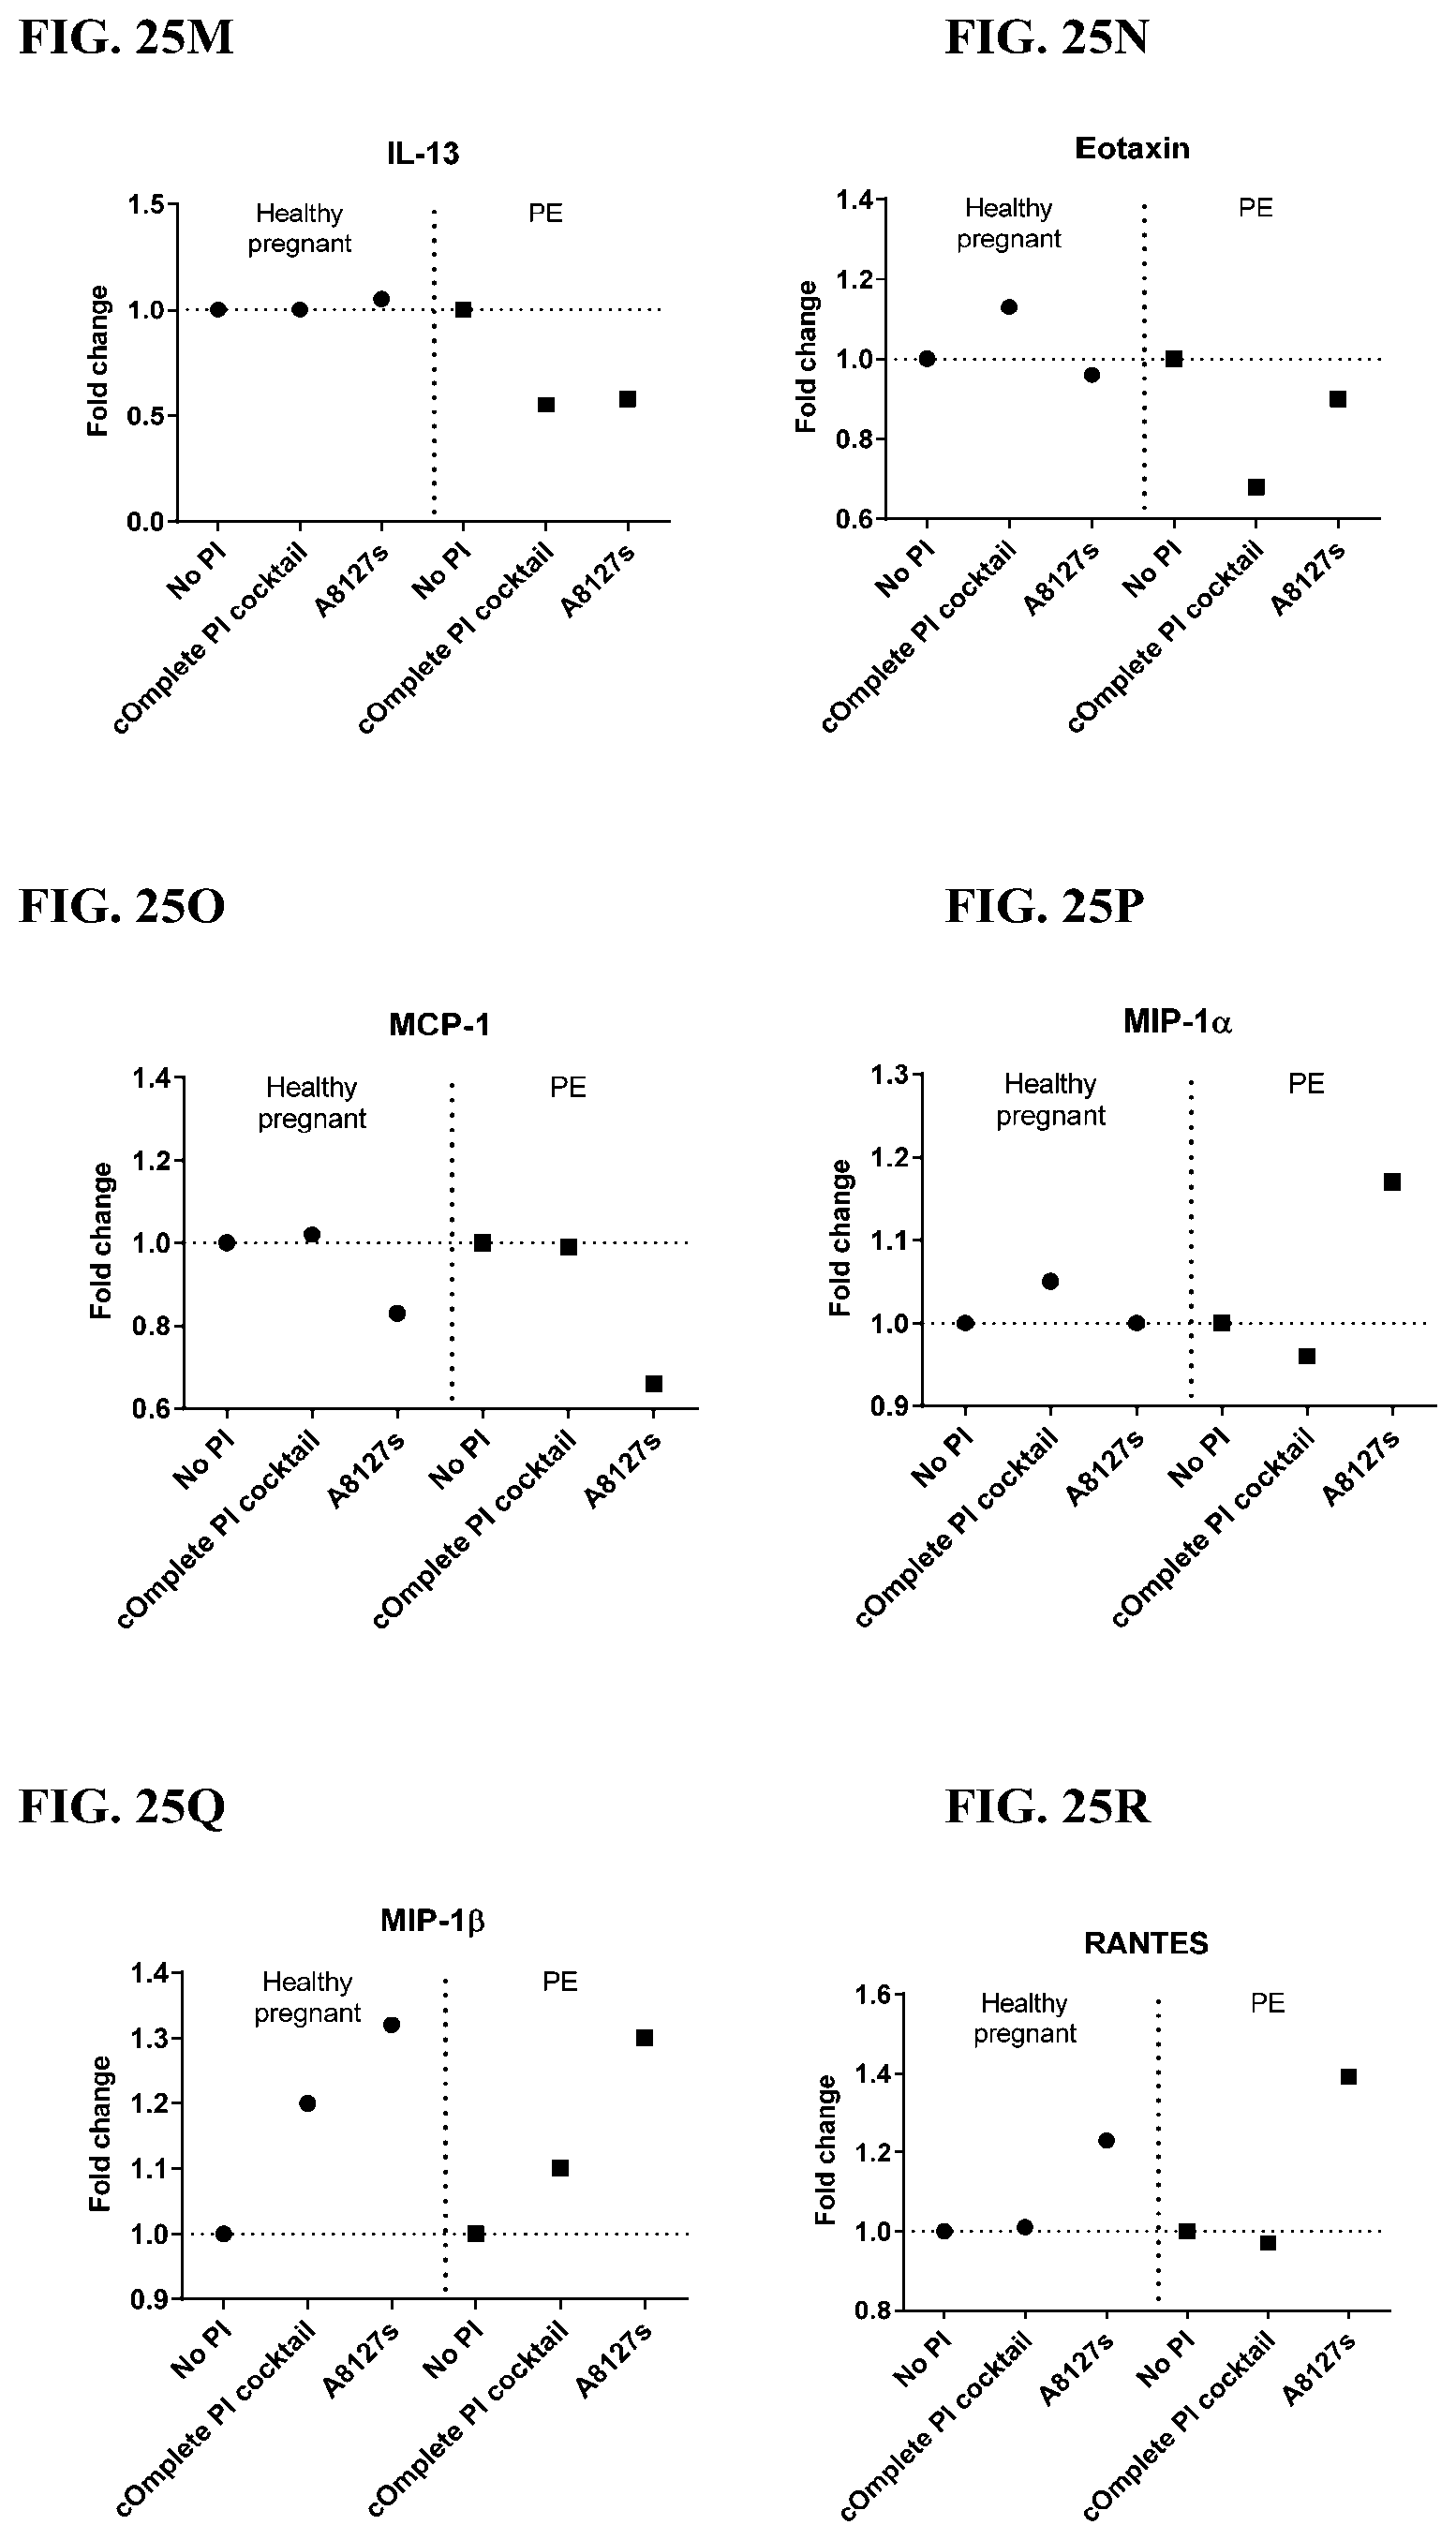
D00172
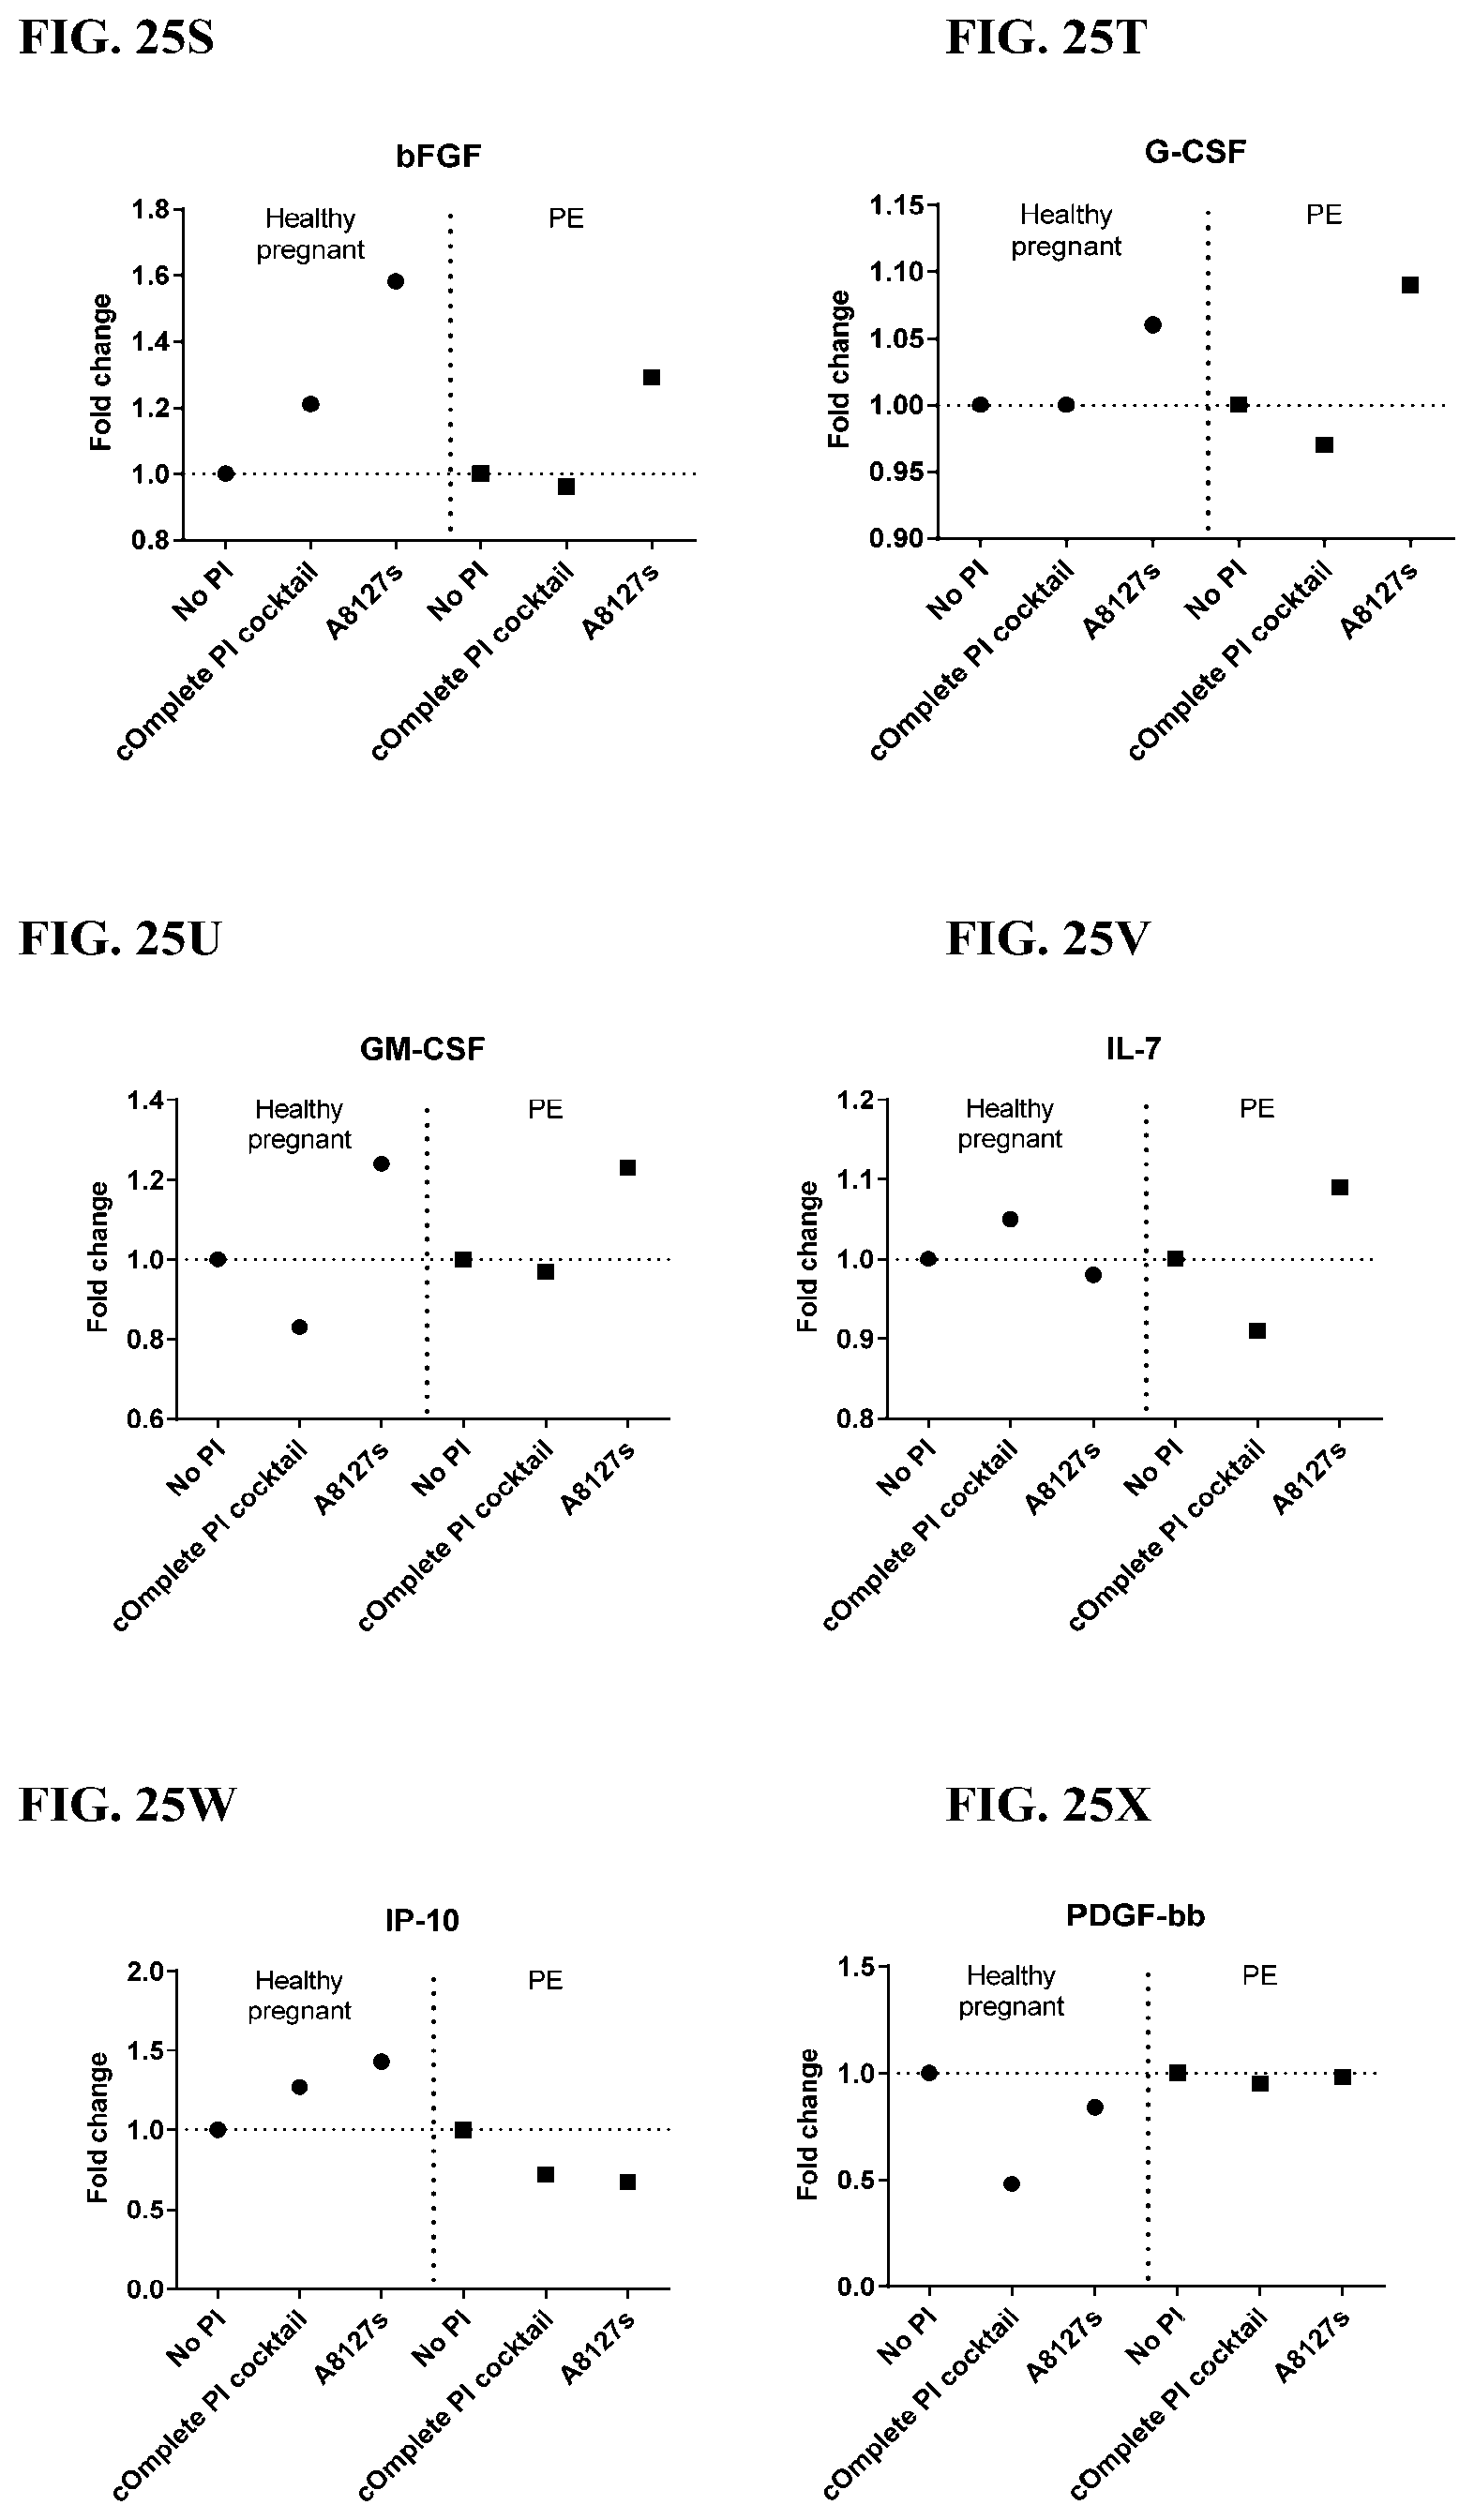
D00173

D00174
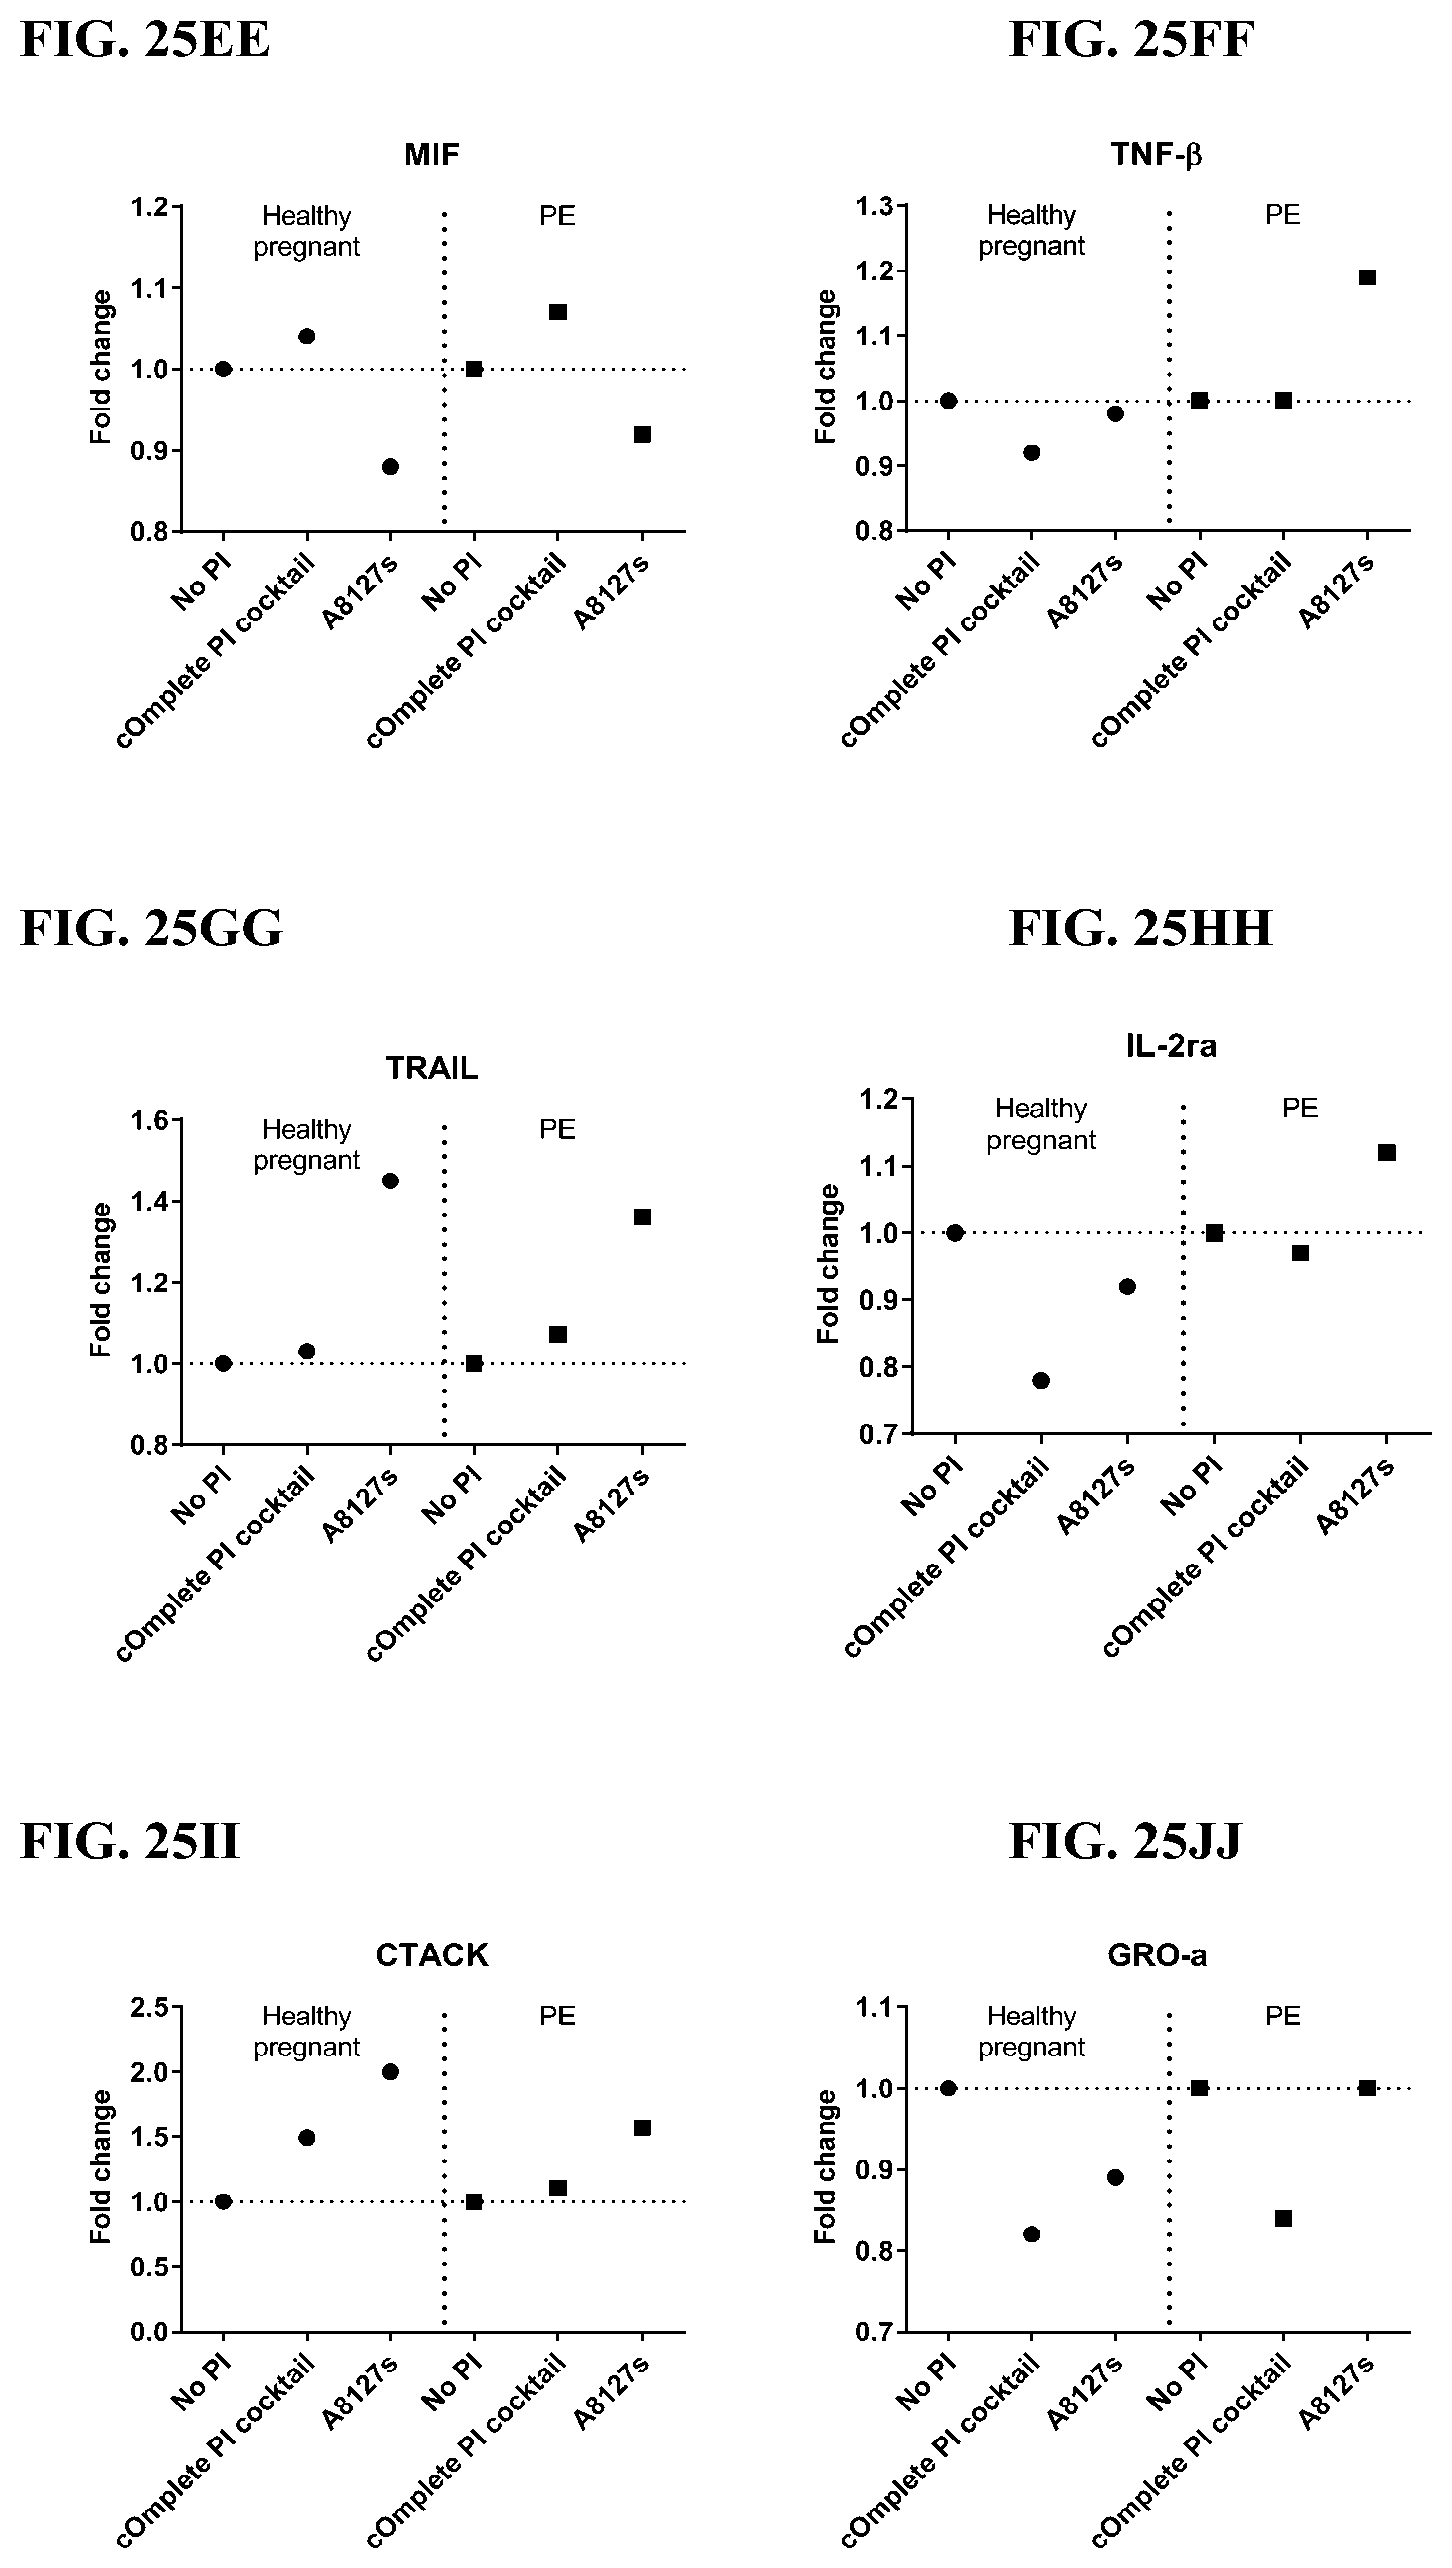
D00175

D00176
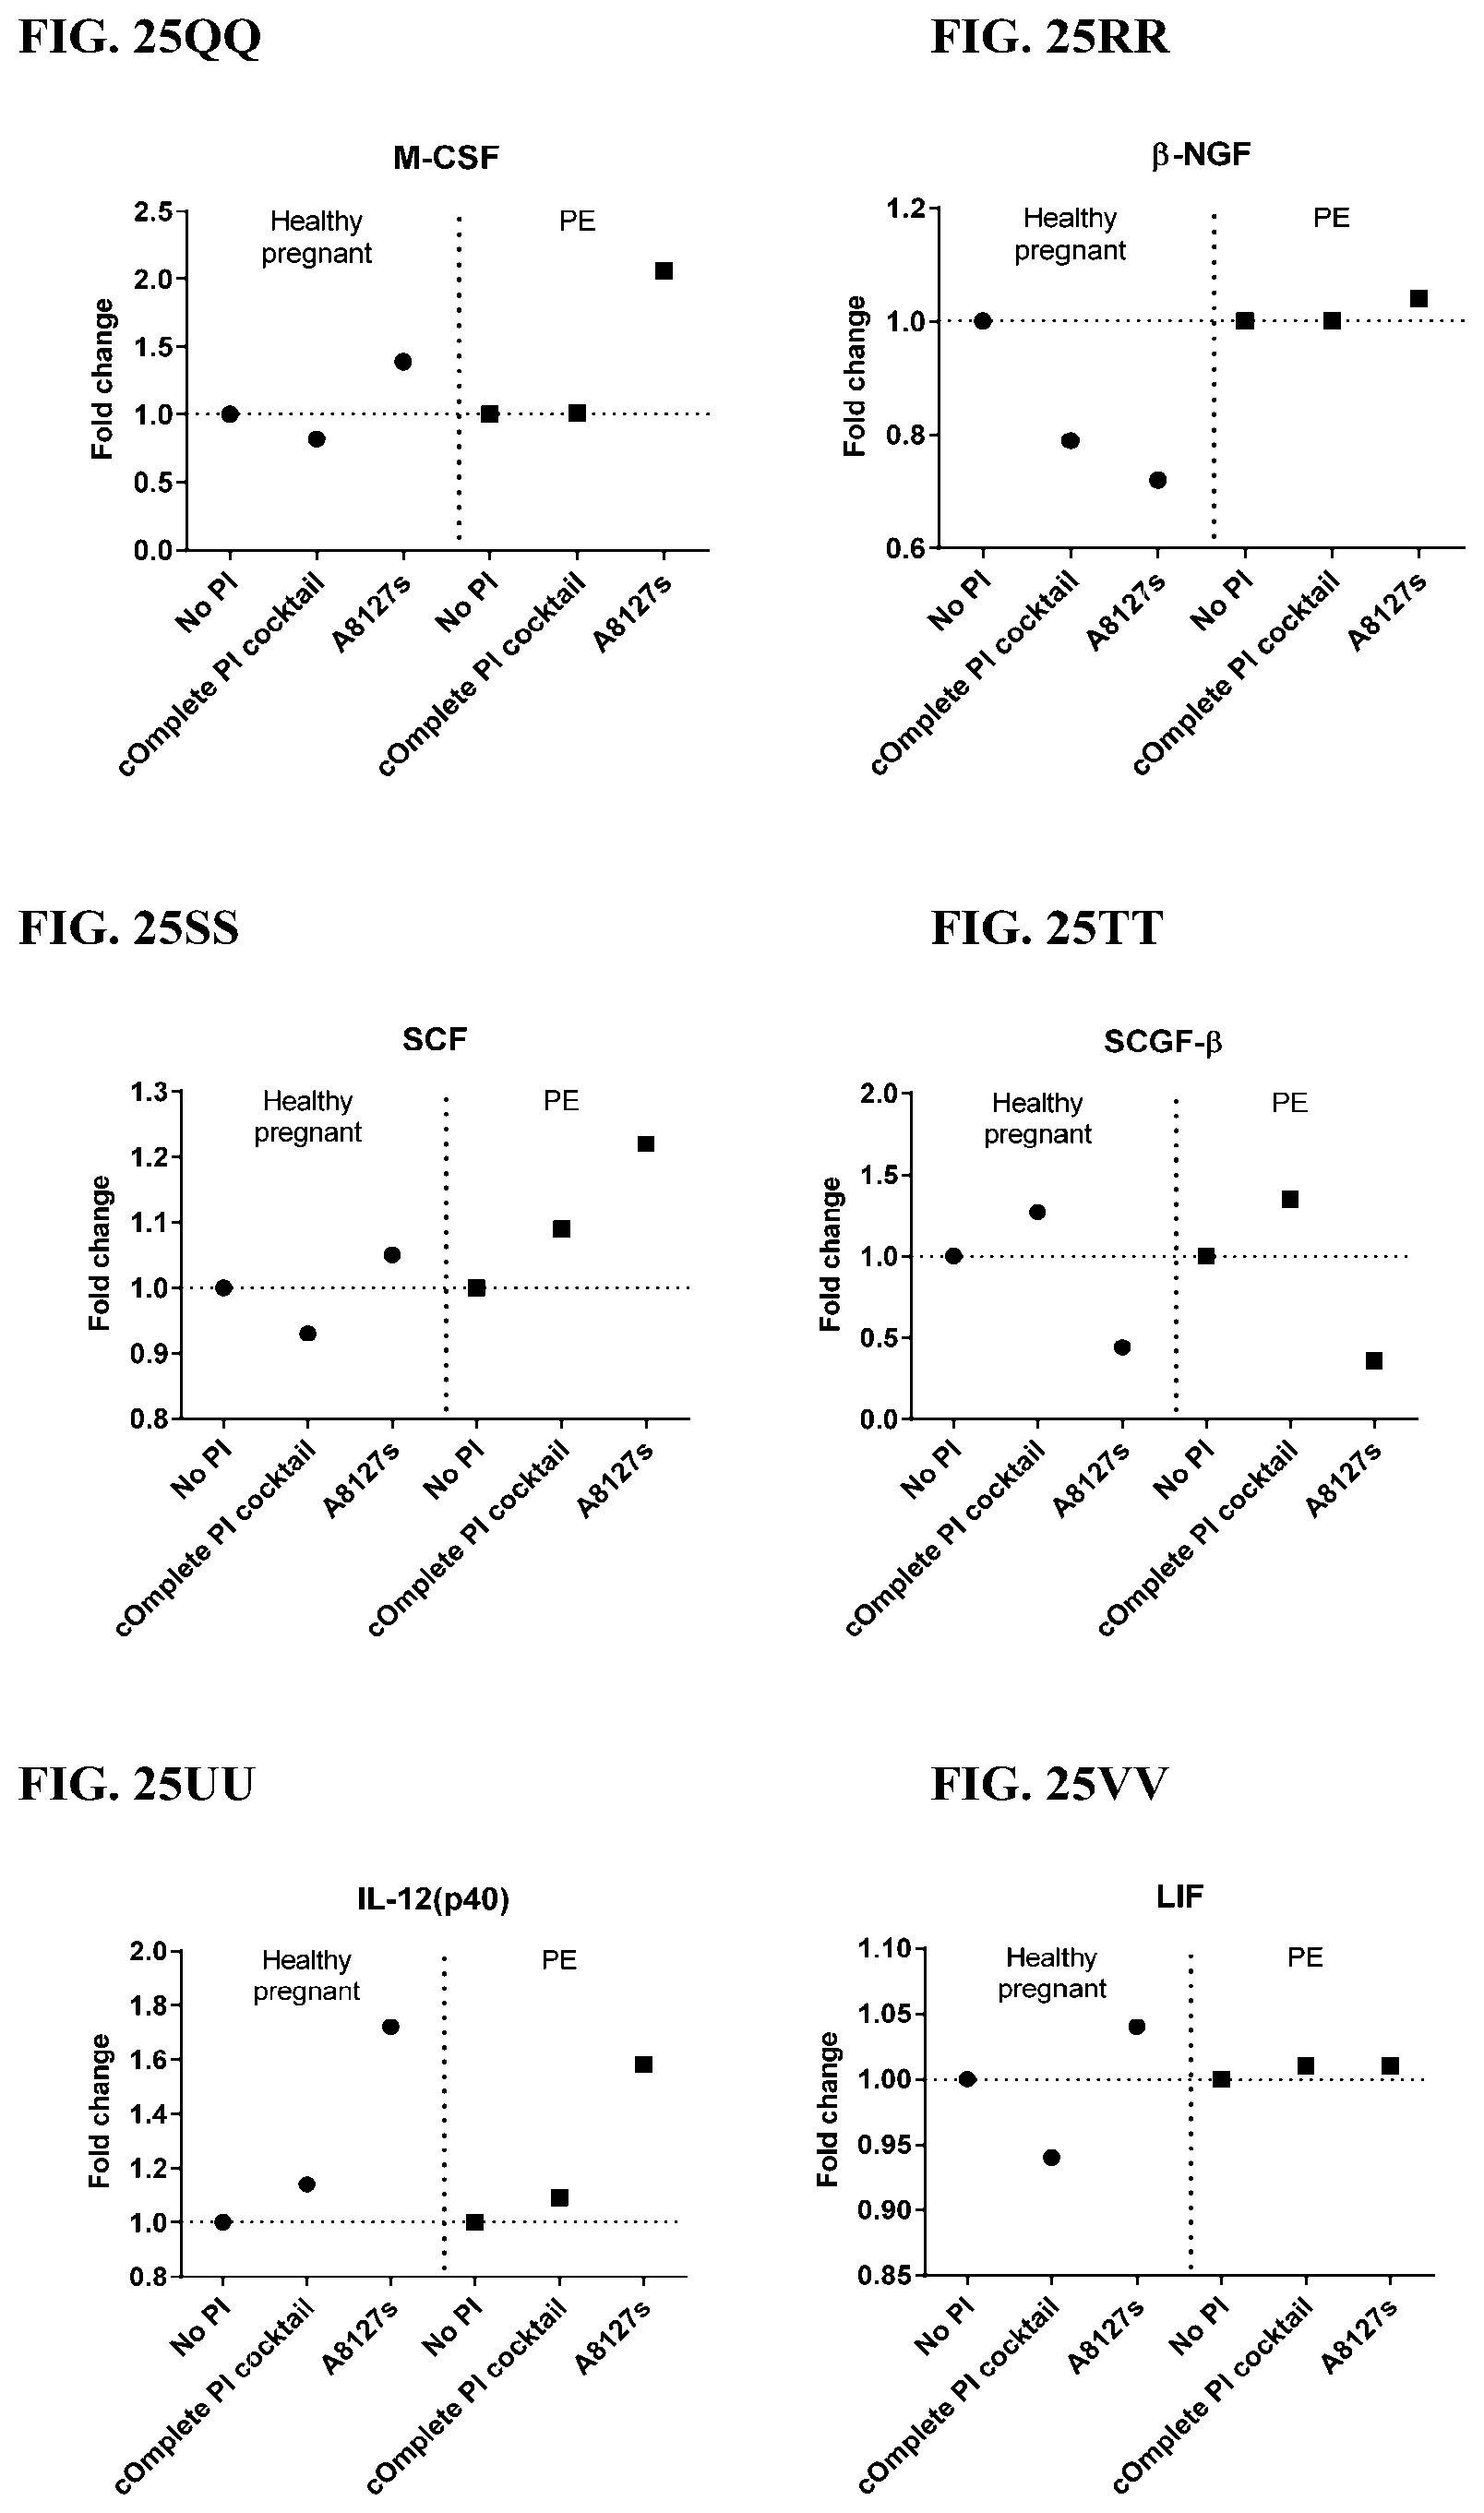
D00177

D00178

D00179

D00180

D00181

D00182
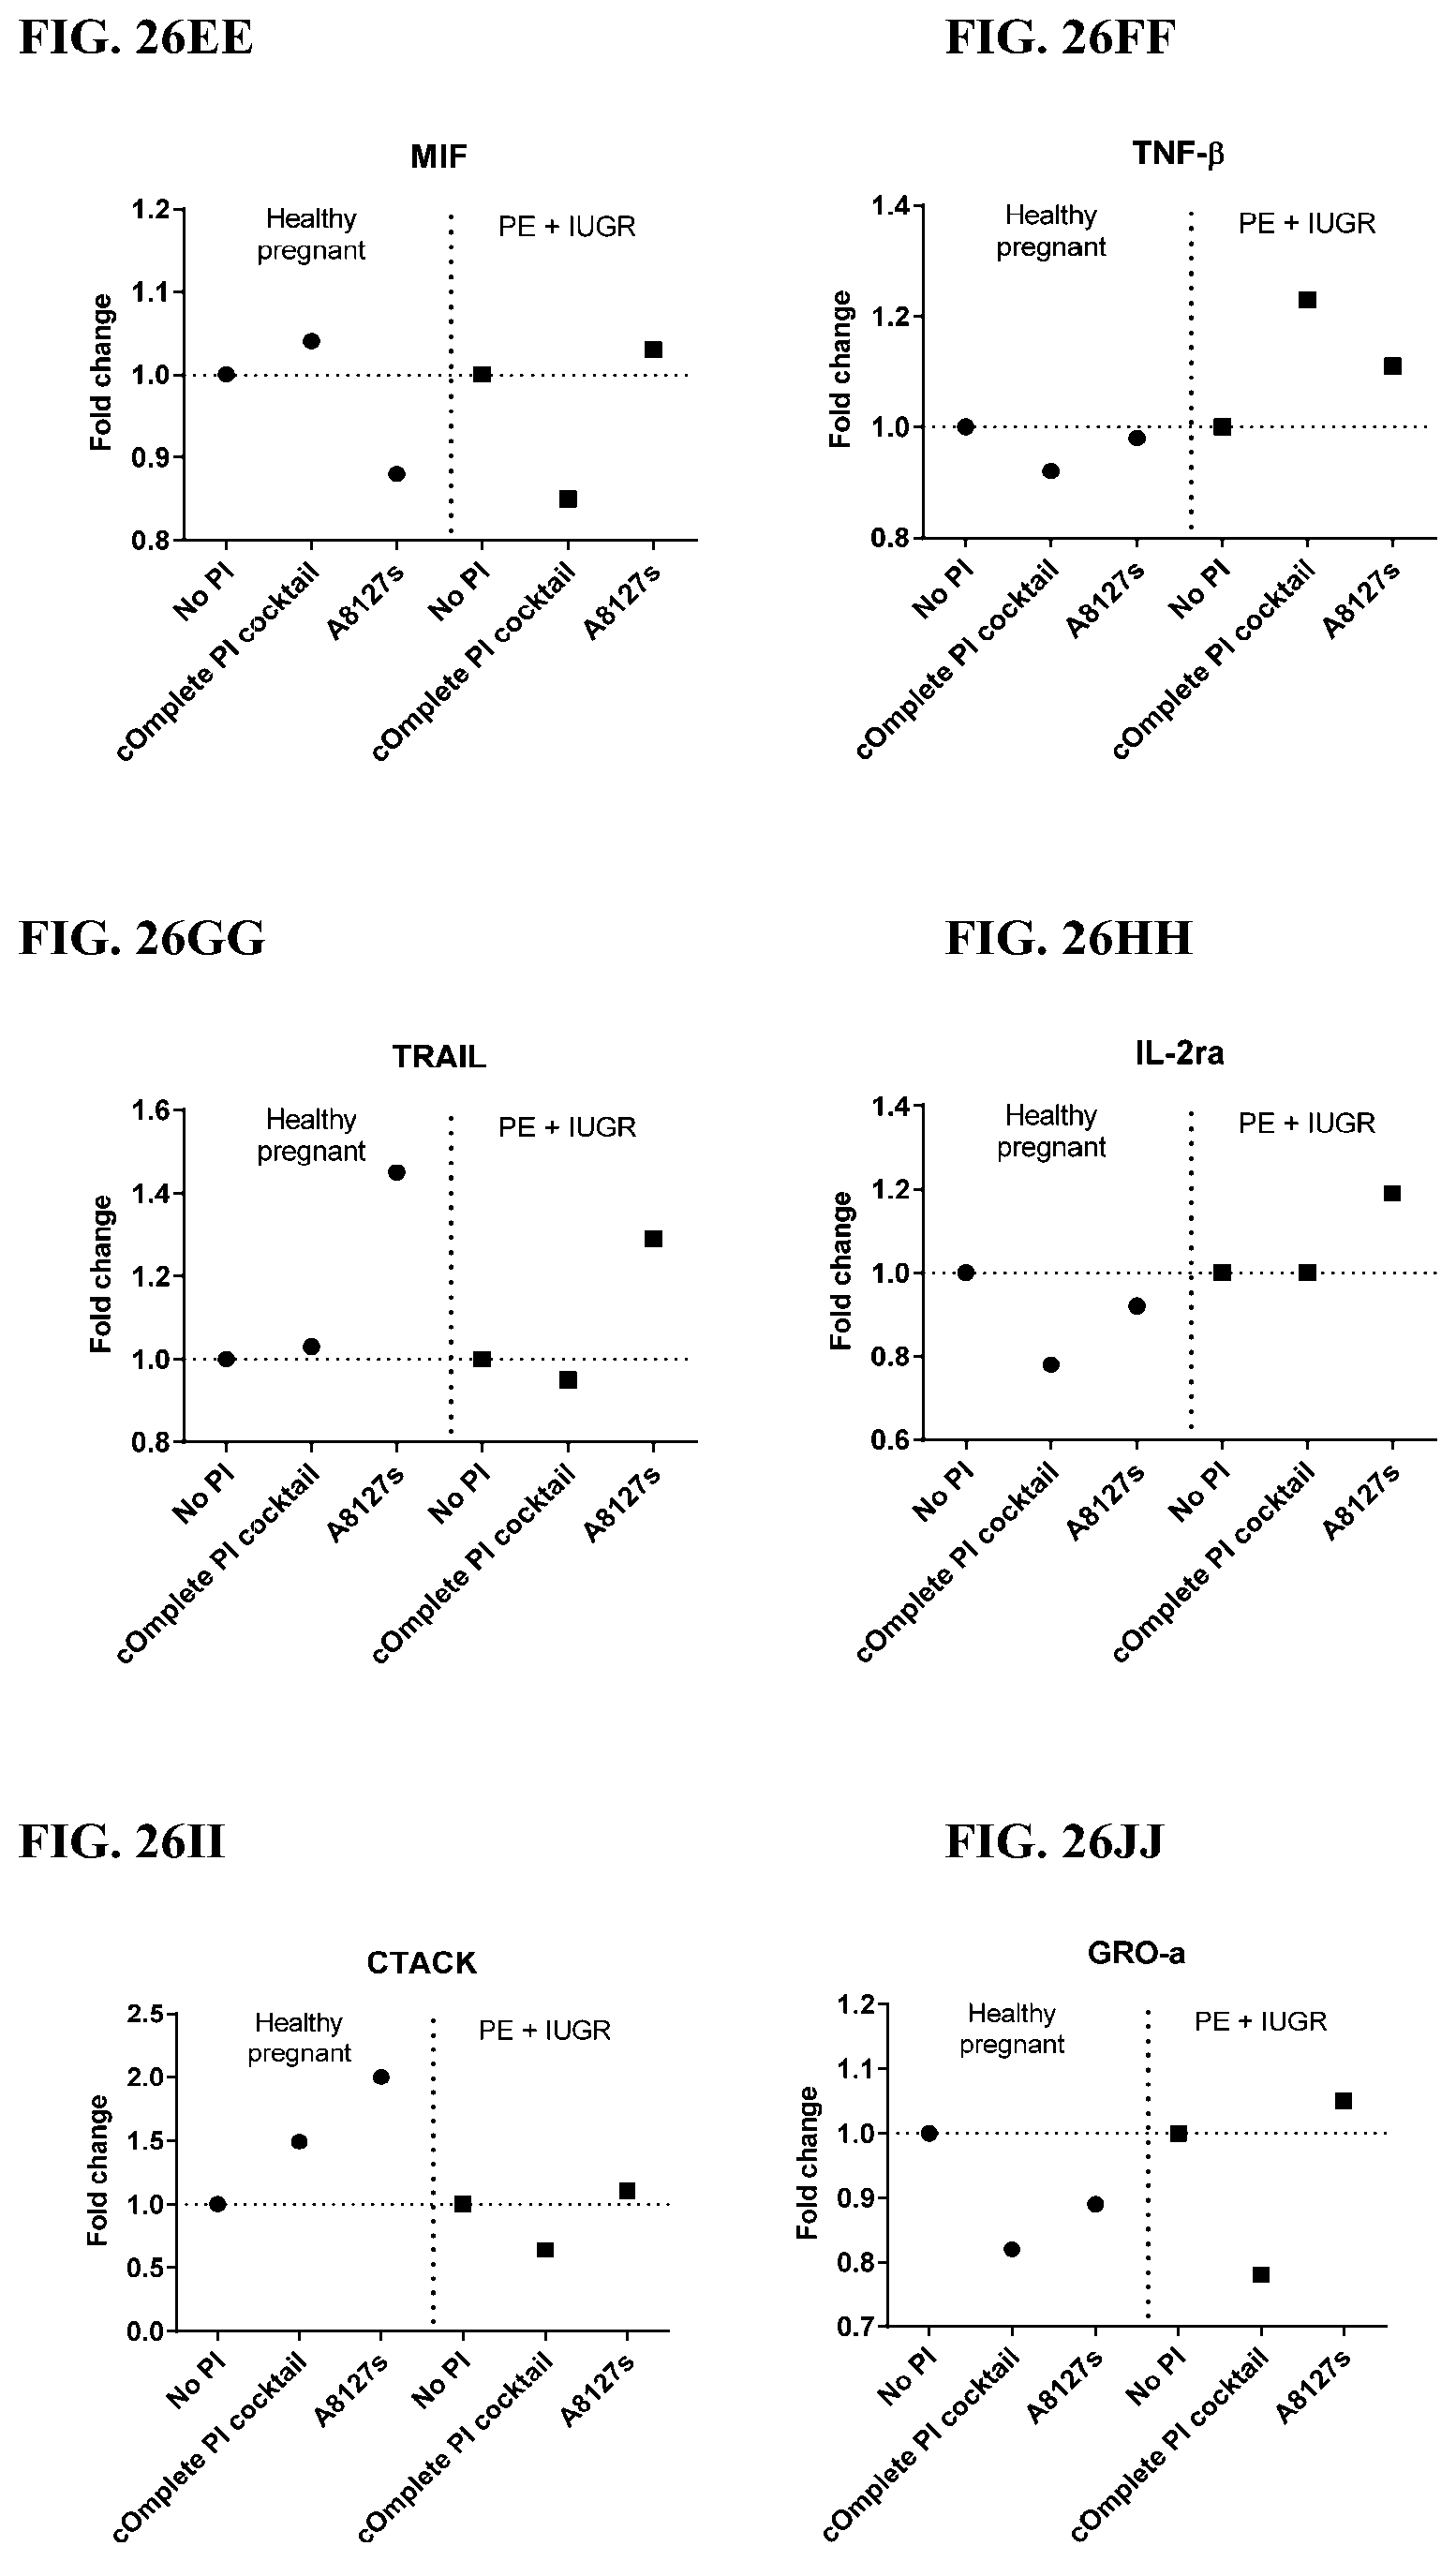
D00183
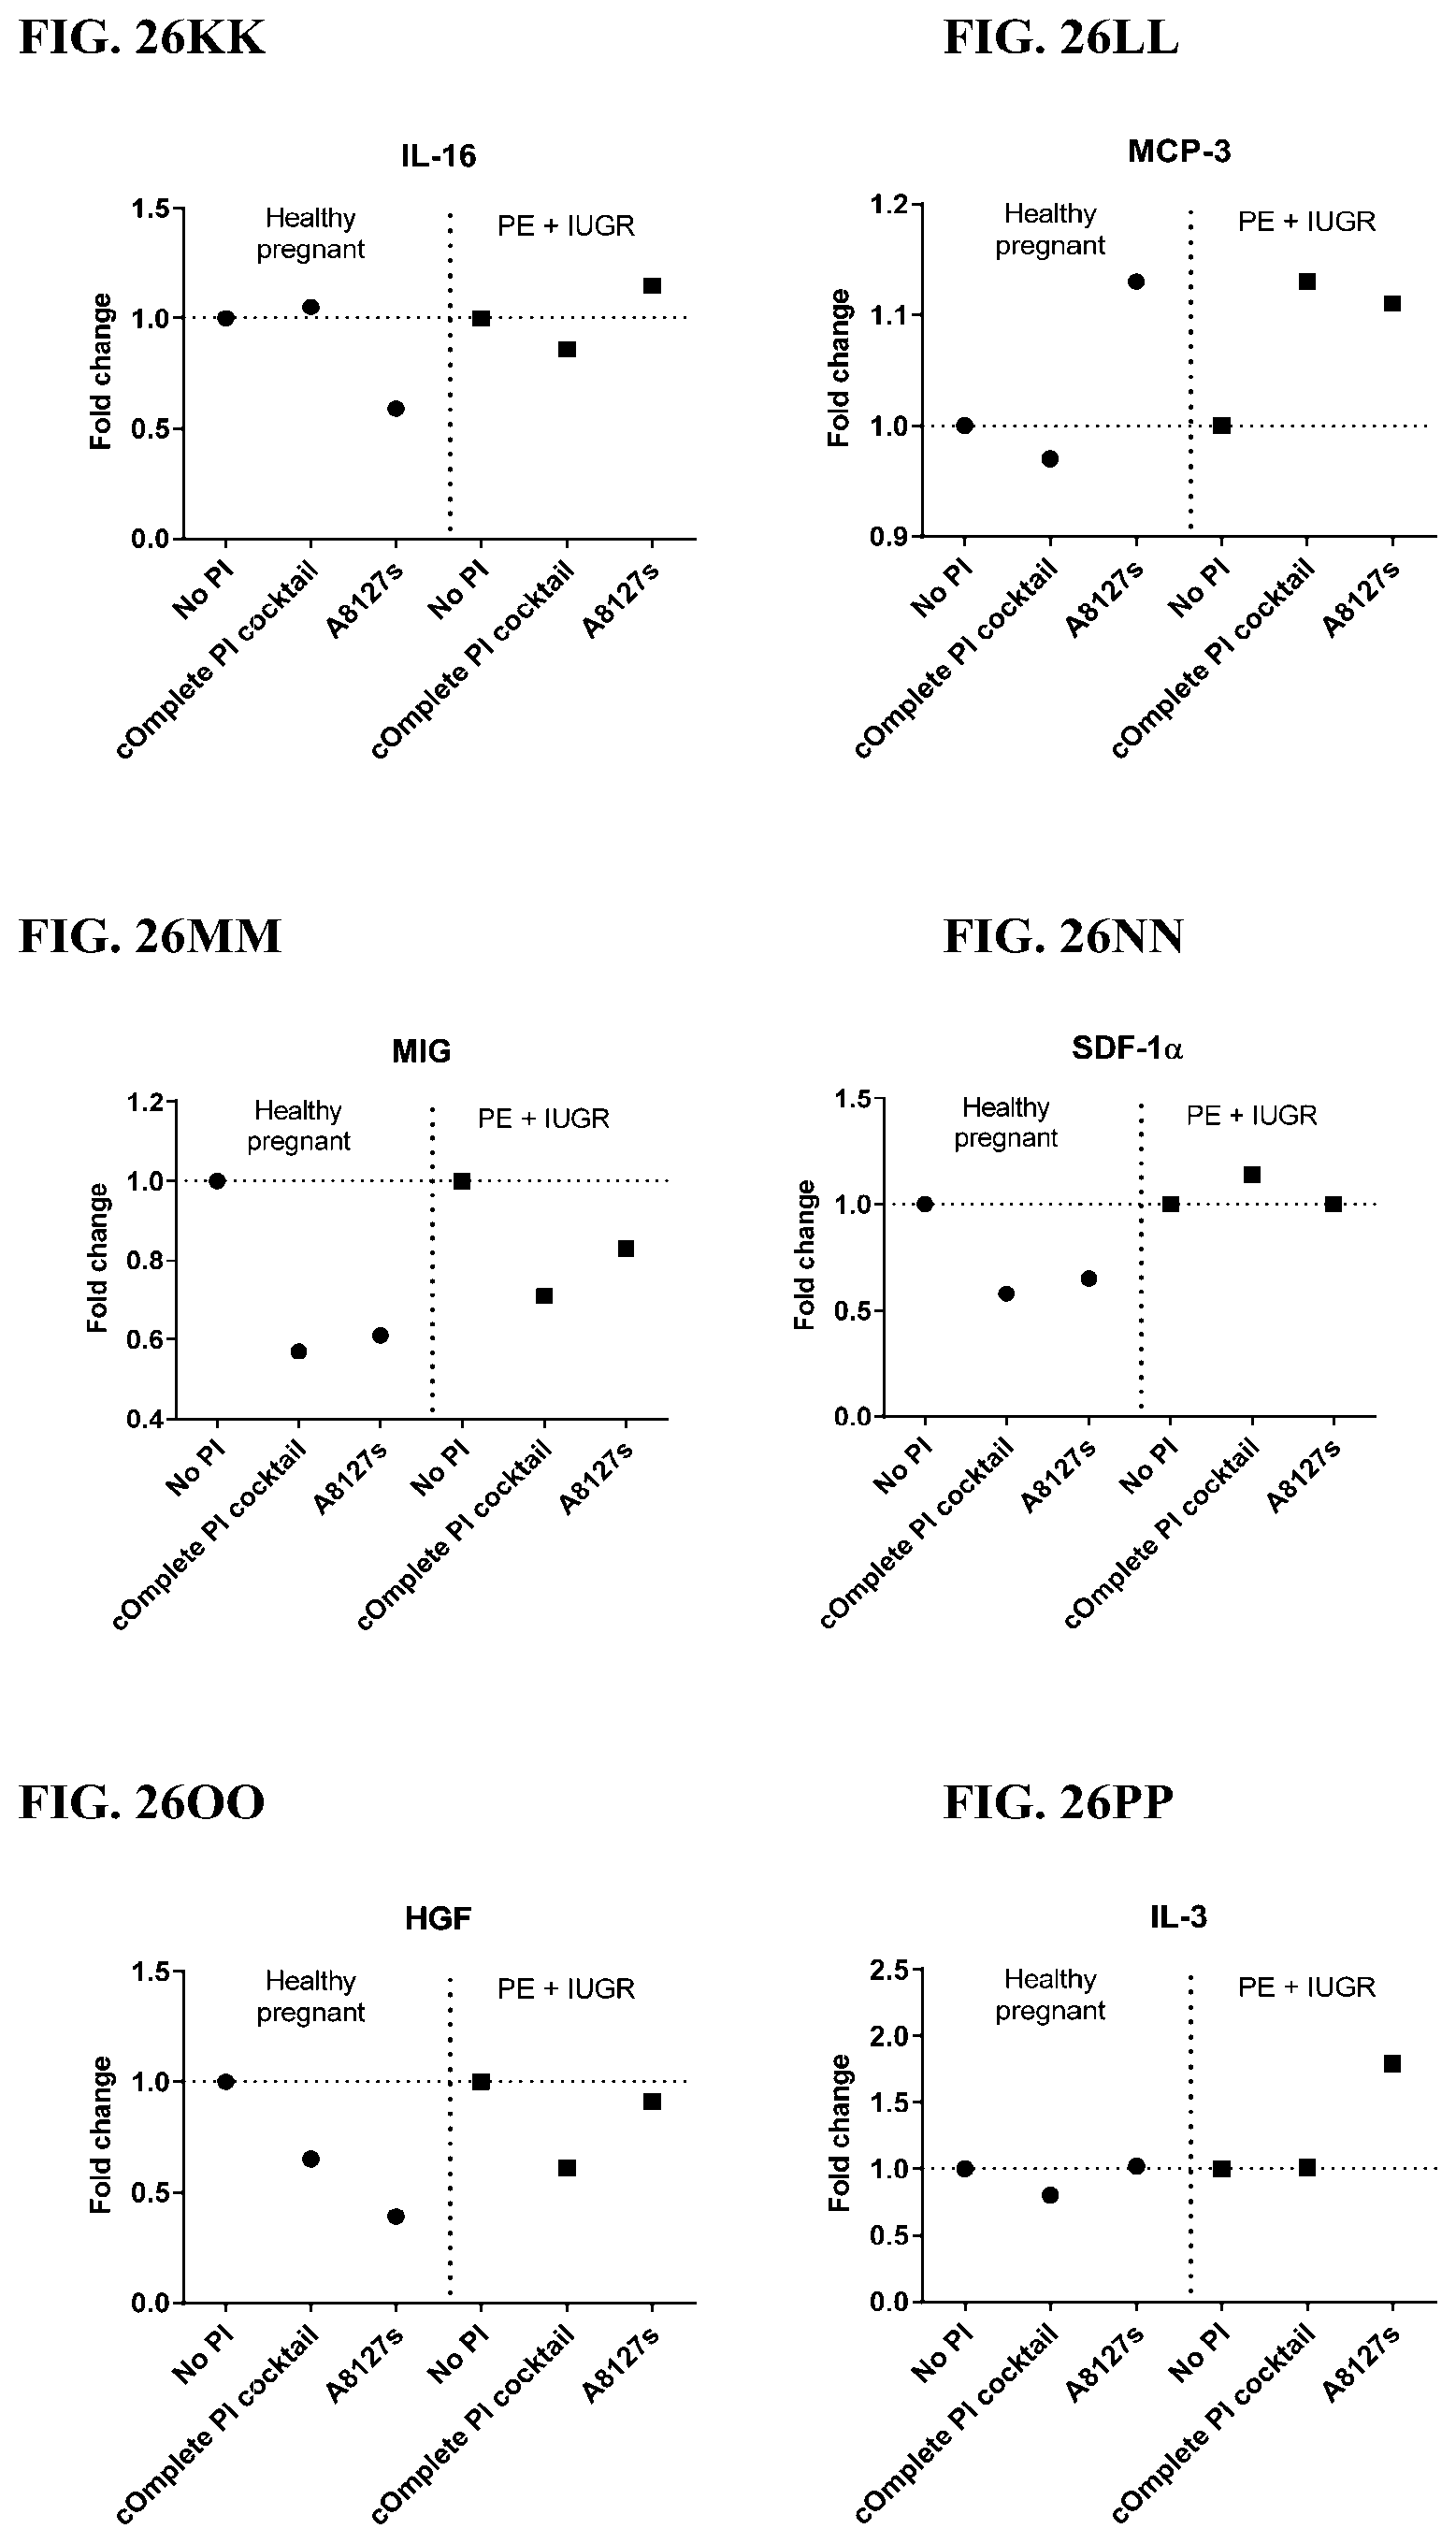
D00184

D00185
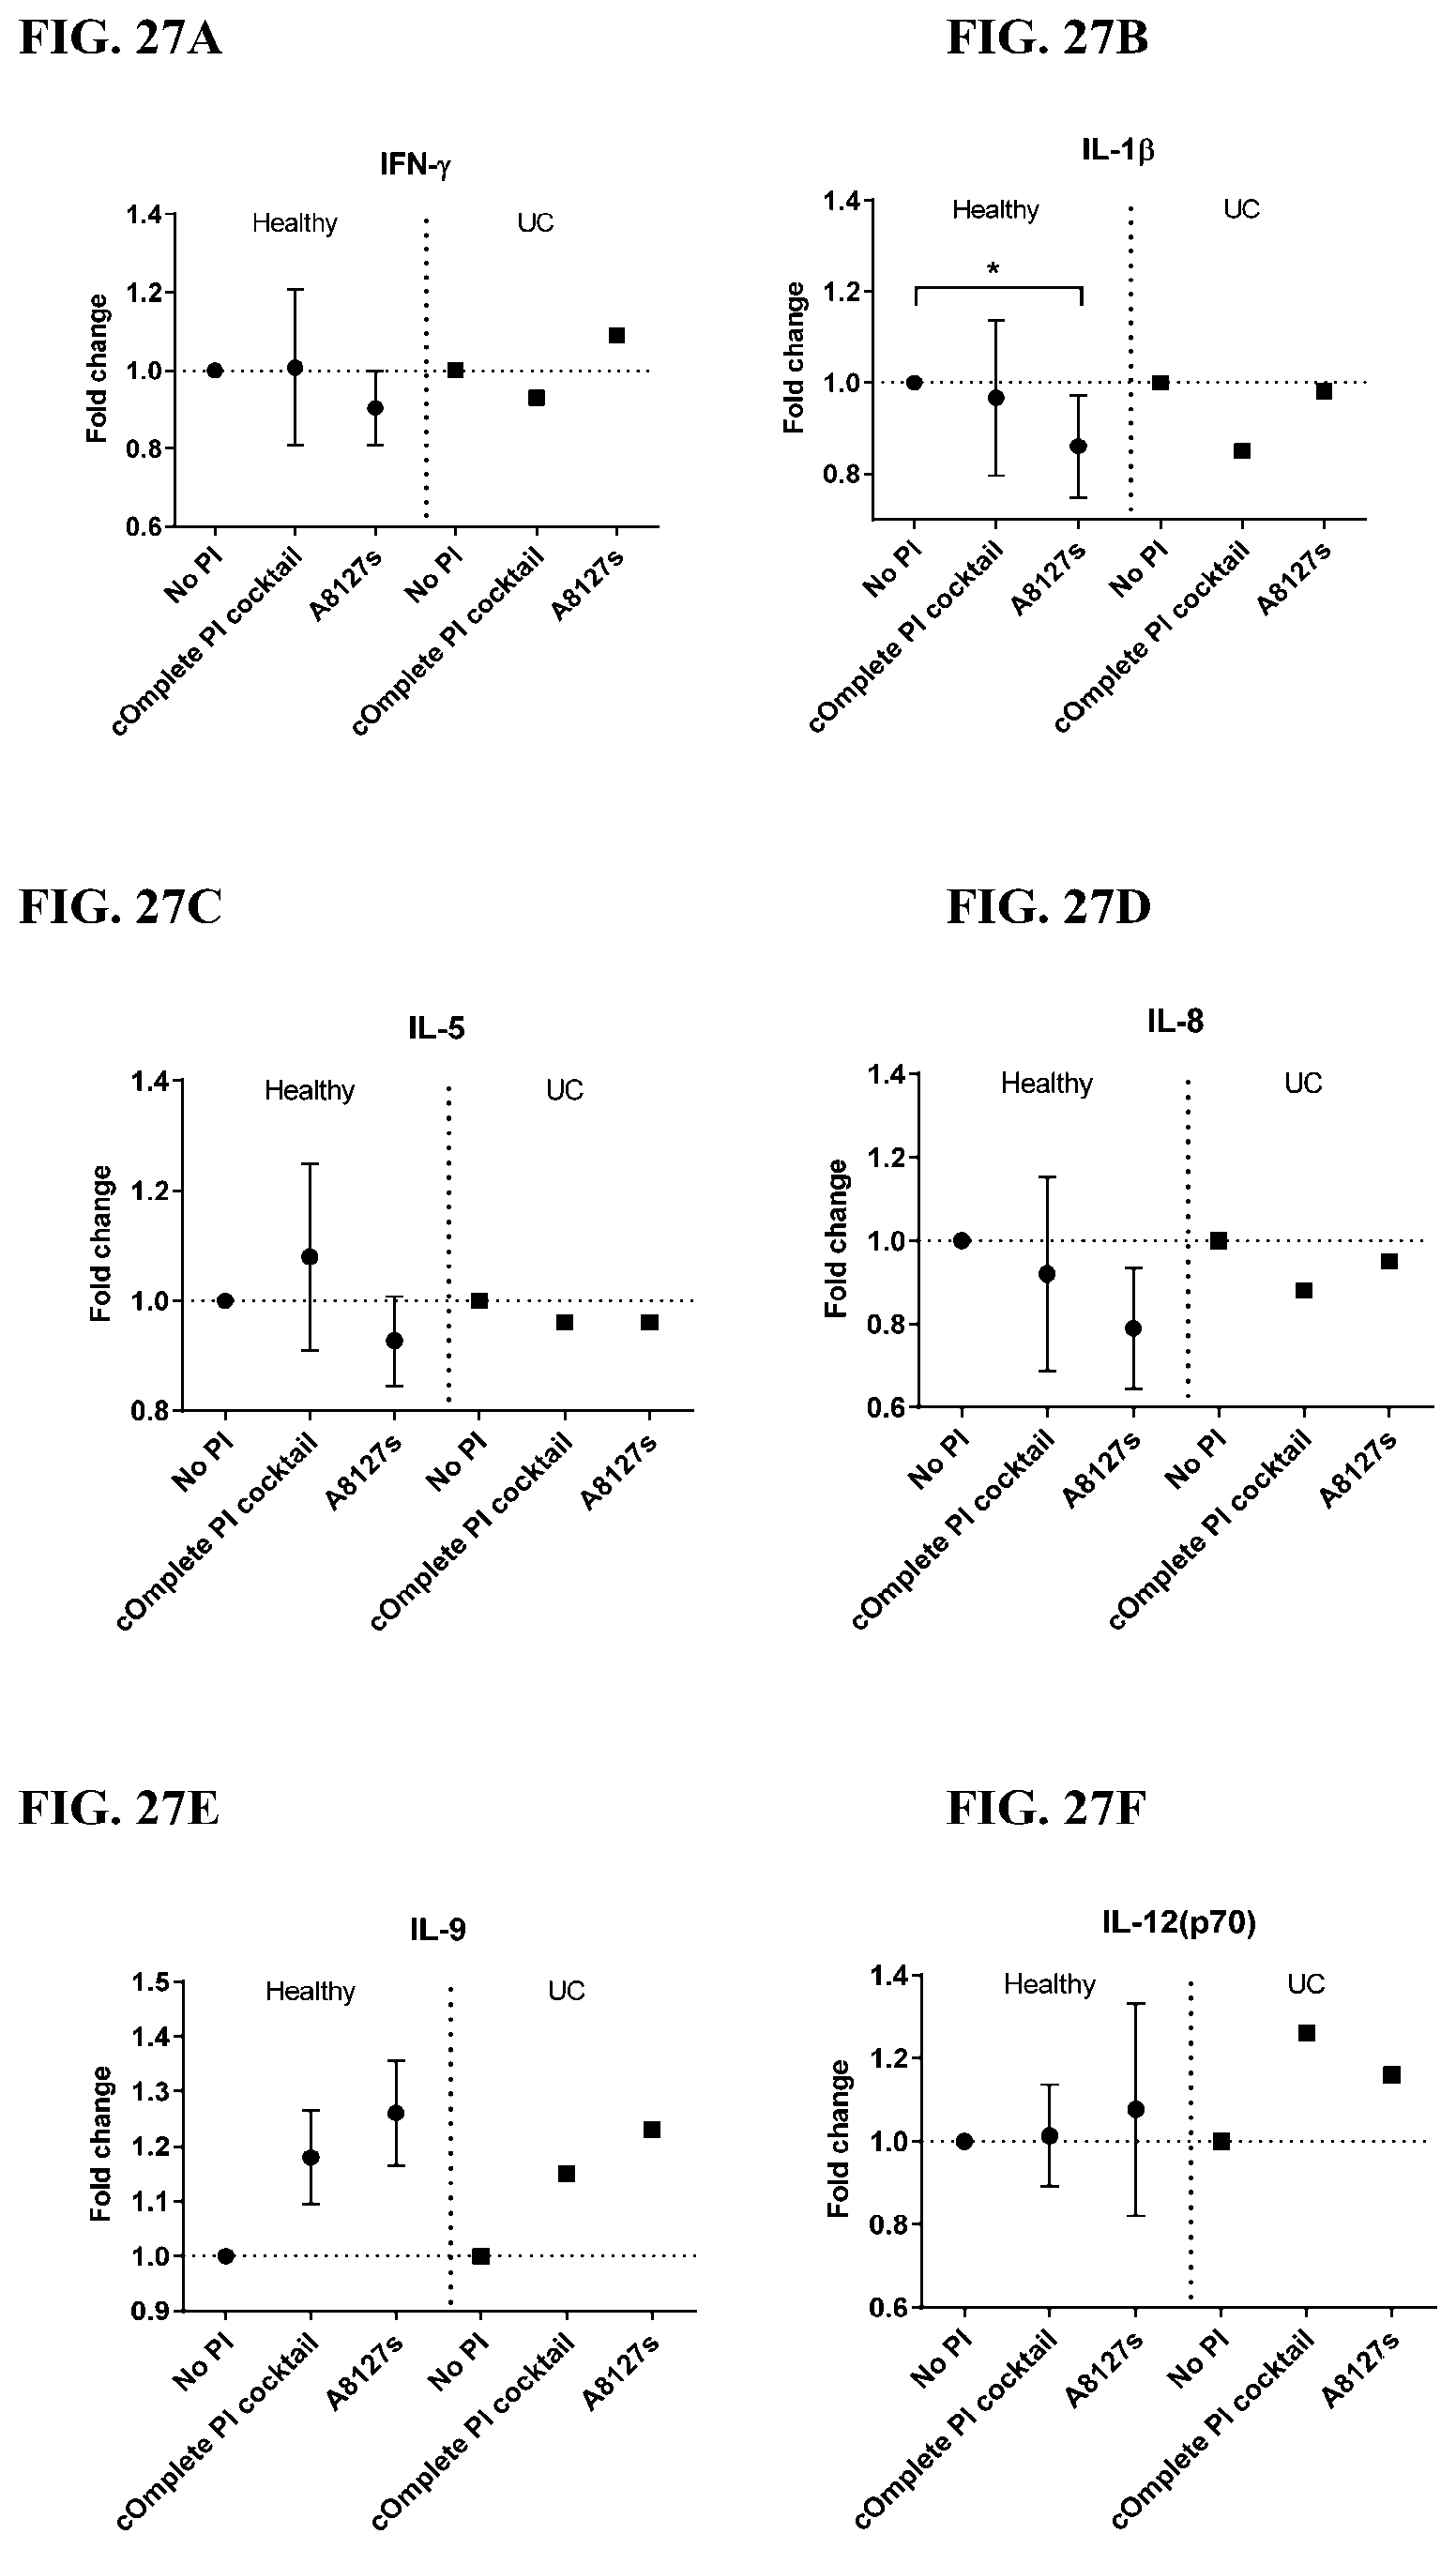
D00186
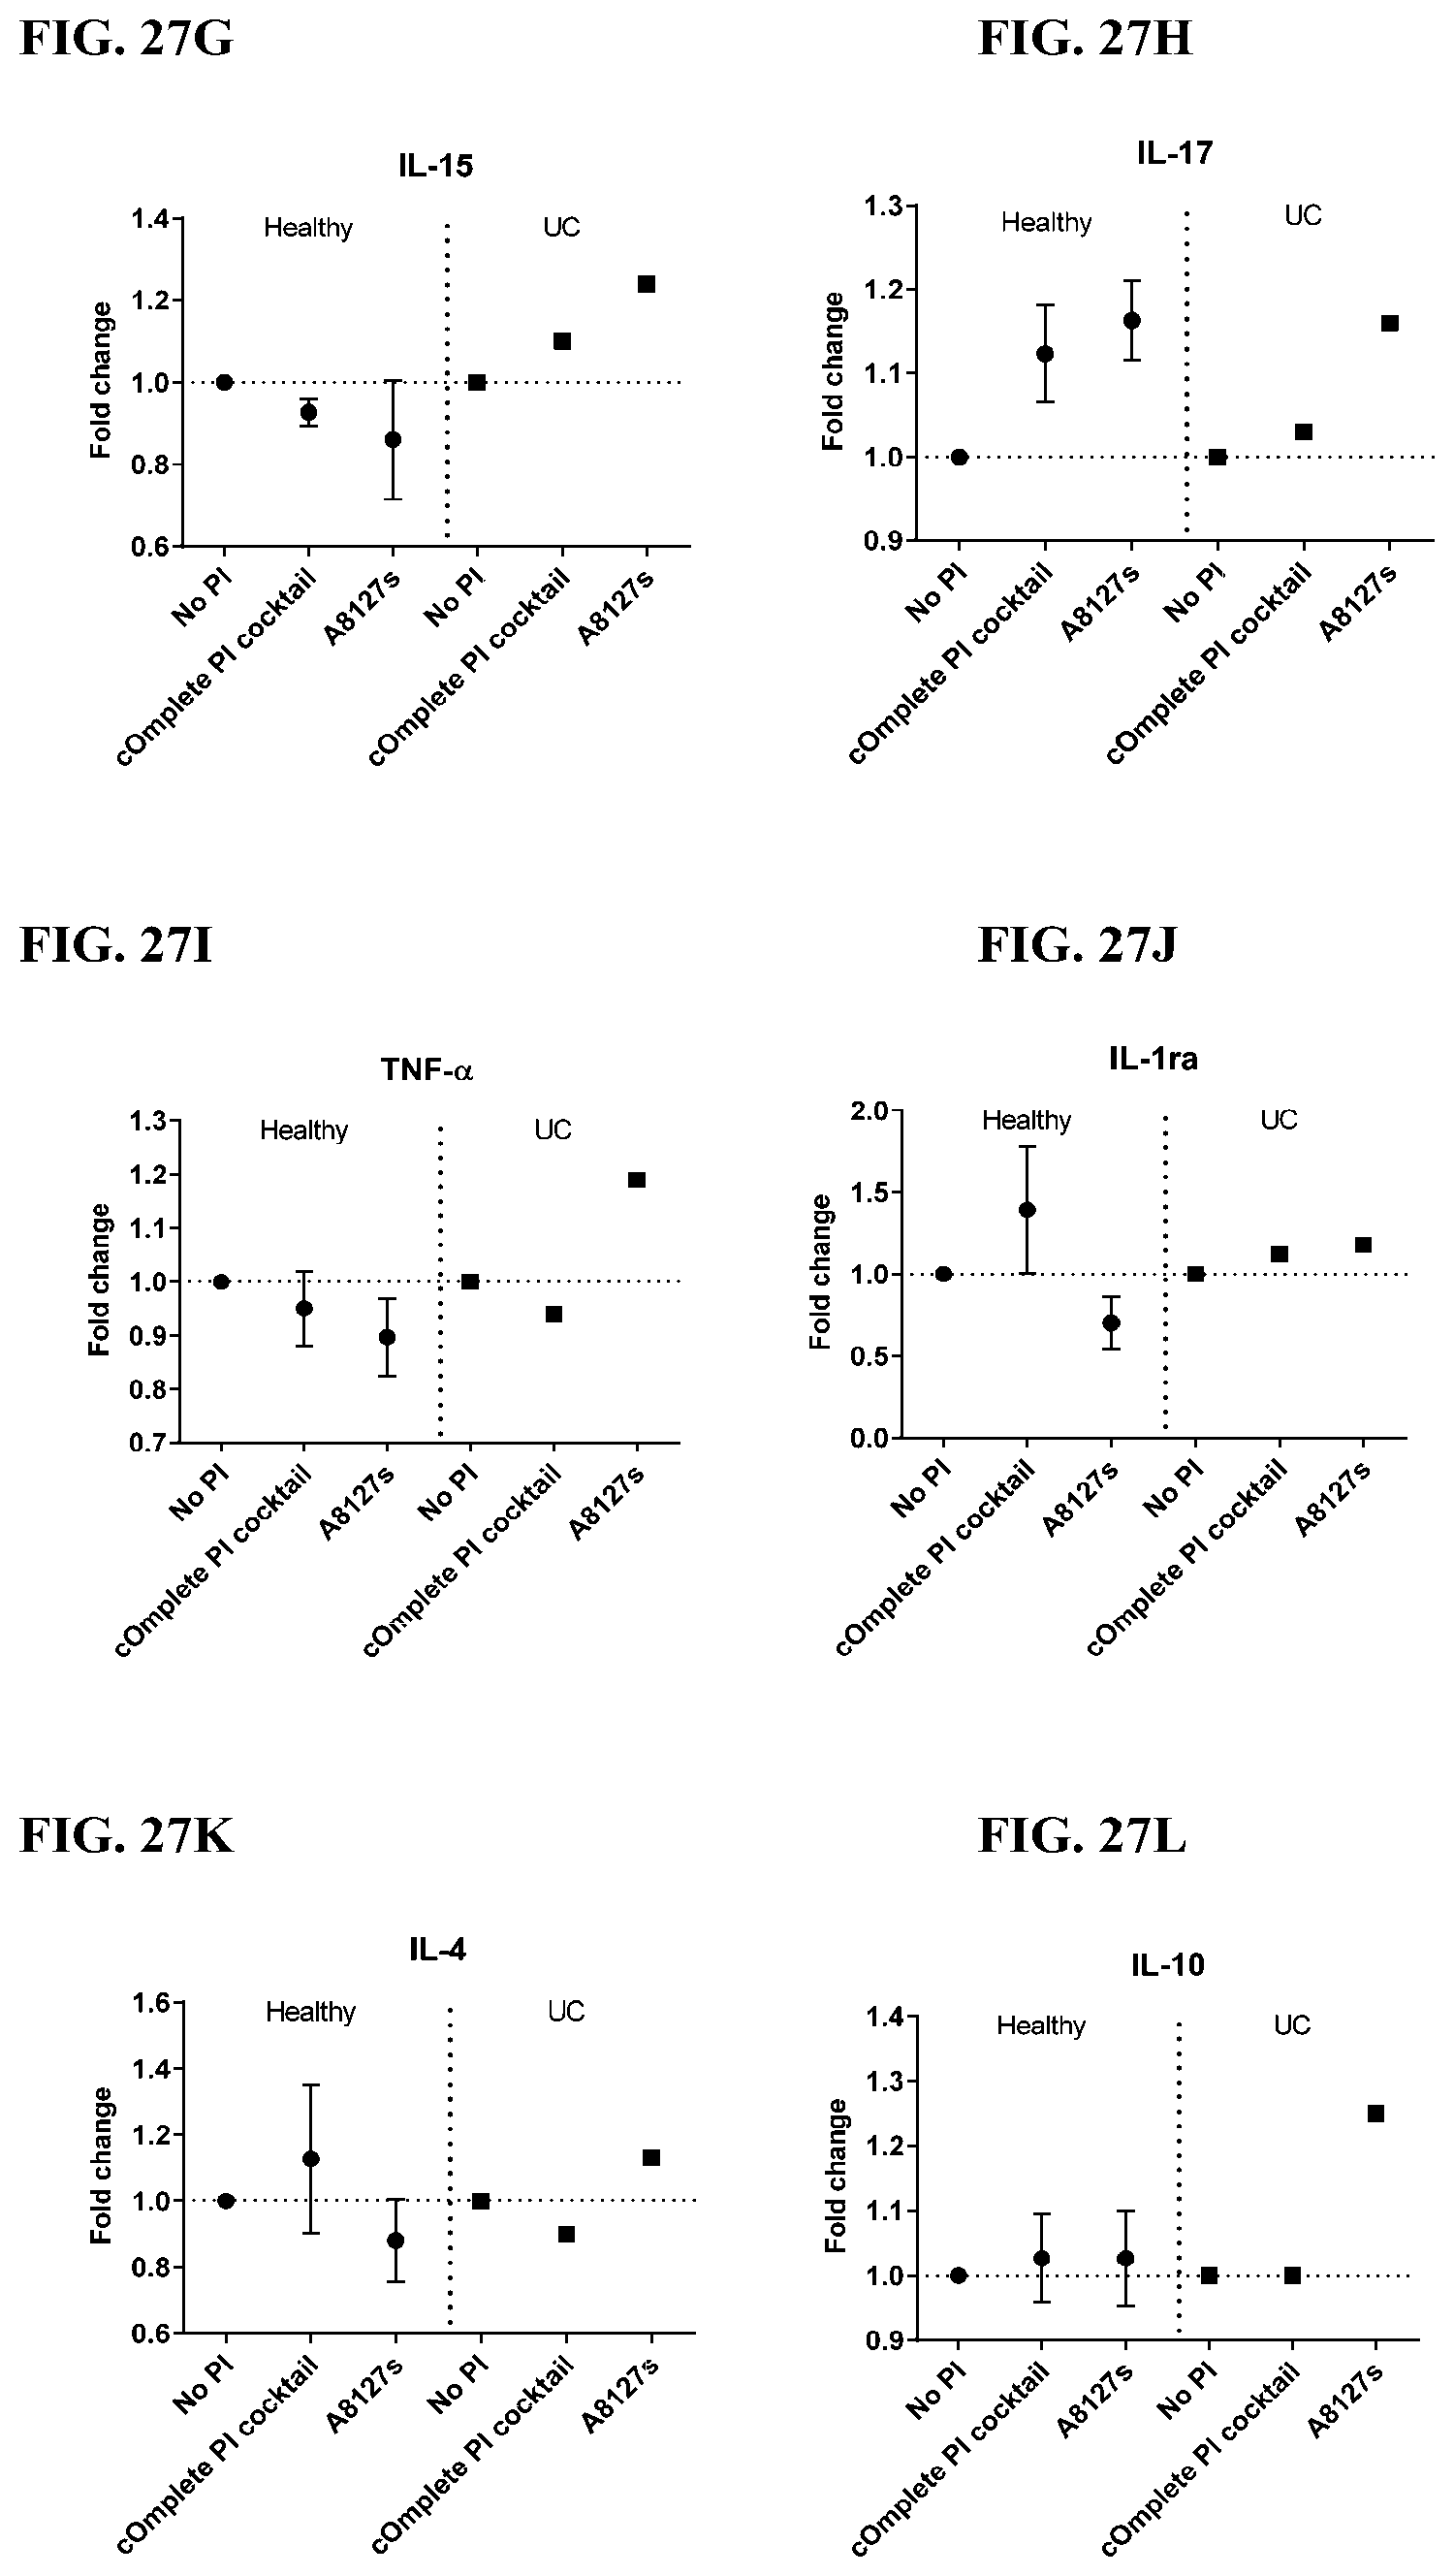
D00187
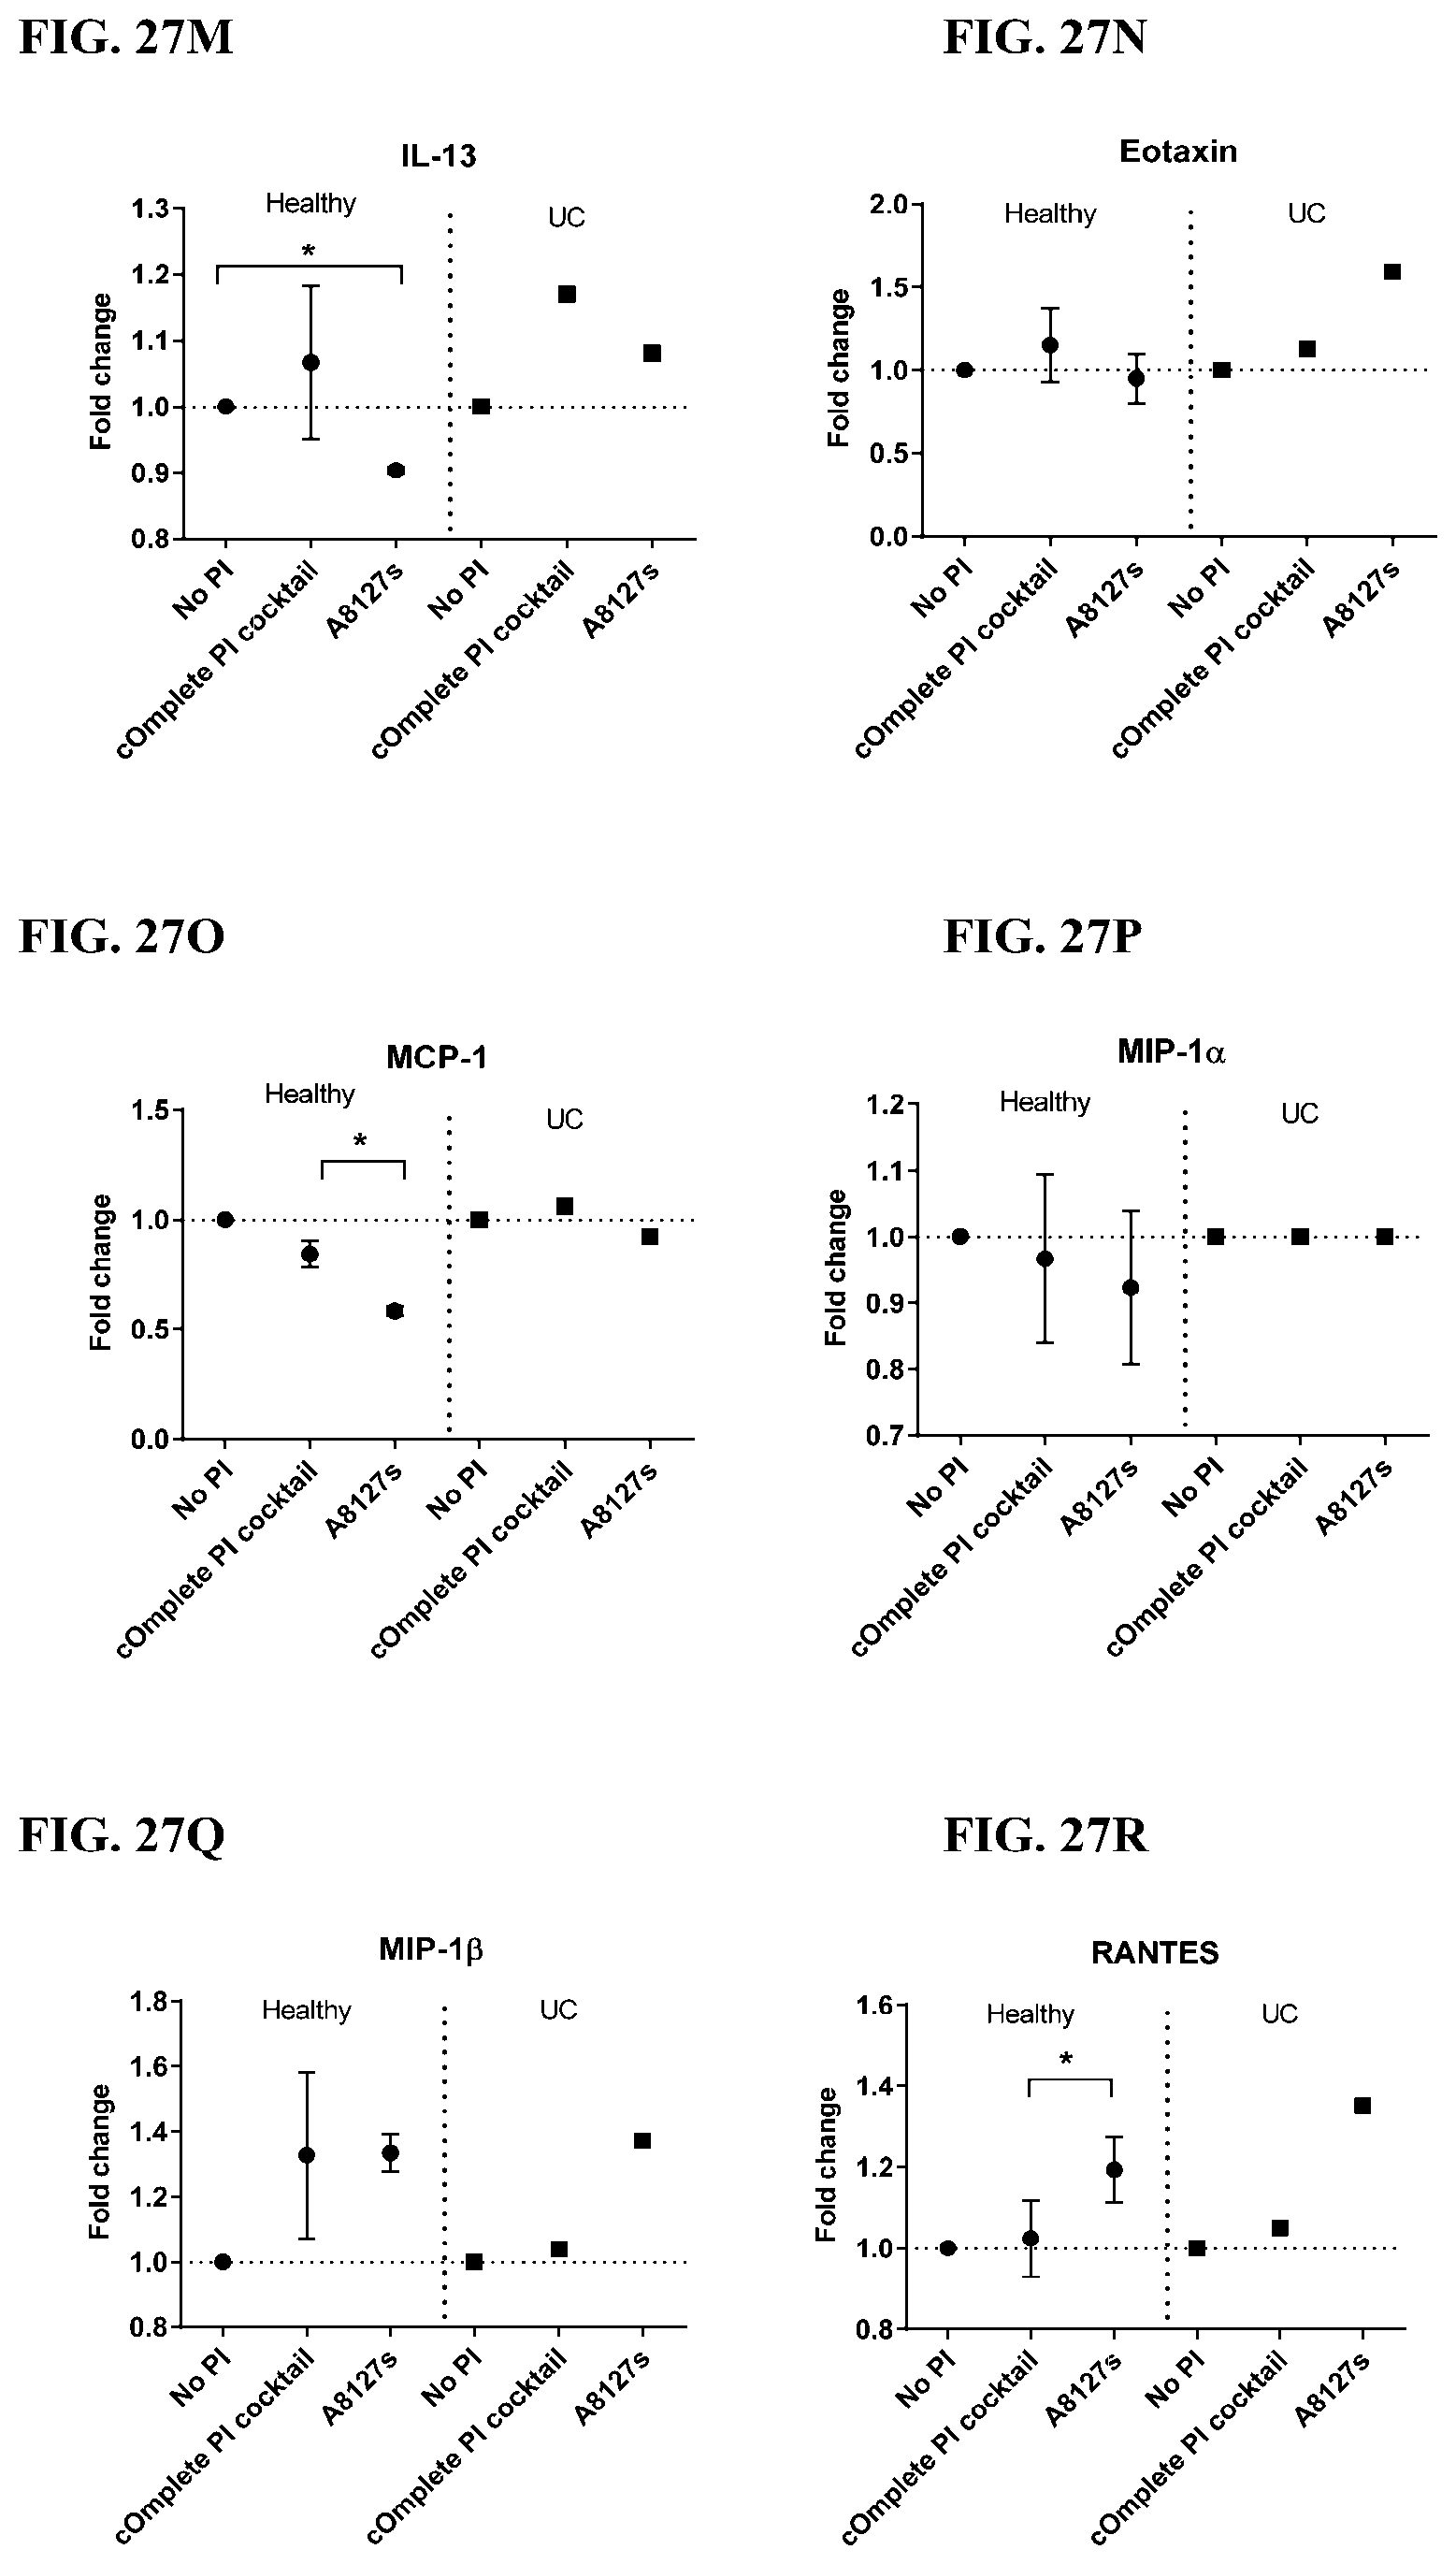
D00188
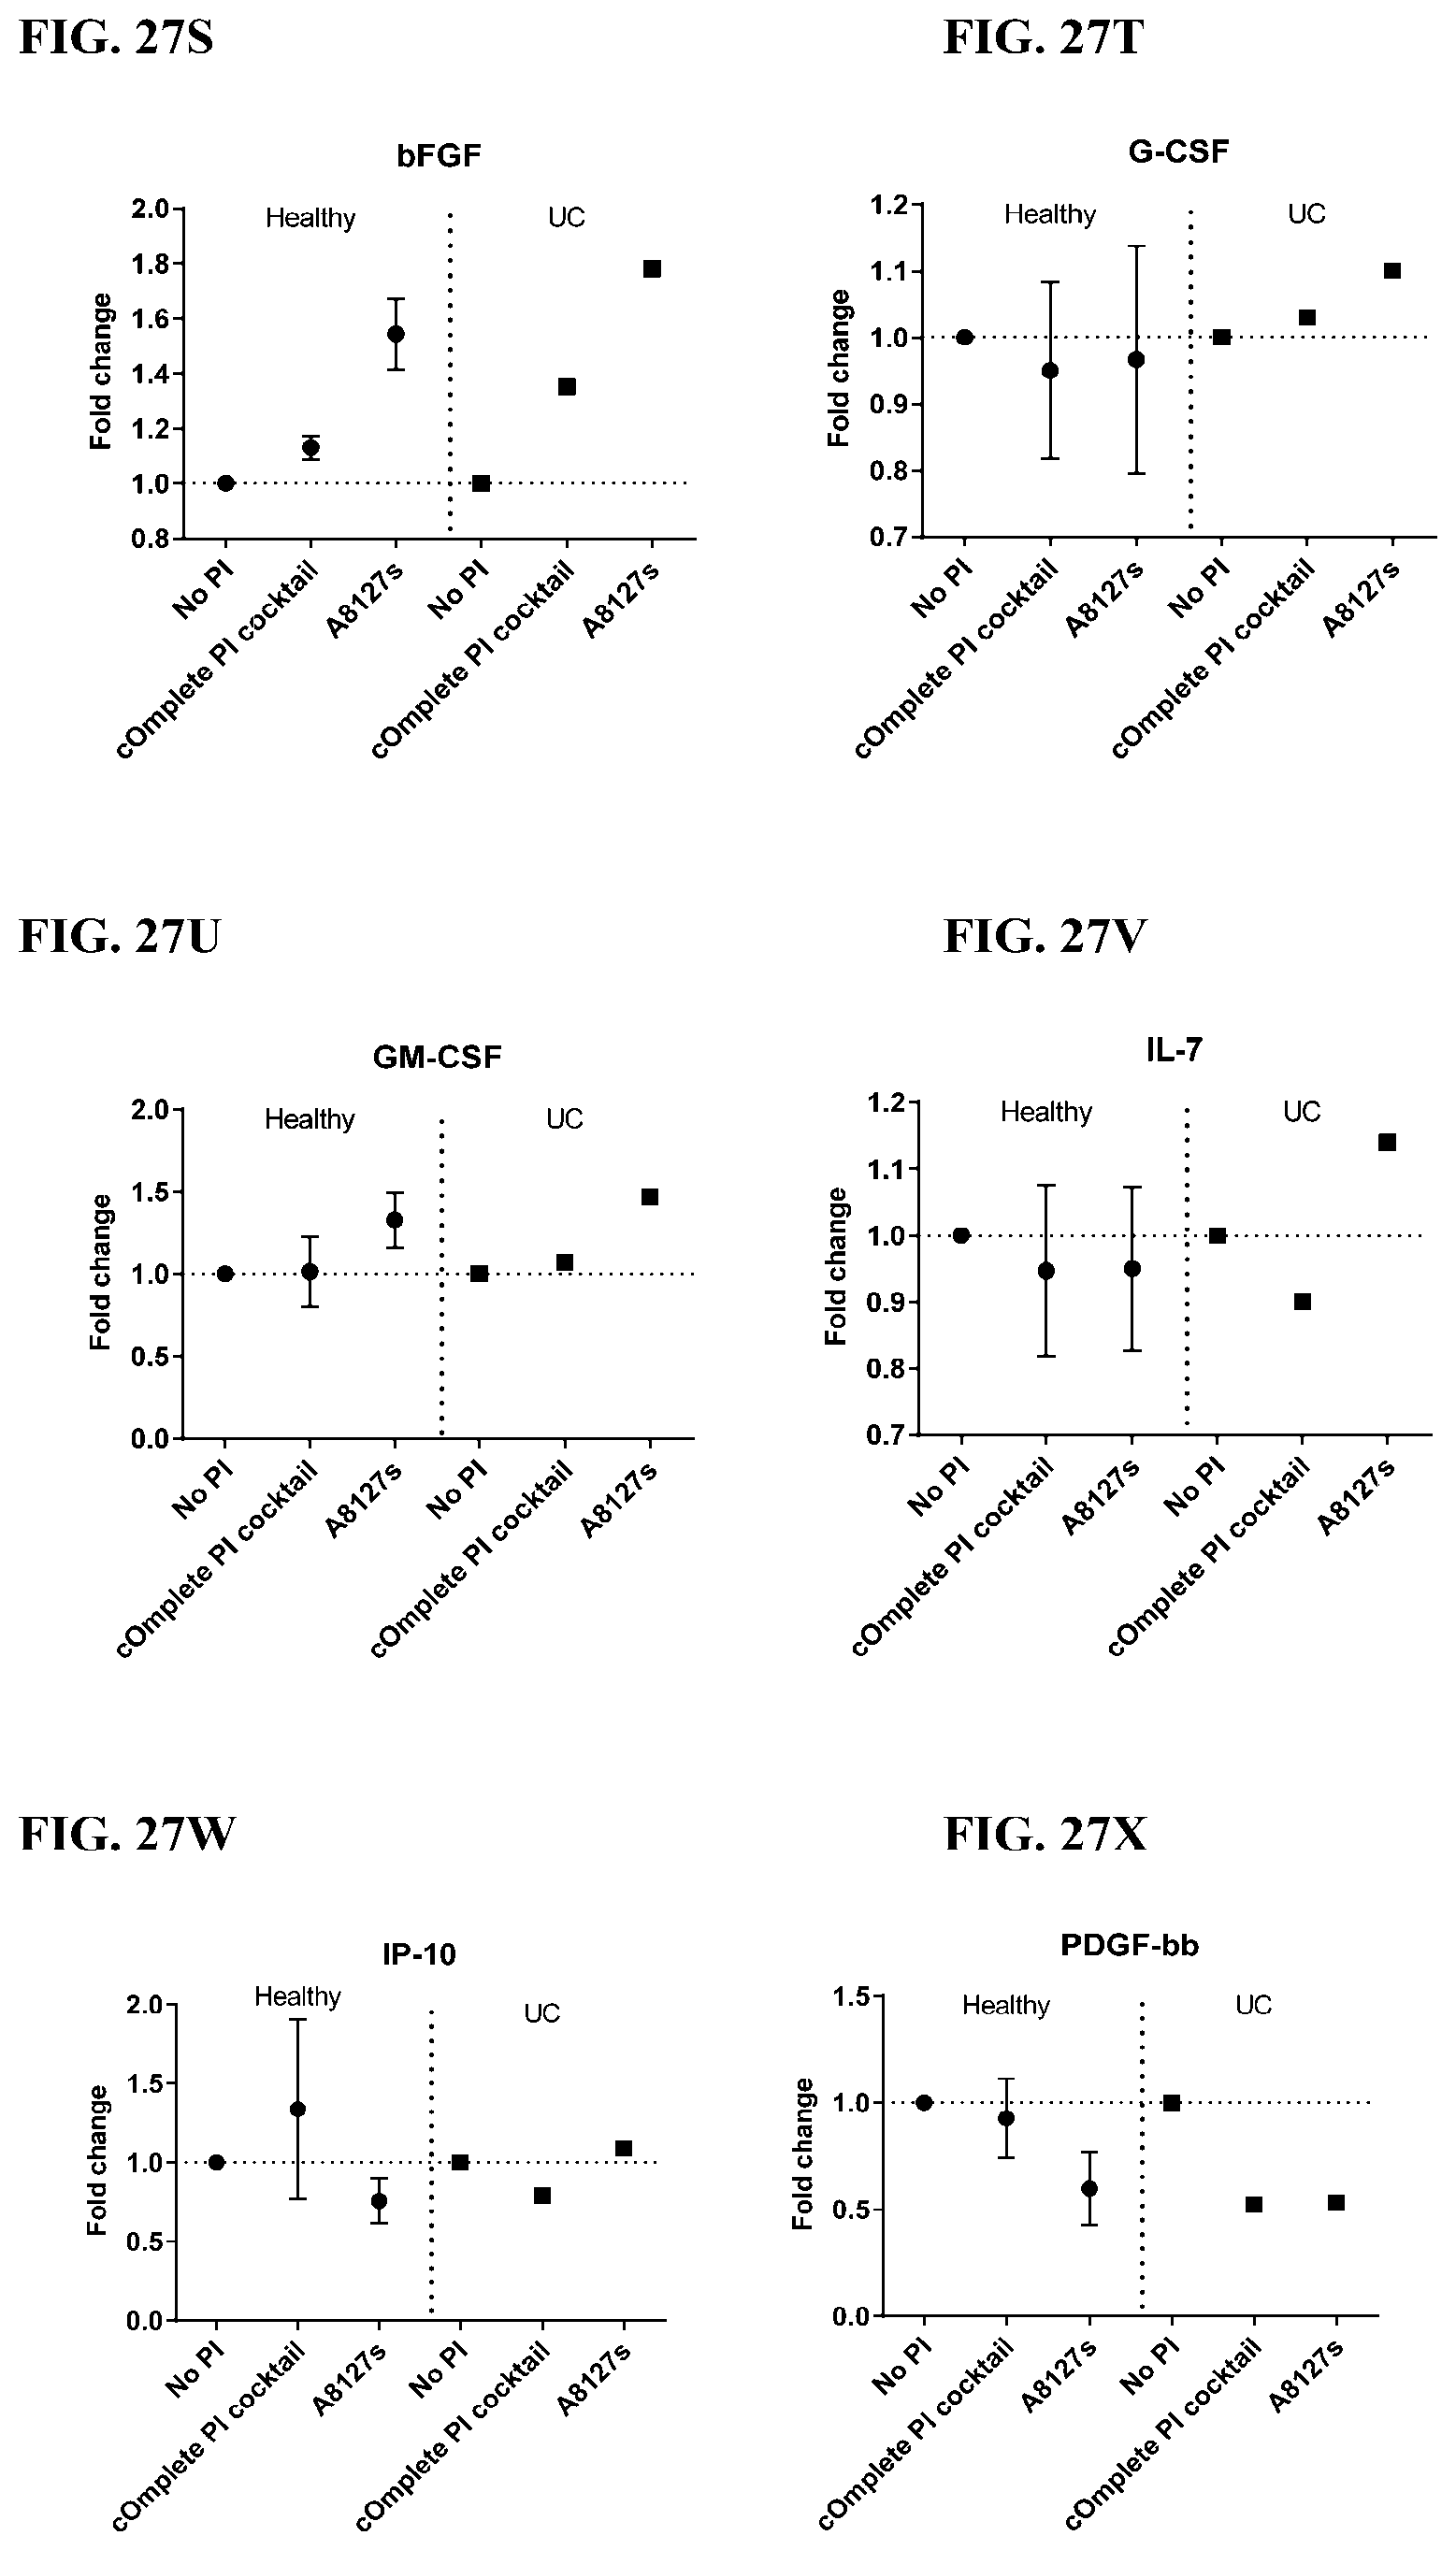
D00189
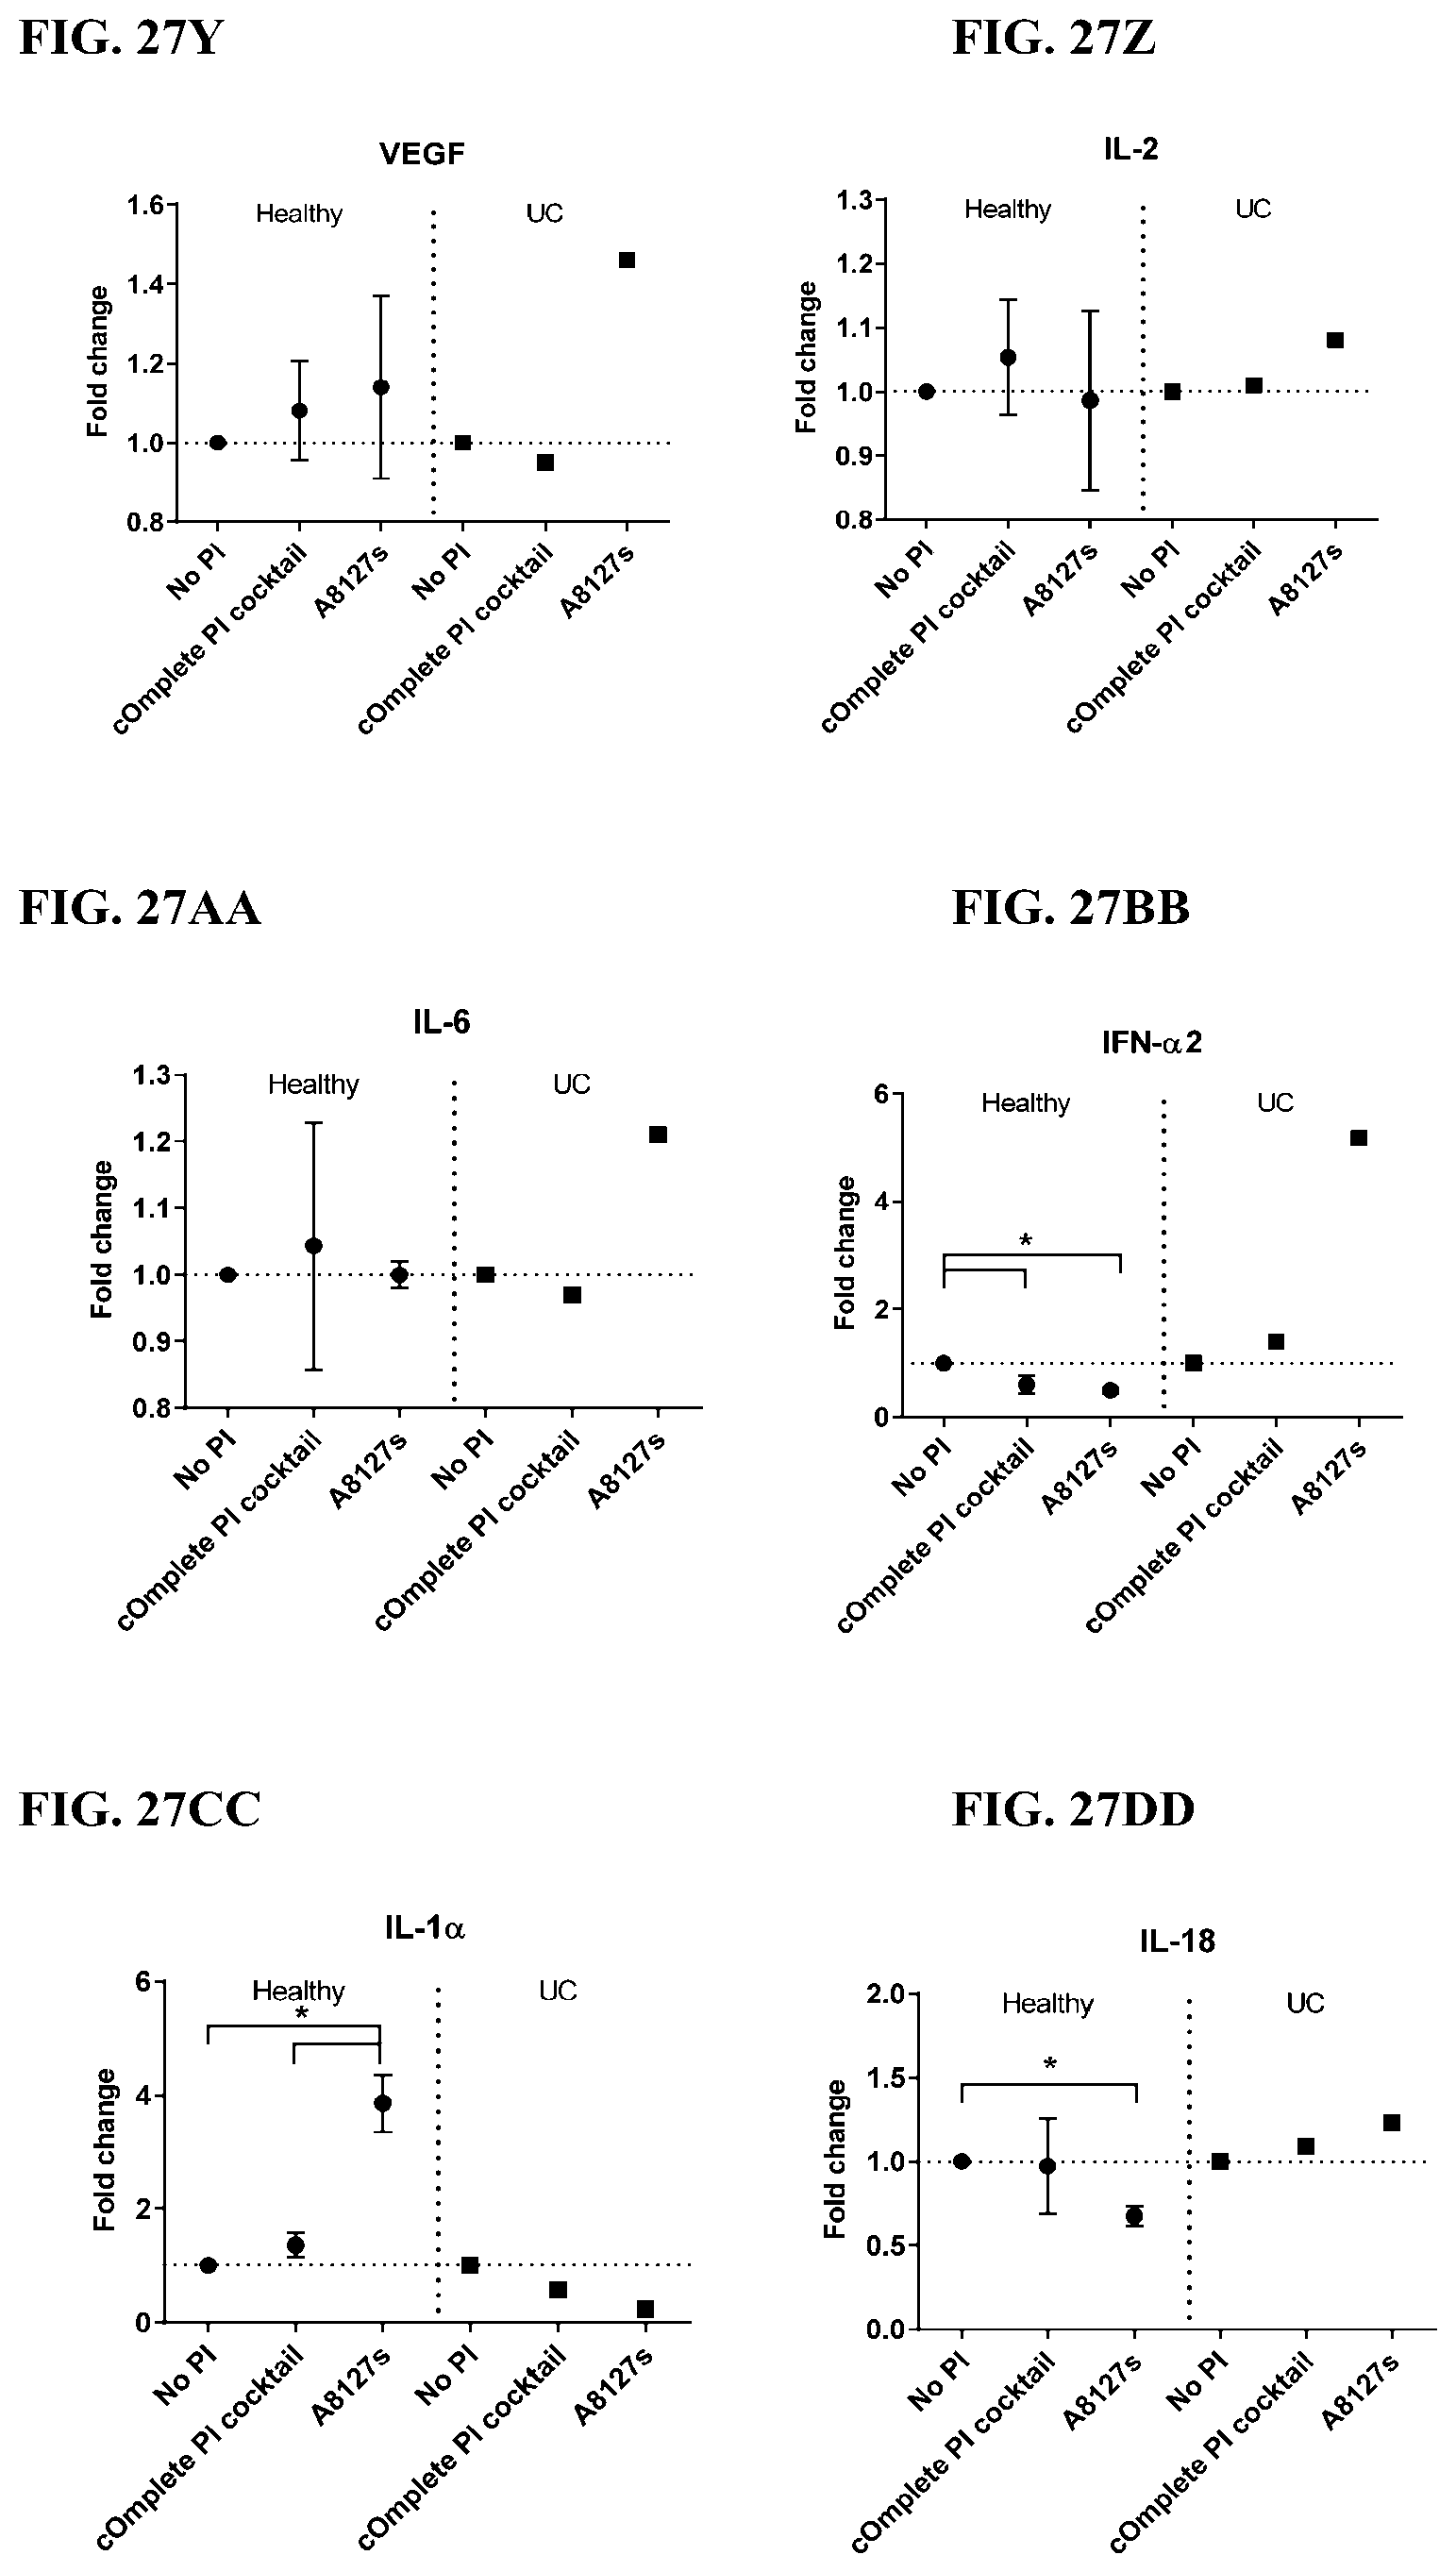
D00190

D00191

D00192
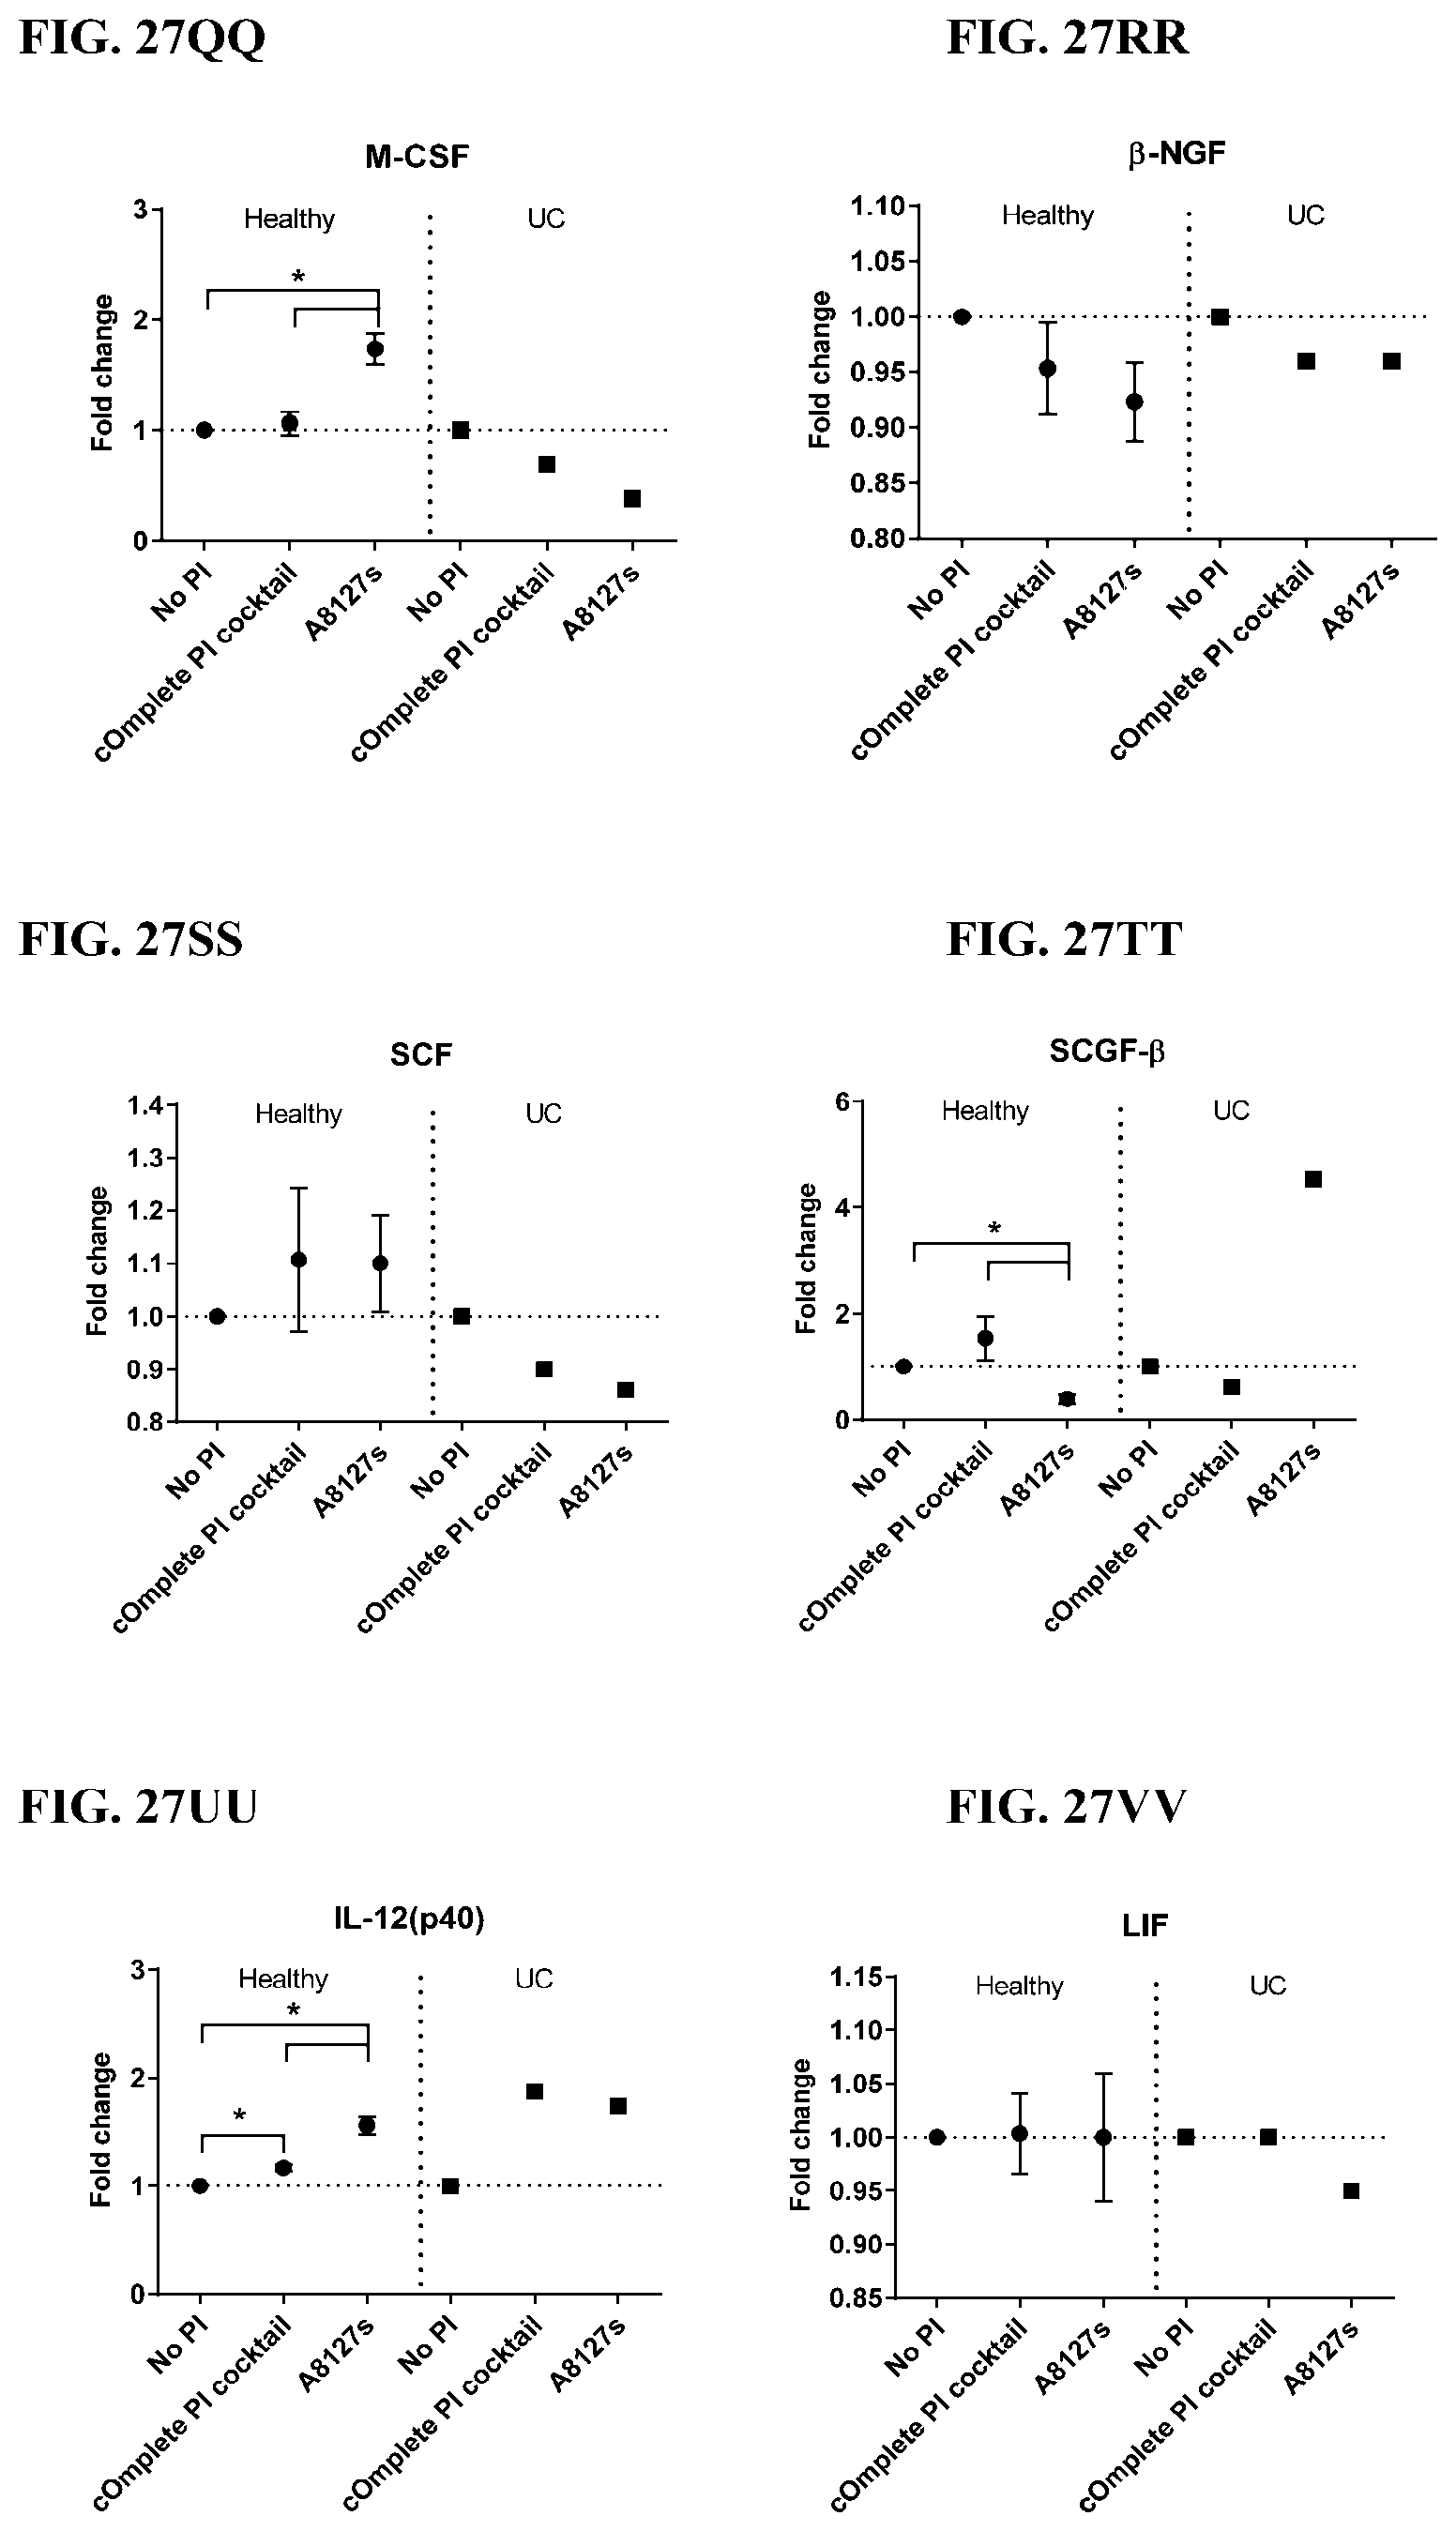
D00193

D00194

D00195
D00196
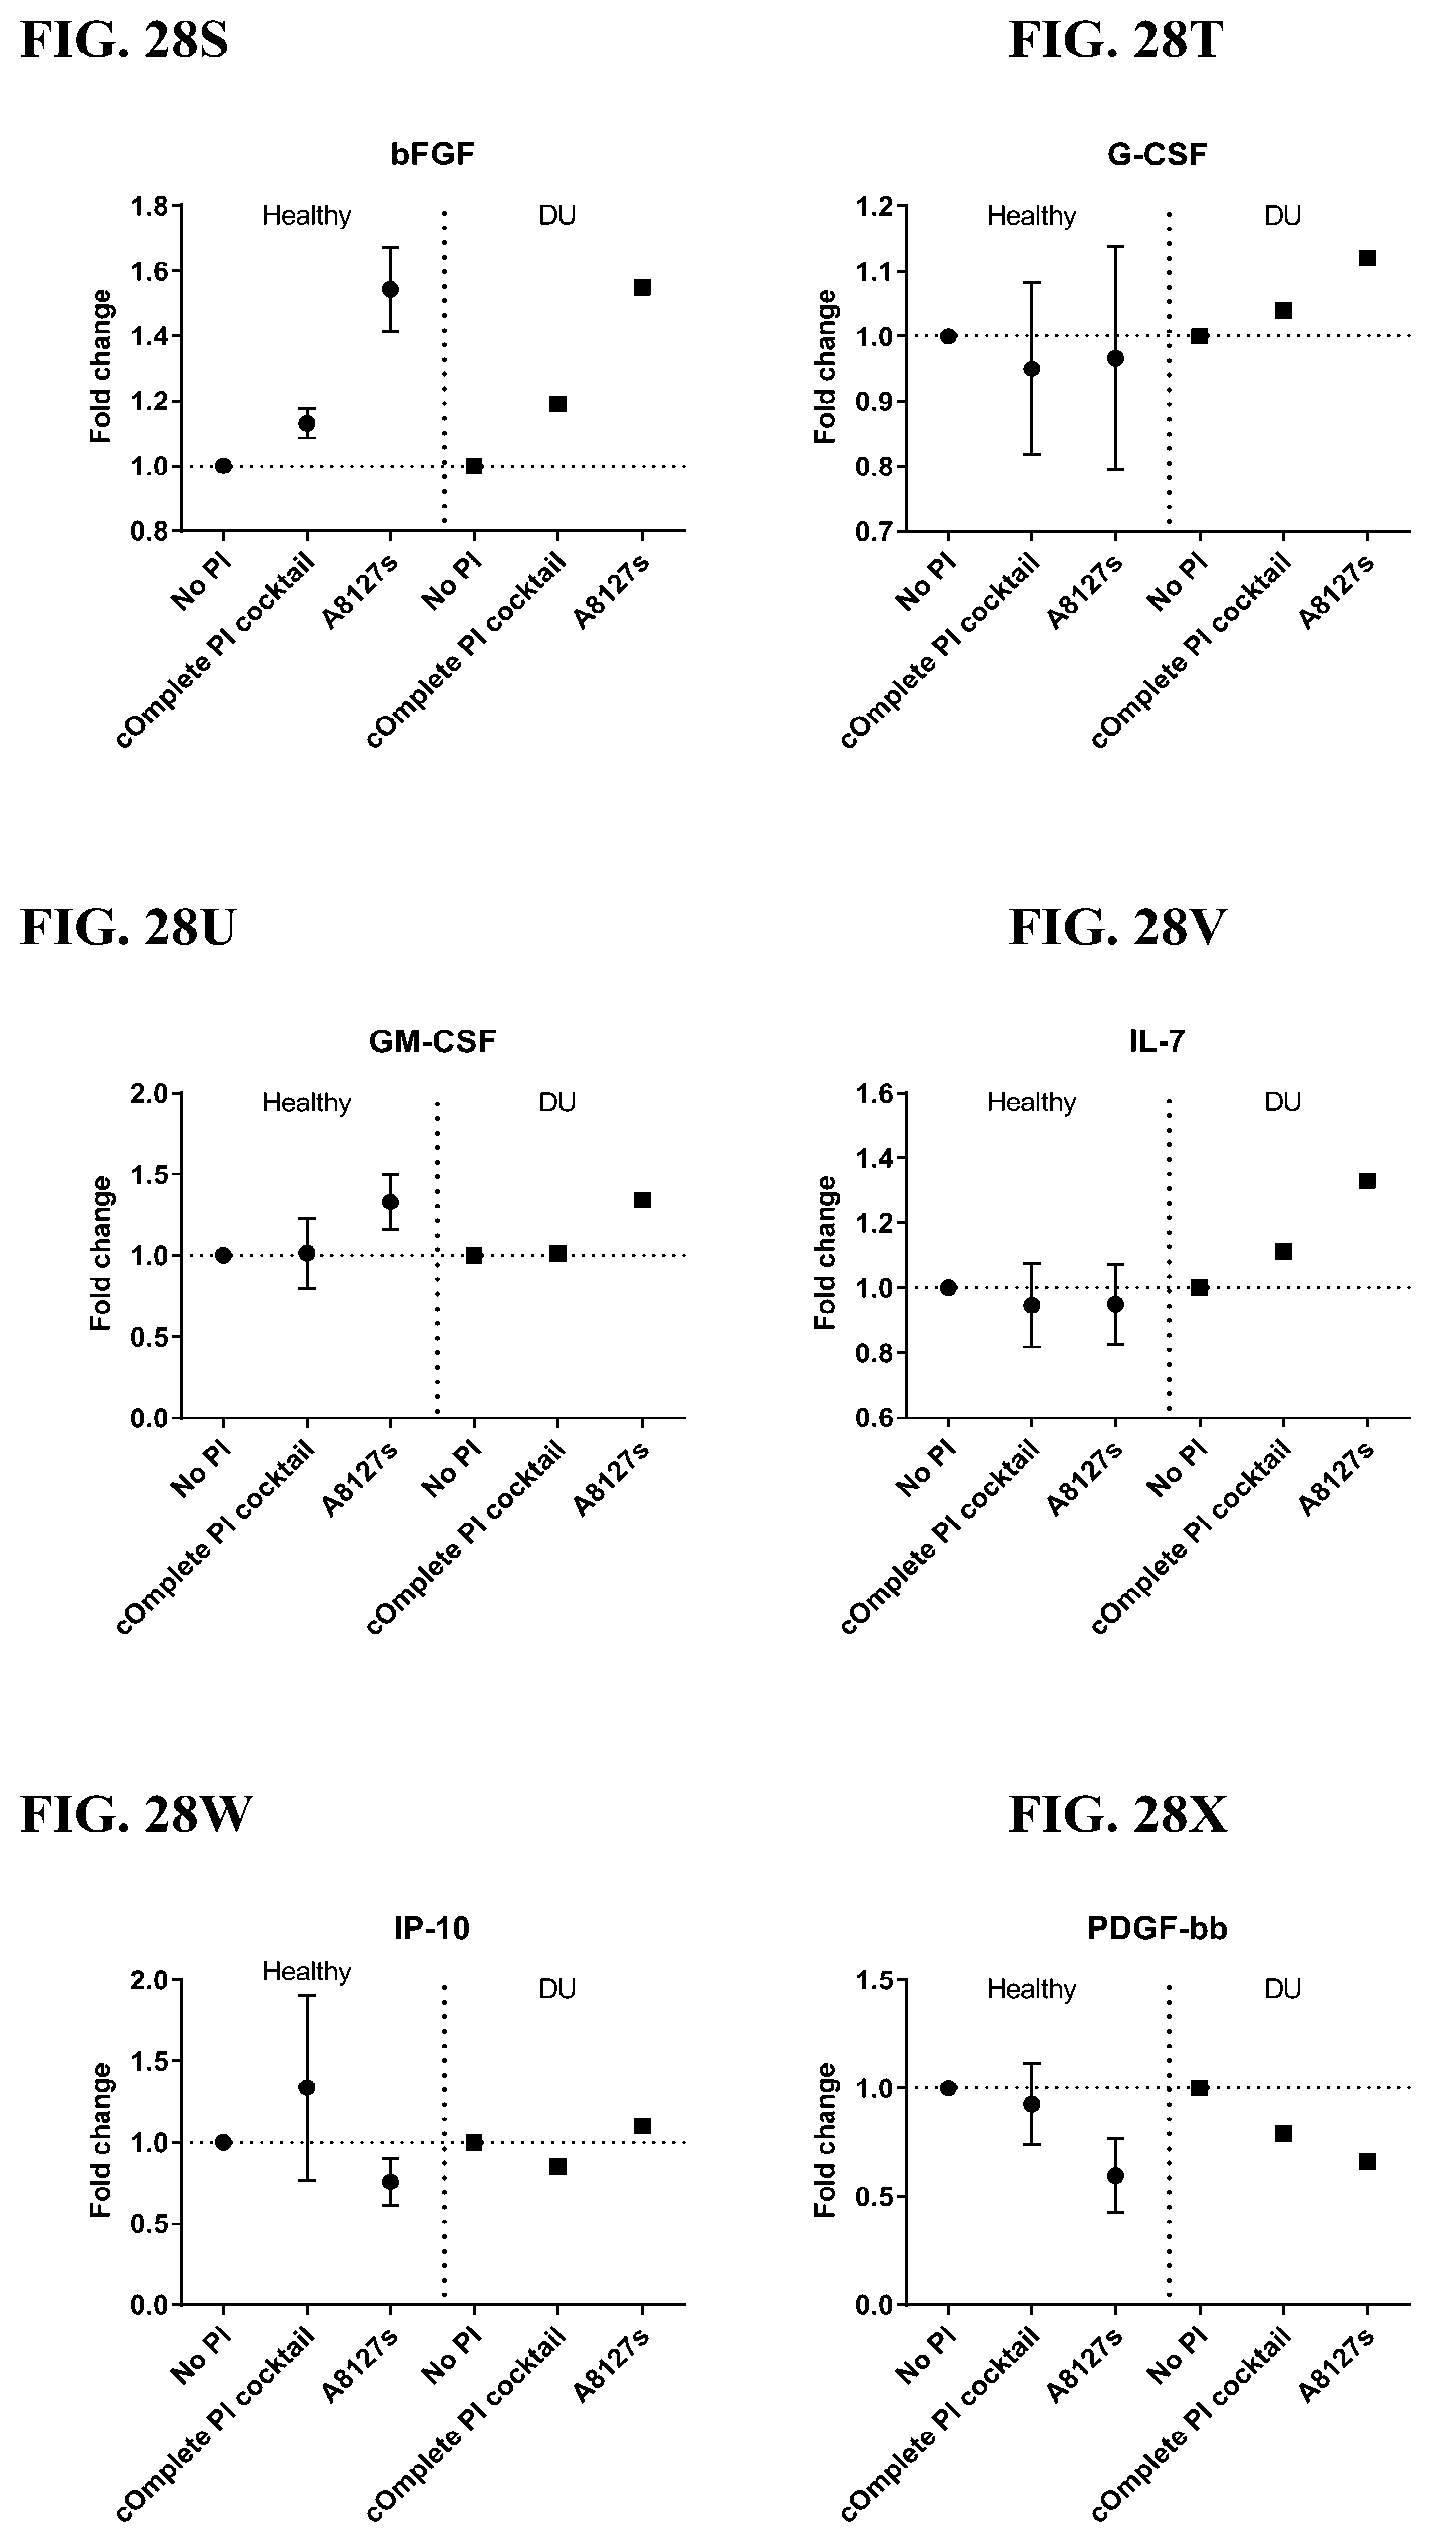
D00197

D00198

D00199

D00200

D00201

D00202

D00203

D00204

D00205

D00206

D00207
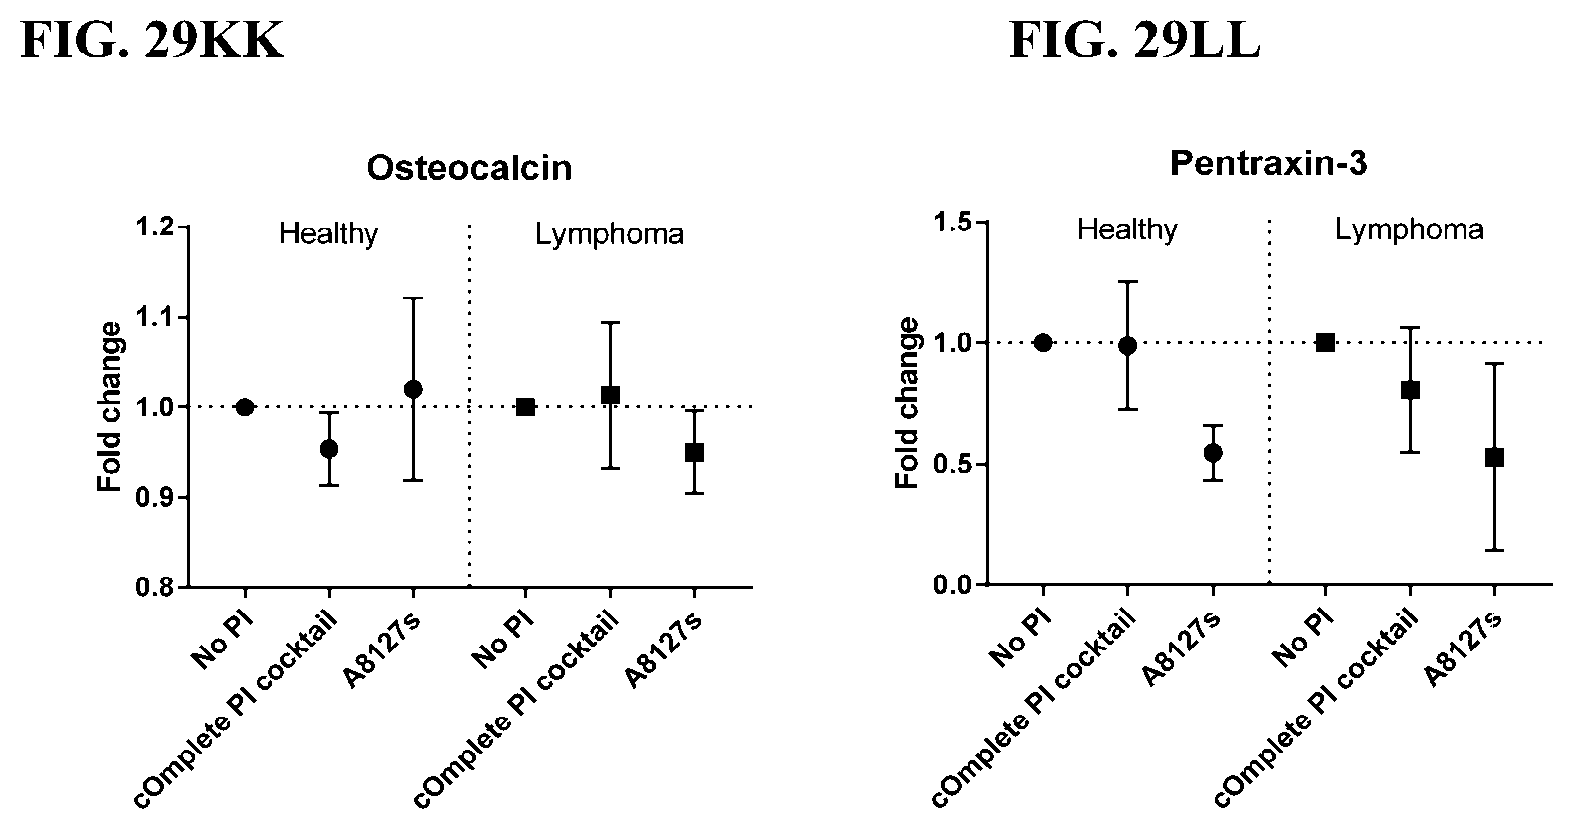
D00208

D00209

D00210
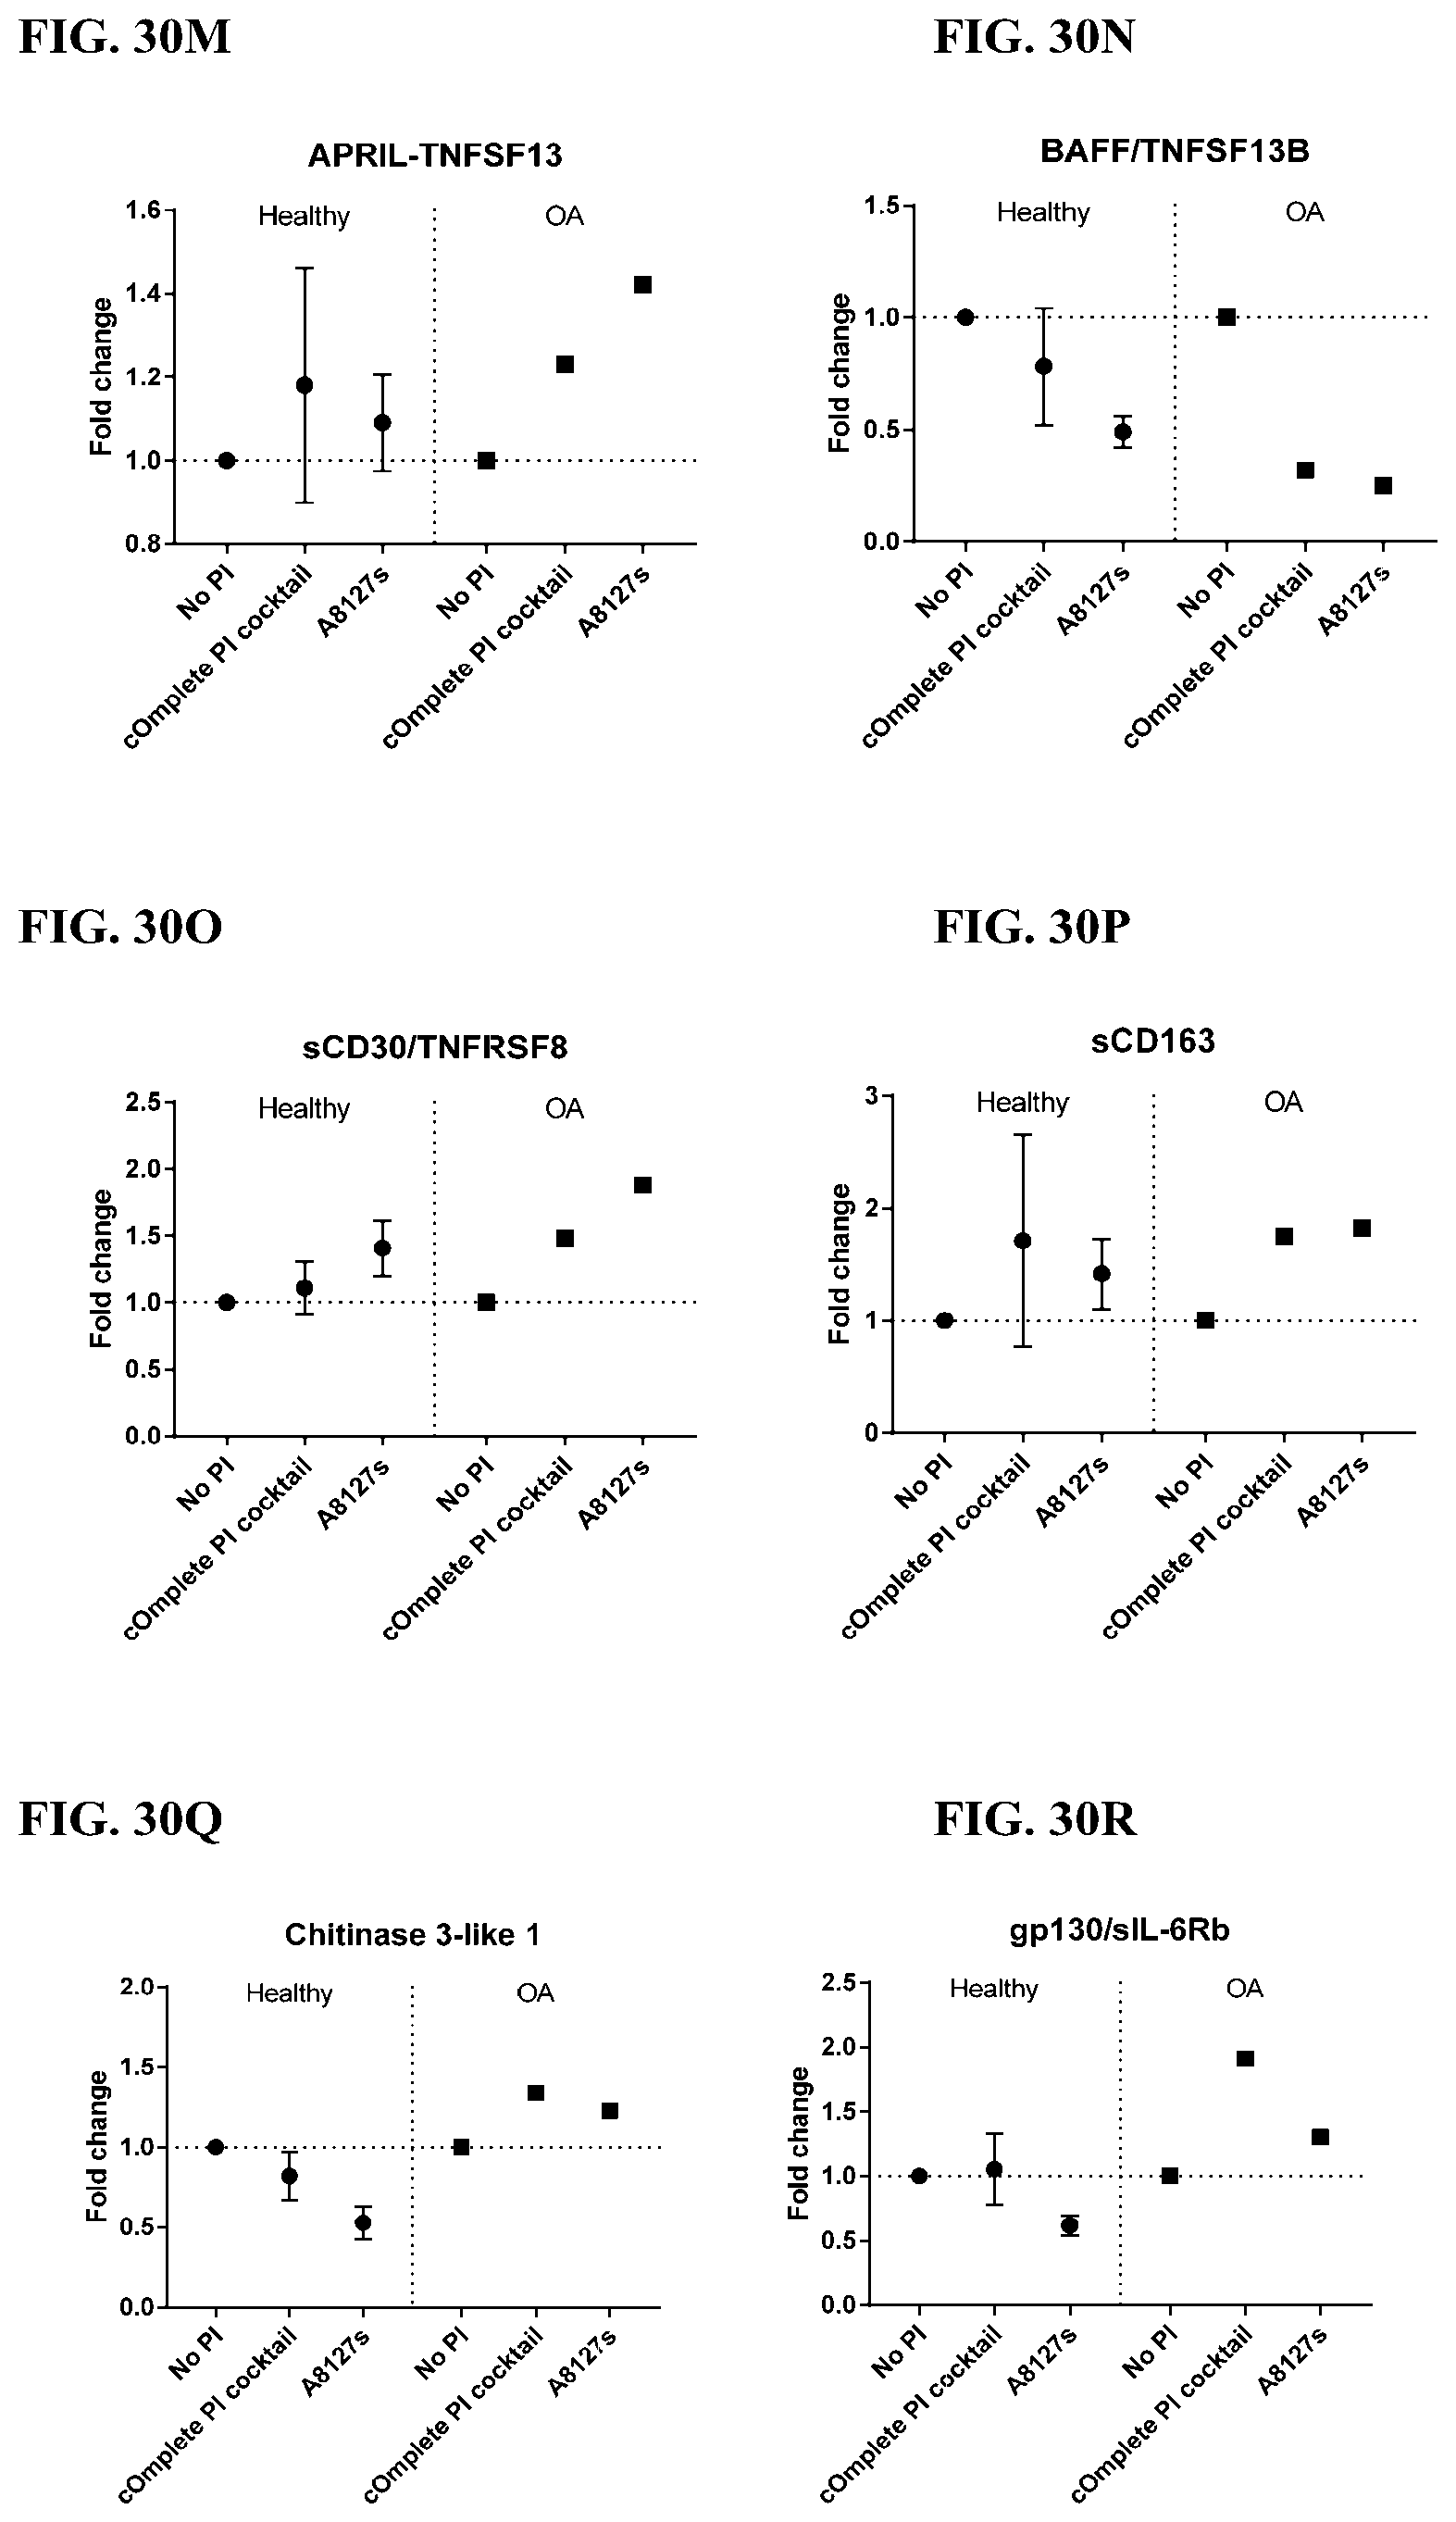
D00211

D00212
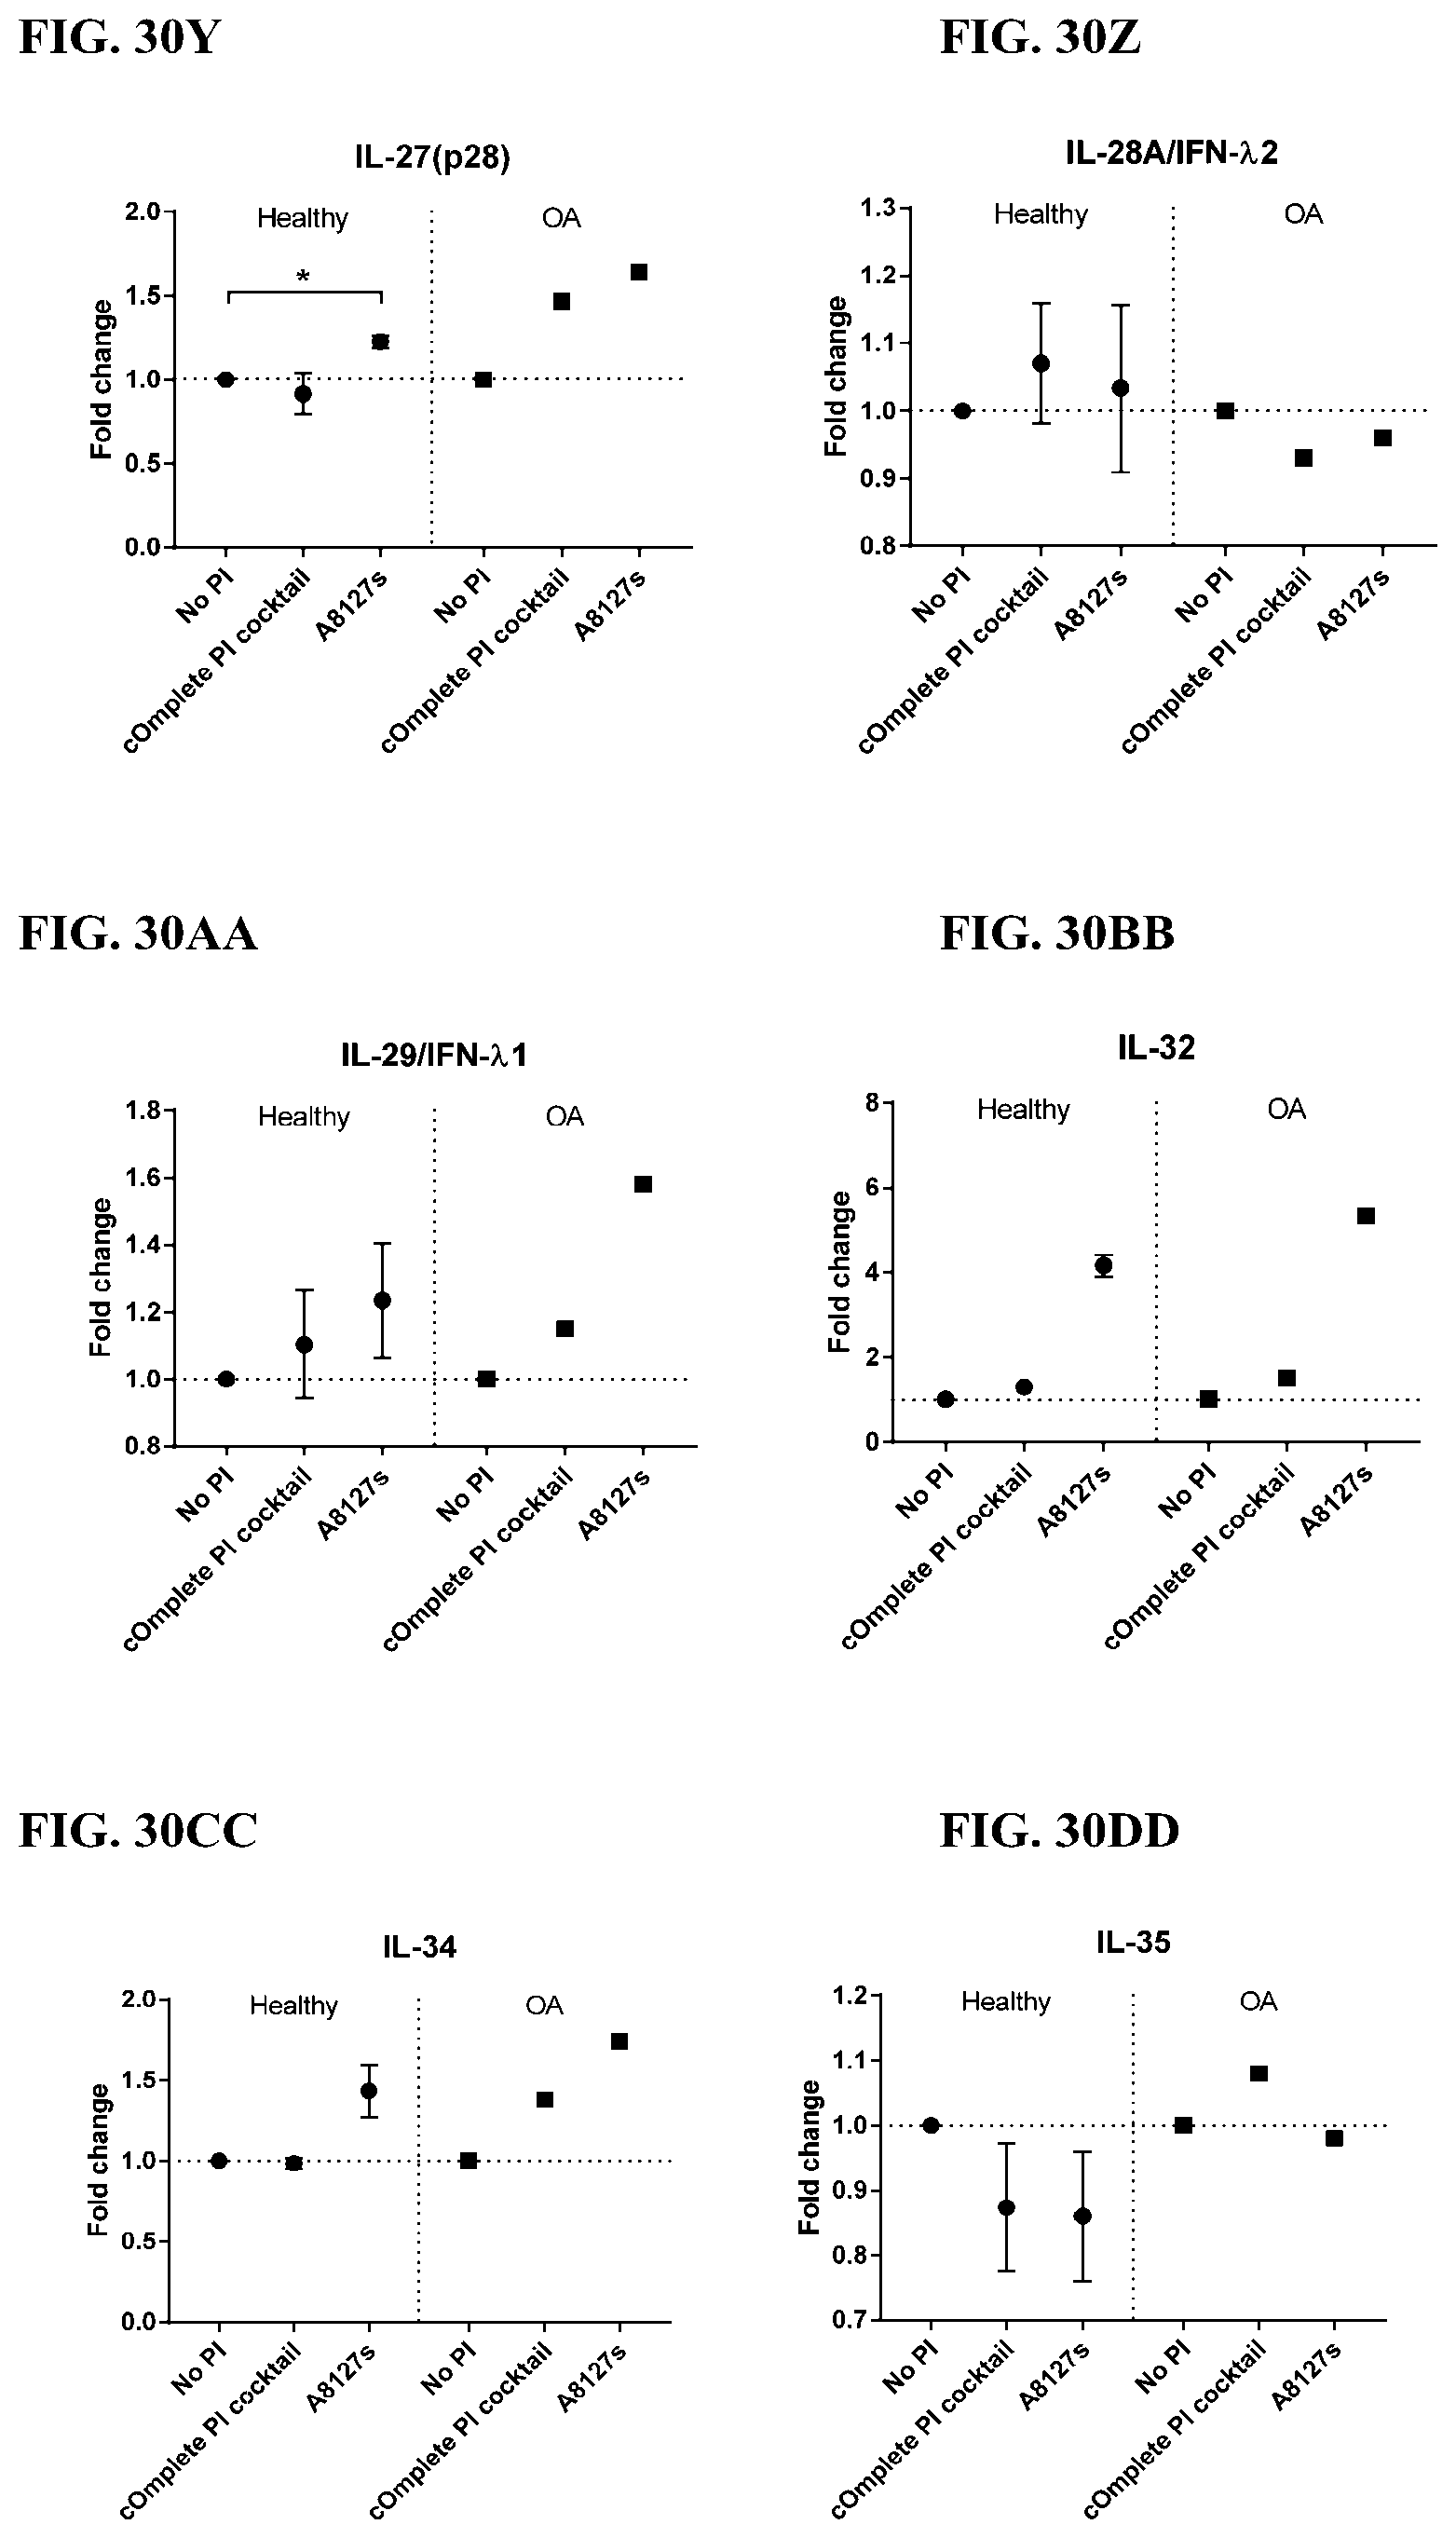
D00213

D00214

D00215
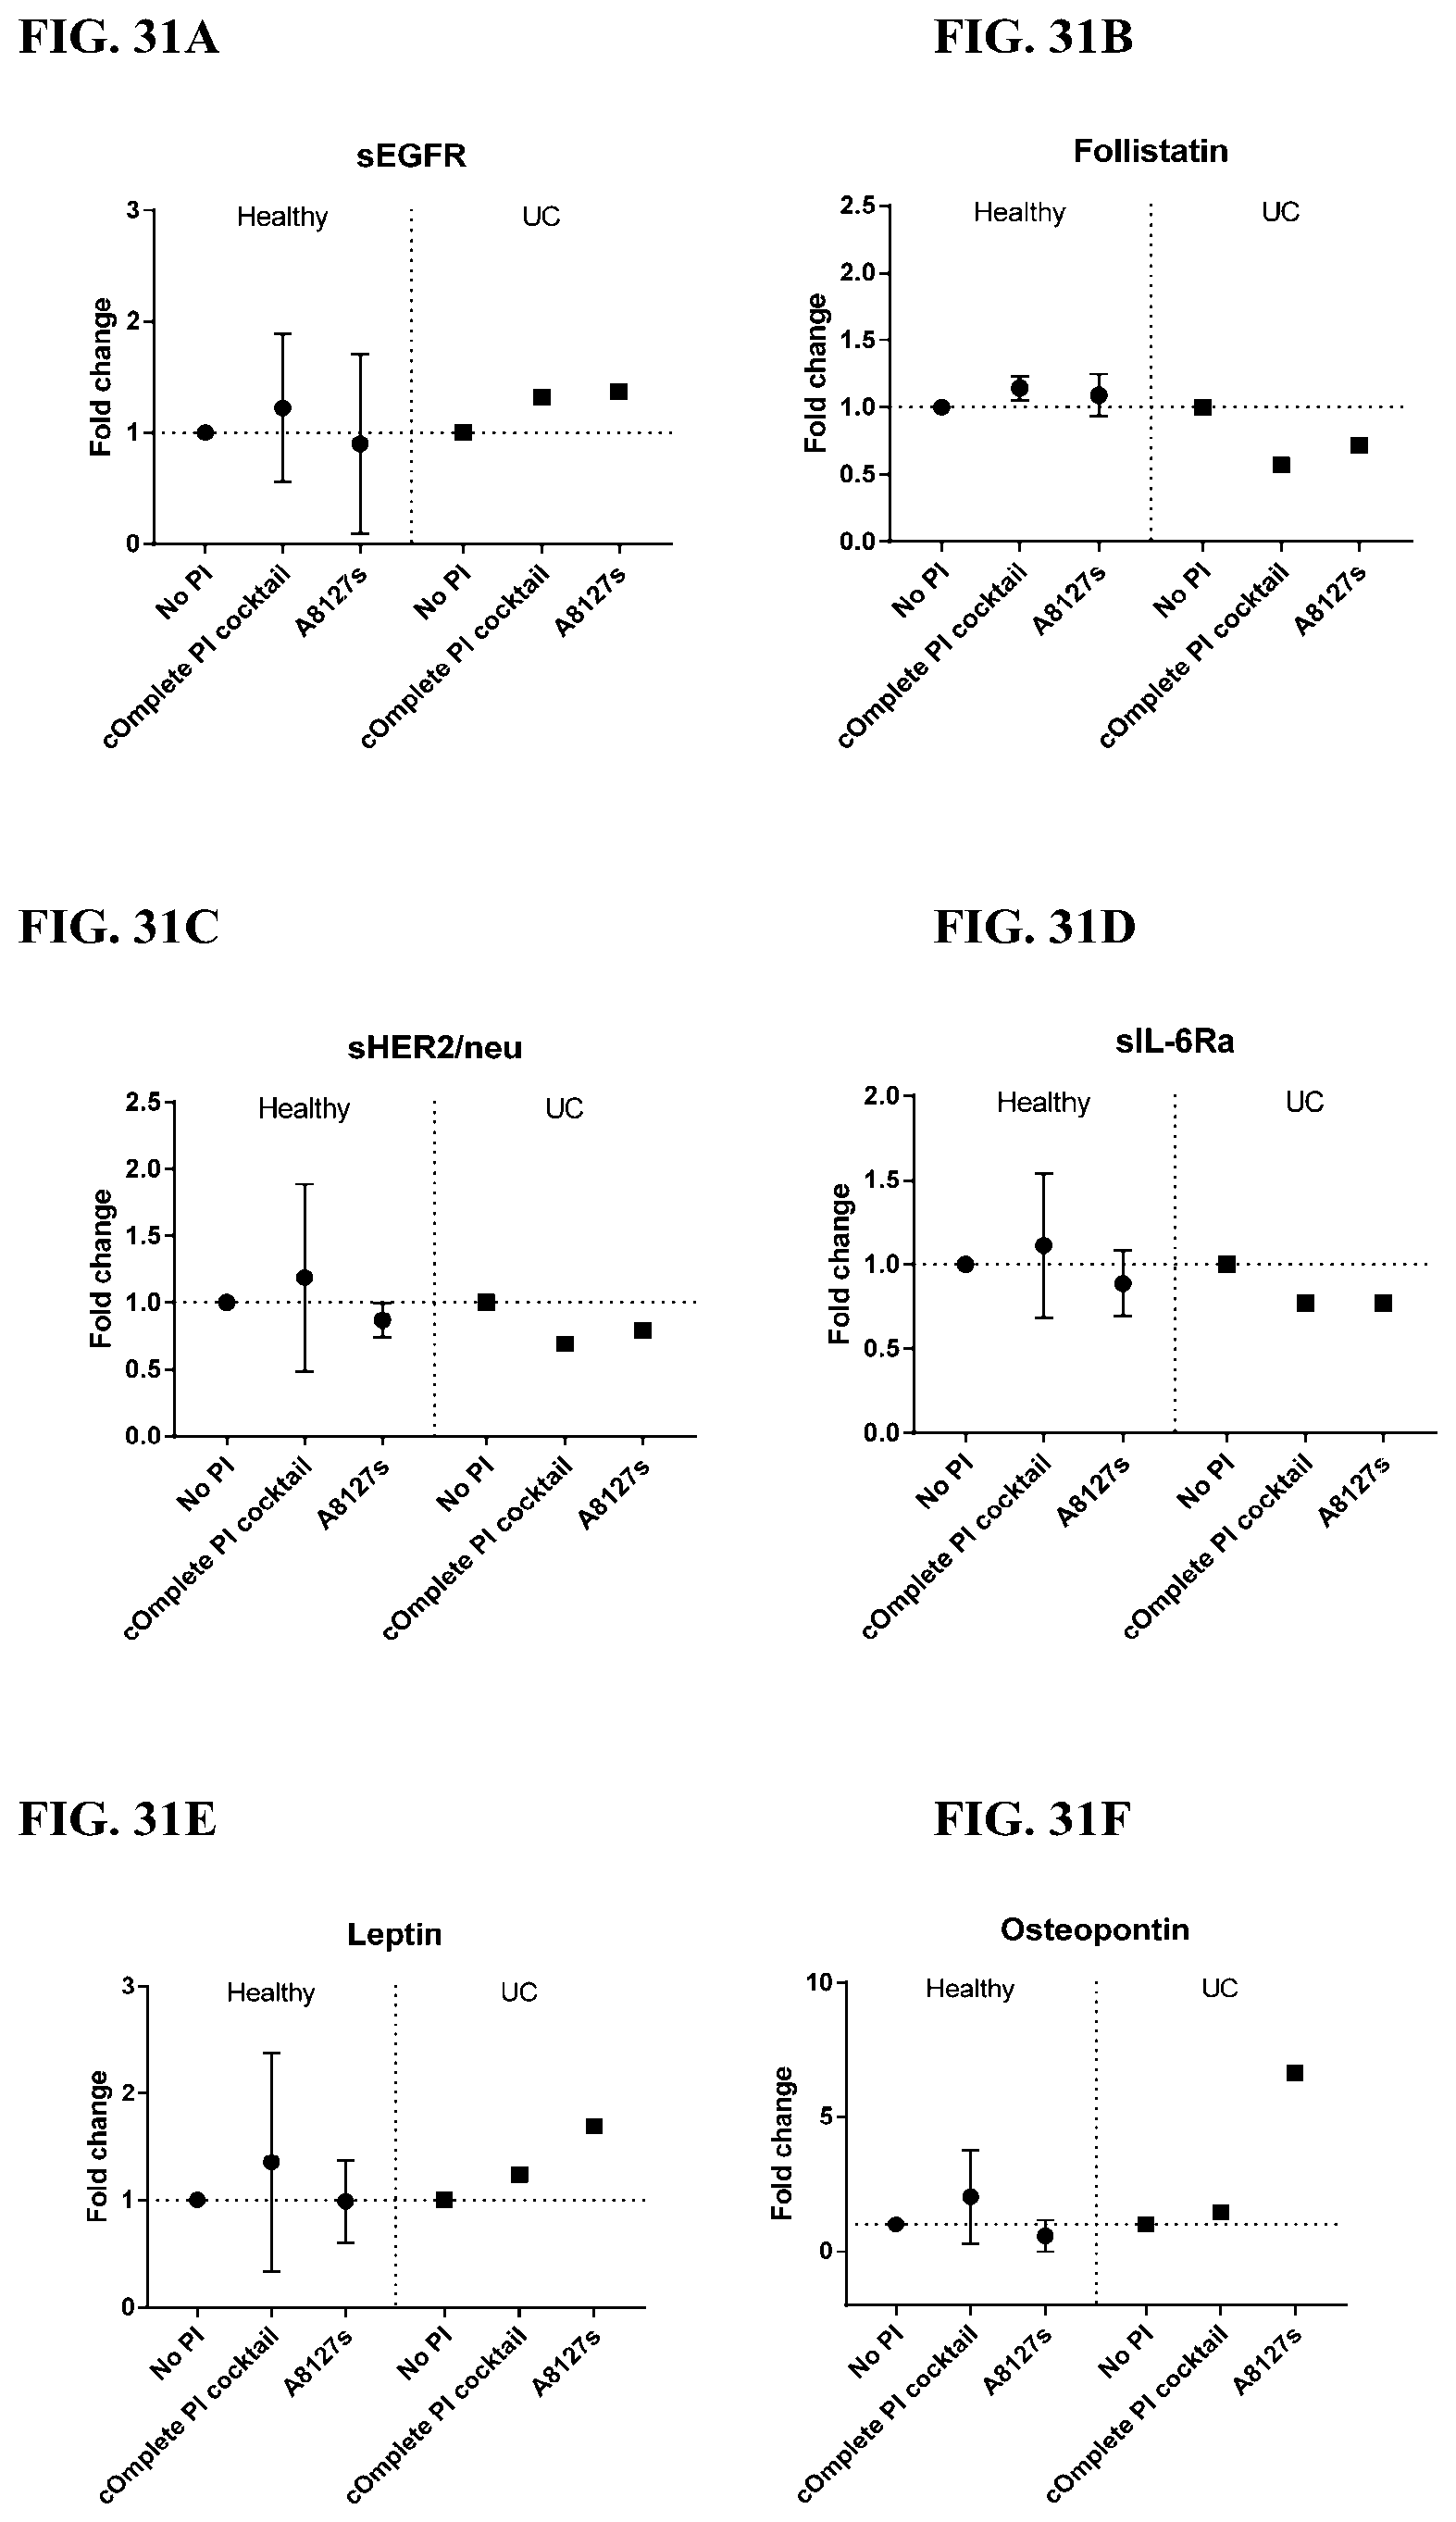
D00216

D00217

D00218
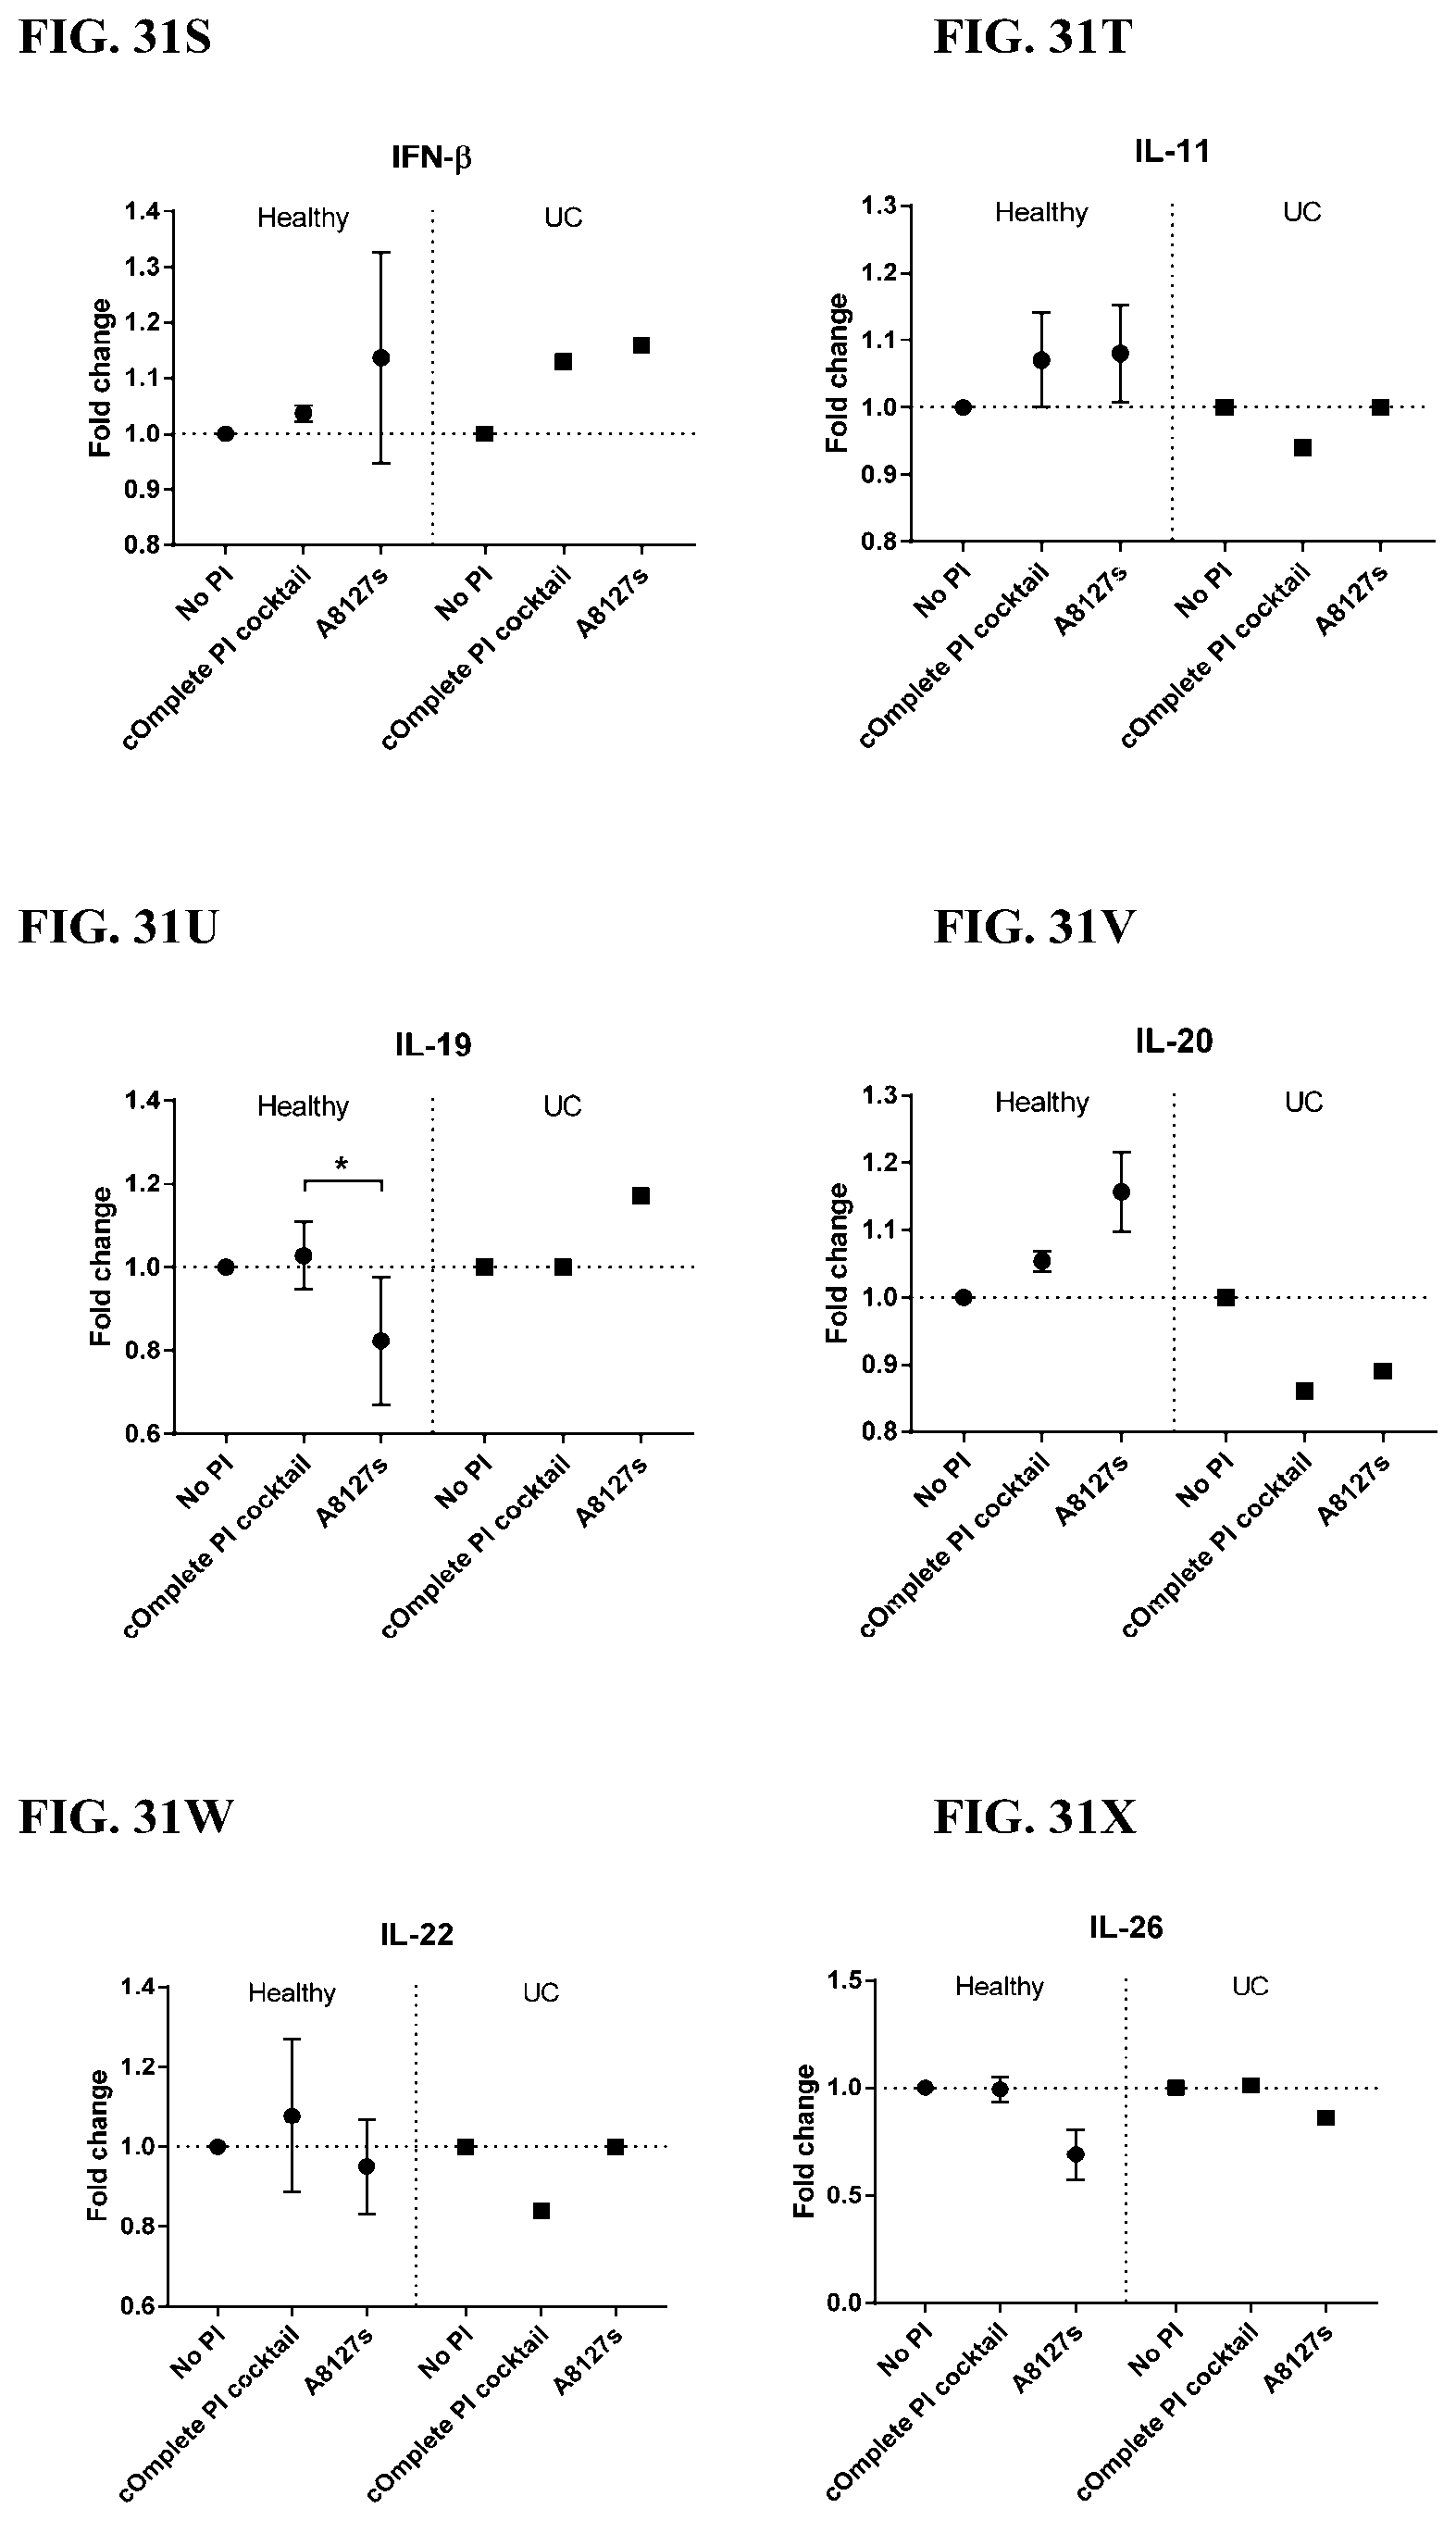
D00219

D00220
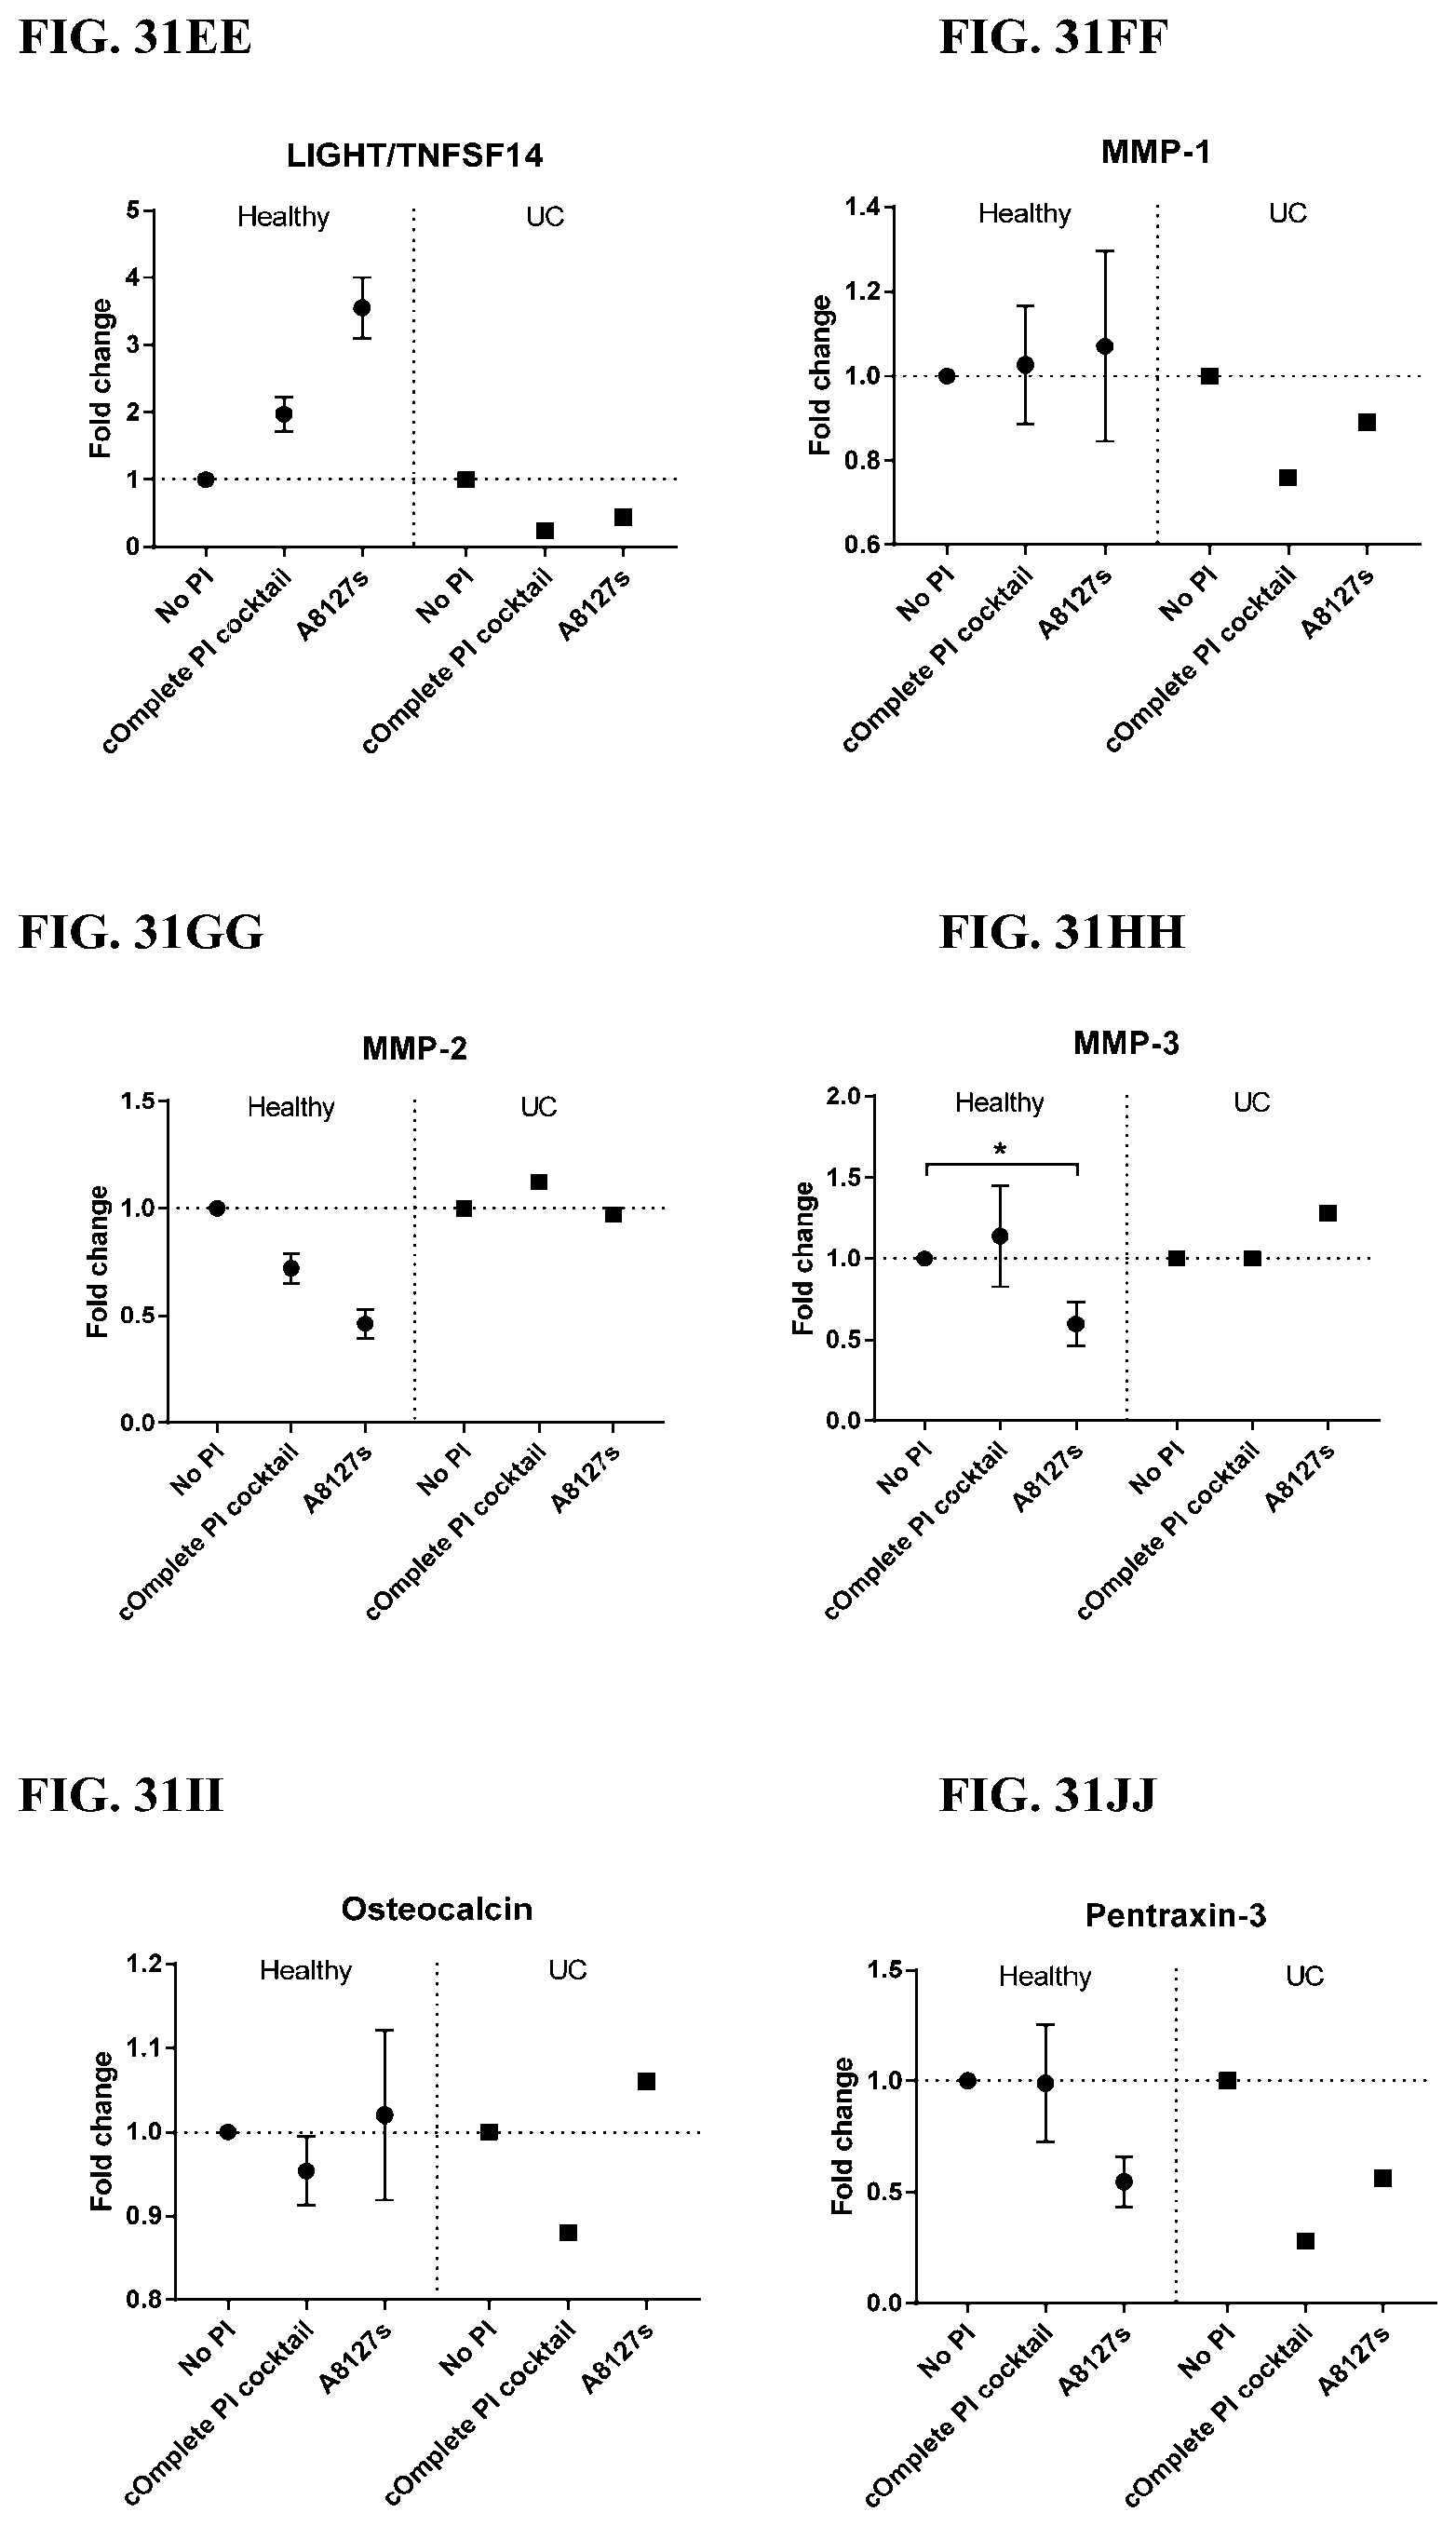
D00221
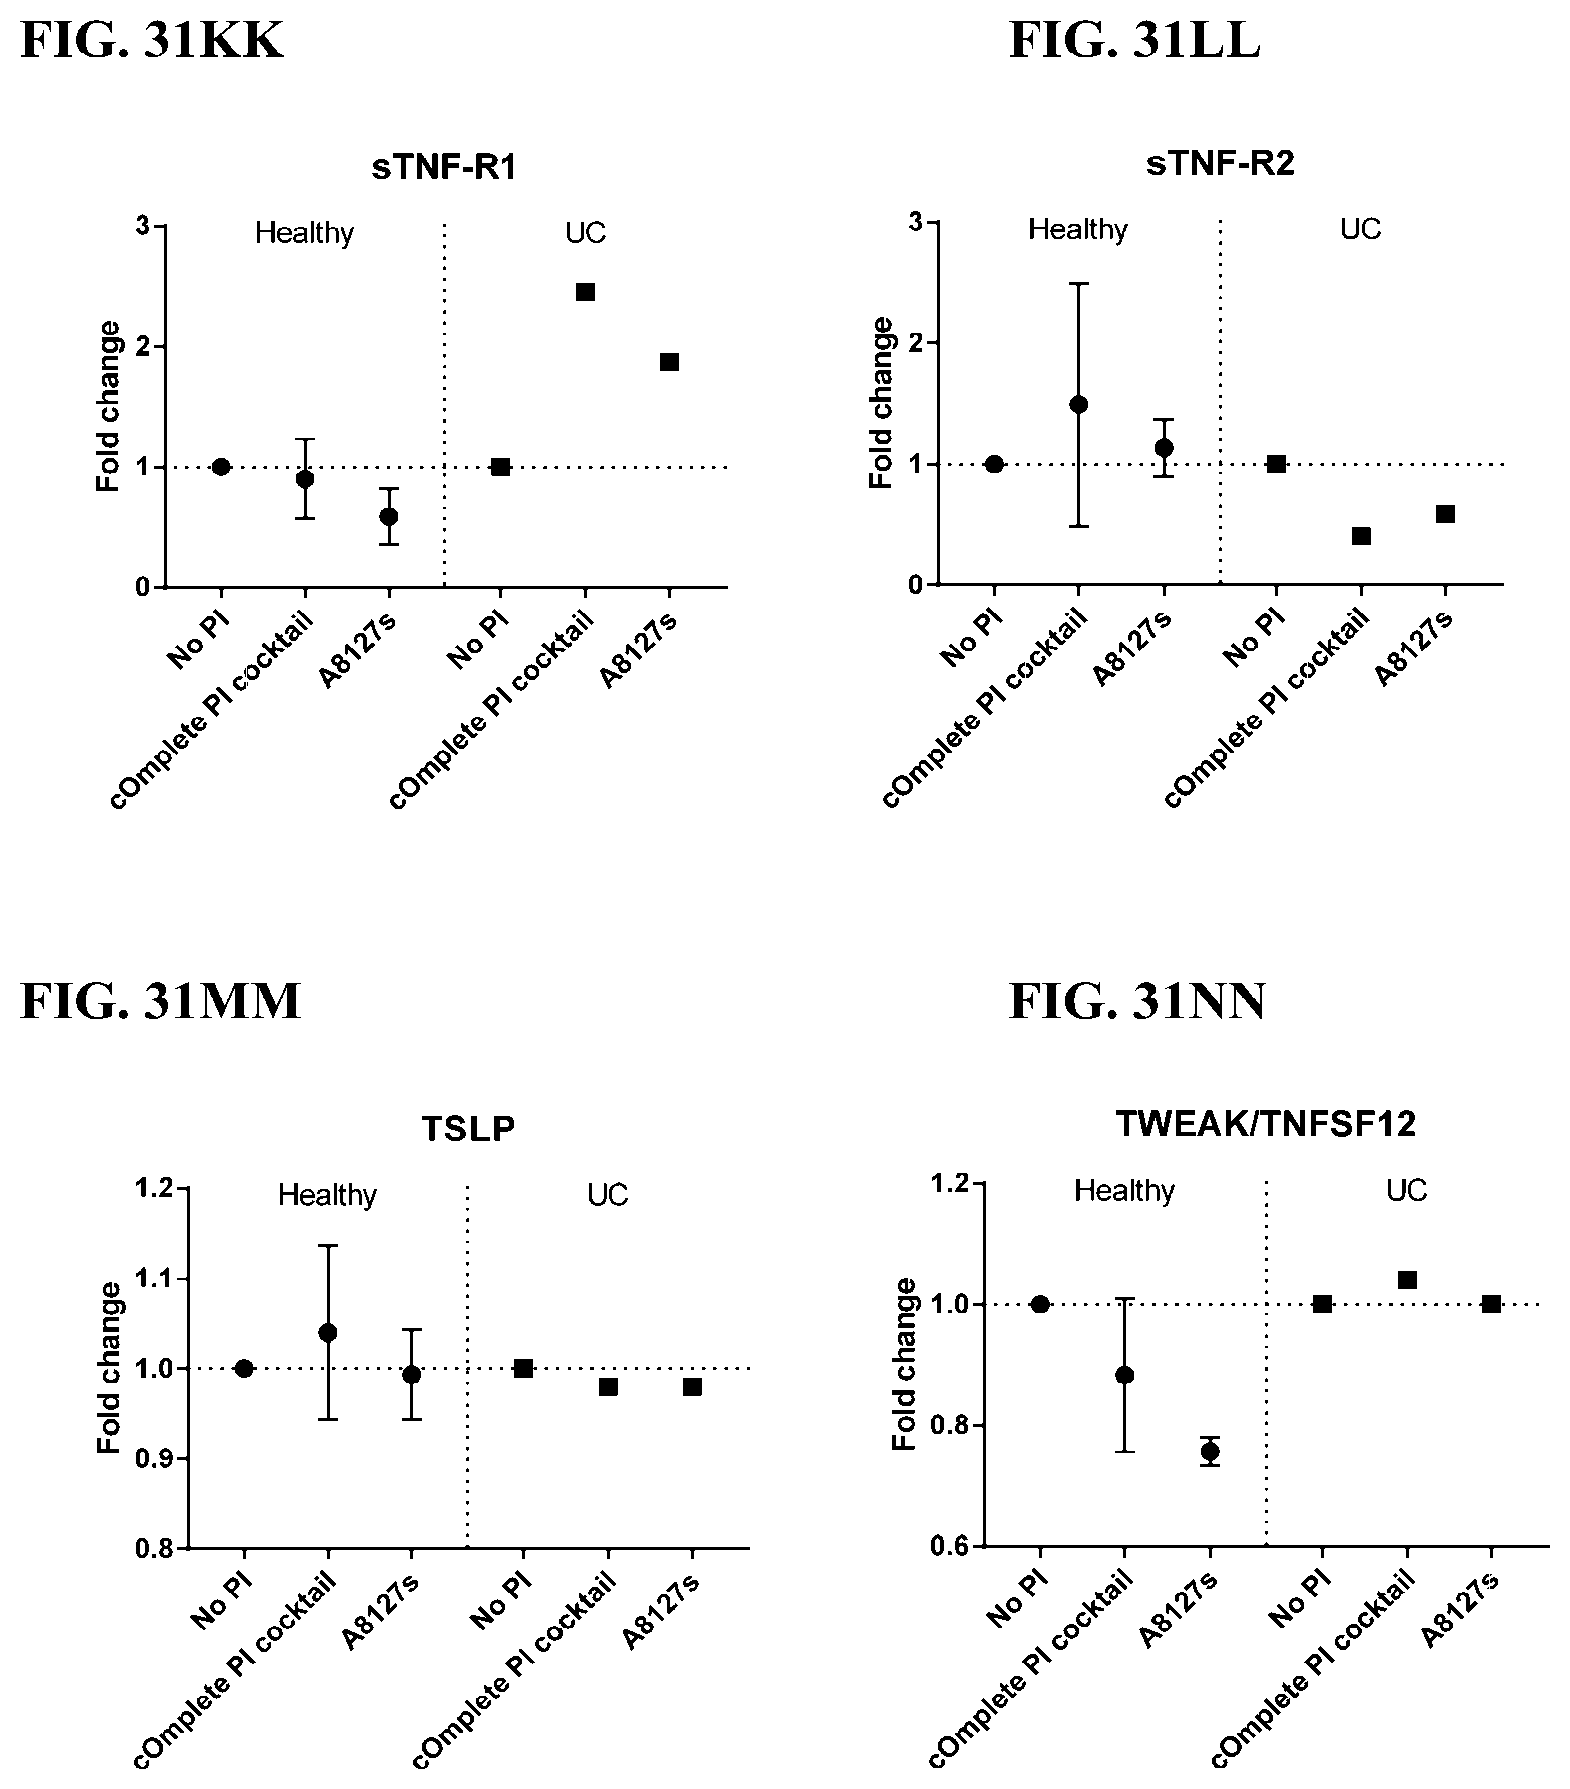
D00222

D00223

D00224

D00225
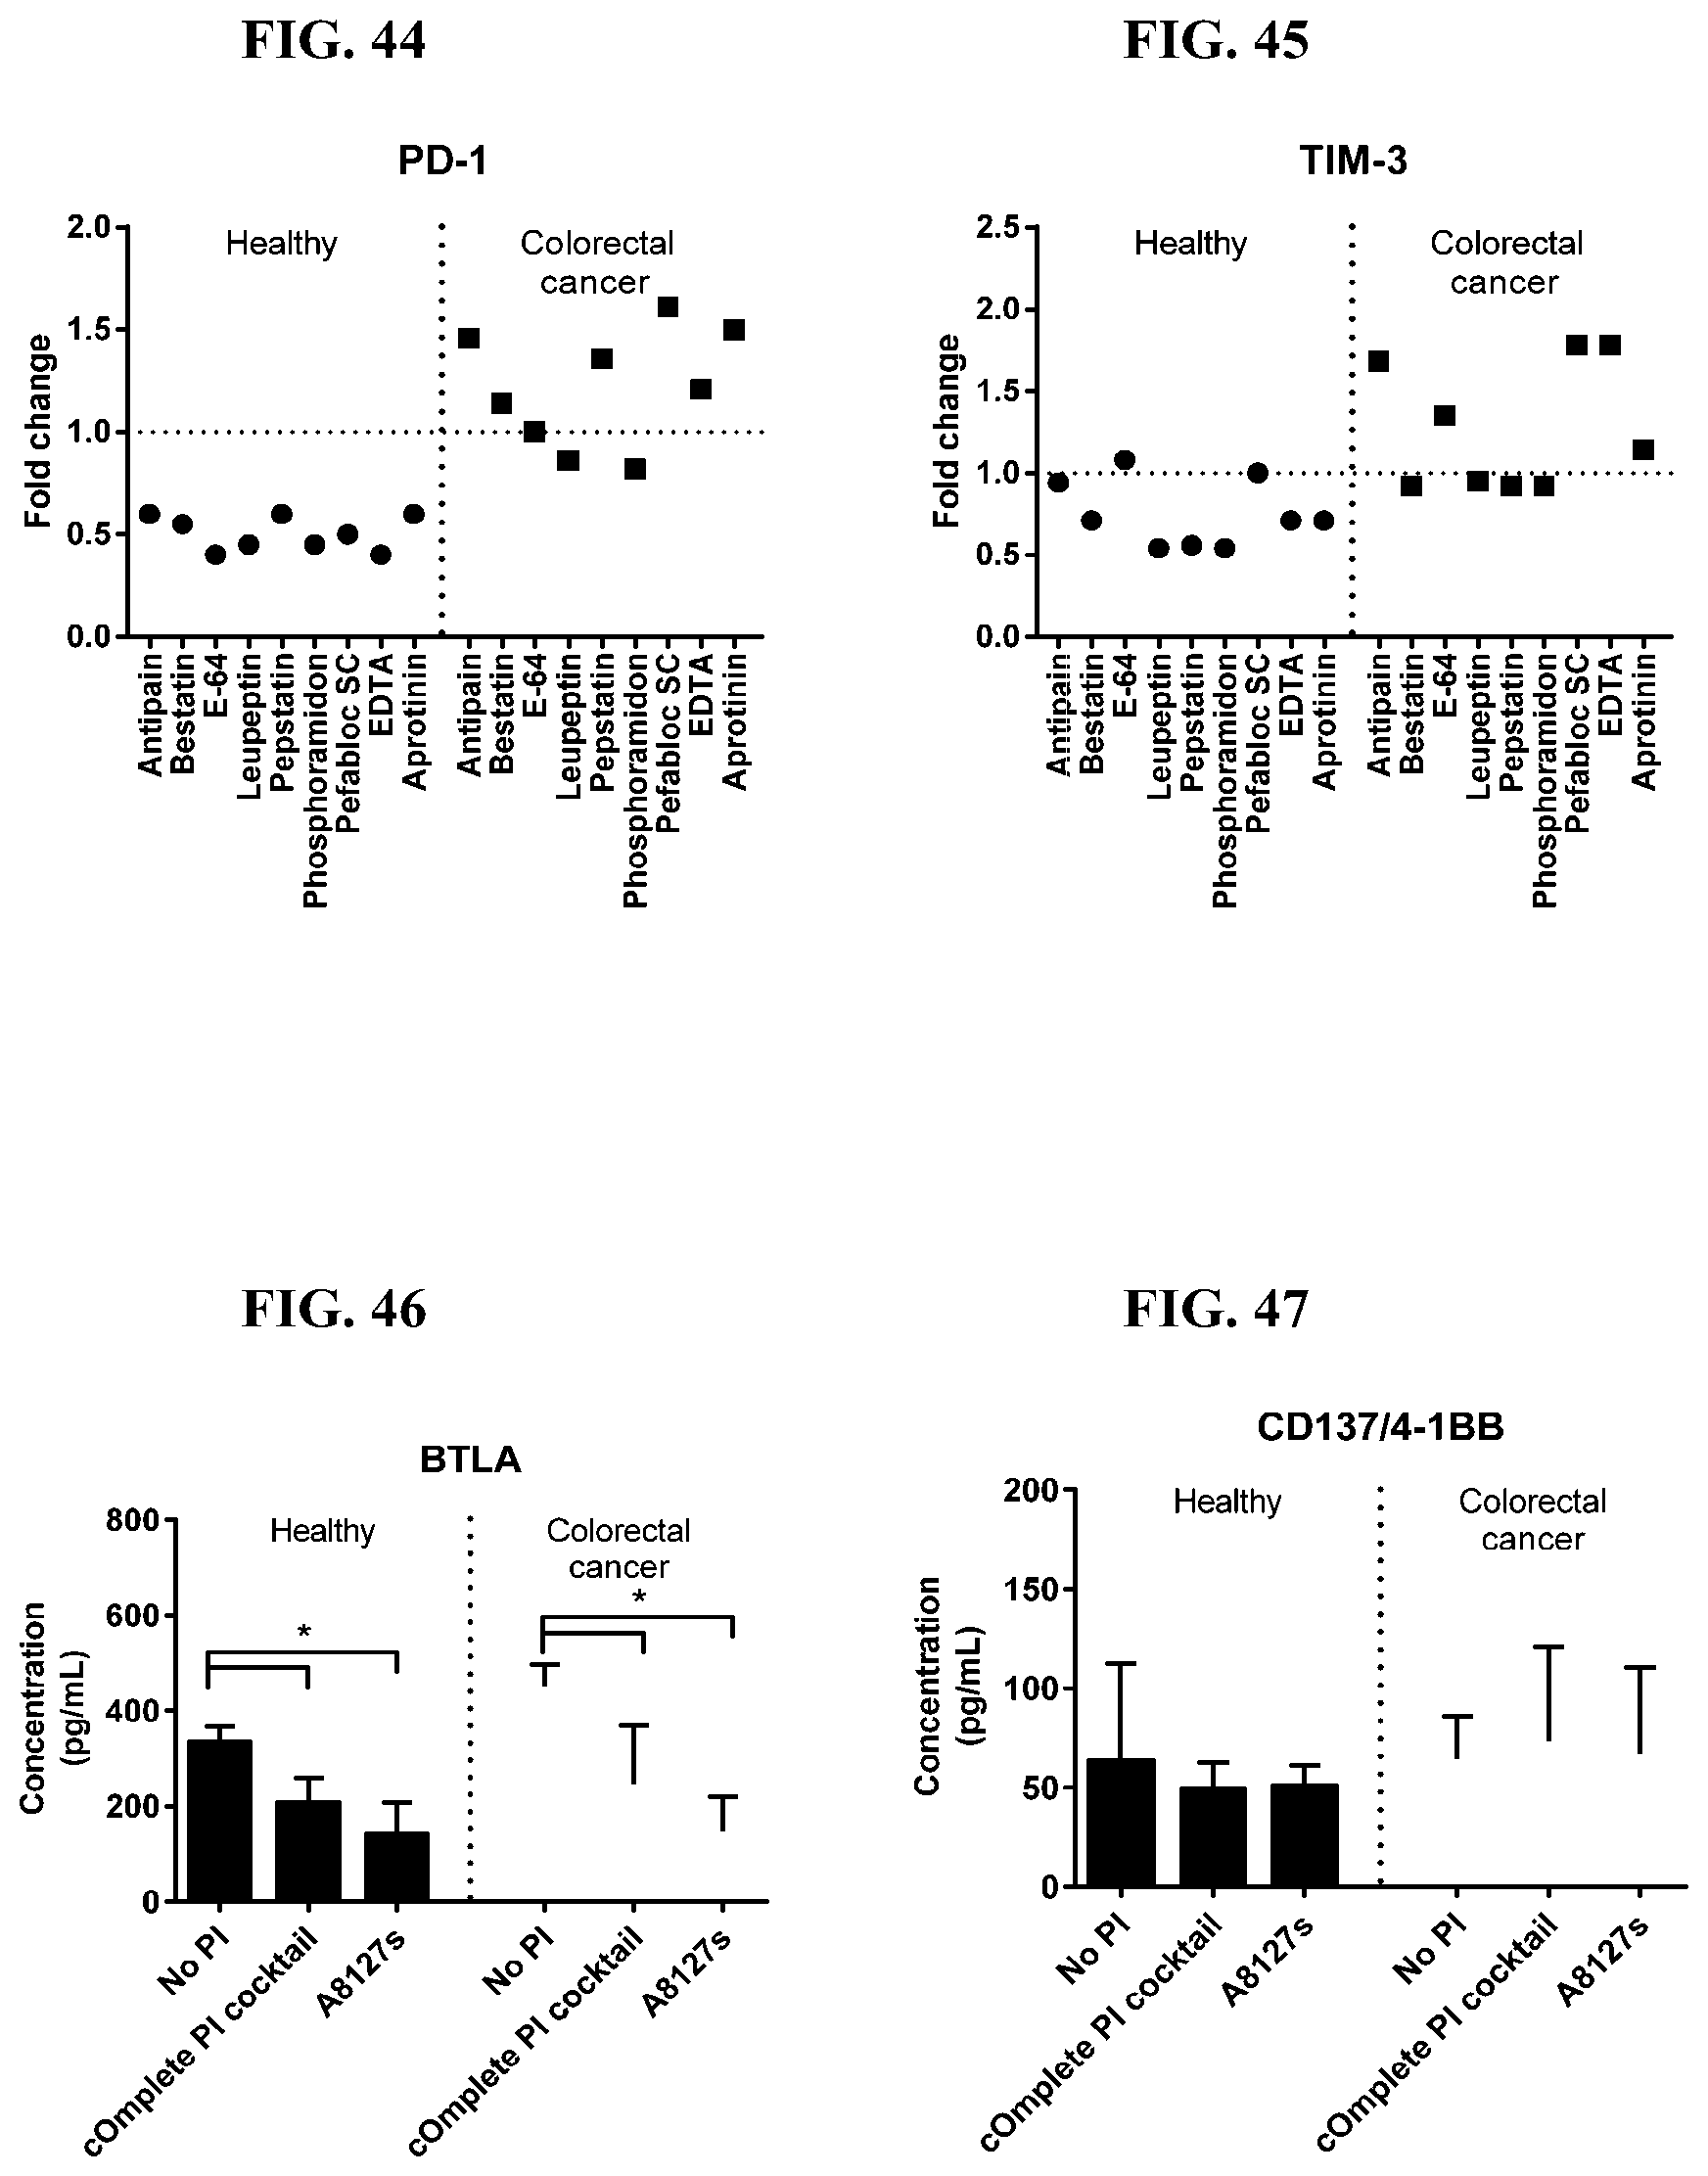
D00226

D00227

D00228
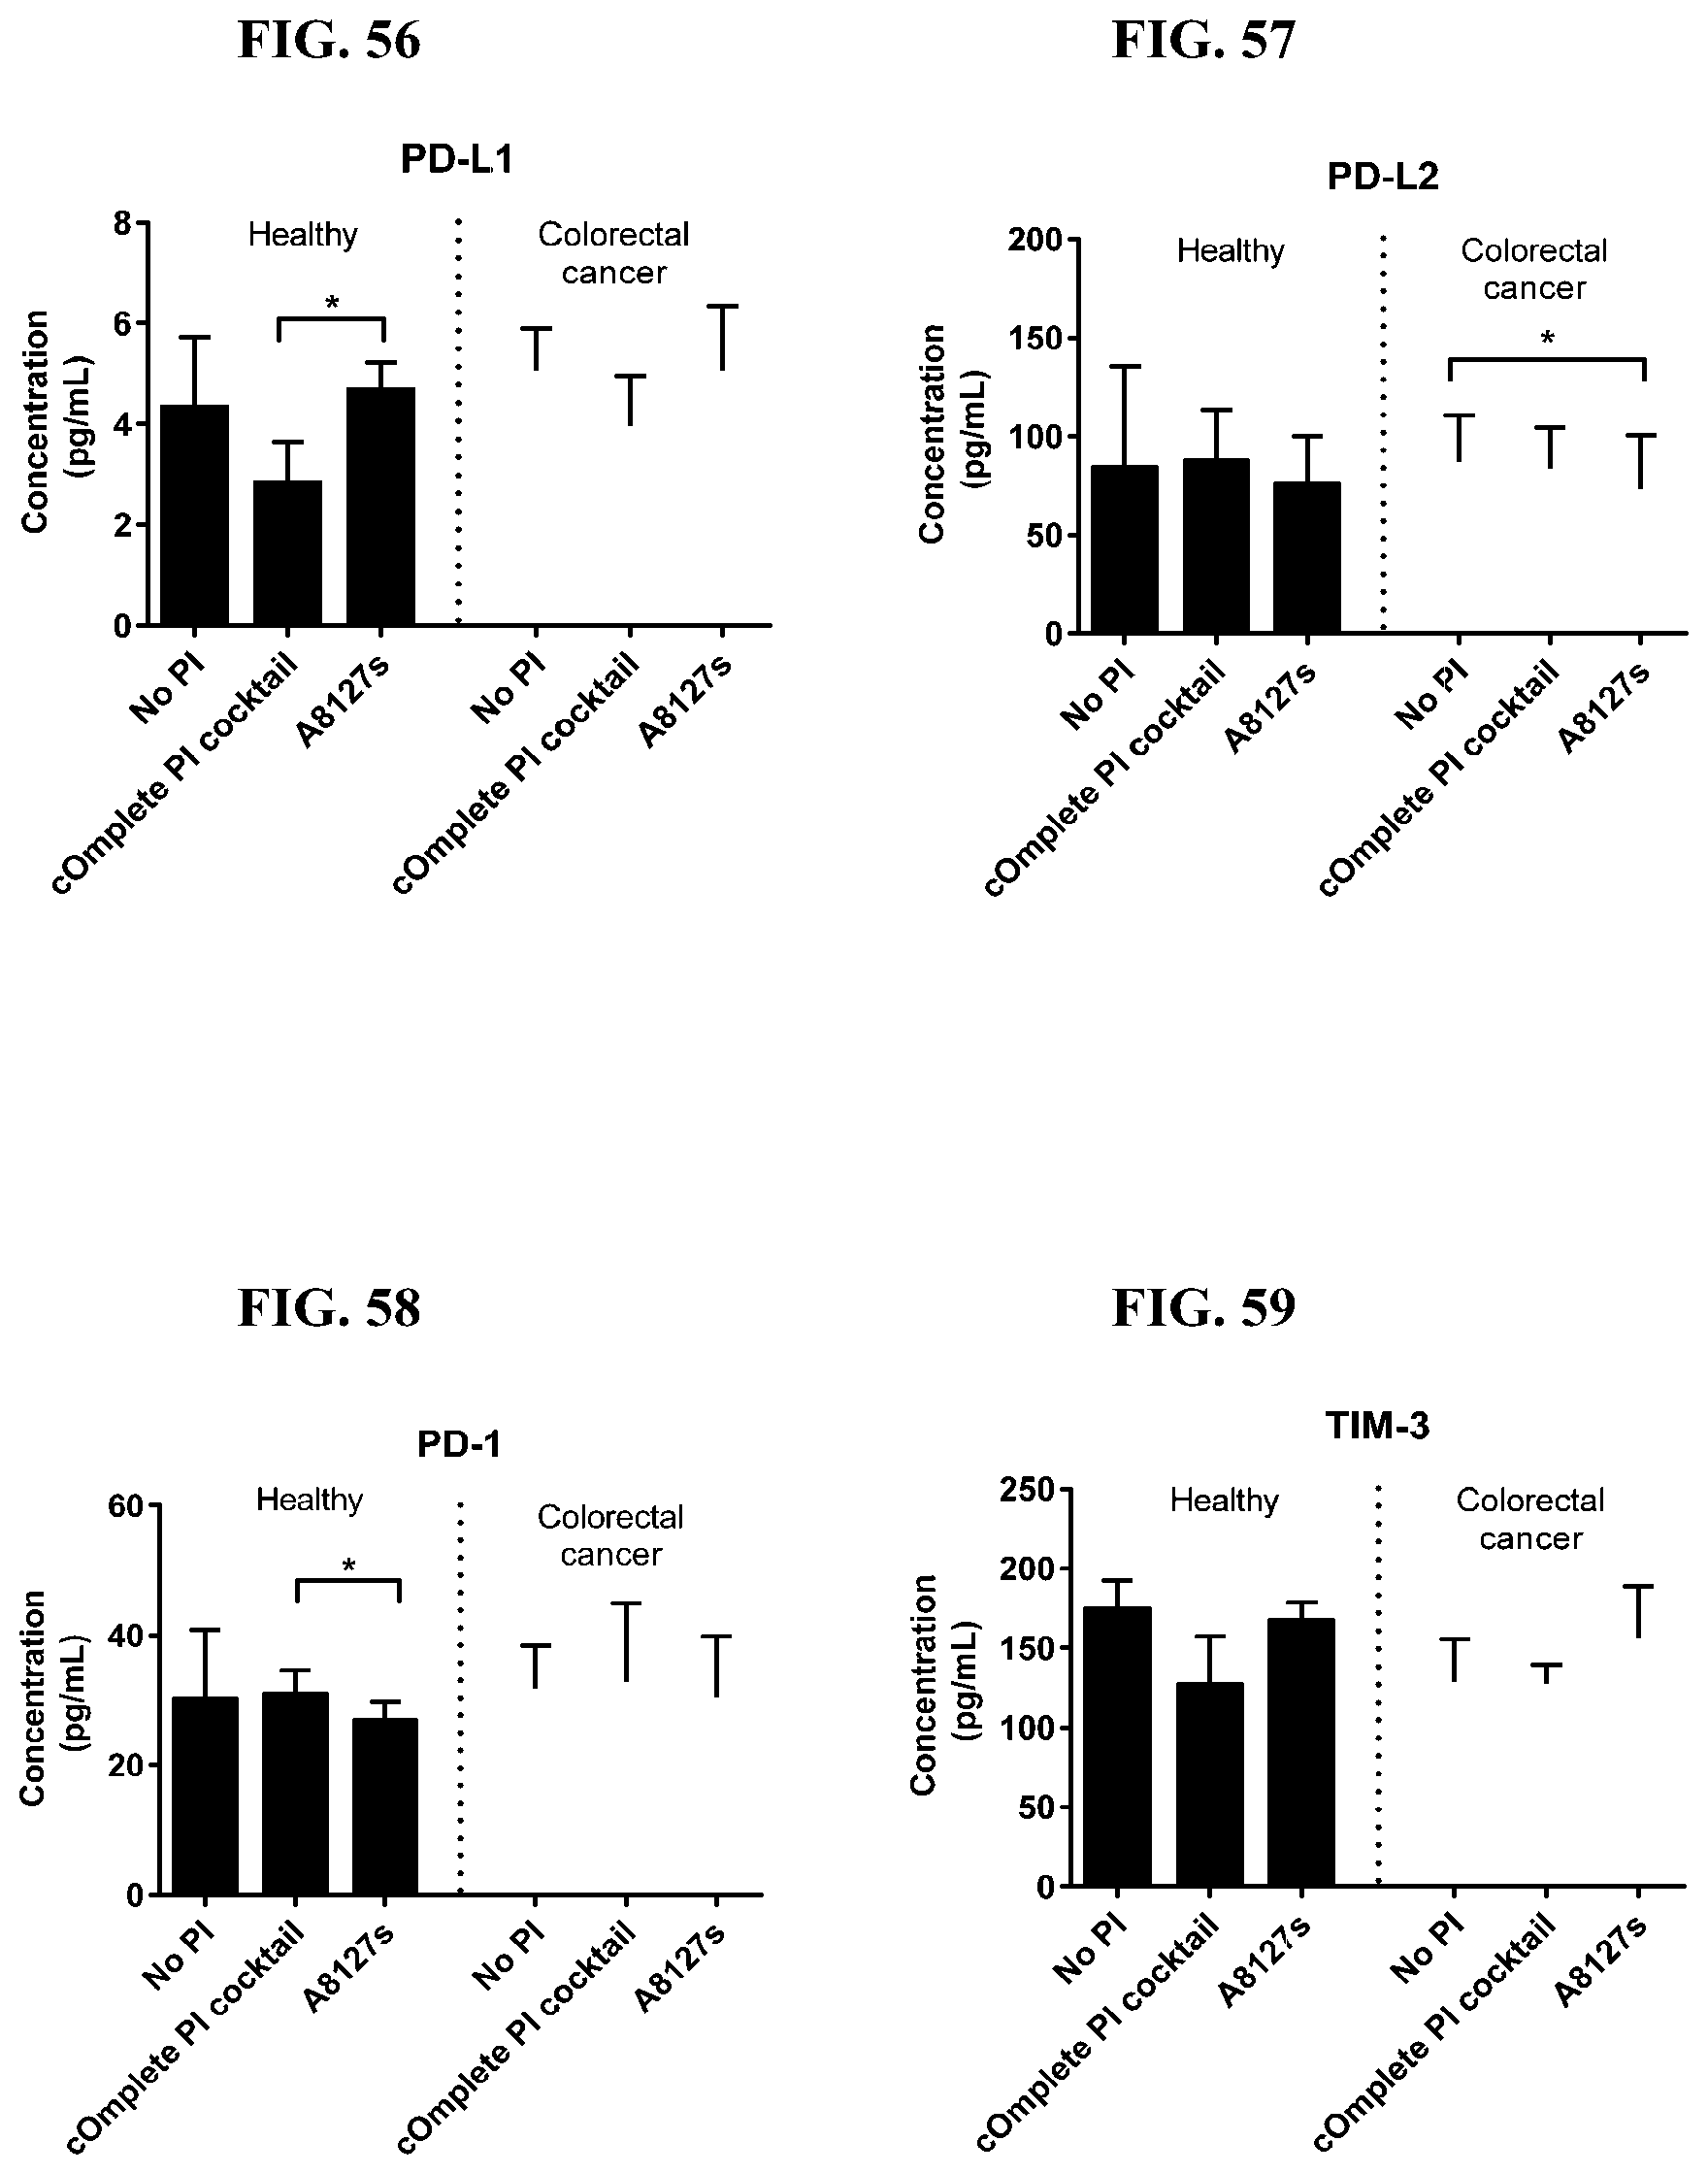
D00229

D00230

D00231

D00232
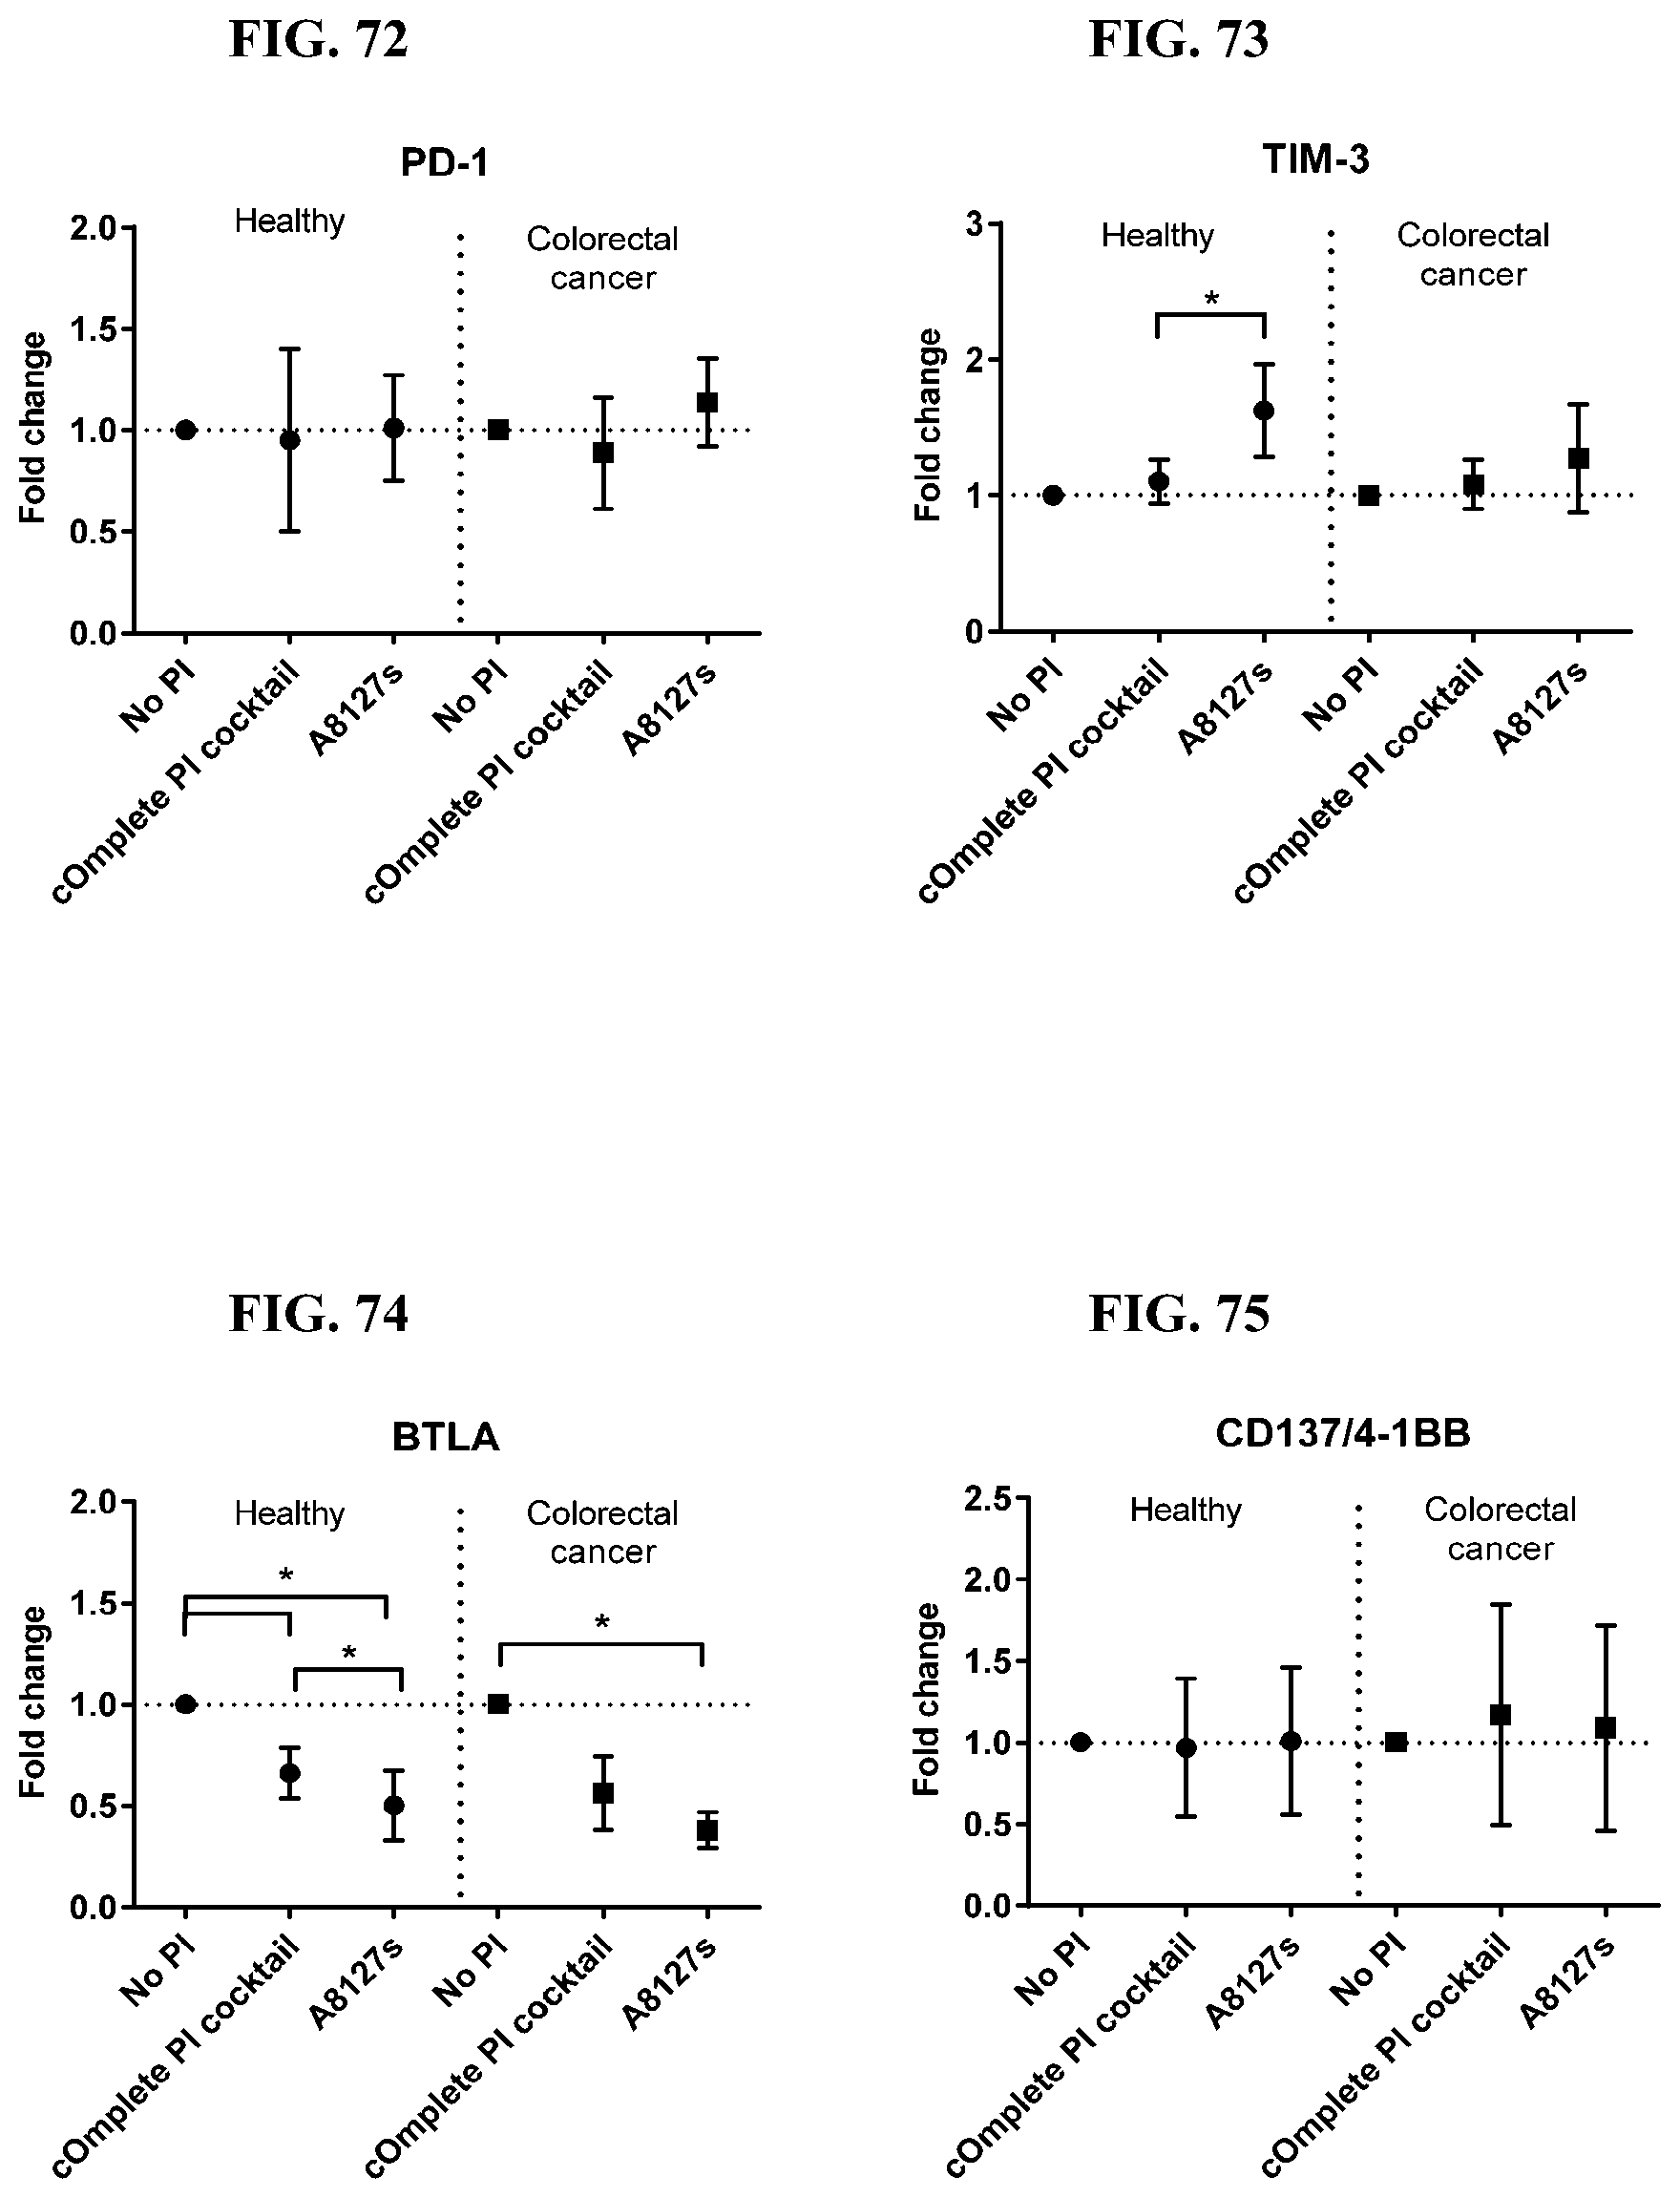
D00233
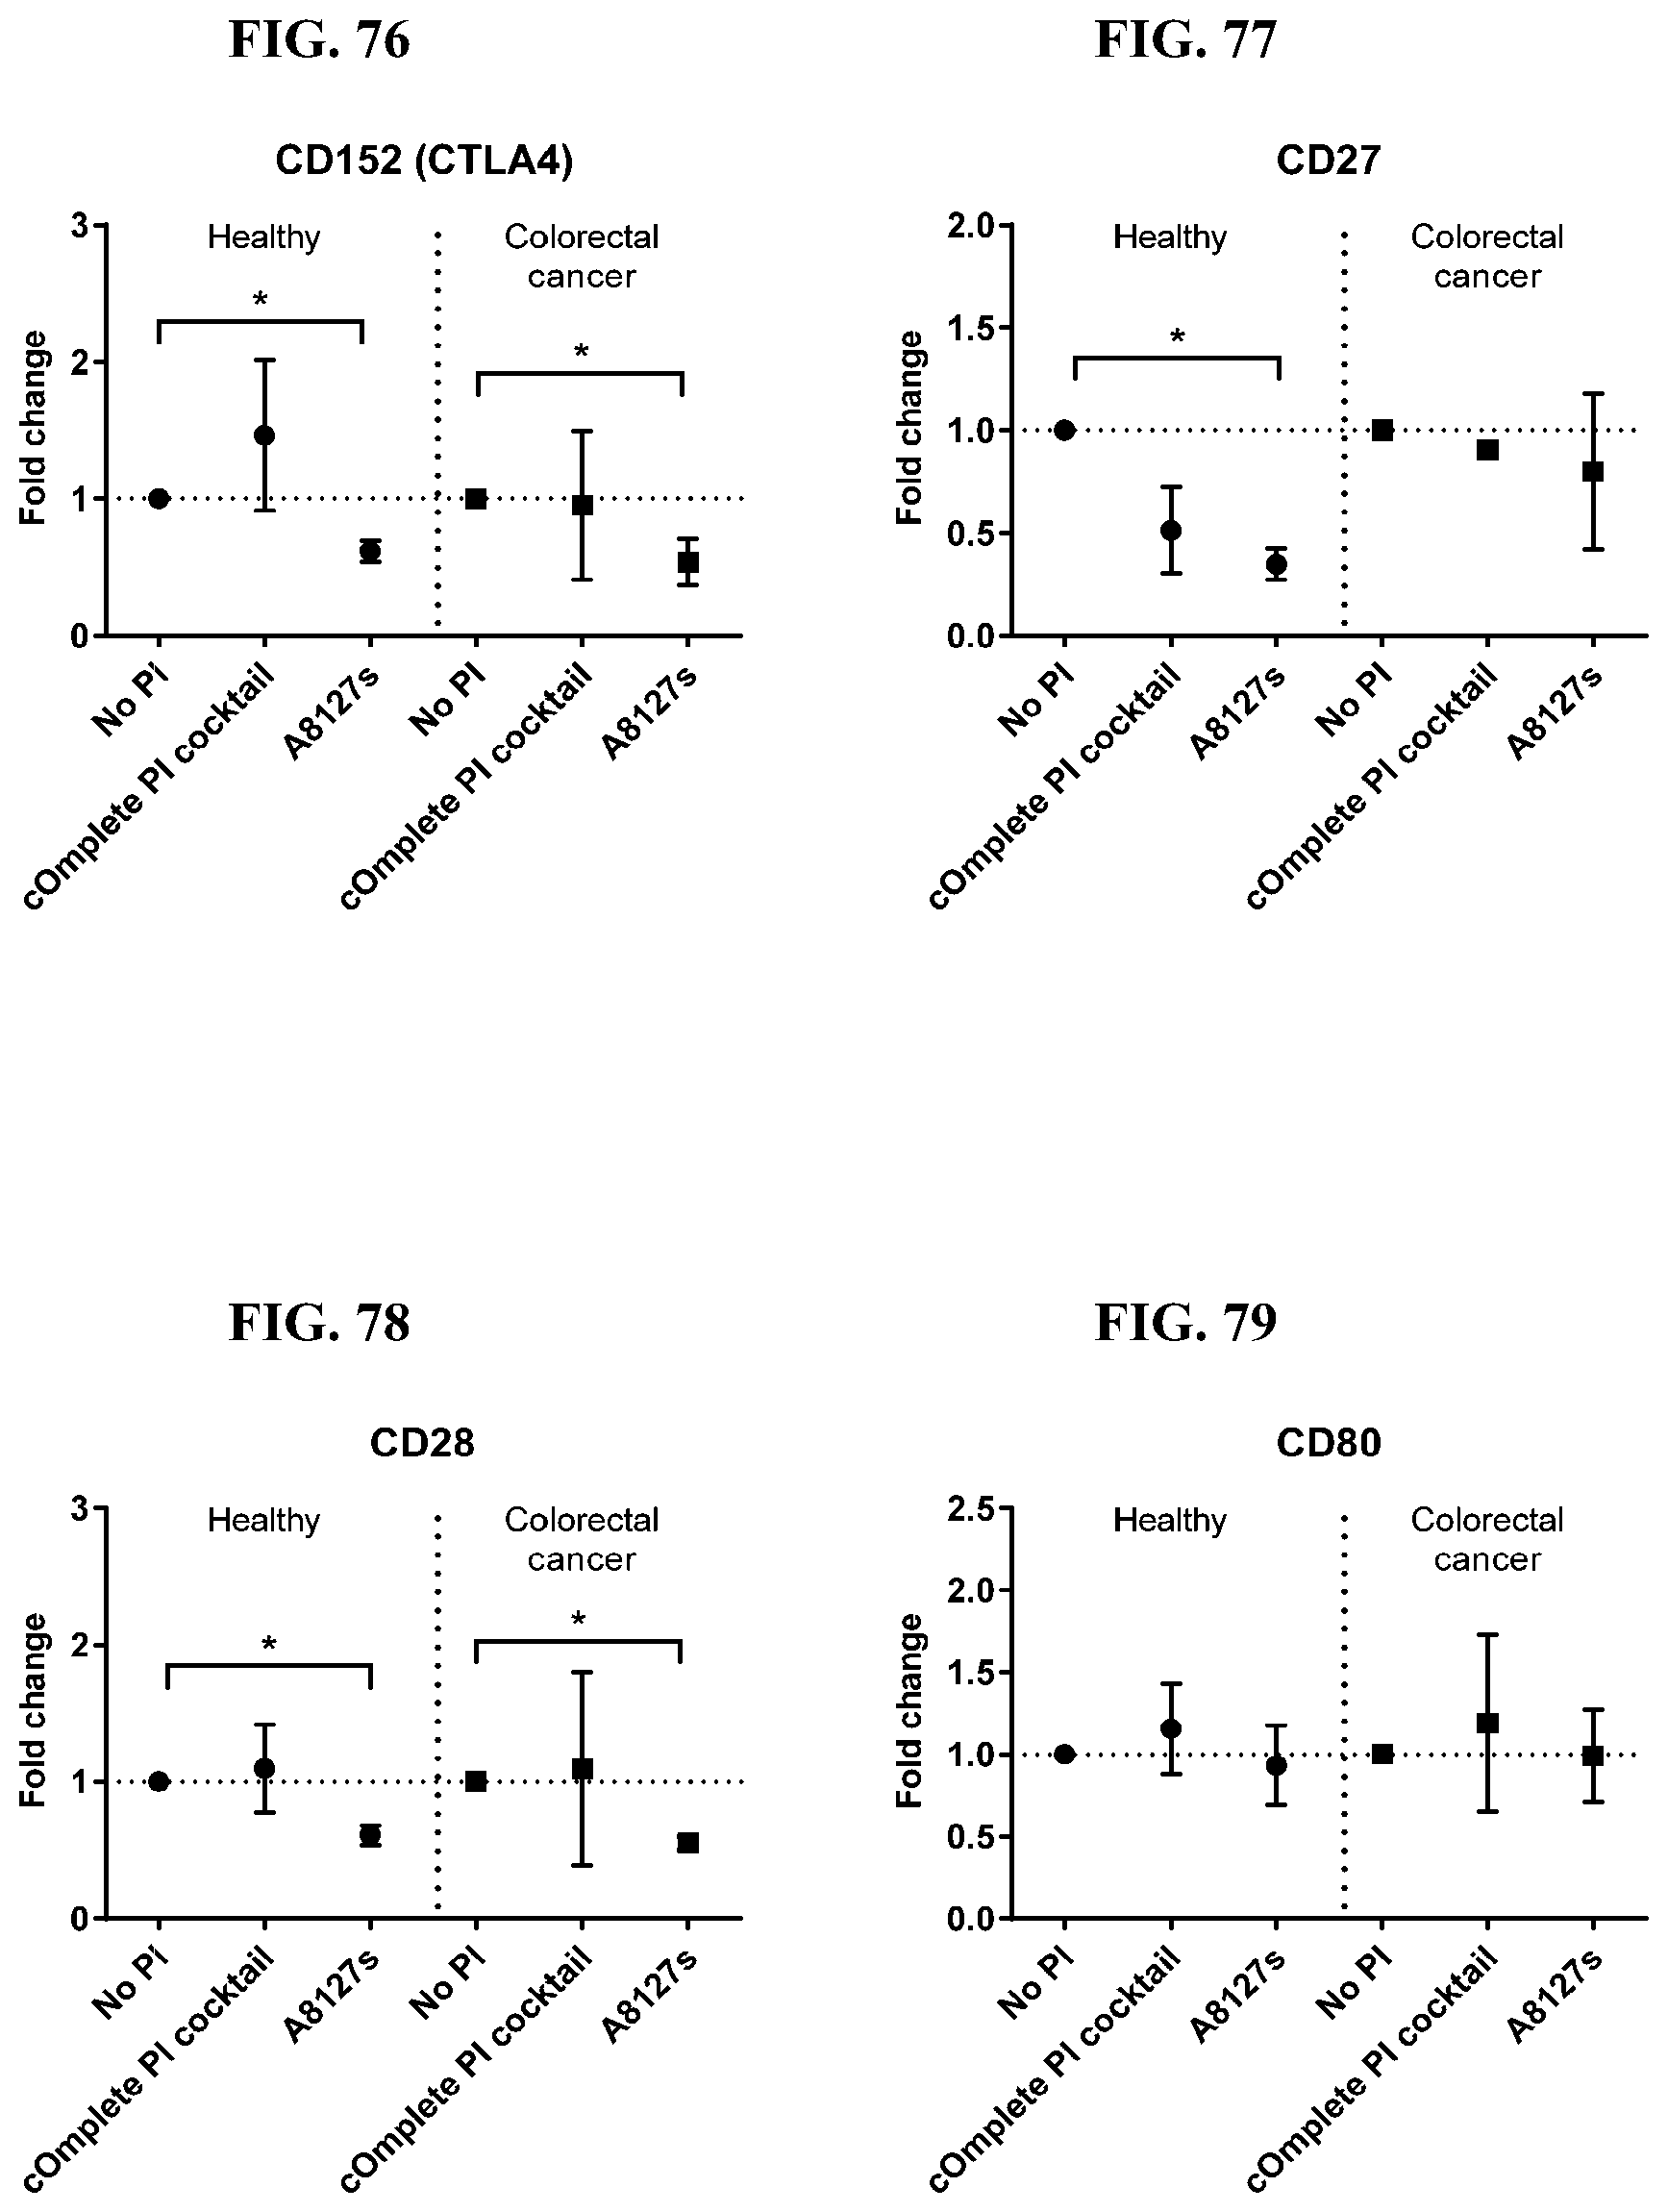
D00234
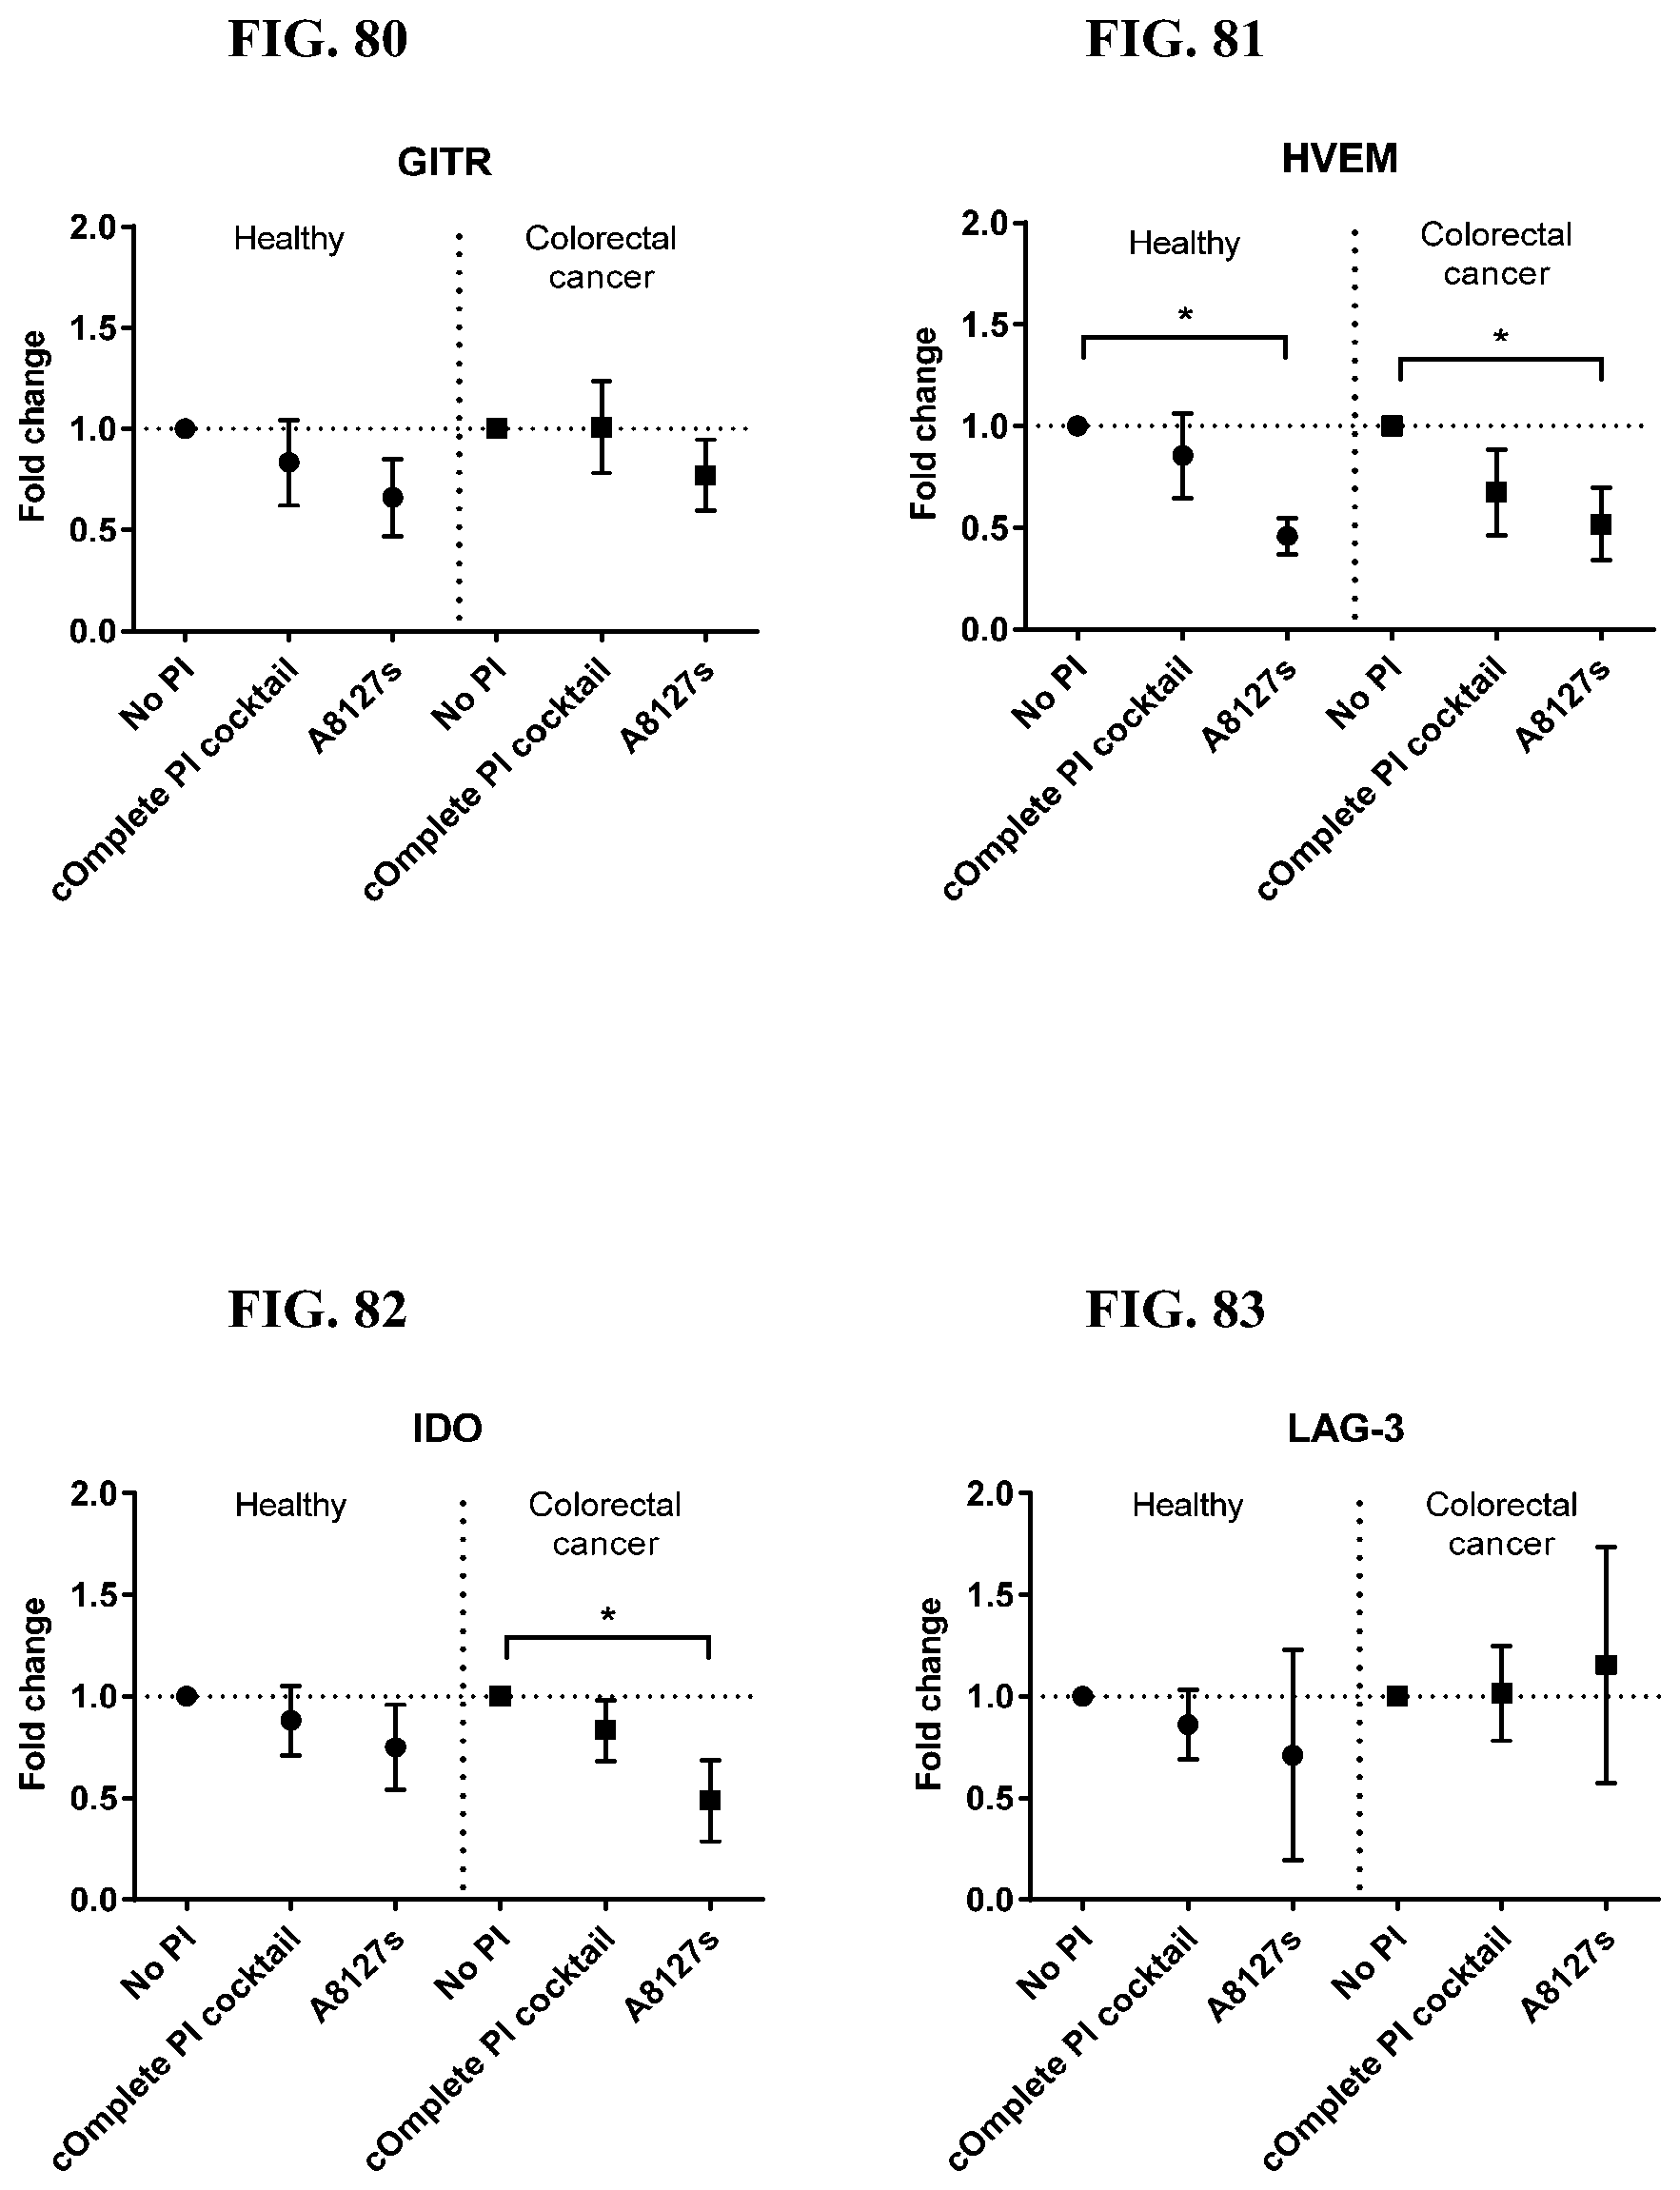
D00235
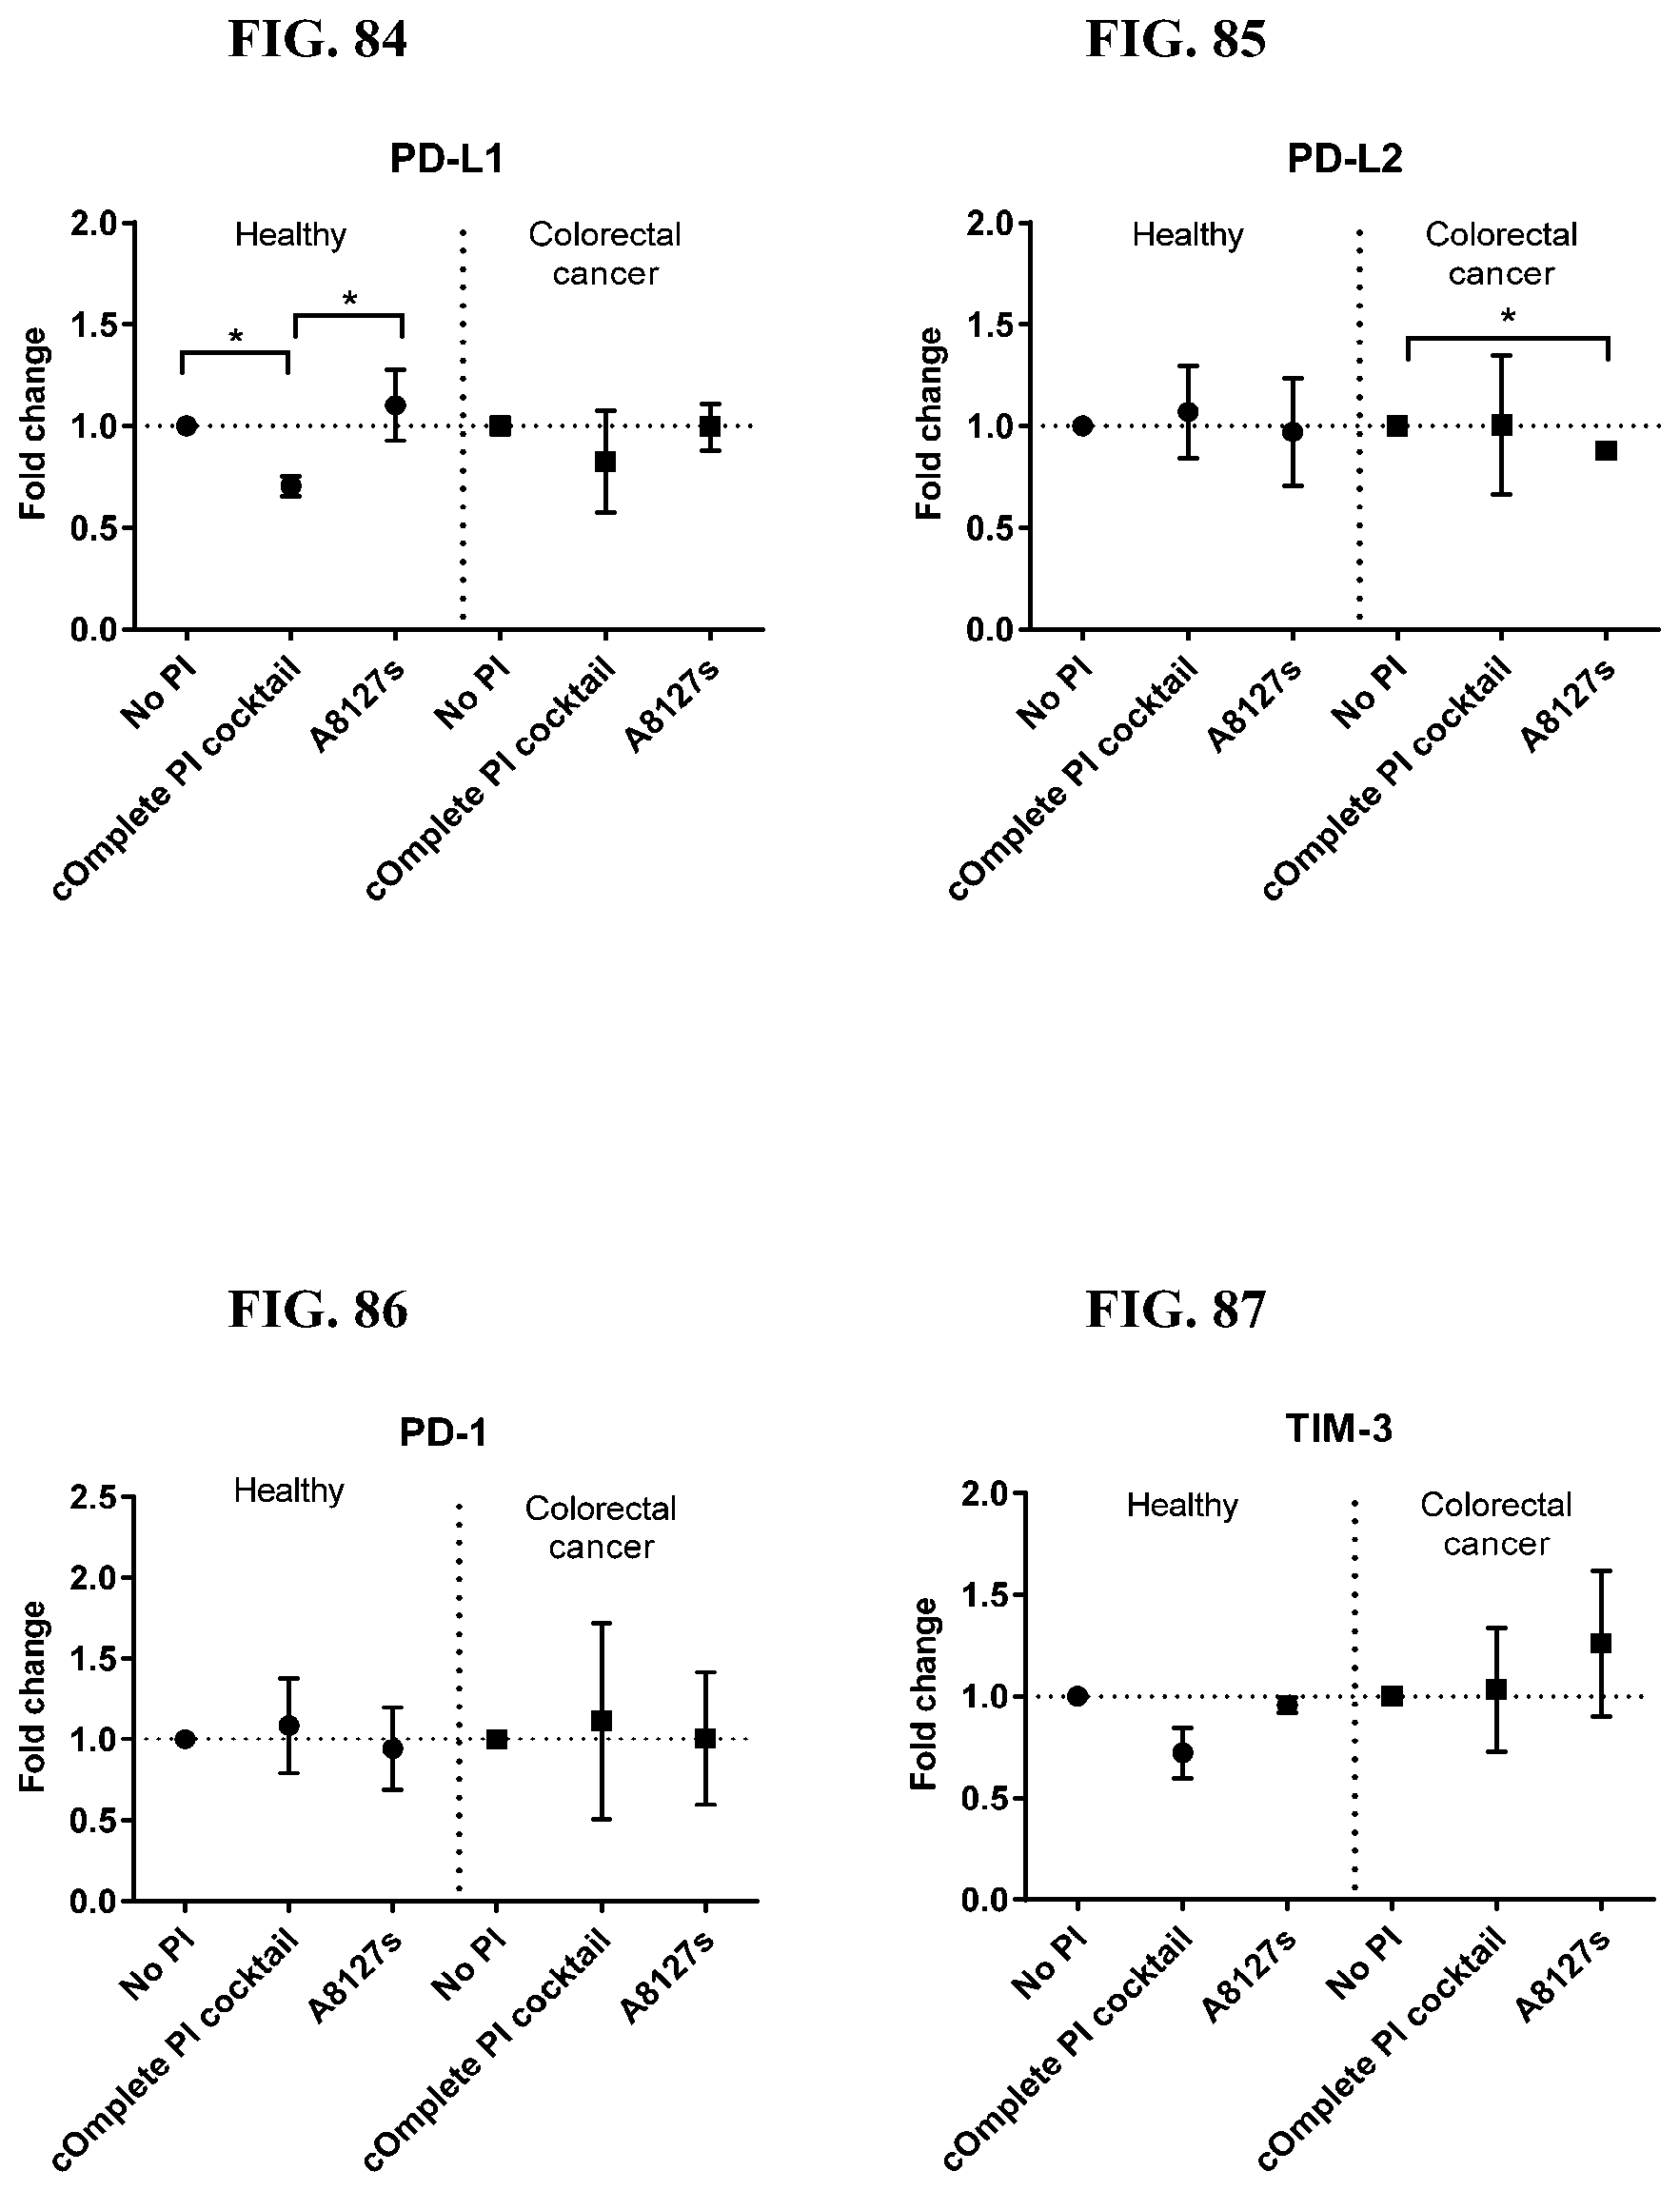
XML
uspto.report is an independent third-party trademark research tool that is not affiliated, endorsed, or sponsored by the United States Patent and Trademark Office (USPTO) or any other governmental organization. The information provided by uspto.report is based on publicly available data at the time of writing and is intended for informational purposes only.
While we strive to provide accurate and up-to-date information, we do not guarantee the accuracy, completeness, reliability, or suitability of the information displayed on this site. The use of this site is at your own risk. Any reliance you place on such information is therefore strictly at your own risk.
All official trademark data, including owner information, should be verified by visiting the official USPTO website at www.uspto.gov. This site is not intended to replace professional legal advice and should not be used as a substitute for consulting with a legal professional who is knowledgeable about trademark law.