Digital Analysis of Blood Samples to Determine Efficacy of Cancer Therapies for Specific Cancers
Haber; Daniel ; et al.
U.S. patent application number 16/344557 was filed with the patent office on 2019-12-26 for digital analysis of blood samples to determine efficacy of cancer therapies for specific cancers. The applicant listed for this patent is The General Hospital Corporation. Invention is credited to Daniel Haber, Xin Hong, Mark Kalinich, Shyamala Maheswaran, David Tomoaki Miyamoto, Tanya Todorova.
| Application Number | 20190391134 16/344557 |
| Document ID | / |
| Family ID | 62025512 |
| Filed Date | 2019-12-26 |


View All Diagrams
| United States Patent Application | 20190391134 |
| Kind Code | A1 |
| Haber; Daniel ; et al. | December 26, 2019 |
Digital Analysis of Blood Samples to Determine Efficacy of Cancer Therapies for Specific Cancers
Abstract
This disclosure relates to new assay methods for analysis of RNA, e.g., from circulating tumor cells (CTCs), tumor-specific exosomes, or tumor-specific cell-free RNA, in a subject's blood sample to determine an expression level of one or more lineage markers in the blood sample, wherein the expression level of a specific one or more lineage markers is predictive of progression-free survival and overall survival for a specific anti-cancer treatment regimen in that subject.
| Inventors: | Haber; Daniel; (Chestnut Hill, MA) ; Maheswaran; Shyamala; (Lexington, MA) ; Todorova; Tanya; (Malden, MA) ; Kalinich; Mark; (Cambridge, MA) ; Miyamoto; David Tomoaki; (Wellesley, MA) ; Hong; Xin; (Medford, MA) | ||||||||||
| Applicant: |
|
||||||||||
|---|---|---|---|---|---|---|---|---|---|---|---|
| Family ID: | 62025512 | ||||||||||
| Appl. No.: | 16/344557 | ||||||||||
| Filed: | October 27, 2017 | ||||||||||
| PCT Filed: | October 27, 2017 | ||||||||||
| PCT NO: | PCT/US17/58855 | ||||||||||
| 371 Date: | April 24, 2019 |
Related U.S. Patent Documents
| Application Number | Filing Date | Patent Number | ||
|---|---|---|---|---|
| 62413952 | Oct 27, 2016 | |||
| Current U.S. Class: | 1/1 |
| Current CPC Class: | C12Q 1/6886 20130101; G01N 33/5011 20130101; A61K 31/4196 20130101; A61K 31/138 20130101; C12Q 2600/158 20130101; C12Q 2600/106 20130101; A61K 31/5685 20130101; G01N 2800/52 20130101 |
| International Class: | G01N 33/50 20060101 G01N033/50; C12Q 1/6886 20060101 C12Q001/6886 |
Claims
1. A method for determining potential efficacy of an anti-cancer agent for a specific cancer in a subject, the method comprising isolating circulating tumor cells (CTCs) from a blood sample from the subject; converting CTC-derived RNA into cDNA; encapsulating the cDNA into individual droplets; amplifying the cDNA in each droplet in the presence of a reporter group configured to bind specifically to cDNA from CTCs and not to cDNA from other cells in the blood; and determining which of a series of lineage markers are expressed in the CTCs in the blood sample, wherein an expression level of a specific one or more lineage markers is predictive of progression-free survival and overall survival for a specific anti-cancer treatment regimen.
2. The method of claim 1, wherein the potential efficacy of a specific anti-cancer treatment regimen for a specific cancer in the subject is determined by comparing the expression levels of the specific one or more of the subject's lineage markers to a reference standard established for the specific anti-cancer treatment regimen for the specific cancer to determine whether the subject will improve with the specific anti-cancer treatment regimen.
3. The method of claim 1, wherein the subject has prostate cancer and if the subject's specific lineage markers assayed before any treatment is started include an elevated level of FOLH1 (PSMA) and HOXB13 above a background noise level determined by evaluation of healthy donors without cancer, then the method predicts that the patient will not improve if treated only with abiraterone.
4. The method of claim 3, wherein the subject is prescribed a combination therapy of abiraterone and another anti-prostate cancer therapy.
5. The method of claim 1, wherein the subject has hormone receptor-positive ("HR+") breast cancer and if the subject's specific lineage markers assayed at three to four weeks after treatment with a drug targeting the estrogen-signaling pathway include an elevated level of one or more of PIP, SERPINA3, AGR2, SCGB2A1, EFHD1, and WFDC2 genes above a background noise level determined by evaluation of healthy donors without cancer, then the method predicts that the patient will not improve if treated only with a drug that targets the estrogen-signaling pathway.
6. The method of claim 5, wherein the drug comprises an ER inhibitor, a selective ER degrader, and an aromatase inhibitor, which block the production of estrogen.
7. The method of claim 5, wherein the subject is further prescribed a combination therapy of a drug targeting the estrogen-signaling pathway and another anti-breast cancer therapy.
8. The method of claim 1, further comprising reducing a volume of the product before isolating RNA.
9. The method of claim 1, further comprising removing contaminants from the cDNA-containing solution before encapsulating the cDNA molecules.
10. The method of claim 1, wherein generating cDNA molecules from the isolated RNA comprises conducting reverse transcription (RT) polymerase chain reaction (PCR) of the isolated RNA molecules.
11. The method of claim 1, wherein amplifying cDNA or cDNA molecules within each of the droplets comprises conducting PCR in each droplet.
12. The method of claim 1, wherein encapsulating individual cDNA molecules further comprises encapsulating PCR reagents in individual droplets with the cDNA molecules and forming at least 1000 droplets of a non-aqueous liquid.
13. The method of claim 1, wherein the reporter groups comprise a fluorescent label.
14. The method of claim 1, wherein probes and primers for use in amplifying the cDNA molecules within each of the droplets correspond to one or more probes and primers that relate to the selected cancer genes listed in Table 3.
15. The method of claim 14, wherein the selected cancer selective genes include prostate cancer-selective genes.
16. The method of claim 14, wherein the selected cancer genes include breast cancer-selective genes.
17. The method of claim 14, wherein the selected cancer genes include genes selective for one or more of lung cancer, pancreatic cancer, liver cancer, and melanoma.
18. The method of claim 1, wherein the CTCs arise from metastatic or primary/localized cancers.
19. (canceled)
20. The method of claim 6, wherein the drug comprises one or more of an ER inhibitor comprising tamoxifen, a selective ER degrader comprising fulvestrant, and an aromatase inhibitor comprising one or more of anastrozole, letrozole, and exemestane.
Description
CROSS REFERENCE TO RELATED APPLICATIONS
[0001] This application claims priority from U.S. Provisional Application Ser. No. 62/413,952, filed on Oct. 27, 2016, which is incorporated herein by reference in its entirety.
TECHNICAL FIELD
[0002] This invention relates to sample analysis techniques, and more particularly to methods and systems for detecting and analyzing nucleic acids from cancer cells, e.g., in blood samples to determine which therapies would be most effective in a specific patient.
BACKGROUND
[0003] The ability to detect the presence of rare circulating tumor cells (CTCs), exosomes, and cell-free nucleic acids, such as cell-free deoxyribonucleic acid (DNA) or ribonucleic acid (RNA), using a simple blood test, or "liquid biopsy," has the potential to greatly enhance the monitoring of cancers, providing instant sampling of tumor cell numbers, genetic composition, and drug response parameters, without requiring invasive tumor biopsies. Thus, the detection of CTCs, exosomes, and cell-free DNA or RNA for early cancer detection has the potential to revolutionize the treatment of cancer, enabling the diagnosis of invasive cancer at a stage before it has metastasized, when curative treatment is expected.
[0004] However, CTCs, exosomes, and cell-free nucleic acids are very rare and/or small and/or are easily degraded, and thus identifying, visualizing, measuring, and scoring these rare components admixed with normal blood components remains a significant challenge, even after partial purification with known microfluidic devices or similar technologies. For example, per milliliter of whole blood, there are only 1-10 CTCs amongst more than 5 billion red blood cells (RBCs) and more than 5 million white blood cells (WBCs) (Plaks et al., "Cancer Circulating Tumor Cells," Science, 341:1186; 2013).
[0005] While exosomes are not that rare, they are only about 30-100 nm in diameter, making them difficult to isolate and detect in blood samples. Due to the complexity of body fluids such as blood, physical separation of exosomes from cells and similar-sized particles is challenging. Isolation of exosomes using differential ultracentrifugation and micro-filtration or a gradient can improve purity. Single step isolation of extracellular vesicles by size-exclusion chromatography has been demonstrated to provide greater efficiency for recovering intact vesicles over centrifugation, although a size-based technique alone will generally not be able to distinguish exosomes from other vesicle types. To isolate a pure population of exosomes a combination of techniques is necessary, based on both physical (e.g. size, density) and biochemical parameters (e.g. presence/absence of certain proteins involved in their biogenesis). A key challenge to isolating tumor-derived exosomes is to differentiate them from exosomes produced by normal tissues.
[0006] When employing cell-free RNA, it is important to minimize release of cellular RNA following blood draw, because cell-free RNA is present at low quantities in the blood. Thus, blood samples require special handling and/or systems to avoid degradation or contamination with nucleic acids from cells, and to stabilize the cell-free RNA.
[0007] In addition, antibody staining of tumor cells is highly variable, due to high heterogeneity among cancer cells, even within an individual patient, as well as the poor physical condition of many tumor cells that circulate in the bloodstream, many of which have begun to undergo programmed cell death or anoikis. In addition, accurate scoring of antibody-stained tumor cells requires differentiation from large numbers of contaminating white blood cells, some of which bind to antibody reagents non-specifically. As such, only a subset of candidate tumor cells can be robustly identified by antibody staining, and as many as half of patients tested have no detectable cells, despite having widely metastatic cancer.
SUMMARY
[0008] The present disclosure relates to methods and uses to obtain the highest possible sensitivity of data relating to tumor-specific RNA, e.g., from rare CTCs, exosomes, and/or cell-free RNA, in standard blood samples to predict which cancer therapies may be most effective to treat a specific detected cancer in a given patient. In particular, the new methods do not need the CTCs and/or exosomes to be completely isolated from contaminating WBCs, and instead can reliably detect as few as one CTC or exosome in products containing, e.g., up to 10,000 WBCs or more. The new assay methods combine (1) an isolation system that can consistently obtain intact CTCs and exosomes with high quality RNA from blood with (2) a droplet-based digital polymerase chain reaction (PCR) assay focused on RNA markers of specific cancer lineages for each tumor type that are absent in blood of healthy patients. The new methods can be used to determine which therapeutic agents have the highest potential to effectively treat the specific cancer type found in each patient.
[0009] In general, the disclosure relates to methods for predicting the efficacy of specific therapeutic regimens, e.g., therapeutic agents, to treat specific cancers in a given subject or patient with ultra-high sensitivity and specificity. The new methods comprise or consist of obtaining tumor-specific RNA from a blood sample and determining which of a series of lineage markers are expressed in the RNA in the blood sample, wherein an expression level of or more specific lineage markers is predictive of progression-free survival and overall survival for a specific anti-cancer treatment regimen. For example, in some implementations, the methods can include or consist of isolating circulating tumor cells (CTCs) from a blood sample from the subject; converting CTC-derived RNA into cDNA; encapsulating the cDNA into individual droplets; amplifying the cDNA in each droplet in the presence of a reporter group configured to bind specifically to cDNA from CTCs and not to cDNA from other cells in the blood; and determining which of a series of lineage markers are expressed in the CTCs in the blood sample, wherein an expression level of a specific one or more lineage markers is predictive of progression-free survival, time to progression, overall survival, or other clinically relevant endpoints for a specific anti-cancer treatment regimen.
[0010] In some implementations, the potential efficacy of a specific anti-cancer treatment regimen for a specific cancer in the subject is determined by comparing the expression levels of one or more of the subject's specific lineage markers to a reference standard established for the specific anti-cancer treatment regimen for the specific cancer to determine whether the subject will be treated effectively with the specific anti-cancer treatment regimen. For example, in some implementations, the subject may have prostate cancer and if the subject's specific lineage markers assayed before treatment is begun include an elevated level of FOLH1 (PSMA) and HOXB13 above a background noise level as determined by evaluation of healthy donors without cancer, then the methods described herein predict that the patient will not improve if treated only with abiraterone (e.g., ZYTIGA.RTM.). In some implementations, such a subject is further prescribed a combination therapy of abiraterone and another anti-prostate cancer therapy.
[0011] In other implementations, the subject may have hormone receptor-positive ("HR+") breast cancer and if the subject's specific lineage markers assayed at three to four weeks after treatment with a drug targeting the estrogen-signaling pathway include an elevated level of one or more, e.g., one, two, three, four, five, or all six, of PIP, SERPINA3, AGR2, SCGB2A1, EFHD1, and WFDC2 genes above a background noise level determined by evaluation of healthy donors without cancer, then the methods described herein predict that the patient will not improve if treated only with a drug that targets the estrogen-signaling pathway. For example the drugs may be, e.g., ER inhibitors (e.g., tamoxifen), selective ER degraders (e.g., fulvestrant), and aromatase inhibitors (AI), which block the production of estrogen (e.g., anastrozole, letrozole, and exemestane). The results of the method may cause a healthcare provider to further prescribe for the subject a combination therapy of a drug targeting the estrogen-signaling pathway and another anti-breast cancer therapy.
[0012] In various implementations, the methods can include the use of microfluidic isolation of circulating tumor cells (CTCs), or exosomes or cell-free RNA, and digital detection of RNA derived from these components. In some embodiments, the RNA can be converted into cDNA and encapsulated into individual droplets for amplification in the presence of reporter groups that are configured to bind specifically to cDNA from CTCs (or other tumor RNA) and not to cDNA from other noncancerous cells.
[0013] The methods described herein can further include reducing a volume of the product before isolating RNA and/or removing contaminants from the cDNA-containing solution before encapsulating the cDNA molecules.
[0014] In various implementations of the new methods, generating cDNA molecules from the isolated RNA can include conducting reverse transcription (RT) polymerase chain reaction (PCR) of the isolated RNA molecules and/or amplifying cDNA molecules within each of the droplets can include conducting PCR in each droplet. In the new methods, encapsulating individual cDNA molecules and PCR reagents in individual droplets can include forming at least 1000 droplets of a non-aqueous liquid, such as one or more fluorocarbons, hydrofluorocarbons, mineral oils, silicone oils, and hydrocarbon oils and/or one or more surfactants. Each droplet can contain, on average, one target cDNA molecule obtained from a CTC. In some embodiments, the reporter groups can be or include a fluorescent label.
[0015] In various implementations, the methods described herein include using probes and primers in amplifying the cDNA molecules within each of the droplets that correspond to one or more genes selected from the list of cancer-selective genes in Table 1 herein. For example, the selected genes can include prostate cancer-selective genes, e.g., any one or more of AGR2, FOLH1, HOXB13, KLK2, KLK3, SCHLAP1, AMACR, AR variants, including AR-V7, UGT2B15, STEAP2, and TMPRSS2:ERG (as can be easily determined from Table 1). In another example, any one or more of ALDH1A3, CDH11, EGFR, FAT1, MET, PKP3, RND3, S100A2, and STEAP2 are selective for pancreatic cancer. Similar lists can be generated for the other types of cancers listed in Table 3.
[0016] In other examples, the selected genes include any one or more of the breast cancer-selective genes listed in Table 3. In other examples, the selected genes include genes selective for one or more of lung, liver, prostate, pancreatic, and melanoma cancer. For example, a multiplexed assay can include 2, 3, 4, 5, 6, 7, 8, 9, 10, 11, 12 or even all of the selected genes that are listed in Table 3 as being selective for a particular type of cancer, e.g., breast cancer, lung cancer, prostate cancer, pancreatic cancer, liver cancer, and melanoma. Typically, a group of primers and probes for 1, 2, 3, 4, 5, 6, 7, 8, 9, 10, 11, or 12 or more cancer-selective genes from Table 1 are used for a particular type of cancer. Other specific combinations of selected genes (markers for those genes) are described in the Examples below.
[0017] In the methods described herein, the CTCs can arise from metastatic or primary/localized cancers.
[0018] The disclosure also provides uses of the probes and primers related to one or more selected cancer genes listed in Table 3 for amplifying and detecting cDNA molecules obtained from circulating tumor cells (CTCs) in a blood sample, and for determining which of a series of lineage markers are expressed in the CTCs in the blood sample, wherein an expression level of a specific one or more lineage markers is predictive of progression-free survival and overall survival for a specific anti-cancer treatment regimen.
[0019] As used herein, the phrase "circulating tumor cells" (CTCs) refers to cancer cells derived from solid tumors (non-hematogenous cancers) that are present in very rare numbers in the blood stream of patients (e.g., about 1 CTC in about 10,000,000 WBCs in whole blood). CTCs can arise from both metastatic as well as primary/localized cancers.
[0020] As used herein, a "product" means a group of isolated rare cells and other contaminating blood cells, e.g., red blood cells, white blood cells (e.g., leukocytes), e.g., in some sort of liquid, e.g., a buffer, such as a pluronic buffer, that arise from processing in the methods described herein, e.g., using the systems described herein. A typical product may contain only about one to ten CTCs admixed with 500 to 2,500 or more WBCs, e.g., one to ten CTCs in a mixture of 1000 to 2000 WBCs. However, the limit of detection of the present methods can be about 1 CTC in 10,000 WBC. Thus, while the present methods can achieve a level of purity of about 1 CTC in 500 WBCs, the present methods do not require highly purified CTCs, as is required in some known methods of CTC analysis.
[0021] The polymerase chain reaction (PCR) is a process of amplification of known DNA fragments by serial annealing and re-annealing of small oligonucleotide primers, resulting in a detectable molecular signal.
[0022] Reverse Transcription (RT)-PCR refers to the use of reverse transcription to generate a complementary c-DNA molecule from an RNA template, thereby enabling the DNA polymerase chain reaction to operate on RNA. An important aspect of the new methods disclosed herein is the availability of high quality RNA from whole cell CTCs that are not lysed or treated in such a way that might destroy or degrade the RNA, or from exosomes or cell-free RNA.
[0023] As used herein, "positive droplets" are lipid-encapsulated molecules in which a PCR reaction performed with tagged primers allows visualization of the PCR amplified product. Thus, a droplet that contained a single template cDNA molecule of a particular targeted gene can become visible using fluorescence microscopy, while an "empty" or "negative" droplet is one that contains no targeted cDNA.
[0024] The new methods and systems provide numerous advantages and benefits. For example, the current methods and systems provide results that are far more accurate and robust than either of the prior known systems when used alone. By breaking down the signal from a single CTC or exosome into hundreds or thousands of brightly fluorescent droplets, each derived from a single cDNA molecule, the new digital-CTC assays enable dramatic signal amplification. Given the strict criteria in selecting and optimizing the biomarker genes described herein, the background signal from normal blood cells is negligible in d-CTC. Thus, d-CTC enables greatly amplified signal from patients with advanced cancer (nearly 100% of patients with prostate, lung, breast, and liver cancers). Not only is the fraction of patients with a positive score significantly increased, but also the high level of signal enables dynamic measurements as tumor load declines following cancer therapy, and enables accurate prediction of clinical outcomes of specific therapies even before the therapies are started.
[0025] In sum, this novel microfluidics platform provides a streamlined, ultrahigh-throughput, rapid (e.g., 3 hours per run), and extremely high sensitivity method of enriching, detecting, and analyzing CTCs in patient blood samples. The platform provides rich, clinically actionable information, including the prediction of clinical outcomes of specific cancer-directed therapies.
[0026] Unless otherwise defined, all technical and scientific terms used herein have the same meaning as commonly understood by one of ordinary skill in the art to which this invention belongs. Although methods and materials similar or equivalent to those described herein can be used in the practice or testing of the present invention, suitable methods and materials are described below. All publications, patent applications, patents, and other references mentioned herein are incorporated by reference in their entirety. In case of conflict, the present specification, including definitions, will control. In addition, the materials, methods, and examples are illustrative only and not intended to be limiting.
[0027] Other features and advantages of the invention will be apparent from the following detailed description, and from the claims.
DESCRIPTION OF DRAWINGS
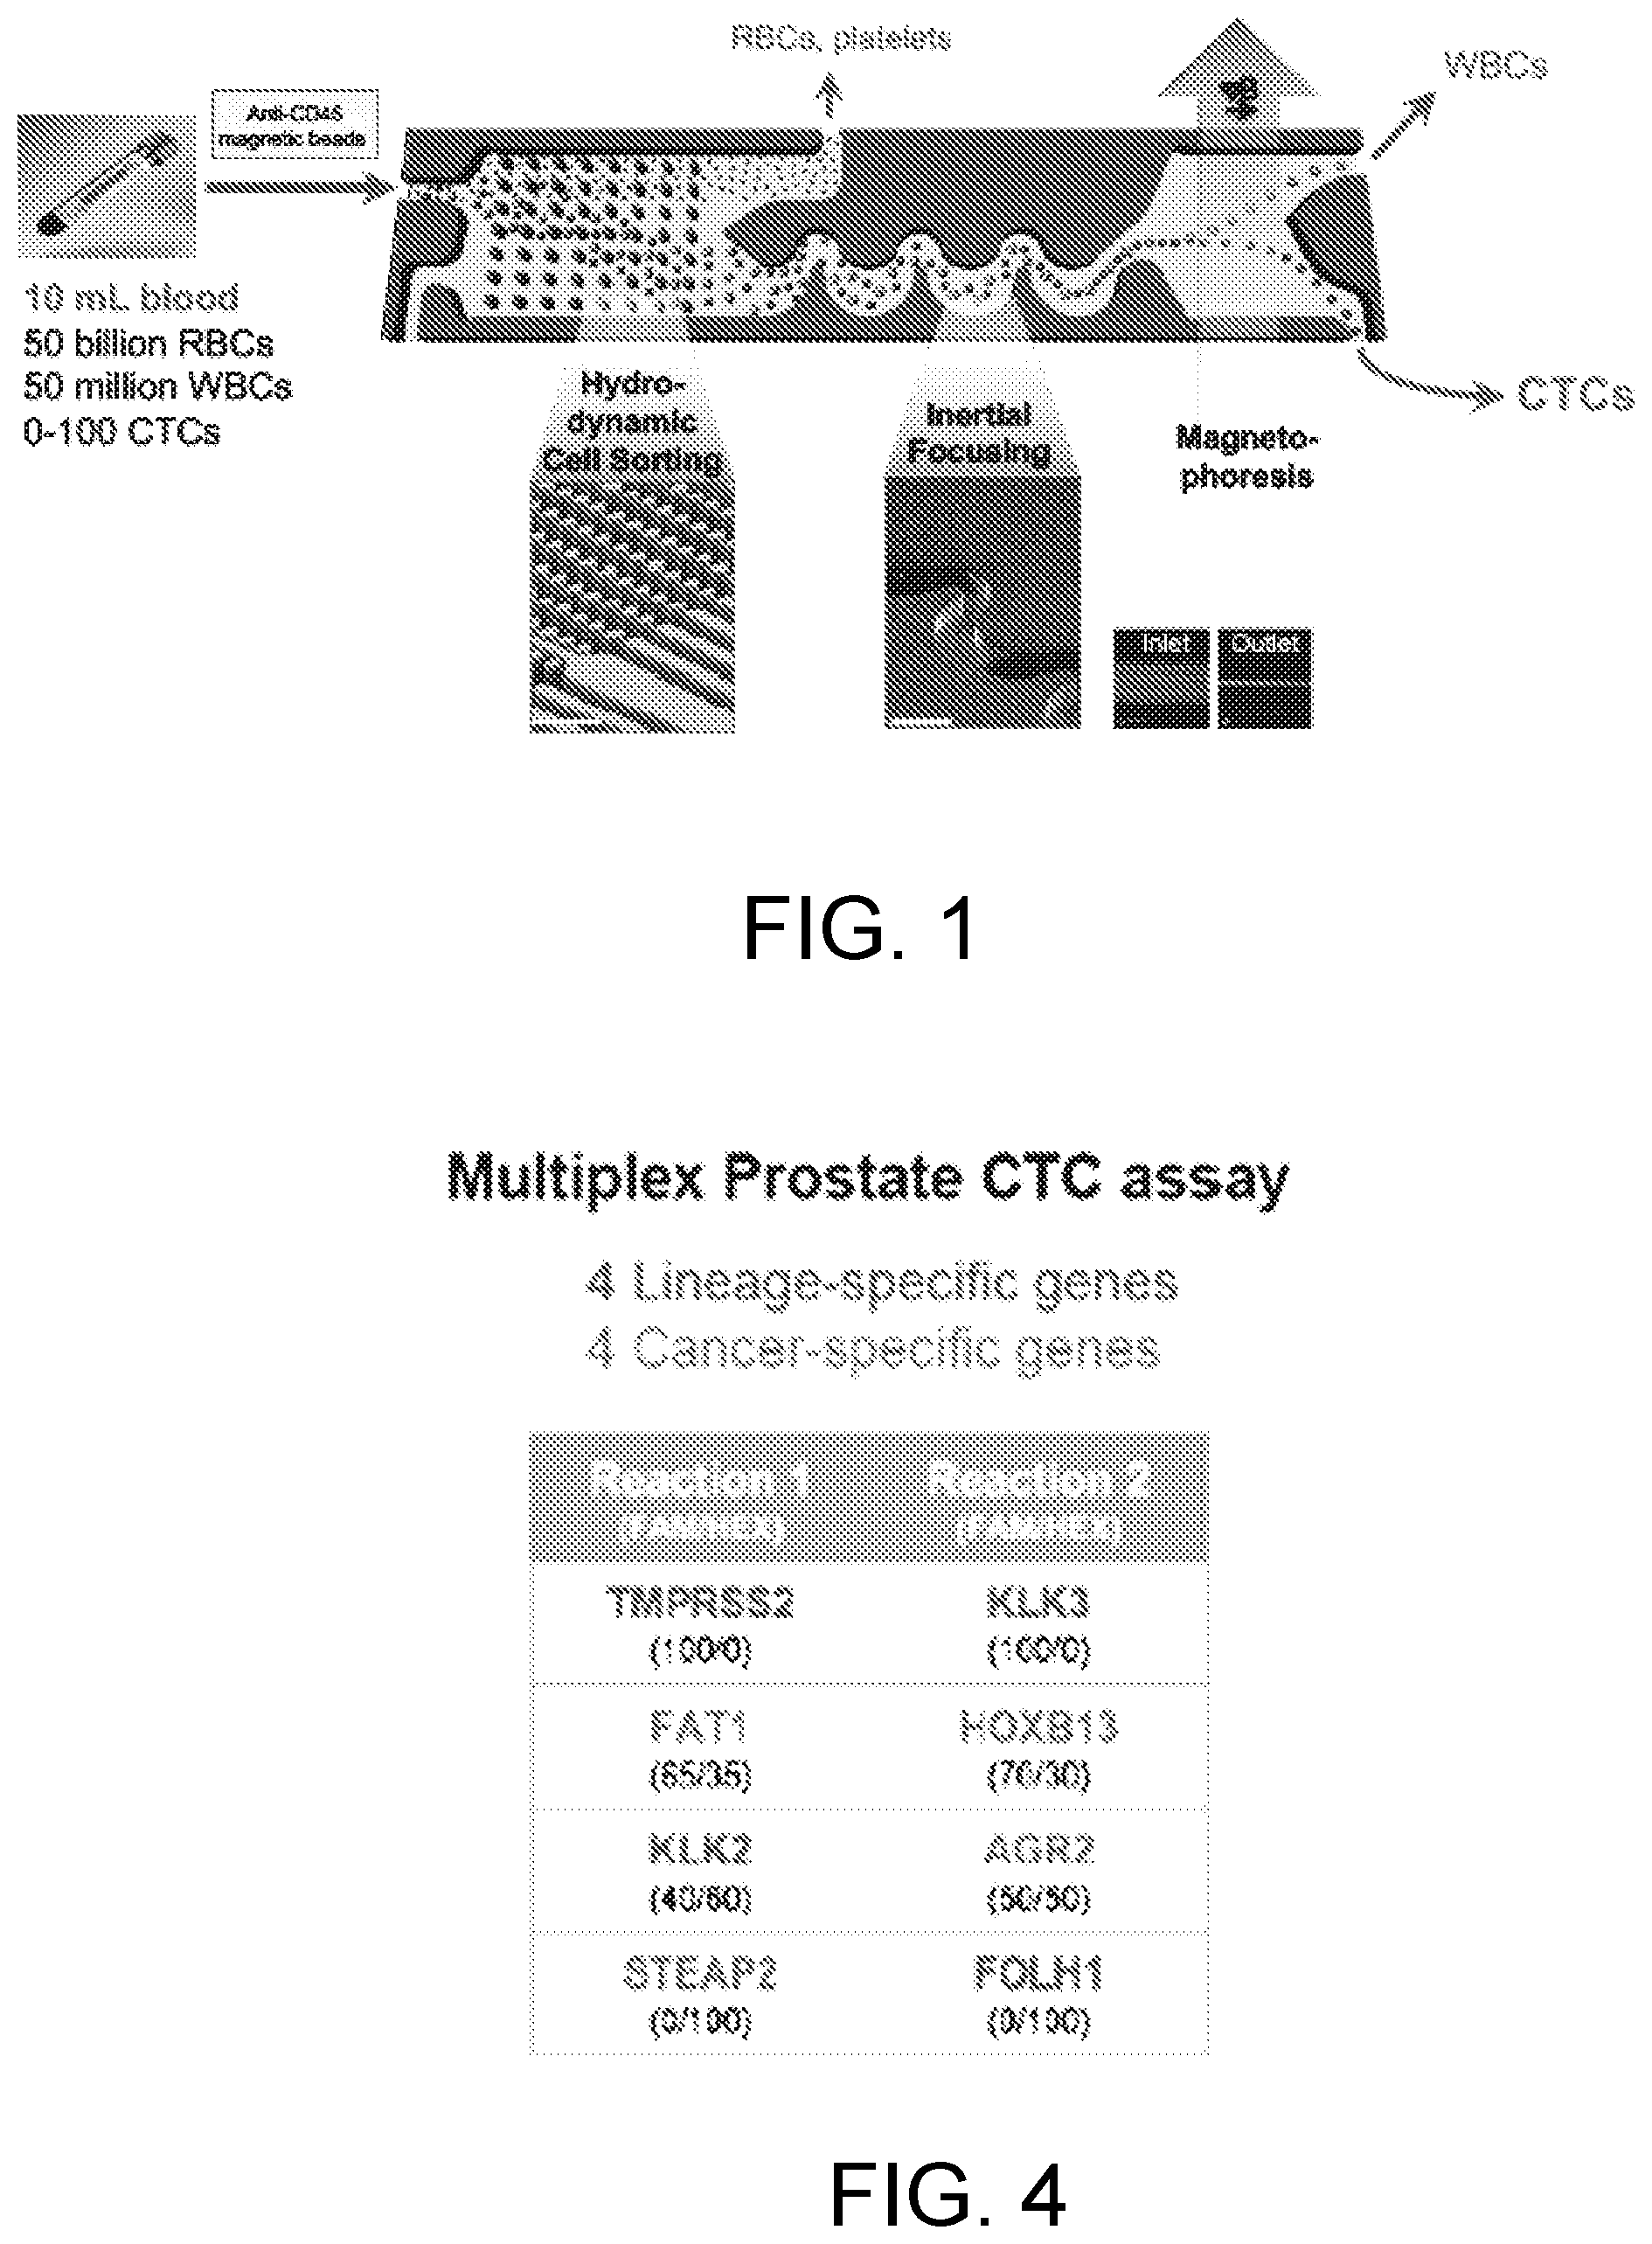
[0028] FIG. 1 is a schematic diagram of a microfluidic CTC isolation module (CTC-iChip).
[0029] FIG. 2 is a schematic diagram showing a series of steps for obtaining intact CTCs from a patient blood sample, and then ending with a signal intensity plot that shows a d-CTC assay multiplexed for four different lineage specific transcripts to detect prostate cancer cell lines spiked into blood (shown as FAM label intensity vs. HEX label intensity).
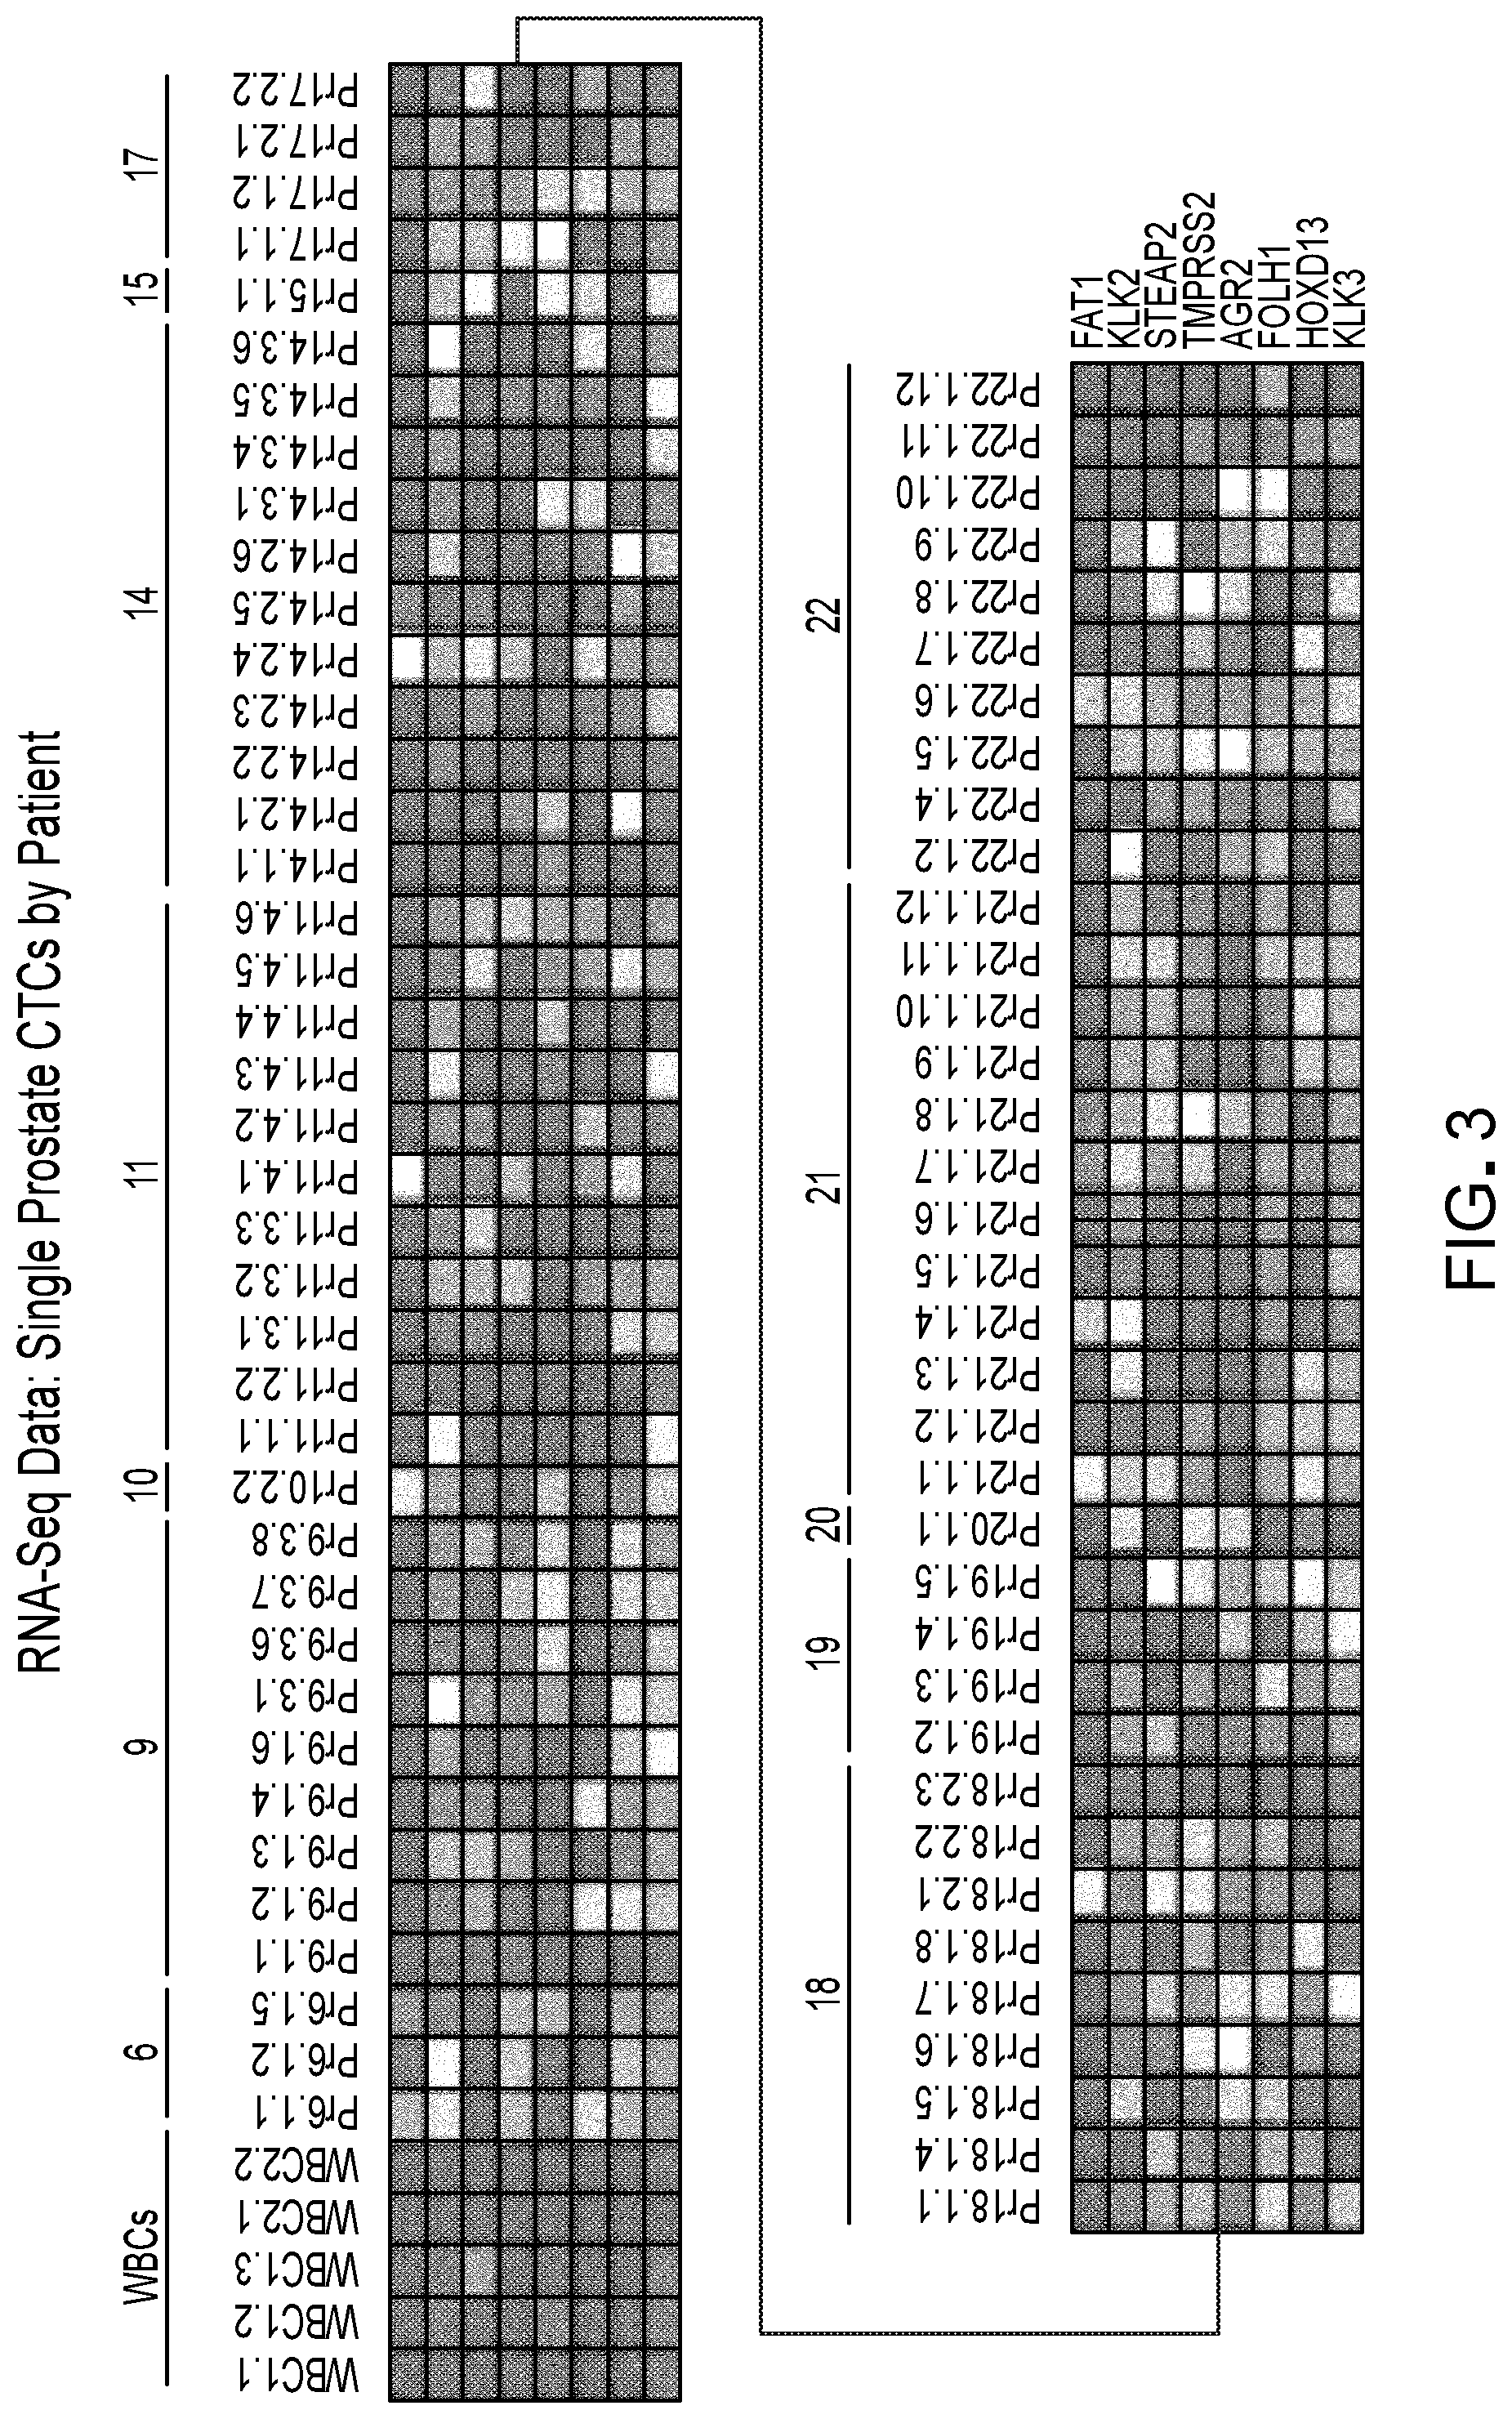
[0030] FIG. 3 is a single cell RNA-seq data showing the expression of final selected genes in white blood cells (WBC) and single prostate CTCs isolated from patients with metastatic prostate cancer.
[0031] FIG. 4 is chart showing the results of a multiplex prostate CTC assay that provides 4 lineage-specific genes (TMPRSS2, KLK3, KLK2, and FOLH1) and 4 cancer-specific genes (FAT1, HOXB13, AGR2, and STEAP2) and shows the list of genes contained within each multiplex prostate CTC assay with FAM/HEX ratio for each gene.
[0032] FIG. 5 is a multi-class support vector machine (SVM) classifier model that automatically classifies positive droplet signals. Representative multiplex ddPCR expression signal in CTCs from a metastatic prostate cancer patient, a localized prostate cancer patient, and a healthy donor.
[0033] FIG. 6 is a graph of d-CTC assay signal for varying numbers of LNCaP cells micro-manipulated into healthy donor whole blood and processed using the CTC-iChip.
[0034] FIG. 7A-7D are a series of graphs showing the ddPCR expression signal for genes in metastatic patients and healthy donors.
[0035] FIG. 7A is a heatmap showing d-CTC assay signal for each gene in blood obtained from healthy donor controls, localized prostate cancer patients, and metastatic castration-resistant prostate cancer (mCRPC) patients.
[0036] FIG. 7B is graph showing the weighted prostate CTC score developed based on the relative signal to noise ratio of the ddPCR expression signal for each gene in metastatic patients relative to healthy donors.
[0037] FIGS. 7C, 7D, and 7E are graphs of relationships between CTC ddPCR signal and CTC staining signal, ddPCR CTC signal and serum PSA, and ddPCR CTC KLK3 signal and serum PSA, respectively.
[0038] FIGS. 8A-8F are a series of graphs and other results of analytical testing and validation of ddPCR expression assay for AR-V7 and TMPRSS2:ERG expression in prostate CTCs.
[0039] FIG. 8A is a bar graph of ddPCR signal for AV-7 for varying numbers of 22Rv1 cells micro-manipulated into healthy donor whole blood and processed using the CTC-iChip.
[0040] FIG. 8B is a bar graph of ddPCR signal for TMPRSS2:ERG for varying numbers of VCaP cells micro-manipulated into healthy donor whole blood and processed using the CTC-iChip.
[0041] FIG. 8C is a chart showing the results of ddPCR signal of metastatic prostate cancer patients having AR-V7 and/or TMPRSS2-ERG ddPCR signal.
[0042] FIG. 8D is a chart showing the results of ddPCR signal of healthy donors having AR-V7 and/or TMPRSS2-ERG ddPCR signal.
[0043] FIG. 8E is a concordance of ddPCR signal for TMPRSS2:ERG in prostate CTCs and matched archival FFPE specimens of prostate cancer biopsy or prostatectomy tissues from prostate cancer patients.
[0044] FIG. 8F is a concordance of ddPCR signal for AR-V7 in prostate CTCs and matched archival FFPE specimens of prostate cancer biopsy or prostatectomy tissues from prostate cancer patients.
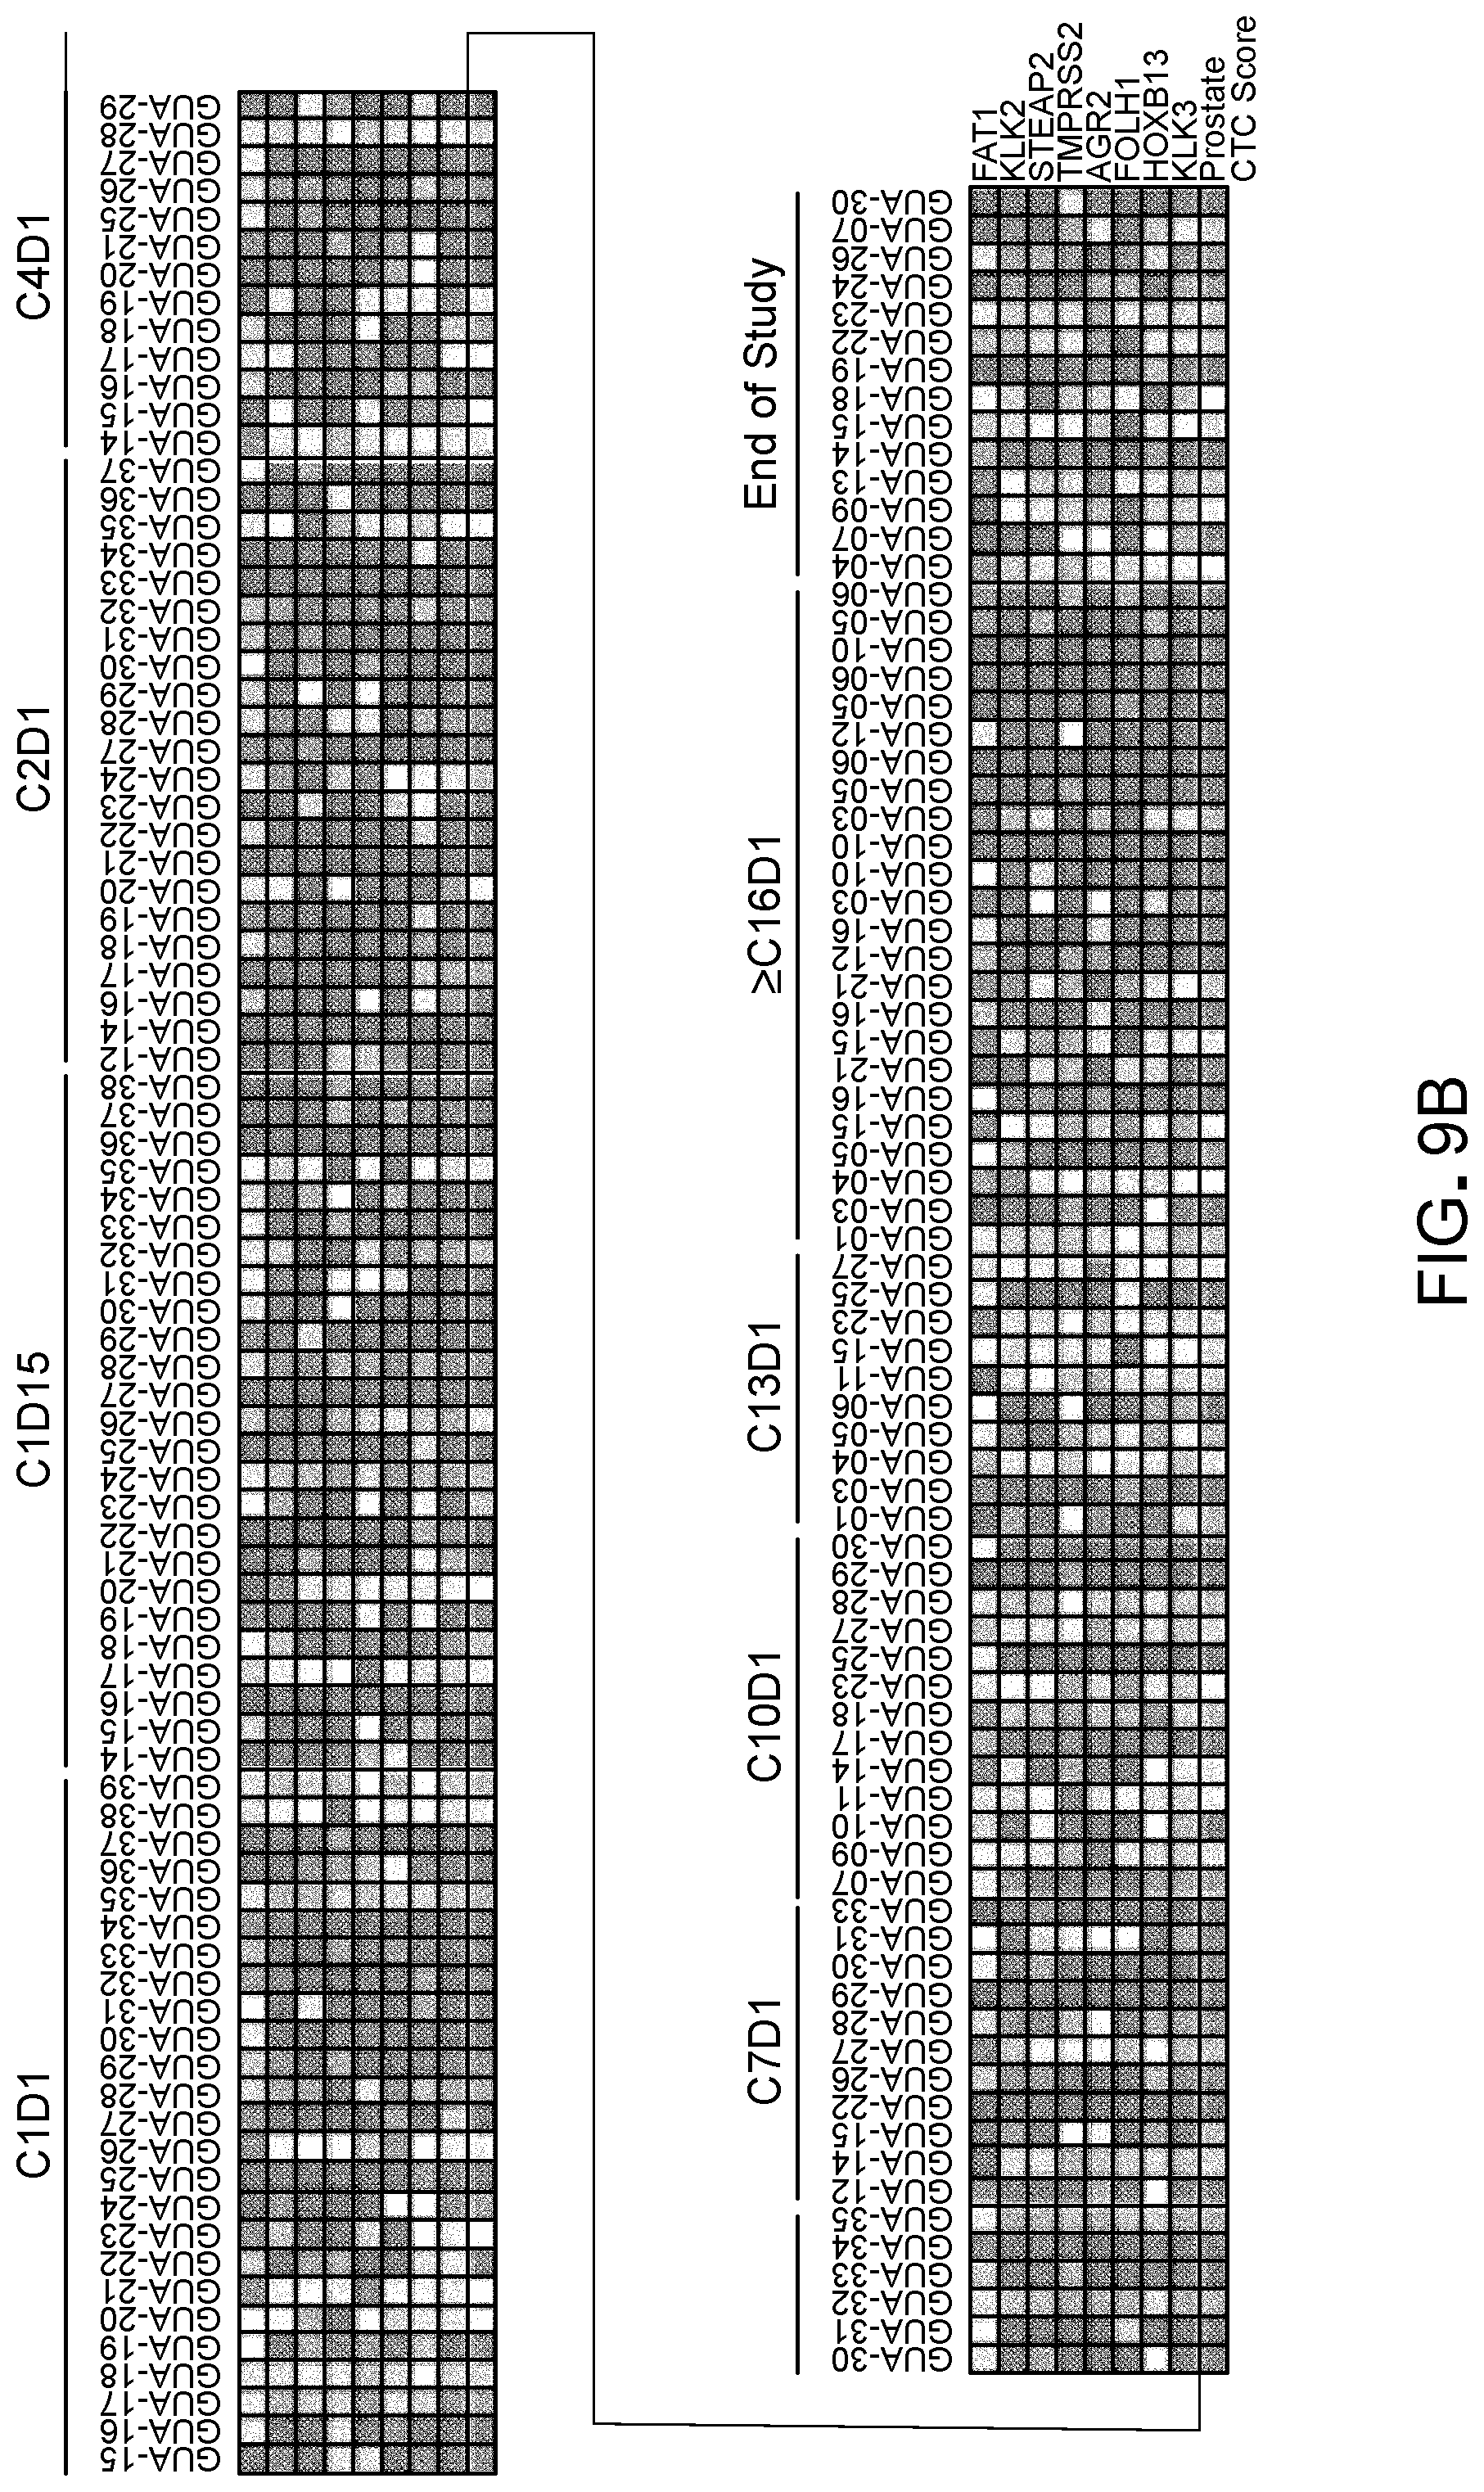
[0045] FIGS. 9A-9B show the results of a prospective study of first-line abiraterone therapy for prostate cancer patients.
[0046] FIG. 9A is a schematic of CTC draw time points in the prospective study of abiraterone in the first-line setting in patients with mCRPC.
[0047] FIG. 9B is a heatmap of digital CTC assay signal in patients at different time points of abiraterone treatment.
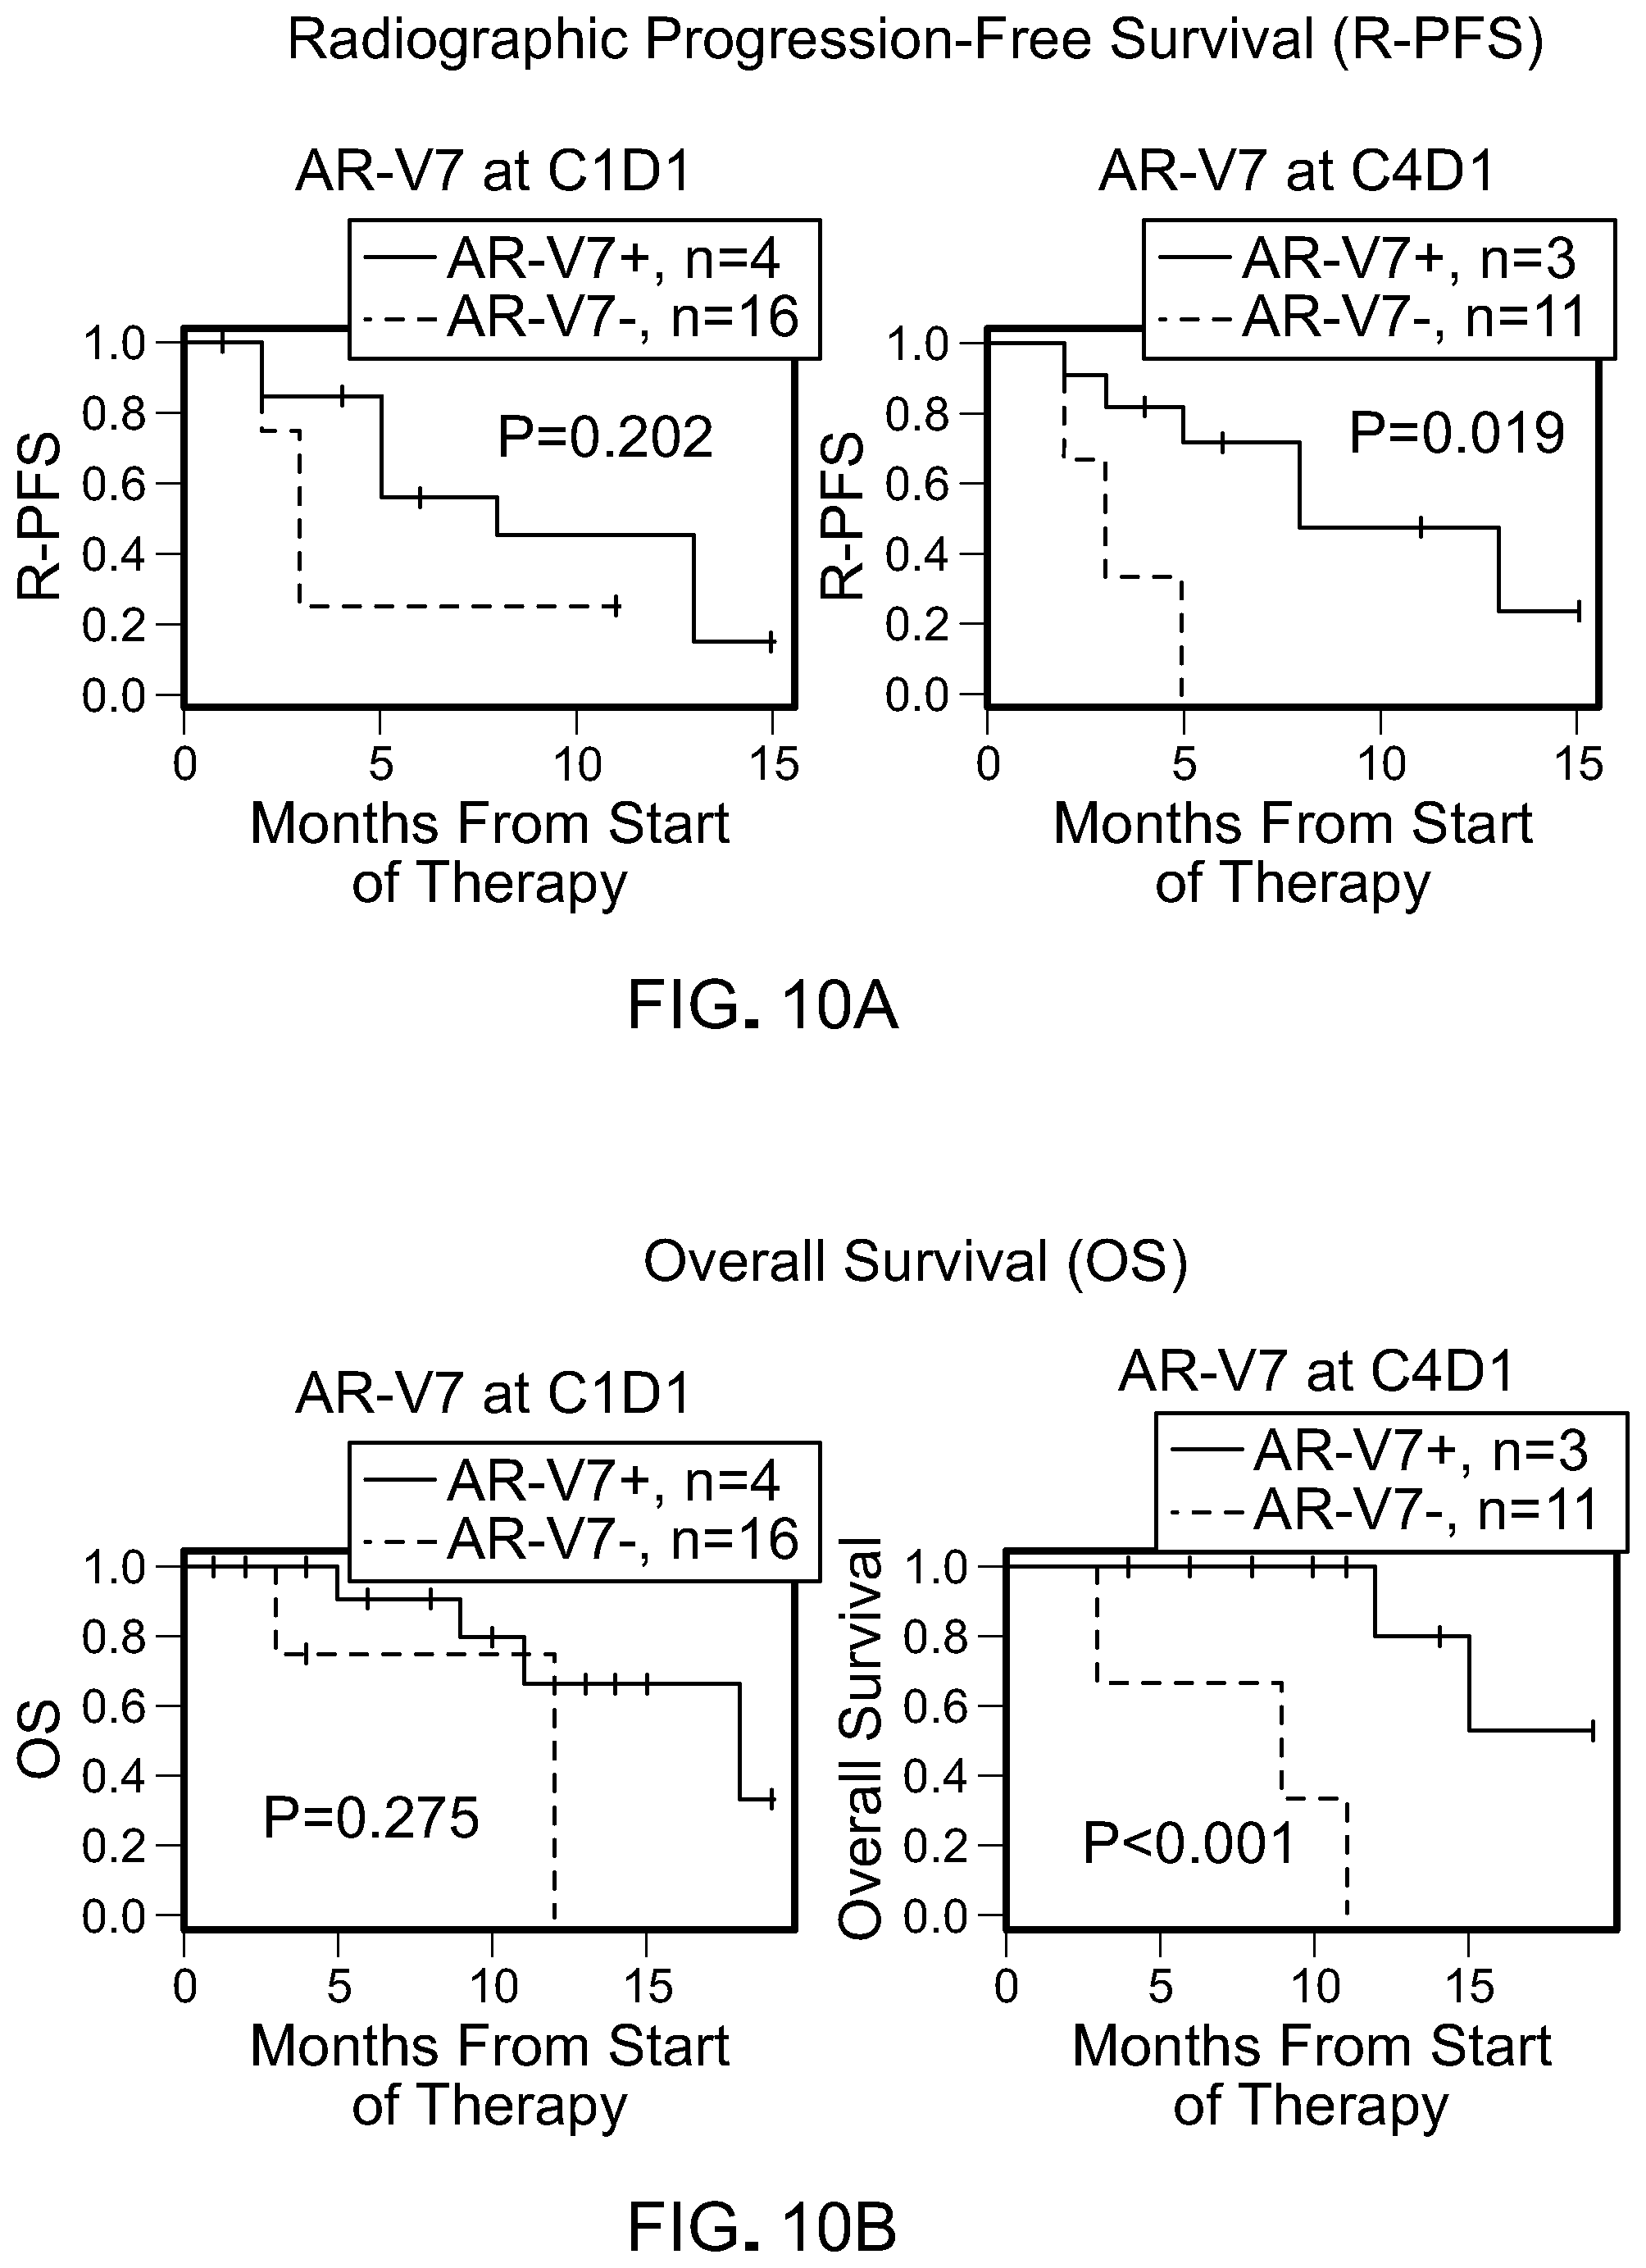
[0048] FIGS. 10A-10F are a series of Kaplan-Meier curves that show the results of a prospective evaluation of digital CTC markers.
[0049] FIG. 10A is a set of Kaplan-Meier curves for radiographic progression-free survival (R-PFS) by AR-V7 status in CTCs at pretreatment (C1D1) and 12 weeks on treatment (C4D1).
[0050] FIG. 10B is a set of Kaplan-Meier curves for overall survival (OS) by AR-V7 status in CTCs at pretreatment (C1D1) and 12 weeks on treatment (C4D1).
[0051] FIG. 10C is a pair of Kaplan-Meier curves for radiographic progression-free survival (R-PFS) for HOXB13 in CTCs at pretreatment (C1D1) and 12 weeks on treatment (C4D1).
[0052] FIG. 10D is a pair of Kaplan-Meier curves for OS for HOXb13 in CTCs at pretreatment (C1D1) and 12 weeks on treatment (C4D1).
[0053] FIG. 10E is a set of Kaplan-Meier curves for R-PFS for FOLH1 in CTCs at pretreatment (C1D1) and 12 weeks on treatment (C4D1).
[0054] FIG. 10F is a series of Kaplan-Meier curves for OS for FOLH1 in CTCs at pretreatment (C1D1) and 12 weeks on treatment (C4D1).
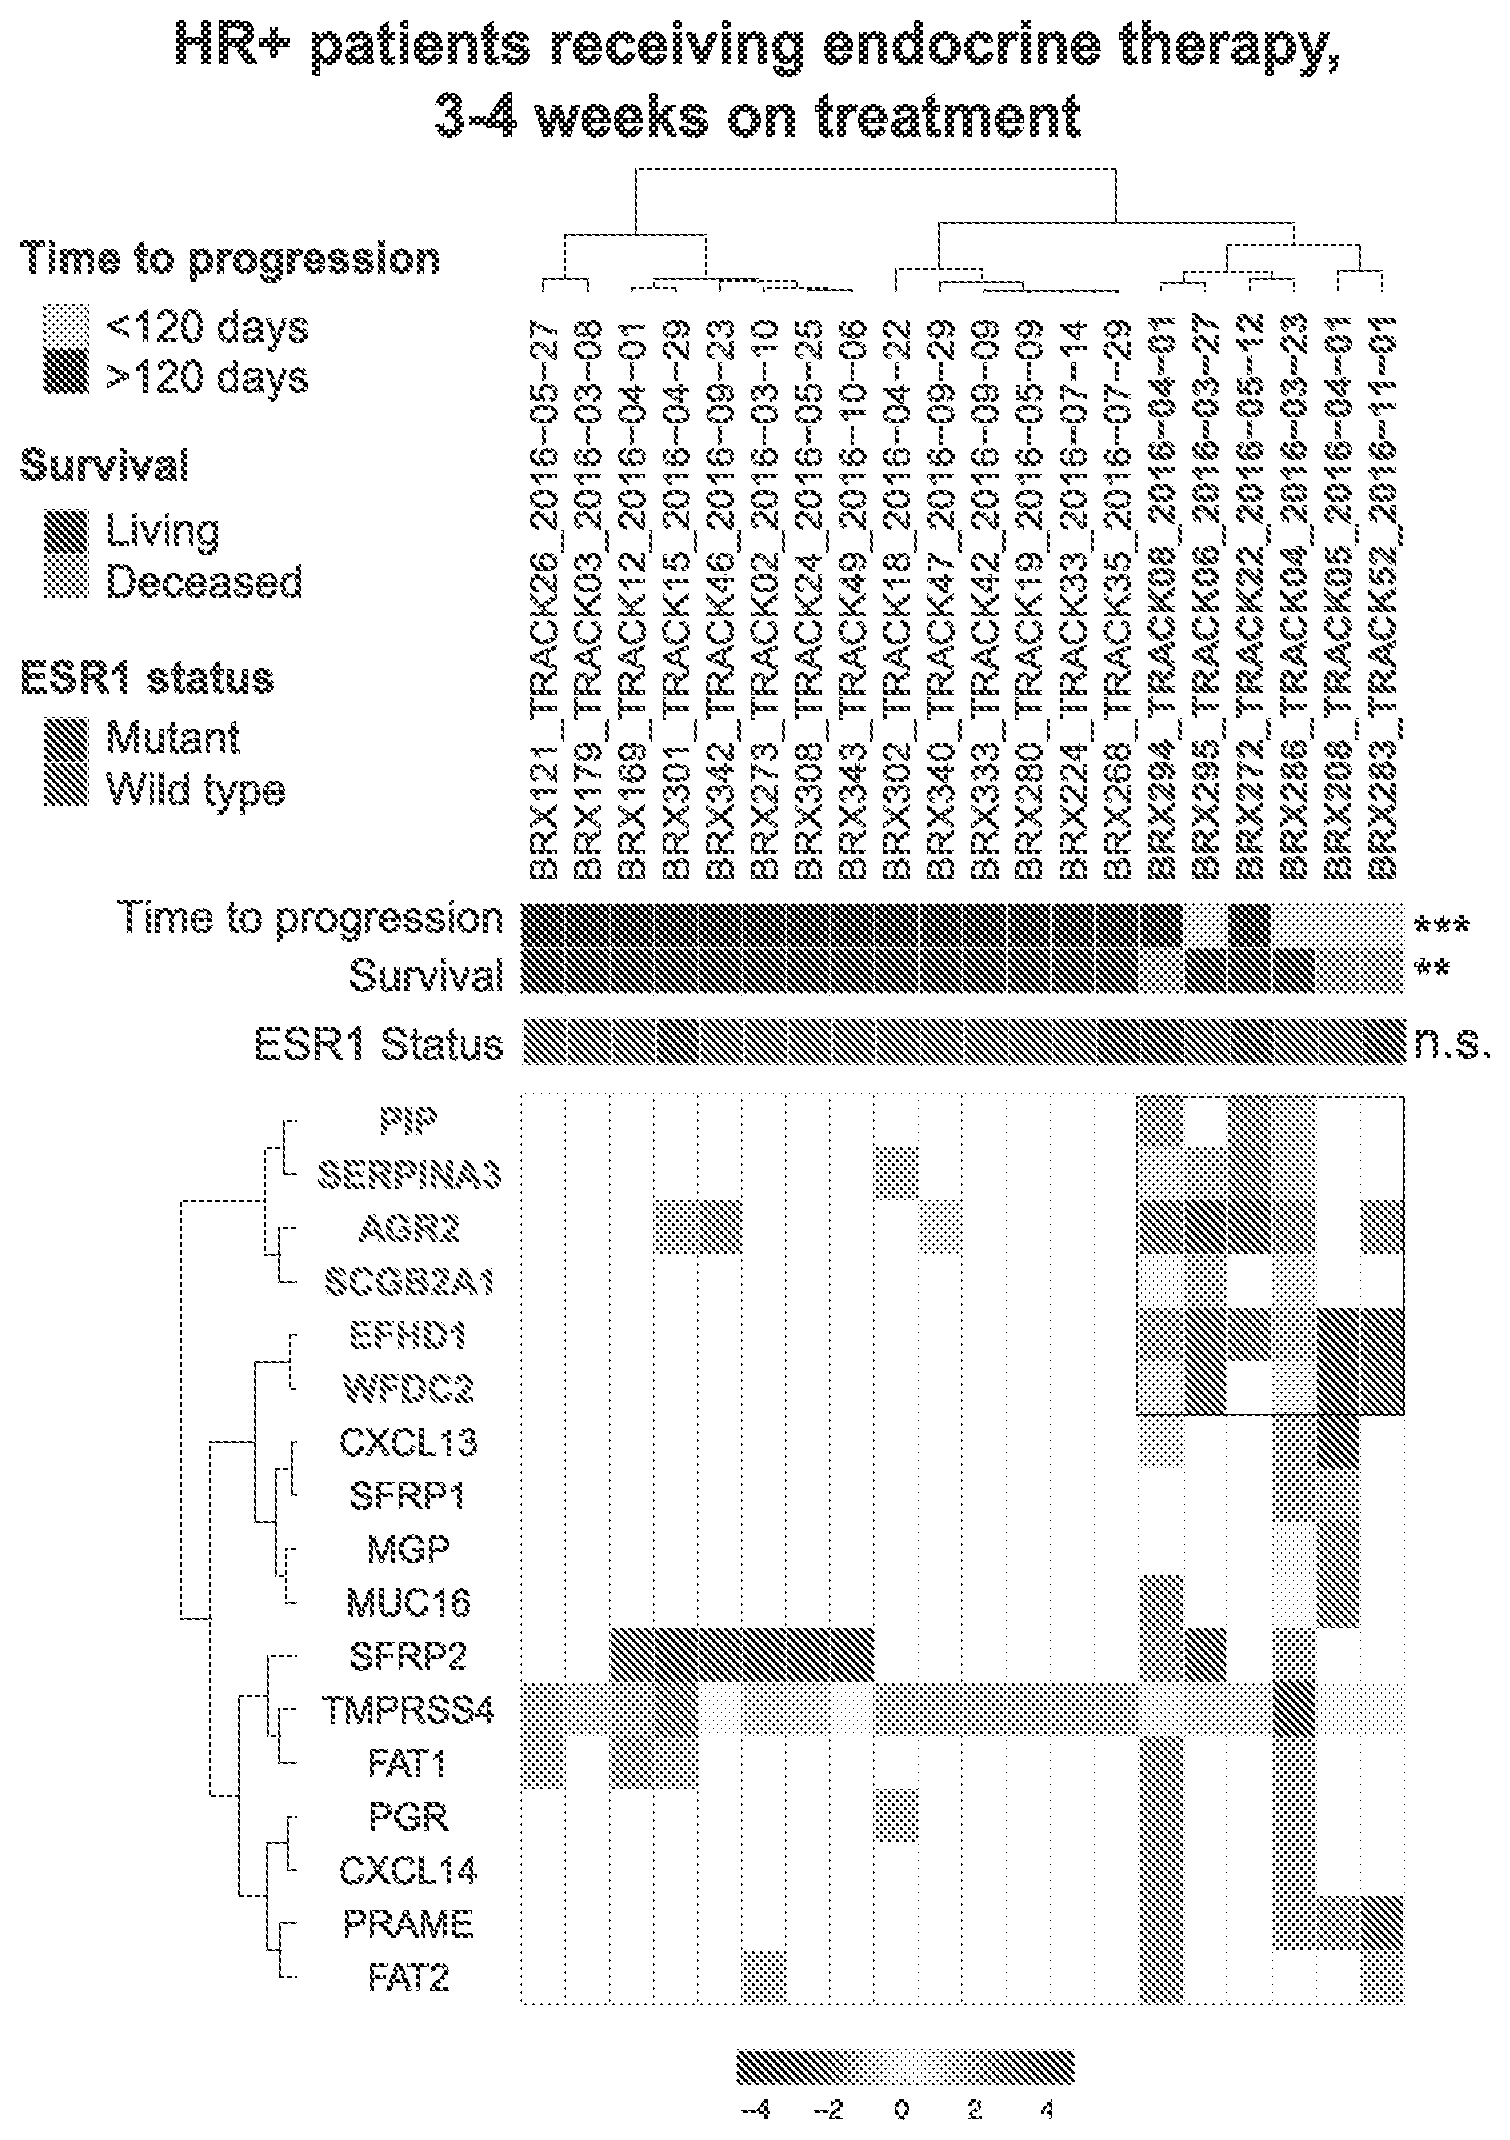
[0055] FIGS. 11A-D are a series of figures that show resistance signature (RS) markers that are associated with endocrine resistance ("ER") signaling identify high-risk HR+ patients receiving endocrine treatment and are prognostic of both OS and time to progression ("TTP") in this population.
[0056] FIG. 11A is a graphic representation of unsupervised clustering of marker expression at 3-4 weeks of treatment in HR+ patients receiving endocrine treatment. A set of markers (red) identifies a group of patients (blue) significantly enriched for progression within 120 days and poor survival (p-values show significance based on Fisher's exact test). ESR1 mutation status for each patient, established by either genotyping or ddPCR, is also indicated.
[0057] FIGS. 11B-1 and B-2 are a pair of graphs that show correlations between a metascore based on the expression of the 6 high risk genes and GSEA signatures associated with estrogen signaling (11B-1) and endocrine resistance (11B-2) across multiple publically available datasets are shown in red crosses. The dotted line on the right as 0.54 represents the median correlation across the multiple comparisons. Correlations with metascores based on 100 random sets of 6 genes are shown in blue circles.
[0058] FIGS. 11C-1 and 11C-2 are a pair of Kaplan-Meier curves of OS (11C-1) and TTP (11C-2) in HR+ patients receiving endocrine therapy based on RS score at 3-4 weeks on treatment. Groups were divided at 275 transcripts/ml; p-values based on log rank tests.
[0059] FIGS. 11D1 and 11D-2 are a pair of Kaplan-Meier curves depicting OS (left) and TTP (right) in HR+ patients receiving endocrine therapy based on presence of ESR1 mutations. p-values based on log rank tests.
DETAILED DESCRIPTION
[0060] The present disclosure relates to methods and systems to obtain information from RNA from cancer cells, e.g., CTCs, in blood samples, exosomes from cancer cells in blood samples, or cell-free RNA from cancer cells, to help predict whether a given anti-cancer regimen will work effectively to treat a specific type of cancer in a given patient. These methods and systems combine the power of isolation techniques such as ultrahigh-throughput microfluidic techniques, for example, negative depletion techniques, e.g., those using negative depletion of hematopoietic cells to isolate untagged CTCs in a blood sample, with analysis techniques, such as droplet-based digital polymerase chain reaction (PCR) assays focused on RNA markers of specific cancer lineages. The specific assay methods, but not the new predictive analysis methods described herein, are described in further detail in PCT WO2016154600, which is incorporated herein by reference in its entirety.
[0061] The new methods include steps carried out by comparing the expression levels of various markers to reference standards, and by comparing these expression levels in patients who are destined to respond to specific cancer therapy or likely to have an early progression of their cancer. Such measurements can be informative at pretreatment baseline or they may emerge through serial blood monitoring once treatment is initiated. The value of these measurements lies in the information provided with respect to specific treatment choices. As multiple treatment options are available for patients with a variety of different cancers, information that helps individualize and guide the rational selection of therapy based on molecular markers becomes critical for effective cancer therapy.
[0062] As a specific example discussed in more detail below, patients with prostate cancer that have an elevated level of FOLH1 (PSMA) and/or HOXB13 before any therapy is started (e.g., above 2.5 transcripts per mL or other predetermined threshold) will not do well if treated only with abiraterone (e.g., ZYTIGA.RTM.). Such patients should be considered for alternative non-hormonal therapies (e.g., taxane chemotherapy or radio-isotope therapy), PARP inhibitors, or novel experimental therapies currently being developed, or combinations of existing therapies that are being tested in patients at high risk of recurrence.
[0063] In addition, other CTC isolation technologies than are described herein can also be used in the new methods as long as they provide partially purification of cells (e.g., filtration, positive tumor cell selection), although the quality of the RNA and hence the sensitivity of the assay will be inferior to the microfluidic technologies. Similarly, other digital PCR technologies applied to RNA are capable of detecting lineage-specific primers, although the sensitivity of the droplet-based assay is likely to be the highest.
General Concepts of the Assay Methods
[0064] The isolation techniques are used to enrich CTCs from a blood sample, e.g., using ultrahigh-throughput microfluidic such as the so-called "CTC-iChip" described in, for example, International PCT Application WO 2015/058206 and in Ozkumur et al., "Inertial Focusing for Tumor Antigen-Dependent and -Independent Sorting of Rare Circulating Tumor Cells," Sci. Transl. Med., 5:179ra47 (2013). The CTC-iChip uses a CTC antigen-independent approach in which WBCs in the blood sample are labeled with magnetic beads, and the sample is then processed through two enrichment stages. The first stage uses deterministic lateral displacement to remove small and flexible cells/particles (RBCs, platelets, unbound magnetic beads, and plasma) while retaining larger cells (CTCs and WBCs). The second stage moves all cells into a narrow fluid stream using inertial focusing and then uses a magnetic field to pull bead-labeled WBCs out of the focused stream, leaving highly enriched CTCs. The CTC-iChip product from 10 ml of whole blood typically contains <500,000 RBCs, <5,000 WBCs, and a variable number of CTCs.
[0065] Some analysis techniques further enrich and analyze the isolated CTCs, e.g., as obtained from the CTC-iChip, e.g., using droplet microfluidics. Some basic information on droplet microfluidics is described generally in Jeremy et al., "Ultrahigh-Throughput Screening in Drop-Based Microfluidics for Directed Evolution," Proc. Natl. Acad. Sci. USA, 107:4004 (2010).
[0066] As used herein, the droplet microfluidic techniques can, in certain implementations, include encapsulation of single cells, RT-PCR reagents, and lysis buffer into droplets of typically non-aqueous liquids (e.g., fluorocarbons, hydrofluorocarbons, mineral oil, silicone oil, and hydrocarbon oil; surfactants can also be include in the non-aqueous liquid, e.g., Span80, Monolein/oleic acid, Tween20/80, SDS, n-butanol, ABIL EM90, and phospholipids), in the size range of, e.g., about 0.5 pL to 15 nL in volume and, e.g., 10 to 300 .mu.m, e.g., 20 to 100 .mu.m, e.g., 30 to 50 .mu.m, e.g., 35 .mu.m in diameter. As used in the new methods described in the present disclosure, these techniques further include amplification of cancer-specific transcripts within the droplets to produce a fluorescent signal, and sorting of amplification-positive drops. This approach results in isolation of pure CTCs that can be sequenced and analyzed for determining the potential efficacy of a specific anti-cancer therapy in a specific patient.
[0067] Due to the high heterogeneity of CTCs, it is useful to use multiplexed amplification to detect as many CTCs as possible. Thus, instead of using one pair of primers in the PCR mixture, one can increase the probability of detecting and sorting CTCs using a combination of tumor specific primers. For additional information on the use of PCR for sorting cancer cells, see, e.g., Eastburn et al., "Identification and genetic analysis of cancer cells with PCR-activated cell sorting," Nucleic Acids Research, 2014, Vol. 42, No. 16 e128.
[0068] In the new assay methods, CTCs are lysed to release RNA molecules, which are representative of the genes expressed in a cancer cell. Most are "lineage" specific, rather than cancer specific, for example any prostate cell (whether cancerous or not) expresses these markers. However, normal blood cells do not, and the fact that the signal is derived from a cell circulating in the bloodstream defines it as an abnormal signal. By converting the RNA to cDNA, one can amplify this lineage signal using PCR. Droplet digital PCR, which is extraordinarily sensitive, is used to allow converting the signal from a single cancer cell (i.e., one signal in an imaging assay) into thousands of positive immunofluorescent droplets. The combination of multiple, highly curated gene transcripts ensures high sensitivity and specificity for cancer, and also allows for functional insights (as in the status of hormone responsive pathways in prostate and breast cancers).
[0069] As noted, the new assay methods focus on the detection and analysis of high quality RNA rather than DNA. While there has been considerable work on DNA mutation detection in plasma and in CTCs, the present methods rely on RNA markers for the following reasons:
[0070] 1. DNA mutations are not tumor specific, and the discovery that a healthy individual has some unidentified cancer cells in the blood is a very difficult clinical situation. In contrast, by selecting tumor-specific RNAs (e.g., prostate vs lung), the new methods can identify the source of cancer cells in the blood.
[0071] 2. DNA mutations are very heterogeneous and besides a few recurrent mutations shared by many cancers, most blood-based mutation detection strategies require pre-existing knowledge of the mutations present in the primary tumor (i.e., not appropriate for screening for unknown cancers). In contrast, all tumor cells derived from specific organs express common lineage markers at the RNA level. Thus, a single cocktail of markers is used in the new methods for each individual type of cancer.
[0072] 3. Low levels of CTCs are shed by invasive cancers before metastases are established (i.e., it is not too late for blood-based detection), but the presence of tumor cells in the blood connotes vascular invasion (i.e., invasive rather than indolent cancer). That is not the case for plasma DNA or plasma protein markers, which are leaked from dying cells in the primary tumor, and do not necessarily indicate vascular invasion. For example, serum PSA protein in the blood is shed by both benign prostate cells as well as primary prostate cancers. On the other hand, CTCs expressing PSA are shed only by invasive prostate cancers.
[0073] 4. The analysis of RNA using the novel digital scoring technologies described herein is extraordinarily sensitive. However, free RNA is degraded in the bloodstream, and the use of isolation systems as described herein, such as microfluidic negative depletion systems (e.g., the CTC-Chip system) is unique in that the untagged tumor cells have high quality RNA that is extractable.
[0074] The choice of cDNA as a target molecule over DNA was made to not only to boost the signal originating from each tumor cell, but also to specifically target only tumor cell transcripts to the exclusion of white blood cell (WBC) transcripts. The boost in signal is a significant advantage, as it avoids the need for the isolation of CTCs to very high levels of purity. That is, it enables robust and repeatable results with products that contain one or more "isolated" CTCs that are still surrounded by hundreds or thousands of contaminating WBCs, e.g., leukocytes, in the same product. Nevertheless, the strategy of targeting cDNA made from RNA as used in the new methods allows the new assay methods to be exquisitely tailored for maximum specificity with minimal levels of CTC purity compared to prior approaches.
[0075] The CTC-iChip technology is highly efficient at isolating non-hematopoietic cells by microfluidic depletion of antibody tagged leukocytes. This feature of the CTC-iChip provides intact tumor-derived RNA (at levels far above those obtained using other technologies), and it is independent of tumor cell surface epitopes (which are highly heterogeneous among cancers and among epithelial vs mesenchymal cell subtypes within an individual cancer). Furthermore, even pre-apoptotic cancer cells whose antibody staining and selection is suboptimal for imaging analysis can provide a source of tumor-specific RNA that can be scored using the methods described herein. For all these reasons, an isolation technology or system that provides high quality RNA from intact CTCs with at least some reduction in the WBCs found in the sample along with the rare CTCs, such as a microfluidic negative depletion system, e.g., the CTC-iChip, is an important first step isolation before the tumor-specific digital readout is applied to the product.
[0076] The droplet-based digital detection of extremely rare molecules within a heterogeneous mixture was originally developed for PCR amplification of individual DNA molecules that are below detection levels when present within a heterogeneous mixture, but which are readily identified when sequestered within a lipid droplet before being subjected to PCR. The basic technology for droplet-based digital PCR ("Droplet Digital PCR (ddPCR)") has been commercialized by RainDance and Bio-Rad, which provide equipment for lipid encapsulation of target molecules followed by PCR analysis. Important scientific advances that made this possible include work in the laboratory of David Weitz at Harvard and Bert Vogelstein at Johns Hopkins. For example, see U.S. Pat. Nos. 6,767,512; 7,074,367; 8,535, 889; 8,841,071; 9,074,242; and U.S. Published Application No. 2014/0303005. See also U.S. Pat. No. 9,068,181.
[0077] However, droplet digital PCR itself is not biologically significant unless coupled to a biological source of material, which is key to the new methods described herein. For instance, detection of lineage-specific RNAs (the central focus of the detection strategy described herein) does not distinguish between normal prostate epithelial cells and cancerous prostate cells. As such, detection of prostate-derived transcripts in the blood is not meaningful: they are present within debris from normal prostate cells or exosomes. It is only when coupled with the isolation of whole CTCs (i.e., intact CTCs in the blood) that the ddPCR assay achieves both extraordinary sensitivity and specificity. Hence, these two technologies are ideally suited for each other, because the isolation systems provide high quality RNA, and the droplet-based digital PCR assays are focused on RNA markers in the new methods.
[0078] One additional aspect is important to the overall success of the new assay methods. As noted, the new assay methods described herein use cDNA made from total RNA, but key to this use is the identification of appropriate biomarkers that are tumor lineage-specific for each type of cancer, yet are so unique as to be completely absent in normal blood cells (even with ddPCR sensitivity). The selection, testing, and validation of the multiple target RNA biomarkers for each type of cancer described herein enable the success of the new assay methods.
Assay Method Steps
[0079] The new assay methods start with the isolation of partially pure CTCs using an isolation system, such as a microfluidic negative depletion system, up to and including the analysis of data from a droplet digital PCR instrument. There are ten main assay steps, some of which are optional, though generally provide better results:
[0080] 1. isolating from the blood sample a product including CTCs and other cells present in blood; e.g. from a patient or a subject;
[0081] 2. reducing a volume of the rare cell-containing product (optional);
[0082] 3. isolating ribonucleic acid (RNA) molecules from the product, e.g., by cell lysis, and generating cDNA molecules in solution from the isolated RNA; e.g., by RT-PCR of RNA released from cells contained in the product;
[0083] 4. cleanup of cDNA synthesized during the RT-PCR step (optional);
[0084] 5. pre-amplifying the cDNA using gene-specific targeted preamplification probes, e.g., using the Fluidigm BioMark.TM. Nested PCR approach, or non-specific whole-transcriptome amplification, e.g., using the Clontech SMARTer.TM. approach (optional);
[0085] 6. encapsulating cDNA molecules in individual droplets, e.g., along with PCR reagents;
[0086] 7. amplifying cDNA molecules within each of the droplets in the presence of reporter groups configured to bind specifically to cDNA from CTCs and not to cDNA from other cells, e.g., using PCR;
[0087] 8. detecting droplets that contain the reporter groups (e.g., "positive" droplets) as an indicator of the presence of cDNA molecules from CTCs in the droplets;
[0088] 9. analyzing CTCs in the detected droplets, e.g., to determine the presence of a particular disease in a patient or subject; and
[0089] 10. detecting the expression of specific cancer-specific or lineage-specific genes in the cancer cells, e.g., CTCs, above the low background levels as determined by healthy donor controls (set at a level of 2.5), to determine whether a specific anti-cancer regimen is expected to be effective for that specific patient's specific tumor.
[0090] The background levels of these cancer-specific or lineage-specific genes are determined by measuring their expression in CTCs (or exosomes) in the blood of many patients without cancer (age-matched to those patients with cancer for a given type of cancer). The predictive value of these cancer-specific or lineage-specific gene markers are then evaluated by monitoring their expression prior to initiation of and during treatment with a specific cancer therapy in many patients over time, e.g., 6 to 12 months, 15 months, 18 months, 21 months, 24 months or more, and determining each patient's progression-free survival and overall survival statistics over each time period. These data are then used to prepare reference standards for each gene and each anti-cancer treatment regimen against which new patient samples can be compared to determine whether a proposed anti-cancer treatment regimen is likely to be effective in a specific patient, and if so, how effective compared to another potential treatment regimen.
[0091] For example, in patients with metastatic castration-resistant prostate cancer, the present inventors have discovered that those patients not having detectable expression of the genes HOXB13 and FOLH1 (PSMA), in their CTCs, as measured by the digital CTC quantitation assay, e.g., a level lower than 2.5 transcripts per mL of blood, will have a better overall survival and progression-free survival when treated with anti-androgen therapy than patients who have a high expression level of these two genes in their CTCs, e.g., a level higher than 2.5 transcripts per mL of blood. The expression of these prostate lineage markers is also detectable in exosomes and other tumor-derived RNA in the blood of patients with prostate cancer.
[0092] As described in further detail below, one of the important features of the new d-CTC assay methods is the careful selection of a number of target gene biomarkers (and corresponding primers) that deliver excellent sensitivity, while simultaneously maintaining nearly perfect specificity. A unique list of target gene biomarkers described herein (Table 3, below) was determined using bioinformatics analyses of publicly available datasets and proprietary RNA-Seq CTC data. Great care was taken to select markers that are not expressed in any subpopulations of leukocytes, but are expressed at a high enough frequency and intensity in CTCs to provide a reliable signal in a reasonably wide array of different and distinct patients. A specific set of markers was selected for each cancer type (e.g., prostate cancer, breast cancer, melanoma, lung cancer, pancreatic cancer, among others) and it is specific ones or sets of these markers that are predictive of the potential efficacy of various anti-cancer therapies.
[0093] The digital measurement of CTC-derived mRNAs provides not only a level of overall tumor burden for these specific cancers, which is an indicator of cancer activity and response or non-response to particular therapies, but it also provides specific information related to the genes being tested. For example, HOXB13 and FOLH1 in prostate cancers are markers of abnormal androgen signaling, a key characteristic of prostate cancers that are resistant to anti-androgenic therapies. Similarly, in breast cancer, response to hormonal therapies is dependent on the activity of the estrogen receptor pathway, which can be measured within CTCs or exosomes using RNA transcripts. In patients undergoing immunotherapy for cancer, such as melanoma, the presence of differentiation markers within CTCs or related blood vesicles can also indicate the expression of unique sets of genes that activate the immune system, and hence predict response or non-response to immunological treatments.
[0094] The separate steps of the assay methods will now be described in more detail.
[0095] 1. CTC Isolation
[0096] Patient blood is run through the CTC-iChip, e.g., version 1.3M or 1.4.5T and a sample is collected in a 15 mL conical tube on ice. CTC-iChips were designed and fabricated as previously described (Ozkumur et al., "Inertial Focusing for Tumor Antigen-Dependent and -Independent Sorting of Rare Circulating Tumor Cells," Science Translational Medicine, 5(179):179ra47 (DOI: 10.1126/scitranslmed.3005616) (2013)).
[0097] The blood samples (.about.20 mls per cancer patient) are collected in EDTA tubes using approved protocols. These samples are then incubated with biotinylated antibodies against CD45 (R&D Systems) and CD66b (AbD Serotec, biotinylated in house) and followed by incubation with Dynabeads.RTM. MyOne.RTM. Streptavidin T1 (Invitrogen) to achieve magnetic labeling of white blood cells (Ozkumur et al., 2013).
[0098] The sample is then processed through the CTC-iChip, which separates the blood components (red and white blood cells and platelets) as well as unconjugated beads away from the CTCs. The CTCs are collected in solution while the red blood cells, platelets, unconjugated beads and the tagged white blood cells are collected in a waste chamber. The process is automated and 10 ml of blood is processed in 1 hour.
[0099] 2. Volume Reduction and Storage of the Rare Cell-Containing Product
[0100] To fully lyse all cells isolated in the product, it is preferable to reduce the product volume from a typical starting point of several milliliters to a final volume of about 100 .mu.l. This can be achieved, for example, by centrifuging the product, and resuspending in pluronic buffer in preparation for cell lysis and generation of cDNA. At this point samples can be processed for long-term storage by adding RNAlater.TM. (ThermoFisher), followed by flash-freezing in liquid nitrogen and storage at -80 C.
[0101] 3. Isolating RNA and Generation of cDNA from Cells in the Product
[0102] The RNA isolation step is important to the process to fully release all RNA molecules from cells in preparation for RT-PCR. A one-step, in-tube reaction can be used to minimize the risk of cell and RNA loss likely to be incurred during standard transfer steps. For example, one can use the Invitrogen SuperScript III.RTM. First-Strand Synthesis Supermix.RTM. for qRT-PCR kit, by adding the RT-PCR mastermix directly to the pelleted product, pipetting to lyse fully, and performing the reaction according to the kit protocol targeting a 1:1 RNA:cDNA ratio. Once cDNA has been synthesized, RNase H is applied to the reaction to remove any remaining RNA. Alternatively, if one wants to perform whole transcriptome pre-amplification of the sample in a later step, cDNA can be synthesized using the SMARTer.TM. Ultra Low Input RNA Kit protocol, which uses proprietary oligonucleotides and reverse transcriptase enzyme.
[0103] 4. Cleanup of cDNA Synthesized During RT-PCR
[0104] Another useful, yet optional, step in the process involves the removal of lysis reagents from the cDNA-containing solution. The presence of harsh detergents can lead to the destabilization of the droplets used in the ddPCR method, once the cDNA-containing solution is transferred to the ddPCR instrument. Detergent removal can be accomplished, e.g., through the use of Solid Phase Reversible Immobilization (SPRI). This technique uses coated magnetic beads to first bind cDNA of a specific size range, then allows removal of detergent-containing supernatant, and finally elution of pure cDNA for input into the ddPCR instrument. In addition to the cleanup of the RT-PCR, the SPRI process also accomplishes a size selection of cDNA, which reduces the number of non-target cDNA molecules that enter the ddPCR phase of the process, which in turn reduces background and noise.
[0105] 5. Pre-Amplification
[0106] Pre-amplification of the cDNA is an optional step that increases the number of template molecules that can be detected in the droplet PCR step thus improving signal-to-noise ratio and boosting the confidence in a positive read-out. It can be a very powerful approach for the detection of markers that are expressed at low levels in CTCs, and for analyzing samples that contain very small numbers of possibly apoptotic CTCs, such as in the context of early detection of pre-metastatic disease. These two approaches have been modified to be applied in the workflow of d-CTC assay. Specific Targeted Amplification (STA), based on the Fluidigm BioMark.TM. Nested PCR protocol, relies on the use of primers specifically designed to amplify the region targeted by the probes used in the droplet PCR step (see Table 2). These primers were carefully designed and tested in conjuncture with their respective fluorescent probes to ensure efficient and specific amplification without increase in noise in healthy controls. Alternatively, whole transcriptome amplification, based on the SMARTer.TM. Ultra Low Input RNA Kit protocol, relies on the amplification of every transcript in the product, including both those found in WBCs and those found in CTCs, using random primers.
[0107] 6. Encapsulation of cDNA Plus PCR Reagents in Droplets
[0108] Once cDNA has been synthesized and purified of contaminating detergents, the entire aggregate of cDNA molecules in solution plus qPCR reagents is divided into many tiny compartmentalized reactions, for example, by a droplet making to instrument, e.g., a droplet generator such as the Biorad Automated Droplet Generator, which generates 20,000 droplets per sample. Each reaction consists of an extremely small droplet of non-aqueous fluid, e.g., oil (PCR stable, e.g., proprietary formulation from vendor), which contains Taqman-type PCR reagents with gene-specific primers and an oligonucleotide probe, and a small amount of sample. Once droplet generation is complete, the sample consists of an emulsion containing a vast number of individual PCR-ready reactions.
[0109] For this step, one can use the PCR probes and related primers for any one or two or more different target genes listed in Table 1 below for overall determination of tumor load, e.g., to determine tumor progression or response to therapy, in single or multiplex reactions. Thus, although in some cases a single set of PCR primers and probes for a particular gene from Table 1 can be included in each droplet, it is also possible to multiplex PCR primers and probes for two or more different genes in each droplet using different fluorescent probes for each primer/probe set, to maximize the detection of tumor cells, given the heterogeneity of gene expression in CTCs. It is also possible to multiplex PCR primers and probes for multiple genes targeting different cancer types in each droplet, thus enabling the broad yet specific detection of multiple tumor types in a single assay.
[0110] 7. PCR of Droplet Encapsulated cDNA Molecules
[0111] Standard PCR cycling is performed on the entire emulsion sample using qPCR cycling conditions. The reaction is carried to 45 cycles to ensure that the vast majority of individual droplet-PCR volumes are brought to endpoint. This is important because, although the reaction is performed with Taqman-type qPCR reagents and cycled under qPCR conditions, the fluorescent intensity of the sample will not be measured during the PCR cycling, but rather in the next step.
[0112] 8. Detection of Positive Droplets
[0113] Since each individual partitioned PCR is brought fully to endpoint before any measurement of fluorescence is performed, each individual droplet will be either a fully fluorescent droplet or will contain virtually no fluorescence at all. This enables the simple enumeration of all positive (fluorescent) and negative (non-fluorescent) droplets.
[0114] 9. Analysis
[0115] Because the upstream RT-PCR targeted a 1:1 RNA:cDNA ratio, each positive droplet should represent a single originating RNA transcript. This interpretation depends on the number of individual droplets far exceeding the number of target cDNA molecules. In the new process, at one extreme we consider the possibility of a single CTC being isolated and lysed, releasing some number of RNA transcripts that are then reverse-transcribed 1:1 into cDNA, partitioned, PCR-amplified, and enumerated.
[0116] We estimate that in the case of a moderately expressed gene, such as the KLK3 gene in prostate cancer cells, each cell contains approximately 80-120 copies of KLK3 mRNA. The Biorad QX200 ddPCR System generates 20,000 droplets, which ensures that for small numbers of isolated CTCs and moderately-expressed target genes there will never be more than one target cDNA molecule per droplet. On the other hand, in cases where the numbers of CTCs reach dozens or hundreds, for moderately-expressing genes there will likely be multiple copies of target cDNA per droplet. In such cases, approximate numbers of originating transcript can be estimated using Poisson statistics.
[0117] 10. Detecting and Determining Anti-Cancer Regimen Efficacy
[0118] The last step includes detecting the expression of particular cancer-specific or lineage-specific genes in the cancer cells, e.g., CTCs, above the low background levels as determined by healthy donor controls (e.g., set at a level of 2.5 transcripts per mL blood), to determine whether a specific anti-cancer regimen is expected to be effective for that patient's specific tumor.
[0119] The background levels of these cancer-specific or lineage-specific genes are determined by measuring their expression in CTCs (or exosomes) in the blood of many patients without cancer (age-matched to those patients with cancer for a given type of cancer). The predictive value of these cancer-specific or lineage-specific gene markers are then evaluated by monitoring their expression prior to initiation of and during treatment with a specific cancer therapy in many patients over time, e.g., 6 to 12 months, 15 months, 18 months, 21 months, 24 months or more, and determining each patient's progression-free survival and overall survival statistics over each time period. These data are then used to prepare reference standards for each gene and each anti-cancer treatment regimen against which new patient samples can be compared to determine whether a proposed anti-cancer treatment regimen is likely to be effective in a specific patient, and if so, how effective compared to another potential treatment regimen.
[0120] For example, in patients with metastatic castration-resistant prostate cancer ("CRPC"), those patients not highly expressing the genes HOXB13 and FOLH1 (PSMA), e.g., a level lower than 2.5 transcripts per mL blood, will have a better overall survival and progression-free survival when treated with anti-androgen therapy than patients who have a high expression level of these two genes, e.g., a level higher than 2.5 transcripts per mL blood.
[0121] In particular, by combining microfluidic enrichment of viable CTCs with digital quantitation of CTC-derived RNA, the new methods described herein provide a highly sensitive and specific assay for serial non-invasive sampling of prostate cancer. This approach overcomes a major limitation of CTC analyses to date, namely the microscopy-based quantitation of multiple immunofluorescence-conjugated antibody stains within mixed cell populations, with its associated requirement for calibration and thresholding of multiple fluorescence parameters, followed by manual verification of individual images. The extraordinary high sensitivity and specificity of sequence-based approaches, which are readily multiplexed to interrogate multiple markers simultaneously, provide greatly improved signal over traditional cell imaging methods. In a pilot cohort of men on first line therapy for early recurrence of prostate cancer, we demonstrated the potential utility of quantitative CTC measurements of both normal prostatic transcripts and aberrant RNA products in informing therapeutic choices.
[0122] Conceptually, the application of a digital RNA-based PCR output to microfluidic CTC-enriched cell populations presents a number of important advantages. The use of purified whole CTCs in the bloodstream as the source of RNA ensures that the measured signal is derived from invasive cancer cells, as opposed to normal tissues, and hence it enables the use of RNA-based markers that are not unique to cancer. Recurrent cancer-specific markers are rare in prostate cancer, which has limited the application of mutation-based plasma DNA sequencing. In addition to lineage-based RNA markers, the role of aberrant androgen receptor ("AR") splice forms in acquired resistance to hormonal therapy necessitates blood-based RNA measurement. In this context, the microfluidic depletion of normal hematopoietic cells from blood specimens is particularly effective in preserving RNA integrity within CTCs, which are not subject to antibody-manipulation or fixation and thus provide excellent signal for digital PCR quantitation. Along with microfluidic CTC isolation, digital scoring of CTC signal for both prostate lineage transcripts and prostate cancer-specific transcripts can be readily automated for high-throughput analyses, making it a realistic tool for clinical applications.
[0123] The recent development of multiple potent treatment modalities for metastatic prostate cancer brings with it the need to identify predictive makers of response. To date, the most significant markers have focused on the demonstration of continued activity of the androgen receptor, which is targeted by many therapeutic modalities. Molecular imaging-based strategies to measure androgen signaling have been demonstrated in some cases, but the availability of blood-based sampling would greatly enhance the utility of such monitoring. We have previously reported that scoring of CTCs for expression of the androgen-driven protein PSA versus the androgen-repressed protein PSMA can be translated into an androgen receptor-induced gene ("AR-on") versus an androgen-repressed gene ("AR-off") CTC immunofluorescence-based signature.
[0124] In treatment-naive patients, virtually all CTCs have AR-on signal, which converts to AR-off following initiation of Androgen Deprivation Therapy ("ADT"). Patients with CRPC, however, most frequently show simultaneous expression of AR-on and AR-off protein signatures, consistent with aberrant AR signaling. In this context, the predictive value of CTC-derived expression of the non-AR target genes HOXB13 and FOLH1 (PSMA) is consistent with altered AR signaling. Germline mutations in HOXB13 have been correlated with increased susceptibility to prostate cancer, and the gene encodes a transcriptional coactivator of AR, which is a known marker of less differentiated prostate cancer, which has also been linked to hormonal therapy resistance in ER-positive breast cancer. FOLH1 is a well-established marker for prostate lineage, normally suppressed by androgen signaling, but co-expressed with PSA in CRPC. Thus, overexpression of these markers within prostate CTCs identify cancers in which altered AR signaling pathways have significant roles in malignant proliferation, lessening the effectiveness of the androgen synthesis inhibitor abiraterone.
[0125] AR-V7 has recently emerged as a readily measurable surrogate for acquired androgen pathway independence, predicting resistance to third or fourth line abiraterone or enzalutamide therapy. Discordant results as to the predictive value of AR-V7 measurements most likely result from different CTC or exosome-based detection assays, as well as their application in patients at different stages of treatment and disease progression. For example, in a large retrospective clinical trial, AR-V7 was detectable in CTCs from only 3% of patients prior to fourth line therapy.
[0126] The application of a high sensitivity digital CTC assay and the serial sampling of patients before and during therapy provide a novel perspective on the significance of AR-V7 positivity. First, we note that detection of this splice variant in untreated patients at the time of first disease recurrence does not by itself indicate resistance to abiraterone; however, the persistence or emergence of AR-V7 in the setting of drug treatment is highly predictive of adverse outcome. In this context, it is likely that drug sensitive tumor cells are suppressed and AR-V7 directly measures the emergence of drug resistant tumor populations.
[0127] Second, the observation that downstream indicators of altered AR signaling (HOXB13 and FOLH1) are more commonly elevated than AR-V7 and are more predictive of adverse outcome when measured in pretreatment CTC specimens suggests that AR-V7 is one of a number of mechanisms that limit the efficacy of AR targeted therapies. The recent application of combined paclitaxel and leuprolide therapy in the initial treatment of high-risk prostate cancer shows the utility of risk stratification as described herein to enable individualized therapies in advanced disease.
[0128] The same techniques can be used to determine the expected efficacy of different therapies used for other types of cancers including melanoma and breast cancer. For example, as shown in Table 1 for melanoma, the following examples of treatments, treatment categories, and drugs can be tested for expected efficacy in specific patients using the assays and methods described herein. Similarly, Table 2 shows drugs and combinations of drugs used to treat breast cancer, which can be tested for efficacy in specific patients using the assays and methods described herein.
TABLE-US-00001 TABLE 1 Melanoma Treatments Treatment category Drugs BRAFV600E inhibitors Targeted therapy Vemurafenib, Dabrafenib, Encorafenib MEK inhibitors Targeted therapy Cobimetinib, Trametinib, Binimetinib Anti-CTLA4 antibody Immunotherapy Ipilimumab Anti-PD1 antibody Immunothreapy Pembrolizumab, Nivolumab CDK4/CDK6 inhibitor Targeted therapy Palbociclib
TABLE-US-00002 TABLE 2 Mono-therapies: Combination therapies: Endocrine therapies (including Endocrine therapies + CDK 4/6 ESR1 inhibitors, Aromatese inhibitors Inhibitors, SERDS) Chemotherapy Endocrine therapies + PI3K inhibitors HER2 Inhibitors Endocrine therapies + mTOR inhibitors PI3K Inhibitors Chemotherapy + PARP inhibitors Immunotherapy Chemotherapy + HER2 inhibitors
Novel Gene Panels to Enable Lineage-Specific Identification of CTCs
[0129] As discussed above, the identification of gene transcripts that are highly specific for cancer cells within the context of surrounding normal blood cells is central to the new methods. While many genes are known to be more highly expressed in cancer cells, the vast majority of these genes also typically have at least limited expression in normal tissues, including blood. Given the extraordinary sensitivity required for this assay, complete absence of signal in normal blood cells is essential for high confidence identification of tumor cells in the bloodstream.
[0130] Candidate tumor-specific transcripts used to detect CTCs in blood are first selected by analyzing publicly available gene expression data sets derived from breast, prostate, lung, pancreas, and liver cancers and melanoma, as well as our lab-generated single cell RNA-Seq data from CTCs isolated from breast, prostate and pancreatic cancer patients and mouse models of these cancers. Transcripts whose expression is restricted to tumors and absent or undetectable in blood components are chosen for further downstream analysis. Demonstrating and validating total absence of expression (with the highest level of sensitivity, i.e., Digital PCR assays) in normal blood cells is important. In general, only .about.10% of candidate genes predicted based on computational models or RNA Seq data are truly negative in human blood samples.
[0131] In particular, candidate tumor-specific mRNA transcripts for the detection of CTCs were initially identified through the analysis of gene expression data sets (microarray and RNA-Seq) derived previously for human breast, prostate, lung, pancreas, hepatocellular, and melanoma cancers. Specific publically available data sets used for this analysis include The Cancer Genome Atlas (TCGA) (The Cancer Genome Atlas, available online at tcga-data.nci.nih.gov/tcga/tcgaHome2.jsp) and the Cancer Cell Line Encyclopedia (CCLE) (available online at broadinstitute.org/ccle/home; see also, Barretina et al., The Cancer Cell Line Encyclopedia enables predictive modelling of anticancer drug sensitivity, Nature 483:603-607 (2012)). In addition, single-cell RNA-seq gene expression data from CTCs isolated from human patients with breast, prostate, and pancreatic cancers were analyzed (GEO accession numbers GSE51827, GSE60407, and GSE67980) (Aceto et al., Circulating tumor cell clusters are oligoclonal precursors of breast cancer metastasis, Cell, 158:1110-1122 (2014); Ting et al., Single-Cell RNA Sequencing Identifies Extracellular Matrix Gene Expression by Pancreatic Circulating Tumor Cells, Cell Rep, 8:1905-1918 (2014); and Miyamoto et al., RNA-Seq of single prostate CTCs implicates noncanonical Wnt signaling in antiandrogen resistance, Science 349:1351-1356 (2015). Tumor specific transcripts identified through these databases were then compared to human leukocyte RNA-Seq gene expression data (GEO accession numbers GSE30811, GSE24759, GSE51808, GSE48060, GSE54514, and GSE67980). Transcripts that displayed significant differential expression, with high expression in tumors and low or undetectable expression in leukocytes, were then selected for further downstream analysis. Moreover, a literature search was performed to select additional candidate tumor-specific transcripts. Between 50 and 100 candidate genes were selected for each type of human cancer.
[0132] For each candidate gene within each specific cancer type, two to four sets of PCR primers were designed to span regions across the target transcript. Primers are synthesized by IDT (Integrated DNA Technologies), probes are labeled with FAM or HEX, ZEN, and IABkFQ to create a probe targeting the middle of the amplicon. Unique features of our PCR primer design methodology necessary for the successful application of digital PCR-based mRNA transcript detection in human CTCs include the following: 1) the specific targeting of the 3' end of each mRNA transcript, given the proclivity of cellular mRNA transcripts to degrade from the 5'-end, particularly in unfixed, fragile cells such as CTCs; 2) the design of primers to generate amplicons that span introns in order to exclude the unintentional amplification of contaminating genomic DNA, for example from excess contaminating leukocytes in the enriched CTC mixture; and 3) the design of primers to inclusively amplify multiple splice variants of a given gene, given the uncertainty in some cases regarding the clinical relevance of specific splice variants.
[0133] The specificity of the primers was first tested by qRT-PCR using cDNA derived from cancer cell lines (representing breast, prostate, lung, pancreas, and liver cancers and melanoma). For each type of human cancer, 2 to 5 established cancer cell lines were cultured and used for initial testing to evaluate PCR primer performance and assess for expression of the target transcript in the specified cancer. To provide an initial test of specificity, the same primers were used to evaluate expression of the target transcript in leukocytes from healthy individuals who do not have a diagnosis of cancer. Leukocytes from a minimum of five different healthy individuals were tested in this phase of testing (mixture of male and female individuals--this was dependent on the type of cancer; i.e. candidate prostate cancer and breast cancer genes required the use of male or female healthy donors only, respectively).
[0134] Leukocytes from healthy individuals were isolated from whole blood using Cell Preparation Tubes with Sodium Heparin (CPT) (Becton, Dickinson, and Co., NJ) following product insert instructions. RNA extraction and first-strand cDNA synthesis was performed for cancer cell lines and isolated leukocytes using standard methods. The specificity of expression of each gene (using 2 to 4 distinct sets of primers for each gene) was tested using qRT-PCR (cell line cDNA as positive controls, leukocyte cDNA from healthy donors as negative controls, and water as an additional negative control). Transcripts present in cancer cell lines, but absent in leukocytes based on qRT-PCR testing were then selected for further validation by droplet digital PCR. The selection criteria to pass this stage of testing were highly stringent, and required qRT-PCR signal to be present in at least one cancer cell line and absent in all healthy donor leukocyte samples tested.
[0135] Target transcripts and specific primer pairs that passed the qRT-PCR stage of testing were further validated using droplet digital PCR. For this stage of testing, the CTC-iChip (see, e.g., Ozkumur et al., "Inertial focusing for tumor antigen-dependent and -independent sorting of rare circulating tumor cells," Sci Transl Med, 5, 179ra147 (2013) was used to process whole blood samples donated by healthy individuals. The CTC-iChip performs negative depletion of red blood cells, platelets, and leukocytes from whole blood, and generates a sample product that is enriched for cells in the blood that do not express leukocyte markers, including CTCs (which should not be present in healthy individuals). For each blood sample, the product from the CTC-iChip was supplemented with an RNA stabilization solution (RNAlater.RTM., Life Technologies) and processed for RNA extraction and cDNA synthesis using standard methods. Droplet digital PCR (Biorad, CA) was then used to quantitate the number of transcripts present in each sample based on the specific primer pairs being tested. Samples assessed by droplet digital PCR during this phase of testing included cDNA from cancer cell lines, leukocyte cDNA from healthy donors processed through the CTC-iChip (at least four healthy individuals per primer pair being tested), and water as a negative control.
[0136] Criteria for passing droplet digital PCR testing were stringent, and included: 1) the presence of transcript signal in cancer cell lines (at least one cell line with >10 positive droplets); 2) excellent signal-to-noise ratio represented by separation of signal between positive and negative (empty) droplets; 3) minimal or absent droplet signal in healthy donors (<3 droplets per healthy donor); and 4) absent droplet signal in water (0 positive droplets).
[0137] Primers that amplified transcripts specifically in cell lines and not in leukocytes in the above droplet digital PCR testing were then subjected to detailed testing of sensitivity of signal. Using single cell micromanipulation, precise numbers of cancer cells (1, 5, 10, 25, and 50 cells) were spiked into whole blood donated by healthy individuals, and then processed through the CTC-iChip. Each sample was then processed as above for testing with droplet digital PCR, and evaluated for sensitivity to ensure the signal was sufficient for the desired clinical application.
[0138] The above stringent procedure of evaluating candidate genes and primers using qRT-PCR and droplet digital PCR resulted in a final primer list consisting of approximately 10% of the initial list of 50-100 candidate genes for each type of cancer (total of approximately 400 initial candidate genes). These primers are then further evaluated for signal in patient CTCs using blood samples donated by cancer patients undergoing cancer treatment at the MGH Cancer Center, collected under an IRB-approved clinical protocol. Key to this portion of the evaluation is a comparison with blood collected from healthy individuals without a diagnosis of cancer. The following Table 3 lists the primers and probes for that have been developed thus far using these methods for the specific detection of CTCs from patients with prostate, breast, hepatocellular, pancreatic, lung, and melanoma cancers using droplet digital PCR.
[0139] While a single gene for each cancer type could be used, the presence of multiple genes within each panel is useful both for sensitivity (CTCs are heterogeneous even within individual patients in their expression patterns) and specificity (detection of multiple gene signals confers added confidence that this represents a true cancer cell signature).
[0140] The gene list provided below in Table 3 includes transcripts that are unique to specific types of cancer (e.g., highly specific markers of prostate or breast or liver cancers), as well as genes that are shared by several cancer types, e.g., all epithelial cancer types (and thus may serve as pan-cancer markers), and genes that are induced in certain conditions (e.g., active androgen signaling in prostate cancer or active estrogen signaling in breast cancer). Thus, each type of cancer was assigned a specific panel of genes that is designed for optimal sensitivity, specificity, and clinically actionable information for the given cancer type.
[0141] In addition, primers described in Table 4 are designed to pre-amplify some of the genes listed in Table 3, while maintaining their high specificity. If STA is a method of choice, these nested primers become additional components of each cancer panel.
[0142] Gene Lists for Different Types of Cancers
[0143] The following Table 3 provides a list of names of genes (with (Genbank ID) and Sequence Identification numbers (SEQ ID NO)), along with cancer types for which they are selective (Br: breast, Lu: lung, Li: liver, Pr: prostate, Panc: pancreatic, Mel: melanoma). In addition, optimized primer sets are listed for each gene (primers 1 and 2), along with the composition of the fluorescent primer probes (e.g., 6-FAM.TM. (blue fluorescent label) or HEX.TM. (green fluorescent label) for tagged probes, and ZEN-31ABkFQ quencher) for optimal visualization of the digital PCR product.
TABLE-US-00003 TABLE 3 Disease Seq Seq Seq Gene Group ID Primer 2 ID Primer 1 ID Probe AGR2 Br, Lu, 1 CTG ACA GTT AGA 2 CAA TTC AGT CTT 3 /56-FAM/ATG CTT ACG/ZEN/ (10551) Li, Pr GCc GAT ATC AC CAG CAA CTT GAG AAC CTG CAG ATA CAG CTC/ 3IABkFQ/ ALDH1A3 Br, Lu, 4 GGT GGC TTT AAA 5 TGT CGC CAA GTT 6 /56-FAM/TTT TCA CTT/ZEN/ (220) Panc ATG TCA GGA A TGA TGG T CTG TGT ATT CGG CCA AAG C/3IABkFQ/ CADPS2 Br, Li, 7 CTC TGC ATT TTT 8 GCC TTG CAC TTC 9 /56-FAM/TCC GAC GTG/ZEN/ Lu, Mel GGA CAT AGG AG CAT TAT GAC GTA CTG TCA TTC ACC T/ 3IABkFQ/ Br, Lu, 10 GAG GCC TAC ATT 11 GTG GTT CTT TCT 12 /56-FAM/CAT CCT CGC/ZEN/ (1009) Panc CTG AAC GC TTT GCC TTC TC CTG CAT CGT CAT TCT/ 3IABkFQ/ CDH3 Br, Li, 13 GTT TCA TCC TCC 14 GCT CCT TGA TCT 15 /56-FAM/CTG CTG GTG/ZEN/ (1001) Mel CTG TGC TG TCC GCT TC CTG CTT TTG TTG GT/ 3IABkFQ/ COL8A1 Br, Lu 16 GAT GCC CCA CTT 17 CCT CGT AAA CTG 18 /56-FAM/AGT ATC CAC/ZEN/ (1295) GCA GTA GCT AAT GGT ACC TAC CCC AAT ATA TGA AGG AAA/3IABkFQ/ EGFR Br, Lu, 19 CTG CTG CCA CAA 20 TTC ACA TCC ATC 21 /56-FAM/CTG CCT GGT/ZEN/ (1956) Li, Panc CCA GT TGG TAC GTG CTG CCG CAA ATT C/ 3IABkFQ/ FAT1 Br, Lu, 22 GAT CCT TAT GCC 23 ATC AGC AGA GTC 24 /56-FAM/TCT TGT CAG/ZEN/ (2195) Li, Mel, ATC ACC GT AAT CAG TGA G CAG CGT TCC CGG/ Pr, Panc 3IABkFQ/ FAT2 Br, Lu 25 CCT GGA TGC TGA 26 TCC TCC ACT CAT 27 /56-FAM/ACC TGC TAC/ZEN/ (2196) CAT TTC TGA CTC CAA CT ATC ACA GAG GGA CAC C/ 3IABkFQ/ FOLH1 Pr 28 CAA TGT GAT AGG 29 TGT TCC AAA GCT 30 /56-FAM/ATG AAC AAC/ZEN/ (2346) TAC TCT CAG AGG CCT CAC AA AGC TGC TCC ACT CTG A/ 3IABkFQ/ Br, Lu, 31 CAG CCA GAT GTG 32 CTG TAC GGA ATG 33 /56-FAM/CAG CAT TTG/ZEN/ (261729) Pr TTG CCA CGT TTC TTG CAG ACT CCA GCG G/ 3IABkGQ/ KLK2 Pr 34 GCT GTG TAC AGT 35 GTC TTC AGG CTC 36 /56-FAM/TGG CTA TTC/ZEN/ (3817) CAT GGA TGG AAA CAG GT TTC TTT AGG CAA TGG GCA/ 3IABkFQ/ KLK3 Pr 37 GTG TGC TGG ACG 38 GTG ATA CCT TGA 39 /56-FAM/AAA GCA CCT/ZEN/ CTG GA AGC ACA CCA TTA GCT CGG GTG ATT CT/ C 3IABkFQ/ LSAMP Mel 40 CAC ATT TGA GTG 41 GCG GAT GTC AAA 42 /56-FAM/TCC AAG AGC/ZEN/ (4045) AAG CTT GTC G CAA GTC AAG AAT GAA GCC ACC ACA/ 3IABkFQ/ MAGEA6- Mel 43 GAA GGA GAA GAT 44 GCT GAC TCC TCT 45 /56-FAM/TTG CCC TGA/ZEN/ CTG CCA GTG GCT CAA G CCA GAG TCA TCA TGC/ (4105) 3IABkFQ/ MET Br, Li, 46 CCA GTA GCC TGA 47 TGT CAG TGA TTC 48 /56-FAM/AGT CAT AGG/ZEN/ (4233) Lu, Panc TTG TGC AT TGT TCA AGG A AAG AGG GCA TTT TGG T/ 3IABkFQ/ MLANA Mel 49 ACT CTT ACA CCA 50 CCA TCA AGG CTC 51 /56-FAM/AAG ACT CCC/ZEN/ (2315) CGG CTG A TGT ATC CAT AGG ATC ACT GTC AGG A/ 3IABkFQ/ NYP1R Br, Lu 52 GGA TCT GAG CAG 53 GAA TTC TTC ATT 54 /56-FAM/AGC AGG AGC/ZEN/ (4886) GAG AAA TAC C CCC TTG AAC TGA GAA AAA GAC AAA TTC CAA AG/3IABkFQ/ Br, Lu, 55 AAG ATG GAC AGG 56 ACT CTT TCC ACA 57 /56-FAM/TGC AGA CAC/ZEN/ (100506658) Li TAT GAC AAG TC TAG TCA GAT GG ATT TTT AAC CCA CTC CTC G/3IABkFQ/ Mel 58 TGT CCT GGC TGT 59 TGG ATC CCT ATC 60 /56-FAM/AGC TCC TCC/ZEN/ (23024) TCA TTC TG TCT TGC CA CTG TCC ATC TCC T/ 3IABkFQ/ PGR Br 61 GGC AAT TGG TTT 62 GGA CTG GAT AAA 63 /56-FAM/ACA AGA TCA/ZEN/ (5241) GAG GCA A TGT ATT CAA GCA TGC AAG TTA TCA AGA AGT TTT GTA AGT T/3IABkFQ/ Br, Li, 64 CTG GTG GAG GAG 65 GGT CGC TGG ATG 66 /56-FAM/AGT GTC CGC/ZEN/ (11187) Lu, Panc AAC GG AAA GGT T AGC AGC TCG AA/3IABkFQ/ PMEL Mel 67 CAG GCA TCG TCA 68 ACA CAA TGG ATC 69 /56-FAM/TTT GGC TGT/ZEN/ (6490) GTT TCC T TGG TGC TAA GAT AGG TGC TTT GCT G/ 3IABkFQ/ PPL Br, Lu, 70 GAG GAG AGA ATC 71 AGG TTC AGG TAC 72 /56-FAM/AGG AAC TCC/ZEN/ (5493) Li AAC AAA CTG C TCC TTC CAG ATT GAG GCG CAC AT/ 3IABkFQ/ RXRG Mel 73 ATA CTT CTG CTT 74 AGC CAT TGT ACT 75 /56-FAM/CTC TGA GGT/ZEN/ (6258) GGT GTA GGC CTT TAA CCC A GGA GAC TCT GCG AGA/ 3IABkFQ/ RND3 Br, Lu, 76 CCG AGA ATT ACG 77 GCG GAC ATT GTC 78 /56-FAM/ACG GCC AGT/ZEN/ (390) Li, Mel, TTC CTA CAG TG ATA GTA AGG A TTT GAA ATC GAC ACA C/ pANC 3IABkFQ/ S100A2 Br, Lu, 79 CTG CCT TGC TCT 80 CTT ACT CAG CTT 81 /56-FAM/ACC TGG TCT/ZEN/ (6273) Li, Panc CCT TCC GAA CTT GTC G GCC ACA GAT CCA TG/ 3IABkFQ/ Br 82 ACT TCC TTG ATC 83 GTC TTT TCA ACC 84 /56-FAM/CCA TGA AGC/ZEN/ (4246) CCT GCC A ATG TCC TCC A TGC TGA TGG TCC TCA/ 3IABkFQ/ SFRP1 Mel 85 CAA TGC CAC CGA 86 CTT TTA TTT TC 87 /56-FAM/TGT GAC AAC/ZEN/ (6422) AGC CT TCC TCA GTG CAA GAG TTG AAA TCT GAG GCC/ AC 3IABkFQ/ SOX10 Mel 88 CTT GTC ACT TTC 89 CTT CAAT GGT GTG 90 /56-FAM/TTG TGC AGG/ZEN/ (663) GTT CAG CAG GGC TCA TGC GGG TAC TGG/ 3IABkFQ/ /SET4 Pr 91 TCC TTG GAT GAC 92 AGA TAC CAC CTC 93 /56-FAM/CCA ATG ATG/ZEN/ (101669767) TCT CCC TAC CCT GAA GAA AGG AGC GGG ATG GAG/ 3IABkFQ/ SCHLAP1 Pr 94 AGA GGT TTA ATG 95 CTC TGG TCT GTC 96 /56-FAM/ACA TGC CTT/ZEN/ SET 5 GGC TCA CAG GTC ATG TAA G TCA CCT TCT CCA CCA/ 3IABkFQ/ AMACR Pr 97 CAC ACC ACC ATA 97 TCA CTT GAG GCC 99 /56-FAM/AGA AAC GGA/ZEN/ (23600) CCT GGA TAA T AAG AGT TC GGT CCA GCC AAG TTC/ 3IABkFQ/ AR Pr 100 CTT TCT TCA GGG 101 CTT GTC GTC TTC 102 /56-FAM/AAG CAG GGA/ZEN/ Variant 7/ TCT GGT CAT T GGA AAT GTT ATG TGA CTC TGG GAG AAA/ SET 1 (367) 3IABkFQ/ AR Pr 103 GAG GCA AGT CAG 104 TGT CCA TCT TGT 105 /56-FAM/TGA AGC AGG/ZEN/ Variant 7 CCT TTC T CGT CTT CG GAT GAC TCT GGG AGA/ SET 3 3IABkFQ/ AR Pr 106 GCT CAC CAT GTG 107 TGG GAG AGA GAC 108 /56-FAM/TGA TTG CGA/ZEN/ Variant 12 TGA CTT GA AGC TGG TA GAG AGC TGC ATC AGT/ SET 1 3IABkFQ/ AR Pr 109 GAA AGT CCA CGC 110 GCA GCC TTG CTC 111 /56-FAM/TGA TTG CGA/ZEN/ Variant 12 TCA CCA T TCT AGC GAG AGC TGC ATC AGT/ SET 4 3IABkFQ/ UGT2B15 Pr 112 CTC TGC ACA AAC 113 TTT CCT CGC CCA 114 /56-FAM/TTG GCT GGT/ZEN/ SET 1 TCT TCC ATT TC TTC TTA CC TTA CAG TGA AGT CCT CC/ (7366) 3IABkFQ/ UGT2B15 Pr 115 GGA AGG AGG 116 GTG AGC TAC TGG 117 /56-FAM/TGG CTA CAC/ZEN/ SET 5 GAA CAG AAA TCC CTG AAC TAT T ATT TGA GAA GAA TGG TGG A/3IABkFQ/ AFP Li 118 AGG AGA TGT GCT 119 TCT GCA TGA ATT 120 /56-FAM/AAT GCT GCA/ZEN/ SET 1 GGA TTG TC ATA CAT TGA CCA TGA CCA CGC TG/3IABkFQ/ (174) C AFP Li 121 ACT GCA GAG ATA 122 TCA CCA TTT TGC 123 /56-FAM/TTG CCC AGT/ZEN/ SET 2 AGT TTA GCT GAC TTA CTT CCT TG TTG TTC AAG AAG CCA C/ 3IABkFQ/ STEAP2 Br, Lu, 124 CAT GTT GCC TAC 125 TCT CCA AAC TTC 126 /56-FAM/ACA TGG CTT/ZEN/ (261729) Pr, Panc AGC CTC T TTC CTC ATT CC ATC AGC AGG TTC ATG CA/ 3IABkFQ/ TEAD3 Br, Lu, 127 GAA GAT CAT CCT 128 CTT CCG AGC TAG 129 /56-FAM/AGC GTG CAA/ZEN/ (7005) Li GTC AGA CGA G AAC CTG TAT G TCA ACT CT TTC GGC/ 3IABkFQ/ Br, Lu, 130 GAT CAG ACA GTC 131 GAC AAT CTT CCA 132 /56-FAM/ACA GGG AG/ZEN/ (7022) Mel ATT CGC AAA G GGG ACT GAG GTT CAG AGG GTT CTT/ 3IABkFQ/ TMPRSS2 Pr 133 CCC AAC CCA GGC 134 TCA ATG AGA AGC 135 /56-FAM/ACC CGG AAA/ZEN/ (7313) ATG ATG ACC TTG GC TCC AGC AGA GCT/3IABkFQ/ GPC3 Li 136 TGC TGG AAT GGA 137 GCT CAT GGA GAT 138 /56-FAM/TCC TTG CTG/ZEN/ (2719) CAA GAA CTC TGA ACT GGT CCT TTT GGC TGT ATC T/ 3IABkFQ/ ALB Li 139 CTT ACT GGC GTT 140 CCA ACT CTT GTA 141 /56-FAM/ACA TTT GCT/ZEN/ (219) TTC TCA TGC GAG GTC TCA AG GCC CAC TTT TCC TAG GT/ 3IABkFQ/ G6PC Li 142 GGA CCA GGG AAA 143 GCA AGG TAG ATT 144 /56-FAM/ACA GCC CAG/ZEN/ (2538) GAT AAA GCC CGT GAC AGA AAT CCC AAC CAC AAA/ 3IABkFQ/ G6PC Li 145 CAT TTT GTG GTT 146 GAT GCT GTG GAT 147 /56-FAM/CTG TCA CGA/ZEN/ SET 2 GGG ATT CTG G GTG GCT ATC TAC CTT GCT GCT CA/ 3IABkFQ/ PRAME Mel 148 GCC TTG CAC TTC 149 CTC TGC ATT TTT 150 /56-FAM/CAA GCG TTG/ZEN/ (23532) CAT TAT GAC GGA CAT AGG AG GAG GTC CTG AGG C/
3IABkFQ/ AH5G Li 151 ATG TGG AGT TTA 152 AGC TTC TCA CTG 153 /56-FAM/CCA CAG AGG/ZEN/ (197) CAG TGT CTG G AGT GTT GC CAG CCA AGT GTA ACC/ 3IABkFQ/ GPR143 Mel 154 ACG GCT CCC ATC 155 CCA CTA TGT CAC 156 /56-FAM/TTC GCC ACG/ZEN/ (4935) CTC CT CT GTA CCT G AGA ACC AGC AGC/3IABkFQ/ PTPRZ1 Mel 157 TGC TCT GAC AAC 158 GGC TGA GGA TCA 259 /56-FAM/AGG CCA GGA/ZEN/ (5803) CCT TAT GC CTT TGT AGA GTC TTT GCT GACT ATT/ 3IABkFQ/ MUCL1 Pr 160 CAT CAG CAG GAC 161 TGT CTG TGC TCC 162 /56-FAM/ACT CCC AAG/ZEN/ (118430) CAG TAG C CTG ATC T AGT ACC AGG ACT GCT/ 3IABkFQ/ PIP Br 163 TCA TTT GGA CGT 164 CTT GCT CCA GCT 165 /5HEX/CCT GCT CCT/ZEN/ (5304) ACT GAC TTG G CCT GTT C GGT TCT CTG CCT G/ 3IABkFQ/ PGR Br 166 GGT GTT TGG TCT 167 ACT GGG TTT GAC 168 /56-FAM/AGT GGG CAG/ZEN/ (5241) AGG ATG GAG TTC GTA GC ATG CTG TAT TTT GCA C/ 3IABkFQ/ TFAP2C Br, Lu 169 GTG ACT CTC CTG 170 CCA TCT CAT TTC 171 /56-FAM/TTC GGC TTC/ZEN/ (7022) ACA TCC TTA G GTC CTC CAA ACA GAC ATA GGC AAA GT/ 3IABkFQ/ Br 172 ACT GTG AAA AAC 173 TCT AGC AAT CAA 174 /56-VAM/TAG CCC TCT/ZEN/ (4246) TTT GGA CTG ATG CAG ATG AGT TCT GAG CCA AAC GCC/ 3IABkFQ/ FAT1 Br, Lu, 175 AGC TCC TTC CAG 176 GTC TGC TCA TCA 177 /56-FAM/ATC CCA GTG/ZEN/ (2195) Pr TCC GAA T ATC ACC TCA ATA CCC ATT GTC ATG GC/ 3IABkFQ/ FAT2 Br, Lu, 178 GGA CAG AGA GAA 179 TGT GGG AGA ATA 180 /56-FAM/TGG AGG TGA/ZEN/ (2195) Pr CAA GGA TGA AC TAG GTG GAT TG CTG TGC TGG ACA ATG/ 3IABkFQ/ RND3 Br, Lu 181 GCT TTG ACA TCA 182 CTG TCC GCA GAT 183 /56-FAM/ACA GTG TCC/ZEN/ (390) GTA GAC CAG AG CAG ACT TG TCA AAA AGT GGA AAG GTG A/3IABkFQ/ Lu 184 CCT GGA AA TGG 185 CAT TGC CTA CAG 186 /56-FAM/CCG ATG ACC/ZEN/ (6439) CCT CCT T GAA GTC TGG TAT GCC AAG AGT GTG AG/ 3IABkFQ/ SCG83A2 Lu 187 CCA GAG GTA AAG 188 TCC CAG ATA ACT 189 /56-FAM/AAG GCA GTA/ZEN/ (117156) GTG CCA AC GTC ATG AAG C GCA GAG TAA CTA CAA AGG C/3IABkFQ SERPINA3 Br, Lu 190 CCT CAA ATA CAT 191 GGA AGC CTT CAC 192 /56-FAM/TAG CAG TCT/ZEN/ (12) CAA GCA CAG C CAG CAA CCC AGG TGG TCC A/ 3IABkFQ/ SFRP2 Br, Lu 193 TTG CAG GCT TCA 194 GCC CGA CAT GCT 195 /56-FAM/TTT CCC CCA/ZEN/ (6423) CAT ACC TT TGA GT GGA CAA CGA CCT TT/ 3IABkFQ/ CRABP2 Br, Lu 196 CTC TTG CAG CCA 197 CCC TTA CCC CAG 198 /56-FAM/TTT CTT TGA/ZEN/ (1382) TTC CTC TT TCA CTT CT CCT CTT CTC TCC TCC CCT/ 3IABkFQ/ AQP4 Lu 199 TGG ACA GAA GAC 200 GGT GCC AGC ATG 201 /56-FAM/CCG ATC CTT/ZEN/ (361) ATA CTC ATA AAG AAT CCC TGG ACC TGC AGT TAT CA/ G 3IABkFQ/ TMPRSS4 Br, Lu 202 ATC TTC CCT CCA 203 CAG TTC CCA CTC 204 /56-FAM/CTC ACT CCA/ZEN/ (56649) TTC TGC TTC ACT TTC TCA G GCC ACC CCA CTC/3IABkFQ/ GREM1 Lu 205 TTT TGC ACC AGT 206 GCC GCA CTG ACA 207 /56-FAM/CCT ACA CGG/ZEN/ (26585) CTC GCT T GTA TGA G TGG GAG CCC TG/3IABkFQ/ indicates data missing or illegible when filed
Note that PRAME is also named MAPE (Melanoma Antigen Preferentially Expressed In Tumors), OIP4 (Opa-Interacting Protein OIP4), and CT130 (Cancer/Testis Antigen 130).
[0144] The following Table 4 lists nested primers designed to specifically pre-amplify the regions targeted by primers listed in Table 3.
TABLE-US-00004 TABLE 4 Primer Seq Seq name ID Nested Forward ID Nested Reverse FAT1 253 CAG ATG GAG GAG GAA GAT TCT G 254 GTA TAC TGC CTG GAG TTC TCT G FAT2 255 CTG GTT CAG GTC TCC ATT AGA G 256 GCT GTG ACT CTG AGC AAG TA AGR2 257 TGT CCT CCT CAA TCT GGT TAA TG 258 GAC AGA AGG GCT TGG AGA TTT PKP3 259 CG TGG CGT TGT AGA AGA T 260 AGA AGA TCT CTG CCT CCG A RND3 261 CAA GAT AGT TGT GGT GGG AGA C 262 AGG GTC TCT GGT CTA CTG ATG TFAP2C 263 TTTGGATTTACCGCTTGGG 264 GACTCCAGTGTGGGAGAG S100A2 265 GGG CCC ACA TAT AAA TCC TCA C 266 CTG CTG GTC ACT GTT CTC ATC PRAME 267 CTTCGCGGTGTGGTGAA 268 GCTGTGTCTCCCGTCAAA PIP 269 CTG GGA CAC ATT GCC TTC T 270 CCA CCA TGC ATT CTT TCA ATT CT PGR 271 AAA CCC AGT TTG GG AGA TGA G 272 CCC TGC CAA TAT CTT GGG TAA T SCGB2A1 273 ACA GCA ACT TCC TTG ATC CC 274 GCG GCA TCA CTG TCT ATG AA MUCL1 275 CCT TGC CTT CTC TTA GGC TTT 276 AGC AGT GGT TTC AGC ATC A PGR 277 CAG ATA ACT CTC ATT CAG TAT TCT TGG 278 CTC TAA TGT AGC TTG ACC TCA TCT TFAP2C 279 GAG AAG TTG GAC AAG ATT GGG 280 GCT GAG AAG TTC TGT GAA TTC TTT A SCGB2A1 281 GTT TCC TCA ACC AGT CAC ATA GA 282 AGT TGT CTA GCA GTT TCC ACA TA
Multiplex Digital Analysis of Gene Transcripts from CTC-Chip Products
[0145] To improve the detection of tumor-specific mRNA from minimal amounts of RNA derived from CTCs, we established a multiplex assay capable of testing many different gene transcripts from a minute amount of CTC-Chip product. This combines the higher sensitivity/specificity of using multiple independent genes, with the fact that the amount of input template is limited (and hence should not be diluted into multiple reactions). Our assay includes 4 genes per reaction, with each gene being resolved uniquely in 2-dimensional space by selecting different ratios of fluorescent conjugated primers. Thus, in a single reaction, we can independently measure 4 gene transcripts without having to dilute the template. For different cancers, we have gone as far as up to 4 different reactions (i.e., up to 20 different gene transcripts), and with application of nested RT-PCR digital assays, there is no limit to the number of reactions that can be performed.
[0146] This multiplex strategy achieves the ideal balance between analyzing multiple transcripts (and hence ensuring against heterogeneous variation in cancer cell expression patterns), but not diluting the input material by performing multiple independent PCR reactions. Depending on tumor types and the number of genes required for optimal signal, we have developed assays ranging from 2-4 multiplex reactions (each multiplex reaction testing for 4-genes). Thus, without undue dilution of input template, we can interrogate the product of a single CTC for expression of anywhere from 8 to 16 different genes. It is important to the assay to be able to add the signal from all of these genes (i.e. cumulative signal), while also having individual gene results (to optimize signal/noise at the individual gene level, and also gather information from specific signaling pathways that each gene interrogates--for example androgen signaling in prostate CTCs).
[0147] To display the results of the multiplex reaction in a single view (and hence differentiate amplification of each gene is isolation), we varied the concentrations of the two fluorescent probes (FAM (blue) and HEX (green)). By doing this, each individual gene amplification reaction has a unique combination of FAM/HEX signal that reflects the composition of the gene-specific primers, and hence identifies the gene-specific PCR product. In 2-dimensional space, we can illustrate the signal position of 4 different gene amplification products produced from a single multiplex reaction. As applied to digital PCR using droplets to encapsulate each PCR reaction, this method separates the targets into individual clusters by modifying the binary signal amplitude of positive droplets, which are displayed quantitatively. As predicted, this method allows both cumulative scoring of total signal for multiple genes (e.g., 16 markers in a total of 4 reactions), while also retaining the ability to quantify the signal from each individual gene target.
Novel Gene Panels to Enable Lineage-Specific Prediction of the Potential Efficacy for Specific Anti-Cancer Treatment Regimens
[0148] Virtually all patients with metastatic prostate cancer experience an initial clinical response following androgen deprivation therapy (ADT). As tumors develop castration-resistance, half of patients have a sustained second remission following treatment with the potent androgen synthesis inhibitor abiraterone (e.g., ZYTIGA.RTM.), while others have only a short response and would hence benefit from alternative or combination therapies. To test whether CTC-derived signatures provide predictive markers of response to anti-androgen therapies after ADT, we prospectively evaluated 25 patients with metastatic CRPC who were initiating abiraterone therapy in the first-line setting.
[0149] Remarkably, an elevated CTC-Score at pretreatment baseline was predictive of early progression, an effect that was driven by expression of FOLH1 (PSMA) and HOXB13 within CTCs. Both of these markers have been associated with aberrant androgen receptor ("AR") signaling, and HOXB13 has been associated with more aggressive, hormone refractory, prostate cancer. The correlation between HOXB13 and FOLH1 CTC-derived signal was evident for radiographic progression-free survival (HOXB13, P=0.015; FOLH1, P=0.015), as well as overall survival (HOXB13, P=0.017; FOLH1, P=0.017). In contrast, the pretreatment serum PSA protein level is correlated with reduced overall survival, but it is not indicative of radiographic progression-free survival or PSA progression, and it is no longer correlated with outcome following initiation of treatment.
Applications of the d-CTC Assay Methods
[0150] The early detection of epithelial cancers at a time when they can be surgically resected or irradiated provides the best chance of cure, and the administration of adjuvant chemotherapy in the setting of minimal cancer dissemination is far more effective in achieving cure than the treatment of established metastatic disease. Just as important as early detection is to select a proper anti-cancer therapy. The new methods described herein use the d-CTC assay methods to not only provide early detection of a specific type of cancer, but in combination with the appropriate reference standards, can be used to determine and compare the predicted efficacy of different therapeutic regimens in a specific patient depending on his or her tumor gene expression profile.
[0151] The d-CTC assays described herein can be used for both initial screening and to determine the best therapeutic regimen. The use of the new d-CTC assays described herein, in which each CTC (no matter how intact or pre-apoptotic) can give rise to hundreds of molecular signals, dramatically enhances the ability to detect and monitor CTCs in patients with known cancer, and to quantitatively monitor and analyze their response to therapeutic interventions. Beyond scoring for cell numbers through molecular markers, specific interrogation of mutations or cancer-associated rearrangements (e.g., EML4-ALK in lung cancer) can be achieved with comparable sensitivity.
[0152] As discussed in the examples below, the new methods described herein are illustrated in prostate cancer, where the analysis demonstrated that an elevated CTC-Score at pretreatment baseline was predictive of early progression, an effect that was driven by expression of FOLH1 (PSMA) and HOXB13 within CTCs.
EXAMPLES
[0153] The invention is further described in the following examples, which do not limit the scope of the invention described in the claims.
Example 1--Materials and Methods
[0154] The following materials and methods were used in the Examples set for the below.
Digital CTC Assay Protocol
[0155] This example provides a general digital CTC assay protocol that can be used for the methods described herein. Different aspects of this general protocol were used in Example 2 below.
[0156] 1. Patient blood is run through I-Chip, version 1.3M or 1.4.5T. Sample is collected in a 15 mL conical tube on ice.
[0157] 2. Sample is spun down at 4 C. Supernatant is decanted and SUPERase.TM. In (DTT independent RNAse inhibitor)+RNALater.RTM. Stabilization Solution (prevents RNA degradation by inhibiting RNAses) is added to the pellet. Sample is flash frozen and placed at -80 until further processing. Samples are stable at -80.
[0158] 3. There are two different processing protocols for RNA purification to cDNA synthesis that were used in the examples described below.
[0159] Approach 1 [0160] a. Sample was thawed on ice. [0161] b. Direct lysis of sample using detergents (NP40, Tween20). [0162] c. Lysed sample was taken straight for cDNA synthesis (Superscript [0163] d. After cDNA synthesis sample was purified via SPRI (Agencourt AMPure.RTM. XP beads) clean-up to clean up detergents and any nucleotides <100 bps.
[0164] Approach 2 [0165] a. Sample was thawed on ice. [0166] b. Sample was processed on RNeasy Qiagen Micro Kit. Protocol has some slight variations compared to traditional Qiagen recommendations. Higher volumes of Buffer RLT (Lysis buffer) were used as well as higher ETOH concentrations. These modifications were made because of RNALater.RTM. addition to the sample. [0167] c. After cDNA synthesis--sample was purified via SPRI (Agencourt AMPure XP beads) clean-up to clean up detergents and any nucleotides <100 bps.
[0168] 4. cDNA (synthesized from Approach 1 or 2) can be processed in two different ways: [0169] a. cDNA was used directly for ddPCR; or [0170] b. cDNA was amplified used a Fluidigm BioMark.TM. Nested PCR approach (primers from genes used for nested PCR have been pre-validated). Amplified cDNA was diluted.
[0171] 5. cDNA (from step 4a or 4b), Biorad Supermix.TM. for probes, primer or primers (for gene of interest; up to 4 different primers (FAM and HEX) can be multiplexed) were added in a total volume of 22 .mu.l.
[0172] 6. Droplets were generated (.about.15,000-18,000 droplets per well).
[0173] 7. Droplet Sample were put in a PCR machine. The PCR conditions were different than Biorad recommendations. We used a step-down rather than a slow ramp to ensure that all droplets reach the same temperature. This is different than what both RainDance and Biorad uses. Better results (i.e., more signal and more separation between positive and negative droplets) can be obtained with the step-down rather than the gradient.
[0174] 8. After the PCR, positive droplets were counted in a ddPCR machine.
[0175] 9. Data is collected and analyzed using TIBCO.RTM. Spotfire.RTM. analysis software.
[0176] The reagents, reagent concentrations, and reaction volumes are provided below:
[0177] Reagents: [0178] Biorad ddPCR.TM. Supermix for Probes (No dUTP) [0179] IDT primers/probes (20.times. or 40.times.) [0180] cDNA (1 ng/ul for cell lines) [0181] Nuclease free water [0182] Eppendorf semi-skirted 96 well plate (Only these plates work with the machine)
[0183] Testing Relevant Cell Lines
[0184] Per Single Reaction:
TABLE-US-00005 ddPCR Supermix 11.0 .mu.l Primer (20x) 1.10 .mu.l cDNA (1 ng/ul) 1.10 .mu.l Water 8.80 .mu.l TOTAL 22.0 .mu.l per well
A master-mix containing ddPCR supermix, cDNA, and water were aliquoted into wells and 1.1 .mu.l of each the primer was added to each well and mixed well.
[0185] Patient Samples
[0186] Per Single Reaction for Individual Genes
TABLE-US-00006 ddPCR Supermix 11.0 .mu.l Primer (20x) 1.1 .mu.l cDNA (patient) Up to 9.9 .mu.l (Balance with water if less) TOTAL 22.0 .mu.l per well
[0187] Per Single Multiplexed Reaction for Multiple Genes
TABLE-US-00007 ddPCR Supermix 11.0 .mu.l Primer 1 (40x) .55 .mu.l Primer 2 (40x) .55 .mu.l Primer 3 (40x) .55 .mu.l Primer 4 (40x) .55 .mu.l cDNA (patient) 8.8 .mu.l TOTAL 22.0 .mu.l per well
[0188] When testing multiple patients against a gene-specific primer or multiplexing primers against multiple genes, a master-mix, which includes the ddPCR supermix and primers, was aliquoted into wells followed by addition of patient cDNA to each well and mixed well.
Patients and Clinical Specimens
[0189] Patients with a diagnosis of prostate cancer provided informed consent to one of two Institutional Review Board approved protocols, DF/HCC 05-300 or DF/HCC 13-209. Patients donated 20 mL of blood for CTC analysis, including patients with metastatic prostate cancer and patients with localized prostate cancer. Formalin-fixed, paraffin-embedded primary tumor tissues from patients were sectioned, and subjected to RNA extraction, prior to processing for droplet digital PCR (see below).
Circulating Tumor Cell Isolation
[0190] CTCs were isolated from fresh whole blood following leukocyte depletion using the microfluidic CTC-iChip as previously described. To maximize recovery of intact CTCs with high quality RNA, blood samples were processed within 4 hours of being collected from the patient. The total time for CTC isolation after receipt of fresh blood samples in the lab was approximately 2.5 hours. Briefly, whole blood samples were spiked with biotinylated antibodies against CD45 (R&D Systems, clone 2D1) CD66b (AbD Serotec, clone 80H3), and CD16 (Janssen Diagnostics), followed by incubation with Dynabeads MyOne Streptavidin T1 (Invitrogen) to achieve magnetic labeling and depletion of white blood cells. After processing of whole blood with the CTC-iChip and collecting the enriched CTC product on ice, cells were centrifuged at 4750 rpm and flash frozen in liquid nitrogen in the presence of RNAlater.RTM. (Ambion) to preserve RNA integrity.
Droplet Digital PCR
[0191] CTC samples were subjected to RNA extraction using the RNeasy Plus Micro Kit (Qiagen), followed by reverse transcription using SuperScript III First-Strand Synthesis System (Life Technologies). cDNA and primers/probes were combined with ddPCR Supermix for Probes (Bio-Rad) in a 96-well plate and loaded onto Bio-Rad's automated droplet generator. Droplets were amplified using a modified 45-cycle PCR with a 70.degree. C. step-down in between the denaturation and annealing steps. Following thermal cycling, amplified droplets were detected via fluorescence with the QX200 Droplet Reader System (Bio-Rad).
[0192] A list of potential gene candidates was generated using publically available databases as well as single cell RNA-seq data. A two-step approach using both RT-PCR and ddPCR was developed to validate these genes. In the first step, cDNA prepared from healthy donor leukocytes and prostate cell lines (LNCaP, PC3, VCaP) was tested against primers using the ABI 7500 and Bio-Rad CFX96 Real-Time PCR Systems. Leukocytes were isolated from male healthy donors using BD Vacutainer.RTM. CPT.TM. Cell Preparation Tubes. Total RNA was extracted from isolated leukocytes and prostate cancer cell lines using RNeasy Micro Kit (Qiagen) and 500 ng reverse transcribed with SuperScript III First-Strand Synthesis System (Life Technologies). 1 ng of total cDNA was used per RT-PCR reaction. Genes expressed in cell lines and absent in healthy donor leukocytes by RT-PCR were further validated in a second step using ddPCR. cDNA prepared from CTC-iChip products of healthy donor males and patients was tested against genes using the ddPCR platform. Differential expression between healthy donors and patients determined by droplet count was used to select genes for the assay (Table 5).
TABLE-US-00008 TABLE 5 Sequences of Final Primers and Probes Used for Each Gene Gene Forward 5'-3' SEQ ID NO: TMPRSS2 TCA ATG AGA AGC ACC TTG GC SEQ ID NO: 331 FAT1 ATC AGC AGA GTC AAT CAG TGA G SEQ ID NO: 332 KLK2 GTC TTC AGG CTC AAA SEQ ID NO: 333 CAG GT STEAP2 TCT CCA AAC TTC TTC CTC ATT CC SEQ ID NO: 334 KLK3 GTG TGC TGG ACG CTG GA SEQ ID NO: 335 HOXB13 CTG TAC GGA ATG CGT TTC TTG SEQ ID NO: 336 AGR2 CAA TTC AGT CTT CAG CAA CTT GAG SEQ ID NO: 337 FOLH1 TGT TCC AAA GCT CCT CAC AA SEQ ID NO: 338 Gene Reverse 5'-3' TMPRSS2 CCC AAC CCA GGC ATG ATG SEQ ID NO: 339 FAT1 GAT CCT TAT GCC ATC ACC GT SEQ ID NO: 340 KLK2 GCT GTG TAC AGT CAT GGA TGG SEQ ID NO: 341 STEAP2 CAT GTT GCC TAC AGC CTC T SEQ ID NO: 342 KLK3 GTG ATA CCT TGA AGC ACA CCA TTA C SEQ ID NO: 343 HOXB13 CAG CCA GAT GTG TTG CCA SEQ ID NO: 344 AGR2 CTG ACA GTT AGA GCC GAT ATC AC SEQ ID NO: 345 FOLH1 CAA TGT GAT AGG TAC TCT CAG AGG SEQ ID NO: 346 Gene Probe 5'-3' TMPRSS2 ACC CGG AAA CC AGC AGA GCT SEQ ID NO: 347 FAT1 TCT TGT CAG CAG CGT TCC CGG SEQ ID NO: 348 KLK2 TGG CTA TTC TTC TTT AGG CAA SEQ ID NO: 349 TGG GCA STEAP2 ACA TGG CTT ATC AGC AGG TTC ATG CA SEQ ID NO: 350 KLK3 AAA GCA CCT GCT CGG GTG ATT CT SEQ ID NO: 351 HOXB13 CAG CAT TTG CAG ACT CCA GCG G SEQ ID NO: 352 AGR2 ATG CTT ACG AAC CTG CAG ATA CAG CTC SEQ ID NO: 353 FOLH1 ATG AAC AAC AGC TGC TCC ACT CTG A SEQ ID NO: 354
Cell Spiking
[0193] To test the limit of detection for the ddPCR assay a series of cell spiking experiments were performed using the CTC-iChip. Single LNCaP cells were manipulated using 10 um Eppendorf TransferMan.RTM. NK2 transfer tips into Kolliphor P188 buffer and spiked into healthy donor male blood. The spiked samples were prepped for processing as described above and run through the CTC-iChip. RNA and cDNA were isolated and prepped from the CTC-iChip products and run on ddPCR using Reactions 1 and 2.
Example 2--Generation of CTC Digital Signature Using Prostate-Lineage Transcripts
[0194] Given the limitations inherent in fluorescence-based imaging and scoring of CTCs admixed with contaminating blood cells, we tested whether RNA-based digital PCR quantitation could provide a higher throughput, more sensitive and more specific readout. Microfluidic (CTC-iChip) depletion of hematopoietic cells from blood samples achieves 10.sup.4 to 10.sup.5 purification of CTCs, with approximately 500 WBCs remaining per 1 mL of processed whole blood. The high quality of RNA within the purified CTCs allows the application of new and highly robust digital droplet-PCR technologies, in which rare cDNA templates are encapsulated within lipid droplets, followed by PCR amplification and fluorescence scoring of positive droplets. The combination of microfluidic whole cell isolation of CTCs from blood and RNA-based digital PCR of CTC-derived transcripts (d-CTC assay) allows the use of prostate tissue lineage-specific mRNAs as highly specific markers to monitor metastatic prostate cancer (FIG. 1).
[0195] To test the application of this strategy for prostate CTC detection, we first identified a panel of prostate-specific transcripts whose expression is virtually absent in normal hematopoietic cells, even following high sensitivity droplet-PCR amplification. We selected multiple markers, both to address the known heterogeneity of prostate cancer cells, as well as to allow interrogation of cellular signaling pathways, including androgen receptor activity. We derived an initial set of 40 candidate genes, both from RNA sequencing of single prostate CTCs (Miyamoto, et al. Science 2015; 349: 1351-6.), as well as from publicly available expression databases.
[0196] Twenty-nine transcripts were identified as having high levels of expression in prostate tissue and/or prostate cancer, but without detectable RNA reads in normal blood cells contaminating the microfluidic CTC-iChip product (FIGS. 2 and 3). Multiple primers and conditions were optimized for a set of 8 genes, which together provided the most robust signal in rare prostate cancer cells admixed with normal blood cells. These genes included androgen responsive transcripts KLK3, KLK2, and TMPRSS2; androgen-repressed transcripts FOLH1 (PSMA) and HOXB13; and androgen-independent transcripts FAT1, AGR2, and STEAP2. To avoid dilution of rare templates while enabling amplification of multiple markers, we designed a multiplex assay (2 reactions with 4 genes per reaction), with differing relative ratios of FAM and HEX fluorescence to define the identity of the amplified product (FIG. 4). A multi-class support vector machine (SVM) classifier algorithm was developed to automatically classify droplets according to their position on the FAM-HEX coordinate system (FIG. 5).
[0197] To validate the assay, we first micro-manipulated individual cells from the prostate cancer line LNCaP, and introduced these into 2.5 mL of whole blood from healthy donors, followed by processing through the CTC-iChip and droplet digital PCR quantitation. Introduction of a single LNCaP cell into a control blood sample generated 150 positive droplets (SD=65.3), with a progressive increase in signal as 3, 5, 10, and 50 cells were spiked into the blood samples (5562.+-.1853 droplets for 50 prostate cell input) (FIG. 6). The distribution of signal among the 8 prostate-lineage transcripts remained comparable with increasing numbers of LNCaP cell input.
Example 3--CTC Scoring in Patients with Metastatic Prostate Cancer
[0198] We tested the d-CTC detection strategy in 12 patients with metastatic prostate cancer, compared with 8 patients with localized prostate cancer, 34 male healthy blood donors (19>50 years old; 15<50 years old), and 5 female controls. The observed signal across all 8 markers is shown in FIG. 7A. Using the 19 age-matched male controls (>age 50) and 12 patients with metastatic prostate cancer, we established a signal threshold for each of the 8 genes at 2 standard deviations above the median in controls, and given the different signal intensity for each gene, we weighted each of these in proportion to the median difference between CRPC patients and age matched controls (see Example 1), thereby deriving a digital CTC-Score. A positive digital CTC-Score was present in 11/12 (92%) patients with metastatic prostate cancer, compared with 0/34 healthy male blood donors (FIG. 7B). Under these stringent criteria, none of the 12 patients with localized prostate cancer had detectable CTC-Scores (FIG. 7B). Interestingly, while we established scoring criteria for highest specificity in monitoring patients with metastatic prostate cancer, low level digital signal was present in some individuals with localized cancer. Among healthy individuals, men >age 50 had higher background signal than those <age 50, and virtually no signal was present in female controls (FIG. 7B).
[0199] To compare the digital CTC assay with more traditional immunofluorescence-based detection of CTCs, pre-treatment blood samples were obtained from 25 patients with mCRPC enrolled on a prospective clinical trial of abiraterone in the first-line setting. Each blood sample was processed through the CTC-iChip and the output was equally divided between immunofluorescence-based microscopy scoring versus d-CTC assay. As expected, concordance between microscopic scoring and digital readouts was evident in samples with high numbers of CTCs, but the d-CTC assay was far more sensitive in identifying cases below microscopic detection, even using sophisticated multispectral fluorescence-based imaging. (R.sup.2=0.01; P=0.6; FIG. 7C). Across patients with mCRPC in the first-line setting, the total digital CTC signal was moderately correlated with serum PSA protein measurements (R.sup.2=0.16; P=0.049) (FIG. 7D). The levels of tumor-derived PSA protein in blood samples were also modestly correlated with the quantitation of CTC-derived KLK3 (PSA) mRNA (R.sup.2=0.18; P=0.038; FIG. 7E). Taken all together, these observations indicate that the digital CTC-Score measures disease burden in patients with metastatic prostate cancer, but that by integrating multiple AR-dependent and independent transcripts within invasive tumor cells in the blood, it appears to provide information on disease status that is non-overlapping and potentially orthogonal to serum PSA protein measurements.
Example 4--Detection of AR-V7 and TMPRSS2-ERG Prostate Cancer Specific Transcripts in CTCs
[0200] While recurrent missense mutations are rare in prostate cancer, two specific RNA fusion transcripts are characteristic of this tumor type. To complement the quantitation of prostate lineage-based transcripts in CTCs, we developed droplet PCR assays for both the TMPRSS2-ERG fusion transcript, which is present in 50% of cases, and the AR-V7 RNA splice variant, which constitutes a marker of resistance to anti-androgen therapy. Both tests were highly specific and sensitive when applied to prostate cell lines spiked into control blood specimens, followed by CTC-iChip purification (FIGS. 8A and 8B). When applied to blood samples from men with metastatic prostate cancer, 5 of 13 (38%) mCRPC patients had the TMPRSS2-ERG translocation, 11 (85%) had the AR-V7 splice variant, and 3 (23%) had both transcripts in their CTCs (FIG. 8C). Blood samples from 12 age-matched donors were negative for both transcripts (FIG. 8D). As expected, men whose CTCs were positive for TMPRSS2-ERG had archival primary tumors that were largely concordant for that marker (FIG. 8E). In contrast, the CTC-derived AR-V7 signal was virtually absent in matched primary prostate cancers (FIG. 8F), consistent with its characterization as a marker that emerges in the setting of advanced CRPC.
Example 5--Prospective Serial Monitoring of Patients on First-Line Abiraterone Therapy
[0201] Virtually all patients with metastatic prostate cancer experience an initial clinical response following androgen deprivation therapy (ADT). As tumors develop castration-resistance, half of patients have a sustained second remission following treatment with the potent androgen synthesis inhibitor abiraterone, while others have only a short response and would hence benefit from alternative or combination therapies. To test whether CTC-derived signatures provide predictive markers of response to anti-androgen therapies after ADT, we prospectively evaluated 25 patients with metastatic CRPC who were initiating abiraterone therapy in the first-line setting.
[0202] We first applied the prostate lineage CTC-Score at the baseline pretreatment time point (C1D1), at on-treatment time points of 2 weeks (C1D15), 4 weeks (C2D1), 12 weeks (C4D1), and at the time of disease progression and discontinuation of therapy (FIGS. 9A and 9B). Remarkably, an elevated CTC-Score at pretreatment baseline (C1D1) was predictive of early progression, an effect that was driven by expression of FOLH1 (PSMA) and HOXB13 within CTCs. Both of these markers have been associated with aberrant androgen receptor signaling, and HOXB13 has been associated with more aggressive, hormone refractory prostate cancer. The correlation between HOXB13 and FOLH1 CTC-derived signal was evident for radiographic progression (HOXB13, P=0.015; FOLH1, P=0.015), as well as overall survival (HOXB13, P=0.017; FOLH1, P=0.017). In contrast, the pretreatment serum PSA protein level is correlated with reduced overall survival, but it is not indicative of radiographic progression or PSA progression, and it is no longer correlated with outcome following initiation of treatment.
[0203] AR-V7 expression has been detected in patients with metastatic CRPC in the second line or greater setting, and it has been shown to predict acquired resistance to abiraterone when administered to patients with such advanced disease. Using the digital CTC assay, AR-V7 was detectable in 4/20 patients tested at the pretreatment baseline time point. In this first line setting, quantitative detection of AR-V7 was not predictive of radiographic progression or overall survival. However, serial monitoring of these patients indicated that the predictive value of AR-V7 increased during the first three courses of therapy, achieving a high predictive value for radiographic progression (P=0.026), and overall survival (P<0.001) using the 3-month time point. This observation is consistent with the initiation of anti-androgen therapy suppressing the proliferation of susceptible tumor cells, with the emergence of AR-V7-driven resistant disease in patients destined for early relapse. In contrast to AR-V7, the TMPRSS2-ERG translocation was not enriched as a function of anti-androgen therapy and it was not correlated with acquired resistance.
[0204] The AR-V7 splice variant measures one of several mechanisms linked to anti-androgen resistance, whereas expression of HOXB13 and FOLH1 are downstream indicators of aberrant androgen signaling. We therefore compared the predictive value of these orthogonal markers, either alone or in combination, in pretreatment CTCs drawn from patients in our prospective first line abiraterone cohort (FIG. 10). Positive signal for either HOXB13 or FOLH1 identified 8/11 (73%) of patients who went on to have early radiographic progression and 5/6 (83%) of those with a shortened overall survival (FIGS. 10C-F). At the same time point, AR-V7 positivity identified 3/11 (27%) of patients with radiographic progression and 2/6 (33%) with poor overall survival (FIGS. 10A-B). All AR-V7 positive patients also scored for HOXB13/FOLH1 expression, hence combining these two markers did not improve the predictive value of HOXB13/FOLH1 scoring alone. At the 3 months on-treatment time point (C4D1), the HOXB13/FOLH1 score identified 7/8 (88%) of patients with destined for radiographic progression and 5/5 (100%) of patients with shortened overall survival, compared with 3/8 (38%) and 3/5 (60%) for AR-V7 positivity. Taken all together, the analysis of CTC-derived digital signatures provides a novel and potentially powerful strategy for predictive assessment and disease monitoring in patients at first relapse of castration-resistant disease.
Example 6--Persistent Estrogen Receptor Signaling in CTCs Identifies Metastatic Breast Cancer Patients Who Will be Resistant to Hormonal Therapy
[0205] In patients with hormone receptor-positive ("HR+") disease, persistent expression of a six-gene resistance signature ("RS") associated with estrogen signaling correlates with adverse outcomes, including shorter time to progression (TTP) and poor overall survival (OS) (p=0.02 (OS), p=0.003 (TTP)) when treated with drugs that target the estrogen-signaling pathway such as ER inhibitors (e.g., tamoxifen), selective ER degraders ("SERDs" such as fulvestrant), and aromatase inhibitors (AI), which block the production of estrogen (e.g., anastrozole, letrozole, and exemestane), e.g., in combination with CDK4/6 inhibitors.
[0206] Only half of the patients with a high RS score harbor ESR1 mutations, suggesting the involvement of additional mechanisms for drug-refractory estrogen signaling. Thus, digital RNA scoring of CTCs enables early monitoring of treatment response and provides the potential for a noninvasive measurement of drug effect on intracellular ER signaling pathways.
Patients
[0207] Patients were consented through an Institutional Review Board approved protocol for CTC collection (DFHCC 05-300). For the initial clinical benchmarking of the assay, 10-20 ml of peripheral blood (17 ml average) was collected from a total of 78 unique patients, representing 85 samples. These include pretreatment samples from 23 Stage I, 24 Stage II and 8 Stage III unique patients, and 30 on-treatment samples from 23 unique Stage IV patients. 33 samples from female healthy donors (HD) were obtained from the blood bank (9 ml average volume).
[0208] To determine if CTC monitoring through the breast CTC-ddPCR assay is predictive of treatment outcome and overall survival, we prospectively collected pretreatment and 3-4 weeks on-treatment draws from metastatic breast cancer patients initiating a new therapy (TRACK cohort). At least one sample was collected from 52 patients; 50% of the patients received some form of endocrine therapy, 10% received chemotherapy, 13% received anti-HER2 therapy while the rest were on a therapy that does not fall into any of these categories. To validate the assay detection characteristics established in the initial phase of assay development on the TRACK cohort, we also collected samples from 10 healthy women with negative breast biopsies after suspicious mammogram findings.
Microfluidic CTC Enrichment
[0209] The CTC-iChip technology for enrichment of CTC from whole blood, through the negative selection of RBC, WBC, and platelets, has been described above. In short, 8-20 ml of whole blood was incubated with biotinylated antibodies against the WBC markers CD45 (R&D Systems, clone 2D1), CD66b (AbD Serotec, clone 80H3), and CD16 (Janssen Diagnostics). Dynabeads MyOne Streptavidin T1 (Invitrogen) were then added to tag the WBC. The blood was subsequently fed through the CTC-iChip, where RBC and platelets were removed through size-based separation, while WBCs were depleted magnetically. The CTC-enriched product was centrifuged, preserved in RNA-later (Ambion) and flash-frozen for long-term storage.
Marker Selection and CTC Signal Scoring 17 markers for breast CTCs (AGR2, CXCL13, CXCL14, EFHD1, FAT1, FAT2, MGP, MUC16, PGR, PIP, PRAME, SCGB2A1, SERPINA3, SFRP1, SFRP2, TMPRSS4, WFDC2) were selected through literature search and mining in-house and publically available datasets including GTeX.RTM. and Oncomine.RTM. for markers expressed in breast cancer but not in whole blood. The specific genes and IDT probes used in the finalize breast cancer assay are listed in Table 6.
TABLE-US-00009 TABLE 6 Entrez ddPCR Primer Gene IDT DNA primer name ID Assay ID notes ddPCR primer 1 ddPCR primer 2 ddPCR probe AGR2 10551 Hs.PT.58.3 HEX CTG ACA GTT AGA CAA TTC AGT /5HEX/ATG CTT ACG/ 8683802 ''primary'' GCC GAT ATC AC CTT CAG CAA ZEN/AAC CTG CAG ATA CAG probe CTT GAG CTC/3IABkFQ/ (SEQ ID NO: 355) AGR2 10551 HS.PT.58. FAM, GTT TGT CCT CCT GTG ATA TCG /56-FAM/TGA CAA ACA/ 20615543 ''secondary'' CAA TCT GGT GCT CTA ACT ZEN/CCT TTC TCC TGA TGG probe GTC AG CC/3IABkFQ/ (SEQ ID NO: 356) CXCL13 10563 Hs.PT.58.4 FAM TCA GCA GCC TCT GGG CAA GAT /56-FAM/TGT AGA TGT/ 5801487 probe CTC CA TTG AAT TCG ZEN/GTC CAA GAG AGC TCA ATC A GTC T/3IABkFQ/ (SEQ ID NO: 357) CXCL14 9547 Hs.PT.58.1 FAM GCT ACA GCG ACG GAC CTC GGT /56-FAM/AAA TGA AGC/ 9273291 probe TGA AGA AG ACC TGG ACA ZEN/CAA AGT ACC CGC ACT G/ 3IABkFQ/ (SEQ ID NO: 358) EFHD1 80303 Hs.PT..58. FAM TCG ATG TGG CCC TTC CGC TCA /56-FAM/TCT TTG AAG/ 27534728 probe TGG AG TCT TGC TCA G ZEN/CCA AGG TCC AAG CCT/ 3IABkFQ/ (SEQ ID NO: 359) FAT1 2195 Hs.PT.58.4 HEX ATC AGC AGA GTC GAT CCT TAT /5HEX/TCT TGT CAG/ 5775110 ''primary'' AAT CAG TGA G GCC ATC ACC GT ZEN/CAG CGT TCC CGG/ probe 3IABkFQ/ (SEQ ID NO: 360) FAT1 2195 HS.PT.58. FAM, AGC TCC TTC CAG GTC TGC TCA /56-FAM/ATC CCA GTG/ 14859907 ''secondary'' TCC GAA T TCA ATC ACC ZEN/ATA CCC ATT GTC ATC probe TCA GC/3IABkFQ/ (SEQ ID NO: 361) FAT2 2196 Hs.PT.58.2 HEX TCC TCC ACT CAT CCT GGA TGC /5HEX/ACC TGC TAC/ 4846942 ''primary'' CTC CAA CT TGA CAT TTC ZEN/ATC ACA GAG GGA GAC probe TGA C/3IABkFQ/ (SEQ ID NO: 362) FAT2 2196 HS.PT.58. FAM, GGA CAG AGA GAA TGT GGG AGA /56-FAM/TGG AGG TGA/ 3832648 ''secondary'' CAA GGA TGA AC ATA TAG GTG ZEN/CTG TGC TGG ACA ATG/ probe GAT TG 3IABkFQ/ (SEQ ID NO: 363) MGP 4256 HS.PT.58. FAM GGATTAAGTTCATA CTTCGGCTTTGA /56- 635768 probe AGATTCCATGCT TATCGTTTCAG FAM/CATGTGATT/ZEN/CCTG GGCACGATGC/3IABkFQ/ (SEQ ID NO: 364) MUC16 94025 Hs.PT.58.3 FAM GAC AAC AAC CAC AGA TCC AGG /56-FAM/AGC CTC TTT/ 543722 probe CTT CAA TAC AC ACC GAT GGT T ZEN/ACT CCT CTG ACC ACA CC/3IABkFQ/ (SEQ ID NO: 365) PGR 5241 Hs.PT.58.1 HEX GGA CTG GAT AAA GGC AAT TGG /5HEX/ACA AGA TCA/ 566542 ''primary'' TGT ATT CAA GCA TTT GAG GCA A ZEN/TGC AAG TTA TCA AGA probe AGT TTT GTA AGT T/3IABkFQ/ (SEQ ID NO: 366) PGR 5241 Hs.Pt.58.5 FAM, GGT GTT TGG TCT ACT GGG TTT /56-FAM/AGT GGG CAG/ 0458902 ''secondary'' AGG ATG GAG GAC TTC GTA GC ZEN/ATG CTG TAT TTT GCA probe C/3IABkFQ/ (SEQ ID NO: 367) PIP 5304 Hs.PT.58.1 FAM, CAG TGC TTG CAG CCA GTA GAA /56-FAM/TGA GGT AAG/ 9165954 ''secondary'' TTC AAA CAG GGT TTT TGG ZEN/TTT TAA CCA CCA TGC probe ATT GTC ATT CTT TC/3IABkFQ/ (SEQ ID NO: 368) PIP 5304 Hs.PT.58.3 HEX TCA TTT GGA CGT CTT GCT CCA /5HEX/CCT GCT CCT/ 9868280 ''primary'' ACT GAC TTG G GCT CCT GTT C ZEN/GGT TCT CTG CCT probe G/3IABkFQ/ (SEQ ID NO: 369) PRAME 23532 Hs.PT.58.4 HEX GCA ACA AGT GAC GTC CAC ACA /5HEX/CAA GCG TTG/ 5281469 ''primary'' TGA GAC CTA CTC ATG CTG AT ZEN/GAG GTC CTG AGG probe C/3IABkFQ/ (SEQ ID NO: 370) SCGB2A1 4246 Hs.PT.58.8 HEX GTC TTT TCA ACC ACT TCC TTG /5HEX/CCA TGA AGC/ 64035 ''primary'' ATG TCC TCC A ATC CCT GCC A ZEN/TGC TGA TGG TCC TCA probe /3IABkFQ/ (SEQ ID NO: 371) SCGB2A1 4246 HS.PT.58. FAM, ACT CTG AAA AAC TCT AGC AAT /56-FAM/TAG CCC TCT/ 25526882 ''secondary'' TTT GGA CTG ATG CAA CAG ATG ZEN/GAG CCA AAC GCC/ probe AGT TCT 3IABkFQ/ (SEQ ID NO: 372) SERPINA3 12 Hs.PT.58.1 FAM CCT CAA ATA CAT GGA AGC CTT /56-FAM/TAG CAG TCT/ 5580605 probe CAA GCA CAG C CAC CAG CAA ZEN/CCC AGG TGG TCC A/3IABkFQ/ (SEQ ID NO: 373) SFRP1 6422 hs.pt.5803 FAM GAG ATG CTT AAG CCT CAG ATT /56-FAM/TGG AGG CTT/ 8429156 probe TGT GAC AAG TTC TCA ACT CGT ZEN/CGG TGG CAT TGG/ TGT C 3IABkFQ/ (SEQ ID NO: 374) SFRP2 6423 Hs.PT.58.2 FAM TTG CAG GCT TCA GCC CGA CAT /56-FAM/TTT CCC CCA/ 0705989 probe CAT ACC TT GCT TGA GT ZEN/GGA CAA CGA CCT TT/3IABkFQ/ (SEQ ID NO: 375) TMPRSS4 56649 Hs.PT.58.3 FAM ATC TTC CCT CCA CAG TTC CCA /56-FAM/CTC ACT CCA/ 161735 probe TTC TGC TTC CTC ACT TTC ZEN/GCC ACC CCA CTC/ TCA G 3IABkFQ/ (SEQ ID NO: 376) WFDC2 10406 Hs.PT.58.2 FAM CCG ACA ACC TCA GCT GGG GAA /56-FAM/TGC TCT CTG/ 5117187 probe AGT GCT G AGT TAA TGT ZEN/CCC AAT GAT AAG GAG TCA C G/3IABkFQ/ (SEQ ID NO: 377)
[0210] For the initial in vitro testing the panel, and to determine the linearity of the signal, we micro-manipulated increasing numbers of BRX-142 cells into 4 ml of HD blood and ran the samples through the CTC-iChip as described above. RNA was extracted using RNeasy.RTM. Micro Kit (Qiagen) and a quarter of it was then used for cDNA synthesis and amplification using the SMART-Seq v4 Ultra Low Input RNA Kit (Clontech). To establish the clinical specificity and sensitivity of the assay, CTC-iChip products from healthy donors and patients were similarly processed. ddPCR analysis was performed using predesigned Taqman-based qPCR assays (Invitrogen) and the ddPCR Supermix for Probes (No dUTP)(Biorad), on the Biorad ddPCR system. For markers detected with multiple probes, the average transcript number was used.
[0211] To normalize for differences in blood volumes among samples, all raw data were corrected for the blood-volume equivalent used in each ddPCR reaction. To further normalize the signal, the median and the doubled standard deviation of the expression of each marker within the 33 test healthy donors was established. The product of the two values was then subtracted from every patient and healthy donor sample analyzed in this study. The total CTC score was calculated by summing the normalized expression of all markers in a sample without additional weighing and reported as transcripts/ml of blood-volume equivalent used.
ESR1 Mutation Detection
[0212] Probes specific for the L536R, Y537C, Y537N, Y537S and D538G ESR1 mutations have been previously published. Their amplification efficiency, as well as that of their respective wild-type probes, was tested on synthetic sequences (data not shown). We established the ability of Y537S to detect mutations present in cDNA from CTC-enriched IFD product by micro-manipulating increasing number of BRx-68 cells in healthy donor blood, and then processing it as described above. 18-cycle WTA was performed using 1/3 of the extracted RNA with the SMART-Seq v4 Ultra Low Input RNA Kit (Clontech) following manufacturer protocols; 1 ul of undiluted WTA product was used per reaction. Patient samples were treated in identical manner; probe specificity was established at 100% after testing at least 5 healthy donor samples per probe. The cut-off for the presence of ESR1 mutation was established at >3 positive droplets.
Statistical Analysis
[0213] Receiver-operator curve analysis was performed to establish the specificity and sensitivity of each marker and the total CTC score for different cancer stages in our initial test cohort. The analysis was performed in R using the ROCR package. The specific script is available upon request. Wilcoxon tests were performed to establish significance of the AUC. The specificity and sensitivity in Stage IV cancer were validated using a new set of healthy donors and the pretreatment samples from the TRACK cohort.
[0214] To determine the pre-treatment division point of high/low RS score, resampling using leave-one-out jack-knife was applied to the algorithm of Contal-O'Quigley to produce a division point that maximizes the difference in overall survival between the two resulting sub-groups. Comparisons of clinical variables between resulting groups are based on Fisher's exact tests for categorical characteristics and exact Wilcoxon rank-sum tests for continuous characteristics.
[0215] Survival analyses based on changes in CTC scores during treatment and on RS scores were analyzed using log-rank test, as subgroups within those comparisons had no events, preventing the use of cox model statistics. Unsupervised clustering of pretreatment and 3-4 week on-treatment samples was performed using Ward's minimum variance method.
Results
[0216] To develop an RNA expression signature to detect breast cancer cells within the background of contaminating normal blood cells, we first analyzed RNA-Seq and microarray gene expression data sets derived from normal breast tissue, breast cancer and whole blood as described above. We ultimately selected 17 markers whose expression is virtually absent in blood cells, but strongly expressed in breast-derived tissues. The markers include breast lineage-specific transcripts (PGR, SCGB2A1, PIP) and transcripts highly expressed in breast cancer (MGP, EFHD1), as well as genes implicated in endocrine signaling (SERPINA3, WFDC2), endocrine drug resistance (AGR2), cancer growth and metastasis (MUC16, TMPRSS4), cellular signaling (FAT1, FAT2, SFRP1, SFRP2), epithelial-derived cytokines (CXCL13, CXCL14), and oncofetal antigens (PRAME).
[0217] Single cell RNA sequencing revealed high, but variable, expression of the 17 markers in 15 individual CTCs isolated as single cells from the blood of women with breast cancer; 5 similarly analyzed single WBCs had negligible expression of these genes. Unlike traditional mutational signatures designed to distinguish between breast cancer and normal breast tissue, the CTC RNA signature panel was intended to inform on the tissue of origin of non-hematopoietic cells within a blood sample, with the potential to provide actionable clinical information for the diagnosis and monitoring of breast cancer.
[0218] To interrogate the entire panel of biomarkers for subsets that may be correlated with endocrine-refractory disease we performed unsupervised clustering of the breast assay components at 3-4 weeks after start of endocrine treatment in the subset of patients with HR+ disease, reasoning that treatment-induced expression changes may distinguish responding from non-responding patients. Indeed, we identified 6 genes (PIP, SERPINA3, AGR2, SCGB2A1, EFHD1 and WFDC2) within a Resistance Signature (RS), whose expression was associated with rapid disease progression (within 120 days) and poor survival (p=0.0031 and p=0.0175 respectively, Fisher's exact test) (FIG. 11A).
[0219] Remarkably, all 6 RS transcripts are significantly enriched in ER+ tumors compared to ER- tumors in the TCGA database, suggesting that their expression may be related to estrogen signaling. Indeed, a metascore based on the mean expression of the RS genes shows a highly significant correlation with the Hallmark Estrogen Receptor (Late) gene signature from the Molecular Signatures Database across multiple publically available gene expression datasets (R=0.70; p=1.7e-70). The RS gene metascore is also correlated with multiple other MSigDB sets related to estrogen signaling and endocrine resistance, resulting in median correlation coefficients of 0.54 and 0.51 respectively (FIGS. 11B-1 and 11B-2). Persistent enrichment of the RS transcripts in CTCs from women whose tumors are refractory to endocrine therapy suggests failure of these drugs to hit their target, as measured within circulating cancer cells.
[0220] Activating mutations in the ESR1 gene encoding ER have been reported in breast cancers with acquired resistance to hormonal therapy and are thought to mediate persistent, ligand-independent ER signaling. In our 3-4 week HR+ patient cohort, 2/20 women had been diagnosed as having an ESR1 mutation based on tumor re-biopsy during the course of clinical care. See Table 7 below, which shows ESR1 mutations detected by CTC-ddPCR and SNapShot genotyping in HR+ patients on endocrine treatment and TNBC patients (negative control).
TABLE-US-00010 TABLE 7 Mutation Specific ESR1 Mutation Specific ESR1 detected by mutation detected SNaPshot detected by mutation detected by Sample Date drawn CTC-ddPCR? by CTC-ddPCR Date SNaPshot Site SNaPshot? SNaPshot HR+ patients receiving endocrine therapy BRX121_TRACK26 2016 May 27 2013 Aug. 26 Primary BRX169_TRACK12 2016 Apr. 1 2013 May 23 Primary BRX179_TRACK03 2016 Mar. 8 2014 Nov. 4 Metastatic BRX208_TRACK05 2016 Apr. 1 2015 Jun. 19 Primary BRX224_TRACK33 2016 Jul. 14 2015 Aug. 7 Metastatic BRX268_TRACK35 2016 Jul. 29 X D538G 2015 Dec. 22 Primary BRX272_TRACK22 2016 May 12 X Y537N, D538G 2016 Feb. 10 Metastatic BRX273_TRACK02 2016 Mar. 10 NA 2013 Feb. 4 Primary NA BRX280_TRACK19 2016 May 9 NA NA NA BRX283_TRACK52 2016 Nov. 1 X Y537C 2016 Jan. 19 Primary BRX286_TRACK04 2016 Mar. 23 2016 Feb. 8 Primary NA BRX294_TRACK08 2016 Apr. 1 X L536R, Y537N 2016 Feb. 5 Metastatic X L536R, Y537N BRX295_TRACK06 2016 Mar. 27 NA NA NA BRX301_TRACK15 2016 Apr. 29 2014 Oct. 31 Metastatic X L536Q* BRX302_TRACK18 2016 Apr. 22 NA NA NA BRX308_TRACK24 2016 May 25 2016 Mar. 6 Primary BRX333_TRACK42 2016 Sep. 9 NA NA NA BRX340_TRACK47 2016 Sep. 29 NA NA NA BRX342_TRACK46 2016 Sep. 23 2016 Aug. 26 Metastatic BRX343_TRACK49 2016 Oct. 6 2016 Aug. 15 Metastatic TNBC patients BRX167_TRACK01 2016 Feb. 9 2015 Sep. 24 Metastatic BRX213_TRACK07 2016 Mar. 3 NA NA NA BRX279_TRACK20 2016 Apr. 14 2016 Jan. 8 Primary BRX281_TRACK25 2016 Apr. 22 2016 Mar. 6 Metastatic BRX287_TRACK09 2016 Mar. 8 2016 Jan. 28 Metastatic BRX289_TRACK17 2016 Mar. 31 2016 Feb. 9 Metastatic BRX319_TRACK32 2016 May 24 2016 Jul. 14 Metastatic BRX330_TRACK36 2016 Jul. 18 2015 Oct. 13 Metastatic NA BRX332_TRACK38 2016 Jul. 27 2016 Feb. 3 Metastatic NA BRX337_TRACK41 2016 Aug. 11 2016 Aug. 11 Primary BRX341_TRACK45 2016 Aug. 25 2016 May 20 Metastatic BRX345_TRACK50 2016 Sep. 16 2016 May 19 Metastatic indicates data missing or illegible when filed
[0221] However many of the patients (8/20) had only undergone genotyping of their primary tumors, while others had had no genotyping performed (5/20). To noninvasively ascertain ESR1 mutation status in all patients, we established a specific digital PCR mutation assay using CTC-derived RNA template, with probes specific for L536R, Y537C, Y537N, Y537S and D538G, which together account for the majority of ESR1mutations (20, 22). The sensitivity and accuracy of the assay was confirmed by spiking single cells carrying the Y537S mutation into blood samples, followed by microfluidic CTC isolation and ddPCR performed on whole transcriptome-amplified cDNA from the product.
[0222] Using this CTC-based assay, additional 3 patients within our HR+ cohort were found to harbor ESR1 mutations, resulting in a total mutation frequency of 5/20 (25%), a prevalence that is consistent with previous studies of heavily treated metastatic HR+ breast cancer (20) (Table 7). Interestingly, the cases with ESR1 mutations were overlapping but not identical with those expressing the RS gene signature (FIG. 11A).
[0223] Of the 5 cases with an ESR1 mutation, 3 had the RS gene signature reflecting persistent ER signaling, and of 6 women with the RS signature, 3 had an ESR1 mutation. In our HR+ cohort, high RS score at 3-4 weeks after initiation of endocrine therapy, was highly prognostic of both poor survival and faster time to progression (FIGS. 11C-1 and 11C-2). In contrast, presence of an ESR1 mutation showed a trend but did not reach significance as predictive of adverse outcome (FIGS. 11D-1 and 11D-2). Expression of the RS expression signature at pretreatment baseline was not predictive of adverse outcome, suggesting that this signature only emerges as significant variable between responding and resistant patients following the administration of hormonal therapy that suppresses ER signaling within susceptible cancer cells.
[0224] The 17 genes that constitute the breast CTC signature were selected to include multiple tissue-derived and cancer-related transcripts with absent expression in blood cells that contaminate the enriched CTC product. As such, the 6 genes included in the RS sub-signature do not represent canonical ER targets, but their expression is, nonetheless, highly correlated with both ER signaling and resistance to endocrine therapy. Their persistent expression within CTCs after treatment initiation identifies women with greatly reduced response to hormonal therapy and shortened overall survival on treatment. The fact that this CTC signature emerges 3-4 weeks after start of hormonal therapy suggests that it may reflect drug-mediated effects on tumor cells. Initiation of novel ER-targeting therapy should suppress ER signaling in susceptible tumor cells, whereas persistent pathway activity would remain evident in cancer cells in which the drug fails to hit its intended target.
[0225] In addition, in this study, ESR1 mutations were noted at the expected frequency, but they were less predictive of adverse clinical outcome than persistent ER signaling as measured by the CTC expression signature.
Other Embodiments
[0226] It is to be understood that while the invention has been described in conjunction with the detailed description thereof, the foregoing description is intended to illustrate and not limit the scope of the invention, which is defined by the scope of the appended claims. Other aspects, advantages, and modifications are within the scope of the following claims.
Sequence CWU 1
1
423123DNAArtificial SequenceDescription of Artificial Sequence
Synthetic primer 1ctgacagtta gagccgatat cac 23224DNAArtificial
SequenceDescription of Artificial Sequence Synthetic primer
2caattcagtc ttcagcaact tgag 24318DNAArtificial SequenceDescription
of Artificial Sequence Synthetic probe 3aacctgcaga tacagctc
18422DNAArtificial SequenceDescription of Artificial Sequence
Synthetic primer 4ggtggcttta aaatgtcagg aa 22519DNAArtificial
SequenceDescription of Artificial Sequence Synthetic primer
5tgtcgccaag tttgatggt 19619DNAArtificial SequenceDescription of
Artificial Sequence Synthetic probe 6ctgtgtattc ggccaaagc
19723DNAArtificial SequenceDescription of Artificial Sequence
Synthetic primer 7ctctgcattt ttggacatag gag 23821DNAArtificial
SequenceDescription of Artificial Sequence Synthetic primer
8gccttgcact tccattatga c 21916DNAArtificial SequenceDescription of
Artificial Sequence Synthetic probe 9gtactgtcat tcacct
161020DNAArtificial SequenceDescription of Artificial Sequence
Synthetic primer 10gaggcctaca ttctgaacgc 201123DNAArtificial
SequenceDescription of Artificial Sequence Synthetic primer
11gtggttcttt cttttgcctt ctc 231215DNAArtificial SequenceDescription
of Artificial Sequence Synthetic probe 12ctgcatcgtc attct
151320DNAArtificial SequenceDescription of Artificial Sequence
Synthetic primer 13gtttcatcct ccctgtgctg 201420DNAArtificial
SequenceDescription of Artificial Sequence Synthetic primer
14gctccttgat cttccgcttc 201514DNAArtificial SequenceDescription of
Artificial Sequence Synthetic probe 15ctgcttttgt tggt
141618DNAArtificial SequenceDescription of Artificial Sequence
Synthetic primer 16gatgccccac ttgcagta 181721DNAArtificial
SequenceDescription of Artificial Sequence Synthetic primer
17cctcgtaaac tggctaatgg t 211824DNAArtificial SequenceDescription
of Artificial Sequence Synthetic probe 18acctacccca atatatgaag gaaa
241917DNAArtificial SequenceDescription of Artificial Sequence
Synthetic primer 19ctgctgccac aaccagt 172021DNAArtificial
SequenceDescription of Artificial Sequence Synthetic primer
20ttcacatcca tctggtacgt g 212113DNAArtificial SequenceDescription
of Artificial Sequence Synthetic probe 21ctgccgcaaa ttc
132220DNAArtificial SequenceDescription of Artificial Sequence
Synthetic primer 22gatccttatg ccatcaccgt 202322DNAArtificial
SequenceDescription of Artificial Sequence Synthetic primer
23atcagcagag tcaatcagtg ag 222412DNAArtificial SequenceDescription
of Artificial Sequence Synthetic probe 24cagcgttccc gg
122521DNAArtificial SequenceDescription of Artificial Sequence
Synthetic primer 25cctggatgct gacatttctg a 212620DNAArtificial
SequenceDescription of Artificial Sequence Synthetic primer
26tcctccactc atctccaact 202716DNAArtificial SequenceDescription of
Artificial Sequence Synthetic probe 27atcacagagg gagacc
162824DNAArtificial SequenceDescription of Artificial Sequence
Synthetic primer 28caatgtgata ggtactctca gagg 242920DNAArtificial
SequenceDescription of Artificial Sequence Synthetic primer
29tgttccaaag ctcctcacaa 203016DNAArtificial SequenceDescription of
Artificial Sequence Synthetic probe 30agctgctcca ctctga
163118DNAArtificial SequenceDescription of Artificial Sequence
Synthetic primer 31cagccagatg tgttgcca 183221DNAArtificial
SequenceDescription of Artificial Sequence Synthetic primer
32ctgtacggaa tgcgtttctt g 213313DNAArtificial SequenceDescription
of Artificial Sequence Synthetic probe 33cagactccag cgg
133421DNAArtificial SequenceDescription of Artificial Sequence
Synthetic primer 34gctgtgtaca gtcatggatg g 213520DNAArtificial
SequenceDescription of Artificial Sequence Synthetic primer
35gtcttcaggc tcaaacaggt 203618DNAArtificial SequenceDescription of
Artificial Sequence Synthetic probe 36ttctttaggc aatgggca
183717DNAArtificial SequenceDescription of Artificial Sequence
Synthetic primer 37gtgtgctgga cgctgga 173825DNAArtificial
SequenceDescription of Artificial Sequence Synthetic primer
38gtgatacctt gaagcacacc attac 253914DNAArtificial
SequenceDescription of Artificial Sequence Synthetic probe
39gctcgggtga ttct 144022DNAArtificial SequenceDescription of
Artificial Sequence Synthetic primer 40cacatttgag tgaagcttgt cg
224121DNAArtificial SequenceDescription of Artificial Sequence
Synthetic primer 41gcggatgtca aacaagtcaa g 214215DNAArtificial
SequenceDescription of Artificial Sequence Synthetic probe
42aatgaagcca ccaca 154321DNAArtificial SequenceDescription of
Artificial Sequence Synthetic primer 43gaaggagaag atctgccagt g
214419DNAArtificial SequenceDescription of Artificial Sequence
Synthetic primer 44gctgactcct ctgctcaag 194515DNAArtificial
SequenceDescription of Artificial Sequence Synthetic probe
45ccagagtcat catgc 154620DNAArtificial SequenceDescription of
Artificial Sequence Synthetic primer 46ccagtagcct gattgtgcat
204722DNAArtificial SequenceDescription of Artificial Sequence
Synthetic primer 47tgtcagtgat tctgttcaag ga 224819DNAArtificial
SequenceDescription of Artificial Sequence Synthetic probe
48aagagggcat tttggttgt 194919DNAArtificial SequenceDescription of
Artificial Sequence Synthetic primer 49actcttacac cacggctga
195021DNAArtificial SequenceDescription of Artificial Sequence
Synthetic primer 50ccatcaaggc tctgtatcca t 215116DNAArtificial
SequenceDescription of Artificial Sequence Synthetic probe
51aggatcactg tcagga 165222DNAArtificial SequenceDescription of
Artificial Sequence Synthetic primer 52ggatctgagc aggagaaata cc
225324DNAArtificial SequenceDescription of Artificial Sequence
Synthetic primer 53gaattcttca ttcccttgaa ctga 245420DNAArtificial
SequenceDescription of Artificial Sequence Synthetic probe
54gaaaaagaca aattccaaag 205523DNAArtificial SequenceDescription of
Artificial Sequence Synthetic primer 55aagatggaca ggtatgacaa gtc
235623DNAArtificial SequenceDescription of Artificial Sequence
Synthetic primer 56actctttcca catagtcaga tgg 235719DNAArtificial
SequenceDescription of Artificial Sequence Synthetic probe
57atttttaacc cactcctcg 195820DNAArtificial SequenceDescription of
Artificial Sequence Synthetic primer 58tgtcctggct gttcattctg
205920DNAArtificial SequenceDescription of Artificial Sequence
Synthetic primer 59tggatcccta tctcttgcca 206013DNAArtificial
SequenceDescription of Artificial Sequence Synthetic probe
60ctgtccatct cct 136119DNAArtificial SequenceDescription of
Artificial Sequence Synthetic primer 61ggcaattggt ttgaggcaa
196224DNAArtificial SequenceDescription of Artificial Sequence
Synthetic primer 62ggactggata aatgtattca agca 246328DNAArtificial
SequenceDescription of Artificial Sequence Synthetic probe
63tgcaagttat caagaagttt tgtaagtt 286417DNAArtificial
SequenceDescription of Artificial Sequence Synthetic primer
64ctggtggagg agaacgg 176519DNAArtificial SequenceDescription of
Artificial Sequence Synthetic primer 65ggtcgctgga tgaaaggtt
196611DNAArtificial SequenceDescription of Artificial Sequence
Synthetic probe 66agcagctcga a 116719DNAArtificial
SequenceDescription of Artificial Sequence Synthetic primer
67caggcatcgt cagtttcct 196821DNAArtificial SequenceDescription of
Artificial Sequence Synthetic primer 68acacaatgga tctggtgcta a
216916DNAArtificial SequenceDescription of Artificial Sequence
Synthetic probe 69gataggtgct ttgctg 167022DNAArtificial
SequenceDescription of Artificial Sequence Synthetic primer
70gaggagagaa tcaacaaact gc 227121DNAArtificial SequenceDescription
of Artificial Sequence Synthetic primer 71aggttcaggt actccttcca g
217214DNAArtificial SequenceDescription of Artificial Sequence
Synthetic probe 72attgaggcgc acat 147321DNAArtificial
SequenceDescription of Artificial Sequence Synthetic primer
73atacttctgc ttggtgtagg c 217422DNAArtificial SequenceDescription
of Artificial Sequence Synthetic primer 74agccattgta ctctttaacc ca
227515DNAArtificial SequenceDescription of Artificial Sequence
Synthetic probe 75ggagactctg cgaga 157623DNAArtificial
SequenceDescription of Artificial Sequence Synthetic primer
76ccgagaatta cgttcctaca gtg 237722DNAArtificial SequenceDescription
of Artificial Sequence Synthetic primer 77gcggacattg tcatagtaag ga
227816DNAArtificial SequenceDescription of Artificial Sequence
Synthetic probe 78tttgaaatcg acacac 167918DNAArtificial
SequenceDescription of Artificial Sequence Synthetic primer
79ctgccttgct ctccttcc 188022DNAArtificial SequenceDescription of
Artificial Sequence Synthetic primer 80cttactcagc ttgaacttgt cg
228114DNAArtificial SequenceDescription of Artificial Sequence
Synthetic probe 81gccacagatc catg 148219DNAArtificial
SequenceDescription of Artificial Sequence Synthetic primer
82acttccttga tccctgcca 198322DNAArtificial SequenceDescription of
Artificial Sequence Synthetic primer 83gtcttttcaa ccatgtcctc ca
228415DNAArtificial SequenceDescription of Artificial Sequence
Synthetic probe 84tgctgatggt cctca 158517DNAArtificial
SequenceDescription of Artificial Sequence Synthetic primer
85caatgccacc gaagcct 178626DNAArtificial SequenceDescription of
Artificial Sequence Synthetic primer 86cttttatttt catcctcagt gcaaac
268718DNAArtificial SequenceDescription of Artificial Sequence
Synthetic probe 87gagttgaaat ctgaggcc 188821DNAArtificial
SequenceDescription of Artificial Sequence Synthetic primer
88cttgtcactt tcgttcagca g 218918DNAArtificial SequenceDescription
of Artificial Sequence Synthetic primer 89cttcatggtg tgggctca
189012DNAArtificial SequenceDescription of Artificial Sequence
Synthetic probe 90tgcgggtact gg 129121DNAArtificial
SequenceDescription of Artificial Sequence Synthetic primer
91tccttggatg actctcccta c 219221DNAArtificial SequenceDescription
of Artificial Sequence Synthetic primer 92agataccacc tccctgaaga a
219315DNAArtificial SequenceDescription of Artificial Sequence
Synthetic probe 93aggagcggga tggag 159421DNAArtificial
SequenceDescription of Artificial Sequence Synthetic primer
94agaggtttaa tgggctcaca g 219522DNAArtificial SequenceDescription
of Artificial Sequence Synthetic primer 95ctctggtctg tcgtcatgta ag
229615DNAArtificial SequenceDescription of Artificial Sequence
Synthetic probe 96tcaccttctc cacca 159722DNAArtificial
SequenceDescription of Artificial Sequence Synthetic primer
97cacaccacca tacctggata at 229820DNAArtificial SequenceDescription
of Artificial Sequence Synthetic primer 98tcacttgagg ccaagagttc
209915DNAArtificial SequenceDescription of Artificial Sequence
Synthetic probe 99ggtccagcca agttc 1510022DNAArtificial
SequenceDescription of Artificial Sequence Synthetic primer
100ctttcttcag ggtctggtca tt 2210124DNAArtificial
SequenceDescription of Artificial Sequence Synthetic primer
101cttgtcgtct tcggaaatgt tatg 2410215DNAArtificial
SequenceDescription of Artificial Sequence Synthetic probe
102tgactctggg agaaa 1510319DNAArtificial SequenceDescription of
Artificial Sequence Synthetic primer 103gaggcaagtc agcctttct
1910420DNAArtificial SequenceDescription of Artificial Sequence
Synthetic primer 104tgtccatctt gtcgtcttcg 2010515DNAArtificial
SequenceDescription of Artificial Sequence Synthetic probe
105gatgactctg ggaga 1510620DNAArtificial SequenceDescription of
Artificial Sequence Synthetic primer 106gctcaccatg tgtgacttga
2010720DNAArtificial SequenceDescription of Artificial Sequence
Synthetic primer 107tgggagagag acagcttgta 2010815DNAArtificial
SequenceDescription of Artificial Sequence Synthetic probe
108gagagctgca tcagt 1510919DNAArtificial SequenceDescription of
Artificial Sequence Synthetic primer 109gaaagtccac gctcaccat
1911018DNAArtificial SequenceDescription of Artificial Sequence
Synthetic primer 110gcagccttgc tctctagc 1811115DNAArtificial
SequenceDescription of Artificial Sequence Synthetic probe
111gagagctgca tcagt 1511223DNAArtificial SequenceDescription of
Artificial Sequence Synthetic primer 112ctctgcacaa actcttccat ttc
2311320DNAArtificial SequenceDescription of Artificial Sequence
Synthetic primer 113tttcctcgcc cattcttacc 2011417DNAArtificial
SequenceDescription of Artificial Sequence Synthetic probe
114ttacagtgaa gtcctcc
1711521DNAArtificial SequenceDescription of Artificial Sequence
Synthetic primer 115ggaaggaggg aacagaaatc c 2111622DNAArtificial
SequenceDescription of Artificial Sequence Synthetic primer
116gtgagctact ggctgaacta tt 2211719DNAArtificial
SequenceDescription of Artificial Sequence Synthetic probe
117atttgagaag aatggtgga 1911820DNAArtificial SequenceDescription of
Artificial Sequence Synthetic primer 118aggagatgtg ctggattgtc
2011925DNAArtificial SequenceDescription of Artificial Sequence
Synthetic primer 119tctgcatgaa ttatacattg accac
2512014DNAArtificial SequenceDescription of Artificial Sequence
Synthetic probe 120aactgaccac gctg 1412124DNAArtificial
SequenceDescription of Artificial Sequence Synthetic primer
121actgcagaga taagtttagc tgac 2412223DNAArtificial
SequenceDescription of Artificial Sequence Synthetic primer
122tcaccatttt gcttacttcc ttg 2312316DNAArtificial
SequenceDescription of Artificial Sequence Synthetic probe
123ttgttcaaga agccac 1612419DNAArtificial SequenceDescription of
Artificial Sequence Synthetic primer 124catgttgcct acagcctct
1912523DNAArtificial SequenceDescription of Artificial Sequence
Synthetic primer 125tctccaaact tcttcctcat tcc 2312617DNAArtificial
SequenceDescription of Artificial Sequence Synthetic probe
126atcagcaggt tcatgca 1712722DNAArtificial SequenceDescription of
Artificial Sequence Synthetic primer 127gaagatcatc ctgtcagacg ag
2212822DNAArtificial SequenceDescription of Artificial Sequence
Synthetic primer 128cttccgagct agaacctgta tg 2212915DNAArtificial
SequenceDescription of Artificial Sequence Synthetic probe
129tcaactcatt tcggc 1513022DNAArtificial SequenceDescription of
Artificial Sequence Synthetic primer 130gatcagacag tcattcgcaa ag
2213121DNAArtificial SequenceDescription of Artificial Sequence
Synthetic primer 131gacaatcttc cagggactga g 2113215DNAArtificial
SequenceDescription of Artificial Sequence Synthetic probe
132gttcagaggg ttctt 1513318DNAArtificial SequenceDescription of
Artificial Sequence Synthetic primer 133cccaacccag gcatgatg
1813420DNAArtificial SequenceDescription of Artificial Sequence
Synthetic primer 134tcaatgagaa gcaccttggc 2013512DNAArtificial
SequenceDescription of Artificial Sequence Synthetic probe
135tccagcagag ct 1213621DNAArtificial SequenceDescription of
Artificial Sequence Synthetic primer 136tgctggaatg gacaagaact c
2113721DNAArtificial SequenceDescription of Artificial Sequence
Synthetic primer 137gctcatggag attgaactgg t 2113816DNAArtificial
SequenceDescription of Artificial Sequence Synthetic probe
138ccttttggct gtatct 1613921DNAArtificial SequenceDescription of
Artificial Sequence Synthetic primer 139cttactggcg ttttctcatg c
2114023DNAArtificial SequenceDescription of Artificial Sequence
Synthetic primer 140ccaactcttg tagaggtctc aag 2314117DNAArtificial
SequenceDescription of Artificial Sequence Synthetic probe
141gcccactttt cctaggt 1714221DNAArtificial SequenceDescription of
Artificial Sequence Synthetic primer 142ggaccaggga aagataaagc c
2114321DNAArtificial SequenceDescription of Artificial Sequence
Synthetic primer 143gcaaggtaga ttcgtgacag a 2114415DNAArtificial
SequenceDescription of Artificial Sequence Synthetic probe
144aatcccaacc acaaa 1514522DNAArtificial SequenceDescription of
Artificial Sequence Synthetic primer 145cattttgtgg ttgggattct gg
2214618DNAArtificial SequenceDescription of Artificial Sequence
Synthetic primer 146gatgctgtgg atgtggct 1814717DNAArtificial
SequenceDescription of Artificial Sequence Synthetic probe
147atctaccttg ctgctca 1714821DNAArtificial SequenceDescription of
Artificial Sequence Synthetic primer 148gccttgcact tccattatga c
2114923DNAArtificial SequenceDescription of Artificial Sequence
Synthetic primer 149ctctgcattt ttggacatag gag 2315013DNAArtificial
SequenceDescription of Artificial Sequence Synthetic probe
150gaggtcctga ggc 1315122DNAArtificial SequenceDescription of
Artificial Sequence Synthetic primer 151atgtggagtt tacagtgtct gg
2215220DNAArtificial SequenceDescription of Artificial Sequence
Synthetic primer 152agcttctcac tgagtgttgc 2015315DNAArtificial
SequenceDescription of Artificial Sequence Synthetic probe
153cagccaagtg taacc 1515417DNAArtificial SequenceDescription of
Artificial Sequence Synthetic primer 154acggctccca tcctcct
1715522DNAArtificial SequenceDescription of Artificial Sequence
Synthetic primer 155ccactatgtc accatgtacc tg 2215612DNAArtificial
SequenceDescription of Artificial Sequence Synthetic probe
156agaaccagca gc 1215720DNAArtificial SequenceDescription of
Artificial Sequence Synthetic primer 157tgctctgaca acccttatgc
2015821DNAArtificial SequenceDescription of Artificial Sequence
Synthetic primer 158ggctgaggat cactttgtag a 2115915DNAArtificial
SequenceDescription of Artificial Sequence Synthetic probe
159gtctttgctg acatt 1516019DNAArtificial SequenceDescription of
Artificial Sequence Synthetic primer 160catcagcagg accagtagc
1916119DNAArtificial SequenceDescription of Artificial Sequence
Synthetic primer 161tgtctgtgct ccctgatct 1916215DNAArtificial
SequenceDescription of Artificial Sequence Synthetic probe
162agtaccagga ctgct 1516322DNAArtificial SequenceDescription of
Artificial Sequence Synthetic primer 163tcatttggac gtactgactt gg
2216419DNAArtificial SequenceDescription of Artificial Sequence
Synthetic primer 164cttgctccag ctcctgttc 1916513DNAArtificial
SequenceDescription of Artificial Sequence Synthetic probe
165ggttctctgc ctg 1316621DNAArtificial SequenceDescription of
Artificial Sequence Synthetic primer 166ggtgtttggt ctaggatgga g
2116720DNAArtificial SequenceDescription of Artificial Sequence
Synthetic primer 167actgggtttg acttcgtagc 2016816DNAArtificial
SequenceDescription of Artificial Sequence Synthetic probe
168atgctgtatt ttgcac 1616922DNAArtificial SequenceDescription of
Artificial Sequence Synthetic primer 169gtgactctcc tgacatcctt ag
2217021DNAArtificial SequenceDescription of Artificial Sequence
Synthetic primer 170ccatctcatt tcgtcctcca a 2117117DNAArtificial
SequenceDescription of Artificial Sequence Synthetic probe
171acagacatag gcaaagt 1717224DNAArtificial SequenceDescription of
Artificial Sequence Synthetic primer 172actctgaaaa actttggact gatg
2417324DNAArtificial SequenceDescription of Artificial Sequence
Synthetic primer 173tctagcaatc aacagatgag ttct 2417412DNAArtificial
SequenceDescription of Artificial Sequence Synthetic probe
174gagccaaacg cc 1217519DNAArtificial SequenceDescription of
Artificial Sequence Synthetic primer 175agctccttcc agtccgaat
1917621DNAArtificial SequenceDescription of Artificial Sequence
Synthetic primer 176gtctgctcat caatcacctc a 2117717DNAArtificial
SequenceDescription of Artificial Sequence Synthetic probe
177atacccattg tcatcgc 1717823DNAArtificial SequenceDescription of
Artificial Sequence Synthetic primer 178ggacagagag aacaaggatg aac
2317923DNAArtificial SequenceDescription of Artificial Sequence
Synthetic primer 179tgtgggagaa tataggtgga ttg 2318015DNAArtificial
SequenceDescription of Artificial Sequence Synthetic probe
180ctgtgctgga caatg 1518123DNAArtificial SequenceDescription of
Artificial Sequence Synthetic primer 181gctttgacat cagtagacca gag
2318220DNAArtificial SequenceDescription of Artificial Sequence
Synthetic primer 182ctgtccgcag atcagacttg 2018319DNAArtificial
SequenceDescription of Artificial Sequence Synthetic probe
183tcaaaaagtg gaaaggtga 1918419DNAArtificial SequenceDescription of
Artificial Sequence Synthetic primer 184cctggaaaat ggcctcctt
1918521DNAArtificial SequenceDescription of Artificial Sequence
Synthetic primer 185cattgcctac aggaagtctg g 2118617DNAArtificial
SequenceDescription of Artificial Sequence Synthetic probe
186tatgccaaga gtgtgag 1718720DNAArtificial SequenceDescription of
Artificial Sequence Synthetic primer 187ccagaggtaa aggtgccaac
2018822DNAArtificial SequenceDescription of Artificial Sequence
Synthetic primer 188tcccagataa ctgtcatgaa gc 2218919DNAArtificial
SequenceDescription of Artificial Sequence Synthetic probe
189gcagagtaac tacaaaggc 1919022DNAArtificial SequenceDescription of
Artificial Sequence Synthetic primer 190cctcaaatac atcaagcaca gc
2219118DNAArtificial SequenceDescription of Artificial Sequence
Synthetic primer 191ggaagccttc accagcaa 1819213DNAArtificial
SequenceDescription of Artificial Sequence Synthetic probe
192cccaggtggt cca 1319320DNAArtificial SequenceDescription of
Artificial Sequence Synthetic primer 193ttgcaggctt cacatacctt
2019417DNAArtificial SequenceDescription of Artificial Sequence
Synthetic primer 194gcccgacatg cttgagt 1719514DNAArtificial
SequenceDescription of Artificial Sequence Synthetic probe
195ggacaacgac cttt 1419620DNAArtificial SequenceDescription of
Artificial Sequence Synthetic primer 196ctcttgcagc cattcctctt
2019720DNAArtificial SequenceDescription of Artificial Sequence
Synthetic primer 197cccttacccc agtcacttct 2019818DNAArtificial
SequenceDescription of Artificial Sequence Synthetic probe
198cctcttctct cctcccct 1819925DNAArtificial SequenceDescription of
Artificial Sequence Synthetic primer 199tggacagaag acatactcat aaagg
2520018DNAArtificial SequenceDescription of Artificial Sequence
Synthetic primer 200ggtgccagca tgaatccc 1820117DNAArtificial
SequenceDescription of Artificial Sequence Synthetic probe
201tggacctgca gttatca 1720221DNAArtificial SequenceDescription of
Artificial Sequence Synthetic primer 202atcttccctc cattctgctt c
2120322DNAArtificial SequenceDescription of Artificial Sequence
Synthetic primer 203cagttcccac tcactttctc ag 2220412DNAArtificial
SequenceDescription of Artificial Sequence Synthetic probe
204gccaccccac tc 1220519DNAArtificial SequenceDescription of
Artificial Sequence Synthetic primer 205ttttgcacca gtctcgctt
1920619DNAArtificial SequenceDescription of Artificial Sequence
Synthetic primer 206gccgcactga cagtatgag 1920711DNAArtificial
SequenceDescription of Artificial Sequence Synthetic probe
207tgggagccct g 1120818DNAArtificial SequenceDescription of
Artificial Sequence Synthetic primer 208cgactgcgag tgataccg
1820917DNAArtificial SequenceDescription of Artificial Sequence
Synthetic primer 209ctctccacgc actccct 1721013DNAArtificial
SequenceDescription of Artificial Sequence Synthetic probe
210aacagccaca acg 1321118DNAArtificial SequenceDescription of
Artificial Sequence Synthetic primer 211tgccgctcat gttcatgc
1821220DNAArtificial SequenceDescription of Artificial Sequence
Synthetic primer 212caggacacca tgaggaacag 2021310DNAArtificial
SequenceDescription of Artificial Sequence Synthetic probe
213tcccgcttca 1021422DNAArtificial SequenceDescription of
Artificial Sequence Synthetic primer 214aagatgtcag acactgagaa cg
2221517DNAArtificial SequenceDescription of Artificial Sequence
Synthetic primer 215cgaagcccga tgtggtc 1721616DNAArtificial
SequenceDescription of Artificial Sequence Synthetic probe
216agtccaaagc acacga 1621720DNAArtificial SequenceDescription of
Artificial Sequence Synthetic primer 217aggagatgtg ctggattgtc
2021825DNAArtificial SequenceDescription of Artificial Sequence
Synthetic primer 218tctgcatgaa ttatacattg accac
2521914DNAArtificial SequenceDescription of Artificial Sequence
Synthetic probe 219aactgaccac gctg 1422022DNAArtificial
SequenceDescription of Artificial Sequence Synthetic primer
220atgtggagtt tacagtgtct gg 2222120DNAArtificial
SequenceDescription of Artificial Sequence Synthetic primer
221agcttctcac tgagtgttgc 2022215DNAArtificial SequenceDescription
of Artificial Sequence Synthetic probe 222cagccaagtg taacc
1522321DNAArtificial SequenceDescription of Artificial Sequence
Synthetic primer 223gagatctgct tgaatgtgct g 2122422DNAArtificial
SequenceDescription of Artificial Sequence Synthetic primer
224caacagaggt ttttcacagc at 2222515DNAArtificial
SequenceDescription of Artificial Sequence Synthetic probe
225tggcaaggtc cgccc 1522621DNAArtificial SequenceDescription of
Artificial Sequence
Synthetic primer 226catggtaggc tgagatgctt t 2122722DNAArtificial
SequenceDescription of Artificial Sequence Synthetic primer
227gacgataagg agacctgctt tg 2222815DNAArtificial
SequenceDescription of Artificial Sequence Synthetic probe
228tgcaagtcaa gctgc 1522922DNAArtificial SequenceDescription of
Artificial Sequence Synthetic primer 229gcgcattctg gaatttgtac tc
2223021DNAArtificial SequenceDescription of Artificial Sequence
Synthetic primer 230gctatgccaa agtgttcgat g 2123115DNAArtificial
SequenceDescription of Artificial Sequence Synthetic probe
231ggaagagcct cagaa 1523222DNAArtificial SequenceDescription of
Artificial Sequence Synthetic primer 232tgatggatat tctctggatg gc
2223325DNAArtificial SequenceDescription of Artificial Sequence
Synthetic primer 233cctgaatctt tactctctct ccttg
2523425DNAArtificial SequenceDescription of Artificial Sequence
Synthetic probe 234cagtttggta cattctattt cttcc 2523521DNAArtificial
SequenceDescription of Artificial Sequence Synthetic primer
235gcacttcaag ttcaccatca c 2123622DNAArtificial SequenceDescription
of Artificial Sequence Synthetic primer 236accagtttat tgtcaccttc ca
2223717DNAArtificial SequenceDescription of Artificial Sequence
Synthetic probe 237cttgactttc tcccctg 1723828DNAArtificial
SequenceDescription of Artificial Sequence Synthetic primer
238acatctatta ttgctactat tgtgtgtt 2823920DNAArtificial
SequenceDescription of Artificial Sequence Synthetic primer
239tgggagcctc ttctctcttc 2024015DNAArtificial SequenceDescription
of Artificial Sequence Synthetic probe 240attgtcgttg acacc
1524124DNAArtificial SequenceDescription of Artificial Sequence
Synthetic primer 241ttcatttgat aagcacacag tctg 2424222DNAArtificial
SequenceDescription of Artificial Sequence Synthetic primer
242accttgaaca tggcatagtc tg 2224316DNAArtificial
SequenceDescription of Artificial Sequence Synthetic probe
243agtcttccag ttccac 1624419DNAArtificial SequenceDescription of
Artificial Sequence Synthetic primer 244aatcagctcc gcttccttg
1924521DNAArtificial SequenceDescription of Artificial Sequence
Synthetic primer 245tgcttatctc gttgtccttc g 2124614DNAArtificial
SequenceDescription of Artificial Sequence Synthetic probe
246catcatccac atcc 1424722DNAArtificial SequenceDescription of
Artificial Sequence Synthetic primer 247cagaagcgca gaagattgta ag
2224820DNAArtificial SequenceDescription of Artificial Sequence
Synthetic primer 248tctttctgat ctgccatcgc 2024913DNAArtificial
SequenceDescription of Artificial Sequence Synthetic probe
249gtccacaacg gtt 1325018DNAArtificial SequenceDescription of
Artificial Sequence Synthetic primer 250agaagcgagt ccgactgt
1825119DNAArtificial SequenceDescription of Artificial Sequence
Synthetic primer 251cactgcacac catctcaca 1925211DNAArtificial
SequenceDescription of Artificial Sequence Synthetic probe
252gccccaggac g 1125322DNAArtificial SequenceDescription of
Artificial Sequence Synthetic primer 253cagatggagg aggaagattc tg
2225422DNAArtificial SequenceDescription of Artificial Sequence
Synthetic primer 254gtatactgcc tggagttctc tg 2225522DNAArtificial
SequenceDescription of Artificial Sequence Synthetic primer
255ctggttcagg tctccattac ag 2225620DNAArtificial
SequenceDescription of Artificial Sequence Synthetic primer
256gctgtgactc tgagcaagta 2025723DNAArtificial SequenceDescription
of Artificial Sequence Synthetic primer 257tgtcctcctc aatctggttt
atg 2325821DNAArtificial SequenceDescription of Artificial Sequence
Synthetic primer 258gacagaaggg cttggagatt t 2125919DNAArtificial
SequenceDescription of Artificial Sequence Synthetic primer
259cggtggcgtt gtagaagat 1926019DNAArtificial SequenceDescription of
Artificial Sequence Synthetic primer 260agaagatctc tgcctccga
1926122DNAArtificial SequenceDescription of Artificial Sequence
Synthetic primer 261caagatagtt gtggtgggag ac 2226221DNAArtificial
SequenceDescription of Artificial Sequence Synthetic primer
262agggtctctg gtctactgat g 2126319DNAArtificial SequenceDescription
of Artificial Sequence Synthetic primer 263tttggattta ccgcttggg
1926418DNAArtificial SequenceDescription of Artificial Sequence
Synthetic primer 264gactccagtg tgggagag 1826522DNAArtificial
SequenceDescription of Artificial Sequence Synthetic primer
265gggcccacat ataaatcctc ac 2226621DNAArtificial
SequenceDescription of Artificial Sequence Synthetic primer
266ctgctggtca ctgttctcat c 2126717DNAArtificial SequenceDescription
of Artificial Sequence Synthetic primer 267cttcgcggtg tggtgaa
1726818DNAArtificial SequenceDescription of Artificial Sequence
Synthetic primer 268gctgtgtctc ccgtcaaa 1826919DNAArtificial
SequenceDescription of Artificial Sequence Synthetic primer
269ctgggacaca ttgccttct 1927023DNAArtificial SequenceDescription of
Artificial Sequence Synthetic primer 270ccaccatgca ttctttcaat tct
2327122DNAArtificial SequenceDescription of Artificial Sequence
Synthetic primer 271aaacccagtt tgaggagatg ag 2227222DNAArtificial
SequenceDescription of Artificial Sequence Synthetic primer
272ccctgccaat atcttgggta at 2227320DNAArtificial
SequenceDescription of Artificial Sequence Synthetic primer
273acagcaactt ccttgatccc 2027420DNAArtificial SequenceDescription
of Artificial Sequence Synthetic primer 274gcggcatcac tgtctatgaa
2027521DNAArtificial SequenceDescription of Artificial Sequence
Synthetic primer 275ccttgccttc tcttaggctt t 2127619DNAArtificial
SequenceDescription of Artificial Sequence Synthetic primer
276agcagtggtt tcagcatca 1927727DNAArtificial SequenceDescription of
Artificial Sequence Synthetic primer 277cagataactc tcattcagta
ttcttgg 2727824DNAArtificial SequenceDescription of Artificial
Sequence Synthetic primer 278ctctaatgta gcttgacctc atct
2427921DNAArtificial SequenceDescription of Artificial Sequence
Synthetic primer 279gagaagttgg acaagattgg g 2128025DNAArtificial
SequenceDescription of Artificial Sequence Synthetic primer
280gctgagaagt tctgtgaatt cttta 2528123DNAArtificial
SequenceDescription of Artificial Sequence Synthetic primer
281gtttcctcaa ccagtcacat aga 2328223DNAArtificial
SequenceDescription of Artificial Sequence Synthetic primer
282agttgtctag cagtttccac ata 2328320DNAArtificial
SequenceDescription of Artificial Sequence Synthetic primer
283gggaaagcct gtctgaagtg 2028421DNAArtificial SequenceDescription
of Artificial Sequence Synthetic primer 284tcgtagcctc cagggtaata g
2128523DNAArtificial SequenceDescription of Artificial Sequence
Synthetic primer 285gttacaggtc tcctatctac agc 2328618DNAArtificial
SequenceDescription of Artificial Sequence Synthetic primer
286gctcagcctc tctggaag 1828722DNAArtificial SequenceDescription of
Artificial Sequence Synthetic primer 287ctctcttacc ctgattcgga tg
2228817DNAArtificial SequenceDescription of Artificial Sequence
Synthetic primer 288ggcgtctgcc tgtgatt 1728920DNAArtificial
SequenceDescription of Artificial Sequence Synthetic primer
289cctgagttct ggtgccaaag 2029018DNAArtificial SequenceDescription
of Artificial Sequence Synthetic primer 290gggcatgagc agcttcaa
1829119DNAArtificial SequenceDescription of Artificial Sequence
Synthetic primer 291ccactggctt ggtggattt 1929221DNAArtificial
SequenceDescription of Artificial Sequence Synthetic primer
292tcaacagaaa tgcccagagt t 2129318DNAArtificial SequenceDescription
of Artificial Sequence Synthetic primer 293cttctccagc tgggcatt
1829417DNAArtificial SequenceDescription of Artificial Sequence
Synthetic primer 294tgctgtggca gcagatg 1729517DNAArtificial
SequenceDescription of Artificial Sequence Synthetic primer
295cggtcatgtc cgccttc 1729622DNAArtificial SequenceDescription of
Artificial Sequence Synthetic primer 296gcgtttccat tatgtcgttg tc
2229719DNAArtificial SequenceDescription of Artificial Sequence
Synthetic primer 297ccctccttct aggatagcg 1929817DNAArtificial
SequenceDescription of Artificial Sequence Synthetic primer
298aacccggaat gggtgat 1729920DNAArtificial SequenceDescription of
Artificial Sequence Synthetic primer 299aaacggactg atgtcactgg
2030025DNAArtificial SequenceDescription of Artificial Sequence
Synthetic primer 300tggacagaag acatactcat aaagg
2530121DNAArtificial SequenceDescription of Artificial Sequence
Synthetic primer 301cccactgctt caggaaacat a 2130222DNAArtificial
SequenceDescription of Artificial Sequence Synthetic primer
302gtcagacatc ttccctccat tc 2230318DNAArtificial
SequenceDescription of Artificial Sequence Synthetic primer
303gccgcactga cagtatga 1830420DNAArtificial SequenceDescription of
Artificial Sequence Synthetic primer 304cagaaggagc aggactgaaa
2030518DNAArtificial SequenceDescription of Artificial Sequence
Synthetic primer 305agcggcgcct cttatatc 1830622DNAArtificial
SequenceDescription of Artificial Sequence Synthetic primer
306gcgttgaaag agaagacaaa ct 2230718DNAArtificial
SequenceDescription of Artificial Sequence Synthetic primer
307ctactgcaac ggcaacct 1830818DNAArtificial SequenceDescription of
Artificial Sequence Synthetic primer 308gggccatgtt cttgctca
1830919DNAArtificial SequenceDescription of Artificial Sequence
Synthetic primer 309cagactcgct cgctcattt 1931019DNAArtificial
SequenceDescription of Artificial Sequence Synthetic primer
310cctccatgcc cactttctt 1931121DNAArtificial SequenceDescription of
Artificial Sequence Synthetic primer 311cccaagtcag tacgtccaaa t
2131224DNAArtificial SequenceDescription of Artificial Sequence
Synthetic primer 312gcctaattcc cgaataacat caac 2431322DNAArtificial
SequenceDescription of Artificial Sequence Synthetic primer
313gctttaaaga aagtgtttgc tg 2231421DNAArtificial
SequenceDescription of Artificial Sequence Synthetic primer
314ctgtatctgc aggttcgtaa g 2131518DNAArtificial SequenceDescription
of Artificial Sequence Synthetic primer 315aagttccccg tgtgcatc
1831618DNAArtificial SequenceDescription of Artificial Sequence
Synthetic primer 316ctcagcctcc tcgatgaa 1831719DNAArtificial
SequenceDescription of Artificial Sequence Synthetic primer
317gtgaggaggc aaggttctg 1931819DNAArtificial SequenceDescription of
Artificial Sequence Synthetic primer 318ggctccagag agggtagtt
1931919DNAArtificial SequenceDescription of Artificial Sequence
Synthetic primer 319tttggattta ccgcttggg 1932018DNAArtificial
SequenceDescription of Artificial Sequence Synthetic primer
320gactccagtg tgggagag 1832117DNAArtificial SequenceDescription of
Artificial Sequence Synthetic primer 321cttcgcggtg tggtgaa
1732218DNAArtificial SequenceDescription of Artificial Sequence
Synthetic primer 322gctgtgtctc ccgtcaaa 1832321DNAArtificial
SequenceDescription of Artificial Sequence Synthetic primer
323atcctgctgt atcacatcat g 2132421DNAArtificial SequenceDescription
of Artificial Sequence Synthetic primer 324ctgacaggtt tcaaagaacc t
2132518DNAArtificial SequenceDescription of Artificial Sequence
Synthetic primer 325ccagtgcctt tggttgct 1832619DNAArtificial
SequenceDescription of Artificial Sequence Synthetic primer
326caagagccag atgggcaag 1932720DNAArtificial SequenceDescription of
Artificial Sequence Synthetic primer 327tgccaagaga agatgctcac
2032822DNAArtificial SequenceDescription of Artificial Sequence
Synthetic primer 328cattgagtgc caacatgaag ac 2232920DNAArtificial
SequenceDescription of Artificial Sequence Synthetic primer
329aagaagctgc caatagggat 2033018DNAArtificial SequenceDescription
of Artificial Sequence Synthetic primer 330tgtccagaga ggtggatg
1833120DNAArtificial SequenceDescription of Artificial Sequence
Synthetic primer 331tcaatgagaa gcaccttggc 2033222DNAArtificial
SequenceDescription of Artificial Sequence Synthetic primer
332atcagcagag tcaatcagtg ag 2233320DNAArtificial
SequenceDescription of Artificial Sequence Synthetic primer
333gtcttcaggc tcaaacaggt 2033423DNAArtificial SequenceDescription
of Artificial Sequence Synthetic primer 334tctccaaact tcttcctcat
tcc 2333517DNAArtificial SequenceDescription of Artificial Sequence
Synthetic primer 335gtgtgctgga cgctgga 1733621DNAArtificial
SequenceDescription of Artificial Sequence Synthetic primer
336ctgtacggaa tgcgtttctt g 2133724DNAArtificial SequenceDescription
of Artificial Sequence Synthetic primer 337caattcagtc ttcagcaact
tgag
2433820DNAArtificial SequenceDescription of Artificial Sequence
Synthetic primer 338tgttccaaag ctcctcacaa 2033918DNAArtificial
SequenceDescription of Artificial Sequence Synthetic primer
339cccaacccag gcatgatg 1834020DNAArtificial SequenceDescription of
Artificial Sequence Synthetic primer 340gatccttatg ccatcaccgt
2034121DNAArtificial SequenceDescription of Artificial Sequence
Synthetic primer 341gctgtgtaca gtcatggatg g 2134219DNAArtificial
SequenceDescription of Artificial Sequence Synthetic primer
342catgttgcct acagcctct 1934325DNAArtificial SequenceDescription of
Artificial Sequence Synthetic primer 343gtgatacctt gaagcacacc attac
2534418DNAArtificial SequenceDescription of Artificial Sequence
Synthetic primer 344cagccagatg tgttgcca 1834523DNAArtificial
SequenceDescription of Artificial Sequence Synthetic primer
345ctgacagtta gagccgatat cac 2334624DNAArtificial
SequenceDescription of Artificial Sequence Synthetic primer
346caatgtgata ggtactctca gagg 2434720DNAArtificial
SequenceDescription of Artificial Sequence Synthetic probe
347acccggaaac cagcagagct 2034821DNAArtificial SequenceDescription
of Artificial Sequence Synthetic probe 348tcttgtcagc agcgttcccg g
2134927DNAArtificial SequenceDescription of Artificial Sequence
Synthetic probe 349tggctattct tctttaggca atgggca
2735026DNAArtificial SequenceDescription of Artificial Sequence
Synthetic probe 350acatggctta tcagcaggtt catgca
2635123DNAArtificial SequenceDescription of Artificial Sequence
Synthetic probe 351aaagcacctg ctcgggtgat tct 2335222DNAArtificial
SequenceDescription of Artificial Sequence Synthetic probe
352cagcatttgc agactccagc gg 2235327DNAArtificial
SequenceDescription of Artificial Sequence Synthetic probe
353atgcttacga acctgcagat acagctc 2735425DNAArtificial
SequenceDescription of Artificial Sequence Synthetic probe
354atgaacaaca gctgctccac tctga 2535518DNAArtificial
SequenceDescription of Artificial Sequence Synthetic probe
355aacctgcaga tacagctc 1835617DNAArtificial SequenceDescription of
Artificial Sequence Synthetic probe 356cctttctcct gatggcc
1735719DNAArtificial SequenceDescription of Artificial Sequence
Synthetic probe 357gtccaagaga gctcagtct 1935816DNAArtificial
SequenceDescription of Artificial Sequence Synthetic probe
358caaagtaccc gcactg 1635915DNAArtificial SequenceDescription of
Artificial Sequence Synthetic probe 359ccaaggtcca agcct
1536012DNAArtificial SequenceDescription of Artificial Sequence
Synthetic probe 360cagcgttccc gg 1236117DNAArtificial
SequenceDescription of Artificial Sequence Synthetic probe
361atacccattg tcatcgc 1736216DNAArtificial SequenceDescription of
Artificial Sequence Synthetic probe 362atcacagagg gagacc
1636315DNAArtificial SequenceDescription of Artificial Sequence
Synthetic probe 363ctgtgctgga caatg 1536414DNAArtificial
SequenceDescription of Artificial Sequence Synthetic probe
364cctgggcacg atgc 1436517DNAArtificial SequenceDescription of
Artificial Sequence Synthetic probe 365actcctctga ccacacc
1736628DNAArtificial SequenceDescription of Artificial Sequence
Synthetic probe 366tgcaagttat caagaagttt tgtaagtt
2836716DNAArtificial SequenceDescription of Artificial Sequence
Synthetic probe 367atgctgtatt ttgcac 1636823DNAArtificial
SequenceDescription of Artificial Sequence Synthetic probe
368ttttaaccac catgcattct ttc 2336913DNAArtificial
SequenceDescription of Artificial Sequence Synthetic probe
369ggttctctgc ctg 1337013DNAArtificial SequenceDescription of
Artificial Sequence Synthetic probe 370gaggtcctga ggc
1337115DNAArtificial SequenceDescription of Artificial Sequence
Synthetic probe 371tgctgatggt cctca 1537212DNAArtificial
SequenceDescription of Artificial Sequence Synthetic probe
372gagccaaacg cc 1237313DNAArtificial SequenceDescription of
Artificial Sequence Synthetic probe 373cccaggtggt cca
1337412DNAArtificial SequenceDescription of Artificial Sequence
Synthetic probe 374cggtggcatt gg 1237514DNAArtificial
SequenceDescription of Artificial Sequence Synthetic probe
375ggacaacgac cttt 1437612DNAArtificial SequenceDescription of
Artificial Sequence Synthetic probe 376gccaccccac tc
1237716DNAArtificial SequenceDescription of Artificial Sequence
Synthetic probe 377cccaatgata aggagg 1637823DNAArtificial
SequenceDescription of Artificial Sequence Synthetic primer
378ctgacagtta gagccgatat cac 2337924DNAArtificial
SequenceDescription of Artificial Sequence Synthetic primer
379caattcagtc ttcagcaact tgag 2438021DNAArtificial
SequenceDescription of Artificial Sequence Synthetic primer
380gtttgtcctc ctcaatctgg t 2138123DNAArtificial SequenceDescription
of Artificial Sequence Synthetic primer 381gtgatatcgg ctctaactgt
cag 2338217DNAArtificial SequenceDescription of Artificial Sequence
Synthetic primer 382tcagcagcct ctctcca 1738322DNAArtificial
SequenceDescription of Artificial Sequence Synthetic primer
383gggcaagatt tgaattcgat ca 2238420DNAArtificial
SequenceDescription of Artificial Sequence Synthetic primer
384gctacagcga cgtgaagaag 2038518DNAArtificial SequenceDescription
of Artificial Sequence Synthetic primer 385gacctcggta cctggaca
1838617DNAArtificial SequenceDescription of Artificial Sequence
Synthetic primer 386tcgatgtggc cctggag 1738719DNAArtificial
SequenceDescription of Artificial Sequence Synthetic primer
387ttccgctcat cttgctcag 1938822DNAArtificial SequenceDescription of
Artificial Sequence Synthetic primer 388atcagcagag tcaatcagtg ag
2238920DNAArtificial SequenceDescription of Artificial Sequence
Synthetic primer 389gatccttatg ccatcaccgt 2039019DNAArtificial
SequenceDescription of Artificial Sequence Synthetic primer
390agctccttcc agtccgaat 1939121DNAArtificial SequenceDescription of
Artificial Sequence Synthetic primer 391gtctgctcat caatcacctc a
2139220DNAArtificial SequenceDescription of Artificial Sequence
Synthetic primer 392tcctccactc atctccaact 2039321DNAArtificial
SequenceDescription of Artificial Sequence Synthetic primer
393cctggatgct gacatttctg a 2139423DNAArtificial SequenceDescription
of Artificial Sequence Synthetic primer 394ggacagagag aacaaggatg
aac 2339523DNAArtificial SequenceDescription of Artificial Sequence
Synthetic primer 395tgtgggagaa tataggtgga ttg 2339626DNAArtificial
SequenceDescription of Artificial Sequence Synthetic primer
396ggattaagtt cataagattc catgct 2639723DNAArtificial
SequenceDescription of Artificial Sequence Synthetic primer
397cttcggcttt gatatcgttt cag 2339823DNAArtificial
SequenceDescription of Artificial Sequence Synthetic primer
398gacaacaacc accttcaata cac 2339919DNAArtificial
SequenceDescription of Artificial Sequence Synthetic primer
399agatccagga ccgatggtt 1940024DNAArtificial SequenceDescription of
Artificial Sequence Synthetic primer 400ggactggata aatgtattca agca
2440119DNAArtificial SequenceDescription of Artificial Sequence
Synthetic primer 401ggcaattggt ttgaggcaa 1940221DNAArtificial
SequenceDescription of Artificial Sequence Synthetic primer
402ggtgtttggt ctaggatgga g 2140320DNAArtificial SequenceDescription
of Artificial Sequence Synthetic primer 403actgggtttg acttcgtagc
2040421DNAArtificial SequenceDescription of Artificial Sequence
Synthetic primer 404cagtgcttgc agttcaaaca g 2140524DNAArtificial
SequenceDescription of Artificial Sequence Synthetic primer
405ccagtagaag gtttttggat tgtc 2440622DNAArtificial
SequenceDescription of Artificial Sequence Synthetic primer
406tcatttggac gtactgactt gg 2240719DNAArtificial
SequenceDescription of Artificial Sequence Synthetic primer
407cttgctccag ctcctgttc 1940821DNAArtificial SequenceDescription of
Artificial Sequence Synthetic primer 408gcaacaagtg actgagacct a
2140920DNAArtificial SequenceDescription of Artificial Sequence
Synthetic primer 409gtccacacac tcatgctgat 2041022DNAArtificial
SequenceDescription of Artificial Sequence Synthetic primer
410gtcttttcaa ccatgtcctc ca 2241119DNAArtificial
SequenceDescription of Artificial Sequence Synthetic primer
411acttccttga tccctgcca 1941224DNAArtificial SequenceDescription of
Artificial Sequence Synthetic primer 412actctgaaaa actttggact gatg
2441324DNAArtificial SequenceDescription of Artificial Sequence
Synthetic primer 413tctagcaatc aacagatgag ttct 2441422DNAArtificial
SequenceDescription of Artificial Sequence Synthetic primer
414cctcaaatac atcaagcaca gc 2241518DNAArtificial
SequenceDescription of Artificial Sequence Synthetic primer
415ggaagccttc accagcaa 1841624DNAArtificial SequenceDescription of
Artificial Sequence Synthetic primer 416gagatgctta agtgtgacaa gttc
2441722DNAArtificial SequenceDescription of Artificial Sequence
Synthetic primer 417cctcagattt caactcgttg tc 2241820DNAArtificial
SequenceDescription of Artificial Sequence Synthetic primer
418ttgcaggctt cacatacctt 2041917DNAArtificial SequenceDescription
of Artificial Sequence Synthetic primer 419gcccgacatg cttgagt
1742021DNAArtificial SequenceDescription of Artificial Sequence
Synthetic primer 420atcttccctc cattctgctt c 2142122DNAArtificial
SequenceDescription of Artificial Sequence Synthetic primer
421cagttcccac tcactttctc ag 2242219DNAArtificial
SequenceDescription of Artificial Sequence Synthetic primer
422ccgacaacct caagtgctg 1942322DNAArtificial SequenceDescription of
Artificial Sequence Synthetic primer 423gctggggaaa gttaatgttc ac
22
D00000
D00001
D00002
D00003
D00004
D00005
D00006
D00007
D00008
D00009
D00010
D00011
D00012
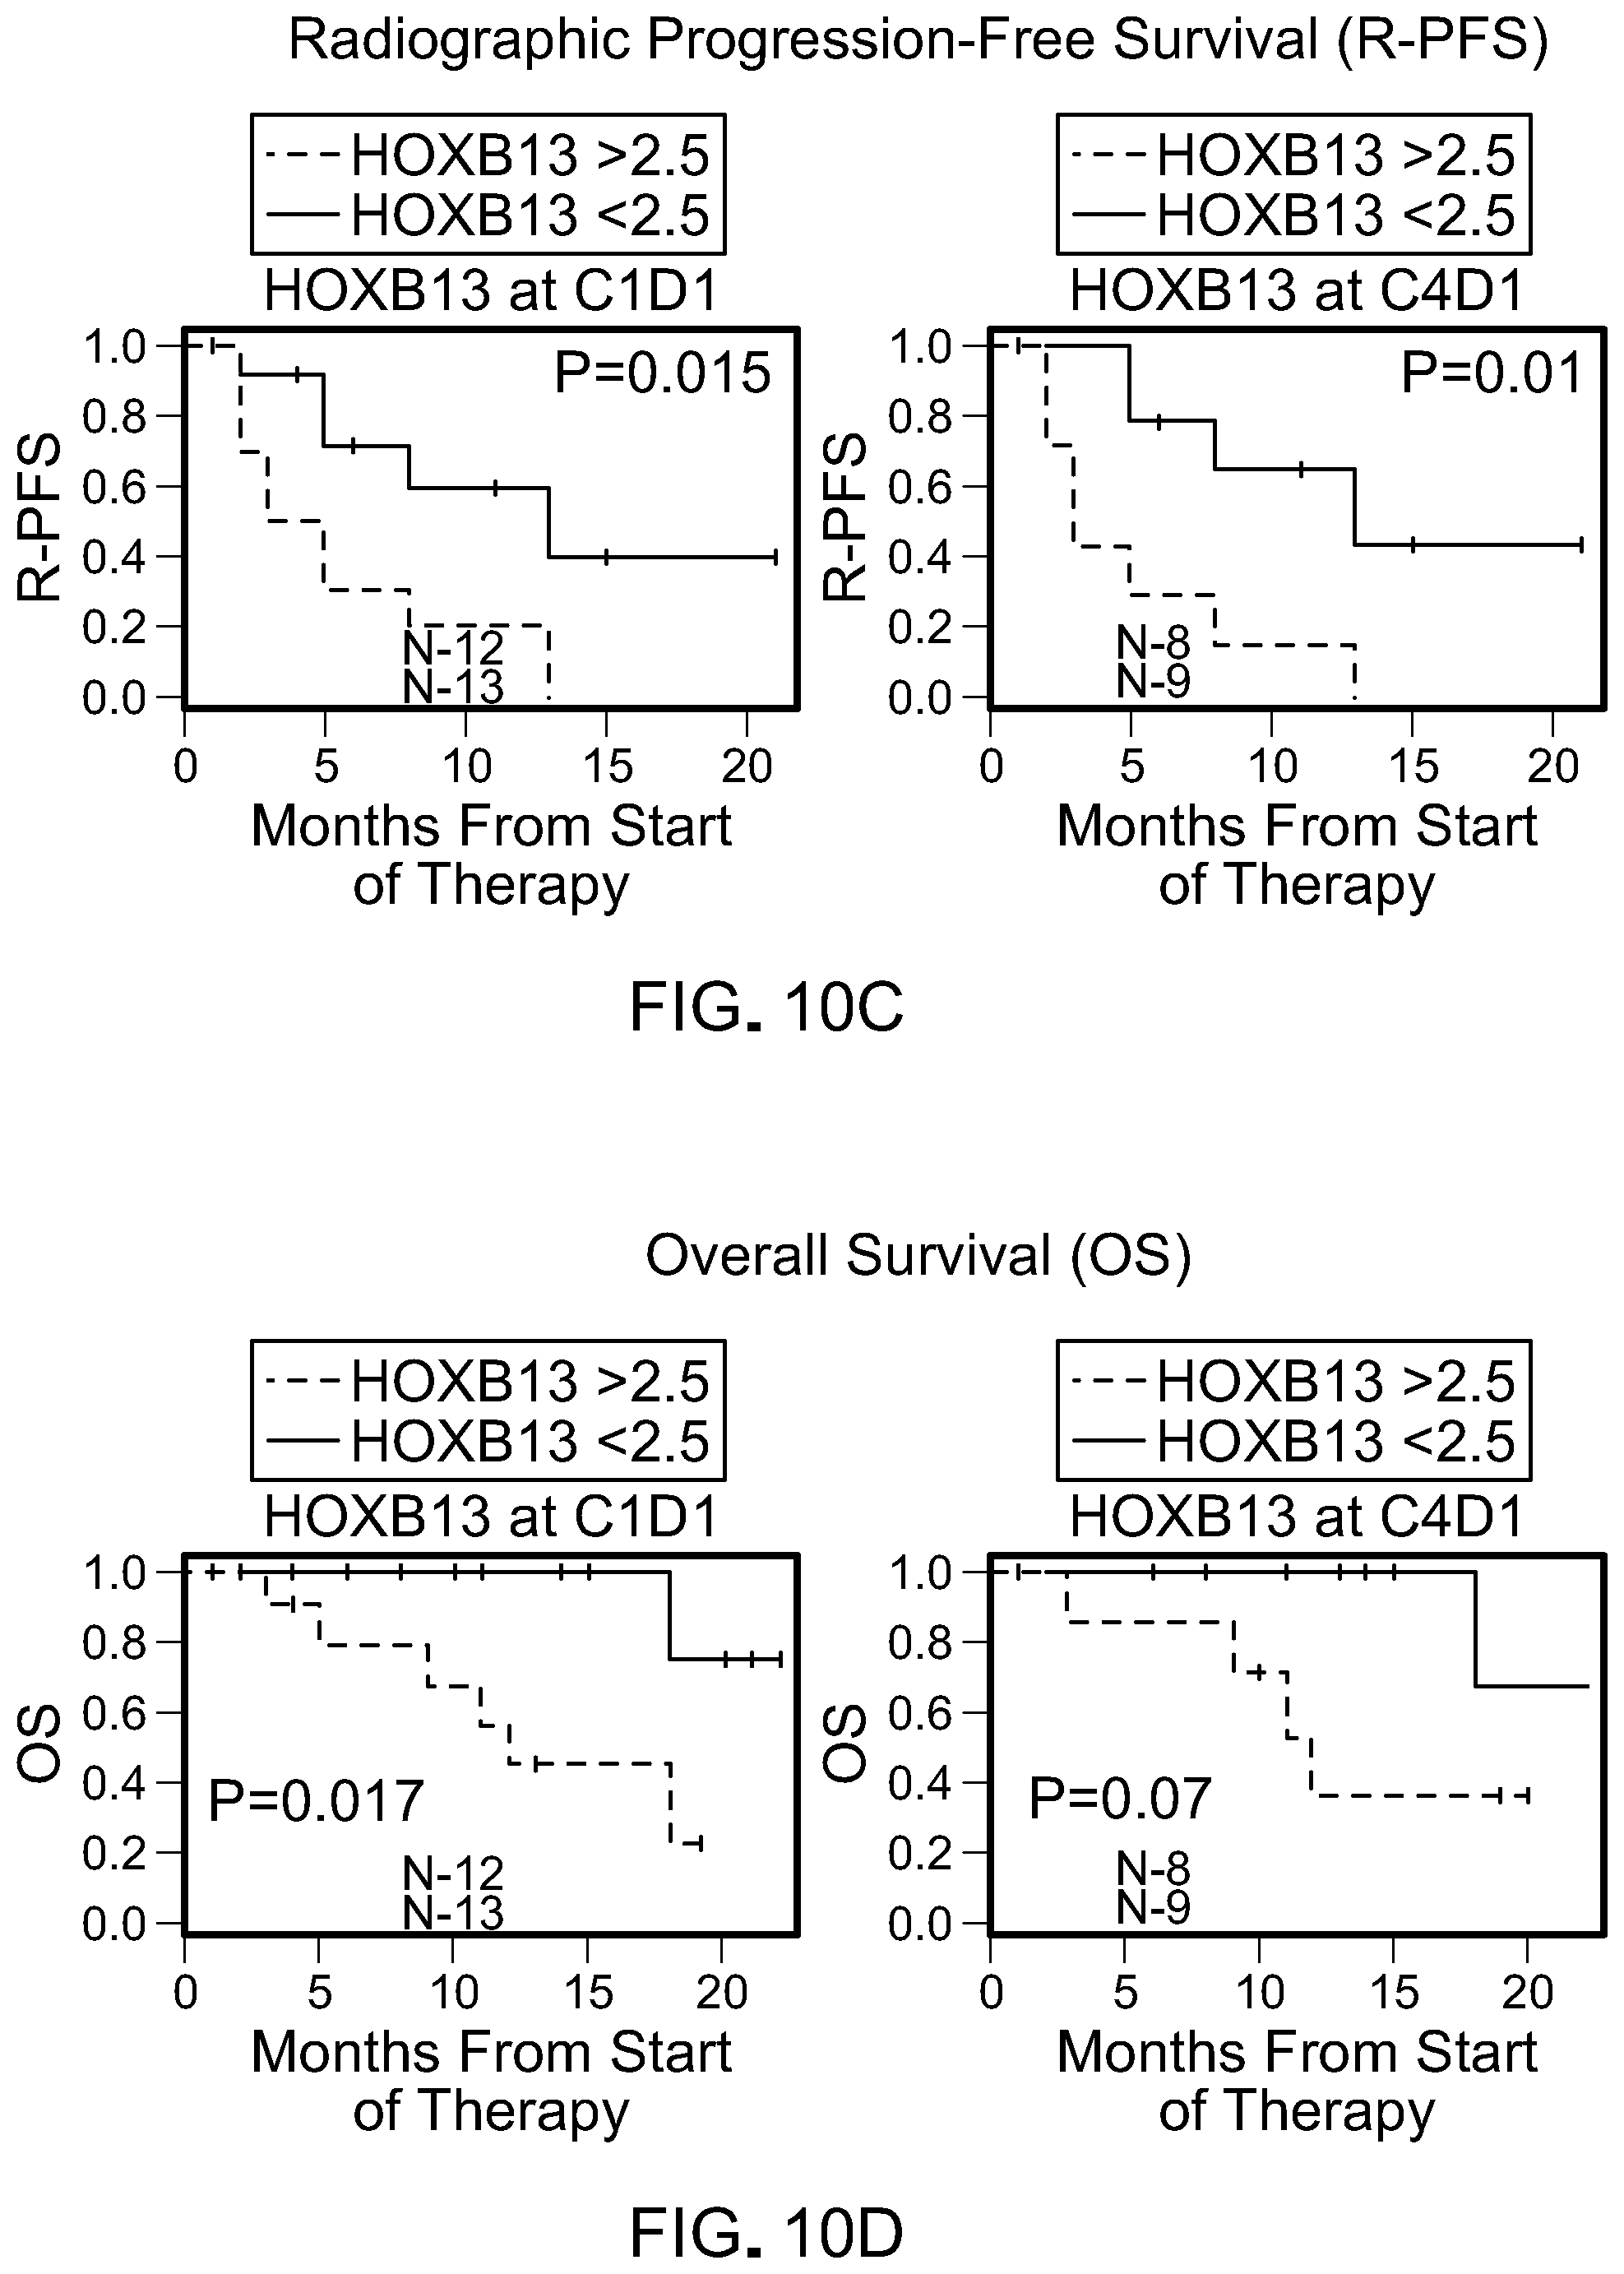
D00013
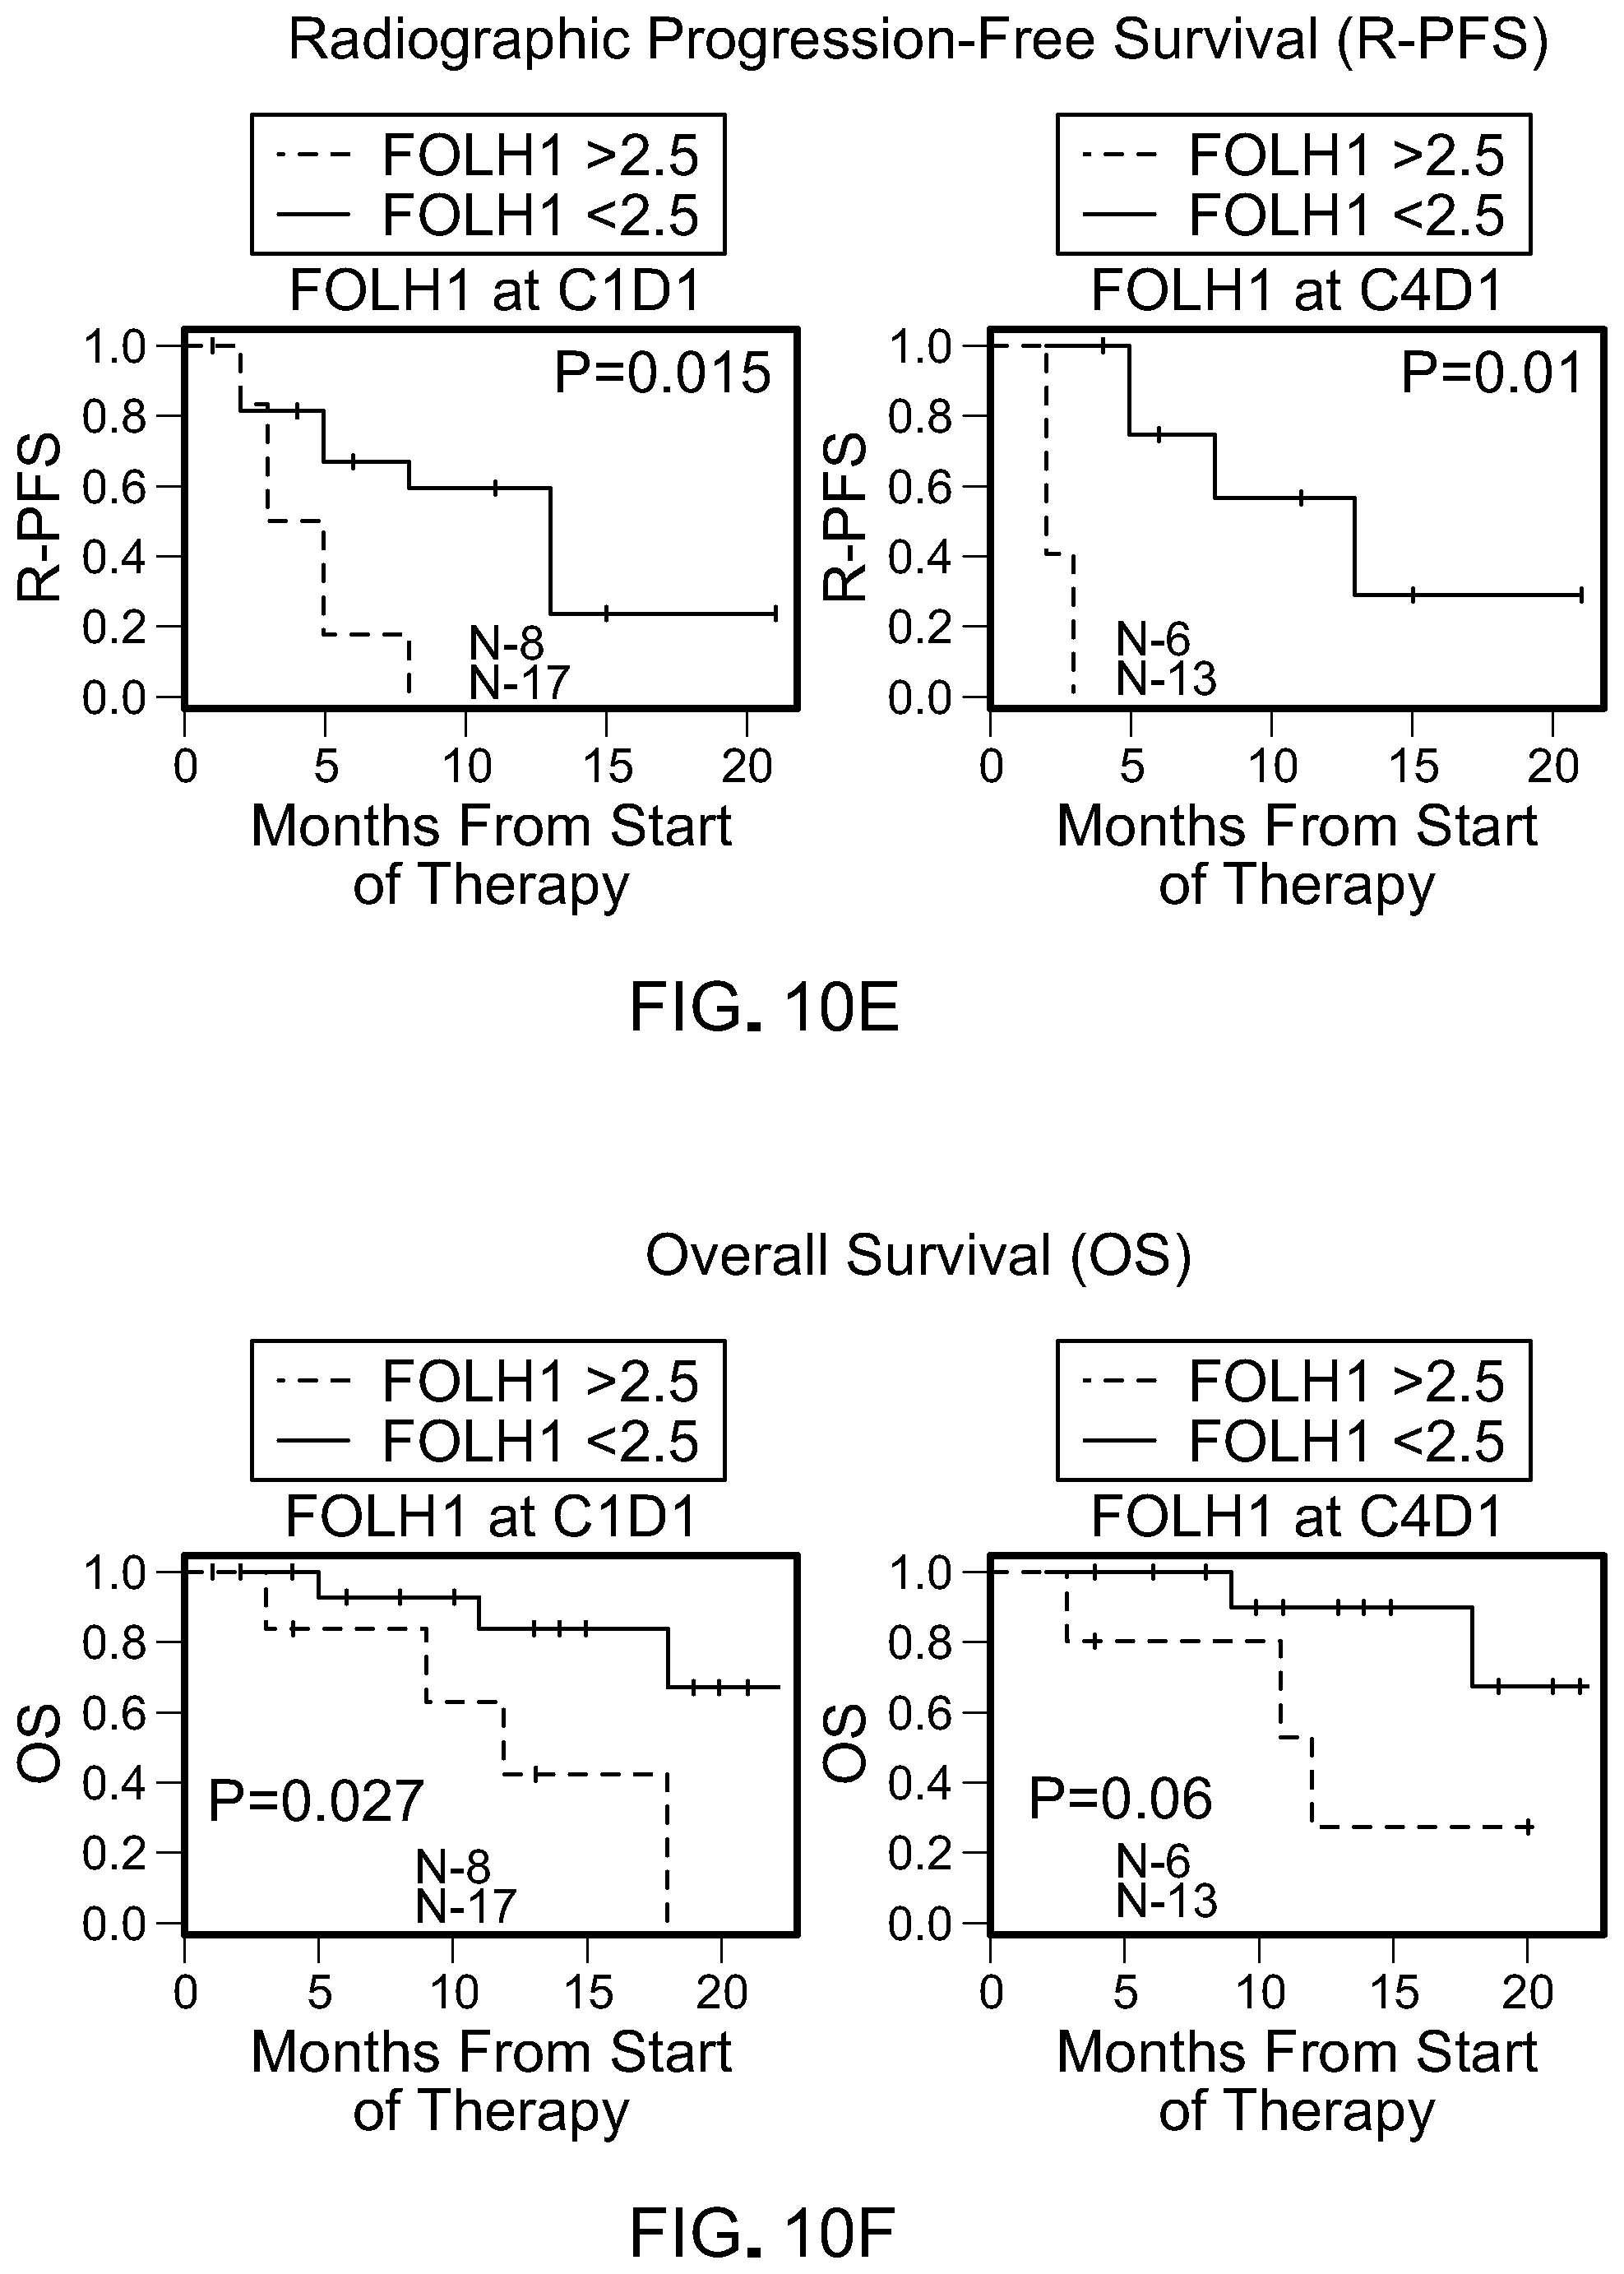
D00014

D00015

D00016

P00899

S00001
XML
uspto.report is an independent third-party trademark research tool that is not affiliated, endorsed, or sponsored by the United States Patent and Trademark Office (USPTO) or any other governmental organization. The information provided by uspto.report is based on publicly available data at the time of writing and is intended for informational purposes only.
While we strive to provide accurate and up-to-date information, we do not guarantee the accuracy, completeness, reliability, or suitability of the information displayed on this site. The use of this site is at your own risk. Any reliance you place on such information is therefore strictly at your own risk.
All official trademark data, including owner information, should be verified by visiting the official USPTO website at www.uspto.gov. This site is not intended to replace professional legal advice and should not be used as a substitute for consulting with a legal professional who is knowledgeable about trademark law.