High Strength Steel Alloys With Ductility Characteristics
BRANAGAN; Daniel James ; et al.
U.S. patent application number 16/415208 was filed with the patent office on 2019-12-19 for high strength steel alloys with ductility characteristics. The applicant listed for this patent is The NanoSteel Company, Inc.. Invention is credited to Scott T. ANDERSON, Daniel James BRANAGAN, Sheng CHENG, Kurtis CLARK, Andrew E. FRERICHS, Taylor L. GIDDENS, Grant G. JUSTICE, Scott LARISH, Brian E. MEACHAM, Alla V. SERGUEEVA, Logan J. TEW.
| Application Number | 20190382875 16/415208 |
| Document ID | / |
| Family ID | 68839597 |
| Filed Date | 2019-12-19 |


View All Diagrams
| United States Patent Application | 20190382875 |
| Kind Code | A1 |
| BRANAGAN; Daniel James ; et al. | December 19, 2019 |
High Strength Steel Alloys With Ductility Characteristics
Abstract
A new class of advanced high strength steel alloys with ductility characteristics such as high impact toughness and improved resistance to penetration, crack resistance and crack propagation.
| Inventors: | BRANAGAN; Daniel James; (Idaho Falls, ID) ; FRERICHS; Andrew E.; (Idaho Falls, ID) ; MEACHAM; Brian E.; (Idaho Falls, ID) ; JUSTICE; Grant G.; (Idaho Falls, ID) ; CLARK; Kurtis; (Idaho Falls, ID) ; TEW; Logan J.; (Idaho Falls, ID) ; ANDERSON; Scott T.; (Idaho Falls, ID) ; LARISH; Scott; (Idaho Falls, ID) ; CHENG; Sheng; (Idaho Falls, ID) ; GIDDENS; Taylor L.; (White, GA) ; SERGUEEVA; Alla V.; (Idaho Falls, ID) | ||||||||||
| Applicant: |
|
||||||||||
|---|---|---|---|---|---|---|---|---|---|---|---|
| Family ID: | 68839597 | ||||||||||
| Appl. No.: | 16/415208 | ||||||||||
| Filed: | May 17, 2019 |
Related U.S. Patent Documents
| Application Number | Filing Date | Patent Number | ||
|---|---|---|---|---|
| 62684869 | Jun 14, 2018 | |||
| Current U.S. Class: | 1/1 |
| Current CPC Class: | C22C 38/02 20130101; C22C 38/58 20130101; C22C 38/08 20130101; C22C 38/38 20130101; C21D 8/0247 20130101; C22C 38/36 20130101; C21D 8/0236 20130101; C21D 9/46 20130101; C21D 8/0205 20130101; C22C 38/56 20130101; C21D 8/0226 20130101; C22C 38/42 20130101; C22C 38/34 20130101; C22C 38/16 20130101; C22C 38/06 20130101; C22C 38/04 20130101 |
| International Class: | C22C 38/58 20060101 C22C038/58; C22C 38/04 20060101 C22C038/04; C22C 38/06 20060101 C22C038/06; C22C 38/02 20060101 C22C038/02; C22C 38/42 20060101 C22C038/42; C22C 38/08 20060101 C22C038/08; C22C 38/16 20060101 C22C038/16; C22C 38/36 20060101 C22C038/36; C22C 38/56 20060101 C22C038/56; C22C 38/38 20060101 C22C038/38; C22C 38/34 20060101 C22C038/34; C21D 9/46 20060101 C21D009/46; C21D 8/02 20060101 C21D008/02 |
Claims
1. A method to achieve a strength/ductility characteristic in a metal comprising: a. supplying a metal alloy comprising at least 70 atomic percent Fe, at least 9.0 atomic percent Mn, at least 0.4 atomic percent Al, and at least two elements selected from Cr, Si or C, melting and cooling at a rate of .ltoreq.250 K/s to a thickness of 25.0 mm to 500.0 mm; b. processing said alloy into sheet by heating and reducing said thickness to form to a thickness of 1.5 mm to 8.0 mm wherein the sheet exhibits an ultimate tensile strength (TS) of 650 MPa to 1500 MPa, a yield strength (YS) at 0.2% offset of 200 MPa to 1,000 MPa and an elongation (E) from 10% to 70%, wherein the alloy further indicates a strength ductility product (TS.times.E) in the range of 15,000 MPa % to 75,000 MPa %.
2. The method of claim 1 wherein the alloy in (a) contains 70 to 80 at. % Fe, 9.0 to 17.0 at. % Mn, and 0.4 to 6.7 at. % Al.
3. The method of claim 1 wherein Cr is selected and is present at a level of 0.2 at. % to 6.3 at. %.
4. The method of claim 1 wherein Si is selected and is present at a level of 0.3 at. % to 6.3 at. %.
5. The method of claim 1 wherein C is selected and is present at a level of 0.3 at. % to 2.7 at. %.
6. The method of claim 1 wherein said alloy is substantially free of nickel and copper such that nickel and copper are present at a level of 0 to 5000 ppm.
7. The method of claim 1 wherein the alloy in (a) indicates a solidus temperature from 1300.degree. C. to 1450.degree. C., a liquidus temperature from 1400.degree. C. to 1550.degree. C., and a liquidus to solidus gap from 30.degree. C. to 150.degree. C.
8. The method of claim 1 wherein the alloy sheet in (b) has a density from 7.3 g/cm3 to 7.9 g/cm3.
9. The method of claim 1 wherein said alloy sheet in (b) indicates an area under a stress-strain curve up to fracture in the range of from 150 to 600 N/mm2.
10. The method of claim 1 wherein the alloy sheet in (b) exhibits a Charpy V-notched toughness of 10 J to 150 J.
11. The method of claim 1 wherein the alloy sheet in (b) exhibits a thickness normalized Charpy V-Notched toughness from 5 to 25 J/mm.
12. The method of claim 1 wherein the alloy sheet in (b) exhibits a bulk fracture toughness from 10 to 400 J.
13. The method of claim 1 wherein the alloy sheet in (b) exhibits a thickness normalized bulk fracture toughness from 5 to 50 J/mm.
14. The method of claim 1 wherein the alloy sheet in (b) exhibits a drop impact toughness of 100 J to 1250 J.
15. The method of claim 1 wherein the alloy sheet in (b) exhibits a thickness normalized drop impact toughness from 75 J/mm to 160 J/mm.
16. The method of claim 1 wherein said alloy sheet in (b) is positioned in a storage tank, freight car, or railway tank car.
17. The method of claim 1 wherein said alloy sheet formed in (b) is positioned in a vehicular frame, vehicular chassis, or vehicular panel.
18. A method to achieve a strength/ductility characteristic in a metal comprising: a. supplying a metal alloy comprising at least 70 atomic percent Fe, at least 9.0 atomic percent Mn, at least 0.4 atomic percent Al, and at least two elements selected from Cr, Si or C, melting and cooling at a rate of .ltoreq.250 K/s to a thickness of 25.0 mm to 500.0 mm; b. processing said alloy into sheet by heating and reducing said thickness to form to a thickness of 1.5 mm to 8.0 mm; c. processing said alloy into sheet by reducing said thickness without heating to form to a thickness of 0.5 mm to 3.0 mm wherein the sheet exhibits an ultimate tensile strength (TS) of 650 MPa to 1500 MPa, a yield strength (YS) at 0.2% offset of 200 MPa to 1000 MPa and an elongation (E) from 10.0% to 90.0%, wherein the alloy further indicates a strength ductility product (TS.times.E) in the range of 10,000 MPa % to 80,000 MPa %.
19. The method of claim 18 wherein the alloy in (a) contains 70 to 80 at. % Fe, 9.0 to 17.0 at. % Mn, and 0.4 to 6.7 at. % Al.
20. The method of claim 18 wherein Cr is selected and is present at a level of 0.2 at. % to 6.3 at. %.
21. The method of claim 18 wherein Si is selected and is present at a level of 0.3 at. % to 6.3 at. %.
22. The method of claim 18 wherein C is selected and is present at a level of 0.3 at. % to 2.7 at. %.
23. The method of claim 18 wherein said alloy is substantially free of nickel and copper such that nickel and copper are present at a level of 0 to 5000 ppm.
24. The method of claim 18 wherein the alloy in (a) indicates a solidus temperature from 1300.degree. C. to 1450.degree. C., a liquidus temperature from 1400.degree. C. to 1550.degree. C., and a liquidus to solidus gap from 30.degree. C. to 150.degree. C.
25. The method of claim 18 wherein the alloy sheet in (b) has a density from 7.3 g/cm3 to 7.9 g/cm3.
26. The method of claim 18 wherein the alloy sheet in (c) may be annealed from 600.degree. C. up to the solidus temperature.
27. The method of claim 18 wherein said alloy sheet in (c) indicates an area under a stress-strain curve up to fracture in the range of from 100 to 700 N/mm2.
28. The method of claim 18 wherein the alloy sheet in (c) exhibits a Charpy V-Notched toughness of 0.5 to 75 J.
29. The method of claim 18 wherein the alloy sheet in (c) exhibits a thickness normalized Charpy V-Notched toughness from 0.5 J/mm to 25 J/mm.
30. The method of claim 18 wherein the impacted alloy sheet in (c) exhibits a bulk fracture toughness from 2 J to 175 J.
31. The method of claim 18 wherein the alloy sheet in (c) exhibits a thickness normalized bulk fracture toughness from 1 to 60 J/mm.
32. The method of claim 18 wherein the impacted alloy sheet in (c) exhibits a drop impact toughness of 40 J to 700 J.
33. The method of claim 18 wherein the alloy sheet in (c) exhibits a thickness normalized drop impact toughness from 75 J/mm to 250 J/mm.
34. The method of claim 18 wherein said alloy sheet in (c) is positioned in a storage tank, freight car, or railway tank car.
35. The method of claim 18 wherein said alloy sheet formed in (c) is positioned in a vehicular frame, vehicular chassis, or vehicular panel.
Description
CROSS REFERENCE TO RELATED APPLICATIONS
[0001] This application claims the benefit of U.S. Provisional Application 62/684,869 filed Jun. 14, 2018 which is fully incorporated herein by reference.
FIELD OF INVENTION
[0002] This application deals with a new class of advanced high strength steel alloys with ductility characteristics such as high impact toughness and improved resistance to penetration, crack initiation and crack propagation.
BACKGROUND
[0003] Toughness as an engineering property can be thought of as the work energy needed to cause failure in a material. The higher the work required to cause failure by a method, the higher the toughness of the material. Toughness in materials is becoming increasingly important across many sectors, especially where tough materials can be used to improve safety. In the automotive industry, relatively high toughness materials are seeing use in so-called crumple zones to reduce the energy that enters the passenger compartment during a collision. Using relatively high toughness materials, gauge thicknesses can be reduced in automobiles in parts where energy absorption is needed to protect passengers, increasing fuel efficiency without compromising safety. These relatively high toughness materials can also be used for road barriers to keep out-of-control vehicles from leaving the roadway or entering the opposing traffic by absorbing energy from the vehicle and safely stopping it. The automotive industry is not alone in the need for relatively high toughness materials, however. The safety of cargo transported overland by rail and on waterways by ships can also be improved with relatively high toughness materials. In recent years, several high-profile incidents where cargo vessels were damaged during collisions or derailments have occurred that have resulted in significant loss of life, property, and cargo. New regulations have been introduced to lessen the probability and impact of such events, and the use of relatively high toughness materials to ensure improved cargo containment is one option available. By increasing the toughness of materials for these shipping containers, cargo can be kept inside the container during such an event and will reduce environmental impact and loss of life or property damage that could result from wayward cargo. Relatively high toughness materials therefore provide many industries the opportunity to improve fuel and cargo efficiency while maintaining or improving safety.
[0004] Advanced High Strength Steels (AHSS's) are those classes of materials whose mechanical properties are superior to the conventional steels. Conventional mild steel has a relatively simple ferritic microstructure; it typically has relatively low carbon content and minimal alloying elements, is readily formed, and is especially sought for its ductility. Widely produced and used, mild steel often serves as a baseline for comparison of other materials. Conventional low- to high-strength steels include IF (interstitial free), BH (bake hardened), and HSLA (high-strength low-alloy). These steels generally have a yield strength of less than 550 MPa and ductility that decreases with increased strength. Higher strength steels are more complex and include such grades as dual phase (DP), complex phase (CP) and transformation induced plasticity (TRIP) steels. The development of advanced high strengths steel has been a challenge since increased strength often results in reduced ductility, cold formability, and toughness.
[0005] Toughness can be measured by a variety of methods, with each method characterizing a material response to a specific condition. Methods to characterize toughness include tensile testing, bulk fracture testing, and Charpy impact testing including V-notched and un-notched specimen geometries. Tensile testing is one of the most widely used methods for mechanical properties evaluation and generally performed by applying load to a sample with a reduced section by a moving crosshead until the sample fails. The displacement rate of the crosshead in tensile testing is generally kept constant or near constant, resulting in a relatively narrow range of strain rates throughout the test. Tensile testing can provide a measure of toughness by calculating the integral of the engineering stress -engineering strain curve and is related to the work required to break the sample in tension and estimated by multiplying the ultimate tensile strength by the total elongation (strength-ductility product). Toughness requirements are unique for each application and a selection of testing method depends on where the application is likely to see failure in a manner similar to particular test condition.
SUMMARY
[0006] A method to achieve a strength/ductility characteristic in a metal comprising:
[0007] a. supplying a metal alloy comprising at least 70 atomic percent Fe, at least 9.0 atomic percent Mn, at least 0.4 atomic percent Al, and at least two elements selected from Cr, Si or C, melting and cooling at a rate of .ltoreq.250 K/s to a thickness of 25.0 mm to 500.0 mm;
[0008] b. processing said alloy into sheet by heating and reducing said thickness to form to a thickness of 1.5 mm to 8.0 mm wherein the sheet exhibits an ultimate tensile strength (TS) of 650 MPa to 1500 MPa, a yield strength (YS) at 0.2% offset of 200 MPa to 1,000 MPa and an elongation (E) from 10% to 70%, wherein the alloy further indicates a strength ductility product (TS.times.E) in the range of 15,000 MPa % to 75,000 MPa %.
[0009] A method to achieve a strength/ductility characteristic in a metal comprising:
[0010] a. supplying a metal alloy comprising at least 70 atomic percent Fe, at least 9.0 atomic percent Mn, at least 0.4 atomic percent Al, and at least two elements selected from Cr, Si or C, melting and cooling at a rate of .ltoreq.250 K/s to a thickness of 25.0 mm to 500.0 mm;
[0011] b. processing said alloy into sheet by heating and reducing said thickness to form to a thickness of 1.5 mm to 8.0 mm;
[0012] c. processing said alloy into sheet by reducing said thickness without heating to form to a thickness of 0.5 mm to 3.0 mm wherein the sheet is annealed and exhibits an ultimate tensile strength (TS) of 650 MPa to 1500 MPa, a yield strength (YS) at 0.2% offset of 200 MPa to 1000 MPa and an elongation (E) from 10.0% to 90.0%, wherein the alloy further indicates a strength ductility product (TS.times.E) in the range of 10,000 MPa % to 80,000 MPa %.
BRIEF DESCRIPTION OF THE DRAWINGS
[0013] The detailed description below may be better understood with reference to the accompanying FIG.s which are provided for illustrative purposes and are not to be considered as limiting any aspect of this invention.
[0014] FIG. 1 Summary on steps towards toughness achievements in alloys herein for the method herein where the alloy at an initial thickness of 25.0 mm to 500.0 mm is heated while reduced in thickness to a reduced thickness of 1.5 mm to 8.0 mm.
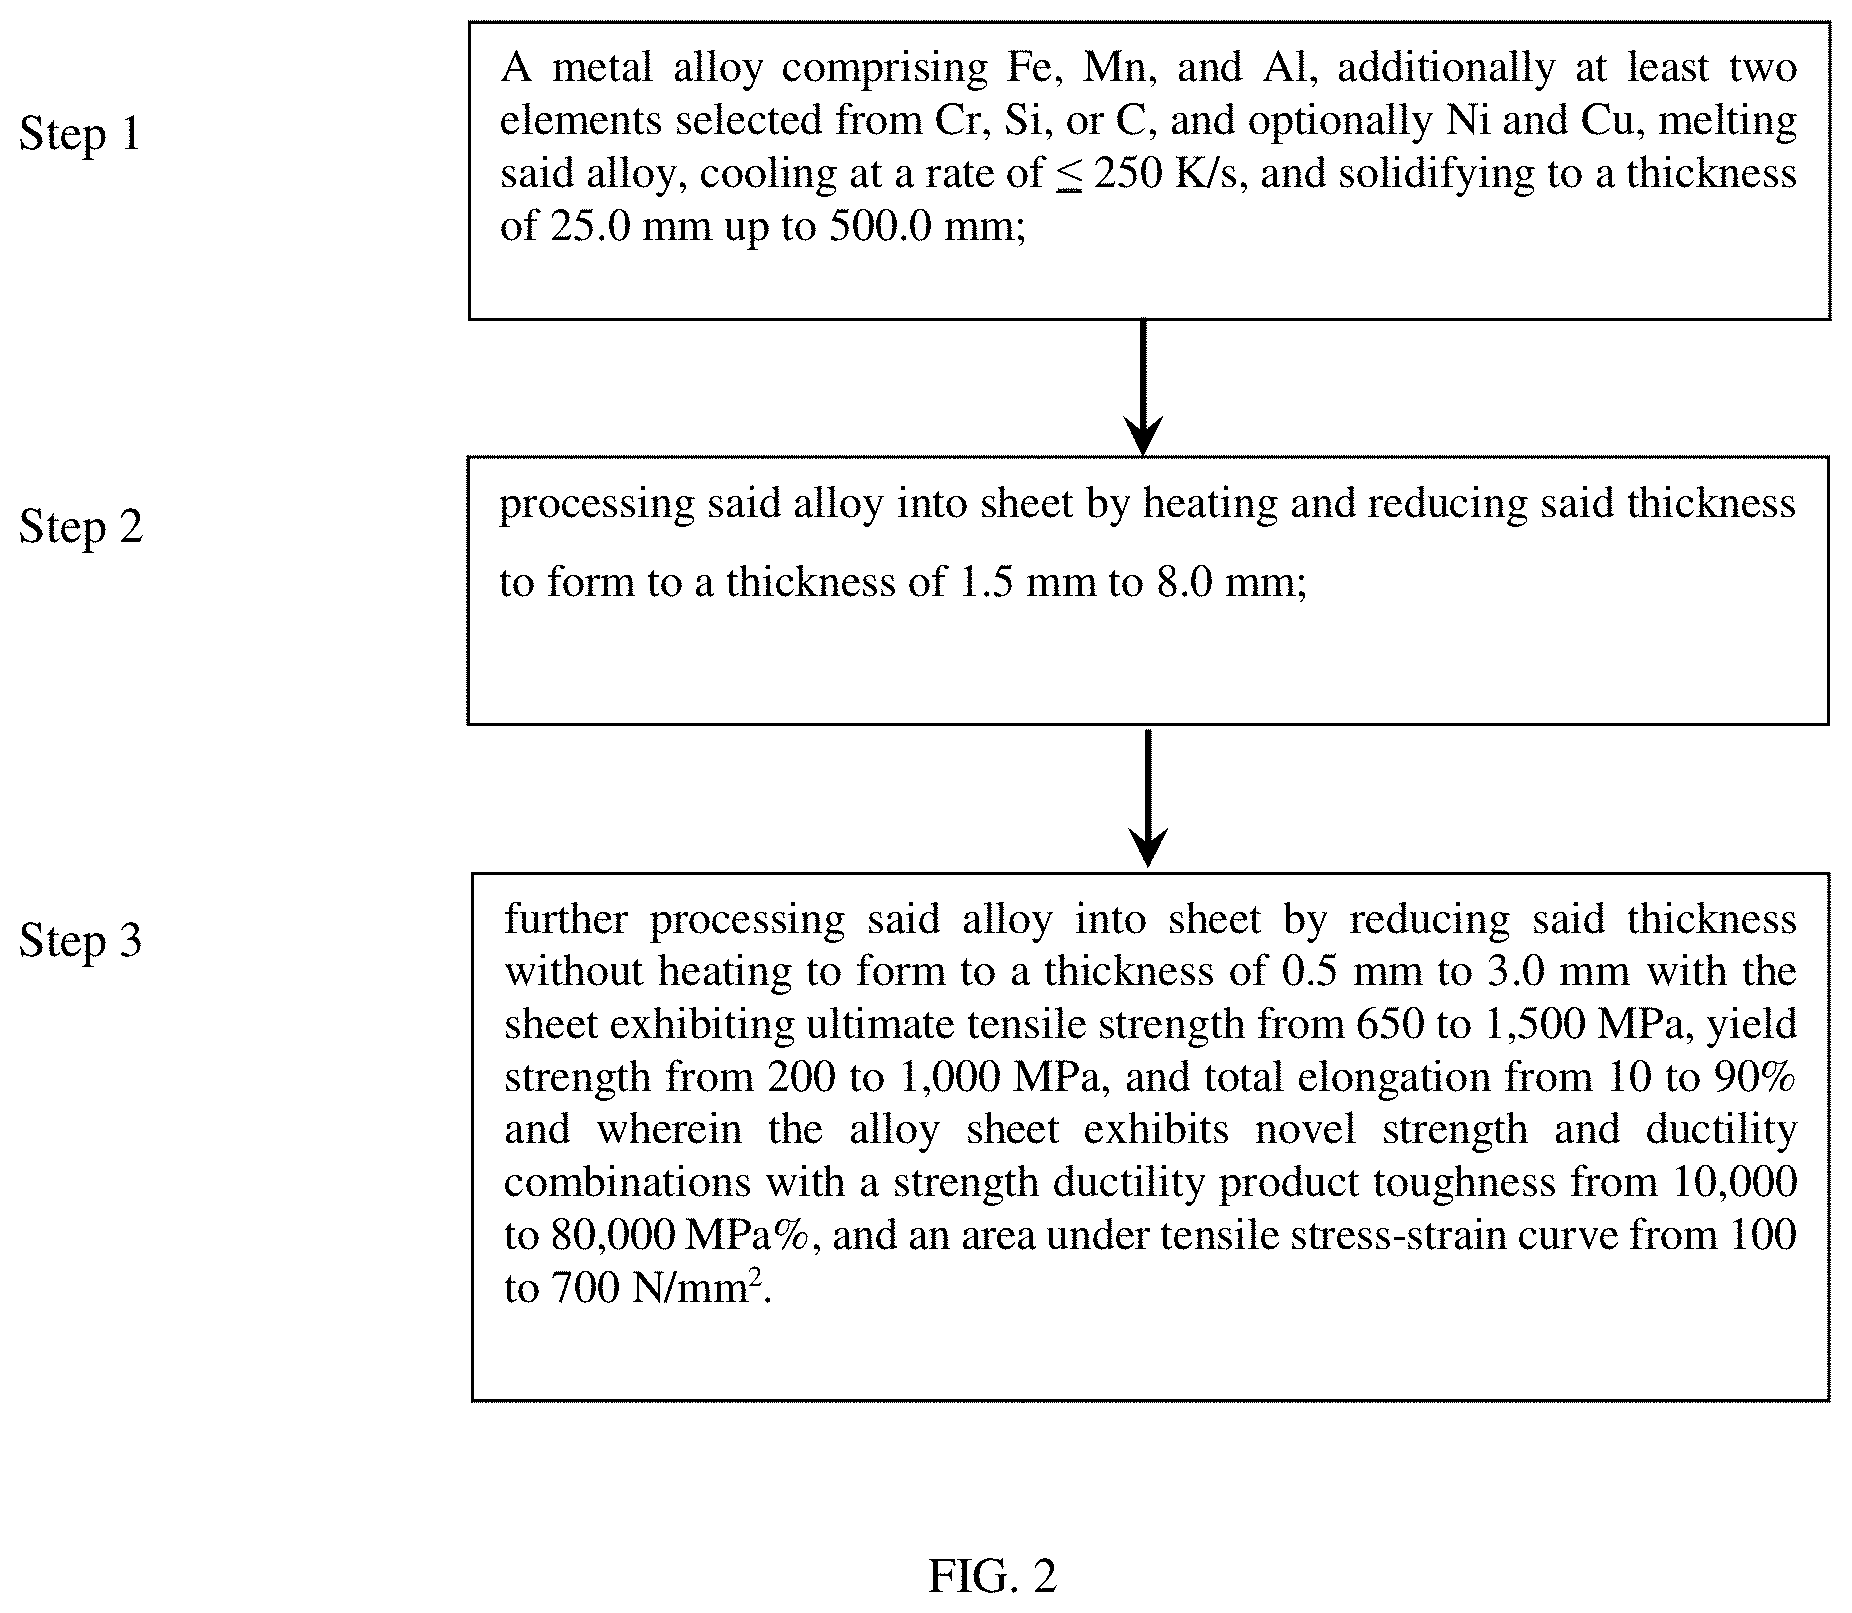
[0015] FIG. 2 Summary on steps towards toughness achievements in alloys herein where the alloy at an initial thickness of 25.0 mm to 500.0 mm is processed into sheet by heating and reducing thickness to 1.5 mm to 8.0 mm and then further reduced to a thickness of 0.5 to 3.0 mm without heating and to provide the indicated properties.
[0016] FIG. 3 Tensile testing geometry; (a) Example of the tensile specimen before testing, and (b) Schematic illustration (all dimensions are in mm).
[0017] FIG. 4 Charpy V-notched testing geometry; (a) Example of the Charpy V-notched specimen before testing, and (b) Schematic illustration (all dimensions are in mm).
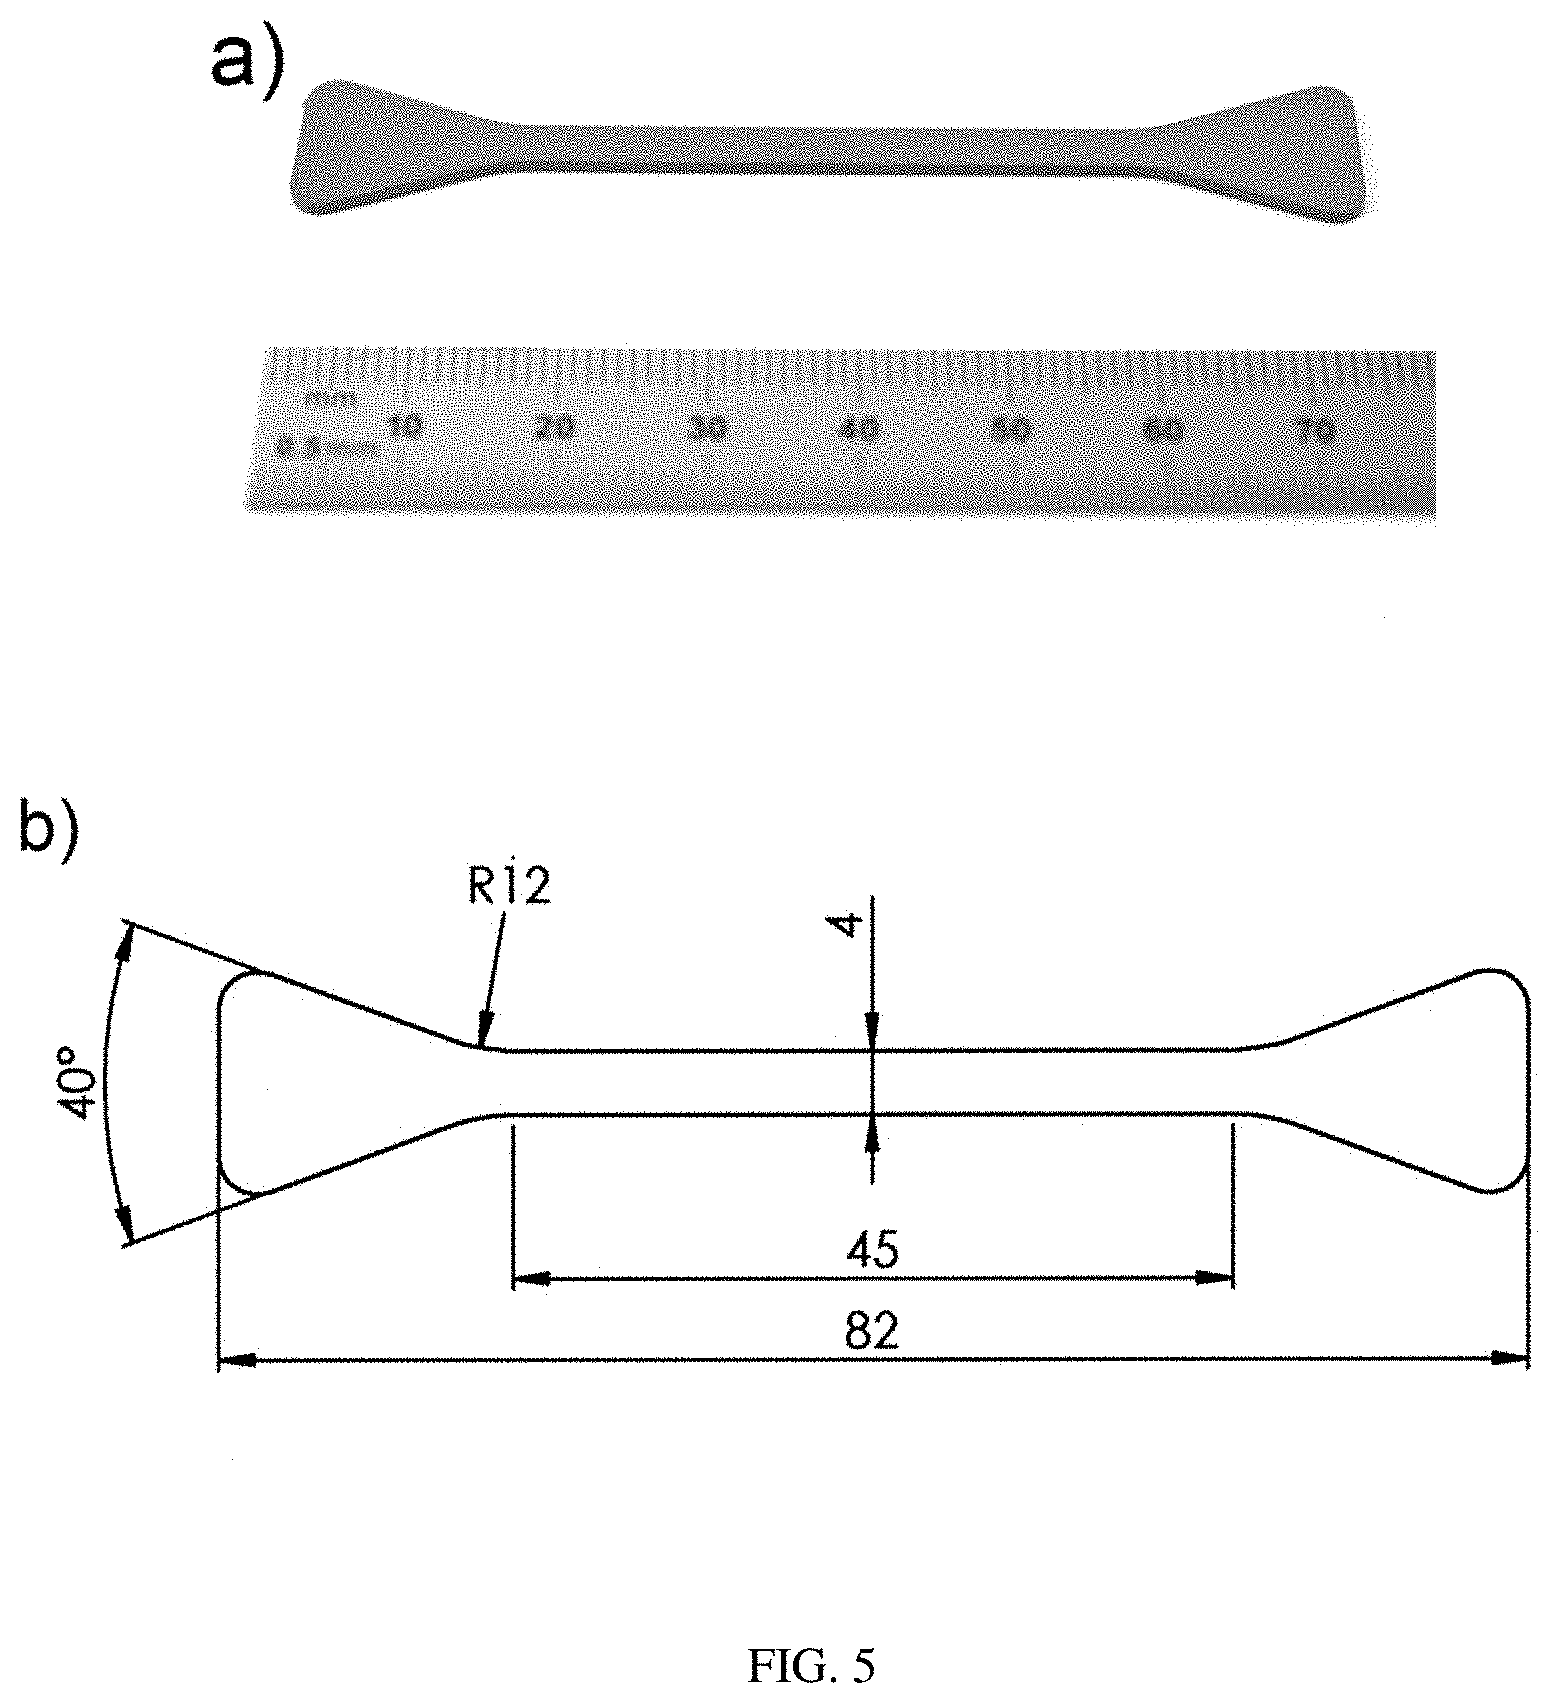
[0018] FIG. 5 Bulk fracture testing geometry; (a) Example of the bulk fracture specimen before testing, and (b) Schematic illustration (all dimensions are in mm).
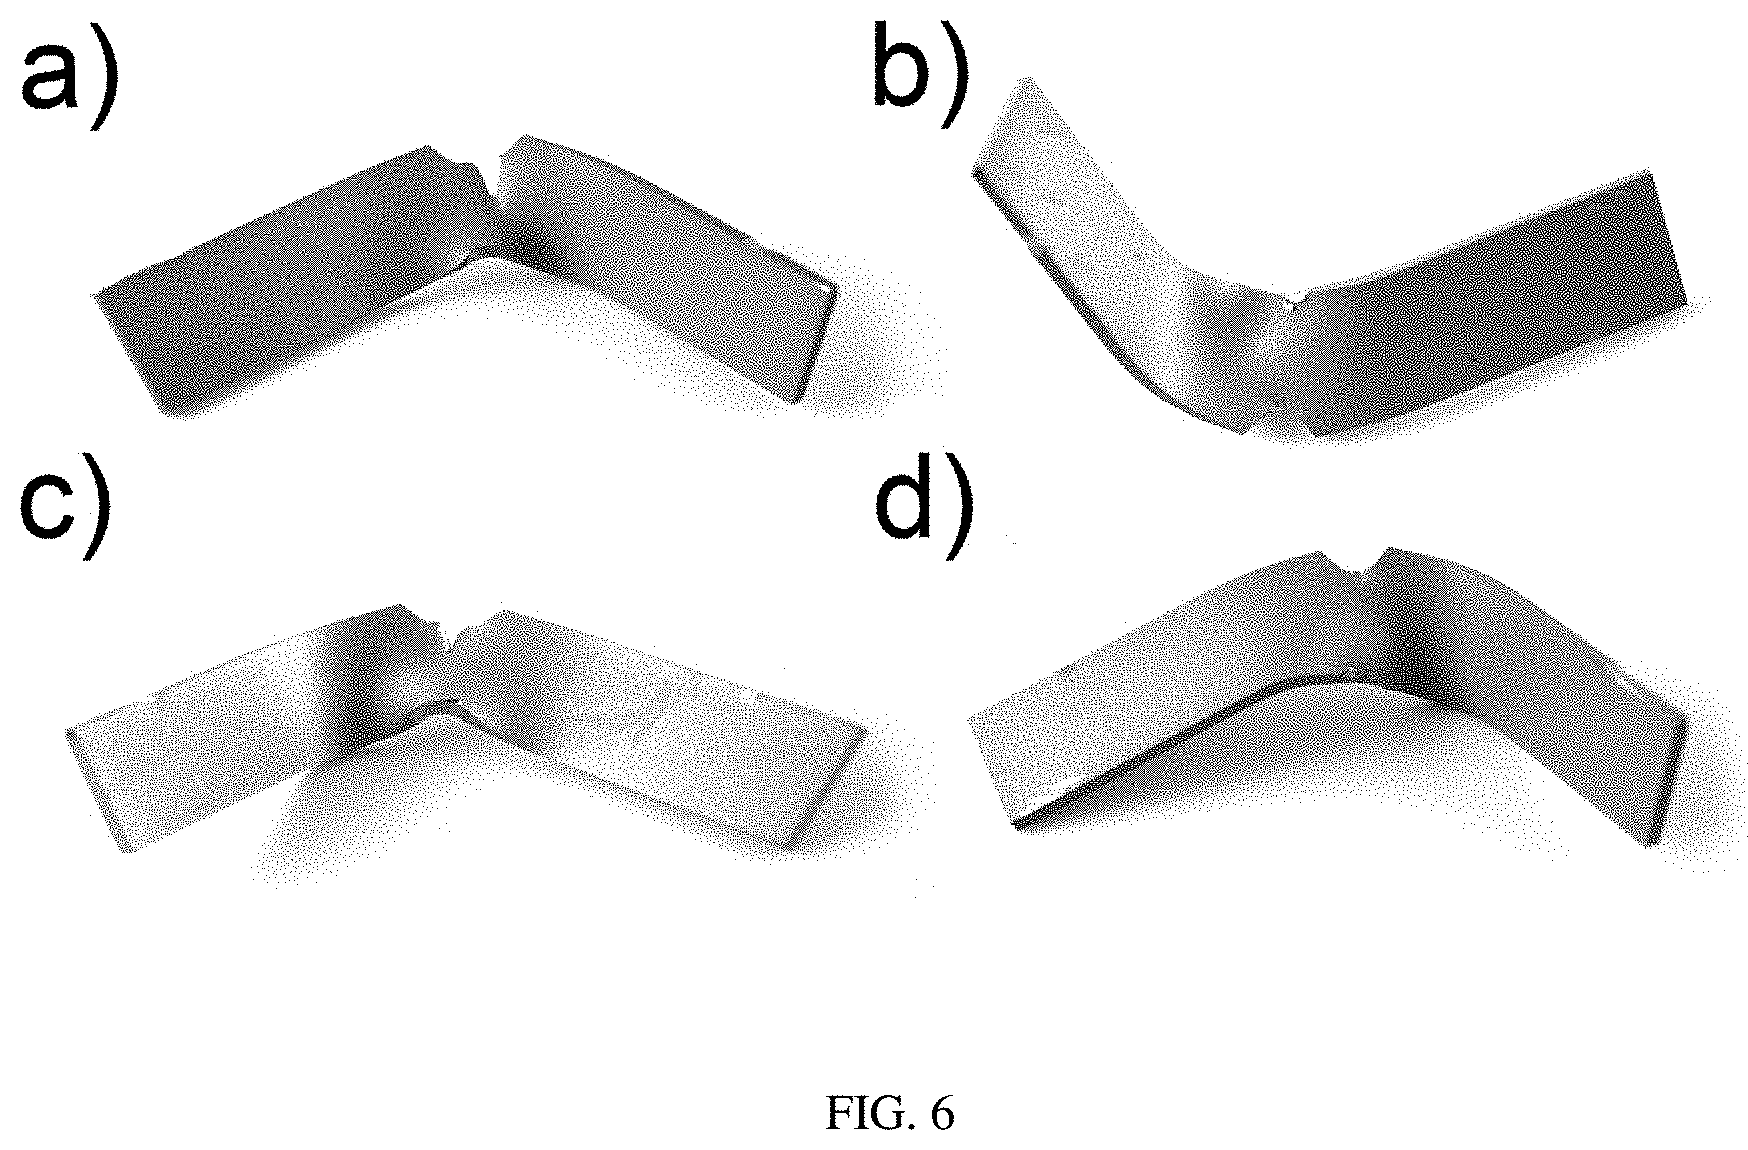
[0019] FIG. 6 Examples of the unbroken Charpy V-notch specimen after testing from (a) Alloy 1, (b) Alloy 2, (c) Alloy 3, and (d) Alloy 4.
[0020] FIG. 7 SEM images of the fracture surface in the Charpy V-notch specimen from Alloy 7 after testing.
[0021] FIG. 8 SEM images of the fracture surface in the Charpy V-notch specimen from Alloy 9 after testing.
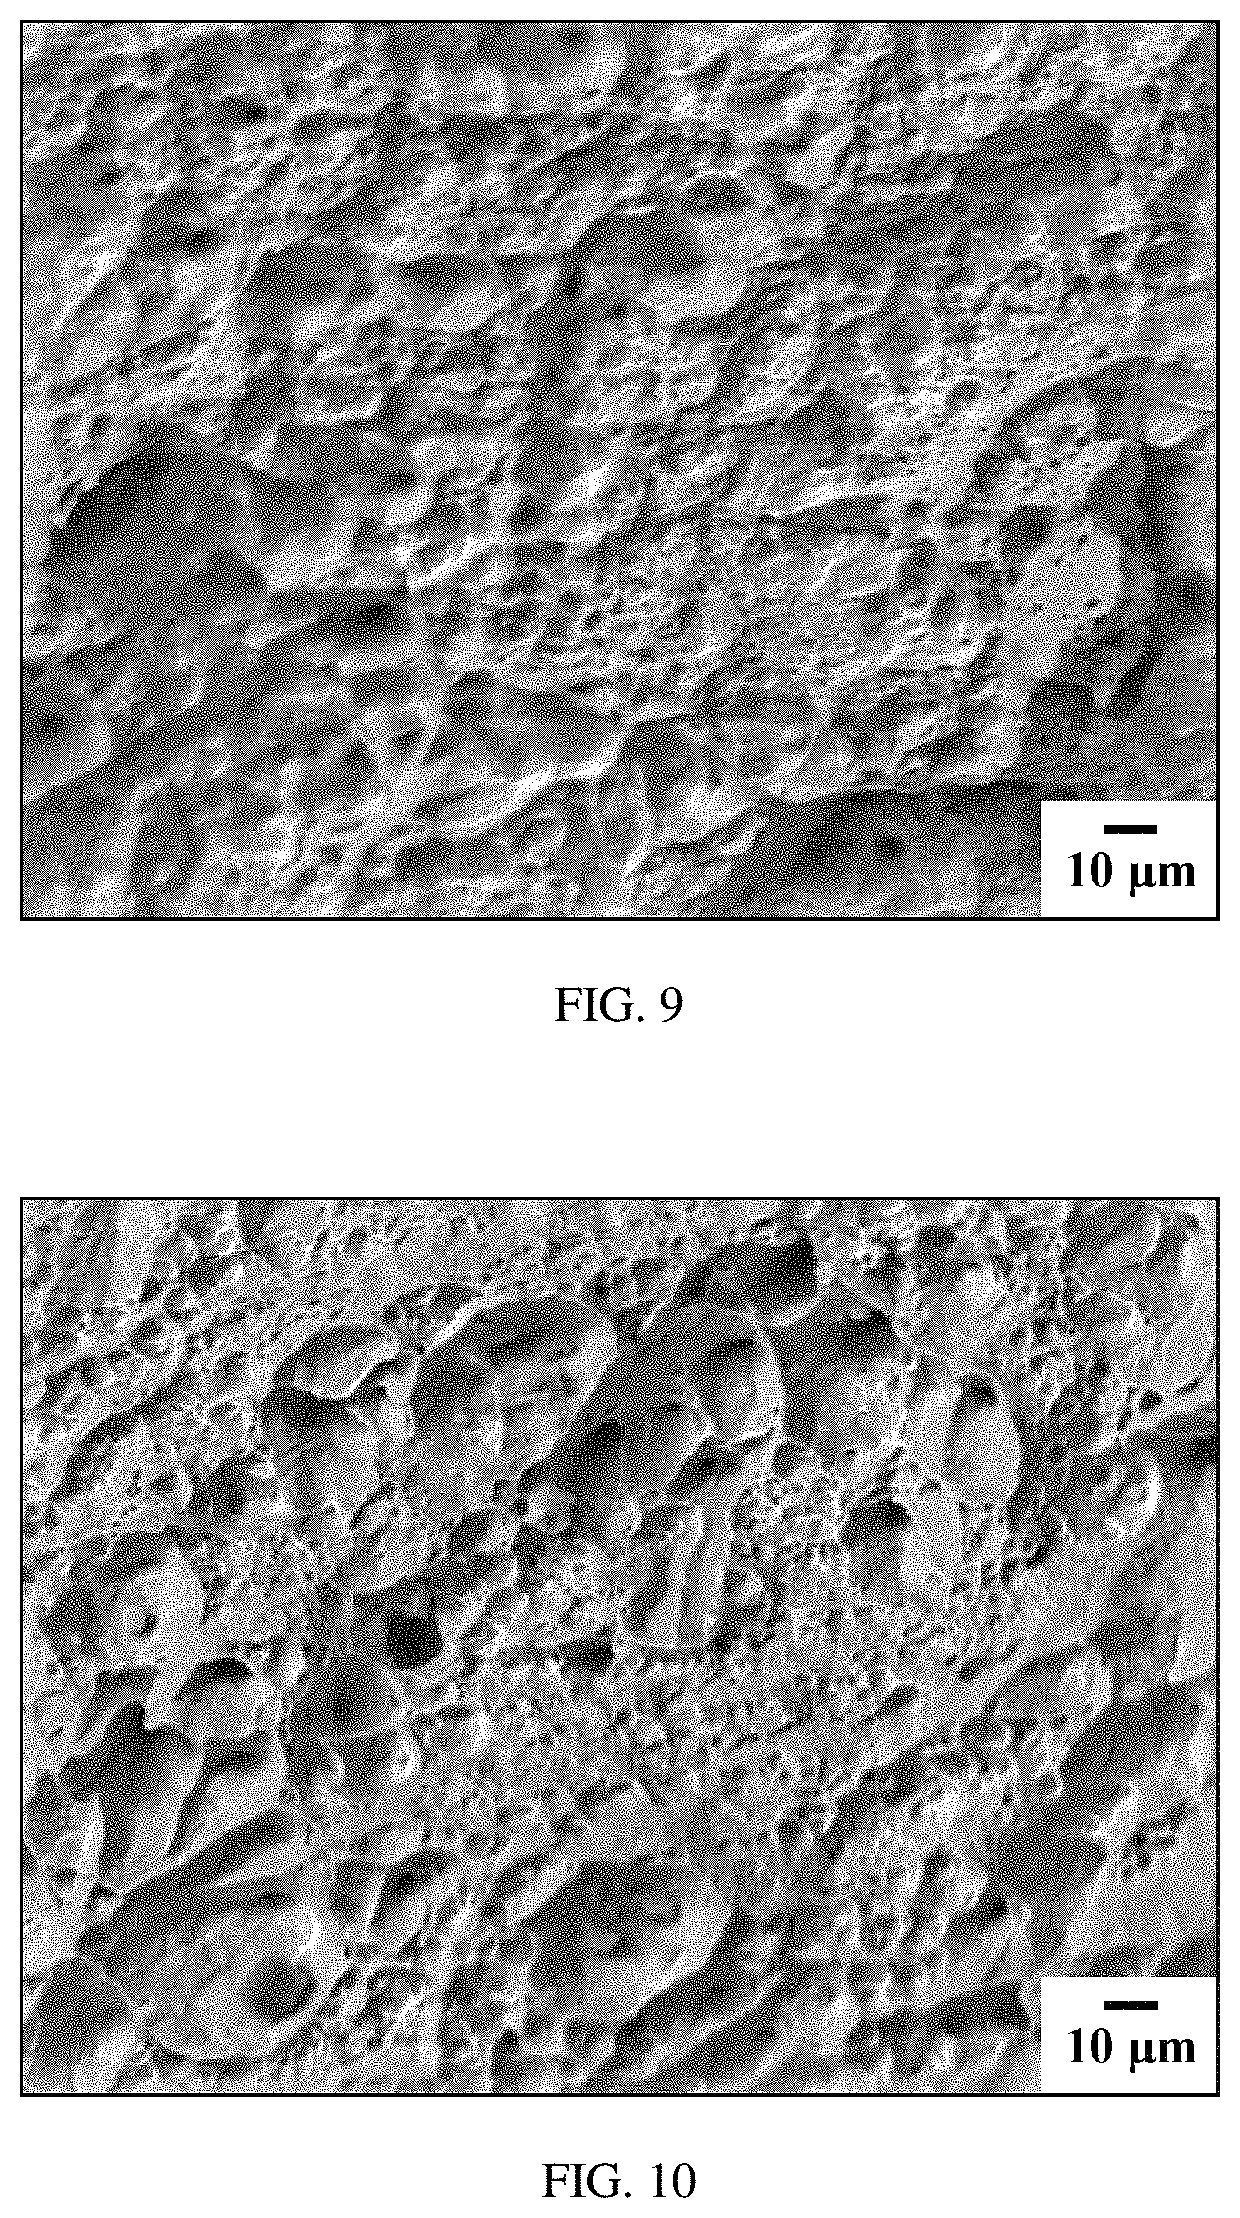
[0022] FIG. 9 SEM images of the fracture surface in the Charpy V-notch specimen from Alloy 19 after testing.
[0023] FIG. 10 SEM images of the fracture surface in the Charpy V-notch specimen from Alloy 20 after testing.
[0024] FIG. 11 SEM images of the fracture surface in the bulk fracture test specimen from Alloy 7 after testing.
[0025] FIG. 12 SEM images of the fracture surface in the bulk fracture test specimen from Alloy 9 after testing.
[0026] FIG. 13 SEM images of the fracture surface in the bulk fracture test specimen from Alloy 19 after testing.
[0027] FIG. 14 SEM images of the fracture surface in the bulk fracture test specimen from Alloy 20 after testing.
[0028] FIG. 15 Examples of unbroken specimens with different thicknesses; (a) From Alloy 7, and (b) From Alloy 9.
[0029] FIG. 16 Charpy V-notch toughness as a function of thickness in Alloy 7.
[0030] FIG. 17 Charpy V-notch toughness as a function of thickness in Alloy 9.
[0031] FIG. 18 Drawing of the impactor utilized during drop impact testing (all dimensions are in mm).
[0032] FIG. 19 A 4 mm thick bulk fracture test specimen from Alloy 24 after testing.
[0033] FIG. 20 Side view of a 4 mm thick drop impact test specimen from Alloy 24 hot band after testing.
[0034] FIG. 21 View of the impact location of a 4 mm thick drop impact test specimen from Alloy 24 hot band after testing.
DETAILED DESCRIPTION OF PREFERRED EMBODIMENTS
[0035] Alloys herein can be produced by different methods of casting including but not limited to continuous casting, thin slab casting, thick slab, and bloom casting at 25.0 to 500.0 mm in thickness with achievement of advanced property combinations by subsequent post-processing. After casting hot rolling is applied to produce thickness ranges from 1.5 to 8.0 mm. Cold rolling may be additionally applied to the hot rolled sheet to produce thickness ranges from 0.5 to 3.0 mm. Annealing may or may not be applied to produced hot rolled and/or cold rolled sheet or plate. FIG. 1 and FIG. 2 provides property ranges for the alloys herein processed in a sheet form. The property ranges in this figure is collected from the ensuing description of the alloys and associated testing.
[0036] FIG. 1 and FIG. 2 illustrate the toughness achievements in alloys herein. In Step 1 in FIG. 1 and FIG. 2, the preferred starting condition is to supply a metal alloy with Fe, Mn and Al, at least two elements selected from Cr, Si, or C, and optionally, Ni and/or Cu. The alloy chemistry is melted, cooled at a rate of .ltoreq.250 K/s, and solidified to a thickness of 25.0 mm and up to 500.0 mm. The casting process can be done in a wide variety of processes including ingot casting, bloom casting, continuous casting, thin slab casting, thick slab casting, belt casting etc. Preferred methods would be continuous casting in sheet form by thin slab casting or thick slab casting. To produce alloys herein in a sheet form, the cast processes can vary widely depending on specific manufacturing routes and specific targeted goals. As an example, consider thick slab casting as one process route to get to sheet product. The alloy would be preferably cast going through a water-cooled mold typically in a thickness range of 150 mm to 350 mm in thickness. Another example would be to preferably process the cast material through a thin slab casting process where casting is typically from 25 to 150 mm in thickness by going through a water-cooled mold. Note that bloom casting would be similar to the examples above, but higher thickness might be cast typically from 200 to 500 mm thick.
[0037] Step 2 in FIG. 1 corresponds to processing said sheet with an initial cast thickness of 25.0 mm to 500.0 mm and reducing to a thickness from 1.5 to 8.0 mm while heating. The processing of the cast material in Step 1 into sheet form can be done by heating, such as by hot rolling, forming a hot band/plate by various methods including roughing mill hot rolling, finishing mill hot rolling, and Steckel mills. The preferred temperature range for such heating is in the range of 700.degree. C. up to the solidus temperature of the alloy. To optimize properties of the hot band after it is produced, the hot band may be additionally heat treated by continuous methods including anneal and pickle lines and continuous annealing lines and batch annealing furnaces. Preferably, sheet material from alloys herein where the thickness reduction has been achieved in the presence of heating has an ultimate tensile strength from 650 to 1500 MPa, a yield strength (YS) at 0.2% offset from 200 MPa to 1,000 MPa, a total elongation from 10% to 70%. Calculated characteristics of toughness based on tensile testing data are represented by the strength/elongation product from 15,000 MPa % to 75,000 MPa % and can be further characterized as having an area under tensile curve from 150 to 600 N/mm.sup.2 (Modulus of toughness).
[0038] Step 2 in FIG. 2 corresponds to processing said alloy into sheet with heating and reducing the thickness of the alloy from an initial thickness of 25.0 mm to 500.0 mm to form a thickness of 1.5 mm to 8.0 mm. The processing of the cast material in Step 1 of FIG. 2 into an initial sheet form at a thickness of 25.0 mm to 500.0 mm can again be done by heating, such as by hot rolling, forming a hot band by various methods including roughing mill hot rolling, finishing mill hot rolling, and Steckel mills. Again, the preferred temperature range for such heating is in the range of 700.degree. C. up to the solidus temperature of the alloy.
[0039] Step 3 in FIG. 2 is therefore preferably done through cold rolling to produce cold rolled sheet with typical thickness from 0.5 to 3.0 mm thick. Note that cold rolling is done without external heat applied to the sheet before or after the reduction process but internal heating/adiabatic heating during the reduction process would be inherent in the process. Cold reduction can be applied at various reductions per pass, variable number of passes and in different mills including tandem mills, Z-mills, Sendzimir mills, and reversing mills. After cold rolling to produce a targeted gauge from 0.5 to 3.0 mm thick, the cold rolled material, which has reduced ductility remaining since, ductility is reduced due to the deformation/gauge reduction, can be preferably annealed to increase the ductility lost from the cold rolling process either partially or completely. Heat treatment, if applied, will be from 600.degree. C. up to the melting point (defined as the solidus temperature). Time for heat treatment can vary depending on the equipment utilized, the thickness of the material heat treated, and the goal of the heat treatment (partial recrystallization, full recrystallization, normalization, heat treatment etc.) but is preferably in the range from 1 minute to 72 hours. Preferably, sheet material from alloys herein by the procedure in FIG. 2 has an ultimate tensile strength from 650 to 1500 MPa, a yield strength at 0.2% offset from 200 MPa to 1,000 MPa, a total elongation from 10 to 90%. Calculated characteristics of toughness based on tensile testing data are represented by the strength/elongation product from 10,000 MPa % to 80,000 MPa %, and may be further characterized by an area under tensile curve from 100 to 700 N/mm.sup.2 (Modulus of toughness).
[0040] Sheet toughness produced from FIG. 1 or FIG. 2 was preferably evaluated by drop impact testing, bulk fracture testing, and Charpy V-notch impact testing. Drop impact testing was used to gauge sheet material toughness and its resistance to penetration. This technique employs a weight dropped from a specific height onto a planar sample that is biaxially constrained. The direction of movement of the impactor is normal to both biaxially constrained directions and in the same direction as the material's thickness. The drop impact testing technique tests a biaxially constrained material's resistance to penetration by an object moving normal to its surface. Preferably, the sheet material herein produced via the method in FIG. 1 exhibits a drop impact toughness of 100 J to 1250 J. Additionally, the range of thickness normalized drop impact toughness is from 75 J/mm to 160 J/mm. Thickness normalized drop impact toughness is the ratio of the toughness measured in Joules from the drop impact test divided by the thickness of the particular sample tested in mm. Preferably, the sheet material herein produced via the method in FIG. 2 exhibits a drop impact toughness of 40 to 700 J. Additionally, the range of thickness normalized drop impact toughness is from 75 to 250 J/mm. As the material gauge is increased from 1.5 to 8.0 mm in thickness in FIG. 1 or increased from 0.5 to 3.0 mm in FIG. 2, it is contemplated that the drop impact toughness values will increase accordingly.
[0041] Bulk fracture testing has been developed to test material toughness to simulate material performance under specific collision-like loading events. It characterizes a resistance to crack initiation. The bulk fracture sample is dynamically loaded perpendicular to the thickness of the material. The sample ends are held fixed in place during the test. This load deforms the sample out of plane until the sample fails by a plastic instability (necking in ductile metals), similar to failure by tensile loading. Preferably, the sheet material herein produced via the method in FIG. 1 exhibits a bulk fracture toughness depending on sheet thickness from 10 to 400 J. Additionally, the range of thickness normalized bulk fracture toughness is from 5 to 50 J/mm. Preferably, the sheet material herein produced via the method in FIG. 2 exhibits a bulk fracture toughness from 2 to 175 J. Additionally, the range of thickness normalized bulk fracture toughness from 1 to 60 J/mm. Thickness normalized bulk fracture toughness is the ratio of the toughness measured in Joules from the bulk fracture test divided by the thickness of the particular sample tested in mm. As the material gauge is increased from 1.5 to 8.0 mm in thickness in FIG. 1 or increased from 0.5 to 3.0 mm in FIG. 2, it is contemplated that the bulk fracture toughness values will increase accordingly.
[0042] Charpy impact testing is preferably performed by the dynamic loading of a sample by a swinging hammer starting from a known height and distance from the center of rotation. The ends of the samples in Charpy impact testing are free and the loading of the sample is similar to a three-point bend test. The total energy of the moving hammer is known and the energy lost in the impact event with the sample can be measured by the rotation angle of the hammer after impact. In Charpy V-notch testing the sample has a pre-machined stress concentration point at the V-notch tip which helps encourage crack nucleation. In this test, the hammer strikes the side opposite the machined notch. Charpy V-notch impact testing measures the work required to plastically deform the sample as well as crack nucleation and propagation. Preferably, the sheet material herein produced via the method in FIG. 1 exhibits a Charpy V-notched toughness of 10 to 150 J. Additionally, the range of thickness normalized Charpy V-Notched toughness is from 5 to 25 J/mm. Preferably, the sheet material herein produced via the method in FIG. 2 exhibits a Charpy V-notched toughness of 0.5 to 75 J. Additionally, the range of thickness normalized Charpy V-Notched toughness from 0.5 to 25 J/mm. Thickness normalized Charpy V-Notched is the ratio of the toughness measured in Joules from the Charpy V-Notched test divided by the thickness of the particular sample tested in mm.
Main Body
Alloys
[0043] The chemical composition of the alloys herein is shown in Table 1, which provides the preferred atomic ratios utilized.
TABLE-US-00001 TABLE 1 Chemical Composition Of Alloys (Atomic %) Alloy Fe Mn Al Cr Si C Ni Cu Alloy 1 70.92 14.10 5.11 2.50 4.87 0.75 1.13 0.62 Alloy 2 77.35 11.51 4.42 -- 0.76 2.55 2.56 0.85 Alloy 3 79.85 12.04 2.42 -- 0.79 2.67 1.34 0.89 Alloy 4 77.85 12.04 4.42 -- 0.79 2.67 1.34 0.89 Alloy 5 75.85 12.04 6.42 -- 0.79 2.67 1.34 0.89 Alloy 6 75.11 12.04 3.65 2.63 5.13 0.79 -- 0.65 Alloy 7 74.05 12.04 4.71 2.63 5.13 0.79 -- 0.65 Alloy 8 72.13 12.04 6.63 2.63 5.13 0.79 -- 0.65 Alloy 9 75.03 12.04 4.38 2.63 5.13 0.79 -- -- Alloy 10 73.76 12.04 5.65 2.63 5.13 0.79 -- -- Alloy 11 74.42 12.04 4.34 2.63 5.13 0.79 -- 0.65 Alloy 12 75.21 12.04 4.34 2.63 5.13 -- -- 0.65 Alloy 13 73.63 12.04 4.34 2.63 5.13 1.58 -- 0.65 Alloy 14 76.42 12.04 4.34 2.63 3.13 0.79 -- 0.65 Alloy 15 78.42 12.04 4.34 2.63 1.13 0.79 -- 0.65 Alloy 16 75.76 14.00 4.00 1.02 4.43 0.79 -- -- Alloy 17 74.65 12.04 4.76 2.63 5.13 0.79 -- -- Alloy 18 75.44 12.04 4.76 2.63 5.13 -- -- -- Alloy 19 73.86 12.04 4.76 2.63 5.13 1.58 -- -- Alloy 20 76.65 12.04 4.76 2.63 3.13 0.79 -- -- Alloy 21 78.65 12.04 4.76 2.63 1.13 0.79 -- -- Alloy 22 76.15 9.16 6.14 2.63 5.13 0.79 -- -- Alloy 23 74.37 13.13 4.00 2.63 4.43 0.79 -- 0.65 Alloy 24 74.26 13.57 4.00 2.63 4.43 0.79 -- 0.32 Alloy 25 74.15 14.00 4.00 2.63 4.43 0.79 -- -- Alloy 26 75.68 13.13 4.00 1.32 4.43 0.79 -- 0.65 Alloy 27 75.57 13.57 4.00 1.32 4.43 0.79 -- 0.32 Alloy 28 75.46 14.00 4.00 1.32 4.43 0.79 -- -- Alloy 29 77.00 13.13 4.00 -- 4.43 0.79 -- 0.65 Alloy 30 76.89 13.57 4.00 -- 4.43 0.79 -- 0.32 Alloy 31 76.78 14.00 4.00 -- 4.43 0.79 -- -- Alloy 32 73.52 12.14 4.61 3.26 4.07 2.11 -- 0.29 Alloy 33 75.69 14.16 3.20 4.59 -- 1.51 0.37 0.48 Alloy 34 70.45 16.85 0.87 1.49 6.22 1.72 0.55 1.85 Alloy 35 78.86 14.41 2.68 0.29 0.87 1.15 0.78 0.96 Alloy 36 76.83 13.67 0.42 -- 2.78 0.38 3.47 2.45 Alloy 37 75.57 11.33 5.55 6.22 0.35 0.98 -- -- Alloy 38 72.85 16.98 1.70 2.76 3.03 1.13 -- 1.55 Alloy 39 74.19 15.64 1.70 2.76 3.03 1.13 -- 1.55 Alloy 40 74.25 16.31 1.26 2.76 3.03 1.13 -- 1.26
[0044] With regards to the above, and as can be seen from Table 1, preferably, when Fe is present at a level of greater than or equal to 70 at. % with Mn and Al, at least two elements are selected from Cr, Si, or C, and optionally, Ni and/or Cu to provide a formulation of elements that totals 100 atomic percent. More preferably, the alloys herein can be described as comprising, consisting essentially of, or consisting of the following elements at the indicated atomic percent: Fe (70 to 80 at. %), Mn (9.0 to 17.0 at. %), Al (0.4 to 6.7 at. %), at least two elements selected from Cr, Si, or C in the following ranges, Cr (0.2 to 6.3 at. %), Si (0.3 to 6.3 at. %), and C (0.3 to 2.7 at. %), and optionally Ni (0.3 to 3.5 at. %) and/or Cu (0.2 to 2.5 at. %). The level of impurities of other elements is in the range of 0 to 5,000 ppm, or 0 to 4000 ppm, or 0 to 3000 ppm, or 0 to 2000 ppm, or 0 to 1000 ppm. In a more preferred embodiment, the alloys herein are substantially free of nickel and copper, meaning that nickel and copper are present only as potential impurities, such as at a level of 0 to 5000 ppm, or 0 to 4000 ppm, or 0 to 3000 ppm, or 0 to 2000 ppm, or 0 to 1000 ppm.
[0045] The alloys herein were processed into a laboratory sheet by processing of laboratory slabs. Laboratory alloy processing is developed to mimic closely the commercial sheet production by continuous casting and include hot rolling and cold rolling. Annealing might be applied depending on targeted properties. Produced sheet can be used in hot rolled (hot band), cold rolled, annealed or partially annealed states.
Laboratory Slab Casting
[0046] Alloys were weighed out into 3,000 to 3,400 gram charges according to the atomic ratios in Table 1 using commercially available ferroadditive powders and a base steel feedstock with known chemistry. Impurities can be present at various levels depending on the feedstock used. Impurity elements would commonly include the following elements; Co, N, P, Ti, Mo, W, Ga, Ge, Sb, Nb, Zr, O, Sn, Ca, B, and S which if present would be in the range from 0 to 5,000 ppm (parts per million) (0 to 0.5 wt %) at the expense of the desired elements noted previously. Preferably, the level of impurities is controlled to fall in the range of 0 to 3,000 ppm (0.3 wt %).
[0047] Charges were loaded into a zirconia coated silica crucible which was placed into an Indutherm VTC800V vacuum tilt casting machine. The machine then evacuated the casting and melting chambers and flushed with argon to atmospheric pressure twice prior to casting to prevent oxidation of the melt. The melt was heated with a 14 kHz RF induction coil until fully molten, approximately from 5 to 7 minutes depending on the alloy composition and charge mass. After the last solids were observed to melt it was allowed to heat for an additional 30 to 45 seconds to provide superheat and ensure melt homogeneity. The casting machine then evacuated the chamber and tilted the crucible and poured the melt into a water-cooled copper die. The melt was allowed to cool under vacuum for 200 seconds before the chamber was filled with argon to atmospheric pressure.
Physical Properties of Cast Alloys
[0048] A sample of between 50 and 150 mg from each alloy herein was taken in the as-cast condition. This sample was heated to an initial ramp temperature between 900.degree. C. and 1300.degree. C. depending on alloy chemistry, at a rate of 40.degree. C./min. Temperature was then increased at 10.degree. C./min to a max temperature between 1425.degree. C. and 1510.degree. C. (maximum temperature limit for the used DSC equipment) depending on alloy chemistry. Once this maximum temperature was achieved, the sample was cooled at a rate of 10.degree. C./min back to the initial ramp temperature before being reheated at 10.degree. C./min to the maximum temperature. Differential Scanning calorimetry (DSC) measurements were taken using a Netzsch Pegasus 404 DSC through all four stages of the experiment, and this data was used to determine the solidus and liquidus temperatures of each alloy, which are in a range from 1325 to 1510.degree. C. as listed in Table 2. Depending on the alloy's chemistry, liquidus-solidus gap varies from 38 to 139.degree. C. Thermal analysis provides information on maximum temperature for the following hot rolling processes that varies depending on alloy chemistry.
TABLE-US-00002 TABLE 2 Thermal Analysis Of Selected Alloys Solidus Liquidus Melting Gap Alloy (.degree. C.) (.degree. C.) (.degree. C.) Alloy 1 1346 1455 109 Alloy 2 1423 1472 49 Alloy 3 1430 1486 56 Alloy 4 1409 1471 62 Alloy 5 1374 1460 85 Alloy 6 1364 1475 111 Alloy 7 1347 1466 119 Alloy 8 1325 1463 139 Alloy 9 1355 1475 120 Alloy 10 1340 1471 131 Alloy 11 1352 1464 112 Alloy 12 1385 1470 85 Alloy 13 1342 1459 117 Alloy 14 1391 1481 90 Alloy 15 1423 1506 84 Alloy 16 1377 1469 91 Alloy 17 1353 1473 120 Alloy 18 1408 1481 73 Alloy 19 1341 1450 109 Alloy 20 1390 1491 101 Alloy 21 1424 1510 86 Alloy 22 1367 1475 108 Alloy 23 1366 1464 98 Alloy 24 1367 1459 92 Alloy 25 1368 1463 94 Alloy 26 1402 1476 74 Alloy 27 1397 1474 77 Alloy 28 1403 1481 78 Alloy 29 1389 1479 90 Alloy 30 1377 1479 102 Alloy 31 1378 1466 88 Alloy 32 1377 1454 77 Alloy 33 1420 1478 58 Alloy 34 1400 1452 52 Alloy 35 1439 1482 43 Alloy 36 1426 1464 38 Alloy 37 1411 1502 91 Alloy 38 1392 1445 53 Alloy 39 1390 1451 61 Alloy 40 1386 1452 66
[0049] The density of the alloys herein was measured on samples from hot rolled material using the Archimedes method in a specially constructed balance allowing weighing in both air and distilled water. The density of each alloy is tabulated in Table 3 and was found to be in the range from 7.35 to 7.90 g/cm.sup.3. The accuracy of this technique is .+-.0.01 g/cm.sup.3.
TABLE-US-00003 TABLE 3 Density Of Alloys Alloy Density (g/cm.sup.3) Alloy 1 7.48 Alloy 2 7.69 Alloy 3 7.80 Alloy 4 7.67 Alloy 5 7.55 Alloy 6 7.57 Alloy 7 7.49 Alloy 8 7.35 Alloy 9 7.51 Alloy 10 7.42 Alloy 11 7.52 Alloy 12 7.51 Alloy 13 7.50 Alloy 14 7.61 Alloy 15 7.68 Alloy 16 7.58 Alloy 17 7.49 Alloy 18 7.48 Alloy 19 7.47 Alloy 20 7.57 Alloy 21 7.65 Alloy 22 7.38 Alloy 23 7.56 Alloy 24 7.56 Alloy 25 7.56 Alloy 26 7.58 Alloy 27 7.57 Alloy 28 7.58 Alloy 29 7.59 Alloy 30 7.59 Alloy 31 7.59 Alloy 32 7.50 Alloy 33 7.73 Alloy 34 7.82 Alloy 35 7.79 Alloy 36 7.90 Alloy 37 7.60 Alloy 38 7.73 Alloy 39 7.74 Alloy 40 7.76
Laboratory Processing into Hot Band Through Hot Rolling
[0050] The alloys herein were preferably processed into a laboratory hot band by hot rolling of laboratory slabs at high temperatures. Laboratory alloy processing is developed to simulate the hot band production from slabs produced by continuous casting. Industrial hot rolling is performed by heating a slab in a tunnel furnace to a target temperature, then passing it through either a reversing mill or a multi-stand mill or a combination of both to reach the target gauge. During rolling on either mill type, the temperature of the slab is steadily decreasing due to heat loss to the air and to the work rolls, so the final hot band is formed at a reduced temperature. This is simulated in the laboratory by heating in a tunnel furnace to between 1100.degree. C. and 1250.degree. C., then hot rolling. The laboratory mill is slower than industrial mills causing greater loss of heat during each hot rolling pass, so the slab is reheated for 4 minutes between passes to reduce the drop in temperature. The final temperature at target gauge when exiting the laboratory mill commonly is in the range from 800.degree. C. to 1,000.degree. C., depending on furnace temperature and final thickness.
[0051] Prior to hot rolling, laboratory slabs were preheated in a Lucifer EHS3GT-B18 furnace. The furnace set point varies between 1100.degree. C. to 1250.degree. C., depending on alloy melting point and point in the hot rolling process, with the initial temperatures set higher to facilitate higher reductions, and later temperatures set lower to minimize surface oxidation on the hot band. The slabs were allowed to soak for 40 minutes prior to hot rolling to ensure they reach the target temperature and then pushed out of the tunnel furnace into a Fenn Model 061 2 high rolling mill. The 50 mm casts were hot rolled for 5 to 10 passes though the mill before being allowed to air cool. Final thickness ranges after hot rolling are preferably from 1.5 mm to 8.0 mm with variable reduction per pass ranging from 20% to 50%.
[0052] Tensile testing results for hot band with thickness from 1.8 to 2.7 mm are listed in Table 4. Two to four specimens were tested for each alloy. The ultimate tensile strength values of the annealed sheet from alloys herein are in a range from 732 to 1434 MPa, the yield strength at 0.2% offset (a parallel line is drawn on the initial stress strain curve and the resulting point of intersection is measured at the 0.2% offset) varies from 405 to 771 MPa, the total elongation recorded in the range from 17.2 to 69.5%, strength ductility product toughness, i.e. the ultimate tensile strength times the total elongation, varies from 17,500 to 71,100 MPa %, and a Modulus of toughness which is calculated in a range from 152 to 580 N/mm.sup.2. Note that the Modulus of Toughness represents the numerical integration of the stress-strain curve area under tensile stress-strain curve from no applied strain all the way up to failure. The Table 4 properties correspond to Step 2 in FIG. 1.
TABLE-US-00004 TABLE 4 Tensile Properties Of Hot Band Sheet Ultimate Yield Strength Area Under Total Tensile Strength, Ductility Stress-Strain Elongation Strength 0.2% Offset Product Curve Thickness Alloy (%) (MPa) (MPa) (MPa %) (N mm/mm.sup.3) (mm) Alloy 1 66.7 954 575 63,600 570 2.2 69.5 935 554 65,000 580 2.3 68.2 936 557 63,800 570 2.3 68.0 935 556 63,600 569 2.3 Alloy 2 57.2 762 451 45,600 392 2.0 60.1 749 440 45,000 403 2.0 57.6 774 466 44,600 403 2.0 67.6 763 441 51,600 466 2.0 Alloy 3 45.3 833 459 37,700 322 1.9 50.9 863 488 43,900 379 1.9 54.4 867 488 47,100 408 1.9 47.5 860 504 40,900 354 2.0 Alloy 4 66.7 830 524 53,300 504 2.1 62.4 830 535 51,800 469 2.1 61.8 827 535 51,100 462 2.1 59.8 818 520 48,900 440 2.1 Alloy 5 63.5 794 574 50,400 476 2.0 61.9 791 572 48,900 461 2.0 58.2 792 555 46,100 431 1.9 44.9 783 548 35,100 324 1.9 Alloy 6 46.3 1382 431 64,000 478 2.3 46.0 1383 434 63,600 474 2.3 38.2 1388 432 53,100 369 2.3 44.8 1381 434 61,800 454 2.3 Alloy 7 50.1 1315 518 65,800 502 2.2 48.9 1302 508 63,700 488 2.2 51.4 1309 497 67,300 518 2.2 48.6 1305 507 63,500 488 2.2 Alloy 8 27.3 966 771 26,400 253 2.2 24.0 960 703 23,000 220 2.2 23.6 960 681 22,700 217 2.2 31.2 964 717 30,000 289 2.2 Alloy 9 34.9 1434 460 50,100 339 2.2 27.1 1345 448 36,500 228 2.2 31.6 1404 468 44,400 290 2.3 28.7 1411 440 40,400 249 2.2 Alloy 10 46.2 1255 628 57,900 471 2.2 47.7 1250 608 59,600 478 2.2 41.7 1223 515 51,000 402 2.7 42.3 1214 573 51,300 406 2.7 Alloy 11 29.2 1261 505 36,800 245 2.2 31.4 1299 504 40,800 274 2.2 35.9 1346 500 48,300 334 2.2 Alloy 12 37.5 1247 429 46,700 349 2.1 38.4 1244 424 47,700 359 2.1 37.6 1246 485 46,800 352 2.1 Alloy 13 31.6 1037 662 32,800 275 2.2 28.8 1007 658 29,000 245 2.1 34.2 1065 635 36,400 301 2.2 Alloy 14 43.9 1274 494 55,900 410 2.1 46.9 1242 505 58,300 449 2.1 46.3 1261 507 58,400 440 2.1 Alloy 15 46.7 1123 478 52,500 406 1.9 48.2 1112 479 53,600 423 1.9 45.9 1115 469 51,100 399 1.9 Alloy 16 44.0 1277 411 56,200 417 2.1 45.2 1296 426 58,600 428 2.1 41.6 1287 429 53,600 385 2.1 Alloy 17 35.6 1385 514 49,300 344 2.1 35.1 1374 512 48,200 333 2.1 37.2 1393 523 51,800 366 2.1 Alloy 18 36.8 1264 454 46,500 357 2.2 37.7 1266 482 47,800 368 2.2 36.7 1261 484 46,200 354 2.2 Alloy 19 24.7 982 625 24,200 198 2.2 25.7 1002 624 25,800 209 2.2 26.7 1023 611 27,300 218 2.2 Alloy 20 41.1 1364 495 56,000 402 2.1 30.4 1292 478 39,200 269 2.1 36.6 1351 497 49,400 348 2.1 Alloy 21 42.9 1226 450 52,600 407 2.0 40.5 1227 450 49,700 378 2.0 39.8 1233 436 49,000 370 2.0 Alloy 22 17.2 1016 692 17,500 152 2.0 17.8 1019 760 18,100 157 2.0 Alloy 23 53.0 1236 492 65,500 507 2.1 36.4 1184 494 43,100 312 2.1 48.5 1250 513 60,700 457 2.1 Alloy 24 45.0 1247 482 56,200 417 2.0 49.2 1254 492 61,800 464 2.1 45.9 1247 482 57,300 427 2.1 Alloy 25 41.5 1260 480 52,300 378 2.1 34.0 1169 486 39,700 286 2.1 56.9 1250 482 71,100 567 2.1 Alloy 26 49.1 1276 473 62,600 473 2.1 50.7 1290 484 65,400 493 2.1 Alloy 27 51.3 1252 451 64,200 495 2.1 35.6 1230 456 43,800 306 2.0 46.6 1256 437 58,500 438 2.1 Alloy 28 46.7 1283 414 59,800 444 2.0 47.3 1271 412 60,200 450 2.0 48.5 1269 412 61,500 467 2.1 Alloy 29 45.2 1312 446 59,300 441 2.0 47.2 1310 455 61,800 464 2.0 45.3 1318 450 59,800 439 2.0 Alloy 30 43.1 1318 428 56,700 410 2.0 43.8 1338 430 58,600 421 2.0 37.4 1313 430 49,100 341 2.0 Alloy 31 39.0 1293 408 50,400 355 2.0 33.5 1271 405 42,500 284 2.0 40.2 1297 410 52,200 372 2.0 Alloy 32 41.4 951 650 39,300 353 2.1 42.7 962 650 41,100 365 2.1 42.6 960 654 40,900 371 2.1 Alloy 33 57.4 829 533 47,600 436 1.9 62.7 831 543 52,100 480 1.9 59.4 831 542 49,300 452 1.9 Alloy 34 53.9 855 571 46,100 422 1.8 57.2 855 586 48,900 452 1.8 56.2 857 583 48,200 444 1.8 Alloy 35 59.2 826 473 48,900 442 1.8 60.8 836 486 50,800 460 1.9 61.2 836 478 51,200 463 1.9 Alloy 36 59.2 736 415 43,600 396 1.8 59.4 732 408 43,500 395 1.8 61.8 745 430 46,000 421 1.8 Alloy 37 46.1 970 539 44,700 361 2.0 38.2 939 539 35,800 292 2.0 38.8 943 535 36,500 298 2.0 Alloy 38 63.1 844 446 53,300 479 1.9 66.4 839 457 55,700 503 2.0 61.5 840 447 51,600 465 2.0 65.2 851 463 55,400 502 2.0 Alloy 39 64.5 893 455 57,600 513 2.0 61.2 877 438 53,700 478 2.0 64.5 875 430 56,400 503 2.0 61.5 890 428 54,700 486 2.0 Alloy 40 61.4 948 423 58,200 515 1.9 62.8 945 436 59,300 527 1.9 62.5 946 440 59,000 525 1.9 64.2 946 451 60,600 540 1.9
Further Laboratory Processing into Sheet Through Cold Rolling and Annealing
[0053] Alloys with chemistries listed in Table 1 were laboratory cast into ingots with 50 mm thickness. The ingots then were hot rolled at the temperature in a range between 1100.degree. C. and 1250.degree. C. and afterward the hot rolled material (i.e. hot band) was media blasted prior to cold rolling to remove surface oxides which could become embedded during the rolling process. Final thickness after cold rolling are preferably from 0.5 mm to 3.0 mm with variable reduction per pass ranging from 10% to 50%.
[0054] For this specific study, hot rolling was done to produce sheet in a range from 1.9 mm to 2.3 mm which was cold rolled using a Fenn Model 061 2 high rolling mill to a thickness range from 1.1 to 1.4 mm with reductions from 10% to 40%. Once the final gauge thickness was reached, tensile samples were cut from the laboratory sheet by wire-EDM. An example of tensile specimen before testing and its dimensions are shown in FIG. 3. The samples were annealed under conditions intended to simulate the thermal exposure expected during an industrial continuous annealing process (850.degree. C. for 10 min) or batch annealing (950.degree. C. for 6 hr) representing final treatment of sheet material in Step 2 in FIG. 2. Samples for 850.degree. C. heat treatment were wrapped in stainless steel foil to prevent oxidation and loaded into a preheated furnace at 850.degree. C. Samples were left in the furnace for 10 minutes while the furnace purged with argon before being removed and allowed to air cool. Samples for 950.degree. C. heat treatment were placed in a hydrogen furnace at room temperature, heated up to 950.degree. C. in hydrogen and argon atmosphere, held for 6 hours, and cooled in the furnace to less than 100.degree. C. in argon.
[0055] Tensile properties were measured on an Instron mechanical testing frame (Model 3369), utilizing Instron's Bluehill control and analysis software. All tests were run at ambient temperature in displacement control at a constant displacement rate of 0.036 mm/s.
[0056] Tensile properties of sheet material with thickness from 1.1 to 1.4 mm from alloys herein after annealing at 850.degree. C. for 10 min are listed in Table 5. The ultimate tensile strength values of the annealed sheet from alloys herein are in a range from 717 to 1414 MPa, the yield strength at 0.2% offset varies from 273 to 838 MPa, the total elongation recorded in the range from 20.8 to 78.9%, strength ductility product toughness varies from 20,500 to 77,100 MPa %, and area under tensile stress-strain curve is calculated in a range from 135 to 677 N/mm.sup.2. Note that the Table 5 properties correspond to Step 2 in FIG. 2.
TABLE-US-00005 TABLE 5 Tensile Properties Of Final Sheet After Annealing At 850.degree. C. For 10 min Area Under Total Ultimate Yield Strength Stress-Strain Elonga- Tensile Strength, Ductility Curve tion Strength 0.2% Offset Product (N mm/ Alloy (%) (MPa) (MPa) (MPa %) mm.sup.3) Alloy 1 78.6 887 455 69,700 616 78.9 888 459 70,000 619 78.5 880 455 69,100 613 77.7 890 467 69,100 614 Alloy 2 76.4 762 355 58,200 509 73.1 756 350 55,200 481 76.4 761 356 58,100 511 72.0 755 352 54,400 475 Alloy 3 67.4 838 339 56,500 470 65.3 825 333 53,800 446 62.3 830 336 51,700 427 62.9 815 333 51,200 423 Alloy 4 65.3 773 366 50,400 432 71.8 778 359 55,800 481 72.0 774 361 55,700 483 68.5 774 363 53,000 458 Alloy 5 72.9 755 394 55,000 492 69.9 757 392 52,900 474 69.3 752 389 52,100 463 67.9 752 395 69,700 454 Alloy 6 40.5 1390 522 56,200 399 39.7 1393 518 55,300 390 42.6 1396 534 59,400 429 Alloy 7 55.2 1243 609 68,600 543 56.0 1274 604 71,200 554 Alloy 8 47.2 951 660 44,900 423 42.5 966 626 41,100 386 46.9 954 637 44,700 422 41.1 965 644 39,700 372 Alloy 9 43.6 1407 623 61,100 453 43.7 1414 639 61,600 454 Alloy 10 57.6 1120 615 64,400 563 58.8 1124 668 66,000 577 57.4 1121 651 64,300 560 Alloy 11 48.1 1354 563 65,100 476 46.6 1338 568 62,400 455 49.7 1333 560 66,200 493 Alloy 12 38.0 1251 613 47,600 361 37.4 1253 599 46,800 354 38.0 1251 610 47,600 362 Alloy 13 38.6 1052 581 40,600 328 44.7 1095 573 48,900 388 42.2 1085 574 45,800 366 Alloy 14 48.4 1219 401 59,000 425 47.3 1226 409 57,900 417 51.6 1208 408 62,300 468 Alloy 15 51.6 1052 317 54,300 406 50.4 1087 320 54,800 394 55.4 1053 321 58,400 446 Alloy 16 42.3 1317 477 55,700 387 42.6 1310 481 55,800 394 48.5 1301 482 63,100 467 46.9 1307 474 61,300 447 Alloy 17 49.0 1331 663 65,200 504 53.1 1330 663 70,600 560 52.4 1325 649 69,500 550 Alloy 18 39.2 1232 648 48,300 383 38.5 1234 669 47,500 375 37.5 1229 644 46,100 363 Alloy 19 43.9 1205 619 52,900 409 52.0 1271 621 66,100 511 59.2 1302 616 77,100 604 Alloy 20 20.8 982 435 20,500 135 22.9 1078 463 24,700 160 23.0 1103 466 25,300 162 Alloy 21 26.8 1070 343 28,700 187 22.7 1017 342 23,100 151 30.5 1139 349 34,700 235 Alloy 22 37.8 1055 768 39,900 373 39.9 1036 838 41,300 386 36.3 1038 745 37,600 349 Alloy 23 56.1 1225 463 68,800 518 56.5 1214 462 68,600 518 56.2 1219 470 68,400 519 Alloy 24 56.9 1244 473 70,800 531 53.5 1229 470 65,700 491 53.1 1241 465 65,900 484 Alloy 25 47.4 1249 474 59,100 421 57.3 1236 470 70,800 542 52.0 1241 474 64,500 483 Alloy 26 48.4 1288 451 62,300 445 50.3 1270 463 63,900 471 50.2 1285 461 64,500 469 Alloy 27 45.1 1304 455 58,800 406 51.1 1287 472 65,700 481 46.0 1282 460 59,000 422 Alloy 28 45.2 1301 460 58,700 418 43.3 1279 439 55,400 390 46.6 1279 457 59,600 435 Alloy 29 44.9 1326 439 59,500 415 43.6 1321 443 57,500 402 49.5 1315 442 65,100 477 Alloy 30 46.0 1348 445 62,100 434 45.2 1345 436 60,800 427 44.8 1330 444 59,600 421 Alloy 31 45.5 1324 443 60,200 516 44.6 1367 448 61,000 517 44.8 1346 439 60,200 508 Alloy 32 67.1 1027 551 68,900 606 73.2 1048 571 76,700 677 66.6 1051 574 70,000 611 Alloy 33 68.7 819 367 56,300 489 68.2 823 371 56,100 488 69.1 829 374 57,200 499 Alloy 34 50.3 918 478 46,200 414 53.4 918 477 49,000 441 53.1 899 449 47,700 423 Alloy 35 75.4 795 287 60,000 508 66.3 784 292 52,000 437 75.8 798 293 60,500 513 Alloy 36 74.2 717 273 53,200 463 71.9 727 282 52,300 454 71.4 739 282 52,800 456 Alloy 37 57.5 1041 368 59,900 460 53.9 1048 372 56,500 430 56.7 1020 365 57,800 452 Alloy 38 71.7 845 379 60,500 530 73.3 846 373 61,900 542 70.7 853 389 60,200 528 68.2 850 381 58,000 505 Alloy 39 69.9 894 390 62,400 537 69.1 903 388 62,400 534 71.7 904 394 64,800 557 70.4 883 376 62,000 534 Alloy 40 70.3 971 402 68,200 576 71.9 956 408 68,600 588 68.6 956 403 65,500 557 71.1 935 391 66,500 569
[0057] Tensile properties of sheet material with thickness from 1.1 to 1.4 mm from alloys herein after annealing at 950.degree. C. for 6 hr are listed in Table 6. The ultimate tensile strength values of the annealed sheet from alloys herein are in a range from 679 to 1418 MPa, the yield strength at 0.2% offset varies from 209 to 588 MPa, the total elongation recorded in the range from 12.0 to 88.2%, strength ductility product toughness varies from 11,000 to 76,200 MPa %, and area under tensile stress-strain curve is calculated in a range from 101 to 663 N/mm.sup.2. Note that the Table 6 properties correspond to Step 2 in FIG. 2.
TABLE-US-00006 TABLE 6 Tensile Properties of Final Sheet After Annealing At 950.degree. C. For 6 Hr Area Under Total Ultimate Yield Strength Stress-Strain Elonga- Tensile Strength, Ductility Curve tion Strength 0.2% Offset Product (N mm/ Alloy (%) (MPa) (MPa) (MPa %) mm.sup.3) Alloy 1 84.6 849 328 71,800 594 81.6 850 330 69,300 572 85.8 828 322 71,100 591 84.5 845 328 71,400 591 Alloy 2 88.2 687 281 60,600 526 80.8 684 281 55,300 473 86.6 688 283 59,600 514 81.8 683 280 55,800 475 Alloy 3 76.2 747 275 56,900 460 75.8 751 275 56,900 456 74.7 753 273 56,200 455 85.9 758 278 65,100 536 Alloy 4 75.6 696 287 52,600 443 82.4 703 291 57,900 495 83.7 699 288 58,500 498 83.9 705 288 59,100 507 Alloy 5 81.6 681 305 55,500 489 82.6 679 302 56,100 495 78.2 684 308 53,500 473 78.7 682 305 53,700 473 Alloy 6 27.1 1247 334 33,600 191 31.8 1328 340 42,300 254 42.4 1353 342 57,300 391 34.5 1332 338 45,800 285 Alloy 7 46.5 1304 355 60,600 417 43.4 1304 357 56,600 378 41.0 1301 358 53,300 347 47.1 1304 361 61,400 428 Alloy 8 38.9 919 467 35,800 330 47.1 923 474 43,400 406 53.7 925 447 49,600 466 42.2 923 456 38,900 360 Alloy 9 34.6 1418 356 49,000 308 29.8 1379 354 41,000 238 28.1 1340 346 37,500 213 27.2 1332 346 36,100 203 Alloy 10 31.8 1083 427 34,400 257 31.2 1081 433 33,700 252 32.4 1104 427 35,700 266 Alloy 11 39.1 1327 356 51,900 328 33.6 1266 354 42,600 252 33.7 1270 357 42,800 254 Alloy 12 32.7 1236 319 40,400 289 33.0 1236 319 40,800 292 33.2 1240 318 41,100 294 Alloy 13 45.9 952 396 43,700 326 46.0 954 396 43,800 326 Alloy 14 41.9 1242 299 52,100 333 41.7 1236 303 51,500 331 47.7 1232 301 58,800 406 Alloy 15 46.7 1065 240 49,700 332 40.7 1069 240 43,500 271 44.8 1083 241 48,500 324 Alloy 16 41.3 1256 328 51,800 340 41.6 1261 310 52,500 346 44.9 1256 321 56,400 386 48.6 1250 321 60,700 432 Alloy 17 42.7 1404 377 59,900 410 42.9 1401 377 60,100 414 43.4 1401 377 60,800 420 Alloy 18 32.9 1264 380 41,600 310 32.4 1257 370 40,700 303 32.2 1260 370 40,600 302 Alloy 19 43.9 1078 405 47,300 327 40.3 1030 405 41,500 291 40.6 1041 406 42,300 295 Alloy 20 40.3 1273 300 51,300 344 39.2 1275 299 50,000 335 40.7 1300 301 52,900 354 Alloy 21 39.4 1202 240 47,300 331 39.1 1196 241 46,800 325 36.8 1201 242 44,200 302 Alloy 22 13.8 930 563 12,800 117 15.1 940 588 14,200 129 12.0 916 556 11,000 101 Alloy 23 52.2 1195 333 62,300 429 56.9 1192 334 67,800 487 49.8 1201 332 59,800 404 Alloy 24 53.9 1179 338 63,500 448 51.1 1189 329 60,700 421 55.0 1193 330 65,700 467 Alloy 25 38.7 1142 326 44,200 278 55.5 1203 326 66,700 473 55.1 1198 329 66,000 470 Alloy 26 42.4 1244 318 52,700 334 37.9 1210 322 45,800 281 49.1 1233 320 60,600 418 Alloy 27 50.7 1234 315 62,600 436 50.5 1237 326 62,400 440 47.2 1233 316 58,100 397 Alloy 28 44.9 1232 302 55,400 376 46.1 1248 315 57,500 393 38.1 1228 301 46,800 296 Alloy 29 39.8 1297 310 51,700 321 45.3 1269 321 57,400 389 42.2 1279 321 53,900 348 Alloy 30 44.8 1279 321 57,300 384 46.3 1297 321 60,100 403 44.4 1298 318 57,600 378 Alloy 31 47.5 1311 323 62,200 419 41.7 1268 317 52,800 343 42.0 1284 324 54,000 349 Alloy 32 87.4 868 406 75,800 659 84.9 869 407 73,700 638 88.1 865 406 76,200 663 Alloy 33 79.2 716 260 56,700 474 83.1 716 261 59,500 502 83.1 716 261 59,500 501 Alloy 34 73.0 775 296 56,500 481 67.9 788 307 53,600 456 69.2 776 302 53,700 456 Alloy 35 84.9 712 226 60,400 501 79.0 699 225 55,200 454 81.0 697 227 56,400 464 Alloy 36 76.6 725 209 55,500 456 77.8 717 212 55,800 461 77.1 718 209 55,400 455 Alloy 37 36.4 736 238 26,800 176 29.2 693 239 20,200 135 29.9 706 238 21,100 140 Alloy 38 81.3 791 289 64,300 546 77.8 792 291 61,600 520 78.0 779 287 60,800 515 Alloy 39 78.3 868 294 67,900 556 79.2 861 292 68,200 559 79.0 866 294 68,300 560 Alloy 40 77.1 959 290 73,900 593 74.7 947 292 70,700 569 74.7 955 290 71,400 575
Toughness Testing
[0058] Materials toughness was measured by Charpy V-notch testing and bulk fracture testing. Charpy V-notch and bulk fracture samples were machined by wire EDM from cold rolled sheet. Charpy V-notch samples are machined in an L-T orientation (sample length in rolling direction, notch in transverse direction), while bulk fracture samples are machined in L-N orientation (length in rolling direction, striking direction is normal to rolled surface). The samples were then annealed either at 850.degree. C. for 10 minutes in argon/air atmosphere or at 950.degree. C. for 6 hours in hydrogen atmosphere.
[0059] The geometry of Charpy V-notch samples were cut in accordance with ASTM E23-12c (10 mm.times.55 mm.times.thickness with a centered 45.degree. V-notch of 0.25 mm radius, 2 mm in depth with a surface finish Ra of less than 2.0 .mu.m on notch and strike face). An example of the Charpy V-notch specimen before testing and its schematic illustration are shown in FIG. 4. Charpy V-notch samples are mounted using self-centering tongs to ensure the samples are centered on the anvil. Testing was done by using the Instron SI-1B Pendulum Impact Tester. The arm of the Impact Tester is set to the high latch position with 26.6 lb weights configured for indicating dial maximum reading of 120 ft-lb (162.7 J). The latch is released and the reading of energy absorbed by the sample is recorded in ft-lb and then converted to joules. The grips of bulk fracture Charpy samples are placed in a cutout in the anvil and a screw is tightened down on the grips to constrain the sample in the anvil.
[0060] Testing results are shown in Table 7. Absorbed energy values during Charpy V-notch testing of alloys herein are in a range from 0.7 to 26.1 J in cold rolled and annealed sheet with thickness from 1.1 to 1.4 mm. Thickness normalized values of the Charpy V-notched toughness vary from 0.5 to 21.8 J/mm. Note that the Table 7 properties correspond to Step 2 in FIG. 2.
TABLE-US-00007 TABLE 7 Charpy V-Notch Testing Data (1.1 to 1.4 mm Thickness) Thickness V-Notch Charpy Normalized V-Notch Toughness Thickness Charpy Toughness Alloy Annealing (J) (mm) (J/mm) Alloy 1 850.degree. C. 10 min 10.8 10.5 11.2 1.2 9.0 8.8 9.3 950.degree. C. 6 hr 16.3 18.3 19.0 1.2 13.6 15.3 15.8 Alloy 2 850.degree. C. 10 min 16.3 13.2 13.6 1.2 13.6 11.0 11.3 950.degree. C. 6 hr 15.6 15.6 12.2 1.2 13.0 13.0 10.2 Alloy 3 850.degree. C. 10 min 13.6 14.2 16.3 1.2 11.3 11.8 13.6 950.degree. C. 6 hr 20.7 16.9 15.9 1.2 17.3 14.1 13.3 Alloy 4 850.degree. C. 10 min 14.2 14.9 14.2 1.2 11.8 12.4 11.8 950.degree. C. 6 hr 20.7 13.2 19.0 1.2 17.3 11.0 15.8 Alloy 5 850.degree. C. 10 min 14.2 15.6 14.9 1.3 10.9 12.0 11.5 950.degree. C. 6 hr 19.3 19.3 17.3 1.3 14.8 14.8 13.3 Alloy 6 850.degree. C. 10 min 13.6 13.9 12.9 1.2 11.3 11.6 10.8 950.degree. C. 6 hr 20.3 20.0 15.6 1.2 16.9 16.7 13.0 Alloy 7 850.degree. C. 10 min 11.2 12.2 12.2 1.2 9.3 10.2 10.2 950.degree. C. 6 hr 16.9 18.3 16.3 1.2 14.1 15.3 13.6 Alloy 8 850.degree. C. 10 min 6.1 4.7 6.8 1.2 5.1 3.9 5.7 950.degree. C. 6 hr 1.7 1.7 1.7 1.2 1.4 1.4 1.4 Alloy 9 850.degree. C. 10 min 13.9 12.9 13.6 1.3 10.7 9.9 10.5 950.degree. C. 6 hr 16.9 17.3 19.0 1.3 13.0 13.3 14.6 Alloy 10 850.degree. C. 10 min 9.5 9.5 10.2 1.2 7.9 7.9 8.5 950.degree. C. 6 hr 7.8 7.8 7.1 1.2 6.5 6.5 5.9 Alloy 11 850.degree. C. 10 min 12.5 12.9 13.2 1.2 10.4 10.8 11.0 950.degree. C. 6 hr 18.3 14.9 16.9 1.2 15.3 12.4 14.1 Alloy 12 850.degree. C. 10 min 12.5 11.5 13.6 1.2 10.4 9.6 11.3 950.degree. C. 6 hr 13.9 15.3 13.6 1.2 11.6 12.8 11.3 Alloy 13 850.degree. C. 10 min 10.2 9.5 9.2 1.2 8.5 7.9 7.7 950.degree. C. 6 hr 13.6 15.6 14.6 1.2 11.3 13.0 12.2 Alloy 14 850.degree. C. 10 min 13.6 14.2 13.2 1.2 11.3 11.8 11.0 950.degree. C. 6 hr 17.6 16.6 18.6 1.2 14.7 13.8 15.5 Alloy 15 850.degree. C. 10 min 12.9 12.9 14.9 1.2 10.8 10.8 12.4 950.degree. C. 6 hr 12.9 18.6 14.6 1.2 10.8 15.5 12.2 Alloy 16 850.degree. C. 10 min 16.3 14.9 14.2 1.2 13.6 12.4 11.8 950.degree. C. 6 hr 15.3 19.7 19.0 1.2 12.8 16.4 15.8 Alloy 17 850.degree. C. 10 min 14.2 12.9 13.2 1.4 10.1 9.2 9.4 950.degree. C. 6 hr 19.0 18.3 19.0 1.4 13.6 13.1 13.6 Alloy 18 850.degree. C. 10 min 12.2 12.2 10.5 1.2 10.2 10.2 8.8 950.degree. C. 6 hr 16.9 18.0 16.3 1.2 14.1 15.0 13.6 Alloy 19 850.degree. C. 10 min 9.8 9.8 9.5 1.4 7.0 7.0 6.8 950.degree. C. 6 hr 17.3 17.3 16.3 1.4 12.4 12.4 11.6 Alloy 20 850.degree. C. 10 min 13.9 14.6 15.3 1.2 11.6 12.2 12.8 950.degree. C. 6 hr 19.0 19.0 16.9 1.3 14.6 14.6 13.0 Alloy 21 850.degree. C. 10 min 14.6 15.3 14.2 1.2 12.2 12.8 11.8 950.degree. C. 6 hr 12.5 16.9 17.6 1.2 10.4 14.1 14.7 Alloy 22 850.degree. C. 10 min 1.4 1.4 1.4 1.4 1.0 1.0 1.0 950.degree. C. 6 hr 0.7 0.7 0.7 1.4 0.5 0.5 0.5 Alloy 23 850.degree. C. 10 min 14.9 15.6 12.9 1.2 12.4 13.0 10.8 950.degree. C. 6 hr 14.9 16.9 16.9 1.2 12.4 14.1 14.1 Alloy 24 850.degree. C. 10 min 14.2 15.9 16.9 1.1 12.9 14.5 15.4 950.degree. C. 6 hr 26.1 16.3 17.6 1.2 21.8 13.6 14.7 Alloy 25 850.degree. C. 10 min 12.5 13.9 12.9 1.2 10.4 11.6 10.8 950.degree. C. 6 hr 17.6 19.0 16.9 1.2 14.7 15.8 14.1 Alloy 26 850.degree. C. 10 min 13.6 14.9 14.2 1.2 11.3 12.4 11.8 950.degree. C. 6 hr 15.3 17.3 17.6 1.2 12.8 14.4 14.7 Alloy 27 850.degree. C. 10 min 13.6 14.2 13.6 1.2 11.3 11.8 11.3 950.degree. C. 6 hr 14.9 16.9 16.3 1.2 12.4 14.1 13.6 Alloy 28 850.degree. C. 10 min 14.6 14.6 14.9 1.2 12.2 12.2 12.4 950.degree. C. 6 hr 18.6 14.9 14.2 1.2 15.5 12.4 11.8 Alloy 29 850.degree. C. 10 min 14.9 14.9 15.6 1.2 12.4 12.4 13.0 950.degree. C. 6 hr 16.3 14.8 18.0 1.2 13.6 12.3 15.0 Alloy 30 850.degree. C. 10 min 14.9 14.9 16.3 1.2 12.4 12.4 13.6 950.degree. C. 6 hr 19.3 17.3 14.9 1.2 16.1 14.4 12.4 Alloy 31 850.degree. C. 10 min 13.6 16.3 14.9 1.2 11.3 13.6 12.4 950.degree. C. 6 hr 15.6 16.3 14.9 1.2 13.0 13.6 12.4 Alloy 32 850.degree. C. 10 min 8.1 8.5 8.1 1.2 6.8 7.1 6.8 950.degree. C. 6 hr 16.3 17.3 16.3 1.2 13.6 14.4 13.6 Alloy 33 850.degree. C. 10 min 10.2 10.5 8.5 1.2 8.5 8.8 7.1 950.degree. C. 6 hr 13.9 14.2 13.6 1.2 11.6 11.8 11.3 Alloy 34 850.degree. C. 10 min 5.4 5.4 5.4 1.2 4.5 4.5 4.5 950.degree. C. 6 hr 10.8 10.8 11.2 1.2 9.0 9.0 9.3 Alloy 35 850.degree. C. 10 min 13.2 12.9 13.6 1.2 11.0 10.8 11.3 950.degree. C. 6 hr 13.9 15.3 13.2 1.2 11.6 12.8 11.0 Alloy 36 850.degree. C. 10 min 9.5 11.2 9.5 1.2 7.9 9.3 7.9 950.degree. C. 6 hr 13.2 11.5 13.9 1.2 11.0 9.6 11.6 Alloy 37 850.degree. C. 10 min 12.5 11.9 12.5 1.2 10.4 9.9 10.4 950.degree. C. 6 hr 11.5 15.3 13.6 1.2 9.6 12.8 11.3 Alloy 38 850.degree. C. 10 min 11.6 10.2 9.9 1.2 9.4 8.2 8.1 950.degree. C. 6 hr 14.0 13.3 13.5 1.2 11.7 11.5 10.9 Alloy 39 850.degree. C. 10 min 13.3 11.3 12.1 1.2 10.9 9.3 9.9 950.degree. C. 6 hr 13.5 13.3 15.5 1.2 11.8 11.1 13.2 Alloy 40 850.degree. C. 10 min 11.3 11.6 10.5 1.2 9.5 10.0 8.8 950.degree. C. 6 hr 13.8 12.4 11.6 1.2 11.9 11.0 9.7
[0061] Bulk fracture samples have 45 mm long by 2 mm wide parallel region between two wedge shaped grips designed to be clamped into a cutout in the anvil. An example of the specimen before testing and its schematic illustration are shown in FIG. 5. The grips of bulk fracture samples are placed in a cutout in the anvil of the Instron SI-1B Pendulum Impact Tester and a screw is tightened down on the grips to constrain the sample in the anvil. The arm of the Impact Tester is set to the high latch position with 26.6 lb weights configured for indicating dial maximum reading of 120 ft-lb (162.7 J). The latch is released and the reading of energy absorbed by the sample is recorded. That value is converted to joules.
[0062] Testing results are shown in Table 8. Absorbed energy values during bulk fracture testing of alloys herein are in a range from 5.8 to 75.2 J for the cold rolled and annealed sheet with thickness of 1.1 to 1.4 mm. Thickness normalized values of bulk fracture toughness vary from 4.1 to 53.7 J/mm. Note that the Table 8 properties correspond to Step 2 in FIG. 2.
TABLE-US-00008 TABLE 8 Bulk Fracture Testing Data (1.1 to 1.4 mm Thickness) Thickness Normalized Bulk Fracture Bulk Fracture Toughness Thickness Toughness Alloy Annealing (J) (mm) (J/mm) Alloy 1 850.degree. C. 10 min 41.7 43.4 43.7 1.2 34.8 36.2 36.4 950.degree. C. 6 hr 54.6 53.2 52.9 1.2 45.5 44.3 44.1 Alloy 2 850.degree. C. 10 min 33.6 34.6 35.6 1.1 30.5 31.5 32.4 950.degree. C. 6 hr 44.1 43.0 44.1 1.1 40.1 39.1 40.1 Alloy 3 850.degree. C. 10 min 42.7 43.0 42.7 1.2 35.6 35.8 35.6 950.degree. C. 6 hr 47.5 50.8 52.2 1.2 39.6 42.3 43.5 Alloy 4 850.degree. C. 10 min 38.0 37.3 38.0 1.2 31.7 31.1 31.7 950.degree. C. 6 hr 49.1 48.1 47.5 1.2 40.9 40.1 39.6 Alloy 5 850.degree. C. 10 min 38.0 37.6 36.6 1.3 29.2 28.9 28.2 950.degree. C. 6 hr 42.7 44.1 45.1 1.3 32.8 33.9 34.7 Alloy 6 850.degree. C. 10 min 50.2 51.9 52.2 1.2 41.8 43.3 43.5 950.degree. C. 6 hr 50.2 51.2 51.9 1.2 41.8 42.7 43.3 Alloy 7 850.degree. C. 10 min 53.2 54.2 54.2 1.2 44.3 45.2 45.2 950.degree. C. 6 hr 54.9 55.9 51.9 1.2 45.8 46.6 43.3 Alloy 8 850.degree. C. 10 min 25.8 27.1 27.5 1.2 21.5 22.6 22.9 950.degree. C. 6 hr 19.7 19.3 20.0 1.2 16.4 16.1 16.7 Alloy 9 850.degree. C. 10 min 59.0 59.3 57.6 1.3 45.4 45.6 44.3 950.degree. C. 6 hr 53.6 59.0 60.0 1.3 41.2 45.4 46.2 Alloy 10 850.degree. C. 10 min 31.9 30.5 33.9 1.2 26.6 25.4 28.3 950.degree. C. 6 hr 54.9 56.3 55.9 1.2 45.8 46.9 46.6 Alloy 11 850.degree. C. 10 min 55.6 53.6 55.6 1.2 46.3 44.7 46.3 950.degree. C. 6 hr 54.2 56.3 57.6 1.2 45.2 46.9 48.0 Alloy 12 850.degree. C. 10 min 45.8 44.7 45.4 1.2 38.2 37.3 37.8 950.degree. C. 6 hr 46.1 45.4 44.7 1.2 38.4 37.8 37.3 Alloy 13 850.degree. C. 10 min 54.9 54.2 55.9 1.2 45.8 45.2 46.6 950.degree. C. 6 hr 59.7 62.4 63.7 1.2 49.8 52.0 53.1 Alloy 14 850.degree. C. 10 min 50.8 49.1 49.5 1.2 42.3 40.9 41.3 950.degree. C. 6 hr 51.9 52.2 52.9 1.2 43.3 43.5 44.1 Alloy 15 850.degree. C. 10 min 49.1 50.8 48.8 1.2 40.9 42.3 40.7 950.degree. C. 6 hr 55.6 54.9 55.6 1.2 46.3 45.8 46.3 Alloy 16 850.degree. C. 10 min 59.0 53.9 54.2 1.2 49.2 44.9 45.2 950.degree. C. 6 hr 50.8 54.9 56.3 1.2 42.3 45.8 46.9 Alloy 17 850.degree. C. 10 min 67.1 61.0 61.7 1.4 47.9 43.6 44.1 950.degree. C. 6 hr 64.4 61.0 61.7 1.4 46.0 43.6 44.1 Alloy 18 850.degree. C. 10 min 44.7 43.4 43.4 1.2 37.3 36.2 36.2 950.degree. C. 6 hr 46.8 45.4 43.4 1.2 39.0 37.8 36.2 Alloy 19 850.degree. C. 10 min 59.7 60.3 60.3 1.4 42.6 43.1 43.1 950.degree. C. 6 hr 73.2 75.2 71.9 1.4 52.3 53.7 51.4 Alloy 20 850.degree. C. 10 min 50.8 50.2 48.4 1.2 42.3 41.8 40.3 950.degree. C. 6 hr 53.9 52.2 54.9 1.2 44.9 43.5 45.8 Alloy 21 850.degree. C. 10 min 46.1 43.4 44.7 1.2 38.4 36.2 37.3 950.degree. C. 6 hr 48.1 49.5 50.2 1.2 40.1 41.3 41.8 Alloy 22 850.degree. C. 10 min 27.8 27.1 28.5 1.4 19.9 19.4 20.4 950.degree. C. 6 hr 5.8 6.8 8.5 1.4 4.1 4.9 6.1 Alloy 23 850.degree. C. 10 min 50.8 52.5 55.9 1.2 42.3 43.8 46.6 950.degree. C. 6 hr 53.6 52.2 52.2 1.2 44.7 43.5 43.5 Alloy 24 850.degree. C. 10 min 51.2 52.2 52.9 1.2 42.7 43.5 44.1 950.degree. C. 6 hr 55.6 56.6 55.6 1.2 46.3 47.2 46.3 Alloy 25 850.degree. C. 10 min 55.6 54.2 52.5 1.2 46.3 45.2 43.8 950.degree. C. 6 hr 55.6 55.6 56.3 1.2 46.3 46.3 46.9 Alloy 26 850.degree. C. 10 min 52.2 51.5 50.8 1.2 43.5 42.9 42.3 950.degree. C. 6 hr 54.2 53.6 52.2 1.2 45.2 44.7 43.5 Alloy 27 850.degree. C. 10 min 51.5 50.2 50.2 1.2 42.9 41.8 41.8 950.degree. C. 6 hr 54.2 52.9 55.6 1.2 45.2 44.1 46.3 Alloy 28 850.degree. C. 10 min 48.8 48.1 50.8 1.2 40.7 40.1 42.3 950.degree. C. 6 hr 54.9 49.5 52.2 1.2 45.8 41.3 43.5 Alloy 29 850.degree. C. 10 min 54.2 54.2 57.6 1.2 45.2 45.2 48.0 950.degree. C. 6 hr 56.6 52.5 54.6 1.2 47.2 43.8 45.5 Alloy 30 850.degree. C. 10 min 51.5 52.2 52.2 1.2 42.9 43.5 43.5 950.degree. C. 6 hr 56.9 55.6 54.6 1.2 47.4 46.3 45.5 Alloy 31 850.degree. C. 10 min 49.5 50.2 49.5 1.2 41.3 41.8 41.3 950.degree. C. 6 hr 55.6 51.9 55.6 1.2 46.3 43.3 46.3 Alloy 32 850.degree. C. 10 min 43.0 44.7 43.4 1.2 35.8 37.3 36.2 950.degree. C. 6 hr 54.2 53.6 54.2 1.2 45.2 44.7 45.2 Alloy 33 850.degree. C. 10 min 40.7 37.6 41.0 1.2 33.9 31.3 34.2 950.degree. C. 6 hr 50.2 48.8 50.2 1.2 41.8 40.7 41.8 Alloy 34 850.degree. C. 10 min 35.9 33.2 35.3 1.2 29.9 27.7 29.4 950.degree. C. 6 hr 49.5 50.8 47.5 1.2 41.3 42.3 39.6 Alloy 35 850.degree. C. 10 min 43.7 44.1 42.4 1.2 36.4 36.8 35.3 950.degree. C. 6 hr 49.5 46.8 50.2 1.2 41.3 39.0 41.8 Alloy 36 850.degree. C. 10 min 42.0 40.3 42.0 1.2 35.0 33.6 35.0 950.degree. C. 6 hr 47.1 43.7 43.4 1.2 39.3 36.4 36.2 Alloy 37 850.degree. C. 10 min 58.0 54.6 56.3 1.2 48.3 45.5 46.9 950.degree. C. 6 hr 58.3 61.0 57.6 1.2 48.6 50.8 48.0 Alloy 38 850.degree. C. 10 min 38.0 37.9 38.5 1.21 31.2 31.0 32.3 950.degree. C. 6 hr 40.7 38.8 38.8 1.20 33.7 32.0 32.6 Alloy 39 850.degree. C. 10 min 38.2 38.5 38.5 1.19 31.6 32.2 33.0 950.degree. C. 6 hr 41.6 41.3 42.9 1.20 34.8 35.1 35.3 Alloy 40 850.degree. C. 10 min 37.3 40.4 38.8 1.18 32.4 33.6 32.4 950.degree. C. 6 hr 38.3 40.8 39.4 1.19 32.7 34.4 32.9
Case Examples
Case Example #1 Unbroken Samples During Charpy V-Notch Testing
[0063] Charpy V-notch specimens (FIG. 4b) were cut out by wire EDM from sheet material with thickness of 1.2 mm from alloys listed in Table 9. The specimens were tested in accordance with Charpy impact testing methodology described in the Main Body of this application. Three specimens were tested for each condition from each alloy and several specimens did not break during the testing as listed in Table 9. Examples of unbroken sample after testing are shown in FIG. 6. Note that specimens are expected to fail at the stress concentration site due to the presence of the V-notch, unbroken samples were not anticipated that indicates high toughness.
TABLE-US-00009 TABLE 9 A Summary Of Unbroken Charpy V-Notch Specimens Alloy Condition Count of Unbroken Samples Alloy 1 950.degree. C. 6 hr 2 Alloy 2 850.degree. C. 10 min 3 Alloy 2 950.degree. C. 6 hr 3 Alloy 3 850.degree. C. 10 min 3 Alloy 3 950.degree. C. 6 hr 3 Alloy 4 850.degree. C. 10 min 2 Alloy 4 950.degree. C. 6 hr 3 Alloy 5 850.degree. C. 10 min 3 Alloy 5 950.degree. C. 6 hr 1 Alloy 6 950.degree. C. 6 hr 2 Alloy 7 950.degree. C. 6 hr 1 Alloy 11 950.degree. C. 6 hr 2 Alloy 12 950.degree. C. 6 hr 3 Alloy 13 850.degree. C. 6h 3 Alloy 14 950.degree. C. 6 hr 2 Alloy 15 950.degree. C. 6 hr 3 Alloy 15 850.degree. C. 10 min 1 Alloy 18 950.degree. C. 6 hr 1 Alloy 20 950.degree. C. 6 hr 2 Alloy 21 950.degree. C. 6 hr 3
[0064] This Case Example demonstrates that alloys herein show high toughness with a resistance to failure even in the presence of a notch.
Case Example #2 Fractography of Charpy V-Notch Specimens after Testing
[0065] Specimens from Alloy 7, Alloy 9, Alloy 19, and Alloy 20 after Charpy V-notch testing in cold rolled and annealed (850.degree. C. for 10 min) state described in the Main Body section of this application were used for SEM analysis of the fracture surface. The Charpy V-notch testing results for these specific specimens from selected alloys are listed in Table 10. Fractured specimens from each alloy were mounted and analyzed by using a Zeiss MA-10 Scanning Electron Microscope (SEM). Micrographs of the fracture surface in tested specimens are shown in FIG. 7 through FIG. 10 for Alloy 7, Alloy 9, Alloy 19, and Alloy 20, respectively. Cup and cone features typical for a ductile fracture were observed in all analyzed specimens.
TABLE-US-00010 TABLE 10 Charpy V-Notch Toughness For Analyzed Specimens Alloy Charpy V-Notch Toughness (J) Alloy 7 12.2 Alloy 9 12.9 Alloy 19 9.8 Alloy 20 15.3
[0066] This Case Example demonstrates that alloys herein undergo a ductile fracture during V-notch impact testing.
Case Example #3 Fractography of Bulk Fracture Specimens after Testing
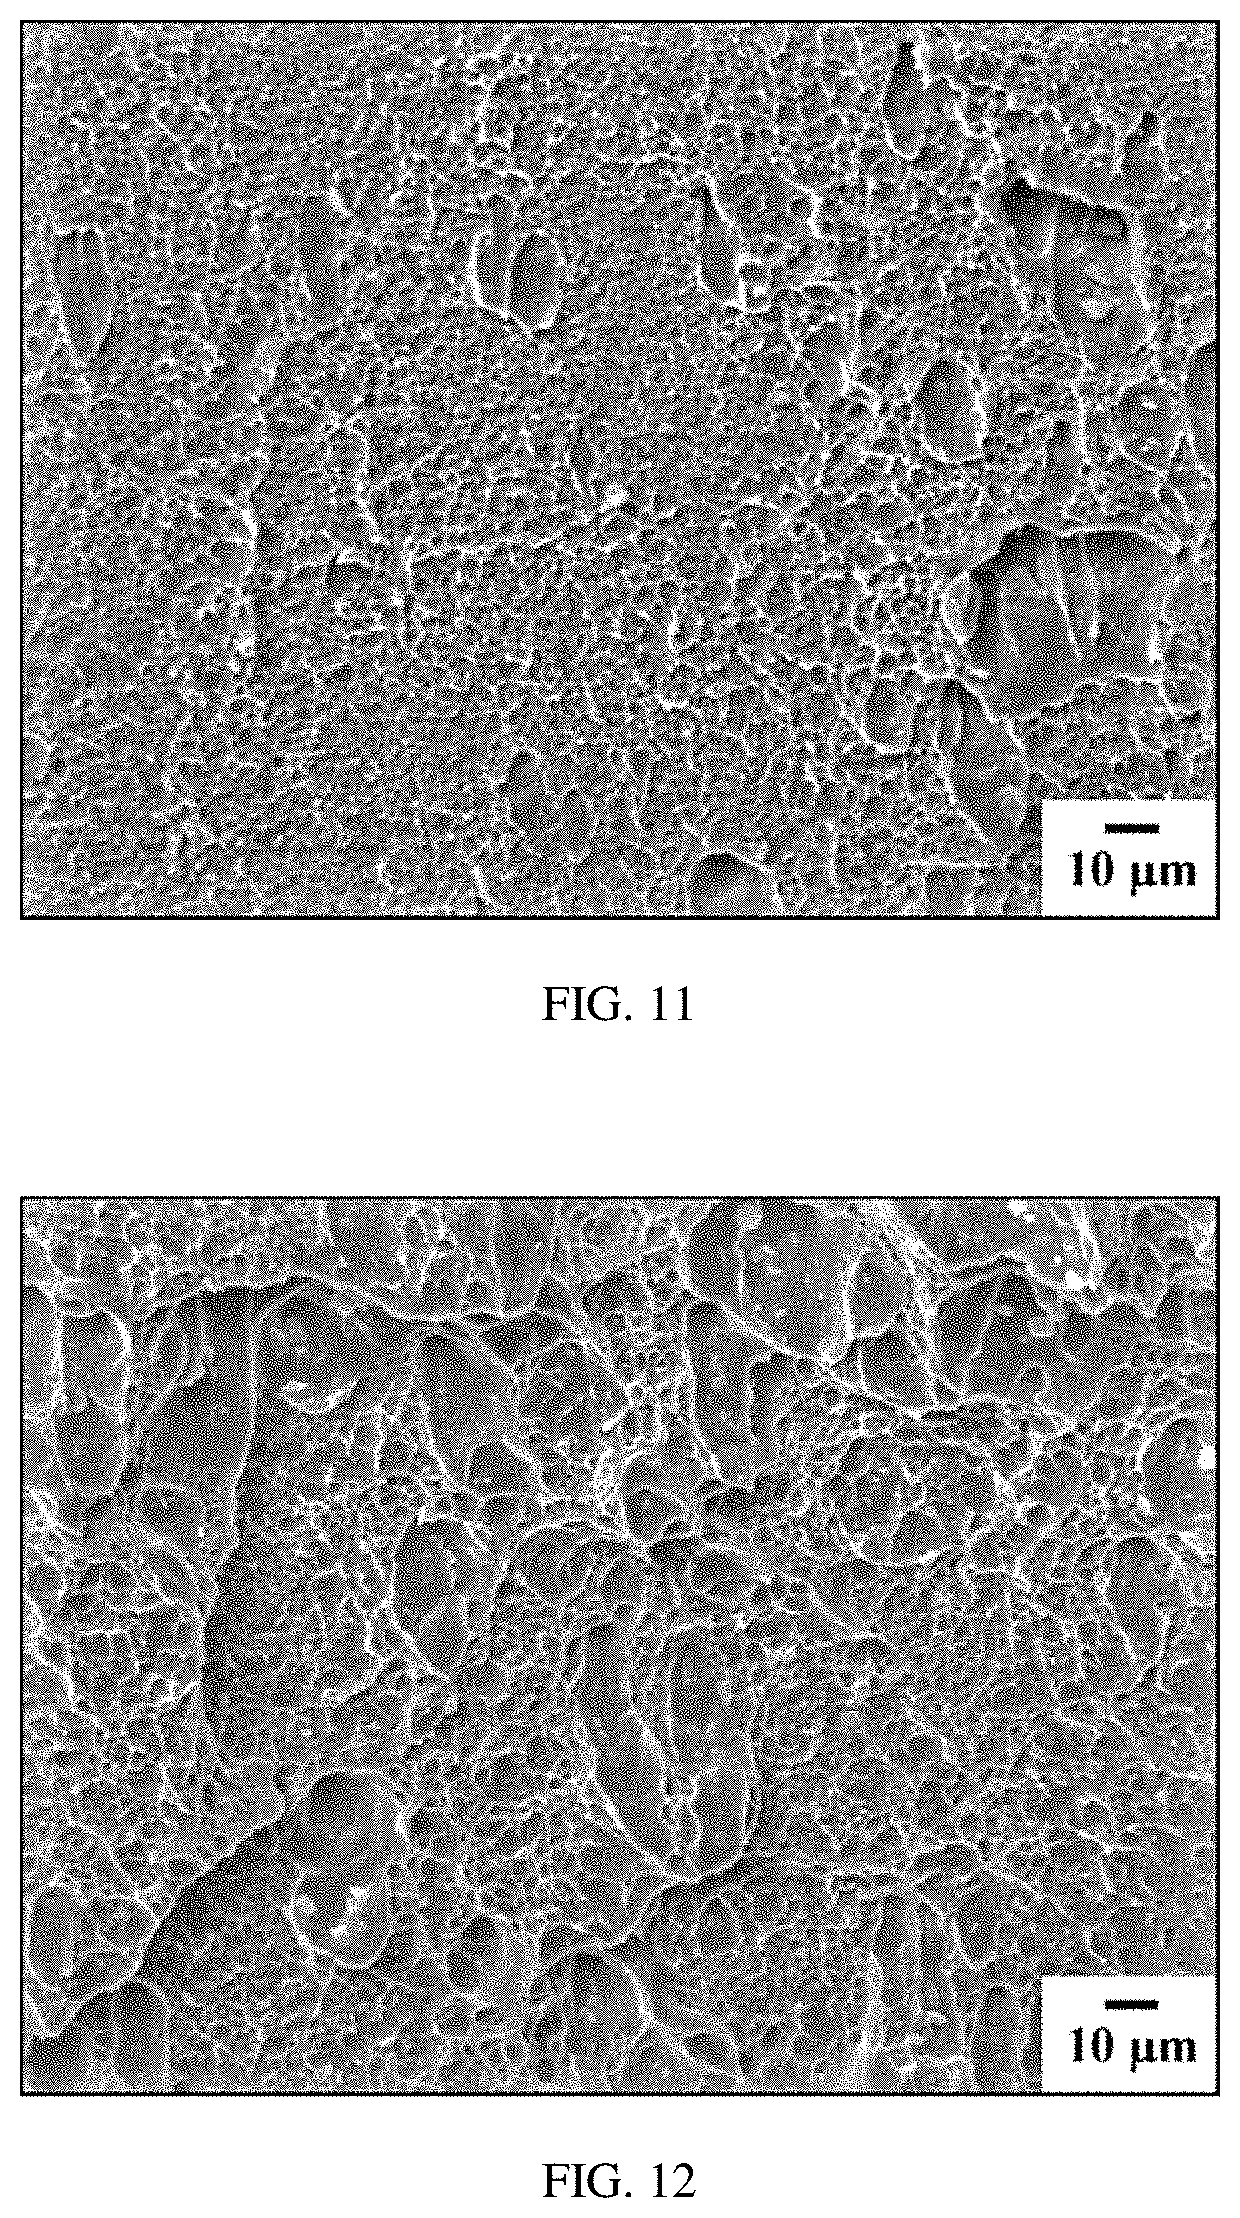
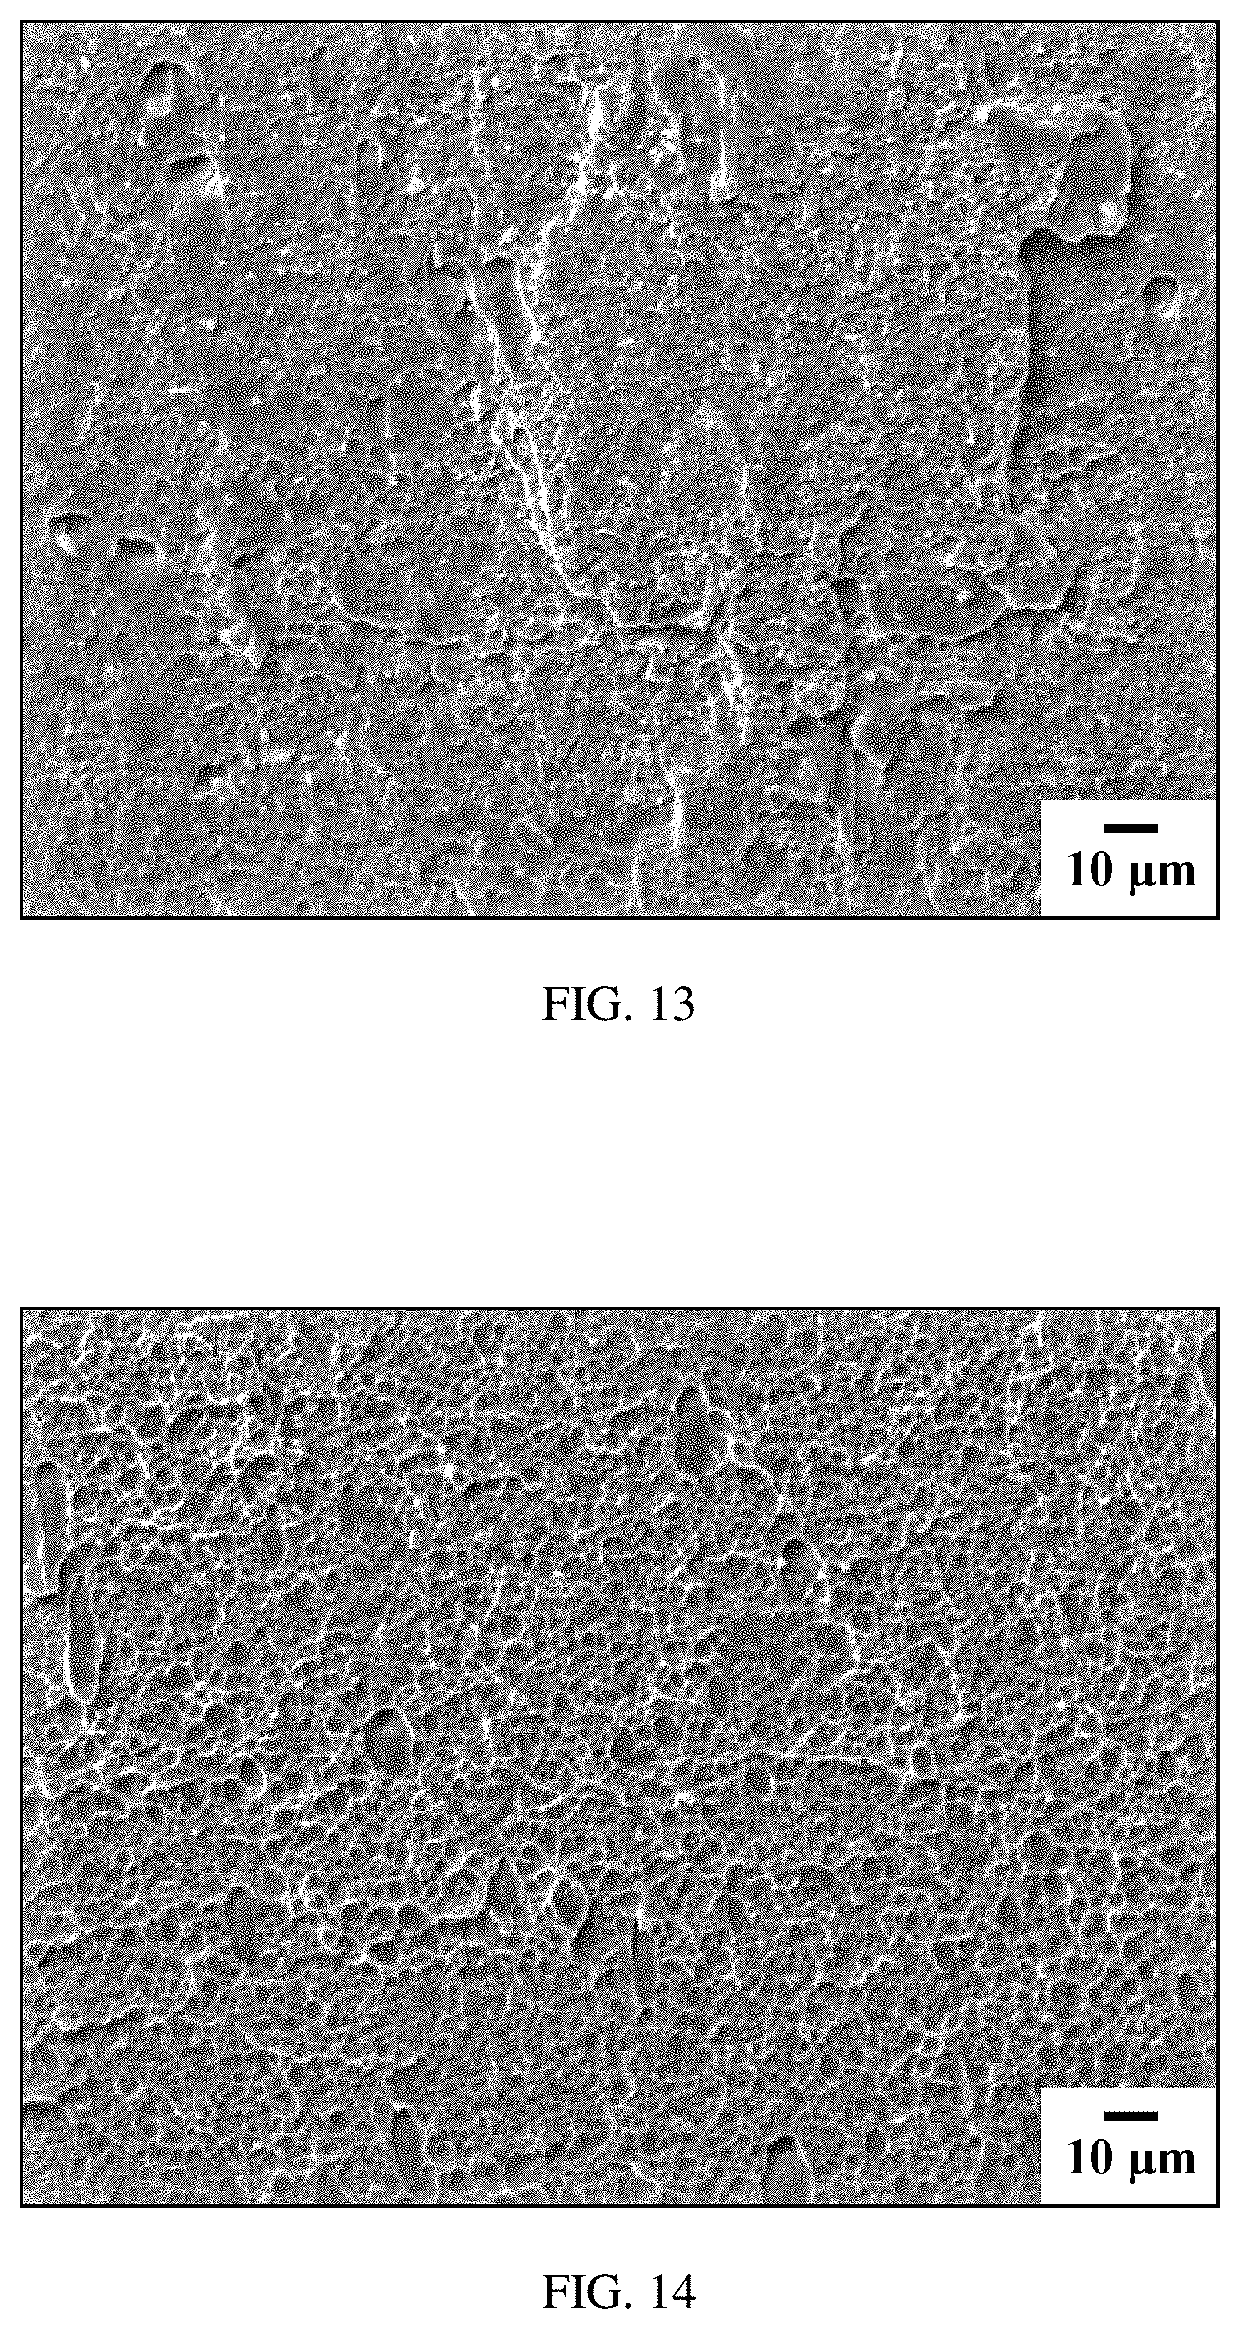
[0067] Specimens from Alloy 7, Alloy 9, Alloy 19, and Alloy 20 after bulk fracture testing in cold rolled and annealed (850.degree. C. for 10 min) state described in the Main Body section of this application were used for SEM analysis of the fracture surface. The bulk fracture testing results for these specific specimens from selected alloys are listed in Table 11. Fractured specimens from each alloy were mounted and analyzed by using a Zeiss MA-10 Scanning Electron Microscope (SEM). Micrographs of the fracture surface are shown in FIG. 11 through FIG. 14 for Alloy 7, Alloy 9, Alloy 19, and Alloy 20, respectively. Cup and cone features typical for a ductile fracture were observed in all analyzed specimens.
TABLE-US-00011 TABLE 11 Bulk Fracture Results Alloy Bulk Fracture Toughness (J) Alloy 7 54.2 Alloy 9 59.3 Alloy 19 60.3 Alloy 20 50.8
[0068] This Case Example demonstrates that alloys herein undergo a ductile fracture during bulk fracture impact testing.
[0069] As indicated from Tables 8 and 11, the normalized bulk fracture toughness range is from 4.1 to 53.7 J/mm. From the existing data the entire range of properties expected for the alloys herein according to the methodology in FIG. 2, through the identified thickness range of 0.5 to 3.0 mm, can be identified. Increasing thickness results in increasing level of toughness and over the thickness range indicated (i.e. 0.5 to 3.0 mm), the data is estimated to be linear. The lower limit of bulk fracture toughness is identified by taking the lower limit of normalized bulk fracture toughness and multiplying it by the minimum thickness of 0.5 mm. The upper limit of bulk fracture toughness is identified by taking the upper limit of normalized bulk fracture toughness and dividing it by the maximum thickness of 3.0 mm. Thus, the range of bulk fracture toughness calculated for the alloys herein is from 2.0 to 161 J.
Case Example #4 Charpy Un-Notched Specimens Testing
[0070] Slabs with thickness of 50 mm were laboratory cast from the Alloy 7 and Alloy 9 according to the atomic ratios provided in Table 1 and laboratory processed by hot rolling to thickness of 5 and 7 mm and by subsequent cold rolling to thicknesses of 1.2 and 2.5 mm. At each listed thickness, Charpy un-notched specimens were cut from the material. Specimens that were cut from the cold rolled sheet (i.e. the 1.2 mm and 2.5 mm samples) were subsequently annealed at 950.degree. C. for 6 hr as described in the Main Body section of the current application.
[0071] Charpy testing was done by using the Instron SI-1B Pendulum Impact Tester in accordance with the methodology described in the Main Body section of the current application. None of the tested specimens broke during the testing but bent and slip through the anvil. The recorded toughness, which corresponds to the work required to bend specimen and push it through the anvil is listed in Table 12 for both alloys. Examples of unbroken specimens after testing are shown in FIG. 15.
TABLE-US-00012 TABLE 12 Charpy Un-Notch Data For Selected Alloys Alloy Thickness (mm) Unnotched Charpy (J) Condition Alloy 7 1.2 20.3 10.8 17.6 Annealed Alloy 7 2.5 134.2 131.5 147.8 Annealed Alloy 7 5.0 292.9 287.4 282.0 Hot rolled Alloy 7 7.0 397.3 -- -- Hot rolled Alloy 9 1.3 20.3 23.0 23.0 Annealed Alloy 9 2.5 127.4 139.6 143.7 Annealed Alloy 9 5.0 313.2 305.1 320.0 Hot rolled Alloy 9 7.0 405.4 -- -- Hot rolled
This Case Example demonstrates high toughness of alloys herein that do not break in a case of impact testing of un-notched specimens.
Case Example #5 Charpy V-Notch Toughness as a Function of Thickness
[0072] Laboratory slabs from Alloy 7 and Alloy 9 were cast according to the atomic compositions provided in Table 1. Materials were produced at a range of thicknesses for Charpy V-notch impact testing by hot rolling, cold rolling, and annealing as previously described. The approximate thicknesses produced for testing are 1.2 mm, 2.5 mm, 5 mm, and 7 mm. For samples at thickness >2.5 mm, material was cast and hot rolled only, whereas for samples with 1.2 mm and 2.5 mm thicknesses the material was cast, hot rolled, cold rolled, and then annealed at 950.degree. C. for 6 hr as described in the Main Body section of the current application. Charpy V-Notch specimens were cut by wire EDM from the sheet material with each thickness.
[0073] Charpy testing was done by using the Instron SI-1B Pendulum Impact Tester in accordance with the methodology described in the Main Body section of the current application. Three specimens were tested at each thickness for each alloy. The measured Charpy V-notch impact energy for Alloy 7 and Alloy 9 are provided in Table 13 and Table 14, respectively. The Charpy V-notch toughness for alloys herein was measured in a range from 16.3 to 104.4 J. Thickness normalized values of the Charpy V-notched toughness vary from 12.5 to 15.6 J/mm. Note that the Table 13 and Table 14 properties correspond to sheet produced to Step 2 in both FIG. 1 and FIG. 2, depending on thickness as noted earlier. The trend in measured Charpy V-notch toughness as a function of material thickness for the alloys is shown in FIG. 16 and FIG. 17 for Alloy 7 and Alloy 9, respectively.
TABLE-US-00013 TABLE 13 Measured Charpy V-notch Toughness For Alloy 7 As A Function Of Thickness Thickness Normalized Thickness Charpy V-Notch Charpy V-Notch Sample # (mm) Toughness (J) Toughness (J/mm) 1 1.2 17.6 14.7 2 1.2 16.3 13.6 3 1.2 16.3 13.6 4 2.5 36.6 14.6 5 2.5 35.3 14.1 6 2.5 35.3 14.1 7 5.0 75.9 15.2 8 5.0 75.9 15.2 9 7.0 99.0 14.2 10 7.0 104.4 14.9 11 7.0 97.6 13.9
TABLE-US-00014 TABLE 14 Measured Charpy V-notch Toughness For Alloy 9 As A Function Of Thickness Thickness Normalized Thickness Charpy V-Notch Charpy V-Notch Sample (mm) Toughness (J) Toughness (J/mm) 1 1.2 16.3 13.6 2 1.2 16.3 13.6 3 1.2 17.6 14.7 4 2.5 36.6 14.6 5 2.5 35.3 14.1 6 2.5 33.9 13.6 7 5.0 62.4 12.5 8 5.0 63.7 12.7 9 5.0 62.4 12.5 10 7.0 89.5 12.8 11 7.0 90.8 13.0 12 7.0 89.5 12.8
[0074] This Case Example demonstrates the trend in Charpy V-notch toughness of the alloys herein as a function of sheet thickness. Note that for alloys herein, the measured Charpy V-notch toughness increases with increasing thickness.
[0075] As indicated from Tables 7, 10, 13, and 14, the normalized Charpy V-notched toughness range is from 0.5 to 21.8 J/mm. From the existing data the entire range of properties expected for the alloys here-in according to the methodology in FIG. 2, through the identified thickness range of 0.5 to 3.0 mm, can be identified. Increasing thickness results in increasing level of toughness and over the thickness range indicated (i.e. 0.5 to 3.0 mm), the data is estimated to be linear. The lower limit of Charpy V-notched toughness is identified by taking the lower limit of normalized Charpy V-notched toughness and multiplying it by the minimum thickness of 0.5 mm. The upper limit of Charpy V-notched toughness is identified by taking the upper limit of normalized Charpy V-notched toughness and dividing it by the maximum thickness of 3.0 mm. Thus, the range of Charpy V-notched toughness calculated for the alloys herein is from 0.2 to 65.4 J.
Case Example #6 Toughness Testing of Hot Band
[0076] Slabs with thickness of 50 mm were laboratory cast from selected alloys listed in Table 16 according to the atomic ratios provided in Table 1 and laboratory processed by hot rolling. Prior to hot rolling, laboratory slabs were preheated in a Lucifer EHS3GT-B18 furnace. The furnace set point varies between 1100.degree. C. to 1250.degree. C., depending on alloy melting point and point in the hot rolling process, with the initial temperatures set higher to facilitate higher reductions, and later temperatures set lower to minimize surface oxidation on the hot band. The slabs were allowed to soak for 40 minutes prior to hot rolling to ensure they reach the target temperature and then pushed out of the tunnel furnace into a Fenn Model 061 2 high rolling mill. The 50 mm casts were hot rolled for 5 to 10 passes though the mill before being allowed to air cool. Final thickness of the hot band materials was from 1.8 to 2.2 mm. Specimens for Charpy V-notch testing and bulk fracture testing were cut by wire EDM from the hot band for each alloy. Charpy V-notch testing and bulk fracture testing were done using the same procedures described in the Main Body section of the current application. For each alloy, two to three specimens were tested by each method.
[0077] Charpy V-notch and bulk fracture testing results are shown in Table 15 and Table 16, respectively. Absorbed energy representing Charpy V-notch toughness of the alloys herein is in a range from 11.9 to 23.7 J for samples with thickness from 1.8 to 2.2 mm. Thickness normalized values of the Charpy V-notched toughness vary from 6.6 to 11.9 J/mm. Note that the Table 15 properties correspond sheet produced in Step 2 in FIG. 2. Bulk fracture toughness values from alloys herein were measured in a range from 16.3 to 101.7 J for samples with thickness from 1.8 to 2.2 mm. Thickness normalized values of the bulk fracture toughness vary from 8.2 to 46.5 J/mm. Note that the Table 16 properties correspond to sheet produced in Step 2 in FIG. 2.
[0078] As indicated from Tables 13, 14, and 15, the normalized Charpy V-notched toughness range is from 6.6 to 15.2 J/mm. From the existing data the entire range of properties expected for the alloys here-in according to the methodology in FIG. 1, through the identified thickness range of 1.5 to 8.0 mm, can be identified. Increasing thickness results in increasing level of toughness and over the thickness range indicated (i.e. 1.5 to 8.0 mm), the data is estimated to be linear. The lower limit of Charpy V-notched toughness is identified by taking the lower limit of normalized Charpy V-notched toughness and multiplying it by the minimum thickness of 1.5 mm. The upper limit of Charpy V-notched toughness is identified by taking the upper limit of normalized Charpy V-notched toughness and dividing it by the maximum thickness of 8.0 mm. Thus, the range of Charpy V-notched toughness calculated for the alloys herein is from 9.9 to 121.6 J.
TABLE-US-00015 TABLE 15 Charpy V-Notch Testing Data On ~2 mm Thick Hot Band Thickness Normalized Charpy V-Notch Charpy V-Notch Toughness Thickness Toughness Alloy (J) (mm) (J/mm) Alloy 23 20.7 21.7 21.0 2.1 9.9 10.3 10.0 Alloy 24 23.0 22.4 23.0 2.1 11.0 10.7 11.0 Alloy 25 21.0 21.4 22.4 2.0 10.5 10.7 11.2 Alloy 26 22.4 22.4 22.4 2.1 10.7 10.7 10.7 Alloy 27 21.0 22.7 21.0 2.1 10.0 10.8 10.0 Alloy 28 22.4 23.7 22.0 2.0 11.2 11.9 11.0 Alloy 29 20.3 19.7 20.3 2.0 10.2 9.9 10.2 Alloy 30 21.7 20.7 22.7 2.0 10.9 10.4 11.4 Alloy 31 21.4 21.4 21.7 2.0 10.7 10.7 10.9 Alloy 32 18.6 19.0 19.0 2.1 8.9 9.0 9.0 Alloy 33 14.6 13.6 14.9 1.9 7.7 7.2 7.8 Alloy 34 14.6 12.2 13.6 1.8 8.1 6.8 7.6 Alloy 35 15.6 14.2 14.9 1.9 8.2 7.5 7.8 Alloy 36 13.2 11.9 13.2 1.8 7.3 6.6 7.3 Alloy 37 21.0 19.7 20.0 2.0 10.5 9.9 10.0
TABLE-US-00016 TABLE 16 Bulk Fracture Testing Data On ~2 mm Thick Hot Band Thickness Normalized Bulk Fracture Bulk Fracture Toughness Thickness Toughness Alloy (J) (mm) (J/mm) Alloy 8 42.7 41.4 40.3 2.2 19.4 18.8 18.3 Alloy 9 97.6 97.6 93.9 2.2 44.4 44.4 42.7 Alloy 10 91.9 98.6 93.6 2.2 41.8 44.8 42.5 Alloy 11 101.7 93.6 97.6 2.2 46.2 42.5 44.4 Alloy 12 80.0 78.6 81.3 2.1 38.1 37.4 38.7 Alloy 13 75.2 84.1 83.4 2.2 34.2 38.2 37.9 Alloy 14 80.3 85.4 82.0 2.1 38.2 40.7 39.0 Alloy 15 69.1 70.5 69.1 1.9 36.4 37.1 36.4 Alloy 16 31.9 19.7 17.6 2.0 16.0 9.9 8.8 Alloy 17 92.5 94.9 94.9 2.1 44.0 45.2 45.2 Alloy 18 83.4 86.1 84.7 2.2 37.9 39.1 38.5 Alloy 19 94.2 96.9 97.6 2.1 44.9 46.1 46.5 Alloy 20 90.2 89.5 90.5 2.2 41.0 40.7 41.1 Alloy 21 70.5 72.2 73.9 1.9 37.1 38.0 38.9 Alloy 22 16.3 23.0 27.1 2.0 8.2 11.5 13.6 Alloy 23 85.4 84.1 86.1 2.1 40.7 40.0 41.0 Alloy 24 85.1 85.4 84.7 2.1 40.5 40.7 40.3 Alloy 25 87.5 85.1 86.4 2.1 41.7 40.5 41.1 Alloy 26 90.2 90.8 87.5 2.1 43.0 43.2 41.7 Alloy 27 85.4 89.1 88.8 2.1 40.7 42.4 42.3 Alloy 28 86.1 84.7 86.4 2.0 43.1 42.4 43.2 Alloy 29 81.3 84.3 85.1 2.0 40.7 42.2 42.6 Alloy 30 86.1 82.0 84.1 2.0 43.1 41.0 42.1 Alloy 31 86.1 88.1 84.1 2.0 43.1 44.1 42.1 Alloy 32 67.5 63.0 54.9 2.1 32.1 30.0 26.1 Alloy 33 51.9 48.4 52.5 1.9 27.3 25.5 27.6 Alloy 34 51.9 51.5 50.2 1.8 28.8 28.6 27.9 Alloy 35 50.8 50.5 51.2 1.9 26.7 26.6 26.9 Alloy 36 45.4 44.7 46.4 1.8 25.2 24.8 25.8 Alloy 37 78.0 76.9 72.9 2.0 39.0 38.5 36.5
[0079] This Case Example demonstrates Charpy V-notch toughness of the alloys herein in a hot rolled condition (hot band) with a thickness more than 1.4 mm and less than or equal to 5 mm.
Case Example #7 Drop Impact Testing of Selected Alloys
[0080] Slabs with thickness of 50 mm were laboratory cast from selected alloys listed in Table 17 according to the atomic ratios provided in Table 1 and laboratory processed by hot rolling, cold rolling and annealing at 850.degree. C. for 10 min as described in the current application. Final thickness of the cold rolled and annealed sheet was from 1.1 to 1.4 mm. Strips with 100 mm width and approximately 300 mm length were cut from the produced sheet from alloys herein.
[0081] The material being drop impact tested was clamped between two steel plates. The plate under the sample has a 50 mm diameter hole centered about the point of impact. The plate above is a square frame to prevent the material from buckling during testing. The impactor utilized for the testing was made from hardened steel having 12.7 mm in diameter with a 3.18 mm radius as shown in FIG. 18. The drop height was 1.3 m. The drop carriage traveled along two precision guide rods to maintain alignment. The weight of the drop carriage and additional weights were determined using a calibrated scale. Drop weight as variable by adding and removing weights to allow determination of a highest drop impact energy when no sheet penetration occurred, and no cracks generated during the impact. The results of the drop impact testing of the alloys herein with thickness from 1.1 to 1.4 mm are listed in Table 17 showing highest drop impact energy without penetration for each alloy representing drop impact toughness and varies from 108 to 279 J. Thickness normalized values are in a range from 92 to 234 J/mm. Note that the Table 17 properties correspond to sheet produced in Step 2 in FIG. 1.
TABLE-US-00017 TABLE 17 Drop Impact Testing Of Alloys In Cold Rolled And Annealed State Highest Passing Thickness Normalized Thickness Drop Impact Drop Impact Alloy (mm) Energy (J) Toughness (J/mm) Alloy 2 1.1 207 188.2 Alloy 3 1.2 236 196.7 Alloy 4 1.2 207 172.5 Alloy 6 1.2 266 221.7 Alloy 9 1.3 207 159.2 Alloy 10 1.2 177 147.5 Alloy 11 1.2 207 172.5 Alloy 13 1.2 221 184.2 Alloy 14 1.2 250 208.3 Alloy 15 1.2 236 196.7 Alloy 17 1.3 192 147.7 Alloy 18 1.2 177 147.5 Alloy 19 1.4 221 157.9 Alloy 20 1.2 250 208.3 Alloy 21 1.2 279 232.5 Alloy 23 1.2 207 172.5 Alloy 24 1.2 208 173.3 Alloy 25 1.2 208 173.3 Alloy 26 1.2 221 184.2 Alloy 27 1.2 236 196.7 Alloy 28 1.2 221 184.2 Alloy 29 1.2 250 208.3 Alloy 30 1.2 221 184.2 Alloy 31 1.2 236 196.7 Alloy 32 1.2 192 160.0 Alloy 33 1.2 192 160.0 Alloy 34 1.2 108 90.0 Alloy 35 1.2 221 184.2 Alloy 36 1.2 177 147.5 Alloy 37 1.2 250 208.3
[0082] This Case Example demonstrates drop impact toughness of the alloys herein in a cold rolled and annealed state with a sheet thickness equal or more than 0.5 mm and less or equal to 1.4 mm.
[0083] As indicated from Table 17, the normalized drop impact toughness range is from 90.0 to 232.5 J/mm. From the existing data the entire range of properties expected for the alloys here-in according to the methodology in FIG. 2, through the identified thickness range of 0.5 to 3.0 mm, can be identified. Increasing thickness results in increasing level of toughness and over the thickness range indicated (i.e. 0.5 to 3.0 mm), the data is estimated to be linear. The lower limit of drop impact toughness is identified by taking the lower limit of normalized drop impact toughness and multiplying it by the minimum thickness of 0.5 mm. The upper limit of drop impact toughness is identified by taking the upper limit of normalized drop impact toughness and dividing it by the maximum thickness of 3.0 mm. Thus, the range of drop impact toughness calculated for the alloys herein is from 45.0 to 696.9 J.
Case Example 8 Bulk Fracture of Alloy 24 at 4 mm Thickness
[0084] A slab of Alloy 24 was cast according to the atomic ratios provided in Table 1 and laboratory processed by hot rolling. Prior to hot rolling, the slab was preheated in a Lucifer EHS3GT-B18 furnace. The slab was allowed to soak for 40 minutes prior to hot rolling to ensure that the slab reached the target temperature. The slab was pushed out of the furnace into a Fenn Model 061 2-high rolling mill. The 50 mm slab was then hot rolled to a final thickness of approximately 4 mm. Specimens for bulk fracture testing were cut by wire-EDM from the hot band. Bulk fracture testing was performed according to the procedures described in the Main Body section of this application.
[0085] The measured bulk fracture energy is provided in Table 19. All tested samples broke and subsequently stopped the hammer. Absorbed energy for the bulk fracture specimens were all measured at 119 J. Note that these measured values are slightly less than the maximum 120 J energy for the test. An image of a tested 4 mm thick bulk fracture sample is provided in FIG. 19.
TABLE-US-00018 TABLE 19 Bulk Fracture Toughness Of Alloy 24 At 4 mm Thickness Thickness Normalized Bulk Fracture Bulk Fracture Sample Toughness (J) Toughness (J/mm) 1 119 29.8 2 119 29.9 3 119 29.9
[0086] This Case Example demonstrates that for the alloys herein, bulk fracture toughness at .gtoreq.4 mm thickness is at the limit measurable by current test equipment. The measured bulk fracture toughness is almost equal to the maximum energy that can be imparted by the hammer, thereby resulting in inaccurate measurements.
[0087] As indicated from Tables 16 and 19, the normalized bulk fracture toughness range is from 8.2 to 46.5 J/mm. Note that due to experimental capacity limitations, the maximum thickness which could be tested in this laboratory system is -4 mm. From the existing data the entire range of properties expected for the alloys herein according to the methodology in FIG. 1, through the identified thickness range of 1.5 to 8.0 mm, can be identified. Increasing thickness results in increasing level of toughness and over the thickness range indicated (i.e. 1.5 to 8.0 mm), the data is estimated to be linear. The lower limit of bulk fracture toughness is identified by taking the lower limit of normalized bulk fracture toughness and multiplying it by the minimum thickness of 1.5 mm. The upper limit of bulk fracture toughness is identified by taking the upper limit of normalized bulk fracture toughness and dividing it by the maximum thickness of 8.0 mm. Thus, the range of bulk fracture toughness calculated for the alloys herein is from 12.3 to 372 J.
Case Example 9 Drop Impact Testing of Alloy 24 at 4 mm Thickness
[0088] A slab of Alloy 24 was cast according to the atomic ratios provided in Table 1 and laboratory processed by hot rolling. Prior to hot rolling, the slab was preheated in a Lucifer EHS3GT-B18 furnace. The slab was allowed to soak for 40 minutes prior to hot rolling to ensure that the slab reached the target temperature. The slab was pushed out of the furnace into a Fenn Model 061 2-high rolling mill. The 50 mm slab was then hot rolled to a final thickness of approximately 4 mm. Drop impact testing was performed according to the procedures described in the Main Body section of this application. Total impact energy of 432 J was used which is the maximum available with this test fixture.
[0089] An image of a tested 4 mm thick drop impact sample is provided in FIG. 20 and FIG. 21. Note that the material did not rupture when impacted with 432 J. A small amount of deformation was observed in the material, as shown by the impact dimple in the sheet. This Case Example demonstrates that drop impact testing alloys herein at .gtoreq.4 mm thickness does not result in failure of the material with the maximum available impact energy.
Case Example #10 Drop Impact Testing of Selected Alloys in Hot Rolled State
[0090] Slabs were cast from alloys listed in Table 20 according to the atomic ratios provided in Table 1 and laboratory processed by hot rolling. Prior to hot rolling, the slab was preheated in a Lucifer EHS3GT-B18 furnace. The slab was allowed to soak for 40 minutes prior to hot rolling to ensure that the slab reached the target temperature. The slab was pushed out of the furnace into a Fenn Model 061 2-high rolling mill. The 50 mm slab was then hot rolled to a final thickness from 2.0 to 3.2 mm. Strips with 100 mm width and approximately 300 mm length were cut from the produced sheet from alloys herein.
[0091] The material being drop impact tested was clamped between two steel plates. The plate under the sample has a 50 mm diameter hole centered about the point of impact. The plate above is a square frame to prevent the material from buckling during testing. The impactor utilized for the testing was made from hardened steel having 12.7 mm in diameter with a 3.18 mm radius as shown in FIG. 18. The drop height was 1.3 m. The drop carriage traveled along two precision guide rods to maintain alignment. The weight of the drop carriage and additional weights were determined using a calibrated scale. Drop weight was variable by adding and removing weights to allow determination of a highest drop impact energy when no sheet penetration occurred, and no cracks generated during the impact. The results of the drop impact testing of the alloys herein with thickness from 2.0 to 3.2 mm are listed in Table 20 showing highest drop impact energy without penetration for each alloy representing drop impact toughness and varies from 157 to 481 J. Thickness normalized values are in a range from 80 to 154 J/mm. Note that the Table 20 properties correspond to sheet produced in Step 2 in FIG. 1.
TABLE-US-00019 TABLE 20 Drop Impact Testing Of Alloys In Hot Rolled State Highest Passing Thickness Normalized Thickness Drop Impact Drop Impact Alloy (mm) Energy (J) Toughness (J/mm) Alloy 02 2.0 217 111 Alloy 03 2.0 232 119 Alloy 09 2.2 262 122 Alloy 09 3.1 481 154 Alloy 11 2.2 252 111 Alloy 11 3.2 481 149 Alloy 13 2.3 217 96 Alloy 16 2.1 232 112 Alloy 16 3.1 439 142 Alloy 19 2.1 187 89 Alloy 19 3.1 394 126 Alloy 29 2.0 232 119 Alloy 36 2.0 157 80 Alloy 39 2.9 246 84
[0092] This Case Example demonstrates drop impact toughness of the alloys herein in a hot rolled state with a sheet thickness equal or more than 2.0 mm and less or equal to 3.2 mm.
[0093] As indicated from Case Examples 9 and 10, the normalized drop impact toughness range is from 80 to 154 J/mm. The maximum thickness which could be tested was .about.4 mm. From the existing data the entire range of properties expected for the alloys herein according to the methodology in FIG. 1, through the identified thickness range of 1.5 to 8.0 mm, can be identified. Increasing thickness results in increasing level of toughness and over the thickness range indicated (i.e. 1.5 to 8.0 mm), the data is estimated to be linear. The lower limit of drop impact toughness is identified by taking the lower limit of normalized drop impact toughness and multiplying it by the minimum thickness of 1.5 mm. The upper limit of drop impact toughness is identified by taking the upper limit of normalized drop impact toughness and dividing it by the maximum thickness of 8.0 mm. Thus, the range of drop impact toughness calculated for the alloys herein is from 120 J to 1232 J.
* * * * *
D00000
D00001
D00002
D00003
D00004
D00005
D00006
D00007
D00008
D00009
D00010
D00011
D00012
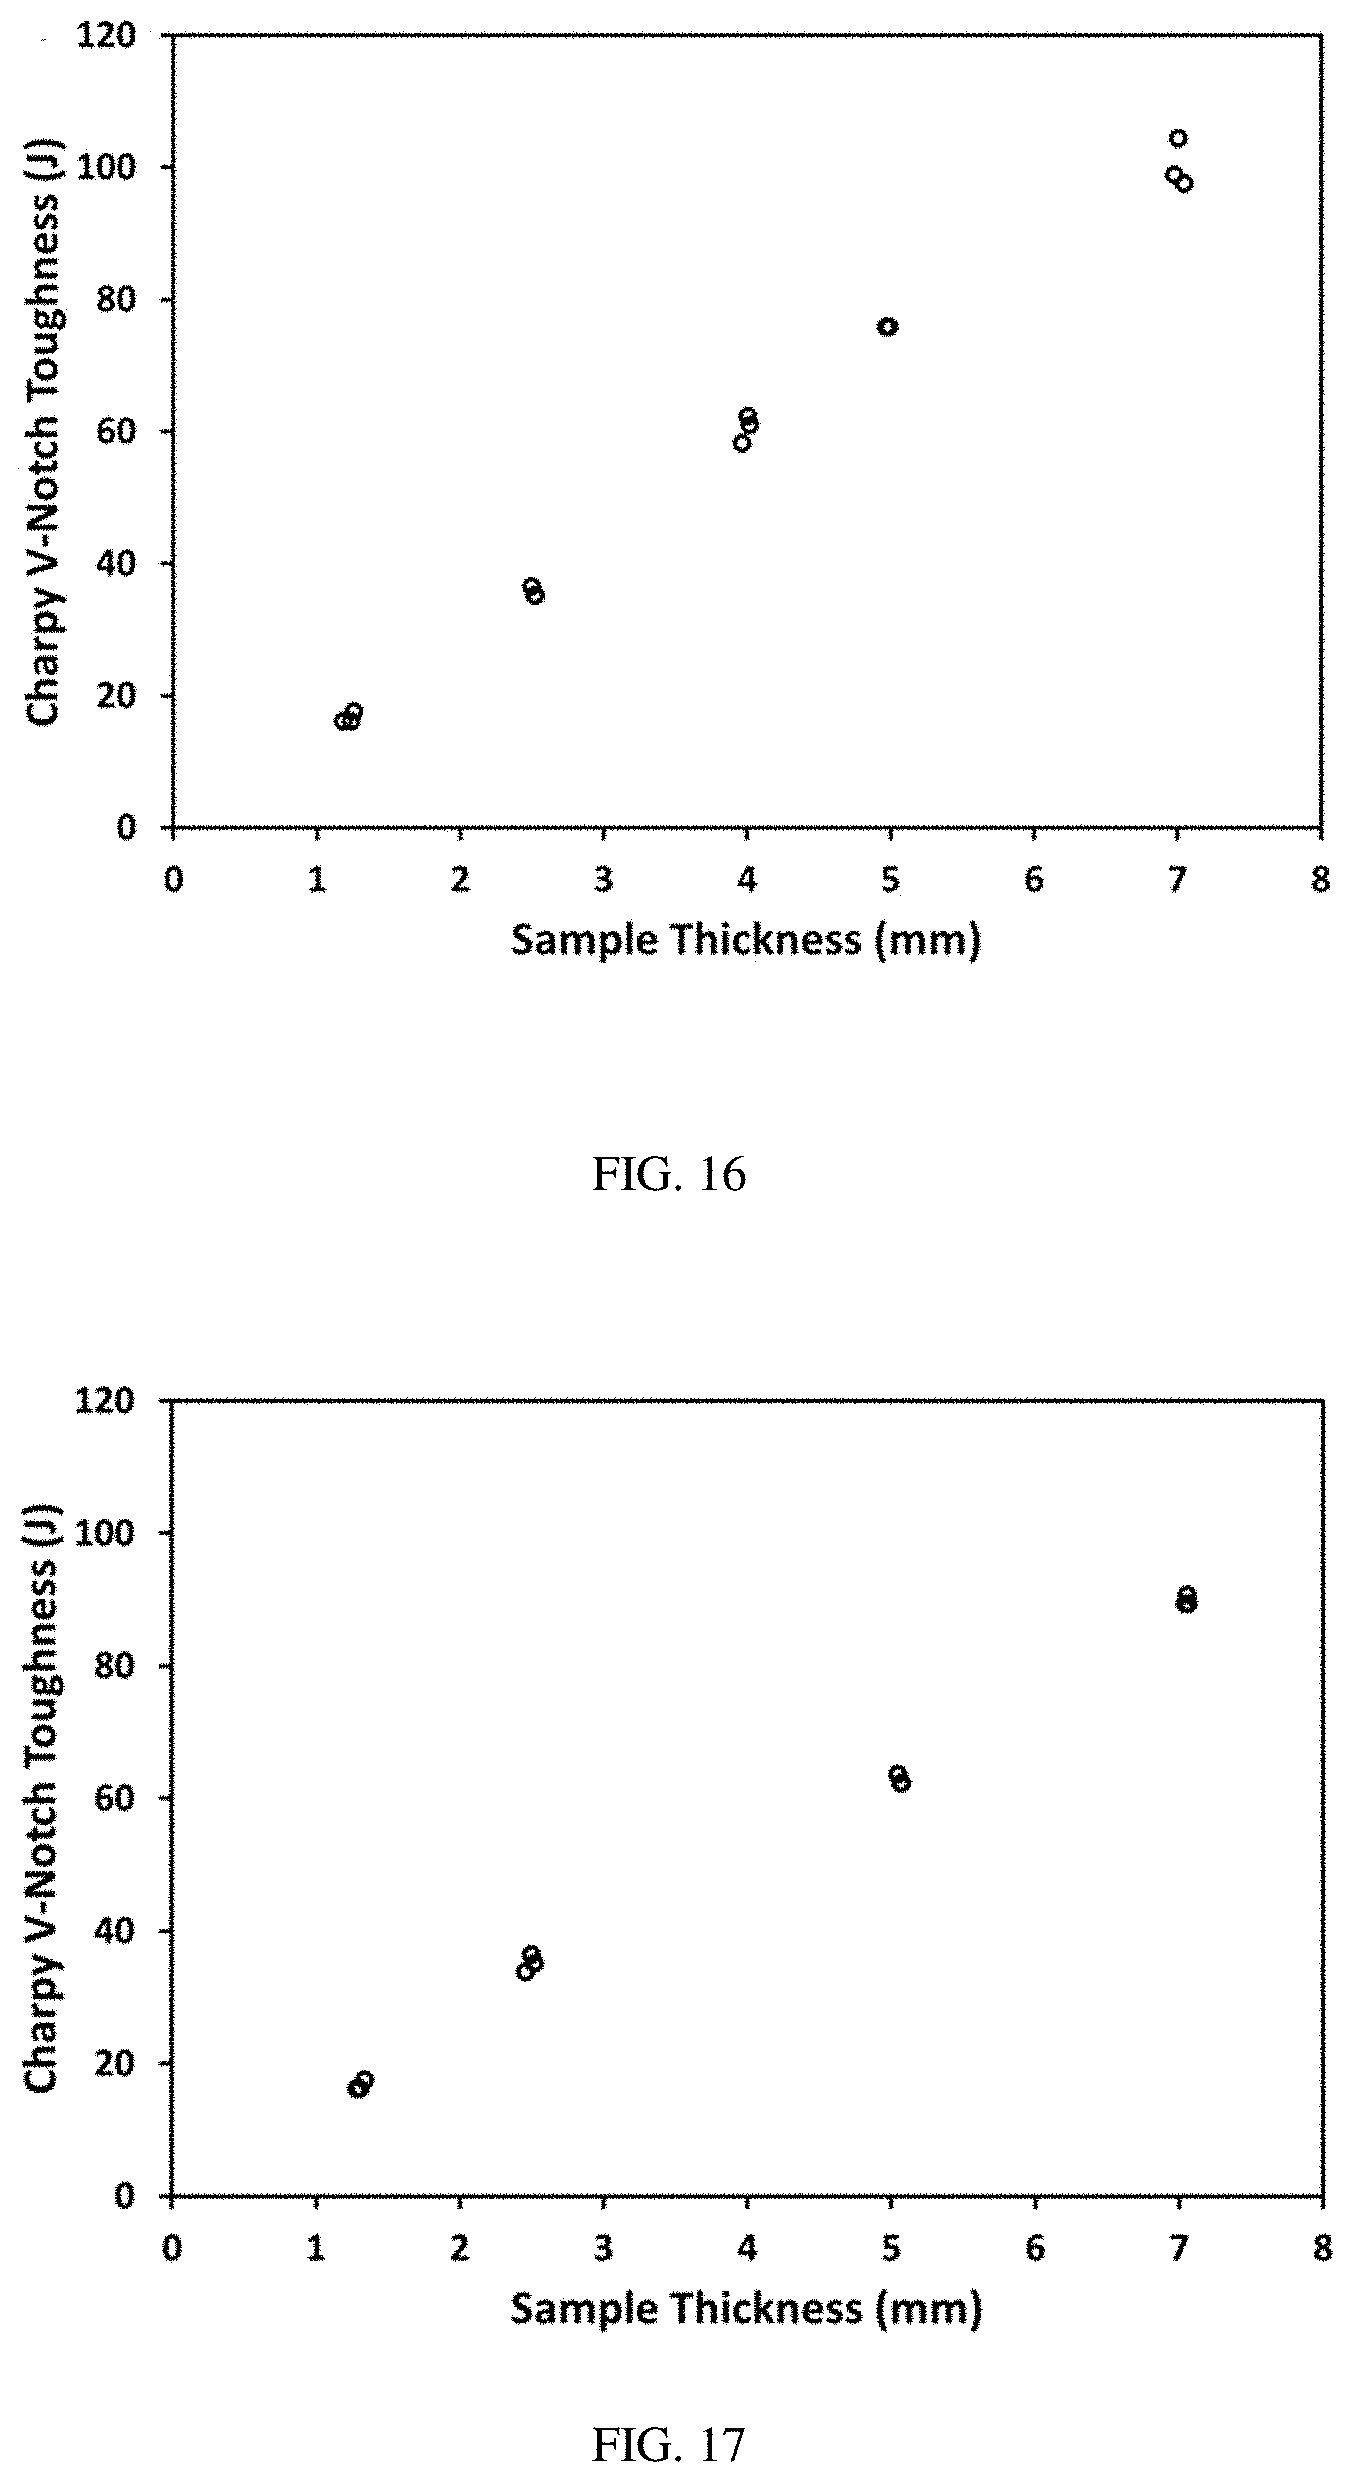
D00013

D00014
XML
uspto.report is an independent third-party trademark research tool that is not affiliated, endorsed, or sponsored by the United States Patent and Trademark Office (USPTO) or any other governmental organization. The information provided by uspto.report is based on publicly available data at the time of writing and is intended for informational purposes only.
While we strive to provide accurate and up-to-date information, we do not guarantee the accuracy, completeness, reliability, or suitability of the information displayed on this site. The use of this site is at your own risk. Any reliance you place on such information is therefore strictly at your own risk.
All official trademark data, including owner information, should be verified by visiting the official USPTO website at www.uspto.gov. This site is not intended to replace professional legal advice and should not be used as a substitute for consulting with a legal professional who is knowledgeable about trademark law.