Method And Apparatus For Imaging In Real Time The Propagation Of A Mechanical Wave In An Acoustically Propagative Material
N'DJIN; William Apoutou ; et al.
U.S. patent application number 16/476674 was filed with the patent office on 2019-12-12 for method and apparatus for imaging in real time the propagation of a mechanical wave in an acoustically propagative material. The applicant listed for this patent is CENTRE LEON-BERARD, INSTITUT NATIONAL DE LA RECHERCHE MEDICALE (INSERM), UNIVERSITE CLAUDE BERNARD LYON. Invention is credited to Francoise CHAVRIER, Kazuhiro MATSUI, William Apoutou N'DJIN, Remi SOUCHON.
| Application Number | 20190374205 16/476674 |
| Document ID | / |
| Family ID | 57868188 |
| Filed Date | 2019-12-12 |


View All Diagrams
| United States Patent Application | 20190374205 |
| Kind Code | A1 |
| N'DJIN; William Apoutou ; et al. | December 12, 2019 |
METHOD AND APPARATUS FOR IMAGING IN REAL TIME THE PROPAGATION OF A MECHANICAL WAVE IN AN ACOUSTICALLY PROPAGATIVE MATERIAL
Abstract
This method for imaging in real time the propagation of a mechanical wave in an acoustically propagative medium comprises steps of: a) emitting (1000) a mechanical wave in an acoustically propagative medium, using an acoustic source being placed in an emission region of the acoustically propagative medium, b) measuring (1002) voltage signal waveform values at a reception region, using an acoustic measurement unit; c) calculating (1004) acoustic field values in the acoustically propagative medium, between the emission region and the reception region, using a reconstruction algorithm implemented in a signal processing unit, and the signal waveform values measured during step b) d) generating an image, using an image generation device and using the calculated acoustic field values.
| Inventors: | N'DJIN; William Apoutou; (Lyon Cedex 03, FR) ; MATSUI; Kazuhiro; (Tokyo, JP) ; CHAVRIER; Francoise; (Lyon Cedex 03, FR) ; SOUCHON; Remi; (Lyon, FR) | ||||||||||
| Applicant: |
|
||||||||||
|---|---|---|---|---|---|---|---|---|---|---|---|
| Family ID: | 57868188 | ||||||||||
| Appl. No.: | 16/476674 | ||||||||||
| Filed: | January 10, 2018 | ||||||||||
| PCT Filed: | January 10, 2018 | ||||||||||
| PCT NO: | PCT/EP2018/050588 | ||||||||||
| 371 Date: | July 9, 2019 |
| Current U.S. Class: | 1/1 |
| Current CPC Class: | G01N 29/07 20130101; A61N 2007/0052 20130101; A61N 7/02 20130101; A61B 8/4494 20130101; A61B 8/4477 20130101; A61B 8/08 20130101; A61B 8/58 20130101; A61B 8/5207 20130101; G01N 2291/023 20130101; G01N 29/28 20130101 |
| International Class: | A61B 8/08 20060101 A61B008/08; A61B 8/00 20060101 A61B008/00; A61N 7/02 20060101 A61N007/02; G01N 29/28 20060101 G01N029/28; G01N 29/07 20060101 G01N029/07 |
Foreign Application Data
| Date | Code | Application Number |
|---|---|---|
| Jan 11, 2017 | EP | 17305037.8 |
Claims
1. A method for imaging in real time the propagation of a mechanical wave in an acoustically propagative medium, wherein it comprises steps of: a) emitting a mechanical wave in an acoustically propagative medium, using an acoustic source being placed in an emission region of the acoustically propagative medium, b) measuring voltage signal waveform values at a reception region, using an acoustic measurement unit, said acoustic measurement unit including a sensor array comprising an array of individual sensors arranged along an orientation axis, and being placed at the reception region, said measurement comprising the simultaneous acquisition, by at least a sub-group of the sensors of the sensor array, of voltage signal waveform values at the reception region, for successive instants in time, c) calculating acoustic field values in the acoustically propagative medium, between the emission region and the reception region, using a reconstruction algorithm implemented in a signal processing unit, and the signal waveform values measured during step b), d) generating an image, using an image generation device and using the calculated acoustic field values.
2. The method of claim 1, wherein, during step b), the voltage signal waveform values at the reception region are acquired simultaneously for the sensors of the sensor array.
3. The method of claim 1, wherein: during step b), voltage signal waveform values are acquired by a predefined sub-group of sensors in response to the mechanical wave generated during step a), said predefined sub-group of sensors being chosen among several different sub-groups of sensors, steps a) and b) are repeated for each sub-group of sensors, the acquisition being performed each time using a different sub-group of sensors, during step c) and d), the acoustic field values are calculated from the voltage signal waveform values measured by the sub-groups of sensors and the image is generated from the calculated acoustic field values for the sub-groups of sensors.
4. The method of claim 1, wherein: during step b), voltage signal waveform values are acquired by a predefined sub-group of sensors in response to the mechanical wave generated during step a), said predefined sub-group of sensors being chosen among several different sub-groups of sensors, during step c), the acoustic field values are calculated in a portion of the acoustically propagative medium, between the emission region and the reception region, using a reconstruction algorithm implemented in a signal processing unit, and the signal waveform values measured during step b), steps a), b) and c) are repeated for each sub-group of sensors, the acquisition being performed each time using a different sub-group of sensors, during step d) the image is generated from the calculated acoustic field values for the sub-groups of sensors.
5. The method of claim 1, wherein, during step b), the acquisition of voltage signal waveform values by the sensors is synchronized in time with the emission of the mechanical wave by the acoustic source using a timing control unit.
6. The method according to claim 1, wherein the reception region is located opposite to the emission region and in that the sensor array is facing the acoustic source, the alignment axis of sensor array thus being aligned with the emission region along the alignment axis, and in that during step c) the acoustic field values are calculated along a geometrical plane (P) parallel to the alignment axis and to the orientation axis.
7. The method according to claim 1, wherein it further comprises steps of: a') emitting an additional mechanical wave using transducers of the sensor array within said medium, b') measuring voltage signal waveform values at a reception region, using sensor array, corresponding to the superposition of mechanical waves with the reflection of the additional mechanical wave, and wherein steps c) and d) further comprise the generation of a background image of the acoustically propagative medium itself, and comprise the combination of said background image with the generated image of the propagation of the mechanical waves in order to generate a composite image.
8. The method according to claim 7, wherein at least one of ultrasound waves is generated using coded excitation.
9. The method according to claim 1, wherein, during step a), the generated mechanical waves are ultrasound waves, wherein the acoustic source is an ultrasound source and wherein acoustic measurement unit is an ultrasound measurement unit, said ultrasound waves being preferably generated with a wave frequency spectrum comprised between 100 kHz and 150 MHz.
10. An apparatus for real-time imaging of the propagation of a mechanical wave in an acoustically propagative medium, wherein said apparatus comprises: an acoustic source, an acoustic measurement unit, including a sensor array comprising an array of individual pressure sensors arranged along an orientation axis, and a signal processing unit, an image generation device, and wherein the apparatus is configured to execute steps of: a) emitting a mechanical wave in an acoustically propagative medium, using an acoustic source being placed in an emission region of the acoustically propagative medium, b) measuring voltage signal waveform at a reception region, using an acoustic measurement unit, said acoustic measurement unit including a sensor array comprising an array of individual sensors arranged along an orientation axis, and being placed at the reception region, said measurement comprising the simultaneous acquisition, by at least a sub-group of the sensors of the sensor array, of voltage signal waveform values at the reception region, for successive instants in time; c) calculating acoustic field values in the acoustically propagative medium, between the emission region and the reception region, using a reconstruction algorithm implemented in a signal processing unit, and the signal waveform values measured during step b) d) generating an image, using an image generation device and using the calculated acoustic field values.
11. The apparatus of claim 10, wherein the apparatus comprises a timing control unit adapted to synchronize in time the acquisition of voltage signal waveform values by the sensors with the emission of the mechanical wave by the acoustic source.
12. The apparatus according to claim 10, wherein, during step b), the voltage signal waveform values at the reception region are acquired simultaneously for all the sensors of the sensor array.
13. The apparatus according to claim 10, wherein the reception region is adapted to be located opposite to the emission region with the sensor array is facing the acoustic source, the sensor array thus being aligned with the emission region along the alignment axis, the apparatus being further configured so that during step c) the acoustic field values are calculated along a geometrical plane parallel to the alignment axis and to the orientation axis.
14. The apparatus according to claim 10, wherein the measurement unit comprises a two-dimensional sensor matrix comprising several adjacent sensor arrays each comprising an array of individual sensors arranged along parallel orientation axes, and wherein the image generation device is programmed to generate a three-dimensional image of the spatial distribution of the acoustic field values in the soft material, between the emission region and the reception region, measured using the two-dimensional sensor matrix, in a volume of the acoustically propagative medium.
15. The apparatus according to claim 10, wherein the generated mechanical waves are ultrasound waves, wherein the acoustic source is an ultrasound source and wherein acoustic measurement unit is an ultrasound measurement unit, said ultrasound source being preferably adapted to generate ultrasound waves with a wave frequency comprised between 100 kHz and 150 MHz.
Description
TECHNICAL FIELD OF THE INVENTION
[0001] The present invention relates to a method and an apparatus for imaging in real time the propagation of a mechanical wave inside an acoustically propagative medium.
BACKGROUND OF THE INVENTION
[0002] Therapeutic ultrasound methods are known, in which a beam of ultrasound waves is generated and applied to an acoustically propagative medium, such as a soft material, for example a biological tissue, in order to create thermal or mechanical lesions in specific target regions inside the medium. The lesions are used to induce a desired effect, such as damaging a defect in the medium, e.g. for removing a tumor in a biological tissue.
[0003] The clinical acceptability of these methods is however hindered by due to the lack of suitable real-time methods for imaging the propagation of ultrasound waves inside the medium.
[0004] Traditionally, the medium is imaged using known methods before applying ultrasound waves. Focusing parameters of the beam of ultrasound waves are calculated, using theoretical models and based on the acquired images, in order to focus the ultrasound beam at the desired target region. Then, the beam of ultrasound waves is applied blindly. The medium is then imaged again, in order to assess the effect generated to the medium by the beam. These steps may be repeated as often as necessary until the desired effect is obtained, for example, until the defect is successfully damaged.
[0005] However, in practice, the beam of ultrasound waves may be strongly attenuated, or may even focus outside the desired target region, for example due to uncontrollable experimental parameters, such as a bad contact at the interface between the ultrasound source and the medium, or due to the presence, inside the medium, of multiple layers having different sound transmission properties, such as muscle, skin or fat in the case of a biological tissue. These experimental parameters are difficult to quantify precisely a priori, and cannot be completely accounted for during calculation of the focusing parameters.
[0006] There is therefore a risk of applying the energy and thus creating a lesion at a wrong position inside the medium. In this case, the desired effect is not obtained, and unnecessary lesions may be created outside the target region. This is obviously an undesirable situation.
[0007] Hydrophone-based techniques are known, for imaging the propagation of ultrasound waves in water either using direct measurements, such as in Harris "A discussion of procedures for ultrasonic intensity and power calculations from miniature hydrophone measurements" Ultrasound Med Biol 1985; 11(6):803-817 or with remote measurements, such as in Maynard et al. "Nearfield acoustic holography: I. Theory of generalized holography and the development of NAH" J Acoust Soc Am 1985; 78(4):1395-1413. In order to image an entire region, a raster-scan method must be used, by repeatedly moving physically the hydrophone at many different points in space to cover an entire imaging plane, which is time consuming. In addition, direct measurements of high intensity ultrasound waves can damage the hydrophone sensor
SUMMARY OF THE INVENTION
[0008] The object of the present invention is therefore to provide a method for imaging, in real time, the propagation of a mechanical wave inside an acoustically propagative medium.
[0009] To that end, the invention relates to a method for imaging in real time the propagation of an ultrasound wave in an acoustically propagative medium, comprising steps of:
[0010] a) emitting a mechanical wave in an acoustically propagative medium, using an acoustic source being placed in an emission region of the acoustically propagative medium,
[0011] b) measuring voltage signal waveform values at a reception region, using an acoustic measurement unit, said acoustic measurement unit including a sensor array comprising an array of individual sensors arranged along an orientation axis, and being placed at the reception region, said measurement comprising the simultaneous acquisition, by at least a sub-group of the sensors of the sensor array, of voltage signal waveform values at the reception region, for successive instants in time;
[0012] c) calculating acoustic field values in the acoustically propagative medium, between the emission region and the reception region, using a reconstruction algorithm implemented in a signal processing unit, and the signal waveform values measured during step b)
[0013] d) generating an image, using an image generation device and using the calculated acoustic field values.
[0014] An advantage of the invention is that the propagation of the ultrasound wave between the emission region and the reception is imaged in real time, thanks to the fact that the acquisition is performed simultaneously by at least some of the individual sensors. The image generation device allows for a fast and accurate reconstruction of the image, allowing a real-time imaging and visualization. This method can be used reliably with ultrasound waves of high intensity that would typically damage hydrophones, and in acoustically propagative media such as soft materials, including optically opaque ones.
[0015] According to advantageous aspects, the invention comprises one or more of the following features, considered alone or according to all possible technical combinations: [0016] During step b), the voltage signal waveform values at the reception region are acquired simultaneously for the sensors of the sensor array. [0017] During step b), voltage signal waveform values are acquired by a predefined sub-group of sensors in response to the mechanical wave generated during step a), said predefined sub-group of sensors being chosen among several different sub-groups of sensors; and steps a) and b) are repeated for each sub-group of sensors, the acquisition being performed each time using a different sub-group of sensors and, during step c) and d), the acoustic field values are calculated from the voltage signal waveform values measured by the sub-groups of sensors and the image is generated from the calculated acoustic field values for the sub-groups of sensors. [0018] During step b), voltage signal waveform values are acquired by a predefined sub-group of sensors in response to the mechanical wave generated during step a), said predefined sub-group of sensors being chosen among several different sub-groups of sensors; and during step c), the acoustic field values are calculated in a portion of the acoustically propagative medium, between the emission region and the reception region, using a reconstruction algorithm implemented in a signal processing unit, and the signal waveform values measured during step b) and steps a), b) and c) are repeated for each sub-group of sensors, the acquisition being performed each time using a different sub-group of sensors and during step d) the image is generated from the calculated acoustic field values for the sub-groups of sensors. [0019] During step b), the acquisition of voltage signal waveform values by the sensors is synchronized in time with the emission of the mechanical wave by the acoustic source using a timing control unit. [0020] The reception region is located opposite to the emission region and whereas the sensor array is facing the acoustic source, the alignment axis of sensor array thus being aligned with the emission region along the alignment axis, and in that during step c) the acoustic field values are calculated along a geometrical plane parallel to the alignment axis and to the orientation axis. [0021] The method further comprises steps of: [0022] a') emitting an additional mechanical wave using transducers of the sensor array within said medium, [0023] b') measuring voltage signal waveform values at a reception region, using sensor array, corresponding to the superposition of mechanical waves with the reflection of the additional mechanical wave, and steps c) and d) further comprise the generation of a background image of the acoustically propagative medium itself, and comprise the combination of said background image with the generated image of the propagation of the mechanical waves in order to generate a composite image. [0024] At least one of ultrasound waves is generated using coded excitation. [0025] During step a), the generated mechanical waves are ultrasound waves, wherein the acoustic source is an ultrasound source and wherein acoustic measurement unit is an ultrasound measurement unit, said ultrasound waves being preferably generated with a wave frequency spectrum comprised between 100 kHz and 150 MHz.
[0026] According to another aspect, the invention relates to an apparatus for real-time imaging of the propagation of an ultrasound wave in an acoustically propagative medium, said apparatus comprising: [0027] an acoustic source, [0028] an acoustic measurement unit, including a sensor array comprising an array of individual pressure sensors arranged along an orientation axis, and [0029] a signal processing unit, [0030] an image generation device, and wherein the apparatus is configured to execute steps of: [0031] a) emitting a mechanical wave in an acoustically propagative medium, using an acoustic source being placed in an emission region of the acoustically propagative medium, [0032] b) measuring voltage signal waveform at a reception region, using an acoustic measurement unit, said acoustic measurement unit including a sensor array comprising an array of individual sensors arranged along an orientation axis, and being placed at the reception region, said measurement comprising the simultaneous acquisition, by at least a sub-group of the sensors of the sensor array, of voltage signal waveform values at the reception region, for successive instants in time; [0033] c) calculating acoustic field values in the acoustically propagative medium, between the emission region and the reception region, using a reconstruction algorithm implemented in a signal processing unit, and the signal waveform values measured during step b) [0034] d) generating an image, using an image generation device and using the calculated acoustic field values.
[0035] According to advantageous aspects, the invention comprises one or more of the following features, considered alone or according to all possible technical combinations: [0036] The apparatus comprises a timing control unit adapted to synchronize in time the acquisition of voltage signal waveform values by the sensors with the emission of the mechanical wave by the acoustic source. [0037] During step b), the voltage signal waveform values at the reception region are acquired simultaneously for all the sensors of the sensor array. [0038] The reception region is adapted to be located opposite to the emission region with the sensor array is facing the acoustic source, the sensor array thus being aligned with the emission region along the alignment axis, the apparatus being further configured so that during step c) the acoustic field values are calculated along a geometrical plane parallel to the alignment axis and to the orientation axis. [0039] The measurement unit comprises a two-dimensional sensor matrix comprising several adjacent sensor arrays each comprising an array of individual sensors arranged along parallel orientation axes, and wherein the image generation device is programmed to generate a three-dimensional image of the spatial distribution of the acoustic field values in the soft material, between the emission region and the reception region, measured using the two-dimensional sensor matrix, in a volume of the acoustically propagative medium. [0040] The generated mechanical waves are ultrasound waves, wherein the acoustic source is an ultrasound source and wherein acoustic measurement unit is an ultrasound measurement unit, said ultrasound source being preferably adapted to generate ultrasound waves with a wave frequency comprised between 100 kHz and 150 MHz.
BRIEF DESCRIPTION OF THE DRAWINGS
[0041] The invention will be better understood upon reading the following description, provided solely as an example, and made in reference to the appended drawing, in which:
[0042] FIG. 1 is a simplified diagrammatic representation of an apparatus according to the invention for imaging in real time the propagation of a mechanical wave in an acoustically propagative medium;
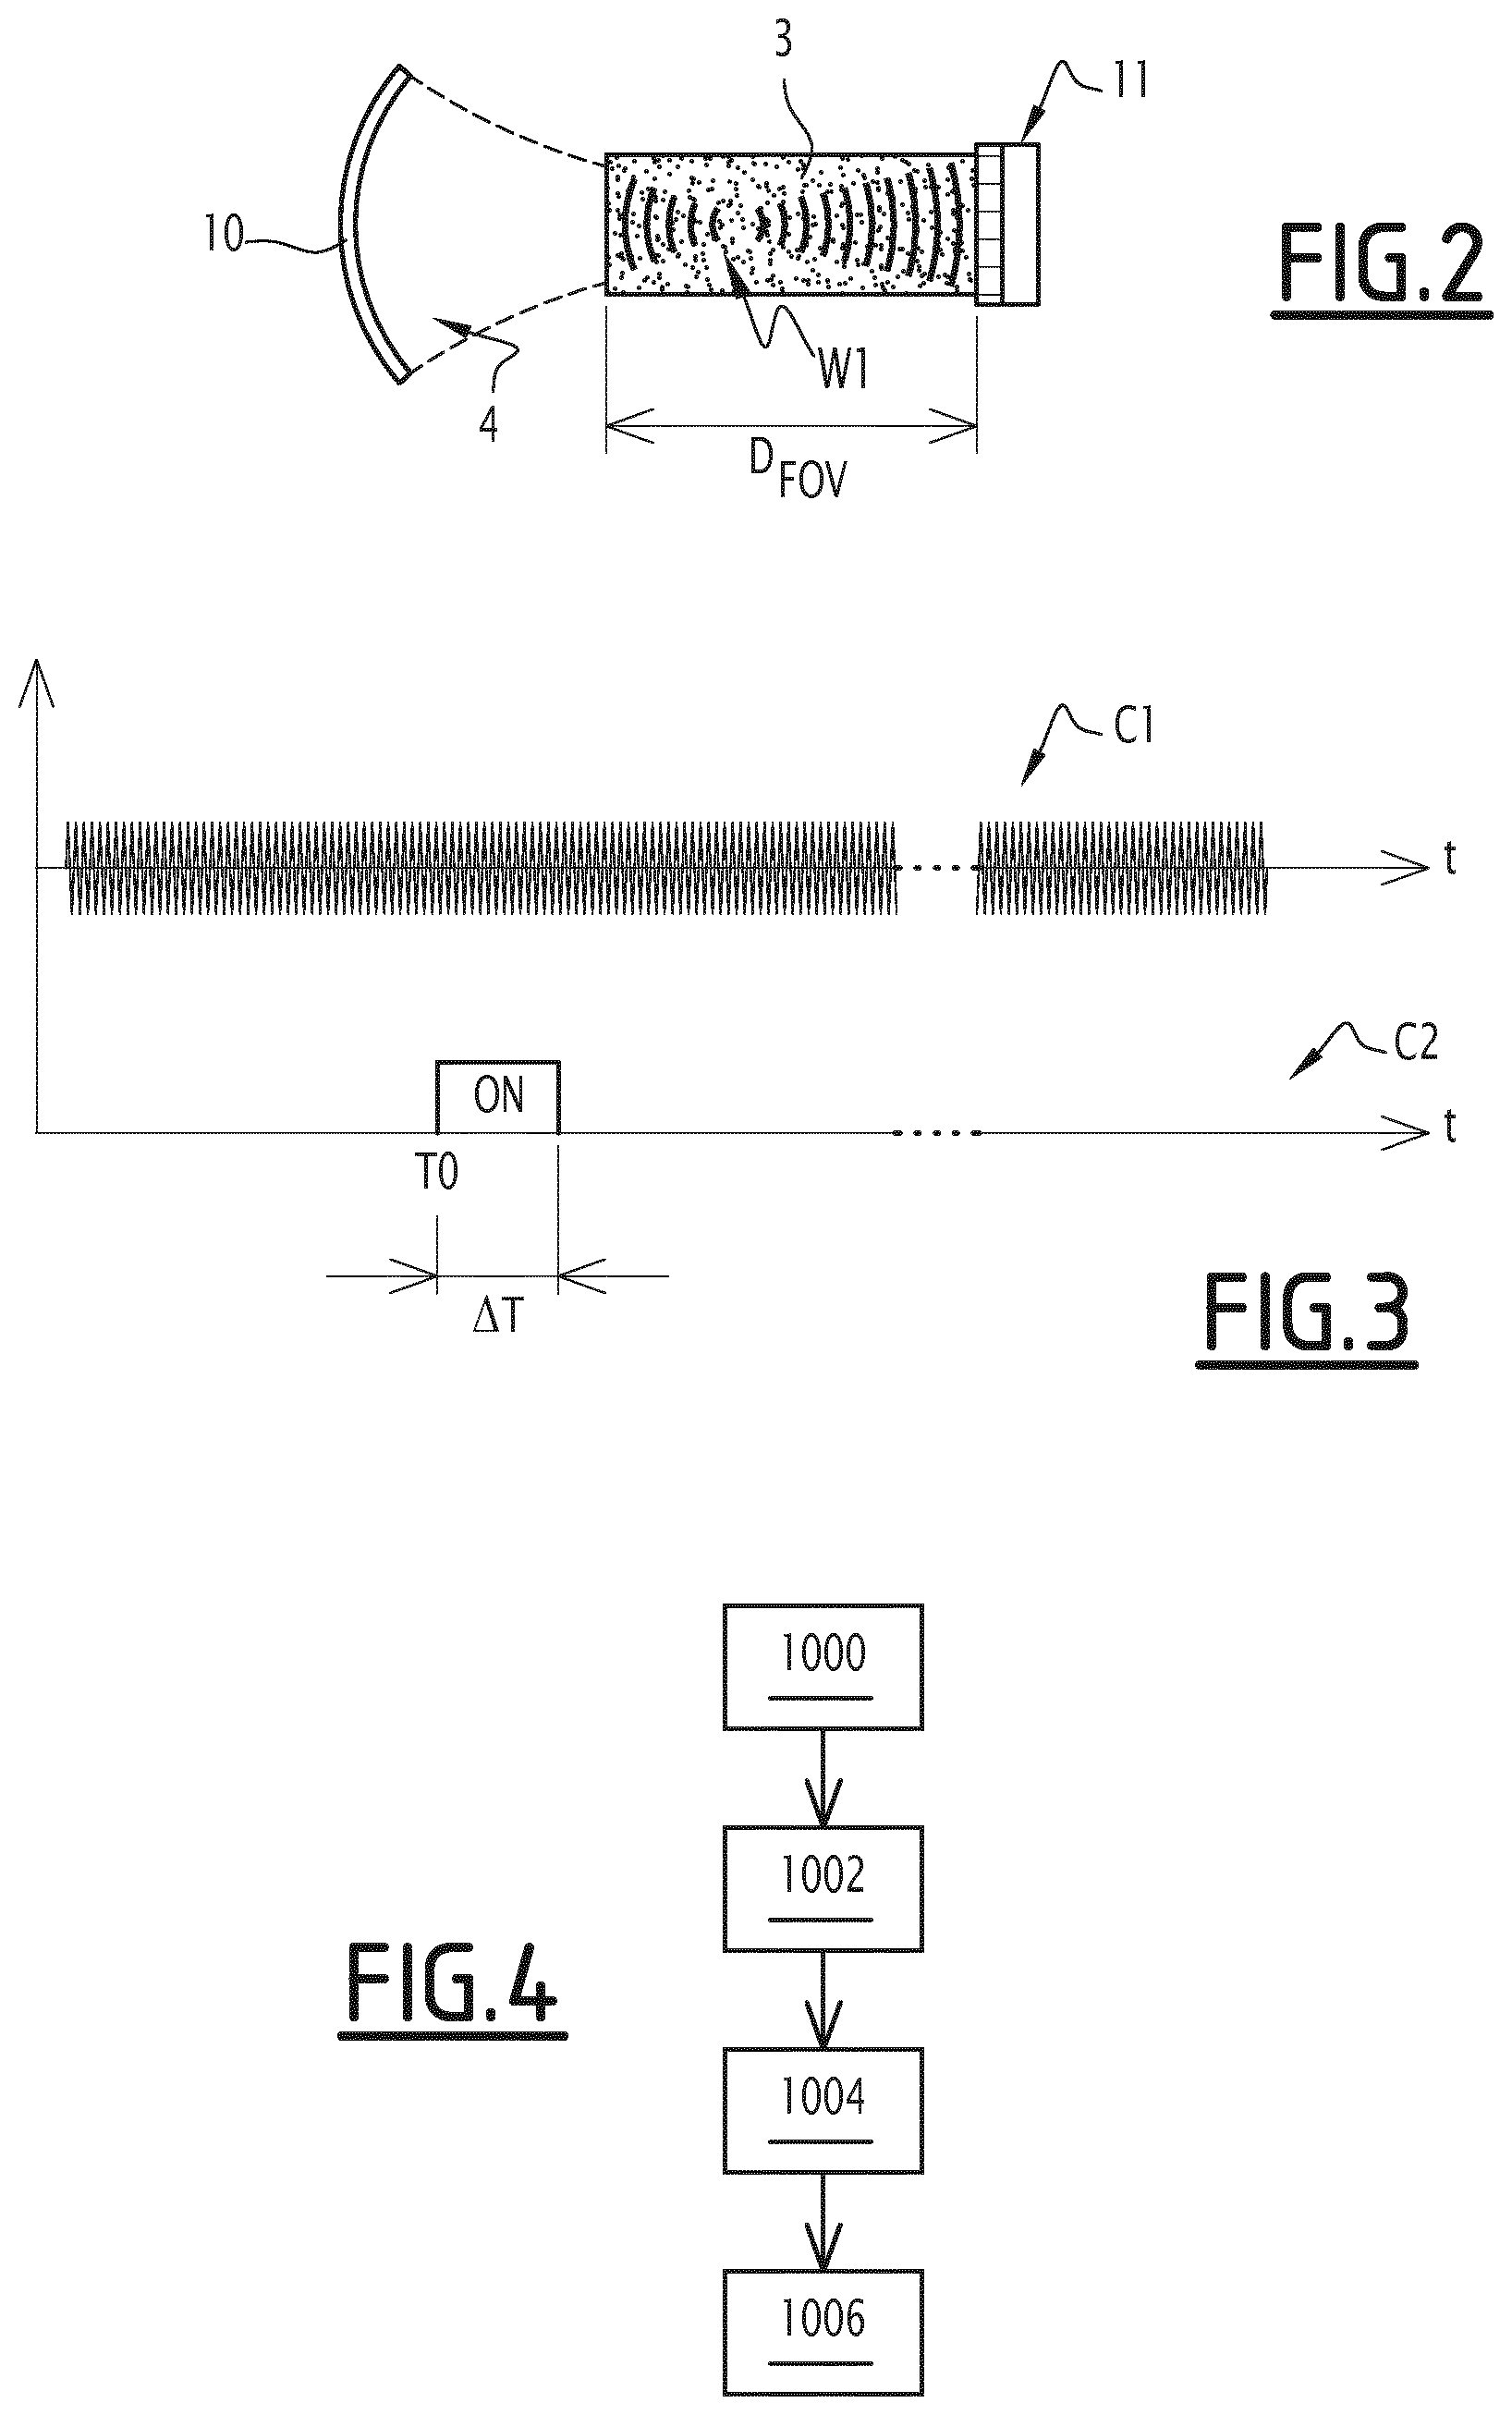
[0043] FIG. 2 is a simplified diagrammatic representation of a field of view of the apparatus of FIG. 1;
[0044] FIG. 3 is a simplified illustration of the measurement of continuous mechanical waves, for successive instants of time, using the apparatus of FIG. 1;
[0045] FIG. 4 is a flow-chart illustrating a method according to the invention for imaging in real time the propagation of an mechanical wave in an acoustically propagative medium, using the apparatus of FIG. 1;
[0046] FIG. 5 is a simplified diagrammatic representation of another embodiment of the apparatus of FIG. 1 according to the invention, in which the emission and reception of mechanical waves are synchronized;
[0047] FIGS. 6, 7 and 8 are simplified diagrammatic representation of a field of view of the apparatus of FIG. 5 for different values of a reconstruction time "t";
[0048] FIG. 9 is a simplified illustration of the synchronization between emission and measurement of transient mechanical waves, using the apparatus of FIG. 5;
[0049] FIG. 10 is a simplified illustration of an interlaced operation mode in which the mechanical waves are imaged alternatively with the medium itself, using an acoustic measurement unit of the apparatus of FIG. 5;
[0050] FIG. 11 is a simplified illustration of a dual-mode operation mode in which the mechanical waves are imaged simultaneously with the medium itself using an acoustic measurement unit of the apparatus of FIG. 5;
[0051] FIGS. 12, 13 and 14 are simplified diagrammatic representations of a field of view of the apparatus of FIG. 5 for different values of time in a line-by-line acquisition mode.
DETAILED DESCRIPTION OF SOME EMBODIMENTS
[0052] FIG. 1 illustrates an apparatus 1 for imaging in real time the propagation of mechanical waves in an acoustically propagative medium 2. In the following examples, the mechanical waves are ultrasound waves.
[0053] In practice, apparatus 1 is adapted to image in real time the propagation of any ultrasound waves. In this example, apparatus 1 is described as imaging an ultrasound wave W1 composed of cycles emitted continuously.
[0054] In what follows, acoustically propagative medium 2 is a soft material, such as an organic tissue, which can be of animal or vegetal origin. For instance, soft material 2 can be an organ of a human body, of an animal body. Acoustically propagative medium 2 can also be a gel, a fluid or a liquid such as water, or a natural or synthetic material.
[0055] In this illustrative example, medium 2 comprises an outer envelope 20, which surrounds medium 2 and serves as a boundary between the inside and the outside of medium 2. However, alternatively, outer envelope 20 is omitted. For example, if medium 2 is a fluid or a gel, apparatus 1 can be at least partially immerged inside medium 2.
[0056] In this example, acoustically propagative medium 2 is a lossless and homogeneous medium.
[0057] Apparatus 1 comprises an ultrasound source 10, an ultrasound measurement unit 11 and an ultrasound scanner 12.
[0058] Ultrasound source 10 is adapted to generate focused ultrasound waves W upon receiving a command signal. For example, ultrasound source 10 comprises transducers, such as piezoelectric materials, adapted to convert an electrical command signal into a vibration in order to generate a variable acoustical pressure field in its surroundings.
[0059] In this example, apparatus 1 further comprises an ultrasound wave generator 101 connected to ultrasound source 10 and adapted to generate and amplify a command signal. For example, wave generator 101 comprises an electrical signal generator and an amplifier circuit forming together a driver circuit of ultrasound source 10. Ultrasound wave generator 101 is advantageously commanded by a programmable electronic calculator, not illustrated. For example, ultrasound wave generator 101 is the generator sold under the commercial reference "Ablatherm.RTM. by Edap-TMS".
[0060] Ultrasound source 10 is preferentially adapted to generate ultrasound waves with a wave frequency comprised between 100 kHz and 150 MHz.
[0061] In this example, ultrasound source 10 is also adapted to generate high-intensity focused ultrasound waves. Optionally, ultrasound source 10 may also be adapted to generate unfocused ultrasound waves and/or low intensity ultrasound waves.
[0062] For example, ultrasound source 10 is a therapeutic ultrasound transducer.
[0063] Ultrasound source 10 is placed in a so-called emission region 21, here at the outer envelope 20 of acoustically propagative medium 2, for example in direct contact with envelope 20, and is arranged so that the emitted ultrasound waves W1 propagate inside acoustically propagative medium 2. On FIG. 1, axis X10 denotes an emission axis of ultrasound source 10. For example, axis 10 is a symmetry axis of the acoustic beam 4 of waves generated by wave generator 101. Axis Y10 is perpendicular to axis X10. In this example, axis X10 is arranged horizontally and axis Y10 is arranged vertically.
[0064] On FIG. 1, the acoustic beam formed by ultrasound waves W1, as they propagate inside acoustically propagative medium 2, is illustrated as dashed lines and bears the numerical reference 4. In this example, acoustic beam 4 is focused on a target region 23 of acoustically propagative medium 2 so as to deliver as much energy as possible to acoustically propagative medium 2 in target region 23 in order to create a lesion there.
[0065] Ultrasound measurement unit 11 includes a sensor array 111, comprising an array of individual sensors 112 arranged along an orientation axis Y11. For example, said orientation axis Y11 is arranged vertically. Here, axis Y11 is parallel to axis Y10. Axis X11 denotes an alignment axis arranged perpendicularly to axis Y11. For example, axis X11 is parallel to axis X10.
[0066] Each individual sensor 112 is adapted to measure the acoustic field values in its immediate surroundings and, more specifically, along a measurement surface. For example, individual sensors 112 are identical to each other and differ only by their position in sensor array 111. In this example, each individual sensor 112 comprises a piezoelectric transducer, for example made of a layer of piezoelectric material defining a measurement surface and being connected to a voltage measurement apparatus. When the acoustic pressure field near the measurement surface changes over time, it induces a deformation of the piezoelectric layer. In turn, the piezoelectric layer generates a voltage whose variation in time is representative of the pressure variation at said measurement surface. This voltage is then recorded over a short time interval, for example using an analogue-to-digital converter, and converted into a measurement signal waveform.
[0067] Individual sensors 112 may alternatively be based on transducers of a different technology, such as capacitive micromachined ultrasonic transducers.
[0068] In this example, individual sensors 112 are aligned along orientation axis Y11, with their respective measurement surfaces orientated in the direction of alignment axis X11. For example, the height h 1 of sensor array 111, measured along orientation axis Y11, is equal to 4 cm.
[0069] Ultrasound measurement unit 11 is placed at a reception region 22 of medium 2, where it can receive the ultrasound waves emitted by ultrasound source 10.
[0070] In this example, reception region 22 is located opposite to the emission region 21. In this case, preferably, reception region 22 is aligned with emission region 21, along axis X10 so that axis X10 and axis X11 coincide with each other.
[0071] However, when the path of acoustic beam 4 is not a straight line inside medium 2, the emission region 21 and the reception region 22 are not necessarily aligned. In that case, axis X10 does not coincide with axis X11. For example, reception region 22 and emission region 21 are located side by side.
[0072] Optionally, an acoustical mirror, such as a reflecting material adapted to reflect or deflect acoustic beam 4 within medium 2, e.g. a sheet of metal, may be placed at a specific location inside medium 2, for example behind an organ of interest, so as to purposefully deflect acoustic beam 4.
[0073] Individual sensors 112 are arranged so as to generate voltage signal waveform values representative of acoustic field values at reception region 22. Here, individual sensors 112 are facing ultrasound source 10, for example with their measurement surface positioned at reception region 22 and turned towards outer envelope 20 and facing ultrasound source 10. For example, individual sensors 112 are in contact with outer envelope 20.
[0074] Reception region 22 is preferably located at a position corresponding to the propagation of acoustic beam 4, so that a significant proportion of the acoustic power emitted by source 10 can be collected by the respective measurement surfaces of the individual pressure sensors 112 of sensor array 111. For example, the power thus collected is said to be significant if it at least equal to 50% of the emitted power, preferably at least 75% of the emitted power, preferably still at least 90% of the emitted power. The higher the proportion of acoustic power, the better the accuracy of the imaging of ultrasound waves W1 by apparatus 1.
[0075] In this example, both the ultrasound source 10 and the ultrasound measurement unit 11 are located outside medium 2. However, source 10 and/or measurement unit 11 may be at least partially inserted within medium 2 if the latter is a gel or a fluid.
[0076] Preferably, ultrasound measurement unit 11 is adapted to acquire simultaneously, by at least 95% of the sensors 112 of sensor array 111, preferably by all sensors 112, the voltage signal waveform values at reception region 22.
[0077] However, in other embodiments, ultrasound measurement unit 11 is adapted to acquire simultaneously, by at least some of the sensors 112, for example by a predefined subgroup of sensors 112, the voltage signal waveform values at a portion of reception region 22.
[0078] Here, as illustrated in FIG. 2, ultrasound measurement unit 11 has a two-dimensional field of view 3 along the propagation direction of acoustic beam 4. In this example, field of view 3 extends along a geometrical plane, noted P, parallel to axis X11 and to orientation axis Y11. The length of field of view 3, measured along alignment axis X11, here along the path followed by acoustic beam 4, bears the reference "D.sub.FOV". The value of length D.sub.FOV depends on the duration of the measurements performed by ultrasound measurement unit 11, as explained in what follows.
[0079] Optionally, each individual sensor 112 of sensor array 111 is able to emit one or several additional mechanical waves, for example ultrasound waves, upon receiving a command signal. Said waves are distinct from waves W1 generated by source 10. In that case, measurement unit 11 is able to operate in an "active mode", for example in a pulse-echo mode, by emitting such additional ultrasound waves inside medium 2 and then, in response, measuring, using the same sensor array 111, reflected ultrasound waves propagating in medium 2 towards the reception region 22. This way, a background image of medium 2 itself can be acquired. In this active mode, sensor array 111 can both emit waves and measure voltage signal waveform values, albeit not necessarily simultaneously.
[0080] Measurement unit 11 is also able to operate in a "passive mode", distinct from the active mode, in which it does not emit any ultrasound wave and merely measures the voltage signal waveform values using individual sensors 112 of sensor array 111. In this embodiment, measurement unit 11 is meant to operate only in the passive mode.
[0081] Ultrasound scanner 12 is adapted to acquire and process data measured by ultrasound measurement unit 11, in order to generate automatically at least one image, noted I, of the spatial distribution, along geometrical plane P, of the acoustic field values in medium 2.
[0082] In this example, ultrasound scanner 12 comprises a signal reception unit 121, a signal processing unit 122, an image generation device 123 and a display device 124. In this illustrative example, ultrasound scanner 12 is the ultrasound scanner sold under the commercial reference "EPIQ 7.RTM." by PHILIPS HEALTHCARE.
[0083] For example, ultrasound scanner 12 comprises an electronic calculator, not illustrated, including an arithmetic logic unit, a graphical processing unit and a data recording medium able to store executable instructions. Signal processing unit 122 and image generation device 123 are implemented as software modules and executed by said electronic calculator.
[0084] Alternatively, signal processing unit 122 and/or image generation device 123 are hardware devices each comprising a programmable electronic calculator.
[0085] Signal reception unit 121 is connected to sensor array 111 so as to collect the measurement signals generated by each individual sensor 112. Said measurement signals may be collected only during so-called signal acquisition intervals, as explained in what follows.
[0086] Signal processing unit 122 is adapted to process and condition the measurement signals acquired by signal reception unit 121, and to calculate the acoustic wave field in at least one spatial position "M", and preferably at a plurality of positions so as to form an image of said acoustic wave field.
[0087] In a first example, signal processing unit 122 is programmed to calculate the acoustic field using a time reversal algorithm. Using this technique, acoustic beam 4 is reconstructed from the measurement signals using a discrete approximation of Rayleigh's integral, as follows:
v k ( t ) = s k ( t ) * h k ( t ) and ( 1 ) .PHI. TR ( M , t ) = 1 2 .pi. k v k ( t + r k ( M ) / c ) r k ( M ) S k ( 2 ) ##EQU00001##
[0088] where: [0089] the star symbol (*) denotes a convolution operation, [0090] .PHI..sub.TR(M,t) is the estimated value of velocity potential at a position "M" inside soft material 2, "M" being the position vector of the observation point, here a pixel position within the field of view, and at a time "t" that can be chosen arbitrarily. A plurality of images can be created by varying time "t", said plurality of images can be assembled in a movie animation showing the propagation of the mechanical wave in the medium, [0091] "v.sub.k(t+r.sub.k(M)/c)" is the normal particle velocity on the k.sup.th element of the sensor array at time "t+r.sub.k(M)/c" [0092] "s.sub.k(t)" is the voltage signal waveform measured on the k.sup.th element of the sensor array at time "t", [0093] "h.sub.k(t)" is the impulse response of the k.sup.th element of the sensor array at time "t". It can be measured experimentally, for example using the stepped plane wave method described in Lakestani F et al. "Generation of a stepped ultrasonic plane wave: Application to piezoelectric transducer calibration". J Phys D: Appl Phys 1976; 9: 547-54, [0094] "r.sub.k(M)" is the distance between the center of the k.sup.th element of the sensor array 111 and location "M", [0095] "c" is the propagation speed of sound inside soft material 2, [0096] "S.sub.k" is the surface of the k.sup.th elements of the sensor array 111
[0097] In the specific case of a monochromatic wave field with a single frequency f, the convolution product "v.sub.k(t)=s.sub.k(t)*h.sub.k(t)" can be replaced by equation "v.sub.k(t)=K.sub.k s.sub.k(t+.phi..sub.k/2.pi.f)", where K.sub.k is a real and positive constant ratio, and .phi..sub.k is a phase shift. This equation is less computationally-intensive than the convolution product and therefore requires less computational resources. It can also be used in the case of a wave field whose frequency contents spans over a narrow frequency bandwidth, with the assumption that sensor sensitivity is constant over that specific bandwidth.
[0098] Finally, other important acoustics parameters, such as pressure p(M,t), all three components of particle velocity vector {right arrow over (v)}(M,t), and all three components of the intensity vector {right arrow over (I)}(M,t) can be calculated from the velocity potential .PHI., using equations:
p = - .rho. .differential. .PHI. / .differential. t ( 3 ) v .fwdarw. = grad .fwdarw. ( .PHI. ) = .gradient. .fwdarw. .PHI. ( 4 ) I .fwdarw. = p v .fwdarw. ( 5 ) ##EQU00002##
[0099] where .rho. is the density of soft material 2.
[0100] In a second example, signal processing unit 122 is programmed to generate the image using a dynamic receive focusing (or "beam forming") image reconstruction algorithm. An example of such an algorithm is described by P.N.T. Wells in "Biomedical Ultrasonics", chapter 6.10.c, Academic Press, London, 1977, ISBN 0-12-742940-9. Using this technique, the values of the measured signals received from the individual respective sensors 112 of sensor array 11 are shifted in time and summed, using the following formulas:
b ( M ) = k s k ( d ( M ) + r k ( M ) c ) ( 6 ) ##EQU00003##
[0101] The beamforming algorithm described by equation (6) is implemented in all medical ultrasound scanners. However, the resulting value b(M) is not representative of the acoustic field, and a correction factor is needed. Assuming all sensor elements have same surface S.sub.k=S and same sensitivity K.sub.k=K, the correction factor is:
.PHI. BF ( M , t M ) = fKS d ( M ) b ( M ) ( 7 ) ##EQU00004##
[0102] where: [0103] b(M) is the value of the post-beamforming ultrasound signal at a position "M" inside soft material 2, "M" being the position vector of the observation point, here a pixel position within the field of view. In medical ultrasound imaging, image b(M) is commonly called the beamformed radio-frequency image, or the beamformed RF image. [0104] .PHI..sub.BF(M,t.sub.M) is the value of an acoustic velocity potential at time "t.sub.M" and at a location "M" inside soft material 2, where time t.sub.M is defined as t.sub.M=d(M)/c, [0105] "s.sub.k((d(M)+r.sub.k(M))/c)" is the value of the voltage signal measured at time t=(d(M)+r.sub.k(M))/c on the k.sup.th element of the sensor array, [0106] "r.sub.k(M)" is the distance between the center of the km element of the sensor array 111 and location "M", [0107] "d(M)" is the smallest distance between the center of the elements of the sensor array 111 and location "M", and is defined as d(M)=min(r.sub.k), [0108] "c" is the propagation speed of sound inside soft material 2, [0109] "f" is the frequency of the ultrasound field to be measured, [0110] "K" is the sensitivity of the elements of the sensor array at frequency f [0111] "S" is the surface of the elements of the sensor array
[0112] The acoustic field value .PHI..sub.BF(M,t) can be calculated at any position M and, optionally, at any arbitrary time "t" by use of a synchronization unit, as will be described in what follows in reference to the embodiment of FIG. 9, and setting delay DE equal to t.sub.M-t. Finally, the entire wave field .PHI..sub.BF(M,t) can be reconstructed by varying the trigger delay DE and repeating the acquisition, so as to cover all possible values for M and t.
[0113] The dynamic receive focusing algorithm described by equations (6) and (7) is not as accurate as the time-reversal algorithm. However it is advantageous because equation (6)--which is computationally intensive--is already implemented in conventional medical ultrasound scanners, typically with fast and efficient hardware or software. Therefore the invention can be implemented using a conventional ultrasound scanner, by retrieving the beamformed radio-frequency image, or its envelope, from that scanner and then calculating the velocity potential using equation (7).
[0114] In the case of conventional medical ultrasound scanners, where only the envelope e(M) of the beamformed RF image is available, then the envelope of a continuous acoustic field can be reconstructed using equation (8):
.PHI. BF ( M ) = fKS d ( M ) e ( M ) ( 8 ) ##EQU00005##
[0115] where e(M)=.parallel.b(M).parallel. is the envelope of the beamformed radio-frequency image. In medical ultrasound, e(M) is commonly called the amplitude of the grayscale ultrasound image, or amplitude of the B-mode image, or amplitude of the sonogram.
[0116] Other techniques are possible for generating the image, such as using a holographic reconstruction algorithm, as described in the previously described article by Maynard et al.
[0117] Other reconstruction algorithms can also be used.
[0118] Preferably, signal processing unit 122 is adapted to account for the physical properties of medium 2, such as attenuation, speed of sound or nonlinearity, when generating the image.
[0119] Optionally, a signal or a data structure representative of said physical properties is acquired by transmitting a wave from the acoustic source 10 or from the acoustic measurement unit 11 operating in active mode, then receiving the acoustic signals with the acoustic measurement unit 11 and processing the signals to determine said physical properties, prior to implementing the method.
[0120] Image generation device 123 is programmed to generate at least one image I of the spatial distribution of the acoustic field calculated by signal processing device 122.
[0121] To this end, image generation device 123 is programmed to implement image reconstruction algorithms.
[0122] For example, generated image I is a digital image, made of a plurality of individual pixels, here forming a two-dimensional matrix. Each pixel has a spatial position and an intensity value. The intensity value of each pixel is representative, according to some predefined scale, of the acoustic field value at a location of soft material 2 associated to the pixel's spatial position.
[0123] Display device 124 is adapted to display the image generated by the image generation device 123. For example, display device 124 is a video screen integrated with ultrasound scanner 12. Alternatively, display device 124 may be distinct from ultrasound scanner 12, for example arranged in a remote location and connected to ultrasound scanner 12 by means of a data link.
[0124] As illustrated on FIG. 3, in this example, ultrasound scanner 12 is programmed to measure data coming from ultrasound measurement unit 11 only during so-called signal detection intervals. The signal detection interval has a duration .DELTA.T. The signal detection interval begins at time T0.
[0125] On FIG. 3, curve C1 illustrates, as a function of time t, ultrasound waves W1 continuously emitted by ultrasound source 10. Curve C2 illustrates said signal detection interval, as a function of time t.
[0126] Optionally, ultrasound scanner 12 is programmed to repeatedly measure data using multiple detection intervals, beginning at instants T0, T1, T2, . . . , Tn, possibly with a predefined repetition frequency preferably comprised between 1 Hz and 10 kHz. This frequency corresponds to the frequency at which the reconstructed acoustic field is updated.
[0127] An example of a method for imaging in real time the propagation of ultrasound wave W1 in medium 2 using apparatus 1 is now described, in reference to the flow chart of FIG. 4.
[0128] Initially, apparatus 1 and medium 2 are provided, with ultrasound source 10 positioned at emission region 21 and ultrasound measurement unit 11 positioned at reception region 22.
[0129] During a step 1000, ultrasound waves W1 are emitted in medium 2 by ultrasound source 10, for example by having wave generator apply a command signal to ultrasound source 10. As an example, ultrasound waves W1 are emitted continuously, for a duration longer than 30 s or 1 min.
[0130] Then, during a step 1002, measurement unit 11 measures the voltage signal waveform at reception region 22. This measurement comprises the simultaneous acquisition, by individual sensors 112 of sensor array 111, of voltage signal waveform values at reception region 22. This simultaneous acquisition is repeated for successive instants in time, for example during the measurement duration.
[0131] In this embodiment, this simultaneous acquisition is performed simultaneously for at least 95% of the individual sensors 112 of sensor array 111, preferably still for all the individual sensors 112 of sensor array 111.
[0132] During this step 1002, in this embodiment, measurement unit 11 operates in the passive mode.
[0133] At the end of step 1002, voltage signal waveform values acquired during the measurement duration are representative of the acoustic field values in medium 2.
[0134] During a step 1004, acoustic field values in medium 2 are automatically calculated, by signal processing unit 122 and, based on the voltage signal waveform measured.
[0135] Then, during a step 1006, an image I of the acoustic field medium 2 is automatically generated, for example using image generation device 123, based on the acoustic field values calculated during step 1004, is automatically displayed on display device 124. The image is then optionally displayed on display device 124.
[0136] In this exemplary embodiment, image I is a two-dimensional image. In alternative embodiments, generated image I is a three-dimensional object. Image I may also be raw image data that is able to be automatically processed by additional devices, for example in order to generate an enhanced image. To this end, the image generation device 123 may be arranged remotely from the rest of apparatus 1.
[0137] In this example, during step 1006, the generation of image I comprises the generation of image data, for example a digital image or an analog video signal, based on the calculated acoustic field values. This generated image I is then displayed by providing said image data to a hardware controller of display device 124. Steps 1002 and 1004 may be repeated continuously, so as to allow visualization in real time of ultrasound waves W1 in medium 2. For example, steps 1002, 1004 and 1006 are repeated for each instant T0, T1, T2, . . . , Tn.
[0138] Due to the position of sensor array 11 relative to emission region 21, and the fact that the acquisition is performed simultaneously for individual sensors 112, the propagation of ultrasound waves W1 between emission region 21 and reception region 22 is imaged in real time. Image generation device 124 allows for a real-time and accurate generation of image I. This method can be used reliably in soft materials, including optically opaque ones, as well as with ultrasound waves of high intensity.
[0139] This method, as well as apparatus 1, can advantageously be used in clinical settings, to monitor in real time the effect of a beam of ultrasonic waves applied to soft material 2, allowing for a quick correction of the focusing properties of the beam if needed. This method can nonetheless be used with any acoustically propagative medium and in non-clinical settings, for example for performing non-destructive testing in industrial settings.
[0140] FIG. 5 shows an apparatus 1' according to another embodiment of the invention. The elements of apparatus 1' which are similar to that of apparatus 1 bear the same references and are not described in further detail in what follows, given that the description above can be transposed to these elements.
[0141] Apparatus 1' is similar to apparatus 1, except that it further comprises a timing control unit 13 adapted to synchronize in time the acquisition of voltage signal waveform values by sensors 112 with the emission of ultrasound waves W2 by ultrasound source 10.
[0142] In the meaning of this invention, "synchronization" means that a controllable time delay is introduced between the emission of an ultrasound wave or of a train of ultrasound waves by ultrasound source 10 and the signal detection interval during which said ultrasound wave or train of ultrasound waves is expected to arrive at reception region 22.
[0143] More specifically, timing control unit 13 is programmed to perform this synchronization by controlling the delay between the beginning of each signal detection interval of ultrasound measurement unit 11 and the beginning of the emission of ultrasound waves W by ultrasound source 10, for example by means of a trigger signal.
[0144] For example, timing control unit 13 is connected to signal reception unit 121 and to wave generator 101 and is adapted to send a trigger signal to ultrasound scanner 12. Timing control unit 13 is also adapted to detect when wave generator 101 commands the emission of ultrasound waves W2.
[0145] Apparatus 1' is well suited for imaging ultrasound waves having a short duration, such as so-called transient waves, emitted during a short duration. Typically, said waves W2 are too short to be adequately imaged using apparatus 1 without synchronization.
[0146] For example, as illustrated in FIGS. 6 to 9, apparatus 1' is used to image transient ultrasound waves W2. The distance between ultrasound source 10 and ultrasound measurement unit 11 bears the reference "L" and is measured as the shortest path followed by acoustic beam 4 between source 10 and reception unit 11. Time interval L/c is the time of flight of wave W2 from the source 10 to the reception unit 11.
[0147] In the example of FIGS. 6 to 8, the acoustic field values are reconstructed based on voltage signal waveform values measured during the detection interval, and varying time "t" in equation (2). Here time "t" takes different values, respectively noted "t.sub.1", "t.sub.2" or "t.sub.n". In this example, only three such values "t.sub.1", "t.sub.2" or "t.sub.n" are described, however the number of values may be chosen differently, for example to cover successively the entire field of view 3.
[0148] FIG. 9 illustrates an example of synchronization between ultrasound source 10 and ultrasound measurement unit 11 for imaging said transient ultrasound wave W2.
[0149] Curve C'1 illustrates a trigger signal generated by timing control unit 13 for commanding ultrasound scanner 12. This trigger signal alternates periodically between an active value and an inactive value. Each time the trigger signal switches from an inactive value to an active value, ultrasound scanner 12 initiates a signal detection interval having a predefined duration, said signal detection intervals being similar to those described previously. Thus, each transition from an inactive value to an active value corresponds to one of instants T0, T1, T2, . . . , Tn.
[0150] Curves C'2 and C'3 illustrate, as a function of time t, several successive ultrasound waves W2 emitted periodically, shown respectively at emission region 21 and at reception region 22. The curve C'3 corresponds to curve C'2 shifted in time by an offset value equal to L/c, which is the time needed for each wave W2 to travel from ultrasound source 10 to measurement unit 11 inside soft material 2.
[0151] Curve C'4 illustrates one signal detection interval of ultrasound measurement unit 11 as a function of time t. The detection interval, here beginning at time T0, is illustrated here with the label "ON".
[0152] In this example, timing control unit 13 is programmed to detect the emission of an ultrasound wave W2 by ultrasound source 10, and then, in response, to command the beginning of a signal detection interval after a delay equal to DE. Preferably, delay DE is lower than or equal to L/c. In other words, the signal detection interval occurs after emission of an ultrasound wave W2, with a delay equal to DE after emission of said ultrasound wave W2. Optionally, the emission of ultrasound waves W2 is done periodically by ultrasound source 10, with a frequency equal to that of the frequency repetition of signal detection intervals.
[0153] Due to this synchronization, each ultrasound wave W2 arrives at reception region 22 during a signal detection interval, i.e. when ultrasound measurement unit 11 is activated and when ultrasound scanner 12 is able to acquire data measured by ultrasound measurement unit 11.
[0154] The method for imaging in real time the propagation of ultrasound waves in soft material 2 using apparatus 1' is similar to that of FIG. 4, except that during step 1002, the acquisition of voltage signal waveform values by individual sensors 112 is synchronized in time with the emission of the ultrasound waves by the ultrasound source 10, using timing control unit 13.
[0155] FIG. 10 illustrates another embodiment of the invention, in which the synchronization of apparatus 1' is taken advantage of. In this FIG. 10, curves C''1, C''2, C''3 and C''5 are similar, respectively, to curves C'1, C'2, C'3 and C'4 of FIG. 9. Curve C''4 corresponds to the amplitude, as a function of time, of ultrasound waves W3 emitted by measurement unit 11.
[0156] In this embodiment, named as "interlaced mode", ultrasound source 11 is commanded, for example by ultrasound scanner 12 and by timing control unit 13, so as to operate alternatively between the passive mode and the active mode, in order to acquire an image of medium 2 itself, along with imaging the propagation of acoustic waves W2 in the same medium 2.
[0157] For example, this operation mode is similar to that of FIG. 9, called the passive mode, except that, in addition, at some time intervals, measurement unit 11 enters in the active mode in which it emits ultrasound waves W2 as described previously. For example, operation in passive mode is repeated "n" times, then operation in active mode is repeated "m" times, where m and n are integer numbers greater than or equal to 1. In passive mode, the detection intervals have duration .DELTA.TP. In active mode, the detection intervals have duration .DELTA.TA. Preferably, .DELTA.TA=2.DELTA.TP=2D.sub.FOV/c, where D.sub.FOV is the depth of the field of view, as described previously. For example, each emission cycle of ultrasound waves W2 by source 10 is followed by an emission cycle of ultrasound waves W3 by measurement unit 11, corresponding to case n=m=1.
[0158] Measurement unit 11 then measures the corresponding reflected waves W3' during subsequent measurement intervals. In this example, measurement intervals of duration .DELTA.TP corresponding to the detection of ultrasound wave W2 at reception region by measurement unit 11 alternate with measurement intervals of duration .DELTA.TA corresponding to the detection of reflected ultrasound waves W3' by measurement unit 11.
[0159] Therefore, in this embodiment, additional steps are executed after steps 1000 and 1002, during which waves W3 are emitted and the corresponding reflected waves W3' are measured by measurement unit 11. During step 1004, a corresponding background image of the medium 2 itself is generated, based on the voltage signal waveform values associated to reflected waves W3'.
[0160] This background image is then combined with the image of the spatial distribution of the acoustic field values associated to waves W2, in order to generate a composite image. This way, structural features of medium 2, such as inclusions or defects, or organs of interest in the case of biological tissues, can be visualized in the combined image along with the propagation of ultrasound waves W2.
[0161] Signal processing unit 122 and image generation device 123 are programmed in consequence.
[0162] FIG. 11 illustrates another embodiment in which the synchronization of apparatus 1' is taken advantage of. This embodiment is named as "dual mode" and is similar to that of FIG. 10, except that ultrasound source 11 is now commanded so as to operate permanently in the active mode, in order to acquire an image of medium 2 itself by emitting ultrasound waves W3 and measuring corresponding reflected waves W3', simultaneously with imaging the propagation of acoustic waves W2 in the same medium 2. This way, structural features of medium 2 can be displayed in the generated image.
[0163] In this example, measurement intervals have a same duration .DELTA.TA equal to 2D.sub.FOV/c, and delay DE is preferably chosen so that DE is lower than or equal to L/c.
[0164] In this embodiment, instead of having two separate steps, measurement step 1002 comprises the acquisition of the voltage signal waveform values at reception region corresponding to the combined effect of ultrasound waves W2 and reflected waves W3'. Optionally, the method further comprises a processing step for automatically separating the contribution of ultrasound waves W2 from the contribution of ultrasound waves W3'. This operation is for example performed by signal processing unit 122.
[0165] Signal processing unit 122 and image generation device 123 are programmed in consequence.
[0166] According to a first exemplary possibility, ultrasound waves W2 and W3' are separated in the frequency domain, for example using a Fourier transform or a wavelet transform. This first possibility is preferably used where the frequency of waves W2 is different from the frequency of waves W3 and/or where waves W2 have a narrow bandwidth. The second possibility is preferably used where the shape of waves W2 is different from the shape of waves W3. According to another exemplary possibility, at least one of ultrasound waves W2 and W3 is transmitted using coded excitation, for example using complementary Golay codes as described by M. Golay in "Complementary series", IRE Transactions on Information Theory, 1961; 7(2): 82-87.
[0167] Preferably, the background image of medium 2 is then obtained using conventional beamforming reconstruction methods, while a series of images showing the propagation of ultrasound wave W2 is reconstructed with the time-reversal reconstruction method.
[0168] This dual mode can also be used as well when imaging continuous waves using apparatus 1', as described previously.
[0169] FIGS. 12 to 14 illustrate yet another embodiment of the invention, in which the synchronization of apparatus 1' is taken advantage of. This embodiment is similar to that of FIGS. 6 to 9, here for a fixed value of distance d, except that, during step 1002, the measurement is performed only by a predefined sub-group of the individual sensors 112. Thus, only a portion of field of view 3 is imaged. Therefore, steps 1000 and 1002 are repeated in succession in order to generate waves W1 and, each time, imaging a different portion of field of view 3 using a different predefined sub-group of the individual sensors 112, until the entire field of view 3 can be imaged. During each measurement step 1002, the simultaneous acquisition of voltage signal waveform values is thus performed only by the individual sensors 112 belonging to said predefined sub-group.
[0170] In this illustrative example, individual sensors 112 are shared between three distinct subgroups A, B and C. To simplify this example, the sensors 112 of each sub-group A, B and C are adjacent and the subgroups A, B and C are not overlapping. However, this is not necessarily the case and any arbitrary number of sub-groups may be defined.
[0171] This acquisition step is illustrated on FIGS. 12 to 14, respectively performed successively by each sub-group A, B, C of individual sensors 112 for imaging, respectively, portions 3', 3'' and 3''' of field of view 3. The delay DE is kept constant for each step, thus imaging a portion of the emitted waves, here noted W2', W2'' and W2''' respectively, in a same region of medium 2.
[0172] The images of the wave propagation can then be generated from the voltage signal waveform values successively acquired by the different sub-groups A, B, C of individual sensors 112. Image generation device 123 is further programmed to this end.
[0173] According to a first exemplary possibility, the images are generated at once during step 1004, after steps 1000 and 1002 have been repeated until all individual sensors 112 of sensor array 111 have been used.
[0174] According to a second exemplary possibility, the complete images of the field of view 3 are generated progressively, by repeating step 1004 every time steps 1000 then 1002 are repeated, to generate successive portions of the image. During each step 1004, a portion of the image I, i.e. an image of the corresponding portion 3', 3'' or 3''' of field of view 3, is generated using the measured voltage signal waveform values acquired by the sub-group of sensors 112 during the previous step 1002. Steps 1000, 1002 then 1004 are repeated until the image I of the entire field of view 3 is generated, even if one or several individual sensors 112 are used more than once.
[0175] This embodiment has the advantage that the generation of the image using data acquired by the successive sub-groups requires less hardware resources than generating an image using data acquired simultaneously by all sensors of the sensor array 111. Therefore, it can be easily implemented on low-end ultrasound scanners 12. While these successive acquisition steps take more time than a simultaneous acquisition by all individual sensors 112, the method is still faster and less cumbersome than moving a hydrophone around space.
[0176] According to yet another embodiment, not illustrated, ultrasound measurement unit 11 comprises a two-dimensional sensor matrix comprising several adjacent sensor arrays, each comprising an array of individual sensors arranged along parallel orientation axes, for example parallel to orientation axis X11. Said two-dimensional sensor matrix replaces sensor array 111 and plays a similar role as sensor array 111 within ultrasound measurement unit 11. For example, individual sensors forming said two-dimensional sensor matrix are similar to individual sensors 112, and each array is similar to sensor array 11.
[0177] As a consequence, field of view of ultrasound measurement unit 11 is a three-dimensional field of view having a prismatic shape and, in the case where axes X10 and X11 are aligned, also comprising geometrical plane P.
[0178] Then, during step 1004, the generated image is a three-dimensional image of the spatial distribution of the acoustic field inside a volume of soft material 2, between emission region 21 and reception region 22.
[0179] This embodiment is applicable to either apparatus 1 or apparatus 1' and may be used in any of the previously described embodiments. Optionally, this two-dimensional sensor matrix may be used in a way similar to that of the embodiment of FIGS. 12 to 14, by defining sub-groups each corresponding to a one-dimensional array of sensors within the two-dimensional sensor matrix.
[0180] In an exemplary embodiment, the sensor array is mounted on a motorized table composed of translation stages, rotation stages, or a combination of such stages. The sensor array can be a linear array, or a matrix array, or any array. Three-dimensional imaging is performed by moving the sensor array to different positions. For each position, the sensor voltage waveforms are recorded, so that the total number of waveforms being acquired Nw is now equal to the number of sensor elements multiplied by the number of displacement positions. The acoustic field is calculated using equation (2), where index k now varies from 1 to Nw. Optionally, the image of the acoustic field is progressively updated after each displacement. This embodiment improves the accuracy of the reconstructed acoustic field, by means of artificially extending the surface of the receiver.
[0181] Alternatively, the acoustic source is mounted on a motorized stage, and the sensor array is mounted on a static holder or on another motorized system.
[0182] The above examples are described with respect to ultrasound waves. However, the invention may be applied to other mechanical waves, such as infrasound waves, for example for imaging applications in non-medical settings. In that case, apparatus 1 and/or 1' are adapted in consequence. For example, ultrasound source 10 is replaced by an acoustic source having a similar role. Ultrasound measurement unit 11 is replaced by an acoustic measurement unit having a similar role and comprising a sensor array including individual sensors suitable to operate in the corresponding frequency range. Ultrasound scanner 12 is replaced by an acoustic scanner having a corresponding role.
[0183] The embodiments and alternatives described above may be combined with each other in order to generate new embodiments of the invention.
* * * * *
D00000
D00001
D00002
D00003
D00004
D00005
D00006
D00007
D00008


XML
uspto.report is an independent third-party trademark research tool that is not affiliated, endorsed, or sponsored by the United States Patent and Trademark Office (USPTO) or any other governmental organization. The information provided by uspto.report is based on publicly available data at the time of writing and is intended for informational purposes only.
While we strive to provide accurate and up-to-date information, we do not guarantee the accuracy, completeness, reliability, or suitability of the information displayed on this site. The use of this site is at your own risk. Any reliance you place on such information is therefore strictly at your own risk.
All official trademark data, including owner information, should be verified by visiting the official USPTO website at www.uspto.gov. This site is not intended to replace professional legal advice and should not be used as a substitute for consulting with a legal professional who is knowledgeable about trademark law.