Method And System For Representation Of Flight Events Using Icons Within A Graphical User Interface
Pena; Joslenne ; et al.
U.S. patent application number 16/000214 was filed with the patent office on 2019-12-05 for method and system for representation of flight events using icons within a graphical user interface. This patent application is currently assigned to HONEYWELL INTERNATIONAL INC.. The applicant listed for this patent is HONEYWELL INTERNATIONAL INC.. Invention is credited to Joslenne Pena, Aaditi Vasudev Rokade.
| Application Number | 20190367177 16/000214 |
| Document ID | / |
| Family ID | 68694284 |
| Filed Date | 2019-12-05 |


| United States Patent Application | 20190367177 |
| Kind Code | A1 |
| Pena; Joslenne ; et al. | December 5, 2019 |
METHOD AND SYSTEM FOR REPRESENTATION OF FLIGHT EVENTS USING ICONS WITHIN A GRAPHICAL USER INTERFACE
Abstract
Methods and systems are provided for displaying non-compliance with expected performance values for flight parameters of an aircraft. The method comprises collecting flight parameter data from the aircraft during aircraft operations and generating a graphical display of a flight path of the aircraft. The flight parameter data is compared with the expected performance values for the flight parameters of the aircraft and points of noncompliance by the aircraft are identified along its flight path. A graphical display icon is superimposed on each point of noncompliance on a graphical display of the flight path of the aircraft. The graphical display icon is a unique iconographic representation of the flight parameter. The flight path and the display icons are displayed on a graphical display device for review after completion of aircraft operations.
| Inventors: | Pena; Joslenne; (Minneapolis, MN) ; Rokade; Aaditi Vasudev; (Navi Mumbai, IN) | ||||||||||
| Applicant: |
|
||||||||||
|---|---|---|---|---|---|---|---|---|---|---|---|
| Assignee: | HONEYWELL INTERNATIONAL
INC. Morris Plains NJ |
||||||||||
| Family ID: | 68694284 | ||||||||||
| Appl. No.: | 16/000214 | ||||||||||
| Filed: | June 5, 2018 |
| Current U.S. Class: | 1/1 |
| Current CPC Class: | B64D 45/0005 20130101; G07C 5/0825 20130101; G08G 5/0021 20130101; B64D 43/00 20130101; G06F 3/04817 20130101; G08G 5/0052 20130101; G08G 5/0065 20130101; G06F 3/04842 20130101; G08G 5/065 20130101; B64D 2045/0075 20130101; B64D 45/00 20130101; G06F 3/04845 20130101; G07C 5/0841 20130101; G08G 5/025 20130101 |
| International Class: | B64D 43/00 20060101 B64D043/00; B64D 45/00 20060101 B64D045/00; G07C 5/08 20060101 G07C005/08; G08G 5/00 20060101 G08G005/00; G06F 3/0481 20060101 G06F003/0481 |
Claims
1. A method for displaying non-compliance with expected performance values for flight parameters of an aircraft, comprising: collecting flight parameter data from the aircraft during aircraft operations; generating a graphical display of a flight path of the aircraft during aircraft operations; comparing the flight parameter data with the expected performance values for the flight parameters of the aircraft during aircraft operations; identifying points of noncompliance by the aircraft with the expected performance values for flight parameters along the flight path of the aircraft; superimposing a graphical display icon on each point of noncompliance by the aircraft on the graphical display of the flight path of the aircraft, where the graphical display icon comprises a unique iconographic representation of the flight parameter; and displaying the flight path and the display icons on a graphical display device for review after completion of aircraft operations.
2. The method of claim 1, where the graphical display of a flight path is a two-dimensional display.
3. The method of claim 1, where the graphical display of a flight path is a three-dimensional display.
4. The method of claim 1, where the points of noncompliance by the aircraft are defined as Flight Operations Quality Assurance (FOQA) events.
5. The method of claim 1, where the graphical display icon comprises a digital map pin.
6. The method of claim 5, where the digital map pin displays pop-up details of the point of noncompliance by the aircraft when selected by a user.
7. The method of claim 1, where the unique iconographic representation of the flight parameter of the graphical display icon may be modified by a user.
8. The method of claim 7, where the resolution size of the unique iconographic representation is modified by the user.
9. The method of claim 7, where the color of the unique iconographic representation is modified by the user.
10. The method of claim 7, where the symbol of the unique iconographic representation is modified by the user.
11. The method of claim 7, where the details of the point of noncompliance displayed on a pop-up of the unique iconographic representation is modified by the user.
12. The method of claim 1, where the review of the display of the flight path and the display icons are part of a post-flight analysis of the aircraft.
13. The method of claim 1, where the display of the flight path and the display icons on the graphical display device is shown in real time.
14. The method of claim 13, where the graphical display device is a mobile electronic device.
15. The method of claim 14, where the mobile electronic device is an electronic flight bag (EFB).
16. The method of claim 14, where the mobile electronic device is an electronic tablet.
17. The method of claim 13, where the real-time display functions as an alert for an aircrew member of the aircraft.
18. The method of claim 17, where the alert is for fuel status of the aircraft.
19. The method of claim 17, where the alert is for environmental conditions affecting the aircraft.
20. A system for the displaying non-compliance with expected performance values for flight parameters of an aircraft, comprising: a plurality of flight data sensors aboard the aircraft that collect flight data parameters during aircraft operations; a computing device located on-board the aircraft, the computing device comprising a processor configured to, generate a graphical display of a flight path of the aircraft during aircraft operations, compare the flight parameter data with the expected performance values for the flight parameters of the aircraft during aircraft operations, identify points of noncompliance by the aircraft with the expected performance values for flight parameters along the flight path of the aircraft, and superimpose a graphical display icon on each point of noncompliance by the aircraft on the graphical display of the flight path of the aircraft, where the graphical display icon comprises a unique iconographic representation of the flight parameter; and a graphical display device that displays the flight path and the display icons for review after completion of aircraft operations.
Description
TECHNICAL FIELD
[0001] The present invention generally relates to aircraft operations, and more particularly relates to a method for representation of flight events using icons within a graphical user interface.
BACKGROUND
[0002] As aircraft data captured during flight becomes more abundant, it is necessary to effectively analyze and visualize this data to measure aircraft performance. Aircrew members and other users of such information must be able to receive the data related to aircraft performance in an efficient way on a graphical user interface (GUI). Hence, there is a need for a method and system for representation a flight events using icons within a graphical user interface.
BRIEF SUMMARY
[0003] This summary is provided to describe select concepts in a simplified form that are further described in the Detailed Description. This summary is not intended to identify key or essential features of the claimed subject matter, nor is it intended to be used as an aid in determining the scope of the claimed subject matter.
[0004] A method is provided for displaying non-compliance with expected performance values for flight parameters of an aircraft. The method comprises: collecting flight parameter data from the aircraft during aircraft operations; generating a graphical display of a flight path of the aircraft during aircraft operations; comparing the flight parameter data with the expected performance values for the flight parameters of the aircraft during aircraft operations; identifying points of noncompliance by the aircraft with the expected performance values for flight parameters along the flight path of the aircraft; superimposing a graphical display icon on each point of noncompliance by the aircraft on the graphical display of the flight path of the aircraft, where the graphical display icon comprises a unique iconographic representation of the flight parameter; and displaying the flight path and the display icons on a graphical display device for review after completion of aircraft operations.
[0005] A system is provided for displaying non-compliance with expected performance values for flight parameters of an aircraft. The system comprises: a plurality of flight data sensors aboard the aircraft that collect flight data parameter during aircraft operations; a computing device located on-board the aircraft, the computing device comprising a processor configured to, generate a graphical display of a flight path of the aircraft during aircraft operations, compare the flight parameter data with the expected performance values for the flight parameters of the aircraft during aircraft operations, identify points of noncompliance by the aircraft with the expected performance values for flight parameters along the flight path of the aircraft, superimpose a graphical display icon on each point of noncompliance by the aircraft on the graphical display of the flight path of the aircraft, where the graphical display icon comprises a unique iconographic representation of the flight parameter; and a graphical display device that displays the flight path and the display icons for review after completion of aircraft operations.
[0006] Furthermore, other desirable features and characteristics of the method and apparatus will become apparent from the subsequent detailed description and the appended claims, taken in conjunction with the accompanying drawings and the preceding background.
BRIEF DESCRIPTION OF THE DRAWINGS
[0007] The present invention will hereinafter be described in conjunction with the following drawing figures, wherein like numerals denote like elements, and wherein:
[0008] FIG. 1 shows a series of unique graphical display icon representations of a flight event in accordance with one embodiment;
[0009] FIG. 2 shows a series of graphical map pins with unique graphical display icon representations for use with an electronic display of a flight event in accordance with one embodiment;
[0010] FIG. 3 shows a two-dimensional display of a flight path of an aircraft using graphical map pins of flight events in accordance with one embodiment;
[0011] FIG. 4 shows a three-dimensional display of a flight path of an aircraft using graphical map pins of flight events in accordance with one embodiment; and
[0012] FIG. 5 shows a flowchart of a method for displaying noncompliance with expected performance values for flight parameters of an aircraft in accordance with one embodiment.
[0013] FIG. 6 shows a diagram of a system for displaying noncompliance with expected performance values for flight parameters of an aircraft in accordance with one embodiment.
DETAILED DESCRIPTION
[0014] The following detailed description is merely exemplary in nature and is not intended to limit the invention or the application and uses of the invention. As used herein, the word "exemplary" means "serving as an example, instance, or illustration." Thus, any embodiment described herein as "exemplary" is not necessarily to be construed as preferred or advantageous over other embodiments. All of the embodiments described herein are exemplary embodiments provided to enable persons skilled in the art to make or use the invention and not to limit the scope of the invention which is defined by the claims. Furthermore, there is no intention to be bound by any expressed or implied theory presented in the preceding technical field, background, brief summary, or the following detailed description.
[0015] A method for displaying non-compliance with expected performance values for flight parameters of an aircraft has been developed. The method involves collecting flight parameter data from the aircraft during aircraft operations. Next a graphical display of the flight path of the aircraft is generated. The flight parameter data is then compared with the expected performance values of the flight parameters of the aircraft and points of noncompliance are identified along the flight path. A graphical display icon is superimposed on each point of noncompliance on the graphical display. Each graphical display icon comprises a unique iconographic representation of the flight parameter. The flight path and the display icons are displayed on a graphical display device for review after completion of aircraft operations.
[0016] In some embodiments, the flight parameters that are measured are defined as Flight Operations Quality Assurance (FOQA) events. FOQA is a voluntary safety program that is designed to make commercial aviation safer by allowing commercial airlines and pilots to share de-identified aggregate information with the Federal Aviation Administration (FAA). The FAA can monitor national trends in aircraft operations and target its resources to address operational risk issues (e.g., flight operations, air traffic control (ATC), airports). The fundamental objective is to allow parties to identify and reduce or eliminate risks as well as minimize deviations from regulations. Examples of defined FOQA events and their descriptions are shown in Table 1 shown below:
TABLE-US-00001 TABLE 1 EVENT EVENT NAME DESCRIPTION NOTES Excessive Power on the An event designed to This event would Ground measure high power also be used in the settings on the ground After Landing that could result in injury phase. to personnel or damage to equipment. Excessive EGT - Start An event designed to This event could detect EGT in excess of be included in flight manual limits other flight during engine start. phases, if desired, although EGT exceedances other than on engine start are extremely rare. Engine Overtemp An event to detect engine EGT in excess of in-flight limits. Takeoff Warning An event that would On some newer trigger on the same aircraft, Takeoff conditions that set off the Warning is a takeoff warning horn. discrete parameter. Trim Setting is normally a component that triggers Takeoff Warning, but it is sometimes not a recorded parameter. Rejected Takeoff - Low An event to detect that the Low end should Speed takeoff roll has begun and be greater than the takeoff has been any anticipated abandoned below a taxi speed. 100 predetermined speed. knots is generally accepted as the cutoff between high- and low- speed aborts. Rejected Takeoff - An event to detect that the High Speed takeoff roll has begun and the takeoff has been abandoned above a predetermined speed. Liftoff Speed High An event to determine the V2 is calculated relationship of the actual based on Gross liftoff speed to V2. Weight. Liftoff Speed Low An event to determine the V2 is calculated relationship of the actual based on Gross liftoff speed to V2. Weight. Pitch High at Takeoff An event that measures Limits are based pitch at takeoff in relation on the angle to the angle required to required for the strike the tail of the tail cone to aircraft. contact the ground with struts compressed. Takeoff Climb Speed An event to detect climb Altitude ranges High speed higher than desired should be used to during the Takeoff Phase accommodate of flight. different desired climb speeds in those ranges. In certain ranges, the climb airspeed will be based on V2. Takeoff Climb Speed An event to detect climb Altitude ranges Low speed lower than desired s hould be used to during the Takeoff Phase accommodate of flight. different desired climb speeds in those ranges. Early Flap Retraction An event to detect any flap movement from the takeoff position prior to reaching the altitude at which flap retraction should begin Excessive Bank Angle An event to detect when Altitude ranges at Takeoff the bank angle exceeds should subdivide the maximum allowable this event with bank angle. different bank limitations in each range. Turbulence - Flaps An event to detect 1.5 g is a Extended excessive G-forces prior generally accepted to flap retraction. limit for this type of event. This event can also occur during the Approach phase of flight. Slow Initial Climb An event to detect a slower than normal climb to the clean-up altitude. Abnormal Flap An event to detect slow This event will Retraction flap movement between also detect stuck any selected flap position flaps. and the previously selected flap position. Height Loss in Climb An event to detect an This event might interruption in climb in benefit from which altitude is lost subdivision in before the climb resumes. altitude ranges. Climb Speed High An event to detect climb speed higher than 250 knots below 10,000 feet. Flap Limit Altitude An event to detect when Altitude would flaps are operated above correspond to the the maximum allowable maximum altitude for flap operation. operating altitude for flaps extended. Turbulence - Flaps Up An event to detect This event will excessive G-force while measure airborne, indicating an turbulence from encounter with turbulent all sources conditions. (convective activity, clear air, or wake induced). Vertical Acceleration limits of +1.5 g to -0.5 g might be considered. Holding/Excess Radar An event to detect The start point for Vectoring excessive delays caused this event would by ATC holding/radar occur after the vectoring. first 360-degree turn and end 600 seconds after the last turn. The event would trigger when the cumulative time exceeds a user defined value. Operating Ceiling An event to detect Exceeded operation of the aircraft above its certificated maximum operating altitude. Landing Gear Down The indicated mach Limiting mach Speed Exceeded number of the aircraft number would be (Mach) exceeds the maximum MLE. allowable mach for operation with the landing gear in the down position. MMO Exceeded An event to detect occurrences of the indicated mach number of the aircraft in excess of the maximum allowable mach number. VMO Exceeded An event to detect occurrences of the indicated airspeed of the aircraft in excess of the maximum allowable airspeed. High Descent Rate An event that measures This event can be unusually high rates of subdivided into descent. altitude ranges to capture abnormal rates of descent that might be caused by different ATC facilities. Excessive Speedbrake An event that measures This event is Usage the amount of time the useful in speedbrake is used during evaluating arrival descent. procedures into specific airports. Approach Speed High An event to detect This event should operation on approach be broken down that is in excess of its into altitude computed final approach bands. Suggested speed. breakdown would be HAT >1,000 feet, HAT 500- 1,000 feet, HAT 50-500 feet, HAT <50 feet. Speeds above 1,000 feet would reference a lookup table. Approach Speed Low An event to detect Speeds above operation on approach 1,000 feet would that is below its computed reference a lookup final approach speed. table. Excessive Power An event to detect an Increase excessive power increase during final phase of approach. Abnormal An event to detect the This event would Configuration - simultaneous use of flaps only be included Flaps/Speedbrake and speedbrakes. if this type of operation were prohibited in the flight operations manual. Abnormal Flap An event to detect slow This event will Extension flap movement between also detect stuck any selected flap position flaps. and the previously selected flap position. Landing Gear Down An event to detect when Speed Exceeded (IAS) the indicated airspeed of the aircraft exceeds the maximum allowable airspeed for operation with the landing gear in the down position. Late Landing Flaps An event to detect flap This event is movement to the landing slightly different flap position below a from Late predetermined altitude. Landing Configuration in that it detects flap movement below a set altitude rather than a flap setting. Low Power on An event to detect aircraft Approach engines not spooled or the power reduced to an unspooled condition below a predetermined altitude. Landing Gear An event to detect when If the operating Operation the indicated airspeed of limitation is the aircraft exceeds the different for maximum allowable landing gear airspeed for operation of extension and the landing gear in transit. retraction, separate events will need to be created for each limitation. Operation Left of An event to detect Localizer Centerline deviation left of localizer centerline.
Operation Right of An event to detect Localizer Centerline deviation right of localizer centerline. Operation Above An event to detect Glideslope deviation above glideslope. Operation Below An event to detect Glideslope deviation below glideslope. Descent Below MDA An event to detect descent below MDA (followed by a climb back to MDA) on non-precision approaches Flap Limiting Speed An event to detect flap This event will be operation at a speed that constructed with a exceeds the maximum different speed placarded airspeed. limit for each flap setting through the use of a lookup table. It will also detect speed exceedances during retraction in the Takeoff phase of flight. Go Around An event to detect that the aircraft has begun its descent for landing, discontinues that descent, and does not land from that approach. ATC Go Around An event to detect a go- around event in which no other events are triggered, such as approach instability, indicating the go around was directed by ATC. Late Landing An event to detect that the Configuration aircraft is not configured with landing flaps and landing gear in the down and locked position at 500 feet HAT. Tire Limiting Speed An event to detect if the tire limiting speed is exceeded. Pitch High - Landing An event that measures Limits are based pitch at landing in relation on the angle to the angle required to required for the strike the tail of the tail cone to aircraft. contact the ground with struts compressed Pitch Low - Landing An event that measures pitch attitude where the aircraft is in a nose down attitude that might result in an initial nose-gear touchdown or threepoint landing. Landing in a Crab An event to detect failure to align aircraft with the runway at touchdown. Hard Landing An event that measures excessive Gforce at touchdown, indicating a hard landing. Bounced Landing An event that measures excessive Gforce at touchdown followed by a second excessive G-force, indicating a bounced, hard landing. Excessive Brake Usage An event to detect higher- A routine than-normal brake operational application. measurement (ROM) would be helpful to determine normal braking at a given airport. Thrust Reverser Stowed An event that measures the speed at which the thrust reverser is stowed during landing rollout. Overweight Landing An event to detect landings made in excess of the maximum gross landing weight. Abnormal/Incorrect An event to detect that the Will need to be Landing Flaps aircraft touched down customized for the with flaps in a position recommendations less than the minimum in the flight expected landing flap manual. setting. Runway/Taxi way An event that measures Rough excessive G-force on the ground, indicating defects in runway/taxiway surfaces. Stick Shaker Operation An event to detect stick shaker operation. GPWS Warning An event to detect when a This event should GPWS warning is be subdivided for triggered. each of the different warning modes of the GPWS. Engine Failure An event to detect inflight engine failure/shutdown. TCAS Advisory An event to detect any This event should TCAS advisory triggered. be separated for TCAS Traffic Advisories (TAs) and Resolution Advisories (RAs). Engine Reverse at Low An event to detect use of Speed engine reverse at low speed that can result in engine overtemps and/or FOD ingestion.
[0017] The events captured by flight data resources involve multiple conceptual mechanical flight parameters. It is advantageous to represent this high priority data in the simplest possible format on the GUI-based applications for easy and quick recognition by the users. This is especially true when the end-users need to act in an appropriate time based on the outcomes of this analysis. The need to articulate and communicate this information quickly and effectively is important as it has great impact on flight operations and performance.
[0018] The use of a graphical display icon is a technique of quickly and effectively communicating necessary flight parameter conditions across a wide variety of platforms including mobile applications, desktop applications, avionics display devices, etc. For example, a graphical display icon could be used on a mobile platform such as an electronic flight bag (EFB) or electronic tablet carried by an aircrew member. The graphical display icons typically require a library of intuitive representations to convey information about status, system behavior task action, or decision making processes especially during critical events.
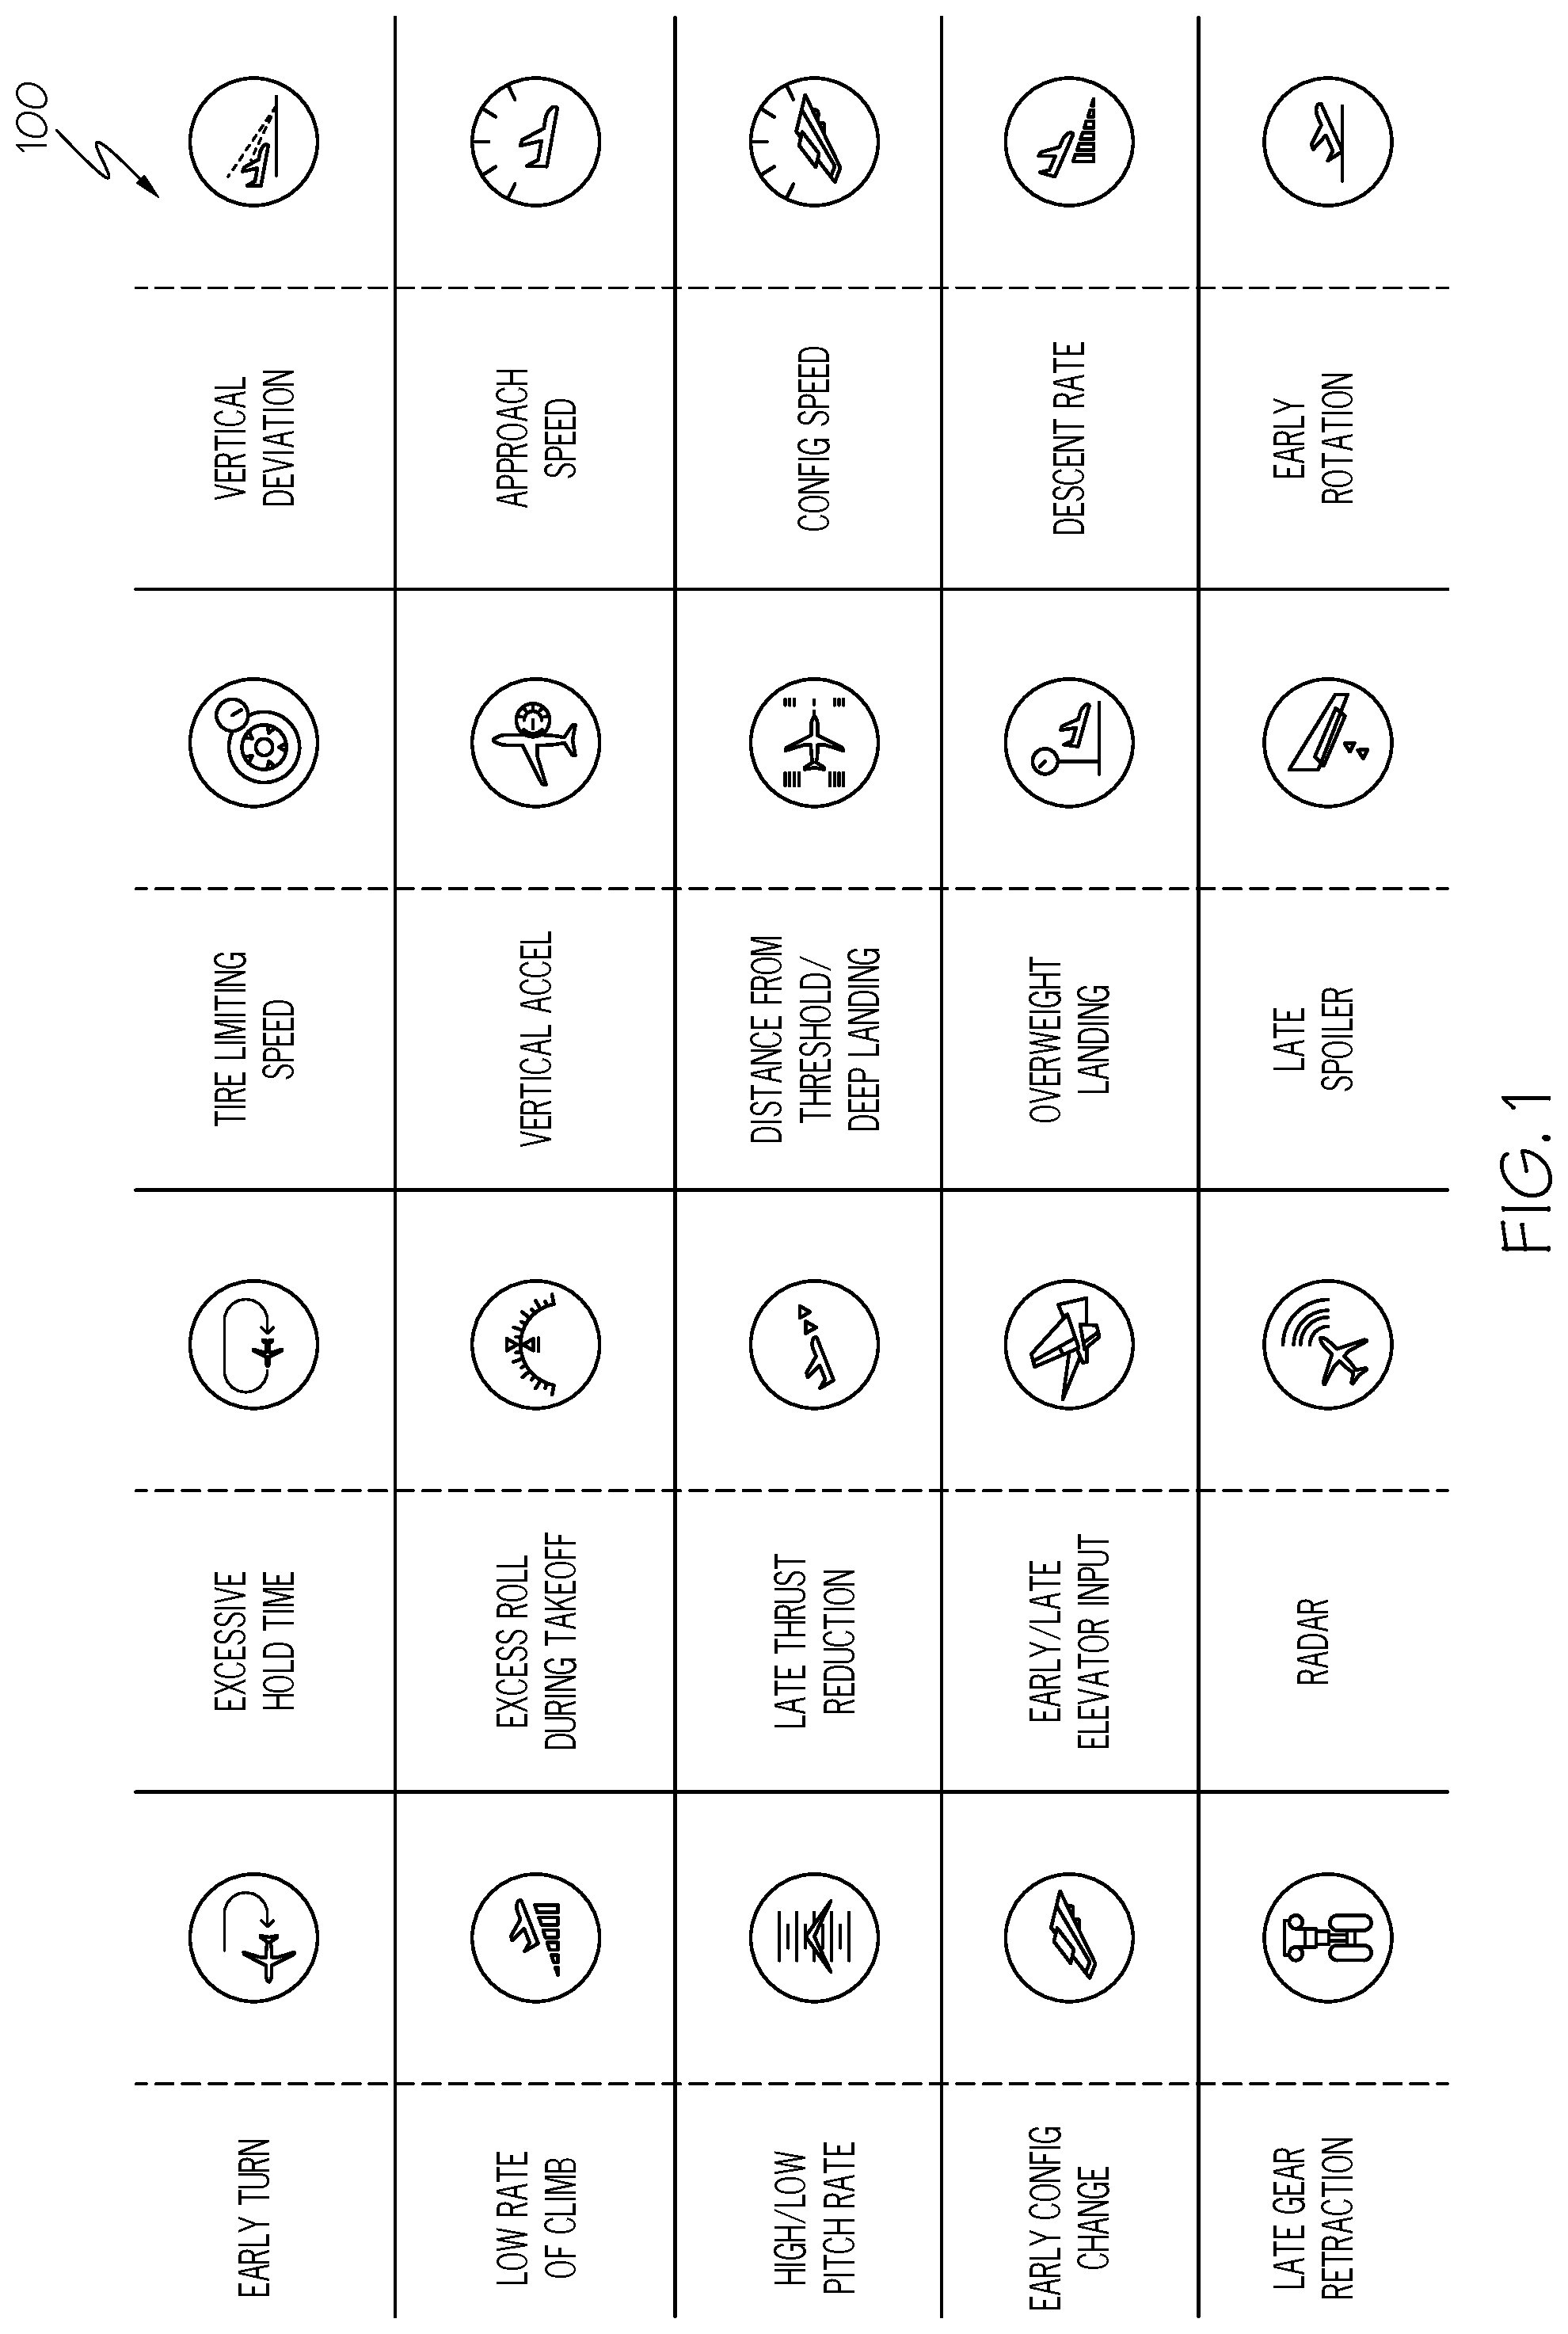
[0019] A key aspect for quick and effective communication is using a "unique iconographic representation" of a flight parameter for each associated graphical display icon. Each iconographic representation would clearly communicate the specific flight parameter conditions with the simple visual recognition. Turning now to FIG. 1, examples of unique iconographic representations of flight parameters are shown. These flight parameters include: early turn; excessive hold time; tire limiting speed; vertical deviation; low rate of climb; excessive roll during take-off; vertical acceleration; approach speed; high/low pitch rate; late thrust reduction; distance from threshold/deep landing; configuration speed; early configuration change; early/late elevator input; overweight landing; dissent rate; late gear retraction; radar; late spoiler; and early rotation.
[0020] As can be seen, each of these iconographic representations is a separate graphical representation of the associated flight parameter that can visually and accurately convey to a user, the flight parameter associated with the icon in real time without cognitively overloading the user. While such iconographic representations may be standardized, it should be understood that these icons may be modified by a user in other embodiments. For example, a user may modify the resolution size, the color, and the symbol used to suit individual preferences and needs. The icons may be tailored to apply to different contextual situations such as fuel, passenger safety, specific flight phases, environmental/atmospheric conditions or automated technologies on board the aircraft.
[0021] In other embodiments, the unique iconographic representations may be used in various graphical formats such as map pins or event detail cards on a graphical display such as a flight path of the aircraft. For example, a map pin with an iconographic representation may further function with a "pop up" message which displays further flight parameter information upon selection of the map pin. Turning now to FIG. 2, examples 200 of map pins are shown that correspond to the unique iconographic representations previously shown in FIG. 1.
[0022] Turning now to FIG. 3, a two-dimensional display 300 of a flight path 302 of an aircraft using graphical map pins 304a, 306a and 308a of flight events is shown in accordance with one embodiment. The display of the flight path 302 shows the altitude of the aircraft versus the time of the flight. Various display map pins 304a, 306a and 308a are shown at various points along the flight path that do not comply with expected performance values of the respective flight parameters. Each display map pin 304a, 306a and 308a has a corresponding event detail card 304b, 306b and 308b that provides more specific information concerning the noncompliance. In this example, the first map pin 304a indicates a noncompliant pitch rate of the aircraft while its corresponding detail card 304b shows a 88.degree./sec high pitch rate of the aircraft. The second display map pin 306a indicates a low rate of climb while its corresponding detail card 306b indicates a low rate of climb of 88 feet/minute. The third display map pin 308a indicates a late gear retraction of the aircraft while the corresponding detail card 308b indicates the landing gear retracted to 880.
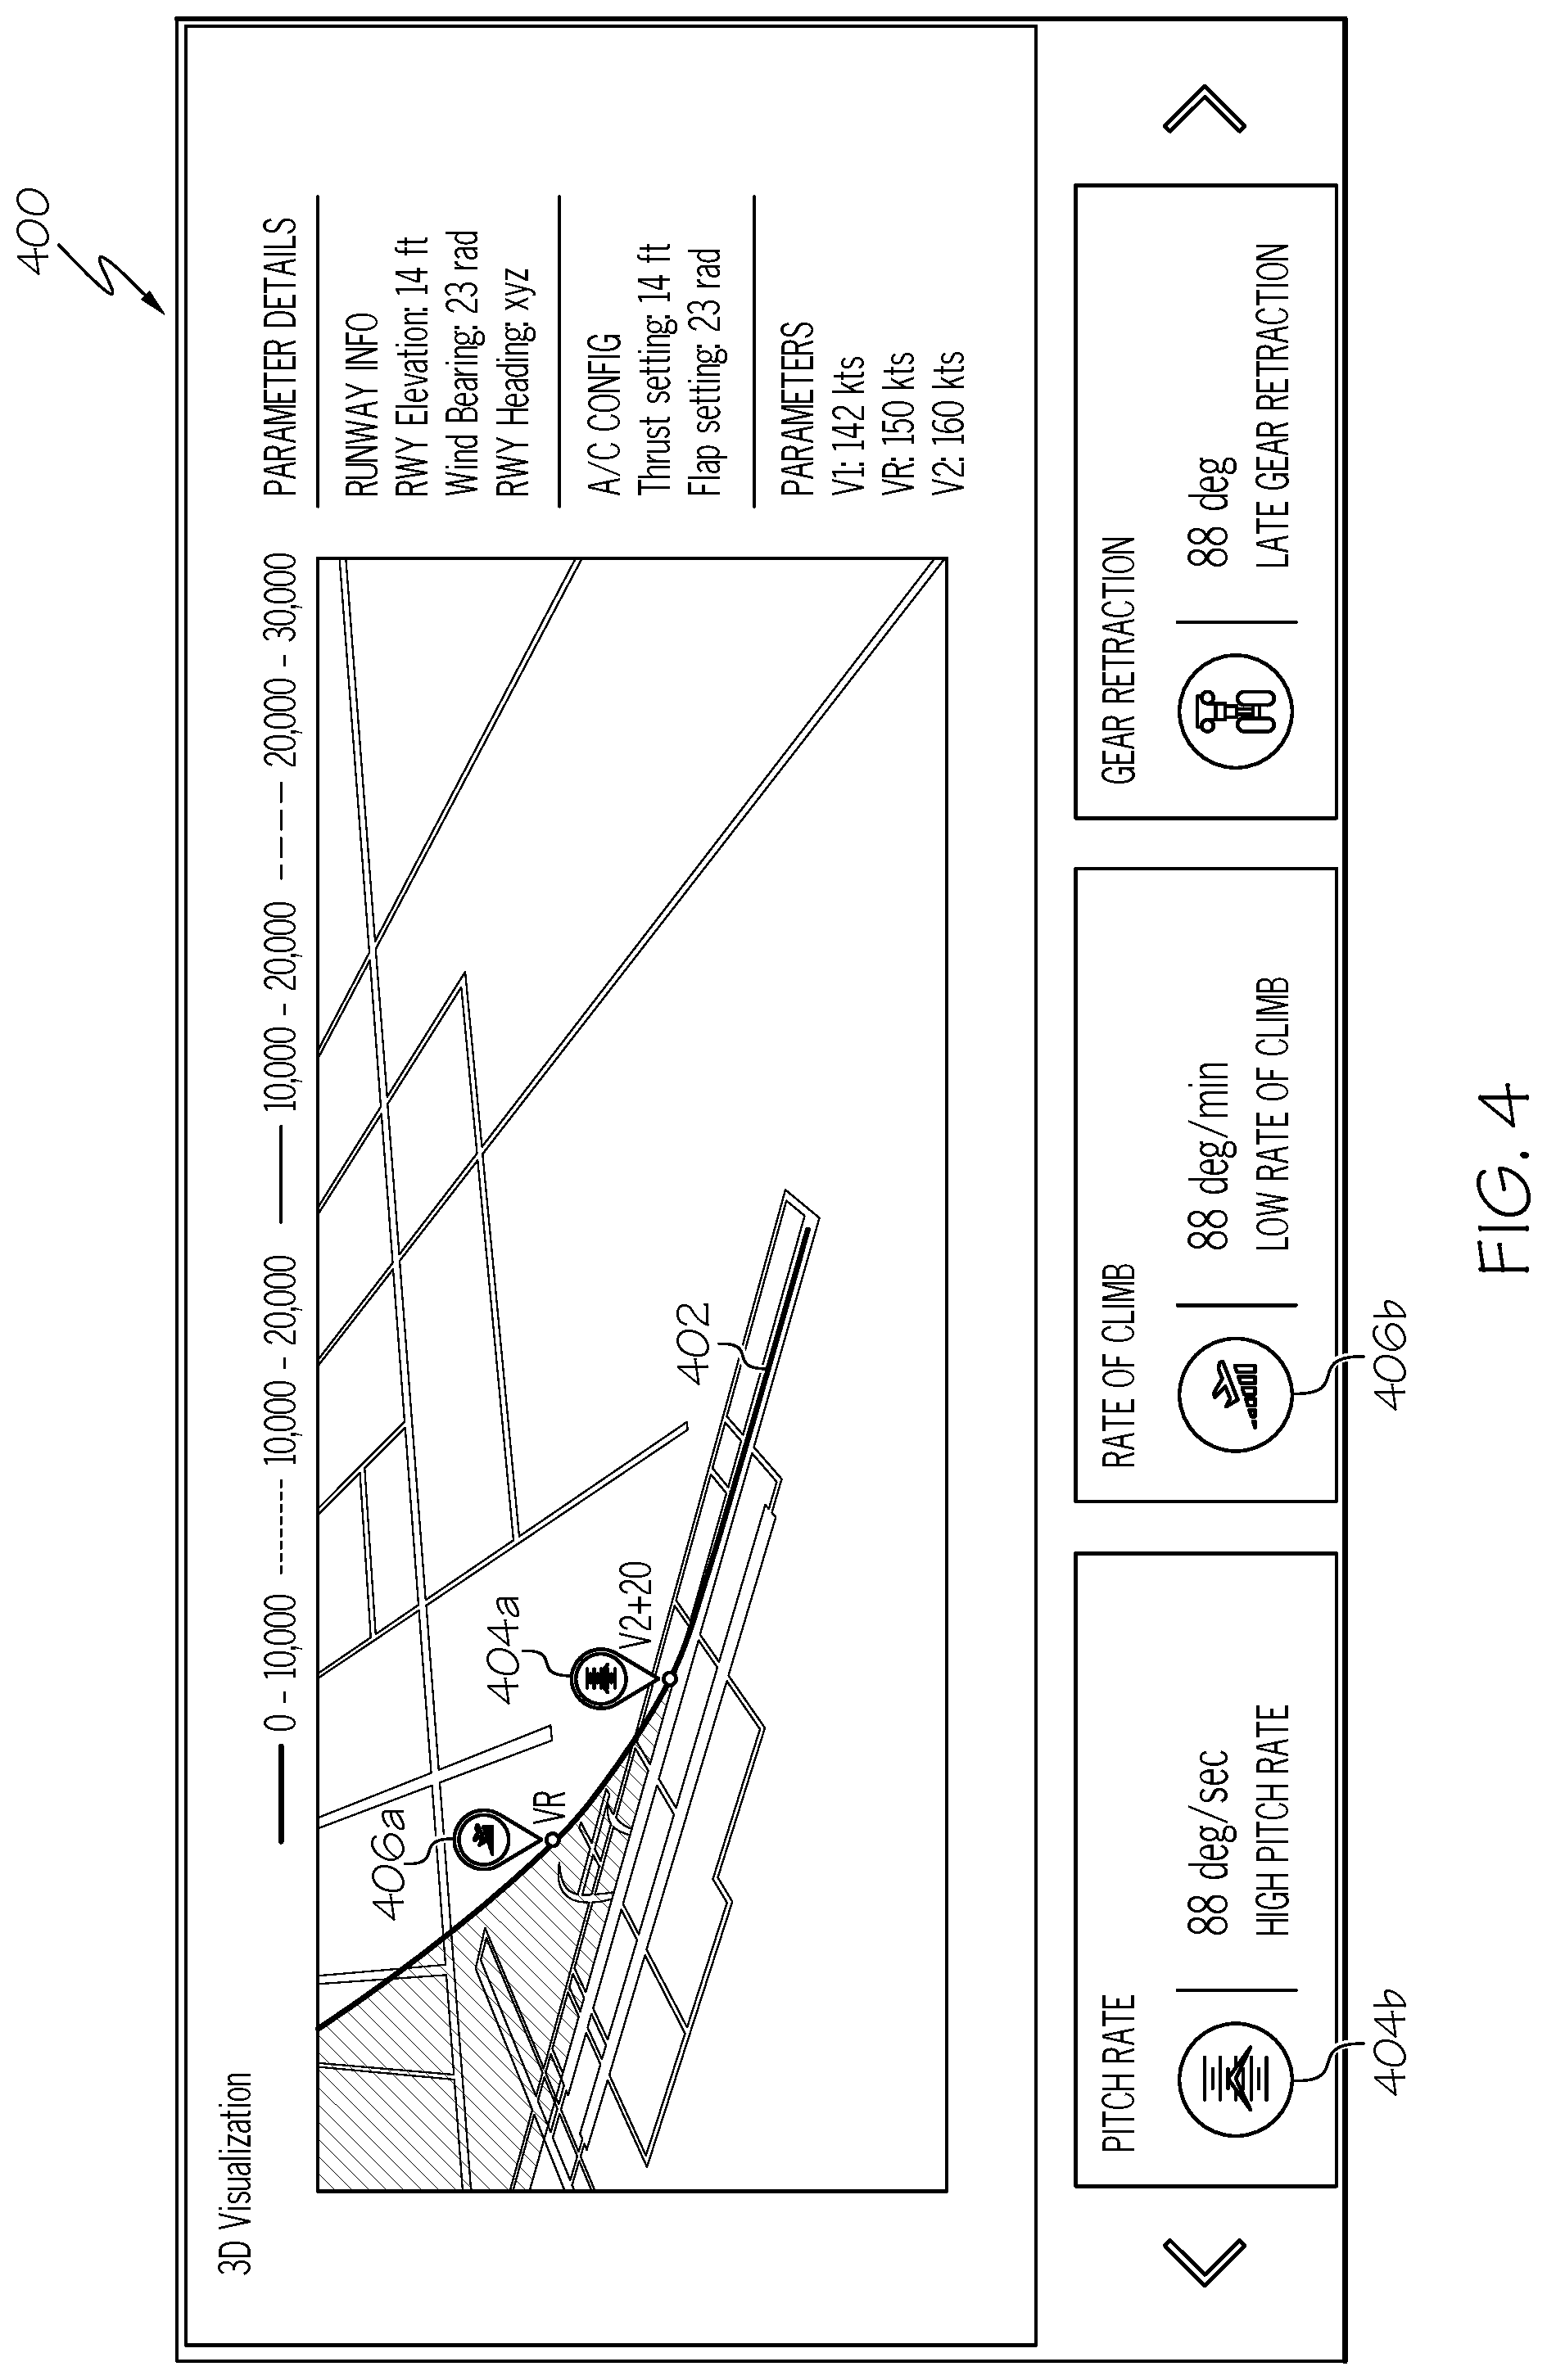
[0023] Turning now to FIG. 4, a three-dimensional display 400 of a flight path 402 of an aircraft using graphical map pins 404a and 406a of flight events is shown in accordance with one embodiment. The display of the flight path 402 shows a three-dimensional visualization of an aircraft's flight path during takeoff. Two display map pins 404a and 406a are shown at various points along the flight path where the aircraft does not comply with expected performance values for the respective flight parameters. Each display map pin 404a and 406a has a corresponding event detail card 404b and 406b that provides more specific information concerning the noncompliant flight parameter. In this example, the first display map pin 404a indicates a noncompliant pitch rate of the aircraft while its corresponding detail card 404b shows details of a high pitch rate of 88.degree./sec. The second display map pin 406a indicates a low rate of climb while its corresponding detail card 406b shows details of a low rate of climb of 88 ft./min.
[0024] Turning now to FIG. 5, a flowchart 500 of a method for displaying noncompliance with expected performance values for flight parameters of an aircraft is shown in accordance with one embodiment. First, flight parameter data from the aircraft during aircraft operations is collected 502. A graphical display of the flight path of the aircraft is then generated 504. The flight parameter data is compared with the expected performance values for the flight parameters of the aircraft during aircraft operations 506. Any points of noncompliance are then identified 508. Once the points of noncompliance are identified 510, graphical display icons are superimposed on each point of noncompliance on the graphical display of the flight path 512. The graphical display icon is a unique iconographic representation of the flight parameter that quickly provides notice concerning the noncompliant flight parameter. The graphical display of the flight path and the display icons is then shown to a user to highlight the points of noncompliance by the aircraft along the flight path 514.
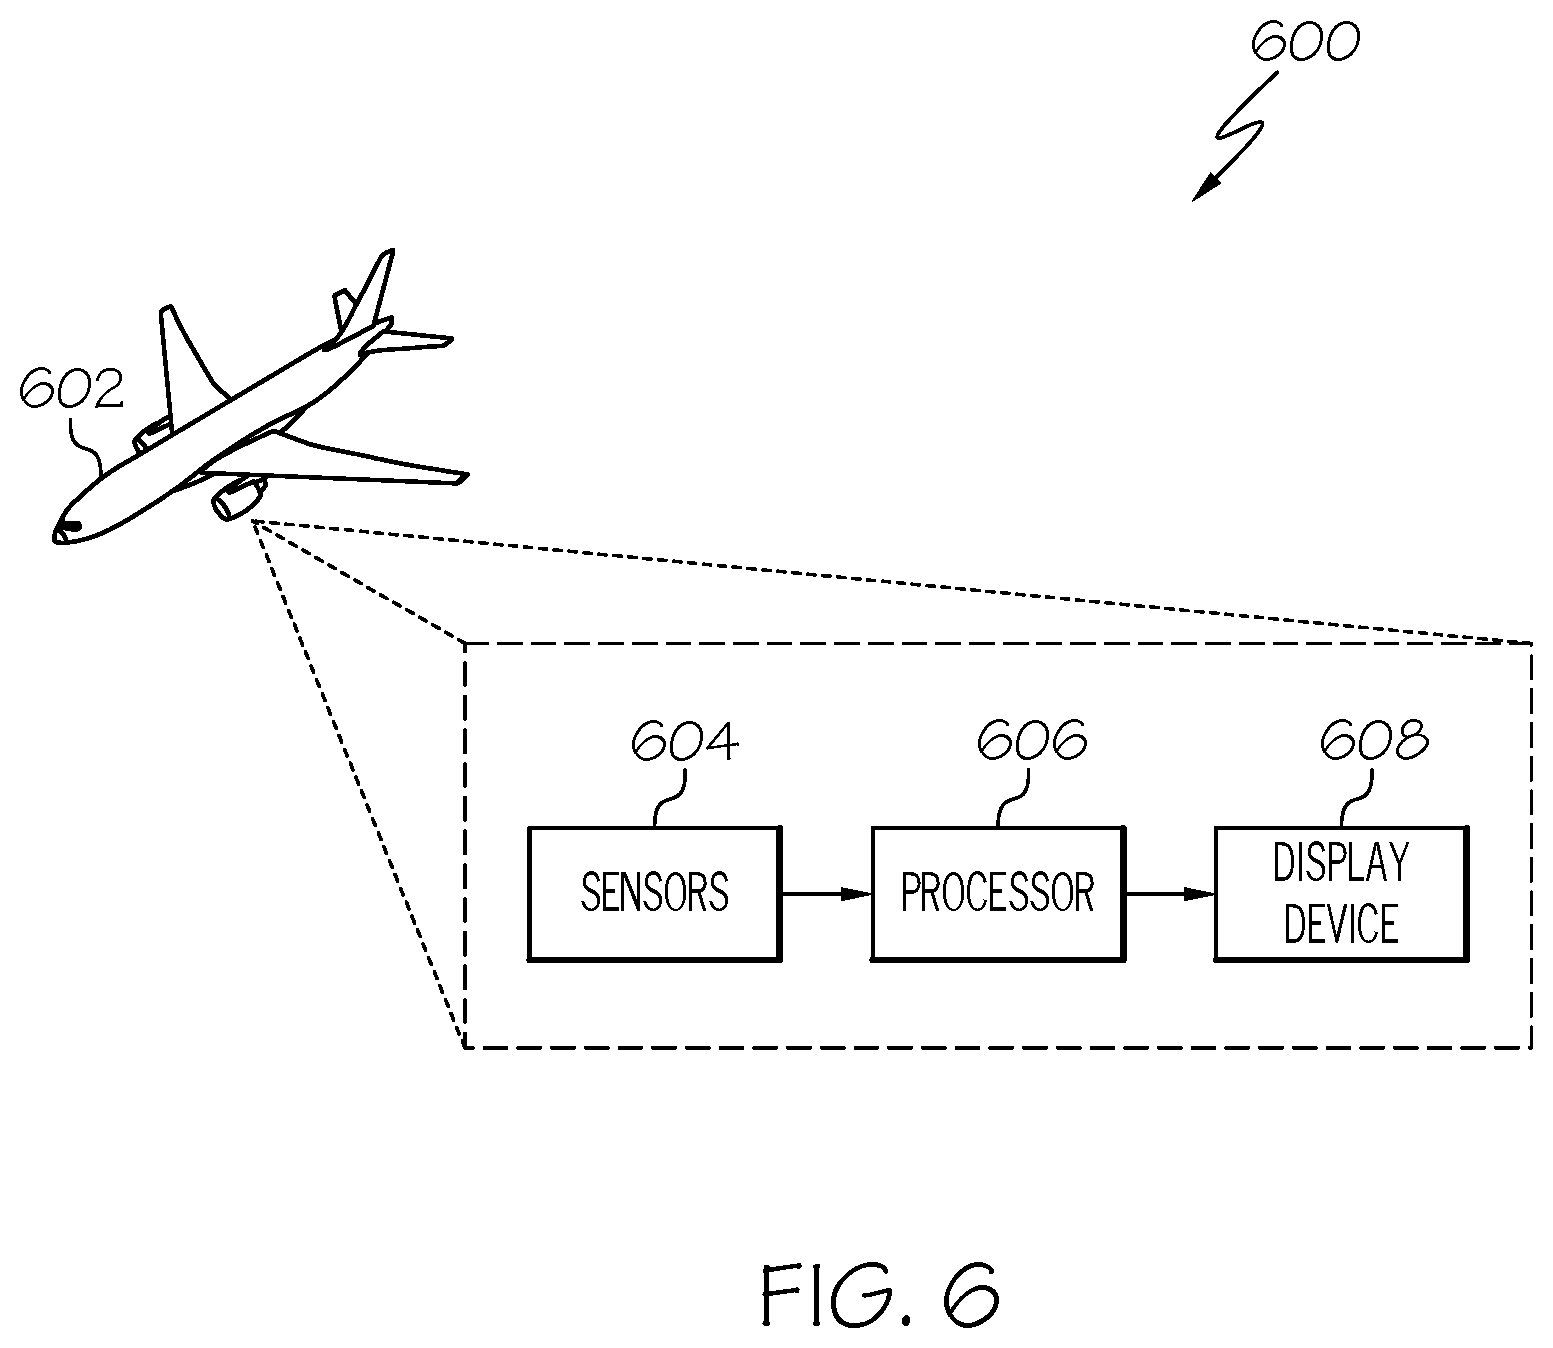
[0025] Turning now to FIG. 6, a diagram of a system 600 for displaying noncompliance with expected performance values for flight parameters of an aircraft 602 in accordance with one embodiment. The system includes a plurality of flight data sensors 604 aboard the aircraft 602 that collect flight data parameters during aircraft operations. The flight data parameters are provided to a computing device with a processor 606 that: generates a graphical display of a flight path of the aircraft 602 during aircraft operations; compares the flight parameter data with the expected performance values for the flight parameters of the aircraft 602 during aircraft operations; identifies points of noncompliance by the aircraft 602 with the expected performance values for flight parameters along the flight path of the aircraft; and superimposes a graphical display icon on each point of noncompliance by the aircraft on the graphical display of the flight path of the aircraft 602, where the graphical display icon comprises a unique iconographic representation of the flight parameter. The graphical display is provided to a graphical display device 608 that displays the flight path and the display icons for review after completion of aircraft operations.
[0026] In some embodiments, the display of the flight path and the display icons may be saved in used as part of a post-flight analysis of an individual aircraft. In other embodiments, multiple displays may be saved and analyzed as part of analysis of multiple aircraft operations for a fleet or an airport. In still other embodiments, the display and the icons may be shown in real time to aircrew members on board the aircraft. This display may serve as an alert to noncompliance with expected flight parameters for the aircrew.
[0027] Those of skill in the art will appreciate that the various illustrative logical blocks, modules, circuits, and algorithm steps described in connection with the embodiments disclosed herein may be implemented as electronic hardware, computer software, or combinations of both. Some of the embodiments and implementations are described above in terms of functional and/or logical block components (or modules) and various processing steps. However, it should be appreciated that such block components (or modules) may be realized by any number of hardware, software, and/or firmware components configured to perform the specified functions. To clearly illustrate this interchangeability of hardware and software, various illustrative components, blocks, modules, circuits, and steps have been described above generally in terms of their functionality. Whether such functionality is implemented as hardware or software depends upon the particular application and design constraints imposed on the overall system. Skilled artisans may implement the described functionality in varying ways for each particular application, but such implementation decisions should not be interpreted as causing a departure from the scope of the present invention. For example, an embodiment of a system or a component may employ various integrated circuit components, e.g., memory elements, digital signal processing elements, logic elements, look-up tables, or the like, which may carry out a variety of functions under the control of one or more microprocessors or other control devices. In addition, those skilled in the art will appreciate that embodiments described herein are merely exemplary implementations.
[0028] The various illustrative logical blocks, modules, and circuits described in connection with the embodiments disclosed herein may be implemented or performed with a general purpose processor, a digital signal processor (DSP), an application specific integrated circuit (ASIC), a field programmable gate array (FPGA) or other programmable logic device, discrete gate or transistor logic, discrete hardware components, or any combination thereof designed to perform the functions described herein. A general-purpose processor may be a microprocessor, but in the alternative, the processor may be any conventional processor, controller, microcontroller, or state machine. A processor may also be implemented as a combination of computing devices, e.g., a combination of a DSP and a microprocessor, a plurality of microprocessors, one or more microprocessors in conjunction with a DSP core, or any other such configuration.
[0029] The steps of a method or algorithm described in connection with the embodiments disclosed herein may be embodied directly in hardware, in a software module executed by a processor, or in a combination of the two. A software module may reside in RAM memory, flash memory, ROM memory, EPROM memory, EEPROM memory, registers, hard disk, a removable disk, a CD-ROM, or any other form of storage medium known in the art. An exemplary storage medium is coupled to the processor such that the processor can read information from, and write information to, the storage medium. In the alternative, the storage medium may be integral to the processor. The processor and the storage medium may reside in an ASIC. The ASIC may reside in a user terminal. In the alternative, the processor and the storage medium may reside as discrete components in a user terminal
[0030] In this document, relational terms such as first and second, and the like may be used solely to distinguish one entity or action from another entity or action without necessarily requiring or implying any actual such relationship or order between such entities or actions. Numerical ordinals such as "first," "second," "third," etc. simply denote different singles of a plurality and do not imply any order or sequence unless specifically defined by the claim language. The sequence of the text in any of the claims does not imply that process steps must be performed in a temporal or logical order according to such sequence unless it is specifically defined by the language of the claim. The process steps may be interchanged in any order without departing from the scope of the invention as long as such an interchange does not contradict the claim language and is not logically nonsensical.
[0031] Furthermore, depending on the context, words such as "connect" or "coupled to" used in describing a relationship between different elements do not imply that a direct physical connection must be made between these elements. For example, two elements may be connected to each other physically, electronically, logically, or in any other manner, through one or more additional elements.
[0032] While at least one exemplary embodiment has been presented in the foregoing detailed description of the invention, it should be appreciated that a vast number of variations exist. It should also be appreciated that the exemplary embodiment or exemplary embodiments are only examples, and are not intended to limit the scope, applicability, or configuration of the invention in any way. Rather, the foregoing detailed description will provide those skilled in the art with a convenient road map for implementing an exemplary embodiment of the invention. It being understood that various changes may be made in the function and arrangement of elements described in an exemplary embodiment without departing from the scope of the invention as set forth in the appended claims.
* * * * *
D00000
D00001
D00002
D00003
D00004
D00005
D00006
XML
uspto.report is an independent third-party trademark research tool that is not affiliated, endorsed, or sponsored by the United States Patent and Trademark Office (USPTO) or any other governmental organization. The information provided by uspto.report is based on publicly available data at the time of writing and is intended for informational purposes only.
While we strive to provide accurate and up-to-date information, we do not guarantee the accuracy, completeness, reliability, or suitability of the information displayed on this site. The use of this site is at your own risk. Any reliance you place on such information is therefore strictly at your own risk.
All official trademark data, including owner information, should be verified by visiting the official USPTO website at www.uspto.gov. This site is not intended to replace professional legal advice and should not be used as a substitute for consulting with a legal professional who is knowledgeable about trademark law.