Composition For Preventing Or Treating Cancer
KU; Sae Kwang ; et al.
U.S. patent application number 16/249501 was filed with the patent office on 2019-11-28 for composition for preventing or treating cancer. The applicant listed for this patent is OKCHUNDANG CO., LTD.. Invention is credited to Gyung Yun BEIK, Chul Jong JUNG, Sae Kwang KU, Seong Min KU, Tae Hun KU, Sang Soo LEE, Xian LI, Jeong Gyun SEO, Jin Gi SHIN, Chil Surk YOON.
| Application Number | 20190358283 16/249501 |
| Document ID | / |
| Family ID | 66656506 |
| Filed Date | 2019-11-28 |


View All Diagrams
| United States Patent Application | 20190358283 |
| Kind Code | A1 |
| KU; Sae Kwang ; et al. | November 28, 2019 |
COMPOSITION FOR PREVENTING OR TREATING CANCER
Abstract
The present invention provides a pharmaceutical composition for preventing or treating cancer, a food composition for enhancing immune functions, and a pharmaceutical composition for preventing or treating cachexia. The composition of the present invention provides effects of further inhibiting the growth of tumors, increasing immunological activity, and suppressing cachexia caused by tumors. In addition, the composition of the present invention can obtain a synergistic effect when co-administered with an existing anticancer drug.
| Inventors: | KU; Sae Kwang; (Daegu, KR) ; KU; Seong Min; (Busan, KR) ; KU; Tae Hun; (Busan, KR) ; JUNG; Chul Jong; (Ulsan, KR) ; BEIK; Gyung Yun; (Daegu, KR) ; SHIN; Jin Gi; (Gyeongsan-si, KR) ; LEE; Sang Soo; (Daegu, KR) ; SEO; Jeong Gyun; (Daegu, KR) ; YOON; Chil Surk; (Uiwang-si, KR) ; LI; Xian; (Daegu, KR) | ||||||||||
| Applicant: |
|
||||||||||
|---|---|---|---|---|---|---|---|---|---|---|---|
| Family ID: | 66656506 | ||||||||||
| Appl. No.: | 16/249501 | ||||||||||
| Filed: | January 16, 2019 |
| Current U.S. Class: | 1/1 |
| Current CPC Class: | A61K 36/342 20130101; A61K 36/64 20130101; A61K 36/64 20130101; A61K 36/076 20130101; A61K 2300/00 20130101; A23L 33/105 20160801; A61K 36/258 20130101; A61K 35/644 20130101; A23V 2002/00 20130101; A61K 36/342 20130101; A61K 36/076 20130101; A61P 35/00 20180101; A61K 36/258 20130101; A61K 2300/00 20130101; A61K 2300/00 20130101; A61K 31/5377 20130101; A61K 2300/00 20130101 |
| International Class: | A61K 36/64 20060101 A61K036/64; A61K 36/258 20060101 A61K036/258; A61K 36/342 20060101 A61K036/342; A61K 36/076 20060101 A61K036/076; A61K 35/644 20060101 A61K035/644; A61K 31/5377 20060101 A61K031/5377; A61P 35/00 20060101 A61P035/00; A23L 33/105 20060101 A23L033/105 |
Foreign Application Data
| Date | Code | Application Number |
|---|---|---|
| May 25, 2018 | KR | 10-2018-0059573 |
Claims
1. A method for treatment of cancer comprising a step: administering, to a subject, a composition comprising Panax ginseng, Adenophorae triphylla, Wolfiporia extensa, Rehmannia glutinosa, and mel.
2. The method of claim 1, wherein the composition comprises 4-5 wt % of Panax ginseng, 4-5 wt % of Adenophorae triphylla, 8-10 wt % of Wolfiporia extensa, 43-48 wt % of Rehmannia glutinosa, and 35-40 wt % of mel.
3. The method of claim 1, wherein the composition comprises 4-5 wt % of Panax ginseng dried powder, 4-5 wt % of Adenophorae triphylla dried powder, 8-10 wt % of Wolfiporia extensa dried powder, 43-48 wt % of Rehmannia glutinosa juice extract, and 35-40 wt % of mel.
4. The method of claim 1, wherein the composition further comprises gefitinib.
5. The method of claim 1, wherein the method further comprises a step administering gefitinib to the subject.
6. The method of claim 5, wherein gefitinib is administered within 5 minutes before or after administering the composition.
7. A method for enhancement of immune functions comprising a step: administering, to a subject, a composition comprising Panax ginseng, Adenophorae triphylla, Wolfiporia extensa, Rehmannia glutinosa, and mel.
8. The method of claim 7, wherein the composition further comprises gefitinib.
9. The method of claim 7, wherein the subject is a cancer patient.
10. The method of claim 7, wherein the method is for enhancement of immune response in the subject, wherein the immune response is indicated by activation of antigen presenting cells or increased production of immune cytokines.
11. The method of claim 7, wherein the method further comprises a step administering gefitinib to the subject.
12. The method of claim 11, wherein gefitinib is administered within 5 minutes before or after administering the composition.
13. A method for treatment of cachexia comprising a step: administering, to a subject, a composition comprising Panax ginseng, Adenophorae triphylla, Wolfiporia extensa, Rehmannia glutinosa, and mel.
14. The method of claim 13, wherein the composition further comprises gefitinib.
15. The method of claim 13, wherein the method further comprises a step administering gefitinib to the subject.
16. The method of claim 15, wherein gefitinib is administered within 5 minutes before or after administering the composition.
Description
TECHNICAL FIELD
[0001] The present invention relates to a composition for preventing or treating cancer.
BACKGROUND ART
[0002] Gefitinib is a typical epidermal growth factor receptor (EGFR) inhibitor anti-cancer drug, which is frequently used as a medicine for various malignant tumors including breast cancer and lung cancer. It is known that gefitinib inhibits EGFR tyrosine kinase domains, and has very low toxicity, as a target-directed anticancer drug, compared with an existing cytotoxic anticancer drug. However, gefitinib causes a variety of undesired side effects, such as skin rash, diarrhea, nausea, vomiting, lack of appetite, gastritis, dehydration, nail pericarditis, hepatotoxicity, helplessness, conjunctivitis, blepharitis, interstitial lung disease, corneal erosion, and eyelash dropouts, and hypersensitivity responses of gefitinib per se or compositional components thereof, resulting in liver toxicity due to an increase in lipid peroxidation by the metabolome formed in the liver and the resultant damage to the antioxidative defense system. Recently, the emergency of resistant malignant tumor cells by EGFR mutation or the like has been a problem.
[0003] Therefore, there is a need for a new combination of co-administration that has the synergistic effect of chemotherapy while solving the toxicity and tolerance problems of gefitinib caused by co-administration of a natural material and a drug including various antioxidants.
PRIOR ART DOCUMENTS
Patent Documents
[0004] (Patent Document 1) Korean Patent No. 10-1719790 [0005] (Patent Document 2) Korean Patent Publication No. 2017-0113246
Non-Patent Documents
[0005] [0006] (Non-Patent Document 1) Hyun D S et al., Effects of Bojungikkitang (a Polyherbal Formula), on Gefitinib Pharmacokinetics in Rats. International Journal of Pharmacology 2015; 11(6):604-10 [0007] (Non-Patent Document 2) Song J et al., Combined treatment with Epimedium koreanum Nakai extract and gefitinib overcomes drug resistance caused by T790M mutation in non-small cell lung cancer cells. Nutrition and Cancer 2014; 66(4):682-9
DETAILED DESCRIPTION OF THE INVENTION
Technical Problem
[0008] The present inventors endeavored to develop a natural material showing a synergistic effect when co-administered with an existing anticancer drug. As a result, the present inventors established that the co-administration of a complex natural material comprising Panax ginseng, Adenophorae triphylla, Wolfiporia extensa, Rehmannia glutinosa, and mel as active ingredients with gefitinib as a medicine for various malignant tumors showed effects of further inhibiting the growth of tumors, increasing immunoreactivity, and suppressing cachexia caused by tumors, and therefore, completed the present invention.
[0009] Therefore, an aspect of the present invention is to provide a pharmaceutical composition for preventing or treating cancer.
[0010] Another aspect of the present invention is to provide a food composition for enhancing immune functions.
[0011] Still another aspect of the present invention is to provide a pharmaceutical composition for preventing or treating cachexia.
[0012] Still another aspect of the present invention is to provide a method for treatment of cancer.
[0013] Still another aspect of the present invention is to provide a method for enhancement of immune functions.
[0014] Still another aspect of the present invention is to provide a method for treatment of cachexia.
Technical Solution
[0015] In accordance with an aspect of the present invention, there is provided a pharmaceutical composition for preventing or treating cancer, the pharmaceutical composition comprising, as active ingredients, Panax ginseng, Adenophorae triphylla, Wolfiporia extensa, Rehmannia glutinosa, and mel.
[0016] The present inventors endeavored to develop a natural material showing a synergistic effect when co-administered with an existing anticancer drug. As a result, the present inventors established that the co-administration of a complex natural material comprising Panax ginseng, Adenophorae triphylla, Wolfiporia extensa, Rehmannia glutinosa, and mel as active ingredients with gefitinib as a medicine for various malignant tumors showed effects of further inhibiting the growth of tumors, increasing immunoreactivity, and suppressing cachexia caused by tumors.
[0017] Panax ginseng is a perennial herbaceous species, belonging to the family Araliaceae, about 60 cm in height, one new stem growing straightly each year, one flower stalk connecting from one end of the stem, and 3 to 6 verticillate petioles. Leaves have long petioles, and a leaf blade being divided into 3-5, forming palmately compound leaves. Hairs are on leaf veins on a front surface of the leaf. In summer, a thin flower stalk comes out, and 4-40 small flowers having a light yellowish color come out from the tip of the flower stalk, hung in the umbel inflorescence. The flowers have five leaves and stamens and one pistil, with an inferior ovary. The fruit thereof is drupe, has an elliptic shape, and turns into bright red when being ripe. Herein, Panax ginseng refers to roots thereof.
[0018] Adenophorae triphylla is a perennial herbaceous species, belonging to the family Campanulaceae. The stems are 50-100 cm in height straightly, and produce a white liquid when broken. Leaves have a long ellipse, 4-5 leaves are verticillate, with hairs on the stems and leaves. Several purplish flowers are versatile at the tip of the stem in July to October. The corolla has a bell shape and is 12-22 mm long. A style is divided into three, and is slightly longer than the corolla, and five stamens are dropped from the flower body. The stamen pole has a wide bottom and many hairs.
[0019] Wolfiporia extensa is a fungus in the family Polyporaceae, and includes Basidiomycota. The sclerotia are formed in pine roots in 10-30 cm underground, and are difformis. The surface is blackish reddish brown with creases, and the inside is white or red.
[0020] Rehmannia glutinosa is a perennial herbaceous species, belonging to the family Orobanchaceae, about 30 cm in height. Leaves with an ellipse shape come out from roots, and purple-red flowers come out in June and July. Herein, Rehmannia glutinosa refers to roots thereof.
[0021] Mel refers to sugar (honey) that is sucked and collected from flower nectarines by honey bees, e.g., Apis cerana or Apis mellifera.
[0022] The composition comprising, as active ingredients, Panax ginseng, Adenophorae triphylla, Wolfiporia extensa, Rehmannia glutinosa, and mel of the present invention is a composition for preventing or treating cancer.
[0023] As used herein, the term "cancer" refers to a disease in which the cell cycle is not normally regulated, resulting in continuous cell division. The cancer is synonymous with "malignant tumor" or "malignant neoplasm".
[0024] In an embodiment of the present invention, the cancer is selected from the group consisting of lung cancer, breast cancer, cervical cancer, pancreatic cancer, non-small cell lung cancer, liver cancer, colon cancer, bone cancer, skin cancer, head cancer, neck cancer, skin melanoma, intraocular melanoma, uterine cancer, ovarian cancer, rectal cancer, brain tumor, bladder cancer, blood cancer, gastric cancer, perianal cancer, fallopian tube carcinoma, endometrial carcinoma, vaginal cancer, vulvar carcinoma, Hodgkin's disease, esophageal cancer, small intestine cancer, endocrine gland cancer, thyroid cancer, parathyroid cancer, adrenal gland cancer, soft tissue sarcoma, urethral cancer, penis cancer, prostate cancer, bladder cancer, renal cancer, ureteral cancer, renal cell carcinoma, renal pelvis carcinoma, central nervous system (CNS) tumor, primary CNS lymphoma, spinal cord tumor, brainstem glioma, or pituitary adenoma, but is not limited thereto.
[0025] According to another embodiment of the present invention, the cancer is lung cancer or breast cancer.
[0026] As used herein, the term "prevention" refers to all actions that can inhibit cancer or delay the development of cancer through administration of the composition of the present invention.
[0027] As used herein, the term "treatment" refers to the inhibition of cancer development, amelioration of cancer, and removal of cancer.
[0028] The pharmaceutical composition for preventing or treating cancer of the present invention comprises, as active ingredients, Panax ginseng, Adenophorae triphylla, Wolfiporia extensa, Rehmannia glutinosa, and mel.
[0029] According to an embodiment of the present invention, the composition is prepared by mixing 4-5 wt % of Panax ginseng, 4-5 wt % of Adenophorae triphylla, 8-10 wt % of Wolfiporia extensa, 43-48 wt % of Rehmannia glutinosa, and 35-40 wt % of mel.
[0030] The Panax ginseng, Adenophorae triphylla, Wolfiporia extensa, Rehmannia glutinosa, and mel included in the composition of the present invention may be pulverized bodies, a suspension of pulverized bodies, a juice, or an extract.
[0031] The pulverized bodies may be prepared by various procedures. For example, the Panax ginseng, Adenophorae triphylla, Wolfiporia extensa, or Rehmannia glutinosa is subjected to a processing procedure, such as vacuum distillation, freeze-drying, or spray drying, and then may be used as pulverized bodies in various states, such as a powdered state, a homogenized state, a sliced state, and a mashed state.
[0032] According to an embodiment of the present invention, the Panax ginseng, Adenophorae triphylla, and Wolfiporia extensa are in a powdered state or a homogenized state, after freeze-drying.
[0033] The suspension of pulverized bodies may be prepared by various solutions. For example, distilled water or buffer (e.g., Tris buffer or HEPES buffer) may be used.
[0034] The juice may be prepared by various procedures. For example, the juice may be prepared by using gear type juicing using a compression effect, press type juicing, crush type juicing, or enzymatic degradation type juicing.
[0035] According to an embodiment of the present invention, the Rehmannia glutinosa is in a juice state.
[0036] According to another embodiment of the present invention, the Rehmannia glutinosa is a juice having a sugar content of 10-20 brix and a solid content of 10-20%.
[0037] According to other embodiment of the present invention, the composition comprises 4-5 wt % of Panax ginseng dried powder, 4-5 wt % of Adenophorae triphylla dried powder, 8-10 wt % of Wolfiporia extensa dried powder, 43-48 wt % of Rehmannia glutinosa juice extract, and 35-40 wt % of mel.
[0038] The extract may be prepared by various procedures. For example, the extract may be prepared by performing cold extraction, hot-water extraction, ultrasonic extraction, or reflux cooling extraction on a solvent crude extract obtained from the extraction with at least one solvent selected from the group consisting of water and C.sub.1-4 alcohols.
[0039] The composition of the present invention may be prepared by aging a mixture of Panax ginseng, Adenophorae triphylla, Wolfiporia extensa, Rehmannia glutinosa, and mel.
[0040] According to an embodiment of the present invention, the aging may be carried out at a temperature of 80-100.degree. C. for 10-100 hours.
[0041] The temperature may be 84-100.degree. C., 88-100.degree. C., 92-100.degree. C., 94-100.degree. C., 80-99.degree. C., 80-98.degree. C., 80-97.degree. C., 84-99.degree. C., 88-98.degree. C., 92-97.degree. C., or 94-97.degree. C. The time may be 10-90 hours, 20-90 hours, 30-90 hours, 40-90 hours, 50-90 hours, 60-90 hours, 10-80 hours, 20-80 hours, 30-80 hours, 40-80 hours, 50-80 hours, 60-80 hours or 65-75 hours.
[0042] According to another embodiment of the present invention, the aging may be carried out once or more. The aging may be carried out twice or more by further including a step of performing cooling before secondary aging.
[0043] The cooling may be carried out at a temperature of 0-30.degree. C. for 10-100 hours.
[0044] The present invention may further comprise an existing anticancer drug showing a synergistic effect in cancer therapy.
[0045] According to an embodiment of the present invention, the pharmaceutical composition for preventing or treating cancer of the present invention further comprises gefitinib.
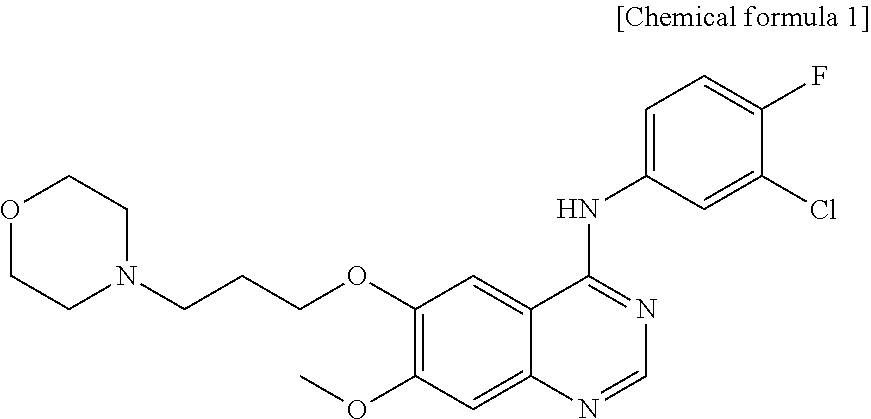
[0046] As used herein, the term "gefitinib" refers to N-(3-chloro-4-fluorophenyl)-7-methoxy-6-(3-morpholinopropoxy)quinazolin-4- -amine of chemical formula 1 below, which selectively inhibits epidermal growth factor receptor (EGFR) tyrosine kinase activity to inhibit the phosphorylation of EGFR, thereby blocking signaling from EFGR to inhibit the proliferation of cancer cells.
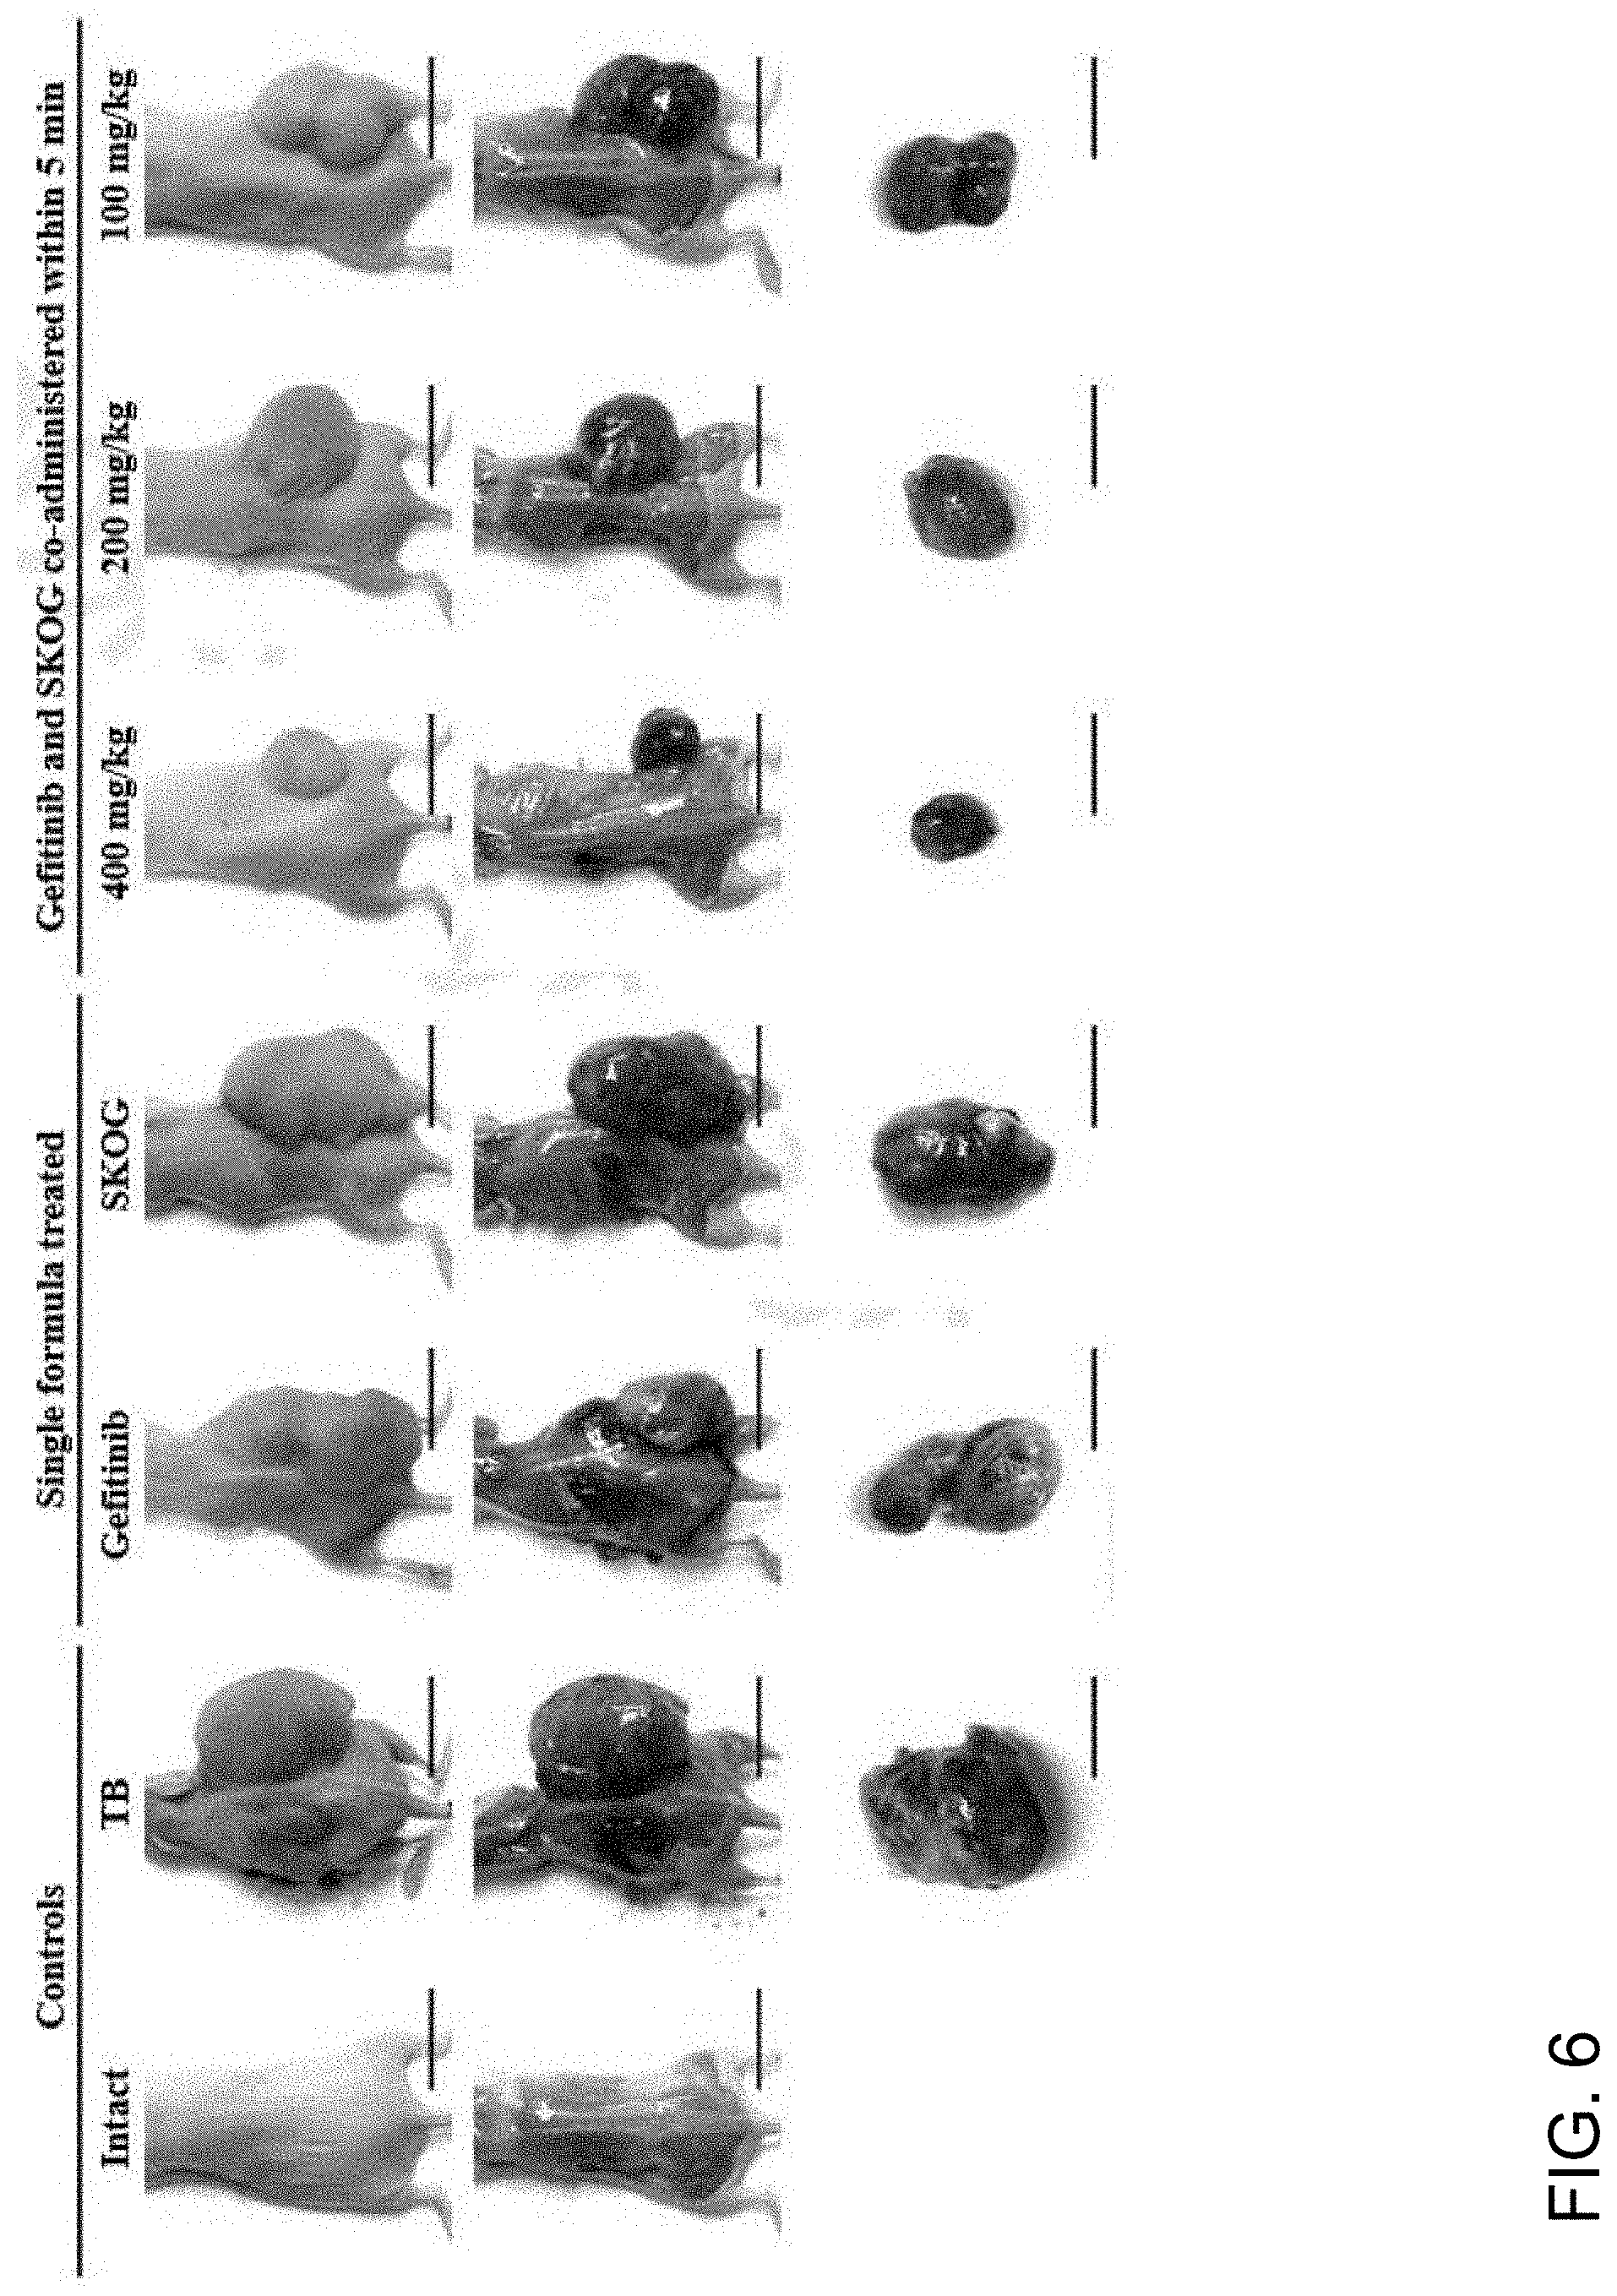
##STR00001##
[0047] The co-administration of the composition of the present invention and gefitinib can show a synergistic effect compared with the administration of composition and gefitinib alone.
[0048] The pharmaceutical composition of the present invention may be used as a pharmaceutical composition comprising a pharmaceutically effective amount of a complex of Panax ginseng, Adenophorae triphylla, Wolfiporia extensa, Rehmannia glutinosa, and mel and/or a pharmaceutically acceptable carrier.
[0049] As used herein, the term "pharmaceutically effective amount" refers to the amount sufficient to attain the efficacy or activity of the complex.
[0050] The pharmaceutically acceptable carrier contained in the pharmaceutical composition of the present invention is usually used at the time of formulating, and examples thereof may include, but are not limited to, lactose, dextrose, sucrose, sorbitol, mannitol, starch, acacia gum, calcium phosphate, alginate, gelatin, calcium silicate, microcrystalline cellulose, polyvinylpyrrolidone, cellulose, water, syrup, methylcellulose, methyl hydroxybenzoate, propyl hydroxybenzoate, talc, magnesium stearate, and mineral oil. The pharmaceutical composition of the present invention may further contain a lubricant, a humectant, a sweetener, a flavoring agent, an emulsifier, a suspending agent, and a preservative.
[0051] The pharmaceutical composition of the present invention may be administered orally or parenterally, and for example, intravenous administration, subcutaneous administration, intramuscular administration, intraperitoneal administration, topical administration, intranasal administration, intrapulmonary administration, rectal administration, intrathecal administration, ocular administration, skin administration, and transdermal administration may be employed.
[0052] An adequate dose of the pharmaceutical composition of the present invention varies depending on factors, such as the formulating method, manner of administration, patient's age, body weight, or gender, severity of disease, food, time of administration, route of administration, excretion rate, and response sensitivity, and an ordinarily skilled practitioner can easily judge and prescribe the dose effective for the desired treatment or prevention. According to a preferable embodiment of the present invention, the daily dose of the pharmaceutical composition of the present invention may be 0.0001-1000 mg/kg.
[0053] The pharmaceutical composition of the present invention may be formulated using a pharmaceutically acceptable carrier and/or excipient according to the method that is easily conducted by a person having ordinary skills in the art to which the present invention pertains, and the composition of the present invention may be prepared into a unit dosage form or may be inserted into a multi-dose container. Here, the dosage form may be a solution in a form of an oily or aqueous medium, a suspension, an emulsion, an extract, a powder, granules, a tablet, a capsule, or a gel (e.g., a hydrogel), and may further include a dispersing agent or a stabilizer.
[0054] According to another aspect of the present invention, the present invention provides a food composition comprising Panax ginseng, Adenophorae triphylla, Wolfiporia extensa, Rehmannia glutinosa, and mel as active ingredients for enhancing immune functions.
[0055] As used herein, the term "immune function" refers to a mechanism in which exogenous and endogenous antigens are physiologically recognized and excluded and homeostasis is maintained in human and animal bodies. The initial recognition of the antigens is mainly carried out by macrophages, and in this procedure, cytokines mediating immune responses are produced.
[0056] According to an embodiment of the present invention, the food composition for enhancing immune functions of the present invention increases the production of serum IFN-.gamma. and splenic TNF-.alpha..
[0057] Interleukin (IL) is a substance that plays an important role in the defense of the human body by acting on several stages for immune responses to regulate the immune responses.
[0058] According to an embodiment, the food composition for enhancing immune functions of the present invention increases the production of splenic IL-1.beta. and IL-10.
[0059] The food composition for enhancing immune functions of the present invention can increase immune functions of a cancer patient.
[0060] According to an embodiment of the present invention, the composition of the present invention further comprises gefitinib.
[0061] The co-administration of the composition of the present invention and gefitinib can show a synergistic effect compared with the administration of the composition and gefitinib alone.
[0062] The composition of the present invention, when prepared as a food composition, comprises, in addition to Panax ginseng, Adenophorae triphylla, Wolfiporia extensa, Rehmannia glutinosa, and mel as active ingredients, the ingredients that are normally added at the time of food manufacturing, for example, proteins, carbohydrates, fats, nutrients, seasonings, and flavoring agents. Examples of the foregoing carbohydrate may include ordinary sugars (monosaccharides, such as glucose and fructose; disaccharides, such as maltose, sucrose and oligosaccharides; and polysaccharides, such as dextrin and cyclodextrin) and sugar alcohols, such as xylitol, sorbitol, and erythritol. Examples of the flavoring agent may include natural flavoring agents (thaumatin, and stevia extract (e.g., rebaudioside A, glycyrrhizin, etc.)) and synthetic flavoring agents (saccharin, aspartame, etc.). For example, the food composition of the present invention, when is prepared as a drink, may further contain, in addition to Panax ginseng, Adenophorae triphylla, Wolfiporia extensa, Rehmannia glutinosa, and mel, citric acid, liquefied fructose, sugar, glucose, acetic acid, malic acid, fruit juice, an Eucommia ulmoides extract, a jujube extract, and a licorice extract.
[0063] The food composition for enhancing immune functions of the present invention can be prepared into a health functional food composition.
[0064] The health functional food for enhancing immune functions comprises the ingredients that are ordinarily added at the time of food manufacturing, for example, proteins, carbohydrates, fats, nutrients, and seasonings. For example, the composition, which prepared as a drink, may contain, as an active ingredient, a hydrangea tea extract and, as an additional ingredient, a flavoring agent or natural carbohydrate. Examples of the natural carbohydrate include monosaccharides (e.g., glucose, fructose, etc.); disaccharides (e.g., maltose, sucrose, etc.); oligosaccharides; polysaccharides (e.g., dextrin, cyclodextrin, etc.); and sugar alcohols (e.g., xylitol, sorbitol, erythritol, etc.). Natural flavoring agents (e.g., thaumatin, stevia extract, etc.) and synthetic flavoring agents (e.g., saccharin, aspartame, etc.) may be used as flavoring agents.
[0065] According to still another aspect of the present invention, the present invention provides a pharmaceutical composition for preventing or treating cachexia, the pharmaceutical composition comprising, as active ingredients, Panax ginseng, Adenophorae triphylla, Wolfiporia extensa, Rehmannia glutinosa, and mel.
[0066] As used herein, the term "cachexia" refers to a systematic malnutrition condition in which, regardless of the supplement of carries, nutritionally irreversible loss of body mass occurs due to a chronic disease, such as tuberculosis, cancer, or diabetes.
[0067] According to an embodiment of the present invention, the cachexia is caused by cancer.
[0068] Since the pharmaceutical composition for preventing or treating cachexia of the present invention is the same as the pharmaceutical composition for preventing or treating cancer with respect to active ingredients, the overlapping descriptions therebetween are omitted to avoid excessive complication of the specification.
[0069] Still another aspect of the present invention provides a method for treatment of cancer comprising a step:
[0070] administering, to a subject, a composition comprising Panax ginseng, Adenophorae triphylla, Wolfiporia extensa, Rehmannia glutinosa, and mel.
[0071] According to an embodiment of the present invention, wherein the composition comprises 4-5 wt % of Panax ginseng, 4-5 wt % of Adenophorae triphylla, 8-10 wt % of Wolfiporia extensa, 43-48 wt % of Rehmannia glutinosa, and 35-40 wt % of mel.
[0072] According to another embodiment of the present invention, wherein the composition comprises 4-5 wt % of Panax ginseng dried powder, 4-5 wt % of Adenophorae triphylla dried powder, 8-10 wt % of Wolfiporia extensa dried powder, 43-48 wt % of Rehmannia glutinosa juice extract, and 35-40 wt % of mel.
[0073] According to an embodiment of the present invention, wherein the composition further comprises gefitinib.
[0074] According to another embodiment of the present invention, the method further comprises a step administering gefitinib to the subject. Gefitinib can be administered within 5 min after administering the composition comprising Panax ginseng, Adenophorae triphylla, Wolfiporia extensa, Rehmannia glutinosa, and mel.
[0075] Still another aspect of the present invention provides a method for enhancement of immune functions comprising a step:
[0076] administering, to a subject, a composition comprising Panax ginseng, Adenophorae triphylla, Wolfiporia extensa, Rehmannia glutinosa, and mel.
[0077] According to an embodiment of the present invention, wherein the composition further comprises gefitinib.
[0078] According to another embodiment of the present invention, the method further comprises a step administering gefitinib to the subject. Gefitinib can be administered within 5 min after administering the composition comprising Panax ginseng, Adenophorae triphylla, Wolfiporia extensa, Rehmannia glutinosa, and mel.
[0079] According to an embodiment of the present invention, wherein the method is for enhancement of immune functions in a cancer patient.
[0080] According to another embodiment of the present invention, wherein the method is for enhancement of immune response in the subject,
[0081] wherein the immune response is indicated by activation of antigen presenting cells (macrophages, B cells and dendritic cells) or increase/production of immune cytokines.
[0082] The initial recognition of the antigens is mainly carried out by macrophages, and in this procedure, cytokines mediating immune responses are produced.
[0083] According to an embodiment of the present invention, the composition for enhancing immune functions of the present invention increases the production of serum IFN-.gamma. and splenic TNF-.alpha..
[0084] Interleukin (IL) is a substance that plays an important role in the defense of the human body by acting on several stages for immune responses to regulate the immune responses.
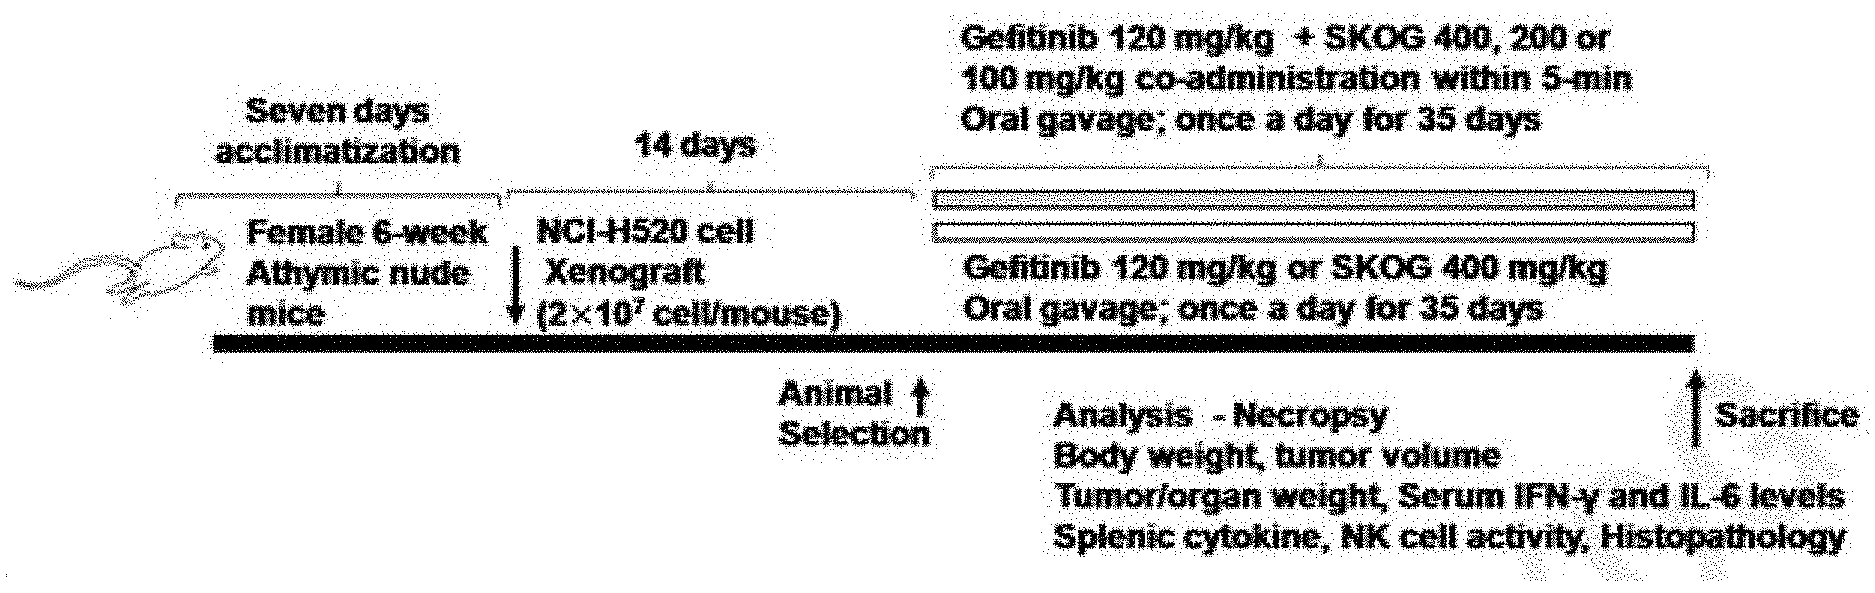
[0085] According to an embodiment, the composition for enhancing immune functions of the present invention increases the production of splenic IL-1.beta. and IL-10.
[0086] Still another aspect of the present invention provides a method for treatment of cachexia comprising a step:
[0087] administering, to a subject, a composition comprising Panax ginseng, Adenophorae triphylla, Wolfiporia extensa, Rehmannia glutinosa, and mel.
[0088] According to an embodiment of the present invention, wherein the composition further comprises gefitinib.
[0089] According to another embodiment of the present invention, the method further comprises a step administering gefitinib to the subject. Gefitinib can be administered within 5 min after administering the composition comprising Panax ginseng, Adenophorae triphylla, Wolfiporia extensa, Rehmannia glutinosa, and mel.
Advantageous Effects
[0090] Features and advantages of the present invention are summarized as follows.
[0091] (a) The present invention provides a pharmaceutical composition for preventing or treating cancer, a food composition for enhancing immune functions, and a pharmaceutical composition for preventing or treating cachexia.
[0092] (b) The composition of the present invention provides effects of further inhibiting the growth of tumors, increasing immunological activity, and suppressing cachexia caused by tumors.
[0093] (c) The composition of the present invention can obtain a synergistic effect when co-administered with an existing anticancer drug.
BRIEF DESCRIPTION OF THE DRAWINGS
[0094] FIGS. 1a and 1b show ultra performance liquid chromatography (UPLC) analysis results of a standard solution and SKOG, respectively.
[0095] FIG. 2 shows cell viability results of NCI-H20 against SKOG 0.01 to 40 mg/ml treatment.
[0096] FIG. 3 shows cell viability results of NCI-H20 against gefitinib 0.001 to 50 mg/ml treatment.
[0097] FIG. 4 shows a tumor cell subcutaneous transplantation and immunization schedule of experimental animals.
[0098] FIG. 5 shows changes in body weight of tumor cell xenograft mice according to SKOG or gefitinib single administration and SKOG and gefitinib co-administration.
[0099] FIG. 6 shows images of the tumor size in tumor cell xenograft mice according to SKOG or gefitinib single administration and SKOG and gefitinib co-administration.
[0100] FIG. 7 shows tumor volumes of tumor cell xenograft mice according to SKOG or gefitinib single administration and SKOG and gefitinib co-administration.
[0101] FIG. 8 shows serum IL-6 and IFN-.gamma. levels in tumor cell xenograft mice according to SKOG or gefitinib single administration and SKOG and gefitinib co-administration.
[0102] FIG. 9 shows splenic and peritoneal NK cell activity in tumor cell xenograft mice according to SKOG or gefitinib single administration and SKOG and gefitinib co-administration.
[0103] FIG. 10 shows cross-sectional images of the tumor mass in tumor cell xenograft mice according to SKOG or gefitinib single administration and SKOG and gefitinib co-administration. In FIGS. 10 to 15, A represents a NCI-H520 tumor cell xenografted and then sterile distilled water administered group, B represents a tumor cell xenografted and then gefitinib 120 mg/kg single composition administered group, C represents SKOG400: a tumor cell xenografted and then SKOG 400 mg/kg single administered group, D represents a tumor cell xenografted and then gefitinib 120 mg/kg and SKOG 400 mg/kg co-administered group, E represents a tumor cell xenografted and then gefitinib 120 mg/kg and SKOG 200 mg/kg co-administered group, F represents a tumor cell xenografted and then gefitinib 120 mg/kg and SKOG 100 mg/kg co-administered group.
[0104] FIG. 11 shows analysis images of intratumoral caspase immune response cells in tumor cell xenograft mice according to SKOG or gefitinib single administration and SKOG and gefitinib co-administration.
[0105] FIG. 12 shows analysis images of intratumoral PARP immune response cells in tumor cell xenograft mice according to SKOG or gefitinib single administration and SKOG and gefitinib co-administration.
[0106] FIG. 13 shows analysis images of intratumoral COX-2 immune response cells in tumor cell xenograft mice according to SKOG or gefitinib single administration and SKOG and gefitinib co-administration.
[0107] FIG. 14 shows analysis images of intratumoral iNOS immune response cells in tumor cell xenograft mice according to SKOG or gefitinib single administration and SKOG and gefitinib co-administration.
[0108] FIG. 15 shows analysis images of intratumoral TNF-.alpha. immune response cells in tumor cell xenograft mice according to SKOG or gefitinib single administration and SKOG and gefitinib co-administration.
[0109] FIG. 16 shows changes of splenic red pulp (RP), white pulp (WP), and secondary follicles (G) in tumor cell xenograft mice according to SKOG or gefitinib single administration and SKOG and gefitinib co-administration. In FIGS. 16 to 18, A represents a normal medium control group, B represents a NCI-H520 tumor cell xenografted and then sterile distilled water administered group, C represents a tumor cell xenografted and then gefitinib 120 mg/kg single composition administered group, D represents SKOG400: a tumor cell xenografted and then SKOG 400 mg/kg single administered group, E represents a tumor cell xenografted and then gefitinib 120 mg/kg and SKOG 400 mg/kg co-administered group, F represents a tumor cell xenografted and then gefitinib 120 mg/kg and SKOG 200 mg/kg co-administered group, G represents a tumor cell xenografted and then gefitinib 120 mg/kg and SKOG 100 mg/kg co-administered group.
[0110] FIG. 17 shows changes of cortex (CO), medullar (ME), and follicles (FO) in submandibular lymph nodes in tumor cell xenograft mice according to SKOG or gefitinib single administration and SKOG and gefitinib co-administration.
[0111] FIG. 18 shows images of periovarian fat in tumor cell xenograft mice according to SKOG or gefitinib single administration and SKOG and gefitinib co-administration.
MODE FOR CARRYING OUT THE INVENTION
[0112] Hereinafter, the present invention will be described in detail with reference to examples. These examples are only for illustrating the present invention more specifically, and it would be obvious to those skilled in the art that the scope of the present invention is not limited by these examples.
[0113] Throughout the present specification, the term "%" used to express the concentration of a specific material, unless otherwise particularly stated, refers to (wt/wt) % for solid/solid, (wt/vol) % for solid/liquid, and (vol/vol) % for liquid/liquid.
Example 1: Preparation of Complex Natural Material
[0114] (1) Materials
[0115] Adenophor triphylla Radix (AR, Andong, Gyeongsangbukdo, Korea), Panax ginseng (Geumsan, Chungcheongnamdo, Korea), Poria cocos Wolf/Wolfiporia extensa (Anhui, Chinese), Rehmannia glutinosa (Andong and Gunwi, Gyeongsangbukdo, Korea), and mel (Okcheon, Chungcheongbukdo, Korea) were used from Okcheon Dang Pharmaceutical Co., Ltd. (Yeongcheon, Korea). Some test materials were kept in Medical Research center for Globalization of Herbal Formulation, Daegu Haany University, Gyeongsan, Korea) (Code No. Adenophora triphylla--AR2016Ku01, KOG--KOG2016Ku01, SKOG--SKOG2016Ku01). AR were stored at 4.degree. C. in a refrigerator until use.
[0116] (2) Preparation Method for SKOG
[0117] Adenophor triphylla Radix was washed to remove impurities, such as soil, followed by removal of moisture, and then dried at 90-120.degree. C. for 5-8 hours by hot-air drying or other drying methods, to a final moisture content of 5% or less. The dried product was prepared into a powder having a particle size of 80 mesh or more by using a pulverizer, such as a pin mill, a ball mill, a rod mill, an air mill, or a jet mill. Poria cocos Wolf was washed to remove impurities, such as soil, followed by removal of moisture, and then the surface thereof was completely dried. Panax ginseng was washed against impurities, such as soil, to remove moisture, and then dried at 90-120.degree. C. for 5-8 hours by hot-air drying or other drying methods, to a final moisture content of 5% or less. The dried Poria cocos Wolf and Panax ginseng were prepared into a powder having a particle size of 80 mesh or more by using a pulverizer, such as a pin mill, a ball mill, a rod mill, an air mill, or a jet mill. Rehmannia glutinosa was washed to remove impurities, such as soil, followed by removal of moisture, pulverized through a mechanical pulverizer, such as a blender, and then passed through a net or a filter with 70-mesh through a mechanical juicing device, such as a hydraulic presser to obtain a juice thereof. The juice needs to have a sugar content of 15-18 brix and a solid content of 13-16%, and needs to have a yield of 70% or more in the process of obtaining the juice through pulverization. Mel was processed to have a moisture content of 22-24% by heating at 80-85.degree. C.
[0118] The thus obtained materials, 4-5 wt % of the Panax ginseng powder, 8-10 wt % of the Poria cocos Wolf powder, 4-5 wt % of the Adenophora triphylla powder, 35-40 wt % of mel, and 43-48 wt % of the Rehmannia glutinosa juice were mixed (table 1), followed by first aging at 94.5-96.5.degree. C. for 72 hours, first cooling at 8-12.degree. C. for 24 hours, second aging at 94.5-96.5.degree. C. for 24 hours, and second cooling at room temperature for 72 hours, thereby preparing KOG.
TABLE-US-00001 TABLE 1 Natural Production Amount material Scientic name area (g) Panax Panax ginseng C. A. Meyer Korea 4,500 ginseng Wolfiporia Poria cocos Wolf China 9,000 extensa Adenophor Adenophora triphylla var. Korea 4,500 triphylla japonica Hara Mel -- Korea 39,000 Rehmannia Rehmannia Korea 47,000 glutinosa glutinosa(Gaertner) Liboschitz ex Steudel -- -- -- 104,000
Example 2: Analysis of Index Ingredients in SKOG
[0119] (1) Instruments and Reagents
[0120] Waters ACQUITY.TM. ultra performance LC system (Waters Corporation, Milford, Mass., USA) equipped with Waters ACQUITY.TM. photodiode array detector (PDA; Waters Corporation, Milford, Mass., USA) was used as ultra performance liquid chromatography (UPLC). Waters ACQUITY.TM. BEH C18 column (1.7 .mu.m, 2.1.times.100; Waters Corporation, Milford, Mass., USA) was used as an HPLC column, and Empower (Waters Corporation, Milford, Mass., USA) was used as software. An extractor used in sample extraction was the ultrasonicator model 8210R-DHT (Branson Ultrasonics, Danbury, Conn.). Reagents used for this experiment were methanol (HPLC grade, Junsei Chemical Co., Ltd., Tokyo, Japan), acetonitrile (HPLC grade, BAKER, Center Valley, Pa., USA), and water (Tertiary distilled water). The standard preparations used in the experiment were purchased from the Sigma-Aldrich (St. Louise, Mo., USA) or Extrasynthese (Genay Cedex, France).
[0121] (2) Preparation of Standard Solution
[0122] Lupeol, which is a substance contained in Adenophorae triphylla, was dissolved in dimethyl sulfoxide (DMSO) to prepare a standard stock solution with a concentration of 1 .mu.g/ml. Lobetyolin and syring aldehyde, which are substances contained in Adenophorae triphylla, acteoside, catalposide, and 5-hydroxymethyl-2-furfural (5H2F), which are substances contained in Rehmannia glutinosa, ginsenosides Rg3 and Rg3, which are substances contained in Panax ginseng, were dissolved in methanol, respectively, to prepare standard stock solutions with a concentration of 1 .mu.g/ml. Thereafter, an appropriate amount of each standard stock solution was taken, and diluted with methanol so as to contain 1, 5, and 10 g per ml of methanol, which was set as standard solutions. A standard curve determination coefficient (R.sup.2) value was more than 0.999 of all standard substances.
[0123] (3) Preparation of Test Liquid for Quantitative Analysis
[0124] A test liquid for quantitative analysis was homogeneously mixed with the sample, which was weighed 1 g precisely, and 10 ml of 30% methanol was added thereto, followed by ultrasonic extraction for 1 hr. This resultant test liquid was filtered through a membrane filter with a pore diameter of 0.2 .mu.m or less, and was picked out as a test liquid.
[0125] (4) Quantification of Sample
[0126] Waters ACQUITY.TM. ultra performance LC system (USA) was used as ultra performance liquid chromatography (UPLC). UPLC equipped with a photodiode array detector (PDA) and a bridged ethylene hydride (BEH) C18 column was used to analyze the index substances, and quantified by using Empower software. PDAA wavelength analysis was conducted at 280 nm for lupeol, acteoside, catalposide, and 5H2F, and 310 nm and 254 nm for lobetyolin and syring aldehyde, respectively. The temperature of the column was analyzed at the room temperature. A mobile phase was a mixed liquid of acetonitrile and water, containing 0.1% formic acid. The analysis was conducted under the conditions shown in table 2 below.
TABLE-US-00002 TABLE 2 0.1% 0.1% Flow Time(min) FA/water(%) FA/acetonitrile(%) rate(ml/min) 0 98 2 0.40 1.0 98 2 0.40 2.0 90 10 0.40 4.0 70 30 0.40 7.0 50 50 0.40 9.0 30 70 0.40 10.0 10 90 0.40 12.0 0 100 0.40 14.0 98 2 0.40 16.0 98 2 0.40
[0127] Rg3 was analyzed at 203 nm, and the mobile phase was a mixed liquid of acetonitrile and water. The analysis was conducted under the conditions shown in table 3 below.
TABLE-US-00003 TABLE 3 Flow Time(min) water(%) acetonitrile(%) rate(ml/min) 0 85 15 0.40 1.0 85 15 0.40 14.0 70 30 0.40 15.0 68 32 0.40 16.0 60 40 0.40 17.0 45 55 0.40 19.0 45 55 0.40 21.0 10 90 0.40 22.0 10 90 0.40 23.0 85 15 0.40
[0128] The sample was injected with 2 .mu.l, and a flow rate was 0.4 ml/min. As a result of analysis, qualitative checking was conducted by the retention time and quantitative analysis was conducted by the peak area method.
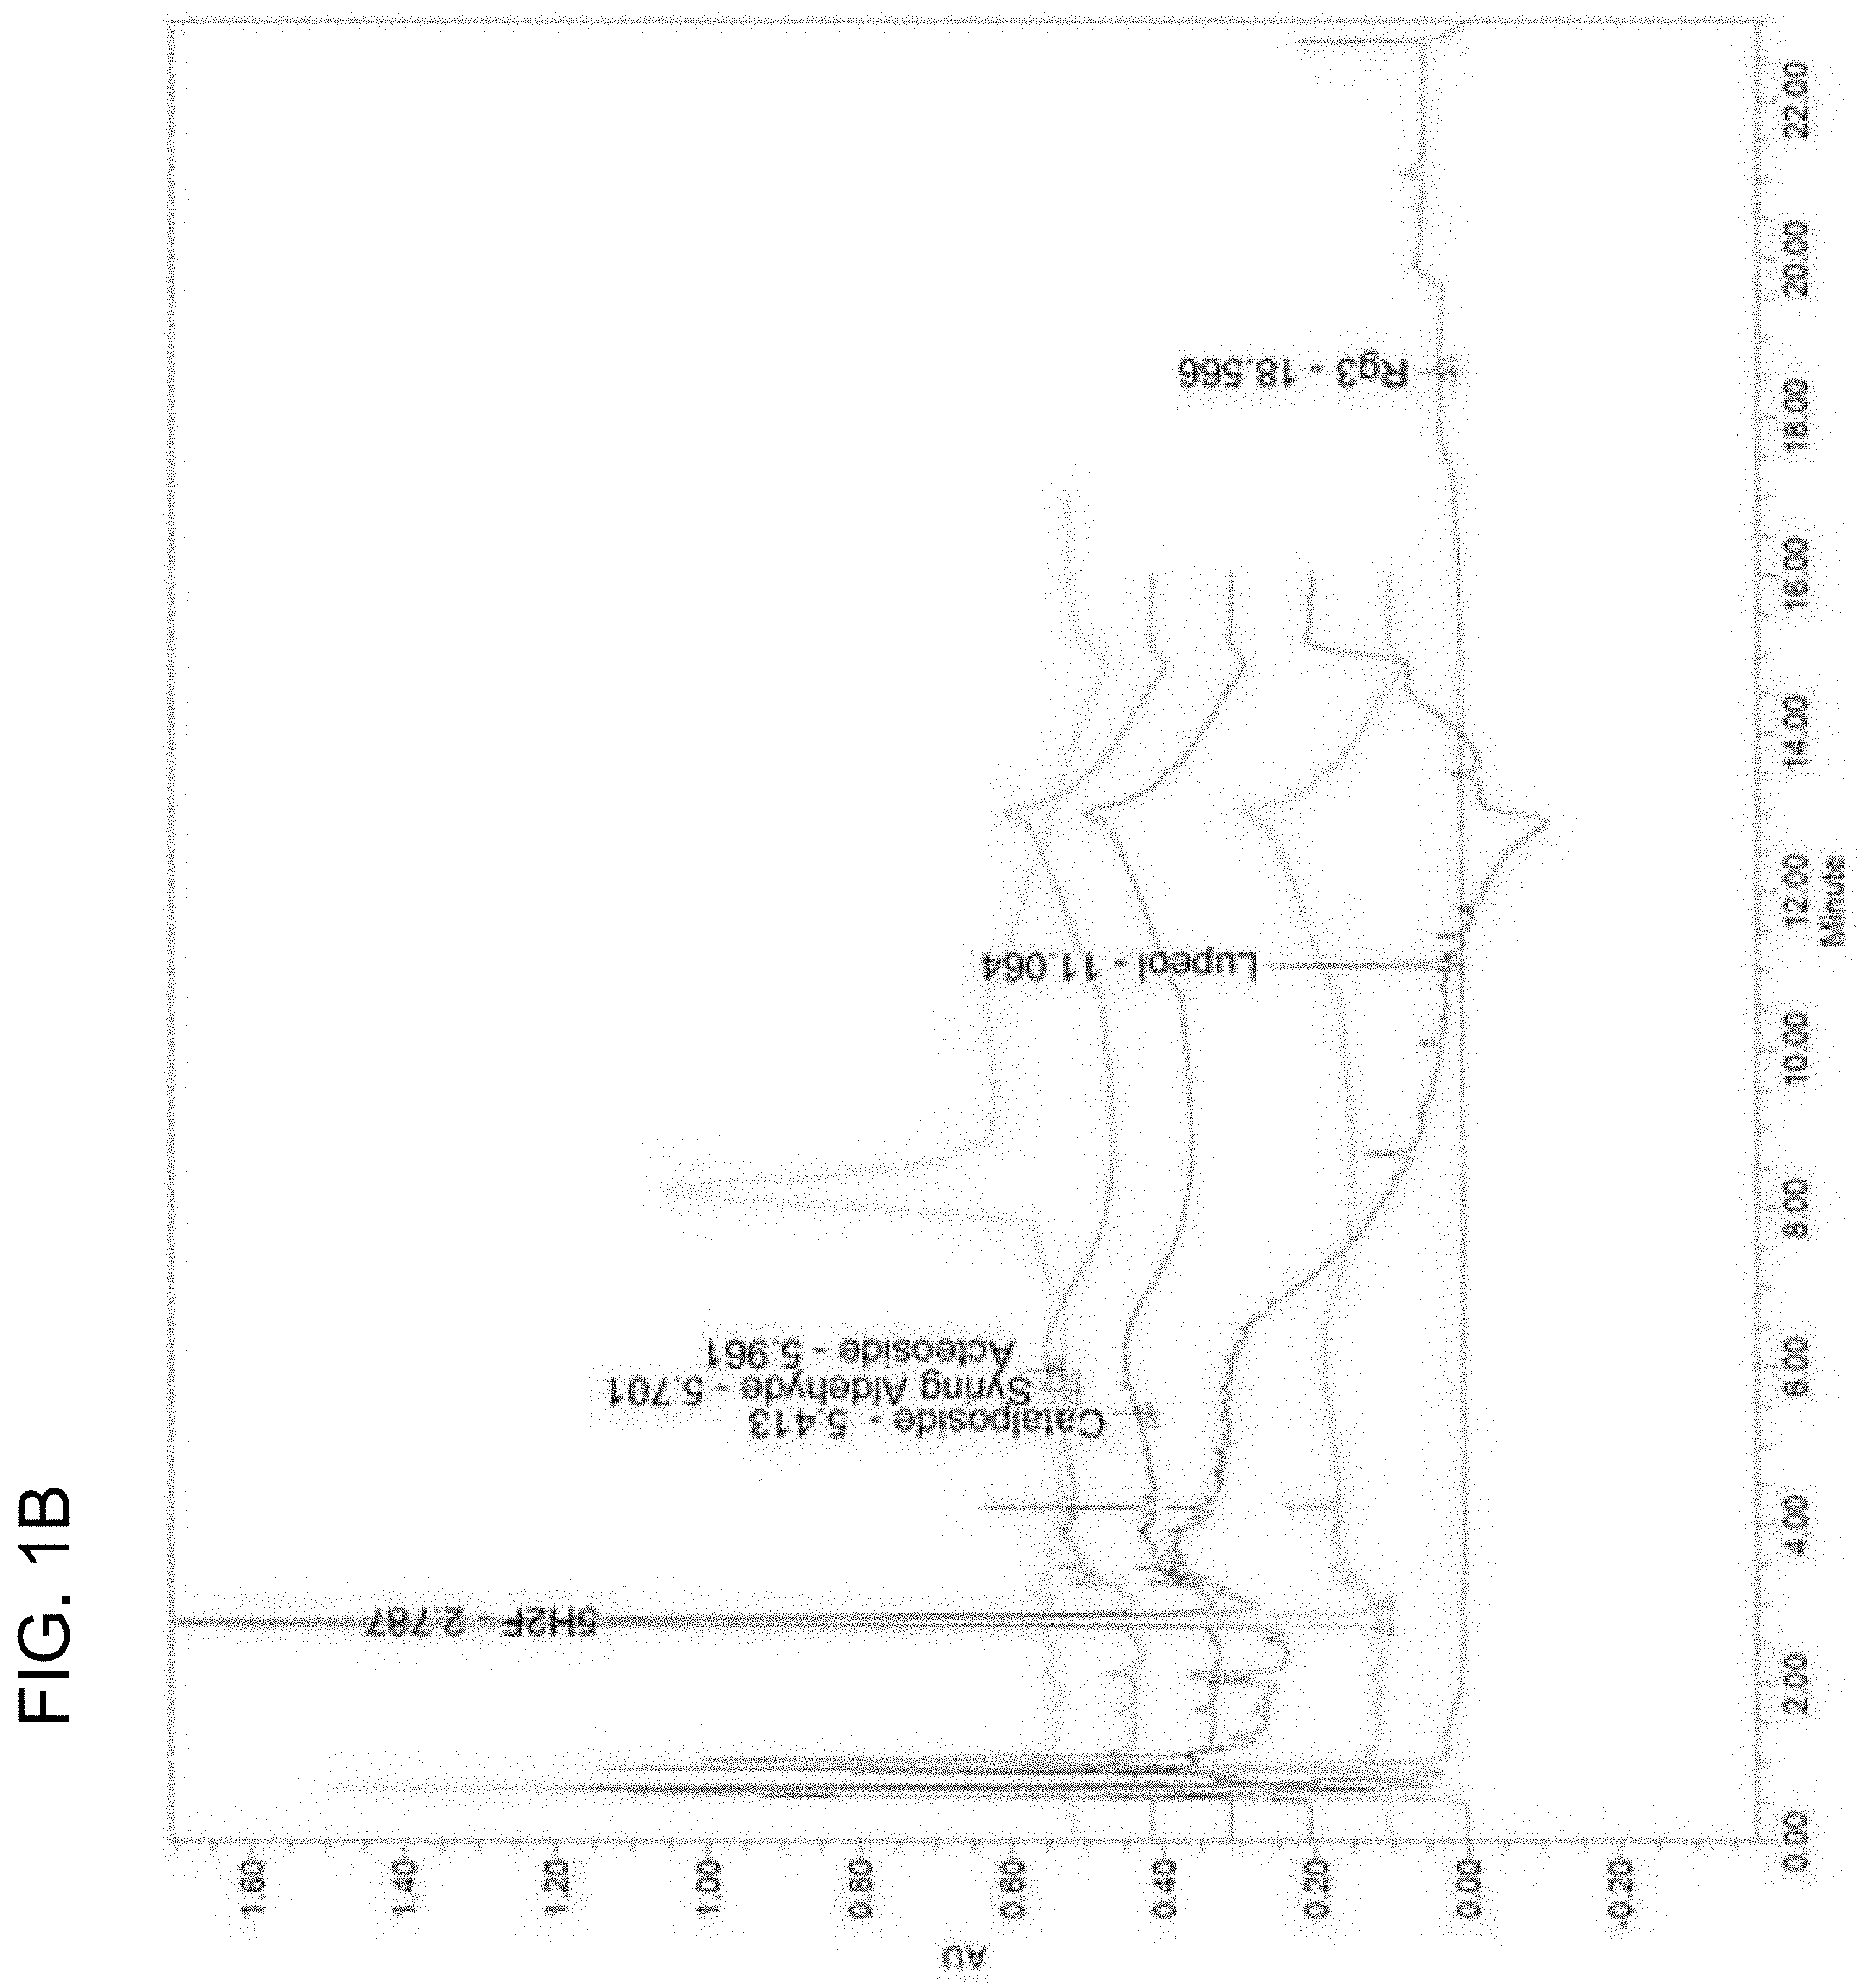
[0129] The results are shown in Table 4 and FIGS. 1a and 1b.
TABLE-US-00004 TABLE 4 Ingredient Concentration (mg/kg) Lupeol 224.52 .+-. 12.5 Lobetyolin -- Syring aldehyde 0.14 .+-. 0.01 5H2F 559.50 .+-. 1.70 Acteoside 0.31 .+-. 0.01 Catalposide 0.33 .+-. 0.01 Rg3 4.42 .+-. 0.02
[0130] FIGS. 1a and 1b show UPLC analysis results of standard solutions and SKOG, respectively. As shown in Table 4 and FIGS. 1a and 1b, it was observed in the UPLC analysis results that SKOG contained lupeol, lobetyolin, and syring aldehyde, 5H2F, acteoside, catalposide, and Rg3 of 224.52.+-.12.5, 0.14.+-.0.01, 559.50.+-.1.70, 0.31.+-.0.01, 0.33.+-.0.01, and 4.42.+-.0.02 mg/kg, respectively.
Example 3: Anticancer Effect
[0131] (1) Materials
[0132] A dark brown viscous composition (SKOG) in which Adenophorae triphylla, Panax ginseng, Wolfiporia extensa, Rehmannia glutinosa, and mel were mixed was provided from Okchundang (Korea), and some test materials were kept in Medical Research center for Globalization of Herbal Formulation, Daegu Haany University, Gyeongsan, Korea) (Code No. SKOG2017Ku01). A pale yellow gefitinib powder was purchased from Suzhou Huihe Pharm Co., Ltd. (Suzhou, China; ANNEX IV).
[0133] NCI-H520 lung cancer cells (ATCC HTB-182) were incubated in RPMI 1640 media (Gibco BRL, Grand Island. N.Y., USA) supplemented with 10% fatal bovine serum (FBS; Gibco BRL, Grand Island. N.Y., USA), 100 U/ml penicillin (Sigma-Aldrich, St. Louise, Mo., USA), and 100 .mu.g/ml streptomycin (Sigma-Aldrich, St. Louise, Mo., USA) at 37.degree. C. 5% CO.sub.2 condition (Model 311, Thermo Forma, Marietta, Ohio, USA). Generally, gefitinib is known to show IC.sub.50 of about 0.1 .mu.M on sensitive EGFR expressed tumor cell lines, but show IC.sub.50 of 1 .mu.M or more on resistant cell lines with EGFR mutation [Han et al., 2012]. The NCI-H520 used in the present test showed IC.sub.50 of 4.56.+-.1.46 .mu.M (2.00.+-.0.64 .mu.g/ml) to gefitinib. From 15 days after the xenograft of NCI-H520 lung cancer cells (2.times.10.sup.7 cells/mouse), the composition in which Adenophorae triphylla, Panax ginseng, Wolfiporia extensa, Rehmannia glutinosa, and mel were mixed was suspended in sterile distilled water at concentrations of 40, 20, and 10 mg/ml, respectively, and then the mice, which had been orally administered with 120 mg/kg gefitinib were co-administered with respective suspensions at a dose of 10 ml/kg (400, 200, and 100 mg/kg) at an interval of within 5 min for 35 days once every day. Also, gefitinib was dissolved in sterile distilled water to a concentration of 12 mg/ml, and orally administered into the mice at a dose of 10 ml/kg (120 mg/kg). In addition, for the provision of stress due to the same administration and restrain, only the same volume of sterile distilled water was administered to each single administration group when the composition in which Adenophorae triphylla, Panax ginseng, Wolfiporia extensa, Rehmannia glutinosa, and mel were mixed or gefitinib was administered, and only sterile distilled water as a medium was administered to the normal and tumor transplant medium control groups twice at an interval of within 5 min.
[0134] (2) Cytotoxic Evaluation
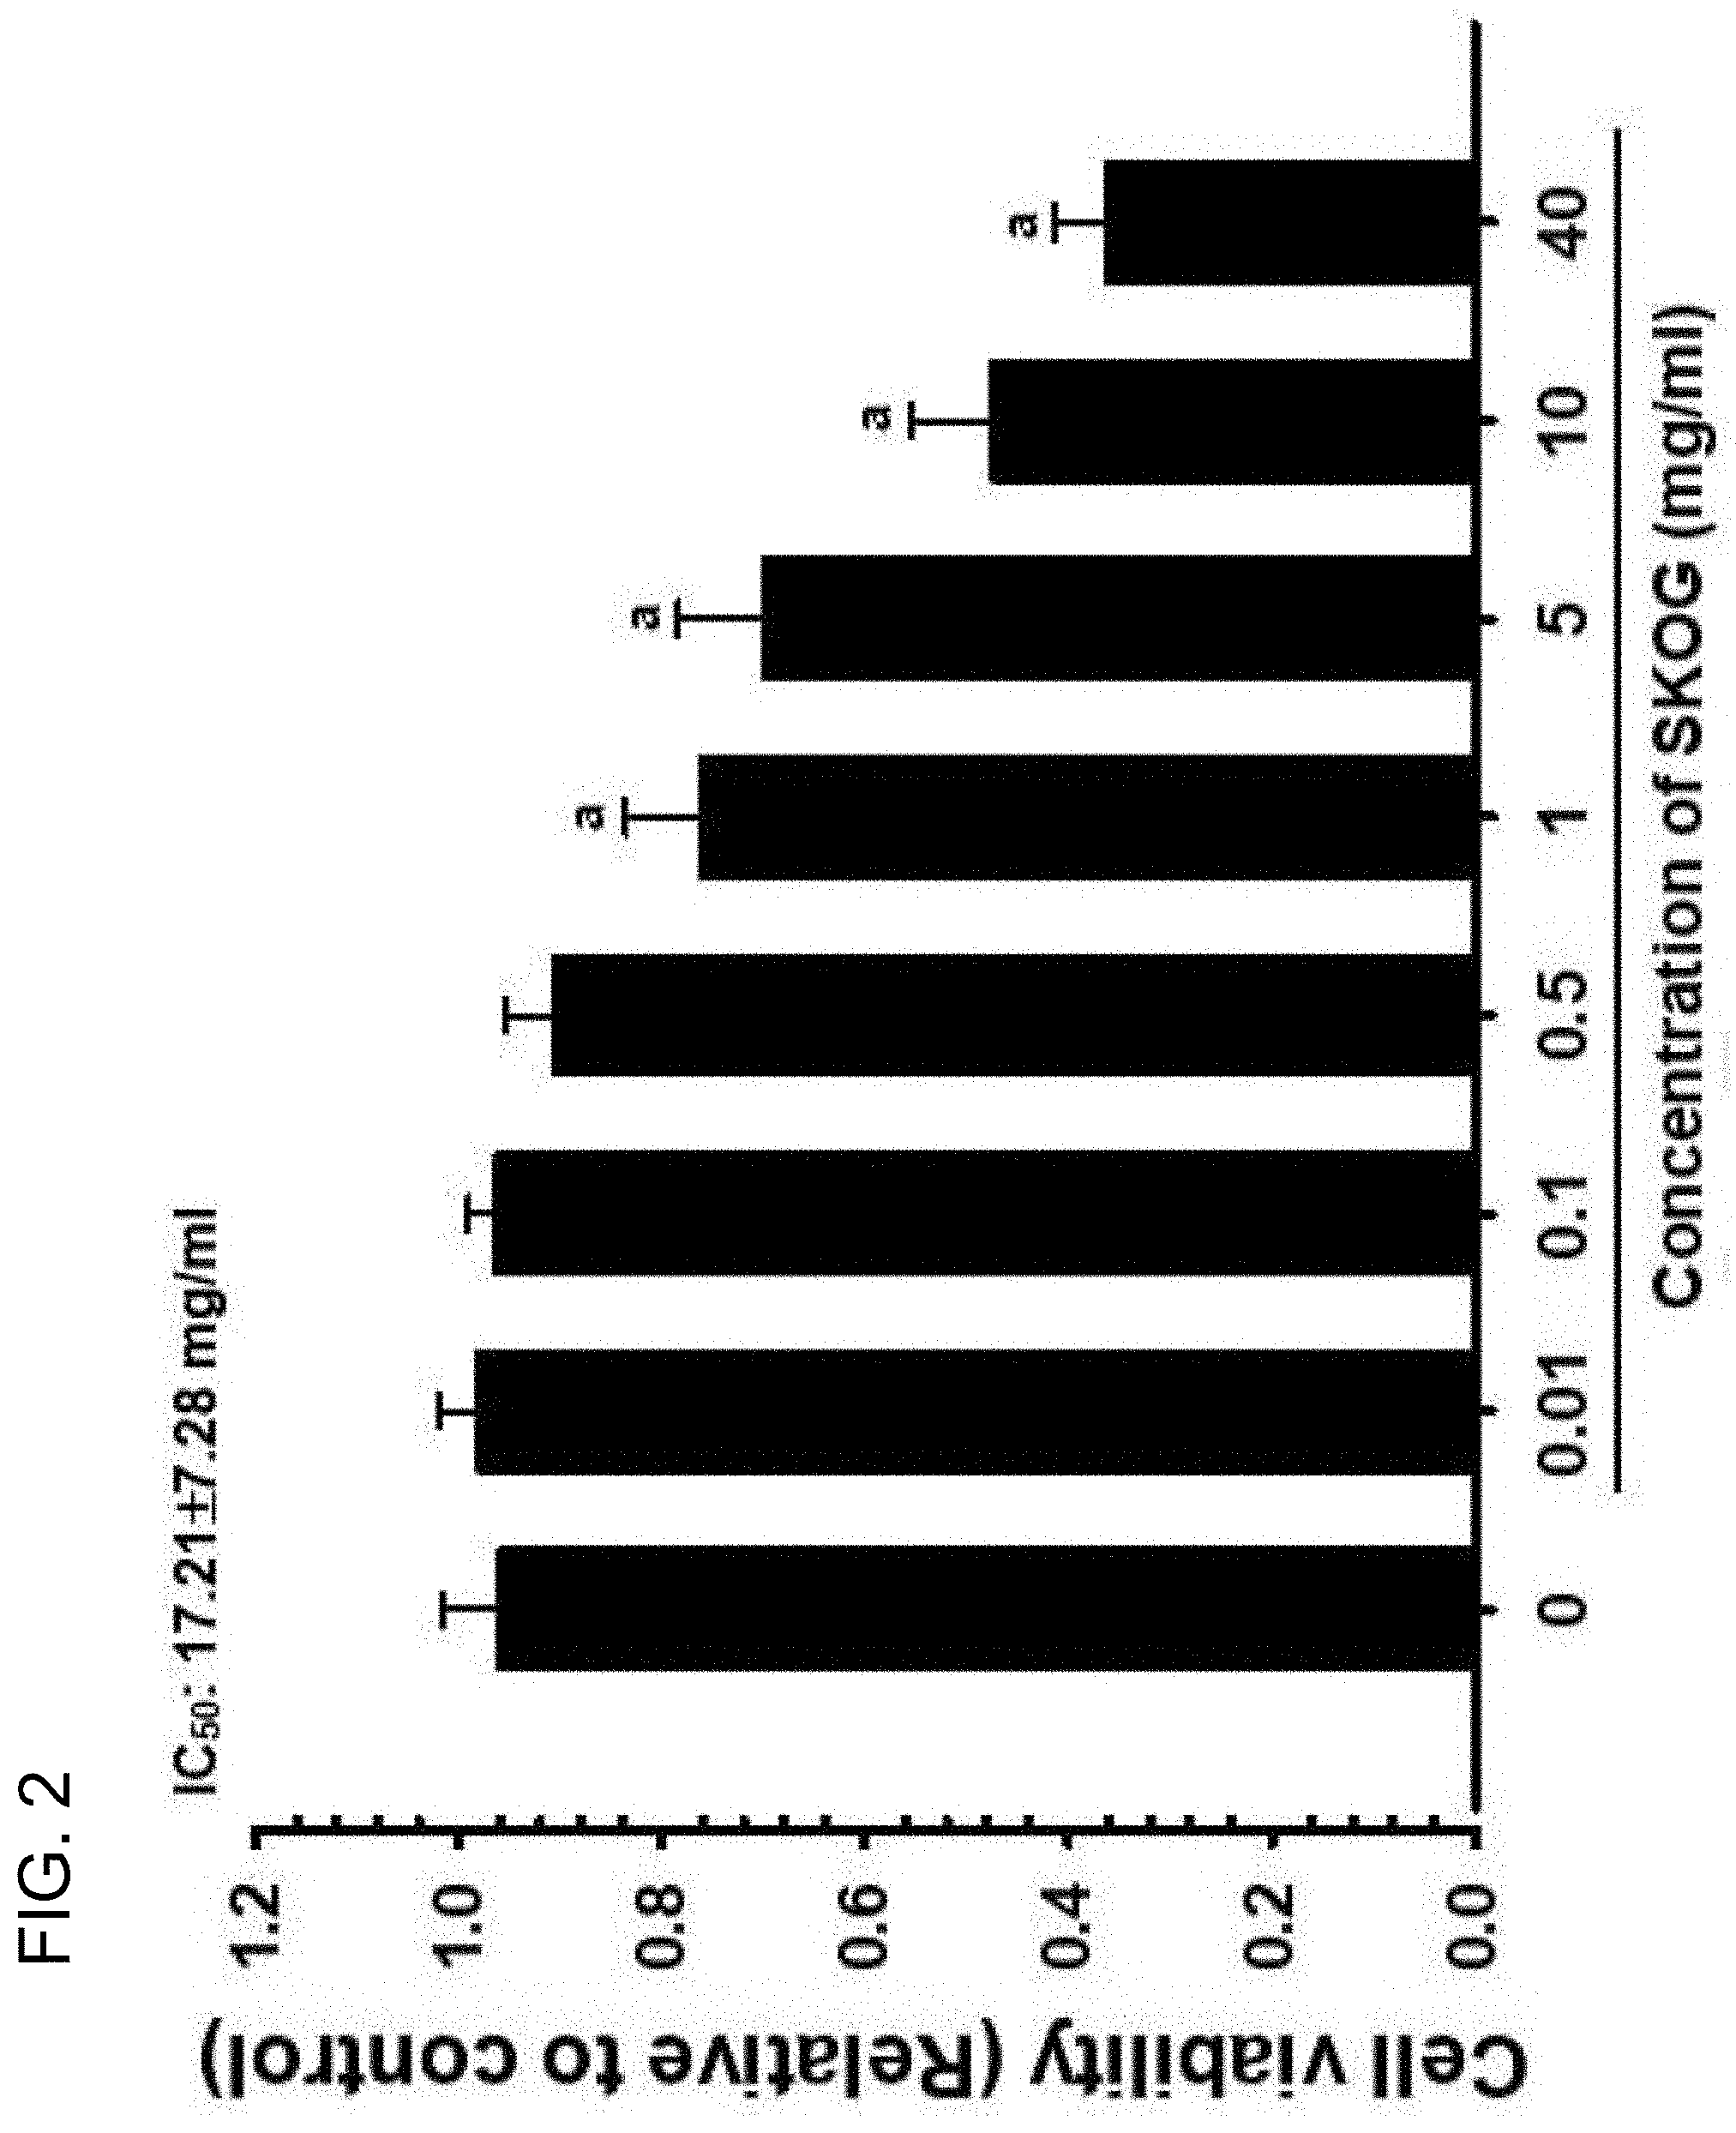
[0135] IC.sub.50 at which SKOG (0, 0.01, 0.1, 0.5, 1, 5, 10, and 40 mg/kg) and gefitinib (0, 0.001, 0.01, 0.1, 1, 5, 10, and 50 .mu.M) inhibited cell viability of NCI-H520 cells (1.times.10.sup.4 cell) by 50% was evaluated by using the MTT method.
[0136] As a result, the cell viability of NCI-H520 cells was significantly reduced in from SKOG 1 mg/ml treated group, compared with the medium control group (1 mg/ml treated group) (p<0.01), and IC.sub.50 was calculated as 17.21.+-.7.28 mg/ml (FIG. 2). The cell viability of NCI-H520 cells showed changes of 2.10, 0.30, -5.72, -20.61, -27.03, -50.53, and -62.23% in the SKOG 0.01, 0.1, 0.5, 1, 5, 10. and 40 mg/ml treated groups, respectively, compared with the non-treated medium control group (0 mg/ml treated group).
[0137] In addition, the cell viability of NCI-H520 cells was significantly reduced in from gefitinib 0.1 .mu.M treated group, compared with the medium control group (0 .mu.M treated group) (p<0.01), and IC.sub.50 was calculated as 4.56.+-.1.46 .mu.M (FIG. 3). The cell viability of NCI-H520 cells showed changes of 2.81, -3.53, -16.05, -26.95, -48.01, -66.29, and -76.96% in the gefitinib 0.001, 0.01, 0.1, 1, 5, 10, and 50 .mu.M treated groups, respectively, compared with the non-treated medium control group (0 .mu.M treated group).
[0138] (3) Animals
[0139] A total of 140 SPF/VAF Hsd:Athymic Nude-Foxnlnu mice (6-week age female. Harlan Lab., Udine Italy) [ANNEX I, II] were acclimatized for 7 days, and then animals with a predetermined weight were selected, xenografted with NCI-H520 cells (2.times.10.sup.7 cells/mouse) into the subcutaneous area of the right buttock. On day 14 after the xenograft of tumor cells, xenograft mice with a tumor volume of 500.14.+-.125.31 mm.sup.3 (314.87.about.771.33 mm.sup.3) or more were again selected, and eight mice per group were used in the present test. A normal medium control group of separate eight mice was also prepared on the basis of the body weight (body weight: normal group--21.34.+-.1.20 g, 19.80-23.20 g; tumor xenograft group--21.35.+-.1.15 g, 19.40-23.60 g). The present animal experiment was conducted under the prior approval of the Institutional Animal Care and Use Committee in Daegu Haany University (Approval No. DHU2017-098, Sep. 25, 2017; ANNEX III) (FIG. 4).
[0140] <Group Classification (a Total of Seven Groups; Eight Animals Per Group)>
[0141] (1) Intact control: Normal medium control group
[0142] (2) TB (tumor bearing) control: NCI-H520 tumor cell xenografted and then sterile distilled water administered group
[0143] (3) G120: Tumor cell xenograft and then gefitinib 120 mg/kg alone-administered group
[0144] (4) SKOG400: Tumor cell xenografted and then composition (Adenophorae triphylla, Panax ginseng, Wolfiporia extensa, Rehmannia glutinosa, and mel being mixed) 400 mg/kg single administered group
[0145] (5) GSK400: Tumor cell xenografted and then gefitinib 120 mg/kg and composition (Adenophorae triphylla, Panax ginseng, Wolfiporia extensa, Rehmannia glutinosa, and mel being mixed) 400 mg/kg co-administered group
[0146] (6) GSK200: Tumor cell xenografted and then gefitinib 120 mg/kg and composition (Adenophorae triphylla, Panax ginseng, Wolfiporia extensa, Rehmannia glutinosa, and mel being mixed) 200 mg/kg co-administered group
[0147] (7) GSK100: Tumor cell xenografted and then gefitinib 120 mg/kg and composition (Adenophorae triphylla, Panax ginseng, Wolfiporia extensa, Rehmannia glutinosa, and mel being mixed) 100 mg/kg co-administered group
[0148] (4) Xenograft of Tumor Cells
[0149] NCI-H520 (American Type Culture Collection Center, Manassas, Va., USA) cells were subcultured and maintained in a 37.degree. C. 5% CO.sub.2 incubator using RPMI 1640 (Gibco, Grand Island, N.Y., USA) supplemented with 10% fetal bovine serum (FBS), and a tumor cell floating liquid was prepared to have 1.0.times.10.sup.8 cell/ml. In addition, 0.2 mL (2.times.10.sup.7 cell/mouse) of NCI-H520 cell floating liquid was injected into the subcutaneous area of the right buttock to form solid tumor masses. In the present experiment, gefitinib or an experimental diet was orally administered from 21 days after the xenograft of NCI-H520 lung cancer cell lines (tumor volume: 500.14.+-.125.31 mm.sup.3, 314.87771.33 mm.sup.3).
[0150] (5) Changes in Body Weight and Weight Gain
[0151] The tumor xenograft control group showed no significant change in body weight during the entire experimental period compared with the normal medium control group, but showed a significant reduction in actual body weight excluding tumor weight and a reduction in weight gain during the administration period on the basis of the actual body weight compared with the normal medium control group (p<0.01). The gefitinib single administered group showed a significant reduction in body weight from 28 days after the administration compared with the tumor xenograft control group (p<0.01), and significant reductions in actual body weight and weight gain during the administration period on the basis of the actual body weight compared with the normal medium control group (p<0.01 or p<0.05). The composition (Adenophorae triphylla, Panax ginseng, Wolfiporia extensa, Rehmannia glutinosa, and mel being mixed, SKOG) single administered group, the gefitinib 120 mg/kg and composition (Adenophorae triphylla, Panax ginseng, Wolfiporia extensa, Rehmannia glutinosa, and mel being mixed) 400, 200, and 100 mg/kg co-administered (GSK 400, 200, and 100 mg/kg) groups showed significant increases in actual body weight and weight gain compared with the tumor xenograft control group (p<0.01 or p<0.05). In particular, the gefitinib 120 mg/kg group and the GSK 400, 200, and 100 mg/kg groups showed a significant increase in body weight from 28 days after the administration compared with gefitinib 120 mg/kg single administered group (p<0.01), also showed significant increases in actual body weight and weight gain compared with the gefitinib 120 mg/kg single administered group (p<0.01) (Table 5 and FIG. 5). The superscript alphabets indicate significant differences. The presence of the same letter means that there is significance between the experimental groups.
TABLE-US-00005 TABLE 5 Body weight (g) Adminisration Actual body Weight gain Group initiation Sacrifice weight (g) Control group Intact 19.45 .+-. 1.31 23.04 .+-. 0.88.sup. 23.04 .+-. 0.88 .sup. 3.59 .+-. 0.56 TB 19.43 .+-. 1.24 22.58 .+-. 0.47.sup. 19.77 .+-. 0.63.sup.a 0.34 .+-. 0.90.sup.a Single material administered group Gefitinib 19.29 .+-. 1.29 20.13 .+-. 0.76.sup.fg 18.46 .+-. 0.77.sup.ad -0.83 .+-. 0.98.sup.ac SKOG 19.38 .+-. 1.39 .sup. 23.03 .+-. 1.65.sup.gh .sup. 20.99 .+-. 1.59.sup.ade 1.61 .+-. 0.67.sup.ace Gefitinib and SKOG co-administered group (within 5 min) 400 mg/kg 19.33 .+-. 1.34 23.40 .+-. 1.37.sup.h 22.93 .+-. 1.44.sup.ce 3.60 .+-. 0.71.sup.ce 200 mg/kg 19.23 .+-. 1.41 22.65 .+-. 1.42.sup.h 21.94 .+-. 1.42.sup.ce 2.72 .+-. 0.45.sup.bc 100 mg/kg 19.20 .+-. 0.64 22.45 .+-. 0.85.sup.h .sup. 21.19 .+-. 0.90.sup.ade 1.99 .+-. 0.65.sup.ace
[0152] As for the actual body weight excluding tumor weight on the final sacrifice day, the tumor xenograft control group showed a change in -14.20% compared with the normal medium control group, and the gefitinib 120 mg/kg and SKOG 400 mg/kg single administration group and the gefitinib 120 mg/kg and SKOG 400, 200, and 100 mg/kg co-administered groups showed changes of -6.61, 6.18, 15.99, 11.01, and 7.20% compared with the tumor xenograft group.
[0153] As for the weight gain during the administration period on the basis of the actual body weight (for 35 days; actual body weight excluding tumor weight on the final sacrifice day-body weight on the start day of administration), the tumor xenograft control group showed a change of -90.47% compared with the normal medium control group, and the gefitinib 120 mg/kg and SKOG 400 mg/kg single administered groups and the GSK 400, 200, and 100 mg/kg administered groups showed changes of -341.95, 372.28, 954.35, 695.50, and 482.41%, respectively, compared with the tumor xenograft control group.
[0154] (6) Change in Tumor Volume
[0155] The gefitinib single administered group showed a significant reduction in tumor volume from day 14 after the start of administration compared with the tumor xenograft control group (p<0.01), and a significant reduction in tumor volume during the administration period compared with the tumor xenograft control group (p<0.01). The SKOG 400 mg/kg single administered group also showed a significant reduction in tumor volume from day 14 after the start of administration compared with the tumor xenograft control group (p<0.01). The change in tumor volume during the administration period was showed to be significant reduction compared with the tumor xenograft control group (p<0.01). The GSK 400, 200, and 100 mg/kg administered groups also showed significant reductions from 14 days after the start of administration compared with the tumor xenograft control group (p<0.01 or p<0.05), and thus showed significant reductions in tumor volume during the administration period compared with the tumor xenograft control group (p<0.01). Especially, the GSK 400 mg/kg administered group, from 14 days after the start of administration, and the GSK 200 mg/kg and 100 mg/kg administration groups from 21 days after the start of administration showed significant reductions in tumor volume compared with the gefitinib single administered group (p<0.01 or p<0.05), and also showed significant reductions in tumor volume during the period section compared with the gefitinib single administered group (p<0.01) (Table 6, FIGS. 6 and 7).
TABLE-US-00006 TABLE 6 Tumor volume (mm.sup.3) Start of At the time of Change administration sacrifice (mm.sup.3) Groups [A] [B] [B - A] Control group TB 469.02 .+-. 102.47 6487.36 .+-. 862.66.sup. 6018.34 .+-. 774.83.sup. Single material administered group Gefitinib 462.10 .+-. 105.87 2858.51 .+-. 377.01.sup.a 2396.41 .+-. 329.84 .sup.a SKOG 472.89 .+-. 141.15 3972.27 .+-. 655.53.sup.ab 3499.37 .+-. 557.32.sup.ab Gefitinib and SKOG co-administered group (within 5 min) 400 mg/kg 473.39 .+-. 137.02 1209.50 .+-. 335.04.sup.ab 736.11 .+-. 235.75.sup.ab 200 mg/kg 477.76 .+-. 161.99 1670.83 .+-. 471.94.sup.ab 1193.07 .+-. 375.71.sup.ab 100 mg/kg 475.73 .+-. 122.90 2125.75 .+-. 442.71.sup.ab 1650.02 .+-. 431.10.sup.ab
[0156] As for a change in tumor volume during the drug administration period (for five weeks; tumor volume on the final sacrifice day-tumor volume on the start day of administration), the gefitinib 120 mg/kg and SKOG 400 mg/kg single administered groups and the GSK 400, 200, and 100 mg/kg administered groups showed changes of -60.18, -41.85, -87.77, -80.18, and -72.58%, respectively, compared with the tumor xenograft control group.
[0157] (7) Change in Tumor Weight
[0158] All the drug administered groups showed significant reductions (p<0.01) in tumor relative and absolute weights compared with the tumor xenograft control group. Especially, the GSK 400, 200, and 100 mg/kg groups showed significant reductions in absolute weight (Table 7) and relative weight (Table 9) compared with gefitinib 120 mg/kg single administered group (p<0.01 or p<0.05) (Tables 7 and 8 and FIG. 6).
TABLE-US-00007 TABLE 7 Submandibular Periovarian Group Tumor weight Spleen lymph nodes fat Control group Intact -- 0.110 .+-. 0.011 0.013 .+-. 0.004 .sup. 0.050 .+-. 0.013 TB 2.808 .+-. 0.282 .sup. 0.054 .+-. 0.005.sup.a 0.004 .+-. 0.001.sup.d 0.008 .+-. 0.002.sup.d Single material administered group Gefitinib 1.664 .+-. 0.292.sup.f 0.051 .+-. 0.007.sup.a 0.004 .+-. 0.001.sup.d 0.007 .+-. 0.002.sup.d SKOG 2.036 .+-. 0.249.sup.f 0.080 .+-. 0.008.sup.abc .sup. 0.008 .+-. 0.002.sup.dfg 0.024 .+-. 0.004.sup.dfg Gefitinib and SKOG co-administered group (within 5 min) 400 mg/kg 0.472 .+-. 0.130.sup.fg 0.103 .+-. 0.011.sup.bc 0.011 .+-. 0.002.sup.fg 0.033 .+-. 0.007.sup.dfg 200 mg/kg 0.706 .+-. 0.278.sup.fg 0.097 .+-. 0.008.sup.abc 0.010 .+-. 0.002.sup.fg 0.028 .+-. 0.006.sup.dfg 100 mg/kg 1.260 .+-. 0.198.sup.fh 0.082 .+-. 0.012.sup.abc 0.009 .+-. 0.001.sup.efg 0.024 .+-. 0.005.sup.dfg
TABLE-US-00008 TABLE 8 submandibular Periovarian Group Tumor weight Spleen lymph nodes fat Control group Intact -- 0.479 .+-. 0.060 0.057 .+-. 0.017.sup. 0.216 .+-. 0.051 .sup. TB 12.453 .+-. 1.378 0.241 .+-. 0.028.sup.a 0.019 .+-. 0.007.sup.e 0.037 .+-. 0.008.sup.e Single material administered group Gefitinib 8.274 .+-. 1.443.sup.g 0.251 .+-. 0.036.sup.a 0.019 .+-. 0.006.sup.e 0.036 .+-. 0.011.sup.e SKOG 8.857 .+-. 1.042.sup.g 0.347 .+-. 0.043.sup.acd 0.034 .+-. 0.009.sup.egh 0.104 .+-. 0.020.sup.egh Gefitinib and SKOG co-administered group (within 5 min) 400 mg/kg 2.037 .+-. 0.632.sup.gh 0.440 .+-. 0.050.sup.cd 0.048 .+-. 0.010.sup.gh 0.140 .+-. 0.035.sup.egh 200 mg/kg 3.123 .+-. 1.208.sup.gh 0.430 .+-. 0.029.sup.bcd 0.044 .+-. 0.005.sup.gh 0.125 .+-. 0.031.sup.egh 100 mg/kg 5.623 .+-. 0.961.sup.gh 0.365 .+-. 0.042.sup.acd 0.039 .+-. 0.005.sup.fgh 0.105 .+-. 0.020.sup.egh
[0159] The gefitinib 120 mg/kg and SKOG 400 mg/kg single administered groups and the GSK 400, 200, and 100 mg/kg administered groups showed changes in absolute tumor weight of -40.73, -27.50, -83.20, -74.85, and -55.15%, respectively, and changes in relative tumor weight of -33.56, -28.88, -83.64, -74.92, and -54.84%, respectively, compared with the tumor xenograft control group.
[0160] (8) Change in Spleen Weight
[0161] The tumor xenograft control group showed significant reductions in absolute and relative spleen weights compared with the normal medium control group (p<0.01), but the SKOG 400 mg/kg single administered group and the GSK 400, 200, and 100 mg/kg administered groups showed significant increases in weight compared with the tumor xenograft control group (p<0.01). Especially, the GSK 400, 200, and 100 mg/kg administered groups showed significant increases in absolute and relative spleen weights compared with the gefitinib single administered group, respectively (p<0.01). The gefitinib single administered group showed no changes in absolute and relative spleen weights compared with the tumor xenograft control group (Tables 7 and 8).
[0162] As for the absolute spleen weight, the tumor xenograft control group showed a change of 50.62% compared with the normal medium control group, and the gefitinib 120 mg/kg and SKOG 400 mg/kg single administered groups and the GSK 400, 200, and 100 mg/kg administered groups showed changes of -7.13, 46.44, 88.74, 79.08, and 51.03% compared with the tumor xenograft control group, respectively.
[0163] As for the relative spleen weight, the tumor xenograft control group showed a change of 49.67% compared with the normal medium control group, and the gefitinib 120 mg/kg and SKOG 400 mg/kg single administered groups and the GSK 400, 200, and 100 mg/kg administered groups showed changes of 4.11, 43.99, 82.15, 78.32, and 51.23% compared with the tumor xenograft control group, respectively.
[0164] (9) Change in Submandibular Lymph Node Weight
[0165] The tumor xenograft control group showed significant reductions in absolute and relative submandibular lymph node weights compared with the normal medium control group, respectively (p<0.01), but the SKOG 400 mg/kg single administered group and the GSK 400, 200, and 100 mg/kg administered groups showed significant increases in submandibular lymph node weight compared with the tumor xenograft control group, respectively (p<0.01). Especially, the GSK 400, 200, and 100 mg/kg administered groups showed significant increases in absolute and relative submandibular lymph node weights compared with the gefitinib single administered group (p<0.01). The gefitinib 120 mg/kg single administered group showed no change in submandibular lymph node weight compared with the tumor xenograft control group (Tables 7 and 8).
[0166] The tumor xenograft control group showed changes in absolute and relative submandibular lymph node weights of -67.92 and -67.03% compared with the normal medium control group. The gefitinib 120 mg/kg and SKOG 400 mg/kg single administered groups and the GSK 400, 200, and 100 mg/kg administered groups showed changes in absolute submandibular lymph node weight of -8.82, 85.29, 161.76, 132.35, and 105.88% compared with the tumor xenograft control group, respectively, and changes in relative submandibular lymph node weight of 1.85, 81.72, 151.99, 130.57, and 106.38% compared with the tumor xenograft control group, respectively.
[0167] (10) Change in Periovarian Fat Weight
[0168] The tumor xenograft control group showed significant reductions in absolute and relative periovarian fat weights compared with the normal medium control group (p<0.01), but the SKOG single administered group and all the three SKOG and gefitinib co-administered groups showed significant increases in periovarian fat weight compared with the tumor xenograft control group (p<0.01). Especially, the GSK 400, 200, and 100 mg/kg administered groups showed significant increases in periovarian fat weight compared with the gefitinib single administered group, respectively (p<0.01). The gefitinib 120 mg/kg single administered group showed no changes in absolute and relative periovarian accumulation fat weights compared with the tumor xenograft control group (Tables 7 and 8).
[0169] As for the absolute periovarian fat weight, the tumor xenograft control group showed a change of -83.21% compared with the normal medium control group. The gefitinib 120 mg/kg and SKOG 400 mg/kg single administered groups and the GSK 400, 200, and 100 mg/kg administered groups showed changes of -13.43, 183.58, 288.06, 237.31, and 182.09%, respectively, compared with the tumor xenograft control group, respectively, and changes of -13.43, 183.58, 288.06, 237.31, and 182.09%, respectively, compared with the tumor xenograft control group.
[0170] As for the relative periovarian fat weight, the tumor xenograft control group showed a change of -82.80% compared with the normal medium control group. The gefitinib 120 mg/kg and SKOG 400 mg/kg single administered groups and the GSK 400, 200, and 100 mg/kg administered groups showed changes of -2.79, 178.96, 277.38, 237.62, and 183.23%, respectively, compared with the tumor xenograft control group.
[0171] (11) Changes in Serum IL-6 and IFN-.gamma. Levels
[0172] The tumor xenograft control group showed a significant increase in serum IL-6 level (p<0.01) and a significant reduction in IFN-.gamma. level (p<0.01), compared with the normal medium control group. However, the SKOG 400 mg/kg single composition group and the GSK 400, 200, and 100 mg/kg administered groups showed a significant reduction in serum IL-6 level and a significant increase in IFN-.gamma. level compared with the tumor xenograft control group (p<0.01). Especially, the GSK 400, 200, and 100 mg/kg administered groups showed a significant reduction in serum IL-6 level and a significant increase in IFN-.gamma. level compared with the gefitinib single administered group (p<0.01). The gefitinib single administered group showed no significant changes in serum IL-6 and IFN-.gamma. levels compared with the tumor xenograft control group (FIG. 8).
[0173] As for the serum IL-6 level, the tumor xenograft control group showed a change of 825.11% compared with the normal medium control group, and the gefitinib 120 mg/kg and SKOG 400 mg/kg single administered groups and the GSK 400, 200, and 100 mg/kg administered groups showed changes of 6.25, -53.28, -76.52, -70.72, and -60.87%, respectively, compared with the tumor xenograft control group.
[0174] As for the serum IFN-.gamma. level, the tumor xenograft control group showed a change of -71.06% compared with the normal medium control group, and the gefitinib 120 mg/kg and SKOG 400 mg/kg single administered groups and the GSK 400, 200, and 100 mg/kg administered groups showed changes of -2.85, 118.57, 151.53, 142.93, and 121.95%, respectively, compared with the tumor xenograft control group.
[0175] (12) Change in NK Cell Activity
[0176] The tumor xenograft control group showed a significant reduction in splenic and peritoneal NK cell activities compared with the normal medium control group (p<0.01). However, the SKOG 400 mg/kg single composition group and the GSK 400, 200, and 100 mg/kg administered groups showed significant increases in splenic and peritoneal NK cell activities compared with the tumor xenograft control group (p<0.01). Especially, the SKOG 400 mg/kg single composition group and the GSK 400, 200, and 100 mg/kg administered groups showed significant increases in splenic and peritoneal NK cell activities compared with the gefitinib single administered group (p<0.01). The gefitinib single administered group showed no significant changes in splenic and peritoneal NK cell activities compared with the tumor xenograft control group (FIG. 9).
[0177] As for the splenic NK cell activity, the tumor xenograft control group showed a change of -82.17% compared with the normal medium control group, and the gefitinib 120 mg/kg and SKOG 400 mg/kg single administered groups and the GSK 400, 200, and 100 mg/kg administered groups showed changes of -6.32, 110.42, 207.47, 157.93, and 116.80%, respectively, compared with the tumor xenograft control group.
[0178] As for the peritoneal NK cell activity, the tumor xenograft control group showed a change of -81.83% compared with the normal medium control group, and the gefitinib 120 mg/kg and SKOG 400 mg/kg single administered groups and the GSK 400, 200, and 100 mg/kg administered groups showed changes of -7.43, 151.48, 279.65, 207.54, and 149.50%, respectively, compared with the tumor xenograft control group.
[0179] (13) Change in Splenic Cytokin Levels
[0180] The tumor xenograft control group showed significant reductions in splenic TNF-.alpha., IL-1.beta., and IL-10 levels compared with the normal medium control group (p<0.01). However, the SKOG 400 mg/kg single composition group and the GSK 400, 200, and 100 mg/kg administered groups showed significant increases in splenic cytokine levels compared with the tumor xenograft control group (p<0.01). Especially, the GSK 400, 200, and 100 mg/kg administered groups showed significant increases in splenic TNF-.alpha., IL-1.beta., and IL-10 levels, respectively, compared with the gefitinib single administered group (p<0.01). The gefitinib single administered group showed no significant changes in splenic cytokine levels compared with the tumor xenograft control group (Table 9).
TABLE-US-00009 TABLE 9 TNF- .alpha. (Tumor necrosis IL-1.beta. IL-10 Group factor-.alpha.) (Interleukin-1.beta.) (Interleukin-10) Control group Intact 142.83 .+-. 49.08 48.33 .+-. 19.26 .sup. 122.81 .+-. 34.71 TB 26.29 .+-. 10.73.sup.a 8.64 .+-. 3.05.sup.a 26.52 .+-. 12.47.sup.a Single material administered group Gefitinib 26.23 .+-. 10.81.sup.a 8.36 .+-. 1.96.sup.a 25.58 .+-. 11.94.sup.a SKOG 70.03 .+-. 38.12.sup.acd 30.26 .+-. 12.78.sup.bcd 73.46 .+-. 19.50.sup.acd Gefitinib and SKOG co-administered group (wtihin 5 min) 400 mg/kg 98.80 .+-. 26.02.sup.cd 44.35 .+-. 10.11.sup.cd 97.56 .+-. 26.24.sup.cd 200 mg/kg 81.62 .+-. 24.83.sup.acd 37.41 .+-. 12.06.sup.cd 82.83 .+-. 22.96.sup.bcd 100 mg/kg 71.75 .+-. 25.06.sup.acd 29.51 .+-. 12.75.sup.bcd 72.39 .+-. 12.62.sup.acd
[0181] As for the splenic TNF-.alpha. level, the tumor xenograft control group showed a change of -81.59% compared with the normal medium control group, and the gefitinib 120 mg/kg and SKOG 400 mg/kg single administered groups and the GSK 400, 200, and 100 mg/kg administered groups showed changes of -0.24, 166.39, 275.84, 210.48, and 172.94%, respectively, compared with the tumor xenograft control group.
[0182] As for the splenic IL-1.beta. level, the tumor xenograft control group showed a change of -82.12% compared with the normal medium control group, and the gefitinib 120 mg/kg and SKOG 400 mg/kg single administered groups and the GSK 400, 200, and 100 mg/kg administered groups showed changes of -3.18, 250.31, 413.34, 333.05, and 241.56%, respectively, compared with the tumor xenograft control group.
[0183] As for the splenic IL-10 level, the tumor xenograft control group showed a change of -78.41% compared with the normal medium control group, and the gefitinib 120 mg/kg and SKOG 400 mg/kg single administered groups and the GSK 400, 200, and 100 mg/kg administered groups showed changes of -3.53, 177.04, 267.95, 212.40, and 173.00%, respectively, compared with the tumor xenograft control group.
[0184] (14) Histological changes
[0185] (1) Histopathological Change of Tumor Mass
[0186] In the tumor xenograft control group, comparatively well differentiated NCI-H520 lung cancer cells were densely formed, a cytoplasmic eosinophilic increase and karyopyknosis by apoptosis were found, and mitosis was also frequently observed. The gefitinib 120 mg/kg and SKOG 400 mg/kg single administered groups and the GSK 400, 200, and 100 mg/kg administered groups showed a significant increase in apoptotic cells (p<0.01) and a significant reduction in proportion of NCI-H520 cells (p<0.01). Especially, the GSK 400, 200, and 100 mg/kg administered groups showed a significant reduction in tumor cell volume and a significant increase in the number of apoptotic cells, compared with the gefitinib single administered group (p<0.01) (Table 10 and FIG. 10).
TABLE-US-00010 TABLE 10 Tumor Percentage Percentage of immune-responsive cells cell of (%/tumor cells) volume apoptotic Caspase- group (%/mm.sup.2) cells (%) 3 PARP COX-2 iNOS TNF-.alpha. Control group TB 79.27 .+-. 7.56 .+-. 11.01 .+-. 14.52 .+-. 59.83 .+-. 12.13 .+-. 7.76 .+-. 8.85 3.59 2.81 6.32 10.29 4.23 1.66 Single material administered group Gefitinib 56.28 .+-. 49.88 .+-. 40.60 .+-. 46.98 .+-. 38.89 .+-. 12.07 .+-. 7.28 .+-. 7.19.sup.a 8.53.sup.a 11.72.sup.d 10.22.sup.a 5.69.sup.d 5.40 2.74 SKOG 66.24 .+-. 30.82 .+-. 28.77 .+-. 35.84 .+-. 39.01 .+-. 37.16 .+-. 37.05 .+-. 5.75.sup.a 5.08.sup.a 6.58.sup.df 10.63.sup.ac 13.59.sup.d 10.24.sup.ab 11.47.sup.de Gefitinib and SKOG co-administered group (within 5 min) 400 29.13 .+-. 86.63 .+-. 75.42 .+-. 86.29 .+-. 11.88 .+-. 74.13 .+-. 62.21 .+-. mg/kg 8.75.sup.ab 7.29.sup.ab 10.45.sup.de 5.22.sup.ab 2.99.sup.de 10.12.sup.ab 17.33.sup.de 200 38.59 .+-. 75.19 .+-. 67.61 .+-. 73.59 .+-. 20.69 .+-. 63.79 .+-. 54.51 .+-. mg/kg 7.28.sup.ab 8.18.sup.ab 12.98.sup.de 10.57.sup.ab 5.09.sup.de 11.92.sup.ab 12.48.sup.de 100 45.75 .+-. 65.37 .+-. 56.78 .+-. 62.96 .+-. 28.77 .+-. 41.65 .+-. 41.97 .+-. mg/kg 5.23.sup.ab 10.60.sup.ab 9.36.sup.df 7.65.sup.ab 7.32.sup.df 11.51.sup.ab 13.30.sup.de
[0187] All the administered groups including the SKOG 400 mg/kg single administered group showed significant increases in intratumoral caspase-3 and PARP immune response cells compared with the tumor xenograft control group (p<0.01). Especially, the GSK 400, 200, and 100 mg/kg administered groups showed significant increases in the numbers of caspase-3 and PARP immune response cells compared with the gefitinib single administered group (p<0.01 or p<0.05) (Table 10 and FIGS. 11 and 12). The SKOG 400 mg/kg single group or the GSK 400, 200, and 100 mg/kg administered groups showed significant increase in the numbers of intratumoral iNOS and TNF-.alpha. immune response cells and a significant reduction in the number of COX-2 immune response cells compared with the tumor xenograft control group (p<0.01). Especially, the GSK 400, 200, and 100 mg/kg administered groups showed significant increases in the numbers of iNOS and TNF-.alpha. immune response cells (p<0.01) and a significant reduction in the number of COX-2 immune response cells (p<0.05) compared with the gefitinib single administered group. The gefitinib 120 mg/kg single composition administered group showed a significant reduction in the number of COX-2 immune response cells (p<0.01) but showed no significant changes in the numbers of iNOS and TNF-.alpha. immune response cells compared with the tumor xenograft control group (Table 10 and FIGS. 13 to 15).
[0188] As for the proportion of tumor cells in the tumor tissue, the gefitinib 120 mg/kg and SKOG 400 mg/kg single administered groups and the GSK 400, 200, and 100 mg/kg administered groups showed changes of -29.01, -16.44, -63.26, -51.32, and -42.29% compared with the tumor xenograft control group, respectively.
[0189] As for the proportion of apoptotic cells in the tumor tissue, the gefitinib 120 mg/kg and SKOG 400 mg/kg single administered groups and the GSK 400, 200, and 100 mg/kg administered groups showed changes of 560.23, 307.89, 1046.61, 895.25, and 765.22% compared with the tumor xenograft control group, respectively.
[0190] As for the proportion of caspase-3 immune response cells in the tumor tissue, the gefitinib 120 mg/kg and SKOG 400 mg/kg single administered groups and the GSK 400, 200, and 100 mg/kg administered groups showed changes of 268.77, 161.29, 585.11, 514.17, and 415.79% compared with the tumor xenograft control group, respectively.
[0191] As for the proportion of PARP immune response cells in the tumor tissue, the gefitinib 120 mg/kg and SKOG 400 mg/kg single administered groups and the GSK 400, 200, and 100 mg/kg administered groups showed changes of 223.59, 146.88, 494.32, 406.88, and 333.67% compared with the tumor xenograft control group, respectively.
[0192] As for the proportion of COX-2 immune response cells in the tumor tissue, the gefitinib 120 mg/kg and SKOG 400 mg/kg single administered groups and the GSK 400, 200, and 100 mg/kg administered groups showed changes of -35.00, -34.80, -80.15, -65.41, and -51.92% compared with the tumor xenograft control group, respectively.
[0193] As for the proportion of iNOS immune response cells in the tumor tissue, the gefitinib 120 mg/kg and SKOG 400 mg/kg single administered groups and the GSK 400, 200, and 100 mg/kg administered groups showed changes of -0.50, 206.23, 510.97, 425.71, and 243.25% compared with the tumor xenograft control group, respectively.
[0194] As for the proportion of TNF-.alpha. immune response cells in the tumor tissue, the gefitinib 120 mg/kg and SKOG 400 mg/kg single administered groups and the GSK 400, 200, and 100 mg/kg administered groups showed changes of -6.19, 377.65, 702.00, 602.72, and 441.11% compared with the tumor xenograft control group, respectively.
[0195] (2) Histopathological Change of Spleen
[0196] The tumor xenograft control group showed atrophy characterized by a remarkable reduction in lymphocytes in the splenic white pulp portion compared with the normal medium control group, resulting in significant reductions in splenic thickness, white pulp diameter, and the number of white pulps (p<0.01). It was histopathologically confirmed that the SKOG 400 mg/kg single administered group and the GSK 400, 200, and 100 mg/kg administered groups showed significant increases in splenic thickness, white pulp diameter, and the number of white pulps compared with the tumor xenograft control group (p<0.01), and especially the SKOG 400 mg/kg single group and the GSK 400, 200, and 100 mg/kg administered groups showed significant increases in splenic thickness, white pulp diameter, and the number of white pulps compared with the gefitinib single administered group (p<0.01). The gefitinib single administered group showed similar changes in splenic thickness, white pulp diameter, and the number of white pulps compared with the tumor xenograft control group (Table 11 and FIG. 16).
TABLE-US-00011 TABLE 11 Splenic Number of Splenic white overall thickness splenic white pulp diameter Group (mm/central region) pulps (/mm.sup.2) (.mu.m/white pulp) Conrol group Intact 1749.75 .+-. 190.38 14.75 .+-. 2.92.sup. 645.75 .+-. 127.16 TB 989. 25 .+-. 135.20.sup.a 4.88 .+-. 1.13.sup.a 188.75 .+-. 69.98.sup.e Single material administered group Gefitinib 993.38 .+-. 131.85.sup.a 4.63 .+-. 1.85.sup.a 187.63 .+-. 73.54.sup.e SKOG 1281.50 .+-. 123.37.sup.acd .sup. 8.25 .+-. 1.67.sup.acd 323.00 .+-. 66.08.sup.efg Gefitinib and SKOG co-administered group (wtihin 5 min) 400 mg/kg 1489.75 .+-. 136.36.sup.acd 13.88 .+-. 2.64.sup.cd 449.50 .+-. 38.91.sup.efg 200 mg/kg 1340.38 .+-. 77940.sup.acd 12.75 .+-. 1.28.sup.bcd 404.75 .+-. 50.76.sup.efg 100 mg/kg 1276.13 .+-. 201.59.sup.acd .sup. 8.63 .+-. 1.30.sup.acd 352.50 .+-. 75.45.sup.efg
[0197] As for the splenic overall thickness, the tumor xenograft control group showed a change of -43.46% compared with the normal medium control group, and the gefitinib 120 mg/kg and SKOG 400 mg/kg single administered groups and the GSK 400, 200, and 100 mg/kg administered groups showed changes of 0.42, 29.54, 50.59, 35.49, and 29.00% compared with the tumor xenograft control group, respectively.
[0198] As for the number of splenic white pulps, the tumor xenograft control group showed a change of -66.95% compared with the normal medium control group, and the gefitinib 120 mg/kg and SKOG 400 mg/kg single administered groups and the GSK 400, 200, and 100 mg/kg administered groups showed changes of -5.13, 69.23, 184.62, 161.54, and 76.92% compared with the tumor xenograft control group, respectively.
[0199] As for the splenic white pulp diameter, the tumor xenograft control group showed a change of -70.77% compared with the normal medium control group, and the gefitinib 120 mg/kg and SKOG 400 mg/kg single administered groups and the GSK 400, 200, and 100 mg/kg administered groups showed changes of -0.60, 71.13, 138.15, 114.44, and 86.75% compared with the tumor xenograft control group, respectively.
[0200] (3) Histopathological Change of Submandibular Lymph Nodes
[0201] The tumor xenograft control group showed atrophy due to a remarkable reduction in lymphocytes in the lymph node cortex compared with the normal medium control group, resulting in significant reductions in submandibular lymph node overall and cortex thicknesses and number of intracortical follicles (p<0.01). However, the SKOG 400 mg/kg single administered group and the GSK 400, 200, and 100 mg/kg administered groups showed histopathologically significant increases in lymph node overall and cortex thicknesses and number of intracortical follicles compared with the tumor xenograft control group (p<0.01). Especially, the GSK 400, 200, and 100 mg/kg administered groups showed significant increases in lymph node overall and cortex thicknesses and number of intracortical follicles compared with the gefitinib single administered group (p<0.01). The gefitinib single administered group showed no significant changes in lymph node overall and cortex thicknesses and number of intracortical follicles compared with the tumor xenograft control group (Table 12 and FIG. 17).
TABLE-US-00012 TABLE 12 submandibular lymph Number of node overall thickness intracortical cortex thickness Group (.mu.m/central region) follicles (/mm.sup.2) (.mu.m/lymph node) Control group Intact 1127.63 .+-. 131.38 16.00 .+-. 3.93 .sup. 540.50 .+-. 113.31 TB 514.63 .+-. 101.14.sup.a 5.75 .+-. 1.28.sup.d 224.38 .+-. 41.00.sup.d Single material administered group Gefitinib 501.50 .+-. 106.64.sup.a 5.38 .+-. 2.39.sup.d 215.75 .+-. 43.93.sup.d SKOG 744.00 .+-. 111.81.sup.abc .sup. 8.63 .+-. 1.30.sup.dfg 306.88 .+-. 25.76.sup.dfg Gefitinib and SKOG co-administered group (wtihin 5 min) 400 mg/kg 843.50 .+-. 113.09.sup.abc 13.00 .+-. 2.73.sup.fg 423.25 .+-. 46.48.sup.efg 200 mg/kg 868.63 .+-. 113.53.sup.abc .sup. 10.50 .+-. 1.93.sup.dfg 380.75 .+-. 43.65.sup.dfg 100 mg/kg 727.51 .+-. 103.85.sup.abc .sup. 8.88 .+-. 1.25.sup.dfg 328.38 .+-. 49.75.sup.dfg
[0202] As for the submandibular lymph node overall thickness, the tumor xenograft control group showed a change of -54.36% compared with the normal medium control group, and the 120 mg/kg and SKOG 400 mg/kg single administered groups and the GSK 400, 200, and 100 mg/kg administered groups showed changes of -2.55, 44.57, 63.91, 49.36, and 41.37%, respectively, compared with the tumor xenograft control group.
[0203] As for the number of intracortical follicles in the submandibular lymph nodes, the tumor xenograft control group showed a change of -64.06% compared with the normal medium control group, and the gefitinib 120 mg/kg and SKOG 400 mg/kg single administered groups and the GSK 400, 200, and 100 mg/kg administered groups showed changes of -6.52, 50.00, 126.09, 82.61, and 54.35%, respectively, compared with the tumor xenograft control group.
[0204] As for the submandibular lymph node cortex thickness, the tumor xenograft control group showed a change of -58.490 compared with the normal medium control group, and the 120 mg/kg and SKOG 400 mg/kg single administered groups and the GSK 400, 200, and 100 mg/kg administered groups showed changes of -3.84, 36.77, 88.64, 69.69, and 46.35%, respectively, compared with the tumor xenograft control group.
[0205] (4) Histopathological Change of Periovarian Fat
[0206] The tumor xenograft control group showed atrophy characterized by a remarkable reduction in white fat cell size compared with the normal medium control group, resulting in significant reductions in accumulation fat thickness and white fat cell average diameter (p<0.01). The SKOG 400 mg/kg single administered group and the GSK 400, 200, and 100 mg/kg administered groups showed histopathologically significant increases in accumulation fat thickness and white fat cell average diameter compared with the tumor xenograft control group, respectively (p<0.01), and especially, the GSK 400, 200, and 100 mg/kg administered groups showed significant increases in accumulation fat thickness and white fat cell average diameter compared with the gefitinib single administered group (p<0.01). The gefitinib single administered group showed similar changes in periovarian accumulation fat tissue thickness and white fat cell average diameter compared with the tumor xenograft control group (Table 13 and FIG. 18).
TABLE-US-00013 TABLE 13 Accumulation fat White fat cell thickness average diameter Group (mm/central regions) (.mu.m) Control group Intact 1752.13 .+-. 201.31 52.11 .+-. 5.21 .sup. TB 409.25 .+-. 103.05.sup.a 13.20 .+-. 2.61.sup.d Single material administered group Gefitinib 375.75 .+-. 91.45.sup.a 12.36 .+-. 1.95.sup.d SKOG 650.00 .+-. 121.29.sup.abc 21.85 .+-. 3.14.sup.def Gefitinib and SKOG co-administered group (within 5 min) 400 mg/kg 1453.00 .+-. 192.34.sup.abc 37.95 .+-. 10.89.sup.def 200 mg/kg 1096.00 .+-. 128.90.sup.abc 32.51 .+-. 11.42.sup.def 100 mg/kg 965.00 .+-. 192.82.sup.abc 25.10 .+-. 6.62.sup.def
[0207] As for the periovarian accumulation fat thickness, the tumor xenograft control group showed a change of -76.64% compared with the normal medium control group, and the gefitinib 120 mg/kg and SKOG 400 mg/kg single administered groups and the GSK 400, 200, and 100 mg/kg administered groups showed changes of -8.19, 58.83, 255.04, 167.81, and 135.80%, respectively, compared with the tumor xenograft control group.
[0208] As for the white fat cell average diameter, the tumor xenograft control group showed a change of -74.67% compared with the normal medium control group, and the gefitinib 120 mg/kg and SKOG 400 mg/kg single administered groups and the GSK 400, 200, and 100 mg/kg administered groups showed changes of -6.37, 68.51, 187.53, 146.30, and 90.11%, respectively, compared with the tumor xenograft control group.
* * * * *
D00000
D00001
D00002
D00003
D00004
D00005
D00006
D00007
D00008
D00009
D00010
D00011
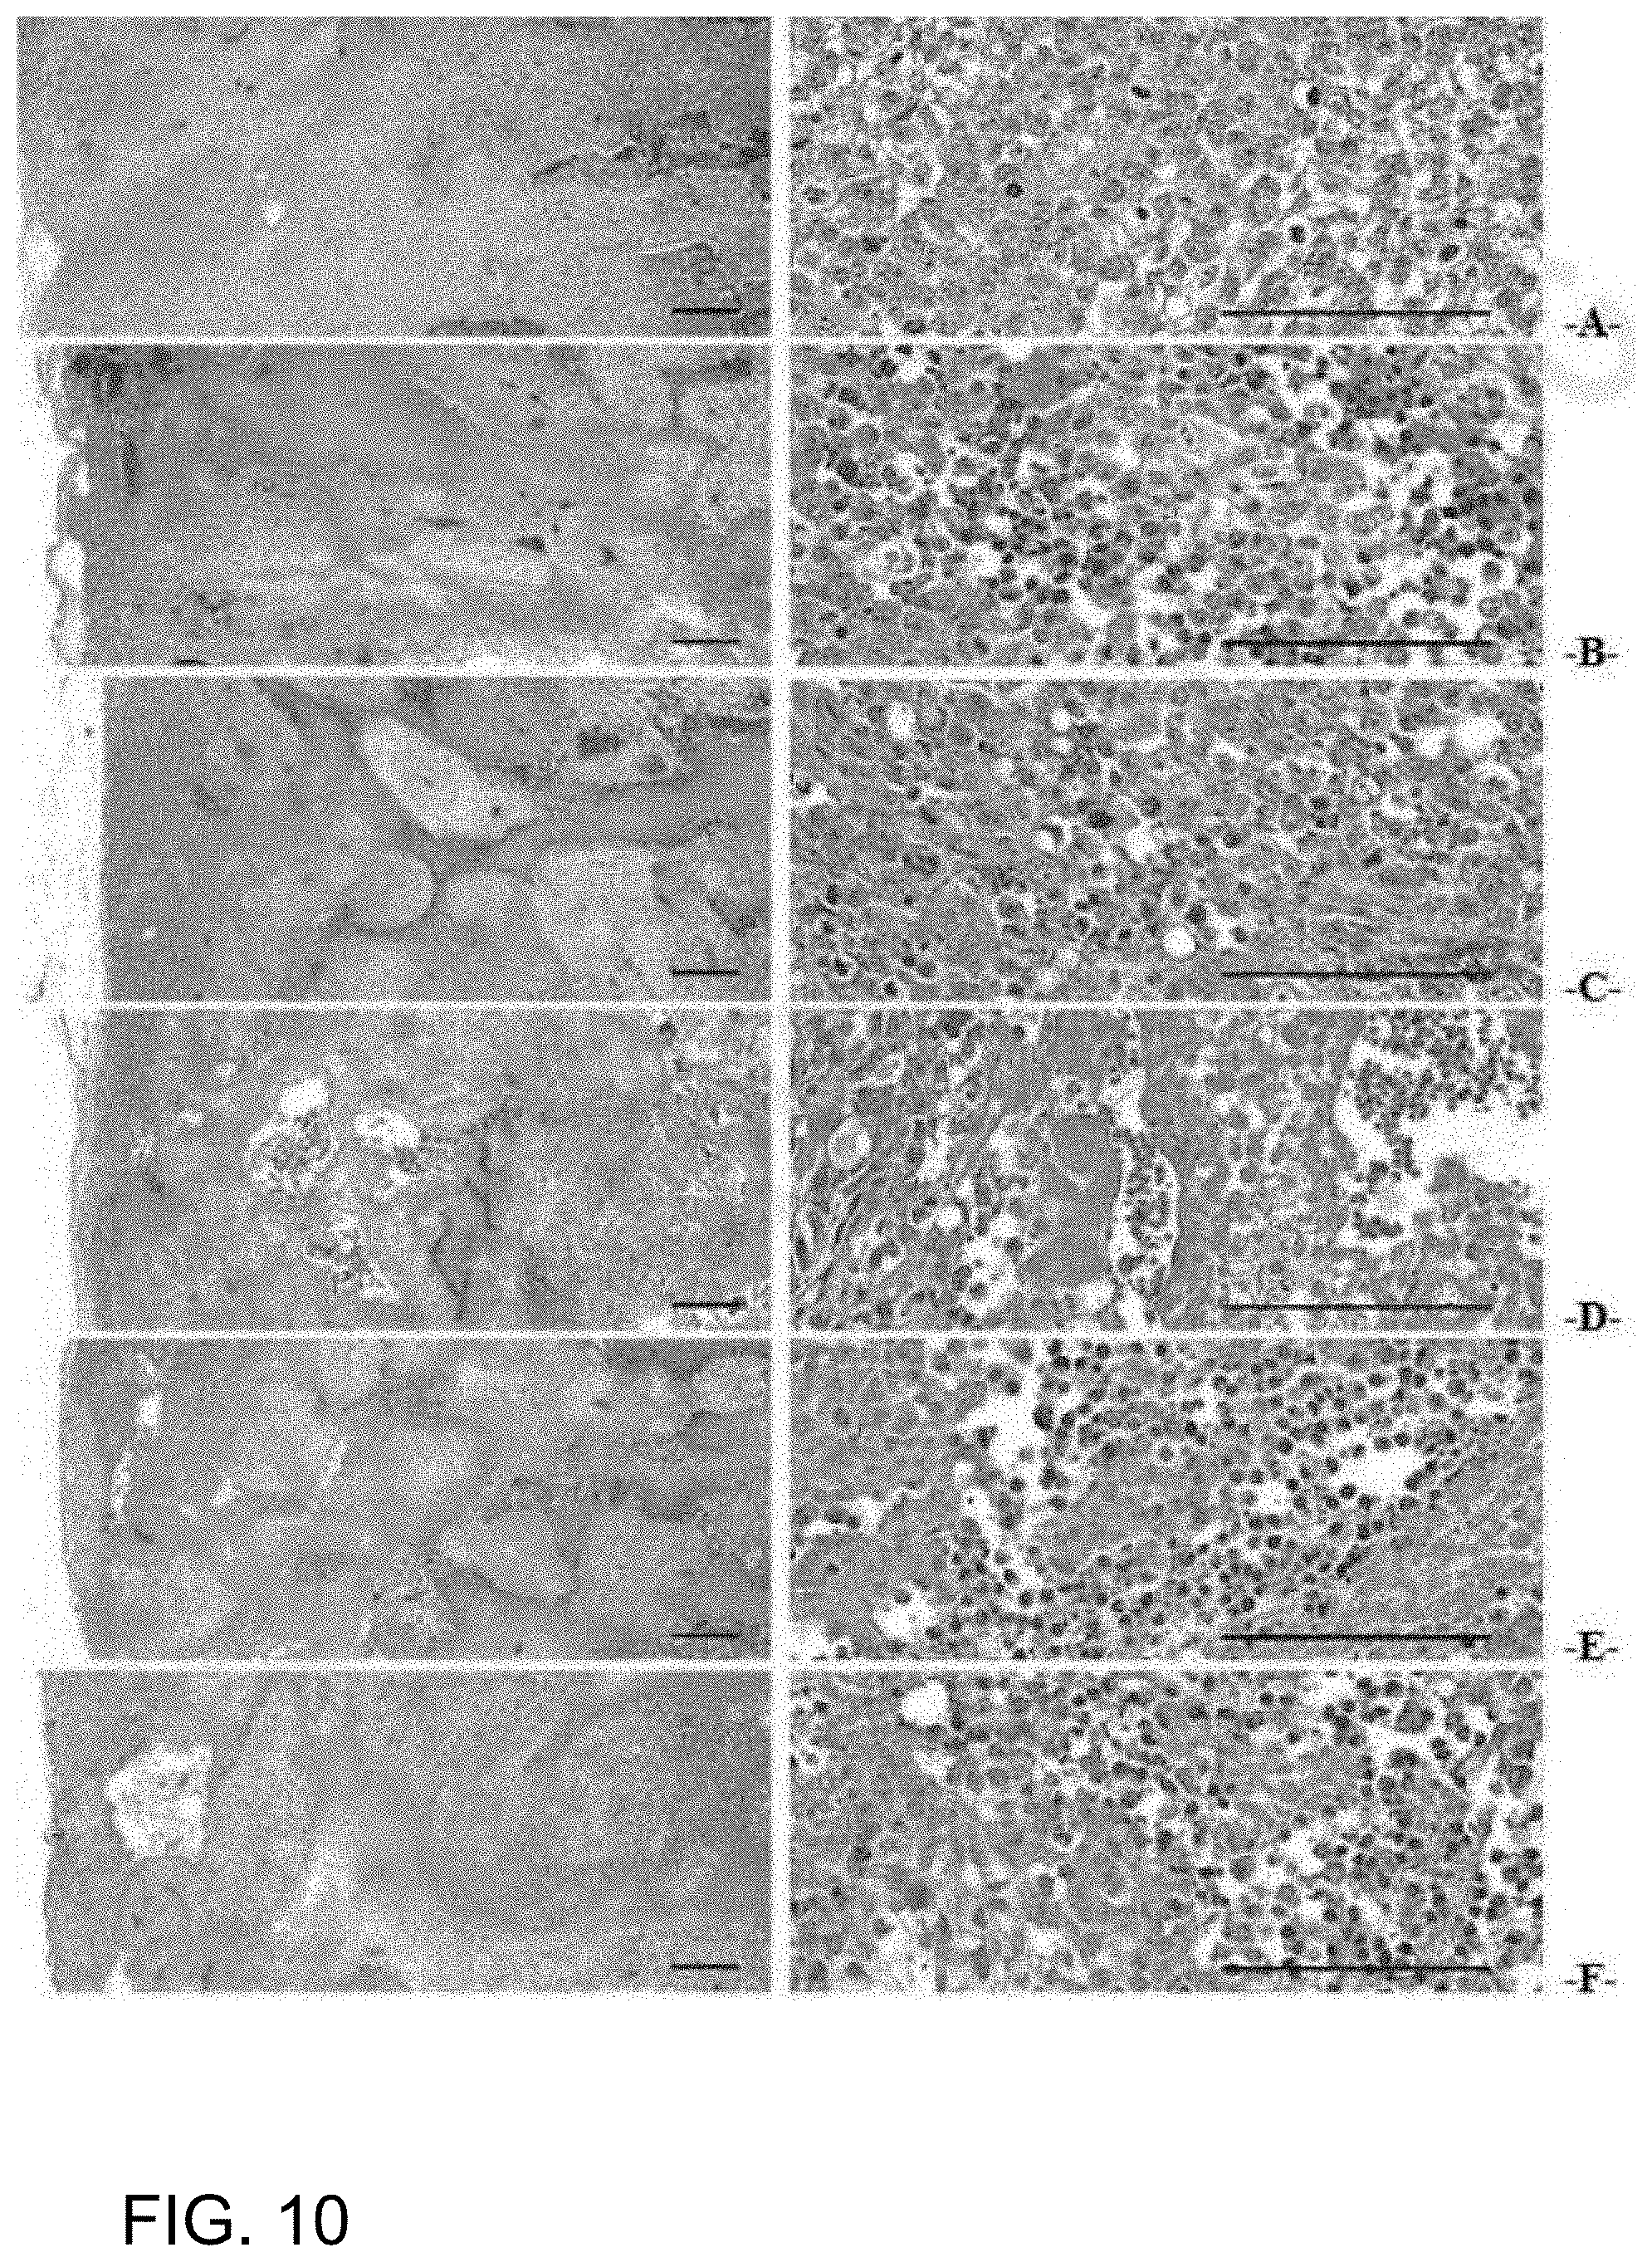
D00012

D00013

D00014

D00015

D00016

D00017

D00018

D00019
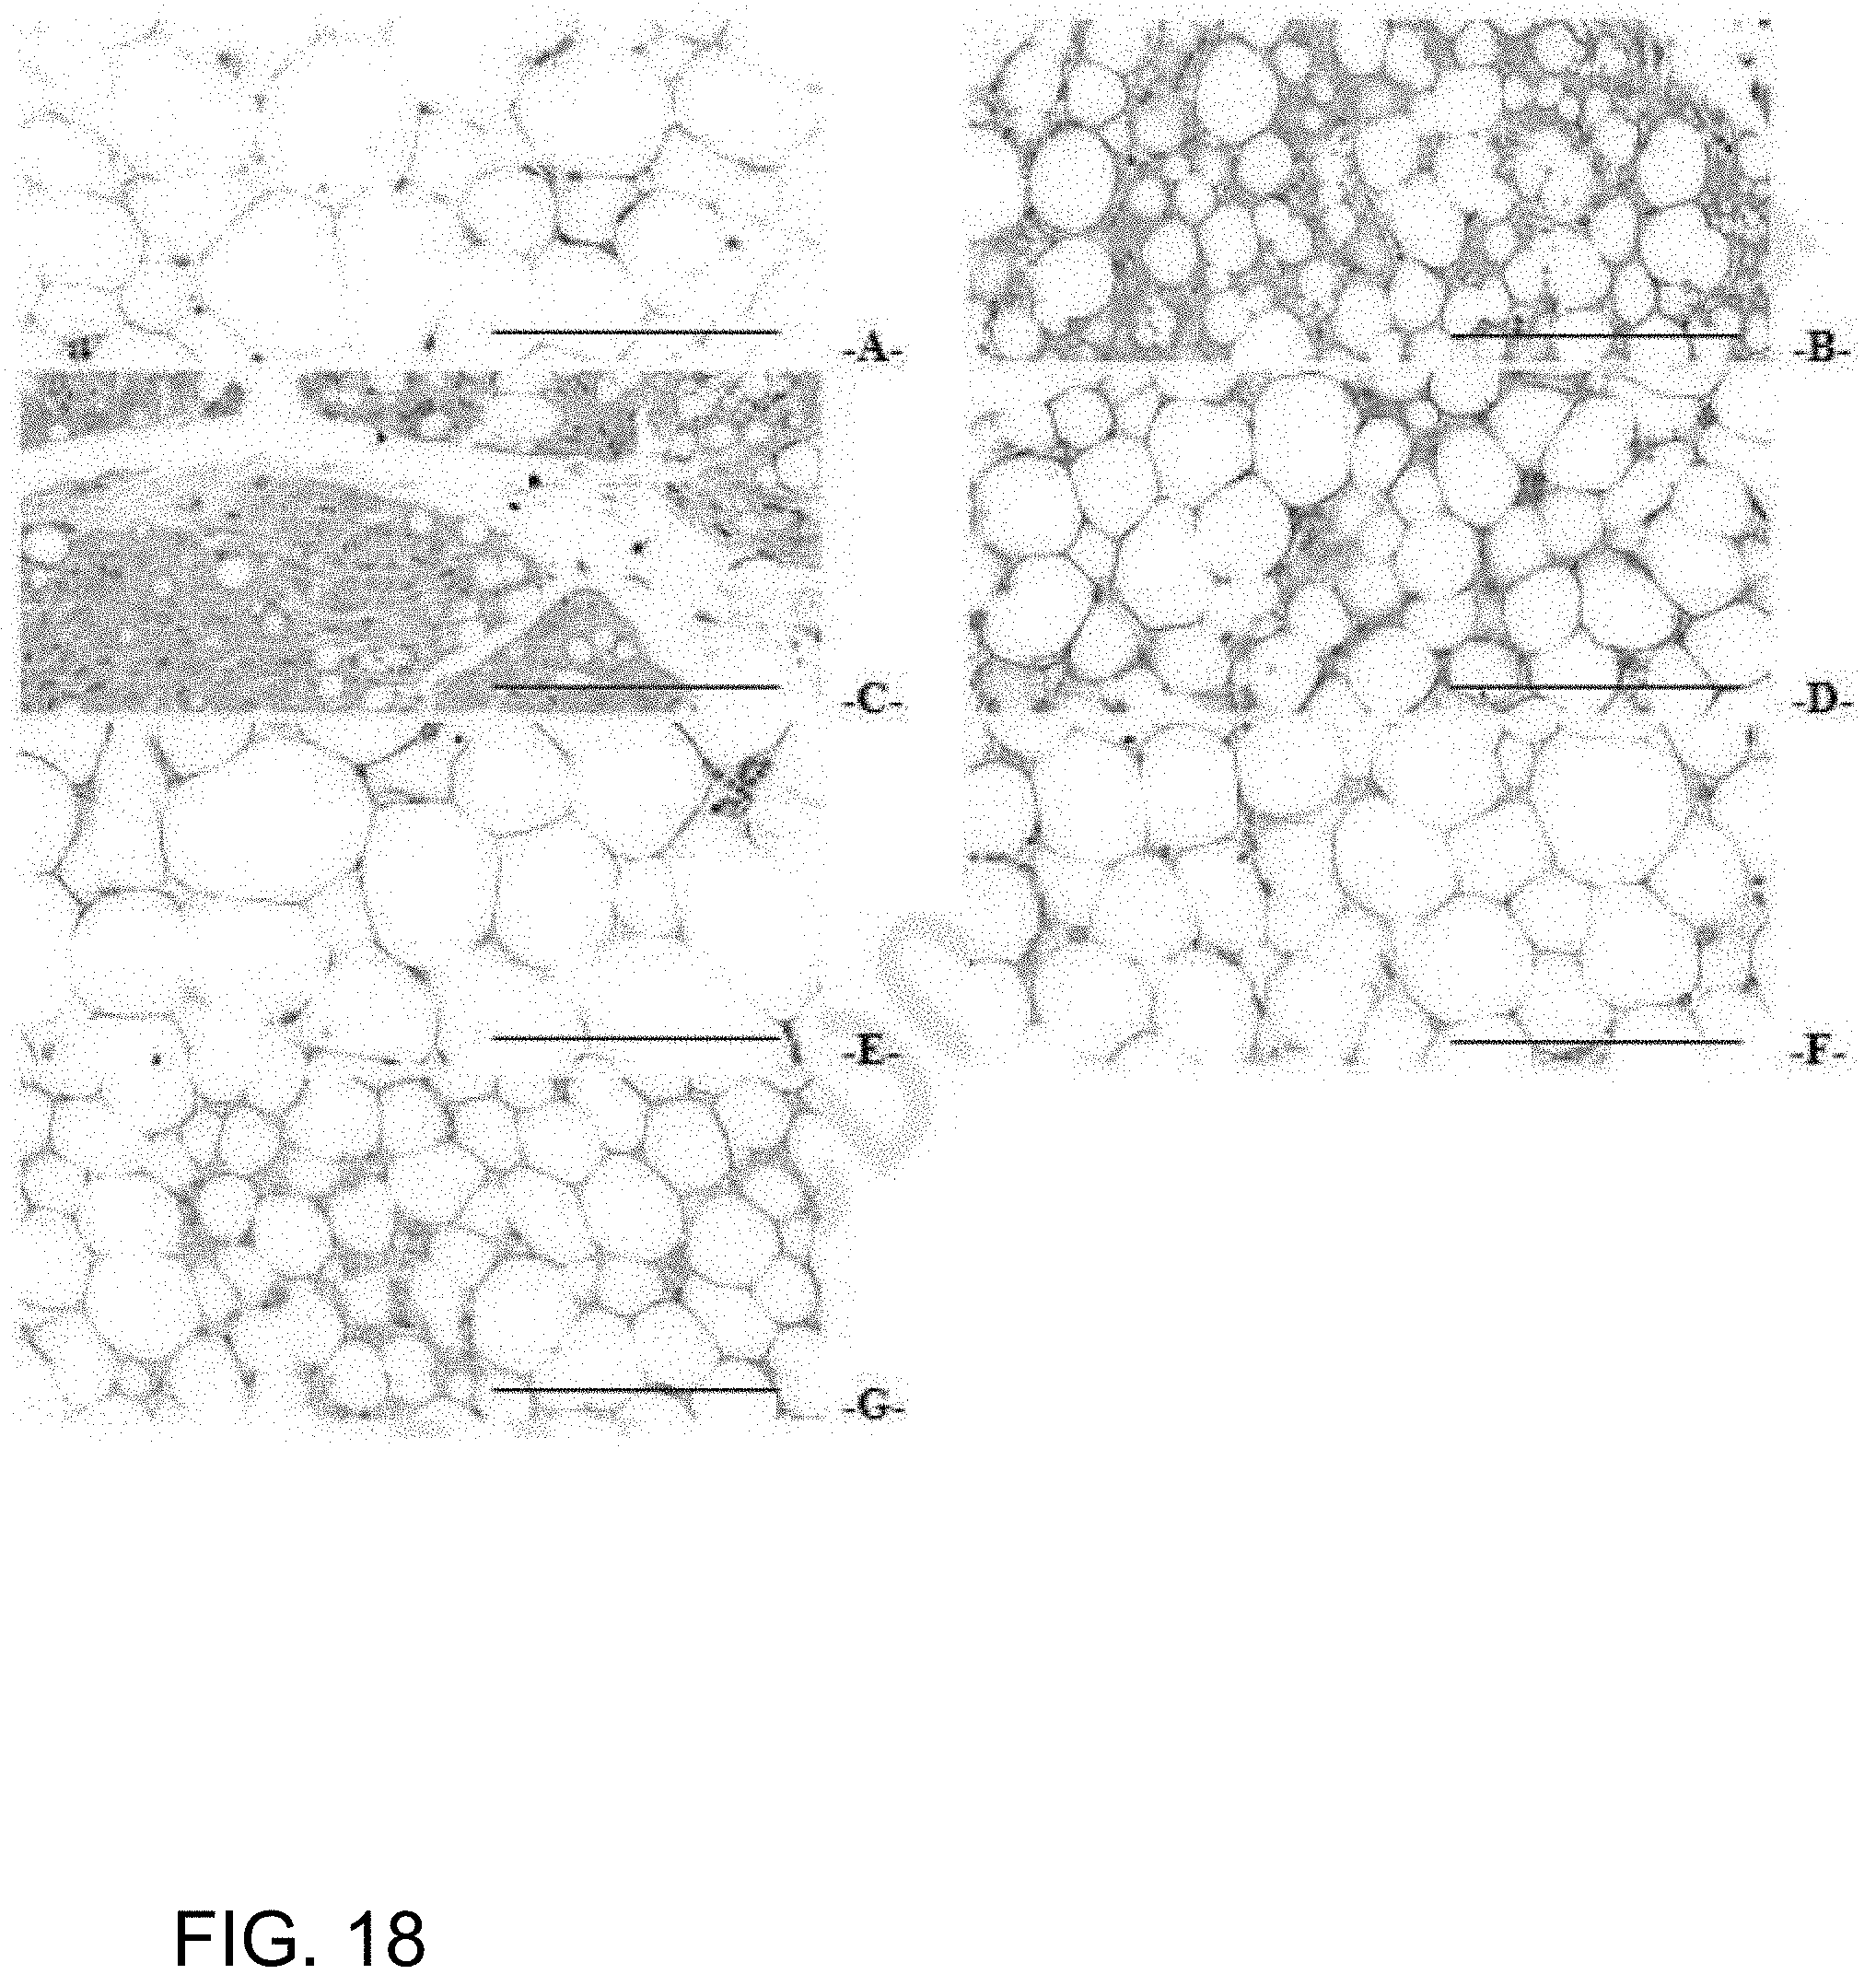
XML
uspto.report is an independent third-party trademark research tool that is not affiliated, endorsed, or sponsored by the United States Patent and Trademark Office (USPTO) or any other governmental organization. The information provided by uspto.report is based on publicly available data at the time of writing and is intended for informational purposes only.
While we strive to provide accurate and up-to-date information, we do not guarantee the accuracy, completeness, reliability, or suitability of the information displayed on this site. The use of this site is at your own risk. Any reliance you place on such information is therefore strictly at your own risk.
All official trademark data, including owner information, should be verified by visiting the official USPTO website at www.uspto.gov. This site is not intended to replace professional legal advice and should not be used as a substitute for consulting with a legal professional who is knowledgeable about trademark law.