Valuation System
Flint; Pete ; et al.
U.S. patent application number 16/449210 was filed with the patent office on 2019-11-21 for valuation system. The applicant listed for this patent is Trulia, LLC. Invention is credited to Jesper Sparre Andersen, Pete Flint, Sami Inkinen.
| Application Number | 20190355026 16/449210 |
| Document ID | / |
| Family ID | 67543574 |
| Filed Date | 2019-11-21 |


View All Diagrams
| United States Patent Application | 20190355026 |
| Kind Code | A1 |
| Flint; Pete ; et al. | November 21, 2019 |
VALUATION SYSTEM
Abstract
Estimating a valuation of a target property is disclosed, including receiving user-generated data regarding one or more properties associated with the target property, processing the user-provided data using one or more data models that are configured to process the user-provided data, and combining the output of the one or more data models to obtain an estimated valuation of the target property.
| Inventors: | Flint; Pete; (San Francisco, CA) ; Andersen; Jesper Sparre; (San Francisco, CA) ; Inkinen; Sami; (San Francisco, CA) | ||||||||||
| Applicant: |
|
||||||||||
|---|---|---|---|---|---|---|---|---|---|---|---|
| Family ID: | 67543574 | ||||||||||
| Appl. No.: | 16/449210 | ||||||||||
| Filed: | June 21, 2019 |
Related U.S. Patent Documents
| Application Number | Filing Date | Patent Number | ||
|---|---|---|---|---|
| 12924037 | Sep 16, 2010 | 10380653 | ||
| 16449210 | ||||
| Current U.S. Class: | 1/1 |
| Current CPC Class: | G06Q 30/0278 20130101 |
| International Class: | G06Q 30/02 20060101 G06Q030/02 |
Claims
1-20. (canceled)
21. A method for estimating a valuation of a target property, comprising: receiving user traffic activity information concerning property information included in a real estate website, wherein the user traffic activity comprises information referencing a first set of users each of whom has accessed a property web page for the target property; using the user traffic activity to select, by one or more processors, a set of comparable properties, other than the target property, whose property web pages were each accessed by at least a threshold number of users in the first set of users; retrieving, from a memory, property data regarding the selected set of comparable properties; processing, using the one or more processors, the property data regarding the selected set of comparable properties using a data model to obtain a valuation of the target property; and causing the obtained valuation of the target property to be displayed.
22. The method as recited in claim 21, wherein the user traffic activity comprises user click patterns, browsing habits/history, or both.
23. The method as recited in claim 21, further comprising: receiving thumb up/down data regarding the target property, wherein the thumb up/down data comprises a user agreement or disagreement with an estimated value of the target property.
24. The method as recited in claim 21, further comprising; processing fact-based data and user-generated data using a data model to obtain a second estimated valuation of the target property, wherein the fact-based data comprises data not based on user activity or user input, and wherein the user-generated data comprises user reviews received on a web page of a neighborhood of the target property from a second set of users, and wherein the user reviews concern a set of categories regarding the neighborhood of the target property; and combining the second estimated valuation of the target property and the obtained valuation of the target property to obtain a revised valuation of the target property.
25. The method as recited in claim 21, wherein selecting the group of comparable properties using the user traffic activity comprises calculating a similarity between the target property and each of the selected set of comparable properties.
26. The method as recited in claim 21, further comprising: providing, at a user interface, a plurality of individually selectable contributing factors each of which is associated with the target property, wherein the plurality of individually selectable contributing factors include one or more of: property data, property improvement data, or comparable property data; receiving from a user, a selection of a subset of the contributing factors from the provided plurality of individually selectable contributing factors; receiving from the user, data associated with each contributing factor in the selected subset of contributing factors; processing the received data associated with each contributing factor using a data model associated with the contributing factors to obtain a contributing factor valuation corresponding to the contributing factor; combining the obtained contributing factor valuations for the contributing factors in the selected subset of contributing factors to obtain a collective estimated contributing factor valuation of the target property; and combining the obtained valuation of the target property and the obtained collective estimated contributing factor valuation of the target property to obtain revised valuation of the target property.
27. The method as recited in claim 26, wherein the combining of the obtained contributing factor valuations is based on a weighted average of the obtained contributing factor valuations for the contributing factors in the selected subset of contributing factors.
28. The method as recited in claim 26, wherein receiving the selection of the subset of the contributing factors comprises receiving an indication that the user has edited data associated with the subset of contributing factors.
29. The method as recited in claim 21, wherein the user traffic activity information comprises a popularity of the target property based on an amount of traffic the web page of the target property receives and a time on market of the target property.
30. The method as recited in claim 21, wherein the set of comparable properties is further identified by determining a present value of at least one of the set of comparable properties.
31. The method as recited in claim 21, wherein the obtained valuation of the target property is displayed only to an owner of the target property.
32. A computer program product for estimating a valuation of a target property, the computer program product being embodied in a computer readable medium and comprising computer instructions for: receiving user traffic activity information concerning property information included in a real estate website, wherein the user traffic activity comprises information referencing a first set of users each of whom has accessed a property web page for the target property; using the user traffic activity to select, by one or more processors, a set of comparable properties, other than the target property, whose property web pages were each accessed by at least a threshold number of users in the first set of users; retrieving, from a memory, property data regarding the selected set of comparable properties; processing, using the one or more processors, the property data regarding the selected set of comparable properties using a data model to obtain a valuation of the target property; and causing the obtained valuation of the target property to be displayed.
33. The computer program product as recited in claim 32, wherein the user traffic activity comprises user click patterns, browsing habits/history, or both.
34. The computer program product as recited in claim 32, wherein the computer instructions are further for: receiving thumb up/down data regarding the target property, wherein the thumb up/down data comprises a user agreement or disagreement with an estimated value of the target property.
35. The computer program product as recited in claim 32, wherein the computer instructions are further for: processing fact-based data and user-generated data using a data model to obtain a second estimated valuation of the target property, wherein the fact-based data comprises data not based on user activity or user input, and wherein the user-generated data comprises user reviews received on a web page of a neighborhood of the target property from a second set of users, and wherein the user reviews concern a set of categories regarding the neighborhood of the target property; and combining the second estimated valuation of the target property and the obtained valuation of the target property to obtain a revised valuation of the target property.
36. The computer program product as recited in claim 32, wherein selecting the group of comparable properties using the user traffic activity comprises calculating a similarity between the target property and each of the selected set of comparable properties.
37. The computer program product as recited in claim 32, wherein the computer instructions are further for: providing, at a user interface, a plurality of individually selectable contributing factors each of which is associated with the target property, wherein the plurality of individually selectable contributing factors include one or more of: property data, property improvement data, or comparable property data; receiving from a user, a selection of a subset of the contributing factors from the provided plurality of individually selectable contributing factors; receiving from the user, data associated with each contributing factor in the selected subset of contributing factors; processing the received data associated with each contributing factor using a data model associated with the contributing factors to obtain a contributing factor valuation corresponding to the contributing factor; combining the obtained contributing factor valuations for the contributing factors in the selected subset of contributing factors to obtain a collective estimated contributing factor valuation of the target property; and combining the obtained valuation of the target property and the obtained collective estimated contributing factor valuation of the target property to obtain revised valuation of the target property.
38. The computer program product as recited in claim 32, wherein the user traffic activity information comprises a popularity of the target property based on an amount of traffic the web page of the target property receives and a time on market of the target property.
39. The computer program product as recited in claim 32, wherein the set of comparable properties is further identified by determining a present value of at least one of the set of comparable properties.
40. A valuation system for estimating a valuation of a target property comprising a non-transitory computer-readable medium having instructions stored thereon, which when executed by one or more processors of the valuation system cause the valuation system to: receive user traffic activity information concerning property information included in a real estate website, wherein the user traffic activity comprises information referencing a first set of users each of whom has accessed a property web page for the target property; using the user traffic activity to select, by the one or more processors, a set of comparable properties, other than the target property, whose property web pages were each accessed by at least a threshold number of users in the first set of users; retrieve, from a memory, property data regarding the selected set of comparable properties: process, by the one or more processors, the property data regarding the selected set of comparable properties using a data model to obtain a valuation of the target property; and cause the obtained valuation of the target property to be displayed.
Description
BACKGROUND OF THE INVENTION
[0001] Real estate information has become widely available on real estate and other websites on the Internet. For example, a user may obtain information about properties for sale, neighborhoods, interest rates, recently sold homes, etc. Users (e.g., buyers and sellers of properties) of real estate websites are often interested in whether or when to buy or sell real estate property. Oftentimes the user is interested in learning about the value of the property. However, typical estimation techniques are based on a limited set of data and do not account for other factors that may significantly affect the valuation. In addition, the various factors that are used to come up with an estimate are typically opaque to the user. As such, improved techniques for estimating a valuation of a real estate property would be useful.
BRIEF DESCRIPTION OF THE DRAWINGS
[0002] Various embodiments of the invention are disclosed in the following detailed description and the accompanying drawings.
[0003] FIG. 1 is a block diagram illustrating an embodiment of an evaluation system for estimating a valuation of a target property.
[0004] FIG. 2 is a flow chart illustrating an embodiment of a process for estimating a valuation of a target property.
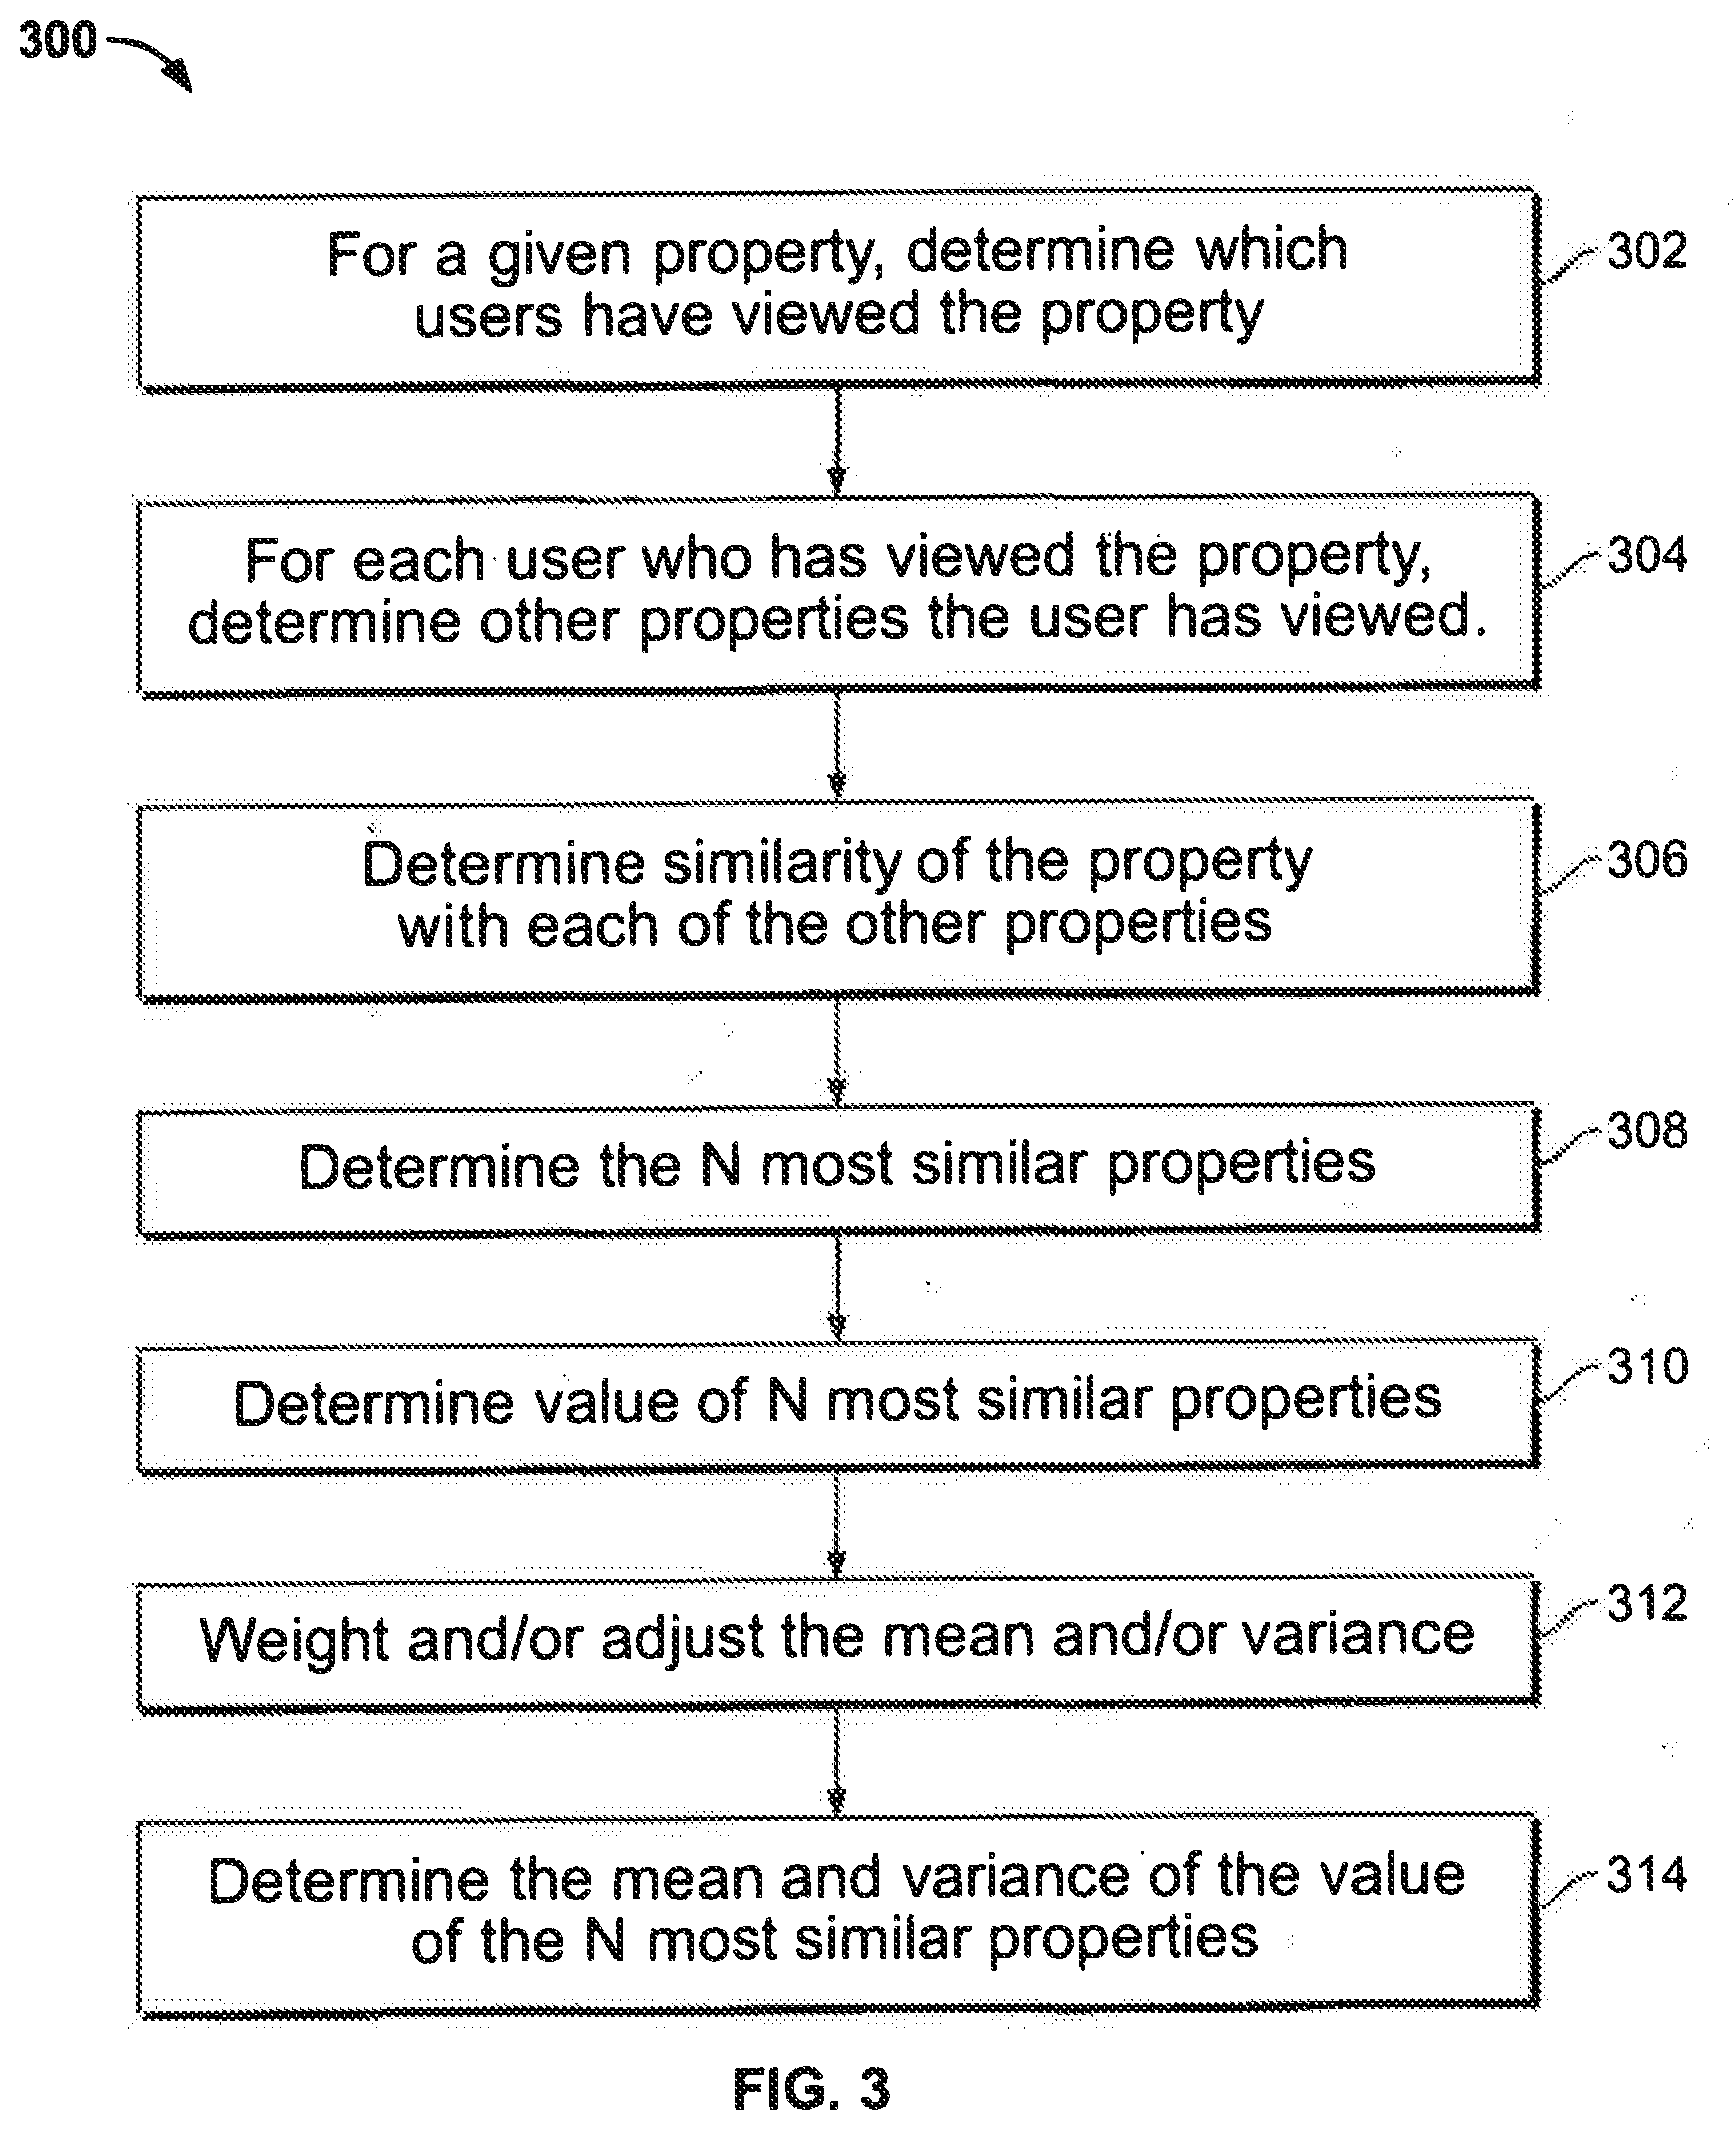
[0005] FIG. 3 is a flow chart illustrating an embodiment of a process for processing user-generated data using a data model.
[0006] FIG. 4 is a diagram illustrating an embodiment of an interface for viewing an estimated property valuation.
[0007] FIGS. 5A-B show a diagram illustrating an embodiment of an interface for adjusting an estimated property valuation.
[0008] FIG. 6 is a flow chart illustrating an embodiment of a process for estimating a valuation of a target property based on individually user-selectable contributing factors.
[0009] FIG. 7A-7B is a diagram illustrating an embodiment of an interface for displaying various data obtained based on an estimated property valuation(s).
[0010] FIG. 8 is a diagram illustrating an example of an interface for indicating comparable neighborhoods.
DETAILED DESCRIPTION
[0011] The invention can be implemented in numerous ways, including as a process; an apparatus; a system; a composition of matter; a computer program product embodied on a computer readable storage medium; and/or a processor, such as a processor configured to execute instructions stored on and/or provided by a memory coupled to the processor. In this specification, these implementations, or any other form that the invention may take, may be referred to as techniques. In general, the order of the steps of disclosed processes may be altered within the scope of the invention. Unless stated otherwise, a component such as a processor or a memory described as being configured to perform a task may be implemented as a general component that is temporarily configured to perform the task at a given time or a specific component that is manufactured to perform the task. As used herein, the term `processor` refers to one or more devices, circuits, and/or processing cores configured to process data, such as computer program instructions.
[0012] A detailed description of one or more embodiments of the invention is provided below along with accompanying figures that illustrate the principles of the invention. The invention is described in connection with such embodiments, but the invention is not limited to any embodiment. The scope of the invention is limited only by the claims and the invention encompasses numerous alternatives, modifications and equivalents. Numerous specific details are set forth in the following description in order to provide a thorough understanding of the invention. These details are provided for the purpose of example and the invention may be practiced according to the claims without some or all of these specific details. For the purpose of clarity, technical material that is known in the technical fields related to the invention has not been described in detail so that the invention is not unnecessarily obscured.
[0013] FIG. 1 is a block diagram illustrating an embodiment of an evaluation system for estimating a valuation of a target property, in this example, the target property is a real estate property of interest. However, in other embodiments, the target property may be any item for which an estimated valuation is desired, such as an automobile, a share of stock, etc.
[0014] In some embodiments, evaluation system 100 is part of a real estate website that provides real estate information to users. For example, users may be able to search for real estate properties, view information about properties, and request an estimated valuation of a property. In some embodiments, system 100 is used to provide the estimated valuation of a property. In some embodiments, system 100 processes and outputs the estimated valuation in response to a request from to view a page that displays the estimated valuation. In some embodiments, system 100 batch processes and stores estimated valuations for a plurality of properties and retrieves the estimated valuations as needed.
[0015] In this example, evaluation system 100 is shown to include a number of data inputs and corresponding data models, including: repeat sales 102, hedonics 104, tax assessment 106, sales/listing 108, comparables 110, comparable neighborhood ratings 112, local ratings/reviews 114, and thumbs up/down 116.
[0016] As used herein, user-generated or subjective data comprises data that is subjective to user(s), and is obtained based on user activity and/or user input. In some embodiments, the user activity and/or user input is associated with users of a real estate website that is configured to monitor at least a portion of user activity and receive input from users, such as ratings and reviews. In this example, user-generated data includes: comparables data, comparable neighborhood ratings data, local ratings/reviews data, and thumbs up/down data. Such data is fed into corresponding data models 110-116. User-generated data can include passively-provided or actively-provided user-generated data. Passively-provided user data is based on, for example, monitoring user activity or traffic (e.g., comparables data). Actively provided user data is based on, for example, data that the user explicitly types in or otherwise provides (e.g., ratings/reviews, thumbs up/down).
[0017] As used herein, fact-based data comprises objective data, e.g., data other than that based on user activity and/or user input. In this example, fact-based data includes repeat sales data, hedonics data, tax assessment data, and sale/listing ratio data. Such data is fed into corresponding data models 102.-108.
[0018] Data models 102-116 are configured to output statistical data (e.g., a mean and variance) associated with an estimated valuation of the target property. In some embodiments, data models 102-116 are independent ensemble data models. Aggregator 118 is configured to combine the various statistical outputs of each of the data models into a final estimated valuation. Aggregator 118 may used any appropriate technique in various embodiments. In some embodiments, aggregator 118 uses a perceptron--such as a neural net or other dynamic model. Weighted averages of the input models are created by the perceptron and could he obtained by training the perceptron using known input and output data. The weights would reflect how reliable each of the data models is in predicting the estimated value. In various embodiments, aggregator 118 may take a weighted average of the data model outputs, pick the data model output associated with the smallest standard deviation, average the data model outputs, randomly pick one data model output, etc. In some embodiments, the final estimated valuation is based at least in part on each of the various fact-based data and user generated data. In other embodiments the final estimated valuation is based on only user-generated data or a user-selected subset of the fact-based data and/or user-generated data, as will be more fully described below. In some embodiments, the user can weight the different types of data inputs, for example, using slider bars.
[0019] Repeat sales data is provided as input to data model 102 and comprises pairs of sales for the same property (or state, county, or zip code) over time. Repeat sales data can be used to compare the price of a single house (or a single neighborhood) against itself at different points in time.
[0020] Hedonic data is provided as input to data model 104 and includes constituent parts that each contribute to the estimated valuation. Examples of hedonic data includes number of bedrooms, number of bathrooms, overall rooms, number of stories, square footage, lot size, whether the property has a fireplace, pool, etc. A hedonic data model could assign a value to each of these parts based on the neighborhood in which the property is located and/or other factors.
[0021] Tax assessment data is provided as input to data model 106 and comprises what the property was last assessed at for tax purposes, typically by the county in which the property is located. Some counties skew the value high or low. A tax assessment data model could account for this and also determine the present value of the assessment based on the year of the last tax assessment.
[0022] Sales/listing ratio data is provided as input to data model 108 and comprises the ratio of an actual sales price to a listing sales price. Listing prices tend to be higher than actual sales prices, for example. A sales/listing ratio data model could adjust a list price to a more realistic sales price, for example.
[0023] These are only some examples of fact-based data. In other embodiments, other types of fact-based data and associated fact-based data models may be used.
[0024] Comparables data is provided as input to data model 110 and includes data that is used to determine comparable properties to the target property. In some embodiments, comparables data may be determined based on criteria specified by the user. For example, a list of criteria may be provided, and the user may checkmark the criteria the user would like used to determine comparables. In some embodiments, comparables data includes user activity (e.g., user traffic, user click patterns, and browsing habits/history). For example, user traffic (e.g., the amount of traffic a web page associated with a property receives) can be used to determine the popularity of a property. User traffic can be used with time on the market of a property to determine the popularity of the property. User click patterns (e.g., which pages a user clicks to view), can be used to indicate which properties are viewed by the same users. An example of how a comparables data model uses click patterns is more fully described below.
[0025] In some embodiments, adjusted comparables data is also used as input to data model 110. In some embodiments, adjusted comparables data includes the price difference between the property being evaluated and the medium or median valuation of comparable homes.
[0026] Comparable neighborhood ratings data is provided as input to data model 112 and includes data that is used to determine comparable neighborhoods to the neighborhood in which the property is located. As used herein, a neighborhood may comprise any geographical region, such as a polygon, a zip code, a city, a county, a state, etc. A neighborhood may be defined by a data provider, such as Maponics (www.maponics.com). Comparable neighborhood ratings data can be used to factor in the neighborhood into a property's estimated valuation. In some embodiments, comparable neighborhood ratings data includes user activity data. For example, user traffic (e.g., the amount of traffic web pages associated with properties in a neighborhood receives) can be used to determine the popularity of a neighborhood. User click patterns can be used to indicate which neighborhoods are viewed by the same users. In some embodiments, similar techniques to determine comparable properties can be used to determine comparable neighborhoods. FIG. 8 is a diagram illustrating an example of an interface for indicating comparable neighborhoods. In this example, locations that are determined to be comparable to a location of interest are listed and suggested. In this example, a location could be any appropriate location, such as an address, neighborhood, zip code, city, or state. In this example, locations are determined to be comparable based on user activity data, such as user click patterns. For example, the locations suggested may be other locations that users who have viewed the location of interest have also viewed most frequently.
[0027] Local ratings/reviews data is provided as input to data model 114 and is used to get a subjective opinion from users looking or living in the neighborhood. In some embodiments, ratings and/or reviews are collected for a set of categories, such as school quality, traffic, air quality, safety, crimes, walkability, restaurants and shopping, recreation, entertainment and nightlife, public transportation, community, cleanliness, etc. For example, users could provide a rating between 1-5 for each of these categories. A data model could use this data to determine an estimated value, giving treater weight to users who live in the neighborhood, for example.
[0028] Thumbs up/down is provided as input to data model 116 and is used by users to agree or disagree with data, such as a list price (or an estimated value). For example, a user might select "thumbs down" if a list price seems unreasonably high based on that user's knowledge. A data model could weight a professional (e.g., realtor, appraiser, etc.)'s opinion more than that of a consumer. In some embodiments, thumbs up/down can be used to agree/disagree with the estimated value, in which case, such data can be fed back into aggregator 118 to adjust the estimated valuation.
[0029] These are only some examples of user-generated data. In other embodiments other types of user-generated data and associated data models may be used.
[0030] In some embodiments, a data model might take as input both fact-based data and user-generated data. For example, a comparables data model might use both user click patterns and facts (e.g., square footage and number of bedrooms) to determine comparable properties.
[0031] FIG. 2 is a flow chart illustrating an embodiment of a process for estimating a valuation of a target property. In some embodiments, this process is performed by evaluation system 100.
[0032] In the example shown, at 202, user-generated data regarding one or more properties associated with the target property is received. For example, in system 100, comparables, comparable neighborhood ratings, local ratings/reviews, and thumbs up/down data are received.
[0033] At 204, fact-based data regarding one or more properties associated with the target property is retrieved. For example, such information could be retrieved from one or more external databases. For example, in system 100, repeat sales, hedonics, tax assessment, and sales/listing ratio data is retrieved.
[0034] The one or more properties at 202 and/or 204 could include, for example, the target property and comparable properties to the target properties. Comparable properties may be defined in various ways in various embodiments. For example, comparable properties could include other properties in a given vicinity of and/or in the same neighborhood as the target property. Comparable properties could be identified based at least in part on user-generated data, such as described above.
[0035] At 206, the user-generated data and fact-based data are processed using one or more data models that are configured to process the data. For example, in system 100, comparables, comparable neighborhood ratings, local ratings/reviews, and thumbs up, down data is processed by data models 110-116, each of which is configured to process one of these types of data. In other embodiments, a data model may be configured to process more than one type of data. In some embodiments, at least one of the data models is provided by a user. For example, a user may obtain or write a custom data model (e.g., a plug-in).
[0036] At 208, the outputs of the one or more data models are combined to obtain an estimated valuation of the target property. For example, in system 100, the outputs of data models 110-116 are combined by aggregator 118 to obtain an estimated valuation. As previously described, aggregator 118 may use any appropriate technique for combining, such as a perceptron or other neural network based technique.
[0037] FIG. 3 is a flow chart illustrating an embodiment of a process for processing user-generated data using a data model. In this example, the user-generated data is user activity data and the data model determines comparable properties to a target property and computes a mean and variance for those properties. For example, in system 100, comparables data model 110 may perform this process. Process 300 is merely an example of one way a data model might process user-generated data. In other embodiments, any of a variety of techniques may be used.
[0038] In the example shown, at 302, for a given property, it is determined which users have viewed the property. For example, if system 100 is part of a real estate website, it is determined which users of the real estate website have viewed the property. This may be done by parsing log files, for example. At 304, for each user who has viewed the property, other properties the user has viewed is determined. In some embodiments, the other properties are selected based on certain criteria, such as those within a certain neighborhood and that have been sold within a given time period. In some embodiments, other properties the user has viewed are only determined for those users who meet certain criteria, such as users who have identified themselves as prospective buyers.
[0039] At 306, a similarity of the property with each of the other properties determined at 304 is determined. For example, a covariance is computed between the pattern of user clicks on the property with that of each of the other properties. The property having the largest covariance with the target property is the most similar property. One method for approximating the covariance of the properties is the Tanimoto Distance:
T = AB 2 A 2 + B 2 - AB 2 ##EQU00001##
[0040] At 308, the N most similar properties are determined. For example, if N is 5, the five properties having the highest covariance of click patterns with the target property are determined. At 310, the value of the N most similar properties is determined. For example, the value may he the sales value brought up to a present value, or some estimated value according to a given definition. At 312, the values are optionally weighted or adjusted. For example, if there is a pool on one property, but not the others, that property value might he adjusted. Additionally, the present value of the property could be determined. For example, the property value might be adjusted based on sales trends since the date the property was last sold. A downward trend, for example, would bring the value down. At 314, the mean and variance of the values associated with the N most similar properties is determined.
[0041] In some embodiments, one or more of the most similar properties are recommended to a user viewing a web page associated with the target property. For example, a box with the text "Other recommended properties" may be displayed with one or more of the recommend properties listed,
[0042] In other embodiments, the technique that is used to determine similar properties to a target property can also be used to determine similar neighborhoods to a neighborhood in which a target property is located. This may be used to determine comparable neighborhoods by comparable neighborhood ratings data model 112, for example.
[0043] FIG. 4 is a diagram illustrating an embodiment of an interface for viewing an estimated property valuation. For example, this interface may be provided as part of a real estate website that allows users to search for and view properties. In this example interface, the property at 3785 16.sup.th St. San Francisco, Calif. 94114 is being displayed. "Trulia Home Value" indicates an estimated valuation of the property being viewed, in this case $1,845,000. In addition, the change from last month and an estimated value range are shown. A user may select the "Adjust home value" button to modify various contributing factors that go into the estimated valuation, as more fully described below.
[0044] In various embodiments, estimated valuations may be used to provide a variety of information to the user. For example, in the example interface shown, a map showing the estimated valuation of the target property and neighboring properties is displayed. "Median home values for nearby locations" shows the median estimated valuations for properties in nearby neighborhoods having 2, 3, and 4 bedrooms, respectively.
[0045] FIGS. 5A-B show a diagram illustrating an embodiment of an interface for adjusting an estimated property valuation. In some embodiments, this interface opens in response to a user selecting the "Adjust home value" button in FIG. 4. As shown in this interface, the original (prior to user adjustment) estimated valuation is shown in box 502 in the left hand column as "Original value $1,845,000". A plurality of contributing factors to the estimated valuation may be individually selected and/or modified in three sections, including: property facts ("Adjust home facts"), property improvements ("Refine the value by adding home improvements"), and comparable properties ("Choose comparable homes"). A user may adjust data associated with one or more of these contributing factors to adjust or modify the estimated valuation. In some embodiments, such as the example shown, the adjusted estimated valuation is updated dynamically (e.g., in response to user adjustments) in box 504 in the left hand column as "Adjusted value $1,930,000". In this example, box 504 also shows a breakdown of how much each contributing factor affected the adjusted estimated valuation. How much each contributing factor affects the adjusted estimated valuation is also shown in each section.
[0046] By allowing the user to adjust various contributing factors, the user can clearly see how various changes/'improvements will affect the property value. In some embodiments, the user adjustments are for the user's information only and not saved or publicly displayed. In other embodiments, the user adjustments may be saved and affect the original estimated valuation for all users. For example, home facts and home improvements may have an error and a user adjustment may correct the error. In some embodiments, only adjustments made by certain types of users are used to modify the original estimated valuation for all users. For example, the types might be users who are registered as a realtor, an appraiser, an inspector, and/or the owner of the property.
[0047] In various embodiments, the interface may provide tools for adjusting other contributing factors. Other contributing factors, for example, could include: comparable neighborhood ratings, local ratings/reviews, and thumbs up/down. For example, an interface for rating the property and/or neighborhood in which a property is located may be provided, in which a user may select from 1-5 stars. Various categories may be provided for rating, such as schools, crime, walkability of the neighborhood; or exterior/interior condition of the property. Reviews may be in freeform text. Thumbs up/down may be a thumb icon that a user can click to indicate that a user agrees/disagrees with or likes/dislikes some data or information associated with a property or neighborhood. Any or all of this user-generated data can be used to adjust the estimated valuation.
[0048] In this example interface, a user may opt to adjust any one of more of a plurality of contributing factors by editing the data in the appropriate section of the interface. In other embodiments, other interfaces could be used. For example, a list of contributing factors may be provided and a user may need to checkmark which of the contributing factors the user would like to modify. In some embodiments, the user can weight the different contributing factors, for example, using slider bars. For example, a user might believe that comparables have a great effect on value than improvements, in which case the user might give a greater weight to the comparables data.
[0049] In some embodiments, this user-adjusted data may be fed into the appropriate data model(s) shown in evaluation system 100 of FIG. 1. For example, in this interface, the home facts data and home improvements data could be provided as input to the hedonics data model 104. Comparable properties data could he provided as input to comparables model 110. For example, "Choose comparable homes" could display the most similar properties, in order from most to least similar. By default, the N most similar properties are checkmarked. The checkmarked properties are then used as input to the data model to determine the estimated valuation. By checkmarking various properties, the user can customize the estimated valuation to only take into account the check marked properties as comparables.
[0050] In this example interface, home facts data and home improvements data are examples of objective or fact-based data that is fed into one or more fact-based data models in system 100. Comparable homes data is an example of subjective or user-generated data that is fed into one or more data models associated with user-generated data in system 100. In some cases, a user might want to override the user-generated/subjective data and want to know the estimated valuation based on fact-based data alone. In some embodiments, the interface includes an element that allows the user to override the subjective data.
[0051] In some embodiments, the interface includes an element that allows the user to adjust between a collective assessment and a personal assessment. For example a slider bar may be presented that allows the user to adjust between All (or N) to 1 users, where "All" (or "N") means that all (or N) users' user-generated data is used to compute the estimated valuation, and "1" means that only the user's user-generated data is used to compute the estimated valuation. A user might find this useful, for example, if the user is interested in a fact-based estimated valuation that takes into account only the user's opinions on, for example, which homes to consider as comparables (as selected by the user under "Choose comparable homes"), or the user's rating of the neighborhood or of the condition of the home.
[0052] In some embodiments, one or more visual cues are used to indicate whether data is the user's data or all users's data. For example, if there is a section for providing and displaying ratings of various categories associated with the property, the user's rating may be displayed along with other users' average rating for each category. In some embodiments, colors may be used to indicate whether data is the user's data or all users' data. For example, there could be a slider bar to adjust between a collective assessment and a personal assessment. When the setting is "1", the rating is shown in one color; when the setting is "All" the rating is shown in a different color.
[0053] FIG. 6 is a flow chart illustrating an embodiment of a process for estimating a valuation of a target property based on individually user-selectable contributing factors. In some embodiments, this process is performed by system 100.
[0054] In the example shown, at 602, a plurality of individually selectable contributing factors each associated with the target property are provided or displayed. For example, interface 500 is displayed, in which the individually selectable contributing factors are: property facts, property improvements, and comparables. At 604, an indication that a user has selected a subset of contributing factors from the plurality of individually selectable contributing factors is received. For example, in interface 500, a user may select a subset of contributing factors by editing one or more of the property facts, home improvements, or comparables. In this example, if the user does not edit the home improvements section, home improvements is not selected as a contributing factor. In other embodiments, a list of contributing factors and editable data associated with each contributing factor is provided and a user may select (e.g., checkmark) one or more of the contributing factors from the list. Those that are checkmarked are considered. selected. At 606, data associated with the subset of contributing factors is received. For example, in interface 500, a user may edit one or more of the property facts, home improvements, or comparables with new data. At 608, the data is processed using one or more data models associated with the contributing factors. For example, the new data entered by the user at 606 may he processed by the appropriate data models in valuation system 100. At 610, the output of the one or more data models is combined to obtain or compute an estimated valuation of the target property. For example, the data processed at 606 may be combined by aggregator 118 to compute the estimated valuation.
[0055] FIG. 7A-7B is a diagram illustrating an embodiment of an interface for displaying various data obtained based on an estimated property valuation(s). Interface 700 shows examples of various data that can be computed based on the estimated property valuation(s) for a particular property (1104 Treat Ave., San Francisco, Calif. 94114). For example, a change in estimated valuation 702 from an earlier date can be displayed. A range of the estimated valuation 704 can he displayed. For example, system 100 may output a low and high for the estimated valuation, where the low and high could be, for example, one standard deviation away from the mean (estimated valuation). An estimated price per square foot 706 could be computed based on the estimated valuation divided by the square footage of the property for each of the target property and comparable properties. A plot of the estimated valuation over time 708 could be computed and displayed, where the estimated valuation is computed for each date corresponding to each data point in the plot. A discussion associated with the estimated valuation 710 among one or more users could he provided. A map 712 showing the estimated valuation of the target property and neighboring properties could be displayed. A plot of comparable home values over time 714 could be displayed. Plot 714 could be computed by averaging estimated valuations of comparable homes at each date in the plot. Comparable homes can be defined in various ways in various embodiments. For example, some embodiments may define comparable homes according to process 300. In various embodiments, a variety of other data can be computed based on the estimated valuation and presented in various tools and interfaces.
[0056] Although the foregoing embodiments have been described in some detail for purposes of clarity of understanding, the invention is not limited to the details provided. There are many alternative ways of implementing the invention. The disclosed embodiments are illustrative and not restrictive.
* * * * *
D00000
D00001
D00002
D00003
D00004
D00005
D00006
D00007
D00008
D00009
D00010
XML
uspto.report is an independent third-party trademark research tool that is not affiliated, endorsed, or sponsored by the United States Patent and Trademark Office (USPTO) or any other governmental organization. The information provided by uspto.report is based on publicly available data at the time of writing and is intended for informational purposes only.
While we strive to provide accurate and up-to-date information, we do not guarantee the accuracy, completeness, reliability, or suitability of the information displayed on this site. The use of this site is at your own risk. Any reliance you place on such information is therefore strictly at your own risk.
All official trademark data, including owner information, should be verified by visiting the official USPTO website at www.uspto.gov. This site is not intended to replace professional legal advice and should not be used as a substitute for consulting with a legal professional who is knowledgeable about trademark law.