Gas Lift Optimization Process
SANDIDGE; DUSTIN LEVI
U.S. patent application number 16/416944 was filed with the patent office on 2019-11-21 for gas lift optimization process. The applicant listed for this patent is PCS FERGUSON, INC.. Invention is credited to DUSTIN LEVI SANDIDGE.
| Application Number | 20190353016 16/416944 |
| Document ID | / |
| Family ID | 68534258 |
| Filed Date | 2019-11-21 |


| United States Patent Application | 20190353016 |
| Kind Code | A1 |
| SANDIDGE; DUSTIN LEVI | November 21, 2019 |
GAS LIFT OPTIMIZATION PROCESS
Abstract
A system, method and process (utility) is presented to control a gas injection setpoint of a production well utilizing gas lift. The utility may control a flow valve and/or source of injection gas (e.g., gas injection compressor) to increase or decrease a gas injection flow rate (e.g., setpoint) into the well during a gas injection interval. The utility monitors bottom hole pressure related values for multiple gas injection intervals with each have different gas injection setpoints (e.g., flow volumes). Bottom Hole Pressures (e.g., averages). The differences between the Bottom Hole Pressures are compared to calculate Bottom Hole Pressure Drawdown (BHPD) rates between intervals. A subsequent gas injection setpoint (e.g., direction and/or magnitude of change) is selected based on a comparison of a current BHPD and a previous BHPD.
| Inventors: | SANDIDGE; DUSTIN LEVI; (DE BEQUE, CO) | ||||||||||
| Applicant: |
|
||||||||||
|---|---|---|---|---|---|---|---|---|---|---|---|
| Family ID: | 68534258 | ||||||||||
| Appl. No.: | 16/416944 | ||||||||||
| Filed: | May 20, 2019 |
Related U.S. Patent Documents
| Application Number | Filing Date | Patent Number | ||
|---|---|---|---|---|
| 62674160 | May 21, 2018 | |||
| Current U.S. Class: | 1/1 |
| Current CPC Class: | E21B 47/10 20130101; E21B 43/122 20130101; E21B 47/06 20130101; E21B 43/123 20130101 |
| International Class: | E21B 43/12 20060101 E21B043/12; E21B 47/06 20060101 E21B047/06; E21B 47/10 20060101 E21B047/10 |
Claims
1. A process for adjusting a gas injection setpoint for a well utilizing gas lift, comprising: identifying a first Bottom Hole Pressure Drawdown (BHPD) between an end of a first gas injection interval having a first gas injection setpoint and an end of a second gas injection interval having a second gas injection setpoint; identifying a second BHPD between an end of a third gas injection interval having a third gas injection setpoint and the end of the second gas injection interval; comparing the second BHPD to the first BHPD; and adjusting a gas injection setpoint for a subsequent gas injection interval based on the comparison.
2. The process of claim 1, further comprising: maintaining gas flow into a well at the first gas injection setpoint for the first gas injection interval to establish a first bottom hole pressure (BHP) at the end of the first gas injection interval; maintaining gas flow into the well at the second gas injection setpoint for the second gas injection interval to establish a second BHP at the end of the second gas injection interval; and identifying a change between the first BHP and the second BHP, wherein the change corresponds to the first BHPD.
3. The process of claim 2, further comprising: maintaining gas flow into the well at the third gas injection setpoint for the third gas injection interval to establish a third BHP at the end of the third gas injection interval; and identifying a change between the second BHP and the third BHP, wherein the change corresponds to the second BHPD.
4. The process of claim 3, wherein the establishing of each BHP comprises at least one of: obtaining a bottom hole pressure measurement from a bottom hole pressure sensor; obtaining a bottom hole pressure related value from an output of a production flow sensor; and generating a bottom hole pressure related value from a multiphase correlation calculation.
5. The process of claim 3, wherein establishing each BHP comprises: generating an average BHP for each gas injection interval.
6. The process of claim 3, further comprising for each gas injection interval: monitoring a current gas flow into the well; comparing the gas flow to a predetermined minimum gas flow; and suspending the gas injection interval when the current gas flow into the well is less that the predetermined minimum gas flow.
7. The process of claim 6, further comprising: identifying when the current gas flow exceeds the gas injection setpoint for the gas injection interval; and restarting the gas injection interval.
8. The process of claim 1, wherein adjusting the gas injection setpoint for the subsequent interval based on the comparison, further comprises: adjusting the gas injection setpoint for the subsequent interval in the direction of a previous gas injection setpoint adjustment if the second BHPD is greater than the first BHPD adjusting the gas injection setpoint for the subsequent interval in a direction opposite of the previous gas injection setpoint adjustment if the second BHPD is less than the first BHPD.
9. The process of claim 8, wherein the adjusting of the gas injection setpoint for the subsequent interval comprises one of increasing the gas injection setpoint for the subsequent interval and decreasing the gas injection setpoint for the subsequent interval.
10. The process of claim 8, wherein adjusting the gas injection setpoint for the subsequent interval in a direction opposite of the previous gas injection setpoint adjustment comprises: adjusting the gas injection setpoint in the opposite direction with a magnitude that is a fraction of a magnitude of the previous gas injection setpoint adjustment.
11. The process of claim 1, further comprising: comparing the second BHPD to a predetermined threshold; and increasing the gas injection setpoint for the subsequent gas injection interval if the second BHPD is less than the predetermined threshold.
12. A system for adjusting a gas injection setpoint for a well utilizing gas lift, comprising: a flow control valve disposed in a flow path between a gas source and a well; a flow meter disposed in the flow path between the gas source and the well, the flow meter being configured to measure a rate of gas flow through the flow path and generate a corresponding output; a controller in communication with the flow control valve and the flow meter, the controller configured to: adjust the flow control valve to establish gas injection setpoints for gas injection intervals, respectively; identify a Bottom Hole Pressure (BHP) for each gas injection interval; calculate a current Bottom Hole Pressure Drawdown (BHPD) between an end of a current gas injection interval and an end of a previous gas injection interval; compare the current BHPD to a previous BHPD; calculate an adjusted gas injection setpoint for a subsequent gas injection interval based on the comparison; and generate a valve control signal for receipt by the flow control valve, the flow control valve being configured to adjust a rate of gas flow into a well to the adjusted gas injection setpoint in response to a valve control signal.
13. The system of claim 12, further comprising at least one of: a bottom hole pressure sensor connected to the controller, wherein the controller identifies the BHP based on an output of the bottom hole pressure sensor; and a production flow sensor connected to the controller, wherein the controller identifies the BHP based on an output of the production flow sensor.
14. The system of claim 12, wherein the controller is configured to perform a multiphase correlation calculation, wherein the controller identifies the BHP based on an output of the multiphase correlation calculation.
15. The system of claim 12, wherein the controller is configured to: identify a change between a BHP for the current gas injection interval and a BHP for an immediately previous gas injection interval, wherein the change is the current BHPD.
16. The system of claim 15, wherein the controller is configured to: set the adjusted gas injection setpoint for the subsequent interval in the direction of a previous gas injection setpoint adjustment if the current BHPD is greater than the previous BHPD; and set the adjusted gas injection setpoint for the subsequent interval in a direction opposite of the previous gas injection setpoint adjustment if the current BHPD is less than the previous BHPD.
17. The system of claim 16, wherein the controller is configured to: increasing the previous the gas injection setpoint or decrease the previous gas injection setpoint for the subsequent interval.
18. The process of claim 16, wherein, when setting the adjusted gas injection setpoint in a direction opposite of the previous gas injection setpoint adjustment, the controller is configured to: set the adjusted gas injection setpoint in the opposite direction with a magnitude that is a fraction of a magnitude of the previous gas injection setpoint adjustment.
19. A process for adjusting a gas injection setpoint for a well utilizing gas lift, comprising: calculating a current Bottom Hole Pressure Drawdown (BHPD) between an end of a current gas injection interval and an end of a previous gas injection interval; comparing the current BHPD to a previous BHPD; calculating an adjusted gas injection setpoint for a subsequent gas injection interval based on the comparison; and controlling flow control valve disposed in a flow path between a gas source and the well to adjust a rate of gas flow into the well to the adjusted gas injection setpoint.
20. The process of claim 19, further comprising: identifying a Bottom Hole Pressure (BHP) for the current gas injection interval; identifying a change between the current BHP and a previous BHP for a previous gas injection interval, wherein the change represents the BHPD.
21. The process of claim 19, further comprising: setting the adjusted gas injection setpoint for the subsequent interval in the direction of a previous gas injection setpoint adjustment if the current BHPD is greater than the previous BHPD; and setting the adjusted gas injection setpoint for the subsequent interval in a direction opposite of the previous gas injection setpoint adjustment if the current BHPD is less than the previous BHPD.
22. The process of claim 21, further comprising: setting the adjusted gas injection setpoint in the opposite direction with a magnitude that is a fraction of a magnitude of the previous gas injection setpoint adjustment.
Description
CROSS REFERENCE
[0001] The present application claims the benefit of the filing date of U.S. Provisional Application No. 62/674,160 having a filing date of May 21, 2018, the entire contents of which is incorporated herein by reference.
FIELD
[0002] The present disclosure relates to artificial lift systems that inject gas into production tubing of hydrocarbon production wells. More specifically, a process is provided that allows for dynamically adjusting (e.g., increase or decrease) a gas injection rate to identify a rate that yields a near peak bottom hole pressure drawdown and/or total fluid production.
BACKGROUND
[0003] Well bores of oil and gas wells extend from the surface to permeable subterranean formations (`reservoirs`) containing hydrocarbons. These well bores are drilled in the ground to a desired depth and may include horizontal sections as well as vertical sections. In any arrangement, piping (e.g., steel), known as casing, is inserted into the well bore. The casing may have differing diameters at different intervals within the well bore and these various intervals of casing may be cemented in-place. Other portions (e.g., within producing formations) may not be cemented in place and/or include perforations to allow hydrocarbons to enter into the casing. Alternatively, the casing may not extend into the production formation (e.g., open-hole completion).
[0004] Disposed within a well casing is a string of production piping/tubing, which has a diameter that is less than the diameter of the well casing. The production tubing may be secured within the well casing via one or more packers, which may provide a seal between the outside of the production piping and the inside of the well casing. The production tubing provides a continuous bore from the production zone to the wellhead through which oil and gas can be produced.
[0005] The flow of fluids, from the reservoir(s) to the surface, may be facilitated by the accumulated energy within the reservoir itself, that is, without reliance on an external energy source. In such an arrangement, the well is said to be flowing naturally. When an external source of energy is required to flow fluids to the surface the well is said to produce by a means of artificial lifting. Generally, this is achieved by the use of a mechanical device inside the well (e.g., pump) or by decreasing the weight of the hydrostatic column in the production tubing by injecting gas into the liquid some distance down the well.
[0006] The injection of gas to decrease the weight of a hydrostatic column is commonly referred to as gas lift, which is artificial lift technique where bubbles of compressed air/gas are injected to reduce the hydrostatic pressure within the production tubing to below a pressure at the inlet of the production tubing. In one gas lift arrangement, high pressure gas is injected into the annular space between the well casing and the production tubing. At one or more predetermined locations along the length of the production tubing, gas lift valves permit the gas in the annular space to enter into the production tubing. Such a gas lift artificial lift system may be combined with additional artificial lift systems. For instance, gas lift may be combined with plunger lift in some arrangements.
SUMMARY
[0007] Presented herein are systems, methods and processes (i.e., utilities) for enhancing or optimizing the gas injection setpoint of a well utilizing gas lift. Generally, the utilities includes initiating a gas lift at an initial gas injection rate or setpoint. The utility utilizes inputs associated a bottom hole pressure to subsequently adjust the gas injection rate. Such inputs may be acquired from, for example, a bottom hole pressure sensor and/or a production rate sensor. In the former regard, a dedicated bottom hole pressure sensor monitors a bottom hole pressure drawdown rate. In the latter regard, a production rate sensor allows for substituting the bottom hole pressure with a total fluid production rate. In further embodiments, the bottom hole pressure may be inferred. For instance, when a dedicated sensor is not available to monitor (e.g., directly or indirectly) bottom hole pressure, the bottom hole pressure may be inferred from known well data and one or more variables (e.g., well depth, formation depth, casing size, temperature etc.) that are known or may be measured. By way of example, performance of a multiphase correlation calculation may provide an input associated with a down hole pressure. Various multiphase correlations are known including, without limitation, Hagedorn and Brown, Petroleum Experts, Petroleum Experts 2, Petroleum Experts 3, Fancher Brown, and Beggs and Brill, to name a few.
[0008] In any arrangement, the utilities control a gas injection flow valve and/or source of injection gas (e.g., gas injection compressor) to increase or decrease a gas injection flow rate into the well during a gas injection interval. In an arrangement, an initial injection rate (e.g., gas injection setpoint) is maintained for a predetermined interval. Based on this injection rate an initial bottom hole pressure (e.g., first BHP) is determined for the interval. The gas injection rate or setpoint is then either increased or decreased a predetermined amount for another time gas injection interval. A subsequent average bottom hole pressure is obtained (e.g., second BHP). At the initiation of the process, the gas injection rate is then increased or decreased in the same direction as the previous increase or decrease for another gas injection interval to find a further bottom hole pressure (e.g., third BHP). The difference or change between the first BHP and second BHP is compared with difference of change between the second BHP and the third BHP. This changes correspond to a Bottom Hole Pressure Drawdown (BHPD) rate. If the second drawdown rate is greater than the first drawdown rate, the direction of change in the injection rate is trending toward a more optimal setting and further increases or decreases in the same direction are applied to the gas injection rate. If the second drawdown rate is less that the first drawdown rate, the injection rate is being adjusted in the incorrect direction and the process reverses. The process may continue in a loop further adjusting the gas injection rate to iterate to closer an optimal setting. That is, after initiation of the process, a new or subsequent BHPD is compared to the prior/previous BHPD to determine a subsequent adjustment direction and/or magnitude for a subsequent gas injection rate. However, in various arrangements, the process may be interrupted and/or altered based on one or more predetermined factors.
BRIEF DESCRIPTION OF THE FIGURES
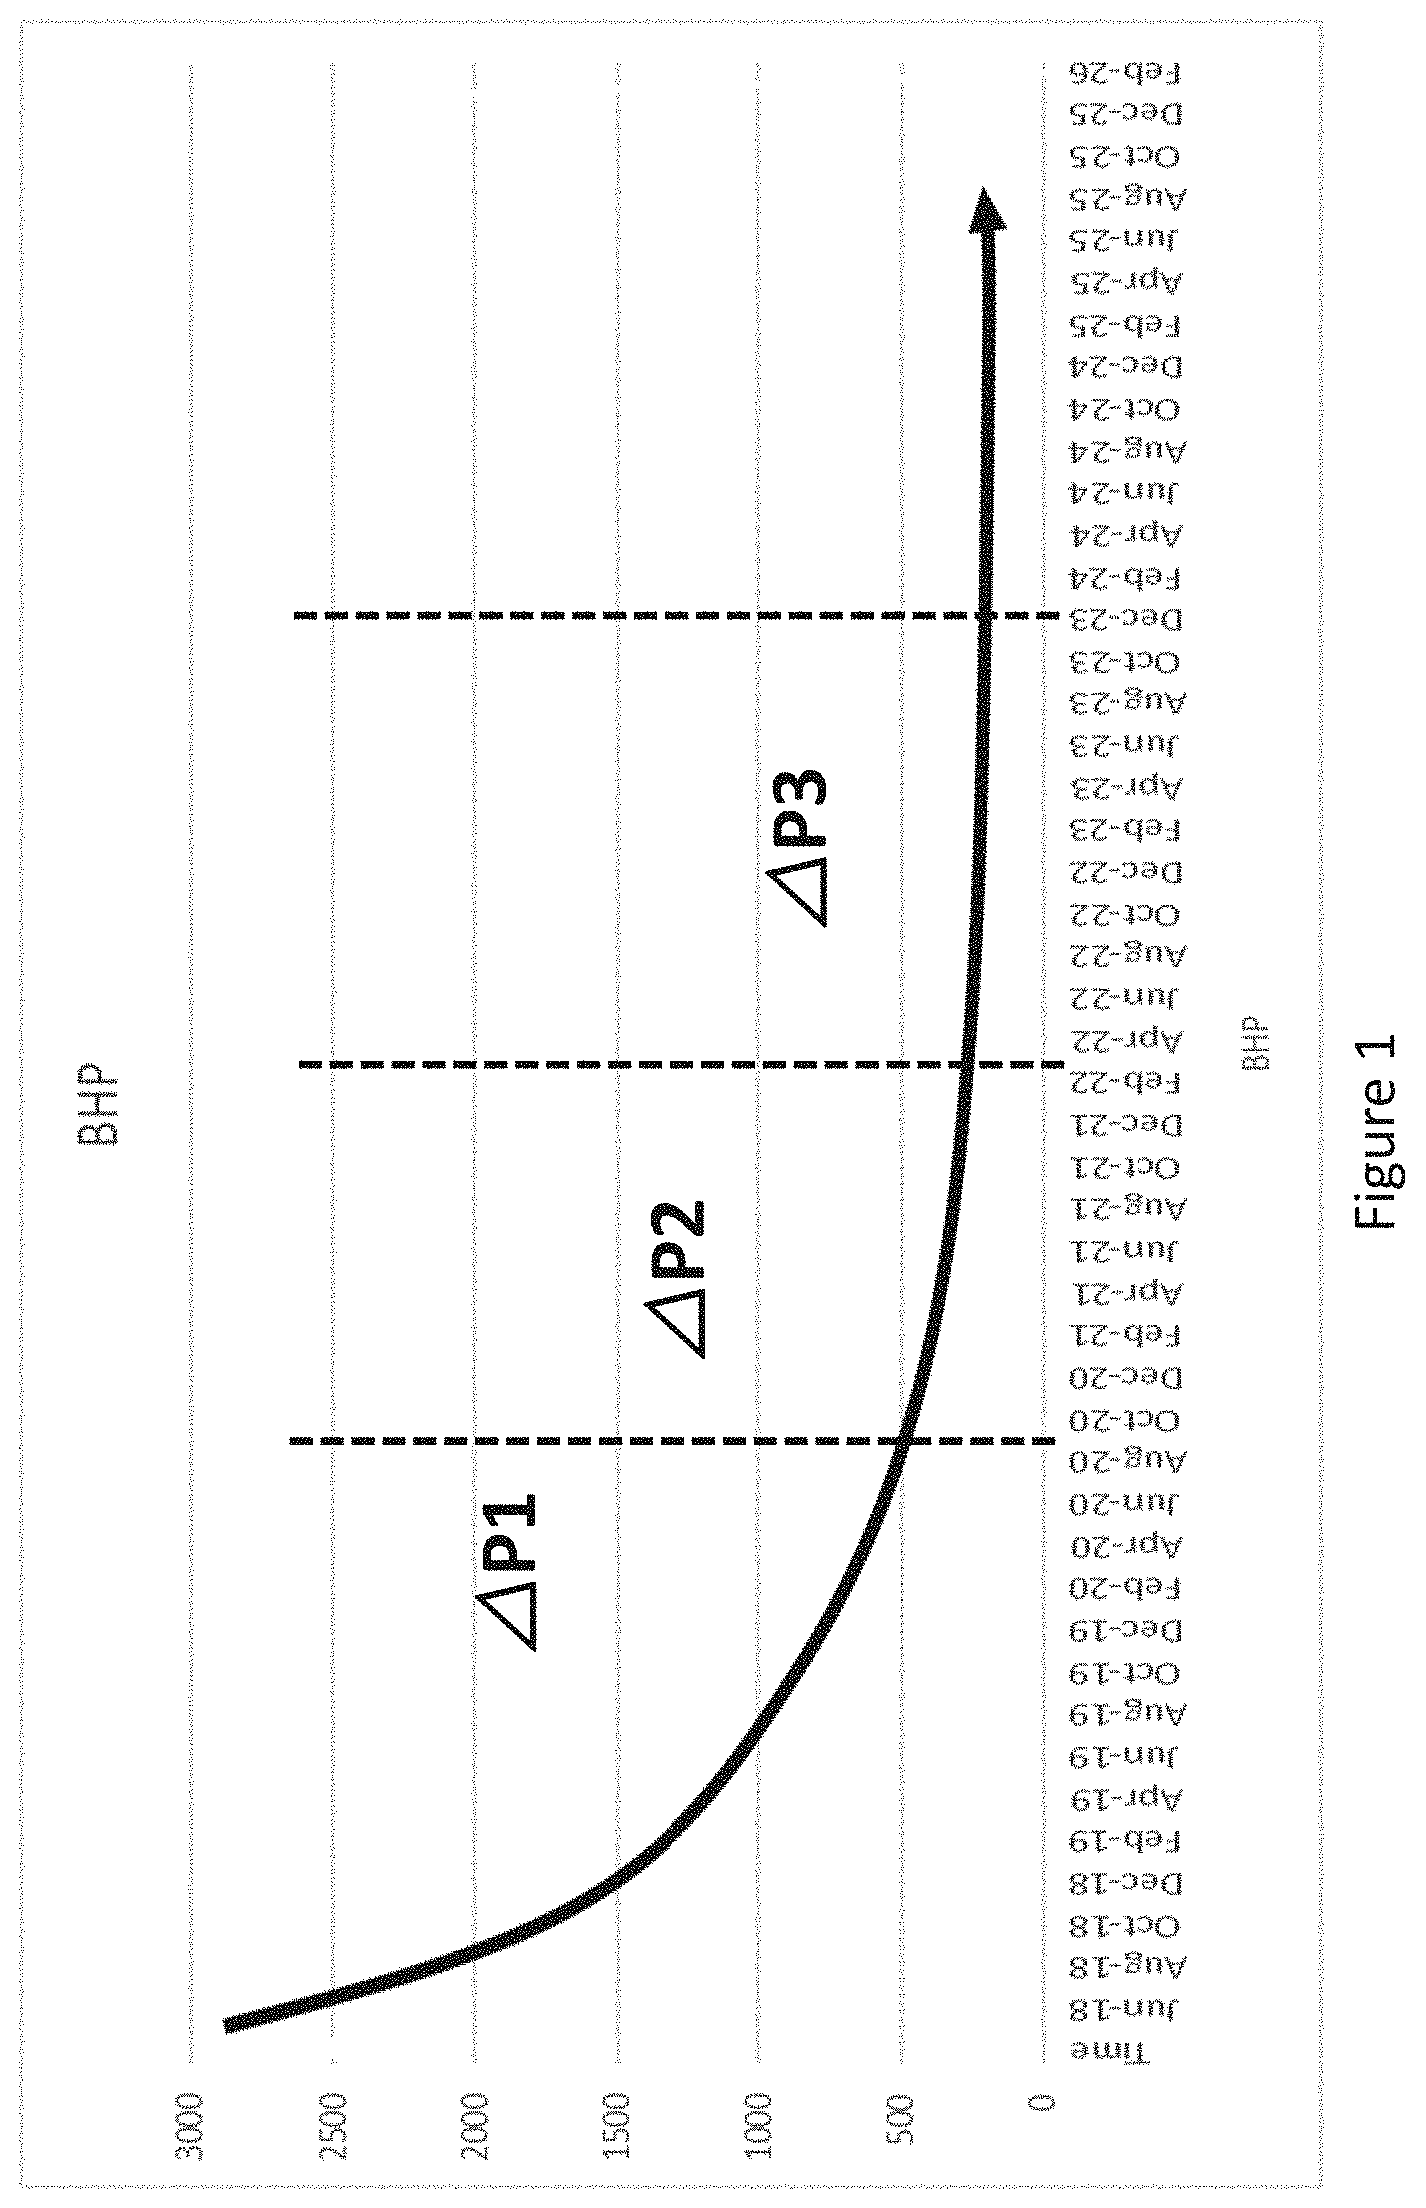
[0009] FIG. 1 is a graph showing well decline over time.
[0010] FIGS. 2A-2C illustrate gas injection values in a gas lift artificial lift system.
[0011] FIG. 3 illustrates a graph of a gas injection rate versus Bottom Hole Pressure (BHP) for any given point in time.
[0012] FIG. 4 illustrates a graph of gas injection rates versus Bottom Hole Pressure drawdown.
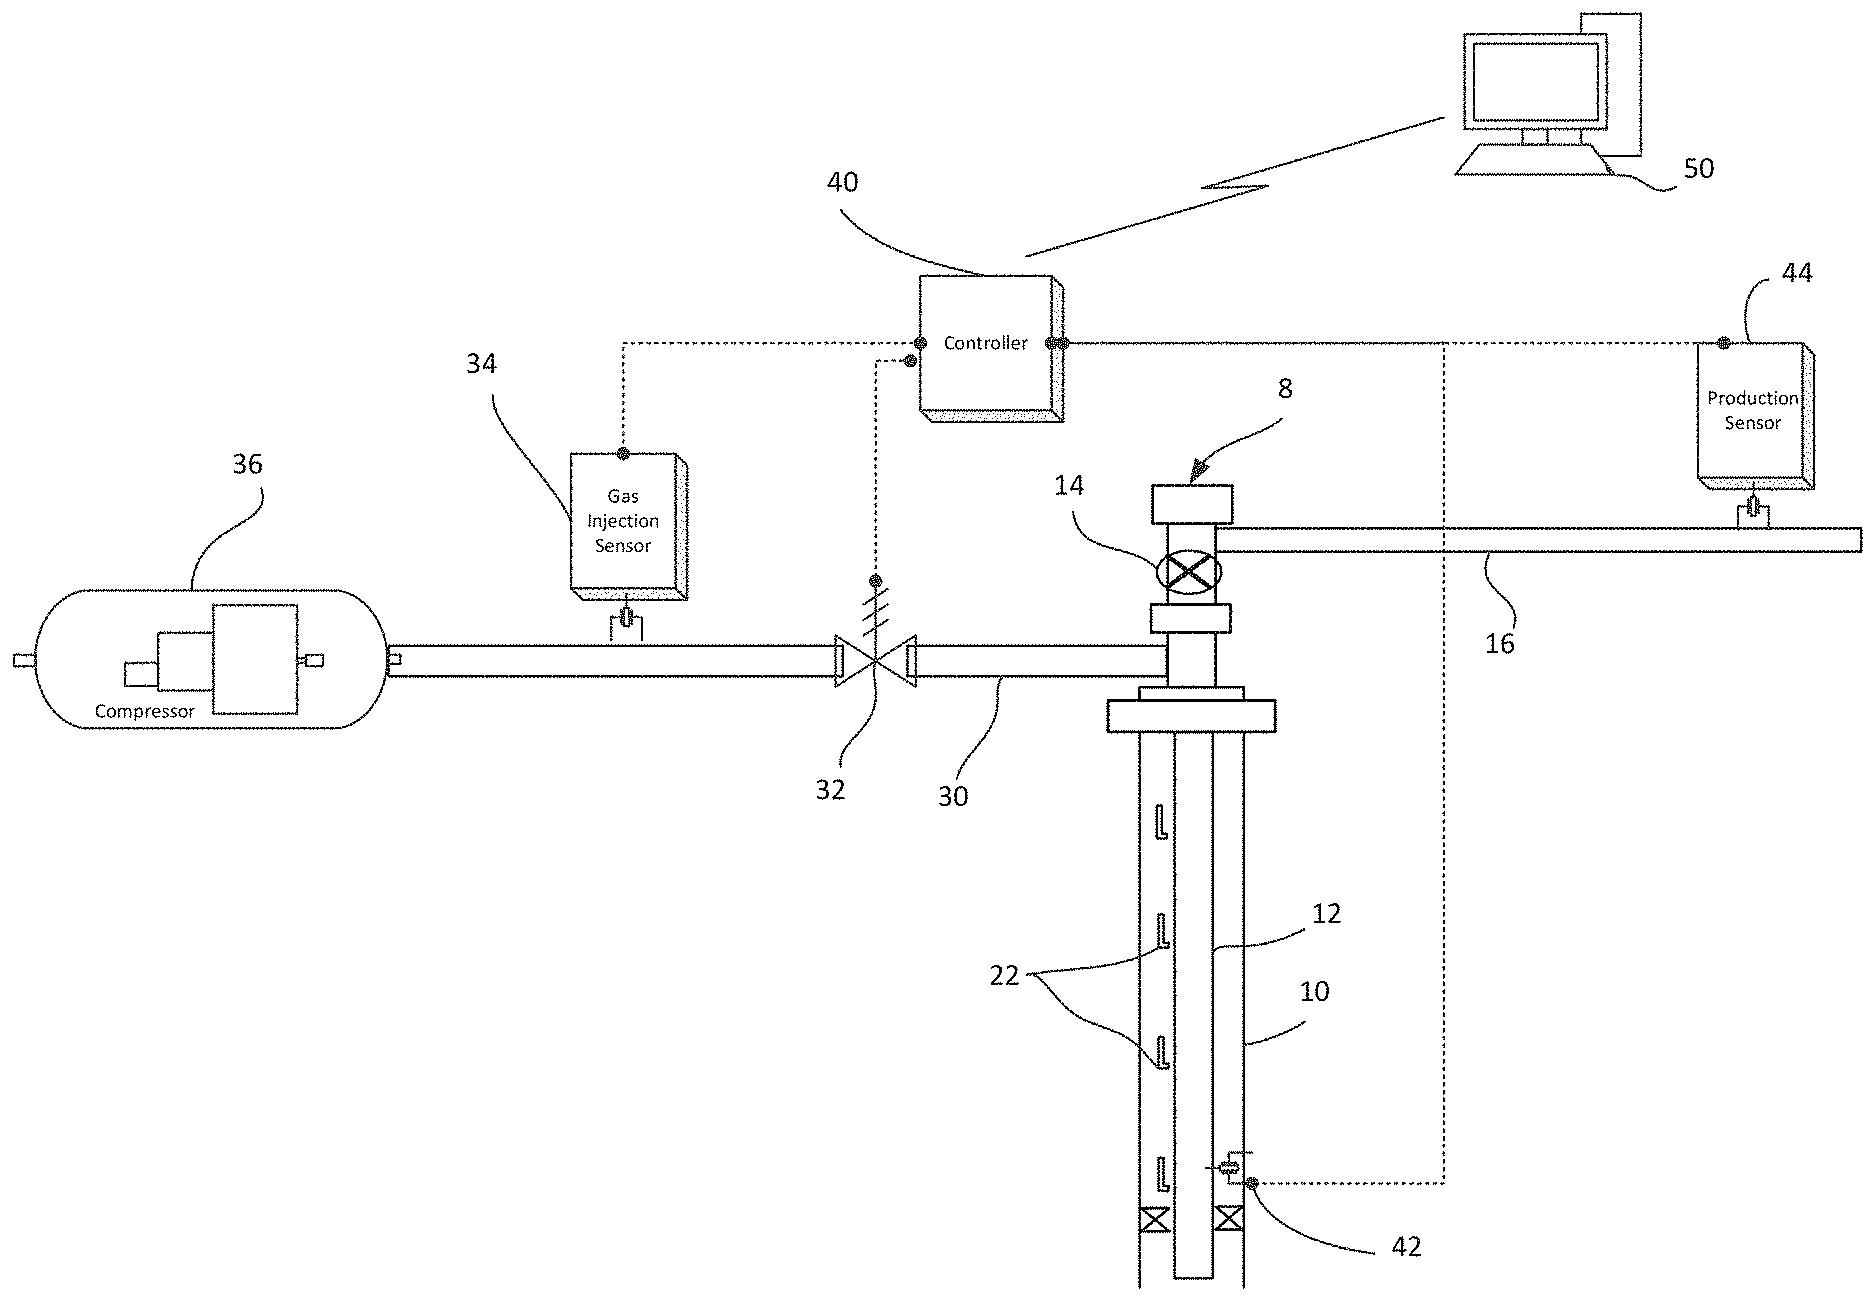
[0013] FIG. 5 illustrates a system for adjusting gas injection setpoints at a production well including gas lift artificial lift.
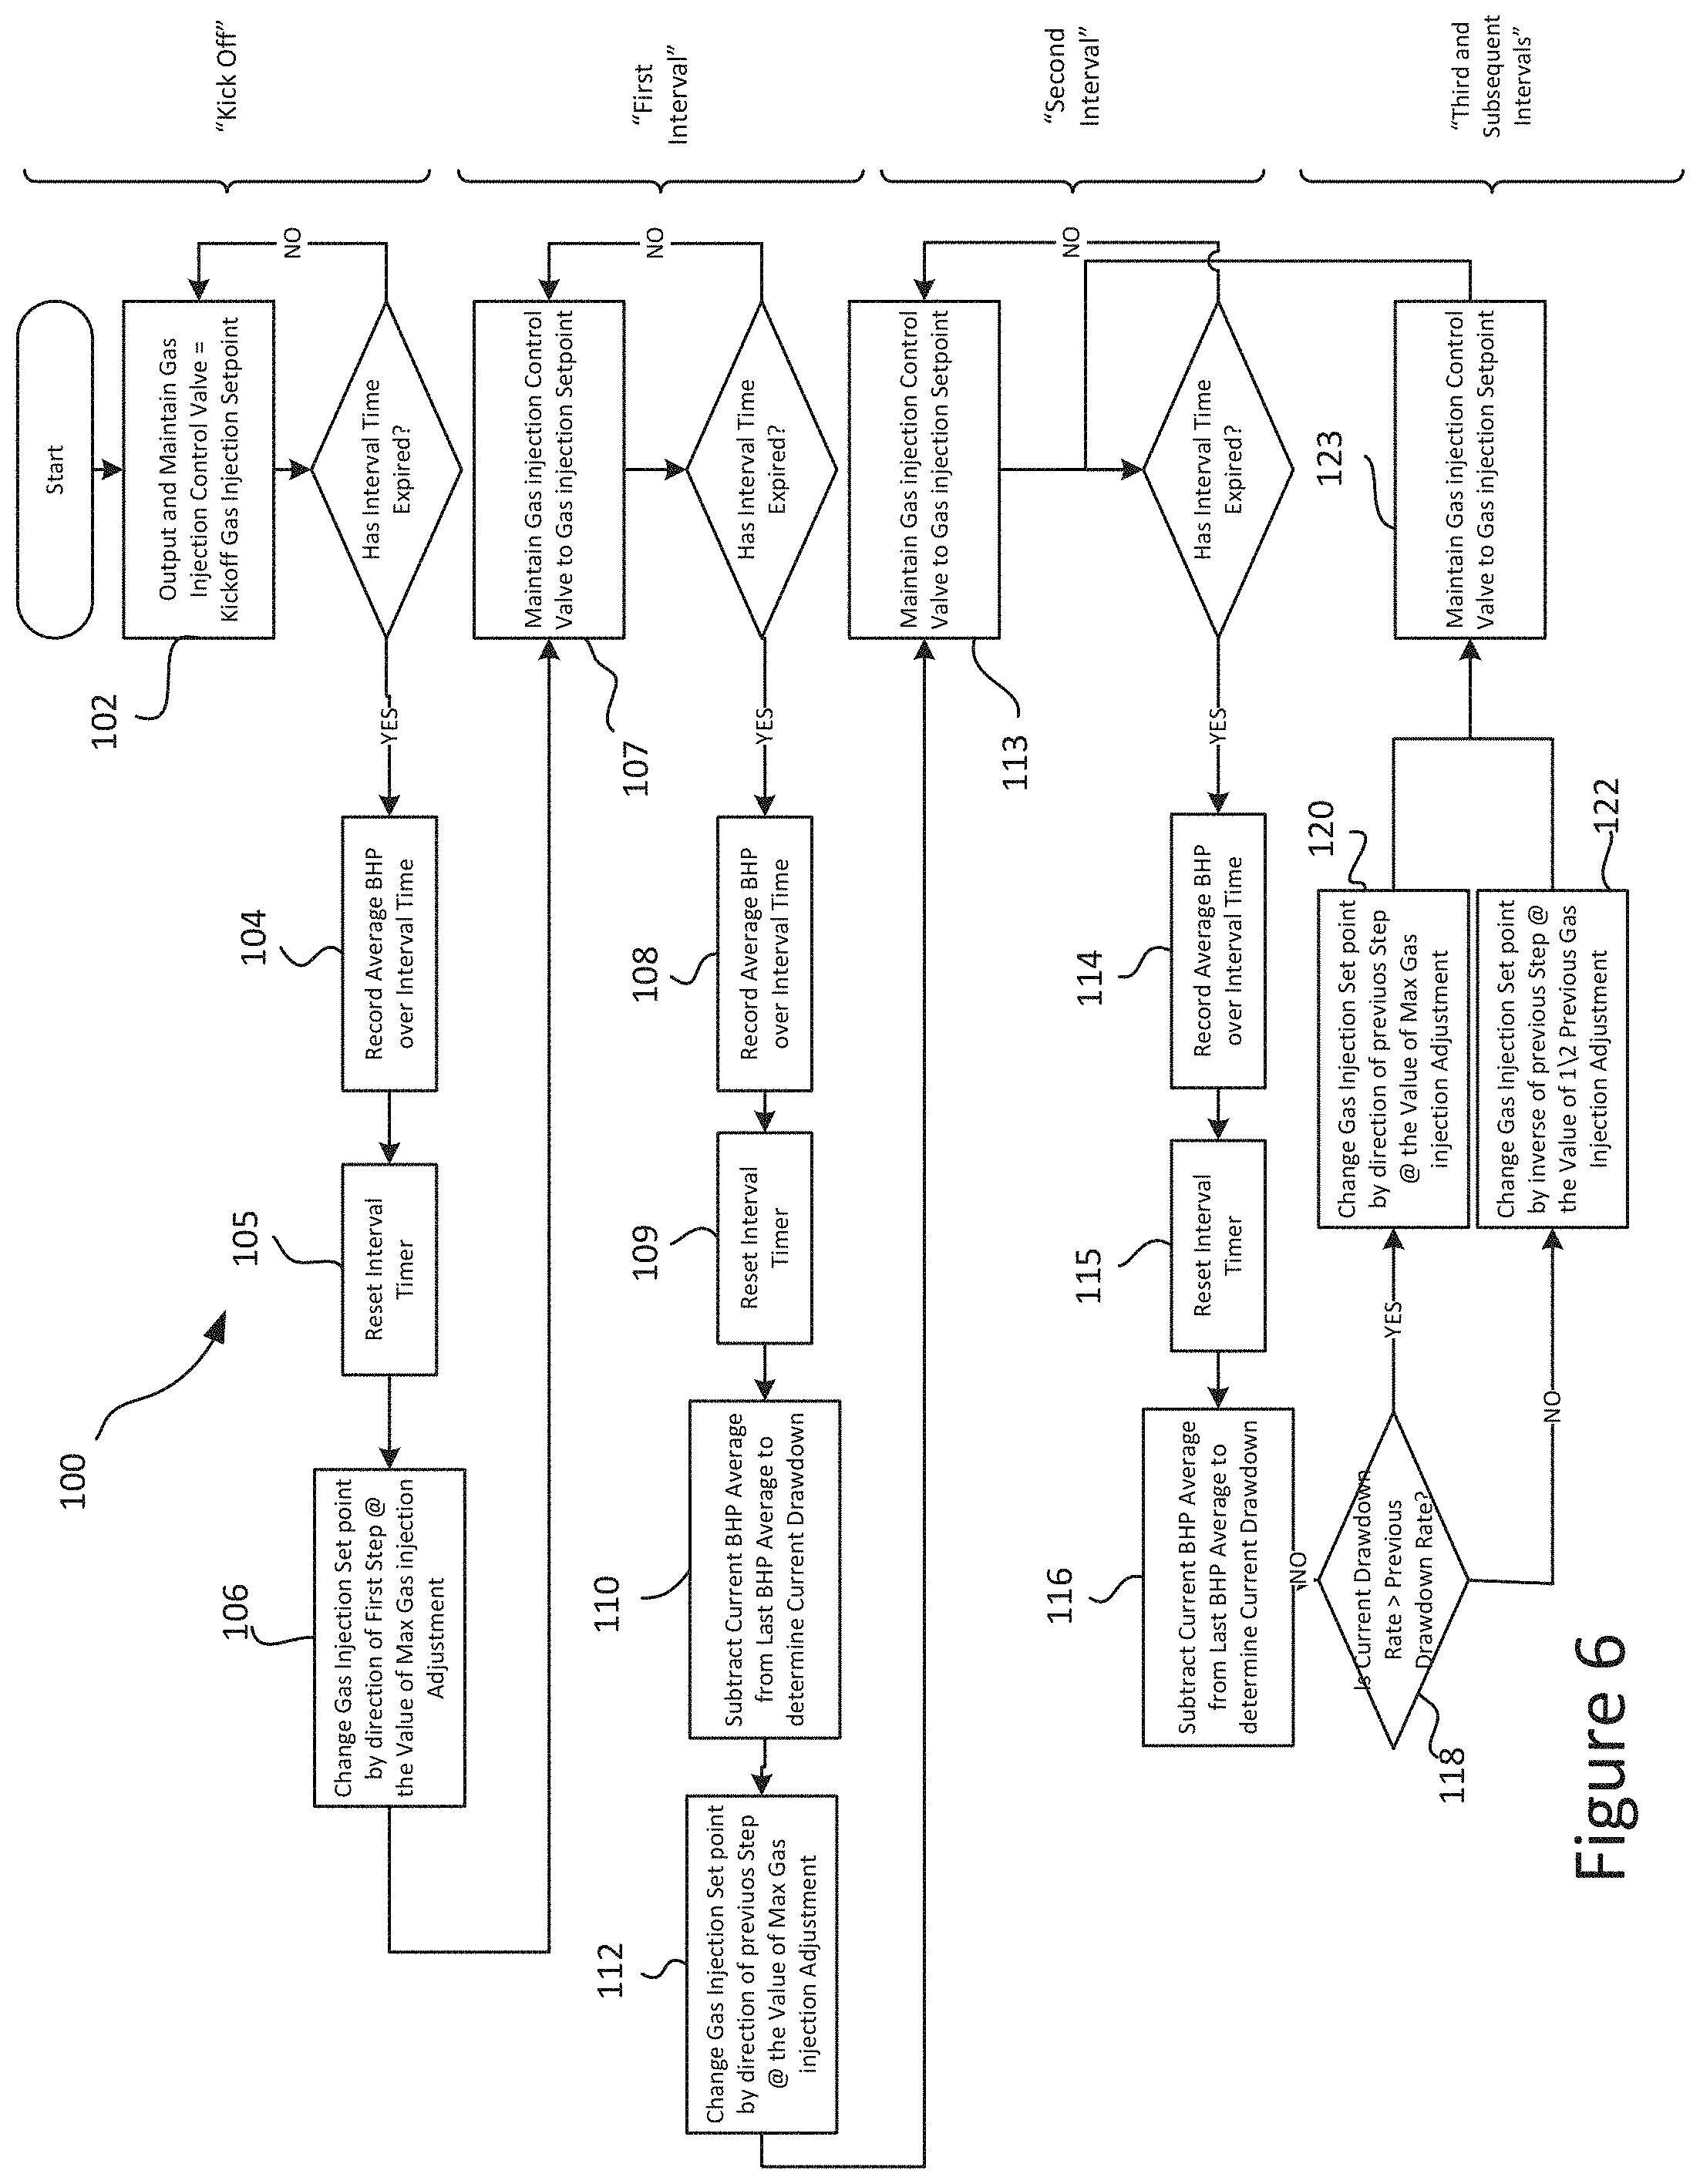
[0014] FIG. 6 illustrates one process for adjusting gas injection setpoints.
[0015] FIG. 7 illustrates a graph of gas injection rate adjustments and changes in Bottom Hole Pressure.
[0016] FIG. 8 illustrates a graph of gas injection rates relative to an optimal gas injection rate.
[0017] FIG. 9 illustrates another process for adjusting gas injection setpoints.
[0018] FIG. 10 illustrates a process for monitoring available injection gas for use in adjusting gas injection setpoints.
DETAILED DESCRIPTION
[0019] Reference will now be made to the accompanying drawings, which at least assist in illustrating the various pertinent features of the present disclosure. The following description is presented for purposes of illustration and description and is not intended to limit the disclosed embodiments to the forms disclosed herein. Consequently, variations and modifications commensurate with the following teachings, and skill and knowledge of the relevant art, are within the scope of the present disclosure.
Definition of Terms
[0020] Control valve--An electronic actuating valve that moves open and close based on an external input
[0021] Bottom Hole Pressure (BHP)--A pressure value that is indicative of a pressure at the bottom of a well.
[0022] Gas injection setpoint--Gas injection rate into an well bore.
[0023] Optimal Gas injection Setpoint--Gas injection rate that yields the greatest BHP drawdown or total fluid production.
[0024] Unloading--Increasing Gas Injection that produces a higher BHP delta
[0025] Loading--Decreasing Gas injection that produces a lower BHP delta
[0026] Drawdown--Decreasing Gas injection to produce a higher BHP delta
[0027] Build Up--Increasing Gas injection that produces a lower BHP delta
[0028] The following disclosure is directed to a process for optimizing a gas injection rate to maximize total fluid production of a well, which typically corresponds to the maximized bottom hole drawdown.
[0029] After being drilled and completed, well production typically declines over time. This decline can be defined as depleting gas and fluid production rates which are directly related to the reduction in reservoir pressure. FIG. 1 shows a general well decline (e.g., decline curve) over time. The well typically declines at different rates .DELTA.P1-.DELTA.P3 at various times in the wells life. The well, at some point, will require some form of artificial lift to improve production by supplementing energy to the wellbore. One form of artificial lift is gas lift.
[0030] FIG. 2A is a schematic illustration of an exemplary installation of a conventional gas lift arrangement. As illustrated, a string of production tubing 12 is disposed within a casing 10 of an oil and gas well. Disposed along the production string 12 at predetermined subterranean locations are one or more mandrels 20. Each of these mandrels 20 supports a gas lift valve 22, which is operative to open and close based on pre-set pressure settings. As shown in FIG. 2B, each mandrel 20 is tubular member having first and second open-ends 24, 26 that are adapted for in-line connection with the production tubing 12. In this regard, one or both ends may be threaded and/or include a collar. The mandrel 20 further includes a lug 28 on its outside surface that supports the gas lift valve 22. The lug includes one or more internal valve ports/bleed ports 18 that communicate with the interior of the mandrel. See FIG. 2C. The gas lift valve 22 may be any appropriately configured gas lift valve and may include various check valves. Typically, such gas lift valves include internally pressurized bellows that allow the valve to open and close based on predetermined pressure changes. For instance, such valves may normally be closed and only open after a gas lift pressure overcomes a downward force of the charged bellows. Exemplary valves are available from PCS Ferguson, Inc. of 3771 Eureka Way, Frederick, Colo. 80516.
[0031] In operation, a high-pressure source of gas (not shown) is injected into the well casing in the annulus between the well-casing 10 and the production tubing 12. The gas lift valves 22 supported by each mandrel 20 opens as the injection gas displaces fluid from the annulus. As these valves open, the opened valve injects gas from the annulus into production tubing 12 via valve port(s) 18 in the mandrel 20. See FIG. 2C. In some arrangements, upper gas valves may close after lower gas valves open. In any arrangement, as the injected gas flows to the surface it expands thereby lifting the liquid within the production tubing and reducing the density and column weight of the fluid in the tubing. It will be appreciated that the gas lift arrangement may be combined with additional artificial lift systems. For instance, the gas lift arrangement may be paired with plunger lift. In such an arrangement (not shown), a plunger may be disposed within the production tubing. Such a plunger may cycle between to bottom of the well and the top of the well to facilitate removal of liquids from the well.
[0032] Aspects of the present disclosure are directed to adjusting the rate at which pressurized gas is injected into the well in the annulus in the annulus between the well-casing and the production tubing. When using gas gift as a means of artificial lift, the Gas Injection Rate (GIR) is a key contributor to successful producing of the well. As noted, gas is compressed and injected through a series of valves such that the gas enters the production tubing along with reservoir fluids and formation gas. FIG. 3 illustrates a graph of a gas injection rate versus Bottom Hole Pressure (BHP) for any given point in time. Generally, it is desirable to minimize the BHP, which allows reservoir fluids and formation gases to more readily enter the production tubing of the well. As shown by the graph, if a Gas Injection Rate (i.e., x-axis) is lower than optimal, liquids may accumulate in the bottom of the well bore. That is, under injection may result in liquid loading of the well which may increase the BHP. Likewise, such liquid accumulation may reduce fluid production. More broadly, under injection may result in a failure of the BHP to drop or may actually increase the BHP in some cases depending on where the well is on its decline curve. If the Gas Injection Rate is too high, then the volume of gas injected into the production tubing may reduce the area within the production tubing that reservoir fluids and formation gases could otherwise occupy to come to the surface. This scenario may also reduce fluid production and increase the BHP due to, for example, pressure build up within the production tubing. As illustrated in FIG. 3, both under injection and over injection can result in an increase in bottom hole pressure, which reduces the efficiency of the well.
[0033] FIG. 3 also illustrates the recognition that, at any point in time over the natural decline curve of a well, an optimal gas injection rate can be identified by seeking the maximum BHP drawdown rate. FIG. 3 also illustrates that if a current gas injection rate is too low the gas injection must be increased to optimize production and increase bottom hole pressure drawdown. Likewise, FIG. 3 illustrates that if a current gas injection rate is too high then gas injection must be reduced to optimize production and increase bottom hole pressure drawdown.
[0034] The present disclosure is directed to determining a near optimal gas injection rate that will result in reducing a bottom hole pressure and/or enhancing the rate of bottom hole pressure drawdown. By monitoring or otherwise estimating a bottom hole pressure based on available data, a near optimal gas injection rate may be iteratively determined by increasing or decreasing gas injection rates to determine which injection rate yields the greatest rate of reduction of the bottom hole pressure (e.g., Bottom Hole Pressure Drawdown or BHPD). By tracking the different injection rates (e.g., injection rate setpoints) and comparing the results for each injection rate setpoint to previous injection rate setpoints, a trend can be developed which will indicate whether the current injection rate setpoint is above or below an optimal gas injection rate. Accordingly, the current injection rate setpoint may be adjusted to be nearer the optimal gas injection rate.
[0035] A practical example of the concepts shown in FIG. 1 and FIG. 3 can be seen in FIG. 4. Over the course of a 30 day well test, three different gas injection rates (e.g., gas injection rate setpoints or `GIR` were tested to determine which rate created the greatest decline in BHP. The slope of the decline was monitored, and it was determined that setpoint 2 (GIR2; 450 MCF) produced the steepest decline in BHP. Setpoints 1 (GIR1; 350 MCF) and 3 (GIR3; 550 MCF) did not produce a decline rate that was as steep as the decline rate of setpoint 2 (GIR2; 450 MCF) so these setpoints would not be considered optimal. The injection setpoint optimization process, which is discussed herein, automates this well testing process to constantly hunt for a near optimal gas injection rate while monitoring and tracking the changes in BHP.
[0036] The automated process (e.g., hunting process) of determining a near optimal gas injection rate uses several different inputs that are subsequently ran through a calculation to determine what the next output (i.e., gas injection rate setpoint) will be to eventually determine a near optimal gas injection setpoint. The hunting process is executed in an electronic controller\RTU\PLC or other processing device. The configuration, status, and results of the process may be made available to a remote terminal via a communications connection (e.g., via wireline or wireless communications) where an operator can review the data. Modifications to the configuration may be made remotely through the same connection.
[0037] FIG. 5 illustrates one embodiment of a production well incorporating equipment to implement the hunting process. As illustrated, a well head assembly 8 (e.g., a lubricator assembly) is disposed on the surface above a well bore having a casing string 10 and production tubing 12. In some embodiments, the well head assembly 8 contains a plunger auto catching device. However, this is not a requirement. The production tubing 12 includes multiple gas injection valves 22 along its length. In the illustrated embodiment, a gas injection line 30 connects the well bore to a gas source to allow injecting gas in the annulus between the casing string 10 and production tubing 12. As discussed above, this gas may pass through the gas injection valves and into the interior of the production tubing to lift production fluids to the surface.
[0038] Surface control equipment includes a master valve(s) 14 and a production line 16. The master valve 14 allows for opening and closing the well. In an embodiment, the master valve may operate in response to instructions from a well controller 40. The controller may operate the well based on time, pressure or based on operator-determined requirements for production. Alternatively, the controller may fully automate the production process. In the illustrated embodiment, the surface control equipment also includes the gas injection line 30, a gas injection control valve 32, a gas injection flow meter 34 and a source of injection gas. In the present embodiment, the source of injection gas is a compressor 36, which may compress available production gases (e.g., pipeline gases) in fluid connection (not shown) with the compressor. The gas injection flow valve 32 may be any electronic actuating valve that moves open and close based on an external input (e.g., valve control signal from the controller 40).
[0039] The controller 40, in the illustrated embodiment, is in data communication with either or both a bottom hole pressure gauge 42 and a production flow sensor 44. Information from these sensing devices may be used as an input in the hunting process. In this regard, the bottom hole pressure gauge 42 and/or the production flow sensor may generate an output that is indicative of a bottom hole pressure of the well. These outputs may be used to monitor bottom hole pressure drawdown for gas injection rate adjustment. However, it will be appreciated, that the bottom hole pressure may be otherwise measured or inferred. For instance, when a dedicated sensor is not available to monitor bottom hole pressure, the bottom hole pressure may be inferred from known well data and one or more variables (e.g., well depth, formation depth, casing size, temperature etc.) that are known to the controller and/or measured. By way of example, performance of a multiphase correlation calculation may provide an input associated with a down hole pressure. Various multiphase correlations are known including, without limitation, Hagedorn and Brown, Petroleum Experts, Petroleum Experts 2, Petroleum Experts 3, Fancher Brown, and Beggs and Brill, to name a few. Further, the controller 40 is in communication with the gas injection flow meter 34 to determine the rate that gas is being injected into the well (gas injection rate). The flow meter may be any electronic device that measures gas flow/volumes. In an embodiment, the flow meter measures gas flow through an orifice. The gas injection rate forms an input for the hunting process. The controller is also in communication with the gas injection control valve 32. The controller generates an output that adjusts the valve 32 to increase or decrease the gas injection flow (e.g., flow rate) into the well.
[0040] The controller 40 can include or perform functionality of the hunting process in addition to controlling the various valve and equipment at the well head. Alternatively, these function may be distributed between two or more controllers or processing platforms (not shown). Generally, the controller 40 may include various hardware elements and software elements. The hardware elements can include one or more processing units, one or more input devices (e.g., a keypad, modem etc.). The controller can also include one or more storage devices such as, by way of example, solid-state storage devices, random access memory (RAM) and/or a read-only memory (ROM) etc. The controller 40 can additionally include a communications system (e.g., a modem, a network card (wireless or wired), an infra-red communication device, etc.), and working memory, which can include RAM and ROM. The communications system can permit data to be exchanged with a network and/or a remote terminal 50. The controller 40 can also include software elements. In some embodiments, one or more functions of the hunting process are implemented as application code in working memory of the controller.
[0041] FIG. 6 illustrates a flow chart of one embodiment of the optimization hunting process 100 or hunting algorithm that may be implemented by the controller 40. To start, an initial gas injection rate or setpoint (e.g., a default injection rate setting or `kick-off setting) is maintained 102 for an initial time step or interval (e.g., hours or days) to establish a baseline or average bottom hole pressure. In this regard, the controller 40 receives an input from the gas injection flow meter 34 identifying the current gas injection flow rate and generates an output to the gas injection flow valve 32 to control adjust the gas injection rate (e.g., gas injection rates setpoint) into the well. That is, the system "kicks off" from a set of definable starting values (e.g., which may be user set) until the interval ends. At the end of the interval, a first bottom hole average pressure (e.g., first average BHP) is recoded/established 104 for the interval. At this time, the interval may be reset 105 and the gas injection rate or setpoint may be increased or decreased 106 by a predetermined amount, which may be a maximum increase/decrease adjustment (e.g., 50 MCF). By way of example, the initial gas injection rate or setpoint may initially be set at 325 MCF and may be increased 50 MCF to 375 MCF. Again, the controller may utilize information from the gas injection flow meter 34 to control the adjustment of the gas injection flow valve 32 to the new setpoint. This increased (or decreased rate) is maintained 107 for the time interval (e.g., step) to establish 108 a second bottom hole average pressure (e.g., second average BHP). Once the second average BHP is established, the time interval is reset 109 and the second average BHP is subtracted from the first average BHP to determine 110 a current Bottom Hole Pressure Drawdown (BHPD) (e.g., first drawdown rate). The BHPD represents a decrease in BHP (e.g., decrease in psi) over the time interval (e.g., hours, days weeks etc.). The gas injection rate or setpoint is then adjusted 112 in the same direction as the previous adjustment. Continuing the above example, the gas injection setpoint may be increased from 375 MCF to 425 MCF.
[0042] The new gas injection setpoint is maintained 113 for another time interval or step. After the time interval, a third bottom hole average pressure (e.g., third average BHP) is established 114 and the interval timer is reset 115. The third average BHP is then subtracted from the second average BHP (i.e., the previous BHP) to determine 116 an updated current BHPD (e.g., second drawdown rate). A determination 118 is made regarding the change in the drawdown rates. If the second drawdown rate is greater than the first drawdown rate, the bottom hole pressure is continuing to decrease and the adjustment is proceeding in the correct direction and further adjustment is made in that direction. Continuing with the present example, if the second drawdown rate is greater than the first drawdown rate, the gas injection setpoint (e.g., adjusted gas injection setpoint) is again increased 120, for example from 425 MCF to 475 MCF. In contrast, if the second drawdown is less than the first drawdown rate, the adjustment is proceeding in the wrong direction. In such a situation, the gas injection setpoint (e.g., adjusted gas injection setpoint) is decreased 122 at one-half of the previous adjustment step. In the case of the above example, the gas injection setpoint would decrease 25 MCF (e.g., a half adjustment or other fractional adjustment in the opposite direction) from 425 to 400. In either case, the loop continues for successive time intervals/steps where a gas injection rate is maintained 123 for a new interval and a new or current average BHP is calculated 114 for that interval. The current average BHP is then subtracted from the previous average BHP to establish a new or current BHPD, which is compared to the previous BHPD such that the gas injection rate may be further adjusted. Of note, adjustment of the gas injection rate in the same direction as the previous adjustment set forth above for the first two intervals is only required at the start of the process. After a first BHPD is established, the process may utilize any two BHPD to make subsequent adjustments without regard to successive adjustments being in the same direction.
[0043] The result of the hunting process set forth in FIG. 6 is that the gas injection setpoint is increased or decreased until the current drawdown rate is no longer larger than the previous drawdown rate. At this time, the gas injection setpoint has passed the optimal setpoint as shown in FIG. 3. At this time, the process reverses the direction of gas adjustment (e.g., increase or decrease) by half (or other fraction) of the previous step and the process continues. In this regard, the process continues to iterate toward the optimal setpoint using smaller adjustments to the gas injection rate setpoint. Of note, due to changes in the well itself, such as the decrease in production over time as illustrated in FIG. 1, the optimal setpoint for the well likewise changes over time. The process of FIG. 6 allows for continuing adjustment of the gas injection setpoint in an automated process while accounting for dynamic changes in the well itself.
[0044] FIGS. 7 and 8 illustrate thirty adjustments made to a Gas Injection Rate setpoint for an exemplary well. More specifically, FIG. 7 illustrates the adjustment in the GIR (i.e., GIR ADJ 210) per interval or step along with a change in the bottom hole pressure (i.e., BHP Delta 212) per interval or step. FIG. 8 illustrates the Gas Injection Rate-GIR 214 per interval or step, the optimal gas injection rate (Optimal Gas Injection Rate or Optimal Rate 216), as well as a minimum gas injection rate 218 and a maximum gas injection rate 220. For purposes of the example, for intervals or steps 1-14, the optimal gas injection rate is 698 MCF. After step 14, the optimal rate increases to 845 MCF. This increase represents, for example, a change to well conditions. For purposes of this example, a kick-off or initial gas injection rate is 325 MFC, the maximum gas injection rate adjustment (GIR ADJ) is 50 MCF and the first step direction is an increase in the gas injection rate.
[0045] The graph of FIG. 7 "Delta by Step" shows the adjustments GIR ADJ 210 made to the gas injection rate setpoint starting at the kickoff gas injection rate as well as the change in bottom hole pressure or BHP Delta 212 between steps. As shown, the GIR ADJ 210 is increased by the maximum (e.g., 50 MCF) for the first eight intervals or steps. This increase is also reflected in the GIR 214 of FIG. 8 which increases from 325 MCF to 725 MCF. During these steps, bottom hole pressure drawdown continues as the GIR 214 approaches the Optimal Gas Injection Rate 216. As shown, the GIR 214 crosses over the Optimal Gas Injection Rate 216 in Step 7 as best shown by FIG. 8 "Gas Injection Tracking". At the point of cross over, the magnitude of BHP Delta 212 reduces significantly in comparison of that recorded at the previous GIR. The process then reduces the size of the adjustment and inverts its direction to begin hunting the Optimal Gas Injection Rate 216. As shown between step 7 and step 13, the GIR 214 is adjusted to iterate around the Optimal Gas Injection Rate 216. For the purposes of this example, the Optimal Gas Injection Rate 216 increases in step 15 from 698 to 845. Accordingly, the process begins increasing the GIR 214 to hunt for the Optimal Gas Injection Rate 216, which has increased in the present example. The increase in the GIR ADJ 210 continues between steps 16 and 22 as the process searches for the Optimal Gas Injection Rate 216. At step 22, the GIR 214 again crosses the Optimal Gas Injection Rate 214 at which time the GIR ADJ reverses direction to continue iterating the GIR 214 about the Optimal Gas Injection Rate 214. Table 1 illustrates mathematical data for Example 1.
TABLE-US-00001 TABLE 1 GIR GIR BHP BHP Delta Interpretation ADJ Kickoff 325 2100 N\A Kickoff 50 Step 1 375 2099.690402 -0.309597523 Unloading 50 Step 2 425 2099.324102 -0.366300366 Unloading 50 Step 3 475 2098.875672 -0.448430493 Unloading 50 Step 4 525 2098.297637 -0.578034682 Unloading 50 Step 5 575 2097.484629 -0.81300813 Unloading 50 Step 6 625 2096.114766 -1.369863014 Unloading 50 Step 7 675 2091.76694 -4.347826087 Unloading 50 Step 8 725 2088.063236 -3.703703704 Build Up -25 Step 9 700 2038.063236 -50 Drawdown -50 Step 10 650 2035.979903 -2.083333333 Loading 25 Step 11 675 2031.632077 -4.347826087 Unloading 50 Step 12 725 2027.928373 -3.703703704 Build Up -25 Step 13 700 1977.928373 -50 Drawdown -50 Step 14 650 1975.84504 -2.083333333 Loading 25 Step 15 675 1975.256804 -0.588235294 Build Up -12.5 Step 16 662.5 1974.708859 -0.547945205 Loading 6.25 Step 17 668.75 1974.141483 -0.567375887 Unloading 12.5 Step 18 681.25 1973.530796 -0.610687023 Unloading 25 Step 19 706.25 1972.810075 -0.720720721 Unloading 50 Step 20 756.25 1971.683315 -1.126760563 Unloading 50 Step 21 806.25 1969.10267 -2.580645161 Unloading 50 Step 22 856.25 1960.213781 -8.888888889 Unloading 50 Step 23 906.25 1958.581128 -1.632653061 Build Up -25 Step 24 881.25 1955.822507 -2.75862069 Drawdown -50 Step 25 831.25 1948.54978 -7.272727273 Drawdown -50 Step 26 781.25 1946.981152 -1.568627451 Loading 25 Step 27 806.25 1944.400507 -2.580645161 Unloading 50 Step 28 856.25 1935.511618 -8.888888889 Unloading 50 Step 29 906.25 1933.878965 -1.632653061 Build Up -25 Step 30 881.25 1931.120345 -2.75862069 Drawdown -50
[0046] The process illustrated in FIGS. 6-8 works in most instances to drive a current Gas Injection Rate setpoint toward an Optimal Gas Injection Rate for current well conditions. Further, the process is dynamic in that it allows for making necessary changes even when well conditions change over time (e.g., increase in Optimal Rate). However, the application of the process in actual use can encounter situations that make the process less effective. By way of example, if the bottom hole pressure change (e.g., BHP Delta) fails to fall sufficiently between steps/intervals or builds between steps/intervals, reservoir pressure may be building and remedial action may be required. By way of further example, in some instances, insufficient gas may be available for injection.
[0047] FIG. 9 illustrates a modification to the process 100 of FIG. 6 that accounts situations where a bottom hole pressure change fails to change sufficiently between steps/intervals. Initially, the illustrated process 100A is substantially identical as the process 100 of FIG. 6 and like references are utilized for like process steps. As above, the process 100A, a kick-off gas injection rate (GIR) is maintained 102 for an initial interval to identify or establish a baseline or average bottom hole pressure. The interval is then reset and the GIR may be increased or decreased 106 by a predetermined amount. This increased (or decreased rate) is maintained for the time interval (e.g., step) to identify or establish 108 a second bottom hole average pressure (e.g., second BHP). Once the second BHP is established, the second BHP is subtracted from the first BHP to determine 110 a current Bottom Hole Pressure Drawdown (BHPD) (e.g., first drawdown). The gas injection rate or setpoint is then adjusted 112 in the same direction as the previous adjustment. The new gas injection setpoint is maintained for another time interval or step. After the time interval, a third bottom hole average pressure (e.g., third BHP) is identified or established 114. The third BHP is then subtracted from the second BHP (i.e., the previous BHP) to determine 116 an updated or current BHPD (e.g., second drawdown).
[0048] At this point in the process 100A, a determination is made regarding the magnitude of the current BHPD. Specifically, the current BHPD rate is compared 124 to a predetermined threshold. This threshold, referred to as the "Force Increase Threshold" in FIG. 9, is a minimum drawdown rate. If the current BHPD rate is below this threshold, it is presumed that the reservoir pressure is increasing or at least failing to drop. Such a reservoir increase/failure to drop is an indication that the well is under-injected and that the well may be fluid loading, which is undesirable. Accordingly, upon identifying such under-injection (i.e., BHPD rate <Force Increase Threshold), the process 100A increases 126 the gas injection rate for the next interval regardless of the current trend. In an embodiment, this forced increase is a maximum allowable gas rate increase. However, this is not a requirement. It the BHPD rate is greater than the threshold, the process 100A continues in an identical manner as the process 100 of FIG. 6.
[0049] Table 2 illustrates an exemplary set of well data wherein an initial GIR at kickoff is 500 MCF, a Maximum GIR adjustment (GIR ADJ) is 50 MFC and a Force Increase Threshold is 2 psi.
TABLE-US-00002 TABLE 2 BHP Step GIR BHP Delta Interpretation GIR ADJ Kickoff 500 2100 N/A Kickoff 50 Step 1 550 2090 -10 Unloading 50 Step 2 600 2075 -15 Unloading 50 Step 3 650 2065 -10 Buildup -25 Step 4 625 2051 -14 Drawdown -50 Step 5 575 2049 -2 Loading 25 Step 6 600 2053 3 Force Increase 50 Step 7 650 2043 -10 Unloading 50 Step 8 700 2020 -23 Unloading 50
In the example of Table 2, where the Force Increase Threshold is set as 2 psi., any change in the BHP delta that exceeds the 2 psi threshold will result in an automatic max increase to the gas injection setpoint regardless of the previous step adjustment direction. As shown, at step 6, proceeding an increase of 25 MCF in the GIR at step 5, the result was a BHP delta of 3 psi. As the BHP in step 6 was greater than the Force Gas injection Increase Threshold of 2 psi, the GIR adjustment to made for Step 7 is an increase to the GIR of 50 MCH, which equivalent to the max adjustment. Due to BHP Delta of Step 7 BHP delta being less than the Force Increase Threshold, the normal process or algorithm continues to run and a GIR increase is derived for Step 8 given the BHP of Step 7 is less than both the result of Step 6 and the Force Increase Threshold. The use of the Force Increase Threshold helps prevent the increase in bottom hole pressure, which may reduce production from the well.
[0050] As noted above, there may be times during production of a well where insufficient gas may be available for injection. That is, production gases from the well or nearby wells or pipelines are often utilized as the source of injection gas for artificial lift. At times, insufficient amounts of these gases may be available for injection. FIG. 10 illustrates a process 300 for use in monitoring when sufficient gas is available for injection. This process 300 is based on the realization that, when instantaneous gas injection rates fall to certain levels, the reduction of injection gas can impact the efficiency of the artificial lift technique (e.g., gas lift). Therefore, at any point, when current gas injection rates fall to predefined low levels, the results of the analysis determined by the hunting process/algorithm need to be protected by restarting the interval to gather analysis of the BHP drawdown of any particular Gas Injection Rate setpoint. The process 300 is a sub routine that operates in parallel with the hunting process/algorithm to protect the validity of the results of Bottom Hole Pressure drawdown associated with any Gas injection Set point in a defined interval.
[0051] As shown, the process (e.g., as implemented in the controller) periodically obtains 302 a current gas injection rate. The current gas injection rate may be a real-time reading of the rate that gas is being injected at surface into the well. Such current readings may be taken at user defined intervals. The current gas injection rate is compared 304 to a minimum gas injection rate setpoint or threshold. If the current gas injection rate exceeds the minimum gas injection rate threshold or setpoint, the hunting process 306 continues unabated until the next current gas injection rate is read and compared to the threshold. If the current gas injection rate falls below the defined setpoint/threshold, the process 300 enters a gas injection rate failure subroutine 308. At this time, the process stops the hunting algorithm/process and monitors the current gas injection rate 310. Such monitoring continues 312 until the available gas (e.g., current gas injection rate) exceeds the current gas injection setpoint (e.g., as previously determined by the hunting algorithm). Once the current gas injection rate is sufficient, the hunting algorithm/process interval and BHP averages are reset 314 and the gas injection continues at the last gas injection rate setpoint. Stated otherwise, should the Current Gas injection rate fall below the threshold, the data being averaged for the purpose of the hunting algorithm during that interval is thrown out and the hunting algorithm does not start a new interval until the current gas injection rate reaches the current gas injection rate set point. Once the current gas injection rate reaches the gas injection set point a new interval is started and the normal operation of the hunting algorithm commences.
[0052] Table 3 illustrates data for two intervals where a gas injection rate falls below a predetermined minimum. In the presented example the interval length is 24 hours with readings taken every hour and a minimum gas injection threshold of 300 MCF.
TABLE-US-00003 TABLE 3 BHP AVG BHP GIR for Interval Interval Time Setpoint GIR BHP interval Event Delta GIR ADJ 1 8:00 500 501 2000 2000 Start Of Interval 1 1 9:00 500 495 1999 1999.5 1 . . . . . . . . . . . . . . . 1 5:00 500 521 1986 1986 1 6:00 500 523 1987 1986.5 1 7:59 500 524 1988 1987.5 End of -12.5 50 Interval 1 2 8:00 500 514 1990 1988.333 Start of Interval 2 2 9:00 550 525 1989 1989 2 . . . . . . . . . . . . . . . 2 15:00 550 500 1988 1988 2 16:00 550 550 1986 1987 2 17:00 550 527 1985 1986.333 2 18:00 550 123 1998 1989.667 Enter MIN GIR FAIL 2 19:00 550 0 2000 2000 N\A 20:00 550 0 2001 2000.5 N\A 21:00 550 0 2002 2001.5 N\A 22:00 550 0 2003 2002.5 N\A 23:00 550 100 2004 2003.5 N\A 0:12 550 561 2004 2004 Exit Min GIR Fail 2 0:12 550 551 2004 2004 Restart Interval 2 2 1:12 550 556 2003 2003.5 2 . . . . . . . . . . . . . . . 2 23:12 550 521 1993 1993 2 0:12 550 552 1994 1993.5 End of -10.5 -25 Interval 2
As set forth in Table 3, numerous readings are omitted for purposes of presentation. Initially, Interval 1 starts at 8:00 with a GIR Setpoint of 500 MCF and BHP of 2000 psi. Every hour (or other sub-interval) the actual GIR is measured as is the bottom hole pressure. Of note, the actual GIR may vary from the GIR Setpoint. In this example, Interval 1 proceeds without the actual GIR falling below the minimum gas injection threshold. At the end of Interval 1 at 7:59 (i.e., next day), the BHP average is calculated from all of the readings, a BHP Delta is calculated and a GIR ADJ of +50 MCF is made to the GIR setpoint. Thus, Interval 2 starts with a GIR Setpoint of 550 MCF and a BHP Average of 1988.33. At 18:00, ten hours into Interval 2, the actual GIR (available gas) drops to 123 MFC, which is below the minimum gas injection threshold of 300 MCF. Thus, the process of FIG. 10 enters failure mode awaiting for available gas to reach the setpoint for Interval 2 (550 MCF). At 0:12, the available gas exceed the setpoint and the hunting algorithm restarts for a new 24 hour period. At the end of the new Interval 2, the BHP Delta is calculated from the BHP recorded or calculated at the start of new Interval 2 rather than the BHP recorded at the start of the aborted Interval 2. Accordingly, the gas injection rate adjustment (GIR ADJ) is calculated based on this BHP Delta.
[0053] The foregoing description has been presented for purposes of illustration and description. Furthermore, the description is not intended to limit the disclosed embodiments to the forms disclosed herein. Consequently, variations and modifications commensurate with the above teachings, and skill and knowledge of the relevant art, are within the scope of the present disclosure. The embodiments described hereinabove are further intended to explain best modes known of practicing the disclosed processes and to enable others skilled in the art to utilize these processes in such, or other embodiments and with various modifications required by the particular application(s) or use(s) of the presented disclosure. It is intended that the appended claims be construed to include alternative embodiments to the extent permitted by the prior art.
* * * * *
D00000
D00001
D00002
D00003
D00004
D00005
D00006
D00007
D00008
D00009
D00010
XML
uspto.report is an independent third-party trademark research tool that is not affiliated, endorsed, or sponsored by the United States Patent and Trademark Office (USPTO) or any other governmental organization. The information provided by uspto.report is based on publicly available data at the time of writing and is intended for informational purposes only.
While we strive to provide accurate and up-to-date information, we do not guarantee the accuracy, completeness, reliability, or suitability of the information displayed on this site. The use of this site is at your own risk. Any reliance you place on such information is therefore strictly at your own risk.
All official trademark data, including owner information, should be verified by visiting the official USPTO website at www.uspto.gov. This site is not intended to replace professional legal advice and should not be used as a substitute for consulting with a legal professional who is knowledgeable about trademark law.