Spectral analysis of gasses emitted during roasting food
Amanuel; Samuel ; et al.
U.S. patent application number 16/392851 was filed with the patent office on 2019-10-24 for spectral analysis of gasses emitted during roasting food. This patent application is currently assigned to Union College. The applicant listed for this patent is Samuel Amanuel, Palmyra Catravas, Joanne D. Kehlbeck. Invention is credited to Samuel Amanuel, Palmyra Catravas, Joanne D. Kehlbeck.
| Application Number | 20190323954 16/392851 |
| Document ID | / |
| Family ID | 68236867 |
| Filed Date | 2019-10-24 |


View All Diagrams
| United States Patent Application | 20190323954 |
| Kind Code | A1 |
| Amanuel; Samuel ; et al. | October 24, 2019 |
Spectral analysis of gasses emitted during roasting food
Abstract
A method for evaluating and controlling roasting and degree (level) of roast in food items including but not limited to: coffee, cocoa, beans, nuts, grains and seeds, involves collecting spectra of the gases (including water vapor) emitted during roasting in the mid-infrared region using either mid-infrared source or visible light to include Raman scattering. The changes in the spectra, due to absorption by molecular vibrations in the gases emitted during roasting are evaluated in real time during roasting. These data may be processed in frequency or time domain. The spectra and change in spectra are correlated with a roasting profile to mark the inception of roasting, progress of roasting and maturity/achievement of degree of a roast. The information can be transmitted to the roaster or controller to monitor the roasting progress and can be used to adjust parameters as desired during roasting.
| Inventors: | Amanuel; Samuel; (Schenectady, NY) ; Catravas; Palmyra; (Rockville, MD) ; Kehlbeck; Joanne D.; (Ballston Lake, NY) | ||||||||||
| Applicant: |
|
||||||||||
|---|---|---|---|---|---|---|---|---|---|---|---|
| Assignee: | Union College Schenectady NY |
||||||||||
| Family ID: | 68236867 | ||||||||||
| Appl. No.: | 16/392851 | ||||||||||
| Filed: | April 24, 2019 |
Related U.S. Patent Documents
| Application Number | Filing Date | Patent Number | ||
|---|---|---|---|---|
| 62661834 | Apr 24, 2018 | |||
| Current U.S. Class: | 1/1 |
| Current CPC Class: | A23F 5/04 20130101; G01N 21/65 20130101; G01N 2021/3595 20130101; G01N 33/02 20130101; G01N 21/3504 20130101 |
| International Class: | G01N 21/3504 20060101 G01N021/3504; G01N 21/65 20060101 G01N021/65; A23F 5/04 20060101 A23F005/04 |
Claims
1. A method for roasting a food item, comprising: heating a food item over time sufficient to obtain a desired flavor that accompanies physical and chemical changes in the food item, including the emission of gases; subjecting the emitted gases to electromagnetic radiation; measuring the interaction of the electromagnetic radiation with the emitted gases as a function of a roasting parameter to detect the spectral changes that accompany roasting; comparing the spectral changes that occur during a specific roasting profile in order to identify the points that mark at least one of the inception of roasting, progress of roasting and maturity of roasting; and adjusting at least one of the roasting parameters to achieve a desired roast of the food item based on the spectral data detected.
2. The method of claim 1, wherein the food item comprises coffee, cocoa, beans, nuts, grains or seeds.
3. The method of claim 1, wherein the electromagnetic radiation comprises mid-infrared or visible light.
4. The method of claim 1, wherein the roasting parameter comprises temperature or time.
5. The method of claim 1, wherein the spectra in the mid IR in the range of 4000 cm-1 to 400 cm-1 comprise absorption or transmission of electromagnetic radiation by the emitted gases.
6. The method of claim 1, wherein comparing a profile of the spectral changes comprises evaluating the intensity of the signals between 1726 cm-1 and 1690 cm-1 to mark at least one of the inception of roasting, level of a roast, progress of roasting and maturity of roasting.
7. The method of claim 1, wherein comparing a profile of the spectral changes comprises evaluating the intensity of the signals between 2200 cm-1 and 2000 cm-1 to mark at least one of the inception of roasting, level of a roast, progress of roasting and maturity of roasting.
8. The method of claim 1, wherein comparing a profile of the spectral changes comprises evaluating the intensity of the signals between 3000 cm-1 and 2800 cm-1 to mark at least one of the inception of roasting, level of a roast, progress of roasting and maturity of roasting.
9. The method of claim 1, wherein comparing a profile of the spectral changes comprises evaluating the intensity of the signals between 3500 cm-1 and 3100 cm-1 to mark at least one of the inception of roasting, level of a roast, progress of roasting and maturity of roasting.
10. The method of claim 1, further comprising the use of Raman scattering measurements on the emitted gasses during roasting to mark at least one of the inception of roasting, level of a roast, progress of roasting and maturity of roasting.
11. The method of claim 1, further comprising conducting a holistic evaluation of the evolution of the diagnostic features of the signals and/or functions of the signals as they change with a roasting parameter, wherein a holistic view of the roasting process shows the morphological signature of a particular roast.
12. The method of claim 1, further comprising applying mid IR measurements of emitted gases during roasting to provide calibration information for other sensors and diagnostic outputs.
13. The method of claim 1, further comprising applying mid IR measurements of emitted gases during roasting to mark the inception of roasting, progress of roasting and maturity/achievement of degree of a roast and providing fiducial information in tandem with other sensors.
Description
CROSS REFERENCE
[0001] This application claims the benefit of the filing date of U.S. Provisional Patent Application Ser. No. 62/661,834, filed Apr. 24, 2018 which is hereby incorporated by reference in its entirety.
FIELD
[0002] The present invention relates generally to the roasting of food items, and more specifically to real-time process and system control of roasting food items by monitoring of the evolved gases and their interaction with electromagnetic radiation.
BACKGROUND
[0003] Roasting is a critical step in food processing that significantly influences the quality of the final product. For example, the widespread consumption of coffee did not take a foothold until roasting was introduced, even though it was discovered much earlier in the southern highlands of Ethiopia. Currently, about two billion cups are consumed daily throughout the world. During roasting, the beans change in color, expand and contract, lose weight and moisture, and emit volatile organic compounds. Because these physical changes are correlated with the chemical reactions, artisans employ these physical changes as roasting markers. For instance, the "first crack" is commonly used to mark the beginning of light roast while the "second crack" is commonly associated with the transition from light to dark roast. These in conjunction with changes in visual appearance, such as change in color and luster, are widely used to classify the degree of a roast. These markers, however, are subjective and inherent differences in the beans limit their efficacy. Arabica beans appear more glossy than Robusta beans because of their greater lipid content. The differences in the beans cause also differences in the number of cracks. While an ensemble of beans crack twice as a chorus, some beans crack more than twice and yet other beans do not crack at all. In industrial settings, temperature profiles are heavily used to develop a desired roast. Temperature profile alone, however, cannot ensure the consistency of the desired roast due to variation in the beans and their moisture content.
[0004] Employing analytical techniques in conjunction with these common practices can improve the consistency of a roast. Baggenstoss et al. studied the evolution of water content, density and lightness (L) in conjunction with formation of aroma compounds and demonstrated that lightness is a better indicator of roast than time alone. Hashim and Chaveron suggest that the alkylpyrazine can be used to monitor degree of roasting. Hashim and Chaveron suggest that the ratio of 2-methylpyrazine to 2,5-dimethylpyrazine or ratio of 2-methylpyrazine to 2,6-dimethylpyrazine can be used as marker for roasting. Similarly, Nehring and Maier used capillary gas chromatography to quantify the alanine, leucine, phenylalanine content in roasted beans in order to indirectly calculate the organic roasting loss (ORV) during roasting. In general, darker roasts have lower level of phospholipids, chlorogenic acids, 3-mercapto-3-methylbutyl esters but higher amounts of cafestol and kahweol. Over-roasting, however, degrades the cafestol and kahweol.
[0005] Molecular vibrations have been used to monitor Maillard reactions in food and to study coffee specifically. Most of the studies on coffee, however, have focused on quality control to identify defects in beans and discriminate bean cultivar. El-Abassy et al. used micro-Raman spectroscopy to discriminate Arabica green beans from Robusta green beans. Briandet et al. showed DRIFT and ATR can be used to distinguish Arabica from Robusta in instant coffee. Esteban-Diez, Gonzalez-Saiz and Pizarro used NIR spectra to distinguish Arabica from Robusta beans. Craig et al studied vibrational bands from carbohydrates, amino acids, lipids, caffeine and chlorogenic acid in roasted coffee beans using ATR-FTIR and NIR in order to distinguish defective from non-defective beans. Craig et al. claim that the models from the NIR measurements are robust in quantitatively discerning adulterated coffee grounds from defective beans. Few IR studies have focused on using the technique to identify degree of roast. NIR has been used to correlate ash and lipid content with degree of roast. Similarly, absorbance in the NIR has been correlated with color, weight, density and moisture content to predict roasting degree in Arabica, Robusta and mixtures of Arabica and Robusta beans. Because of scattering, however, interpretation of the NIR spectra is difficult without doing significant data processing. Lyman et al used FTIR-ATR to study the effect of roasting conditions on the flavor-print in brewed coffee and found that the type and concentration of the carbonyl compounds formed during roasting depends on the roasting conditions. A major drawback of these techniques is that the analyses take a long time and the information cannot be provided in real-time during roasting. Alternatively, time of flight mass spectrometry (TOFMS) of the volatile organic compounds (VOC) emitted during roasting of coffee beans has been useful in providing real-time information during roasting.
SUMMARY
[0006] In accordance with one aspect of the present disclosure, there is provided a method for roasting a food item, including:
[0007] heating a food item over time sufficient to obtain a desired flavor that accompanies physical and chemical changes in the food item, including the emission of gases;
[0008] subjecting the emitted gases to electromagnetic radiation;
[0009] measuring the interaction of the electromagnetic radiation with the emitted gases as a function of a roasting parameter to detect the spectral changes that accompany roasting;
[0010] comparing the spectral changes that occur during a specific roasting profile in order to identify the points that mark at least one of the inception of roasting, progress of roasting and maturity of roasting; and
[0011] adjusting at least one of the roasting parameters to achieve a desired roast of the food item based on the spectral data detected.
[0012] These and other aspects of the present disclosure will become apparent upon a review of the following detailed description and the claims appended thereto.
BRIEF DESCRIPTION OF THE DRAWINGS
[0013] FIG. 1 is a series of mid-IR absorption spectra of the gases emitted during roasting with the temperatures indicated in .degree. C.;
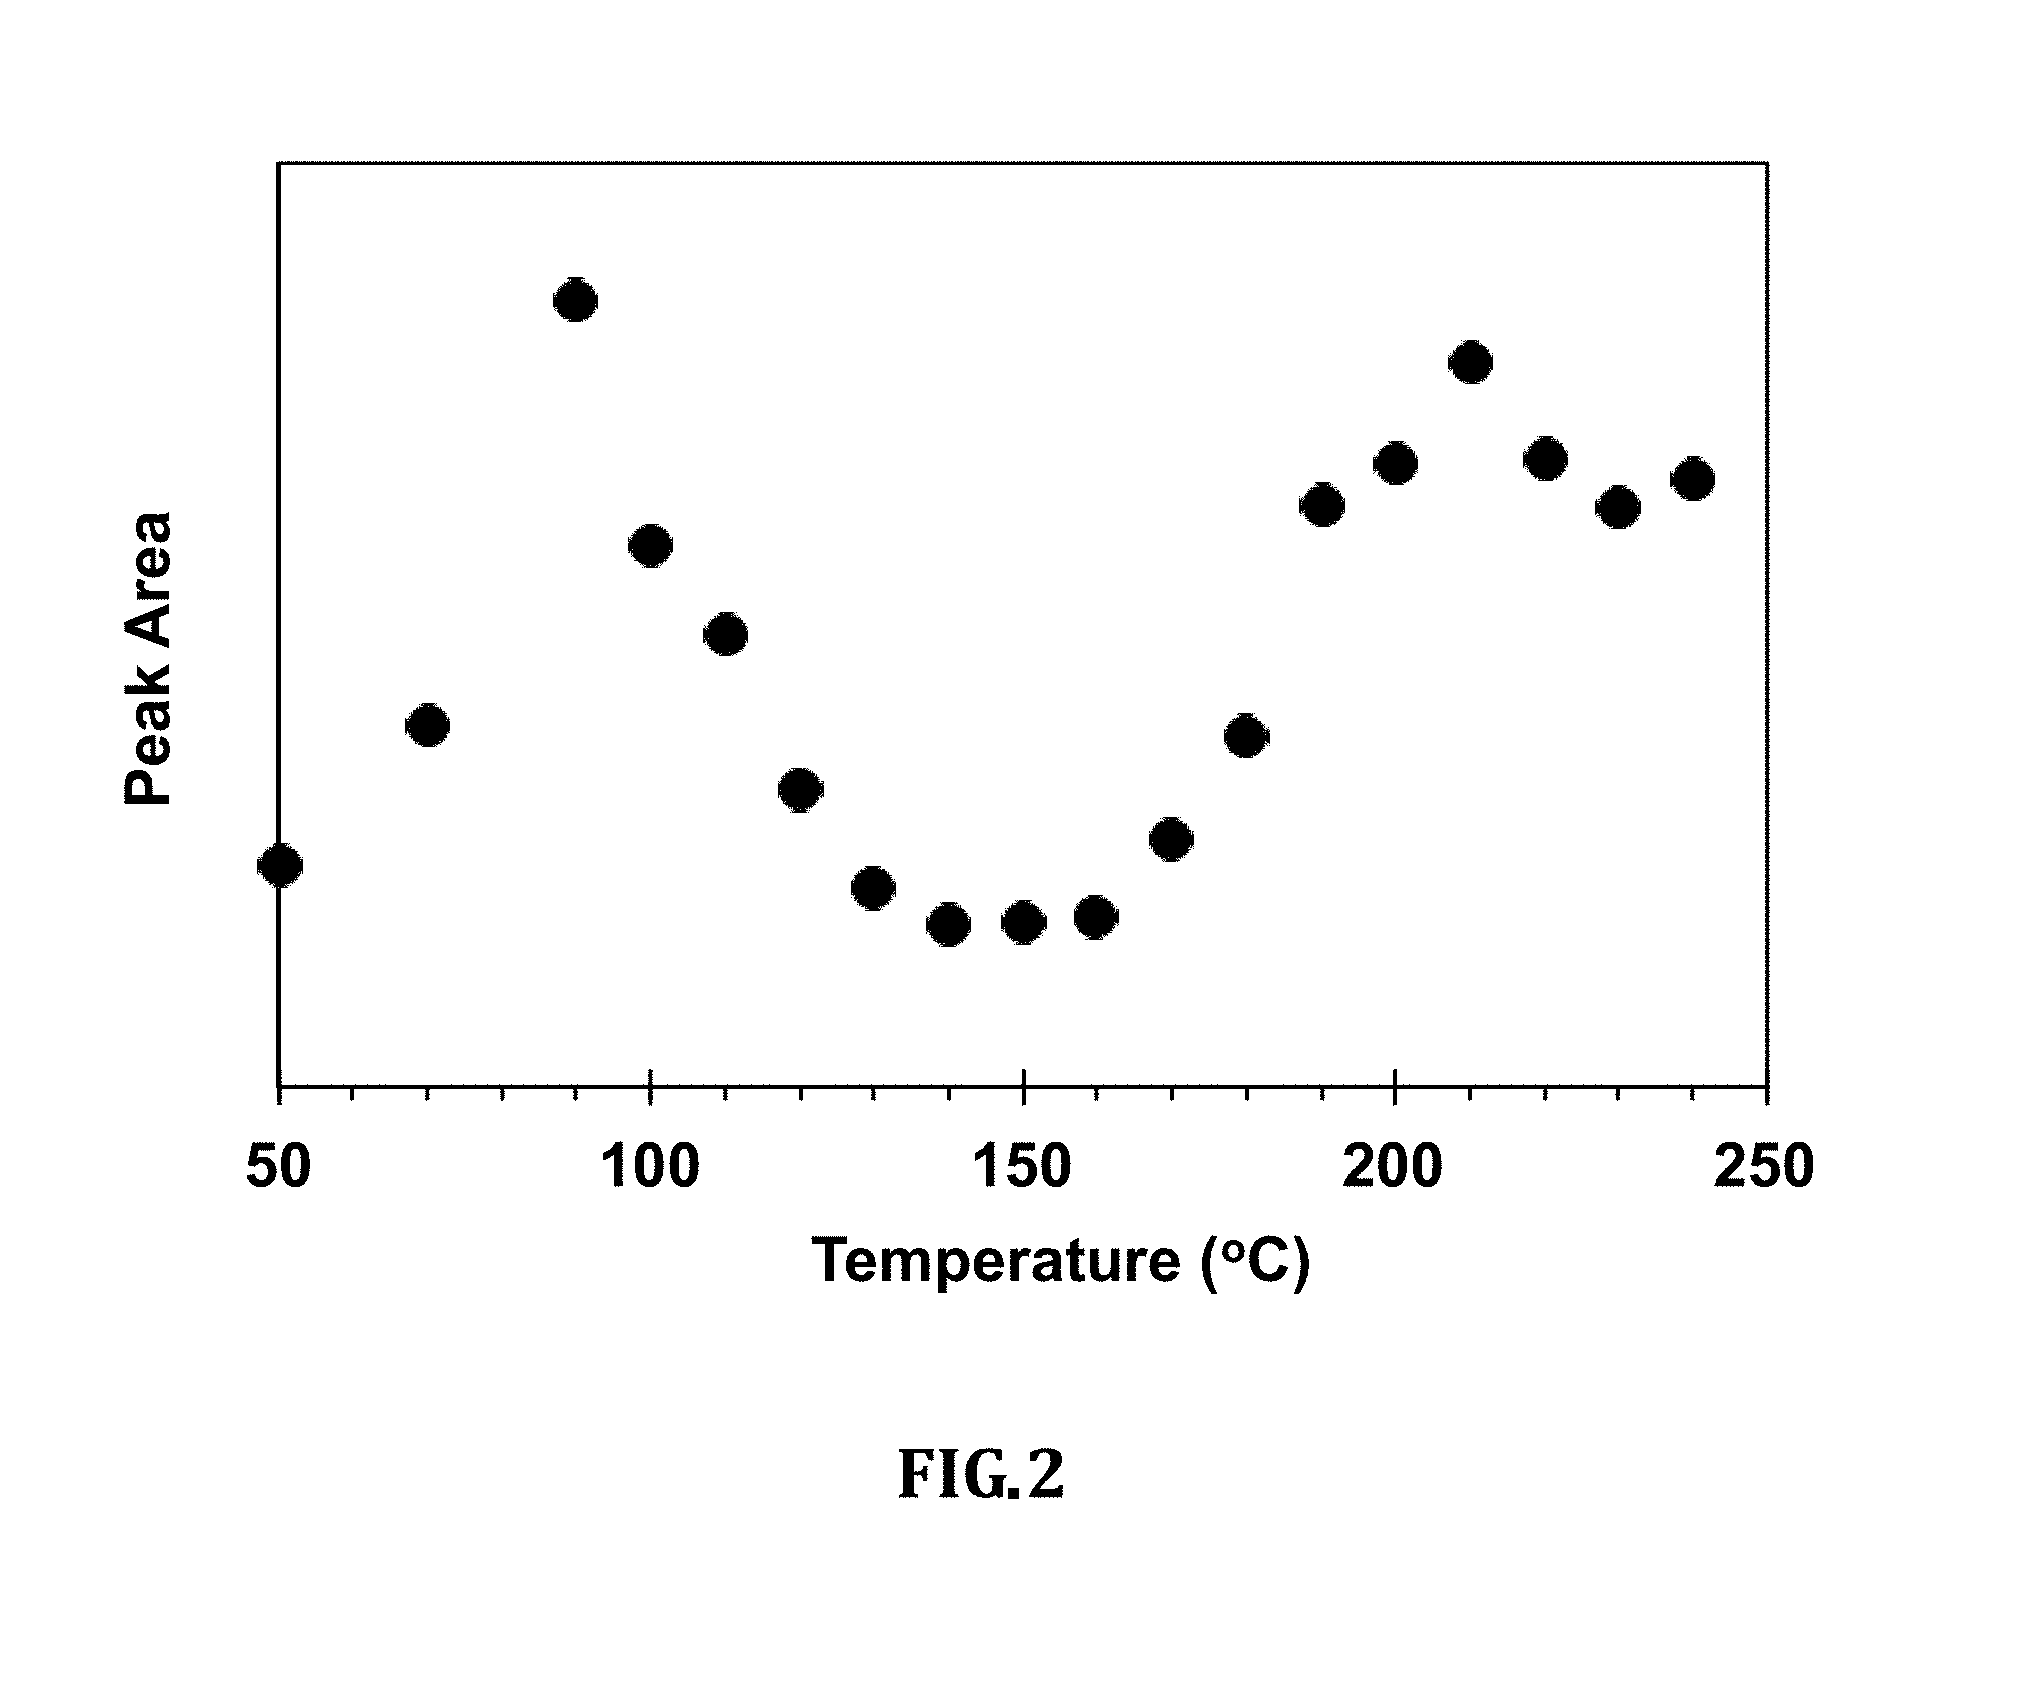
[0014] FIG. 2 is a graph of the intensity of the absorption as calculated from the area under the peaks between 1726 and 1691 cm-1;
[0015] FIG. 3 is a graph of the intensity of the absorption as calculated from the area under the peaks between 2985 and 2831 cm-1;
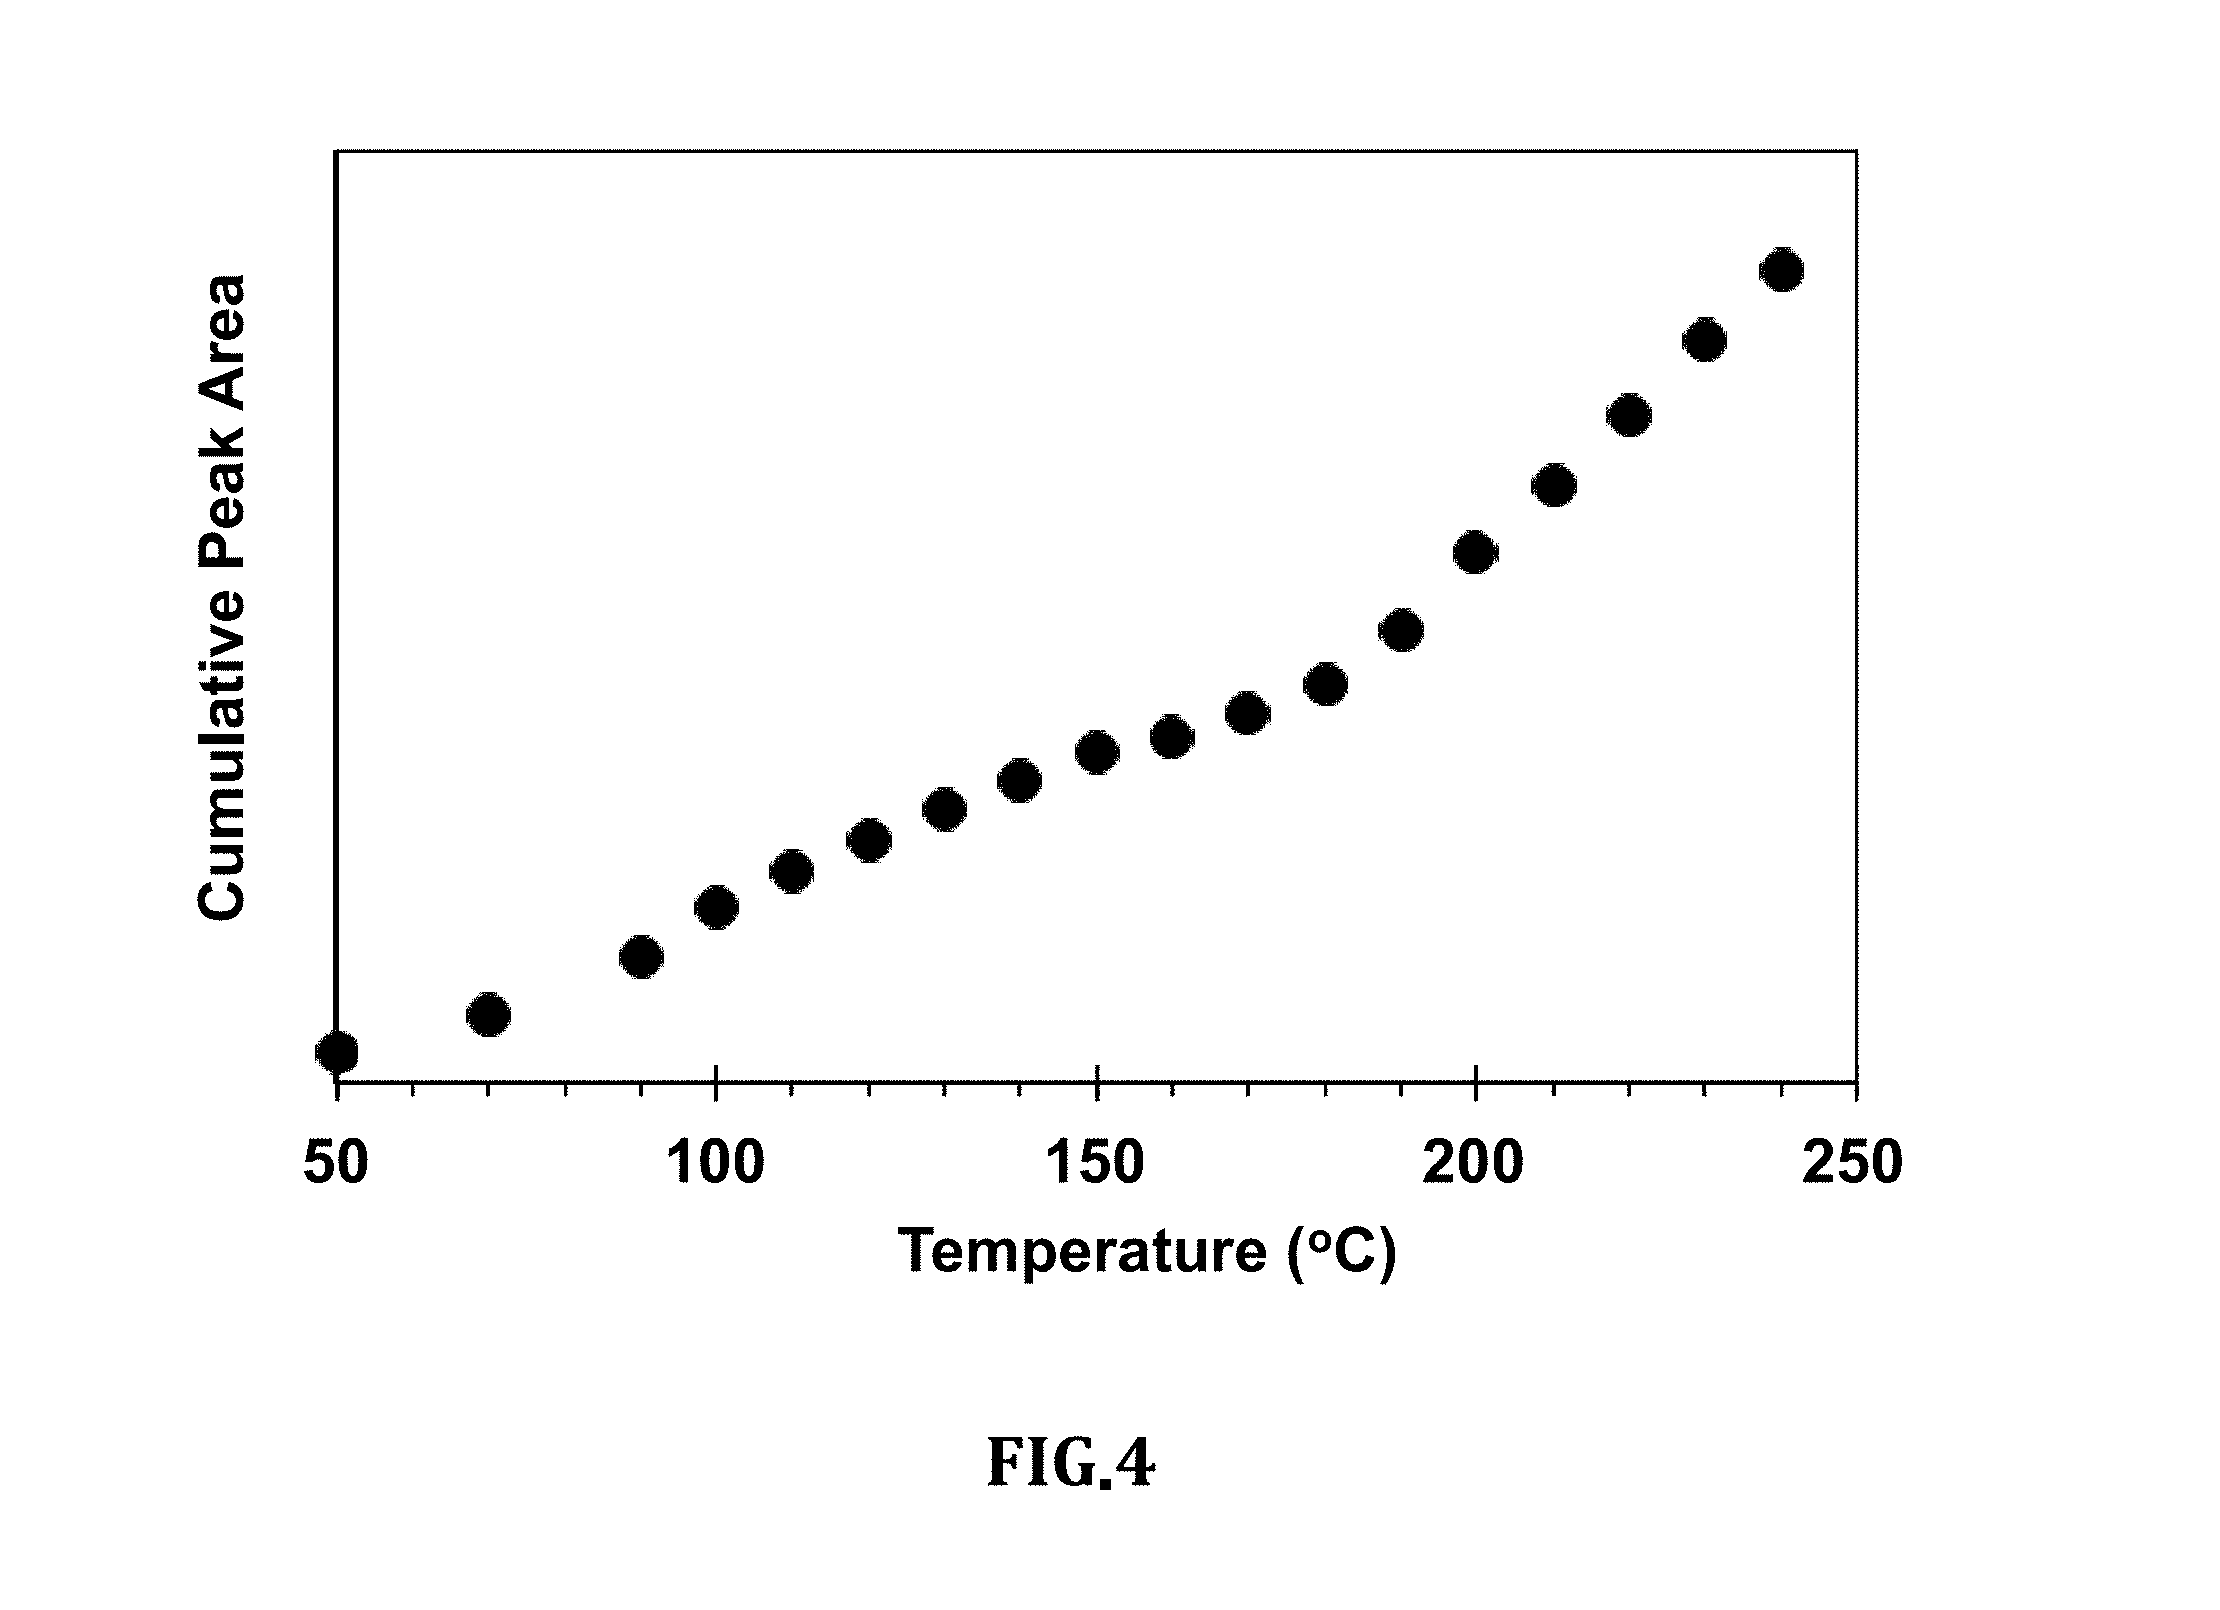
[0016] FIG. 4 is a graph of the cumulative intensity of the absorption as calculated from the sequential sum of areas in FIG. 2;
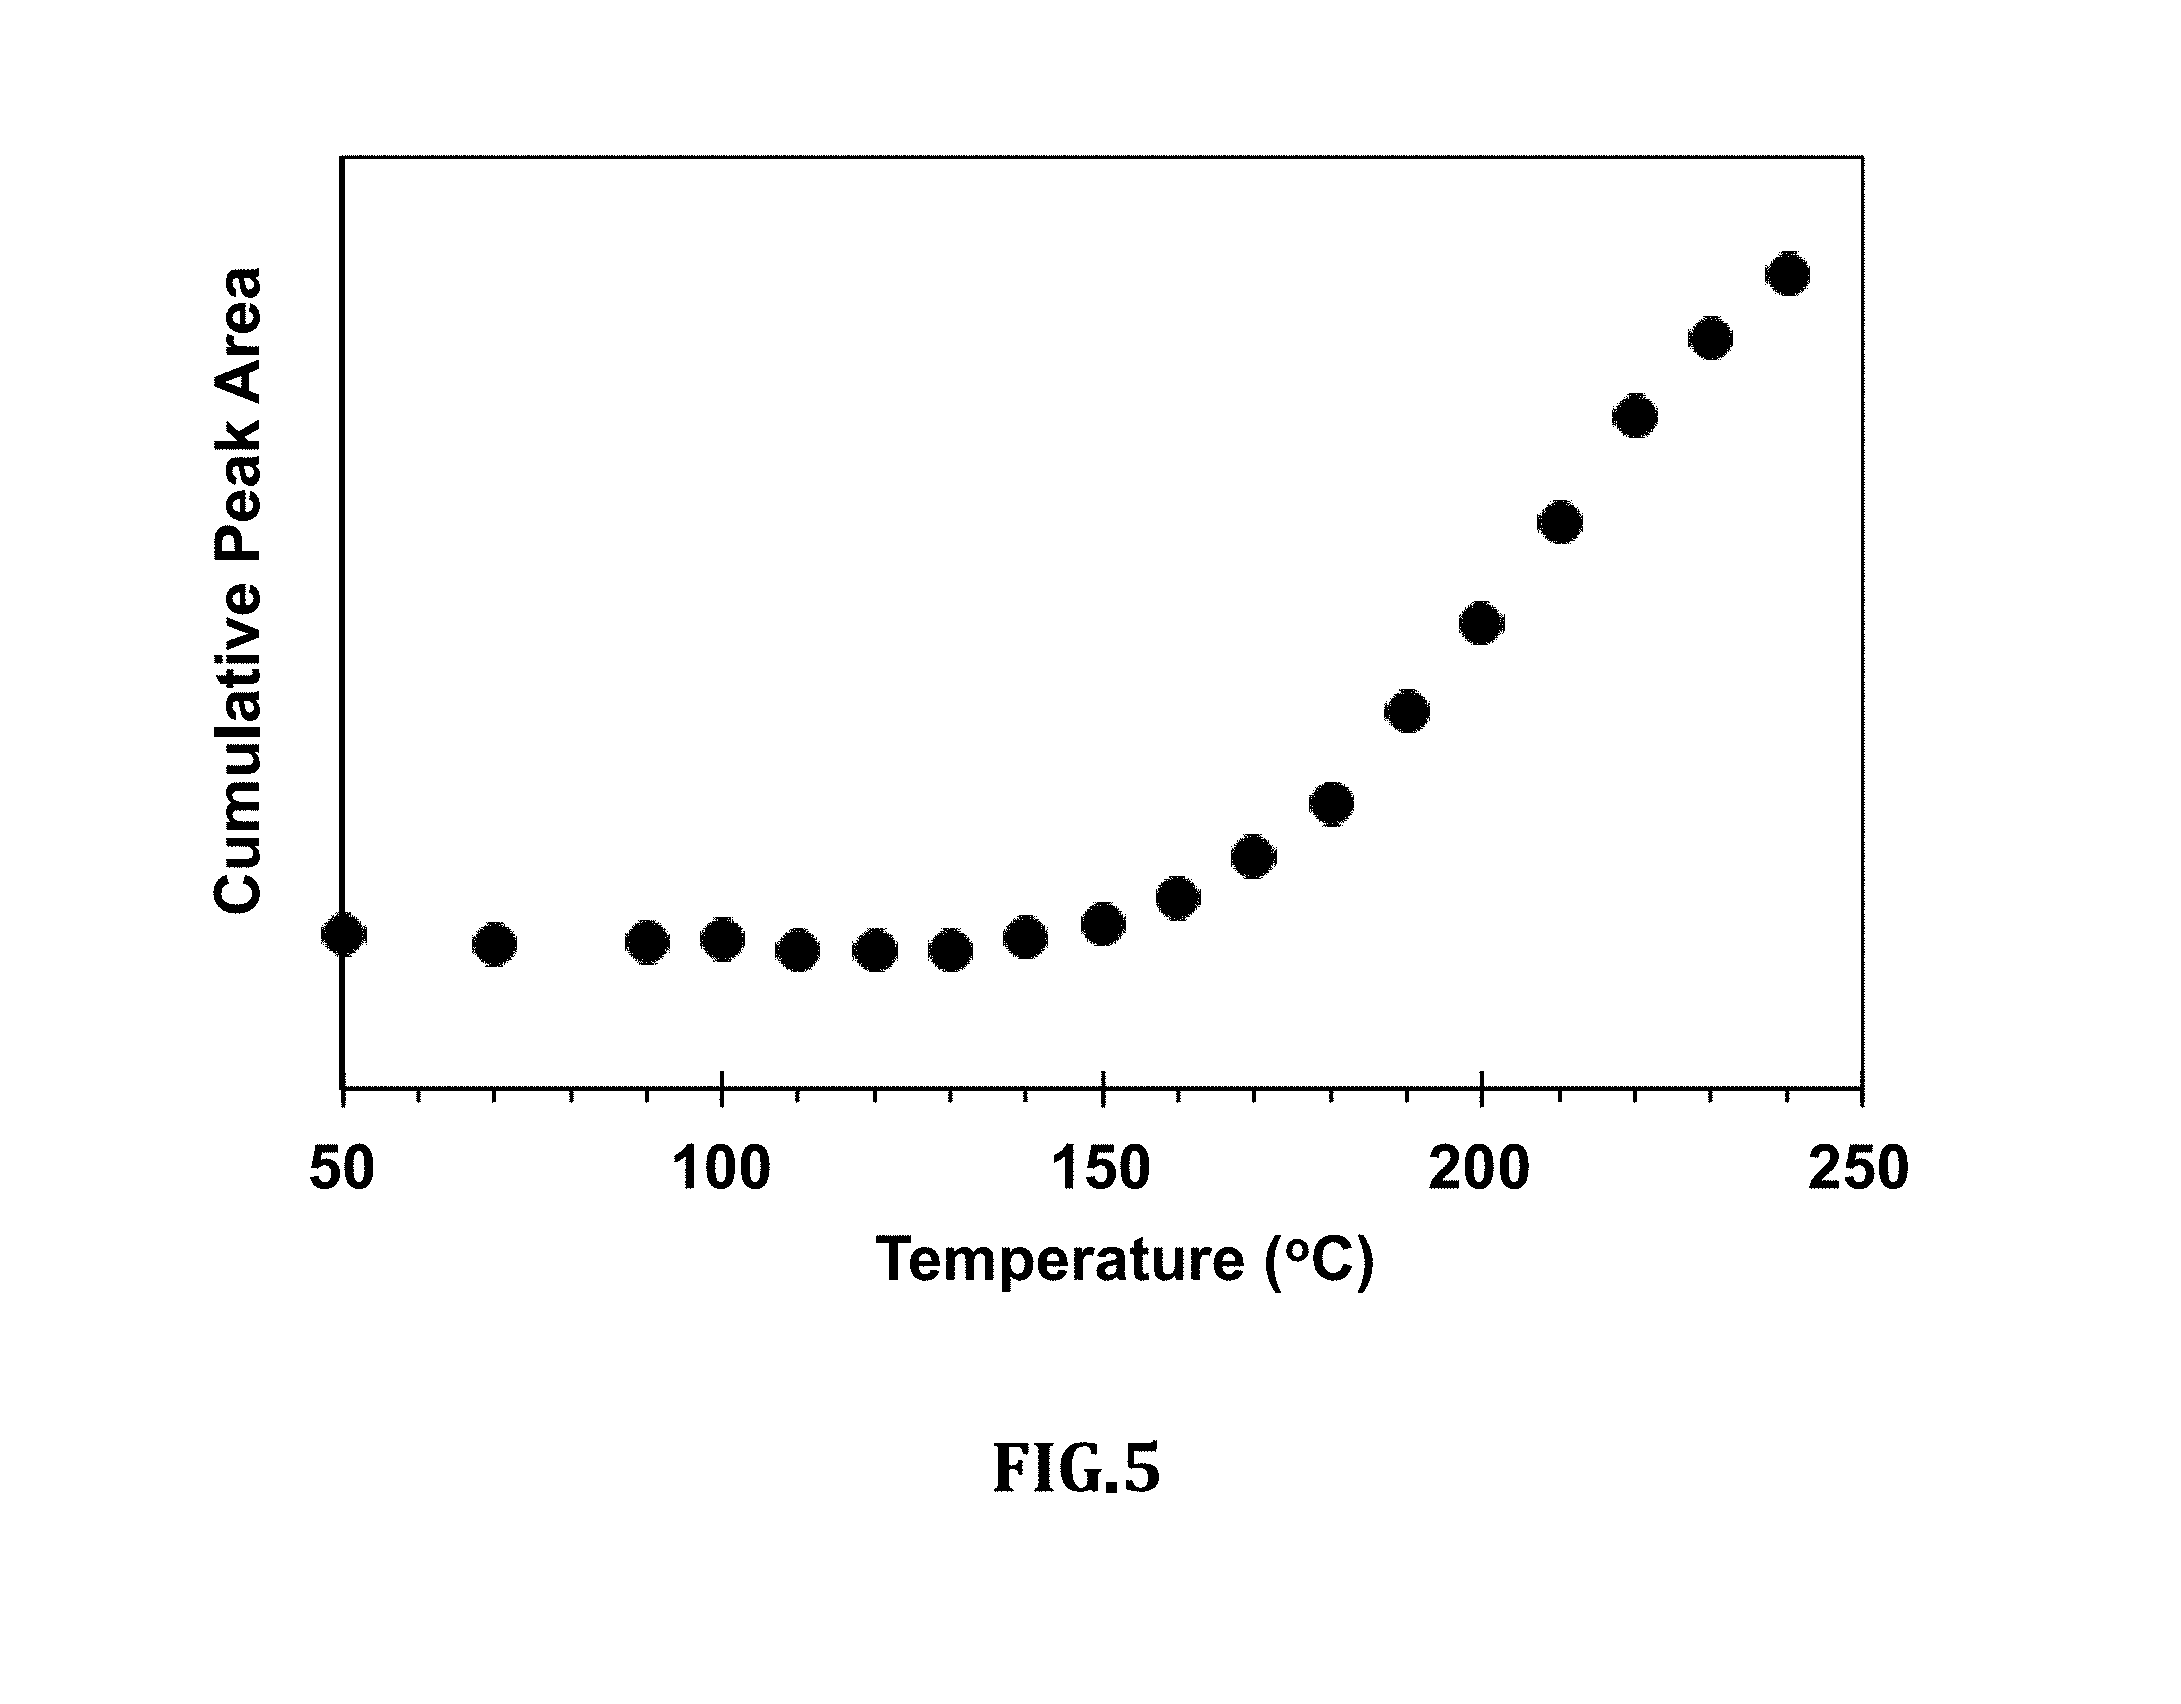
[0017] FIG. 5 is a graph of the cumulative intensity of the absorption as calculated from the sequential sum of areas in FIG. 4;
[0018] FIG. 6 is the sequence of mid-IR absorption spectra at different temperatures of the gases emitted during roasting after baseline removal of the even vertical shift for each spectrum;
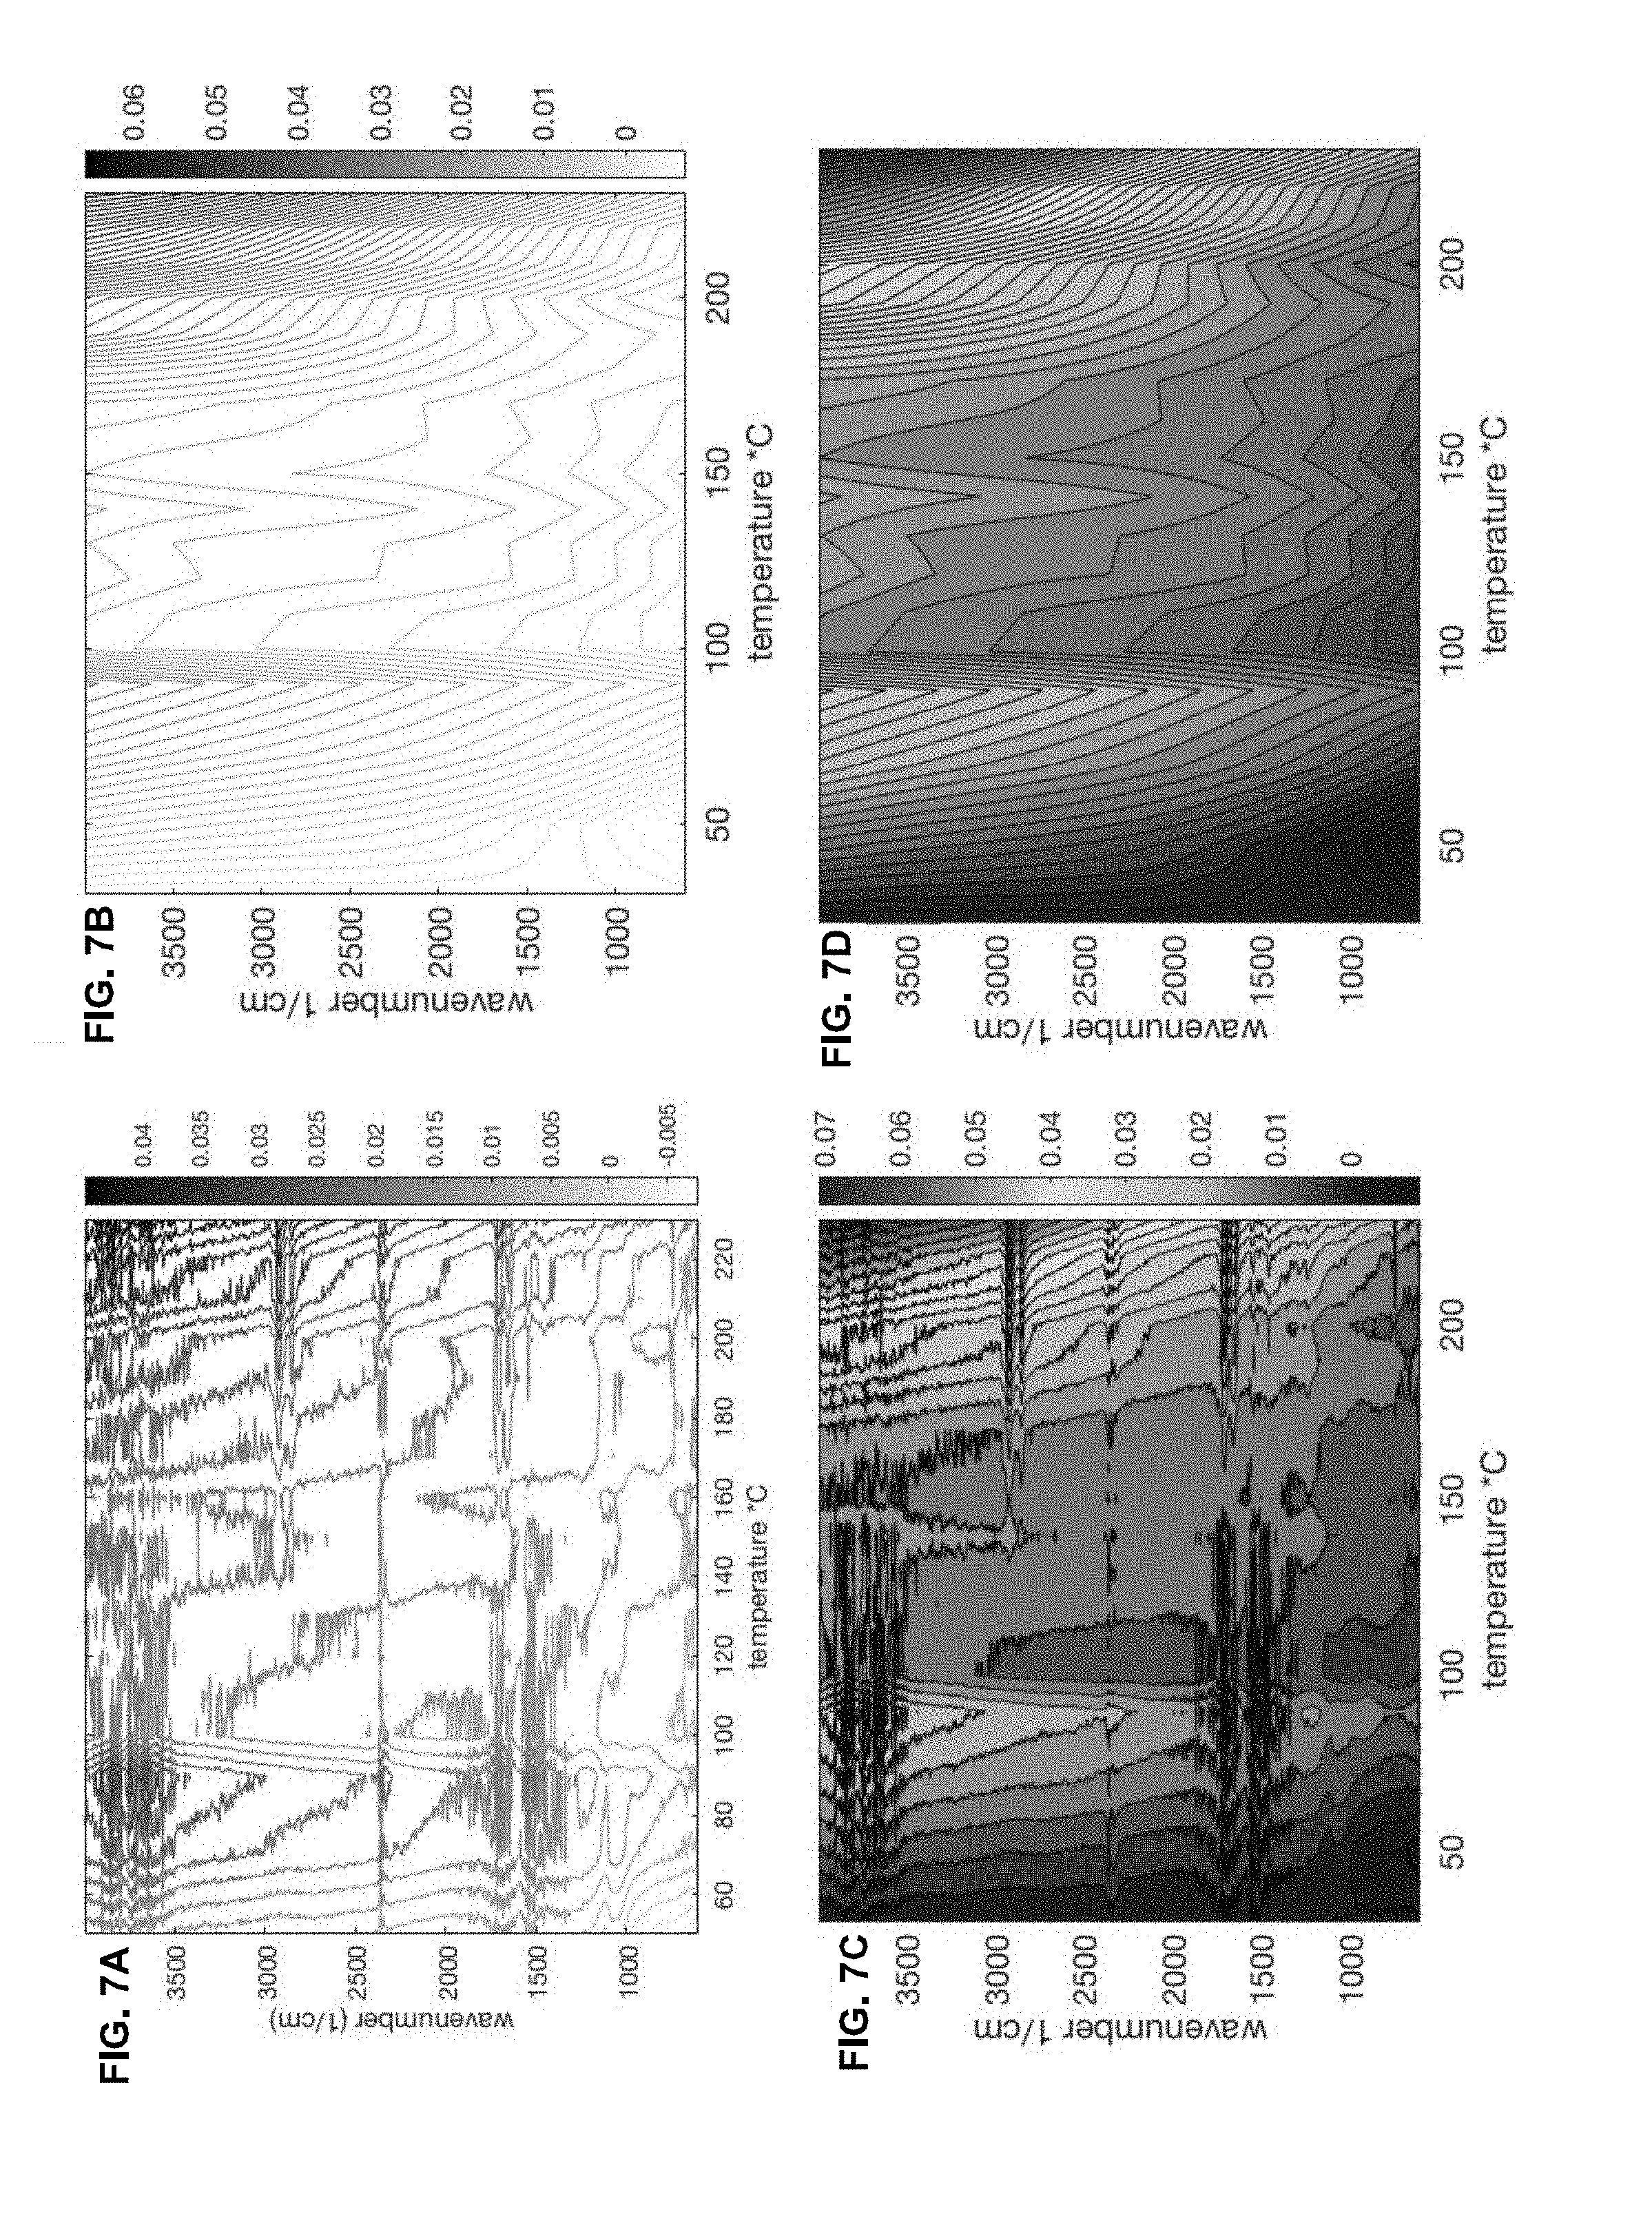
[0019] FIG. 7A shows a contour plot of the raw mid-IR absorption spectra, while FIG. 7B shows the global evolution of the uneven vertical shift of the spectra across the temperature range from 30.degree. C. to 240.degree. C. and color versions of the greyscale plots in FIGS. 7A and 7B are shown in FIGS. 7C and 7D, respectively;
[0020] FIG. 8A shows a contour plot of the absorption spectra (intensity vs heating stage temperature and wavenumber), along with FIG. 8B, the cumulative signal resolved in each wavenumber bin between 3000 and 2750 cm-1, with color versions provided in FIGS. 8C and 8D;
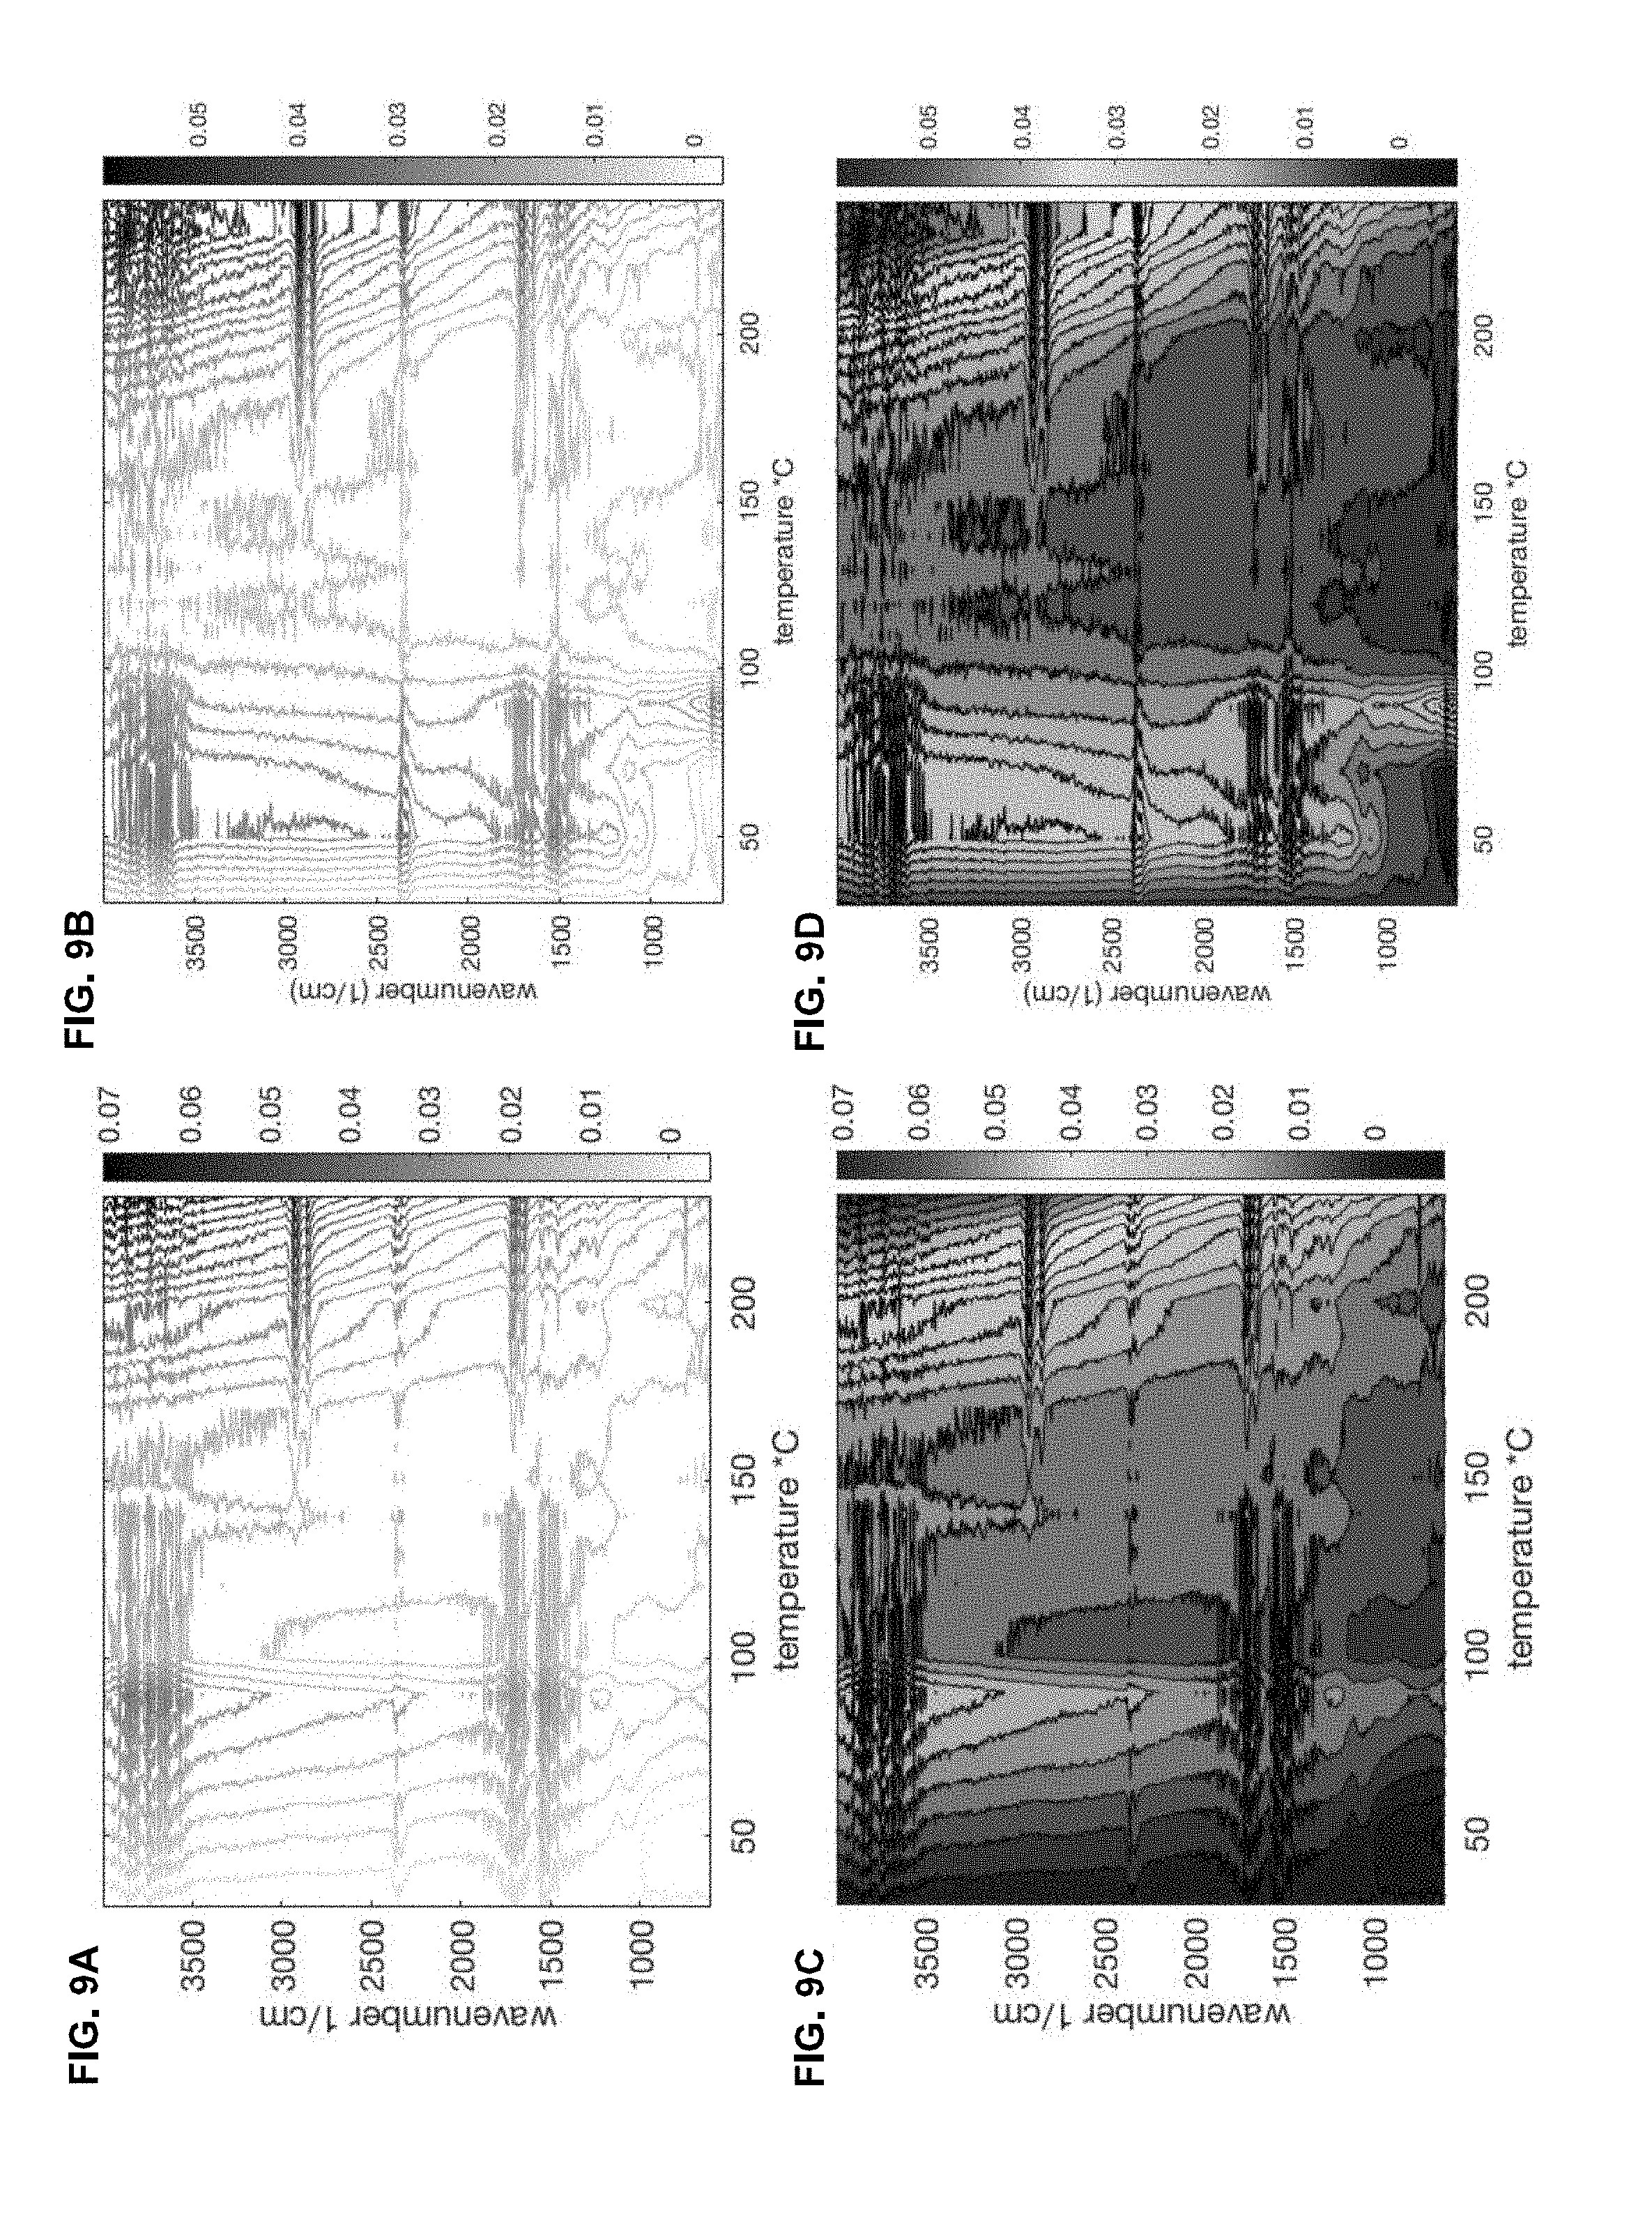
[0021] FIGS. 9A and 9B compare the contour plots for two different roasts, showing the correlated holistic evolution of both the spectral peaks and the uneven vertical shift, which contain complementary diagnostic information, with color versions provided in FIGS. 9C and 9D;
[0022] FIG. 10 is a second example of a series of mid-IR absorption spectra acquired during roasting with the temperatures indicated in .degree. C., for an alternate approach to background subtraction (Example 2);
[0023] FIG. 11 shows a series of mid-IR absorption spectra at different temperatures of the gases emitted during roasting after baseline removal of the even vertical shift for each spectrum for Example 2;
[0024] FIG. 12 is a graph of the intensity of the signals as calculated from the area under the peaks between 2985 and 2831 cm-1 for Example 2;
[0025] FIGS. 13A-13D is the equivalent of FIGS. 7A-7D, for Example 2, respectively; and
[0026] FIG. 14A is a graph of the intensity of the absorption as calculated from the area under the peaks between 1726 and 1691 cm-1 for Example 2, FIG. 14B and FIG. 14D show the contour plot of the intensity of the absorption for each wavenumber bin as a function of temperature, and FIG. 14C and FIG. 14E show the derivative of the intensity with respect to temperature, which improves the discernment of multiple signatures in the spectrum, including the onset of roasting over FIGS. 14A, 14B and 14D for the background subtraction method used in Example 2.
DETAILED DESCRIPTION
[0027] The present invention is directed to a method for marking the inception of roasting, progress of roasting and maturity and achievement of degree of a roast in food items including but not limited to: coffee, cocoa, beans, nuts, grains and seeds, from the mid-IR spectra of the gases emitted during roasting. The present invention involves the use of mid-IR sources directed to the gases emitted during roasting. The changes in spectra due to absorption by the molecular vibrations in the gases are correlated individually or in tandem with each other with roasting parameters and degree of roast in the food items. The profile of these changes is correlated with a pre-described roasting profile to mark the inception of roasting, progress of roasting and maturity of the roasting.
[0028] The method for roasting a food item includes heating a food item over time sufficient to obtain a desired flavor that accompanies physical and chemical changes in the food item, including the emission of gases.
[0029] Another aspect of the invention uses a visible light source and a detector to probe the gases emitted during roasting using Raman scattering. The changes in spectra due to absorption by the molecular vibrations in the gases are correlated individually or in tandem with each other with roasting parameters and degree of roast in the food items. The profile of these changes is correlated with a pre-described roasting profile to mark the inception of roasting, progress of roasting and maturity of the roasting.
[0030] Aspects of the invention include evaluating the intensity of the signals between 1726 cm-1 and 1690 cm-1, to mark the inception of roasting, level of a roast, progress of roasting and maturity/achievement of degree of a roast of food items.
[0031] Aspects of the invention include evaluating the intensity of the signals between 2200 cm-1 and 2000 cm-1, to mark the inception of roasting, level of a roast, progress of roasting and maturity/achievement of degree of a roast of food items.
[0032] Aspects of the invention include evaluating the intensity of the signals between 3000 cm-1 and 2800 cm-1, to mark the inception of roasting, level of a roast, progress of roasting and maturity/achievement of degree of a roast of food items.
[0033] Aspects of the invention include evaluating the intensity of the signals between 3500 cm-1 and 3100 cm-1, to mark the inception of roasting, level of a roast, progress of roasting and maturity/achievement of degree of a roast of food items.
[0034] Another aspect of the invention includes the use of mid IR measurements of emitted gases during roasting to provide calibration information for other sensors and diagnostic outputs that can be used to mark the inception of roasting, level of a roast, progress of roasting and maturity/achievement of degree of a roast of food items.
[0035] Another aspect of the invention includes the use mid IR measurements of emitted gases during roasting to mark the inception of roasting, progress of roasting and maturity/achievement of degree of a roast and provide fiducial information in tandem with other sensors.
[0036] The foregoing has outlined in general how the molecular vibrations in the gasses emitted during roasting can be used to mark the inception of roasting, level of a roast, progress of roasting and maturity/achievement of degree of a roast of food items.
[0037] The present invention relates generally to the roasting of food items, and more specifically, to real-time process and system control of coffee roasting by monitoring the evolved gases and their absorption in the mid infrared radiation. The present invention correlates mid-IR spectral analysis of gases emitted during roasting in real time with a roasting profile in food items (including but not limited to: coffee, cocoa, beans, nuts, grains and seeds) that mark the inception of roasting, progress of roasting and maturity/achievement of degree of a roast.
[0038] During roasting of food items different gases (including water vapor) are released at different stages of the roasting. The present invention probes the gases using a mid-infrared and visible electromagnetic radiation source and detects what is transmitted, reflected, and diffusely scattered. Part of the radiation is absorbed due to the molecular vibrations and the strength of the absorption is due to the gaseous products formed during roasting and is correlated with roasting parameters of the food items and degree of roast in the food items.
[0039] The disclosure will be further illustrated with reference to the following specific examples. It is understood that these examples are given by way of illustration and are not meant to limit the disclosure or the claims to follow.
[0040] Example 1: FTIR spectra were collected in a reflection mode using a Hyperion microscope (Bruker) with MCT detector. We collected 64 scans with 4 cm.sup.-1 resolution. Four Yirga Chefe green beans (2 with their seam up and 2 with their seam down) were placed in a modified heating (Linkam) stage where a thin metallic foil was used to reflect the IR beam. The beans were placed in such a way that they did not to block any part of the IR beam. Temperature of the stage was raised at 10.degree. C. per minute and was held isothermally for 4 minutes at each prescribed temperature. As soon the temperature reached the set point, a spectrum was collected and background was collected before the temperature was raised.
[0041] FIG. 1 is a series of mid-IR absorption spectra of the gases emitted during roasting. The spectra are collected in reflection mode with the temperatures indicated. Arabica coffee beans were used in this experiment.
[0042] FIG. 2 is a graph of the intensity of the absorption as calculated from the area under the peaks between 1726 and 1691 cm-1.
[0043] FIG. 3 is a graph of the intensity of the absorption as calculated from the area under the peaks between 2985 and 2831 cm-1.
[0044] FIG. 4 is a graph of the cumulative intensity of the absorption as calculated from the sequential sum of areas in FIG. 2.
[0045] FIG. 5 is a graph of the cumulative intensity of the absorption as calculated from the sequential sum of areas in FIG. 4.
[0046] For instance, FIG. 1 presents absorbance spectra collected at different temperatures during roasting of Arabica coffee. These spectra have been shifted vertically for the clarity of presentation. However, they have not been modified in any other way. The multiple sharp peaks in the two regions of 3800-3500 cm-1 and 1850-1350 cm-1 are indicative of water vapor released at different stages. Because the vapors do not readily escape from the roasting chamber, they condense and form droplets along the beam path. This causes Mie scattering and can manifest as uneven vertical shift in the absorbance spectra. Coffee beans with significant (initial) water content cause significant scattering in comparison to coffee beans that are dry. This is more pronounced at lower temperatures when most of the bulk water is released from the beans.
[0047] The intensity of absorption due to molecular vibrations can be used as a roasting marker. The intensity of several vibrational bands from the area under the peak was calculated. FIG. 2 shows how the intensity of the signals between 1726 and 1691 cm.sup.-1 changes with temperature where there are two maxima as a function of temperature. The first is due to drying of the beans whereas the maximum at higher temperature is due to roasting of the beans. The onset of the second maximum and its levels mark the inception of roasting, level of a roast, progress of roasting and maturity/achievement of degree of a roast.
[0048] FIG. 3 shows how the intensity of the signals between 2985 and 2831 cm.sup.-1 changes with temperature where there is rapid increase in intensity above 150.degree. C. This marks the inception of roasting and its values indicate the level of a roast, progress of roasting and maturity/achievement of degree of a roast.
[0049] Because we collected background at each set temperature, another way of looking at the intensity is by looking at the cumulative area of the peaks. FIG. 4 shows the cumulative area of the between 1726 and 1691 cm.sup.-1 which was obtained by sequentially adding the areas in FIG. 2. The intensity as presented in FIG. 4 increases with the temperature, however, the rate of increase is different at different temperatures. Fast increase is obtained above 150.degree. C., which indicates inception of roasting. The values of the intensity indicate the level of a roast, progress of roasting and maturity/achievement of degree of a roast.
[0050] Similarly, FIG. 5 shows the cumulative area of the between 2985 and 2831 cm.sup.-1 which was obtained by sequentially adding the areas in FIG. 3. The intensity as presented in FIG. 5 increases rapidly above 150.degree. C., which indicates inception of roasting. The values of the intensity indicate the level of a roast, progress of roasting and maturity/achievement of degree of a roast.
[0051] The intensity of absorption due to molecular vibrations individually or in tandem with each other indicates inception of roasting, level of a roast, progress of roasting and maturity/achievement of degree of a roast.
[0052] Visualization of the signals and of functions of the signals as they change with temperature across a roast enables rapid, holistic evaluation of the evolution of the diagnostic features of the signals and is useful for comparing one roast with another. The signals may be separated into two components--the uneven vertical shift of the spectra and the net absorption spectra after baseline removal--for a global view of correlated, complementary diagnostic information they contain. One example of the implementation of a holistic view of the roasting process is a contour plot of each component of the mid IR signal resolved in wavenumber/frequency to show the morphological signature of variations across and within clusters of peaks as they evolve with temperature or other roasting parameter. Another example is a contour plot of the cumulative signal, resolved in wavenumber. Another example is a contour plot of the derivative of the spectra with respect to temperature or other roasting parameter. Contour plots of the derivative of the spectra with respect to temperature are useful when examining regions of the spectrum where multiple signatures are present and, depending on the method of background subtraction used, can improve the discernment of the separate signatures and the onset of roasting.
[0053] FIG. 6 through FIG. 9 shows additional complementary spectra and their contour plots from the same experimental setup and run as that described in Example 1. However, each spectrum in these cases was collected two minutes after the temperature reached it is set point and before a background was collected.
[0054] FIG. 6 is the sequence of mid-IR absorption spectra at different temperatures of the gases emitted during roasting after removal of the even vertical shift for each spectrum. Polynomial fitting was used for baseline removal.
[0055] FIG. 7A shows a contour plot of the full series of mid-IR absorption spectra and FIG. 7B shows the global evolution of the uneven vertical shift of the spectra across the full roast of the four bean sample. Color versions of the greyscale plots in FIGS. 7A and 7B are shown in FIGS. 7C and 7D, respectively.
[0056] FIG. 8A shows a contour plot of the absorption spectra (intensity vs heating stage temperature and wavenumber), along with FIG. 8B, the cumulative signal resolved in each wavenumber bin, corresponding to the wavenumber range of FIG. 3. The detailed morphologies of the spectral peaks crossed with a roasting parameter viewed with high resolution permits. Color versions of FIG. 8A and FIG. 8B are shown in FIG. 8C and FIG. 8D, respectively.
[0057] FIGS. 9A and 9B compare the contour plots for two different roasts, showing the correlated holistic evolution of both the spectral peaks and the uneven vertical shift, which contain complementary diagnostic information. Color versions of FIG. 9A and FIG. 9B are provided in FIG. 9C and FIG. 9D, respectively.
[0058] Example 2 presents analysis of the FTIR spectra of a 4-bean roast acquired with the same experimental setup as Example 1, but with a single background acquired at 30.degree. C. was applied to all the spectra. FIGS. 10-13 show the global evolution of the raw FTIR data and the uneven vertical shift of the spectra, while FIG. 14 illustrates the effect of the derivative of the intensity with respect to temperature for a wavenumber region in which multiple signatures exist in proximity. Results were confirmed with correlation plots of portions of the spectrum with respect to reference spectra at different temperatures, and peak area calculations for small wavenumber bins that avoid inclusion of multiple signatures.
[0059] FIGS. 10 through 14 correspond to Example 2.
[0060] FIG. 10 is a second example of a series of mid-IR absorption spectra acquired during roasting with the temperatures indicated in .degree. C., where a single background was acquired at 30.degree. C. and applied to all of the spectra.
[0061] FIG. 11 shows mid-IR absorption spectra at different temperatures of the gases emitted during roasting after baseline removal of the even vertical shift for each spectrum for Example 2.
[0062] FIG. 12 is a graph of the intensity of the signals as calculated from the area under the peaks between 2985 and 2831 cm-1 for Example 2.
[0063] FIG. 13 is the equivalent of FIG. 7, for Example 2.
[0064] FIG. 14A is a graph of the intensity of the absorption as calculated from the area under the peaks between 1726 and 1691 cm-1 for Example 2. FIG. 14B/14D show the contour plot of the intensity of the absorption for each wavenumber bin as a function of temperature. FIG. 14C/14E show the derivative of the intensity with respect to temperature, which improves the discernment of multiple signatures in the spectrum, including the onset of roasting over FIGS. 14A, 14B and 14D for the background subtraction method used in Example 2. Color versions of FIG. 14B and FIG. 14C are shown in FIG. 14D and FIG. 14E, respectively.
[0065] Although various embodiments have been depicted and described in detail herein, it will be apparent to those skilled in the relevant art that various modifications, additions, substitutions, and the like can be made without departing from the spirit of the disclosure and these are therefore considered to be within the scope of the disclosure as defined in the claims which follow.
* * * * *
D00000
D00001
D00002
D00003
D00004
D00005
D00006
D00007
D00008
D00009
D00010
D00011
D00012

D00013

D00014

XML
uspto.report is an independent third-party trademark research tool that is not affiliated, endorsed, or sponsored by the United States Patent and Trademark Office (USPTO) or any other governmental organization. The information provided by uspto.report is based on publicly available data at the time of writing and is intended for informational purposes only.
While we strive to provide accurate and up-to-date information, we do not guarantee the accuracy, completeness, reliability, or suitability of the information displayed on this site. The use of this site is at your own risk. Any reliance you place on such information is therefore strictly at your own risk.
All official trademark data, including owner information, should be verified by visiting the official USPTO website at www.uspto.gov. This site is not intended to replace professional legal advice and should not be used as a substitute for consulting with a legal professional who is knowledgeable about trademark law.