Automated Mutual Improvement Of Oilfield Models
ZHANG; Feifei ; et al.
U.S. patent application number 16/344462 was filed with the patent office on 2019-10-24 for automated mutual improvement of oilfield models. The applicant listed for this patent is LANDMARK GRAPHICS CORPORATION. Invention is credited to Brent Charles HOUCHENS, Kaiji LU, Ethan MYERS, Michael Keith REDMAN, Avinash WESLEY, Joseph Blake WINSTON, Feifei ZHANG.
| Application Number | 20190323323 16/344462 |
| Document ID | / |
| Family ID | 62491650 |
| Filed Date | 2019-10-24 |


View All Diagrams
| United States Patent Application | 20190323323 |
| Kind Code | A1 |
| ZHANG; Feifei ; et al. | October 24, 2019 |
AUTOMATED MUTUAL IMPROVEMENT OF OILFIELD MODELS
Abstract
Systems, methods, and computer-readable media are described for the mutual improvement of physics-based and data-driven models related to an oilfield. These may involve generating, via a processor, with an oilfield related condition as a first input, a first output based on one of a physics-based model or a data-based model; generating, using the first input or a second input, a second output based on the other of the physics-based model or the data-based model not used to generate the first output; and modifying, automatically, at least one of the physics-based model, data-driven model, the first input or the second input, based on the first output or second output.
| Inventors: | ZHANG; Feifei; (Spring, TX) ; HOUCHENS; Brent Charles; (Houston, TX) ; WINSTON; Joseph Blake; (Houston, TX) ; REDMAN; Michael Keith; (Houston, TX) ; WESLEY; Avinash; (New Caney, TX) ; MYERS; Ethan; (Houston, TX) ; LU; Kaiji; (Houston, TX) | ||||||||||
| Applicant: |
|
||||||||||
|---|---|---|---|---|---|---|---|---|---|---|---|
| Family ID: | 62491650 | ||||||||||
| Appl. No.: | 16/344462 | ||||||||||
| Filed: | April 27, 2017 | ||||||||||
| PCT Filed: | April 27, 2017 | ||||||||||
| PCT NO: | PCT/US2017/029765 | ||||||||||
| 371 Date: | April 24, 2019 |
Related U.S. Patent Documents
| Application Number | Filing Date | Patent Number | ||
|---|---|---|---|---|
| 62431359 | Dec 7, 2016 | |||
| Current U.S. Class: | 1/1 |
| Current CPC Class: | E21B 49/00 20130101; E21B 41/00 20130101; E21B 41/0092 20130101; E21B 47/00 20130101 |
| International Class: | E21B 41/00 20060101 E21B041/00 |
Claims
1. A method comprising: generating, via a processor, with an oilfield related condition as a first input, a first output based on one of a physics-based model or a data-based model; generating, using the first input or a second input, a second output based on the other of the physics-based model or the data-based model not used to generate the first output; and modifying, automatically, at least one of the physics-based model, data-driven model, the first input or the second input, based on the first output or second output.
2. The method of claim 1 wherein the first output and second output are generated in parallel.
3. The method of claim 1 wherein the first output and second output are generated in series.
4. The method of claim 3, further comprising, subsequent generating the first output, obtaining measured data from the oilfield related to the first output.
5. The method of claim 4, wherein the second output is generated based on the second input, and wherein the second input is at least one of the measured data, the first output, or a difference between the measured data and the first output.
6. The method of claim 5, wherein the second input is at least one of the measured data, or the difference between the measured data and the first output, and the measured data is measured in real-time.
7. The method of claim 1, wherein modifying at least one of the physics-based model or the data-driven model comprises replacement with a different respective physics-based model or data-driven model.
8. The method of claim 1, wherein modifying the physic-based model comprises altering a variable within the model.
9. The method of claim 1, further comprising determining a normal range for the first output based on the second output.
10. The method of claim 1, wherein the first output is generated based on the physics-based model, and the second output is generated based on the data-driven model.
11. The method of claim 1, further comprising assigning a confidence value to the first and second outputs.
12. Then method of claim 1, wherein the method is conducted continuously in real-time.
13. A system comprising: one or more processors; and at least one computer-readable storage medium having stored therein instructions which, when executed by the one or more processors, cause the one or more processors to: generate, via a processor, with an oilfield related condition as a first input, a first output based on one of a physics-based model or a data-based model; generate, using the first input or a second input, a second output based on the other of the physics-based model or the data-based model not used to generate the first output; and modify automatically at least one of the physics-based model, data-driven model, the first input or the second input, based on the first output or second output.
14. The system of claim 13, the at least one computer-readable storage medium storing additional instructions which, when executed by the one or more processors, cause the one or more processors to: subsequent generating the first output, obtain measured data from the oilfield related to the first output.
15. The system of claim 14, wherein the second output is generated based on the second input, and wherein the second input is at least one of the measured data, the first output, or a difference between the measured data and the first output.
16. The system of claim 13, wherein modifying at least one of the physics-based model or the data-driven model comprises replacement with a different respective physics-based model or data-driven model.
17. The system of claim 13, wherein modifying the physic-based model comprises altering a variable within the model.
18. A non-transitory computer-readable storage medium comprising: instructions stored therein which, when executed by one or more processors, cause the one or more processors to: generate, via a processor, with an oilfield related condition as a first input, a first output based on one of a physics-based model or a data-based model; generate, using the first input or a second input, a second output based on the other of the physics-based model or the data-based model not used to generate the first output; and modify automatically at least one of the physics-based model, data-driven model, the first input or the second input, based on the first output or second output.
19. The non-transitory computer-readable storage medium of claim 18, comprising additional instructions which, when executed by the one or more processors, cause the one or more processors to: subsequent generating the first output, obtain measured data from the oilfield related to the first output.
20. The non-transitory computer-readable storage medium of claim 19, wherein the second output is generated based on the second input, and wherein the second input is at least one of the measured condition, the first output, or a difference between the measured data and the first output.
Description
[0001] This application claims priority to U.S. Provisional Application No. 62/431,359, entitled "AUTOMATED MUTUAL IMPROVEMENT OF OILFIELD MODELS" filed on Dec. 7, 2016, which is incorporated herein by reference in its entirety.
TECHNICAL FIELD
[0002] The present technology pertains to the use and improvement oilfield related modeling for hydrocarbon exploration, drilling, and production. In particular, the present disclosure relates to the mutual improvement of physics-based models and data-driven models for improved accuracy and expedited oilfield solutions.
BACKGROUND
[0003] During various phases of hydrocarbon exploration and production, it may be necessary to characterize and model the various aspects of an oilfield. The models assist in planning, prediction, and understanding the various variables and how they may affect outcomes. These can include anything from physical factors such has formation type, fluid flow, to determining causes for events. Models that are developed may vary in accuracy and use depending on the known and unknown variables present and what metrics are desired. With improved modeling costs can be reduced, potential problems avoided, and improved hydrocarbon production can be achieved.
BRIEF DESCRIPTION OF THE DRAWINGS
[0004] In order to describe the manner in which the above-recited and other advantages and features of the disclosure can be obtained, a more particular description of the principles briefly described above will be rendered by reference to specific embodiments thereof which are illustrated in the appended drawings. Understanding that these drawings depict only exemplary embodiments of the disclosure and are not therefore to be considered to be limiting of its scope, the principles herein are described and explained with additional specificity and detail through the use of the accompanying drawings in which:
[0005] FIG. 1A illustrates an exemplary oilfield environment for implementation of the disclosure herein;
[0006] FIG. 1B illustrates an exemplary oilfield environment for implementation of the disclosure herein;
[0007] FIG. 1C illustrates an exemplary oilfield environment with production tubing for implementation of the disclosure herein;
[0008] FIG. 1D illustrates an exemplary oilfield environment with a drilling device for implementation of the disclosure herein;
[0009] FIG. 1E illustrates an exemplary oilfield environment with a wireline device for implementation of the disclosure herein;
[0010] FIG. 2 illustrates a flow diagram of one implementation of the improvement model disclosed herein;
[0011] FIG. 3 illustrates a flow diagram of one implementation of the improvement model disclosed herein;
[0012] FIG. 4 illustrates a flow diagram of one implementation of the improvement model disclosed herein;
[0013] FIG. 5 illustrates a flow diagram of one implementation of a parallelized weighted model disclosed herein;
[0014] FIGS. 6A and 6B illustrates schematic diagram of example computing device.
DETAILED DESCRIPTION
[0015] Various embodiments of the disclosure are discussed in detail below. While specific implementations are discussed, it should be understood that this is done for illustration purposes only. A person skilled in the relevant art will recognize that other components and configurations may be used without parting from the spirit and scope of the disclosure.
[0016] Additional features and advantages of the disclosure will be set forth in the description which follows, and in part will be obvious from the description, or can be learned by practice of the herein disclosed principles. The features and advantages of the disclosure can be realized and obtained by means of the instruments and combinations particularly pointed out in the appended claims. These and other features of the disclosure will become more fully apparent from the following description and appended claims, or can be learned by the practice of the principles set forth herein.
[0017] It will be appreciated that for simplicity and clarity of illustration, where appropriate, reference numerals have been repeated among the different figures to indicate corresponding or analogous elements. In addition, numerous specific details are set forth in order to provide a thorough understanding of the embodiments described herein. However, it will be understood by those of ordinary skill in the art that the embodiments described herein can be practiced without these specific details. In other instances, methods, procedures and components have not been described in detail so as not to obscure the related relevant feature being described. The drawings are not necessarily to scale and the proportions of certain parts may be exaggerated to better illustrate details and features. The description is not to be considered as limiting the scope of the embodiments described herein.
[0018] The term "coupled" is defined as connected, whether directly or indirectly through intervening components, and is not necessarily limited to physical connections. The term "substantially" is defined to be essentially conforming to the particular dimension, shape or other word that substantially modifies, such that the component need not be exact. In the following discussion and in the claims, the terms "including" and "comprising" are used in an open-ended fashion, and thus should be interpreted to mean "including, but not limited to . . . ". The term "oilfield" should be interpreted to mean any area, including its surface and subsurface regions, having a reservoir of hydrocarbons, be they oil, gas or a combination, with or without water and other non-hydrocarbon components, and may include any number of wellbores in various phases of development, rigs, stimulation or production equipment or other equipment.
[0019] Hyper-physical parameters may be defined herein as physical parameters which have high uncertainty or are difficult to obtain (examples: viscosity, density, surface tension, conductivity, friction factor, porosity, etc.). Physics-based models are defined herein as models built on first-principles and laws of nature and may include unknown parameters and closure relations. A physics-based model may encompass a number of sub-models. Examples of physics-based models or sub-models include conservation of mass, conservation of momentum, 1st and 2nd laws of thermodynamics, Maxwell's equations, and the like.
[0020] Data-driven models may be defined herein as models that are not based on first-principles. Data-driven models attempt to model actual real-world data via various analysis techniques, and involve post hoc modeling of obtained data. A data-driven model may encompass a number of sub-models. Examples of data-driven models or sub-models include numerical analysis, mathematical analysis, curve fitting, clustering, and rules-based decisions, with variables not necessarily related to a physical variable or parameter. Primary data may be defined herein as direct observations or measurements. Secondary data may be defined herein as indirect measurements, including data from complex tests, such as formation permeability, skin factor. Hybrid models may be defined herein as combination of physical-models with data-driven models. When referring to a model herein, such as a physics-based model or data-driven model, the term "model" encompasses the singular and plural. In particular, a physics-based model or a data-driven model may be made up of, or otherwise encompass, multiple models, which are referred to herein as sub-models. Accordingly, unless otherwise noted, the term "model," whether physics-based or data-driven, may be made up of a single model or multiple models. Further the plural form "models" may refer to multiple sub-models which make up or are encompassed by a model, or may refer to multiple models each differing from one another in some way, such as differing in the particular sub-models used, or using the same kind of sub-models but with the sub-models differing in one or more variables, constant or other parameters, or the multiple models otherwise differing in the variables, constants, or other parameter while still each being physics-based or data-driven.
[0021] Causes, when related to an oilfield event, may be defined herein as symptom/potential scenario/potential events (e.g., what can go wrong). Cause-control (referred to herein also as control node) may be defined herein as "how an event may have occurred" tests to verify if cause happened or is happening (via model(s) or limits). Central node as defined herein determines that the potential event (cause) has happened and why (control).
Overview
[0022] Disclosed herein are systems, methods and computer readable storage media for automatic modification of one or both of a physics-based model and a data-driven model based on the results of the other, i.e., the mutual improvement of the combined use of at least one of a physics-based model and at least one of a data-driven model. Real-world data is collected related to an oilfield and used along with physics-based and data-driven models as inputs as well as to compare outcomes in order to automatically improve one or both of the physics-based and data-driven modeling.
[0023] Both the physics-based models and data-driven models each have particular strengths which may be used to complement and correct the other to produce more accurate modeling. Inputs related to an oilfield condition, including estimated physical (including hyper-physical) parameters and/or measured data from the oilfield, may be provided to one or both of the physics-based model and data-driven models in parallel or in series to generate a prediction regarding various conditions or parameters related to an oilfield. Real world measured data related to the oilfield can then be collected from downhole sources, surface sources, and historical data, and then compared to the outputs of the models, such as a predicted result, or modeled parameter or condition. The difference between the outputs of the models and the measured data can then be the basis for the other of the models, or the next iteration of the models' processing. Inputs to one or both of the models may include outputs from the other of the models, the conditions related to an oilfield, differences between the condition and/or the output from one or both of the models, as well as the original inputs related to the oilfield, and/or adjusted or estimated hyper-physical parameters.
[0024] The outputs of the models provide a basis upon which to analyze the quality of the results of both the physics-based model and data-driven model. For example, the data-driven output may give a different result than the physics-based model or may aid in explaining why the physics-based model may have been incorrect or inaccurate. Alternatively, it may be that the physics-based model provided a more accurate modeling than the data-driven model, in which case the data-driven model may be modified.
[0025] In view of the different outputs, one or both of the models may be improved in some way. For instance, the inputs may be modified or the models modified in some way. Modifying the models may include modifying one or more of the variables of the model, one or more constants, or replacing the physics-based model with a new physics-based model, or the data-driven model with a new data-driven model, which may be more pertinent for modeling the desired oilfield condition.
[0026] The physics-based models and data-driven models may be run in parallel. In such case, estimated and/or collected data related to an oilfield condition, whether via sensors or historical data, may be provided as inputs to each of the physics-based models and data-driven models. The results of each of the physics-based models and data-driven models can be compared to the other or to other collected data. One or both of the physics-based models and data-driven models can be modified in view of the results of the other. When run in series, the physics-based model may be processed first, with the output, either directly or indirectly serving as a basis an input into the data-driven model. For example, the output itself may be used, or the differences of the output with measured data (real-time or historical) from the oilfield. Additionally, or alternatively, the original input or the measured data may be provided as an input to the second processed model. This can be carried out in reverse where the data-driven model is followed by the physics-based model. The processing of the models and collection of the measured data can be carried out repeatedly, in real-time, substantially in real-time and automatically.
[0027] Furthermore, the results from each of the physics-based model and the data-driven model can be assigned a confidence weightage value. For instance, during operations in an oilfield incidents or accidents may occur, or in response to a set of circumstances an operator may choose to carry out an operation. Accordingly, during operations there may be a "cause" or various "causes" for an "event." The physics-based model and the data-driven model can be used to evaluate whether something is cause for an event or which cause is most likely for a particular event, or whether an event actually occurred. Each of the physics-based model and the data-driven model can be weighted with a confidence weightage value for determining which cause is most likely.
Description
[0028] The disclosure herein can be implemented in the context of an oilfield environment having one or more boreholes for the production of hydrocarbons. An exemplary oilfield in which the present disclosure may be implemented is illustrated in FIG. 1A. The oilfield 100 can include multiple wells 110A-F which may have tools 102A-D for data acquisition. The multiple wells 110A-F may target one or more hydrocarbon reservoirs. Moreover, the oilfield 100 has sensors and computing devices positioned at various locations for sensing, collecting, analyzing, and/or reporting data. For instance, well 110A illustrates a drilled well having a wireline data acquisition tool 102A suspended from a rig at the surface for sensing and collecting data, generating well logs, and performing downhole tests which are provided to the surface. Well 110B is currently being drilled with drilling tool 102B which may incorporate subs and additional tools for logging while drilling (LWD) and/or measuring while drilling (MWD). Well 110C is a producing well having a production tool 102C. The tool 102C is deployed from a Christmas tree 120 at the surface (having valves, spools, and fittings). Fluid flows through perforations in the casing (not shown) and into the production tool 102C in the wellbore to the surface. Well 110D illustrates a well having blowout event of fluid from an underground reservoir. The tool 102D may permit data acquisition by a geophysicist to determine characteristics of a subterranean formation and features, including seismic data. Well 110E is undergoing fracturing and having initial fractures 115, with producing equipment 122 at the surface. Well 110F is an abandoned well which had been previously drilled and produced.
[0029] The oilfield 100 can include a subterranean formation 104, which can have multiple geological formations 106A-D, such as a shale layer 106A, a carbonate layer 106B, a shale layer 106C, and a sand layer 106D. In some cases, a fault line 108 can extend through one or more of the layers 106A-D.
[0030] Sensors and data acquisition tools may be provided around the oilfield 100, multiple wells 110A-E and associated with tools 102A-D. The data may be collected to a central aggregating unit and then provided to a processing unit. The data collected by such sensors and tools 102A-D can include oilfield parameters, values, graphs, models, predictions, monitor conditions and/or operations, describe properties or characteristics of components and/or conditions below ground or on the surface, manage conditions and/or operations in the oilfield 100, analyze and adapt to changes in the oilfield 100, etc. The data can include, for example, properties of formations or geological features, physical conditions in the oilfield 100, events in the oilfield 100, parameters of devices or components in the oilfield 100, etc.
[0031] The general structure of the method is shown in FIG. 1B with flow 100B having an oilfield 101 with multiple producing wells 125. Downhole measurements 45 may be taken by sensors and tools underground within or around wells 125, along with surface measurements 55 taken at the surface, with such measurements including flow rates, temperature, pressure, fluid composition, hydrocarbon composition, and other various parameters of interest. The downhole measurements 45 and surface measurements 55 may be provided to the data aggregator unit 50 (referred to also herein as the "aggregator"). The data received by the aggregator 50 may be filtered to remove or reduce noise, or otherwise treat the measured data. The collected data from aggregator 50 may then be fed to a control unit 65 having a processor. The data aggregator unit 50 and control unit 65 may be a single unit or multiple units. Historical data 60 of an oilfield condition may also be provided to the data aggregator unit 50 or directly to the control unit 65.
[0032] The control unit 65 may process both physics-based models 70 and data-driven models 75 (one or more of each of a physics-based model 70 or data-driven model 75). The initial inputs to the physics-based models 70 and data-driven models 75 may be related to an oilfield condition, including collected measured data from downhole measurements 45, surface measurements 55 as well as historical data 60 about an oilfield, or other oilfield related parameters necessary for processing the models, and/or estimated physical and hyper-physical parameters. The inputs can be the same to each model (each having a first input), or may be different (a first input to one model, a second input into the other of the models). After the initial processing by either of the models, the input parameters may include outputs from one or both of the physics-based models 70 and data-driven models 75 to the other of the models. Furthermore, after an output is obtained from one or both of the models, the output can be compared to the measured data from the oilfield. The collected measured data may be from downhole measurements 45, surface measurements 55 as well as historical data 60 about an oilfield. This difference, and/or the measured data can be provided as an input to the other or both of the physics-based models 70 and data-driven models 75. In view of the output results from each of the physics-based models 70 and data-driven models 75, one or both of the physics-based model and data-driven models may be modified, or the input to either of the models may be modified. Modifying the models may include updated constants of models, variables, algorithms, equations, or may also include replacement of the models with another of the physics-based models 70 or data-driven models 75. This process can be carried out in parallel, where physics-based models 70 and data-driven models 75 are being processed simultaneously, or in series where one is processed first, followed by the other. In both cases, the method steps can be carried out in real-time and repeated continuously and automatically, with each iteration intended to provide a more accurate overall model of the oilfield conditions or parameters of interest.
[0033] For example, the control unit 65 can process the physics-based models 70 and data-driven models 75 in parallel such that results of either can be compared one to the other, or to collected data, and one or both of the physics-based models 70 and data-driven models 75 in view of the other. The initial inputs to either of the physics-based models 70 and data-driven models 75 maybe an oilfield related condition, and may include collected measured data, or estimated hyper-physical parameters, and the inputs into either model may be the same or different. The results of one or both of the physics-based models 70 and data-driven models 75 can be provided to the other of the models, and/or the results compared one to the other or to the collected measured data, and/or modifying the physics-based models 70 and data-driven models 75 and/or inputs to either of the models. This can be repeated to further update models, inputs and evaluate models to further refine and obtain more accurate models and outputs.
[0034] Additionally, or alternatively, the physics-based models 70 and data-driven models 75 can also be processed in series. For example, the physics-based models 70 can be provided with an input related to an oilfield condition (from collected measured data, estimations, estimated hyper-physical parameters, or outputs or a calculating of the data-driven models 75) to obtain an output, such as a predicted downhole parameter, which may be compared to collected measured data from the oilfield. The collected measured data and/or the differences between the output and the collected measured data, and/or a physical parameter can then be provided as data-based input parameter to the data-driven model. The data-driven models 75 can then generate a data-driven output parameter. In view of this result, at least one of the physics-based models 70, data-driven models 75, or an input to the physics-based models 70 can be modified.
[0035] The order of the physics-based models 70 and data-driven models 75 may also be reversed when processed in series. Rather than processing the physics-based models 70 first as described above, collected measured data can first be provided to the data-driven models 75. The output from the data-driven models 75 can be provided to physics-based models 70 and/or compared to collected measured data and the difference and/or the collected measured data provided as an input to the physics-based models 70. Based on the output from the physics-based model 70, at least one of the physics-based models 70, data-driven models 75, or an input can be modified.
[0036] Based on a single or numerous iterations, reports 80 can be can be generated related to the results of the models. Such reports 80 may include for example surveillance reports, abnormal activities reports, or optimized solutions to resolve problems.
[0037] Whereas FIG. 1A and FIG. 1B show multiple wells, FIGS. 1C-1E illustrate various types of wells which may be part of an oilfield as in FIG. 1A or FIG. 1B, along with a flow diagram of how such measured data may be collected and processing physics-based and data-driven models. Such are exemplary and as described previously, data may be obtained from various parts of the oilfield along with various types of wells at various stages of life. As illustrated in FIG. 1C, there is shown a producing well flow 100C having a surface 5 with a borehole 25 extending down through subterranean earth 20. Within the borehole 25 are production tubulars 30 extending from the surface 5. The borehole 25 extends to a target production zone 35 having fractures 40 for extraction of hydrocarbons 30 and/or injection of fracturing or flow control fluids. Provided downhole are downhole sensors 37 to obtain measurements of various downhole parameters. At the surface 5 is a pump 10 with surface valves 15 and surface sensors 17. The downhole sensors 37 and the surface valves 15 may be actuated for various purposes including controlling the flow of fluids. The downhole sensors 37 and surface sensors 17 may be used for collecting downhole measurements 45 and surface measurements 55 such as flow rates, temperature, pressure, fluid composition, hydrocarbon composition, and other various parameters of interest. Such measured data is provided to the data aggregator unit 50. The data aggregator unit 50 may be on the surface or provided within the borehole 25. The data may be processed with control unit 65, having a processor, and used with the physics-based models 70 and data-driven models 75 as discussed above
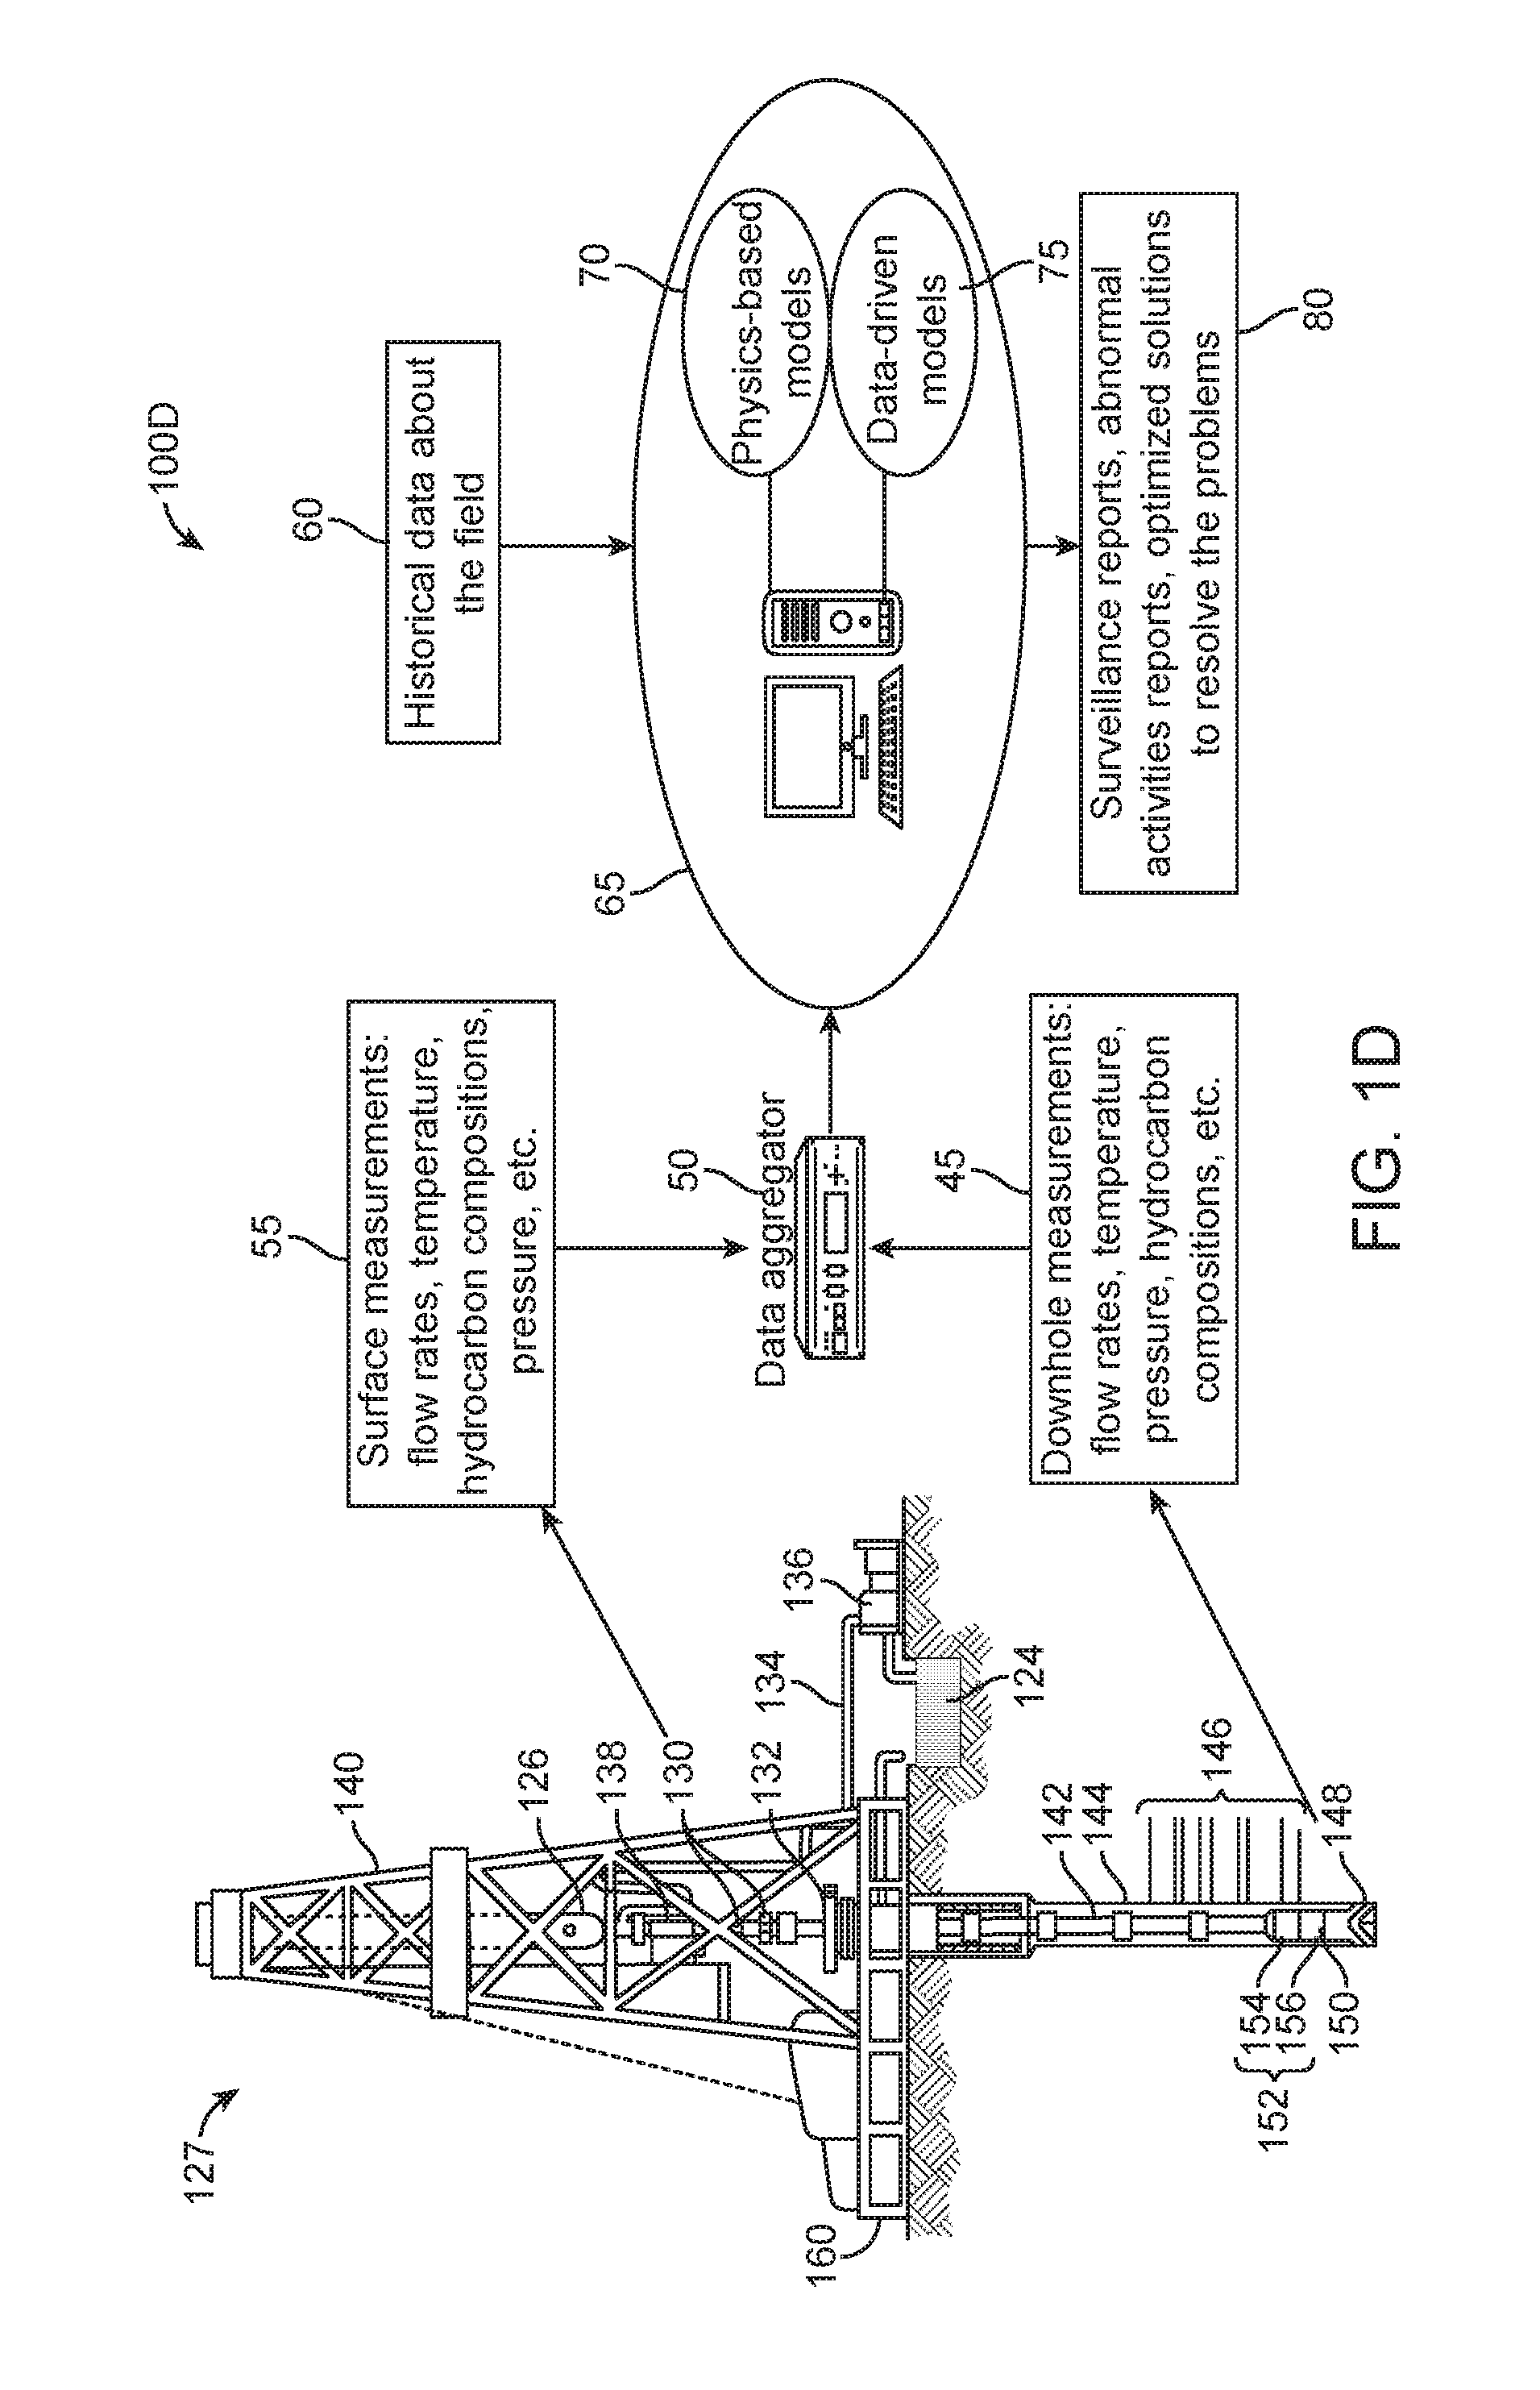
[0038] While FIG. 1C includes a stimulation environment with production tubing, FIG. 1D includes a downhole drilling environment flow 100D with a diagrammatic view of a logging while drilling (LWD) wellbore operating environment 127. As depicted in FIG. 1D, a drilling platform 160 is equipped with a derrick 140 that supports a hoist 126 for raising and lowering a drill string 142. The hoist 126 suspends a top drive 138 suitable for rotating the drill string 142 and lowering the drill string 142 through the well head 132. Connected to the lower end of the drill string 142 is a drill bit 148. As the drill bit 148 rotates, the drill bit 148 creates a wellbore 144 that passes through various formations 146. A pump 136 circulates drilling fluid through a supply pipe 134 to top drive 138, down through the interior of drill string 142, through orifices in drill bit 148, back to the surface via the annulus around drill string 142, and into a retention pit 124. The drilling fluid transports cuttings from the wellbore 144 into the pit 124 and aids in maintaining the integrity of the wellbore 144. Various materials can be used for drilling fluid, including oil-based fluids and water-based fluids.
[0039] The well head 132 or derrick 140 may include sensors and valves to for collecting surface measurements such as flow rate, temperature, pressure, composition of drilling fluids etc. With respect to downhole measurements, logging tools 156 can be integrated into the bottom-hole assembly 152 near the drill bit 148. As the drill bit 148 extends the wellbore 144 through the formations 146, logging tools 156 collect measurements relating to various formation properties as well as the orientation of the tool and various other drilling conditions. The bottom-hole assembly 152 may also include a telemetry sub 154 to transfer measurement data to a surface receiver 130 and to receive commands from the surface. In at least some cases, the telemetry sub 154 communicates with a surface receiver 130 using mud pulse telemetry. In some instances, the telemetry sub 154 does not communicate with the surface, but rather stores logging data for later retrieval at the surface when the logging assembly is recovered.
[0040] Each of the logging tools 156 may include a plurality of tool components, spaced apart from each other, and communicatively coupled with one or more wires. The logging tools 156 may also include one or more computing devices 150 communicatively coupled with one or more of the plurality of tool components by one or more wires. The computing device 150 may be configured to control or monitor the performance of the tool, process logging data, and/or carry out the methods of the present disclosure. The computing device 150 may also receive data regarding the drilling device including drilling rate, orientation, etc. and transmitted to the surface.
[0041] In at least some instances, one or more of the logging tools 156 may communicate with a surface receiver 130 via acoustics, wirelessly, fiber optics, or via a wire, such as wired drillpipe. In other cases, the one or more of the logging tools 156 may communicate with a surface receiver 130 by wireless signal transmission. In at least some cases, one or more of the logging tools 156 may receive electrical power from a wire that extends to the surface, including wires extending through a wired drillpipe.
[0042] Downhole measurements 45 such as from the logging tools 156, performance of the tool or drilling device, data collected by computing device 150, along with surface measurements 55 may be provided to the data aggregator unit 50 along with any surface measurements. The data may be processed with control unit 65 and used with the physics-based and data-driven models as discussed above
[0043] Whereas FIG. 1C refers to a stimulation environment and FIG. 1D a drilling environment, FIG. 1E illustrates a wireline oilfield environment flow 100E. As shown in FIG. 1E, a tool having tool body 192 can be employed with "wireline" systems, in order to carry out logging or other operations. For example, instead of using the drill string 142 of FIG. 1D to lower tool body 192, which may contain sensors or other instrumentation for detecting and logging nearby characteristics and conditions of the wellbore and surrounding formation, a conveyance 182 can be used. The tool body 192 can be lowered into the wellbore 194 by wireline conveyance 182. The conveyance 182 can be anchored in the drill rig 180 or portable means such as a truck. The conveyance 182 can be wireline (having one or more wires), slicklines, cables, or the like, as well as tubular conveyances such as coiled tubing, joint tubing, or other tubulars.
[0044] The illustrated conveyance 182 provides support for the tool, as well as enabling communication between the tool processors on the surface and providing a power supply. The wireline conveyance 182 can include fiber optic cabling for carrying out communications. The wireline conveyance 182 is sufficiently strong and flexible to tether the tool body 192 through the wellbore 194, while also permitting communication through the wireline conveyance 182 to local processor 188 and/or remote processors 184, 186. Additionally, power can be supplied via the wireline conveyance 182 to meet power requirements of the tool. For slickline or coiled tubing configurations, power can be supplied downhole with a battery or via a downhole generator. Accordingly downhole measurements 45 from the wireline logging too may be transmitted to the surface processors 184, 186. Further, surface sensors 190 may be provided which obtain surface measurements 55, which may relate to speed of the logging tool, conveyance 182, temperature, pressure, or other parameters of interest at the surface. The data aggregator unit 50 may be on the surface or provided within the wellbore 194. The data may be processed with control unit 65 and used with the physics-based and data-driven models as discussed above
[0045] With respect to the flows as shown in FIGS. 1B-E the inputs may be initially based on estimates of parameters, and then the models and inputs improved as more data is collected and fed into the system. Additionally, for situations where the physical process is fully or sufficiently understood and the confidence about the physics-based model is high, the model is set and only the hyper-physical input parameters need to be adjusted by the data-driven model, which may be illustrated in FIG. 2.
[0046] Referring now to FIG. 2, an exemplary flow diagram 200 is illustrated which provides for a mutual improvement flow between the physics-based model 70 and data-driven model 75. As disclosed therein, estimated hyper-physical parameters 205 may be determined, such as permeability, skin factor, friction factor, porosity, etc. One or more of these can be provided as a first input to a physics-based model 210, which can output predicted parameter result 215. Examples of a physics-based model 210 may include Buckley-Leverett displacement model for immiscible displacement or the well inflow equations based on Darcy's law, among others, to make an oilfield prediction, such as predict the water break-through or well production rate. Further, as shown, collected data regarding an oilfield condition, such as real-time measured data 220, may be collected via surface and/or downhole sensors. These may include direct measurement of the predicted parameters by the physics-based model or indirect measurements which allow calculation of the same. Further, historical data can be employed additionally or alternatively. These measurements can be filtered to remove noise thereby producing filtered data 225 which may be more effectively used for accurate modeling.
[0047] Next, the trend of differences between the results 215 generated by the physics-based model 210 is compared to the filtered data 225 to obtain the difference 230. The differences 230 are then provided as an input (referred to herein also as a second input) to the data-driven model 235. Alternatively, or additionally, the measured data 220 can be provided as an input into the data-driven model 235. Still further, the output of the physics-based model 210 may be provided as an input into the data-driven model 235. Still further, the first input which was provided to the physics-based model may be provided as an input to the data-driven model 235. Based on the output of the data-driven model 235, the adjusted estimated physical hyper-parameters 240 can be generated. The adjusted physical hyper-parameters 240 can then be provided as updated inputs into the physics-based model 210. The steps of 210-240 can then be repeated any number of iterations. With each iteration, the physical hyper-parameters as input into the physics-based model 210 and the predicted-results 215 may be improved by the data-driven model 235. Each of the steps in flow 200 can be carried out automatically by a processor.
[0048] The physics-based model and data-driven model of flow diagram 200 may be particular types of models, where although each may be made up of, or otherwise encompass, multiple models, are each made up of one kind or type of a physics-based model or a data-driven model respectively. For the situations where the physical process is not fully understood, the physical system may not be modeled correctly. Accordingly, multiple physics-based models which differ from one another may be used in parallel to obtain optimal results. These multiple physic-based models may each differ from one another, such as differing in the particular sub-models used, or using the same sub-models but with different variables, constant or other parameters, or otherwise differing in the variables, constants, or other parameter between the models or sub-models while still each being physics-based. In particular, a plurality of different types of physics-based models may be run for a given time iteration. The data-driven model then uses the performance history to determine the best physics-based model in each scenario. An illustrative flow for such method is shown in FIG. 3.
[0049] FIG. 3 illustrates an exemplary flow diagram 300, which may be a modification of flow 200 in FIG. 2. In the flow diagram 300, several physics-models may be evaluated and the best performing in view of the output of the data-driven model, including data-driven sub-models, may be selected for modeling. To begin the flow, estimated hyper-physical parameters 305 may be estimated or determined, such as permeability, skin factor, porosity, etc. One or more of these can be provided as a first input to a physics-based model A 310A. The physics-based model A 310A in the first iteration may be a best guess at which model may best be appropriate. On subsequent iterations, it may be the best performing model of the previous iteration. Simultaneously, or on subsequent iterations of the method in flow diagram 300, other physics-based models may be processed with the first input as well, such as physics-based model B 310B, or any number n of a plurality of physics-based models 310n. The physics-based models 310A-n may each provide an output such as predicted parameter results 315. Further, real-time measured data 320 may be collected via surface and/or downhole sensors, which may include direct measurement of the predicted parameters by the physics-based models or indirect measurements which allow calculation of the same. The real-time measurements can be filtered to remove noise thereby producing filtered data 325 which may be more effectively used for accurate modeling. Historical data can be employed additionally or alternatively provided along with the real-time measured data 320.
[0050] Next, the trend of differences between the predicted results 315 generated by the physics-based models 310A-n are compared to the filtered data 325 to obtain the difference 330. The differences 330 may also include the differences resulting from a comparison to one or more physics-based models 310A-n from the current and/or one or more previous iterations of the flow. Accordingly, with each iteration, the best performing model may be recorded to form a historical data set of best performing models for comparison in each iteration. Alternatively, or additionally, the measured data 320 can be provided as an input into the data-driven model 335. Still further, the output of the physics-based models 310A-n or previous physics-based models may be provided as an input into the data-driven model 335. Still further, the first input which was provided to the physics-based models may be provided as an input to the data-driven model 335.
[0051] Based on the output of the data-driven model 335, adjusted physical parameters 340 may be generated. Additionally, the best performing physics-based model 345 may be determined. For example, the output of the data-driven model 335 may indicate which of the physics-based models 310A-n produced the most accurate results. Alternatively, or additionally, the outputs of the physics-based models 310A-n may be compared to the filtered data 325 which may include an oilfield condition which the physics-based models are attempting to model. Alternatively, or additionally, the output of the physics-based models 310A-n may be compared to the output of the data-driven model 335 and/or oilfield conditions measured and collected in filtered data 325. Accordingly, any number of metrics may be employed to determine the best performing physics-based model of the plurality of physics-based models 310A-n. The method may then proceed again with another iteration employing the best performing physics-based model as physics-based model A 310A. Any number of new or previously used physics-based models 310B-n can also be employed for comparison to physics-based model A 310A in the next iteration to determine the best performing model.
[0052] Each of the steps in flow 300 can be carried out automatically by a processor. The method may be carried out continuously in real-time with each iteration of the method intended to produce a more accurate modeling of various oilfield conditions and parameters.
[0053] The present disclosure provides for detecting abnormal measured parameters to monitor the status of sensors and equipment. One illustrated embodiment is provided for in flow diagram 400 shown in FIG. 4. In this embodiment, a physics-based model, which may contain sub-models, sets a range for the values. The data-driven model, which may contain sub-models, analyzes the frequency, trend and severity of un-physical real-time measured values and detect the possible failures. The physics-based model determines "in-range" correct values of the real-time measurements and feeds it to a secondary data-based model to improve that model, including improvements to any encompassed sub-models.
[0054] Accordingly, the method begins with processing of a physics-based model 405. In this instance, the input into the physics-based model and any sub-models may include estimated hyper-physical parameters, and/or may include measured oilfield conditions or parameters, and/or be outputs from previous physics-based or data-driven models, or other inputs. Real-time measurements 410 in an oilfield are made of various oilfield conditions via various sensors, tools and other data gathering instruments. A physics-based model 405 defines an acceptable range 415 of values for these collected real-time measurements 410.
[0055] Out of range values 420 may be considered as incorrect, as not representative of measurements or data that are correct or able to occur in the real world, and so may be indicative of some type of problem. These out of range values 420 are fed to a data-driven model 425. The data driven model 425 may process the frequency, trend and severity of the out of range values 420 for various real world event failures 430 which may result from such values being out of range. These real world event failures may include sensor failures, equipment failures, process failures, among other failures.
[0056] For those in range values 435, these may be considered as correct values and so may serve as a basis for modeling oilfield conditions or other type of modeling. Accordingly, for values in-range, the flow proceeds to the next step 440, wherein the in-range values 435 may be provided to improved data-driven model 445, which, due to the correct range, may provide faster and/or more accurate results 450, interpretations and extrapolations. The flow diagram 400 may also be incorporated into the flow diagrams 200 and/or 300 to provide correct range values to the data-driven processing steps 225 and 335 to improve the data-driven models therein. The flow diagram may be incorporated into the data filter steps 225 and 325 of flow diagrams 200 and/or 300 respectively.
[0057] Additionally, or alternatively the data-driven models may be employed in the data filter steps 225 and 325 of flow diagrams 200 and/or 300. The data-driven models can be used as virtual sensors to filter the noise out of the real-time data and then input the clean data to the physics-based models 210 or 310A-n and/or the data-driven models 235 and/or 335 from FIG. 2 or 3, respectively. For example, the data-driven models may be chosen so as to determine which measured values is noise and which is true, or provide an acceptable value range, or provide trends or other fitting models for more accurate use of measured data.
[0058] As previously discussed the present disclosure encompasses the processing of the data-driven models and physics-based models in parallel. These can be employed with weighted confidence values to reduce the number of false alarms: process physics-based and data-driven models simultaneously and determine which generates more accurate alarms. Depending on the performance of each model, the system assigns different confidence values to weight different models. The final weights for the physics-based models and data-driven models are different. Trained multiple data-driven models and the plurality of votes can be used to assign weights. One exemplary embodiment is provided in FIG. 5, related to determining causes for an event, such a as a failure or other occurrence.
[0059] Illustrated in FIG. 5 is a flow diagram 500 illustrating the use of confidence values with physics-based and data-driven models to determine causes for an event. As shown therein, a plurality of causes are considered, for example cause node 505A, cause node 505B, or any n number of causes 505n. The cause nodes 505A-n are possible causes for an event, represented by main event node 590. Accordingly, if the main event is a stuck pipe, the possible cause nodes 505A-n may be divided up for example amongst the various possible causes such as wellbore collapse, key seating, poor hole cleaning, etc. Each of the cause nodes 505A-n have a particular positive and nonzero confidence value weightage 506A-n respectively, the entirety of which are normalized, for example such that they all sums to 1. For example, cause node 505A may be assigned a confidence weightage value 506A of 0.4, cause node 505B may be assigned a confidence weightage value 506A of 0.3 as a confidence weightage value, and the n number of additional cause nodes 505n may be assigned a confidence weightage value 506n of 0.3. Each of these cause nodes 505A and cause node 506B add together, and n number of cause nodes 505n sum to 1 (0.4+0.3+0.3). With n number of cause nodes 505n, they similarly are normalized.
[0060] Each cause node 505A-n has its own assigned respective control node 510A-n. The control nodes of 510A-n contain various models for evaluating the likelihood of the cause nodes 505A-n and assigning them the confidence weightage value. Further, each control node may each have a plurality of sub-control nodes. As shown in FIG. 5, cause node 505A has a control node 510A. Control node 510A contains a number of sub-control nodes. As shown in FIG. 5, it has sub-control node 515A, sub-control node 515B, and any number of other sub-control nodes 515n. Further, within each sub-control nodes various models are processed, and as shown in FIG. 5, each of sub-control nodes 515A-n have a data-driven model, physics-based model, and a rules-based model. These are each assigned a normalized confidence value weightage, for example between 0 and 1 and such that they together sum to 1. For example, sub-control node 515A may have data-driven model 520A, physics-based model 525A and rules-based model 530A. Additionally, sub-control node 515B may have data-driven model 520B, physics-based model 525B and rules-based model 530B. Further, each of the n number of sub-control nodes 515n may have data-driven model 520n, physics-based model 525n and rules-based model 530n. The data-driven modules contain the logic to detect the anomalies using statistical and machine learning techniques and the physics-based modules contain logic to detect the anomalies using first principle concepts. The anomalies are then monitored using clustering algorithms. They detect any emerging clusters of rising anomalies, e.g., if too many incidences of anomalies have occurred in a short time period, the clustering algorithms define probabilities based on the size of emerging cluster. The likelihood calculations are performed each time new data arrives.
[0061] These are then processed according to their confidence weightage values 516A-n providing a confidence value output 540A-n regarding a cause. Each of the sub-control nodes 515A, 515B, and 515n are assigned a confidence weightage value 516A, 516B, 516n, each normalized for example between 0 and 1, and which together sum to 1. The sub-control nodes 515A-n are processed according to their respective confidence weightage values 516A-n to obtain confidence value outputs 540A-n. For example, the sub-control node 515A may output 540A. Sub-control node 515B may have an output 540B and any number of sub-control nodes n may have n number of outputs, represented by 540n.
[0062] Similarly cause node 505B and n number of cause nodes 505n each have assigned a control node 510B and n number of control nodes represented by 510n respectively. Similarly to 510A, the control nodes 510B and 510n may have a plurality of sub-control nodes. Each of the sub-control nodes may have a plurality of models, such as a data-driven model, a physics-based model, and a rules-based model. Each of the sub-control nodes also have confidence weightage values and provide a confidence value output. The output of each of the control nodes 510A, 510B, and 510n for each cause are then fed into main event node 590. The main event node 590 then itself processes the various control node outputs and cause node outputs to determine if any one of the causes is the cause for an event. Additionally, or alternatively, the main event node 590 may determine if an event has occurred. For instance, based on the outputs and confidence value weightages whether an alarm is a false alarm or real alarm can be determined.
[0063] The process of FIG. 5 can be carried out continuously and in real-time, including substantially in real-time and each of the confidence value weightages can be updated continuously, as can the various models employed, control nodes and various causes.
[0064] FIG. 6A illustrates an example computing device which can be employed to perform various steps, methods, and techniques disclosed above. The more appropriate embodiment will be apparent to those of ordinary skill in the art when practicing the present technology. Persons of ordinary skill in the art will also readily appreciate that other system embodiments are possible.
[0065] Example system and/or computing device 1000 includes a processing unit (CPU or processor) 1010 and a system bus 1005 that couples various system components including the system memory 1015 such as read only memory (ROM) 1020 and random access memory (RAM) 1035 to the processor 1010. The processors disclosed herein can all be forms of this processor 1010. The system 1000 can include a cache 1012 of high-speed memory connected directly with, in close proximity to, or integrated as part of the processor 1010. The system 1000 copies data from the memory 1015 and/or the storage device 1030 to the cache 1012 for quick access by the processor 1010. In this way, the cache provides a performance boost that avoids processor 1010 delays while waiting for data. These and other modules can control or be configured to control the processor 1010 to perform various operations or actions. Other system memory 1015 may be available for use as well. The memory 1015 can include multiple different types of memory with different performance characteristics. It can be appreciated that the disclosure may operate on a computing device 1000 with more than one processor 1010 or on a group or cluster of computing devices networked together to provide greater processing capability. The processor 1010 can include any general purpose processor and a hardware module or software module, such as module 1 1032, module 2 1034, and module 3 1036 stored in storage device 1030, configured to control the processor 1010 as well as a special-purpose processor where software instructions are incorporated into the processor. The processor 1010 may be a self-contained computing system, containing multiple cores or processors, a bus, memory controller, cache, etc. A multi-core processor may be symmetric or asymmetric. The processor 1010 can include multiple processors, such as a system having multiple, physically separate processors in different sockets, or a system having multiple processor cores on a single physical chip. Similarly, the processor 1010 can include multiple distributed processors located in multiple separate computing devices, but working together such as via a communications network. Multiple processors or processor cores can share resources such as memory 1015 or the cache 1012, or can operate using independent resources. The processor 1010 can include one or more of a state machine, an application specific integrated circuit (ASIC), or a programmable gate array (PGA) including a field PGA (FPGA).
[0066] The system bus 1005 may be any of several types of bus structures including a memory bus or memory controller, a peripheral bus, and a local bus using any of a variety of bus architectures. A basic input/output (BIOS) stored in ROM 1020 or the like, may provide the basic routine that helps to transfer information between elements within the computing device 1000, such as during start-up. The computing device 1000 further includes storage devices 1030 or computer-readable storage media such as a hard disk drive, a magnetic disk drive, an optical disk drive, tape drive, solid-state drive, RAM drive, removable storage devices, a redundant array of inexpensive disks (RAID), hybrid storage device, or the like. The storage device 1030 can include software modules 1032, 1034, 1036 for controlling the processor 1010. The system 1000 can include other hardware or software modules. The storage device 1030 is connected to the system bus 1005 by a drive interface. The drives and the associated computer-readable storage devices provide nonvolatile storage of computer-readable instructions, data structures, program modules and other data for the computing device 1000. In one aspect, a hardware module that performs a particular function includes the software component stored in a tangible computer-readable storage device in connection with the necessary hardware components, such as the processor 1010, bus 1005, and so forth, to carry out a particular function. In another aspect, the system can use a processor and computer-readable storage device to store instructions which, when executed by the processor, cause the processor to perform operations, a method or other specific actions. The basic components and appropriate variations can be modified depending on the type of device, such as whether the device 1000 is a small, handheld computing device, a desktop computer, or a computer server. When the processor 1010 executes instructions to perform "operations", the processor 1010 can perform the operations directly and/or facilitate, direct, or cooperate with another device or component to perform the operations.
[0067] Although the exemplary embodiment(s) described herein employs the hard disk 1030, other types of computer-readable storage devices which can store data that are accessible by a computer, such as magnetic cassettes, flash memory cards, digital versatile disks (DVDs), cartridges, random access memories (RAMs) 1035, read only memory (ROM) 1020, a cable containing a bit stream and the like, may also be used in the exemplary operating environment. Tangible computer-readable storage media, computer-readable storage devices, or computer-readable memory devices, expressly exclude media such as transitory waves, energy, carrier signals, electromagnetic waves, and signals per se.
[0068] To enable user interaction with the computing device 1000, an input device 1045 represents any number of input mechanisms, such as a microphone for speech, a touch-sensitive screen for gesture or graphical input, keyboard, mouse, motion input, speech and so forth. An output device 1035 can also be one or more of a number of output mechanisms known to those of skill in the art. In some instances, multimodal systems enable a user to provide multiple types of input to communicate with the computing device 1000. The communications interface 1040 generally governs and manages the user input and system output. There is no restriction on operating on any particular hardware arrangement and therefore the basic hardware depicted may easily be substituted for improved hardware or firmware arrangements as they are developed.
[0069] For clarity of explanation, the illustrative system embodiment is presented as including individual functional blocks including functional blocks labeled as a "processor" or processor 1010. The functions these blocks represent may be provided through the use of either shared or dedicated hardware, including, but not limited to, hardware capable of executing software and hardware, such as a processor 1010, that is purpose-built to operate as an equivalent to software executing on a general purpose processor. For example the functions of one or more processors presented in FIG. 6A may be provided by a single shared processor or multiple processors. (Use of the term "processor" should not be construed to refer exclusively to hardware capable of executing software.) Illustrative embodiments may include microprocessor and/or digital signal processor (DSP) hardware, read-only memory (ROM) 1020 for storing software performing the operations described below, and random access memory (RAM) 1035 for storing results. Very large scale integration (VLSI) hardware embodiments, as well as custom VLSI circuitry in combination with a general purpose DSP circuit, may also be provided.
[0070] The logical operations of the various embodiments are implemented as: (1) a sequence of computer implemented steps, operations, or procedures running on a programmable circuit within a general use computer, (2) a sequence of computer implemented steps, operations, or procedures running on a specific-use programmable circuit; and/or (3) interconnected machine modules or program engines within the programmable circuits. The system 1000 shown in FIG. 6A can practice all or part of the recited methods, can be a part of the recited systems, and/or can operate according to instructions in the recited tangible computer-readable storage devices. Such logical operations can be implemented as modules configured to control the processor 1010 to perform particular functions according to the programming of the module. For example, FIG. 6A illustrates three modules Mod1 1032, Mod2 1034 and Mod3 1036 which are modules configured to control the processor 1010. These modules may be stored on the storage device 1030 and loaded into RAM 1035 or memory 1015 at runtime or may be stored in other computer-readable memory locations.
[0071] One or more parts of the example computing device 1000, up to and including the entire computing device 1000, can be virtualized. For example, a virtual processor can be a software object that executes according to a particular instruction set, even when a physical processor of the same type as the virtual processor is unavailable. A virtualization layer or a virtual "host" can enable virtualized components of one or more different computing devices or device types by translating virtualized operations to actual operations. Ultimately however, virtualized hardware of every type is implemented or executed by some underlying physical hardware. Thus, a virtualization compute layer can operate on top of a physical compute layer. The virtualization compute layer can include one or more of a virtual machine, an overlay network, a hypervisor, virtual switching, and any other virtualization application.
[0072] The processor 1010 can include all types of processors disclosed herein, including a virtual processor. However, when referring to a virtual processor, the processor 1010 includes the software components associated with executing the virtual processor in a virtualization layer and underlying hardware necessary to execute the virtualization layer. The system 1000 can include a physical or virtual processor 1010 that receive instructions stored in a computer-readable storage device, which cause the processor 1010 to perform certain operations. When referring to a virtual processor 1010, the system also includes the underlying physical hardware executing the virtual processor 1010.
[0073] FIG. 6B illustrates an example computer system 1050 having a chipset architecture that can be used in executing the described method and generating and displaying a graphical user interface (GUI). Computer system 1050 is an example of computer hardware, software, and firmware that can be used to implement the disclosed technology. System 1050 can include a processor 1052, representative of any number of physically and/or logically distinct resources capable of executing software, firmware, and hardware configured to perform identified computations. Processor 1052 can communicate with a chipset 1054 that can control input to and output from processor 1052. In this example, chipset 1054 outputs information to output 1062, such as a display, and can read and write information to storage device 1064, which can include magnetic media, and solid state media, for example. Chipset 1054 can also read data from and write data to RAM 1066. A bridge 1056 for interfacing with a variety of user interface components 1085 can be provided for interfacing with chipset 1054. Such user interface components 1085 can include a keyboard, a microphone, touch detection and processing circuitry, a pointing device, such as a mouse, and so on. In general, inputs to system 1050 can come from any of a variety of sources, machine generated and/or human generated.
[0074] Chipset 1054 can also interface with one or more communication interfaces 1060 that can have different physical interfaces. Such communication interfaces can include interfaces for wired and wireless local area networks, for broadband wireless networks, as well as personal area networks. Some applications of the methods for generating, displaying, and using the GUI disclosed herein can include receiving ordered datasets over the physical interface or be generated by the machine itself by processor 1052 analyzing data stored in storage 1064 or 1066. Further, the machine can receive inputs from a user via user interface components 1085 and execute appropriate functions, such as browsing functions by interpreting these inputs using processor 1052.
[0075] It can be appreciated that example systems 1000 and 1050 can have more than one processor 1010/1052 or be part of a group or cluster of computing devices networked together to provide greater processing capability.
[0076] Embodiments within the scope of the present disclosure may also include tangible and/or non-transitory computer-readable storage devices for carrying or having computer-executable instructions or data structures stored thereon. Such tangible computer-readable storage devices can be any available device that can be accessed by a general purpose or special purpose computer, including the functional design of any special purpose processor as described above. By way of example, and not limitation, such tangible computer-readable devices can include RAM, ROM, EEPROM, CD-ROM or other optical disk storage, magnetic disk storage or other magnetic storage devices, or any other device which can be used to carry or store desired program code in the form of computer-executable instructions, data structures, or processor chip design. When information or instructions are provided via a network or another communications connection (either hardwired, wireless, or combination thereof) to a computer, the computer properly views the connection as a computer-readable medium. Thus, any such connection is properly termed a computer-readable medium. Combinations of the above should also be included within the scope of the computer-readable storage devices.
[0077] Computer-executable instructions include, for example, instructions and data which cause a general purpose computer, special purpose computer, or special purpose processing device to perform a certain function or group of functions. Computer-executable instructions also include program modules that are executed by computers in stand-alone or network environments. Generally, program modules include routines, programs, components, data structures, objects, and the functions inherent in the design of special-purpose processors, etc. that perform particular tasks or implement particular abstract data types. Computer-executable instructions, associated data structures, and program modules represent examples of the program code means for executing steps of the methods disclosed herein. The particular sequence of such executable instructions or associated data structures represents examples of corresponding acts for implementing the functions described in such steps.
[0078] Other embodiments of the disclosure may be practiced in network computing environments with many types of computer system configurations, including personal computers, hand-held devices, multi-processor systems, microprocessor-based or programmable consumer electronics, network PCs, minicomputers, mainframe computers, and the like. Embodiments may also be practiced in distributed computing environments where tasks are performed by local and remote processing devices that are linked (either by hardwired links, wireless links, or by a combination thereof) through a communications network. In a distributed computing environment, program modules may be located in both local and remote memory storage devices.
[0079] STATEMENTS OF THE DISCLOSURE INCLUDE:
[0080] Statement 1: A method including generating, via a processor, with an oilfield related condition as a first input, a first output based on one of a physics-based model or a data-based model; generating, using the first input or a second input, a second output based on the other of the physics-based model or the data-based model not used to generate the first output; and modifying, automatically, at least one of the physics-based model, data-driven model, the first input or the second input, based on the first output or second output.
[0081] Statement 2: The method according to Statement 1, wherein the first output and second output are generated in parallel.
[0082] Statement 3: The method according to Statement 1, wherein the first output and second output are generated in series.
[0083] Statement 4: The method according to any one of Statements 1-3, further including, subsequent generating the first output, obtaining measured data from the oilfield related to the first output.
[0084] Statement 5: The method according to any one of Statements 1-4, wherein the second output is generated based on the second input, and wherein the second input is at least one of the measured data, the first output, or a difference between the measured data and the first output.
[0085] Statement 6: The method according to any one of Statements 1-5, wherein the second input is at least one of the measured data, or the difference between the measured data and the first output, and the measured data is measured in real-time.
[0086] Statement 7: The method according to any one of Statements 1-6, wherein modifying at least one of the physics-based model or the data-driven model includes replacement with a different respective physics-based model or data-driven model.
[0087] Statement 8: The method according to any one of Statements 1-7, wherein modifying the physic-based model includes altering a variable within the model.
[0088] Statement 9: The method according to any one of Statements 1-8, further including determining a normal range for the first output based on the second output.
[0089] Statement 10: The method according to any one of Statements 1-9, wherein the first output is generated based on the physics-based model, and the second output is generated based on the data-driven model.
[0090] Statement 11: The method according to any one of Statements 1-10, further including assigning a confidence value to the first and second outputs.
[0091] Statement 12: The method according to any one of Statements 1-11, wherein the method is conducted continuously in real-time.
[0092] Statement 13: A system including one or more processors; and at least one computer-readable storage medium having stored therein instructions which, when executed by the one or more processors, cause the one or more processors to: generate, via a processor, with an oilfield related condition as a first input, a first output based on one of a physics-based model or a data-based model; generate, using the first input or a second input, a second output based on the other of the physics-based model or the data-based model not used to generate the first output; and modify automatically at least one of the physics-based model, data-driven model, the first input or the second input, based on the first output or second output.
[0093] Statement 14: The system according to Statement 13, the at least one computer-readable storage medium storing additional instructions which, when executed by the one or more processors, cause the one or more processors to: subsequent generating the first output, obtain measured data from the oilfield related to the first output.
[0094] Statement 15: The system according to any one of Statements 13-14, wherein the second output is generated based on the second input, and wherein the second input is at least one of the measured data, the first output, or a difference between the measured data and the first output.
[0095] Statement 16: The system according to any one of Statements 13-15, wherein modifying at least one of the physics-based model or the data-driven model comprises replacement with a different respective physics-based model or data-driven model.
[0096] Statement 17: The system according to any one of Statements 13-16, wherein modifying the physic-based model comprises altering a variable within the model.
[0097] Statement 18: A non-transitory computer-readable storage medium including: instructions stored therein which, when executed by one or more processors, cause the one or more processors to: generate, via a processor, with an oilfield related condition as a first input, a first output based on one of a physics-based model or a data-based model; generate, using the first input or a second input, a second output based on the other of the physics-based model or the data-based model not used to generate the first output; and modify automatically at least one of the physics-based model, data-driven model, the first input or the second input, based on the first output or second output.
[0098] Statement 19: The non-transitory computer-readable storage medium according to Statement 18, including additional instructions which, when executed by the one or more processors, cause the one or more processors to: subsequent generating the first output, obtain measured data from the oilfield related to the first output.
[0099] Statement 20: The non-transitory computer-readable storage medium according to Statements 18 or 19, the second output is generated based on the second input, and wherein the second input is at least one of the measured condition, the first output, or a difference between the measured data and the first output.
[0100] Although a variety of information was used to explain aspects within the scope of the appended claims, no limitation of the claims should be implied based on particular features or arrangements, as one of ordinary skill would be able to derive a wide variety of implementations. Further and although some subject matter may have been described in language specific to structural features and/or method steps, it is to be understood that the subject matter defined in the appended claims is not necessarily limited to these described features or acts. Such functionality can be distributed differently or performed in components other than those identified herein. Rather, the described features and steps are disclosed as possible components of systems and methods within the scope of the appended claims.
* * * * *
D00000
D00001
D00002
D00003
D00004
D00005
D00006
D00007
D00008
D00009
D00010
D00011
XML
uspto.report is an independent third-party trademark research tool that is not affiliated, endorsed, or sponsored by the United States Patent and Trademark Office (USPTO) or any other governmental organization. The information provided by uspto.report is based on publicly available data at the time of writing and is intended for informational purposes only.
While we strive to provide accurate and up-to-date information, we do not guarantee the accuracy, completeness, reliability, or suitability of the information displayed on this site. The use of this site is at your own risk. Any reliance you place on such information is therefore strictly at your own risk.
All official trademark data, including owner information, should be verified by visiting the official USPTO website at www.uspto.gov. This site is not intended to replace professional legal advice and should not be used as a substitute for consulting with a legal professional who is knowledgeable about trademark law.